Identifying sources of chlorinated aliphatic hydrocarbons in a residential area in Italy using the...
15
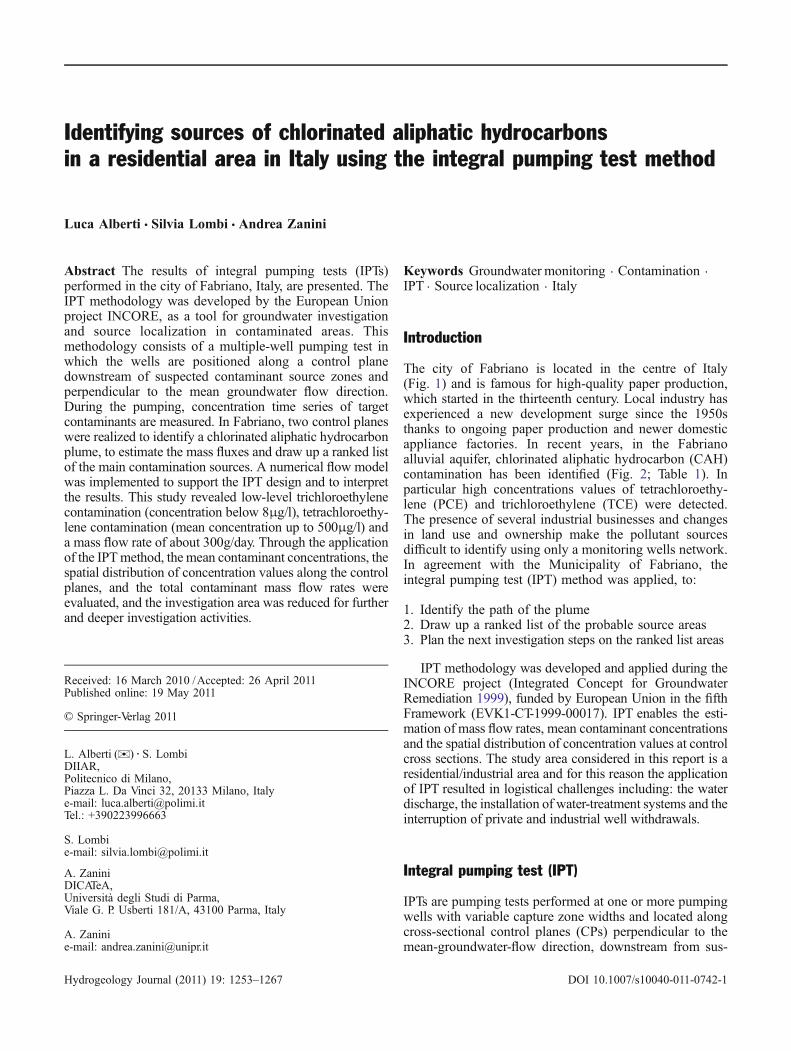
Identifying sources of chlorinated aliphatic hydrocarbons in a residential area in Italy using the integral pumping test method Luca Alberti & Silvia Lombi & Andrea Zanini Abstract The results of integral pumping tests (IPTs) performed in the city of Fabriano, Italy, are presented. The IPT methodology was developed by the European Union project INCORE, as a tool for groundwater investigation and source localization in contaminated areas. This methodology consists of a multiple-well pumping test in which the wells are positioned along a control plane downstream of suspected contaminant source zones and perpendicular to the mean groundwater flow direction. During the pumping, concentration time series of target contaminants are measured. In Fabriano, two control planes were realized to identify a chlorinated aliphatic hydrocarbon plume, to estimate the mass fluxes and draw up a ranked list of the main contamination sources. A numerical flow model was implemented to support the IPT design and to interpret the results. This study revealed low-level trichloroethylene contamination (concentration below 8μg/l), tetrachloroethy- lene contamination (mean concentration up to 500μg/l) and a mass flow rate of about 300g/day. Through the application of the IPT method, the mean contaminant concentrations, the spatial distribution of concentration values along the control planes, and the total contaminant mass flow rates were evaluated, and the investigation area was reduced for further and deeper investigation activities. Keywords Groundwater monitoring . Contamination . IPT . Source localization . Italy Introduction The city of Fabriano is located in the centre of Italy (Fig. 1) and is famous for high-quality paper production, which started in the thirteenth century. Local industry has experienced a new development surge since the 1950s thanks to ongoing paper production and newer domestic appliance factories. In recent years, in the Fabriano alluvial aquifer, chlorinated aliphatic hydrocarbon (CAH) contamination has been identified (Fig. 2; Table 1). In particular high concentrations values of tetrachloroethy- lene (PCE) and trichloroethylene (TCE) were detected. The presence of several industrial businesses and changes in land use and ownership make the pollutant sources difficult to identify using only a monitoring wells network. In agreement with the Municipality of Fabriano, the integral pumping test (IPT) method was applied, to: 1. Identify the path of the plume 2. Draw up a ranked list of the probable source areas 3. Plan the next investigation steps on the ranked list areas IPT methodology was developed and applied during the INCORE project (Integrated Concept for Groundwater Remediation 1999), funded by European Union in the fifth Framework (EVK1-CT-1999-00017). IPT enables the esti- mation of mass flow rates, mean contaminant concentrations and the spatial distribution of concentration values at control cross sections. The study area considered in this report is a residential/industrial area and for this reason the application of IPT resulted in logistical challenges including: the water discharge, the installation of water-treatment systems and the interruption of private and industrial well withdrawals. Integral pumping test (IPT) IPTs are pumping tests performed at one or more pumping wells with variable capture zone widths and located along cross-sectional control planes (CPs) perpendicular to the mean-groundwater-flow direction, downstream from sus- Received: 16 March 2010 /Accepted: 26 April 2011 Published online: 19 May 2011 * Springer-Verlag 2011 L. Alberti ()) : S. Lombi DIIAR, Politecnico di Milano, Piazza L. Da Vinci 32, 20133 Milano, Italy e-mail: [email protected] Tel.: +390223996663 S. Lombi e-mail: [email protected] A. Zanini DICATeA, Università degli Studi di Parma, Viale G. P. Usberti 181/A, 43100 Parma, Italy A. Zanini e-mail: [email protected] Hydrogeology Journal (2011) 19: 1253–1267 DOI 10.1007/s10040-011-0742-1
Transcript of Identifying sources of chlorinated aliphatic hydrocarbons in a residential area in Italy using the...
Identifying sources of chlorinated aliphatic hydrocarbons
in a residential area in Italy using the integral pumping test method
Luca Alberti & Silvia Lombi & Andrea Zanini
Abstract The results of integral pumping tests (IPTs)performed in the city of Fabriano, Italy, are presented. TheIPT methodology was developed by the European Unionproject INCORE, as a tool for groundwater investigationand source localization in contaminated areas. Thismethodology consists of a multiple-well pumping test inwhich the wells are positioned along a control planedownstream of suspected contaminant source zones andperpendicular to the mean groundwater flow direction.During the pumping, concentration time series of targetcontaminants are measured. In Fabriano, two control planeswere realized to identify a chlorinated aliphatic hydrocarbonplume, to estimate the mass fluxes and draw up a ranked listof the main contamination sources. A numerical flow modelwas implemented to support the IPT design and to interpretthe results. This study revealed low-level trichloroethylenecontamination (concentration below 8μg/l), tetrachloroethy-lene contamination (mean concentration up to 500μg/l) anda mass flow rate of about 300g/day. Through the applicationof the IPTmethod, the mean contaminant concentrations, thespatial distribution of concentration values along the controlplanes, and the total contaminant mass flow rates wereevaluated, and the investigation area was reduced for furtherand deeper investigation activities.
Keywords Groundwater monitoring . Contamination .IPT . Source localization . Italy
Introduction
The city of Fabriano is located in the centre of Italy(Fig. 1) and is famous for high-quality paper production,which started in the thirteenth century. Local industry hasexperienced a new development surge since the 1950sthanks to ongoing paper production and newer domesticappliance factories. In recent years, in the Fabrianoalluvial aquifer, chlorinated aliphatic hydrocarbon (CAH)contamination has been identified (Fig. 2; Table 1). Inparticular high concentrations values of tetrachloroethy-lene (PCE) and trichloroethylene (TCE) were detected.The presence of several industrial businesses and changesin land use and ownership make the pollutant sourcesdifficult to identify using only a monitoring wells network.In agreement with the Municipality of Fabriano, theintegral pumping test (IPT) method was applied, to:
1. Identify the path of the plume2. Draw up a ranked list of the probable source areas3. Plan the next investigation steps on the ranked list areas
IPT methodology was developed and applied during theINCORE project (Integrated Concept for GroundwaterRemediation 1999), funded by European Union in the fifthFramework (EVK1-CT-1999-00017). IPT enables the esti-mation of mass flow rates, mean contaminant concentrationsand the spatial distribution of concentration values at controlcross sections. The study area considered in this report is aresidential/industrial area and for this reason the applicationof IPT resulted in logistical challenges including: the waterdischarge, the installation of water-treatment systems and theinterruption of private and industrial well withdrawals.
Integral pumping test (IPT)
IPTs are pumping tests performed at one or more pumpingwells with variable capture zone widths and located alongcross-sectional control planes (CPs) perpendicular to themean-groundwater-flow direction, downstream from sus-
Received: 16 March 2010 /Accepted: 26 April 2011Published online: 19 May 2011
* Springer-Verlag 2011
L. Alberti ()) : S. LombiDIIAR,Politecnico di Milano,Piazza L. Da Vinci 32, 20133 Milano, Italye-mail: [email protected].: +390223996663
S. Lombie-mail: [email protected]
A. ZaniniDICATeA,Università degli Studi di Parma,Viale G. P. Usberti 181/A, 43100 Parma, Italy
A. Zaninie-mail: [email protected]
Hydrogeology Journal (2011) 19: 1253–1267 DOI 10.1007/s10040-011-0742-1
pected sources (Schwarz et al. 1998; Ptak and Teutsch2000; Schwarz 2002). The methodology is part of aphased approach, defined as the ‘cyclic approach’ devel-oped by the EU project INCORE that reduces theinvestigated area from one phase to the next. Thisapproach consists of three phases: plume screening,source screening and source/plume remediation. The firstphase involves evaluation of the plume/s by means of theIPTs and considers a very wide area. Then, on the basis ofthe obtained results, it is possible to identify the source bymeans of further IPT analysis and new characterizationactivities (second phase). After the identification of thesource area/s it is possible to design source/plumeremediation activities (third phase). The scope of thiswork regards only the first phase and the planning of thesecond phase. This phased approach allows the remediationactivities to be focused within the source/plume area to savemoney and accelerate the cleanup process.
The IPT methodology can be summarized in six steps:
1. Geological analysis of the study area2. Design of the pumping tests3. Performance of the pumping tests4. Numerical interpretation of the results5. Evaluation of the most probable sources6. Proposals for further studies
The IPT design involves determining number andlocation of wells, pumping rates and times; theseparameters should allow the well capture zones to coverthe entire groundwater flow downstream of the suspectedsource area. During the pumping period, concentrationvalues of pollutants are measured at specific times in thedischarged groundwater of each pumping well. Theconcentration time series allows determination of theposition and extent of the contaminant plumes. Thisinformation is obtained by the application of an inversionalgorithm (Ptak and Teutsch 2000), which converts themeasured concentration vs. time into a concentrationdistribution along each well.
The inversion of the time series is not unique, and doesnot uniquely state how the contaminant is distributedwithin the aquifer. Interpretation of the results for eachwell is necessary to describe the concentration distributionalong the whole control plane. Normally, to simplify theprocess, a symmetric solution is considered, where thecontaminant mass is distributed equally on both sides ofthe pumping well, which yields a symmetric concentrationin the aquifer along the control plane. Moreover, morethan one pumping well is considered in subsequentpumping campaigns in order to allow an overlapping ofthe individual capture zones between two adjacent wells.If the local flow field is known, the mass flow rates and
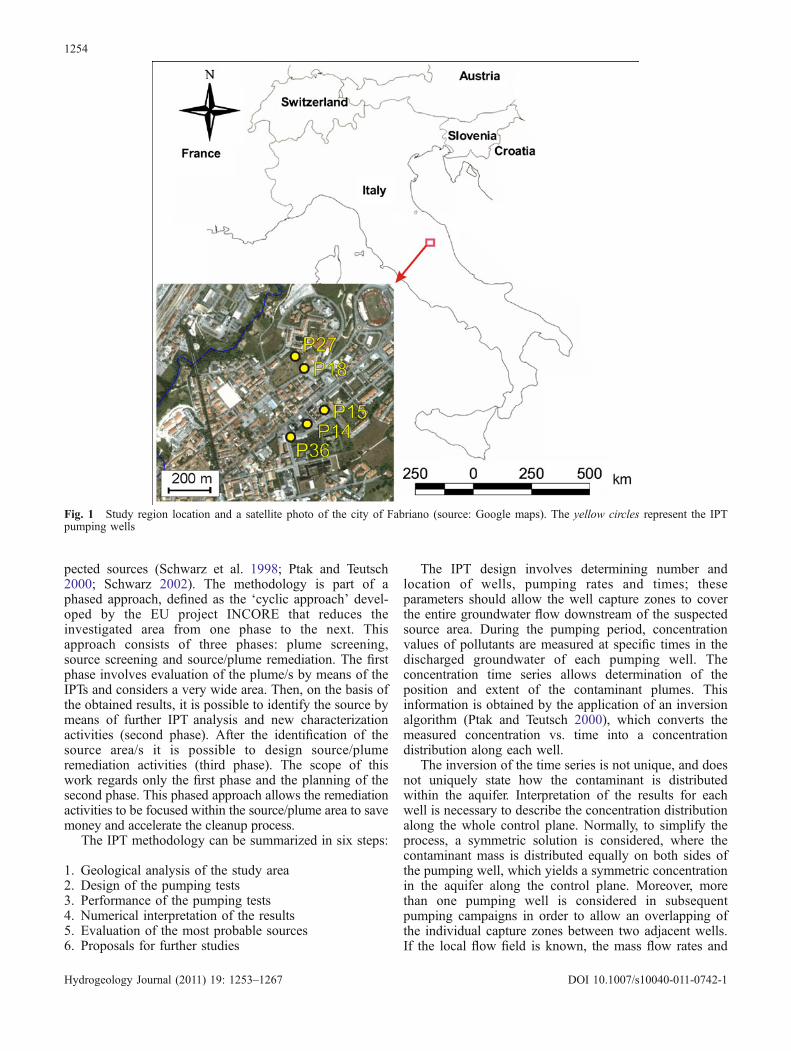
Fig. 1 Study region location and a satellite photo of the city of Fabriano (source: Google maps). The yellow circles represent the IPTpumping wells
1254
Hydrogeology Journal (2011) 19: 1253–1267 DOI 10.1007/s10040-011-0742-1
the mean concentration distributions at the control planeare evaluated.
The inversion algorithm (Schwarz et al. 1998; Ptak andTeutsch 2000; Schwarz 2002) described by Eq. (1) issubject to several assumptions: a confined, homogeneous,
isotropic, unbounded porous-medium aquifer with constantthickness. The effective porosity, hydraulic conductivity andhydraulic gradient are considered constant.
With these assumptions the inversion problem may besolved analytically. The relationship between the concen-
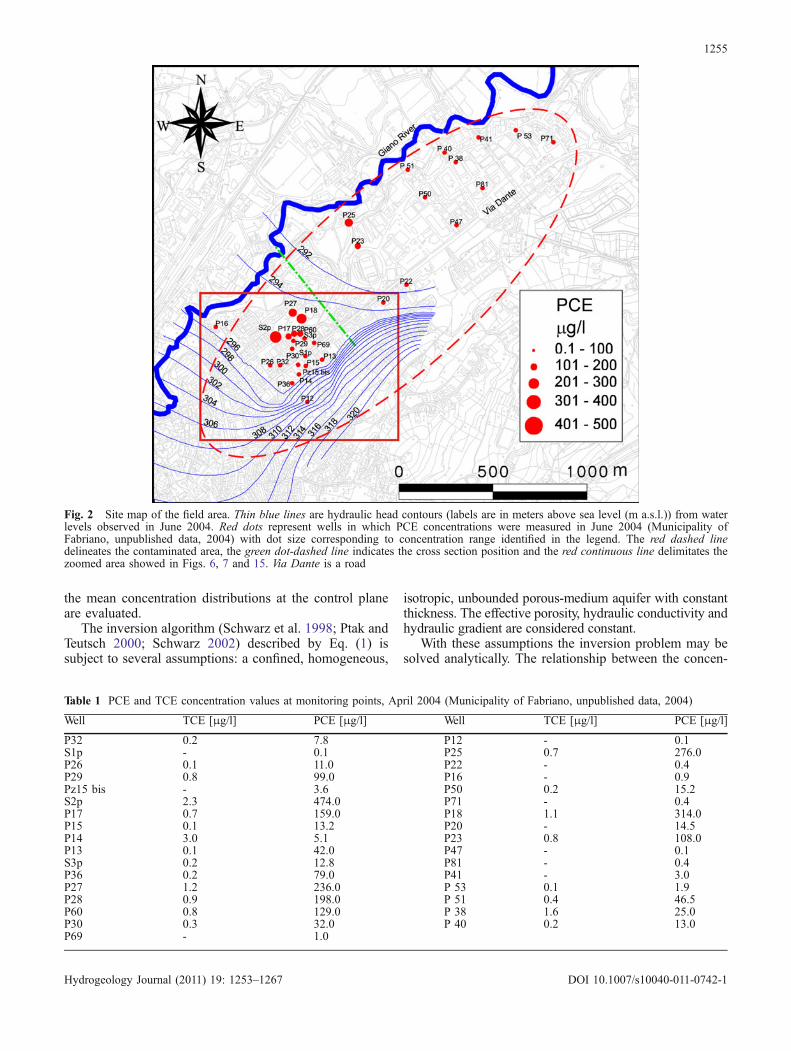
Fig. 2 Site map of the field area. Thin blue lines are hydraulic head contours (labels are in meters above sea level (m a.s.l.)) from waterlevels observed in June 2004. Red dots represent wells in which PCE concentrations were measured in June 2004 (Municipality ofFabriano, unpublished data, 2004) with dot size corresponding to concentration range identified in the legend. The red dashed linedelineates the contaminated area, the green dot-dashed line indicates the cross section position and the red continuous line delimitates thezoomed area showed in Figs. 6, 7 and 15. Via Dante is a road
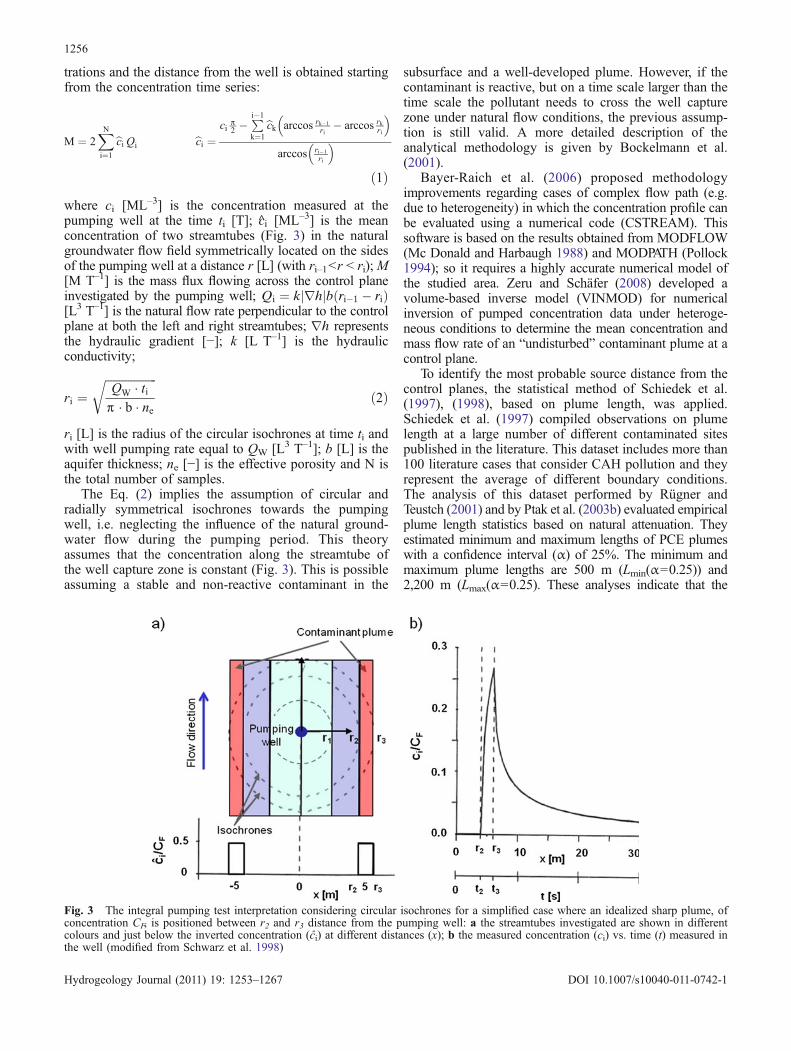
Table 1 PCE and TCE concentration values at monitoring points, April 2004 (Municipality of Fabriano, unpublished data, 2004)
Well TCE [μg/l] PCE [μg/l] Well TCE [μg/l] PCE [μg/l]
P32 0.2 7.8 P12 - 0.1S1p - 0.1 P25 0.7 276.0P26 0.1 11.0 P22 - 0.4P29 0.8 99.0 P16 - 0.9Pz15 bis - 3.6 P50 0.2 15.2S2p 2.3 474.0 P71 - 0.4P17 0.7 159.0 P18 1.1 314.0P15 0.1 13.2 P20 - 14.5P14 3.0 5.1 P23 0.8 108.0P13 0.1 42.0 P47 - 0.1S3p 0.2 12.8 P81 - 0.4P36 0.2 79.0 P41 - 3.0P27 1.2 236.0 P 53 0.1 1.9P28 0.9 198.0 P 51 0.4 46.5P60 0.8 129.0 P 38 1.6 25.0P30 0.3 32.0 P 40 0.2 13.0P69 - 1.0
1255
Hydrogeology Journal (2011) 19: 1253–1267 DOI 10.1007/s10040-011-0742-1
trations and the distance from the well is obtained startingfrom the concentration time series:
M ¼ 2XN
i¼1
bciQi bci ¼ci p
2 �Pi�1
k¼1bck arccos rk�1
ri� arccos rk
ri
� �
arccos ri�1ri
� �
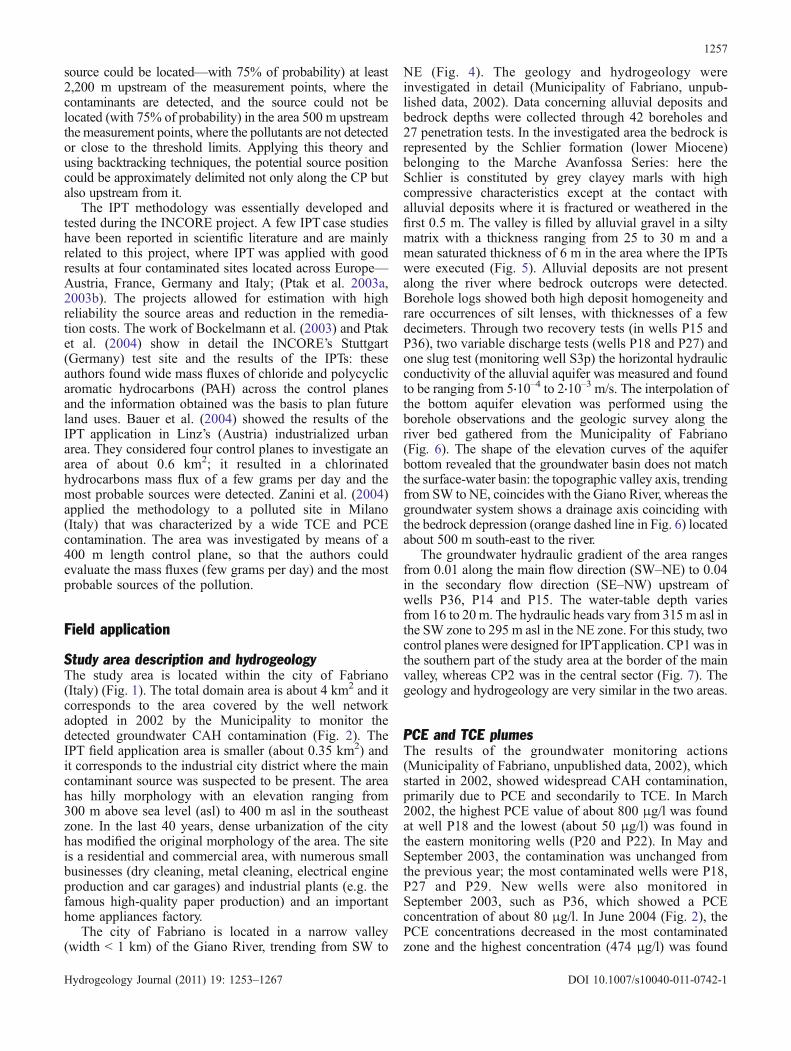
ð1Þwhere ci [ML–3] is the concentration measured at thepumping well at the time ti [T]; ci [ML–3] is the meanconcentration of two streamtubes (Fig. 3) in the naturalgroundwater flow field symmetrically located on the sidesof the pumping well at a distance r [L] (with ri–1<r < ri);M[M T–1] is the mass flux flowing across the control planeinvestigated by the pumping well; Qi ¼ k rhj jb ri�1 � rið Þ[L3 T–1] is the natural flow rate perpendicular to the controlplane at both the left and right streamtubes; rh representsthe hydraulic gradient [−]; k [L T–1] is the hydraulicconductivity;
ri ¼ffiffiffiffiffiffiffiffiffiffiffiffiffiffiffiffiffiffiQW � tip � b � ne
rð2Þ
ri [L] is the radius of the circular isochrones at time ti andwith well pumping rate equal to QW [L3 T–1]; b [L] is theaquifer thickness; ne [−] is the effective porosity and N isthe total number of samples.
The Eq. (2) implies the assumption of circular andradially symmetrical isochrones towards the pumpingwell, i.e. neglecting the influence of the natural ground-water flow during the pumping period. This theoryassumes that the concentration along the streamtube ofthe well capture zone is constant (Fig. 3). This is possibleassuming a stable and non-reactive contaminant in the
subsurface and a well-developed plume. However, if thecontaminant is reactive, but on a time scale larger than thetime scale the pollutant needs to cross the well capturezone under natural flow conditions, the previous assump-tion is still valid. A more detailed description of theanalytical methodology is given by Bockelmann et al.(2001).
Bayer-Raich et al. (2006) proposed methodologyimprovements regarding cases of complex flow path (e.g.due to heterogeneity) in which the concentration profile canbe evaluated using a numerical code (CSTREAM). Thissoftware is based on the results obtained from MODFLOW(Mc Donald and Harbaugh 1988) and MODPATH (Pollock1994); so it requires a highly accurate numerical model ofthe studied area. Zeru and Schäfer (2008) developed avolume-based inverse model (VINMOD) for numericalinversion of pumped concentration data under heteroge-neous conditions to determine the mean concentration andmass flow rate of an “undisturbed” contaminant plume at acontrol plane.
To identify the most probable source distance from thecontrol planes, the statistical method of Schiedek et al.(1997), (1998), based on plume length, was applied.Schiedek et al. (1997) compiled observations on plumelength at a large number of different contaminated sitespublished in the literature. This dataset includes more than100 literature cases that consider CAH pollution and theyrepresent the average of different boundary conditions.The analysis of this dataset performed by Rügner andTeustch (2001) and by Ptak et al. (2003b) evaluated empiricalplume length statistics based on natural attenuation. Theyestimated minimum and maximum lengths of PCE plumeswith a confidence interval (α) of 25%. The minimum andmaximum plume lengths are 500 m (Lmin(α=0.25)) and2,200 m (Lmax(α=0.25). These analyses indicate that the
Fig. 3 The integral pumping test interpretation considering circular isochrones for a simplified case where an idealized sharp plume, ofconcentration CF, is positioned between r2 and r3 distance from the pumping well: a the streamtubes investigated are shown in differentcolours and just below the inverted concentration (ĉi) at different distances (x); b the measured concentration (ci) vs. time (t) measured inthe well (modified from Schwarz et al. 1998)
1256
Hydrogeology Journal (2011) 19: 1253–1267 DOI 10.1007/s10040-011-0742-1
source could be located—with 75% of probability) at least2,200 m upstream of the measurement points, where thecontaminants are detected, and the source could not belocated (with 75% of probability) in the area 500 m upstreamthe measurement points, where the pollutants are not detectedor close to the threshold limits. Applying this theory andusing backtracking techniques, the potential source positioncould be approximately delimited not only along the CP butalso upstream from it.
The IPT methodology was essentially developed andtested during the INCORE project. A few IPTcase studieshave been reported in scientific literature and are mainlyrelated to this project, where IPT was applied with goodresults at four contaminated sites located across Europe—Austria, France, Germany and Italy; (Ptak et al. 2003a,2003b). The projects allowed for estimation with highreliability the source areas and reduction in the remedia-tion costs. The work of Bockelmann et al. (2003) and Ptaket al. (2004) show in detail the INCORE’s Stuttgart(Germany) test site and the results of the IPTs: theseauthors found wide mass fluxes of chloride and polycyclicaromatic hydrocarbons (PAH) across the control planesand the information obtained was the basis to plan futureland uses. Bauer et al. (2004) showed the results of theIPT application in Linz’s (Austria) industrialized urbanarea. They considered four control planes to investigate anarea of about 0.6 km2; it resulted in a chlorinatedhydrocarbons mass flux of a few grams per day and themost probable sources were detected. Zanini et al. (2004)applied the methodology to a polluted site in Milano(Italy) that was characterized by a wide TCE and PCEcontamination. The area was investigated by means of a400 m length control plane, so that the authors couldevaluate the mass fluxes (few grams per day) and the mostprobable sources of the pollution.
Field application
Study area description and hydrogeologyThe study area is located within the city of Fabriano(Italy) (Fig. 1). The total domain area is about 4 km2 and itcorresponds to the area covered by the well networkadopted in 2002 by the Municipality to monitor thedetected groundwater CAH contamination (Fig. 2). TheIPT field application area is smaller (about 0.35 km2) andit corresponds to the industrial city district where the maincontaminant source was suspected to be present. The areahas hilly morphology with an elevation ranging from300 m above sea level (asl) to 400 m asl in the southeastzone. In the last 40 years, dense urbanization of the cityhas modified the original morphology of the area. The siteis a residential and commercial area, with numerous smallbusinesses (dry cleaning, metal cleaning, electrical engineproduction and car garages) and industrial plants (e.g. thefamous high-quality paper production) and an importanthome appliances factory.
The city of Fabriano is located in a narrow valley(width < 1 km) of the Giano River, trending from SW to
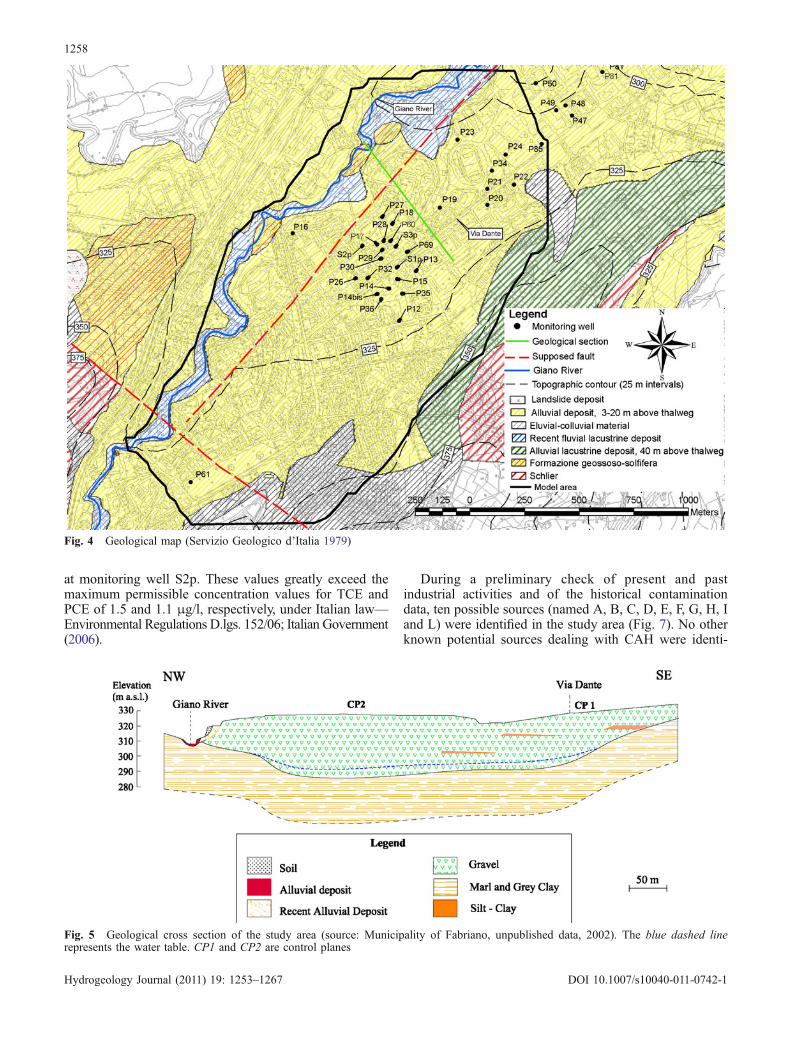
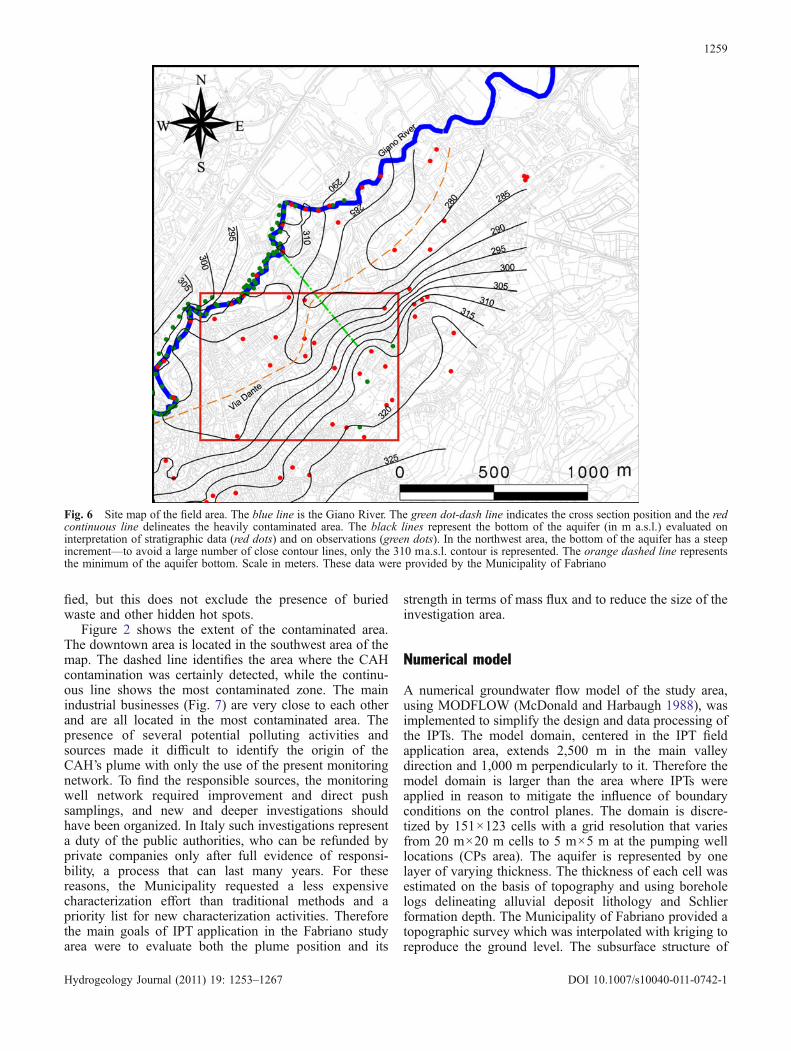
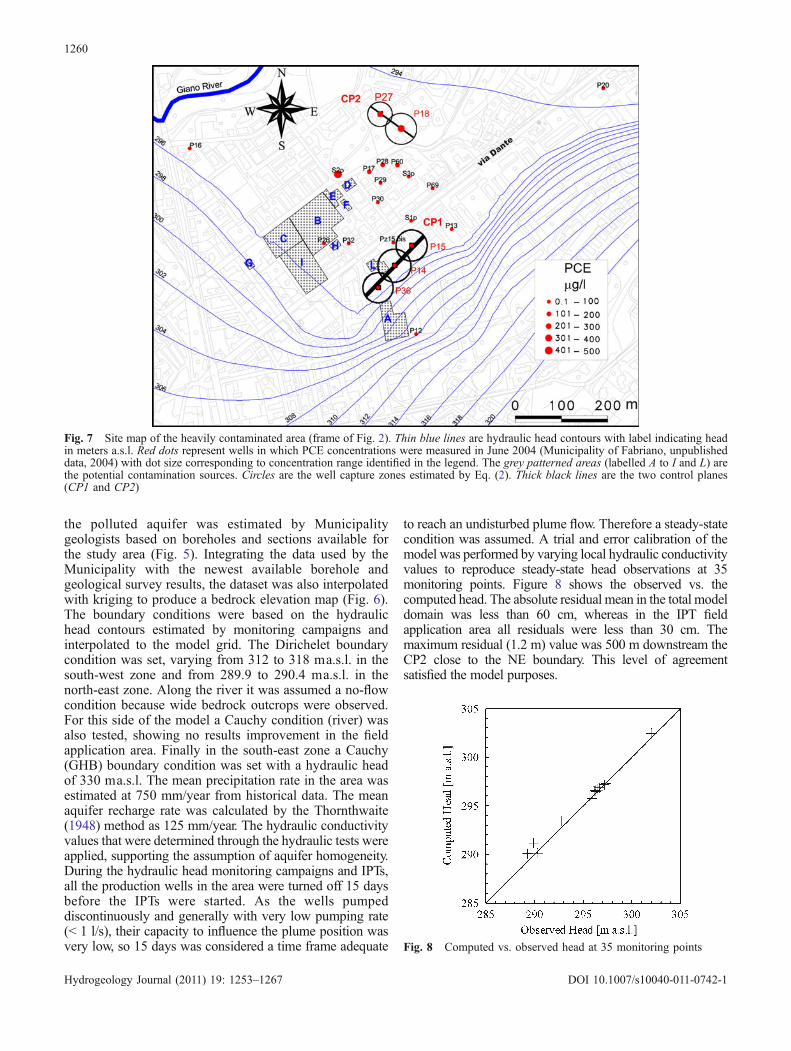
NE (Fig. 4). The geology and hydrogeology wereinvestigated in detail (Municipality of Fabriano, unpub-lished data, 2002). Data concerning alluvial deposits andbedrock depths were collected through 42 boreholes and27 penetration tests. In the investigated area the bedrock isrepresented by the Schlier formation (lower Miocene)belonging to the Marche Avanfossa Series: here theSchlier is constituted by grey clayey marls with highcompressive characteristics except at the contact withalluvial deposits where it is fractured or weathered in thefirst 0.5 m. The valley is filled by alluvial gravel in a siltymatrix with a thickness ranging from 25 to 30 m and amean saturated thickness of 6 m in the area where the IPTswere executed (Fig. 5). Alluvial deposits are not presentalong the river where bedrock outcrops were detected.Borehole logs showed both high deposit homogeneity andrare occurrences of silt lenses, with thicknesses of a fewdecimeters. Through two recovery tests (in wells P15 andP36), two variable discharge tests (wells P18 and P27) andone slug test (monitoring well S3p) the horizontal hydraulicconductivity of the alluvial aquifer was measured and foundto be ranging from 5⋅10–4 to 2⋅10–3 m/s. The interpolation ofthe bottom aquifer elevation was performed using theborehole observations and the geologic survey along theriver bed gathered from the Municipality of Fabriano(Fig. 6). The shape of the elevation curves of the aquiferbottom revealed that the groundwater basin does not matchthe surface-water basin: the topographic valley axis, trendingfrom SW to NE, coincides with the Giano River, whereas thegroundwater system shows a drainage axis coinciding withthe bedrock depression (orange dashed line in Fig. 6) locatedabout 500 m south-east to the river.
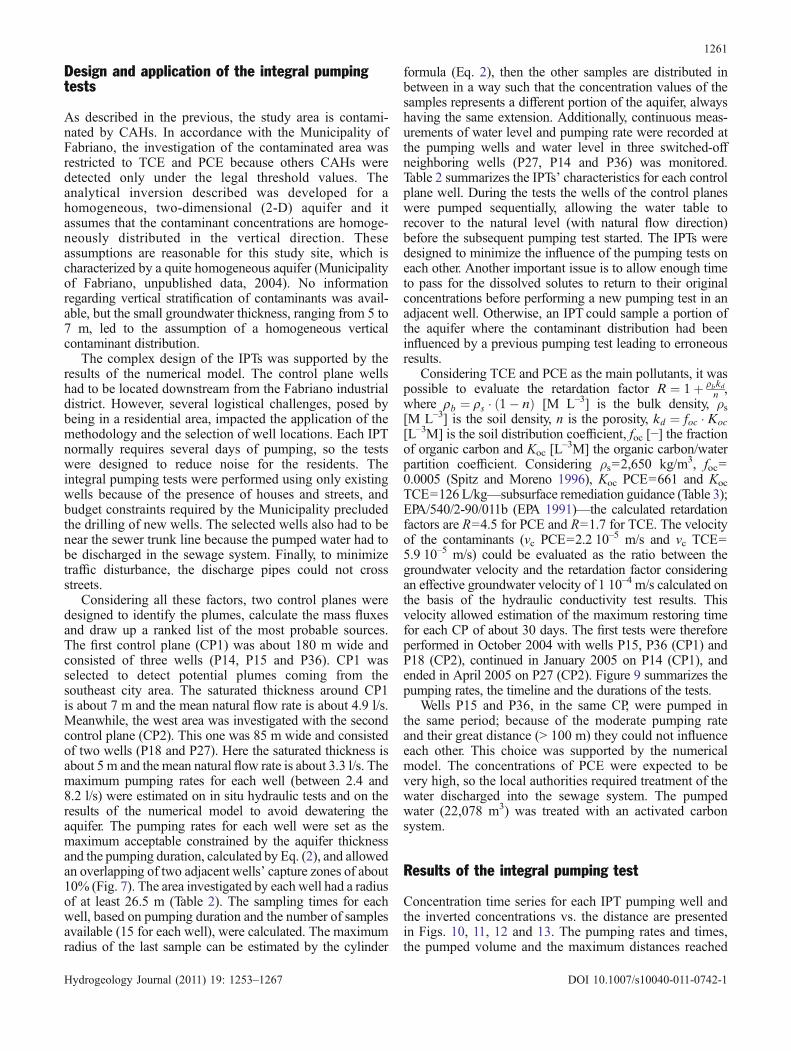
The groundwater hydraulic gradient of the area rangesfrom 0.01 along the main flow direction (SW–NE) to 0.04in the secondary flow direction (SE–NW) upstream ofwells P36, P14 and P15. The water-table depth variesfrom 16 to 20m. The hydraulic heads vary from 315 m asl inthe SW zone to 295 m asl in the NE zone. For this study, twocontrol planes were designed for IPTapplication. CP1 was inthe southern part of the study area at the border of the mainvalley, whereas CP2 was in the central sector (Fig. 7). Thegeology and hydrogeology are very similar in the two areas.
PCE and TCE plumesThe results of the groundwater monitoring actions(Municipality of Fabriano, unpublished data, 2002), whichstarted in 2002, showed widespread CAH contamination,primarily due to PCE and secondarily to TCE. In March2002, the highest PCE value of about 800 μg/l was foundat well P18 and the lowest (about 50 μg/l) was found inthe eastern monitoring wells (P20 and P22). In May andSeptember 2003, the contamination was unchanged fromthe previous year; the most contaminated wells were P18,P27 and P29. New wells were also monitored inSeptember 2003, such as P36, which showed a PCEconcentration of about 80 μg/l. In June 2004 (Fig. 2), thePCE concentrations decreased in the most contaminatedzone and the highest concentration (474 μg/l) was found
1257
Hydrogeology Journal (2011) 19: 1253–1267 DOI 10.1007/s10040-011-0742-1
at monitoring well S2p. These values greatly exceed themaximum permissible concentration values for TCE andPCE of 1.5 and 1.1 μg/l, respectively, under Italian law—Environmental Regulations D.lgs. 152/06; Italian Government(2006).
During a preliminary check of present and pastindustrial activities and of the historical contaminationdata, ten possible sources (named A, B, C, D, E, F, G, H, Iand L) were identified in the study area (Fig. 7). No otherknown potential sources dealing with CAH were identi-
Fig. 4 Geological map (Servizio Geologico d’Italia 1979)
Fig. 5 Geological cross section of the study area (source: Municipality of Fabriano, unpublished data, 2002). The blue dashed linerepresents the water table. CP1 and CP2 are control planes
1258
Hydrogeology Journal (2011) 19: 1253–1267 DOI 10.1007/s10040-011-0742-1
fied, but this does not exclude the presence of buriedwaste and other hidden hot spots.
Figure 2 shows the extent of the contaminated area.The downtown area is located in the southwest area of themap. The dashed line identifies the area where the CAHcontamination was certainly detected, while the continu-ous line shows the most contaminated zone. The mainindustrial businesses (Fig. 7) are very close to each otherand are all located in the most contaminated area. Thepresence of several potential polluting activities andsources made it difficult to identify the origin of theCAH’s plume with only the use of the present monitoringnetwork. To find the responsible sources, the monitoringwell network required improvement and direct pushsamplings, and new and deeper investigations shouldhave been organized. In Italy such investigations representa duty of the public authorities, who can be refunded byprivate companies only after full evidence of responsi-bility, a process that can last many years. For thesereasons, the Municipality requested a less expensivecharacterization effort than traditional methods and apriority list for new characterization activities. Thereforethe main goals of IPT application in the Fabriano studyarea were to evaluate both the plume position and its
strength in terms of mass flux and to reduce the size of theinvestigation area.
Numerical model
A numerical groundwater flow model of the study area,using MODFLOW (McDonald and Harbaugh 1988), wasimplemented to simplify the design and data processing ofthe IPTs. The model domain, centered in the IPT fieldapplication area, extends 2,500 m in the main valleydirection and 1,000 m perpendicularly to it. Therefore themodel domain is larger than the area where IPTs wereapplied in reason to mitigate the influence of boundaryconditions on the control planes. The domain is discre-tized by 151×123 cells with a grid resolution that variesfrom 20 m×20 m cells to 5 m×5 m at the pumping welllocations (CPs area). The aquifer is represented by onelayer of varying thickness. The thickness of each cell wasestimated on the basis of topography and using boreholelogs delineating alluvial deposit lithology and Schlierformation depth. The Municipality of Fabriano provided atopographic survey which was interpolated with kriging toreproduce the ground level. The subsurface structure of
Fig. 6 Site map of the field area. The blue line is the Giano River. The green dot-dash line indicates the cross section position and the redcontinuous line delineates the heavily contaminated area. The black lines represent the bottom of the aquifer (in m a.s.l.) evaluated oninterpretation of stratigraphic data (red dots) and on observations (green dots). In the northwest area, the bottom of the aquifer has a steepincrement—to avoid a large number of close contour lines, only the 310 ma.s.l. contour is represented. The orange dashed line representsthe minimum of the aquifer bottom. Scale in meters. These data were provided by the Municipality of Fabriano
1259
Hydrogeology Journal (2011) 19: 1253–1267 DOI 10.1007/s10040-011-0742-1
the polluted aquifer was estimated by Municipalitygeologists based on boreholes and sections available forthe study area (Fig. 5). Integrating the data used by theMunicipality with the newest available borehole andgeological survey results, the dataset was also interpolatedwith kriging to produce a bedrock elevation map (Fig. 6).The boundary conditions were based on the hydraulichead contours estimated by monitoring campaigns andinterpolated to the model grid. The Dirichelet boundarycondition was set, varying from 312 to 318 ma.s.l. in thesouth-west zone and from 289.9 to 290.4 ma.s.l. in thenorth-east zone. Along the river it was assumed a no-flowcondition because wide bedrock outcrops were observed.For this side of the model a Cauchy condition (river) wasalso tested, showing no results improvement in the fieldapplication area. Finally in the south-east zone a Cauchy(GHB) boundary condition was set with a hydraulic headof 330 ma.s.l. The mean precipitation rate in the area wasestimated at 750 mm/year from historical data. The meanaquifer recharge rate was calculated by the Thornthwaite(1948) method as 125 mm/year. The hydraulic conductivityvalues that were determined through the hydraulic tests wereapplied, supporting the assumption of aquifer homogeneity.During the hydraulic head monitoring campaigns and IPTs,all the production wells in the area were turned off 15 daysbefore the IPTs were started. As the wells pumpeddiscontinuously and generally with very low pumping rate(< 1 l/s), their capacity to influence the plume position wasvery low, so 15 days was considered a time frame adequate
to reach an undisturbed plume flow. Therefore a steady-statecondition was assumed. A trial and error calibration of themodel was performed by varying local hydraulic conductivityvalues to reproduce steady-state head observations at 35monitoring points. Figure 8 shows the observed vs. thecomputed head. The absolute residual mean in the total modeldomain was less than 60 cm, whereas in the IPT fieldapplication area all residuals were less than 30 cm. Themaximum residual (1.2 m) value was 500 m downstream theCP2 close to the NE boundary. This level of agreementsatisfied the model purposes.
Fig. 7 Site map of the heavily contaminated area (frame of Fig. 2). Thin blue lines are hydraulic head contours with label indicating headin meters a.s.l. Red dots represent wells in which PCE concentrations were measured in June 2004 (Municipality of Fabriano, unpublisheddata, 2004) with dot size corresponding to concentration range identified in the legend. The grey patterned areas (labelled A to I and L) arethe potential contamination sources. Circles are the well capture zones estimated by Eq. (2). Thick black lines are the two control planes(CP1 and CP2)
Fig. 8 Computed vs. observed head at 35 monitoring points
1260
Hydrogeology Journal (2011) 19: 1253–1267 DOI 10.1007/s10040-011-0742-1
Design and application of the integral pumpingtests
As described in the previous, the study area is contami-nated by CAHs. In accordance with the Municipality ofFabriano, the investigation of the contaminated area wasrestricted to TCE and PCE because others CAHs weredetected only under the legal threshold values. Theanalytical inversion described was developed for ahomogeneous, two-dimensional (2-D) aquifer and itassumes that the contaminant concentrations are homoge-neously distributed in the vertical direction. Theseassumptions are reasonable for this study site, which ischaracterized by a quite homogeneous aquifer (Municipalityof Fabriano, unpublished data, 2004). No informationregarding vertical stratification of contaminants was avail-able, but the small groundwater thickness, ranging from 5 to7 m, led to the assumption of a homogeneous verticalcontaminant distribution.
The complex design of the IPTs was supported by theresults of the numerical model. The control plane wellshad to be located downstream from the Fabriano industrialdistrict. However, several logistical challenges, posed bybeing in a residential area, impacted the application of themethodology and the selection of well locations. Each IPTnormally requires several days of pumping, so the testswere designed to reduce noise for the residents. Theintegral pumping tests were performed using only existingwells because of the presence of houses and streets, andbudget constraints required by the Municipality precludedthe drilling of new wells. The selected wells also had to benear the sewer trunk line because the pumped water had tobe discharged in the sewage system. Finally, to minimizetraffic disturbance, the discharge pipes could not crossstreets.
Considering all these factors, two control planes weredesigned to identify the plumes, calculate the mass fluxesand draw up a ranked list of the most probable sources.The first control plane (CP1) was about 180 m wide andconsisted of three wells (P14, P15 and P36). CP1 wasselected to detect potential plumes coming from thesoutheast city area. The saturated thickness around CP1is about 7 m and the mean natural flow rate is about 4.9 l/s.Meanwhile, the west area was investigated with the secondcontrol plane (CP2). This one was 85 m wide and consistedof two wells (P18 and P27). Here the saturated thickness isabout 5 m and the mean natural flow rate is about 3.3 l/s. Themaximum pumping rates for each well (between 2.4 and8.2 l/s) were estimated on in situ hydraulic tests and on theresults of the numerical model to avoid dewatering theaquifer. The pumping rates for each well were set as themaximum acceptable constrained by the aquifer thicknessand the pumping duration, calculated by Eq. (2), and allowedan overlapping of two adjacent wells’ capture zones of about10% (Fig. 7). The area investigated by each well had a radiusof at least 26.5 m (Table 2). The sampling times for eachwell, based on pumping duration and the number of samplesavailable (15 for each well), were calculated. The maximumradius of the last sample can be estimated by the cylinder
formula (Eq. 2), then the other samples are distributed inbetween in a way such that the concentration values of thesamples represents a different portion of the aquifer, alwayshaving the same extension. Additionally, continuous meas-urements of water level and pumping rate were recorded atthe pumping wells and water level in three switched-offneighboring wells (P27, P14 and P36) was monitored.Table 2 summarizes the IPTs’ characteristics for each controlplane well. During the tests the wells of the control planeswere pumped sequentially, allowing the water table torecover to the natural level (with natural flow direction)before the subsequent pumping test started. The IPTs weredesigned to minimize the influence of the pumping tests oneach other. Another important issue is to allow enough timeto pass for the dissolved solutes to return to their originalconcentrations before performing a new pumping test in anadjacent well. Otherwise, an IPT could sample a portion ofthe aquifer where the contaminant distribution had beeninfluenced by a previous pumping test leading to erroneousresults.
Considering TCE and PCE as the main pollutants, it waspossible to evaluate the retardation factor R ¼ 1þ rbkd
n ,where rb ¼ rs � ð1� nÞ [M L–3] is the bulk density, ρs[M L–3] is the soil density, n is the porosity, kd ¼ foc �Koc
[L–3M] is the soil distribution coefficient, foc [−] the fractionof organic carbon and Koc [L
–3M] the organic carbon/waterpartition coefficient. Considering ρs=2,650 kg/m3, foc=0.0005 (Spitz and Moreno 1996), Koc PCE=661 and Koc
TCE=126 L/kg—subsurface remediation guidance (Table 3);EPA/540/2-90/011b (EPA 1991)—the calculated retardationfactors are R=4.5 for PCE and R=1.7 for TCE. The velocityof the contaminants (vc PCE=2.2 10–5 m/s and vc TCE=5.9 10–5 m/s) could be evaluated as the ratio between thegroundwater velocity and the retardation factor consideringan effective groundwater velocity of 1 10–4 m/s calculated onthe basis of the hydraulic conductivity test results. Thisvelocity allowed estimation of the maximum restoring timefor each CP of about 30 days. The first tests were thereforeperformed in October 2004 with wells P15, P36 (CP1) andP18 (CP2), continued in January 2005 on P14 (CP1), andended in April 2005 on P27 (CP2). Figure 9 summarizes thepumping rates, the timeline and the durations of the tests.
Wells P15 and P36, in the same CP, were pumped inthe same period; because of the moderate pumping rateand their great distance (> 100 m) they could not influenceeach other. This choice was supported by the numericalmodel. The concentrations of PCE were expected to bevery high, so the local authorities required treatment of thewater discharged into the sewage system. The pumpedwater (22,078 m3) was treated with an activated carbonsystem.
Results of the integral pumping test
Concentration time series for each IPT pumping well andthe inverted concentrations vs. the distance are presentedin Figs. 10, 11, 12 and 13. The pumping rates and times,the pumped volume and the maximum distances reached
1261
Hydrogeology Journal (2011) 19: 1253–1267 DOI 10.1007/s10040-011-0742-1
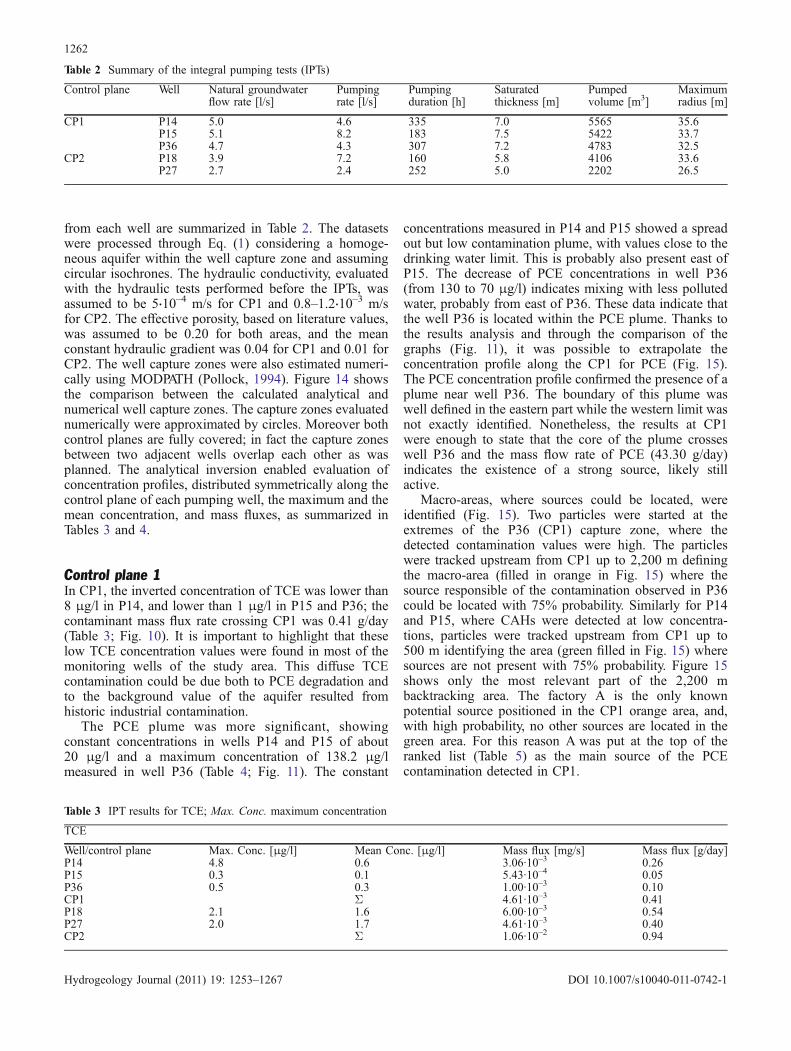
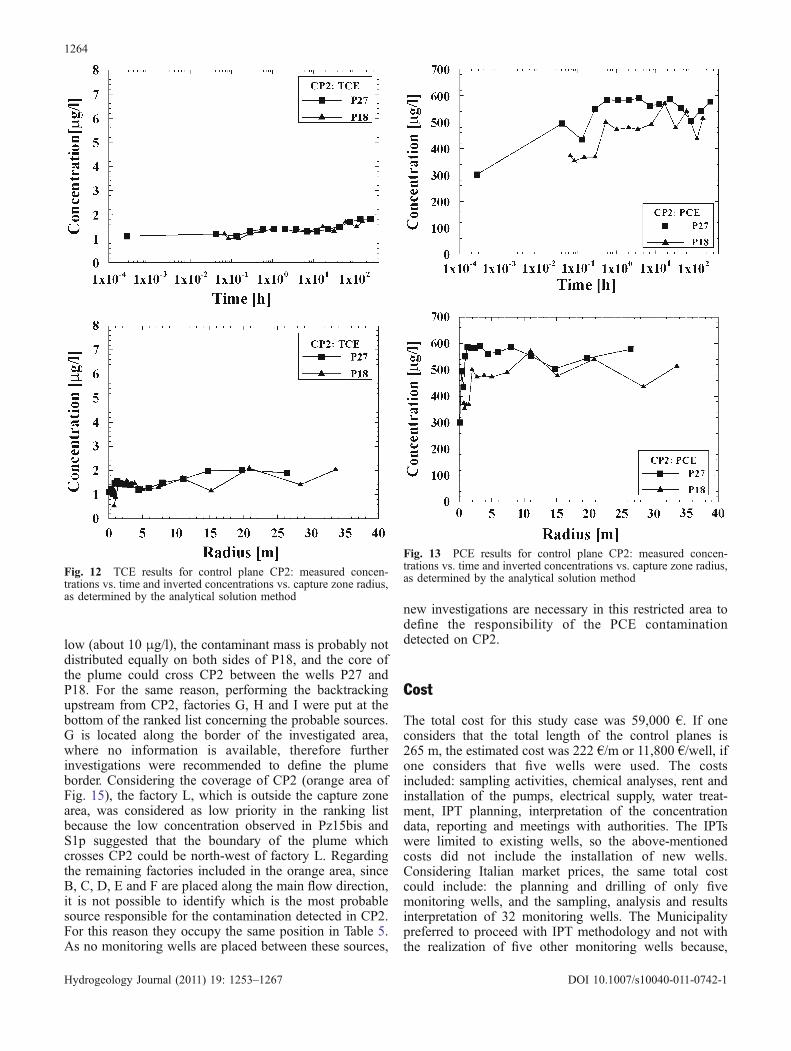
from each well are summarized in Table 2. The datasetswere processed through Eq. (1) considering a homoge-neous aquifer within the well capture zone and assumingcircular isochrones. The hydraulic conductivity, evaluatedwith the hydraulic tests performed before the IPTs, wasassumed to be 5⋅10–4 m/s for CP1 and 0.8–1.2⋅10–3 m/sfor CP2. The effective porosity, based on literature values,was assumed to be 0.20 for both areas, and the meanconstant hydraulic gradient was 0.04 for CP1 and 0.01 forCP2. The well capture zones were also estimated numeri-cally using MODPATH (Pollock, 1994). Figure 14 showsthe comparison between the calculated analytical andnumerical well capture zones. The capture zones evaluatednumerically were approximated by circles. Moreover bothcontrol planes are fully covered; in fact the capture zonesbetween two adjacent wells overlap each other as wasplanned. The analytical inversion enabled evaluation ofconcentration profiles, distributed symmetrically along thecontrol plane of each pumping well, the maximum and themean concentration, and mass fluxes, as summarized inTables 3 and 4.
Control plane 1In CP1, the inverted concentration of TCE was lower than8 μg/l in P14, and lower than 1 μg/l in P15 and P36; thecontaminant mass flux rate crossing CP1 was 0.41 g/day(Table 3; Fig. 10). It is important to highlight that theselow TCE concentration values were found in most of themonitoring wells of the study area. This diffuse TCEcontamination could be due both to PCE degradation andto the background value of the aquifer resulted fromhistoric industrial contamination.
The PCE plume was more significant, showingconstant concentrations in wells P14 and P15 of about20 μg/l and a maximum concentration of 138.2 μg/lmeasured in well P36 (Table 4; Fig. 11). The constant
concentrations measured in P14 and P15 showed a spreadout but low contamination plume, with values close to thedrinking water limit. This is probably also present east ofP15. The decrease of PCE concentrations in well P36(from 130 to 70 μg/l) indicates mixing with less pollutedwater, probably from east of P36. These data indicate thatthe well P36 is located within the PCE plume. Thanks tothe results analysis and through the comparison of thegraphs (Fig. 11), it was possible to extrapolate theconcentration profile along the CP1 for PCE (Fig. 15).The PCE concentration profile confirmed the presence of aplume near well P36. The boundary of this plume waswell defined in the eastern part while the western limit wasnot exactly identified. Nonetheless, the results at CP1were enough to state that the core of the plume crosseswell P36 and the mass flow rate of PCE (43.30 g/day)indicates the existence of a strong source, likely stillactive.
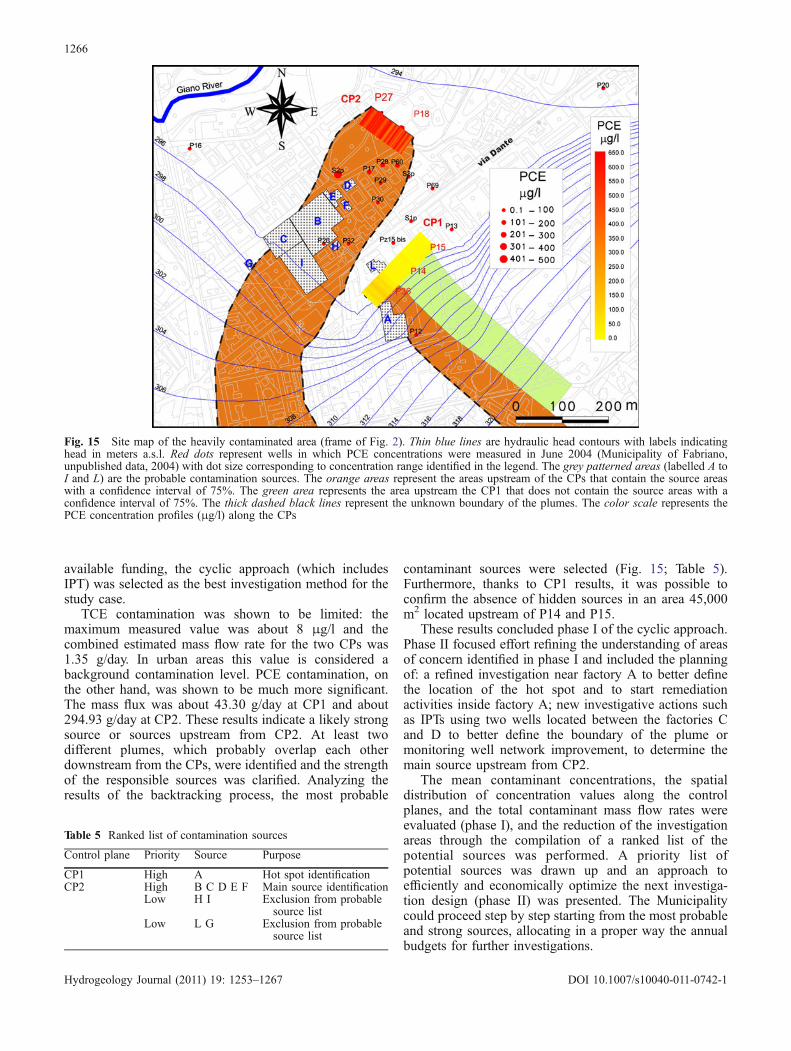
Macro-areas, where sources could be located, wereidentified (Fig. 15). Two particles were started at theextremes of the P36 (CP1) capture zone, where thedetected contamination values were high. The particleswere tracked upstream from CP1 up to 2,200 m definingthe macro-area (filled in orange in Fig. 15) where thesource responsible of the contamination observed in P36could be located with 75% probability. Similarly for P14and P15, where CAHs were detected at low concentra-tions, particles were tracked upstream from CP1 up to500 m identifying the area (green filled in Fig. 15) wheresources are not present with 75% probability. Figure 15shows only the most relevant part of the 2,200 mbacktracking area. The factory A is the only knownpotential source positioned in the CP1 orange area, and,with high probability, no other sources are located in thegreen area. For this reason A was put at the top of theranked list (Table 5) as the main source of the PCEcontamination detected in CP1.
Table 2 Summary of the integral pumping tests (IPTs)
Control plane Well Natural groundwaterflow rate [l/s]
Pumpingrate [l/s]
Pumpingduration [h]
Saturatedthickness [m]
Pumpedvolume [m3]
Maximumradius [m]
CP1 P14 5.0 4.6 335 7.0 5565 35.6P15 5.1 8.2 183 7.5 5422 33.7P36 4.7 4.3 307 7.2 4783 32.5
CP2 P18 3.9 7.2 160 5.8 4106 33.6P27 2.7 2.4 252 5.0 2202 26.5
Table 3 IPT results for TCE; Max. Conc. maximum concentration
TCE
Well/control plane Max. Conc. [μg/l] Mean Conc. [μg/l] Mass flux [mg/s] Mass flux [g/day]P14 4.8 0.6 3.06·10–3 0.26P15 0.3 0.1 5.43·10–4 0.05P36 0.5 0.3 1.00·10–3 0.10CP1 Σ 4.61·10–3 0.41P18 2.1 1.6 6.00·10–3 0.54P27 2.0 1.7 4.61·10–3 0.40CP2 Σ 1.06·10–2 0.94
1262
Hydrogeology Journal (2011) 19: 1253–1267 DOI 10.1007/s10040-011-0742-1
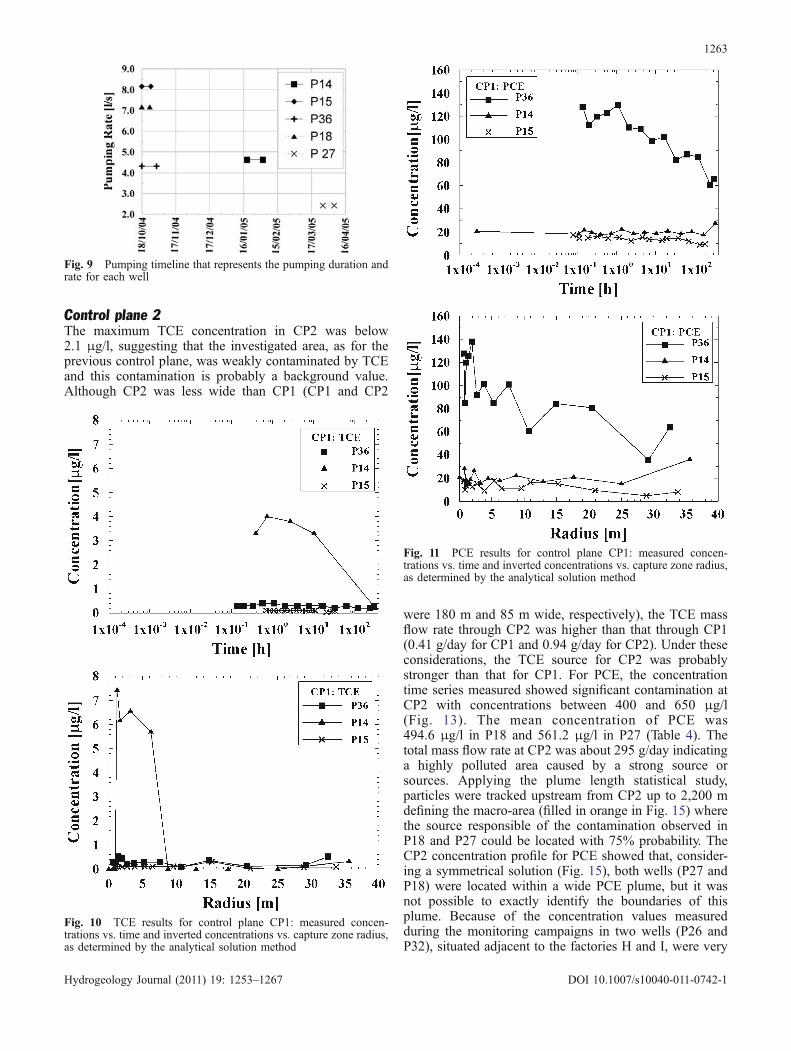
Control plane 2The maximum TCE concentration in CP2 was below2.1 μg/l, suggesting that the investigated area, as for theprevious control plane, was weakly contaminated by TCEand this contamination is probably a background value.Although CP2 was less wide than CP1 (CP1 and CP2
were 180 m and 85 m wide, respectively), the TCE massflow rate through CP2 was higher than that through CP1(0.41 g/day for CP1 and 0.94 g/day for CP2). Under theseconsiderations, the TCE source for CP2 was probablystronger than that for CP1. For PCE, the concentrationtime series measured showed significant contamination atCP2 with concentrations between 400 and 650 μg/l(Fig. 13). The mean concentration of PCE was494.6 μg/l in P18 and 561.2 μg/l in P27 (Table 4). Thetotal mass flow rate at CP2 was about 295 g/day indicatinga highly polluted area caused by a strong source orsources. Applying the plume length statistical study,particles were tracked upstream from CP2 up to 2,200 mdefining the macro-area (filled in orange in Fig. 15) wherethe source responsible of the contamination observed inP18 and P27 could be located with 75% probability. TheCP2 concentration profile for PCE showed that, consider-ing a symmetrical solution (Fig. 15), both wells (P27 andP18) were located within a wide PCE plume, but it wasnot possible to exactly identify the boundaries of thisplume. Because of the concentration values measuredduring the monitoring campaigns in two wells (P26 andP32), situated adjacent to the factories H and I, were very
Fig. 9 Pumping timeline that represents the pumping duration andrate for each well
Fig. 10 TCE results for control plane CP1: measured concen-trations vs. time and inverted concentrations vs. capture zone radius,as determined by the analytical solution method
Fig. 11 PCE results for control plane CP1: measured concen-trations vs. time and inverted concentrations vs. capture zone radius,as determined by the analytical solution method
1263
Hydrogeology Journal (2011) 19: 1253–1267 DOI 10.1007/s10040-011-0742-1
low (about 10 μg/l), the contaminant mass is probably notdistributed equally on both sides of P18, and the core ofthe plume could cross CP2 between the wells P27 andP18. For the same reason, performing the backtrackingupstream from CP2, factories G, H and I were put at thebottom of the ranked list concerning the probable sources.G is located along the border of the investigated area,where no information is available, therefore furtherinvestigations were recommended to define the plumeborder. Considering the coverage of CP2 (orange area ofFig. 15), the factory L, which is outside the capture zonearea, was considered as low priority in the ranking listbecause the low concentration observed in Pz15bis andS1p suggested that the boundary of the plume whichcrosses CP2 could be north-west of factory L. Regardingthe remaining factories included in the orange area, sinceB, C, D, E and F are placed along the main flow direction,it is not possible to identify which is the most probablesource responsible for the contamination detected in CP2.For this reason they occupy the same position in Table 5.As no monitoring wells are placed between these sources,
new investigations are necessary in this restricted area todefine the responsibility of the PCE contaminationdetected on CP2.
Cost
The total cost for this study case was 59,000 €. If oneconsiders that the total length of the control planes is265 m, the estimated cost was 222 €/m or 11,800 €/well, ifone considers that five wells were used. The costsincluded: sampling activities, chemical analyses, rent andinstallation of the pumps, electrical supply, water treat-ment, IPT planning, interpretation of the concentrationdata, reporting and meetings with authorities. The IPTswere limited to existing wells, so the above-mentionedcosts did not include the installation of new wells.Considering Italian market prices, the same total costcould include: the planning and drilling of only fivemonitoring wells, and the sampling, analysis and resultsinterpretation of 32 monitoring wells. The Municipalitypreferred to proceed with IPT methodology and not withthe realization of five other monitoring wells because,
Fig. 12 TCE results for control plane CP2: measured concen-trations vs. time and inverted concentrations vs. capture zone radius,as determined by the analytical solution method
Fig. 13 PCE results for control plane CP2: measured concen-trations vs. time and inverted concentrations vs. capture zone radius,as determined by the analytical solution method
1264
Hydrogeology Journal (2011) 19: 1253–1267 DOI 10.1007/s10040-011-0742-1
considering the initial lack of knowledge of the plumedistribution, it was not sure that this last choice couldsignificantly improve the monitoring network and theknowledge about contamination distribution. Furthermorethe IPT investigation, compared to a simple monitoringnetwork, offered the advantage to calculate concentrationprofiles continuously along the CPs, to evaluate themaximum and the mean concentration, to quantify themass fluxes and finally to better direct future drilling,monitoring and testing operations by delineating the mostlikely sources of contamination.
Conclusions
The heterogeneous distribution of CAH contamination inthe city of Fabriano (Italy) renders PCE and TCE plumesidentification difficult, using hydrogeologic investigationssuch as monitoring campaigns, drilling of new monitoringwells, and multilevel sampling. Historical studies, madeby the Municipality of Fabriano, limited the number ofprobable sources to ten. No other known possible sourceswere identified in the municipal and surrounding areas.Considering the features of the site, the objectives and
Fig. 14 Comparison between analytical and numerical well capture zones
Table 4 IPT results for PCE. Max. Conc. maximum concentration
PCE
Well/control plane Max. Conc. [μg/l] Mean Conc. [μg/l] Mass flux [mg/s] Mass flux [g/day]P14 36.3 23.5 1.17·10–1 10.12P15 17.8 10.3 5.20·10–2 4.49P36 138.2 70.9 3.32·10–1 28.69CP1 Σ 5.01·10–1 43.30P18 645.4 494.6 1.93 166.65P27 650.1 561.2 1.50 128.28CP2 Σ 3.43 294.93
1265
Hydrogeology Journal (2011) 19: 1253–1267 DOI 10.1007/s10040-011-0742-1
available funding, the cyclic approach (which includesIPT) was selected as the best investigation method for thestudy case.
TCE contamination was shown to be limited: themaximum measured value was about 8 μg/l and thecombined estimated mass flow rate for the two CPs was1.35 g/day. In urban areas this value is considered abackground contamination level. PCE contamination, onthe other hand, was shown to be much more significant.The mass flux was about 43.30 g/day at CP1 and about294.93 g/day at CP2. These results indicate a likely strongsource or sources upstream from CP2. At least twodifferent plumes, which probably overlap each otherdownstream from the CPs, were identified and the strengthof the responsible sources was clarified. Analyzing theresults of the backtracking process, the most probable
contaminant sources were selected (Fig. 15; Table 5).Furthermore, thanks to CP1 results, it was possible toconfirm the absence of hidden sources in an area 45,000m2 located upstream of P14 and P15.
These results concluded phase I of the cyclic approach.Phase II focused effort refining the understanding of areasof concern identified in phase I and included the planningof: a refined investigation near factory A to better definethe location of the hot spot and to start remediationactivities inside factory A; new investigative actions suchas IPTs using two wells located between the factories Cand D to better define the boundary of the plume ormonitoring well network improvement, to determine themain source upstream from CP2.
The mean contaminant concentrations, the spatialdistribution of concentration values along the controlplanes, and the total contaminant mass flow rates wereevaluated (phase I), and the reduction of the investigationareas through the compilation of a ranked list of thepotential sources was performed. A priority list ofpotential sources was drawn up and an approach toefficiently and economically optimize the next investiga-tion design (phase II) was presented. The Municipalitycould proceed step by step starting from the most probableand strong sources, allocating in a proper way the annualbudgets for further investigations.
Fig. 15 Site map of the heavily contaminated area (frame of Fig. 2). Thin blue lines are hydraulic head contours with labels indicatinghead in meters a.s.l. Red dots represent wells in which PCE concentrations were measured in June 2004 (Municipality of Fabriano,unpublished data, 2004) with dot size corresponding to concentration range identified in the legend. The grey patterned areas (labelled A toI and L) are the probable contamination sources. The orange areas represent the areas upstream of the CPs that contain the source areaswith a confidence interval of 75%. The green area represents the area upstream the CP1 that does not contain the source areas with aconfidence interval of 75%. The thick dashed black lines represent the unknown boundary of the plumes. The color scale represents thePCE concentration profiles (μg/l) along the CPs
Table 5 Ranked list of contamination sources
Control plane Priority Source Purpose
CP1 High A Hot spot identificationCP2 High B C D E F Main source identification
Low H I Exclusion from probablesource list
Low L G Exclusion from probablesource list
1266
Hydrogeology Journal (2011) 19: 1253–1267 DOI 10.1007/s10040-011-0742-1
Acknowledgements The authors would like to thank the Munici-pality of Fabriano and Dr. C. Blasetti for providing the data andfunding this project, Prof. Vincenzo Francani and Prof. MariaGiovanna Tanda for supporting this study. The authors are gratefulto Mike Fienen for its comments and English review. We would alsolike to thank the Associate Editor of Hydrogeology Journal and theanonymous reviewers for their many helpful comments.
References
Bayer-Raich M, Jarsjö J, Liedl R, Ptak T, Teutsch G (2006) Integralpumping test analyses of linearly sorbed groundwater contam-inants using multiple wells: inferring mass flows and naturalattenuation rates. Water Resour Res 42:W08411. doi:10.1029/2005WR004244
Bauer S, Bayer-Raich M, Holder T, Ptak T, Kolesar C, Müller D(2004) Quantification of groundwater contamination in an urbanarea using integral pumping tests. J Contam Hydrol 75:183–213
Bockelmann A, Ptak T, Teutsch G (2001) An analytical quantifica-tion of mass fluxes and natural attenuation rate constants at aformer gasworks site. J Contam Hydrol 53(3–4):429–453
Bockelmann A, Zamfirescu D, Ptak T, Grathwohl P, Teutsch G(2003) Quantification of mass fluxes and natural attenuationrates at an industrial site with a limited monitoring network: acase study. J Contam Hydrol 60(1–2):97–121
EPA (1991) Subsurface remediation guidance reference guide. EPA/540/2-90/011B, EPA, Washington, DC
INCORE (Integrated Concept for Groundwater Remediation)(1999) Fifth EC framework program: energy, environment,sustainable development. Key action one, Contract no. EVK1-CT-1999-0001, INCORE, Londonerry, UK
Italian Government (2006) Norme in materia ambientale [Environ-mental regulations]. Decreto legislativo 3 aprile 2006, n 152 ,Gazzetta Ufficiale n 88 del 14 aprile 2006- supplementoordinario n 96, Government of Italy, Rome
Mcdonald MG, Harbaugh AW (1988) A modular three-dimensional,finite difference ground-water flow model. US GeologicalSurvey Techniques of Water Resources Investigations, book 6,chapter A1. US Geological Survey, Reston, VA
Pollock DW (1994) User’s guide for MODPATH/MODPATH-PLOT,version 3: a particle tracking postprocessing package for MOD-FLOW, the US Geological Survey Finite-Difference Ground-Water Flow Model. US Geol Surv Open-File Rep 94–464
Ptak T, Teutsch G (2000) Development and application of anintegral investigation method for the characterization of ground-water contamination. In: Contaminated soil 2000. Telford,London, pp 198–205
Ptak T, Alberti L, Bauer S et al (2003a) Integral investigation ofgroundwater quality. Integrated Concept for GroundwaterRemediation-INCORE. Final report on CD-ROM, UWUmweltwirtschaft, Stuttgart, Germany
Ptak, T, Jarsjö J, Kirchholtes H et al (2003b) Delimiting of potentialcontamination source zones. Integrated Concept for Ground-water Remediation-INCORE. Final report on CD-ROM, UWUmweltwirtschaft, Stuttgart, Germany
Ptak T, Jarsjö J, Bayer-Raich M, Holder T, Teustch G (2004) Theintegral groundwater investigation method principles, applica-tion and evaluation. IGEA 19:13–26
Rügner H, Teutsch G (2001) Literature study on “Naturalattenuation of organic pollutants in groundwater”. Final reportfor EU-fp5 project INCORE. ISBN: 3-00-011706-7. Alsoavailable at http://umweltwirtschaft-uw.de/incore/summary.htm.Accessed 30 Apr 2001
Schiedek T, Grathwohl P, Teutsch G (1997) Literaturstudie zumnatürlichen Rückhalt/Abbau von Schadstoffen im Grundwasser[Literature study concerning natural degradation processes for agroundwater contamination plume]. Report from Altlastenbear-beitung, vol 35/97, November, Baden-Württemberg LandDepartment for Environmental Protection, Stuttgart, Germany,51 pp
Schiedek T, Grathwohl P, Teutsch G (1998) Natural attenuation andplume length of organic contaminants. Annal Geophysic, partII, 16: c489, Abstract GS98
Schwarz R (2002) Grundwasser-Gefährdungsabschätzung durchemissions-und Immissionsmessungen an Deponien und Altlas-ten [Groundwater risk analysis assessment for a waste dumparea using emission-immission tests]. PhD Thesis, University ofTübingen, Germany, 125 pp
Schwarz R, Ptak T, Holder T, Teutsch G (1998) Groundwater riskassessment at contaminated sites: a new investigation approach.In: Herbert M, Kovar K (eds) GQ’98 groundwater quality:remediation and protection, IAHS Publication, 250th edn.,IAHS, Wallingford, UK, pp 68–71
Servizio Geologico d’Italia (Italian Geological Survey) (1979)Foglio Fabriano 301, 1:50000. Grafica Editoriale Cartografica,Rome
Spitz K, Moreno J (1996) Practical guide to groundwater and solutetransport modeling. Wiley, Chichester, UK, 461 pp
Thornthwaite CW (1948) An approach toward a rational classi-fication of climate. Geogr Rev 38:55–94
Zanini A, Alberti L, Ceccon S, Bauer S, Ptak T, Tanda MG (2004)Application of the integral investigation pumping test inMilano. IGEA 19:41–60
Zeru A, Schäfer G, Volume-based inverse model (VINMOD) (2008)Innovative approach to quantify groundwater pollution inheterogeneous aquifers. J Hydroinform 10(4):345–345
1267
Hydrogeology Journal (2011) 19: 1253–1267 DOI 10.1007/s10040-011-0742-1