
Oracle Argus Safety English Administrator's Guide Release 8.1.1
Upload
independentCategory
view
1download
0
Fisheries Research xxx (2005) xxx–xxx
Bioeconomic modelling and risk assessment of the Cubanfishery for spiny lobsterPanulirus argus
3
4
Rafael Pugaa,∗, Sergio Hern´andez Vazquezb,Juana L´opez Martinezc, Marıa E. de Le´ona
5
6
a Centro de Investigaciones Pesqueras, 5a Avenida y Calle 246, Barlovento, Sta. Fe, Playa,Apartado Postal 11300, Ciudad de la Habana, Cuba
7
8b Centro de Investigaciones Biol´ogicas del Noroeste, S.C. Apartado Postal 128, La Paz, B.C.S. 23000, Mexico9
c Centro de Investigaciones Biol´ogicas del Noroeste, S.C. Unidad Guaymas, Apartado Postal 349, Guaymas 85465, Sonora, Mexico10
Received 14 December 2003; received in revised form 21 February 2005; accepted 23 March 2005; online 17 June 2005
11
Abstract12
Spiny lobster (Panulirus argus), the most valuable fishery resource in Cuba, is subject to a state property regime and to alimited-access system. Managers need to be advised on the consequences of choosing different methods for managing the fishery.An age-structured bioeconomic model was developed to simulate the population dynamics of the stock allowing short-term andlong-term (equilibrium) predictions on catch, biomass, egg production, revenue, cost and profit, due to changes in the fishingeffort. The equilibrium version of the model can be used to estimate a number of bioeconomic reference points, such as thefishing effort for the maximum sustainable yield per recruit, or the maximum economic yield per recruit. The stochastic andd ment, takingi ds
13
14
15
16
17
18
19
20
21
©22
K23
24
125
26
a27
s28
i29
an30
31
oral32
33
was34
00235
36
urce37
the38
1 02 d
FISH 1906 1–15
ynamic version can be used to assess every year the risk of exceeding common benchmarks used in fishery managento account uncertainty in parameters, such as catchability and recruitment. It was found that the recruitment has decreaseince 1988 and that the effort should be limited at the level of maximum economic yield.2005 Published by Elsevier B.V.
eywords: Panulirus argus; Population dynamics; Fishery assessment; Stock and recruitment
. Introduction
In Cuba, spiny lobsterPanulirus arguscan be foundll round the country, but it is most common around theouth coast where the main fishery occurs, especiallyn the Gulf of Bataban´o (Fig. 1), where 60% of the
∗ Corresponding author. Tel.: +53 7 2088638; fax: +53 7 2049827.E-mail address:[email protected] (R. Puga).
total national catch is harvested. The Gulf of Batabois a reef lagoon with an area of 20,850 km2, 6 m meandepth, surrounded by a number of small keys and creefs and many sea grass beds (Paez and Revilla, 1991),an ideal habitat for spiny lobster. The average catch7034 t between 1978 and 1989, but from 1990 to 2this decreased to 5005 t.
Spiny lobster is the most valuable fishery resoin Cuba and many studies have been made on
165-7836/$ – see front matter © 2005 Published by Elsevier B.V.oi:10.1016/j.fishres.2005.03.014

2 R. Puga et al. / Fisheries Research xxx (2005) xxx–xxx
Fig. 1. Map showing fishing areas for spiny lobster in Cuban archipelago.
species. A review of the main aspects of the biology,39
fishery and management was reported byBaisre and40
Cruz (1994). About 70% of the catch is comprised of41
lobsters between 70 and 100 mm carapace length. More42
than 60% of the catch is processed as pre-cooked whole43
lobsters and exported to Japan, France, Spain, Italy and44
Canada, with an average price of US$ 12 kg−1.45
At present, there are 117 boats in the Gulf of Bata-46
bano fishery, which operate two kinds of fishing gears,47
artificial shelters and trap-like nets. There are about48
143,000 artificial shelters made of tree trunks and49
fibercement plates, and about 12,200 rectangular trap-50
like nets made of chicken wire with large leader nets51
(about 40 m long) attached at the two front corners52
in a V-pattern. The fishing gears used in the fish-53
ery are well described byBaisre and Cruz (1994)54
andCruz and Phillips (1994). The fishery is currently55
managed with input and biological controls which56
include a state property regime; limited entry; territorial57
rights to fishery enterprises; gear restrictions; a 105-58
day closed season from March to May; closed areas59
to protect juveniles and spawners; a minimum legal60
size of 69 mm carapace length (CL) and a prohibition61
on taking berried females. A detailed data-collecting62
system on the fishery has been established. The biolog-63
ical and fishery information are analysed at the Fish-64
eries Research Centre. The management regulations65
are annually revised by a Fisheries Management Com-66
mittee which comprises managers, decision-makers,67
users and scientists, and the final decisions are enforced68
b69
270
Historically, assessments of the spiny lobster71
resource in Cuba have been based on virtual population72
analysis (Puga et al., 1996), yield per recruit analy- 73
sis (Puga et al., 1995) and surplus production models 74
(Puga et al., 2003). Managers currently require advice 75
on the economic consequences of choosing from a76
number of alternative options for managing the fishery.77
The objectives of the present research were to apply78
a bioeconomic model to the fishery in the Gulf of79
Bataban´o, to explore some reference points and to per-80
form a risk assessment on the probability of achieving81
or exceeding them. Bioeconomic models have been82
applied to other spiny or rock lobster fisheries, such83
as New Zealand, Hawaiian, Archipelago and Mexico84
(Breen et al., 1994; Clarke et al., 1992; Seijo et al.,85
1991). General bioeconomic models forP. argusfish- 86
eries in Cuba, Brazil and Isla Mujeres (Mexico) were87
developed bySeijo et al. (2001). 88
2. Methods 89
2.1. Data sources 90
Catch, effort, proportions of exported products91
(fixed and variable), cost and spiny lobster price data92
were obtained from compulsory records from the fish-93
ing, processing and exporting enterprises. Effort data94
as boat fishing days are available since 1983 and catch95
data are available since 1928. The stock assessment96
w 02,97
b only98
y a Fisheries Inspection Unit (Puga and de Le´on,003).
FISH 1906 1–15
as performed with data for the period 1974–20ecause length frequency of landings is available

R. Puga et al. / Fisheries Research xxx (2005) xxx–xxx 3
since 1974. These length frequencies are converted99
from monthly landings by export size categories in the100
processing plants, as described byAlfonso et al. (1995).101
Mean values of proportions of different products cate-102
gories, costs and prices were estimated with statistics103
from 1999 to 2001.104
2.2. Parameters105
Natural mortality rate was assumed to be the same106
for all the age groups. It was estimated asM= 0.34107
using the growth parameters estimated byLeon108
et al. (1995), considered to be the most reliable for109
the species in its distribution area (Arce and de Le´on,110
2001), and a mean water temperature of 27◦C, using111
an empirical equation developed byCruz et al. (1981)112
for lobsters, similar to Pauly’s equation used for finfish113
(Pauly, 1980). There is also an estimate from Turks and114
Caicos Islands ofM= 0.36 using catch and effort data115
(Medley and Ninnes, 1997).116
The egg production was computed through size117
(age)-specific maturity and fecundity relations from118
previous studies (Cruz and de Le´on, 1991). Multi-119
ple spawning was modelled by assuming that females120
larger than 80 mm CL have two broods per year121
(Lipcius, 1985).122
Conversions between size (age) and weight were123
made with the length–weight relationship presented by124
Cruz et al. (1981).125
om-126
m n127
( s128
f nce129
and crew salary. Fixed cost comprises depreciation of130
boats, engines and fishing gears, administrative salary131
and opportunity cost on capital. Opportunity cost is132
defined bySeijo et al. (1998)as the net benefits that133
could have been achieved in the next best economic134
alternative of investment. Following the recommen-135
dation ofSparre and Willman (1993)andSeijo et al. 136
(1998), opportunity cost was estimated as a rate of the137
capital invested in the fishery and processing sectors,138
taking into account the real average interest rate of 11%139
from the Cuban banking sector. Opportunity cost of140
capital was calculated byBreen et al. (1994)using an 141
interest rate of 10% in the New Zealand fishery for142
Jasus edwarsii. Processing cost comprises transport,143
packing material, power and water, repair and mainte-144
nance, salary, depreciation of equipments and export145
tax. 146
All parameters used in the stock assessment and147
in the population dynamics model are presented in148
Tables 1–4. 149
2.3. Stock assessment 150
Length frequency of landings was converted to age151
structure of catches in numbers by a slicing method152
(Sparre andVenema, 1997) with the growth parameters 153
obtained byLeon et al. (1995). Sequential popula- 154
tion analysis (SPA) with the ADAPT framework was155
applied to the 1974–2002 matrix of catch-at-age groups156
f d 157
M in 158
n d the159
s mate160
TW
A ggs pe 3
>
W 981). Ega ork.
Economic parameters were computed as recended byAnderson (1986), Sparre and Willma
1993)andSeijo et al. (1998). Variable cost compriseuel and lubricants, food, ice, repair and maintena
able 1eight, egg production, selectivity and stock size at age
ge (year) Weight (kg) Egg production (efemale per year)
1 0.014 02 0.139 03 0.412 29614 0.781 353555 1.196 2290506 1.615 3795057 2.014 5069758 2.376 6229309 3.172 754359
eight estimates from length–weight relationship byCruz et al. (1nd de Le´on (1991). Selectivity and stock size from SPA in this w
FISH 1906 1–15
rom 1 to >9, using an Excel spreadsheet (Lassen anedley, 2000). The catch-per-unit effort (CPUE)umber was used as an index of abundance, antock sizes by age and year were used to esti
r Selectivity (relative toage 8 years)
Stock size in 198(thousands)
0.001 40836.40.385 27928.81.429 15874.22.149 6616.72.344 2257.81.867 736.81.600 289.51.000 122.40.500 109.8
g production estimates from maturity and fecundity results byCruz

4 R. Puga et al. / Fisheries Research xxx (2005) xxx–xxx
Table 2Set of biological parameters of the spiny lobster in the Gulf of Bataban´o fishery
Parameter Description Value Source
L∞ (males) (mm CL) Maximum asymptotic length 185 Leon et al. (1995)L∞ (females) (mm CL) 155 Leon et al. (1995)K (males) (year−1) Growth rate 0.23 Leon et al. (1995)K (females) (year−1) 0.19 Leon et al. (1995)t0 (males) (year) 0.44 Leon et al. (1995)t0 (females) (year) 0.37 Leon et al. (1995)M (year−1) Natural mortality rate 0.34q8 Catchability at age 8 years 1.16× 10⁻⁵ SPA in this workα Parameter of the Ricker stock–recruit relation 0.22226 SPA in this workβ Parameter of the Ricker stock–recruit relation −0.00214 SPA in this work
Table 3Economic parameters for the Gulf of Bataban´o lobster fishery, cal-culated from compulsory records from the fishing and processingenterprises between 1999 and 2001
Parameters Value Unit
Variable cost 171 US$/boat fishing dayFixed cost 24840 US$/boatProcessing cost 687 US$/t raw spiny lobsterFishing days per boat 173
logarithmic values of catchabilities (coefficients of pro-161
portionality between indices of abundance and absolute162
abundance) by age and year. Residuals from the matrix163
of catchabilities and the mean values by age were used164
to compute the minimum of the least-squares sum of165
residuals as the objective function, fitting the terminal166
fishing mortality rate for age group 8 years. Fishing167
mortality rates for ages 1–7 years in year 2002 were168
relative to age 8 years, on the assumption that the169
selectivity pattern remained stable during the period170
1997–2000.171
A Ricker (1954)stock–recruitment relationship was172
estimated from a non-linear fit to spawning and recruit-173
ment outputs from SPA. The spawning index used was174
the egg production at yeart, and the recruitment index 175
was the number of 1-year-old lobsters at yeart+ 1. 176
2.4. Population dynamics model 177
The model was developed on MS Excel spread-178
sheets. An age-based version of the Ricker yield per179
recruit model was used to generate long-term (equilib-180
rium) predictions on yield per recruit, profit per recruit181
and spawning per recruit, as a function of changes in182
the fishing effort. A dynamic age-structured version of183
the model was used for short-term predictions of catch,184
profit and egg production as responses to different lev-185
els of effort by year. 186
The dynamic model represents the flow of lobsters187
by age through the years, starting from the age structure188
in 1983 obtained from SPA. 189
Recruitment is determined by: 190
N1,t+1 = αSt e−βSt191
whereN1,t+1 is the number of individuals with age 1192
year at the start of the yeart+ 1,α andβ are the param- 193
eters from Ricker stock–recruitment relation andSt is 194
Table 4Industrial parameters for the Gulf of Bataban´o lobster fishery calculated from compulsory records from the processing and exporting enterprisesbetween 1999 and 2001
Proportion of differentproducts categories
Conversion factors from raw Price (US$ kg−1)
Pre-cooked whole lobster 0.621Frozen tails 0.309Frozen whole 0.049Alive 0.022
FISH 1906 1–15
material to products categories
0.926 12.120.320 27.870.980 12.24
1.000 12.32

R. Puga et al. / Fisheries Research xxx (2005) xxx–xxx 5
the egg production index at yeart.195
St =∑
NFa,tPEFa196
where NFa,t is the number of females with agea at the197
start of yeart and PEFa is the production of eggs per198
female per year by agea.199
The equations that describe the basic dynamics of200
the lobster fishery are:201
Na+1,t+1 = Na,t e−(Fa,t+M)202
whereNa,t is the number of individuals with agea at203
the start of yeart,Fa,t the age-specific fishing mortality204
rate at yeart andM is the natural mortality rate.205
Fishing mortality is calculated by age and time as206
follows:207
Fa,t = Sa/8F8,t208
whereSa/8 is the selectivity pattern by agea relative to209
age 8 years andF8,t is the fishing mortality rate at age210
8 years at yeart.211
F8,t = ftq8212
where ft is the fishing effort at yeart and q8 is the213
catchability coefficient at age 8 years.214
Catch is estimated on the assumption that it is taken215
instantaneously at the middle of the year:216
Ct =∑ (
(Na,t − Na+1,t+1)
(Fa,t
Fa,t + M
))Wa217
w218
2219
220
T221
w s222
o n223
f es224
a uct225
c lity226
o the227
l228
229
T230
where VC/f is the variable cost per unit of effort,ft the 231
fishing effort at yeart, FC/b the fixed cost per boat,bt 232
the number of boats at yeart, PCt raw the processing 233
cost per tonne of raw material andCt is the catch at 234
year t. The number of boats by year is estimated by235
means of the annual number of boat fishing days and236
the average figure of 173 fishing days per boat. 237
Total profits by year are then calculated as238
TPt = TRt −TCt, and the present value of profit over239
time was estimated taking into account a discount rate240
of 10%. 241
In a similar way, in the New Zealand fishery forJ. 242
edwarsii.Variable cost were assumed to depend on fish-243
ing mortality rate and fixed cost on the capital invested244
(Breen et al., 1994). They also used a discount rate245
of 10% to calculate the present value of profit over246
time. 247
2.6. Uncertainty and risk analysis 248
The deterministic equilibrium version of the model249
allows estimating some reference points usable for250
fishery management, while the stochastic dynamics251
version allows for uncertainties in input parameters252
and can evaluate the probabilities of achieving and253
exceeding reference points through Monte Carlo sim-254
ulation. Monte Carlo simulation is a convenient and255
extended tool to assess a model’s output given differ-256
ent types and levels of error in the model’s inputs as257
n n 258
( 259
s ses260
d ity261
f , 262
2 263
sti-264
m 265
266
er267
268
er269
270
sur-271
as272
273
rt 274
275
hereWa is the mean weight by age.
.5. Economic model
Total revenues are calculated according to:
Rt = Ct
∑PCpCFpPRp
hereCt is the catch at yeart, PCp the proportionf different product categoriesp, CFp the conversio
actors from raw material to each product categoripnd PRp are the prices per unit of weight by prodategoriesp. It should be noted that almost the totaf products are exported, so the consumption in
ocal market is irrelevant.Total costs are computed as:
Ct = VC
fft + FC
bbt + PCt rawCt
FISH 1906 1–15
oted byRestrepo et al. (1992), Francis and Shotto1997)andSeijo and Caddy (2000). The Monte Carloimulation approach is well suited for such analyue to the explicit control over the probability dens
unctions for uncertain input parameters (Legault et al.002).
In this work, the following reference points are eated:
fcurrent: average effort for the period 2000–2002;fmey/r: effort associated with maximum profit precruit;fmsy/r: effort associated with maximum yield precruit;fmed: effort associated with the observed medianvival ratio (N1/S) in a replacement line analysisexamined byMace and Sissenwine (1993);fhigh: a level of effort similar to the maximum effoobserved in the fishery.
6 R. Puga et al. / Fisheries Research xxx (2005) xxx–xxx
In the risk assessment performed byHobday and276
Punt (2001), about the Victorian southern rock lobster,277
J. edwarsiithe values for the parameters that determine278
age, natural mortality, egg production and selectivity279
were all assumed to be known exactly, and the future280
recruitment was determined by random sampling from281
the recruitments for the last 10 years of the assessment282
period.283
Simpfendorfer et al. (2000)assessed the status of the284
whiskery shark stock in southwestern Australia using285
an age-structured model. They conducted a risk analy-286
sis to determine the impact of future harvest strategies287
on biomass targets, and recruitment variability was288
assumed to be described by a normal distribution with289
CV = 20%.290
In the stochastic version of the CubanP. argus291
model, the values for the parameters that determine292
age, natural mortality and egg production were all293
assumed to be known exactly, while catchability and294
recruitment were considered as input parameters with295
uncertainty specified as log-normally distributed ran-296
dom variables. Since coefficients of variation from SPA297
were CV = 9.8% for catchability and CV = 18.4% for298
recruitment, coefficients of variation were assigned as299
10 and 20%, respectively, for both input parameters300
during Monte Carlo simulations.301
Each time the stochastic model was used, 2000 runs302
were made starting in the 1983 situation and projecting303
the population forward with the observed fishing effort304
during 1983–2002 and with three alternative levels of305
e306
the307
p han308
1 no309
fi cor-310
r rved311
m ysis312
( ple313
e lcu-314
l n be315
c -316
t For317
a hat318
c aight319
l s320
a321
r322
R f323
which can then be translated back to the SPR scale324
(Mace and Sissenwine, 1993). The replacement line is 325
defined as the line with a slope equal to the observed326
average survival ratio.Sissenwine and Shepherd (1987)327
referred to the fishing mortality rate that corresponds to328
the average survival ratio asF-replacement They pro- 329
posed estimating it from the median survival ratio, in330
which case it may be referred to, by the symbol,Fmed 331
(F-median). 332
3. Results 333
3.1. Stock assessment 334
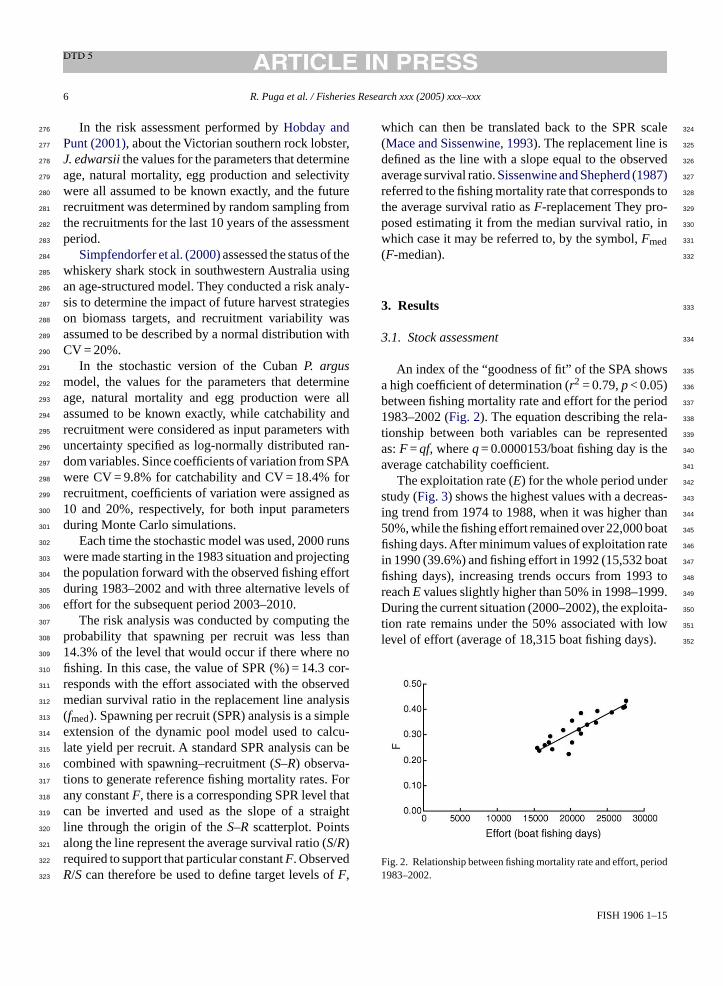
An index of the “goodness of fit” of the SPA shows335
a high coefficient of determination (r2 = 0.79,p< 0.05) 336
between fishing mortality rate and effort for the period337
1983–2002 (Fig. 2). The equation describing the rela-338
tionship between both variables can be represented339
as:F=qf, whereq= 0.0000153/boat fishing day is the340
average catchability coefficient. 341
The exploitation rate (E) for the whole period under 342
study (Fig. 3) shows the highest values with a decreas-343
ing trend from 1974 to 1988, when it was higher than344
50%, while the fishing effort remained over 22,000 boat345
fishing days.After minimum values of exploitation rate346
in 1990 (39.6%) and fishing effort in 1992 (15,532 boat347
fishing days), increasing trends occurs from 1993 to348
r 99.349
D ita-350
t low351
l ). 352
F riod1
ffort for the subsequent period 2003–2010.The risk analysis was conducted by computing
robability that spawning per recruit was less t4.3% of the level that would occur if there whereshing. In this case, the value of SPR (%) = 14.3esponds with the effort associated with the obseedian survival ratio in the replacement line analfmed). Spawning per recruit (SPR) analysis is a simxtension of the dynamic pool model used to ca
ate yield per recruit. A standard SPR analysis caombined with spawning–recruitment (S–R) observaions to generate reference fishing mortality rates.ny constantF, there is a corresponding SPR level tan be inverted and used as the slope of a strine through the origin of theS–R scatterplot. Pointlong the line represent the average survival ratio (S/R)equired to support that particular constantF. Observed/Scan therefore be used to define target levels oF,
FISH 1906 1–15
eachE values slightly higher than 50% in 1998–19uring the current situation (2000–2002), the explo
ion rate remains under the 50% associated withevel of effort (average of 18,315 boat fishing days
ig. 2. Relationship between fishing mortality rate and effort, pe983–2002.

FISH 1906 1–15
R. Puga et al. / Fisheries Research xxx (2005) xxx–xxx 7
Fig. 3. Annual time series of exploitation rate (solid line) and effort(dotted solid line) in the spiny lobster fishery of the Gulf of Bataban´o.
The egg production shows an increasing trend from353
562× 109 eggs in 1980 to 1191× 109 eggs in 1992354
(Fig. 4) and a subsequent decline to 666× 109 eggs in355
2000. The level of recruitment (N1) decreased in 33%356
during the period 1988–1998 related the maximum357
level observed during 1977–1987. Maximum recruit-358
ment occurred in 1983 (40.8× 10⁶) and minimum in359
1993 (23.9× 10⁶). A recruitment recovery seems to360
have occurred since 1998. This variation matches quite361
well with a juvenile abundance index from nursery362
areas and with a puerulus settlement index (Fig. 5)363
recorded byCruz et al. (1995).364
The Ricker stock–recruitment fit (Fig. 6) produced a365
dome-shaped curve that suggests a density-dependence366
effect between adults and juveniles. The maximum367
number of recruits is determined by the total fecundity368
of the parent stock, and the actual number of recruits369
depends on the destiny of the eggs produced by the370
F andr
Fig. 5. Annual anomalies of recruitment (solid line), juvenile abun-dance index (dashed line) and puerulus settlement index (dotted solidline).
Fig. 6. The fit of the Ricker stock–recruitment relationship with eggproduction and recruitment lagged 1 year.
spawning stock. This relationship allows predicting371
recruitment by means of the egg production during the372
previous year, with an acceptable coefficient of deter-373
minationr2 = 0.68 (p< 0.05). 374
The annual economic results of this fishery for 2002375
indicate that the spiny lobster fishery is a very profitable376
activity, which produces a profit equivalent to the 83%377
of the total revenue (Table 5). The mayor source of cost 378
Table 5Economic results for year 2002
US$ year−1 (millions)
Revenues 55.87Variable cost 2.93Fixed cost 2.91Processing cost 3.63Total cost 9.46Profit 46.41
ig. 4. Annual time series of egg production (dashed line)ecruitment (solid line).

8 R. Puga et al. / Fisheries Research xxx (2005) xxx–xxx
Fig. 7. Equilibrium curve of profit per recruit as a function of effortshowing some reference points. Closed circle,fcurrent; left dashedline, fmey/r; solid line,fmed; right dashed line,fhigh.
is the processing cost, which comprises 38% of the total379
cost, while variable and fixed cost represent 31% each380
one.381
3.2. Reference points382
The corresponding bioeconomic indicators pro-383
duced by the deterministic equilibrium version of the384
model are displayed inTable 6.385
The current status of the fishery and three levels of386
effort (fmey/r, fmed and fhigh) were chosen to be rep-387
resented in the equilibrium curve of profit per recruit388
(Fig. 7). According to this model, the long-term maxi-389
mum profit will be obtained with a higher fishing effort390
(24,016 boat fishing days) than the current one (aver-391
age of 18,315 boat fishing days in 2000–2002). On392
the other hand, bothfmed= 26,814 boat fishing days393
andfhigh = 30,000 boat fishing days, will produce lower394
profits, will reduce the spawning stock and will increase395
the exploitation rate over 50%.396
3.3. Predictions397
The ability of the model to fit the data was examined398
by comparing the observed data with the model pre-399
diction corresponding to the 50th percentile of Monte400
Carlo simulations (Fig. 8). From 2003 to 2010, the401
projections were based on the current level of effort.402
The model generally captures the changes over time in403
t als,404
w ari-405
a iated406
t407
Fig. 8. Observed catch (closed circles) for the period 1983–2002,50% percentile of predictions (solid line), and upper and lower 80%percentiles (dashed lines) from the dynamic model. From 2003 to2010, the projections are based on the current level of effort.
Three different levels of fishing effort for the period408
2003–2010 were chosen to show short-term predictions409
in an economic indicator, such as present value of profit410
(Fig. 9) and a biological one, such as SPR (%) (Fig. 10). 411
The three possible decisions suppose gradual incre-412
ments of effort to reach the specific reference points413
(fcurrent, fmey/r andfhigh) in year 2006. It can be noted414
that predictions for both variables, like the model pre-415
dictions for the catch, reflect interannual changes likely416
associated to variations in recruitment and therefore in417
the stock structure. 418
3.4. Risk analysis 419
The purpose of the risk analysis is to examine420
the implications of alternative levels of fishing effort421
Fig. 9. Short-term prediction of present value of profit from thedd
he catch, with acceptable 80% probability intervhile the projections for 2003–2010 show similar vtions than the observed in the past, likely assoc
o changes in recruitment.
FISH 1906 1–15
ynamic model for three scenarios of effort. Solid line,fcurrent; dottedashed line,fmey/r; dashed line,fhigh.

R. Puga et al. / Fisheries Research xxx (2005) xxx–xxx 9
Table 6Reference points and some bioeconomic results
Effort (boat fishing days) F (year−1) E (%) Y/R (g/R) Profit/R (US$/R) SPR (%)
fcurrent 18315 0.266 43.9 193.90 1.6950 24.5fmey/r 24016 0.349 50.6 199.62 1.7306 17.0fmsy/r 26405 0.384 53.0 200.02 1.7260 14.7fmed 26814 0.390 53.4 200.01 1.7244 14.3fhigh 30000 0.436 56.2 199.34 1.7050 11.9
Fig. 10. Short-term prediction of spawning per recruit from thedynamic model for three scenarios of effort. Solid line,fcurrent; dotteddashed line,fmey/r; dashed line,fhigh.
for the future status of the resource over an 8-year422
period. The implications of the different management423
actions are summarized by changes over time in the424
SPR (%).Fig. 11shows the annual probabilities that425
the egg production will be less than the replacement426
SPR (%) = 14.3 as a function of the three levels of427
Fig. 11. Annual probabilities that the egg production to be less thanthe replacement SPR (%) for three scenarios of effort. Solid line,fcurrent; dotted dashed line,fmey/r; dashed line,fhigh.
effort. Whit fcurrent the probability will never exceed 428
the 25%, butfmey/r will produce probabilities of (SPR 429
(%) < 14.3%) greater than 50% between 2008 and430
2010. The risk of exceeding (SPR (%) < 14.3%) is con-431
siderably higher forfhigh, with probabilities over 70% 432
since 2006. 433
4. Discussion 434
4.1. Stock assessment 435
The average catchability coefficient ofq= 436
0.0000153/boat fishing day is similar to the value437
of q= 0.0000124/trip in the FloridaP. argusfishery, 438
estimated with data fromMuller et al. (1997). The 439
exploitation rate ranged between 40 and 65% for the440
whole period, analogous to the case of FloridaP. argus 441
fishery, with exploitation rates between 41 and 60%.442
The fishing effort and the exploitation rate reached443
the highest values before 1989 (Fig. 3). The exploita- 444
tion rate was particularly high between 1974 and445
1978 when the closed season was reduced to 45 days446
and large quantities of undersized individuals were447
landed causing a growth overfishing during this period448
(Baisre and Cruz, 1994). Since 1979, the closed sea-449
son was lengthened to 90 days and the minimum450
legal size was strictly enforced, and landings gradu-451
ally increased to 8125 t in 1985. Fishing effort and452
therefore exploitation rate remain at low levels from453
1 ban454
e 455
or 456
p - 457
c by458
h , 459
1 sed460
s also461
FISH 1906 1–15
991 to 1994 because of bad conditions in the Cuconomy.
In 1990, the catch dropped (Fig. 8) because a porevious recruitment (Puga et al., 1991) probably assoiated with a high mortality of juveniles causedurricane Gilbert in September 1988 (Baisre and Cruz994) and with a large catch during the 1989 cloeason. The poor catches in 2000 and 2001 are

10 R. Puga et al. / Fisheries Research xxx (2005) xxx–xxx
likely related to high landings during the 1999–2000462
closed seasons.463
The hypothesis of a stock–recruitment model seems464
reasonable taking into account that phyllosoma larvae465
distribution and abundance (Alfonso et al., 1991) cou-466
pled quite well with water circulation patterns deter-467
mined byGarcıa et al. (1991a)in the oceanic waters468
off the Gulf of Bataban´o.Hernandez and Pi˜neiro (2003)469
also studied the sea surface water transport, turbulence,470
depth of the top of the thermocline, sea surface temper-471
ature and vertical stability in the same region. They472
concluded that downwelling and upwelling move-473
ments produce a so-called “cascade effect” that main-474
tains nutrients suspended, and they suggested that this475
effect contributes with larvae retention in the region.476
Roberts (1997)characterized South Cuba as an impor-477
tant downstream reef area, with a high likelihood of a478
larva finding a site on which to settle and live.Lindeman479
et al. (2001)reported new information on current pat-480
terns off southwest Cuba based on satellite-tracker481
drifter paths from 10 m depths. They found that four482
drifters spent 1, 3, 5 and 8 months, respectively, in483
various eddies off the Gulf of Bataban´o, suggesting484
possible larval retention, taking into account that lar-485
vae remain about 6–8 months in the ocean (Alfonso486
et al., 1991).Yeung et al. (2001)also concluded that in487
the Florida Keys, a retention pathway of 6–8 months is488
possible forP. arguslocal larvae, because of the circu-489
lation mechanisms determined by eddies and counter-490
current systems.491
le492
o fects493
o ob-494
s the495
f ther496
m ove-497
m al-498
i )499
d500
u ity-501
d stud-502
i tal503
c vel504
o 3)505
r een506
r of507
a the508
s uit-509
ment is large, and the overall stock abundance trends510
are fundamentally governed by recruitment changes.511
In Cuba, the construction of dams in numerous rivers512
flowing into south coast has surely reduced the nutrients513
discharge into the coastal zone, as has the drastic reduc-514
tion of fertilizers used in agriculture (Baisre, 2000). 515
Between 1986 and 2000, dam capacity increased by516
50%, while fertilizer utilization decreased by 80%.517
Large-scale hydrological alterations on land, such as518
river damming, could cause reduction of nutrient inputs519
to the sea (Jickells, 1998; Ittekkot et al., 2000), while 520
the reduction of nutrient runoff may actually reduce521
productivity of shellfish stocks (Caddy and Defeo, 522
2003). On the other hand, between 1996 and 2002 the523
fishing area has been affected by five hurricanes and524
one tropical storm. The consequences of these phe-525
nomenons for the decline of recruitment since 1988526
need to be examined. 527
A shown inTable 5, the spiny lobster fishery is very 528
profitable in Cuba, with profits about 80% of the total529
revenue, in contrast to the New Zealand fishery for red530
rock lobster (J. edwarsii) which was overcapitalized 531
and had to be rebuilt (Breen et al., 1994). 532
4.2. Reference points 533
Because of the decreasing trend of the recruitment534
and the uncertainty for it variation in the future, the535
reference points were estimated on a per recruit pre-536
cautory basis instead on an absolute basis. 537
been538
d SPR539
a s 540
o d 541
S s 542
a ent543
o ed544
a n 545
F 546
M 547
fi 548
g high549
r ent550
S ment551
P ions552
b sh-553
e the554
U shed555
It is a matter of high priority to investigate the rof density-dependent and density-independent efn the variations of recruitment in Cuban spiny lter stock. Density dependence could result fromeeding rate being reduced by the presence of oembers of the same population and also from ments due to habitat limiting both in quantity and qu
ty (Rose et al., 2001). InAustralia,Morgan et al. (1982escribed a stock–recruitment relationship forPan-lirus cygnusand believed that after settlement densependent relationships dominated. More recent
es (Caputi et al., 2001) have shown that environmenonditions could be the factor controlling the lef puerulus settlement.Ehrhardt and Sobreira (200eported a density-dependent relationship betwecruitment success and parent stock abundanceP.rgus in northeastern Brazil. They concluded thatignificance of the environmental signals on recr
FISH 1906 1–15
Reference points based on SPR (%) haveefined based on the relationship betweennd the survival ratiosR/S obtained from pairf stock–recruitment observations.Sissenwine anhepherd (1987)proposed thatFmed could be used abiological reference point for defining recruitm
verfishing. More recently,Fmed has been considers a limit reference point since atF levels higher thamed stocks can be expected to decline (Caddy andahon, 1995). After a survey of 91 sets ofS–Rdata for
sheries resources,Mace and Sissenwine (1993)sug-ested that high fecundity may be associated withesilience and therefore with low values of replacemPR (%). They reported that the Fisheries Managelans developed in the U.S. use overfishing definitased on threshold levels of SPR for 60% of the firies stocks. The definition of overfishing used in.S. stated that the resource is recruitment overfi

R. Puga et al. / Fisheries Research xxx (2005) xxx–xxx 11
when the egg production is below 10% of a non-fished556
population forHomarus americanusand 5% forP.557
argus(Addison, 1997).558
In their analysis about reference points for fisheries559
management,Caddy and Mahon (1995)remarked that560
the fisheries economic theory holds that there is an eco-561
nomic target reference point, the maximum economic562
yield (MEY), which occurs at the effort level yield-563
ing the greatest margin of revenue over cost from the564
resource. SinceFmey occurs at lower levels of effort565
thanFmsy, the use of this economic target reference566
point is less likely to result in biological overfishing567
tan the use ofFmsy. Results inTable 6show that fish-568
ing effort is lower and SPR (%) is higher forFmey than569
Fmsy.570
In this case,Fmedalso exceedsFmey/r, so it does not571
make sense to apply a fishing mortality rate ofFmed572
since it will produce less profit per recruit. On the other573
hand,Fmed is tied to the observed history and will be574
risky if the fishery is around the depleted situation.575
Helser et al. (2002)stated that the Delaware Bay576
blue crab stock is not currently being overfished, since577
Fcurrent is belowFmed with 80% confidence.578
An economic tool is essential in fisheries manage-579
ment, and maximizing the net present value over an580
indefinite time horizon, must be made the primary581
goal of management (Hannesson, 2001), where eco-582
nomic efficiency is the over-riding policy objective.583
Therefore, to keep the exploitation around theFmey/r584
level must be a priority for the lobster fishery in585
C586
4587
for588
1 effi-589
c e-590
s ory591
o was592
l ictly593
e -594
t nd595
1 ugh596
t h597
l his598
i599
K .600
(601
In the Cuban fishery for spiny lobster, the fishing602
effort does not follow the model proposed bySmith 603
(1969) because a Fisheries Management Committee604
controls the effort under a limited-entry regime. Sim-605
ulations for three levels of effort show that predictions606
of catch and present value of profit are similar for607
fhigh andfmey/r with increases till 2005, and with sub-608
sequent declines followed by recovery in 2009. For609
fcurrent, the predictions of catch and present value of610
profit show lower levels with increases to 2004 and pos-611
terior declines.Fig. 11illustrates howfhigh will reduce 612
the egg production below the replacement SPR (%)613
since 2007 and f mey/r will also exceed this reference614
point in years 2009 and 2010. 615
Mace and Sissenwine (1993)andCaddy and Mahon 616
(1995)pointed out that SPR decreases monotonically617
as fishing intensity increases, whileBreen et al. (1994) 618
concluded that the economic performance in the New619
Zealand fishery for red rock lobster can vary widely 620
with recruitment. 621
4.4. Uncertainty and risk analysis 622
The reasons for risk analysis are related to the need623
of better ways to advise fishery managers and to the624
adoption of the precautionary approach (Francis and 625
Shotton, 1997). One stage in dealing with risk is the626
way fishery managers take uncertainty into account in627
making decisions. In this paper, a risk assessment is628
conducted in the context of the formulation of advice629
f of630
t 631
vari-632
a een633
s 634
S 635
ta,636
s red.637
N og-638
n ent639
r od-640
e that641
e ely642
d ort643
o risk644
a tion645
p nder-646
t of 647
uba.
.3. Predictions
The model predicts the observed catch983–2002 with an acceptable determination coient of r2 = 0.72 (p< 0.05). The main outliers corrpond to 1985 with the maximum catch in the histf the fishery after a period when the closed season
engthened and the minimum legal size was strnforced (Baisre and Cruz, 1994), 1990 with a dras
ic decline after the Hurricane Gilbert in 1988 a999 when the tropical storm Irene crossed thro
he Gulf of Bataban´o in October and provoked higandings during the mass autumnal migration. Ts a typical phenomenon described byHerrkind andanciruk (1978)and studied in Cuba byGarcıa et al
1991b).
FISH 1906 1–15
or fishery managers, in the form of an evaluationhe expected effects of alternative levels of effort.
One of the most fundamental sources of naturalbility in marine resources is the relationship betwpawning stock size and recruitment (Mace andissenwine, 2002).Due to the complexity of stock–recruitment da
tock–recruitment relationships were largely ignoowadays, recruitment overfishing is widely recized as a reality and consequently, stock–recruitmelationships are a primary focus of uncertainty mlling. In particular for lobsters, scientists agreelucidating stock–recruitment relationship is extremifficult, but it is suggested that defining some sf stock–recruitment relationship is essential ifnalysis of the consequences of different exploitaatterns and management strategies is to be u
aken (Addison, 1997). Another important source

12 R. Puga et al. / Fisheries Research xxx (2005) xxx–xxx
uncertainty associated with human activities includes648
changes in catchability (Mace and Sissenwine, 2002).649
Although simple models may be biased, they tend650
to be more statiscally stable than more complex mod-651
els. And even in complex models, there is a possibility652
that some important aspect of the dynamics of the sys-653
tem will be excluded or misrepresented (Mace and654
Sissenwine, 2002). In this paper, uncertainty in the655
model is based on recruitment and catchability histor-656
ical variations on the assumption that the parameters657
that determine age, natural mortality and egg produc-658
tion were known exactly.Allowing for uncertainty in all659
of these parameters is beyond the scope of the current660
study, although any such allowance would probably661
have led to wider probability intervals in the predic-662
tions.663
Variability in the projections during the assessment664
of king and Spanish mackerel is derived from the future665
recruitment values and the future natural mortality rate666
(Legault et al., 2002). Future recruitment is generated667
from a log-normal distribution with mean and variance668
set at the values from the historical recruitments esti-669
mated by the ADAPT framework.670
Because of the fluctuation of recruitment and catch-671
ability, the annual risk to achieve or exceed a reference672
point for fishery management could vary between years673
for the same level of effort in the Cuban spiny lobster674
fishery. Shepherd (2002)used an age-based popula-675
tion model in the stock assessment of the Atlantic676
striped bass. The incoming annual recruitment was ran-677
d bu-678
t rate679
t also680
f sen681
b the682
s ly683
d684
il-685
i s in686
c be687
b688
5689
ore690
d hery691
t lable692
from the monitoring program. Although the model is693
simple in form, it allows biological and economic indi-694
cators of interest to managers to be estimated, together695
with the uncertainty associated with the predictions.696
Future research should be conducted to develop a more697
complex model, taking into account environmental698
effects and fluctuations over time in parameters, such699
as growth and natural mortality rates. 700
Exploitation of spiny lobster in Cuba is a very prof-701
itable activity. If the main aim of the fishery is to702
maximize profits in a sustainable way, the effort must703
be limited at the level of maximum economic yield.704
Nevertheless, the status of the resource and the risk of705
reducing SPR below the replacement SPR (%) need to706
be updated regularly. 707
The annual exploitation rate of the limited-entry708
rock lobster fishery of Western Australia (P. cygnus) 709
is controlled by constraining the total allowable effort.710
The model developed byHall (1997)allows the eval- 711
uation of alternative levels of fishing effort within the712
management zone, providing managers and industry713
with a tool to explore alternative harvest strategies. 714
Mackerel assessments in the Gulf of Mexico are715
conducted annually such that the following year the716
total acceptable catch, or quota, can be chosen by the717
management councils (Legault et al., 2002). Taking 718
into account the results of this paper, the assessment of719
the Cuban fishery for lobster should be updated annu-720
ally, the annual fishing effort needs to be planned in721
consequence by the Fisheries Management Commit-722
t the723
F ved724
b by725
b self726
c lems727
( ds728
t ene-729
fi into730
a r the731
fi , 732
2 733
A 734
aid735
o p 736
h s on737
omly chosen from log-normal recruitment distriions bounded by the levels occurring under modeo high levels of spawning stock biomass. Theyound that the probabilities of exceeding the choenchmark level were different between years forame targetF during a 10-year projection period, likeue to variations in the abundance-at-age values.
Maximizing catch, minimizing depletion probabty and limiting the range of year-to-year changeatch limits, are three conflicting aims that have toalanced (Holt, 1998).
. Conclusions
The proposed model provides a tool for metailed analyses of the Cuban spiny lobster fis
hrough the use of fishery statistics and data avai
FISH 1906 1–15
ee, and the final decisions must be enforced byisheries Inspection Unit. It could be easily achiey assigning a maximum number of fishing daysoat in each fishing enterprise. Limited entry by itannot be expected to solve all management probCharles, 2002). The permitted effort in a year neeo be determined with care so as to optimize the bts from the resource in a sustainable way, takingccount the status of the resource, the objectives foshery and the needs of the interest groups (Cochrane002).
cknowledgments
This work has been made possible with thef FAO-DANIDA through a Bioeconomic Workshoeld in Cuba, 1995, and the Regional Workshop

R. Puga et al. / Fisheries Research xxx (2005) xxx–xxx 13
Management of the Spiny Lobster Fisheries in the738
WECAFC area held in Belize, 1997, and Mexico, 1998.739
The first author is a Ph.D. student in Centra de Inves-740
tigaciones Biol´ogicas del Noroeste (CIBNOR) and he741
has a grant (#182872) of Consejo Nacional de Cien-742
cia y Tecnolog´ıa (CONACYT) of Mexico. Funding743
by Ministerio de la Industria Pesquera (MIP) of Cuba744
during this project is also greatly appreciated.We grate-745
fully acknowledge Dr. Juan Carlos Seijo (CINVES-746
TAV, Mexico) for his assistance in bioeconomic mod-747
elling, Dr.Victor Restrepo (ICCAT, Spain) and Dr. Paul748
Medley (UK) for their assistance in stock assessment749
methods. We also thank Dr. Silvia Salas (CINVES-750
TAV, Mexico), Dr. Nick Caputi (Western Australian751
Marine Research Laboratories) and the two anony-752
mous reviewers, for their valuable revisions of the753
manuscript.754
References755
Addison, J.T., 1997. Lobster stock assessment: report from a work-756
shop. I. Mar. Freshwater Res. 48, 941–944.757
Alfonso,A., Sotomayor, R., Cruz, R., Puga, R., de Le´on, M.E., 1995.758
Software para la evaluaci´on de la biolog´ıa y la pesquer´ıa de la759
langosta (P.argus) en Cuba. Rev. Cub. Invest. Pesq. 19 (2), 77–81.760
Alfonso, I., Frıas, M.P., Baisre, J.A., Campos, A., 1991. Distribuc´ıon761
y abundancia de larvas de la langostaPanulirus argusen aguas762
alrededor de Cuba. Rev. Invest. Mar. 12 (1–3), 5–19.763
Anderson, L.G., 1986. The Economics of Fisheries Management,764
revised and enlarged ed. University Press, Johns Hopkins.765
e766
e767
768
769
ries770
ish.771
772
. In:773
an-774
775
ing776
777
ter778
779
s on780
781
782
ivity783
rate784
785
an-786
787
Charles, A.T., 2002. Use rights and responsible fisheries; limit-788
ing access and harvesting trough rights-based management. In:789
Cochrane, K.L. (Ed.), A Fishery Manager’s Guidebook. Man-790
agement Measures and Their Application. FAO Fish. Tech. Pap.791
424, 131–158. 792
Clarke, R.P., Yoshimoto, S.S., Pooley, S.G., 1992. A bioeconomic793
analysis of the Northwestern Hawaiian islands lobster fishery.794
Mar. Resour. Econ. 7, 114–140. 795
Cochrane, K.L., 2002. The use of scientific information in the design796
of management strategies. In: Cochrane, K.L. (Ed.), A Fishery797
Manager’s Guidebook. Management Measures and Their Appli-798
cation. FAO Fish. Tech. Pap. 424, 95–130. 799
Cruz, R., Phillips, B.F., 1994. The artificial shelters (pesqueros)800
used for the spiny lobster (Panulirus argus) fisheries in Cuba. 801
In: Phillips, B.F., Cobb, J.S., Kittaka, J. (Eds.), Spiny Lob-802
ster Management. Fishing News Books, London, pp. 323–803
339. 804
Cruz, R., de Le´on, M.E., 1991. Din´anica reproductiva de la langosta805
(Panulirus argus) en el archipielago cubano. Rev. Invest. Mar. 12 806
(1–3), 234–245. 807
Cruz, R., Coyula, R., Ramirez, A.T., 1981. Crecimiento y mortali-808
dad de la Iangosta espinosa (Panulirus argus) en la plataforma 809
suroccidental de Cuba. Rev. Cub. Invest. Pesq. 6 (4), 89–810
119. 811
Cruz, R., Puga, R., de Le´on, M.E., 1995. Prediction of commercial 812
catches of the spiny lobsterPanulirus argusin the Gulf of Bata- 813
bano, Cuba. Crustaceana 68 (2), 238–244. 814
Ehrhardt, N.M., Sobreira, C.A., 2003.An assessment of the Brazilian815
spiny lobster,P. argus, fishery. FAO Fish. Rep. 715, 68–74. 816
Francis, R.I.C.C., Shotton, R., 1997. “Risk” in fisheries management:817
a review. Can. J. Fish. Aquat. Sci. 54, 1699–1715. 818
Garcıa, C., Chirino, A., Rodr´ıguez, J.P., 1991a. Corrientes819
geostroficas en la ZEE al sur de Cuba. Rev. Invest. Mar. 12 (1–3),820
29–38. 821
Garcıa, C., Hern´andez, B., Baisre, J.A., Cruz, R., 1991b. Factores822
823
est.824
825
H f dif-826
827
water828
829
H fish-830
ds.),831
lish-832
833
H ion-834
y blue835
or-836
ries837
838
H sur839
840
H ster,841
ien-842
on,843
844
FISH 1906 1–15
climaticos en las pesquer´ıas cubanas de langosta (Panulirusargus): su relacion con las migraciones masivas. Rev. InvMar. 12 (1–3), 131–139.
all, G.N., 1997. Delay-difference model to estimate the catch oferent categories of the western rock lobster (Panulirus cygnus)for the two stages of the annual fishing season. Mar. FreshRes. 48, 949–958.
annesson, R., 2001. The role of economic tools in redefiningeries management. In: Pitcher, T.J., Hart, P.J.B., Pauly, D. (EReinventing Fisheries Management. Kluwer Academic Pubers, Dordrecht, pp. 251–260.
elser, T.E., Sharov, A., Kahn, D.M., 2002. A stochastic decisbased approach to assessing the status of the Delaware Bacrab stock. In: Berkson, J.M., Kline, L.L., Orth, D.J. (Eds.), Incporating Uncertainty into Fisheries Models. American FisheSociety Simposium 27, pp. 63–82.
ernandez, B., Pi˜neiro, R., 2003. Hundimiento de las aguas alde Cuba. Invest. Mar., Valpara´ıso 31 (1), 33–49.
errkind, W.F., Kanciruk, J., 1978. Mass migration of spiny lobPanulirus argus, (Crustacea: Palinuridae): Synopsys and Ortation. In: Schmidt, S.K., Keeton, W.T. (Eds.),Animal MigratiNavigation and Homing. New York, 430–439.
Arce, A.M., de Leon M.E., 2001. Biology. In: Report on thFAO/DANIDA/CFRAMP/WECAFC Regional Workshop on thAssessment of the Caribbean Spiny Lobster (Panulirus argus).FAO Fish. Rep. 619, 17–25.
Baisre, J.A., 2000. Chronicles of Cuban marine fishe(1935–1995). Trend analysis and fisheries potential. FAO FTech. Pap. 394, 1–26.
Baisre, J.A., Cruz, R., 1994. The Cuban spiny lobster fisheryPhillips, B.F., Cobb, J.S., Kittaka, J. (Eds.), Spiny Lobster Magement. Fishing News Books, London, pp. 119–132.
Breen, P.A., Gilbert, D.J., Chant, K., 1994. Bioeconomic modellof the New Zealand fishery for the red rock lobsters (Jasusedwar-sii). In: Phillips, B.F., Cobb, J.S., Kittaka, J. (Eds.), Spiny LobsManagement. Fishing News Books, London, pp. 302–310.
Caputi, N., Chubb, C.C., Pearce, A., 2001. Environmental effectrecruitment on the western rock lobster,Panulirus cygnus. Mar.Freshwater Res. 52, 1167–1174.
Caddy, J.F., Defeo, O., 2003. Enhancing or restoring the productof natural populations of shellfish and other marine invertebresources. FAO Fish. Tech. Pap. 448, 1–159.
Caddy, J.F., Mahon, R., 1995. Reference points for fisheries magement. FAO Fish. Tech. Pap. 347, 1–83.

14 R. Puga et al. / Fisheries Research xxx (2005) xxx–xxx
Hobday, D., Punt, A.E., 2001. Size-structured population modelling845
and risk assessment of the Victorian southern rock lobster,Jasus846
edwarsiifishery. Mar. Freshwater Res. 52, 1495–1508.847
Holt, S.J., 1998. Points of view. Fifty years on. Rev. Fish Biol. Fish.848
8, 357–366.849
Ittekkot,V., Humborg, C., Sch¨afer, P., 2000. Hydrological alterations850
and marine biogeochemistry: a silicate issue? BioScience 50 (9),851
776–782.852
Jickells, T.D., 1998. Nutrient biogeochemistry of the coastal zone.853
Science 281, 217–222.854
Lassen, H., Medley, P., 2000.Virtual population analysis—a practical855
manual for stock assessment. FAO Fish. Tech. Pap. 400, 1–129.856
Legault, C.M., Powers, J.E., Restrepo, V.E., 2002. Mixed Monte857
Carlo/bootstrap approach to assessing king and Spanish mack-858
erel in the Atlantic and Gulf of Mexico: its evolution and impact.859
In: Berkson, J.M., Kline, L.L., Orth, D.J. (Eds.), Incorporating860
Uncertainty into Fisheries Models. American Fisheries Society861
Simposium 27, pp. 37–44.862
de Leon, M.E., Cruz, R., Puga, R., 1995. Actualizaci´on de la edad863
y el crecimiento de la langosta espinosaPanulirus argus. Rev.864
Cub. Invest. Pesq. 19 (2), 10–15.865
Lindeman, K.C., Lee, T.N., Wilson, W.D., Claro, R.,Ault, J.S., 2001.866
Transport of larvae originating in southwest Cuba and the Dry867
Tortugas: evidence for partial retention in grunts and snappers.868
Proc. Gulf Caribb. Fish. Inst. 52, 732–747.869
Lipcius, R.N., 1985. Size-dependent reproduction and molting in870
spiny lobsters and other long-lived decapods. In: Wenner, A.871
(Ed.), Crustacean Issues, vol. 3. Factors in Adult Growth. Rot-872
terdam, Balkema, pp. 129–148.873
Mace, P.M., Sissenwine, M.P., 1993. How much spawning per recruit874
is enough? In: Smith, S.J., Hunt, J.J., Rivard, D. (Eds.), Risk875
Management Evaluation and Biological Reference Points for876
Fisheries Management. Can. Spec. Pub. Fish. Aquat. Sci. 120,877
101–118.878
Mace, P.M., Sissenwine, M.P., 2002. Coping with uncertainty: evo-879
ent.880
ing881
ciety882
883
M pu-884
d885
886
M ent887
)888
889
M val-890
ter,891
tion892
893
P de894
n895
79.896
P tality,897
n 175898
899
P n900
ment901
of Caribbean Spiny Lobster Fisheries in the, WECAF Area. FAO902
Fish. Rep. 715, 85–91. 903
Puga, R., de Le´on, M.E., Cruz, R., 1991. Evaluaci´on de la Pesquer´ıa 904
de langosta espinosaPanulirus argusen Cuba. Rev. Invest. Mar. 905
12 (1–3), 286–294. 906
Puga, R., de Le´on, M.E., Cruz, R., 1995. Estado de explotaci´on y 907
estructura poblacional de la langosta espinosaPanulirus argus 908
en Cuba. Rev. Cub. Invest. Pesq. 19 (2), 41–49. 909
Puga, R., de Le´on, M.E., Cruz, R., 1996. Catchability of the 910
main fishing methods in the Cuban fishery of the spiny lobster911
Panulirus argus, Latreille, 1804, and implications for man- 912
agement (Decapoda, Palinuridae). Crustaceana 69 (4), 703–913
718. 914
Puga, R., de Le´on, M.E., Gonz´alez-Yanez, A.A., Baisre, J.A., 2003. 915
Aplicacion de un modelo din´amico de biomasa en la evaluaci´on 916
bioeconom´ıca de la pesqueria de langosta en Cuba. Rev. Cub.917
Invest. Pesq. 23 (1), 54–57. 918
Restrepo, V., Hoening, J.M., Powers, J.E., Baird, J.W., Turner, S.C.,919
1992. A simple simulation approach to risk and cost analysis,920
with applications to swordfish and cod fisheries. Fish. Bull. (US)921
90, 736–748. 922
Ricker, W.E., 1954. Stock and recruitment. J. Fish. Res. Bd. Can. 11,923
559–623. 924
Roberts, C.M., 1997. Connectivity and management of Caribbean925
coral reefs. Science 278 (5342), 1454–1560. 926
Rose, K.A., Cowan Jr., J.H., Winemiller, K.O., Myers, R.A., Hilborn,927
R., 2001. Compensatory dependence in fish populations: impor-928
tance, controversy, understanding and prognosis. Fish Fish. 2,929
293–327. 930
Seijo, J.C., Caddy, J.F., 2000. Uncertainty in bio-economic reference931
points and indicators of marine fisheries. Mar. Freshwater Res.932
51, 477–483. 933
Seijo, J.C., Defeo, O., Salas, S., 1998. Fisheries bioeconomics. The-934
ory, modelling and management. FAO Fish. Tech. Pap. 368,935
1–108. 936
S 937
938
t. 939
940
S co-941
C 942
bean943
– 944
945
S sess-946
J.M.,947
to948
27,949
950
S ess-951
i 952
953
S ective954
Can.955
956
S con.957
958
lution of the relationship between science and managemIn: Berkson, J.M., Kline, L.L., Orth, D.J. (Eds.), IncorporatUncertainty into Fisheries Models. American Fisheries SoSimposium 27, pp. 9–28.
edley, P.A.H., Ninnes, C.H., 1997. A recruitment index and polation model for spiny lobster (Panuilrus argus) using catch aneffort data. Can. J. Fish. Aquat. Sci. 54, 1414–1421.
organ, G.R., Phillips, B.F., Joll, L.M., 1982. Stock and recruitmrelationships inPanulirus cygnusthe commercial rock (spinylobster of Western Australia. Fish. Bull. 80 (3), 475–486.
uller, R.G., Hunt, J.H., Matthews, T.R., Sharp, W.C., 1997. Euation of effort reduction in the Florida Keys spiny lobsPanulirus argus, fishery using and age-structured populaanalysis. Mar. Freshwater Res. 48, 1131–1136.
aez, J., Revilla, N., 1991. Relaci´on entre la captura por unidadarea de la langosta (Panulirus argus) y los diferentes biotopos eel Golfo de Bataban´o, Cuba. Rev. Invest. Mar. 12 (1–3), 269–2
auly, D., 1980. On the interrelationships between natural morgrowth parameters and mean environmental temperature ifish stocks. J. CIEM 39 (3), 175–192.
uga, R., de Le´on, M.E., 2003. La pesquer´ıa de la langosta eCuba. In: Report of the Second Workshop on the Manage
FISH 1906 1–15
eijo, J.C., Salas, S., Arceo, P., Fuentes, D., 1991. An´alisis bioe-conomico de metodos alternativos de captura de langosta (Pan-ulirus argus) de la plataforma continental deYucat´an. Rev. InvesMar. 12 (1–3), 300–308.
eijo, J.C., P´erez, E., Puga, R., de Almeida R.C., 2001. Bioenomics. In: Report on the FAO/DANIDA/CFRAMP/WECAFRegional Workshop on the Assessment of the CaribSpiny Lobster (Panulirus argus). FAO Fish. Rep. 619, 115135.
hepherd, G.R., 2002. Incorporating uncertainty into stock asments: a case study of Atlantic striped bass. In: Berkson,Kline, L.L., Orth, D.J. (Eds.), Incorporating Uncertainty inFisheries Models. American Fisheries Society Simposiumpp. 45–62.
impfendorfer, C.A., Donohue, K., Hall, N.G., 2000. Stock assment and risk analysis for the whiskery shark (Furgaleus mack(Whitley)) in south-western Australia. Fish. Res. 47, 1–17.
issenwine, M.P., Shepherd, J.G., 1987. An alternative perspon recruitment overfishing and biological reference points.J. Fish. Aquat. Sci. 44, 913–918.
mith, V.L., 1969. On models of commercial fishing. J. Polit. E77, 181–198.

R. Puga et al. / Fisheries Research xxx (2005) xxx–xxx 15
Sparre, P.,Venema, S.C., 1997. Introducci´on a la evaluaci´on de recur-959
sos pesqueros tropicales. Parte 1. Manual. FAO Fish. Tech. Pap.960
306.2, 1–440.961
Sparre, P., Willman, R., 1993. Software for bio economic analysis962
of fisheries, BEAM 4. Analytical Bioeconomic Simulation of963
Space Structured Multi Species and Multi Fleet Fisheries, vol. 1:
Description of Model; vol. 2: User’s Manual. FAO Comput. Inf. 964
Ser. (Fish.) 3 (1), 1–186. 965
Yeung, C., Jones, D.L., Criales, M.M., Jackson, T.L., Richards, W.J.,966
2001. Influence of costal eddies and counter-currents on the influx967
of spiny lobster,Panulirus argus, postlarvae into Florida Bay. 968
Mar. Freshwater Res. 52, 1217–1232. 969
FISH 1906 1–15
Copyright © 2022 FDOKUMEN