The Role of Biofilm Growth in Bacteria-Facilitated Contaminant Transport in Porous Media
Upload
independentCategory
view
2download
0
Biodegradation during contaminant transport in porous media:
8. The influence of microbial system variability on transport
behavior and parameter determination
M. L. Brusseau,1,2 S. K. Sandrin,3 L. Li,1 I. Yolcubal,4 F. L. Jordan,1 and R. M. Maier1
Received 15 March 2005; revised 5 October 2005; accepted 17 January 2006; published 15 April 2006.
[1] The impact of microbial system variability on the biodegradation and transportbehavior of a model solute, salicylate, was investigated with a series of miscibledisplacement experiments. Four systems of increasing complexity were employed: asterilized, well-sorted sand inoculated with a single bacterial isolate, a sterilized soilinoculated with the same isolate, and two soils, each of which contained an indigenousmultiple-population community of bacteria. The experiments were conducted in replicate(three or four experiments per set) and with paired controls. The biodegradation andtransport behavior of salicylate exhibited a small degree of variability among the replicatesfor the two inoculated systems and a relatively large degree of variability for the twoindigenous systems. The greater variability observed for the two indigenous systems isattributed primarily to greater variability of microbial system properties, such as initial celldensity, metabolic status, and community composition. Values for maximum specificgrowth rate coefficient, mean lag time, and lag time variance were determined by modelcalibration to the measured breakthrough curves and compared to values obtained frombatch experiments. Reasonable correspondence was observed between the two sets ofvalues for both the inoculated and indigenous systems. The maximum specific growth ratecoefficient exhibited a relatively small degree of uncertainty for all four systems, whereasgreater uncertainty was associated with the lag time mean and variance. The variability incalibrated parameters among each set of replicate experiments was significantly greaterthan the uncertainty associated with the individual experiment calibrations and themeasured input parameters. These results illustrate that variability inherent to naturalmicrobial systems can cause variability in transport behavior even under controlledlaboratory conditions and concomitantly enhance the uncertainty of biokinetic parametersobtained from laboratory studies.
Citation: Brusseau, M. L., S. Sandrin, L. Li, I. Yolcubal, F. Jordan, and R. Maier (2006), Biodegradation during contaminant
transport in porous media: 8. The influence of microbial system variability on transport behavior and parameter determination, Water
Resour. Res., 42, W04406, doi:10.1029/2005WR004112.
1. Introduction
[2] Characterizing the transport behavior of biodegradablecompounds is critical to evaluating their long-term fate inthe subsurface and for the use of bioremediation and natural-attenuation-based methods to remediate contaminated sites.One major challenge is the variability of microbial, chemical,and physical system properties, and the level of effortrequired to adequately characterize that variability. Thequestion of system variability is especially pertinent tosituations for which microbial processes are significant,
given the variability inherent in biological systems. Thisvariability greatly influences site characterization, riskassessment, and mathematical modeling.[3] Mathematical modeling is an integral component
of site characterization, risk assessment, and remediationsystem planning and performance evaluation. The issue ofparameter uncertainty is central to all mathematical model-ing activities. Parameter uncertainty, and the resultantuncertainty in model output, has long been investigatedfor modeling flow and nonreactive solute transport in thesubsurface. Conversely, the impact of uncertainty in reac-tion-related parameters on contaminant transport modelinghas only recently begun to receive full attention [e.g.,Steinberg et al., 1997; Abbaspoura et al., 1998; McNabband Dooher, 1998; Tebes-Stevens and Valocchi, 2000;Thornton et al., 2001]. Parameter uncertainty issues areparticularly relevant to the transport of biodegradablecontaminants, as the coupling of hydrodynamic, chemical,and microbiological processes results in significant com-plexity, with numerous sources of variability and attendantuncertainty in associated parameters.
1Department of Soil, Water and Environmental Science, University ofArizona, Tucson, Arizona, USA.
2Department of Hydrology and Water Resources, University of Arizona,Tucson, Arizona, USA.
3Science Outreach Program, University of Wisconsin-Oshkosh, Osh-kosh, Wisconsin, USA.
4Department of Geological Engineering, Kocaeli University, Izmit,Turkey.
Copyright 2006 by the American Geophysical Union.0043-1397/06/2005WR004112$09.00
W04406
WATER RESOURCES RESEARCH, VOL. 42, W04406, doi:10.1029/2005WR004112, 2006
1 of 15

[4] Laboratory studies, using samples collected froma site, are often conducted to characterize contaminantbiodegradation and transport behavior in support of siteremediation activities. These studies also serve as sourcesof biokinetic parameters (degradation rate coefficients,microbial growth coefficients) used for field-scale modelingefforts. The representativeness of laboratory-derived bio-degradation measurements for field-scale applications is acritical issue [e.g.,Madsen, 1991; Chapelle et al., 1996] thathas yet to be fully resolved. In addition, while the sensitivityof model output to biokinetic parameter variability has beenexamined to some extent [e.g., Chen et al., 1992; Brusseauet al., 1999; Tebes-Stevens and Valocchi, 2000], the degreeof uncertainty associated specifically with laboratory-deter-mined biokinetic parameters has received scant attention.[5] Parameter uncertainty results from at least three major
sources, the model calibration process, measurement uncer-tainty, and sample variability associated with spatial andtemporal variability of field-scale properties. The latterfactor, while of great significance, is beyond the scope ofthis study. Model calibration can contribute to parameteruncertainty through issues such as parameter cross correla-tion and nonuniqueness of solutions, and the use of inappro-priate models. The influence of model calibration onbiokinetic parameter uncertainty has been discussed for batch[Grady et al., 1996; Liu and Zachara, 2001] and column[Brusseau et al., 1992; Li et al., 2001] systems. Measure-ment-associated uncertainty is likely to be of especially greatsignificance for microbial systems, incorporating the effectsof factors such as variability in metabolic status, condition-specific sensitivity, intrapopulation variability, and commu-nity heterogeneity and dynamics, in addition to typicalmeasurement errors. The impact of microbial system vari-ability on the uncertainty of laboratory-determined biokineticparameters does not appear to have been examined to anygreat extent, especially for column-based experiments. Thisis illustrated by the fact that experiment replication was notemployed in the vast majority of column-based biodegrada-tion studies reported in the literature.[6] Laboratory biodegradation studies are typically con-
ducted using either batch or column methods. The corre-spondence of results obtained with the two methods, or lackthereof, is another issue of interest. Comparisons of batchand column results are often evaluated in terms of biokineticparameters. The few studies that have investigated this issuehave produced conflicting results in that similar biokineticcoefficients have been obtained in some cases, but not inothers [Angley et al., 1992; Estrella et al., 1993; Kelly et al.,1996; Langner et al., 1998; Guo and Wagenet, 1999; Guoet al., 1999; Li et al., 2001; Park et al., 2001; Phanikumar
et al., 2002; Alshafie and Ghoshal, 2003]. The observeddifferences between batch and column parameter valueshave been attributed to several factors, including differencesin hydrodynamic conditions, substrate supply, and nutrientavailability. The comparison of batch and column resultscan be complicated by the use of simplified models, such asthose based on first-order degradation, that are oftenemployed to represent biodegradation processes. The bio-kinetic parameters associated with such models are gener-ally composite terms, incorporating the influence ofmultiple properties and processes, some of which are likelyto vary from one experiment to another, as well as betweenbatch and column systems. In addition, microbial celldensities and cell elution are often not measured for columnstudies. Thus the impact of microbial population dynamicson biodegradation and transport is unknown, and theresultant biokinetic parameters are ill defined.[7] The purpose of this study is to investigate the impact
of microbial system variability on the biodegradation andtransport behavior of a model solute for systems of definedand increasing complexity. Miscible displacement experi-ments are conducted in replicate, with paired controls, andincorporate analysis of cell mass balances. The variabilityand condition dependency of biokinetic parameters obtainedfrom calibrating a transport model to the column data isevaluated. In addition, the correspondence between valuesdetermined from batch and column methods is assessed.
2. Materials and Methods
2.1. Materials
[8] Four systems of increasing complexity wereemployed for this study: a well-sorted sand inoculated witha single bacterial isolate, a soil inoculated with the sameisolate, and two soils, each of which contained an indige-nous multiple-population community of bacteria. The well-sorted (20/30 mesh) natural sand used for system one wasAccusand (Unimin Corp.). The soil used for systems twoand three was a loamy sandy soil (Hayhook) with arelatively low organic carbon content (0.4%), collectedlocally in Tucson. The soil used for system four was an80:20 mixture of a sandy, low organic carbon content soil(Vinton) and a higher organic carbon content soil (Mt.Lemmon), both collected locally. This mixed soil will bereferred to hereafter as Vinton-M. Pertinent properties of thethree porous media are presented in Table 1.[9] The chemicals used in this study were purchased from
Sigma Chemical Co. (St. Louis, Mo). Salicylate was used asthe biodegradable tracer and pentafluorobenzoic acid(PFBA) as the nonreactive tracer. A phosphate-buffered
Table 1. Properties of Porous Media
PorousMedium
Sand,%
Silt,%
Clay,%
CEC,a
meq/gTOC,b
%Pores
<1 mm,c %Pores
1–60 mm, %Pores
>60 mm, %Bulk Density,
g/cm3 ndaL,
e
mm
Accusand 100 0 0 0.6 0.04 0.03 17.5 82.5 1.8 0.34 0.7Hayhook 85 5 10 7.1 0.1 6.5 47 47 1.7 0.37 3.2Vinton-M 85 10 5 5.0 1.0 11.7 67.5 21 1.7 0.44 2.0
aCEC is cation exchange capacity, measured by Soil, Water and Plant Analysis Laboratory, University of Arizona.bTOC is total soil organic carbon, measured by Soil, Water and Plant Analysis Laboratory, University of Arizona.cDetermined as described by Danielson and Sutherland [1986].dPorosity.eLongitudinal dispersivity.
2 of 15
W04406 BRUSSEAU ET AL.: INFLUENCE OF MICROBIAL VARIABILITY ON CO W04406
mineral salts solution (MSB), composed of 1.5 g/L KH2PO4,0.5 g/L Na2HPO4, 0.2 g/L MgSO4-7H20, 2.5 g/L NH4Cl,0.3 mg/L FeCl3, 13.2 mg/L CaCl2-2H2O, comprised theaqueous solution used in all batch and miscible displacementexperiments (including the nonreactive tracer tests). Radio-labeled 14C-salicylic acid (ring-labeled), with a measuredspecific activity of 5.9 mCi/mmol (>95% purity), was alsopurchased from Sigma Chemical Co.[10] A pure culture of Pseudomonas putida RB1353 was
used as the inoculum for experiments conducted withAccusand and for selected experiments conducted withHayhook soil. This isolate contains the NAH plasmid thatencodes genes for the degradation of naphthalene andsalicylate, as well as a selectable antibiotic (Kanamycin)resistance marker. This culture was kindly provided byRobert Burlage (Oak Ridge National Laboratories, TN).The two soils, Hayhook and Vinton-M, contain an indige-nous community of bacteria, a fraction of which candegrade salicylate.[11] All system components and materials (except for
soils used for indigenous system experiments) were steril-ized prior to each experiment. Specifically, Accusand wasautoclaved for 60 min, whereas the Hayhook soil subsam-ples used for the inoculated experiments were autoclaved30 min for four consecutive days. The tubing, pump, andother components used for the miscible displacementexperiments that could not withstand autoclaving weresterilized by treatment with a 2% bleach solution for aminimum of 30 min, followed by treatment with sterile0.01% Na thiosulfate solution, used to neutralize the bleach,and a final treatment with sterile, distilled, deionized water.All glassware and solutions were sterilized by autoclaving,except for the salicylate solutions, which were filter-sterilizedusing a 0.2-mm filter.
2.2. Batch Experiments
[12] Batch experiments were performed to determine bio-degradation/growth parameters, including maximum specificgrowth rate coefficient (mmax), half saturation constant (Kc),mean lag time (tlag), and variance of lag time (slag). Thesestudies were performed for a range of salicylate concentra-tions and for each microbial community used, RB1353 andthe two indigenous communities associated with Hayhookand Vinton-M soils. Salicylate solutions were mixed withinoculum in 250-mL Erlenmeyer flasks with threaded capslined with rubber septa. The threads were wrapped withteflon tape to ensure that the flasks were airtight. Sampleswere collected periodically to monitor the temporal decline inaqueous salicylate concentrations. These experiments wereperformed three separate times, in triplicate each time.[13] The RB1353 pure-isolate solution was prepared by
growing a 24-hour preculture from one isolated colony on astreak plate, followed by growing a 48-hour culture in LuriaBroth. The solution was amended with 100 mg/L Kanamycin(LBK) to select for RB1353 and eliminate other potentialbacteria present. The cultures were harvested in late station-ary phase. The cells were pelleted by centrifugation, resus-pended in saline to dissolve attached carbon, repelleted, andfinally suspended in MSB solution. Concentrated RB1353inoculum was added to the salicylate solutions to achieve thedesired cell density of 107 CFU/mL (CFU = colony formingunits). The Hayhook and Vinton-M soil inoculums were
prepared by saturating the soils with MSB solution, followedby a 96-hour incubation period to allow the indigenouscommunity to acclimate. Wet soil (equivalent to 10 g drysoil) was added to the flasks, followed by sufficient salicylatesolution to achieve a final aqueous volume of 20 mL with thedesired concentration of salicylate.[14] Aqueous concentrations of salicylate were analyzed
by two methods, depending on the initial aqueous concen-tration and the presence or absence of dissolved organiccarbon. A UV-Vis spectrophotometer (Hitachi, ModelU-2000, Danbury, CT), at a wavelength of 296 nm, wasused for experiments with low dissolved organic carbon andinitial concentrations of 20 mg/L or greater (RB1353 batchexperiments and RB1353-inoculated Accusand columnexperiments). For the remaining experiments, salicylatesolutions were spiked with 14C-salicylate to allow analysisby liquid scintillation. Samples from batch slurry systems orcolumn effluent were centrifuged for 10 min at 10,000 � Gto separate suspended soil particles and bacterial cells,including those containing 14C. It was assumed that anyremaining 14C in the supernatant was 14C-salicylate, basedon the results of preliminary tests which showed no mea-surable production of intermediates. A 1-mL sample of thesupernatant was analyzed for radioactivity using a liquidscintillation counter (Model 1600TR Packard InstrumentCompany, Meriden, CT).[15] The cell yields (Y) were determined separately from
the biodegradation studies discussed above. For RB1353, aconcentrated solution of cells was inoculated into 1 L of a50 mg/L salicylate solution in a 2.8-L flask and placed on ashaker. Salicylate was added to the experimental flask twomore times, such that the total mass of salicylate added was150 mg. Small samples of solution were collected period-ically to monitor salicylate loss. After complete degradationof the third addition of salicylate, the solution was centri-fuged in aliquots in a 250-mL centrifuge bottle, and thesupernatant was decanted after each centrifugation event.The pellet remaining after the four centrifugation events wasdried and weighed to determine final cell mass. A control, toaccount for potential growth due to residual carbon remain-ing in the cells, was conducted by inoculating the sameamount of cells into MSB solution (no salicylate). Theseexperiments were performed in duplicate.[16] The cell yield for the indigenous soil communities
was determined using 14C-salicylate-spiked solutions totrack the fate of carbon in the system. Soil and spikedsalicylate solution were added to specially designed flasks.Evolved CO2 (including
14C-CO2) was collected in uprighttubes containing 1N potassium hydroxide (KOH) sealed inthe flasks. It was assumed that all initial salicylate had beenconsumed to produce new cells or CO2 when salicylatereached nondetectable levels. Samples were taken from theKOH tubes and analyzed for 14C-CO2 using a liquidscintillation counter. The mass of C produced as cells wasdetermined as the difference between initial C (as salicylate)and total C evolved as CO2.
[17] The results of the batch biodegradation experimentswere used to obtain cell growth curves for the threemicrobial communities, and data from these curves wereused to determine all of the biokinetic parameters except forcell yield. The cell growth curves were generated bycalculating the mass of cells produced at each sampling
W04406 BRUSSEAU ET AL.: INFLUENCE OF MICROBIAL VARIABILITY ON CO
3 of 15
W04406
time, which is the product of the amount of salicylatedegraded and the final cell yield (mass cells produced/masssalicylate degraded). Specific growth rate coefficients foreach concentration were computed as the slope of the linearportion of the cell growth curve plotted as natural log of cellcounts (ordinate) versus time (abscissa). This slope wascalculated from a linear regression analysis of data from allthree triplicate flasks. The maximum specific growth ratecoefficient was determined using the Lineweaver-Burkmethod [Bailey and Ollis, 1986], a linearized Monodgrowth equation (r2 values of 0.96 and greater wereobtained). The half saturation constant was determined asthe substrate concentration corresponding to a specificgrowth rate coefficient that is half of the maximum value.The mean lag time (tlag) was determined by calculating theintercept of the tangent line to the exponential growth curve(as determined from the linear regression). The lag timevariance (slag) was calculated from the standard deviationassociated with the slope and intercept of the regressionline. As such, it is a measure of the variability of the meanlag time among the triplicate flasks as well as among thecommunity in each flask.[18] Sorption experiments were performed in batch sys-
tems containing sterilized soil slurries for five aqueousconcentrations of salicylate (1, 5, 20, 50 and 100 mg/L)spiked with 14C-salicylate. Soil was sterilized by ovendrying at 105�C for three days. One gram of sterilized soilwas added to a sterilized test tube, followed by addition oftwo mL of salicylate solution. These systems were allowedto equilibrate for 24 hours on a shaker table. Subsamplesfrom each tube were vortexed in a microcentrifuge at14,000 � G for 10 min, and the supernatant was analyzedfor aqueous 14C-labeled salicylate as described above.
2.3. Miscible Displacement Experiments
[19] Miscible displacement experiments were conductedwith a nonreactive tracer to characterize the hydrodynamicproperties of the packed columns. Experiments were con-ducted with salicylate and sterile porous media to evaluatesorption and potential abiotic loss processes. Five sets of
experiments were conducted to evaluate biodegradation andtransport of salicylate under a range of conditions. One setof experiments comprising four replicates was conductedusing sterlized Accusand media inoculated with RB1353.Another set of four replicate experiments was conductedusing sterilized Hayhook soil inoculated with RB1353. Oneset of four replicate experiments was conducted usingnonsterilized Hayhook soil with its natural indigenousmicrobial community, and another set of three replicateexperiments was conducted using nonsterilized Vinton-Msoil (indigenous system). Each experiment for these foursets was conducted simultaneously with a paired control, forwhich all conditions were as identical as possible with theexception that the injection solution contained MSB but nosalicylate (i.e., a total of 30 experiments were conducted, 15with salicylate and 15 with MSB). All of these experimentswere conducted using a flow rate of 0.3 ml/min, which isequivalent to an average pore water velocity of approxi-mately 10 cm/hr. The salicylate injection concentration was20 mg/L. The initial cell densities are reported in Table 2. Afifth set of experiments was conducted with the RB1353-inoculated Accusand system, wherein the salicylate injec-tion concentration, pore water velocity, and initial celldensity were varied. The specific conditions for theseexperiments are listed in Table 3.[20] For the systems inoculated with RB1353, 200 g of
sterilized porous media were inoculated with 10 mL ofinoculum to produce an initial cell density of approximately107 CFU/g dry media. The indigenous soil systems wereprepared as described for the batch biodegradation studies.The porous media were subsequently packed into glasscolumns (15 cm length, 2.5 cm diameter) under a laminarflow hood using aseptic techniques.[21] The packed column was connected to a piston
displacement pump using teflon tubing. For all experiments,excluding the controls, MSB solution was pumped throughthe column for approximately 22 hours (�15 pore vol-umes), followed by approximately 17 pore volumes ofsalicylate solution. The solution reservoir was sparged withoxygen for all experiments to eliminate potential oxygenconstraints within the system. Effluent samples were col-lected continuously in culture tubes using a fraction collec-tor. Each tube was amended with 1N sodium hydroxide toprevent salicylate degradation.[22] Effluent samples were collected periodically during
each experiment to measure bacterial cell elution. These
Table 2. Initial Cell Densities and Population Growth for Miscible
Displacement Experiments
ExperimentInitial Cell Density,a
CFU/g dry mediaPopulationGrowth, %
Accusand A 1.5 (±0.16) � 107 96Accusand B 1.0 (±0.1) � 107 448Accusand C 2.4 (±0.1) � 107 223Accusand D 1.4 (±0.2) � 107 61Inoculated Hayhook A 2.0 (±0.2) � 107 17Inoculated Hayhook B 2.0 (±0.15) � 107 23Inoculated Hayhook C 1.3 (±0.1) � 107 8Inoculated Hayhook D 2.1 (±0.25) � 107 0Hayhook A 3.1 (±0.7) � 106 84Hayhook B 1.1 (±0.2) � 106 372Hayhook C 5.9 (±0.9) � 104 2440Hayhook D 5.4 (±0.8) � 105 163Vinton-M A 3.8 (±0.5) � 106 354Vinton-M B 9.5 (±1.2) � 105 1453Vinton-M C 2.8 (±0.3) � 106 147
aFor the Accusand system, cell densities at the onset of substrateintroduction are lower than the reported initial cell densities due to cellelution during the column saturation process (see text). Values inparentheses denote 95% confidence intervals.
Table 3. Conditions for Additional RB1353-Inoculated Accusand
Miscible Displacement Experiments
Experiment
SalicylateInjection
Concentration,mg/L
Pore WaterVelocity,cm/hr
InitialCell Density,a
CFU/g dry mediaPopulationGrowth, %
Accusand 1 5.6 8.7 1.7 (±0.3) � 107 12Accusand 2 6.7 9.2 2.3 (±0.2) � 107 0Accusand 3 64.2 7.8 1.4 (±0.4) � 107 212Accusand 4 20.4 2.2 1.0 (±0.1) � 107 402Accusand 5 21.4 82.6 7.6 (±1.4) � 106 899Accusand 6 20.8 8.8 2.5 (±0.3) � 108 0Accusand 7 21.3 8.8 2.8 (±0.2) � 106 1634
aCell densities at the onset of substrate introduction are lower than thereported initial cell densities due to cell elution during the column saturationprocess (see text). Values in parentheses denote 95% confidence intervals.
4 of 15
W04406 BRUSSEAU ET AL.: INFLUENCE OF MICROBIAL VARIABILITY ON CO W04406

samples were collected in sterile microcentrifuge tubes.Serial dilutions were performed immediately, followed byplating on nutrient agar. Samples of the porous media werecollected prior to and after each miscible displacementexperiment to determine initial and final cell densities.Three subsamples were collected from the soil reservoirduring packing of the column. Following each experiment,samples were collected in duplicate from both ends of thecolumn and at two locations, 5 cm and 10 cm from theinfluent end of the column (i.e., a total of eight sampleswere collected from four locations within the column). A9.5-mL aliquot of a 0.85% saline solution was added toapproximately 1.3 g of wet sand or soil, and the slurry wasvortexed for 1 min to transfer the cells into solution. Serialdilutions of this solution were plated on nutrient agar.[23] Viable cell counts were obtained by plating serial
dilutions of samples, in triplicate, on nutrient agar (LBK)plates for the inoculated systems, or on both salicylate-MSBagar (100 mg/L salicylate, 100 mg/L cycloheximide, MSB,and noble agar) plates and R2A plates for the indigenoussystems. The two sets of plates were used for the indigenoussystems to obtain measures of salicylate degraders and totalheterotrophic bacteria, respectively. These measurementsare assumed to provide a conservative estimate of totalactive populations, given the possible existence of viablebut nonculturable bacteria in the indigenous systems.[24] Cell mass balance calculations were performed for
all of the miscible displacement experiments. The initial andfinal numbers of cells present in the column were calculatedby multiplying the mean initial and final cell densities bythe mass of dry porous media packed into the column. Totalcells eluted, and cells eluted prior to and during salicylateinjection, were determined by integrating under the cellelution curve. Population growth (G) was calculated as thedifference between the sum of the number of cells elutedduring salicylate injection (Epulse) and those remaining inthe column (R) and the initial number of cells in the column(I), corrected for the number of cells eluted during thepresalicylate flush (Epre-pulse), normalized by the number ofinitial cells: G = [(R + Epulse) � (I � Epre-pulse)]/I.
3. Mathematical Modeling
3.1. Governing Equations
[25] A one-dimensional, steady state flow, advective-dispersive solute transport model incorporating cell growth/decay, microbial lag, inhibition, and cell transport was used toanalyze the measured breakthrough curves [Brusseau et al.,1999; Li, 2001]. The governing equations are
R@C*
@T¼ � @C*
@Xþ 1
P
@2C*
@X 2� ecM*
C*
Kc*þ C*
� �O*
Ko*þ O*
� �
ð1Þ
@M*
@T¼ emM*
C*
Kc*þ C*
� �O*
Ko*þ O*
� �� wb M*� 1ð Þ �MT*
ð2Þ
@O*
@T¼ � @O*
@Xþ 1
P
@2O*
@X 2� eoM*
C*
Kc*þ C*
� �O*
Ko*þ O*
� �ð3Þ
where the following nondimensional parameters are definedas
X ¼ x
L; T ¼ vt
L; P ¼ vL
Dð4Þ
C* ¼ C
C0
; O* ¼ O
O0
; M* ¼ M
M0
ð5Þ
R ¼ 1þ rqKd ; Kc* ¼ Kc
C0
; Ko* ¼ Ko
O0
ð6Þ
ec ¼mmLM0
vYC0
; eo ¼gommLM0
vO0
; em ¼ mmLv
ð7Þ
wb ¼bL
vð8Þ
where the coefficients are defined in the notation section. Asecond-order upwind finite difference method [Colella,1990] was applied to the advection term of equation (1), anda regular second-order finite difference method was appliedto the dispersion term of equation (1). An Adam-Bashforththree step method was used for solving the ordinarydifferential equations. The governing equations were solvedunder standard initial and boundary conditions:
C* X ; 0ð Þ ¼ 0:0 ð9Þ
O* X ; 0ð Þ ¼ 1:0 ð10Þ
M* X ; 0ð Þ ¼ 1:0 ð11Þ
C*� 1
P
@C*
@X
� �X¼0
¼ C0*;@C*
@X
� �X¼1
¼ 0:0 ð12Þ
O*� 1
P
@O*
@X
� �X¼0
¼ O0*;@O*
@X
� �X¼1
¼ 0:0 ð13Þ
A three-phase linear growth model proposed by Buchananet al. [1997], which assumes the microbial populationcomprises a normal distribution of lag times, was used torepresent lag. Once a threshold concentration (Cind, requiredfor induction of metabolic processes) at any node within thesystem is achieved, a ‘timer’ is turned on for that node. Themean and variance of lag time are then used to calculatethe number of cells emerging from the lag phase at any onetime step, using the following equation:
Mti ¼Zti
ti�1
1ffiffiffiffiffiffi2p
psexp �
ti � tlag� �
i
� �2
2s2i
0B@
1CAdt þMi�1 ð14Þ
These cells are added to the number of metabolizing cells atthat node and then substrate consumption is computed.[26] Several assumptions are employed in the derivation
of these equations and their application to the experimentsconducted herein. The substrate is assumed to be readilyavailable to the biomass (no bioavailability constraints),with uptake from the solution phase only. These assump-
W04406 BRUSSEAU ET AL.: INFLUENCE OF MICROBIAL VARIABILITY ON CO
5 of 15
W04406
tions are valid given that salicylate is not subject tosignificant sorption by the porous media. Inhibition associ-ated with higher substrate concentrations was notemployed, based on the results of the batch experimentsand the range of salicylate concentrations used for themiscible displacement experiments. As will be discussedbelow, cell transport and elution was not significant for theHayhook and Vinton-M soils, and thus had no measurableimpact on biodegradation and transport of salicylate in theHayhook-inoculated system and the two indigenous sys-tems. It was therefore unnecessary to simulate cell transportfor these three systems, as confirmed by the results ofpreliminary sensitivity analyses. Conversely, cell transportand elution was significant for the RB1353-inoculatedAccusand system. Given that this system is relativelysimple and well defined, the impact of cell transport forthis case is accounted for using a simplified ‘‘cell loss’’term, in place of explicit cell transport equations. This termwas obtained by converting the measured cell elution datainto a ‘‘cell loss’’ function that is time-dependent. Bacterialretention for the Accusand system was most likely gov-erned by a single mechanism, as discussed below. Thus thecell loss term in this case is essentially a single-retention-process function. This simplified approach for representingthe effects of cell transport was adequate for the RB1353-inoculated Accusand system. This approach, however,would generally not be satisfactory for more complexsystems wherein cell transport is significant.[27] Subsurface environments typically contain complex
microbial communities composed of multiple populationsof bacteria and other microorganisms. Thus it is reasonableto expect that more than one member of the community maybe capable of degrading a given solute [e.g., Chen et al.,1992; MacNaughton et al., 1999; Bodour et al., 2003;Roling et al., 2004; Katsivela et al., 2005; Wang et al.,2005]. Such is the case for the two indigenous soil systemsused in this study. It is also reasonable to expect that eachpopulation may have its own affinity and utilization rate forthat solute. However, a single set of biokinetic coefficientsis typically used for modeling biodegradation processes,even for systems that contain multiple populations capableof degrading the solute of interest. In essence, it is assumedthat the activities of multiple populations of degraders canbe represented with a single suite of biokinetic parameters.While it may be preferable to explicitly represent theactivity of each individual population, this is rarely feasibledue to a lack of sufficient information. The simplifiedapproach is used herein.
3.2. Parameter Determination
[28] The mathematical model was calibrated to the break-through curves obtained from the miscible displacementexperiments, optimizing values for mm, tlag, and slag. The
optimization process was monitored to ensure that globalminimums were attained and that the optimized values werenot dependent on initial values. The calibrated valuesobtained for the three parameters will be compared to thevalues obtained from the batch experiments.[29] Values for all other input parameters were deter-
mined independently. Porosity, bulk density, and pore watervelocity were measured for each experiment. Dispersivitieswere determined by calibration of a simple one-dimensionaladvection-dispersion model to the nonreactive tracer break-through curves. Initial cell densities were determined foreach experiment as noted above. The values for theseparameters are listed in Tables 1–3. Values for Kd wereobtained from the batch sorption experiment and the mis-cible displacement experiments conducted under sterileconditions. Values for Kc and Y were obtained from thebatch experiments (see Table 4). The biomass decay coef-ficient was set to 0.001 d�1 based on values reported in theliterature. Preliminary simulations showed that model out-put was insensitive to this term for values less thanapproximately 0.1 d�1. This is not unexpected given theconditions associated with the experiments, and is consis-tent with the results of prior studies [e.g., Chen et al., 1992;Brusseau et al., 1999; Tebes-Stevens and Valocchi, 2000].The Cind was set to 0.1 mg/L, based on the results of thebatch studies.
4. Results and Discussion
4.1. Sorption and Biodegradation Batch Studies
[30] Sorption of salicylate by Accusand was found to benegligible, consistent with the results of prior studies[Sandrin et al., 2001]. Sorption of salicylate by Hayhookand Vinton-M soils was adequately represented by linearisotherms over the range of concentrations used in thisstudy. The isotherms yielded sorption coefficients of 0.08and 0.28 (L/Kg) for Hayhook and Vinton-M, respectively.[31] The cell growth curves for all three systems
exhibited typical behavior wherein a lag phase was followedby a period of exponential growth (data not shown). Therelationship between specific growth rate coefficient andinitial substrate concentration was well described with theMonod equation. A smaller specific growth rate coefficientwas obtained at the 100 mg/L salicylate concentration forthe Hayhook system, indicating possible inhibition effectsabove 50 mg/L, which is greater than the C0 used for themiscible displacement experiments.[32] The biodegradation/growth parameters determined
from analysis of the batch data are presented in Table 4.The maximum specific growth rate coefficients are similarfor all three systems. Conversely, the half saturation con-stants are substantially lower and the yield coefficients arelarger for the Hayhook and Vinton-M indigenous commu-
Table 4. Biodegradation/Growth Parameters Determined From Batch Experiments
System Yield, g/g Kc, mg/L mmax, h�1 tlag, h slag, h
RB1353a 0.22 (0.19–0.25) 70 (60–80) 0.25 (0.2–0.3) 2.0 (0.2–3.8) 1.0 (0.1–1.9)Hayhook Indigenous 0.52 (0.44–0.60) 4.5 (3.8–5.2) 0.2 (0.1–0.3) 22 (10–34) 19.7 (1.7–37.7)Vinton-M Indigenous 0.68 (0.62–0.75) 2.5 (2.1–2.9) 0.1 (0.05–0.15) 2.9 (0.3–5.5) 8.7 (1.6–15.8)
aIsolate used for Accusand-inoculated and Hayhook-inoculated systems. Values in parentheses denote 95% confidenceintervals.
6 of 15
W04406 BRUSSEAU ET AL.: INFLUENCE OF MICROBIAL VARIABILITY ON CO W04406

nities compared to the corresponding values obtained forRB1353. This indicates the indigenous systems have greateraffinity for salicylate, perhaps reflecting their multiple-population nature. The mean lag time obtained for Hayhookis significantly larger than those obtained for RB1353 andVinton-M. Inspection of Table 4 reveals that the level ofuncertainty associated with the batch-determined values isrelatively small, with the notable exception of the lag-related parameters.
4.2. Tracer and Salicylate Transport forSterile Conditions
[33] The breakthrough curves obtained for PFBA, thenonreactive tracer, were sharp and symmetrical for all threemedia, and mass recovery was complete (data not shown).These results indicate ideal hydrodynamic conditions for thepacked columns. The calculated dispersivities obtainedfrom model calibration of the PFBA breakthrough curvesare approximately 3–4 times larger for Vinton-M andHayhook soils compared to Accusand, consistent with thedifferences in porous medium texture (see Table 1).[34] The breakthrough curves obtained for salicylate were
also sharp and symmetrical (data not shown). Mass recoverywas complete, indicating no abiotic loss mechanisms forsalicylate in these systems. No retardation was observed forsalicylate transport in Accusand, and slight retardation wasobserved for transport in Hayhook and Vinton-M. Theseresults are consistent with those from the batch sorptionexperiments. On the basis these results, sorption-associatedbioavailability constraints are unlikely for these systems.
4.3. Salicylate Biodegradation and Transport
[35] The salicylate breakthrough curves obtained for thefour replicate experiments conducted with RB1353-inocu-lated Accusand are shown in Figure 1. The breakthroughcurves are relatively similar, indicating reasonable repro-ducibility. It is important to note that a constant-concentra-tion solution of salicylate was injected for approximately17 pore volumes for the experiments. Thus the observationof relative effluent concentrations less than one indicates
mass loss due to biodegradation. In addition, the nonsteadyconcentrations indicate temporal variability in biodegrada-tion potential. Approximately 85% of the salicylate intro-duced into the columns was degraded based on massbalance calculations.[36] The relative effluent concentrations for all cases
reached values close to 1 within the first pore volume,indicating a delay in the onset of significant substrateconsumption. Such delays can be caused by lag processesthat delay the initiation of biodegradation, and by low initialcell densities (which limit initial substrate demand). Theresults of prior experiments have shown that the delay insubstrate consumption for the RB1353-Accusand system isdue primarily to metabolic lag, i.e., the time required forinduction and synthesis of appropriate enzymes necessaryfor biodegradation of salicylate [Sandrin et al., 2001]. Aftera few pore volumes, salicylate concentrations declinedsharply as the bacterial population exited the lag phaseand attained the maximum biodegradation potential associ-ated with the initial cell density. The impact of lag onsalicylate transport behavior ended at approximately 6 porevolumes, as is qualitatively denoted by the distinct changein slope of the salicylate breakthrough curves (Figure 1).The salicylate concentrations exhibited a moderate declineafter completion of the lag phase effects. This nonsteadybehavior indicates that there was a continued increase insubstrate demand with time, due presumably to an increasein cell density (i.e., population growth). This is consistentwith the microbial growth estimates, which showedincreases in cell numbers of approximately 60 to 450%(Table 2).[37] The salicylate breakthrough curves obtained for the
replicate experiments conducted with RB1353-inoculatedHayhook soil are shown in Figure 2. The breakthroughcurves are relatively similar, indicating reproducibility, aswas observed for the RB1353-inoculated Accusand experi-ments. Peak relative effluent concentrations of 0.5–0.6 wereobserved, indicating shorter delays in the onset of substrateconsumption compared to the Accusand system. This likely
Figure 1. Breakthrough curves for transport of salicylate in RB1353-inoculated Accusand; fourreplicate experiments.
W04406 BRUSSEAU ET AL.: INFLUENCE OF MICROBIAL VARIABILITY ON CO
7 of 15
W04406
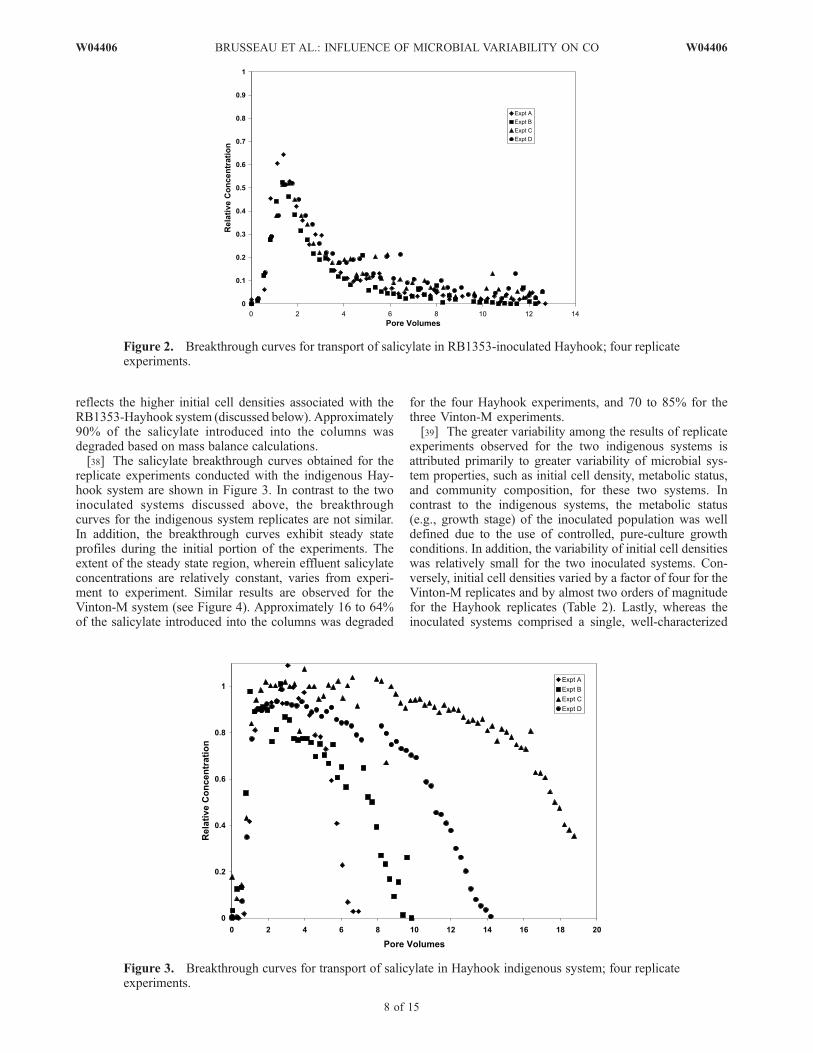
reflects the higher initial cell densities associated with theRB1353-Hayhook system (discussed below). Approximately90% of the salicylate introduced into the columns wasdegraded based on mass balance calculations.[38] The salicylate breakthrough curves obtained for the
replicate experiments conducted with the indigenous Hay-hook system are shown in Figure 3. In contrast to the twoinoculated systems discussed above, the breakthroughcurves for the indigenous system replicates are not similar.In addition, the breakthrough curves exhibit steady stateprofiles during the initial portion of the experiments. Theextent of the steady state region, wherein effluent salicylateconcentrations are relatively constant, varies from experi-ment to experiment. Similar results are observed for theVinton-M system (see Figure 4). Approximately 16 to 64%of the salicylate introduced into the columns was degraded
for the four Hayhook experiments, and 70 to 85% for thethree Vinton-M experiments.[39] The greater variability among the results of replicate
experiments observed for the two indigenous systems isattributed primarily to greater variability of microbial sys-tem properties, such as initial cell density, metabolic status,and community composition, for these two systems. Incontrast to the indigenous systems, the metabolic status(e.g., growth stage) of the inoculated population was welldefined due to the use of controlled, pure-culture growthconditions. In addition, the variability of initial cell densitieswas relatively small for the two inoculated systems. Con-versely, initial cell densities varied by a factor of four for theVinton-M replicates and by almost two orders of magnitudefor the Hayhook replicates (Table 2). Lastly, whereas theinoculated systems comprised a single, well-characterized
Figure 2. Breakthrough curves for transport of salicylate in RB1353-inoculated Hayhook; four replicateexperiments.
Figure 3. Breakthrough curves for transport of salicylate in Hayhook indigenous system; four replicateexperiments.
8 of 15
W04406 BRUSSEAU ET AL.: INFLUENCE OF MICROBIAL VARIABILITY ON CO W04406

isolate, the indigenous systems contained multiple-popula-tion communities wherein multiple salicylate degraders arepresent. For example, an analysis of eight samples collectedfrom different locations within the 12-L reservoir containingthe Hayhook soil showed that culturable microbial countsranged over 2.5 orders of magnitude, and that differentmicroorganisms were present (based on morphologicalanalysis) in the various samples.[40] The influence of differences in initial cell density on
transport behavior is illustrated by the results obtained forthe Hayhook indigenous system. Inspection of Figure 3 andTable 2 reveals that the length of the steady state periodobserved for the breakthrough curves correlates inverselywith the initial cell density. For example, experiment A hasthe largest initial cell density and shortest steady stateperiod, whereas experiment C has the smallest initial celldensity and longest steady state period. Such a correlation isnot observed, however, for the Vinton-M system. Forexample, experiment B has the lowest initial cell densityand also the shortest steady state period. This latter behaviorindicates that other factors in addition to differences ininitial cell density contributed to the observed replicatevariability.
4.4. Population Growth and Cell Transport
[41] Moderate levels of population growth occurred forthe inoculated Accusand system in the presence of salicylate(Table 2). Conversely, no growth was observed for the fourcomplementary control experiments wherein the Accusandcolumns were flushed with MSB solution (no salicylate). Incontrast, similar levels of growth were observed for thesalicylate and control experiments for both indigenoussystems. This indicates carbon compounds that can supportgrowth in the absence of salicylate were present in theHayhook and Vinton-M soils, which is not surprising giventheir levels of soil organic carbon. Minimal populationgrowth was observed for the Hayhook inoculated experi-ments. This is related to the larger initial cell densities
associated with this system compared to the other systems.The initial cell densities of total culturable bacteria weresimilar (�107 CFU/g soil) for all four systems. However,populations capable of degrading salicylate composed onlya fraction of the total community for the two indigenoussystems. Thus the initial cell densities of salicylatedegraders were typically an order of magnitude lower(�106). For the RB1353-inoculated Accusand system, ap-proximately 75% of the initial cells were eluted during theMSB preflush prior to the injection of salicylate solution.Thus the cell densities were almost an order of magnitudelower at the onset of biodegradation. Conversely, cellelution was minimal during the MSB preflush for theHayhook-inoculated system. Thus the amount of cellsproduced from growth for the Hayhook-inoculated systemwas negligible compared to its order of magnitude largerinitial cell density.[42] The significance of cell transport and elution varied
greatly among the systems. Greater than 99% of all cellswere associated with the porous medium grains for theHayhook-inoculated system and for both indigenous sys-tems. Thus cell transport and elution had no measurableimpact on biodegradation and transport of salicylate forthese three systems. Conversely, cell transport and elutionwas significant for the Accusand system. The greaterretention of cells observed for the Hayhook and Vinton-Msoils is likely due to a combination of attachment andstraining. With respect to cell attachment, both Hayhookand Vinton-M have organic carbon and clay mineral con-tents that are significantly greater than those of Accusand,and would thus be expected to have greater attachmentpotentials [Jordan et al., 2004]. The results of recentresearch indicate that straining can influence colloid trans-port, depending on grain size distribution, grain morpholo-gy, packing, and other factors [e.g., Bradford et al., 2002,2003; Sirivithayapakorn and Keller, 2003; Tufenkji et al.,2004]. On the basis of the pore size distributions for thethree porous media reported in Table 1, and assuming a
Figure 4. Breakthrough curves for transport of salicylate in Vinton-M indigenous system; threereplicate experiments.
W04406 BRUSSEAU ET AL.: INFLUENCE OF MICROBIAL VARIABILITY ON CO
9 of 15
W04406
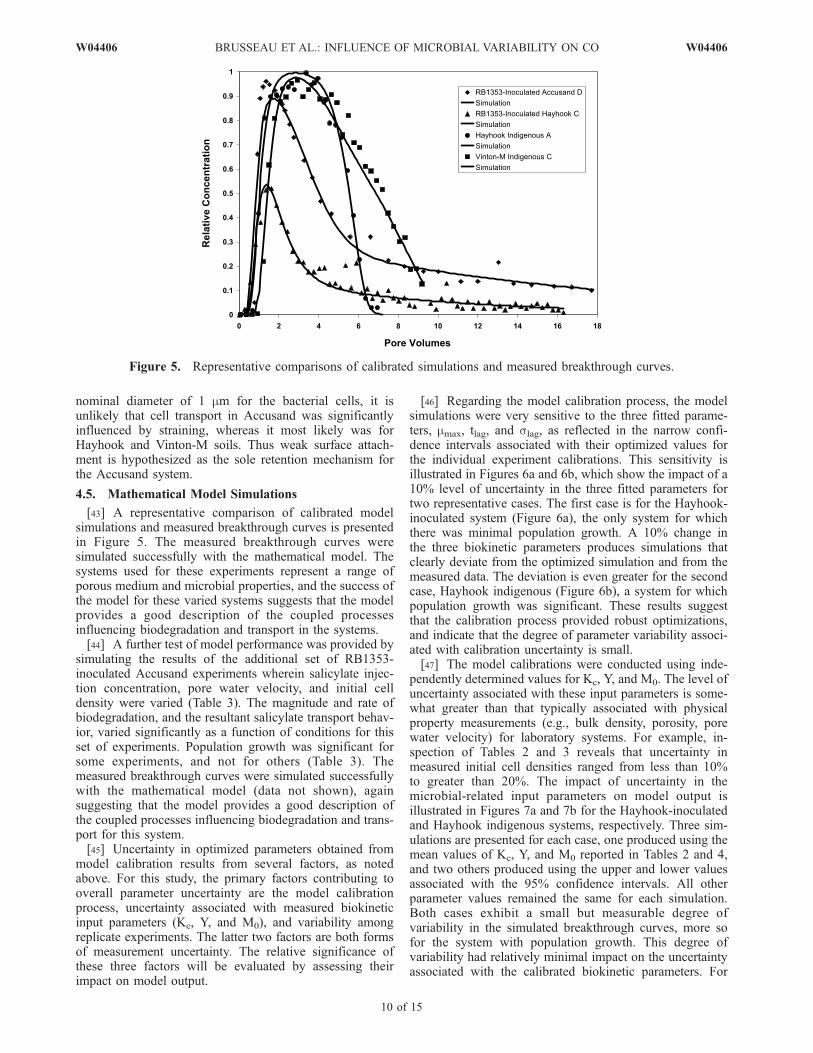
nominal diameter of 1 mm for the bacterial cells, it isunlikely that cell transport in Accusand was significantlyinfluenced by straining, whereas it most likely was forHayhook and Vinton-M soils. Thus weak surface attach-ment is hypothesized as the sole retention mechanism forthe Accusand system.
4.5. Mathematical Model Simulations
[43] A representative comparison of calibrated modelsimulations and measured breakthrough curves is presentedin Figure 5. The measured breakthrough curves weresimulated successfully with the mathematical model. Thesystems used for these experiments represent a range ofporous medium and microbial properties, and the success ofthe model for these varied systems suggests that the modelprovides a good description of the coupled processesinfluencing biodegradation and transport in the systems.[44] A further test of model performance was provided by
simulating the results of the additional set of RB1353-inoculated Accusand experiments wherein salicylate injec-tion concentration, pore water velocity, and initial celldensity were varied (Table 3). The magnitude and rate ofbiodegradation, and the resultant salicylate transport behav-ior, varied significantly as a function of conditions for thisset of experiments. Population growth was significant forsome experiments, and not for others (Table 3). Themeasured breakthrough curves were simulated successfullywith the mathematical model (data not shown), againsuggesting that the model provides a good description ofthe coupled processes influencing biodegradation and trans-port for this system.[45] Uncertainty in optimized parameters obtained from
model calibration results from several factors, as notedabove. For this study, the primary factors contributing tooverall parameter uncertainty are the model calibrationprocess, uncertainty associated with measured biokineticinput parameters (Kc, Y, and M0), and variability amongreplicate experiments. The latter two factors are both formsof measurement uncertainty. The relative significance ofthese three factors will be evaluated by assessing theirimpact on model output.
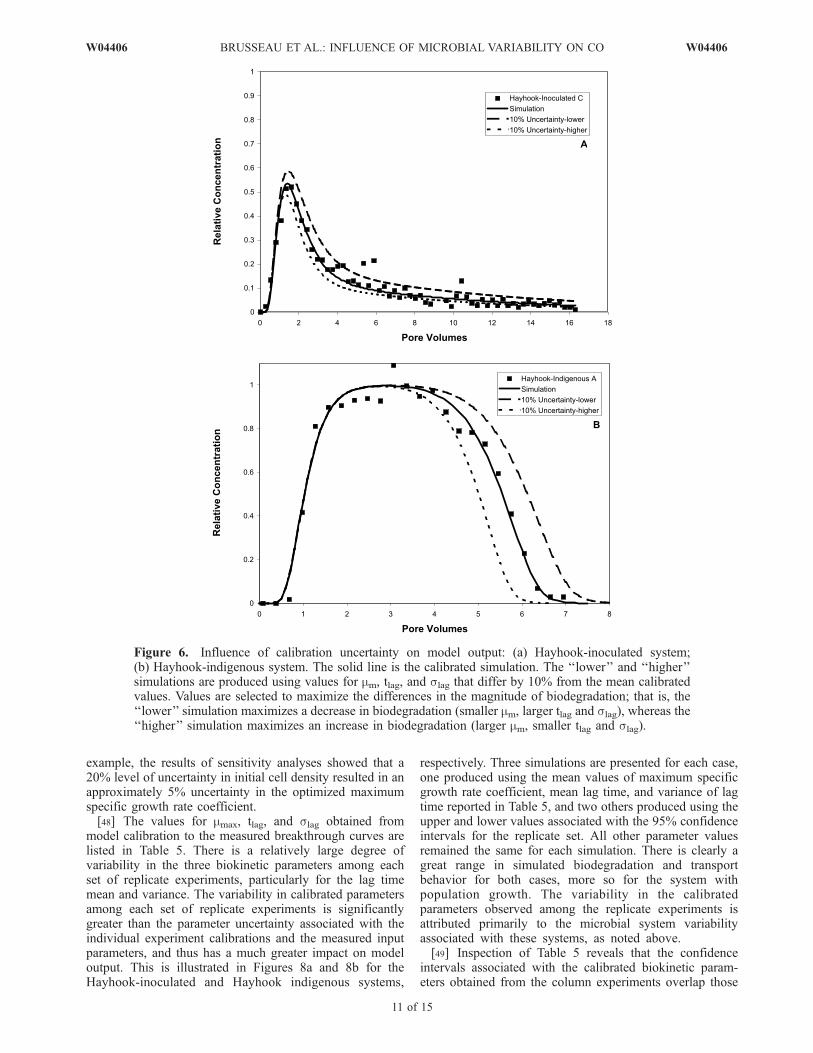
[46] Regarding the model calibration process, the modelsimulations were very sensitive to the three fitted parame-ters, mmax, tlag, and slag, as reflected in the narrow confi-dence intervals associated with their optimized values forthe individual experiment calibrations. This sensitivity isillustrated in Figures 6a and 6b, which show the impact of a10% level of uncertainty in the three fitted parameters fortwo representative cases. The first case is for the Hayhook-inoculated system (Figure 6a), the only system for whichthere was minimal population growth. A 10% change inthe three biokinetic parameters produces simulations thatclearly deviate from the optimized simulation and from themeasured data. The deviation is even greater for the secondcase, Hayhook indigenous (Figure 6b), a system for whichpopulation growth was significant. These results suggestthat the calibration process provided robust optimizations,and indicate that the degree of parameter variability associ-ated with calibration uncertainty is small.[47] The model calibrations were conducted using inde-
pendently determined values for Kc, Y, and M0. The level ofuncertainty associated with these input parameters is some-what greater than that typically associated with physicalproperty measurements (e.g., bulk density, porosity, porewater velocity) for laboratory systems. For example, in-spection of Tables 2 and 3 reveals that uncertainty inmeasured initial cell densities ranged from less than 10%to greater than 20%. The impact of uncertainty in themicrobial-related input parameters on model output isillustrated in Figures 7a and 7b for the Hayhook-inoculatedand Hayhook indigenous systems, respectively. Three sim-ulations are presented for each case, one produced using themean values of Kc, Y, and M0 reported in Tables 2 and 4,and two others produced using the upper and lower valuesassociated with the 95% confidence intervals. All otherparameter values remained the same for each simulation.Both cases exhibit a small but measurable degree ofvariability in the simulated breakthrough curves, more sofor the system with population growth. This degree ofvariability had relatively minimal impact on the uncertaintyassociated with the calibrated biokinetic parameters. For
Figure 5. Representative comparisons of calibrated simulations and measured breakthrough curves.
10 of 15
W04406 BRUSSEAU ET AL.: INFLUENCE OF MICROBIAL VARIABILITY ON CO W04406
example, the results of sensitivity analyses showed that a20% level of uncertainty in initial cell density resulted in anapproximately 5% uncertainty in the optimized maximumspecific growth rate coefficient.[48] The values for mmax, tlag, and slag obtained from
model calibration to the measured breakthrough curves arelisted in Table 5. There is a relatively large degree ofvariability in the three biokinetic parameters among eachset of replicate experiments, particularly for the lag timemean and variance. The variability in calibrated parametersamong each set of replicate experiments is significantlygreater than the parameter uncertainty associated with theindividual experiment calibrations and the measured inputparameters, and thus has a much greater impact on modeloutput. This is illustrated in Figures 8a and 8b for theHayhook-inoculated and Hayhook indigenous systems,
respectively. Three simulations are presented for each case,one produced using the mean values of maximum specificgrowth rate coefficient, mean lag time, and variance of lagtime reported in Table 5, and two others produced using theupper and lower values associated with the 95% confidenceintervals for the replicate set. All other parameter valuesremained the same for each simulation. There is clearly agreat range in simulated biodegradation and transportbehavior for both cases, more so for the system withpopulation growth. The variability in the calibratedparameters observed among the replicate experiments isattributed primarily to the microbial system variabilityassociated with these systems, as noted above.[49] Inspection of Table 5 reveals that the confidence
intervals associated with the calibrated biokinetic param-eters obtained from the column experiments overlap those
Figure 6. Influence of calibration uncertainty on model output: (a) Hayhook-inoculated system;(b) Hayhook-indigenous system. The solid line is the calibrated simulation. The ‘‘lower’’ and ‘‘higher’’simulations are produced using values for mm, tlag, and slag that differ by 10% from the mean calibratedvalues. Values are selected to maximize the differences in the magnitude of biodegradation; that is, the‘‘lower’’ simulation maximizes a decrease in biodegradation (smaller mm, larger tlag and slag), whereas the‘‘higher’’ simulation maximizes an increase in biodegradation (larger mm, smaller tlag and slag).
W04406 BRUSSEAU ET AL.: INFLUENCE OF MICROBIAL VARIABILITY ON CO
11 of 15
W04406

associated with the batch-measured values (Table 4).Given the level of uncertainty demonstrated for both thecolumn- and batch-determined parameters, it appears thatthere is reasonable correspondence between them. Thiscorrespondence is another piece of evidence supportingthe validity of the mathematical model used to representtransport. Interestingly, the maximum specific growth ratecoefficient exhibits a relatively small degree of uncertainty forboth batch and column systems, whereas greater uncertaintyis associated with the lag time mean and variance. One mayconjecture that this difference reflects the fact that themaximum specific growth rate coefficient represents aninherent property of the microbial system (assuming a propermodel is used), whereas the lag time mean and variance are
Figure 7. Influence of uncertainty in input parameters Y, Kc, and M0 on model output: (a) Hayhook-inoculated system; (b) Hayhook-indigenous system. The ‘‘mean’’ simulation is produced using the meanvalues for Y, Kc, and M0. The ‘‘lower’’ and ‘‘higher’’ simulations are produced using limiting valuesassociated with the 95% confidence intervals. Values are selected to maximize the differences in themagnitude of biodegradation; that is, the ‘‘lower’’ simulation maximizes a decrease in biodegradation(smaller Y, larger Kc, and smaller M0), whereas the ‘‘higher’’ simulation maximizes an increase inbiodegradation (larger Y, smaller Kc, and larger M0).
Table 5. Biokinetic Parameters Determined From Miscible
Displacement Experimentsa
Experiment mmax, h�1 tlag, h slag, h
Accusand A-Db 0.32 (0.1–0.5) 4.2 (2.2–6.3) 2.4 (0.9–4.0)Accusand 1–7b 0.31 (0.01–0.7) 2.5 (0.01–5.2) 1.1 (0.01–3.3)Hayhook-inoculated A-Db 0.38 (0.2–0.5) 1.9 (0.2–4.7) 3.3 (2.5–4.1)Hayhook-indigenous A-D 0.38 (0.2–0.5) 9.4 (1–21) 7.2 (1–20)Vinton-M A-C 0.25 (0.1–0.4) 3.1 (1.0–8.0) 1.1 (0.1–2.7)
aThe mean values and the associated 95% confidence intervals (inparentheses) are based on the individual optimized values obtained for allexperiments in each replicate set. Thus the variability represents primarilythe variability among all experiments within a given set.
bSystem employed the RB1353 isolate.
12 of 15
W04406 BRUSSEAU ET AL.: INFLUENCE OF MICROBIAL VARIABILITY ON CO W04406
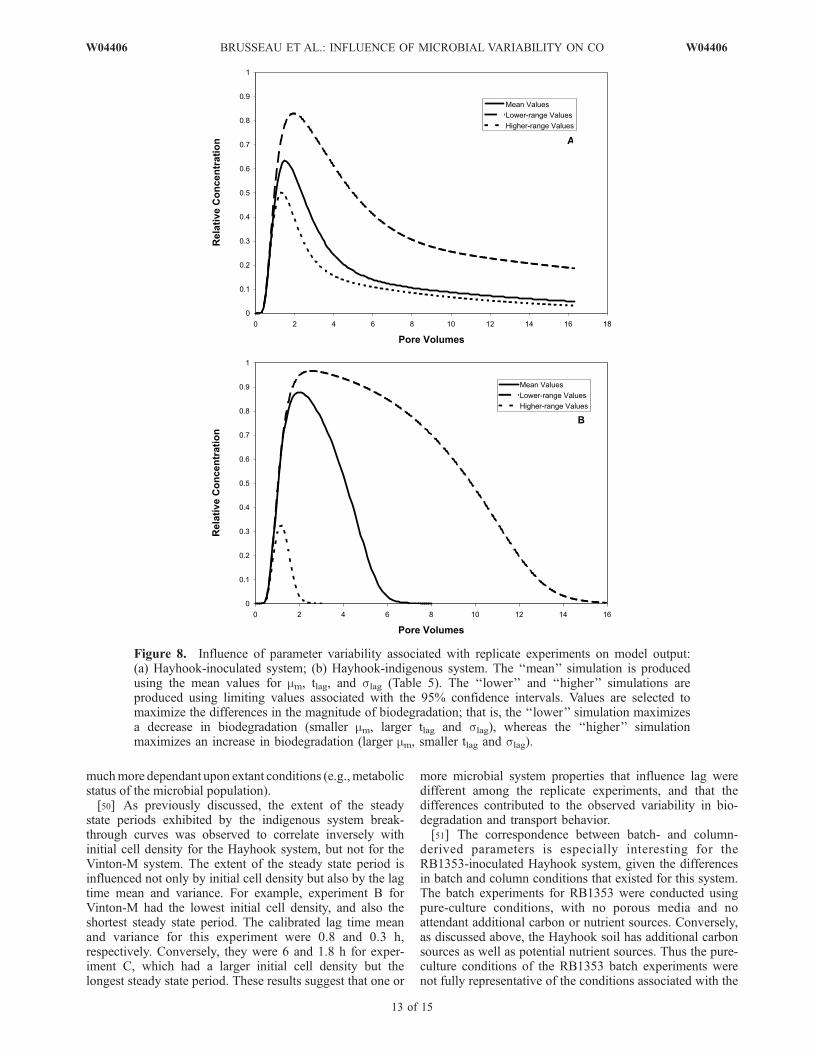
muchmore dependant upon extant conditions (e.g., metabolicstatus of the microbial population).[50] As previously discussed, the extent of the steady
state periods exhibited by the indigenous system break-through curves was observed to correlate inversely withinitial cell density for the Hayhook system, but not for theVinton-M system. The extent of the steady state period isinfluenced not only by initial cell density but also by the lagtime mean and variance. For example, experiment B forVinton-M had the lowest initial cell density, and also theshortest steady state period. The calibrated lag time meanand variance for this experiment were 0.8 and 0.3 h,respectively. Conversely, they were 6 and 1.8 h for exper-iment C, which had a larger initial cell density but thelongest steady state period. These results suggest that one or
more microbial system properties that influence lag weredifferent among the replicate experiments, and that thedifferences contributed to the observed variability in bio-degradation and transport behavior.[51] The correspondence between batch- and column-
derived parameters is especially interesting for theRB1353-inoculated Hayhook system, given the differencesin batch and column conditions that existed for this system.The batch experiments for RB1353 were conducted usingpure-culture conditions, with no porous media and noattendant additional carbon or nutrient sources. Conversely,as discussed above, the Hayhook soil has additional carbonsources as well as potential nutrient sources. Thus the pure-culture conditions of the RB1353 batch experiments werenot fully representative of the conditions associated with the
Figure 8. Influence of parameter variability associated with replicate experiments on model output:(a) Hayhook-inoculated system; (b) Hayhook-indigenous system. The ‘‘mean’’ simulation is producedusing the mean values for mm, tlag, and slag (Table 5). The ‘‘lower’’ and ‘‘higher’’ simulations areproduced using limiting values associated with the 95% confidence intervals. Values are selected tomaximize the differences in the magnitude of biodegradation; that is, the ‘‘lower’’ simulation maximizesa decrease in biodegradation (smaller mm, larger tlag and slag), whereas the ‘‘higher’’ simulationmaximizes an increase in biodegradation (larger mm, smaller tlag and slag).
W04406 BRUSSEAU ET AL.: INFLUENCE OF MICROBIAL VARIABILITY ON CO
13 of 15
W04406

RB1353-inoculated Hayhook column experiments. Despitethis difference, the batch- and column-derived biokineticparameters were similar.
5. Summary
[52] The impact of microbial system variability on thebiodegradation and transport behavior of a model solute wasinvestigated. The four systems employed comprised a rangeof porous medium and microbial properties, and concomi-tantly exhibited a range of biodegradation and transportbehavior. The biodegradation and transport behavior ofsalicylate exhibited a relatively small degree of variabilityfor the two inoculated systems, and a larger degree ofvariability for the two indigenous systems. The greatervariability observed for the two indigenous systems wasattributed primarily to greater variability of microbial sys-tem properties, such as initial cell density, metabolic status,and community composition. A mathematical model incor-porating cell growth, lag, and cell elution was used suc-cessfully to simulate the measured breakthrough curves.The calibrated values obtained for the maximum specificgrowth rate coefficient, the mean lag time, and the lag timevariance exhibited a significant degree of variability amongreplicates. Reasonable correspondence was observed be-tween the column-determined and batch-determined valuesfor both the inoculated and the indigenous systems. Suchcorrespondence would have been unlikely for the indige-nous systems if cell densities had not been measuredindependently for each experiment, given their large degreeof variability. The results reported herein illustrate thatvariability inherent to natural microbial systems can causevariability in transport behavior even under controlledlaboratory conditions, and concomitantly enhance the un-certainty of biokinetic parameters obtained from laboratorystudies.
Notation
b first order cell mass decay coefficient [T�1].C substrate concentration [ML�3].C0 substrate boundary input concentration [ML�3].
Cind induction concentration for microbial population[ML�3].
D hydrodynamic dispersion coefficient [L2T�1].Kc half-saturation constant for the substrate [ML�3].Ko half-saturation constant for the electron acceptor
[ML�3].Kd the equilibrium sorption constant [L3M�1].L column length [L].M biomass concentration [ML�3].M0 initial biomass [ML�3].M*T a cell transport and elution function (dimension-
less).Mti metabolizing biomass concentration at time step i
[ML�3].Mt�1 the metabolizing biomass concentration at time step
i-1 [ML�3].O electron-acceptor concentration [ML�3].O0 electron-acceptor boundary input concentration
[ML�3].t time [T].tl time since C > Cind [T].
tlag mean lag time [T].v average pore water velocity [LT�1].x distance [L].Y yield coefficient (cell mass produced/mass of
substrate degraded) (dimensionless).go a stoichiometric coefficient equal to the mass of
electron acceptor utilized by bacteria per unit massof substrate degraded (dimensionless).
q fractional volumetric water content of the packedcolumn (dimensionless).
mm maximum specific growth rate coefficient for themicrobial population [T�1].
r bulk density of the porous medium [ML�3].slag variance of lag time [T].
[53] Acknowledgment. This research was supported by grantsprovided by the NIEHS Superfund Basic Science Research Program (grant2P42ESO4940-11) and the U.S. Environmental Protection Agency STARprogram.
ReferencesAbbaspoura, K. C., R. Schulin, M. T. van Genuchten, and E. Schlappi(1998), Procedures for uncertainty analyses applied to a landfill leachateplume, Ground Water, 36, 874–883.
Alshafie, M., and S. Ghoshal (2003), Naphthalene biodegradation fromnon-aqueous-phase liquids in batch and column systems: Comparisonof biokinetic rate coefficients, Biotechnol. Prog., 19, 844–852.
Angley, J. T., M. L. Brusseau, W. L. Miller, and J. J. Delfino (1992),Nonequilibrium sorption and aerobic biodegradation of dissolved alkyl-benzenes during transport in aquifer material: Column experiments andevaluation of a coupled-process model, Environ. Sci. Technol., 26(7),1404–1410.
Bailey, J. E., and D. F. Ollis (1986), Biochemical Engineering Fundamen-tals, McGraw-Hill, New York.
Bodour, A. A., J. M. Wang, M. L. Brusseau, and R. M. Maier (2003),Temporal change in culturable phenanthrene degraders in response tolong-term exposure to phenanthrene in a soil column system, Environ.Microbiol., 5, 888–895.
Bradford, S. A., S. R. Yates, M. Bettahar, and J. Simunek (2002), Physicalfactors affecting the transport and fate of colloids in saturated porousmedia, Water Resour. Res., 38(12), 1327, doi:10.1029/2002WR001340.
Bradford, S. A., J. Simunek, M. Bettahar, M. Van Genuchten, and S. R.Yates (2003), Modeling colloid attachment, straining, and exclusion insaturated porous media, Environ. Sci. Technol., 37, 2242–2250.
Brusseau, M. L., R. E. Jessup, and P. S. C. Rao (1992), Modeling solutetransport influenced by multi-process nonequilibrium and transformationreactions, Water Resour. Res., 28, 175–182.
Brusseau, M. L., L. H. Xie, and L. Li (1999), Biodegradation duringcontaminant transport in porous media: 1. Mathematical analysis ofcontrolling factors, J. Contam. Hydrol., 37, 269–293.
Buchanan, R. L., R. C. Whiting, and W. C. Damert (1997), When is simplegood enough: A comparison of the Gompertz, Baranyi, and three-phaselinear models for fitting bacterial growth curves, Food Microbiol., 14,313–326.
Chapelle, F. H., P. M. Bradley, D. R. Lovley, and D. A. Vroblesky (1996),Measureing rates of biodegradation in a contaminated aquifer using fieldand laboratory methods, Ground Water, 34, 691–698.
Chen, Y. M., L. M. Abriola, P. J. J. Alvarez, P. J. Anid, and T. M. Vogel(1992), Modeling transport and biodegradation of benzene and toluene insandy aquifer material: Comparisons with experimental measurements,Water Resour. Res., 28, 1833–1847.
Colella, P. (1990), Multidimensional upwind methods for hyperbolicconservation laws, J. Comput. Phys., 87, 171–179.
Danielson, R. E., and P. L. Sutherland (1986), Porosity, in Methods of SoilAnalysis, part 1, Physical and Mineralogical Properties, 2nd ed., editedby A. Klute, pp. 443–461, Am. Soc. of Argron., Madison, Wis.
Estrella, M. R., M. L. Brusseau, R. S. Maier, I. L. Pepper, P. J. Wierenga,and R. M. Miller (1993), Biodegradation, sorption, and transport of 2,4-dichlorophenoxyacetic acid in saturated and unsaturated soils, Appl.Environ. Microbiol., 59, 4266–4273.
Grady, C. P. L., B. F. Smets, and D. S. Barbeau (1996), Variability in kineticparameter estimates: A review of possible causes and a proposed termi-nology, Water Res., 30, 742–748.
14 of 15
W04406 BRUSSEAU ET AL.: INFLUENCE OF MICROBIAL VARIABILITY ON CO W04406

Guo, L., and R. J. Wagenet (1999), Evaluation of alachlor degradationunder transport conditions, Soil Sci. Soc. Am. J., 63, 443–449.
Guo, L., R. J. Wagenet, and W. A. Jury (1999), Adsorption effects onaldicarb degradation, Soil Sci. Soc. Am. J., 63, 1637–1644.
Jordan, F. L., S. K. Sandrin, R. J. Frye, M. L. Brusseau, and R. M. Maier(2004), The influence of system complexity on bacterial transport insaturated porous media, J. Contam. Hydrol., 74, 19–38.
Katsivela, E., E. R. B. Moore, D. Marouki, C. Stropml, D. Pieper, andN. Kalogerakis (2005), Bacterial community dynamics during in-situbioremediation of petroleum waste sludge in landfarming sites, Bio-remediation, 16, 169–180.
Kelly, W. R., G. M. Hornberger, J. S. Herman, and A. L. Mills (1996),Kinetics of BTX biodegradation and mineralization in batch and columnsystems, J. Contam. Hydrol., 23, 113–132.
Langner, H. W., W. P. Inskeep, H. M. Gaber, W. L. Jones, B. S. Das, andJ. M. Wraith (1998), Pore water velocity and residence time effects onthe degradation of 2,4-D during transport, Environ. Sci. Technol., 32,1308–1315.
Li, L. (2001), Modeling transport of contaminants influenced by complexmicrobial processes, Ph.D. dissertation, Univ. of Ariz., Tucson.
Li, L., I. Yolcubal, S. Sandrin, M. Q. Hu, and M. L. Brusseau (2001),Biodegradation during contaminant transport in porous media: 3.Apparent condition-dependency of growth-related coefficients, J. Con-tam. Hydrol., 50, 209–223.
Liu, C., and J. M. Zachara (2001), Uncertainties of monod kinetic para-meters nonlinearly estimated from batch experiments, Environ. Sci. Tech-nol., 35, 133–141.
MacNaughton, S. J., J. R. Stephen, A. D. Venosa, G. A. Davis, Y. J. Chang,and D. C.White (1999), Microbial population changes during bioremedia-tion of an experimental oil spill, Appl. Environ. Microbiol., 65, 3566–3574.
Madsen, E. L. (1991), Determining in situ biodegradation: Facts and chal-lenges, Environ. Sci. Technol., 25, 1663–1673.
McNabb, W. W., and B. P. Dooher (1998), Uncertainty analyses of fuelhydrocarbon biodegradation signatures in ground water by probabilisticmodeling, Ground Water, 36, 691–698.
Park, J.-H., X. Zhao, and T. C. Voice (2001), Comparison of biodegradationkinetic parameters for naphthalene in batch and sand column systems byPseudomonas Putida, Environ. Prog., 20, 93–102.
Phanikumar, M. S., D. W. Hyndman, D. C. Wiggert, M. J. Dybas, M. E.Witt, and C. S. Criddle (2002), Simulation of micribial transport and
carbon tetrachloride biodegradation in intermittently-fed aquifer col-umns, Water Resour. Res., 38(4), 1033, doi:10.1029/2001WR000289.
Roling, W. F. M., M. G. Milner, D. M. Jones, F. Fratepietro, R. P. J.Swannell, F. Daniel, and I. M. Head (2004), Bacterial communitydynamics and hydrocarbon degradation during a field-scale evaluationof bioremediation on a mudflat beach contaminated with buried oil, Appl.Environ. Microbiol., 70, 2603–2613.
Sandrin, S. K., F. L. Jordan, R. M. Maier, and M. L. Brusseau (2001), Biode-gradation during contaminant transport in porous media: 4. Impact ofmicrobial lag and bacterial cell growth, J. Contam. Hydrol., 50, 225–242.
Sirivithayapakorn, S., and A. Keller (2003), Transport of colloids in saturatedporous media: A pore-scale observation of the size-exclusion effect andcolloid acceleration, Water Resour. Res., 39(4), 1109, doi:10.1029/2002WR001583.
Steinberg, L. J., J. H. Reckhom, and R. L. Wolpert (1997), Characterizationof parameters in mechanistic models: A case study of a PCB fate andtransport model, Ecol. Model., 97, 35–46.
Tebes-Stevens, C. L., and A. J. Valocchi (2000), Calculation of reactionparameter sensitivity coefficients in multicomponent subsurface transportmodels, Adv. Water. Resour., 23, 591–611.
Thornton, S. F., D. N. Lerner, and S. A. Banwart (2001), Assessing thenatural attenuation of organic contaminants in aquifers using plume-scale electron and carbon balances: Model development with analysis ofuncertainty and parameter sensitivity, J. Contam. Hydrol., 53, 199–232.
Tufenkji, N., G. F. Miller, J. N. Ryan, R. W. Harvey, and M. Elimelech(2004), Transport of Cryptosporidium oocysts in porous media: Role ofstraining and physicochemical filtration, Environ. Sci. Technol., 38,5932–5938.
Wang, J.-M., B. Patterson, A. Bodour, R. M. Maier, and M. L. Brusseau(2005), Biodegradation during contaminant transport in porous media: 7.Impact of multiple-degrader community dynamics, Envrion. Toxicol.Chem., 24, 2806–2811.
����������������������������M. L. Brusseau, F. L. Jordan, L. Li, and R. M. Maier, Department of
Soil, Water and Environmental Science, University of Arizona, Tucson, AZ85721, USA. ([email protected])
S. K. Sandrin, Science Outreach Program, University of Wisconsin-Oshkosh, 800 Algoma Boulevard, Oshkosh, WI 54901, USA.
I. Yolcubal, Department of Geological Engineering, Kocaeli University,Izmit 41040, Turkey.
W04406 BRUSSEAU ET AL.: INFLUENCE OF MICROBIAL VARIABILITY ON CO
15 of 15
W04406
Copyright © 2022 FDOKUMEN