Beware the Gini Index! A New Inequality Measure - arXiv
26
Beware the Gini Index! A New Inequality Measure Sabiou Inoua Chapman University [email protected] Abstract. The Gini index underestimates inequality for heavy-tailed distributions: for example, a Pareto distribution with exponent 1.5 (which has infinite variance) has the same Gini index as any exponential distribution (a mere 0.5). This is because the Gini index is relatively robust to extreme observations: while a statistic’s robustness to extremes is desirable for data potentially distorted by outliers, it is misleading for heavy-tailed distributions, which inherently exhibit extremes. We propose an alternative inequality index: the variance normalized by the second moment. This ratio is more stable (hence more reliable) for large samples from an infinite-variance distribution than the Gini index paradoxically. Moreover, the new index satisfies the normative axioms of inequality measurement; notably, it is decomposable into inequality within and between subgroups, unlike the Gini index. Keywords: inequality, Gini index, heavy tail, power law, infinite variance, generalized central limit theorem, robustness JEL Codes: C10, D63
-
Upload
khangminh22 -
Category
Documents
-
view
1 -
download
0
Transcript of Beware the Gini Index! A New Inequality Measure - arXiv

Beware the Gini Index! A New Inequality Measure
Sabiou Inoua
Chapman University
Abstract. The Gini index underestimates inequality for heavy-tailed distributions: for
example, a Pareto distribution with exponent 1.5 (which has infinite variance) has
the same Gini index as any exponential distribution (a mere 0.5). This is because the
Gini index is relatively robust to extreme observations: while a statistic’s robustness
to extremes is desirable for data potentially distorted by outliers, it is misleading for
heavy-tailed distributions, which inherently exhibit extremes. We propose an
alternative inequality index: the variance normalized by the second moment. This
ratio is more stable (hence more reliable) for large samples from an infinite-variance
distribution than the Gini index paradoxically. Moreover, the new index satisfies the
normative axioms of inequality measurement; notably, it is decomposable into
inequality within and between subgroups, unlike the Gini index.
Keywords: inequality, Gini index, heavy tail, power law, infinite variance,
generalized central limit theorem, robustness
JEL Codes: C10, D63

1 Overview
The Gini index, proposed by C. Gini [1], is the most popular inequality measure.
Iconic by its geometric interpretation in terms of the Lorenz curve [2], the Gini index
is also fascinating by its rich mathematical properties and alternative formulations
[3]. Yet the Gini index has some limitations; for example, it does not apply to a zero-
mean distribution (such as the normal distribution) and it may behave poorly, falling
outside the interval [0,1], for variables assuming negative values. This problem is
easily fixed however, for one can adjust the definition of the index for negative
values [4]. In fact, the Gini ratio’s denominator is more rigorously defined for a
signed variable to be the variable’s mean absolute value (rather than the raw mean):
then the ratio is well-defined and well-behaved for any nonzero variable (Section 4).
More importantly, the Gini index underestimates inequality for heavy-tailed
distributions.1 Thus a Pareto distribution with an exponent of 1.5 (an infinite-
variance variable) has the same Gini index as any exponential distribution (a mere
0.5), because the Gini index is relatively insensitive to a distribution’s tail, namely to
extreme realizations of a variable (Section 2). While a statistic’s robustness to
extremes is desirable for data potentially distorted by outliers, it is misleading for
heavy-tailed distributions, which inherently exhibit extremes. We propose an
alternative inequality index (Section 3) that may seem paradoxical at first sight but
that is well-behaved upon scrutiny: the variance normalized by the second moment.
This ratio is stable for large samples even when the theoretical (population) variance
is infinite: it is then more stable statistically than the Gini index, surprisingly (Section
4). Moreover, the new index satisfies the normative axioms of inequality
1 This limitation of the Gini index should not be confused with other seemingly related issues
suggested in the literature. For example, the Gini index is commonly reported to be over-sensitive to
changes in the middle of a distribution compared to changes in the distribution’s tails, a claim that
does not stand closer scrutiny, however [5]. This paper focuses not so much on the Gini’s different
treatments of portions of a distribution than the index’s mild treatment of heavy tails. Other reported
flaws of the index include a small-sample bias and a bias due to grouping [6, 7, 8, and refs. therein].

3
measurement: notably it is decomposable into inequality within and between
subgroups, unlike the Gini index.
2 The Gini Index and Heavy Tails
The Gini index of a non-negative variable X with positive mean is by definition:2
1'| |
2( ) ,( )
X XG X
X (1)
where 'X is an independent copy of X (that is, X and 'X are independent but
identically distributed). For a continuous variable X, the Gini index is more easily
computed from the distribution function ( )F x prob{ }X x through the formula:
0( )[1 ( )]
( ) .( )
F x F x dxG X
X (2)
For an empirical variable (or sample) X1
[ ,..., ],N
x x the Gini index becomes
2 1 1
1| |
2( ) .mean( )
N N
i ji jx x
NG XX
(3)
This formula becomes much simpler if one arranges X in ascending order,(1) (2)
x x
...( )i
x ...( )
.N
x Then
( )1
1
2 1( ) .
N
ii
N
ii
ix NG X
N Nx (4)
These are standard facts about the Gini index that we remind for the sequel.3
The following Proposition (proven shortly) illustrates the above-mentioned
inadequacy of the Gini index for heavy-tailed distributions:
2 Throughout this paper, the word “variable” is used preferably to “random variable”. We always
exclude throughout this paper the trivial case where X=0 with probability 1. 3 For a review and proof of these facts and many others, see e.g. [3].

4
Proposition 1. If Z is an exponential distribution with mean 2/3, then Z and exp(Z) have
the same Gini index 0.5.G Moreover, ( ) [exp( )]G Z G Z if mean( )Z 2/3.
This is not a minor anomaly, for Z and exp(Z) are not different just quantitatively
(though this is important enough in itself): exp(Z) is a heavy-tailed variable with
infinite-variance: a Pareto distribution with exponent 3/2 (Figure 1).
Figure 1. Exponential versus Pareto distribution. The two
distributions, Z and X=exp(Z), have the same Gini index G=0.5!
A brief overview on heavy-tailed distributions here may help better articulate the
sequel. A heavy-tailed variable X is precisely one that has heavier tail relatively to
any exponential distribution, in the sense that [exp( )]X for all 0. In most
applications, it is sufficient to restrict to the subclass of sub-exponential heavy-tailed
variables, whose defining property is to exhibit the “one-big jump phenomenon”,
whereby the distribution is dominated by one observation (the maximum one), in

5
the sense that for independent copies 1
{ ,..., }N
X X of a sub-exponential X we have (by
definition):4
1
1
prob{ ... }1 ( , 1).
prob{max( ,..., ) }N
N
X X xx N
X X x (5)
An implication of this definition is that the tail of X decays more slowly indeed than
any exponential distribution in the sense that
prob{ }
( , all 0).exp( )
X xx
x (6)
Exponential distributions, therefore, are a reference middle between heavy and light
tails. Pareto distributions are the simplest type of heavy-tailed variables. A Pareto
distribution, to remind the basics, is a continuous variable X with5
min
prob{ } ( / ) ,X x x x xmin
0, 0x (7)
where the parameter is called the tail exponent (or Pareto index). A Pareto
distribution is therefore a line in log-log plot: log prob{ }X xmin
log( ) logx x
(Figure 2: 4th Subplot). It can be characterized as the exponential of an exponential
distribution: for any Z with prob{ }Z z minexp[ ( )],z z
min,z z prob{ Ze }x
prob{Z log }x exp[ (log x min)]z min
( / ) ,x x wheremin
xmin
exp( );z
conversely, logX is exponential if X is Pareto. A power law X is a distribution that is
Pareto asymptotically, in the sense that there is 0 such that
prob{ } 0| |x X x C as x . Power laws are an important class of heavy-
tailed distributions due to their ubiquity in social phenomena, notably in economic
data [12, 13].
Heavy-tailed variables are special because they need not obey the standard laws of
large numbers when their variability is too high (the lower , the more extreme the
variability of a power law); and when they do, their sum converges more slowly to a
4 For a review of subexponential variables, see [9-11]. 5 For a more detailed introduction to the theory and empirics of Pareto distributions, see, e.g., [12].

6
Gaussian distribution compared to more common distributions. One can show that
for any power law, ( )X if , which follows by direct integration for a
Pareto, for which ( )X min/ ( )x if 0 . Thanks to seminal work by P.
Levy [14] and the contributions of other influential probability theorists of the past
century, the central limit theorem has been extended to any variable (with light or
heavy tails) into what we may call the “stable limit theorem”, a complete
characterization of all the possible limit laws of the (properly normalized) sum of
independent copies of a variable. (See this paper’s Appendix for a specialization of
this theorem invoked throughout this paper, notably in Proposition 4, Section 4.) The
only possible limit laws are called alpha-stable or Levy variables, in reference to
their stability by convolution (that is, up to standardization, a stable law is preserved
by addition of independent copies of it) and their characteristic parameter (0,2] :
except the Gaussian (the finite variance case, or 2), Levy variables are a special
subclass of infinite-variance power laws whose exponents (0,2). 6 Thus the limit
sum of independent copies of any infinite-variance variable X, if this limit exists, is
necessarily an infinite-variance variable itself, a Levy with (0,2), unless the tail
of X is not heavy enough, in the sense that x 2
| |( 1 )
X xX is a slowly varying
function: this last condition is the general condition for convergence to a Gaussian
(generalizing the finite second moment condition).7 A function L is slowly varying if
it behaves asymptotically like a constant, in the sense that ( )/ ( ) 1L tx L x as x
for any 0t (two common examples being a constant and a logarithmic function).8
A necessary condition for the sum of independent copies of a variable X to converge
to a stable law is that X have a regularly varying distribution, meaning prob{| |X
6 For a synthetic textbook exposition of the general central limit theorem see, e.g., [15, sec. 2.2, th.
2.2.15] and [16, sec. 3.8, th. 3.8.2]. For intuitive derivations in a physics context, see e.g. [17, 18]. For an
economic application, see e.g. [19].
7 Throughout, 1 1A
stands for the indicator function of A: 1 1A
if A is true, 1 1A
if A is false.
8 A constant function C satisfies ( )C xt ( ).C x
7
}x ( )L x x with L slowly varying: power laws are the subclass with ( ) 0.L x C
We focus in this paper mostly on power laws.
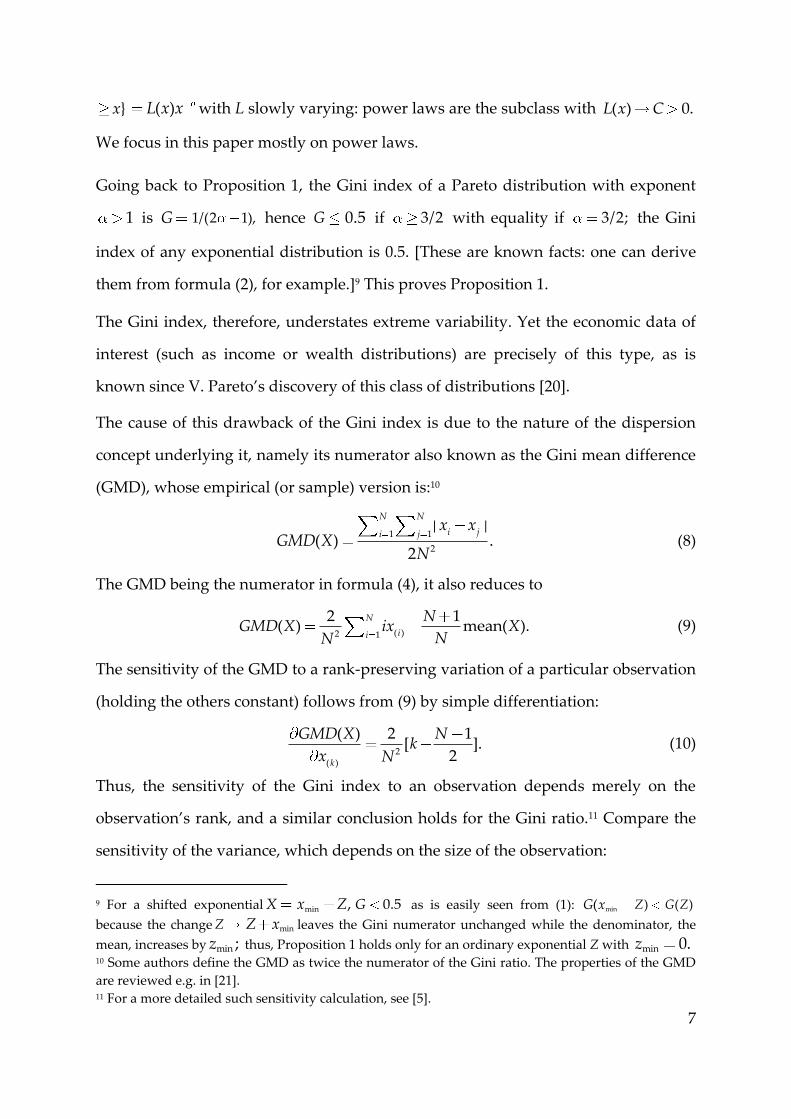
Going back to Proposition 1, the Gini index of a Pareto distribution with exponent
1 is G 1/(2 1), hence G 0.5 if 3/2 with equality if 3/2; the Gini
index of any exponential distribution is 0.5. [These are known facts: one can derive
them from formula (2), for example.]9 This proves Proposition 1.
The Gini index, therefore, understates extreme variability. Yet the economic data of
interest (such as income or wealth distributions) are precisely of this type, as is
known since V. Pareto’s discovery of this class of distributions [20].
The cause of this drawback of the Gini index is due to the nature of the dispersion
concept underlying it, namely its numerator also known as the Gini mean difference
(GMD), whose empirical (or sample) version is:10
1 1
2
| |( ) .
2
N N
i ji jx x
GMD XN
(8)
The GMD being the numerator in formula (4), it also reduces to
( )2 1
2 1( ) mean( ).
N
ii
NGMD X ix X
NN (9)
The sensitivity of the GMD to a rank-preserving variation of a particular observation
(holding the others constant) follows from (9) by simple differentiation:
2
( )
( ) 2 1[ ].
2k
GMD X Nk
x N (10)
Thus, the sensitivity of the Gini index to an observation depends merely on the
observation’s rank, and a similar conclusion holds for the Gini ratio.11 Compare the
sensitivity of the variance, which depends on the size of the observation:
9 For a shifted exponential X min ,x Z 0.5G as is easily seen from (1): min(G x )Z ( )G Z
because the change Z minZ x leaves the Gini numerator unchanged while the denominator, the
mean, increases by min ;z thus, Proposition 1 holds only for an ordinary exponential Z with min 0.z 10 Some authors define the GMD as twice the numerator of the Gini ratio. The properties of the GMD
are reviewed e.g. in [21]. 11 For a more detailed such sensitivity calculation, see [5].

8
var( ) 2
[ mean( )].i
i
Xx X
x N (11)
Because empirical data are possibly contaminated by a few outliers, one usually
assumes (for good reasons) that the lower a statistic’s sensitivity to an individual
observation, the better: hence a certain advocacy for robust dispersion measures like
the mean absolute deviation (MAD), or the GMD, compared to the variance.12 Yet it
is a mistake to transpose the outlier argument to a heavy-tailed distribution, which
intrinsically exbibits extremes that, moreover, represent a sizable portion of the
distribution by definition [equation (5)]. For power laws (or regularly varying
distributions more generally), the one-big jump phenomenon presents itself in a
specific manner that is the more striking, the smaller the power law’s tail exponent
: in particular, when 1 one can show that the maximum observation in a large
random sample from a (positive) power law is on average of the same order of
magnitude as the sum of all observations [22, p. 465]:13
1
1
... 1( ) (0 1, ).max{ ,..., }
N
N
X XN
X X (12)
If 0.5, for example, one single observation in a sufficiently large sample will
represent on average 50% of the sum of all observations (Figure 2).
12 The MAD is even less sensitive to extremes in the sense that its sensitivity to an observation
depends merely on the sign of this observation’s distance from the median. 13 For an intuitive derivation of this formula, and the corresponding ones for 1, see [18, p. 106].

9
Figure 2. The one-big jump phenomenon (or dominance of a few
observations) is an intrinsic feature of heavy-tailed distribution: here, a
Pareto distribution with exponent 0.5; one observation (the 5324th one)
accounts for much of the sum of the distribution.
Thus, any robust summary of a heavy-tailed variable is a poor summary of that
distribution.
By its greater sensitivity to extremes, the variance is a more faithful measure of
dispersion for power laws than the GMD. That the variance is infinite for a broader
class of distributions can itself be counted as a virtue in this respect.14 The concept of
infinite variance should not deter us, for the difficulty is not as important as it may
seem at first sight: an infinite theoretical (population) variance empirically means
that the sample variance fluctuate wildly from sample to sample (which is just
another way of saying that the distribution is ill-represented by an average value):
formally, the second moment of a large sample from an infinite-variance power law
14 The GMD of a distribution is finite whenever the mean of the distribution is finite; thus, the GMD of
a power law with exponent 1 is finite. More on this in Section 4.

10
is an infinite variance Levy variable by the general central limit theorem.15 But if the
variance is properly normalized into a ratio, through a denominator whose sample
fluctuation is of the same order of magnitude as that of the variance, then it yields a
statistically stable measure of variability (Section 4). The right denominator to that
effect is none other than the second moment: as it turns out, the variance normalized
by the second moment is a natural inequality measure.
3 An Alternative Inequality Measure
We propose, therefore, for any (nonzero) empirical variable 1
[ ,..., ]N
X x x , the
inequality measure:
2
variance( )( ) .
mean( )
XI X
X (13)
Clearly, 0 1.I Besides the obvious interpretation as a normalized variance, the
ratio I has various other interpretations that illustrate its potential versatility as a
general concept (beyond the specific use as an inequality measure). Suffice it here to
mention a few known results across the sciences that implicitly involve the
inequality index I and on which therefore new light may be shed if this connection is
made explicit. Consider, to begin with, the following simple but powerful result in
probability theory (usually known as the “second moment method”):
Second moment method. For any finite-variance 0X we have prob{ 0} ( ).X I X
This result is a consequence of Cauchy-Schwarz inequality, it is known:
2 1/2 2 1/2 2 1/2 1/2
{ 0} { 0}( ) ( 1 ) [ ( )] [ (1 ) ] [ ( )] [prob{ 0}] ,
X XX X X X X
from which (14) follows, if one solves for prob{ 0}.X
15 More precisely, if
1{ , ..., }
NX X are independent copies of an (infinite-variance) power law with
]0, 2[, then2/ 2
1Ni iN x converges in distribution to Levy variable with index /2. See Appendix.

11
The I index has also a series of potential applications, notably in economics,
inherited from its simple relationship with the Hirshman-Herfindal index [23, 24]:
2
1
2
1
( ) .( )
N
ii
N
ii
xH X
x (15)
Clearly, we have
1
( ) 1 .( )
I XNH X
(16)
Thus, any interpretation of the H index can be rephrased in terms of the I index. The
H index is of course primarily used as a concentration measure: H is then interpreted
as measuring an inverse effective number of observations in a distribution (the
number of dominant elements in it so to speak). That is, a variable X is mostly
concentrated on 1/H(X) number of its elements (e.g. 1/H(X) 2.05 for X
[1,2,1,90,110]); in particular, perfect equality (X [x,…,x]) means 1/ ( )H X N, and
perfect inequality is approached by a large distribution concentrated on one
individual, for which 1/ ( )H X 1 1/ .N It makes sense therefore to measure the
degree of equality in a distribution X by the fraction of its dominant elements,
namely by the ratio [1/ ( )]/H X N 1 ( ),I X or the effective number of elements in X
relatively to that of a perfectly equal distribution of the same size.
A similar interpretation of I follows from the following probabilistic interpretation of
H. To any nonnegative variable X1
[ ,..., ]N
x x we associate the two probability
systems P [ ]i
p and [ ],i
Q s wherei
p 1/N and / Nk ki i
q x x ( 1,..., ),i N and denote
by P
and Q
the corresponding expectation operators. The probability systems can
be called the uniform versus “rich-get-richer” probability measures (as would
suggest the following experiment: pick at random a value from X, where the
probability of picking i
x is ,i
p and increase the picked value by some amount;
consider the same experiment, but with probability i
q instead.) We have ( )P
P

12
1/N and ( )Q
Q .H Thus,1 ( )I X measures the degree of equality in X by
comparing the two associated probability measures through the ratio ( )/ ( ).P Q
P Q
The index I also has an informational interpretation: since the inverse ratio 1/H
measures the effective number of elements in a distribution, it follows that H itself
measures the frequency of each element in the distribution adjusted for the relative
size of each element: that is, H is effectively a probability. But since to each
probability, one can associate an information measure by taking the log-probability,
we have an information interpretation of H in terms of
2( ( )) log ( ),R Q X H X (17)
namely the second order Rényi entropy of the “rich get richer” probability system
associated to X. The Rényi entropy [25] of a probability system 1
[ ,..., ]n
P p p is more
generally defined as
1
1( ) log( ) ( 0, 1).
1
N
ii
R P p (18)
The I index is also a normalized version of the second order generalized inequality
entropy measure, the general class of which plays a central role in the axiomatic
approach to inequality measurement discussed shortly:
2
2 1 mean( )
1 1 1[ ( ) 1] [ 1].
2 2
N i
i X
xE NH
N (19)
In other words
2
2
2.
2 1
EI
E (20)
Finally, the new index has this other general interpretation also inherited from the H
index: usually this latter emerges as a measure of how much of the variability of an
aggregate variable (e.g. GDP [19]) is due to the typical fluctuation of the individual
components (firms’ sales), provided these latter are statistically independent from
one another. That is, the following interpretation holds in many contexts:

13
aggregate volatility
individual volatility .H (21)
In terms of the new inequality index, we have
aggregate volatility
individual volatility
1 1.
1N I (22)
Thus, a large aggregate volatility can emerge even in a very large system of
independent components if these latter are highly unequal: 1/N is the damping
factor due to the aggregation of independent homogenous components; but this
damping factor is offset if the individual components are highly unequal. The
argument in terms of the H index is known [19].16 But the reformulation in terms of
the new index uncovers an
0
1Inequality Multiplier .
1k
k
II
(23)
Any situation where the H index plays a role, so could also do the inequality
multiplier; and this is potentially the case of any sum of individual variables.
Consider, for example, the return of an index or portfolio of assets, which is the
average return of the individual assets, say 1Ni i iR x R , where [ ]
ix X are the asset
weights. In the simple case of independent, identically distributed, zero-mean
individual asset returns, the portfolio’s volatility is var( | )R X1
( )var( ).H X R 17
Relaxing the assumption of independent individual components, one can also define
a linkage multiplier, the part of aggregate fluctuation due to the network
amplification or propagation of interdependent individual shocks [28], or even
consider a multiplier due to the inequality of network degrees (since some
individuals are more heavily connected than others), usually measured by the
coefficient of variation (CV) of the degrees [28]. The link between CV and I is a direct
one:
16 According to [19], the micro shocks of 100 largest firms in the US could account for one-third of
aggregate fluctuations of the country’s GDP. 17 The H index appears in portfolio theory as an effective portfolio diversification measure [26, 27].

14
2
2.
1
CVI
CV (24)
To summarize: the new index has potentially a range of applications due to its
simple connections with a few core concepts across the sciences, connections given
by the conversion formulas (already proven or easy to establish):
2 1
0
1 (1 ) ,k
k
NH CV I I (25)
2 1
1
(1 ) .k
k
CV I I I (26)
2
log[ (1 )].R N I (27)
2
1.
2 1
IE
I (28)
As an inequality measure, more specifically, the I index enjoys the axioms of the
normative approach to inequality measurement, which requires that an inequality
measure J J(X) satisfy a list of properties, notably:
1. Normalization: 0 ( ) 1.J X
2. Scale invariance: ( ) ( )J X J X for 0.
3. Anonymity: J(X) should be invariant to the way the elements of X are indexed
(invariance to permutations of X).
4. Transfer principle: a rank-preserving transfer from a greater to lower element
of X (from a richer to a poorer person) should reduce inequality.
5. Population principle: J(X, X) J(X) (invariance to pooled replications of X).
6. Decomposability: if X comes in subgroups, then J should be decomposable into
inequality within subgroups and inequality between subgroups.
We know of no inequality measure in the literature that satisfy all the 6 axioms. The
Gini index satisfies Axioms 1-5, but not necessarily Axiom 6 (decomposability),
except in the case of nonoverlapping subgroups [29, Appendix A]. By an important

15
theorem [30-32], an inequality measure ( )J X , continuous with respect to each
element of X, satisfies the principle of transfers, scale independence, and
decomposability if and only if it is some increasing function of a generalized entropy
measure (where can be any real number including 1 if interpreted as 1) 18
1 mean( )
1 1[ ( ) 1].
( 1)
N i
i X
xE
N (29)
Proposition 2. The index I satisfies the Axioms 1-6 listed above.
Proof. The index I obeys the population principle and anonymity in a
straightforward way, and it is normalized. Since I2 2
2 /(2 1),E E a strictly
increasing function of 2,E it satisfies the principle of transfers, scale independence,
and decomposability by virtue of the above-mentioned theorem. ∎
One can also derive the 6 properties for I by direct calculation; for example, the
transfer principle: a rank-preserving transfer 0t from richer to poorer, or ( , )i j
x x
( ,i
x t ),j
x t is by definition one such thati
x t ,j
x t hence it is one such that
22 ( ) 4 .j i
t x x t The transfer preserves mean(X) but decreases the second moment:
2mean( )X 2mean( )X 22t 2 (j
t x ).i
x Thus, the transfer lowers I, namely 1
2(mean( )) /X 2mean( ).X The decomposition of I by subgroup components can be
established from the corresponding decomposition formula of the generalized
entropy2
E through a standard (if tedious) procedure [29, Appendix A].
4 Comparing the Two Inequality Measures
We emphasized at least two reasons in favor of the new index over the Gini index
(that I reflects better extreme variability and that it is always decomposable). A
systematic empirical investigation of the two inequality measures using income or
18 This is a central theorem of the axiomatic approach [33: see Theorem 4]. See also [34].

16
wealth distributions (in view notably of the first argued limitation of the Gini index)
is beyond this paper’s scope: for such study to be conclusive one would need to
work with complete income or wealth distributions, rather than the relatively
aggregated and often partial data, coming, say, by income classes, such as the US
census data used in Figure 3. (We should not expect a major diffence between the
two indices using aggregated data that even out extremes, although we note a
turning point around 1995 when G becomes greater than I.)19 Thus we will be
contempt here with theoretical comparisons of the two indices illustrated, when
needed, with simulated heavy-tailed data.
Figure 3. The inequality measures G and I for the USA census income data.
The two measures I and G share a few similarities. They coincide for at least two
distributions: the exponential one, for which I G 0.5, and the Bernoulli one, or the
19 Source: Historical Income Tables, census.gov. These are income data (in dollars) grouped in classes:
[under 15000], [25,000 to 34,999], …, [200000 and over]. We take the lowest income to be zero and
roughly estimate the highest income in such a way as to recover the summary statistics (such as the
mean income) reported in the data. An overview of the limitations of common inequality data can be
found e.g. in the recent review paper [35].

17
indicator function of an event E, for which I G 1 prob( ).E For a Pareto with
exponent , we have ( )G G 1( 1) if 1, as already mentioned earlier; in
contrast ( )I I 2( 1) for 2, as one can establish using the moment formula
for the Pareto mentioned in the brief reminder on power laws (Section 2). Simple
calculations yield ( ) ( )I G if 2 2 2 and ( )I ( )G if 2 2.
Conceptually, moreover, both indices are just normalized dispersion measures. In
fact, the two indices belong to a general class of inequality measures:
1'| |
2( ) ,| |
p
p p
X XI X
X (30)
where, again, 'X is an independent copy of X, and 1.p 20 The general index pI is
well-defined for any nonzero variable X with | ,| pX and it is in the range [0,1].
This is true by the triangle inequality:21
1/ 1/ 1/ 1/( ' ) ( | ) ( '| ) 2( | ) .| | | | |p p p p p p p pX X X X X (31)
For 2,p the numerator in (30) is (X 2') /2X 2(X 2 'X X 2 )/2X var( ),X
so 2
.I I For 1p we recover G if 0X and ( ) 0.X In fact we should define the
Gini index more generally as 1
( ) ( ),G X I X namely
1'| |
2( ) .| |
X XG X
X (32)
As announced earlier (Section 2), this general definition circumvents the undesirable
behavior of the common definition of G vis-à-vis signed variables. In particular, if X
is a symmetric variable (that is, X and X have the same distribution), then ( )G X
( )G X by the extended definition (32). However, one can show that G 1/ 2 0.7
20 If we define dispersion more strictly in terms of the distance function ( , )X Y pX Y induced by the norm pX X 1/( | )| ,p pX then we would consider instead
1/ pI as inequality measure. But statisticians use more flexible “distance” concepts (such as a square distance).
21 The triangle inequality is applied, that is, to the distance function referred to in the preceding note.

18
for the Gaussian, suggesting this latter is more unequal distribution than an
exponential variable, for example; more generally, a significant presence of negatives
in a distribution tends to produce relatively high values for both indices, which is
perhaps intuitively reasonable: a society with symmetric income distribution would
be one in which only half of the population have positive incomes and the other half
are indebted to them, an extreme form of inequality! This is even better reflected in
the new index, since ( ) 1I X if mean( ) 0.X But then both indices (especially the
new one) are poor measures of heavy-tailedness for signed variables (by ranking
higher a Gaussian compared to say a Pareto with index 1.5, for example: the next
paragraphs define I for infinite-variance variables). This is easily fixed however: the
heavy-tailedness of X can be measured by ( ).| |I X
We close the comparison of the two indices by a discussion of their respective
statistical stability. One might be inclined to prejudge that I is a more volatile statistic
compared to G, and to assume that I is the more volatile, the heavier the tail of X. But
this is only true of the ratios’ numerators. In fact, I is more stable statistically then G
for infinite-variance variables, paradoxically: moreover, we have the curious pattern
that I(X) is the more stable compared to G(X), the more volatile is X; and the reverse
pattern for G (Figure 4).

19
Figure 4. Statistical Stability of G versus I for Pareto variables (100 large
samples of 100000 random draws). Notice the curious pattern: the lower is
alpha (hence the heavier-tailed the Pareto), the more stable is I (red) compared
to G (blue), and vice versa.
The slow convergence pattern of G is not surprising per se and it has been
documented [8]. What is surprising is the inverse pattern of I compared to that of G.
This suggests a scrutiny of the limit behavior of the I index. Formally, we model the
possible sample realization of ( )I X by the following estimator, based on N
independent copies 1
{ ,..., }N
X X of X, to investigate its large-sample behavior:
2
1
2
1
( ) 1 .( )
N
iiN N
ii
XI X
N X (33)
Because ( )N
I X involves sums of independent copies of X and X2, its limit behavior is
regulated by the general central limit theorem (in the same way as for the H index,
whose limit behavior for a Pareto with 1 is known [19, prop. 2]).

20
Proposition 3. If X is a positive power law with exponent (0,2), then ( ) 1N
I X as
.N Moreover, 1 ( )N
I X 0 like 1N if (0,1), 1 2/N if (1,2), and
1 2(log )N N if 1 and X is Pareto.22
This proposition, proven in the Appendix, explains the above-mentioned seemingly
paradoxical statistical stability of the index I (Figure 4): the heavier the tail of the
power law, the more stable the index I, with the possible exception of 1 (which
more generally is a singular parameter in the theory of the limit sum of power laws).
Figure 5. Convergence rate of the empirical (or sample) inequality index
( )N
I X for infinite-variance Pareto variable X. The lower is the tail
exponent , the more rapid the convergence rate (for 1).
Proposition 3 suggests that we extend the definition of the I index to a theoretical
variable X as the large sample limit of its empirical version, namely as ( )I X
lim ( ),N N
I X which for a finite-variance distribution reduces of course to
2var( )/ ( ),X X by the law of large numbers, and for an (infinite-variance) power law
22 We assume X≥0 merely to avoid worrying about an additional condition: see Appendix.

21
X with (0,2) is ( ) 1I X (by Proposition 3). An apparent limitation of this
extension to infinite-variance theoretical distributions is that it does not reflect the
gradation of inequality for power laws of exponent in the range (0,2), a scale of
inequality that we know is inversely related to . But this is hardly a real problem,
for the gradation of inequality for power laws with (0,2) is recovered
empirically in the speed of the convergence ( ) 1,N
I X which is the more rapid, the
lower is , so that for a comparably large sample size N, the index ( )N
I X tends to be
higher, the lower is .
The limit behavior of the Gini index, on the other hand, is that of the estimator
( )( ) 2 1.
N
iiN N
ii
iXG X
N X (34)
The study of ( )N
G X involves more care and technique because ( )N
G X involves a
sum of ranked (hence dependent) variables in the numerator. For a power law X, a
characterization of the limit behavior of ( )N
G X has already be done for the case
1 2 [8], which show the slow convergence of ( )N
G X for infinite-variance power
laws: the complement case 0 1 would involve essentially the same
technicalities, which we do not repeat here. We mention however:
Proposition 4. If X is a power law with exponent 1, then ( ) 1N
G X as .N
In lieu of a formal but long proof, we just emphasize here a simple intuitive
argument as to why this result is to be expected (referring the reader to [8] for the
preliminary technique needed before one can apply the general central limit theorem
for a formal proof). The intuitive argument is based on Atkinson’s formula [36],
according to which “when a very top group of the income distribution, infinitesimal
in numbers, owns a finite share S of total income, the Gini coefficient G can be
approximated by )* (1G S S , where G* is the Gini coefficient for the rest of the
population” [37]. In a large sample from a power law with 1, the highest

22
“income” on average has the share S 1 according to equation (12), and we also
have *G G approximately (because G is only mildly affected if one observation,
here the biggest one, is removed). So G G (1 ), hence G lim 1.N N
G
5 Summary
Beyond the specific discussion on inequality measurement, this paper revisits
received doctrine on robustness, whose desirability might be questionable for heavy
tailed variables. The Gini index remains a powerful inequality measure for light-
tailed distributions potentially distorted by outliers. But the variance normalized by
the second moment better suits heavy-tailed variables, and it satisfies the normative
axioms of inequality measurement, including decomposability. As a concept, the
new index is potentially useful beyond the specific purpose of inequality
measurement due to its simple relationships with fundamental concepts across the
sciences, such as: variance, Herfindahl-Hirschman index, and Rényi entropy.

Appendix
For two functions F and G of x, the notation F G means ( )/ ( ) 1F x G x as .x
For variables { }N
X and Y, N
XN N
a b Y means the convergence in distribution
(N
X ) /N N
a b Y holds. Many claims in the main text rely on the following [15:
sec. 2.2, th. 2.2.15, 16: sec. 3.8, th. 3.8.2]:
Limit Theorem for Power Laws. Let 1
{ ,..., }N
X X be independent copies of a variable X
with prob{ } ,| |X x Cx 0,C (0,2), and lim[prob{ } / prob{ }]| |x
X x X x
[0,1] . Then 1/
1( ) ( )
N
i NiN X b as ,N where ( ) is a Levy variable
with exponent , and 0N
b if (0,1), ( )N X if (1,2), and | |( 1 )
X NN X if 1.
For a Pareto 1,X the theorem says 1/
1( ) ( )
N
i NiN X b as ,N where
0, 1
log , 1
( ) , 1.N
b N N
E X N
(35)
Proof of Proposition 3. Without loss of generality, assume 0X (otherwise, simply
add the condition [0,1]). We investigate the limit behavior of
2
1
2
1
( )( ) 1 .
N
iiN N
ii
XI X
N X
By the limit theorem,1
( )N
i Nix b 1/ ( )N and 2
1
N
iix 2/ ( /2).N 23 Thus
1/ 2
1 2/
[ ( ) ( )]( ) 1 .
( /2)N
N
b NI X
N (36)
Hence
2
21 2/
[ ( )] 1, (0,1)
( /2)1 ( )
[ ( )], (1,2)
( /2)
N
NI X
XN
(37)
23 The second sum is just an application of the theorem to X2 which is a Pareto with exponent /2,
since 2
prob{ }X z1/2 1/2
prob{ ( ) .}X z z
24
In particular, ( ) 1N
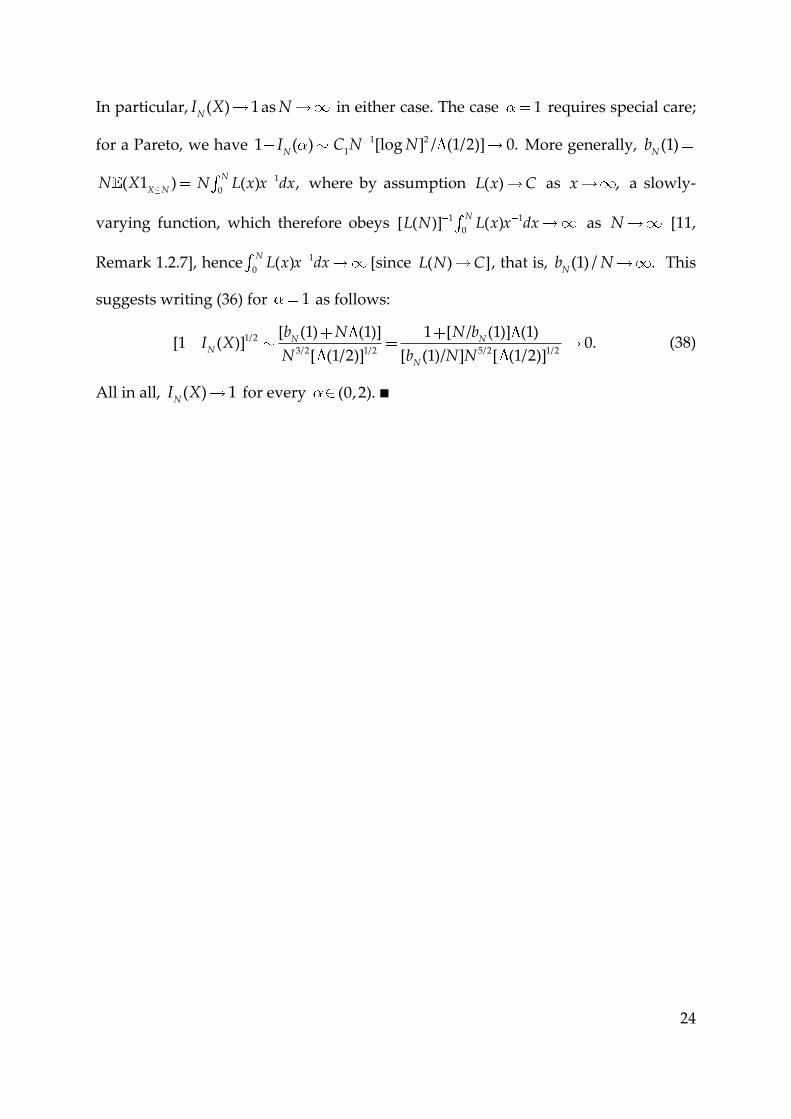
I X as N in either case. The case 1 requires special care;
for a Pareto, we have 1 ( )N
I 1 2
1[log ] / (1/2)] 0.C N N More generally, (1)
Nb
( 1 )X N
N X 1
0( ) ,
NN L x x dx where by assumption ( )L x C as ,x a slowly-
varying function, which therefore obeys 1 1
0[ ( )] ( )
NL N L x x dx as N [11,
Remark 1.2.7], hence 1
0( )
NL x x dx [since ( ) ]L N C , that is, (1) / .
Nb N This
suggests writing (36) for 1 as follows:
1/2
3/2 1/2 5/2 1/2
[ (1) (1)] 1 [ / (1)] (1)[1 ( )] 0.
[ (1/2)] [ (1)/ ] [ (1/2)]N N
N
N
b N N bI X
N b N N (38)
All in all, ( ) 1N
I X for every (0,2).∎

References
[1] C. Gini, Variabilita e mutabilita: contributo allo studio delle relazioni statistiche,
Studi Economico-giurdici. Facolta di Giurisprudenza della R. Universita di Cagliari,
3 (1912).
[2] M.O. Lorenz, Methods of measuring the concentration of wealth, Publications of
the American statistical association, 9 (1905) 209-219.
[3] S. Yitzhaki, More than a dozen alternative ways of spelling Gini, Research on
Economic Inequality, 8 (1998) 13-30.
[4] C.-N. Chen, T.-W. Tsaur, T.-S. Rhai, The Gini coefficient and negative income,
Oxford Economic Papers, 34 (1982) 473-478.
[5] J.L. Gastwirth, Is the Gini index of inequality overly sensitive to changes in the
middle of the income distribution?, Statistics and Public Policy, 4 (2017) 1-11.
[6] G. Deltas, The small-sample bias of the Gini coefficient: results and implications
for empirical research, Review of Economics and Statistics, 85 (2003) 226-234.
[7] T. Van Ourti, P. Clarke, A simple correction to remove the bias of the Gini
coefficient due to grouping, Review of Economics and Statistics, 93 (2011) 982-994.
[8] A. Fontanari, N.N. Taleb, P. Cirillo, Gini estimation under infinite variance,
Physica A, 502 (2018) 256-269.
[9] J.L. Teugels, The class of subexponential distributions, The Annals of Probability,
3 (1975) 1000-1011.
[10] C.M. Goldie, C. Klüppelberg, Subexponential distributions, in: R.E.F. Robert J.
Adler, Murad S. Taqqu (Ed.) A practical guide to heavy tails: statistical techniques
and applications, Birkhauser Boston, Cambridge, MA, 1998, pp. 435-459.
[11] T. Mikosch, Regular variation, subexponentiality and their applications in
probability theory, in, Eindhoven University of Technology Eindhoven, 1999.
[12] M.E. Newman, Power laws, Pareto distributions and Zipf's law, Contemporary
Physics, 46 (2005) 323-351.
[13] X. Gabaix, Power laws in economics: An introduction, The Journal of Economic
Perspectives, 30 (2016) 185-205.
[14] P. Lévy, Théorie des erreurs. La loi de Gauss et les lois exceptionnelles, Bulletin
de la Société mathématique de France, 52 (1924) 49-85.
[15] P. Embrechts, C. Kluppelberg, T. Mikosch, Modelling Extremal Events for
Insurance and Finance, Springer Science & Business Media, Berlin, 1997.
[16] R. Durrett, Probability: Theory and Examples, 5 ed., Cambridge University
Press, Cambridge, 2019.
[17] J.-P. Bouchaud, A. Georges, Anomalous diffusion in disordered media:
statistical mechanisms, models and physical applications, Physics Reports, 195 (1990)
127-293.
[18] D. Sornette, Critical phenomena in natural sciences: chaos, fractals,
selforganization and disorder: concepts and tools, 2 ed., Springer, Berlin, 2006.

26
[19] X. Gabaix, The granular origins of aggregate fluctuations, Econometrica, 79
(2011) 733-772.
[20] V. Pareto, La courbe de la répartition de la richesse, Viret-Genton, Lausanne,
1896.
[21] S. Yitzhaki, Gini’s mean difference: A superior measure of variability for non-
normal distributions, Metron, 61 (2003) 285-316.
[22] W. Feller, An Introduction to Probability Theory and its Applications, 2 ed., John
Wiley & Sons, New York, 1966 [1971].
[23] A. Hirschman, National Power and the Structure of Foreign Trade, University of
California Press, Berkeley, 1945.
[24] O.C. Herfindahl, Concentration in the Steel Industry, in, Columbia University,
1950.
[25] A. Rényi, On measures of entropy and information, in: Proceedings of the
Fourth Berkeley Symposium on Mathematical Statistics and Probability, Volume 1:
Contributions to the Theory of Statistics, University of California Press, 1961, pp.
547-561.
[26] W. Woerheide, D. Persson, An index of portfolio diversification, Financial
Services Review, 2 (1992) 73-85.
[27] J.-P. Bouchaud, M. Potters, J.-P. Aguilar, Missing information and asset
allocation, arXiv preprint cond-mat/9707042, (1997).
[28] D. Acemoglu, V.M. Carvalho, A. Ozdaglar, A. Tahbaz‐Salehi, The network
origins of aggregate fluctuations, Econometrica, 80 (2012) 1977-2016.
[29] F. Cowell, Measuring Inequality, Oxford University Press, Oxford, 2011.
[30] F. Bourguignon, Decomposable income inequality measures, Econometrica, 47
(1979) 901-920.
[31] F.A. Cowell, On the structure of additive inequality measures, The Review of
Economic Studies, 47 (1980) 521-531.
[32] A.F. Shorrocks, The class of additively decomposable inequality measures,
Econometrica, 48 (1980) 613-625.
[33] F.A. Cowell, Measurement of Inequality, in: Handbook of Income Distribution,
2000, pp. 87-166.
[34] F.A. Cowell, E. Flachaire, Inequality with ordinal data, Economica, 84 (2017) 290-
321.
[35] T. McGregor, B. Smith, S. Wills, Measuring inequality, Oxford Review of
Economic Policy, 35 (2019) 368-395.
[36] A.B. Atkinson, T. Piketty, Top incomes over the twentieth century: a contrast
between continental european and english-speaking countries, in: A.B. Atkinson, T.
Piketty (Eds.), Oxford University Press, Oxford, 2007.
[37] F. Alvaredo, A note on the relationship between top income shares and the Gini
coefficient, Economics Letters, 110 (2011) 274-277.