Inequality in Disbaility in Bangladesh
10
Inequality in Disability in Bangladesh Md. Ismail Tareque 1 *, Sharifa Begum 2 , Yasuhiko Saito 3,4,5 1 Department of Population Science and Human Resource Development, University of Rajshahi, Rajshahi, Bangladesh, 2 Population and Health Studies Division, Bangladesh Institute of Development Studies (BIDS), Dhaka, Bangladesh, 3 Advanced Research Institute for the Sciences and Humanities, Nihon University, Tokyo, Japan, 4 School of Medicine, Nihon University, Tokyo, Japan, 5 Duke-NUS Graduate Medical School, Singapore, Singapore Abstract Objective: To investigate inequality in disability in Bangladesh. Methods: The study used both household level and individual level data from a large nationally representative data set, Bangladesh’s Household Income and Expenditure Survey - 2010. Principal component analysis was used to construct a wealth index based on household assets from household level data. Then, using data from 49,809 individuals aged 5 years and over, chi-square tests and logistic regression were performed to test the association between wealth level and disability. Findings: Women and older people are significantly more likely to report having disabilities than men and younger people. For middle and rich families, respectively, there is a 14 percent lower likelihood of reporting disabilities than for poor families. Changes in the probability of having disabilities are linear with increasing wealth. In addition, the study identifies some significant factors affecting disability, namely, age, sex, education, marital status, and place of residence including divisional differences. Conclusion: In Bangladesh, worse health among the poor argues for policies prioritizing this group while at the same time giving special attention to women and the elderly. Citation: Tareque MI, Begum S, Saito Y (2014) Inequality in Disability in Bangladesh. PLoS ONE 9(7): e103681. doi:10.1371/journal.pone.0103681 Editor: Sten H. Vermund, Vanderbilt University, United States of America Received June 27, 2013; Accepted July 6, 2014; Published July 30, 2014 Copyright: ß 2014 Tareque et al. This is an open-access article distributed under the terms of the Creative Commons Attribution License, which permits unrestricted use, distribution, and reproduction in any medium, provided the original author and source are credited. Funding: The authors have no support or funding to report. Competing Interests: The authors have declared that no competing interests exist. * Email: [email protected] Introduction Socioeconomic inequality in health is a key public health concern [1]. In developed countries, the gradient in the association between socioeconomic status and health is well documented with individuals of higher status living longer, enjoying better health, and experiencing less disability [2–6]. Individuals with a lower socioeconomic status generally experience higher morbidity and mortality rates than those with a higher socioeconomic status [7,8]. Moreover, compared with persons without disabilities, persons with disabilities are reported to have lower educational attainment, lower employment rates, and lower wages when employed, and they are more likely to be income poor [9–12]. In developing countries, several studies have also shown that persons with disabilities are poorer than their nondisabled peers in terms of access to education, access to health care, employment, income, social support, and civic involvement. For example, disabled persons had lower school attendance [13–19], higher unemployment rates, and lower mean monthly salaries compared with non-disabled persons [13–15,17–19]. However, this was not the case in Zimbabwe where the employment rate and mean monthly salaries were not found to be affected by a disability status [16]. Comparing data from household surveys in 13 developing countries, Filmer [20] found that disability is associated with an increased probability of individuals falling in the two poorest quintiles. Using data from 15 developing countries, Mitra, Posarac, and Vick [21] also found that disability was significantly associated with higher multidimensional poverty as well as lower educational attainment, lower employment rates, and higher medical expenditures. Evidence of lower access to health care, education, and the labor market for people with disabilities was also found in Afghanistan and Zambia, but poverty measured by an asset index was not found to be statistically different between people with and without disabilities [22]. Men were found to have a higher rate of disability than women in Zambia [14], but in Viet Nam, men were found to have a lower rate of disability than women [18]. Disability and poverty are reported to have a complex and interdependent relationship [22]. They are intricately linked as both a cause and consequence of each other [23]. The onset of disability may lead to lower living standards and poverty through the adverse impact of disability on education, employment, earnings, and increased expenditures related to disability [21]. Disability, particularly of the family income earner, worsens the position of the family on the income scale, and family members suffer extreme hardship. Moreover, people with disabilities experience poorer levels of health than does the general population [24], and the health care costs for the disabled are a financial catastrophe. There is also the case that people who live in a state of chronic poverty are more likely to have a disability. Chronically poor people are often at risk of ill health and injuries which may lead to disability through a number of routes. They often live in unsanitary and substandard housing conditions, are unable to afford nutritious foods, lack the ability to access clean PLOS ONE | www.plosone.org 1 July 2014 | Volume 9 | Issue 7 | e103681
-
Upload
independent -
Category
Documents
-
view
2 -
download
0
Transcript of Inequality in Disbaility in Bangladesh

Inequality in Disability in BangladeshMd. Ismail Tareque1*, Sharifa Begum2, Yasuhiko Saito3,4,5
1 Department of Population Science and Human Resource Development, University of Rajshahi, Rajshahi, Bangladesh, 2 Population and Health Studies Division,
Bangladesh Institute of Development Studies (BIDS), Dhaka, Bangladesh, 3 Advanced Research Institute for the Sciences and Humanities, Nihon University, Tokyo, Japan,
4 School of Medicine, Nihon University, Tokyo, Japan, 5 Duke-NUS Graduate Medical School, Singapore, Singapore
Abstract
Objective: To investigate inequality in disability in Bangladesh.
Methods: The study used both household level and individual level data from a large nationally representative data set,Bangladesh’s Household Income and Expenditure Survey - 2010. Principal component analysis was used to construct awealth index based on household assets from household level data. Then, using data from 49,809 individuals aged 5 yearsand over, chi-square tests and logistic regression were performed to test the association between wealth level and disability.
Findings: Women and older people are significantly more likely to report having disabilities than men and younger people.For middle and rich families, respectively, there is a 14 percent lower likelihood of reporting disabilities than for poorfamilies. Changes in the probability of having disabilities are linear with increasing wealth. In addition, the study identifiessome significant factors affecting disability, namely, age, sex, education, marital status, and place of residence includingdivisional differences.
Conclusion: In Bangladesh, worse health among the poor argues for policies prioritizing this group while at the same timegiving special attention to women and the elderly.
Citation: Tareque MI, Begum S, Saito Y (2014) Inequality in Disability in Bangladesh. PLoS ONE 9(7): e103681. doi:10.1371/journal.pone.0103681
Editor: Sten H. Vermund, Vanderbilt University, United States of America
Received June 27, 2013; Accepted July 6, 2014; Published July 30, 2014
Copyright: � 2014 Tareque et al. This is an open-access article distributed under the terms of the Creative Commons Attribution License, which permitsunrestricted use, distribution, and reproduction in any medium, provided the original author and source are credited.
Funding: The authors have no support or funding to report.
Competing Interests: The authors have declared that no competing interests exist.
* Email: [email protected]
Introduction
Socioeconomic inequality in health is a key public health
concern [1]. In developed countries, the gradient in the association
between socioeconomic status and health is well documented with
individuals of higher status living longer, enjoying better health,
and experiencing less disability [2–6]. Individuals with a lower
socioeconomic status generally experience higher morbidity and
mortality rates than those with a higher socioeconomic status
[7,8]. Moreover, compared with persons without disabilities,
persons with disabilities are reported to have lower educational
attainment, lower employment rates, and lower wages when
employed, and they are more likely to be income poor [9–12].
In developing countries, several studies have also shown that
persons with disabilities are poorer than their nondisabled peers in
terms of access to education, access to health care, employment,
income, social support, and civic involvement. For example,
disabled persons had lower school attendance [13–19], higher
unemployment rates, and lower mean monthly salaries compared
with non-disabled persons [13–15,17–19]. However, this was not
the case in Zimbabwe where the employment rate and mean
monthly salaries were not found to be affected by a disability status
[16]. Comparing data from household surveys in 13 developing
countries, Filmer [20] found that disability is associated with an
increased probability of individuals falling in the two poorest
quintiles. Using data from 15 developing countries, Mitra,
Posarac, and Vick [21] also found that disability was significantly
associated with higher multidimensional poverty as well as lower
educational attainment, lower employment rates, and higher
medical expenditures. Evidence of lower access to health care,
education, and the labor market for people with disabilities was
also found in Afghanistan and Zambia, but poverty measured by
an asset index was not found to be statistically different between
people with and without disabilities [22]. Men were found to have
a higher rate of disability than women in Zambia [14], but in Viet
Nam, men were found to have a lower rate of disability than
women [18].
Disability and poverty are reported to have a complex and
interdependent relationship [22]. They are intricately linked as
both a cause and consequence of each other [23]. The onset of
disability may lead to lower living standards and poverty through
the adverse impact of disability on education, employment,
earnings, and increased expenditures related to disability [21].
Disability, particularly of the family income earner, worsens the
position of the family on the income scale, and family members
suffer extreme hardship. Moreover, people with disabilities
experience poorer levels of health than does the general
population [24], and the health care costs for the disabled are a
financial catastrophe. There is also the case that people who live in
a state of chronic poverty are more likely to have a disability.
Chronically poor people are often at risk of ill health and injuries
which may lead to disability through a number of routes. They
often live in unsanitary and substandard housing conditions, are
unable to afford nutritious foods, lack the ability to access clean
PLOS ONE | www.plosone.org 1 July 2014 | Volume 9 | Issue 7 | e103681

water and basic sanitation, and are more likely to have unsafe or
dangerous jobs. These poverty-related environmental and struc-
tural risks for disability mean that the poor who become disabled
will descend further into poverty [25]. In developing countries,
there is evidence that malnutrition leads to disability [26]. The
international development community is beginning to recognize
that people with disabilities are disproportionately represented
among the poorest and most vulnerable and, thus, that the
disabled must be a core issue in development policies and
programs [25]. However, to date, there has been no country-wide
study in Bangladesh on the type, severity, and causes of disabilities
[27]. And, in Bangladesh, there has never been an in-depth
analysis of the association between wealth and disability. Thus, to
bridge the knowledge and research gaps on the relationship
between wealth and health outcomes, this study investigates wealth
inequality in disability in Bangladesh. This analysis, using a large
nationally representative survey conducted in Bangladesh, takes
place in two stages. The first looks at the structure of wealth
among Bangladeshi people. The second examines the relationship
between wealth and disability.
Methods
Data sourceThis study utilizes data from a large nationally representative
survey, Bangladesh’s Household Income and Expenditure Survey
(HIES) - 2010, collected by the Bangladesh Bureau of Statistics
(BBS), an apex organization of Bangladesh’s Ministry of Planning.
The objectives, sampling design, and methodologies are described
elsewhere in detail [28]. In brief, the survey provides valuable
household level data on household income, expenditures, assets,
housing conditions, as well as individual level data on education,
employment, health, disability, etc. A two-stage stratified random
sampling technique was employed in drawing the sample of HIES
- 2010. The data collection was completed in one year (1 February
2010 to 31 January 2011). A total of 12,240 households were
selected, with 7,840 from rural areas and 4,400 from urban areas.
All individuals from selected households were interviewed for a
total of 55,580 individuals; of those, 35,894 came from rural areas
and the rest from urban areas.
This study utilizes both household level and individual level
data. The wealth index was constructed using household assets
from household level data (N = 12,240). Then, wealth index values
were assigned to all individuals (N = 55,580) based on household
i.d.’s. For the individual level data analyses, we dropped 74 cases
with missing values for the wealth index, two cases with missing
values for other variables used in the analysis, and restricted our
sample to those who were 5 years old and over for a total of 49,809
individuals, of whom 24,555 (49.30 percent) were male and 25,254
(50.70 percent) were female. There are no missing values across
disability status in the data set.
MeasuresOutcome variable. The International Classification of
Functioning, Disability and Health (ICF) developed by the World
Health Organization provided a framework for conceptualizing
disability. Operationalizing an ICF-based approach to disability
has required the development of new measurement tools for use in
both censuses and surveys. To date, a short set of six disability-
related questions suitable for use in national censuses and surveys
has been developed and adopted by the Washington Group. This
set of questions, the disability module, is used in HIES –2010 and
is consistent with the ICF [29]. It covers six functional domains or
basic actions: (1) vision, (2) hearing, (3) walking and climbing, (4)
remembering and concentrating, (5) self-care, and (6) speaking and
communicating. To assess disabilities in the above six actions,
every household member was asked the following questions: (1)
Does (name) have difficulty seeing, even if he/she is wearing
glasses? (2) Does (name) have difficulty hearing, even if he/she is
wearing a hearing aid? (3) Does (name) have difficulty walking or
climbing steps? (4) Does (name) have difficulty remembering or
concentrating? (5) Does (name) have difficulty with self-care such
as washing all over or dressing, feeding, toileting, etc.? And (6)
Does (name) have difficulty communicating, for example, under-
standing or being understood? Each question has four response
categories: (a) no difficulty, (b) yes, some difficulty, (c) yes, severe
difficulty, or (d) yes, can’t see/hear/walk/remember/self-care/
communicate at all. Applying the same cut-off points as in the
study for Bangladesh by Tareque, Begum, and Saito [30], the
present study categorized having each disability into 2 groups:
‘‘no’’ (no difficulty) with a value of 0 and ‘‘yes’’ (yes, some
difficulty/yes, severe difficulty/yes, can’t see/hear/walk/remem-
ber/self-care/communicate at all) with a value of 1. And, to create
the outcome variable, the disability, i.e. having at least one among
the above six disabilities, the six disabilities were combined into
one measure with a value of 1 assigned where there was a
disability, and a value of 0 assigned otherwise.
Independent variables. The independent variables include
the wealth index (described in the construction of the wealth index
section), age categories (expressed as seven groups: 5–14, 15–24,
25–34, 35–44, 45–54, 55–64, and 65 and over), sex (male and
female), two educational categories (illiterate and literate), two
marital status categories (married and others, where others
includes never married, widowed, divorced, and separated), place
of residence (rural and urban), and the divisions (7 divisions,
namely, Barisal, Chittagong, Dhaka, Khulna, Rajshahi, Rangpur,
and Sylhet). The seven divisions divide Bangladesh into seven
major administrative regions. Each division is named after the
major city (within the division’s jurisdiction) that serves as the
administrative capital of that division.
Construction of the wealth indexAt the household level, the survey includes data on whether or
not the household contains the following 27 assets: radio, two-in-
one/cassette player, camera/camcorder, bicycle, motorcycle/
scooter, motor car, refrigerator/freezer, washing machine, fans,
heaters, television, VCR/VCP/DVD, dish antenna/decoder,
pressure lamps/petromax, sewing machine, bedroom furniture,
drawing room furniture, dining room furniture, carpet, kitchen
items - cutlery, kitchen items - crockery, kitchen items - cooking,
tube-well, wrist watch/wall clock, mobile, computer/TV card,
and boat/others. Each variable (asset) is dichotomized as 1 if
present and 0 if not, and the wealth index is constructed using
Filmer and Pritchett’s method [31] of employing principal
component analysis (PCA). Weights are determined by factor
scores derived from the first principal component in the PCA.
The first component is used since it is the one that captures the
largest amount of information common to all the items. The first
component has an Eigen value of 3.84 capturing fully 14 percent
of the variance in the data. Each scoring factor is divided by the
sample standard deviation for that asset to yield the final asset
weight. And the index is derived by summing the products of the
normalized scores for each asset determined by PCA and the final
asset weight.
Then, the constructed wealth index values are assigned to each
individual based on common variables in both household and
individual level data sets. Individuals are then ranked from top to
bottom according to the index value as suggested by Rutstein and
Inequality in Disability in Bangladesh
PLOS ONE | www.plosone.org 2 July 2014 | Volume 9 | Issue 7 | e103681

Johnson [32]. We then establish cutoff values for percentiles of the
population, and we refer to the bottom 40 percent as ‘‘poor’’, the
next 40 percent as ‘‘middle’’, and the top 20 percent as ‘‘rich’’
following Filmer and Pritchett’s study [31]. Several studies suggest
that the wealth index is a good alternative to distinguish wealth
layers within a population. It is in agreement with measures of
household consumption, and it proxies well for other indicators of
economic wellbeing [31,33–35]. Compared with expenditure
measures, it is reported to be the easier measure of economic
status to collect and produces superior, more believable results and
equal or greater distinctions in health outcomes [32].
Analysis planWe begin by describing study respondents, the structure of
assets, and the wealth index. This we accomplish with a descriptive
examination of a series of findings that depict attributes of the
Bangladeshi population across categories of the wealth index
constructed using PCA, as described above. Next, using Chi-
square tests, we examine differences in the proportion of disability
by wealth categories, sex, and age groups. Then, with a series of
logistic regression models we examine associations between the
wealth index and disability.
The first model (labeled as Model 1) established a bivariate
association by showing results that are unadjusted. The wealth
index was treated categorically. Results presented are in the form
of odds ratios with confidence intervals and show the odds of
having a disability. The next model (Model 2) regressed the
outcome variable on wealth index categories, age, and sex. The
last model (Model 3) attempted to examine possible mechanisms
driving any association by adjusting for additional characteristics
such as education, marital status, place of residence, and division.
Multicollinearity in the logistic regression analyses in our study was
checked by examining the standard errors for the regression
coefficients. A standard error larger than 2.0 indicates numerical
problems such as multicollinearity among the independent
variables [36]. Additionally, a sensitivity analysis was performed
considering ‘‘no difficulty/yes, some difficulty’’ as ‘‘no disability’’
and ‘‘yes, severe difficulty/yes, can’t see/hear/walk/remember/
self-care/communicate at all’’ as ‘‘disabled’’ for the outcome
variable, because research has shown that moderate difficulties
(yes, some difficulty) may not be as reliably self-reported as severe
difficulties (yes, severe difficulty/yes, can’t see/hear/walk/remem-
ber/self-care/communicate at all) [37,38]. Below, we discuss if the
results changed when disability covered only severe difficulties
(results not shown).
The net significance of the wealth index in all models was
estimated by calculating the difference in the log-likelihood statistic
between models that did and did not contain the wealth index (the
latter not shown). Finally, the predicted probabilities of reporting a
disability were estimated across wealth categories and presented in
graph form. To determine the probability, the value of all
variables for the final equation, except for wealth categories
(Model 3), were held constant, and the mean sample probabilities
for the disability were calculated. As such, the result can be
interpreted as the probability that an otherwise average respon-
dent would report the disability. The entire statistical analysis of
the study was performed with STATA/SE 12.1 (StataCorp LP,
College Station, Texas, United States of America).
Ethical considerationsThe Ethics committee at BBS approved a waiver from ethical
approval for this retrospective study. As the de-identified data for
this study came from secondary sources, this study does not
require ethical approval.
Results
Sample descriptionTable 1 provides descriptive information about the sample and
the association between selected characteristics and gender with p
values of Chi-square tests. The mean age is 29.50 years for males
(29.35 years for females), and more than half of the respondents
are female. More female respondents are currently married than
male respondents. In terms of educational level, a higher
percentage of males are literate than females. The urban-rural
residence ratio is about 4:6; and more than one-fourth of
respondents come from Dhaka division. Women are significantly
more likely to report having at least one disability than men; but
when disability covers only severe difficulties, women are less likely
to report having a disability than men.
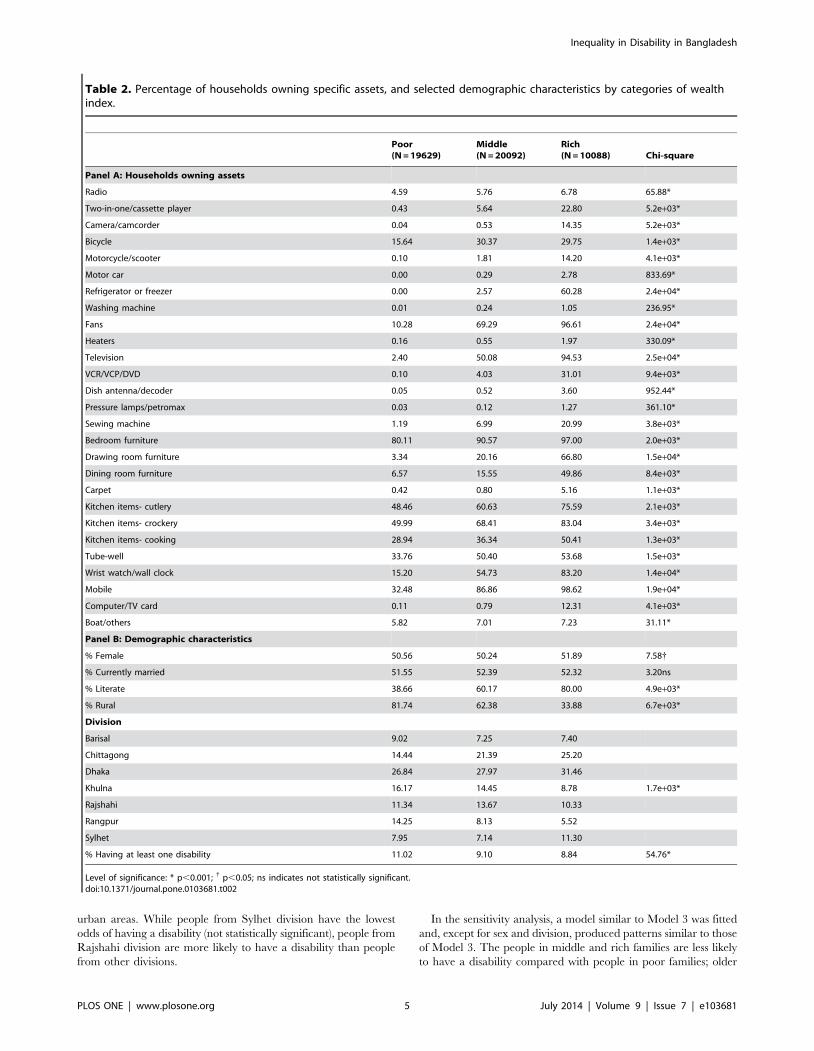
Structure of wealth and disabilityTable 2 provides information about wealth and poverty in two
panels. Panel A examines the specific assets owned across the
categories of the wealth index. Those living in poor households
own just the assets necessary for their livelihood and do not own
expensive assets such as cameras, motor cars, refrigerators,
computers, etc. Though radios are inexpensive compared with
televisions, it seems that Bangladeshi families prefer to have
televisions as their source of entertainment rather than radios.
Notably, about 95 percent of rich households own televisions,
while only 7 percent own radios. Those in the middle category
typically own bicycles, fans, televisions, furniture for the bedroom,
drawing and dining room furniture, kitchen items, tube-wells, and
mobile phones. An appreciative step up in wealth is only evident
for the highest category. Individuals in rich households own a fair
mix of assets; and a few Bangladeshi households possess a motor
car, washing machine, heaters, dish antenna, pressure lamps, and
carpet. In sum, the wealth index has efficiently created poor,
middle, and rich groups in the absence of direct wealth measures
for individual cases.
Panel B displays demographic characteristics of the study
population across the wealth index. As expected, poor households
are made up primarily of illiterate individuals. A slightly higher
percent of women exist in rich households than in poor
households. Marital status is not significantly associated with the
wealth index. A higher percentage of rural households fall in the
poor category of the wealth index compared with urban
households. A comparatively higher percent of households from
Barisal, Khulna, Rajshahi, and Rangpur divisions are in the poor
category, and the percent of poor households generally decreases
when moving to the rich category of the wealth index. Individuals
from poor households have a higher likelihood of having one or
more disabilities, and this probability decreases with increases in
wealth.
Association between wealth and disabilityTable 3 shows the percent reporting disability by wealth
categories, age group, and sex. Across the wealth categories,
disability shows an increasing trend with age. Across age groups,
with the exception of females aged 15–34, the percent of poor
people reporting a disability is higher than that of middle and/or
rich people. It is also evident that women have a higher incidence
of disability than men across age groups, except in the 5–24 year
category.
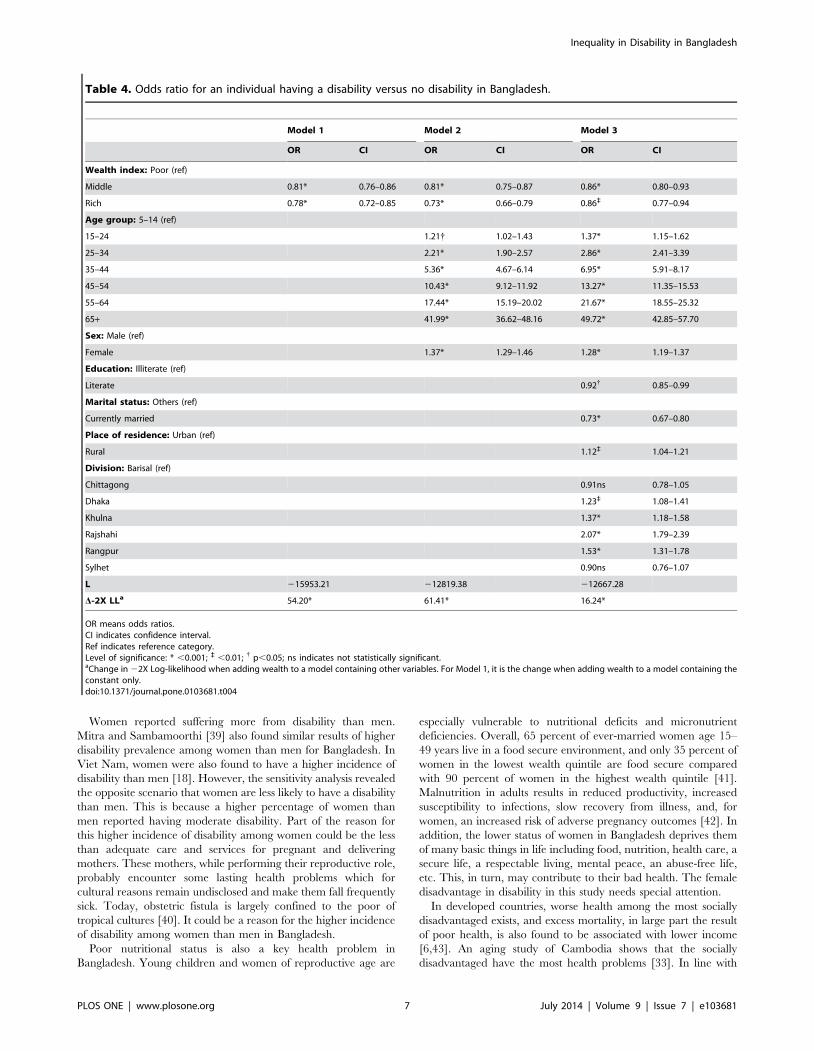
Table 4 presents results of logistic regressions that predict the
odds of having a disability among the study population. Model 1
shows that those in the middle wealth category are less likely to
report having a disability compared with those in the poor
Inequality in Disability in Bangladesh
PLOS ONE | www.plosone.org 3 July 2014 | Volume 9 | Issue 7 | e103681

category; and those in the rich category are less likely to report
having a disability compared with those in the middle category
(keeping middle as the reference category, statistically significant
results were obtained; the results are not shown). The advantages
of being from a wealthier family for not having a disability are
attenuated but persist after incorporating controls for age and sex
in Model 2. The effects of age and sex are as expected. The odds of
having a disability increase significantly with increases in age.
Individuals aged 65 years and over are about 42 times more likely
to report having a disability than individuals aged 5–14 years.
Females are 1.37 times more likely to have a disability than males.
In Model 3, the advantages of being from a wealthier family for
not having a disability are further attenuated but persist after
incorporating additional controls for education, marital status,
place of residence, and division. The study reveals that those in
middle and rich families, respectively, there is a 14 percent lower
likelihood of reporting disabilities than for poor families. The odds
of having a disability by age group are also in the expected
direction in Model 3. That is, older people are more likely to have
a disability than younger people, but the odds of having a disability
increase across age groups in Model 3 (with additional controls)
compared with Model 2. The disadvantages of being female for
having a disability also persist in Model 3. Compared with
uneducated people, educated people are less likely to be disabled
in both unadjusted (result not shown) and adjusted models (Model
3). Individuals currently married are significantly less likely to
report having a disability than others. Individuals from rural areas
are more likely to report having a disability than individuals from
Table 1. Characteristics of individuals in sample by gender.
Characteristics Male (N = 24555) Female (N = 25254)
Age (Mean and CI) 29.50 (29.26–29.74) 29.35 (29.12–29.57)
Age
5–14 28.11 26.27
15–24 19.96 20.44
25–34 15.29 17.92
35–44 13.49 14.41
45–54 10.71 9.64
55–64 6.74 6.09
65+ 5.69 5.22
p value 0.000
Marital status
Currently married 50.13 53.91
Others 49.87 46.09
p value 0.000
Education
Illiterate 41.45 47.06
Literate 58.55 52.94
p value 0.000
Place of residence
Urban 36.18 35.36
Rural 63.82 64.64
p value 0.057
Division
Barisal 7.96 7.99
Chittagong 19.09 19.75
Dhaka 27.98 28.47
Khulna 14.29 13.68
Rajshahi 12.16 11.99
Rangpur 10.32 9.71
Sylhet 8.20 8.39
p value 0.048
Having at least one disability
No 91.17 89.24
Yes 8.83 10.76
p value 0.000
p values are of Chi-square tests.doi:10.1371/journal.pone.0103681.t001
Inequality in Disability in Bangladesh
PLOS ONE | www.plosone.org 4 July 2014 | Volume 9 | Issue 7 | e103681
urban areas. While people from Sylhet division have the lowest
odds of having a disability (not statistically significant), people from
Rajshahi division are more likely to have a disability than people
from other divisions.
In the sensitivity analysis, a model similar to Model 3 was fitted
and, except for sex and division, produced patterns similar to those
of Model 3. The people in middle and rich families are less likely
to have a disability compared with people in poor families; older
Table 2. Percentage of households owning specific assets, and selected demographic characteristics by categories of wealthindex.
Poor(N = 19629)
Middle(N = 20092)
Rich(N = 10088) Chi-square
Panel A: Households owning assets
Radio 4.59 5.76 6.78 65.88*
Two-in-one/cassette player 0.43 5.64 22.80 5.2e+03*
Camera/camcorder 0.04 0.53 14.35 5.2e+03*
Bicycle 15.64 30.37 29.75 1.4e+03*
Motorcycle/scooter 0.10 1.81 14.20 4.1e+03*
Motor car 0.00 0.29 2.78 833.69*
Refrigerator or freezer 0.00 2.57 60.28 2.4e+04*
Washing machine 0.01 0.24 1.05 236.95*
Fans 10.28 69.29 96.61 2.4e+04*
Heaters 0.16 0.55 1.97 330.09*
Television 2.40 50.08 94.53 2.5e+04*
VCR/VCP/DVD 0.10 4.03 31.01 9.4e+03*
Dish antenna/decoder 0.05 0.52 3.60 952.44*
Pressure lamps/petromax 0.03 0.12 1.27 361.10*
Sewing machine 1.19 6.99 20.99 3.8e+03*
Bedroom furniture 80.11 90.57 97.00 2.0e+03*
Drawing room furniture 3.34 20.16 66.80 1.5e+04*
Dining room furniture 6.57 15.55 49.86 8.4e+03*
Carpet 0.42 0.80 5.16 1.1e+03*
Kitchen items- cutlery 48.46 60.63 75.59 2.1e+03*
Kitchen items- crockery 49.99 68.41 83.04 3.4e+03*
Kitchen items- cooking 28.94 36.34 50.41 1.3e+03*
Tube-well 33.76 50.40 53.68 1.5e+03*
Wrist watch/wall clock 15.20 54.73 83.20 1.4e+04*
Mobile 32.48 86.86 98.62 1.9e+04*
Computer/TV card 0.11 0.79 12.31 4.1e+03*
Boat/others 5.82 7.01 7.23 31.11*
Panel B: Demographic characteristics
% Female 50.56 50.24 51.89 7.58{
% Currently married 51.55 52.39 52.32 3.20ns
% Literate 38.66 60.17 80.00 4.9e+03*
% Rural 81.74 62.38 33.88 6.7e+03*
Division
Barisal 9.02 7.25 7.40
Chittagong 14.44 21.39 25.20
Dhaka 26.84 27.97 31.46
Khulna 16.17 14.45 8.78 1.7e+03*
Rajshahi 11.34 13.67 10.33
Rangpur 14.25 8.13 5.52
Sylhet 7.95 7.14 11.30
% Having at least one disability 11.02 9.10 8.84 54.76*
Level of significance: * p,0.001; { p,0.05; ns indicates not statistically significant.doi:10.1371/journal.pone.0103681.t002
Inequality in Disability in Bangladesh
PLOS ONE | www.plosone.org 5 July 2014 | Volume 9 | Issue 7 | e103681

people are more likely to have a disability than younger people;
educated people are less likely to be disabled than uneducated
people; currently married individuals are less likely to report
having a disability than others; individuals from rural areas are
more likely to have a disability than individuals from urban areas;
but women are less likely to have a disability compared with men;
and people from Barisal division have higher odds of having a
disability than people from other divisions.
Results from Models 1–3 indicate that those in the middle and
rich categories are substantially less likely to have a disability than
those in the poor category. The D-2X LL values are statistically
significant for all the models and indicate that the equations
showing the relationship between wealth and disability with
additional controls are better fitted than the equations without the
wealth index.
Predicted probabilities of disability obtained from Model 3 in
Table 4 are plotted in Figure 1. The figure emphasizes that those
in the middle and rich wealth category have a consistently lower
probability of disability.
Discussion
An abundance of evidence from developed countries links
economic wellbeing and health, while only a handful of literature
exists for developing countries, and no study examines inequality
in disability in Bangladesh. The current study reveals that the
disability prevalence was 8.83 percent for males and 10.76 percent
for females in 2010. Utilizing data collected in 2003 for the World
Health Survey (WHS) for Bangladeshi working-age people (18–65
years), Mitra, Posarac, and Vick [21] reported that the disability
prevalence was 9.91 percent for males and 22.90 percent for
females. Corresponding figures from HIES-2010 are 9.45 percent
for males and 12.05 percent for females. Part of the difference
could be due to differences in measures, response categories, and
time period. In WHS, there were five response categories - 1: no
difficulty, 2: mild difficulty, 3: moderate difficulty, 4: severe
difficulty, and 5: extreme difficulty/unable to do. The WHS-based
disability measures may underestimate disability prevalence,
because they do not cover difficulties in hearing and communi-
cating. They may also overestimate disability prevalence, because
the introduction to the section containing questions on difficulties
in functioning does not explain, as does the introduction to the
questions of the Washington Group, that reported limitations or
restrictions need to be related to a ‘‘health problem.’’
The present study provides some notable results in relation to
the test of the relationship between wealth index and disability.
The wealth index, a more permanent indicator than income or
consumption [32], separates the study population into three
groups. The bottom 40 percent consists of households that own a
few assets, while the next 40 percent, labeled as middle, own more
assets. Undoubtedly, those in the highest quintile, labeled as rich,
do appear to be qualitatively better off compared with the rest of
the population. The following are some conclusions regarding the
above wealth categories and disability: (a) Women are significantly
more likely to report having a disability than men. (b) There is a
differential in disability across gradients of wealth. A consistent
significant decline in having a disability was identified when
moving from the poor to the rich category. (c) Changes in the
probability of having a disability are linear with increasing wealth
(Figure 1). Each gradient increase in wealth relates to a noticeably
lower probability of having a disability. Moreover, the current
study identifies some significant factors that affect disability,
namely, age, sex, education, marital status, and place of residence
including divisional differences.
Ta
ble
3.
Pe
rce
nt
of
ind
ivid
ual
sh
avin
gd
isab
ility
by
cate
go
rie
so
fw
eal
thin
de
x,se
x,an
dag
eg
rou
ps.
Ma
leF
em
ale
Po
or
Mid
dle
Ric
hp
va
lue
Po
or
Mid
dle
Ric
hp
va
lue
Ag
eg
rou
p
5–
14
3.0
52
.03
2.4
30
.04
71
.83
1.9
12
.13
0.8
20
15
–2
43
.92
2.4
01
.85
0.0
02
2.6
82
.79
1.6
30
.09
0
25
–3
44
.71
3.5
12
.28
0.0
13
5.8
96
.32
4.5
10
.14
9
35
–4
49
.62
7.7
97
.75
0.1
76
13
.74
13
.37
11
.01
0.1
71
45
–5
41
7.6
71
2.7
51
4.1
90
.00
72
4.9
52
2.4
62
0.9
10
.17
8
55
–6
42
6.6
72
3.6
02
5.7
00
.44
03
5.6
62
7.4
32
7.7
30
.00
3
65
+5
0.0
94
0.9
63
9.7
80
.00
25
7.6
15
1.8
44
2.0
00
.00
0
To
tal
(Nu
mb
er)
97
05
99
97
48
53
99
24
10
09
55
23
5
pva
lue
sar
eo
fC
hi-
squ
are
test
s.d
oi:1
0.1
37
1/j
ou
rnal
.po
ne
.01
03
68
1.t
00
3
Inequality in Disability in Bangladesh
PLOS ONE | www.plosone.org 6 July 2014 | Volume 9 | Issue 7 | e103681
Women reported suffering more from disability than men.
Mitra and Sambamoorthi [39] also found similar results of higher
disability prevalence among women than men for Bangladesh. In
Viet Nam, women were also found to have a higher incidence of
disability than men [18]. However, the sensitivity analysis revealed
the opposite scenario that women are less likely to have a disability
than men. This is because a higher percentage of women than
men reported having moderate disability. Part of the reason for
this higher incidence of disability among women could be the less
than adequate care and services for pregnant and delivering
mothers. These mothers, while performing their reproductive role,
probably encounter some lasting health problems which for
cultural reasons remain undisclosed and make them fall frequently
sick. Today, obstetric fistula is largely confined to the poor of
tropical cultures [40]. It could be a reason for the higher incidence
of disability among women than men in Bangladesh.
Poor nutritional status is also a key health problem in
Bangladesh. Young children and women of reproductive age are
especially vulnerable to nutritional deficits and micronutrient
deficiencies. Overall, 65 percent of ever-married women age 15–
49 years live in a food secure environment, and only 35 percent of
women in the lowest wealth quintile are food secure compared
with 90 percent of women in the highest wealth quintile [41].
Malnutrition in adults results in reduced productivity, increased
susceptibility to infections, slow recovery from illness, and, for
women, an increased risk of adverse pregnancy outcomes [42]. In
addition, the lower status of women in Bangladesh deprives them
of many basic things in life including food, nutrition, health care, a
secure life, a respectable living, mental peace, an abuse-free life,
etc. This, in turn, may contribute to their bad health. The female
disadvantage in disability in this study needs special attention.
In developed countries, worse health among the most socially
disadvantaged exists, and excess mortality, in large part the result
of poor health, is also found to be associated with lower income
[6,43]. An aging study of Cambodia shows that the socially
disadvantaged have the most health problems [33]. In line with
Table 4. Odds ratio for an individual having a disability versus no disability in Bangladesh.
Model 1 Model 2 Model 3
OR CI OR CI OR CI
Wealth index: Poor (ref)
Middle 0.81* 0.76–0.86 0.81* 0.75–0.87 0.86* 0.80–0.93
Rich 0.78* 0.72–0.85 0.73* 0.66–0.79 0.86` 0.77–0.94
Age group: 5–14 (ref)
15–24 1.21{ 1.02–1.43 1.37* 1.15–1.62
25–34 2.21* 1.90–2.57 2.86* 2.41–3.39
35–44 5.36* 4.67–6.14 6.95* 5.91–8.17
45–54 10.43* 9.12–11.92 13.27* 11.35–15.53
55–64 17.44* 15.19–20.02 21.67* 18.55–25.32
65+ 41.99* 36.62–48.16 49.72* 42.85–57.70
Sex: Male (ref)
Female 1.37* 1.29–1.46 1.28* 1.19–1.37
Education: Illiterate (ref)
Literate 0.92{ 0.85–0.99
Marital status: Others (ref)
Currently married 0.73* 0.67–0.80
Place of residence: Urban (ref)
Rural 1.12` 1.04–1.21
Division: Barisal (ref)
Chittagong 0.91ns 0.78–1.05
Dhaka 1.23` 1.08–1.41
Khulna 1.37* 1.18–1.58
Rajshahi 2.07* 1.79–2.39
Rangpur 1.53* 1.31–1.78
Sylhet 0.90ns 0.76–1.07
L 215953.21 212819.38 212667.28
D-2X LLa 54.20* 61.41* 16.24*
OR means odds ratios.CI indicates confidence interval.Ref indicates reference category.Level of significance: * ,0.001; ` ,0.01; { p,0.05; ns indicates not statistically significant.aChange in 22X Log-likelihood when adding wealth to a model containing other variables. For Model 1, it is the change when adding wealth to a model containing theconstant only.doi:10.1371/journal.pone.0103681.t004
Inequality in Disability in Bangladesh
PLOS ONE | www.plosone.org 7 July 2014 | Volume 9 | Issue 7 | e103681

other studies [20,21], the current study shows that the most
socially disadvantaged, i.e. poor people, have a higher incidence of
disability than middle and/or rich people.
Assuming that the association runs from wealth to disability, it is
quite possible that a series of demographic factors intervene. The
current study shows a negative association between age and
disability, with older individuals more likely to report disability
than their younger counterparts. Mitra and Sambamoorthi [39]
also found that older people in Bangladesh had a higher disability
prevalence than their younger counterparts. Health problems, the
types of disability used in this study, usually increase with
increasing age and, thus, it is not surprising to have the highest
odds ratios of having a disability for those aged 65+. The above
result could be partly explained by aging studies that reveal that
older individuals are more likely to report poor health [44,45] and
disability [46] than their younger counterparts. And, therefore, our
study urges policy makers to pay special attention to the elderly
when making policies regarding disabilities.
Educated persons may earn more, adopt healthier lifestyles,
and, consequently, have less disability. In the United States, poor
and poorly educated people were found to die at higher rates than
those with higher incomes or better education [8]. In Japan,
education has only a small effect on disability, and the robust
education-health relationship found in Western societies does not
seem applicable in Japan [47]. In our study, education is found to
have a positive influence on disability in both the final adjusted
model and the sensitivity analysis. Healthy life partners are usually
chosen for marriage; therefore, currently married individuals
might have less disability than others. In the present study, those
who are currently married are less likely to report having a
disability than others. Regional differences in disability are also of
interest. Persons from places with insufficient transportation,
treatment, and health care facilities may have more disabilities. In
conformity with a study conducted by the Danish Bilharziasis
Laboratory for the World Bank [27], we also observe that in
Bangladesh most people with disabilities live in rural areas. In
terms of divisional differences of disability, we also found a higher
prevalence of disability in Rajshahi division than in other divisions,
while the sensitivity analysis showed a higher prevalence of
disability in Barisal division. Therefore, this study suggests
implementing disability-related policies that pay particular atten-
tion to Rajshahi division and target rural areas throughout
Bangladesh.
LimitationsThis study’s limitations should be considered when interpreting
our findings. First, the data are cross-sectional. We did not control
for possible endogeneity of wealth: are you poor because you are
disabled and cannot work? Or, are you disabled because being
poor you were not able to access health services and get adequate
care? Second, the data are self-reported. Although this could be a
possible source of bias, studies have shown that self-reported data
Figure 1. Predicted probabilities of disability by wealth index in Bangladesh.doi:10.1371/journal.pone.0103681.g001
Inequality in Disability in Bangladesh
PLOS ONE | www.plosone.org 8 July 2014 | Volume 9 | Issue 7 | e103681

on functional disability were consistent with medical diagnoses
[48]. Third, structural and functional aspects of human body more
than capacity and/or performance were included for quantifying
disability. Despite this limitation, this most recent and reliable
nationally representative large data set presents a clear scenario of
wealth inequality in disability among Bangladeshis. What is
certainly needed to address the above limitations is a health
transition analysis through routine disability reporting with wealth
inequality. This is where a longitudinal study could play a vital
role.
Conclusions
In summary, as a first study examining economic inequality and
its association with disability in Bangladesh, this study has
provided some notable results. In particular, a gradient in
disability was found across wealth categories; individuals from
middle/rich families are shown to have less disability than those
living in poor families. Also, the prevalence of disabilities among
older people and women is greater than among their younger and
male counterparts, respectively. Therefore, in Bangladesh, worse
health among the poor argues for policies prioritizing this group
while at the same time giving special attention to women and the
elderly.
Author Contributions
Conceived and designed the experiments: MIT SB YS. Performed the
experiments: MIT YS. Analyzed the data: MIT. Wrote the paper: MIT.
Helped access data: SB. Read and approved the final draft: MIT YS SB.
References
1. Siegrist J, Marmot M (2004) Health inequalities and the psychosocial
environment - two scientific challenges. Soc Sci Med 58(8): 1463–73.
doi:10.1016/S0277-9536(03)00349-6.
2. Blane D (2001) Commentary: Socioeconomic health differentials. Int J Epide-
miol 30(2): 292–3. doi:10.1093/ije/30.2.292.
3. Braveman PA, Cubbin C, Egerter S, Chideya S, Marchi KS, et al. (2005)
Socioeconomic status in health research: One size does not fit all. JAMA 294(22):
2879–88. doi:10.1001/jama.294.22.2879.
4. Demakakos P, Nazroo J, Breeze E, Marmot M (2008) Socioeconomic status and
health: The role of subjective social status. Soc Sci Med 67(2): 330–40.
doi:10.1016/j.socscimed.2008.03.038.
5. von dem Knesebeck O, Luschen G, Cockerham WC, Siegrist J (2003)
Socioeconomic status and health among the aged in the United States and
Germany: A comparative cross-sectional study. Soc Sci Med 57(9): 1643–52.
doi:10.1016/S0277-9536(03)00020-0.
6. Braveman PA, Cubbin C, Egerter S, Williams DR, Pamuk E (2010)
Socioeconomic disparities in health in the United States: What the patterns
tel l us. Am J Public Health (Suppl 1): S186–96. doi:10.2105/
AJPH.2009.166082.
7. Mackenbach JP, Kunst AE, Cavelaars AEJM, Groenhof F, Geurts JJM, et al.
(1997) Socioeconomic inequalities in morbidity and mortality in western Europe.
Lancet 349(9066): 1655–9. doi:10.1016/S0140-6736(96)07226-1.
8. Pappas G, Queen S, Hadden W, Fisher G (1993) The increasing disparity in
mortality between socioeconomic groups in the United States, 1960 and 1986.
N Engl J Med 329(2): 103–9. doi:10.1056/NEJM199307083290207.
9. Gannon B, Nolan B (2004) Disability and labor force participation in Ireland.
Econ Soc Rev 35(2): 135–55.
10. Organisation for Economic Co-operation and Development (2009) Sickness,
disability and work: Keeping on track in the economic downturn. Paris:
Organisation for Economic Co-operation and Development.
11. Parodi G, Sciulli D (2008) Disability in Italian households: Income, poverty and
labour market participation. Appl Econ 40(20): 2615–30. doi:10.1080/
00036840600970211.
12. Saunders P (2007) The costs of disability and the incidence of poverty.
Aust J Soc Issues 42(4): 461–80.
13. Eide AH, Rooy GV, Loeb ME (2003) Living conditions among people with
activity limitations in Namibia. A representative, national survey. SINTEF
Health Research, Oslo, Norway. Available: http://www.safod.org/Images/
LCNamibia.pdf. Accessed 1 January 2014.
14. Eide AH, Loeb ME (2006) Living conditions among people with activity
limitations in Zambia. A national representative study. SINTEF Health
Research, Oslo, Norway. Available: http://www.sintef.no/upload/Helse/
Levek%C3%A5r%20og%20tjenester/ZambiaLCweb.pdf. Accessed 1 January
2014.
15. Eide AH, Kamaleri Y (2009) Living conditions among people with disabilities in
Mozambique: A national representative study. SINTEF Health Research, Oslo,
Norway. Available: http://www.sintef.no/upload/Helse/Levekar%20og%20
tjenester/LC%20Report%20Mozambique%20-%202nd%20revision.pdf Ac-
cessed 1 January 2014.
16. Eide AH, Nhiwathiwa S, Muderedzi J, Loeb ME (2003) Living conditions
among people with activity limitations in Zimbabwe. A representative regional
survey. SINTEF Health Research, Oslo, Norway. Available: http://www.safod.
org/Images/LCZimbabwe.pdf. Accessed 1 January 2014.
17. Loeb ME, Eide AH (2004) Living conditions among people with activity
limitations in Malawi. A national representative study. SINTEF Health
Research, Oslo, Norway. Available: http://www.safod.org/Images/
LCMalawi.pdf. Accessed 1 January 2014.
18. Palmer MG, Thuy NTM, Quyen QTN, Duy DS, Huynh HV, et al. (2012)
Disability measures as an indicator of poverty: A case study from Viet Nam. J Int
Dev 24: S53–68. doi:10.1002/jid.1715.
19. World Bank (2009) People with disabilities in India: From commitments to
outcomes. Washington, DC: World Bank.
20. Filmer D (2008) Disability, poverty, and schooling in developing countries:Results from 14 household surveys. World Bank Econ Rev 22(1): 141–63.
doi:10.1093/wber/lhm021.
21. Mitra S, Posarac A, Vick B (2013) Disability and poverty in developing
countries: A multidimensional study. World Dev 41: 1–18. doi:10.1016/j.worlddev.2012.05.024.
22. Trani J-F, Loeb M (2012) Poverty and disability: A vicious circle? Evidence fromAfghanistan and Zambia. J Int Dev 24: S19–52. doi:10.1002/jid.1709.
23. Braithwaite J, Mont D (2009) Disability and poverty: A survey of World BankPoverty Assessments and implications. Alter 3(3): 219–32. doi:10.1016/
j.alter.2008.10.002.
24. World Health Organization, World Bank (2011) World report on disability
2011. World Health Organization, 20 Avenue Appia, 1211 Geneva 27,Switzerland. Available: http://whqlibdoc.who.int/publications/2011/
9789240685215_eng.pdf. Accessed 14 January 2013.
25. Groce N, Kett M, Lang R, Trani J-F (2011) Disability and poverty: The need for
a more nuanced understanding of implications for development policy andpractice. Third World Q 32(8): 1493–513. doi:10.1080/01436597.2011.604520.
26. Maulik PK, Damstadt GL (2007) Childhood disabilities in low- and middle-
income countries: Overview of screening, prevention, services, legislation and
epidemiology. Pediatrics (Suppl. 1): S1–55. doi:10.1542/peds.2007-0043B.
27. DBLWB (The Danish Bilharziasis Laboratory for the World Bank) (2004)Disability in Bangladesh: A situation analysis, final report. People’s Republic of
Bangladesh. Available: http://siteresources.worldbank.org/DISABILITY/
Resources/Regions/South%20Asia/DisabilityinBangladesh.pdf. Accessed 13January 2013.
28. BBS (Bangladesh Bureau of Statistics) (2011) Report of the household income &expenditure survey 2010. Bangladesh Bureau of Statistics, Statistics Division,
Ministry of Planning, New Panama Printing Press, Dhaka, Bangladesh.Available: http://www.bbs.gov.bd/PageWebMenuContent.aspx?MenuKey =
320. Accessed 21 November 2012.
29. Madans JH, Loeb ME, Altman BA (2011) Measuring disability and monitoring
the UN Convention on the Rights of Persons with Disabilities: The work of theWashington Group on Disability Statistics. BMC Public Health (Suppl 4): S4.
doi:10.1186/1471-2458-11-S4-S4.
30. Tareque MI, Begum S, Saito Y (2013) Gender differences in disability-free life
expectancy at old ages in Bangladesh. J Aging Health 25(8): 1299–312. doi:10.1177/0898264313501388.
31. Filmer D, Pritchett LH (2001) Estimating wealth effects without expendituredata-or tears: An application to educational enrollments in states of India.
Demography 38(1): 115–32. doi:10.1353/dem.2001.0003.
32. Rutstein SO, Johnson K (2004) The DHS wealth index. Calverton, MD, USA:
ORC Macro.
33. Zimmer Z (2008) Poverty, wealth inequality and health among older adults in
rural Cambodia. Soc Sci Med 66(1): 57–71. doi:10.1016/j.socs-cimed.2007.08.032.
34. Bollen KA, Glanville JL, Stecklov G (2002) Economic status proxies in studies of
fertility in developing countries: Does the measure matter. Popul Stud 56(1): 81–
96. doi:10.1080/00324720213796.
35. Houweling TAJ, Kunst AE, Mackenbach JP (2003) Measuring health inequalityamong children in developing countries: Does the choice of the indicator of
economic status matter? Int J Equity Health 2(1): 8. doi:10.1186/1475-9276-2-
8.
36. Chan YH (2004) Biostatistics 202: Logistic regression analysis. Singapore Med J45(4): 149–53.
37. Lafortune G, Balestat G, the Disability Study Expert Group Members (2007)Trends in severe disability among elderly people: Assessing the evidence in 12
OECD countries and the future implications. OECD Health Working Paper 26,France: OECD.
Inequality in Disability in Bangladesh
PLOS ONE | www.plosone.org 9 July 2014 | Volume 9 | Issue 7 | e103681

38. Miller K, Mont D, Maitland A, Altman B, Madans J (2011) Results of a cross-
national structured cognitive interviewing protocol to test measures of disability.Qual Quant 45(4): 801–15. doi:10.1007/s11135-010-9370-4.
39. Mitra S, Sambamoorthi U (2013) Disability prevalence among adults: Estimates
for 54 countries and progress toward a global estimate, Disabil Rehabil 1–8.doi:10.3109/09638288.2013.825333.
40. Wall LL (2012) Obstetric fistula is a ‘‘neglected tropical disease’’. PLoS NeglTrop Dis 6(8): e1769. doi:10.1371/journal.pntd.0001769.
41. National Institute of Population Research and Training [NIPORT], Mitra and
Associates, ICF International (2013) Bangladesh Demographic and HealthSurvey 2011. Dhaka, Bangladesh and Calverton, Maryland, USA: NIPORT,
Mitra and Associates, and ICF International. Available: http://www.measuredhs.com/pubs/pdf/FR265/FR265.pdf. Accessed 1 August 2013.
42. Victora CG, Adair L, Fall C, Hallal PC, Martorell R, et al. (2008) Maternal andchild undernutrition: Consequences for adult health and human capital. Lancet
317(9609): 340–57. doi:10.1016/S0140-6736(07)61692-4.
43. Jarvandi S, Yan Y, Schootman M (2012) Income disparity and risk of death: Theimportance of health behaviors and other mediating factors. PLoS ONE 7(11):
e49929. doi:10.1371/journal.pone.0049929.
44. Drumond Andrade FC, Guevara PE, Lebrao ML, de Oliveira Duarte YA,
Santos JL (2011) Gender differences in life expectancy and disability-free life
expectancy among older adults in Sao Paulo, Brazil. Womens Health Issues
21(1): 64–70. doi:10.1016/j.whi.2010.08.007.
45. Rahman MO, Barsky AJ (2003) Self-reported health among older Bangladeshis:
How good a health indicator is it? Gerontologist 43(6): 856–63. doi:10.1093/
geront/43.6.856.
46. Dewhurst F, Dewhurst MJ, Gray WK, Orega G, Howlett W, et al. (2012) The
prevalence of disability in older people in Hai, Tanzania. Age Ageing 41(4): 517–
23. doi:10.1093/ageing/afs054.
47. Yong V, Saito Y (2012) Are there education differentials in disability and
mortality transitions and active life expectancy among Japanese older adults?
Findings from a 10-year prospective cohort study. J Gerontol B Psychol Sci Soc
Sci 67B(3): 343–53. doi:10.1093/geronb/gbs029.
48. Zunzunegui MV, Alvarado BE, Beland F, Vissandjee B (2009) Explaining health
differences between men and women in later life: A cross-city comparison in
Latin America and the Caribbean. Soc Sci Med 68(2): 235–42. doi:10.1016/
j.socscimed.2008.10.031.
Inequality in Disability in Bangladesh
PLOS ONE | www.plosone.org 10 July 2014 | Volume 9 | Issue 7 | e103681