BET Meeting Packet 12-17-12 - Greenwich, CT
485
TOWN OF GREENWICH REGULAR MONTHLY MEETING OF THE BOARD OF ESTIMATE AND TAXATION Monday, December 17, 2012 Cone Room, 2 nd Floor 6:30 P.M. AGENDA 1. Call to Order and Pledge of Allegiance 2. Consideration of Applications 3. ROUTINE APPLICATIONS Number Department Amount Purpose PD-3 Police $ 3,400.00 Approval to Use F2175 51100 & 57050 Overtime Services & Benefits PW-3 DPW $ 64,000.00 Additional Appropriation B345 59560 12129 Temporary Fire Station ED-1 BOE $ 2,500.00 Approval to Use F6050408 51900 & 51310 Growth & Dev. Substitute Pay ED-2 BOE $ 2,500.00 Approval to Use F6050608 51310 & 53100 Substitute Pay & Supplies NON-ROUTINE APPLICATIONS Number Department Amount Purpose ED-3 BOE $ 126,000.00 Release of Conditions B680 59090 13150 Mitel Phone System Upgrade GM-1 GEMS $ 1,824,000.00 Release of Conditions A440 57225 Contribution to GEMS PR-3 Parks & Recreation $ 3,081,750.00 Additional Appropriation Z809 59840 Storm Damage PR-4 Parks & Recreation $ 317,544.44 Additional Appropriation Various codes Storm Damage
-
Upload
khangminh22 -
Category
Documents
-
view
0 -
download
0
Transcript of BET Meeting Packet 12-17-12 - Greenwich, CT

TOWN OF GREENWICH REGULAR MONTHLY MEETING OF THE BOARD OF ESTIMATE AND TAXATION
Monday, December 17, 2012 Cone Room, 2nd Floor
6:30 P.M.
AGENDA
1. Call to Order and Pledge of Allegiance
2. Consideration of Applications
3. ROUTINE APPLICATIONS Number Department Amount Purpose
PD-3 Police $ 3,400.00 Approval to Use
F2175 51100 & 57050 Overtime Services & Benefits
PW-3 DPW $ 64,000.00 Additional Appropriation B345 59560 12129 Temporary Fire Station
ED-1 BOE $ 2,500.00 Approval to Use
F6050408 51900 & 51310 Growth & Dev. Substitute Pay
ED-2 BOE $ 2,500.00 Approval to Use F6050608 51310 & 53100 Substitute Pay & Supplies
NON-ROUTINE APPLICATIONS Number Department Amount Purpose
ED-3 BOE $ 126,000.00 Release of Conditions
B680 59090 13150 Mitel Phone System Upgrade
GM-1 GEMS $ 1,824,000.00 Release of Conditions A440 57225 Contribution to GEMS
PR-3 Parks & Recreation $ 3,081,750.00 Additional Appropriation Z809 59840 Storm Damage
PR-4 Parks & Recreation $ 317,544.44 Additional Appropriation
Various codes Storm Damage

NW-8 Nathaniel Witherell $ 22,476,000.00 Release of Conditions B450 59560 12201 NW Renew
4. Assessor’s Report
5. Comptroller’s Report
6. Acceptance of Treasurer’s Report showing investing portfolio activity for the month of
November 2012
7. BET Standing Committee Reports:
☐Audit ☐Budget ☒Human Resources
☐Investment ☐Law ☐Policy/Procedures
8. BET Liaison Reports:
☐CD Block Grant ☐CIP - Capital Improv. ☐Education
☒Finance/Assessor ☐Retirement ☐N.W. Board
☐OPEB Investment ☐Fire/Police ☐Revaluation Team
9. BET Special Project Team Reports:
☐Central Fire House ☒GHS MISA / Remediation ☒N. W. Building Comm.
☐Hay Study Implem. ☐Labor Contracts ☒BET I.T. Upgrade
10. New Business:
Approval of the HarbourVest Investment Agreements
Approval of the Comprehensive Annual Financial Report, Federal & Single Audits and Acceptance of the Management Letter for the Year Ending June 30, 2012.
11. Old Business:
Meeting Schedules
12. Approval of BET Meeting Minutes for November 19, 2012
13. Chairman’s Report
14. Adjournment
Michael S. Mason, Chairman

Town Of Greenwich Request Form For Budget Adjustments
BET Meeting Date: I Dec-12 Application #: PO 3 ...._ ___ ..,~
Department & Division: Police
Action Requested: Approval to Use
Date of Submission: December 3, 2012
Fund Dept Object Project Desc Amount
To: F 2175 51100 Overtime Services
F 2175 57050 Benefits
From: Federal Highway Safety Program Grant Click It or Ticket Enforcemen
Justification of Request: (Set forth reasons the adjustment is required, the factors involved in arriving at costs, and the status of the account from which the transfer is made. Attach separate copy if necessary.)
3,351
49
3,400
We respectfully request permission to accept the amount of $3,400 from the State of Connecticut Department of Transportation for "Wave #43 - Click It or Ticket" safety campaign to enforce the mandatory seat belt Jaw. This amount is being made available to the Greenwich Police Department to work with State Police in reminding motorists and passengers to buckle up to reduce and/or prevent serious injuries and save lives. Please see attached Em?Jil no "fication.
First Selectman: Department Head:
First Selectman: Certified correct as to computations and amounts shows as appropriations to date and unencumbered balances, with any changes given.
Date: Comptroller:
The following action was taken at a meeting of the Board of Estimate and Taxation held on : Approved Motion: Disapproved Modified as follows: Second:
Clerk of the Board:-----------
This form should be submitted with 35 blue copies in addition to a current Appropriation Statement

"Hedge , Edmund" <Edmund [email protected]>
11 /23/2012 11:35 AM
To '"Roger Drenth"' <[email protected]>
cc
bee
Subject RE: Click it or ticket
Subject: RE: Click it or Ticket Wave 43 December 3-16, 2012
Your WAVE # 43 reques t for Enforcement funding has been approved by the Highway Safety Office and shall not exceed $3,400. In order to meet requirements, all r eimbursement claims must be submitted to the Highway Safety o f fice no later tha n 30 days after the conclusion of the enforcement campaign. Please include the total number of enforcement actions and post survey seat bel t usage rate i n the reimbursemen t claim.
ED
Edmund M. Hedge Jr . Law En f orcement Liaison/Drug Evalua tion and Classification Program Manager Hig hway Safety Office CT. Department of Transportation PO Box 317546 2800 Berl in Turnpike Newington, CT. 06131-7546 Tel: (860) - 594-2386 Fax: (860) -594-237 4 Email: [email protected]

Town Of Greenwich Request Form For Budget Adjustments
BET Meeting Date: I Dec-12
Application # : _ PW 3
Department & Division: DPW
Action Requested: Additional Appropriation
Date of Submission: November 28, 2012
Fund Dept Object Project Desc
To: B 345 59560 12129 Temporary Fire Station
From: Capital Non-Recurring
Justification of Request : (Set forth reasons the adjustment is required, the factors involved in arriving at costs. and the status of the account from which the transfer is made. Attach separate copy It necessary.)
PLEASE SEE. ATTACHED
Dep;:lrtm~nt Hea ·
Certified correct as to com tations and amounts shows as appropriations to balances, with any changes given.
Date: Comptroller:
The following action was taken at a meeting of the Board of Estimate and Taxation held on: Approved Motion: Disapproved Modified as follows: Second:
Clerk of the Board: --------------------
Amount
64,000
64,000
This form should be submitted with 40 blue cop1es in addition to a current Appropriation Statement
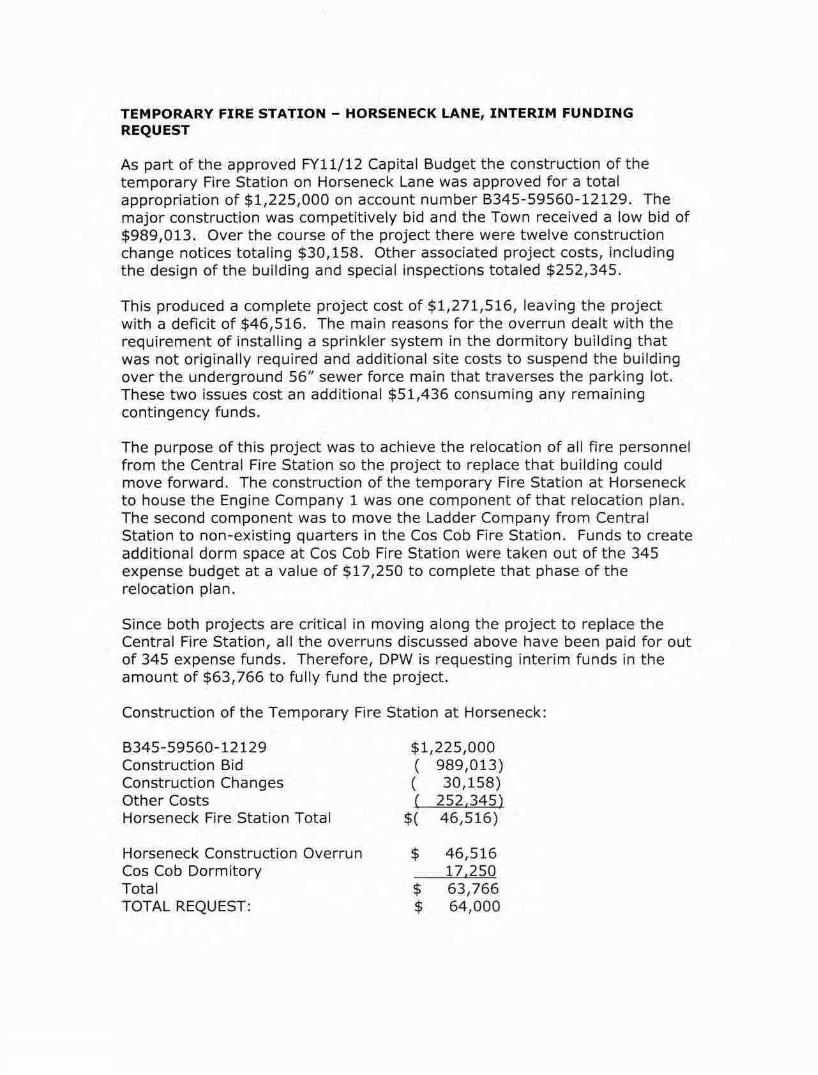
TEMPORARY FIRE STATION - HORSENECK LANE, INTERI M FUNDING REQUEST
As part of the approved FY11/12 Capital Budget the construction of the temporary Fire Station on Horseneck Lane was approved for a total appropriation of $1,225,000 on account number B345-59560-12129. The major construction was competitively bid and the Town received a low bid of $989,013 . Over the course of the project there were twelve construction change notices totaling $30,158. Other associated project costs, including the design of the building and special inspections totaled $252,345.
This produced a complete project cost of $1,271,516, leaving the project with a deficit of .$46,516. The main reasons for the overrun dealt with the requirement of installing a sprinkler system in the dormitory building that was not originally required and additional site costs to suspend the building over the underground 56" sewer force main that traverses the parking lot. These two issues cost an additional $51,436 consuming any remaining contingency funds;
The purpose of this project was to achieve the relocation of all fire personnel from the Central Fire Station so the project to replace that building could move forward. The construction of the temporary Fire Station at Horseneck to house the Engine Company 1 was one component of that relocation plan. The second component was to move the Ladder Company from Central Station to non-existing quarters in the Cos Cob Fire Station. Funds to create additional dorm space at Cos Cob Fire Station were taken out of the 345 expense budget at a value of $17,250 to complete that phase of the relocation plan.
Since both projects are critical in moving along the project to replace the Central Fire Station, all the overruns discussed above have been paid for out of 345 expense funds. Therefore, DPW is requesting interim funds in the amount of $63,766 to fully fund the project.
Construction of the Temporary Fire Station at Horseneck:
B345-59560-12129 Construction Bid Construction Changes Other Costs Horseneck Fire Station Total
Horseneck Construction Overrun Cos Cob Dormitory Total TOTAL REQUEST:
$1,225,000 ( 989,013) ( 30,158) ( 252,345)
$( 46,516)
$ 46,516 17,250
$ 63,766 $ 64,000

BET Meeting Date: Application #: ED 1
Department & Division:
Action Requested: Approval to Use
Date of Submission: December 2, 2012
Fund Dept Object Project Desc AmountF 6050408 51900 Growth & Dev. 1,980
To: F 6050408 51310 Substitute Pay 520
From: GRANT 2,500
Justification of Request : (Set forth reasons the adjustment is required, the factors involved in arriving at costs, and the status of the account from which the transfer is made. Attach separate copy if necessary.)
Town Of Greenwich Request Form For Budget Adjustments
BOE
The Lone Pine Grant will focus on Flexible Grouping at New Lebanon Elementary School. These flexible groups meet with teachers four times per week, sixty minutes per day. Students are in three 20-minute instructional groups. Teachers meet weekly to address immediate needs and plan
S G f
Dec-12
Board Chairman Department Head:
Certified correct as to computations and amounts shows as appropriations to date and unencumbered balances, with any changes given.
Date: Comptroller:
The following action was taken at a meeting of the Board of Estimate and Taxation held on: ________ Approved Motion:________ Disapproved________ Modified as follows: Second:
Clerk of the Board:
appropriate instructional groups. Students will be assessed every six weeks, and regrouped as needed. Groups consist of guided reading, shared reading, vocabulary, word study, Orton-Gillingham Reading Instruction, ESL and bilingual groups, computer (lexia and imagine learning), independent and phonemic awareness.
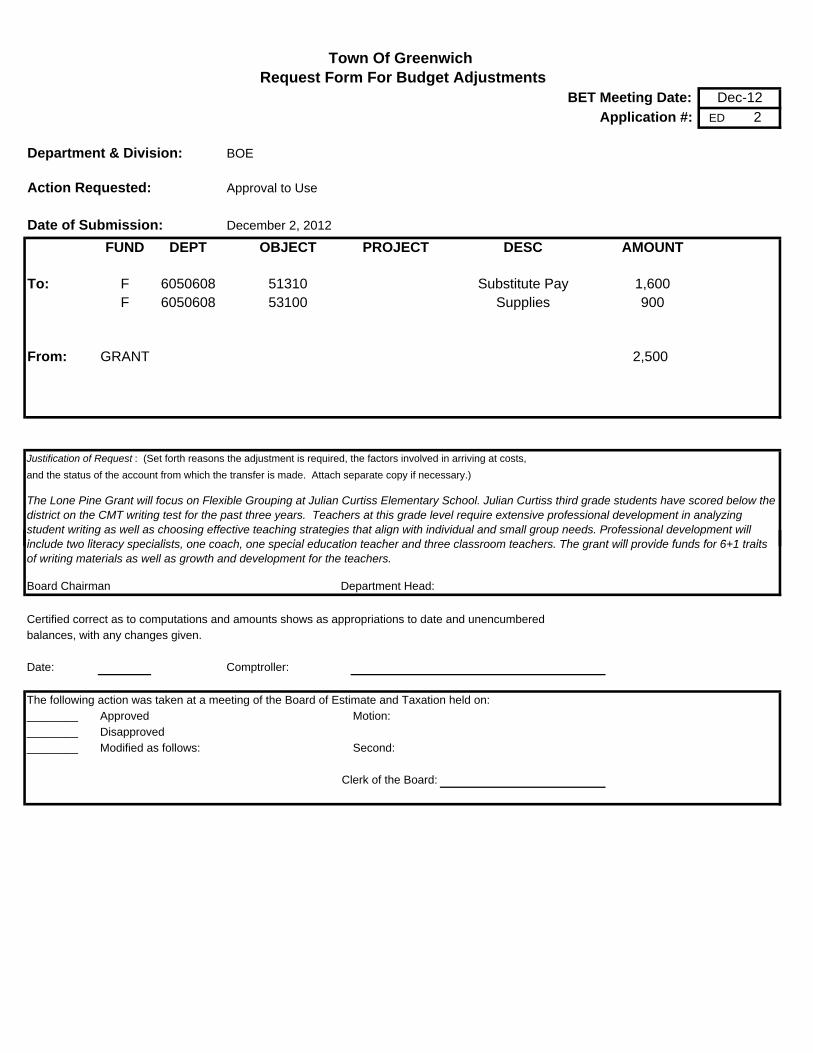
BET Meeting Date: Application #: ED 2
Department & Division:
Action Requested: Approval to Use
Date of Submission: December 2, 2012
FUND DEPT OBJECT PROJECT DESC AMOUNT
To: F 6050608 51310 Substitute Pay 1,600F 6050608 53100 Supplies 900
From: GRANT 2,500
Justification of Request : (Set forth reasons the adjustment is required, the factors involved in arriving at costs, and the status of the account from which the transfer is made. Attach separate copy if necessary.)
Town Of Greenwich Request Form For Budget Adjustments
BOE
The Lone Pine Grant will focus on Flexible Grouping at Julian Curtiss Elementary School. Julian Curtiss third grade students have scored below the district on the CMT writing test for the past three years. Teachers at this grade level require extensive professional development in analyzing student writing as well as choosing effective teaching strategies that align with individual and small group needs. Professional development will i l d t lit i li t h i l d ti t h d th l t h Th t ill id f d f 6 1 t it
Dec-12
Board Chairman Department Head:
Certified correct as to computations and amounts shows as appropriations to date and unencumbered balances, with any changes given.
Date: Comptroller:
The following action was taken at a meeting of the Board of Estimate and Taxation held on: ________ Approved Motion:________ Disapproved________ Modified as follows: Second:
Clerk of the Board:
include two literacy specialists, one coach, one special education teacher and three classroom teachers. The grant will provide funds for 6+1 traits of writing materials as well as growth and development for the teachers.

BET Meeting Date: Application #: ED 3
Department & Division:
Action Requested: Approval to Use
Date of Submission: December 2, 2012
FUND DEPT OBJECT PROJECT DESC AMOUNT
To: B 680 59090 13150 Phone System (Mitel) Upgrade 126,000
From: B 680 59090 13150 Phone System (Mitel) Upgrade 126,000
Justification of Request : (Set forth reasons the adjustment is required, the factors involved in arriving at costs, and the status of the account from which the transfer is made. Attach separate copy if necessary.)
Town Of Greenwich Request Form For Budget Adjustments
BOE
Requesting the release of condition placed on the BOE's capital project for Phone System (Mitel) Upgrade The allocation is not for a new phone
Dec-12
Board Chairman Department Head:
Certified correct as to computations and amounts shows as appropriations to date and unencumbered balances, with any changes given.
Date: Comptroller:
The following action was taken at a meeting of the Board of Estimate and Taxation held on: ________ Approved Motion:________ Disapproved________ Modified as follows: Second:
Clerk of the Board:
Requesting the release of condition placed on the BOE's capital project for Phone System (Mitel) Upgrade. The allocation is not for a new phone system, but to upgrade existing Mitel communication software and necessary hardware. The phone system was installed in Summer of 2006. The current software level (7.1) is no longer supported by Mitel. Without the upgrade the District will not be able to receive manufacturer support in the event of a major problem, as well as the inability to add additional equipment (i.e. telephone sets).

Town Of Greenwich Request Form For Budget Adjustments
BET Meeting Date: Dec-12 t-------il
Application #: GM 1
Department & Division: GEMS
Action Requested: Release of Conditions
Date of Submission: December 3, 2012
Fund Dept Object Project Desc
To: A440 57225 Contrib To GEMS
From:
Justification of Request: (Set forth reasons the adjustment is required , the factors involved in arriving at costs,
and the status of the account from which the transfer is made. Attach separate copy if necessary.)
Release of Second Half Payment for GEMS for FY20 1212013 as per attachments.
Department Head:
Cert1f1ed correct as to computations and amounts shows as appropriations to date and unencumbered
balances, with any changes given.
Date: Comptroller:
The following action was taken at a meeting of the Board of Estimate and Taxation held on: Approved Motion:
Disapproved
Modified as fo llows: Second:
Clerk of the Board: ----------------------
Amount
1,824,000
1,824,000
This form should be submitted with 35 blue copies in addition to a current Appropriation Statement
...._ ___ .....;6

November 27,2012
Ms. Caroline Baisley Department of Health Greenwich Town Hall 101 Field Point Road Greenwich, CT 06830
RE: 2nd Half Town Fee Request 201 2-2013
Dear Ms. Baisley:
This letter requests $1,824,000 representing the 2nd Half payment of the approved town fee for fiscal year 2012-201 3.
Approved fee FY 2012-2013
Paid to date
BALANCE DUE GEMS
Sincerely,
tjc..f,__,~ John StTong Fiscal Officer
$3,846,000
2,022,000
$1,824,000
1111 EAST PUTNAM AVENUE • RIVERSIDE, CONNECTICUT 06878 • 203-637-7505 www.greenwichems.org
REENWICH IIERGENCY
ED/CAL ER~Inc.
GEMS Quarterly Report
TO:
FROM:
RE:
DATE:
C. Baisley, Director ofHealth J. Crary, Town Administrator P. Mynarski, Comptroller M. Mason, BET Chairman J. Pellegrino, BET Budget Chairman R. Geiger, Budget Director D. Flynn, Health Department C. Budkins, Town Clerk
Charlce A. Tufts
Financial and Quarterly Report
November 2012
Enclosed please find GEMS' Operational and Financial Quarterly report.
II II EAST PUTNAM A YENUB- RlVERSIDE, CT 06878 - (203) 637-7505- WWW.GREENWICHEMS.ORG fNFO@GREBNWTCHEMS

Totlll Number of Ambulance Calla
BACKUP MEDIC 1 MEDIC2 ALL 15 194 147
Total Numbar of Coda·20 Responses
BACKUP MEDIC 1 MEDIC2 ALL 100 79
ALS I BLS Breakout
BACKUP MEDIC 1 MEDIC2 ALS BLS fiL(::
a n ~
0 59 38 .....
Typo of Calls, by Modic Station
Inter-Hospital Emergency Transports
BACKUP MEDIC 1
Patient Transports 134 Hospital Non-EO Mutual Aid -othar :=~i~= : ·. ·:: · .. :-:-:-.;.; . .; a:-·:-··.·.<·.::::.;.· :-:134-:· ·:. Assist 7 Cancelled 16
DOA 1 Fire/ Pollee Standby 1 Public Stand·by 10 No patient Found 6 RMA 32 ALL 10 197
MEDiC2
96
· .. · .. ·: 96 :· 3 10
e 34
149
...
MEDIC3 53
MEDIC 3 35
MEDIC3
36
. ·~6:· ::· 2 5
9 63
August 2012 STATISTICAL REPORT
MEDIC 4 110
MEOIC4 62
MEDIC4
ALL 519
ALL
276
ALL 220 133
,• ·.·. ·.·:: ~53:
ALL
0 85 361
0
0 ·:· 85 ;.;.::;::=-:_.:: ::-:- ·'·.351 ·
4
6 15
110
12 35
0 19 90
519
Number o( Code·20 Responses with Patients Transported/ Avg. Response Time
BACKUP
min
MEDIC 1 74
4.oo min
MEDIC2 57
<~.63 min
MEDIC3 24
5.54 min
MEDIC4 54
4.16mln
Breakdown ot Response Times by Percentage For All Coda-20 Calli Patient Tansprtod
5 minutes or len 76% 159
6 minutes - 8 m•nutes 16% 34
Breakdown of Re$pOnse Times by Percentage For Medic 1 Coda·20 Patients Transported
5 minutes or less 84% 62
6 minutes - 8 minutes 11%
8
Breakdown of Response Times by Percentage For Medic 2 Code·20 Patlenta Transported
5 minutes or le$G 72% 41
6 minutes - 8 minutes 18% 10
Breakdown of Response Times by Percentage For Medic 3 Code.20 Patients Transported
5 minute$ or less 54% 13
6 minutes - 8 minutes 33%
B
Breakdown of Response Time5 by Percentage For Medic 4 Code-20 Patlentll Transported
5 mlnuies or less 80% 43
6 minutes • 8 minutes 15%
8
> 8 minutes 3% 7
,. 8 minutes 5% 4
,. 8 minutes 11%
6
> B minutes 4%
> 8 minutes 6% 3
ALL 209
4.39 min

Extended Response Time Analysis
Study period: August 1 -August 31, 2012
Total days studied: 31
Extended responses: 18*
Range: 8 minutes - 16 minutes
Distribution: 8 minutes - 6 9 minutes - 4
10 minutes - 1 11 minutes - 2 12 minutes - 3 13 minutes - 0 > 13 min 2
18 total
Distribution by unit:
Medic 1 - 4 Medic 2 - 3 Medic 3 - 5 Medic 4 - 5 1505 1
Mean: 9 minutes
Mode: 8 minutes
• Definition of extended response time for this study -Dispatched code 20 with arrival time of 8 minutes or greater [all call locations are included in study, even those that are listed as exceptions within our Town contract]
No clear patterns this month with distribution of extended responses across all sections of the Town. Total improved from August 2011 [significant storm event] Four calls on the King St corridor

Patient And Call Information Greenwich EMS
Branch 1Senrice Date ri11c;:ident #Re,~ptir11eVehicle [Incident Address
1 08/02/2012 50530 9 Medic 1 PEMBERWICK PARK 2 08/02/2012 50571 10 Medic 2 195 NORTH BOUND AT 2 3 08/03/2012 50893 16 Medic 3 159 VALLEY RD 4 08/04/2012 51058 14 Medic 4 214 JOHN STREET 2 08/06/2012 51493 9 Medic 2 106 SOUNDBEACH AVE 1 08/07/2012 51754 8 Medic 1 88 Parsonage Road 3 08/07/2012 51763 12 Medic 3 1165 King street 3 08/10/2012 52568 12 Medic 3 ROUTE 15 BETWEEN 28 & 27 4 08/12/2012 53046 8 Medic 4 1300 KING ST BRUCE GOLF COURSE 4 08/13/2012 53307 8 Medic 4 10 FORT HILL LN 2 08/19/2012 54589 11 1505 SOUND BEACH AT CENTER DR 3 08/19/2012 54609 8 Medic 3 37 LONDONDERRY DR 3 08/20/2012 55003 8 Medic 3 15 UPPER CROSS RD 1 08/22/2012 55308 11 Medic 1 1-95 NORTHBOUND AT EXIT 2 4 08/23/2012 55733 8 Medic 4 301 RIVERSVILLE RD 1 08/27/2012 56604 9 Medic 1 1165 King street 4 08/29/2012 57111 9 Medic 4 34 SUMNER RD 2 08/30/2012 57340 12 Medic 2 15 MEADOW MARSH LANE
8
9
Notes
Pt down revine, difficult access into NY and back
horseback rider down/wilderness area GEMS and GPO had difficulties locating address from Bible St all units busy from Round Hill Rd Shifted in glenville Responded from station all units busy incorrect address Responded from station into NY and back Responded from the post road Medic 4 on call responded form central greenwich from GHA Responded from station
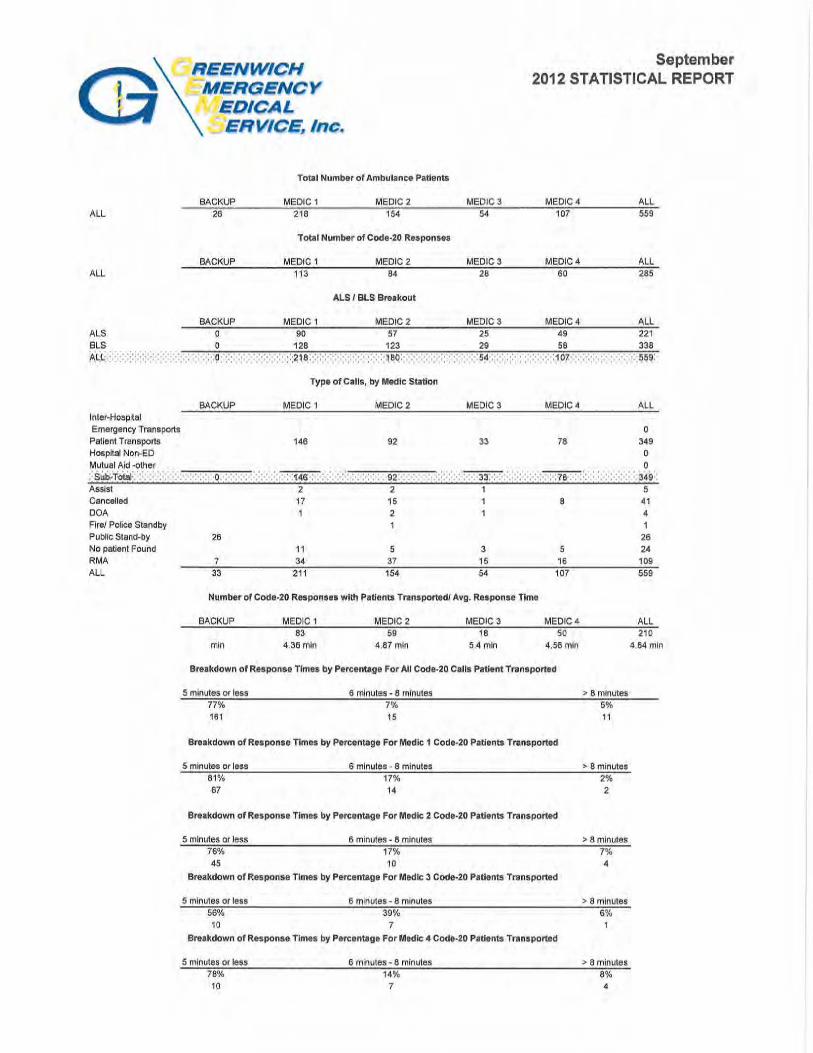
Totlll Number of Ambulance PaUents
BACKUP MEDIC 1 MEDIC 2 ALL 28 218 154
Total Number of Code-20 Ruponen
BACKUP MEDIC 1 MEDIC 2 ALL 113 84
ALS I BLS Broakout
BACKUP MEDIC 1 MEDIC2
MEDICJ 54
MEDICS 28
MEDICS
September 2012 STATISTICAL REPORT
MEDIC4 ALL 107 559
MEDIC4 ALL 60 285
MEDIC 4 ALL ALS 0 90 57 25 49 221 BLS 0 128 123 29 58 338 At,{: --·.·:::::;:-:::·:·:;:.·.,.._.,...: -. -:-::79-. :.,...::"'"':-:-.- ....,_,,...,_.-:-.;.-=-· "'"'::...,.-:;.,..:;2:::-;1:-::8-.;"":-:...,.::-- -:-. -;.·-.. "":::"'· •7.: "": :;-:; 1:-::8-::o:,...· 7>_,,,...,-:-:-·."'·:"';:7-:;.,...: - ,.-:-:: s::-;.s--.. -=-:-·,...,:...,.;:-.,...:-,...·· -:-••. -=-. -: •• :...,.·: 1::-':o£::,:-. :-=-: '"': :-; --=-::- : --=-: -. -,_-;_s7!i9;;-,-:
Inter-Hospital Emergency Transports Patient Transports Hospital Non·ED Mutual Aid -other :'stlbti-bt:5J: ·.· Assist Cancelled DOA Flre/ Pollee Standby Public Stand-by No patient Found RMA ALL
Type of Calls, by Medic Station
BACKUP MEDIC 1 MEDIC2
146 92
MEDIC 3 MEOIC4
33 78
ALL
0 349
0
·0:·:. :-:-;·. :;.;.,:. : '146·:-. .;.·:. :-: 0
.·. · ... ·>3a:-:-· :: ·::: .-:-:-:- -:·:n :-: <:.;>: · :-:-:-.:: 349'.
26
7 33
2 17 1
11 34
211
2 15 2
5 37 154
3 15 54
Number or Code-20 Respons .. wlttJ Patients Transported/ Avg. Response Time
BACKUP
min
MEDICI 83
4.36 min
MEDIC 2 59
4.87 min
MEDIC3 18
5.4 min
8
16 107
MEDIC4 so
4.56 min
Breakdown of Response Times by Percentage For All Code·20 Calls Patient Transported
5 minutes or less 77% 161
6 minutes - a mlnute11 7% 15
erukdown of Response Times by Pefcento~gll For Medic 1 Code-20 Petlents Transported
5 minutes or I&SS 81%
f!f7
6 minutes - 8 minutes 17% 14
Breakdown of Response Times by Parcantage For Medic 2 Code-20 PaUents Transported
5 minutes or less 76% 45
6 mil'lules - 8 minutes 17% 10
Breakdown of Response Times by Percentage For Medic 3 Code-20 Patients Transpo"ed
5 minutes or less 56% 10
6 minutes - 8 minutes 39%
7
Breakdown of Response limes by Percentaga For Medic 4 Codo·20 Patients Transported
5 minutes or less 78% 10
8 minutes- 8 minules 14%
7
> B minutes 5% 11
> 8 minutes 2% 2
> 8 minutes 7% 4
> 8 minutes 6%
> 8 minutes 8% 4
5 41
4 1 26 24
109 559
ALL 210
4.64 min

Extended Response Time Analysis
Study period: September 1- September 30,2012
Total days studied: 30
Extended responses: 14*
Range:
Distribution:
8 minutes - 24 minutes
8 minutes - 2 9 minutes - 4
10 minutes - 2 11 minutes - 1 12 minutes - 1 13 minutes - 0 > 13 min 4
14 total
Distribution by unit:
Mean:
Mode:
Medic 1 - 3 Medic 2 - 2 Medic 3 - 5 Medic 4 - 4
10 minutes
9 minutes
• Definition of extended response time for this study -Dispatched code 20 with arrival time of 8 minutes or greater [all call locations are included in study, even those that are listed as exceptions within our Town contract]
Five of the 14 extended responses were on limited access highways Extreme extended response of 24 minutes due to trees down blocking access

Patient And Call Information Greenwich EMS
Branch# !service i:>ateci:lll # · ~~sp~_!!ll'l~ iVehicle [Incident Address
1 3 3 4 2 3 4 4 2 2 3 3 4 1
09/12/2012 09/15/2012 09/18/2012 09/18/2012 09/18/2012 9/22/2012 09/23/2012 09/23/2012 09/24/2012 09/25/2012 09/26/2012 09/26/2012 09/30/2012 09/30/2012
60445 0:08:00 61367 0:08:00 61934 . 0:09:00 61936 0:09:00 62129 0:24:00 63043 0:10:00 63167 0:09:00 63397 0:15:43 63525 0:10:33 63815 0:15:00 63935 0:14:00 63970 0:11:02 64944 0:09:00 64950 0:12:35
Medic 1 1 INDIAN CHASE DR Medic 3 7 OLD ROUND HILL LN Medic 3 478 TACONIC RD Medic 4 RTE 15 SOUTH NEAR EX 27 Medic 2 11 INDIAN MILL RD Medic 3 50 LONDONDERRY DRIVE Medic 4 129 HALSTEAD AVE Medic 4 195 NORTH BETWEEN EXIT 4 AND 5 Medic 2 1-95 NB 2-3 Medic 1 Rte 15 NB at exit 29 Medic 3 Rte 15 SB at old tolls Medic 3 43 CLABOARD RIDGE RD Medic 4 31 DUNCAN DR Medic 1 66 GLENWOOD DR
Notes
Responded fr om Medic 2 Responded fr om west putnam ave medic 1 out on call
~.rain from Station from Station ~.rain rain, street bl< _9cked by tree down
3 from Station Responded fr om station Responded fr from Station ~
om station medic 1 on call 2
from the Hubl Responded fr no numbers o
om Greenwich Hospital n house
from Station ~ 4 from Glenville , house poorly marked

Total Number of Ambulance Calls
BACKUP MEDIC 1 MEDIC 2 ALL 41 199 207
Totllll Number of Code-20 Responses
BACKUP MEDICI MEDIC 2 ALL 105 85
ALS I BLS Breakoul
BACKUP MEOIC1 MEDIC 2 ALS 0 69 61 BLS 0 68
MEDIC 3 52
MEDIC 3 27
MEDIC 3 19
October 2012 STATISTICAL REPORT
MEDIC4 AL.L. 96 595
MEOIC4 ALL
49 266
MEOIC4 ALL 41 190
38 157
~u:.:- .·: ·: ·. ·: ::·::··;:··: :~ :·. . p·.: .::·.•. :.-:: '· : .. :-.1:~7:-. .· . z~· . . ·.•: .. · ~m ...
lnter-Hosp~al
Emergency Transports
Patient Transports Hospital Non-EO
Mutual Aid ·other .-s~~r~:: <<·::: Assist Cancelled
DOA Fire/ Police Standby Public Stand·by No patient Found
RMA
ALL
Type of Calls, by Medic Station
BACKUP MEDIC1 MEDIC 2
137 99
MEOIC3 MEDIC 4
79
ALL
0 347
0 0
:•:•:•.•0:·.·::: :····m -:-:-< ·:-. .;-·-gg;.: . :·· ·:: .:.: _:·32: ;.-::;:::;:::-:::·:-.-:'19· ·> :<·;:::: ::- ·-:~4?:: 2 12 2
41 7
39 41 199
4 15 2
-41 7
39 207
7
2 10 52
Number of Code·20 Res pontes with Patients Transported/ Avg. Rosponse Time
BACKUP
min
MEDIC 1 87
3.85 min
MEDIC2
55 3.87 min
MEDIC 3 17
6.13mln
4
3 10 98
MEDIC 4
44 4.60 min
Brukdown of Response Times by Percentage For All Code·20 Cells Patient Tansprted
5 minutes or less
79%
19
6 minutes - 8 minutes
17% 35
Breakdown of Rnponse Times by Percentage For Medic 1 Code·20 Patlenbl Transported
5 minutes or less 85%
74
6 minutes - 8 minutes
14% 12
Brellkdown of Responee Times by Percentage For Medic 2 Code·20 Patients Transported
5 minutes or less 78% 43
6 minutes • 8 mlnutas 18%
10 Brea~down of Response Times by Percentage For Modic 3 Code·20 Patients Transportad
S minutes or less 59%
10
6 minutes • 8 minutes 24%
4
Breakdown of Response Times by Percentage For Medic; 4 Code-20 Patlenta Traneportad
S minutes or less 75% 33
6 minutes • 8 minutes
20% 9
> 8 minutes
4% 8
> 8 minutes 1%
> 8 minutes
4% 2
> 8 minutes
18% 3
> 8 minutes
5%
2
7 38 4 0
41 19 98
595
ALL
203 4.21 min
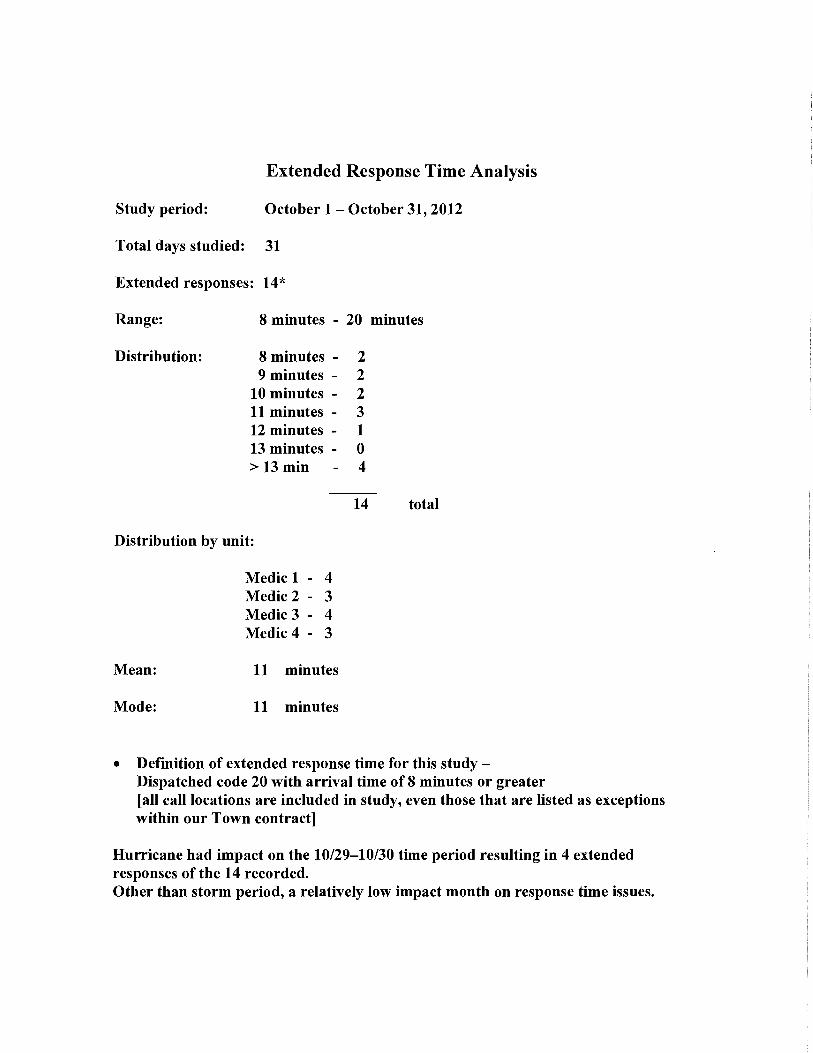
Extended Response Time Analysis
Study period: October 1- October 31, 2012
Total days studied: 31
Extended responses: 14*
Range:
Distribution:
8 minutes - 20 minutes
8 minutes - 2 9 minutes - 2
10 minutes - 2 11 minutes - 3 12 minutes - 1 13 minutes - 0 > 13 min 4
14 total
Distribution by unit:
Mean:
Mode:
Medic 1 - 4 Medic 2 - 3 Medic 3 - 4 Medic 4 - 3
11 minutes
11 minutes
• Definition of extended response time for this study -Dispatched code 20 with arrival time of 8 minutes or greater [all call locations are included in study, even those that are listed as exceptions within our Town contract]
Hurricane had impact on the 10/29-10/30 time period resulting in 4 extended responses of the 14 recorded. Other than storm period, a relatively low impact month on response time issues.

Patient And Call Information Greenwich EMS
8ranC:bJ$er\fi~e, ~~!~;~~-~i~E!~! (Yt;!hicle·ot;!s~~~l?!i()n
4 10/03/2012 65667 Medic 4 4 10/05/2012 66234 Medic 4 2 10/08/2012 66971 Medic 2 3 10/11/2012 67689 Medic 3 2 10/12/2012 67848 Medic 2 1 10/12/2012 67887 Medic 1 3 10/16/2012 68777 Medic 3 3 10/19/2012 69609 Medic 3
10/20/2012 69814 Medic 1 4 10/26/2012 71250 Medic4 3 10/29/2012 72013 Medic 3 1 10/29/2012 72077 Medic 1 2 10/29/2012 72138 Medic 2 1 10/30/2012 72146 Medic 1
Resp time :Notes
RT15 NB PRIOR TO 28 11 Traffic and weather per PCR 1165 KING STREET 9 from GHA 266 COGNEWAUGH RD 9 House poorly marked 8 BURNING TREE RD. 10 Construction had use alternate route 1165 King street 11 from Hillside RTE 15 SOUTH EXIT 27 11 RT 15 NB EXIT 27-28 19 to King St & back RTE 15 SOUTH EXIT 27 8 to King St & back 195 N EXIT 3 8 Traffic to scene 10 BROOKSIDE DRIVE 10 from Sta 4 20 WINWOOD RD 12 Hurricane 8 MAYO AVENUE 20 Hurricane 210 SHORE RD 15 Hurricane 2A CHINMOY AVE 15 Hurricane
11 Mode
11 Mean

EXPLANATORY NOTES FOR SIX MONTHS ENDED 10/31/12
PAYOR ACTUAL CALLS BUDGETED CALLS VARJANCE
Month YTD Month YTD Month YTD
Medicare 163 1015 185 1114 -22 -99 Self-Pay/Private 161 978 166 996 -5 -18 Medicaid 23 122 15 90 8 32
Total 347 2115 366 2200 -19 -85
I) Jn the month of October, calls were under budget by 19 and total calls for GEMS first half of the fiscal year at October 31 trailed budget by 85 calls. Budgeted calls were based on multiyear historical experience, and were adjusted upward for the fiscal 20 13 budget, but actual experience has been a lower call volume since a mild 20 11 -20 12 winter and nu season.
2) For the six months, the change in net assets for GEMS' funds was lower by $179k. The change in operating net assets for the unrestricted fund (reflected in the net asset change above) was a negative $84k for the same period. On the capital side, contributions from donors to be used for capital purchases totaled $81 k for the six months.
3) Patient care service revenue was $ 1,141 k for the six months ended October 31, under budget by $144k. As noted above, this also continues a trend which started in the prior fiscal year.
4) On the Balance sheet, the account "Cash and Cash Equivalents-Unrestricted'' reflects a negative book balance covered by cash transfers from Board unrestTicted cash. Net receivables at October 31 were slightly higher than at the fiscal 2012 April 30111 year end. Deferred revenue in the liability section reflects town contract revenue to be recognized into income as eamed. Payables and accrued expenses at October 3 l !<! were under the last year end balance by $79k.
5) Operating expenses in totaJ were under budget for the period by $56k. Salaries showed the largest favorab le variance in the expense categories.
1111 EAST PUTNAM AVENUE • RIVERSIDE~ CONNECTICUT 06878 • 203-637-7505 www.greenwichems.org
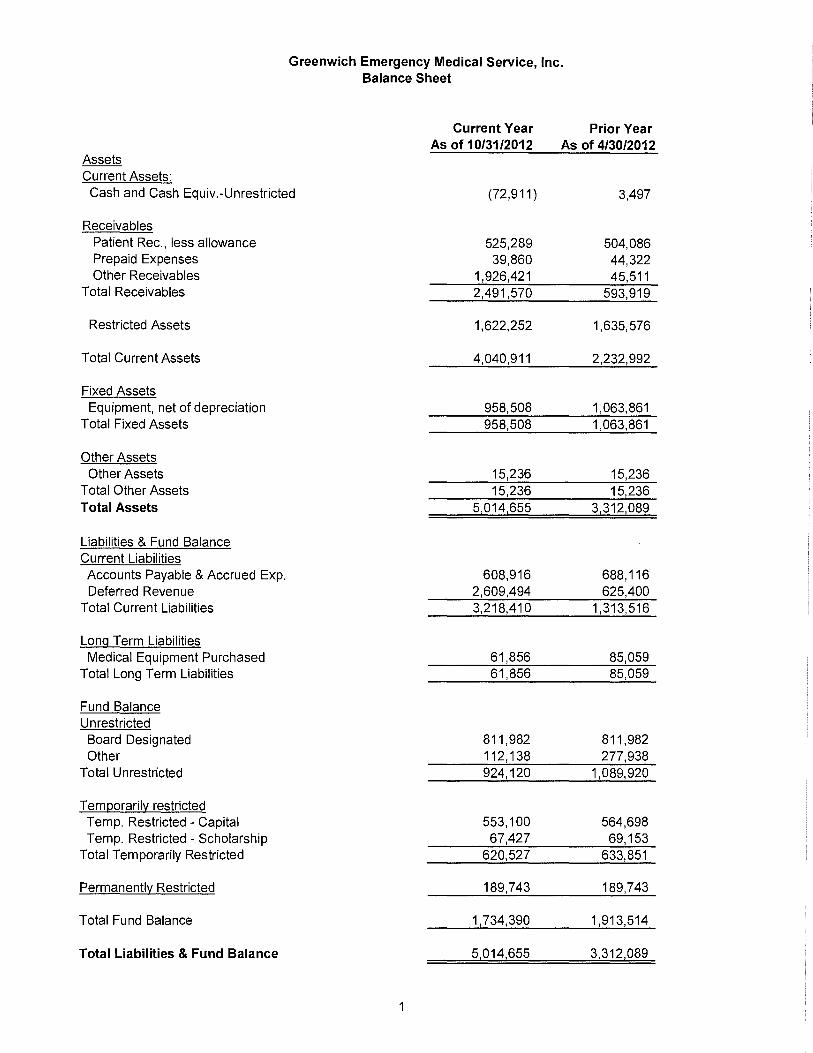
Greenwich Emergency Medical Service, Inc.
Current Assets: Cash and Cash Equiv.-Unrestricted
Receivables Patient Rec., less allowance Prepaid Expenses Other Receivables
Total Receivables
Restricted Assets
Total Current Assets
Fixed Assets Equipment, net of depreciation
Total Fixed Assets
Other Assets Other Assets
Total Other Assets Total Assets
Liabilities & Fund Balance Current Liabilities Accounts Payable & Accrued Exp. Deferred Revenue
Total Current Liabilities
Long Term Liabilities Medical Equipment Purchased
Total Long Term Liabilities
Fund Balance Unrestricted
Board Designated Other
Total Unrestricted
Temporarily restricted Temp. Restricted- Capital Temp. Restricted- Scholarship
Total Temporarily Restricted
Permanently Restricted
Total Fund Balance
Total Liabilities & Fund Balance
Balance Sheet
Current Year As of 10/31/2012
(72,911)
525,289 39,860
1,926,421 2,491,570
1,622,252
4,040,911
958,508 958,508
15,236 15,236
5 014 655
608,916 2,609,494 3,218,410
61,856 61,856
811,982 112,138 924,120
553,100 67,427
620,527
189,743
1,734,390
5 014 655
Prior Year As of 4/30/2012
3,497
504,086 44,322 45,511
593,919
1,635,576
2,232,992
1,063,861 1,063,861
15,236 15,236
3 312 089
688,116 625,400
1,313,516
85,059 85,059
811,982 277,938
1,089,920
564,698 69,153
633,851
189,743
1,913,514
3 312 089

Revenue Public Su~;mort Contributions (See Note) Town Of Greenwich Greenwich Hospital Total Public Support
Public Revenue Patient Services, Net Patient Service Revenue Total Patient Services, Net
Investment Income Training Income Stand-By Income Total Public Revenue Total Revenue
Ex12enses Total Ex12enses Life Support Services Total Net Operating Expenses
Change in 012erating Net Assets
Change in non- 012erating Net Assets Depreciation Scholarships Capital Purchases Total Change in Non-Oper.Net Assets
Change Net Assets
Note: Capital 80,643 Scholarship 1 775
82,418
Greenwich Emergency Medical Service, Inc Statements of Changes in Net Assets Six Months Ending October 31, 2012
Unrestricted Temporarily Permanently Fund Restricted Fund Restricted Fund
82,418 1,907,407
45,500 1,952,907 82,418 0
1,140,975 1,140,975
1,925 39,022 38,031
1,219,953 3,172,860 82,418 0
3,256,512 3,256,512
(83,652) 82,418 0
(174,388) (3,500)
92,240 {92,240} (82,148} (95,740}
(165,800) (13,322) 0
2
Total
82,418 1,907,407
45,500 2,035,325
1,140,975 1,140,975
1,925 39,022 38,031
1,219,953 3,255,278
3,256,512 3,256,512
(1,234)
(174,388) (3,500)
(177,888)
(179, 122)
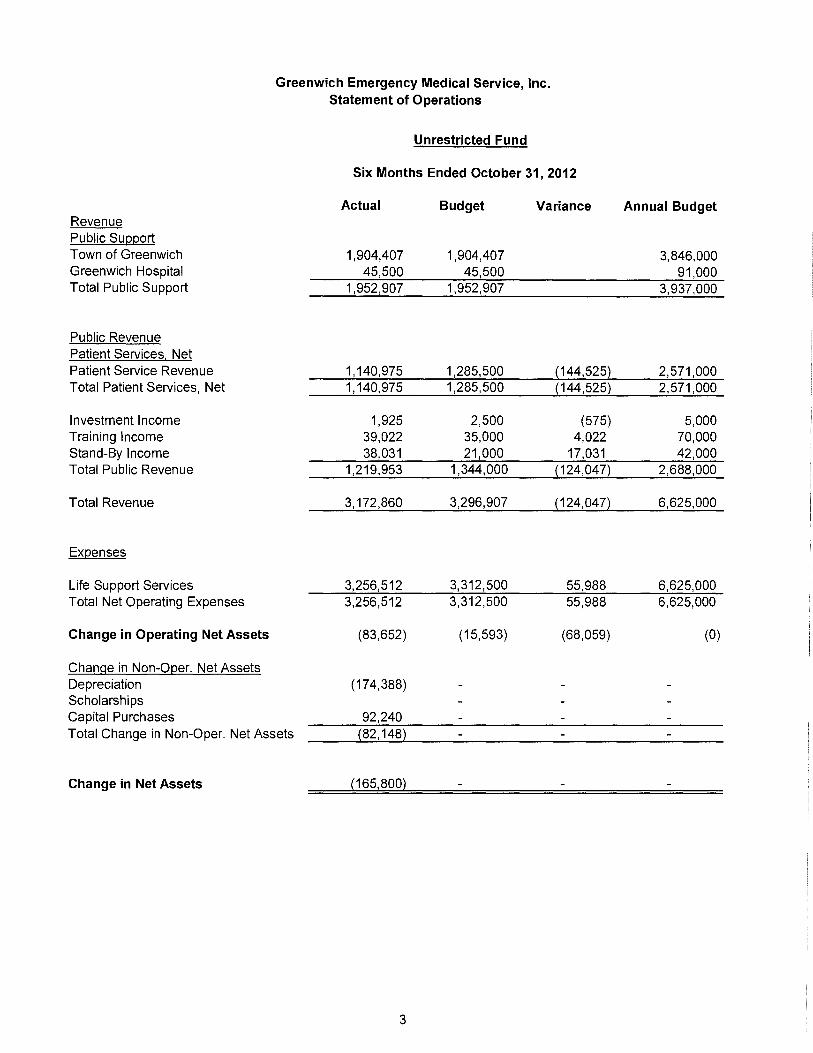
Greenwich Emergency Medical Service, Inc.
Revenue Public Support Town of Greenwich Greenwich Hospital Total Public Support
Public Revenue Patient Services. Net Patient Service Revenue Total Patient Services, Net
Investment I nco me Training Income Stand-By Income Total Public Revenue
Total Revenue
Expenses
Life Support Services Total Net Operating Expenses
Change in Operating Net Assets
Change in Non-Oper. Net Assets Depreciation Scholarships Capital Purchases Total Change in Non-Oper. Net Assets
Change in Net Assets
Statement of Operations
Unrestricted Fund
Six Months Ended October 31, 2012
Actual
1,904,407 45,500
1,952,907
1,140,975 1,140,975
1,925 39,022 38,031
1,219,953
3,172,860
3,256,512 3,256,512
(83,652)
(174,388)
92,240 (82, 148)
(165,800)
3
Budget
1,904,407 45,500
1,952,907
1,285,500 1,285,500
2,500 35,000 21,000
1,344,000
3,296,907
3,312,500 3,312,500
(15,593)
Variance
(144,525) (144,525)
(575) 4,022
17,031 (124,047)
(124,047)
55,988 55,988
(68,059)
Annual Budget
3,846,000 91,000
3,937,000
2,571,000 2,571,000
5,000 70,000 42,000
2,688,000
6,625,000
6,625,000 6,625,000
(0)

Greenwich Emergency Medical Service, Inc. Statement of Functional Expenses
Actual Budgeted Total Actual 6 Months 6 Months Fiscal Year 12 Months 10/31/2012 10/31/2012 Budget 4/30/2012
Life Su!;n~ort Services Salaries & Wages 1,904,868 1,961,850 3,923,700 3,804,931 Employee Benefits 477,004 436,000 872,000 923,218 Payroll Taxes 144,298 150,800 301,600 291,552 Workers Compensation I Safety 118,801 130,000 260,000 266,746 Total Personnel Related Expenses 2,644,970 2,678,650 5,357,300 5,286,447
Professional Fees 12,962 18,000 36,000 29,720 Office Expenses 21,590 27,000 54,000 50,580 Rent 110,865 113,000 226,000 219,091 Telephone 10,305 13,000 26,000 20,728 Utilities 2,547 9,500 19,000 12,198 Insurance 47,424 43,700 87,400 81,332 Fuel 30,388 38,650 77,300 64,821
Repairs & Maint. -Vehicles 37,273 34,300 68,600 104,150 Repairs & Maint.- Other 61,334 65,500 131,000 105,554 Medical Supplies 20,497 26,350 52,700 56,012 Uniforms 14,671 10,900 21,800 18,686 Training 37,295 28,700 57,400 63,712 Membership & Licenses 2,773 3,000 6,000 7,834 Public Ed/Promotional Events 33,326 19,150 38,300 35,659 Provision for Bad Debt 124,191 133,750 267,500 245,979 Collection Fees 5,836 8,500 17,000 14,605 Capital Fundraising Expenses 10,980 12,600 25,200 23,259 Bank Charges 5,453 6,250 12,500 11,442 Continuing Education/Seminars 3,987 7,000 14,000 23,269 Grant- Community CPR 4,507 1,551 Misc. & Contingency 13,339 15,000 30,000 18,043 Total Other Expenses 611,542 633,850 1,267,700 1,208,225
Total Functional Expenses 3,256,512 3,312,500 6,625,000 6,494,672
Other Expenses: Scholarships 3,500 3,000 Depreciation 174,388 174,388 348,780 380,073
Total of All Expenses 3,434,400 3,486,888 6,973,780 6,877,745
4

Greenwich Emergency Medical Service, Inc. Patient Receivable Analysis
Gross A/R Sent to Gross A/R Allow. Period Beginning Gross Contractual Collection/ Ending Doubtful Net Gross Net Months Ended Balance Charges Adjustments Payments Write-Offs Balance Accounts Receivables Coli. % Coli. % Charges AR
May 08-July'08 521,128 793,155 196,212 469,308 61,275 587,488 82,493 504,995 59 79 2.54 Aug'08-0ct'08 587,488 686,464 146,254 530,432 63,168 534,099 83,379 450,720 77 98 2.50 Nov'08-Jan'09 534,099 749,812 177,602 470,585 59,744 575,980 90,161 485,819 63 82 2.55 Feb'09-Apr'09 575,980 704,075 212,157 503,124 56,789 507,985 91,246 416,739 71 102 2.54 May '09-July'09 507,985 770,081 178,880 456,685 67,700 574,801 93,834 479,600 59 77 2.43 Aug '09-0ct'09 574,801 802,067 222,267 537,075 63,387 554,139 99,275 453,497 67 93 2.35 Nov '09 -Jan'10 554,139 788,323 185,306 450,891 62,994 643,271 107,508 533,392 57 75 2.65 Feb'10- April'10 643,271 803,269 245,286 526,028 62,393 612,832 110,924 501,908 65 94 2.70 May'10 - July'10 612,832 912,406 264,037 488,037 72,755 700,409 116,217 584,193 53 75 2.70 Aug'10 - Oct'10 700,409 874,937 265,091 529,656 70,012 710,587 121,010 589,577 61 87 2.90 Nov'10 - Jan'11 710,587 866,697 284,627 511,470 61,488 719,700 129,952 589,748 59 88 3.04 Feb'11 -Apr '11 719,700 790,442 292,650 494,784 48,503 674,205 132,519 541,686 63 99 3.26 May'11 - July'11 674,205 931,815 294,042 555,085 65,098 691,574 143,309 548,265 60 87 2.58 Aug'11 - Oct'11 691,574 834,788 280,775 501,018 54,530 690,039 154,321 535,718 60 90 2.90 Nov'11 - Jan'12 690,039 846,004 312,629 496,179 69,584 657,651 146,787 510,864 59 93 2.87 Feb'12- Apr'12 657,651 776,365 266,370 457,908 63,991 646,698 142,611 504,086 59 90 2.97 May'12 - July'12 646,698 891,905 300,043 474,488 68,296 695,777 143,837 551,940 53 80 2.80 Aug'12 - Oct'12 695,777 875,222 308,372 526,648 68,101 667,878 142,589 525,289 60 93 2.78
5

Town Of Greenwich Request Form For Budget Adjustments
BET Meeting Date: 11--D_e_c-_12--t
Application #: PR 3 ...._ ___ ... Department & Division: P&R
Action Requested: Additional Appropriation
Date of Submission: December 12, 2012
Fund Dept Object Project Desc Amount
To: z 809 59840 TBD Storm - Grn Point 844,750.00
z 809 59840 TBD Storm - Grass Island 91,700.00
z 809 59840 TBD Storm - Island Beach 1,307,100
z 809 59840 TBD Storm - Great Captain Island 674,600
z 809 59840 TBD Storm - Byram Marina 163,600
From: Capital Non Recurring 3,081,750.00
Justification of Request:
Estimated cost for the repair of town infrastructure damaged by Super Storm Sandy.
A comprehensive report containing details of specific damages along with estimated cost of repairs can be found in the three attached PDF files.
-..........£.
Board Chairman Department Head: \...: -Certified correct as to computations and amounts shows as appropriations to £."andJunencumbered balances, with any changes given. U . . Date: Comptroller:
The following action was taken at a meeting of the Board of Estimate and Taxation held on: Vote Clerk of the Board:
Email this form as a PDF along with any supporting documentation (in PDF Format)

Storm Damage Assessment & Opinion of Probable Repair
Cost Report
Prepared for: Town of Greenwich
Parks & Recreation Department Greenwich, CT
XX/XX/XX
Prepared By:
611 Access Road Stratford, CT 06615
Tel 203-377-0663 Fax 203-375-6561
www.racellc.co
Project No. 2012125 ST
OR
M D
AM
AG
E A
SS
ES
SM
EN
T &
OP
C R
EP
OR
T

ROBERGE ASSOCIATES COASTAL ENGINEERS, LLC
TABLE OF CONTENTS
1.0 STORM DAMAGE ASSESSMENT SUMMARY
2.0 GREENWICH POINT
2.1 Damage Summary Table
2.2 Opinion of Probable Cost Tables
2.3 Aerial Photograph with Damage Locations
2.4 Representative Photographs
3.0 GRASS ISLAND
3.1 Damage Summary Table
3.2 Opinion of Probable Cost Tables
3.3 Aerial Photograph with Damage Locations
3.4 Representative Photographs
4.0 ISLAND BEACH
4.1 Damage Summary Table
4.2 Opinion of Probable Cost Tables
4.3 Aerial Photograph with Damage Locations
4.4 Representative Photographs
5.0 GREAT CAPTAINS ISLAND
5.1 Damage Summary Table
5.2 Opinion of Probable Cost Tables
5.3 Aerial Photograph with Damage Locations
5.4 Representative Photographs
6.0 BYRAM MARINA
6.1 Damage Summary Table
6.2 Opinion of Probable Cost Tables
6.3 Aerial Photograph with Damage Locations
6.4 Representative Photographs

Town of Greenwich Marine Facility Storm Damage Assessment
ROBERGE ASSOCIATES COASTAL ENGINEERS, LLC
SECTION 1.0
Storm Damage Summary

Opinion of Probable Costs ‐ Summary Table
Project Information
Project Name:
TOG Storm Damage ‐ Marine
Facilities
Project Number: 2012125
Project Location: Greenwich, CT
Client: Town of Greenwich
Prepared By: D. Santa
Date: December 5, 2012
Cost Criteria
Project Manager 1.0%
General Conditions Varies (see OPC tables)
City Cost Index for Crew & Equipment 1.263
City Cost Index for Materials (see note 6) 1.000
Profit (on mat'ls and equip., see note 3 for profit on labor) 10.0%
Inflation 0.0%
Contingency 10.0%
Sales Tax on Materials 6.35%
Sales Tax on Labor (new construction only) 0.00%
Assumptions
1. Unrestricted site access with no disruptions
2. 2012 US Dollars
3. Standard Union Labor Rates Including O&P per RS Means adjusted for region.
4. Equipment Rates includes Profit only per RS Means adjusted for region.
5. City Cost Index for Crew per RS Means
6. City Cost Index = 1.0 for Materials provided by local supplier.y p y pp
MARINE FACILITIES SUMMARY TABLE
OPC Summary by Site
Greenwich Point 844,750$
Grass Island 91,700$
Island Beach 1,307,100$
Great Captains Island 674,600$
Byram Marina 163,600$ Total OPC 3,081,750$
ROBERGE ASSOCIATES COASTAL ENGINEERS, LLC
Town of Greenwich Marine Facility Storm Damage Assessment
ROBERGE ASSOCIATES COASTAL ENGINEERS, LLC
SECTION 2.0
Greenwich Point
Town of Greenwich Marine Facility Storm Damage Assessment
ROBERGE ASSOCIATES COASTAL ENGINEERS, LLC
SECTION 2.1
Greenwich Point Damage Summary Table
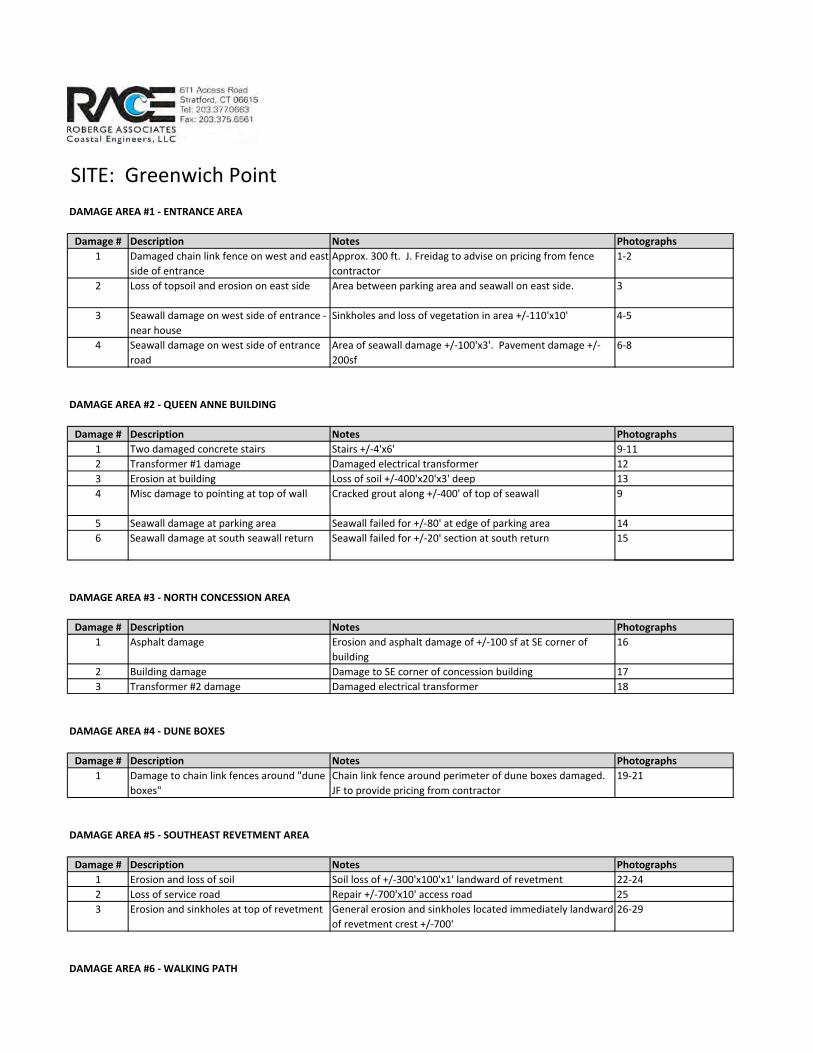
SITE: Greenwich Point
DAMAGE AREA #1 ‐ ENTRANCE AREA
Damage # Description Notes Photographs
1 Damaged chain link fence on west and east
side of entrance
Approx. 300 ft. J. Freidag to advise on pricing from fence
contractor
1‐2
2 Loss of topsoil and erosion on east side Area between parking area and seawall on east side. 3
3 Seawall damage on west side of entrance ‐
near house
Sinkholes and loss of vegetation in area +/‐110'x10' 4‐5
4 Seawall damage on west side of entrance
road
Area of seawall damage +/‐100'x3'. Pavement damage +/‐
200sf
6‐8
DAMAGE AREA #2 ‐ QUEEN ANNE BUILDING
Damage # Description Notes Photographs
1 Two damaged concrete stairs Stairs +/‐4'x6' 9‐11
2 Transformer #1 damage Damaged electrical transformer 12
3 Erosion at building Loss of soil +/‐400'x20'x3' deep 13
4 Misc damage to pointing at top of wall Cracked grout along +/‐400' of top of seawall 9
5 Seawall damage at parking area Seawall failed for +/‐80' at edge of parking area 14
6 Seawall damage at south seawall return Seawall failed for +/‐20' section at south return 15
DAMAGE AREA #3 ‐ NORTH CONCESSION AREA
Damage # Description Notes Photographs
1 Asphalt damage Erosion and asphalt damage of +/‐100 sf at SE corner of
building
16
2 Building damage Damage to SE corner of concession building 17
3 Transformer #2 damage Damaged electrical transformer 18
DAMAGE AREA #4 ‐ DUNE BOXES
Damage # Description Notes Photographs
1 Damage to chain link fences around "dune
boxes"
Chain link fence around perimeter of dune boxes damaged.
JF to provide pricing from contractor
19‐21
DAMAGE AREA #5 ‐ SOUTHEAST REVETMENT AREA
Damage # Description Notes Photographs
1 Erosion and loss of soil Soil loss of +/‐300'x100'x1' landward of revetment 22‐24
2 Loss of service road Repair +/‐700'x10' access road 25
3 Erosion and sinkholes at top of revetment General erosion and sinkholes located immediately landward
of revetment crest +/‐700'
26‐29
DAMAGE AREA #6 ‐ WALKING PATH

Damage # Description Notes Photographs
1 Loss of walking path Soil loss on entire walking path. Revetment stones displaced
on to walking path +/2,600' long
30‐35
2 Trees fallen on walking path Two trees fallen over walking path 31
3 Misc. damage to bridges Loose and displaced deck boards and foundation
undermining.
32‐34
DAMAGE AREA #7 ‐ SOUTH OF EAGLE POND
Damage # Description Notes Photographs
1 Seawall failures Minor failures +/‐20'x1' on south side of road
2 Sinkholes at edge of road Area of erosion +/‐40'x4' (already repaired by Town)
3 Erosion / loss of compacted parking area Loss of compacted fill in parking area +/‐150'x20'x6" deep 35
4 Shoreline protection issue Vegetated shoreline destroyed by storm. Sand regraded by
Town but waterward edge not stable. Recommend
reclaiming displaced stone and armoring slope. Approx
length 150'.
36
DAMAGE AREA #8 ‐ SOUTHWEST REVETMENT
Damage # Description Notes Photographs
1 Erosion and sinkholes at top of revetment General erosion and sinkholes located immediately landward
of revetment crest for +/‐1200'.
37
2 Damage to grills Displaced grills in picnic area 38
DAMAGE AREA #9 ‐ ROAD AT WORKSHOP
Damage # Description Notes Photographs
1 Erosion and sinkholes at top of revetment General erosion and sinkholes located immediately landward
of revetment crest for +/‐300'.
39
2 Scour at landward side of road Erosion and vegetation damage for +/‐200' 40
3 Pavement damage Damaged area of roadway +/‐30'x3' 41
4 Diesel tank displaced 300 gallon diesel tank displaced into adjacent pond.
Recovered by TOG Fire Department. Contaminated fuel
needs to be removed from site and tank replaced.
DAMAGE AREA #10 ‐ OLD GREENWICH YACHT CLUB
Damage # Description Notes Photographs
1 Pier damage Pier shifted 3' east, utilities broken 42
2 Non Storm Pier Significant non storm deterioration, replacement in near
future
3 Float anchor piles Broken bolts connecting plumb & batter piles, broken /
damaged pile guides
43
4 Gangway Damage to rivets 44
5 Kayak Racks Damaged 45
DAMAGE AREA #11 ‐ CAUSEWAY NORTH OF EAGLE POND
Damage # Description Notes Photographs
1 Sink Holes 2 Sinkholes on roadway 46
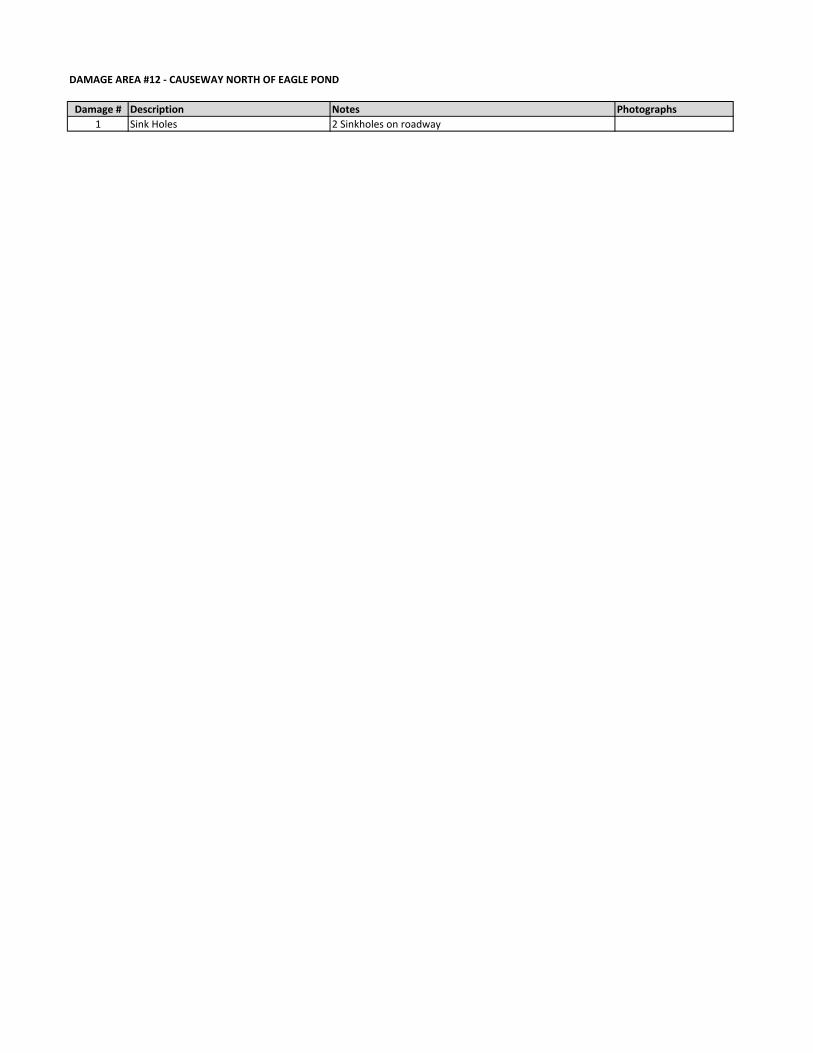
DAMAGE AREA #12 ‐ CAUSEWAY NORTH OF EAGLE POND
Damage # Description Notes Photographs
1 Sink Holes 2 Sinkholes on roadway

Town of Greenwich Marine Facility Storm Damage Assessment
ROBERGE ASSOCIATES COASTAL ENGINEERS, LLC
SECTION 2.2
Greenwich Point Opinion of Probable Cost Tables

Opinion of Probable Costs
Project Information
Project Name: TOG Storm Damage ‐ Greenwich Point Site
Project Number: 2012125
Project Location: Greenwich, CT
Client: Town of Greenwich
Prepared By: D. Santa
Date: December 4, 2012
Cost Criteria
Project Manager 1.0%
General Conditions 10.0%
City Cost Index for Crew & Equipment 1.263
City Cost Index for Materials (see note 6) 1.000
Profit (on mat'ls and equip., see note 3 for profit on labor) 10.0%
Inflation 0.0%
Contingency 10.0%
Sales Tax on Materials 6.35%
Sales Tax on Labor (new construction only) 0.00%
Assumptions
1. Unrestricted site access with no disruptions
2. 2012 US Dollars
3. Standard Union Labor Rates Including O&P per RS Means adjusted for region.
4. Equipment Rates includes Profit only per RS Means adjusted for region.
5. City Cost Index for Crew per RS Means
6. City Cost Index = 1.0 for Materials provided by local supplier.
Summary of Costs
Professional Engineering Services 40,000$
Building Permit Fee ‐$
Mobilization & Demobilization 19,800$
Post Storm Site Clean Up (obtain from Town of Greenwich) 30,250$
Damage Area #1 ‐ Entrance Area 57,600$
Damage Area #2 ‐ Queen Anne Building 120,800$
Damage Area #3 ‐ North Concession 32,900$
Damage Area #4 ‐ Dune Boxes 61,200$
Damage Area #5 ‐ Southeast Revetment Area 95,100$
Damage Area #6 ‐ Walking Path 183,400$
Damage Area #7 ‐ South of Eagle Pond 107,800$
Damage Area #8 ‐ Southwest Revetment 26,600$
Damage Area #9 ‐ Road at Workshop 14,800$
Damage Area #10 ‐ Old Greenwich YC 43,700$
Damage Area #11 ‐ Greenwich Point Marina 6,800$
Damage Area #12 ‐ Causeway 4,000$
Total OPC 844,750$
ROBERGE ASSOCIATES COASTAL ENGINEERS, LLC
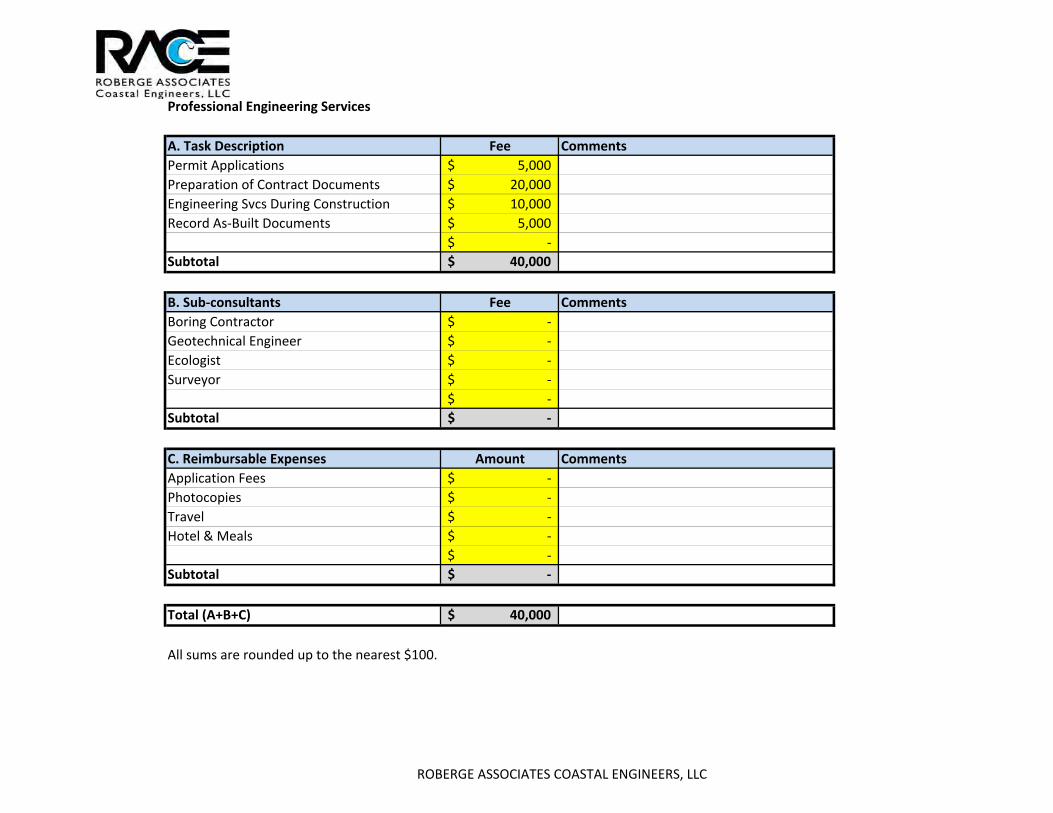
Professional Engineering Services
A. Task Description Fee Comments
Permit Applications 5,000$
Preparation of Contract Documents 20,000$
Engineering Svcs During Construction 10,000$
Record As‐Built Documents 5,000$
‐$
Subtotal 40,000$
B. Sub‐consultants Fee Comments
Boring Contractor ‐$
Geotechnical Engineer ‐$
Ecologist ‐$
Surveyor ‐$
‐$
Subtotal ‐$
C. Reimbursable Expenses Amount Comments
Application Fees ‐$
Photocopies ‐$
Travel ‐$
Hotel & Meals ‐$
‐$
Subtotal ‐$
Total (A+B+C) 40,000$
All sums are rounded up to the nearest $100.
ROBERGE ASSOCIATES COASTAL ENGINEERS, LLC

Mobilization & Demobilization
A. Materials & Products Quantity Units Unit $ Extended $ Comments
Consumables 1 LS 1,000.00$ 1,000$
‐$
‐$ ‐$
Subtotal 1,000$
City Cost Index 1.000 ‐$
Adjusted Cost 1,000$
Profit 10.00% 100$
Subtotal 1,100$
Sales Tax 6.35% 70$ State Sales Tax
Total Material Cost 1,200$
B. Installation Tasks Crew No. of Shifts $ Shift Extended $ Comments
Mobilization N/A N/A 15,000$ Estimate for Mobilization
Subtotal 15,000$
Sales Tax (New Construction Only) 0.00% ‐$
Subtotal 15,000$
C. Subcontractor / Other Quantity Units Unit $ Extended $ Comments
‐$
‐$
Subtotal ‐$
Profit 10.00% ‐$
Subtotal ‐$
Item Totals Total Comments
A+B+C 16,200$
Project Manager 1.0% 162$
General Conditions 10% 1,636$
Inflation 0% ‐$
Contingency 10% 1,800$
Total 19,800$
All sums are rounded up to the nearest $100.
ROBERGE ASSOCIATES COASTAL ENGINEERS, LLC

Damage Area 1 ‐ Entrance Area
A. Materials & Products Quantity Units Unit $ Extended $ Comments
Fill delivered to site 14 cy 35.00$ 490$
Seawall repair material 1 ls 8,000.00$ 8,000$
Repair area 100lf. Assume 50% of material recovered
from exist. Wall
Pavement repair material 1 ls 200.00$ 200$ Repair area 200sf
‐$ ‐$
‐$ ‐$
Subtotal 8,690$
City Cost Index 1.000 ‐$
Adjusted Cost 8,690$
Profit 10.00% 869$
Subtotal 9,559$
Sales Tax 6.35% 607$ State Sales Tax
Total Material Cost 10,200$
B. Installation Tasks Crew No. of Shifts $ Shift Extended $ Comments
Add fill and grade 1 2.0 2,519.18$ 5,038$ Fill on east and west side of entrance
Repair seawall damage 2 15.0 1,216.02$ 18,240$ 100' damaged section of seawall
Pavement repair 3 0.5 5,151.02$ 2,576$ 200sf damaged pavement area
‐$
‐$
Subtotal 25,854$
Sales Tax (New Construction Only) 0.00% ‐$
Subtotal 25,900$
C. Subcontractor / Other Quantity Units Unit $ Extended $ Comments
Replace 300' of damaged fence 1 LS 11,000.00$ 11,000$ Estimate from J. Freidag
‐$
Subtotal 11,000$
Profit 0.00% ‐$
Subtotal 11,000$
Item Totals Total Comments
A+B+C 47,100$
Project Manager 1.0% 471$
General Conditions 10% 4,757$
Inflation 0% ‐$
Contingency 10% 5,233$
Total 57,600$
All sums are rounded up to the nearest $100.
ROBERGE ASSOCIATES COASTAL ENGINEERS, LLC

Damage Area #2 ‐ Queen Anne Building
A. Materials & Products Quantity Units Unit $ Extended $ Comments
Concrete 10 cy 177.00$ 1,770$ Replace beach access stairs
Fill 900 cy 35.00$ 31,500$ Fill in front of Queen Anne Building
Seawall materials 1 ls 500.00$ 500$ Repair top of seawall
‐$
‐$ ‐$
Subtotal 33,770$
City Cost Index 1.000 ‐$
Adjusted Cost 33,770$
Profit 10.00% 3,377$
Subtotal 37,147$
Sales Tax 6.35% 2,359$ State Sales Tax
Total Material Cost 39,600$
B. Installation Tasks Crew No. of Shifts $ Shift Extended $ Comments
Demo stairs 4 0.5 3,050.04$ 1,525$ Demo and remove two beach access stairs
Construct stairs 5 2.0 2,715.12$ 5,430$ Form and construct two beach access stairs
Backfill and grade at building 1 2.0 2,519.18$ 5,038$ Backfill scour area +/‐400'x20'x3'
Misc pointing to top of seawall 2 3.0 1,216.02$ 3,648$ Repair damage to top of seawall adjacent to Queen Anne building
‐$
‐$
‐$
Subtotal 15,642$
Sales Tax (New Construction Only) 0.00% ‐$
Subtotal 15,700$
C. Subcontractor / Other Quantity Units Unit $ Extended $ Comments
Transformer Damage 1 ls 43,500.00$ 43,500$ Fix damage to Transformers #1 and #2 including replacing transformers,
testing, running new cable, new splice chamber. Price from J. Friedag.
‐$
Subtotal 43,500$
Profit 0.00% ‐$
Subtotal 43,500$
Item Totals Total Comments
A+B+C 98,800$
Project Manager 1.0% 988$
General Conditions 10% 9,979$
Inflation 0% ‐$
Contingency 10% 10,977$
Total 120,800$
All sums are rounded up to the nearest $100.
ROBERGE ASSOCIATES COASTAL ENGINEERS, LLC
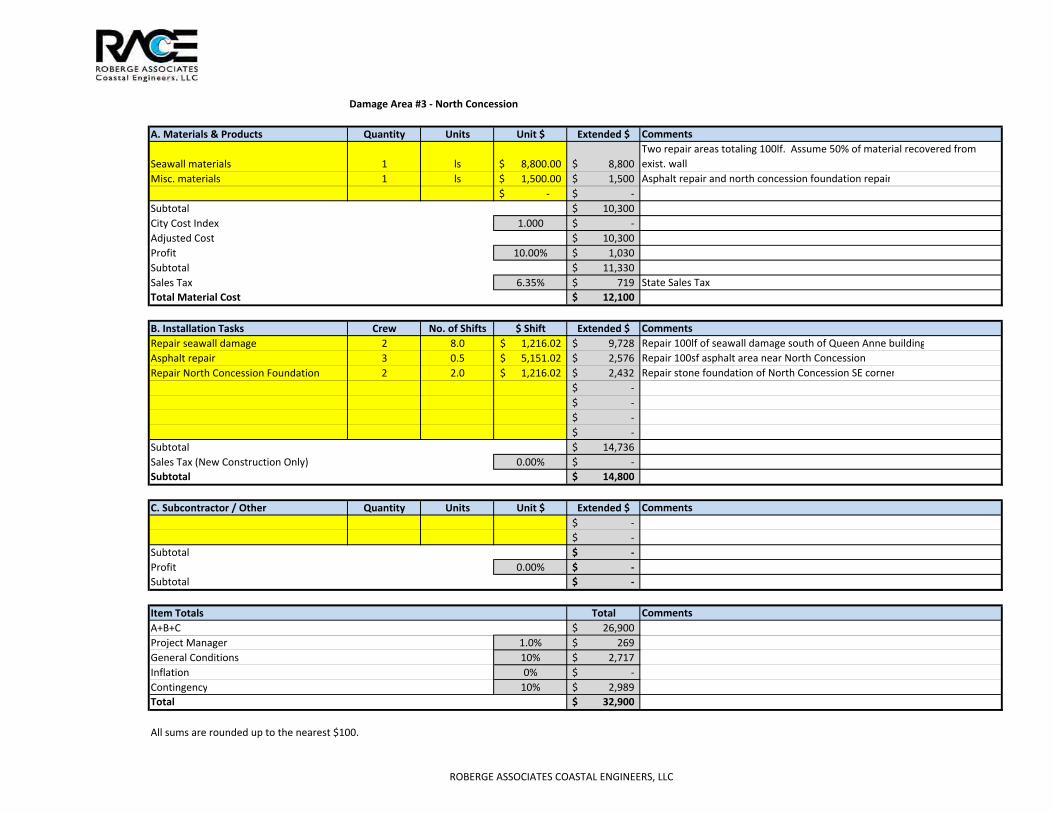
Damage Area #3 ‐ North Concession
A. Materials & Products Quantity Units Unit $ Extended $ Comments
Seawall materials 1 ls 8,800.00$ 8,800$
Two repair areas totaling 100lf. Assume 50% of material recovered from
exist. wall
Misc. materials 1 ls 1,500.00$ 1,500$ Asphalt repair and north concession foundation repair
‐$ ‐$
Subtotal 10,300$
City Cost Index 1.000 ‐$
Adjusted Cost 10,300$
Profit 10.00% 1,030$
Subtotal 11,330$
Sales Tax 6.35% 719$ State Sales Tax
Total Material Cost 12,100$
B. Installation Tasks Crew No. of Shifts $ Shift Extended $ Comments
Repair seawall damage 2 8.0 1,216.02$ 9,728$ Repair 100lf of seawall damage south of Queen Anne building
Asphalt repair 3 0.5 5,151.02$ 2,576$ Repair 100sf asphalt area near North Concession
Repair North Concession Foundation 2 2.0 1,216.02$ 2,432$ Repair stone foundation of North Concession SE corner
‐$
‐$
‐$
‐$
Subtotal 14,736$
Sales Tax (New Construction Only) 0.00% ‐$
Subtotal 14,800$
C. Subcontractor / Other Quantity Units Unit $ Extended $ Comments
‐$
‐$
Subtotal ‐$
Profit 0.00% ‐$
Subtotal ‐$
Item Totals Total Comments
A+B+C 26,900$
Project Manager 1.0% 269$
General Conditions 10% 2,717$
Inflation 0% ‐$
Contingency 10% 2,989$
Total 32,900$
All sums are rounded up to the nearest $100.
ROBERGE ASSOCIATES COASTAL ENGINEERS, LLC

Damage Area #4 ‐ Dune Boxes
A. Materials & Products Quantity Units Unit $ Extended $ Comments
‐$ ‐$
‐$ ‐$
‐$ ‐$
‐$ ‐$
‐$ ‐$
Subtotal ‐$
City Cost Index 1.000 ‐$
Adjusted Cost ‐$
Profit 10.00% ‐$
Subtotal ‐$
Sales Tax 6.35% ‐$ State Sales Tax
Total Material Cost ‐$
B. Installation Tasks Crew No. of Shifts $ Shift Extended $ Comments
‐$
‐$
‐$
‐$
‐$
Subtotal ‐$
Sales Tax (New Construction Only) 0.00% ‐$
Subtotal ‐$
C. Subcontractor / Other Quantity Units Unit $ Extended $ Comments
Replace fence 1 ls 50,000.00$ 50,000$
Remove damaged fence and replace around dune boxes.
Price per J. Freidag.
‐$
Subtotal 50,000$
Profit ‐$
Subtotal 50,000$
Item Totals Total Comments
A+B+C 50,000$
Project Manager 1.0% 500$
General Conditions 10% 5,050$
Inflation 0% ‐$
Contingency 10% 5,555$
Total 61,200$
All sums are rounded up to the nearest $100.
ROBERGE ASSOCIATES COASTAL ENGINEERS, LLC

Damage Area #5 ‐ Southeast Revetment Area
A. Materials & Products Quantity Units Unit $ Extended $ Comments
Fill delivered to site 1400 cy 35.00$ 49,000$ Fill material for areas landward of revetment
Misc. materials (incl. geotextile fabric) 1 ls 2,000.00$ 2,000$
‐$ ‐$
Subtotal 51,000$
City Cost Index 1.000 ‐$
Adjusted Cost 51,000$
Profit 10.00% 5,100$
Subtotal 56,100$
Sales Tax 6.35% 3,562$ State Sales Tax
Total Material Cost 59,700$
B. Installation Tasks Crew No. of Shifts $ Shift Extended $ Comments
Fill and grade (general) 1 5.0 2,519.18$ 12,596$ Fill and grade sinkholes at top of revetment and eroded areas
Fill and grade (service road) 1 1.5 2,519.18$ 3,779$ Fill and grade 12" of fill on +/‐700' x 10' service road
Compact service road 6 1.0 1,697.83$ 1,698$ Compact material on service road
‐$
‐$
‐$
‐$
Subtotal 18,072$
Sales Tax (New Construction Only) 0.00% ‐$
Subtotal 18,100$
C. Subcontractor / Other Quantity Units Unit $ Extended $ Comments
‐$
‐$
Subtotal ‐$
Profit 0.00% ‐$
Subtotal ‐$
Item Totals Total Comments
A+B+C 77,800$
Project Manager 1.0% 778$
General Conditions 10% 7,858$
Inflation 0% ‐$
Contingency 10% 8,644$
Total 95,100$
All sums are rounded up to the nearest $100.
ROBERGE ASSOCIATES COASTAL ENGINEERS, LLC

Damage Area #6 ‐ Walking Path
A. Materials & Products Quantity Units Unit $ Extended $ Comments
Fill delivered to site 1500 cy 35.00$ 52,500$ Fill material for walking path
Geotextile fabric 3 sy 2,000.00$ 6,000$
Misc. materials 1 ls 2,000.00$ 2,000$ Includes misc. material for bridge repairs
Subtotal 60,500$
City Cost Index 1.000 ‐$
Adjusted Cost 60,500$
Profit 10.00% 6,050$
Subtotal 66,550$
Sales Tax 6.35% 4,226$ State Sales Tax
Total Material Cost 70,800$
B. Installation Tasks Crew No. of Shifts $ Shift Extended $ Comments
Site preparation
1 10.0 2,519.18$ 25,192$ Remove/reset displaced revetment stone. Clear trees. Place geotextile
Place fill for path 1 15.0 2,519.18$ 37,788$ Fill path +/‐2550 long, 6' wide to a depth of 2.5'
Compact fill 6 6.0 1,697.83$ 10,187$ Compact material on service road
Misc bridge repairs 7 5.0 1,202.88$ 6,014$
‐$
‐$
‐$
Subtotal 79,181$
Sales Tax (New Construction Only) 0.00% ‐$
Subtotal 79,200$
C. Subcontractor / Other Quantity Units Unit $ Extended $ Comments
‐$
‐$
Subtotal ‐$
Profit 0.00% ‐$
Subtotal ‐$
Item Totals Total Comments
A+B+C 150,000$
Project Manager 1.0% 1,500$
General Conditions 10% 15,150$
Inflation 0% ‐$
Contingency 10% 16,665$
Total 183,400$
All sums are rounded up to the nearest $100.
ROBERGE ASSOCIATES COASTAL ENGINEERS, LLC

Damage Area #7 ‐ South of Eagle Pond
A. Materials & Products Quantity Units Unit $ Extended $ Comments
Fill delivered to site 60 cy 35.00$ 2,100$ Fill material for parking area
Geotextile fabric 1 ls 1,500.00$ 1,500$
Seawall repair materials 1 ls 1,000.00$ 1,000$
Revetment armor stone 1 ls 35,000.00$ 35,000$
Subtotal 39,600$
City Cost Index 1.000 ‐$
Adjusted Cost 39,600$
Profit 10.00% 3,960$
Subtotal 43,560$
Sales Tax 6.35% 2,766$ State Sales Tax
Total Material Cost 46,400$
B. Installation Tasks Crew No. of Shifts $ Shift Extended $ Comments
Seawall repair 2 2.0 1,216.02$ 2,432$ Repair 20' section of seawall
Place fill in parking area 1 2.0 2,519.18$ 5,038$ Repair of 150'x20' parking area
Compact fill 6 1.0 1,697.83$ 1,698$
Install revetment in area of eroded slope 8 15.0 2,173.77$ 32,607$
‐$
‐$
‐$
Subtotal 41,775$
Sales Tax (New Construction Only) 0.00% ‐$
Subtotal 41,800$
C. Subcontractor / Other Quantity Units Unit $ Extended $ Comments
‐$
‐$
Subtotal ‐$
Profit 0.00% ‐$
Subtotal ‐$
Item Totals Total Comments
A+B+C 88,200$
Project Manager 1.0% 882$
General Conditions 10% 8,908$
Inflation 0% ‐$
Contingency 10% 9,799$
Total 107,800$
All sums are rounded up to the nearest $100.
ROBERGE ASSOCIATES COASTAL ENGINEERS, LLC

Damage Area #8 ‐ Southwest Revetment
A. Materials & Products Quantity Units Unit $ Extended $ Comments
Fill delivered to site 200 cy 35.00$ 7,000$ Fill material for voids at crest of revetment
Geotextile fabric 1 ls 1,000.00$ 1,000$
Replacement grills 5 ea 300.00$ 1,500$
Misc materials 1 ls 500.00$ 500$
‐$
Subtotal 10,000$
City Cost Index 1.000 ‐$
Adjusted Cost 10,000$
Profit 10.00% 1,000$
Subtotal 11,000$
Sales Tax 6.35% 699$ State Sales Tax
Total Material Cost 11,700$
B. Installation Tasks Crew No. of Shifts $ Shift Extended $ Comments
Fill eroded area at top of revetment 1 3.0 2,519.18$ 7,558$ Fill +/‐1200' length of voids behind revetment
Install replacement grills 7 2.0 1,202.88$ 2,406$ Repair of 150'x20' parking area
‐$
‐$
‐$
‐$
‐$
Subtotal 9,963$
Sales Tax (New Construction Only) 0.00% ‐$
Subtotal 10,000$
C. Subcontractor / Other Quantity Units Unit $ Extended $ Comments
‐$
‐$
Subtotal ‐$
Profit 0.00% ‐$
Subtotal ‐$
Item Totals Total Comments
A+B+C 21,700$
Project Manager 1.0% 217$
General Conditions 10% 2,192$
Inflation 0% ‐$
Contingency 10% 2,411$
Total 26,600$
All sums are rounded up to the nearest $100.
ROBERGE ASSOCIATES COASTAL ENGINEERS, LLC
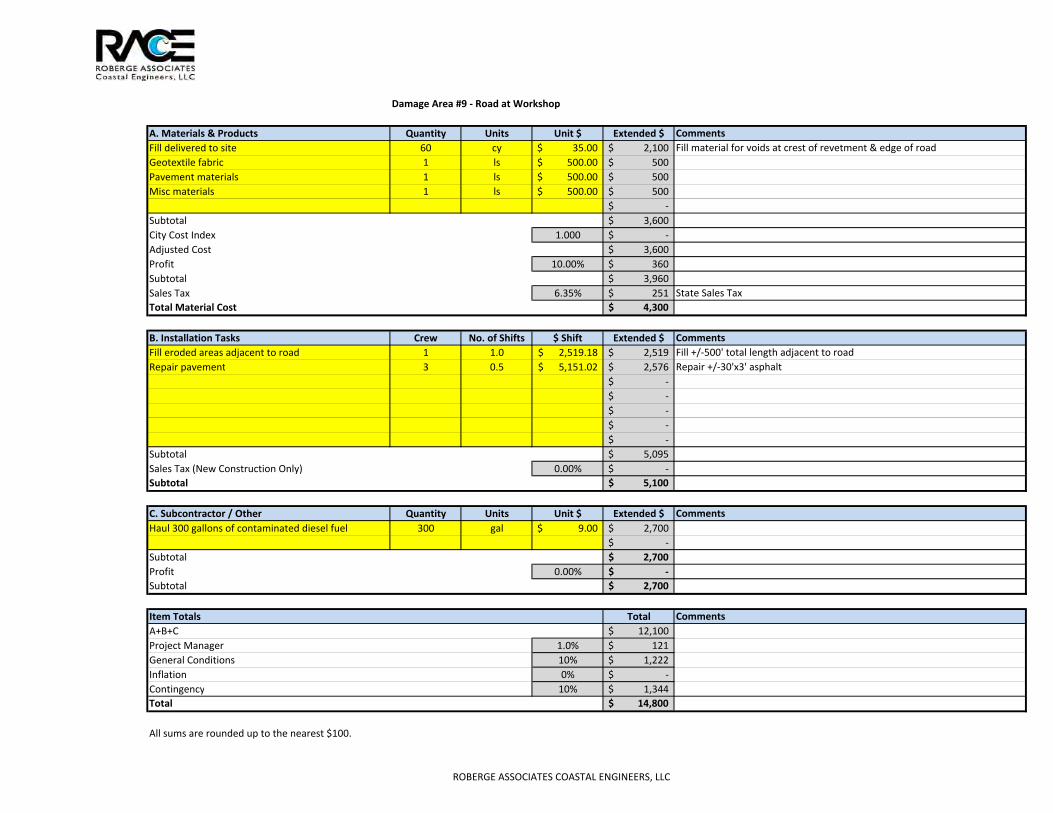
Damage Area #9 ‐ Road at Workshop
A. Materials & Products Quantity Units Unit $ Extended $ Comments
Fill delivered to site 60 cy 35.00$ 2,100$ Fill material for voids at crest of revetment & edge of road
Geotextile fabric 1 ls 500.00$ 500$
Pavement materials 1 ls 500.00$ 500$
Misc materials 1 ls 500.00$ 500$
‐$
Subtotal 3,600$
City Cost Index 1.000 ‐$
Adjusted Cost 3,600$
Profit 10.00% 360$
Subtotal 3,960$
Sales Tax 6.35% 251$ State Sales Tax
Total Material Cost 4,300$
B. Installation Tasks Crew No. of Shifts $ Shift Extended $ Comments
Fill eroded areas adjacent to road 1 1.0 2,519.18$ 2,519$ Fill +/‐500' total length adjacent to road
Repair pavement 3 0.5 5,151.02$ 2,576$ Repair +/‐30'x3' asphalt
‐$
‐$
‐$
‐$
‐$
Subtotal 5,095$
Sales Tax (New Construction Only) 0.00% ‐$
Subtotal 5,100$
C. Subcontractor / Other Quantity Units Unit $ Extended $ Comments
Haul 300 gallons of contaminated diesel fuel 300 gal 9.00$ 2,700$
‐$
Subtotal 2,700$
Profit 0.00% ‐$
Subtotal 2,700$
Item Totals Total Comments
A+B+C 12,100$
Project Manager 1.0% 121$
General Conditions 10% 1,222$
Inflation 0% ‐$
Contingency 10% 1,344$
Total 14,800$
All sums are rounded up to the nearest $100.
ROBERGE ASSOCIATES COASTAL ENGINEERS, LLC

Damage Area #10 ‐ Old Greenwich Yacht Club
A. Materials & Products Quantity Units Unit $ Extended $ Comments
Misc materials 1 ls 4,000.00$ 4,000$ Hardware, pile guides, utilities, kayak racks, etc
‐$
‐$
‐$
‐$
Subtotal 4,000$
City Cost Index 1.000 ‐$
Adjusted Cost 4,000$
Profit 10.00% 400$
Subtotal 4,400$
Sales Tax 6.35% 279$ State Sales Tax
Total Material Cost 4,700$
B. Installation Tasks Crew No. of Shifts $ Shift Extended $ Comments
Repair damage to OGYC piers and docks 9 10.0 2,187.26$ 21,873$ Reset and secure pier to foundation, replace pile guides, repair batter pile
bolted connections.
Repair utilities 10 3.0 1,423.91$ 4,272$ Misc repair to utilities
Repair kayak racks 7 4.0 1,202.88$ 4,812$ Repair damaged kayak racks
‐$
‐$
‐$
‐$
Subtotal 30,956$
Sales Tax (New Construction Only) 0.00% ‐$
Subtotal 31,000$
C. Subcontractor / Other Quantity Units Unit $ Extended $ Comments
‐$
‐$
Subtotal ‐$
Profit 0.00% ‐$
Subtotal ‐$
Item Totals Total Comments
A+B+C 35,700$
Project Manager 1.0% 357$
General Conditions 10% 3,606$
Inflation 0% ‐$
Contingency 10% 3,966$
Total 43,700$
All sums are rounded up to the nearest $100.
ROBERGE ASSOCIATES COASTAL ENGINEERS, LLC

Damage Area #11 ‐ Greenwich Point Marina
A. Materials & Products Quantity Units Unit $ Extended $ Comments
‐$
‐$
‐$
‐$
‐$
Subtotal ‐$
City Cost Index 1.000 ‐$
Adjusted Cost ‐$
Profit 10.00% ‐$
Subtotal ‐$
Sales Tax 6.35% ‐$ State Sales Tax
Total Material Cost ‐$
B. Installation Tasks Crew No. of Shifts $ Shift Extended $ Comments
‐$
‐$
‐$
‐$
‐$
‐$
Subtotal ‐$
Sales Tax (New Construction Only) 0.00% ‐$
Subtotal ‐$
C. Subcontractor / Other Quantity Units Unit $ Extended $ Comments
Replace damaged fence 1 ls 5,500.00$ 5,500$ Fence around storage area. Price per J. Freidag
‐$
Subtotal 5,500$
Profit 0.00% ‐$
Subtotal 5,500$
Item Totals Total Comments
A+B+C 5,500$
Project Manager 1.0% 55$
General Conditions 10% 556$
Inflation 0% ‐$
Contingency 10% 611$
Total 6,800$
All sums are rounded up to the nearest $100.
ROBERGE ASSOCIATES COASTAL ENGINEERS, LLC

Damage Area #12 ‐ Causeway
A. Materials & Products Quantity Units Unit $ Extended $ Comments
Misc materials (paving repair) 1 ls 500.00$ 500$
‐$
‐$
‐$
‐$
Subtotal 500$
City Cost Index 1.000 ‐$
Adjusted Cost 500$
Profit 10.00% 50$
Subtotal 550$
Sales Tax 6.35% 35$ State Sales Tax
Total Material Cost 600$
B. Installation Tasks Crew No. of Shifts $ Shift Extended $ Comments
Repair sinkholes and pave 3 0.5 5,151.02$ 2,576$
‐$
‐$
‐$
‐$
‐$
Subtotal 2,576$
Sales Tax (New Construction Only) 0.00% ‐$
Subtotal 2,600$
C. Subcontractor / Other Quantity Units Unit $ Extended $ Comments
‐$
‐$
Subtotal ‐$
Profit 0.00% ‐$
Subtotal ‐$
Item Totals Total Comments
A+B+C 3,200$
Project Manager 1.0% 32$
General Conditions 10% 323$
Inflation 0% ‐$
Contingency 10% 356$
Total 4,000$
All sums are rounded up to the nearest $100.
ROBERGE ASSOCIATES COASTAL ENGINEERS, LLC

Crew 1 RS Means B10P ‐ Filling/Rough Grading
A. Labor Bare Cost Incl. O&P
Equipment Operator 46.55$ 70.25$
Laborer (0.5) 17.55$ 27.00$
Subtotal 97.25$
Hours per Shift 8
Total Shift Labor Rate 778.00$
B. Equipment Bare Cost (Daily) Incl. Profit (Daily)
Crawler Loader 3cy 1,106.00$ 1,216.60$
Subtotal 1,216.60$
Adjustment for variable Shift ‐$
Total Shift Equipment Rate 1,216.60$
Total Daily Crew Rate 1,994.60$
City Cost Index 1.263 524.58$
Adjusted Daily Crew Rate 2,519.18$
ROBERGE ASSOCIATES COASTAL ENGINEERS, LLC

Crew 2 RS Means D1 ‐ Minor Seawall Repair
A. Labor Bare Cost Incl. O&P
Bricklayer 44.00$ 66.60$
Bricklayer Helper 35.60$ 53.75$
Subtotal 120.35$
Hours per Shift 8
Total Shift Labor Rate 962.80$
B. Equipment Bare Cost (Daily) Incl. Profit (Daily)
Subtotal ‐$
Adjustment for variable Shift ‐$
Total Shift Equipment Rate ‐$
Total Daily Crew Rate 962.80$
City Cost Index 1.263 253.22$
Adjusted Daily Crew Rate 1,216.02$
ROBERGE ASSOCIATES COASTAL ENGINEERS, LLC
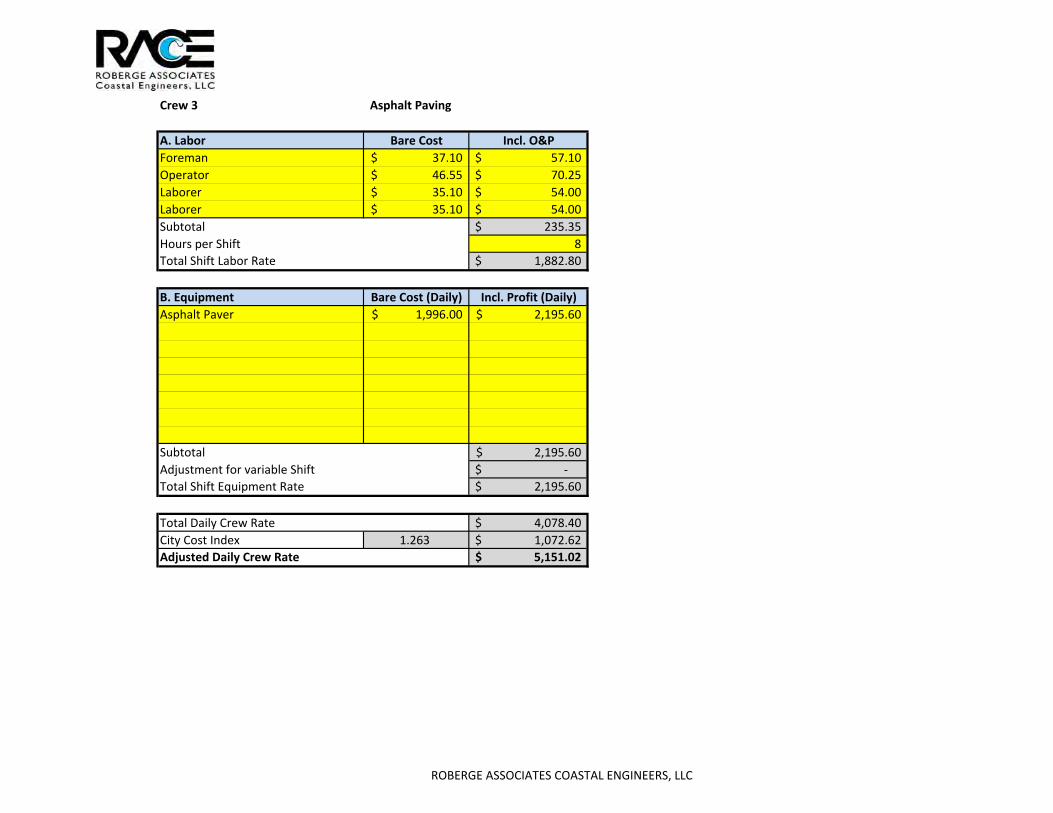
Crew 3 Asphalt Paving
A. Labor Bare Cost Incl. O&P
Foreman 37.10$ 57.10$
Operator 46.55$ 70.25$
Laborer 35.10$ 54.00$
Laborer 35.10$ 54.00$
Subtotal 235.35$
Hours per Shift 8
Total Shift Labor Rate 1,882.80$
B. Equipment Bare Cost (Daily) Incl. Profit (Daily)
Asphalt Paver 1,996.00$ 2,195.60$
Subtotal 2,195.60$
Adjustment for variable Shift ‐$
Total Shift Equipment Rate 2,195.60$
Total Daily Crew Rate 4,078.40$
City Cost Index 1.263 1,072.62$
Adjusted Daily Crew Rate 5,151.02$
ROBERGE ASSOCIATES COASTAL ENGINEERS, LLC
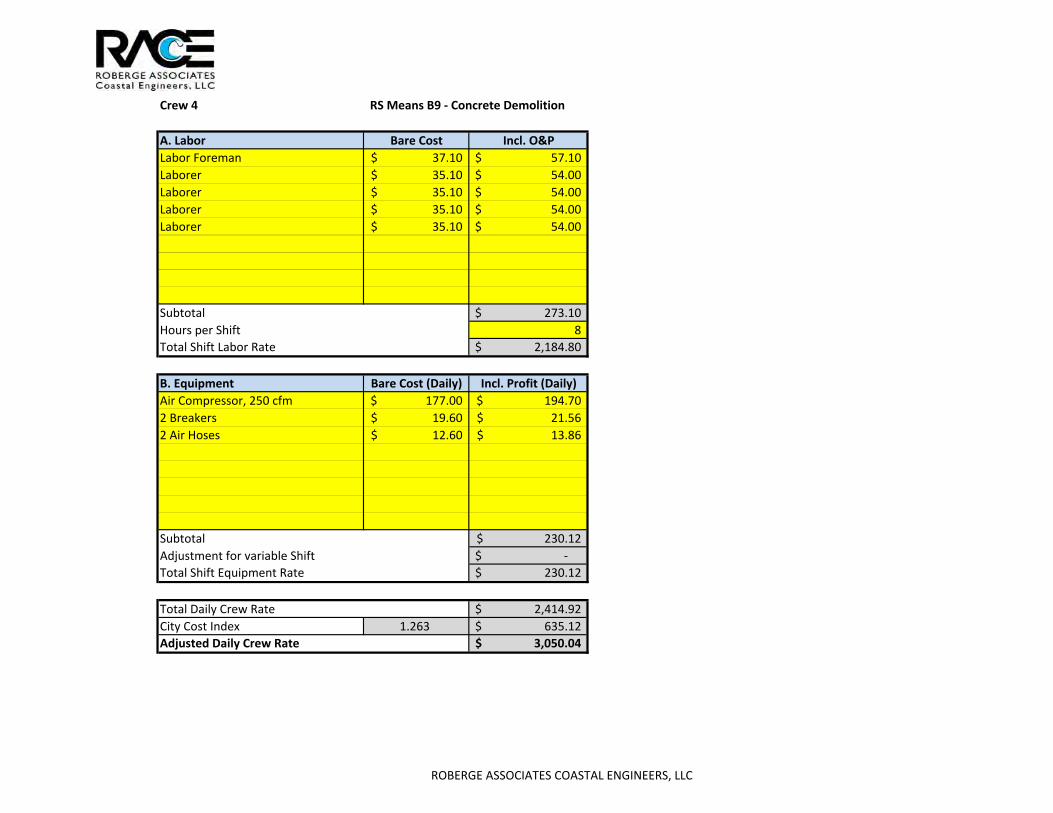
Crew 4 RS Means B9 ‐ Concrete Demolition
A. Labor Bare Cost Incl. O&P
Labor Foreman 37.10$ 57.10$
Laborer 35.10$ 54.00$
Laborer 35.10$ 54.00$
Laborer 35.10$ 54.00$
Laborer 35.10$ 54.00$
Subtotal 273.10$
Hours per Shift 8
Total Shift Labor Rate 2,184.80$
B. Equipment Bare Cost (Daily) Incl. Profit (Daily)
Air Compressor, 250 cfm 177.00$ 194.70$
2 Breakers 19.60$ 21.56$
2 Air Hoses 12.60$ 13.86$
Subtotal 230.12$
Adjustment for variable Shift ‐$
Total Shift Equipment Rate 230.12$
Total Daily Crew Rate 2,414.92$
City Cost Index 1.263 635.12$
Adjusted Daily Crew Rate 3,050.04$
ROBERGE ASSOCIATES COASTAL ENGINEERS, LLC

Crew 5 Concrete Placement
A. Labor Bare Cost Incl. O&P
Carpenter Foreman 46.10$ 70.95$
Carpenter 44.10$ 67.85$
Laborer 35.10$ 54.00$
1 Cement Finisher 47.80$ 72.15$
Subtotal 264.95$
Hours per Shift 8
Total Shift Labor Rate 2,119.60$
B. Equipment Bare Cost (Daily) Incl. Profit (Daily)
Gas Engine Vibrator 27.40$ 30.14$
Subtotal 30.14$
Adjustment for variable Shift ‐$
Total Shift Equipment Rate 30.14$
Total Daily Crew Rate 2,149.74$
City Cost Index 1.263 565.38$
Adjusted Daily Crew Rate 2,715.12$
ROBERGE ASSOCIATES COASTAL ENGINEERS, LLC
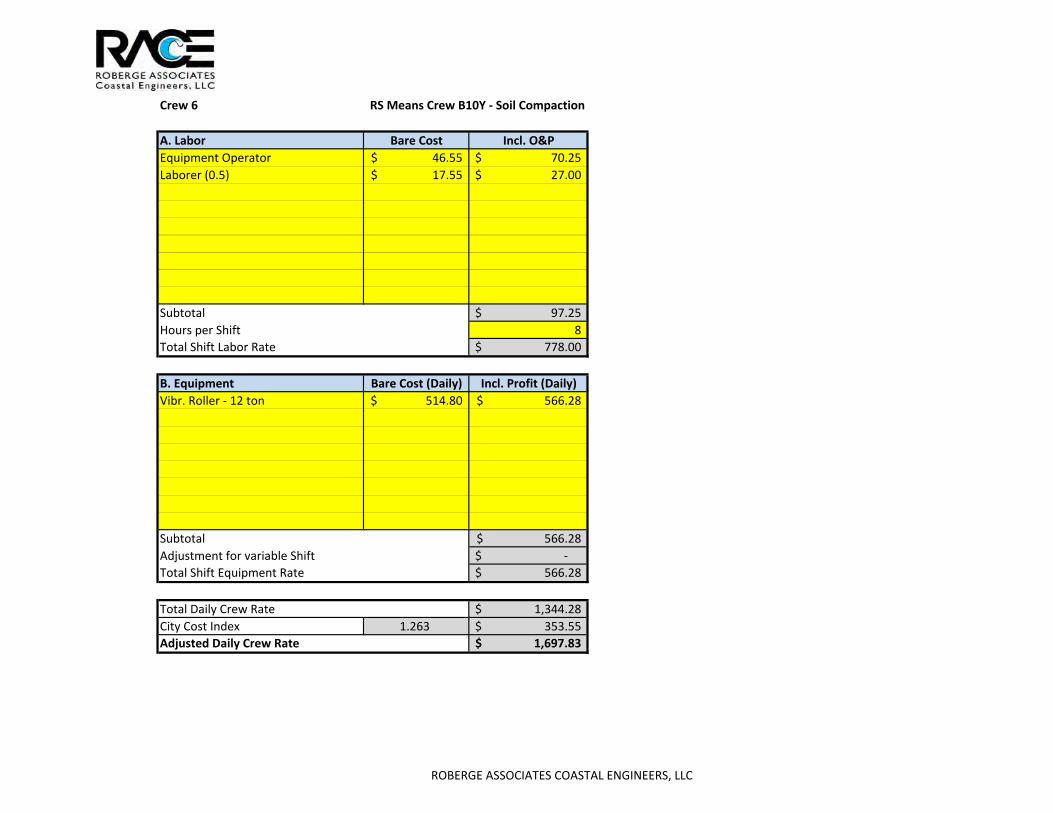
Crew 6 RS Means Crew B10Y ‐ Soil Compaction
A. Labor Bare Cost Incl. O&P
Equipment Operator 46.55$ 70.25$
Laborer (0.5) 17.55$ 27.00$
Subtotal 97.25$
Hours per Shift 8
Total Shift Labor Rate 778.00$
B. Equipment Bare Cost (Daily) Incl. Profit (Daily)
Vibr. Roller ‐ 12 ton 514.80$ 566.28$
Subtotal 566.28$
Adjustment for variable Shift ‐$
Total Shift Equipment Rate 566.28$
Total Daily Crew Rate 1,344.28$
City Cost Index 1.263 353.55$
Adjusted Daily Crew Rate 1,697.83$
ROBERGE ASSOCIATES COASTAL ENGINEERS, LLC

Crew 7 RS Means Crew L2 ‐ Carpentry
A. Labor Bare Cost Incl. O&P
Carpenter 44.10$ 67.85$
Carpenter Helper 33.30$ 51.20$
Subtotal 119.05$
Hours per Shift 8
Total Shift Labor Rate 952.40$
B. Equipment Bare Cost (Daily) Incl. Profit (Daily)
Subtotal ‐$
Adjustment for variable Shift ‐$
Total Shift Equipment Rate ‐$
Total Daily Crew Rate 952.40$
City Cost Index 1.263 250.48$
Adjusted Daily Crew Rate 1,202.88$
ROBERGE ASSOCIATES COASTAL ENGINEERS, LLC

Crew 8 RS Means Crew B12G ‐ Hydraulic Excavator
A. Labor Bare Cost Incl. O&P
Equipment Operator 47.80$ 72.15$
Laborer 35.10$ 54.00$
Subtotal 126.15$
Hours per Shift 8
Total Shift Labor Rate 1,009.20$
B. Equipment Bare Cost (Daily) Incl. Profit (Daily)
Hydraulic Excavator 0.75 cy 647.20$ 711.92$
Subtotal 711.92$
Adjustment for variable Shift ‐$
Total Shift Equipment Rate 711.92$
Total Daily Crew Rate 1,721.12$
City Cost Index 1.263 452.65$
Adjusted Daily Crew Rate 2,173.77$
ROBERGE ASSOCIATES COASTAL ENGINEERS, LLC

Crew 9 Dockbuilders
A. Labor Bare Cost Incl. O&P
Dockbuilber (Foreman) 44.80$ 72.00$
Dockbuilder 42.80$ 68.80$
Dockbuilder 42.80$ 68.80$
Subtotal 209.60$
Hours per Shift 8
Total Shift Labor Rate 1,676.80$
B. Equipment Bare Cost (Daily) Incl. Profit (Daily)
Misc. Hand Tools 50.00$ 55.00$
Subtotal 55.00$
Adjustment for variable Shift ‐$
Total Shift Equipment Rate 55.00$
Total Daily Crew Rate 1,731.80$
City Cost Index 1.263 455.46$
Adjusted Daily Crew Rate 2,187.26$
ROBERGE ASSOCIATES COASTAL ENGINEERS, LLC

Crew 10 Electrician
A. Labor Bare Cost Incl. O&P
Electrician (foreman) 53.55$ 80.05$
Laborer 35.10$ 54.00$
Subtotal 134.05$
Hours per Shift 8
Total Shift Labor Rate 1,072.40$
B. Equipment Bare Cost (Daily) Incl. Profit (Daily)
Misc. Hand Tools 50.00$ 55.00$
Subtotal 55.00$
Adjustment for variable Shift ‐$
Total Shift Equipment Rate 55.00$
Total Daily Crew Rate 1,127.40$
City Cost Index 1.263 296.51$
Adjusted Daily Crew Rate 1,423.91$
ROBERGE ASSOCIATES COASTAL ENGINEERS, LLC
Town of Greenwich Marine Facility Storm Damage Assessment
ROBERGE ASSOCIATES COASTAL ENGINEERS, LLC
SECTION 2.3
Greenwich Point Aerial Photograph with Damage
Locations
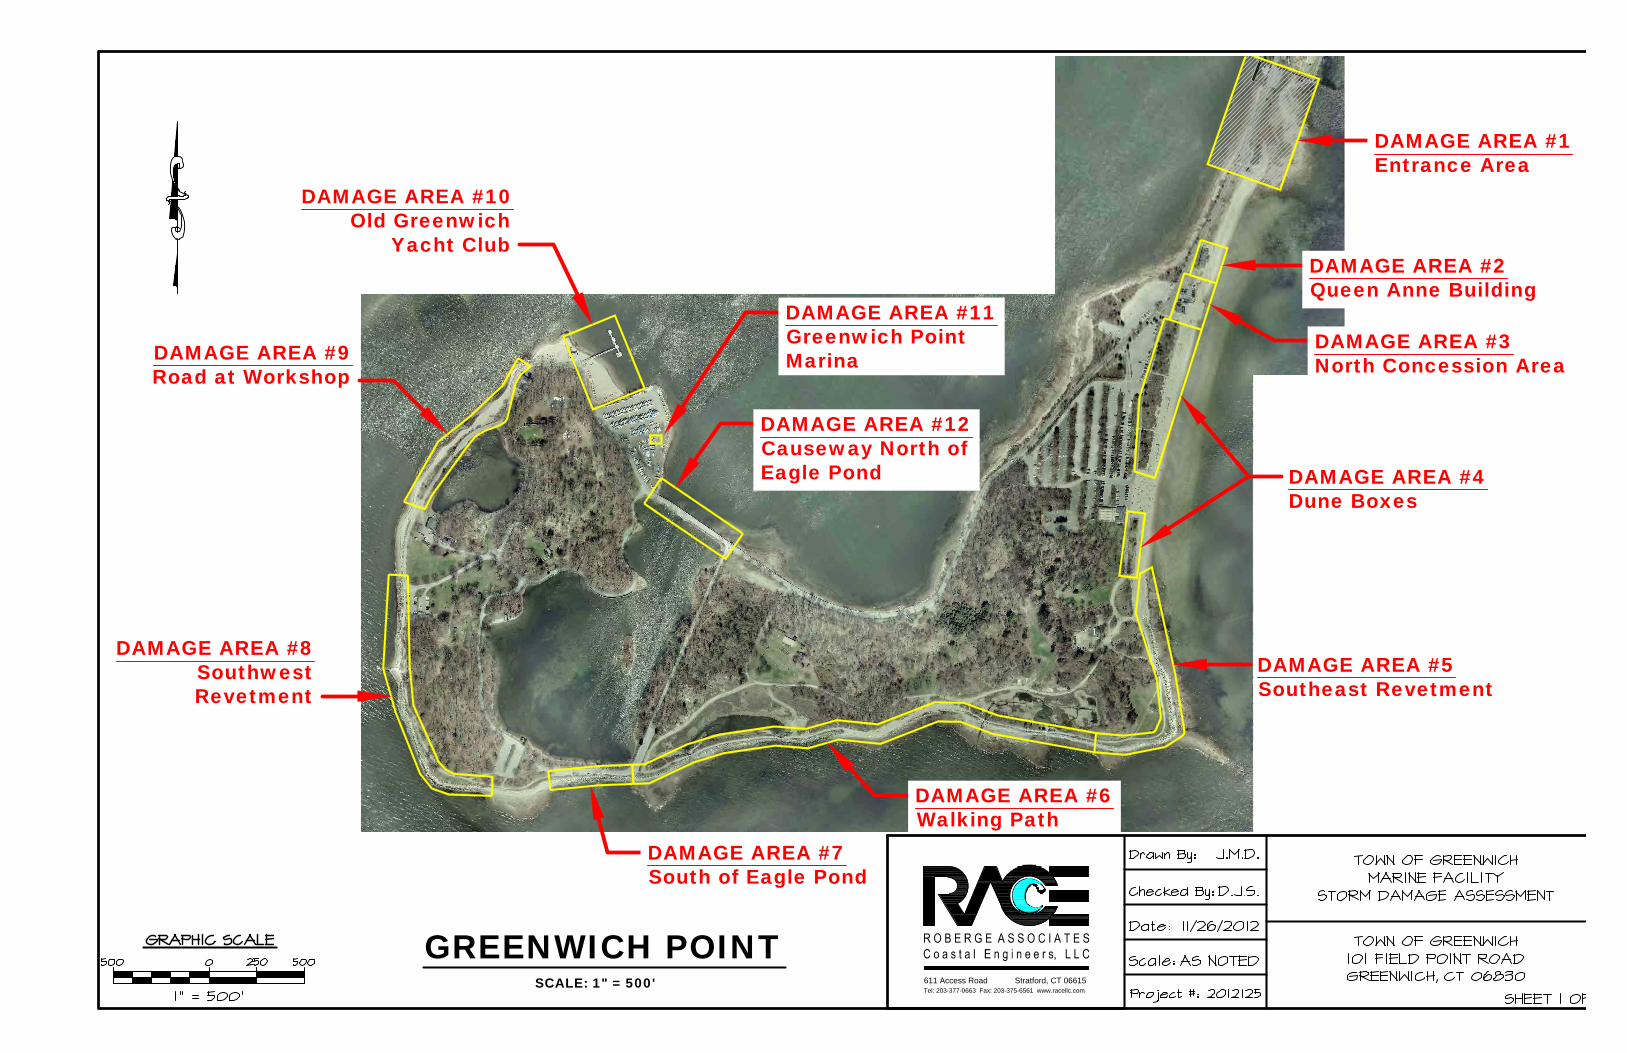
DAMAGE AREA #1Entrance Area
DAMAGE AREA #2Queen Anne Building
DAMAGE AREA #3North Concession Area
DAMAGE AREA #4Dune Boxes
DAMAGE AREA #5Southeast Revetment
DAMAGE AREA #6Walking Path
DAMAGE AREA #7South of Eagle Pond
DAMAGE AREA #8SouthwestRevetment
DAMAGE AREA #9Road at Workshop
DAMAGE AREA #10Old Greenwich
Yacht Club
DAMAGE AREA #12Causeway North ofEagle Pond
DAMAGE AREA #11Greenwich PointMarina
GREENWICH POINTSCALE: 1" = 500' 611 Access Road Stratford, CT 06615
Tel: 203-377-0663 Fax: 203-375-6561 www.racellc.com

Town of Greenwich Marine Facility Storm Damage Assessment
ROBERGE ASSOCIATES COASTAL ENGINEERS, LLC
SECTION 2.4
Greenwich Point Representative Photographs

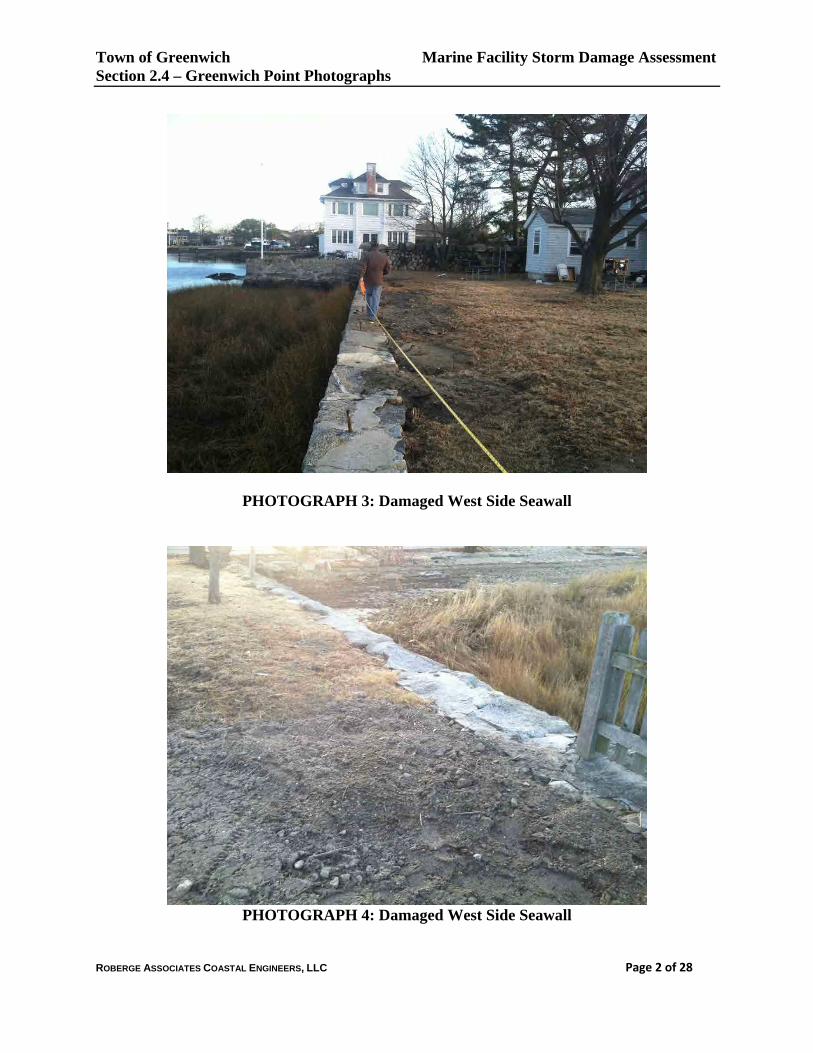
Town of Greenwich Marine Facility Storm Damage Assessment Section 2.4 – Greenwich Point Photographs
ROBERGE ASSOCIATES COASTAL ENGINEERS, LLC Page 1 of 28
DAMAGE AREA #1 – ENTRANCE AREA
PHOTOGRAPH 1: Damaged Chain Link Fence
PHOTOGRAPH 2: Loss of Topsoil & Erosion
Town of Greenwich Marine Facility Storm Damage Assessment Section 2.4 – Greenwich Point Photographs
ROBERGE ASSOCIATES COASTAL ENGINEERS, LLC Page 2 of 28
PHOTOGRAPH 3: Damaged West Side Seawall
PHOTOGRAPH 4: Damaged West Side Seawall

Town of Greenwich Marine Facility Storm Damage Assessment Section 2.4 – Greenwich Point Photographs
ROBERGE ASSOCIATES COASTAL ENGINEERS, LLC Page 3 of 28
PHOTOGRAPH 5: Damaged Seawall on West Side of Entrance Road
PHOTOGRAPH 6: Damaged Seawall on West Side of Entrance Road

Town of Greenwich Marine Facility Storm Damage Assessment Section 2.4 – Greenwich Point Photographs
ROBERGE ASSOCIATES COASTAL ENGINEERS, LLC Page 4 of 28
PHOTOGRAPH 7: Damaged Seawall on West Side of Entrance Road
PHOTOGRAPH 8: Damaged Seawall on West Side of Entrance Road
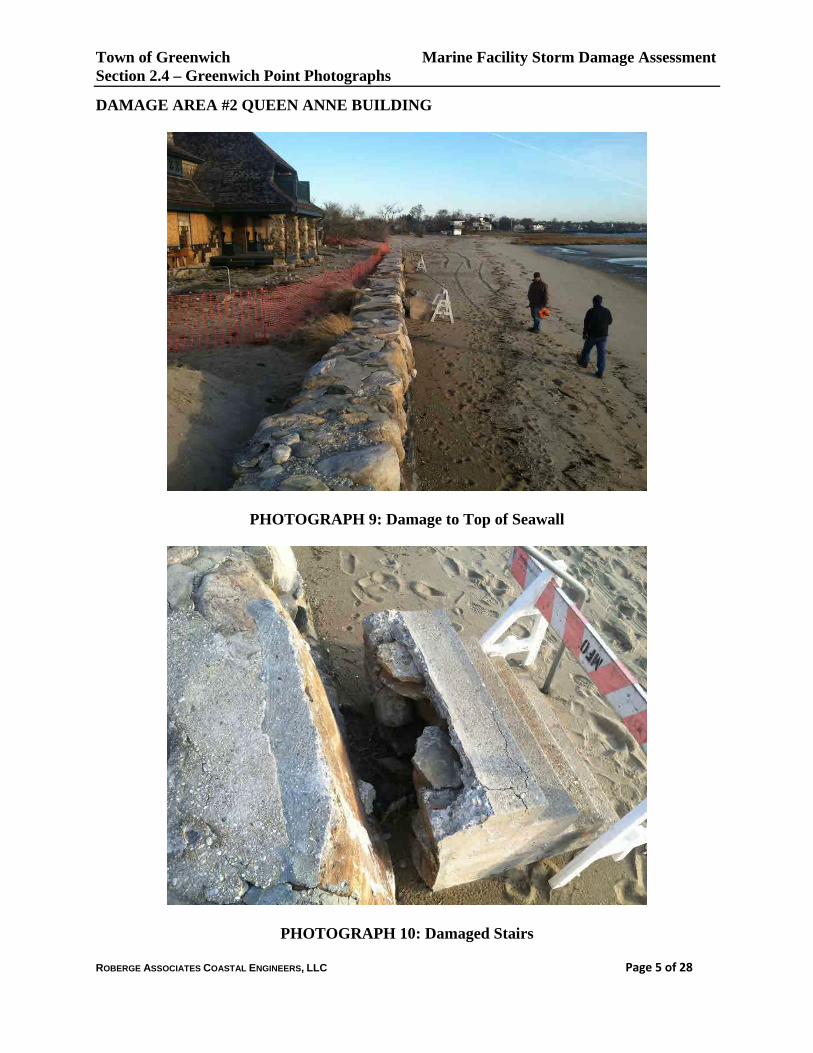
Town of Greenwich Marine Facility Storm Damage Assessment Section 2.4 – Greenwich Point Photographs
ROBERGE ASSOCIATES COASTAL ENGINEERS, LLC Page 5 of 28
DAMAGE AREA #2 QUEEN ANNE BUILDING
PHOTOGRAPH 9: Damage to Top of Seawall
PHOTOGRAPH 10: Damaged Stairs

Town of Greenwich Marine Facility Storm Damage Assessment Section 2.4 – Greenwich Point Photographs
ROBERGE ASSOCIATES COASTAL ENGINEERS, LLC Page 6 of 28
PHOTOGRAPH 11: Damaged Stairs
PHOTOGRAPH 12: Damaged Transformer

Town of Greenwich Marine Facility Storm Damage Assessment Section 2.4 – Greenwich Point Photographs
ROBERGE ASSOCIATES COASTAL ENGINEERS, LLC Page 7 of 28
PHOTOGRAPH 13: Erosion & Loss of Soil in Front of Building
PHOTOGRAPH 14: Seawall Damage

Town of Greenwich Marine Facility Storm Damage Assessment Section 2.4 – Greenwich Point Photographs
ROBERGE ASSOCIATES COASTAL ENGINEERS, LLC Page 8 of 28
PHOTOGRAPH 15: Damaged Seawall at South Seawall Return

Town of Greenwich Marine Facility Storm Damage Assessment Section 2.4 – Greenwich Point Photographs
ROBERGE ASSOCIATES COASTAL ENGINEERS, LLC Page 9 of 28
DAMAGE AREA #3 – NORTH CONCESSION AREA
PHOTOGRAPH 16: Damaged Asphalt
PHOTOGRAPH 17: Damage to South East Building Corner

Town of Greenwich Marine Facility Storm Damage Assessment Section 2.4 – Greenwich Point Photographs
ROBERGE ASSOCIATES COASTAL ENGINEERS, LLC Page 10 of 28
PHOTOGRAPH 18: Damage to Transformer #2

Town of Greenwich Marine Facility Storm Damage Assessment Section 2.4 – Greenwich Point Photographs
ROBERGE ASSOCIATES COASTAL ENGINEERS, LLC Page 11 of 28
DAMAGE AREA #4 – DUNE BOXES
PHOTOGRAPH 19: Damage to Chain Link Fences Around Dune Boxes
PHOTOGRAPH 20: Damage to Chain Link Fences Around Dune Boxes
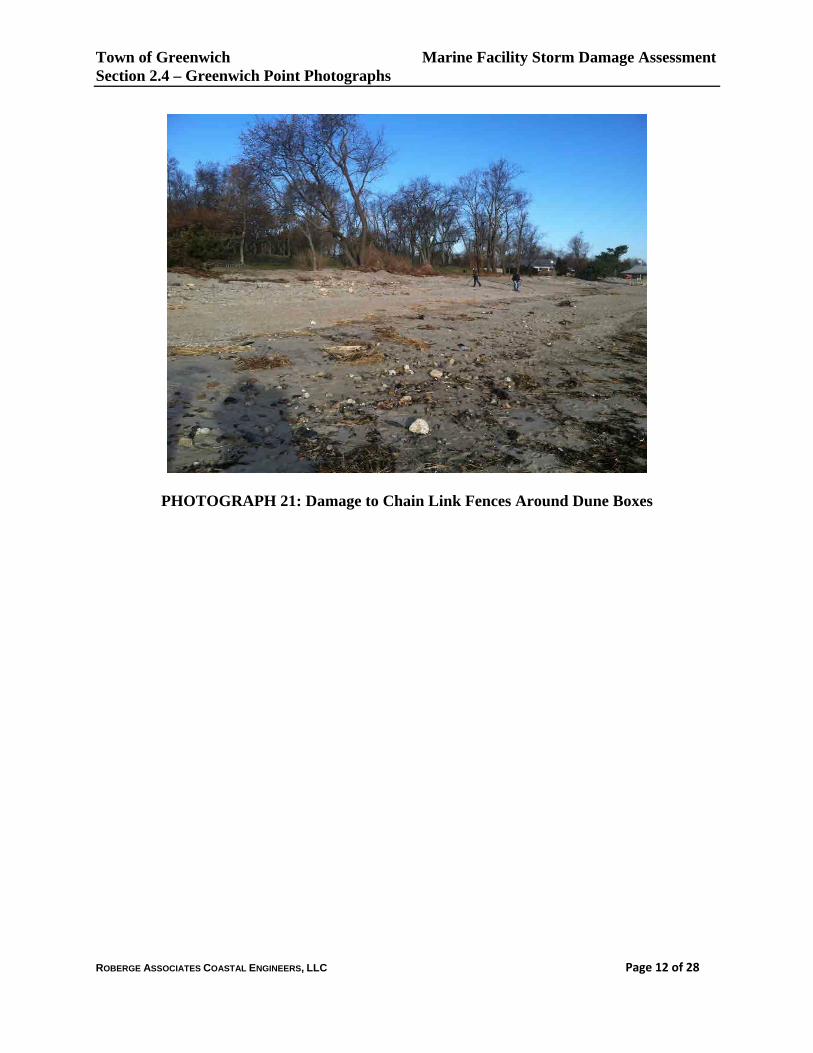
Town of Greenwich Marine Facility Storm Damage Assessment Section 2.4 – Greenwich Point Photographs
ROBERGE ASSOCIATES COASTAL ENGINEERS, LLC Page 12 of 28
PHOTOGRAPH 21: Damage to Chain Link Fences Around Dune Boxes

Town of Greenwich Marine Facility Storm Damage Assessment Section 2.4 – Greenwich Point Photographs
ROBERGE ASSOCIATES COASTAL ENGINEERS, LLC Page 13 of 28
DAMAGE AREA #5 – SOUTHEAST REVETMENT
PHOTOGRAPH 22: EROSION & LOSS OF SOIL
PHOTOGRAPH 23: EROSION & LOSS OF SOIL

Town of Greenwich Marine Facility Storm Damage Assessment Section 2.4 – Greenwich Point Photographs
ROBERGE ASSOCIATES COASTAL ENGINEERS, LLC Page 14 of 28
PHOTOGRAPH 24: EROSION & LOSS OF SOIL
PHOTOGRAPH 25: Loss of Service Road
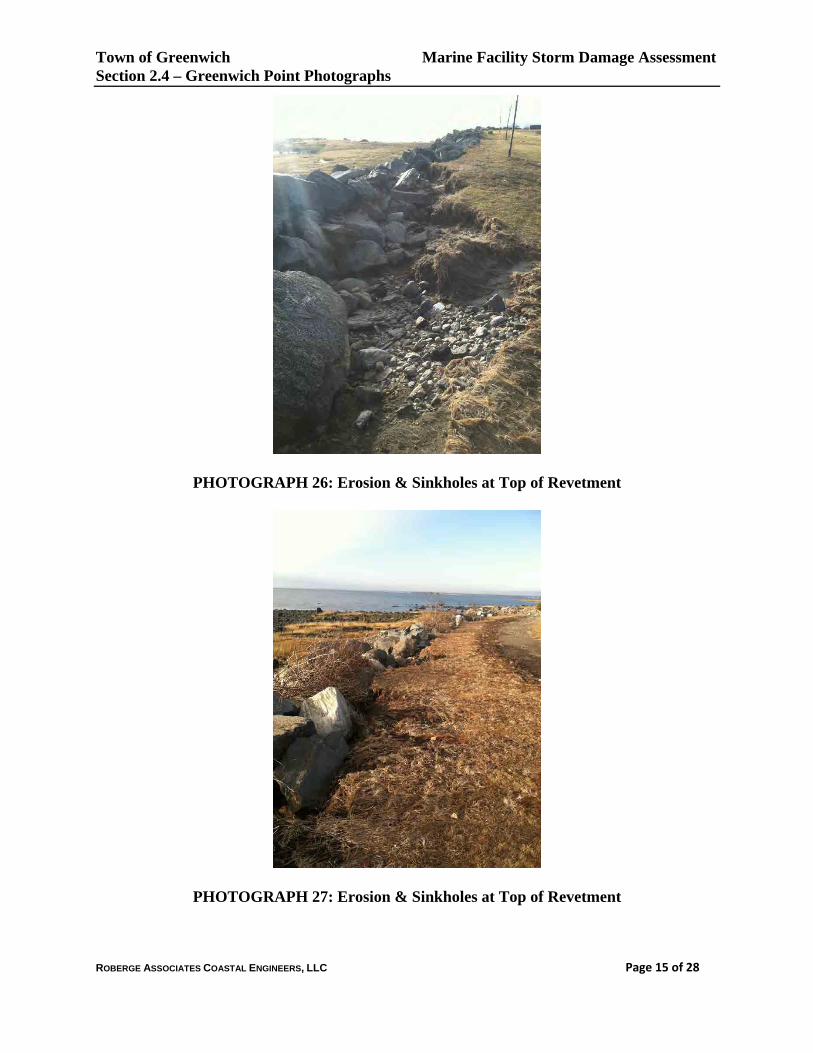
Town of Greenwich Marine Facility Storm Damage Assessment Section 2.4 – Greenwich Point Photographs
ROBERGE ASSOCIATES COASTAL ENGINEERS, LLC Page 15 of 28
PHOTOGRAPH 26: Erosion & Sinkholes at Top of Revetment
PHOTOGRAPH 27: Erosion & Sinkholes at Top of Revetment

Town of Greenwich Marine Facility Storm Damage Assessment Section 2.4 – Greenwich Point Photographs
ROBERGE ASSOCIATES COASTAL ENGINEERS, LLC Page 16 of 28
PHOTOGRAPH 28: Erosion & Sinkholes at Top of Revetment
PHOTOGRAPH 29: Erosion & Sinkholes at Top of Revetment
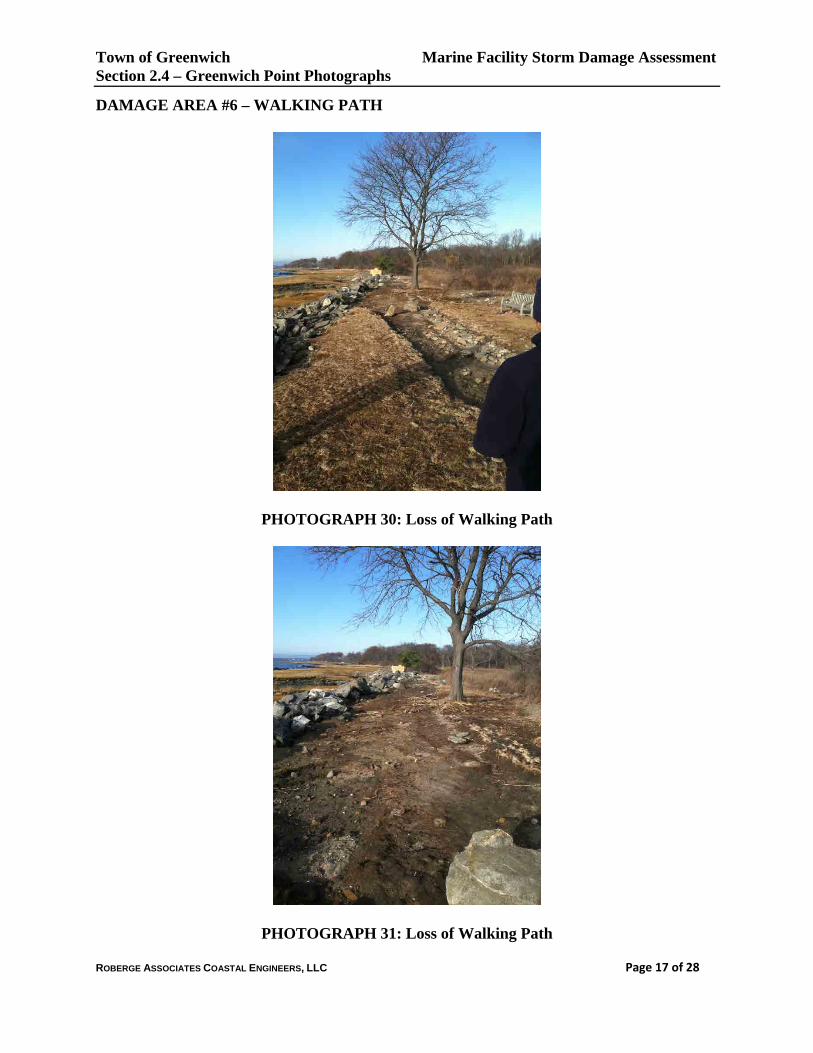
Town of Greenwich Marine Facility Storm Damage Assessment Section 2.4 – Greenwich Point Photographs
ROBERGE ASSOCIATES COASTAL ENGINEERS, LLC Page 17 of 28
DAMAGE AREA #6 – WALKING PATH
PHOTOGRAPH 30: Loss of Walking Path
PHOTOGRAPH 31: Loss of Walking Path
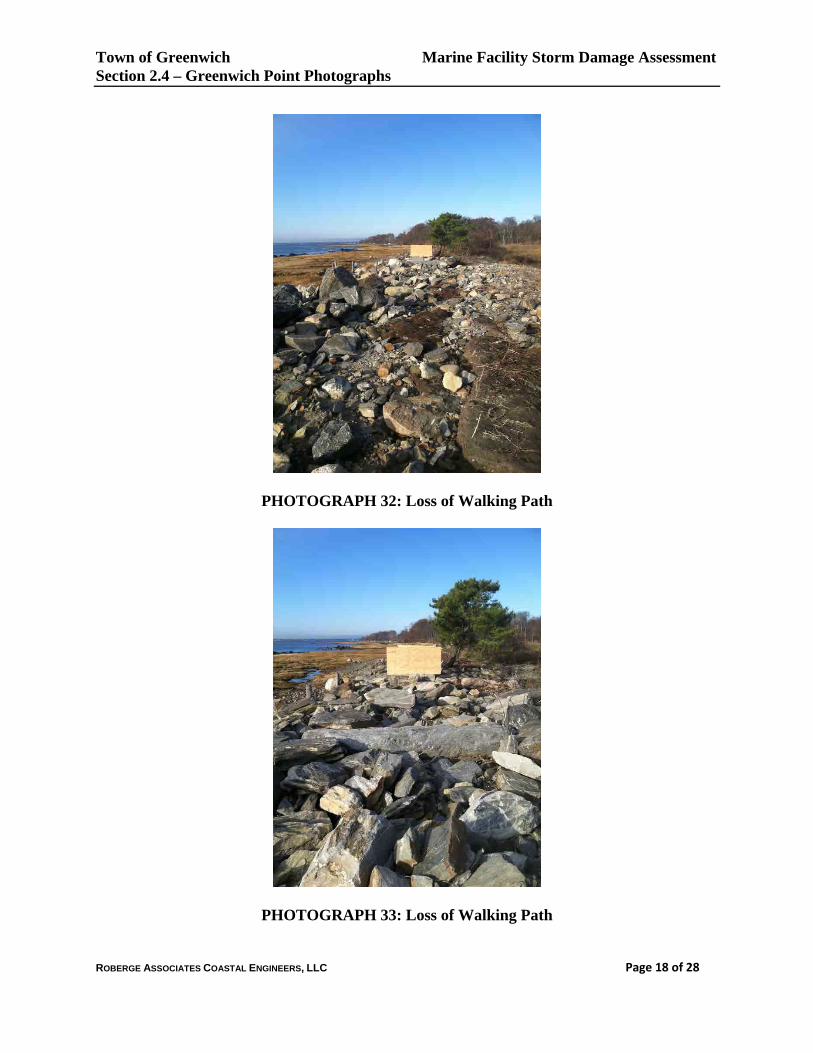
Town of Greenwich Marine Facility Storm Damage Assessment Section 2.4 – Greenwich Point Photographs
ROBERGE ASSOCIATES COASTAL ENGINEERS, LLC Page 18 of 28
PHOTOGRAPH 32: Loss of Walking Path
PHOTOGRAPH 33: Loss of Walking Path

Town of Greenwich Marine Facility Storm Damage Assessment Section 2.4 – Greenwich Point Photographs
ROBERGE ASSOCIATES COASTAL ENGINEERS, LLC Page 19 of 28
PHOTOGRAPH 34: Loss of Walking Path
PHOTOGRAPH 35: Loss of Walking Path
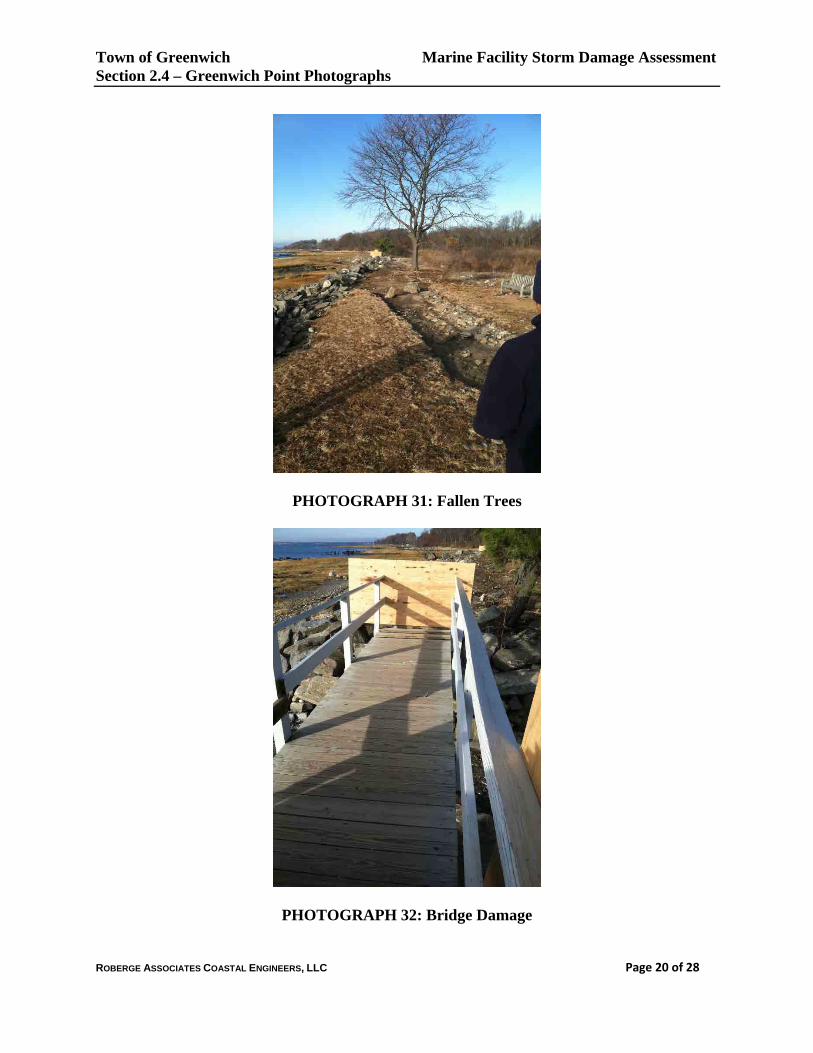
Town of Greenwich Marine Facility Storm Damage Assessment Section 2.4 – Greenwich Point Photographs
ROBERGE ASSOCIATES COASTAL ENGINEERS, LLC Page 20 of 28
PHOTOGRAPH 31: Fallen Trees
PHOTOGRAPH 32: Bridge Damage
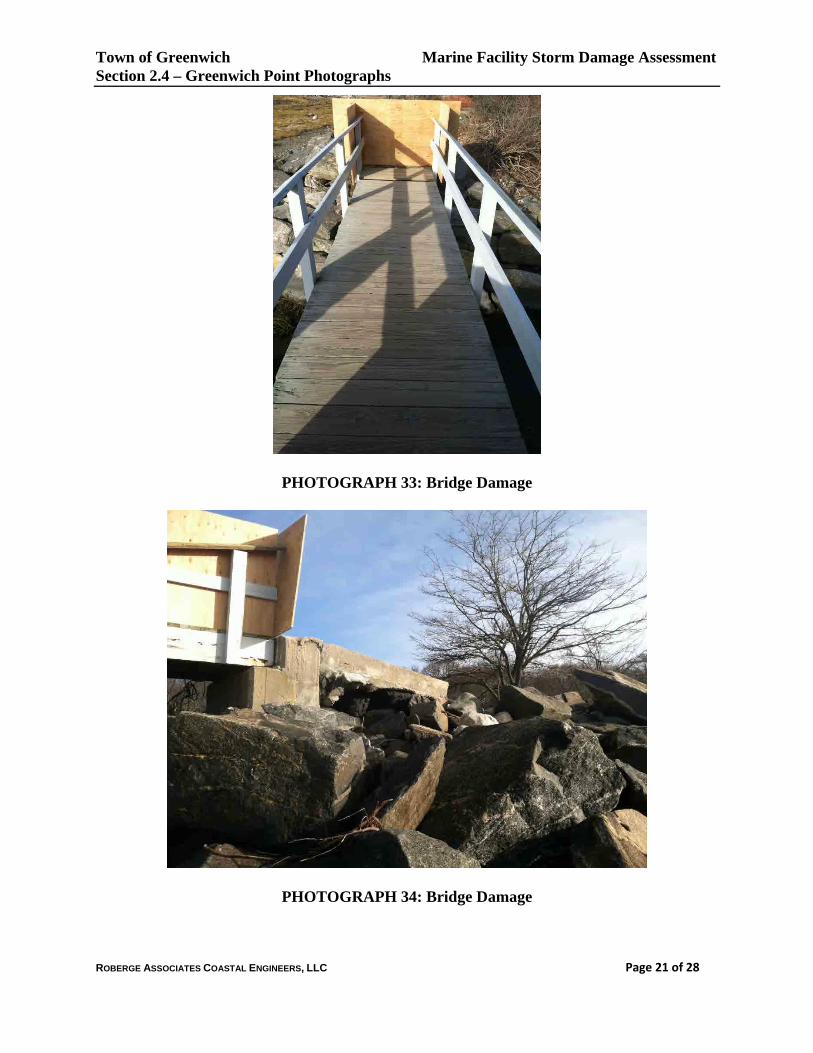
Town of Greenwich Marine Facility Storm Damage Assessment Section 2.4 – Greenwich Point Photographs
ROBERGE ASSOCIATES COASTAL ENGINEERS, LLC Page 21 of 28
PHOTOGRAPH 33: Bridge Damage
PHOTOGRAPH 34: Bridge Damage
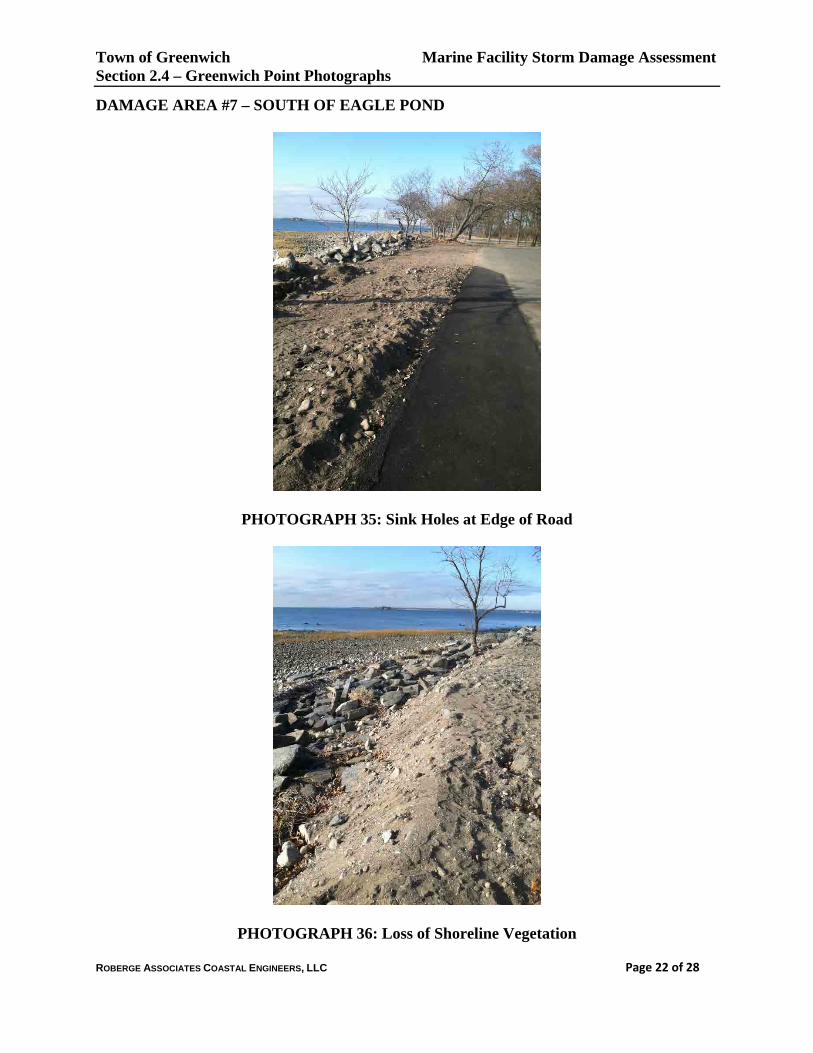
Town of Greenwich Marine Facility Storm Damage Assessment Section 2.4 – Greenwich Point Photographs
ROBERGE ASSOCIATES COASTAL ENGINEERS, LLC Page 22 of 28
DAMAGE AREA #7 – SOUTH OF EAGLE POND
PHOTOGRAPH 35: Sink Holes at Edge of Road
PHOTOGRAPH 36: Loss of Shoreline Vegetation
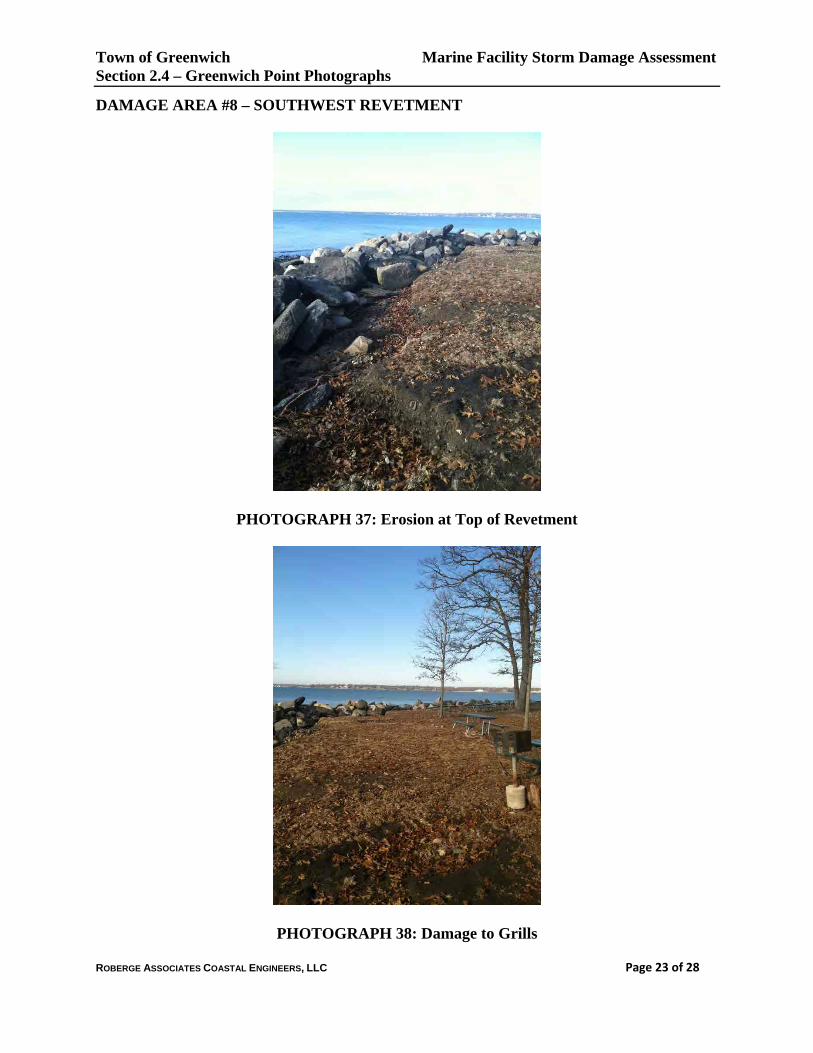
Town of Greenwich Marine Facility Storm Damage Assessment Section 2.4 – Greenwich Point Photographs
ROBERGE ASSOCIATES COASTAL ENGINEERS, LLC Page 23 of 28
DAMAGE AREA #8 – SOUTHWEST REVETMENT
PHOTOGRAPH 37: Erosion at Top of Revetment
PHOTOGRAPH 38: Damage to Grills
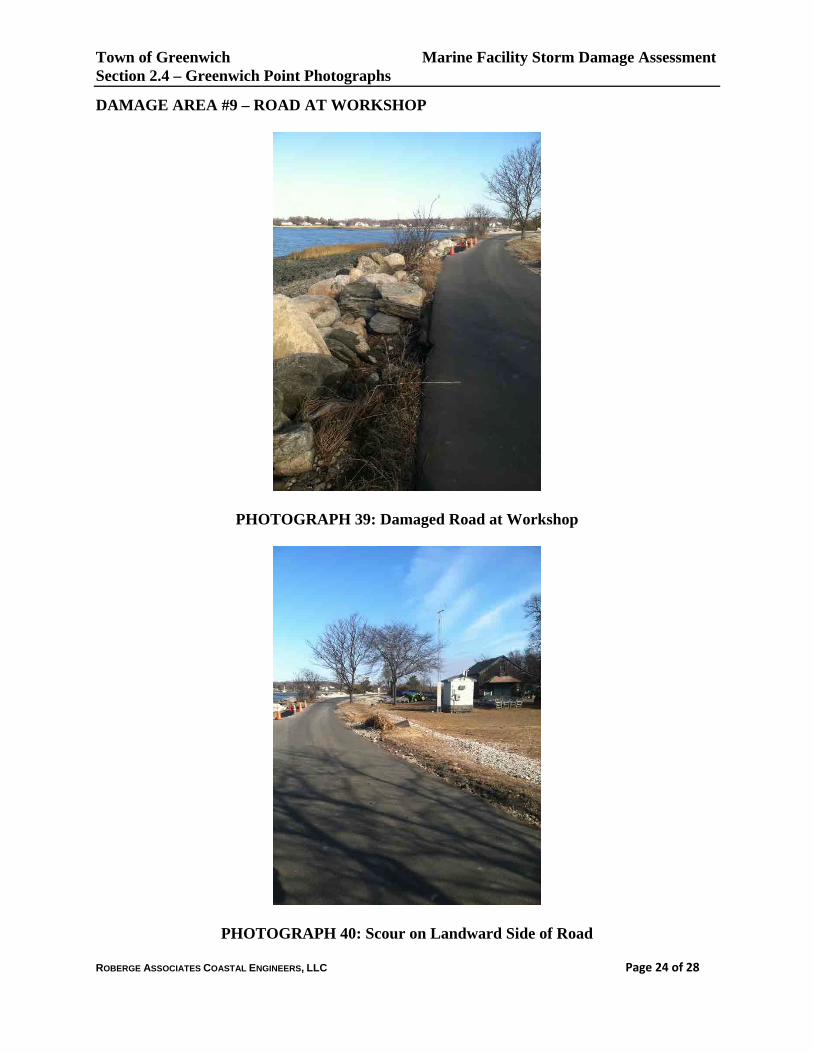
Town of Greenwich Marine Facility Storm Damage Assessment Section 2.4 – Greenwich Point Photographs
ROBERGE ASSOCIATES COASTAL ENGINEERS, LLC Page 24 of 28
DAMAGE AREA #9 – ROAD AT WORKSHOP
PHOTOGRAPH 39: Damaged Road at Workshop
PHOTOGRAPH 40: Scour on Landward Side of Road

Town of Greenwich Marine Facility Storm Damage Assessment Section 2.4 – Greenwich Point Photographs
ROBERGE ASSOCIATES COASTAL ENGINEERS, LLC Page 25 of 28
PHOTOGRAPH 41: Pavement Damage

Town of Greenwich Marine Facility Storm Damage Assessment Section 2.4 – Greenwich Point Photographs
ROBERGE ASSOCIATES COASTAL ENGINEERS, LLC Page 26 of 28
DAMAGE AREA #10 – OLD GREENWICH YACHT CLUB
PHOTOGRAPH 42: Pier Damage
PHOTOGRAPH 43: Float Pile Damage

Town of Greenwich Marine Facility Storm Damage Assessment Section 2.4 – Greenwich Point Photographs
ROBERGE ASSOCIATES COASTAL ENGINEERS, LLC Page 27 of 28
PHOTOGRAPH 44: Gangway Damage
PHOTOGRAPH 45: Damaged Kayak Racks

Town of Greenwich Marine Facility Storm Damage Assessment Section 2.4 – Greenwich Point Photographs
ROBERGE ASSOCIATES COASTAL ENGINEERS, LLC Page 28 of 28
DAMAGE AREA #11 – CAUSEWAY NORTH OF EAGLE POND
PHOTOGRAPH 46: Sinkholes in Roadway
Town of Greenwich Marine Facility Storm Damage Assessment
ROBERGE ASSOCIATES COASTAL ENGINEERS, LLC
SECTION 3.0
Grass Island

Town of Greenwich Marine Facility Storm Damage Assessment
ROBERGE ASSOCIATES COASTAL ENGINEERS, LLC
SECTION 3.1
Grass Island Damage Summary Table

Town of Greenwich
Marine Facility Storm Damage Assessment
Project No. 2012125
SITE: Grass Island
DAMAGE AREA #1 ‐ SOUTH SEAWALL & REVETMENT
Damage # Description Notes Photographs
1 Sinkholes Approx. 300 ft. Between revetment and parking area 1‐2
2 Erosion Top of revetment to clubhouse. Undermined asphalt 3
3 Missing fence posts 3 missing posts @ edge of parking area 4
DAMAGE AREA #2 ‐ACCESS PIER
Damage # Description Notes Photographs
1 Stringer damage South stringer split 5
2 Decking Deck board lifted on southeast corner 6
3 Gangway Handrail Bent 7
4 Gallows Bolts loose
DAMAGE AREA #3 ‐ MARINA
Damage # Description Notes Photographs
1 Pile guides 4 Broken
2 Finger dock damage Abrasion and timber damage at end of dock 8
3 R b R il A 30' / i i3 Rub Rails Approx. 30' +/‐ missing
4 Broken deck board Located on t‐head at pile guide

Town of Greenwich Marine Facility Storm Damage Assessment
ROBERGE ASSOCIATES COASTAL ENGINEERS, LLC
SECTION 3.2
Grass Island Opinion of Probable Cost Tables
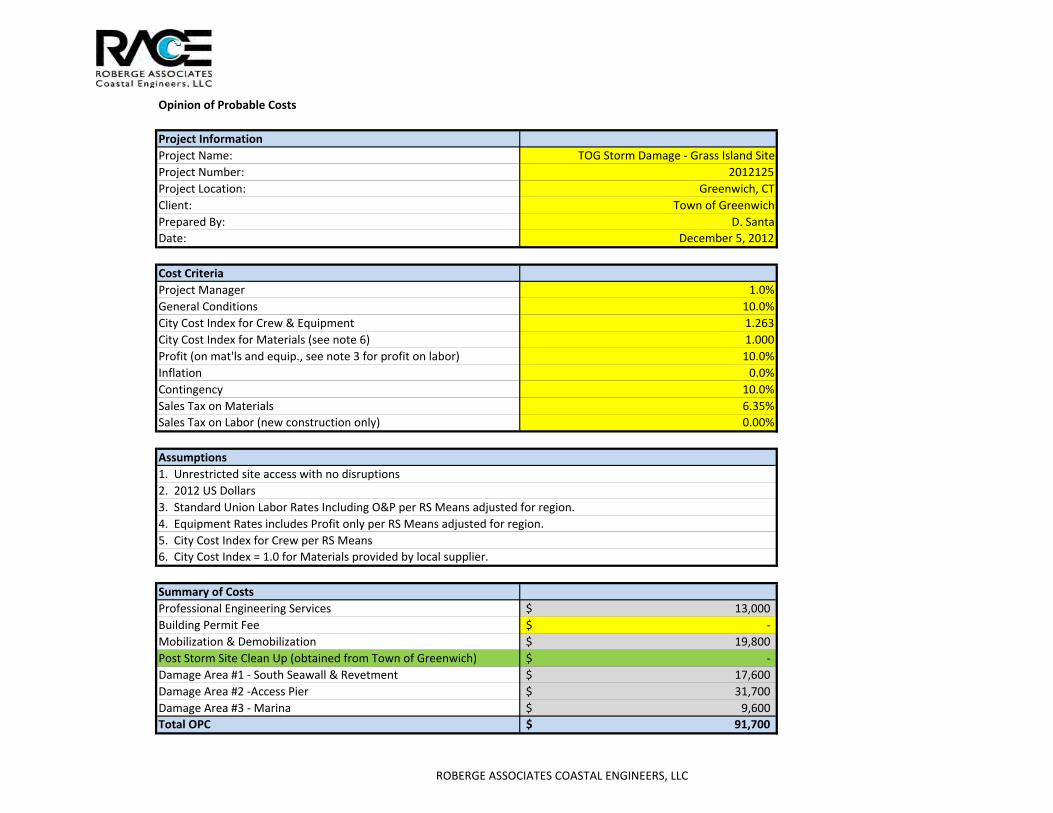
Opinion of Probable Costs
Project Information
Project Name: TOG Storm Damage ‐ Grass Island Site
Project Number: 2012125
Project Location: Greenwich, CT
Client: Town of Greenwich
Prepared By: D. Santa
Date: December 5, 2012
Cost Criteria
Project Manager 1.0%
General Conditions 10.0%
City Cost Index for Crew & Equipment 1.263
City Cost Index for Materials (see note 6) 1.000
Profit (on mat'ls and equip., see note 3 for profit on labor) 10.0%
Inflation 0.0%
Contingency 10.0%
Sales Tax on Materials 6.35%
Sales Tax on Labor (new construction only) 0.00%
Assumptions
1. Unrestricted site access with no disruptions
2. 2012 US Dollars
3. Standard Union Labor Rates Including O&P per RS Means adjusted for region.
4. Equipment Rates includes Profit only per RS Means adjusted for region.
5. City Cost Index for Crew per RS Means
6. City Cost Index = 1.0 for Materials provided by local supplier.
Summary of Costs
Professional Engineering Services 13,000$
Building Permit Fee ‐$
Mobilization & Demobilization 19,800$
Post Storm Site Clean Up (obtained from Town of Greenwich) ‐$
Damage Area #1 ‐ South Seawall & Revetment 17,600$
Damage Area #2 ‐Access Pier 31,700$
Damage Area #3 ‐ Marina 9,600$
Total OPC 91,700$
ROBERGE ASSOCIATES COASTAL ENGINEERS, LLC
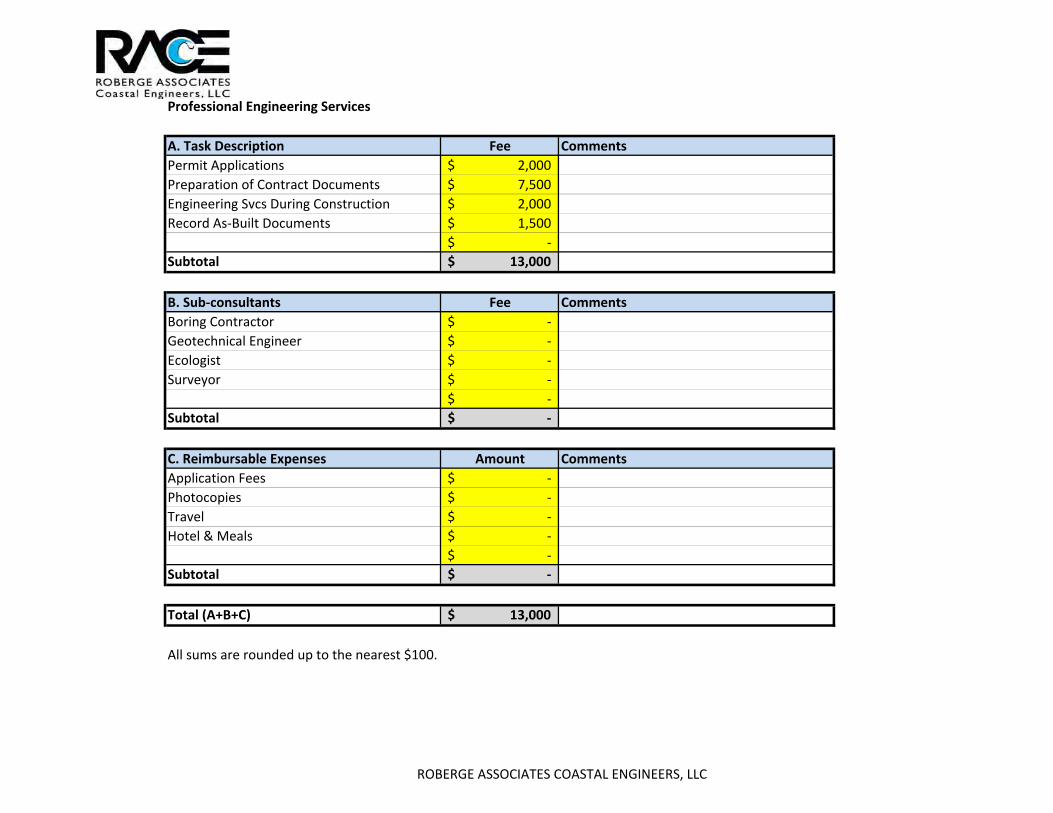
Professional Engineering Services
A. Task Description Fee Comments
Permit Applications 2,000$
Preparation of Contract Documents 7,500$
Engineering Svcs During Construction 2,000$
Record As‐Built Documents 1,500$
‐$
Subtotal 13,000$
B. Sub‐consultants Fee Comments
Boring Contractor ‐$
Geotechnical Engineer ‐$
Ecologist ‐$
Surveyor ‐$
‐$
Subtotal ‐$
C. Reimbursable Expenses Amount Comments
Application Fees ‐$
Photocopies ‐$
Travel ‐$
Hotel & Meals ‐$
‐$
Subtotal ‐$
Total (A+B+C) 13,000$
All sums are rounded up to the nearest $100.
ROBERGE ASSOCIATES COASTAL ENGINEERS, LLC
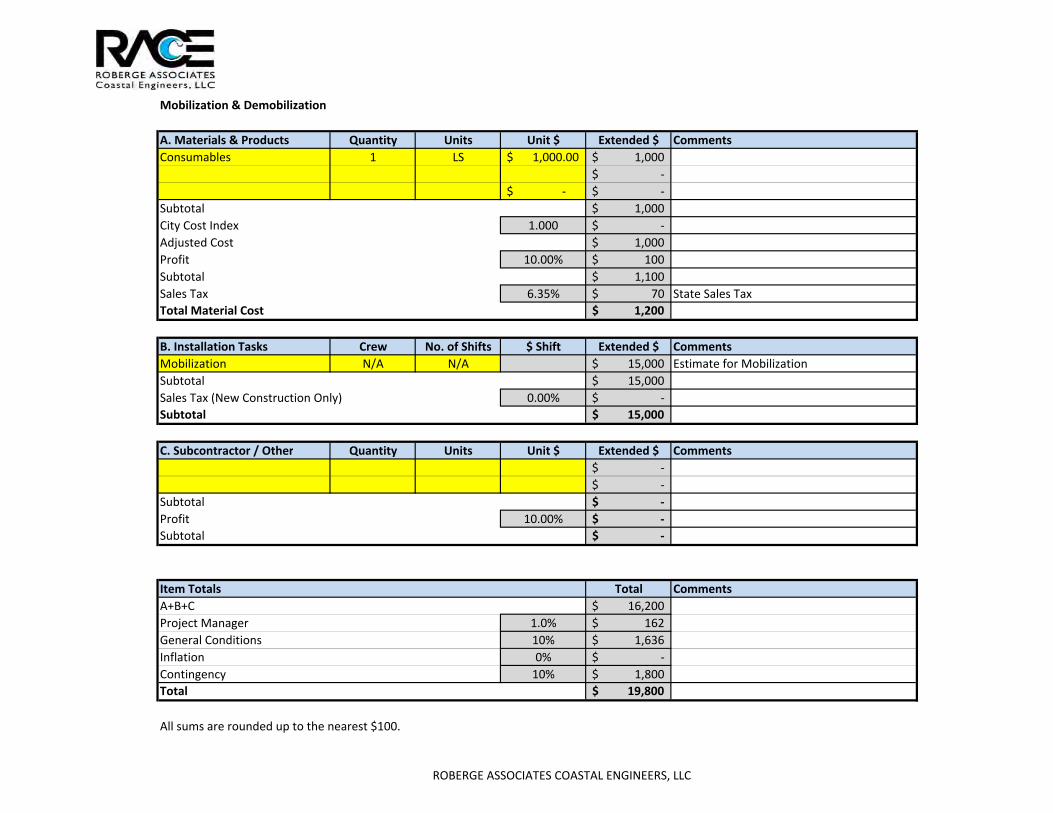
Mobilization & Demobilization
A. Materials & Products Quantity Units Unit $ Extended $ Comments
Consumables 1 LS 1,000.00$ 1,000$
‐$
‐$ ‐$
Subtotal 1,000$
City Cost Index 1.000 ‐$
Adjusted Cost 1,000$
Profit 10.00% 100$
Subtotal 1,100$
Sales Tax 6.35% 70$ State Sales Tax
Total Material Cost 1,200$
B. Installation Tasks Crew No. of Shifts $ Shift Extended $ Comments
Mobilization N/A N/A 15,000$ Estimate for Mobilization
Subtotal 15,000$
Sales Tax (New Construction Only) 0.00% ‐$
Subtotal 15,000$
C. Subcontractor / Other Quantity Units Unit $ Extended $ Comments
‐$
‐$
Subtotal ‐$
Profit 10.00% ‐$
Subtotal ‐$
Item Totals Total Comments
A+B+C 16,200$
Project Manager 1.0% 162$
General Conditions 10% 1,636$
Inflation 0% ‐$
Contingency 10% 1,800$
Total 19,800$
All sums are rounded up to the nearest $100.
ROBERGE ASSOCIATES COASTAL ENGINEERS, LLC

Damage Area 1 ‐ South Seawall & Revetment
A. Materials & Products Quantity Units Unit $ Extended $ Comments
Fill delivered to site 100 cy 35.00$ 3,500$ Fill delivered to site
Fence post material 1 ls 1,000.00$ 1,000$ 3 fence posts and concrete for base
Misc material 1 ls 500.00$ 500$
‐$ ‐$
‐$ ‐$
Subtotal 5,000$
City Cost Index 1.000 ‐$
Adjusted Cost 5,000$
Profit 10.00% 500$
Subtotal 5,500$
Sales Tax 6.35% 349$ State Sales Tax
Total Material Cost 5,900$
B. Installation Tasks Crew No. of Shifts $ Shift Extended $ Comments
Add fill and grade 1 2.0 2,519.18$ 5,038$ Fill on east and west side of entrance
Replace fence posts 2 1.0 1,887.43$ 1,887$ 100' damaged section of seawall
‐$
‐$
‐$
Subtotal 6,926$
Sales Tax (New Construction Only) 0.00% ‐$
Subtotal 7,000$
C. Subcontractor / Other Quantity Units Unit $ Extended $ Comments
Replace split rail fence 1 LS 1,500.00$ 1,500$ Estimate from J. Freidag
‐$
Subtotal 1,500$
Profit 0.00% ‐$
Subtotal 1,500$
Item Totals Total Comments
A+B+C 14,400$
Project Manager 1.0% 144$
General Conditions 10% 1,454$
Inflation 0% ‐$
Contingency 10% 1,600$
Total 17,600$
All sums are rounded up to the nearest $100.
ROBERGE ASSOCIATES COASTAL ENGINEERS, LLC
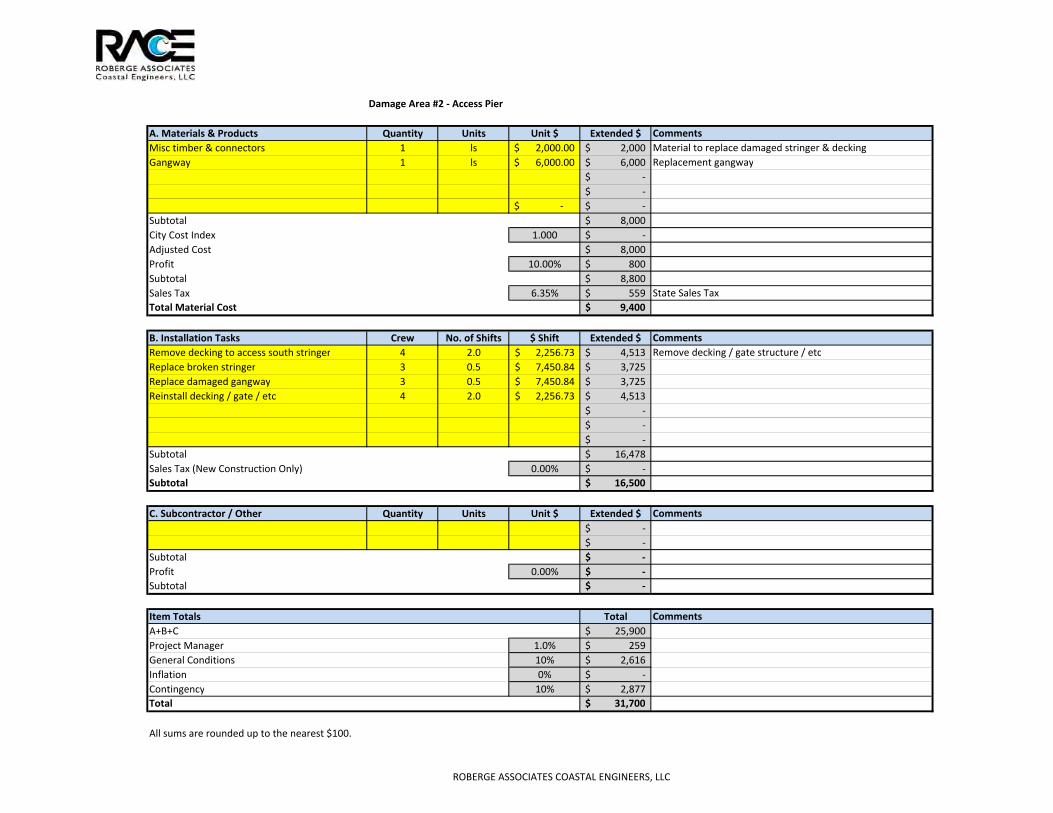
Damage Area #2 ‐ Access Pier
A. Materials & Products Quantity Units Unit $ Extended $ Comments
Misc timber & connectors 1 ls 2,000.00$ 2,000$ Material to replace damaged stringer & decking
Gangway 1 ls 6,000.00$ 6,000$ Replacement gangway
‐$
‐$
‐$ ‐$
Subtotal 8,000$
City Cost Index 1.000 ‐$
Adjusted Cost 8,000$
Profit 10.00% 800$
Subtotal 8,800$
Sales Tax 6.35% 559$ State Sales Tax
Total Material Cost 9,400$
B. Installation Tasks Crew No. of Shifts $ Shift Extended $ Comments
Remove decking to access south stringer 4 2.0 2,256.73$ 4,513$ Remove decking / gate structure / etc
Replace broken stringer 3 0.5 7,450.84$ 3,725$
Replace damaged gangway 3 0.5 7,450.84$ 3,725$
Reinstall decking / gate / etc 4 2.0 2,256.73$ 4,513$
‐$
‐$
‐$
Subtotal 16,478$
Sales Tax (New Construction Only) 0.00% ‐$
Subtotal 16,500$
C. Subcontractor / Other Quantity Units Unit $ Extended $ Comments
‐$
‐$
Subtotal ‐$
Profit 0.00% ‐$
Subtotal ‐$
Item Totals Total Comments
A+B+C 25,900$
Project Manager 1.0% 259$
General Conditions 10% 2,616$
Inflation 0% ‐$
Contingency 10% 2,877$
Total 31,700$
All sums are rounded up to the nearest $100.
ROBERGE ASSOCIATES COASTAL ENGINEERS, LLC
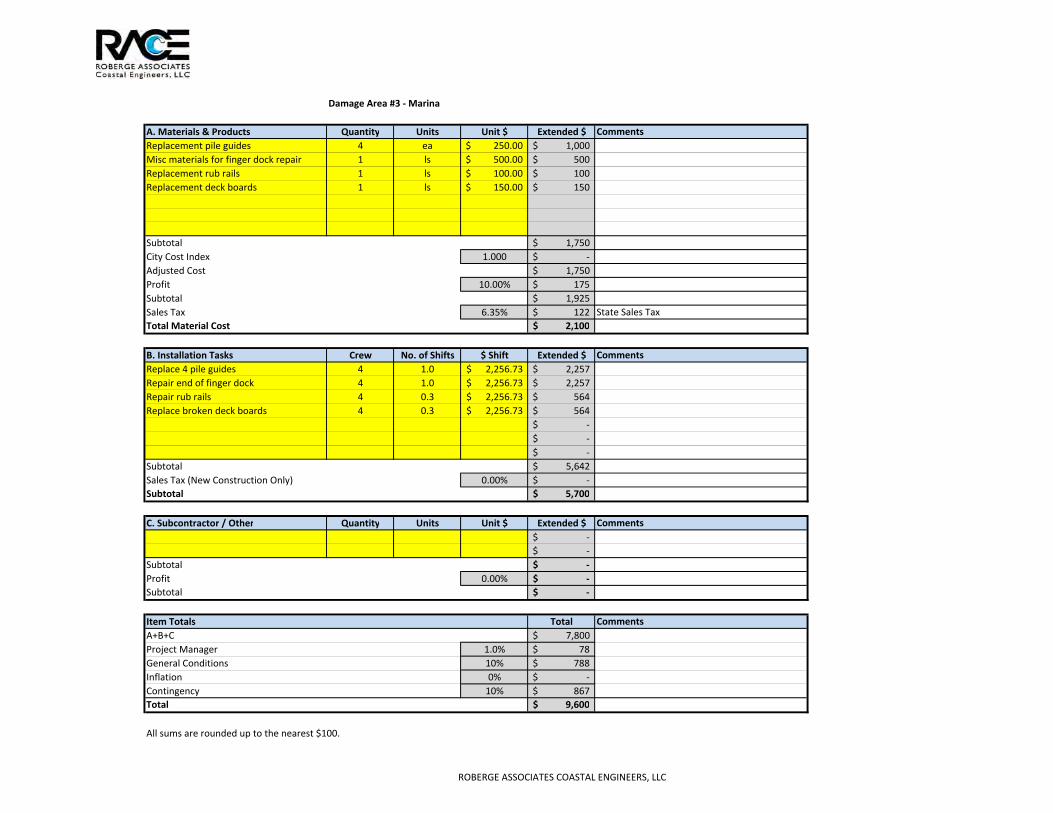
Damage Area #3 ‐ Marina
A. Materials & Products Quantity Units Unit $ Extended $ Comments
Replacement pile guides 4 ea 250.00$ 1,000$
Misc materials for finger dock repair 1 ls 500.00$ 500$
Replacement rub rails 1 ls 100.00$ 100$
Replacement deck boards 1 ls 150.00$ 150$
Subtotal 1,750$
City Cost Index 1.000 ‐$
Adjusted Cost 1,750$
Profit 10.00% 175$
Subtotal 1,925$
Sales Tax 6.35% 122$ State Sales Tax
Total Material Cost 2,100$
B. Installation Tasks Crew No. of Shifts $ Shift Extended $ Comments
Replace 4 pile guides 4 1.0 2,256.73$ 2,257$
Repair end of finger dock 4 1.0 2,256.73$ 2,257$
Repair rub rails 4 0.3 2,256.73$ 564$
Replace broken deck boards 4 0.3 2,256.73$ 564$
‐$
‐$
‐$
Subtotal 5,642$
Sales Tax (New Construction Only) 0.00% ‐$
Subtotal 5,700$
C. Subcontractor / Other Quantity Units Unit $ Extended $ Comments
‐$
‐$
Subtotal ‐$
Profit 0.00% ‐$
Subtotal ‐$
Item Totals Total Comments
A+B+C 7,800$
Project Manager 1.0% 78$
General Conditions 10% 788$
Inflation 0% ‐$
Contingency 10% 867$
Total 9,600$
All sums are rounded up to the nearest $100.
ROBERGE ASSOCIATES COASTAL ENGINEERS, LLC

Crew 1 RS Means B10P ‐ Filling/Rough Grading
A. Labor Bare Cost Incl. O&P
Equipment Operator 46.55$ 70.25$
Laborer (0.5) 17.55$ 27.00$
Subtotal 97.25$
Hours per Shift 8
Total Shift Labor Rate 778.00$
B. Equipment Bare Cost (Daily) Incl. Profit (Daily)
Crawler Loader 3cy 1,106.00$ 1,216.60$
Subtotal 1,216.60$
Adjustment for variable Shift ‐$
Total Shift Equipment Rate 1,216.60$
Total Daily Crew Rate 1,994.60$
City Cost Index 1.263 524.58$
Adjusted Daily Crew Rate 2,519.18$
ROBERGE ASSOCIATES COASTAL ENGINEERS, LLC
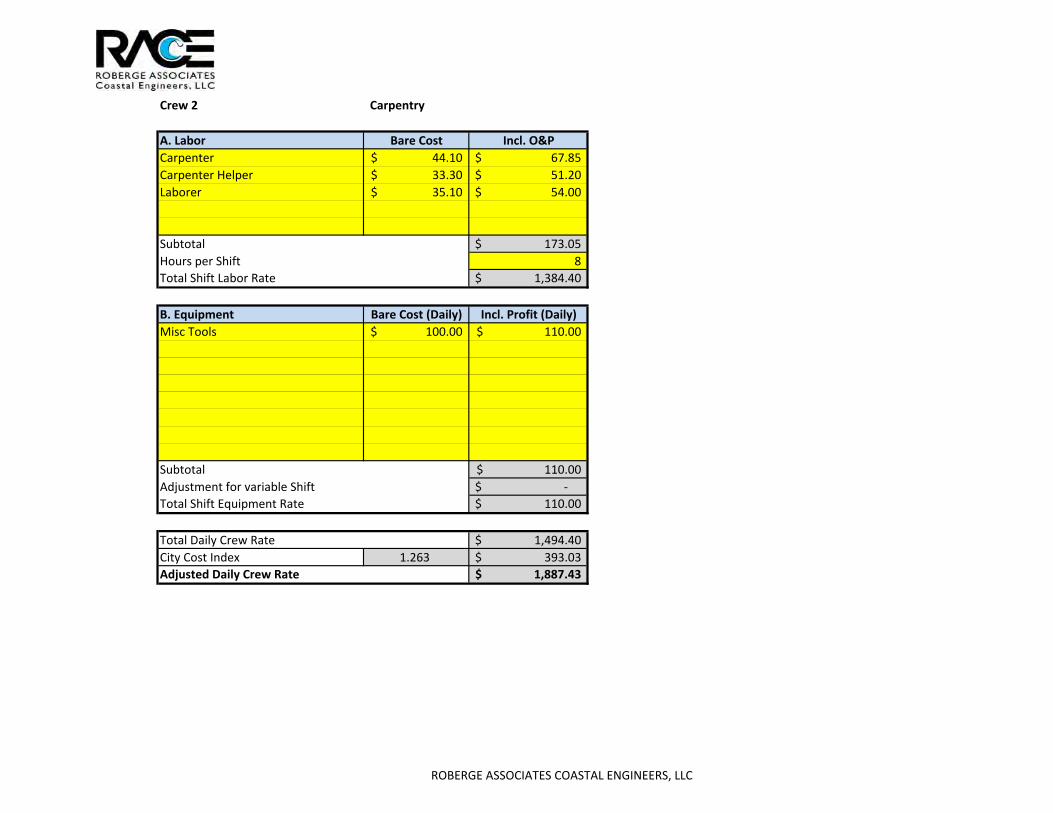
Crew 2 Carpentry
A. Labor Bare Cost Incl. O&P
Carpenter 44.10$ 67.85$
Carpenter Helper 33.30$ 51.20$
Laborer 35.10$ 54.00$
Subtotal 173.05$
Hours per Shift 8
Total Shift Labor Rate 1,384.40$
B. Equipment Bare Cost (Daily) Incl. Profit (Daily)
Misc Tools 100.00$ 110.00$
Subtotal 110.00$
Adjustment for variable Shift ‐$
Total Shift Equipment Rate 110.00$
Total Daily Crew Rate 1,494.40$
City Cost Index 1.263 393.03$
Adjusted Daily Crew Rate 1,887.43$
ROBERGE ASSOCIATES COASTAL ENGINEERS, LLC

Crew 3 Barge Crew
A. Labor Bare Cost Incl. O&P
Dockbuilder (foreman) 44.80$ 72.00$
Dockbuilder 42.80$ 68.80$
Dockbuilder 42.80$ 68.80$
Equipment Operator 47.80$ 72.15$
Oiler 41.25$ 62.25$
Subtotal 344.00$
Hours per Shift 8
Total Shift Labor Rate 2,752.00$
B. Equipment Bare Cost (Daily) Incl. Profit (Daily)
Barge 779.20$ 857.12$
Pushboat 800.00$ 880.00$
Crane 1,257.00$ 1,382.70$
Misc tools 25.00$ 27.50$
Subtotal 3,147.32$
Adjustment for variable Shift ‐$
Total Shift Equipment Rate 3,147.32$
Total Daily Crew Rate 5,899.32$
City Cost Index 1.263 1,551.52$
Adjusted Daily Crew Rate 7,450.84$
ROBERGE ASSOCIATES COASTAL ENGINEERS, LLC

Crew 4 Dockbuilder Crew
A. Labor Bare Cost Incl. O&P
Dockbuilder (foreman) 44.80$ 72.00$
Dockbuilder 42.80$ 68.80$
Dockbuilder 42.80$ 68.80$
Subtotal 209.60$
Hours per Shift 8
Total Shift Labor Rate 1,676.80$
B. Equipment Bare Cost (Daily) Incl. Profit (Daily)
Misc tools 100.00$ 110.00$
Subtotal 110.00$
Adjustment for variable Shift ‐$
Total Shift Equipment Rate 110.00$
Total Daily Crew Rate 1,786.80$
City Cost Index 1.263 469.93$
Adjusted Daily Crew Rate 2,256.73$
ROBERGE ASSOCIATES COASTAL ENGINEERS, LLC

Town of Greenwich Marine Facility Storm Damage Assessment
ROBERGE ASSOCIATES COASTAL ENGINEERS, LLC
SECTION 3.3
Grass Island Aerial Photograph with Damage
Locations
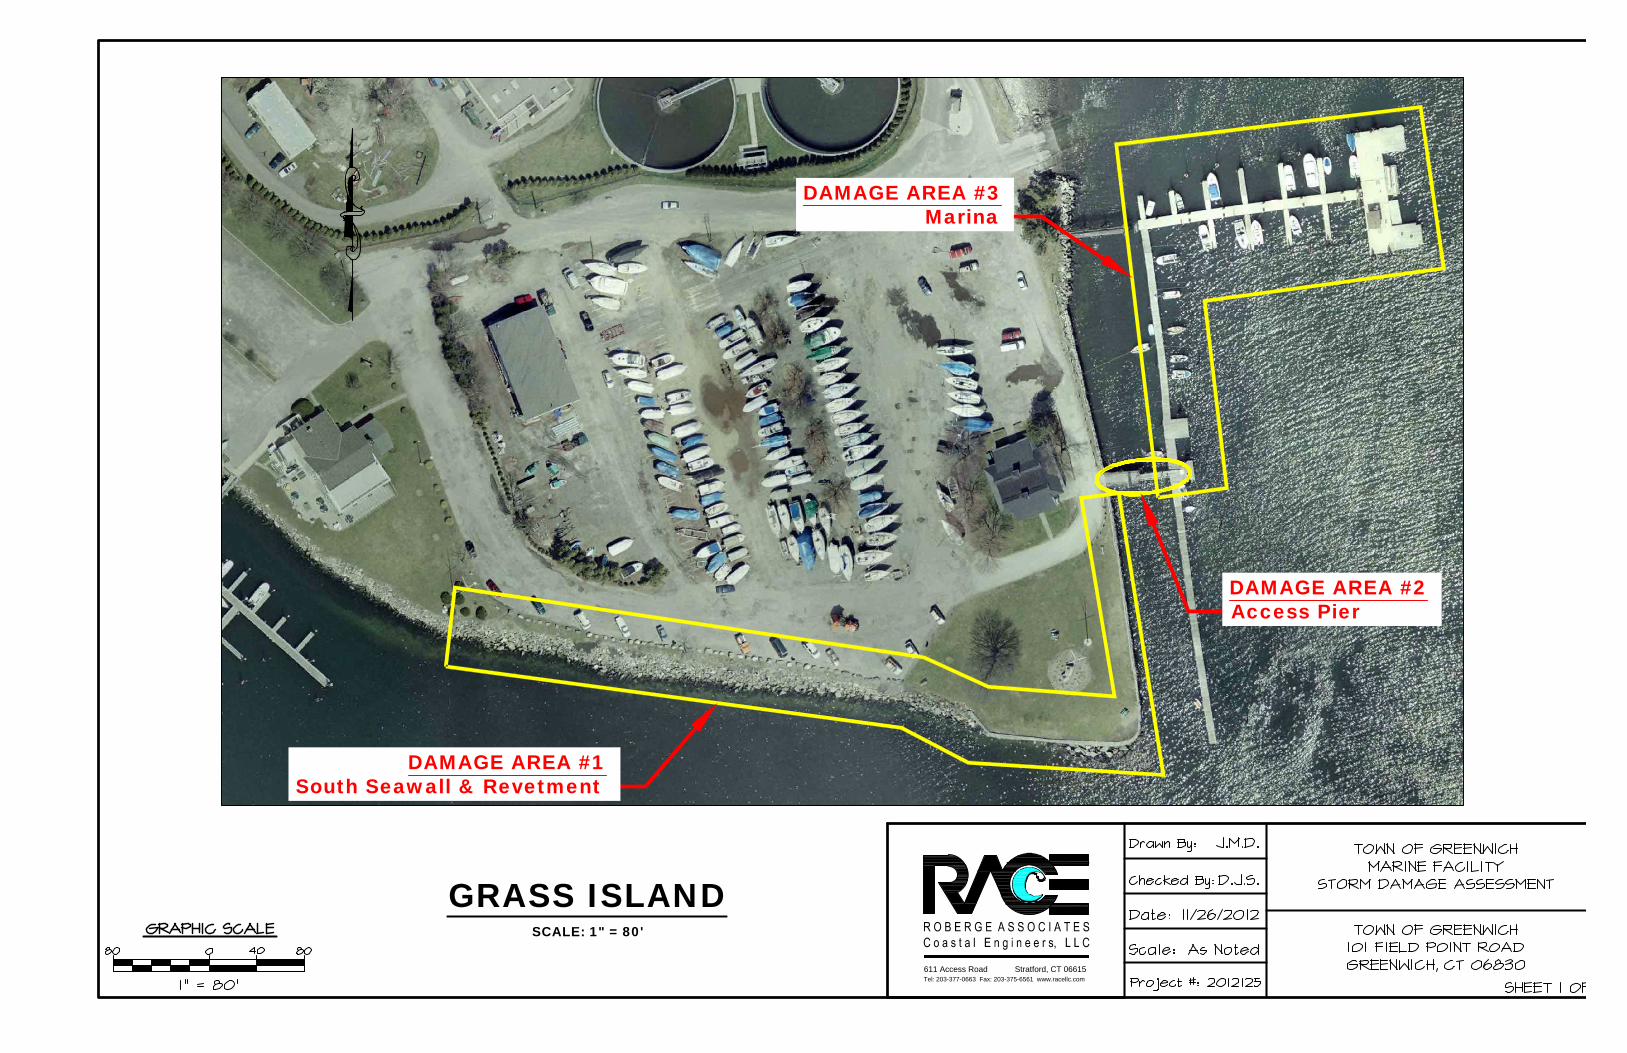
DAMAGE AREA #1South Seawall & Revetment
DAMAGE AREA #2Access Pier
DAMAGE AREA #3Marina
GRASS ISLANDSCALE: 1" = 80'
611 Access Road Stratford, CT 06615Tel: 203-377-0663 Fax: 203-375-6561 www.racellc.com

Town of Greenwich Marine Facility Storm Damage Assessment
ROBERGE ASSOCIATES COASTAL ENGINEERS, LLC
SECTION 3.4
Grass Island Representative Photographs

Town of Greenwich Marine Facility Storm Damage Assessment Section 3.4 – Grass Island Photographs
ROBERGE ASSOCIATES COASTAL ENGINEERS, LLC Page 1 of 5
DAMAGE AREA #1 – SOUTH POINT SEAWALL & REVETMENT
PHOTOGRAPH 1: Sinkholes
PHOTOGRAPH 2: Sinkholes

Town of Greenwich Marine Facility Storm Damage Assessment Section 3.4 – Grass Island Photographs
ROBERGE ASSOCIATES COASTAL ENGINEERS, LLC Page 2 of 5
PHOTOGRAPH 3: Erosion Along Top of Bank
PHOTOGRAPH 4: Missing Fence Posts
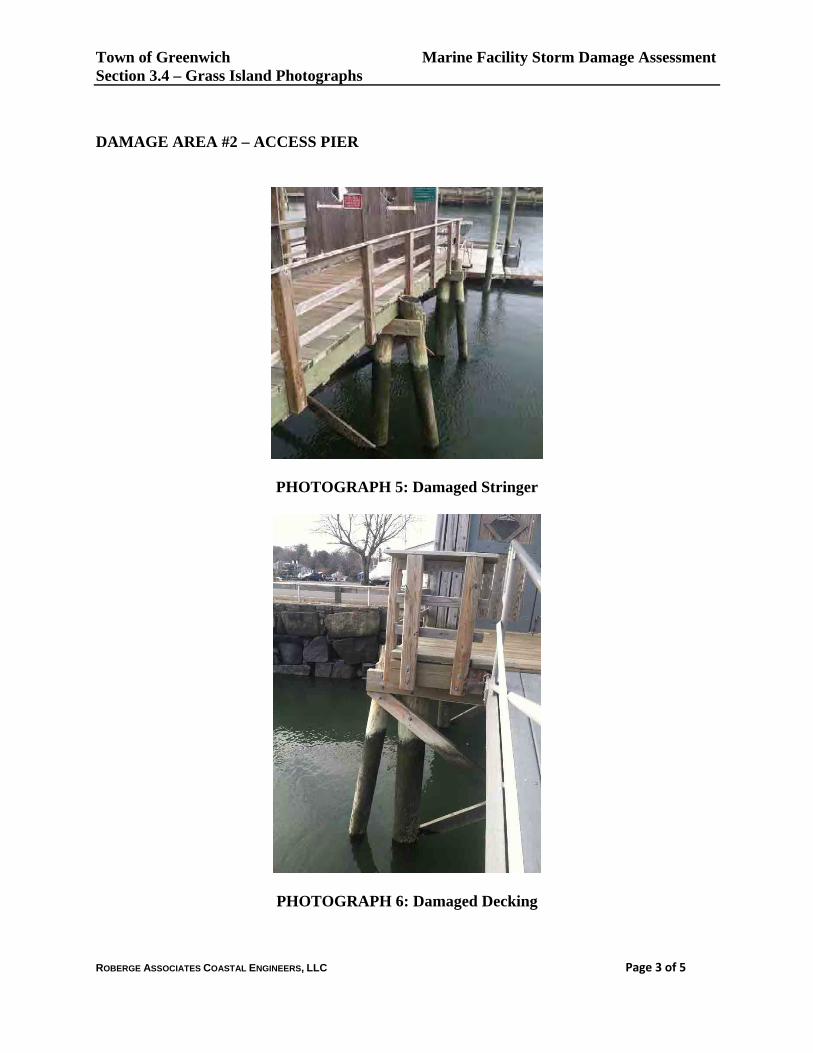
Town of Greenwich Marine Facility Storm Damage Assessment Section 3.4 – Grass Island Photographs
ROBERGE ASSOCIATES COASTAL ENGINEERS, LLC Page 3 of 5
DAMAGE AREA #2 – ACCESS PIER
PHOTOGRAPH 5: Damaged Stringer
PHOTOGRAPH 6: Damaged Decking

Town of Greenwich Marine Facility Storm Damage Assessment Section 3.4 – Grass Island Photographs
ROBERGE ASSOCIATES COASTAL ENGINEERS, LLC Page 4 of 5
PHOTOGRAPH 7: Damaged Gangway Handrail
DAMAGE AREA #3 – MARINA

Town of Greenwich Marine Facility Storm Damage Assessment Section 3.4 – Grass Island Photographs
ROBERGE ASSOCIATES COASTAL ENGINEERS, LLC Page 5 of 5
PHOTOGRAPH 8: Finger Dock Damage
PHOTOGRAPH 9: Rub Rail Damage

Town of Greenwich Marine Facility Storm Damage Assessment
ROBERGE ASSOCIATES COASTAL ENGINEERS, LLC
SECTION 4.0
Island Beach
Town of Greenwich Marine Facility Storm Damage Assessment
ROBERGE ASSOCIATES COASTAL ENGINEERS, LLC
SECTION 4.1
Island Beach Damage Summary Table

Town of Greenwich
Marine Facility Storm Damage Assessment
Project No. 2012125
SITE: Island Beach
DAMAGE AREA #1 ‐ PIER
Damage # Description Notes Photographs
1 East gangway Replace damaged gangway on east side of pierhead
2 Pier Replace +/‐215' pier, including all foundation piles, and
repair stone & masonry pierhead and enclosure structure.
1‐4
3 W t li R l ll t bl t li i i i l d 5 63 Waterlines Replace all potable water lines servicing island 5‐6
DAMAGE AREA #2 ‐CONCRETE PIER LANDING
Damage # Description Notes Photographs
1 Broken slabs Replace +/‐3,300sf of broken and displaced concrete slabs 7‐8
2 Guard rails Replace 250lf of timber guardrail2 Guard rails Replace 250lf of timber guardrail
3 Pavilion Replace beach pavilion 9
4 Erosion Fill +/‐15cy eroded areas on landside of concrete pier
landing
10
DAMAGE AREA #3 ‐ LOCKER ROOM
Damage # Description Notes PhotographsDamage # Description Notes Photographs
1 Damaged Seawall Replace 100' of damaged seawall 11‐12
2 Broken Sidewalk Dispose of existing damaged sidewalk and replace. Length
60' +/‐
3 Erosion Erosion area +/‐200' x 20' x 3'
4 Damaged steel cap on ssp 40' +/‐ broken cap 13
Deteriorated SSP SSP in advanced state of deterioration. Not storm related.
DAMAGE AREA #4 ‐PROPANE TANKS
Damage # Description Notes Photographs
1 Propane Tanks 2 Propane tanks displaced by buoyancy 14‐15
2 Fencing 50' of timber fence damaged
DAMAGE AREA #5 ‐WEST PARK AREA
Damage # Description Notes Photographs
1 Sink Holes & Erosion 600' +/‐ on landward side of wall 18
2 Precast Seawall Damage Numerous panels broken. Proposed repair to include
addition of revetment armoring along face of wall
16, 17
3 SSP & Cap 80' +/‐ Cap displaced. SSP in poor condition
4 Stone Seawall Damaged seawall area +/‐4' tall x 20' x 2'g /

Town of Greenwich Marine Facility Storm Damage Assessment
ROBERGE ASSOCIATES COASTAL ENGINEERS, LLC
SECTION 4.2
Island Beach Opinion of Probable Cost Tables

Opinion of Probable Costs
Project Information
Project Name: TOG Storm Damage ‐ Island Beach
Project Number: 2012125
Project Location: Greenwich, CT
Client: Town of Greenwich
Prepared By: D. Santa
Date: December 5, 2012
Cost Criteria
Project Manager 1.0%
General Conditions (note: increased to 15% due to island logistics) 15.0%
City Cost Index for Crew & Equipment 1.263
City Cost Index for Materials (see note 6) 1.000
Profit (on mat'ls and equip., see note 3 for profit on labor) 10.0%
Inflation 0.0%
Contingency 10.0%
Sales Tax on Materials 6.35%
Sales Tax on Labor (new construction only) 0.00%
Assumptions
1. Unrestricted site access with no disruptions
2. 2012 US Dollars
3. Standard Union Labor Rates Including O&P per RS Means adjusted for region.
4. Equipment Rates includes Profit only per RS Means adjusted for region.
5. City Cost Index for Crew per RS Means
6. City Cost Index = 1.0 for Materials provided by local supplier.
Summary of Costs
Professional Engineering Services 72,000$
Building Permit Fee ‐$
Mobilization & Demobilization 67,000$
Post Storm Site Clean Up (per Town of Greenwich) ‐$
Damage Area #1 ‐ Pier 816,500$
Damage Area #2 ‐ Concrete Pier Landing 221,000$
Damage Area #3 ‐ Southeast Point 130,600$
Damage Area #4 ‐ Propane Tanks 15,600$
Damage Area #5 ‐ West Park Area 223,100$
Total OPC 1,307,100$
ROBERGE ASSOCIATES COASTAL ENGINEERS, LLC

Professional Engineering Services
A. Task Description Fee Comments
Permit Applications 10,000$
Preparation of Contract Documents 45,000$
Engineering Svcs During Construction 15,000$
Record As‐Built Documents 2,000$
‐$
Subtotal 72,000$
B. Sub‐consultants Fee Comments
Boring Contractor ‐$
Geotechnical Engineer ‐$
Ecologist ‐$
Surveyor ‐$
‐$
Subtotal ‐$
C. Reimbursable Expenses Amount Comments
Application Fees ‐$
Photocopies ‐$
Travel ‐$
Hotel & Meals ‐$
‐$
Subtotal ‐$
Total (A+B+C) 72,000$
All sums are rounded up to the nearest $100.
ROBERGE ASSOCIATES COASTAL ENGINEERS, LLC

Mobilization & Demobilization
A. Materials & Products Quantity Units Unit $ Extended $ Comments
Consumables 1 LS 2,000.00$ 2,000$
‐$
‐$ ‐$
Subtotal 2,000$
City Cost Index 1.000 ‐$
Adjusted Cost 2,000$
Profit 10.00% 200$
Subtotal 2,200$
Sales Tax 6.35% 140$ State Sales Tax
Total Material Cost 2,400$
B. Installation Tasks Crew No. of Shifts $ Shift Extended $ Comments
Mobilization N/A N/A 50,000$ Estimate for Mobilization considering island location
Subtotal 50,000$
Sales Tax (New Construction Only) 0.00% ‐$
Subtotal 50,000$
C. Subcontractor / Other Quantity Units Unit $ Extended $ Comments
‐$
‐$
Subtotal ‐$
Profit 10.00% ‐$
Subtotal ‐$
Item Totals Total Comments
A+B+C 52,400$
Project Manager 1.0% 524$
General Conditions 15% 7,939$
Inflation 0% ‐$
Contingency 10% 6,086$
Total 67,000$
All sums are rounded up to the nearest $100.
ROBERGE ASSOCIATES COASTAL ENGINEERS, LLC

Damage Area 1 ‐ Access Pier
A. Materials & Products Quantity Units Unit $ Extended $ Comments
Replacement gangway 1 ls 8,000.00$ 8,000$
Timber piles 2400 lf 10.00$ 24,000$ 48 Class B Piles
Pile caps 576 lf 10.80$ 6,221$ 6x12
Bracing 691 lf 7.58$ 5,238$ 4x12
Stringers 2840 lf 7.58$ 21,527$ 4x12
Decking 3655 lf 4.26$ 15,570$ 3x10
Blocking 440 lf 2.25$ 990$ 4x4
Guardrail material 75 lf 415.00$ 31,125$
Misc hardware 1 ls 5,000.00$ 5,000$ Galv fasteners
Plumbing materials 1 ls 5,000.00$ 5,000$
Debris containers 30 ea 500.00$ 15,000$
Subtotal 137,671$
City Cost Index 1.000 ‐$
Adjusted Cost 137,671$
Profit 10.00% 13,767$
Subtotal 151,438$
Sales Tax 6.35% 9,616$ State Sales Tax
Total Material Cost 161,100$
B. Installation Tasks Crew No. of Shifts $ Shift Extended $ Comments
Demo pier 2 5.0 7,485.57$ 37,428$
Repair pierhead 2 3.0 7,485.57$ 22,457$
Install & proof piles 1 15.0 8,309.15$ 124,637$
Install caps & bracing 2 12.0 7,485.57$ 89,827$
Install stringers & blocking 2 15.0 7,485.57$ 112,284$
Install decking 4 7.0 2,951.88$ 20,663$
Install guardrail 4 5.0 2,951.88$ 14,759$
Repair potable water lines 5 5.0 1,803.06$ 9,015$
Material barge support 3 20.0 2,338.07$ 46,761$
Subtotal 477,832$
Sales Tax (New Construction Only) 0.00% ‐$
Subtotal 477,900$
C. Subcontractor / Other Quantity Units Unit $ Extended $ Comments
‐$
‐$
Subtotal ‐$
Profit 0.00% ‐$
Subtotal ‐$
Item Totals Total Comments
A+B+C 639,000$
Project Manager 1.0% 6,390$
General Conditions 15% 96,809$
Inflation 0% ‐$
Contingency 10% 74,220$
Total 816,500$
All sums are rounded up to the nearest $100.
ROBERGE ASSOCIATES COASTAL ENGINEERS, LLC

Damage Area 2 ‐ Concrete Pier Landing
A. Materials & Products Quantity Units Unit $ Extended $ Comments
Precast concrete slabs 3300 sf 13.00$ 42,900$
Guardrail materials 250 lf 75.00$ 18,750$
Beach pavilion materials 1 ls 7,500.00$ 7,500$
Fill material 15 cy 64.00$ 960$ Fill material based on $35/cy on mainland and
transported to site by barge and rehandled by
clamshell on island.
Misc. hardware 1 ls 5,000.00$ 5,000$
Debris containers 25 ea 500.00$ 12,500$
Subtotal 87,610$
City Cost Index 1.000 ‐$
Adjusted Cost 87,610$
Profit 10.00% 8,761$
Subtotal 96,371$
Sales Tax 6.35% 6,120$ State Sales Tax
Total Material Cost 102,500$
B. Installation Tasks Crew No. of Shifts $ Shift Extended $ Comments
Demo exist slabs 6 4.0 2,719.39$ 10,878$
Rehandle debris to material barge 7 2.0 2,882.04$ 5,764$
Deliver debris material to mainland 3 1.0 2,338.07$ 2,338$
Installation of new slabs 6 7.0 2,719.39$ 19,036$
Installation of new slabs 4 7.0 2,951.88$ 20,663$
Reconstruct beach pavilion 4 3.0 2,951.88$ 8,856$
Fill and grade eroded area 8 1.0 2,791.23$ 2,791$
Subtotal 70,326$
Sales Tax (New Construction Only) 0.00% ‐$
Subtotal 70,400$
C. Subcontractor / Other Quantity Units Unit $ Extended $ Comments
‐$
‐$
Subtotal ‐$
Profit 0.00% ‐$
Subtotal ‐$
Item Totals Total Comments
A+B+C 172,900$
Project Manager 1.0% 1,729$
General Conditions 15% 26,194$
Inflation 0% ‐$
Contingency 10% 20,082$
Total 221,000$
All sums are rounded up to the nearest $100.
ROBERGE ASSOCIATES COASTAL ENGINEERS, LLC

Damage Area #3 ‐ Southeast Point
A. Materials & Products Quantity Units Unit $ Extended $ Comments
Debris containers 5 ea 500.00$ 2,500$
Seawall materials 20 cy 64.00$ 1,280$ Material based on $35/cy on mainland and
transported to site by barge and rehandled by
clamshell on island.
Fill materials 450 cy 64.00$ 28,800$ Material based on $35/cy on mainland and
transported to site by barge and rehandled by
clamshell on island.
Precast sidewalk 240 sf 15.00$ 3,600$
Misc materials 1 ls 3,000.00$ 3,000$
Subtotal 39,180$
City Cost Index 1.000 ‐$
Adjusted Cost 39,180$
Profit 10.00% 3,918$
Subtotal 43,098$
Sales Tax 6.35% 2,737$ State Sales Tax
Total Material Cost 45,900$
B. Installation Tasks Crew No. of Shifts $ Shift Extended $ Comments
Demo & remove sidewalk 6 2.0 2,719.39$ 5,439$
Transport debris to mainland 3 1.0 2,338.07$ 2,338$
Haul seawall materials from beach 8 0.5 2,791.23$ 1,396$
Reconstruct wall 6 10.0 2,719.39$ 27,194$
Fill eroded area 8 2.0 2,791.23$ 5,582$
Replace sidewalk 6 2.0 2,719.39$ 5,439$
Misc SSP repairs 4 3.0 2,951.88$ 8,856$
Subtotal 56,243$
Sales Tax (New Construction Only) 0.00% ‐$
Subtotal 56,300$
C. Subcontractor / Other Quantity Units Unit $ Extended $ Comments
‐$
‐$
Subtotal ‐$
Profit 0.00% ‐$
Subtotal ‐$
Item Totals Total Comments
A+B+C 102,200$
Project Manager 1.0% 1,022$
General Conditions 15% 15,483$
Inflation 0% ‐$
Contingency 10% 11,871$
Total 130,600$
All sums are rounded up to the nearest $100.
ROBERGE ASSOCIATES COASTAL ENGINEERS, LLC

Damage Area #4 ‐ Propane Tank Area
A. Materials & Products Quantity Units Unit $ Extended $ Comments
Anchor blocks & misc hardware 1 ls 2,000.00$ 2,000$
Fence 1 ls 1,500.00$ 1,500$
‐$
‐$
Subtotal 3,500$
City Cost Index 1.000 ‐$
Adjusted Cost 3,500$
Profit 10.00% 350$
Subtotal 3,850$
Sales Tax 6.35% 244$ State Sales Tax
Total Material Cost 4,100$
B. Installation Tasks Crew No. of Shifts $ Shift Extended $ Comments
Install anchor blocks and secure tanks 6 1.0 2,719.39$ 2,719$
Install fence 4 1.0 2,951.88$ 2,952$
Material barge support 3 1.0 2,338.07$ 2,338$
‐$
‐$
‐$
‐$
Subtotal 8,009$
Sales Tax (New Construction Only) 0.00% ‐$
Subtotal 8,100$
C. Subcontractor / Other Quantity Units Unit $ Extended $ Comments
‐$
‐$
Subtotal ‐$
Profit 0.00% ‐$
Subtotal ‐$
Item Totals Total Comments
A+B+C 12,200$
Project Manager 1.0% 122$
General Conditions 15% 1,848$
Inflation 0% ‐$
Contingency 10% 1,417$
Total 15,600$
All sums are rounded up to the nearest $100.
ROBERGE ASSOCIATES COASTAL ENGINEERS, LLC
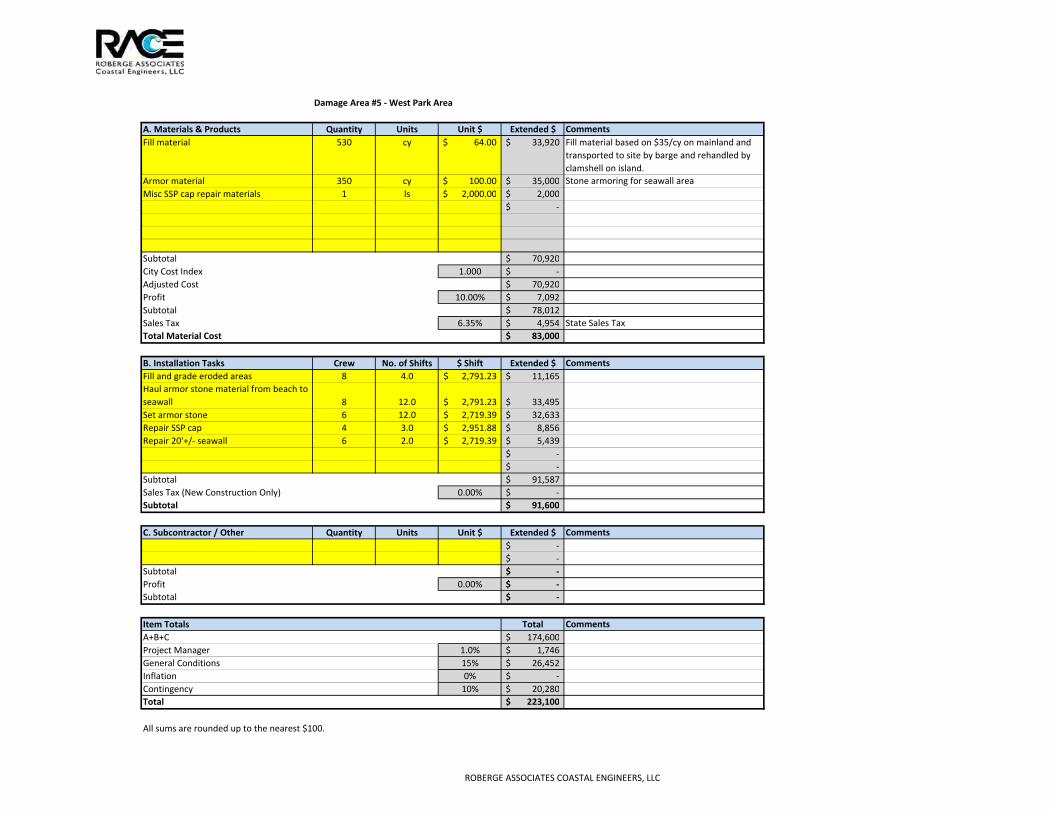
Damage Area #5 ‐ West Park Area
A. Materials & Products Quantity Units Unit $ Extended $ Comments
Fill material 530 cy 64.00$ 33,920$ Fill material based on $35/cy on mainland and
transported to site by barge and rehandled by
clamshell on island.
Armor material 350 cy 100.00$ 35,000$ Stone armoring for seawall area
Misc SSP cap repair materials 1 ls 2,000.00$ 2,000$
‐$
Subtotal 70,920$
City Cost Index 1.000 ‐$
Adjusted Cost 70,920$
Profit 10.00% 7,092$
Subtotal 78,012$
Sales Tax 6.35% 4,954$ State Sales Tax
Total Material Cost 83,000$
B. Installation Tasks Crew No. of Shifts $ Shift Extended $ Comments
Fill and grade eroded areas 8 4.0 2,791.23$ 11,165$
Haul armor stone material from beach to
seawall 8 12.0 2,791.23$ 33,495$
Set armor stone 6 12.0 2,719.39$ 32,633$
Repair SSP cap 4 3.0 2,951.88$ 8,856$
Repair 20'+/‐ seawall 6 2.0 2,719.39$ 5,439$
‐$
‐$
Subtotal 91,587$
Sales Tax (New Construction Only) 0.00% ‐$
Subtotal 91,600$
C. Subcontractor / Other Quantity Units Unit $ Extended $ Comments
‐$
‐$
Subtotal ‐$
Profit 0.00% ‐$
Subtotal ‐$
Item Totals Total Comments
A+B+C 174,600$
Project Manager 1.0% 1,746$
General Conditions 15% 26,452$
Inflation 0% ‐$
Contingency 10% 20,280$
Total 223,100$
All sums are rounded up to the nearest $100.
ROBERGE ASSOCIATES COASTAL ENGINEERS, LLC

Crew 1 Barge Crew ‐ Pile driving
A. Labor Bare Cost Incl. O&P
Dockbuilder (foreman) 44.80$ 72.00$
Dockbuilder 42.80$ 68.80$
Dockbuilder 42.80$ 68.80$
Equipment Operator 47.80$ 72.15$
Oiler 41.25$ 62.25$
Subtotal 344.00$
Hours per Shift 8
Total Shift Labor Rate 2,752.00$
B. Equipment Bare Cost (Daily) Incl. Profit (Daily)
Barge 779.20$ 857.12$
Pushboat 800.00$ 880.00$
Crane 1,257.00$ 1,382.70$
Diesel hammer 592.80$ 652.08$
Misc tools 50.00$ 55.00$
Subtotal 3,826.90$
Adjustment for variable Shift ‐$
Total Shift Equipment Rate 3,826.90$
Total Daily Crew Rate 6,578.90$
City Cost Index 1.263 1,730.25$
Adjusted Daily Crew Rate 8,309.15$
ROBERGE ASSOCIATES COASTAL ENGINEERS, LLC

Crew 2 Barge Crew ‐ Dockbuilding
A. Labor Bare Cost Incl. O&P
Dockbuilder (foreman) 44.80$ 72.00$
Dockbuilder 42.80$ 68.80$
Dockbuilder 42.80$ 68.80$
Equipment Operator 47.80$ 72.15$
Oiler 41.25$ 62.25$
Subtotal 344.00$
Hours per Shift 8
Total Shift Labor Rate 2,752.00$
B. Equipment Bare Cost (Daily) Incl. Profit (Daily)
Barge 779.20$ 857.12$
Pushboat 800.00$ 880.00$
Crane 1,257.00$ 1,382.70$
Misc tools 50.00$ 55.00$
Subtotal 3,174.82$
Adjustment for variable Shift ‐$
Total Shift Equipment Rate 3,174.82$
Total Daily Crew Rate 5,926.82$
City Cost Index 1.263 1,558.75$
Adjusted Daily Crew Rate 7,485.57$
ROBERGE ASSOCIATES COASTAL ENGINEERS, LLC

Crew 3 Material Barge
A. Labor Bare Cost Incl. O&P
Equipment Operator 46.55$ 70.25$
Laborer 35.10$ 54.00$
Subtotal 124.25$
Hours per Shift 8
Total Shift Labor Rate 994.00$
B. Equipment Bare Cost (Daily) Incl. Profit (Daily)
Deck barge 779.20$ 857.20$
Push boat 800.00$ 880.00$
Subtotal 857.20$
Adjustment for variable Shift ‐$
Total Shift Equipment Rate 857.20$
Total Daily Crew Rate 1,851.20$
City Cost Index 1.263 486.87$
Adjusted Daily Crew Rate 2,338.07$
ROBERGE ASSOCIATES COASTAL ENGINEERS, LLC

Crew 4 Dockbuilder Crew
A. Labor Bare Cost Incl. O&P
Dockbuilder (foreman) 44.80$ 72.00$
Dockbuilder 42.80$ 68.80$
Dockbuilder 42.80$ 68.80$
Dockbuilder 42.80$ 68.80$
Subtotal 278.40$
Hours per Shift 8
Total Shift Labor Rate 2,227.20$
B. Equipment Bare Cost (Daily) Incl. Profit (Daily)
Misc tools 100.00$ 110.00$
Subtotal 110.00$
Adjustment for variable Shift ‐$
Total Shift Equipment Rate 110.00$
Total Daily Crew Rate 2,337.20$
City Cost Index 1.263 614.68$
Adjusted Daily Crew Rate 2,951.88$
ROBERGE ASSOCIATES COASTAL ENGINEERS, LLC

Crew 5 Plumbing Crew
A. Labor Bare Cost Incl. O&P
Plumber 54.60$ 82.35$
Plumber 54.60$ 82.35$
Subtotal 164.70$
Hours per Shift 8
Total Shift Labor Rate 1,317.60$
B. Equipment Bare Cost (Daily) Incl. Profit (Daily)
Misc tools 100.00$ 110.00$
Subtotal 110.00$
Adjustment for variable Shift ‐$
Total Shift Equipment Rate 110.00$
Total Daily Crew Rate 1,427.60$
City Cost Index 1.263 375.46$
Adjusted Daily Crew Rate 1,803.06$
ROBERGE ASSOCIATES COASTAL ENGINEERS, LLC

Crew 6 Excavator Crew
A. Labor Bare Cost Incl. O&P
Operator 47.80$ 72.15$
Laborer 35.10$ 54.00$
Laborer 35.10$ 54.00$
Subtotal 180.15$
Hours per Shift 8
Total Shift Labor Rate 1,441.20$
B. Equipment Bare Cost (Daily) Incl. Profit (Daily)
Hydraulic Excavator 647.20$ 711.92$
Subtotal 711.92$
Adjustment for variable Shift ‐$
Total Shift Equipment Rate 711.92$
Total Daily Crew Rate 2,153.12$
City Cost Index 1.263 566.27$
Adjusted Daily Crew Rate 2,719.39$
ROBERGE ASSOCIATES COASTAL ENGINEERS, LLC
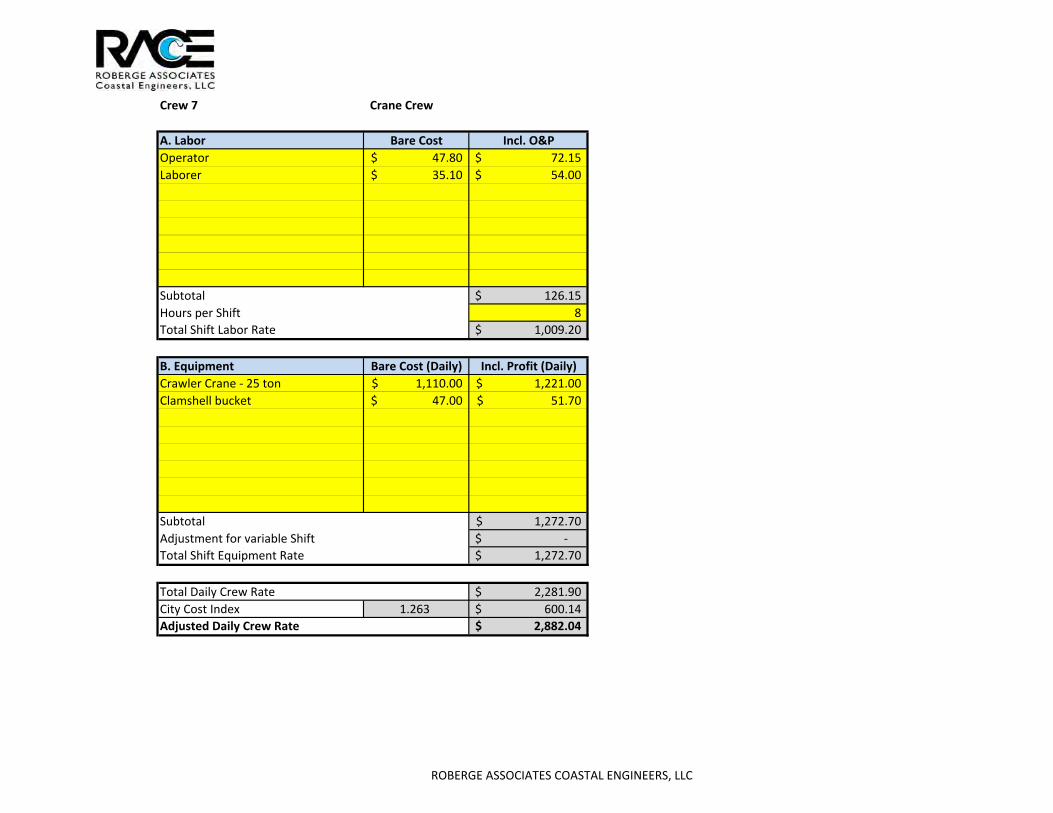
Crew 7 Crane Crew
A. Labor Bare Cost Incl. O&P
Operator 47.80$ 72.15$
Laborer 35.10$ 54.00$
Subtotal 126.15$
Hours per Shift 8
Total Shift Labor Rate 1,009.20$
B. Equipment Bare Cost (Daily) Incl. Profit (Daily)
Crawler Crane ‐ 25 ton 1,110.00$ 1,221.00$
Clamshell bucket 47.00$ 51.70$
Subtotal 1,272.70$
Adjustment for variable Shift ‐$
Total Shift Equipment Rate 1,272.70$
Total Daily Crew Rate 2,281.90$
City Cost Index 1.263 600.14$
Adjusted Daily Crew Rate 2,882.04$
ROBERGE ASSOCIATES COASTAL ENGINEERS, LLC

Crew 8 Loader
A. Labor Bare Cost Incl. O&P
Operator 46.55$ 70.25$
Laborer 35.10$ 54.00$
Subtotal 124.25$
Hours per Shift 8
Total Shift Labor Rate 994.00$
B. Equipment Bare Cost (Daily) Incl. Profit (Daily)
Crawler Loader 1,106.00$ 1,216.00$
Subtotal 1,216.00$
Adjustment for variable Shift ‐$
Total Shift Equipment Rate 1,216.00$
Total Daily Crew Rate 2,210.00$
City Cost Index 1.263 581.23$
Adjusted Daily Crew Rate 2,791.23$
ROBERGE ASSOCIATES COASTAL ENGINEERS, LLC

Town of Greenwich Marine Facility Storm Damage Assessment
ROBERGE ASSOCIATES COASTAL ENGINEERS, LLC
SECTION 4.3
Island Beach Aerial Photograph with Damage
Locations

DAMAGE AREA #1Pier Area
DAMAGE AREA #3Southeast Point
DAMAGE AREA #2Concrete Pier Landing
DAMAGE AREA #4Propane Tank Area
DAMAGE AREA #5West Park Area
ISLAND BEACHSCALE: 1" = 100'
611 Access Road Stratford, CT 06615Tel: 203-377-0663 Fax: 203-375-6561 www.racellc.com

Town of Greenwich Marine Facility Storm Damage Assessment
ROBERGE ASSOCIATES COASTAL ENGINEERS, LLC
SECTION 4.4
Island Beach Representative Photographs

Town of Greenwich Marine Facility Storm Damage Assessment Section 4.4 – Island Beach Photographs
ROBERGE ASSOCIATES COASTAL ENGINEERS, LLC Page 1 of 10
DAMAGE AREA #1 – PIER
PHOTOGRAPH 1: Destroyed Pier
PHOTOGRAPH 2: Destroyed Pier
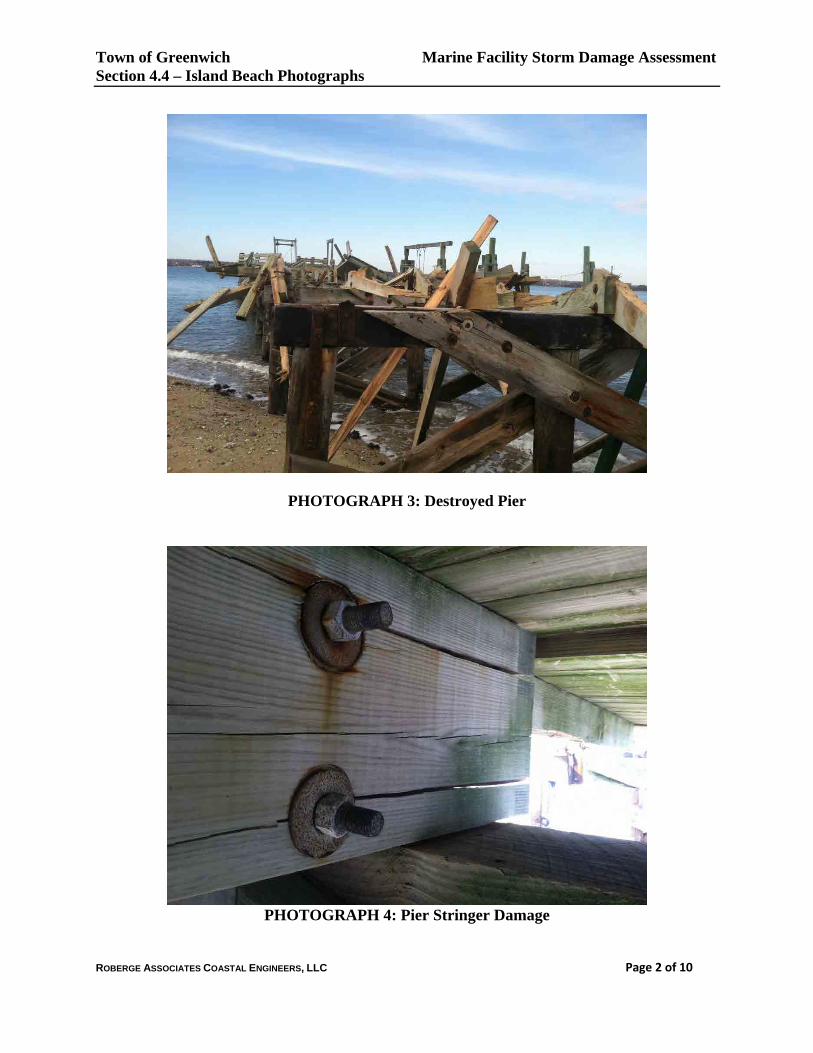
Town of Greenwich Marine Facility Storm Damage Assessment Section 4.4 – Island Beach Photographs
ROBERGE ASSOCIATES COASTAL ENGINEERS, LLC Page 2 of 10
PHOTOGRAPH 3: Destroyed Pier
PHOTOGRAPH 4: Pier Stringer Damage
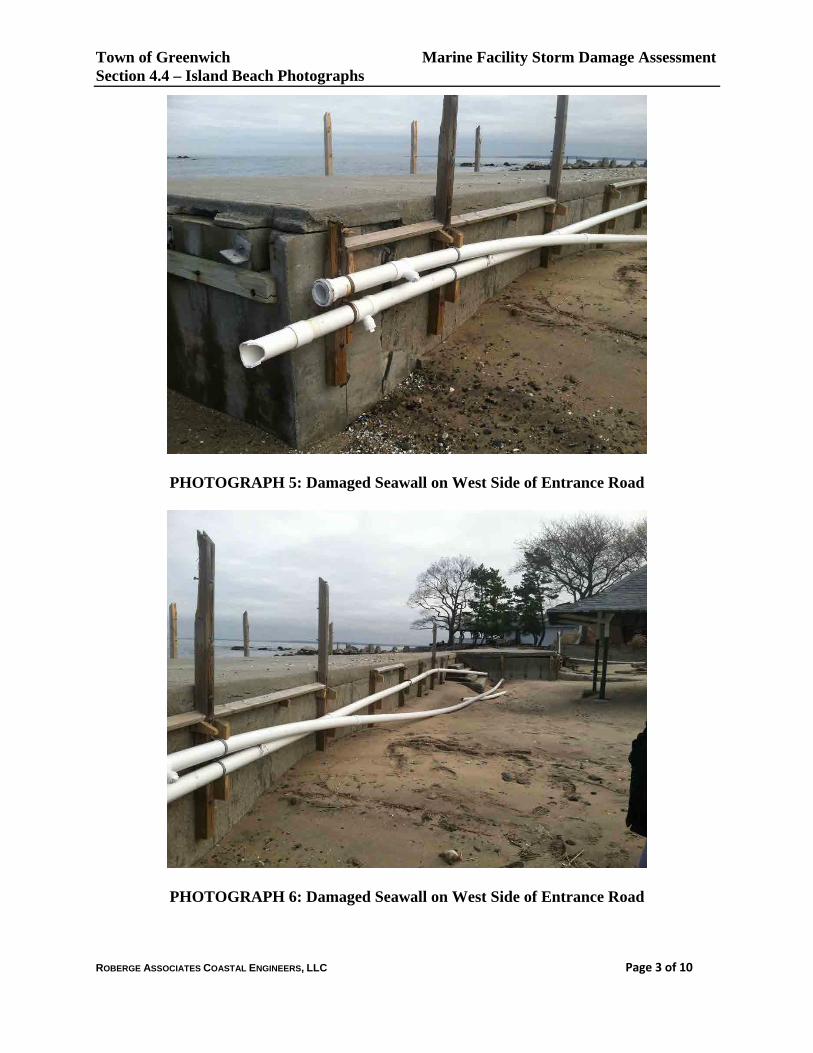
Town of Greenwich Marine Facility Storm Damage Assessment Section 4.4 – Island Beach Photographs
ROBERGE ASSOCIATES COASTAL ENGINEERS, LLC Page 3 of 10
PHOTOGRAPH 5: Damaged Seawall on West Side of Entrance Road
PHOTOGRAPH 6: Damaged Seawall on West Side of Entrance Road

Town of Greenwich Marine Facility Storm Damage Assessment Section 4.4 – Island Beach Photographs
ROBERGE ASSOCIATES COASTAL ENGINEERS, LLC Page 4 of 10
DAMAGE AREA #2 – CONCRETE PIER LANDING
PHOTOGRAPH 7: Destroyed Concrete Slabs
PHOTOGRAPH 8: Destroyed Concrete Slabs
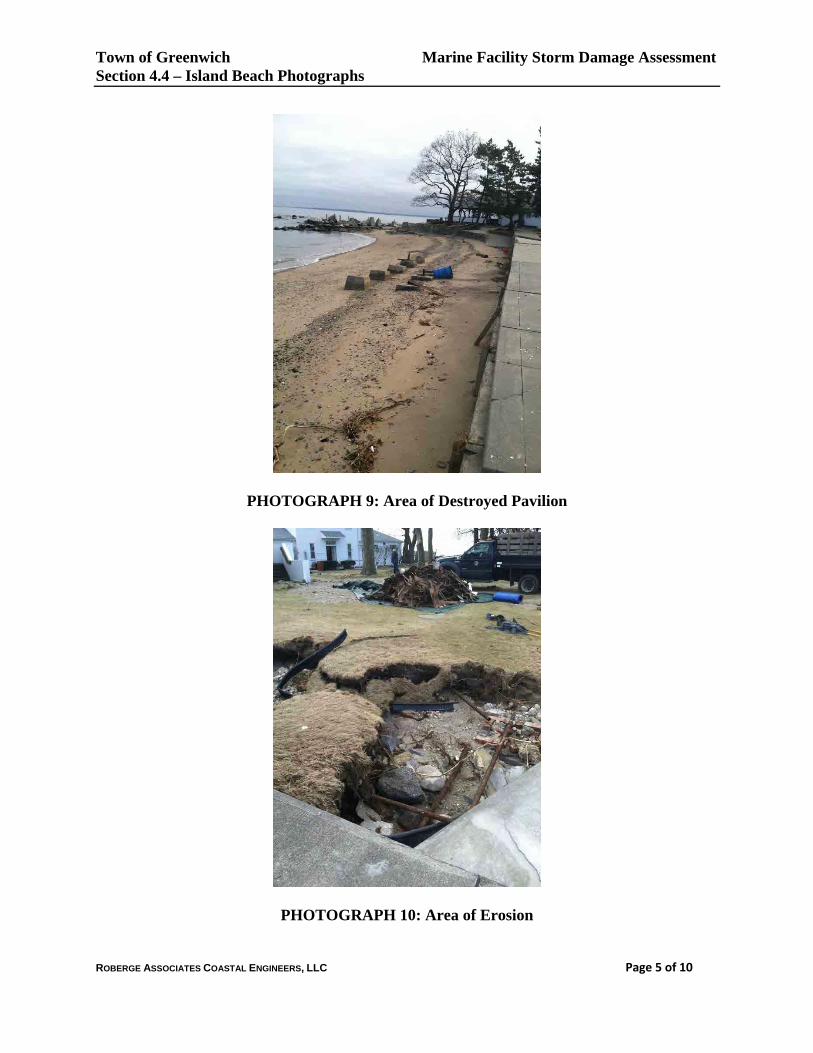
Town of Greenwich Marine Facility Storm Damage Assessment Section 4.4 – Island Beach Photographs
ROBERGE ASSOCIATES COASTAL ENGINEERS, LLC Page 5 of 10
PHOTOGRAPH 9: Area of Destroyed Pavilion
PHOTOGRAPH 10: Area of Erosion
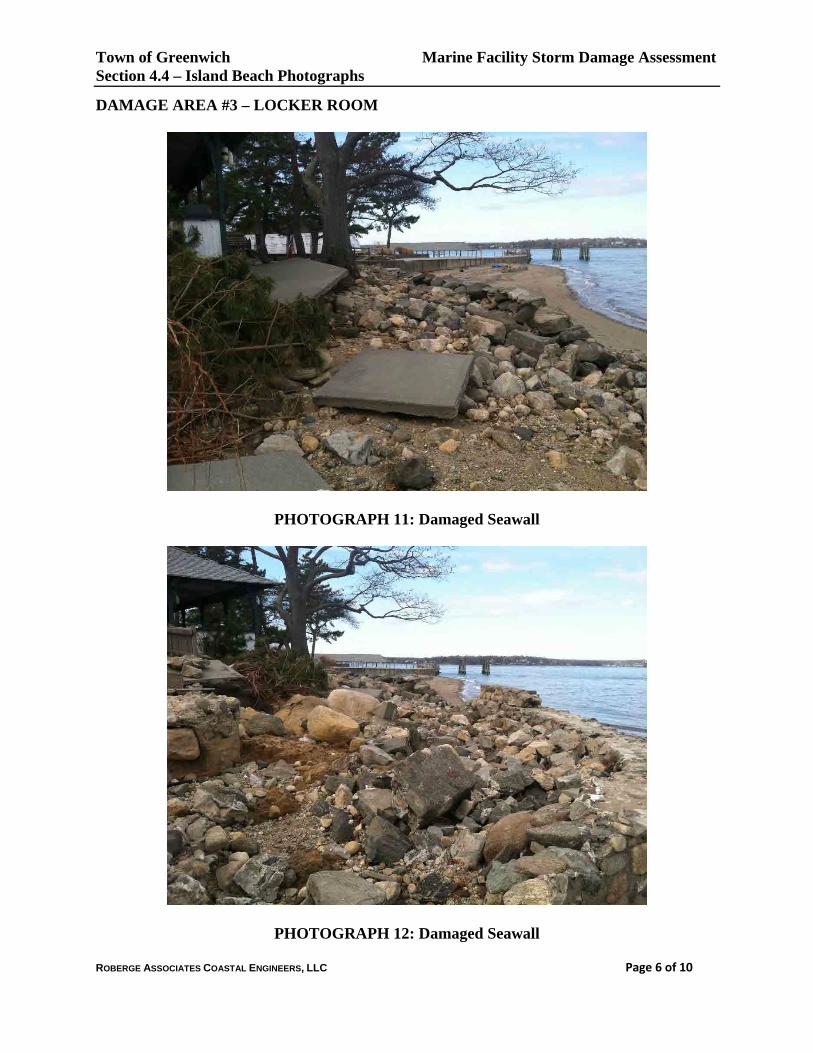
Town of Greenwich Marine Facility Storm Damage Assessment Section 4.4 – Island Beach Photographs
ROBERGE ASSOCIATES COASTAL ENGINEERS, LLC Page 6 of 10
DAMAGE AREA #3 – LOCKER ROOM
PHOTOGRAPH 11: Damaged Seawall
PHOTOGRAPH 12: Damaged Seawall

Town of Greenwich Marine Facility Storm Damage Assessment Section 4.4 – Island Beach Photographs
ROBERGE ASSOCIATES COASTAL ENGINEERS, LLC Page 7 of 10
PHOTOGRAPH 13: Damaged Steel Cap on Sheet Pile

Town of Greenwich Marine Facility Storm Damage Assessment Section 4.4 – Island Beach Photographs
ROBERGE ASSOCIATES COASTAL ENGINEERS, LLC Page 8 of 10
DAMAGE AREA #4 – PROPOANE TANKS
PHOTOGRAPH 14: Displaced Propane Tanks
PHOTOGRAPH 15: Displaced Propane Tanks

Town of Greenwich Marine Facility Storm Damage Assessment Section 4.4 – Island Beach Photographs
ROBERGE ASSOCIATES COASTAL ENGINEERS, LLC Page 9 of 10
PHOTOGRAPH 16: Damaged Concrete Seawall

Town of Greenwich Marine Facility Storm Damage Assessment Section 4.4 – Island Beach Photographs
ROBERGE ASSOCIATES COASTAL ENGINEERS, LLC Page 10 of 10
DAMAGE AREA #5 – WEST PARK AREA
PHOTOGRAPH 17: Damaged Seawall
PHOTOGRAPH 18: Sink Holes & Erosion

Town of Greenwich Marine Facility Storm Damage Assessment
ROBERGE ASSOCIATES COASTAL ENGINEERS, LLC
SECTION 5.0
Great Captains Island

Town of Greenwich Marine Facility Storm Damage Assessment
ROBERGE ASSOCIATES COASTAL ENGINEERS, LLC
SECTION 5.1
Great Captains Island Damage Summary Table

Town of Greenwich
Marine Facility Storm Damage Assessment
Project No. 2012125
SITE: Great Captain Island
DAMAGE AREA #1 ‐ PIER
Damage # Description Notes Photographs
1 Landward end of pier Undermined & shifted 1
2 Landward 4 Pile bents Uplift damage. Pier raised +/‐1' due to storm damage 2
3 Di l B i N B k 33 Diagonal Bracing Numerous Broken 3
4 Gangway Hinge Damage
DAMAGE AREA #2 ‐SOUTH ESCARPMENT
Damage # Description Notes Photographs
1 Erosion Loss of shoreline & vegetation 4‐5
DAMAGE AREA #3 ‐WEST END CAUSEWAY
Damage # Description Notes Photographs
1 Concrete walkway Loss of 30' x10' section of walkway 6
2 Stairway Concrete foundation undermined 7
3 Erosion 100' x 30' x 2' Area 8
Town of Greenwich Marine Facility Storm Damage Assessment
ROBERGE ASSOCIATES COASTAL ENGINEERS, LLC
SECTION 5.2
Great Captains Island Opinion of Probable Cost Tables

Opinion of Probable Costs
Project Information
Project Name: TOG Storm Damage ‐ Great Captain
Project Number: 2012125
Project Location: Greenwich, CT
Client: Town of Greenwich
Prepared By: D. Santa
Date: December 5, 2012
Cost Criteria
Project Manager 1.0%
General Conditions (note: increased to 15% due to island logistics) 15.0%
City Cost Index for Crew & Equipment 1.263
City Cost Index for Materials (see note 6) 1.000
Profit (on mat'ls and equip., see note 3 for profit on labor) 10.0%
Inflation 0.0%
Contingency 10.0%
Sales Tax on Materials 6.35%
Sales Tax on Labor (new construction only) 0.00%
Assumptions
1. Unrestricted site access with no disruptions
2. 2012 US Dollars
3. Standard Union Labor Rates Including O&P per RS Means adjusted for region.
4. Equipment Rates includes Profit only per RS Means adjusted for region.
5. City Cost Index for Crew per RS Means
6. City Cost Index = 1.0 for Materials provided by local supplier.
Summary of Costs
Professional Engineering Services 42,000$
Building Permit Fee ‐$
Mobilization & Demobilization 67,000$
Post Storm Site Clean Up (per Town of Greenwich) ‐$
Damage Area #1 ‐ Access Pier 143,300$
Damage Area #2 ‐ South Escarpment 291,700$
Damage Area #3 ‐ Concrete Walkway 130,600$
Damage Area #4 ‐ West End of Causeway 44,900$
Total OPC 674,600$
ROBERGE ASSOCIATES COASTAL ENGINEERS, LLC

Professional Engineering Services
A. Task Description Fee Comments
Permit Applications 5,000$
Preparation of Contract Documents 25,000$
Engineering Svcs During Construction 10,000$
Record As‐Built Documents 2,000$
‐$
Subtotal 42,000$
B. Sub‐consultants Fee Comments
Boring Contractor ‐$
Geotechnical Engineer ‐$
Ecologist ‐$
Surveyor ‐$
‐$
Subtotal ‐$
C. Reimbursable Expenses Amount Comments
Application Fees ‐$
Photocopies ‐$
Travel ‐$
Hotel & Meals ‐$
‐$
Subtotal ‐$
Total (A+B+C) 42,000$
All sums are rounded up to the nearest $100.
ROBERGE ASSOCIATES COASTAL ENGINEERS, LLC

Mobilization & Demobilization
A. Materials & Products Quantity Units Unit $ Extended $ Comments
Consumables 1 LS 2,000.00$ 2,000$
‐$
‐$ ‐$
Subtotal 2,000$
City Cost Index 1.000 ‐$
Adjusted Cost 2,000$
Profit 10.00% 200$
Subtotal 2,200$
Sales Tax 6.35% 140$ State Sales Tax
Total Material Cost 2,400$
B. Installation Tasks Crew No. of Shifts $ Shift Extended $ Comments
Mobilization N/A N/A 50,000$ Estimate for Mobilization considering island location
Subtotal 50,000$
Sales Tax (New Construction Only) 0.00% ‐$
Subtotal 50,000$
C. Subcontractor / Other Quantity Units Unit $ Extended $ Comments
‐$
‐$
Subtotal ‐$
Profit 10.00% ‐$
Subtotal ‐$
Item Totals Total Comments
A+B+C 52,400$
Project Manager 1.0% 524$
General Conditions 15% 7,939$
Inflation 0% ‐$
Contingency 10% 6,086$
Total 67,000$
All sums are rounded up to the nearest $100.
ROBERGE ASSOCIATES COASTAL ENGINEERS, LLC

Damage Area 1 ‐ Access Pier
A. Materials & Products Quantity Units Unit $ Extended $ Comments
Replacement gangway 1 ls 8,000.00$ 8,000$
Timber piles 336 lf 10.00$ 3,360$ 8 Class B Piles
Pile caps 77 lf 10.80$ 832$ 6x12
Bracing 216 lf 7.58$ 1,637$ 4x12
Stringers 330 lf 7.58$ 2,501$ 4x12
Decking 624 lf 4.26$ 2,658$ 3x10
Blocking 48 lf 2.25$ 108$ 4x4
Guardrail material 75 lf 100.00$ 7,500$
Misc hardware 1 ls 2,500.00$ 2,500$ Galv fasteners
Debris containers 10 ea 500.00$ 5,000$
Subtotal 34,097$
City Cost Index 1.000 ‐$
Adjusted Cost 34,097$
Profit 10.00% 3,410$
Subtotal 37,506$
Sales Tax 6.35% 2,382$ State Sales Tax
Total Material Cost 39,900$
B. Installation Tasks Crew No. of Shifts $ Shift Extended $ Comments
Demo landward 50' of pier 2 1.0 7,485.57$ 7,486$
Install and proof 8 piles 1 2.0 8,309.15$ 16,618$
Pier reconstruction 2 5.0 7,485.57$ 37,428$ Including replacement of landward 50', diagonal
bracing repair, gangway replacement
Install guardrail 4 2.0 2,951.88$ 5,904$
Material barge support 3 2.0 2,338.07$ 4,676$
Subtotal 72,112$
Sales Tax (New Construction Only) 0.00% ‐$
Subtotal 72,200$
C. Subcontractor / Other Quantity Units Unit $ Extended $ Comments
‐$
‐$
Subtotal ‐$
Profit 0.00% ‐$
Subtotal ‐$
Item Totals Total Comments
A+B+C 112,100$
Project Manager 1.0% 1,121$
General Conditions 15% 16,983$
Inflation 0% ‐$
Contingency 10% 13,020$
Total 143,300$
All sums are rounded up to the nearest $100.
ROBERGE ASSOCIATES COASTAL ENGINEERS, LLC

Damage Area 2 ‐ South Escarpment
A. Materials & Products Quantity Units Unit $ Extended $ Comments
Geotextile fabric 1 ls 2,100.00$ 2,100$
Fill material for 500' long revetment 625 cy 64.00$ 40,000$ Fill material based on $35/cy on mainland and
transported to site by barge and rehandled by
clamshell on island.
Armor material for 500' long revetment 625 cy 100.00$ 62,500$ Revetment armor stone transported to island
Misc materials 1 ls 1,500.00$ 1,500$
‐$
‐$
Subtotal 106,100$
City Cost Index 1.000 ‐$
Adjusted Cost 106,100$
Profit 10.00% 10,610$
Subtotal 116,710$
Sales Tax 6.35% 7,411$ State Sales Tax
Total Material Cost 124,200$
B. Installation Tasks Crew No. of Shifts $ Shift Extended $ Comments
Clear and regrade 500' escarpment 6 5.0 2,719.39$ 13,597$
Set geotextile fabric 4 5.0 2,951.88$ 14,759$
Haul revetment material from beach 8 10.0 2,791.23$ 27,912$
Construct 500' revetment 6 15.0 2,719.39$ 40,791$
Material barge support 4 3.0 2,338.07$ 7,014$
‐$
‐$
Subtotal 104,074$
Sales Tax (New Construction Only) 0.00% ‐$
Subtotal 104,100$
C. Subcontractor / Other Quantity Units Unit $ Extended $ Comments
‐$
‐$
Subtotal ‐$
Profit 0.00% ‐$
Subtotal ‐$
Item Totals Total Comments
A+B+C 228,300$
Project Manager 1.0% 2,283$
General Conditions 15% 34,587$
Inflation 0% ‐$
Contingency 10% 26,517$
Total 291,700$
All sums are rounded up to the nearest $100.
ROBERGE ASSOCIATES COASTAL ENGINEERS, LLC
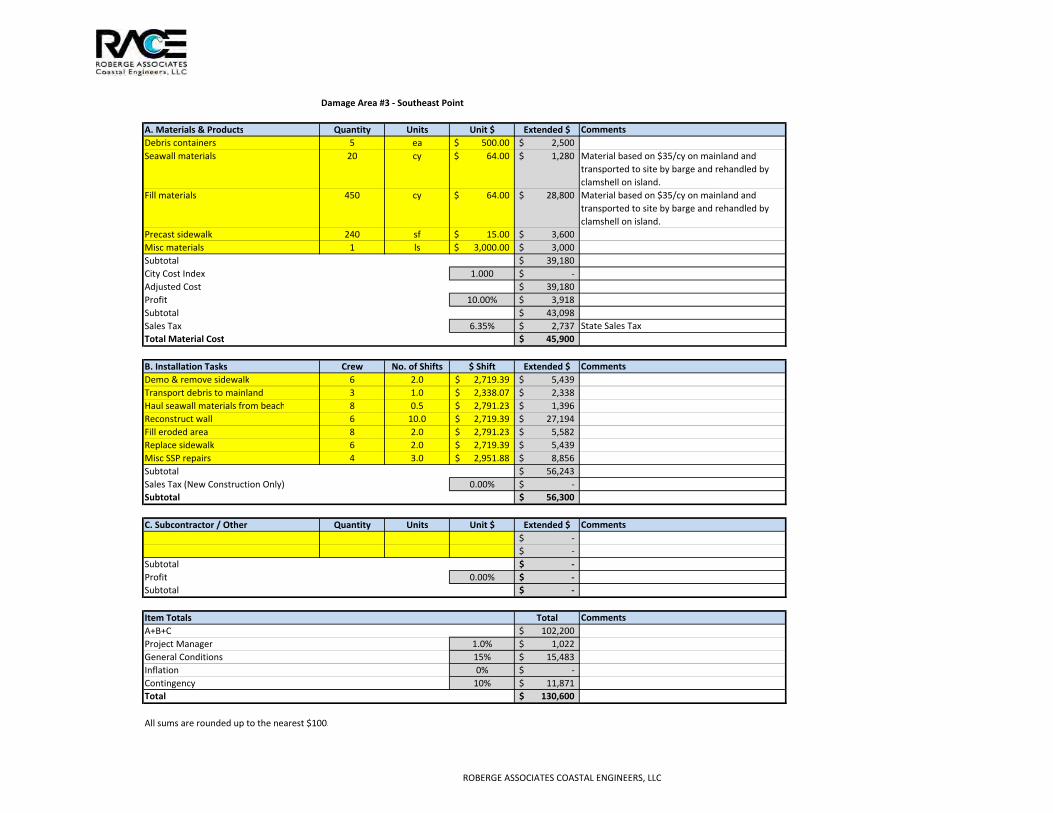
Damage Area #3 ‐ Southeast Point
A. Materials & Products Quantity Units Unit $ Extended $ Comments
Debris containers 5 ea 500.00$ 2,500$
Seawall materials 20 cy 64.00$ 1,280$ Material based on $35/cy on mainland and
transported to site by barge and rehandled by
clamshell on island.
Fill materials 450 cy 64.00$ 28,800$ Material based on $35/cy on mainland and
transported to site by barge and rehandled by
clamshell on island.
Precast sidewalk 240 sf 15.00$ 3,600$
Misc materials 1 ls 3,000.00$ 3,000$
Subtotal 39,180$
City Cost Index 1.000 ‐$
Adjusted Cost 39,180$
Profit 10.00% 3,918$
Subtotal 43,098$
Sales Tax 6.35% 2,737$ State Sales Tax
Total Material Cost 45,900$
B. Installation Tasks Crew No. of Shifts $ Shift Extended $ Comments
Demo & remove sidewalk 6 2.0 2,719.39$ 5,439$
Transport debris to mainland 3 1.0 2,338.07$ 2,338$
Haul seawall materials from beach 8 0.5 2,791.23$ 1,396$
Reconstruct wall 6 10.0 2,719.39$ 27,194$
Fill eroded area 8 2.0 2,791.23$ 5,582$
Replace sidewalk 6 2.0 2,719.39$ 5,439$
Misc SSP repairs 4 3.0 2,951.88$ 8,856$
Subtotal 56,243$
Sales Tax (New Construction Only) 0.00% ‐$
Subtotal 56,300$
C. Subcontractor / Other Quantity Units Unit $ Extended $ Comments
‐$
‐$
Subtotal ‐$
Profit 0.00% ‐$
Subtotal ‐$
Item Totals Total Comments
A+B+C 102,200$
Project Manager 1.0% 1,022$
General Conditions 15% 15,483$
Inflation 0% ‐$
Contingency 10% 11,871$
Total 130,600$
All sums are rounded up to the nearest $100.
ROBERGE ASSOCIATES COASTAL ENGINEERS, LLC

Damage Area #4 ‐ West End Causeway
A. Materials & Products Quantity Units Unit $ Extended $ Comments
Precast concrete walkway 300 sf 15.00$ 4,500$
Fill materials 222 cy 64.00$ 14,208$ Material based on $35/cy on mainland and
transported to site by barge and rehandled by
clamshell on island.
Misc. materials 1 ls 500.00$ 500$
‐$
Subtotal 19,208$
City Cost Index 1.000 ‐$
Adjusted Cost 19,208$
Profit 10.00% 1,921$
Subtotal 21,129$
Sales Tax 6.35% 1,342$ State Sales Tax
Total Material Cost 22,500$
B. Installation Tasks Crew No. of Shifts $ Shift Extended $ Comments
Fill and grade 100'x30'x2' area at west
end of causeway
8 3.0 2,791.23$ 8,374$
Install replacement concrete walk 6 1.0 2,719.39$ 2,719$
Repair stair foundation 4 0.5 2,951.88$ 1,476$
‐$
‐$
‐$
‐$
Subtotal 12,569$
Sales Tax (New Construction Only) 0.00% ‐$
Subtotal 12,600$
C. Subcontractor / Other Quantity Units Unit $ Extended $ Comments
‐$
‐$
Subtotal ‐$
Profit 0.00% ‐$
Subtotal ‐$
Item Totals Total Comments
A+B+C 35,100$
Project Manager 1.0% 351$
General Conditions 15% 5,318$
Inflation 0% ‐$
Contingency 10% 4,077$
Total 44,900$
All sums are rounded up to the nearest $100.
ROBERGE ASSOCIATES COASTAL ENGINEERS, LLC

Crew 1 Barge Crew ‐ Pile driving
A. Labor Bare Cost Incl. O&P
Dockbuilder (foreman) 44.80$ 72.00$
Dockbuilder 42.80$ 68.80$
Dockbuilder 42.80$ 68.80$
Equipment Operator 47.80$ 72.15$
Oiler 41.25$ 62.25$
Subtotal 344.00$
Hours per Shift 8
Total Shift Labor Rate 2,752.00$
B. Equipment Bare Cost (Daily) Incl. Profit (Daily)
Barge 779.20$ 857.12$
Pushboat 800.00$ 880.00$
Crane 1,257.00$ 1,382.70$
Diesel hammer 592.80$ 652.08$
Misc tools 50.00$ 55.00$
Subtotal 3,826.90$
Adjustment for variable Shift ‐$
Total Shift Equipment Rate 3,826.90$
Total Daily Crew Rate 6,578.90$
City Cost Index 1.263 1,730.25$
Adjusted Daily Crew Rate 8,309.15$
ROBERGE ASSOCIATES COASTAL ENGINEERS, LLC

Crew 2 Barge Crew ‐ Dockbuilding
A. Labor Bare Cost Incl. O&P
Dockbuilder (foreman) 44.80$ 72.00$
Dockbuilder 42.80$ 68.80$
Dockbuilder 42.80$ 68.80$
Equipment Operator 47.80$ 72.15$
Oiler 41.25$ 62.25$
Subtotal 344.00$
Hours per Shift 8
Total Shift Labor Rate 2,752.00$
B. Equipment Bare Cost (Daily) Incl. Profit (Daily)
Barge 779.20$ 857.12$
Pushboat 800.00$ 880.00$
Crane 1,257.00$ 1,382.70$
Misc tools 50.00$ 55.00$
Subtotal 3,174.82$
Adjustment for variable Shift ‐$
Total Shift Equipment Rate 3,174.82$
Total Daily Crew Rate 5,926.82$
City Cost Index 1.263 1,558.75$
Adjusted Daily Crew Rate 7,485.57$
ROBERGE ASSOCIATES COASTAL ENGINEERS, LLC

Crew 3 Material Barge
A. Labor Bare Cost Incl. O&P
Equipment Operator 46.55$ 70.25$
Laborer 35.10$ 54.00$
Subtotal 124.25$
Hours per Shift 8
Total Shift Labor Rate 994.00$
B. Equipment Bare Cost (Daily) Incl. Profit (Daily)
Deck barge 779.20$ 857.20$
Push boat 800.00$ 880.00$
Subtotal 857.20$
Adjustment for variable Shift ‐$
Total Shift Equipment Rate 857.20$
Total Daily Crew Rate 1,851.20$
City Cost Index 1.263 486.87$
Adjusted Daily Crew Rate 2,338.07$
ROBERGE ASSOCIATES COASTAL ENGINEERS, LLC

Crew 4 Dockbuilder Crew
A. Labor Bare Cost Incl. O&P
Dockbuilder (foreman) 44.80$ 72.00$
Dockbuilder 42.80$ 68.80$
Dockbuilder 42.80$ 68.80$
Dockbuilder 42.80$ 68.80$
Subtotal 278.40$
Hours per Shift 8
Total Shift Labor Rate 2,227.20$
B. Equipment Bare Cost (Daily) Incl. Profit (Daily)
Misc tools 100.00$ 110.00$
Subtotal 110.00$
Adjustment for variable Shift ‐$
Total Shift Equipment Rate 110.00$
Total Daily Crew Rate 2,337.20$
City Cost Index 1.263 614.68$
Adjusted Daily Crew Rate 2,951.88$
ROBERGE ASSOCIATES COASTAL ENGINEERS, LLC
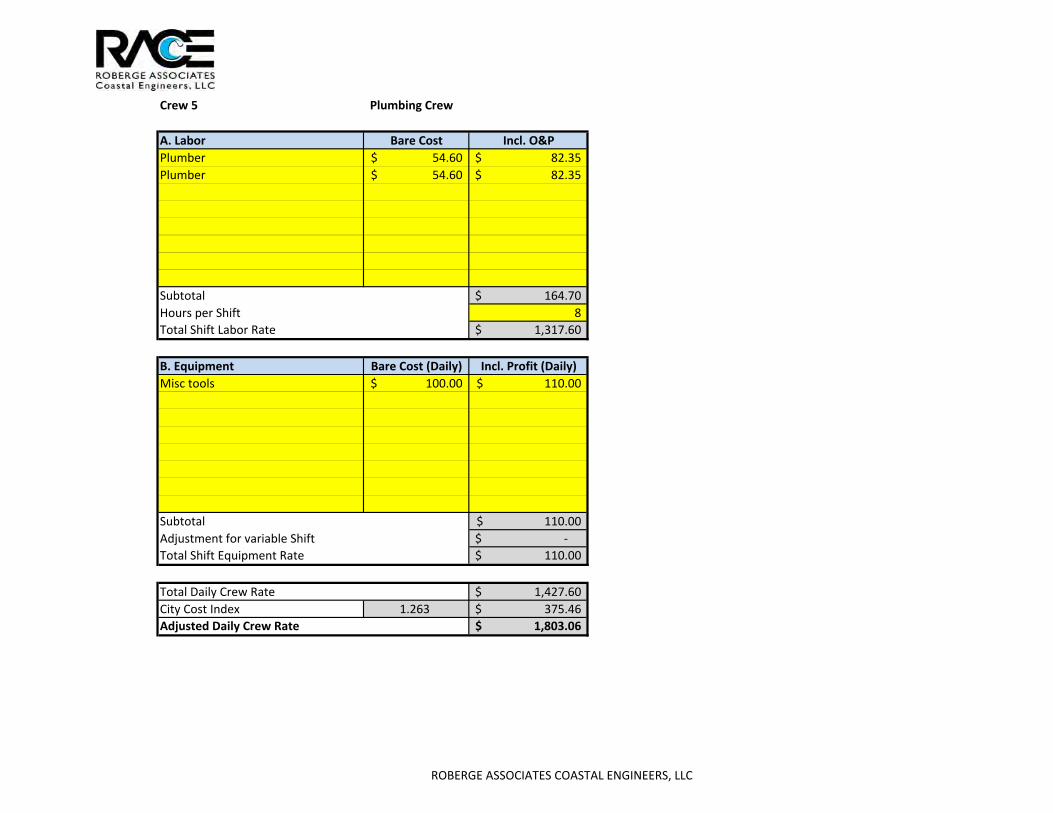
Crew 5 Plumbing Crew
A. Labor Bare Cost Incl. O&P
Plumber 54.60$ 82.35$
Plumber 54.60$ 82.35$
Subtotal 164.70$
Hours per Shift 8
Total Shift Labor Rate 1,317.60$
B. Equipment Bare Cost (Daily) Incl. Profit (Daily)
Misc tools 100.00$ 110.00$
Subtotal 110.00$
Adjustment for variable Shift ‐$
Total Shift Equipment Rate 110.00$
Total Daily Crew Rate 1,427.60$
City Cost Index 1.263 375.46$
Adjusted Daily Crew Rate 1,803.06$
ROBERGE ASSOCIATES COASTAL ENGINEERS, LLC

Crew 6 Excavator Crew
A. Labor Bare Cost Incl. O&P
Operator 47.80$ 72.15$
Laborer 35.10$ 54.00$
Laborer 35.10$ 54.00$
Subtotal 180.15$
Hours per Shift 8
Total Shift Labor Rate 1,441.20$
B. Equipment Bare Cost (Daily) Incl. Profit (Daily)
Hydraulic Excavator 647.20$ 711.92$
Subtotal 711.92$
Adjustment for variable Shift ‐$
Total Shift Equipment Rate 711.92$
Total Daily Crew Rate 2,153.12$
City Cost Index 1.263 566.27$
Adjusted Daily Crew Rate 2,719.39$
ROBERGE ASSOCIATES COASTAL ENGINEERS, LLC

Crew 7 Crane Crew
A. Labor Bare Cost Incl. O&P
Operator 47.80$ 72.15$
Laborer 35.10$ 54.00$
Subtotal 126.15$
Hours per Shift 8
Total Shift Labor Rate 1,009.20$
B. Equipment Bare Cost (Daily) Incl. Profit (Daily)
Crawler Crane ‐ 25 ton 1,110.00$ 1,221.00$
Clamshell bucket 47.00$ 51.70$
Subtotal 1,272.70$
Adjustment for variable Shift ‐$
Total Shift Equipment Rate 1,272.70$
Total Daily Crew Rate 2,281.90$
City Cost Index 1.263 600.14$
Adjusted Daily Crew Rate 2,882.04$
ROBERGE ASSOCIATES COASTAL ENGINEERS, LLC

Crew 8 Loader
A. Labor Bare Cost Incl. O&P
Operator 46.55$ 70.25$
Laborer 35.10$ 54.00$
Subtotal 124.25$
Hours per Shift 8
Total Shift Labor Rate 994.00$
B. Equipment Bare Cost (Daily) Incl. Profit (Daily)
Crawler Loader 1,106.00$ 1,216.00$
Subtotal 1,216.00$
Adjustment for variable Shift ‐$
Total Shift Equipment Rate 1,216.00$
Total Daily Crew Rate 2,210.00$
City Cost Index 1.263 581.23$
Adjusted Daily Crew Rate 2,791.23$
ROBERGE ASSOCIATES COASTAL ENGINEERS, LLC

Town of Greenwich Marine Facility Storm Damage Assessment
ROBERGE ASSOCIATES COASTAL ENGINEERS, LLC
SECTION 5.3
Great Captains Island Aerial Photograph with Damage
Locations

DAMAGE AREA #1Access Pier
DAMAGE AREA #2South Escarpment
DAMAGE AREA #3West End Causeway
GREAT CAPTAINS ISLANDSCALE: 1" = 100'
611 Access Road Stratford, CT 06615Tel: 203-377-0663 Fax: 203-375-6561 www.racellc.com

Town of Greenwich Marine Facility Storm Damage Assessment
ROBERGE ASSOCIATES COASTAL ENGINEERS, LLC
SECTION 5.4
Great Captains Island Representative Photographs

Town of Greenwich Marine Facility Storm Damage Assessment Section 5.4 – Great Captain Island Photographs
ROBERGE ASSOCIATES COASTAL ENGINEERS, LLC Page 1 of 5
DAMAGE AREA #1 – PIER
PHOTOGRAPH 1: Damaged Landward End of Pier
PHOTOGRAPH 2: Damaged Pile Bents

Town of Greenwich Marine Facility Storm Damage Assessment Section 5.4 – Great Captain Island Photographs
ROBERGE ASSOCIATES COASTAL ENGINEERS, LLC Page 2 of 5
PHOTOGRAPH 3: Damaged Diagonal Bracing
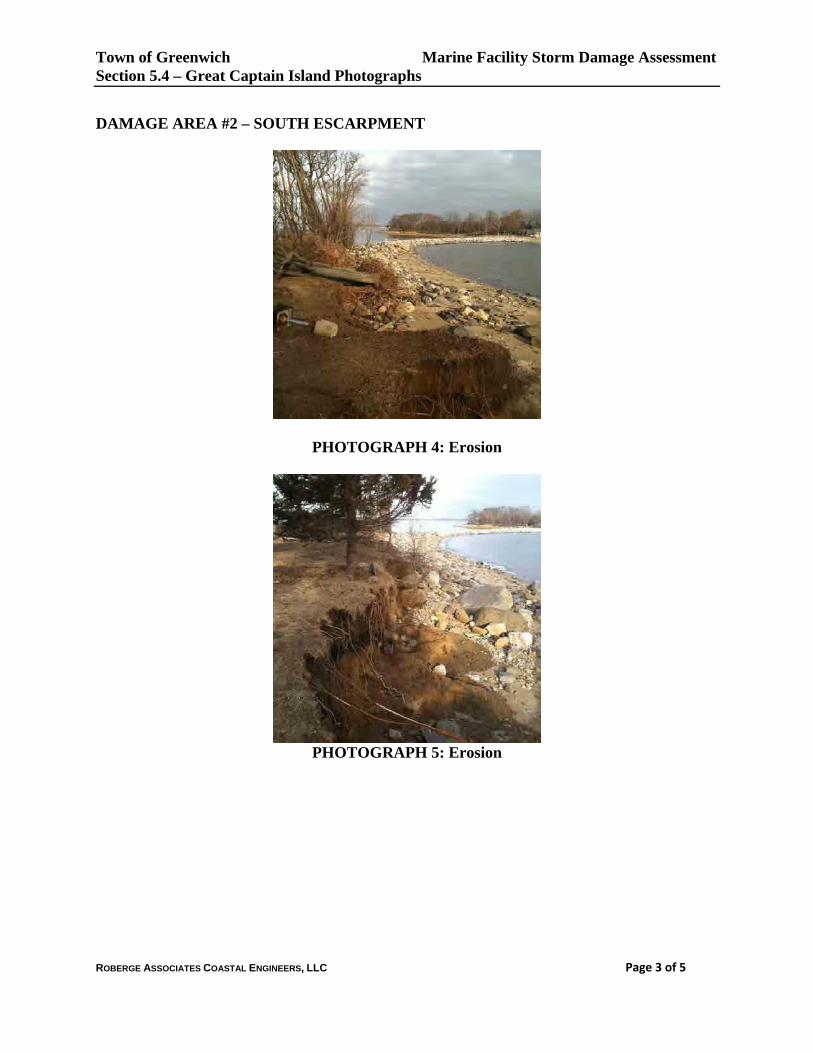
Town of Greenwich Marine Facility Storm Damage Assessment Section 5.4 – Great Captain Island Photographs
ROBERGE ASSOCIATES COASTAL ENGINEERS, LLC Page 3 of 5
DAMAGE AREA #2 – SOUTH ESCARPMENT
PHOTOGRAPH 4: Erosion
PHOTOGRAPH 5: Erosion

Town of Greenwich Marine Facility Storm Damage Assessment Section 5.4 – Great Captain Island Photographs
ROBERGE ASSOCIATES COASTAL ENGINEERS, LLC Page 4 of 5
DAMAGE AREA #3 – WEST END CAUSEWAY
PHOTOGRAPH 6: Damaged Walkway
PHOTOGRAPH 7: Damaged Concrete Stairway Foundation

Town of Greenwich Marine Facility Storm Damage Assessment Section 5.4 – Great Captain Island Photographs
ROBERGE ASSOCIATES COASTAL ENGINEERS, LLC Page 5 of 5
PHOTOGRAPH 8: Erosion

Town of Greenwich Marine Facility Storm Damage Assessment
ROBERGE ASSOCIATES COASTAL ENGINEERS, LLC
SECTION 6.0
Byram Marina
Town of Greenwich Marine Facility Storm Damage Assessment
ROBERGE ASSOCIATES COASTAL ENGINEERS, LLC
SECTION 6.1
Byram Marina Damage Summary Table

Town of Greenwich
Marine Facility Storm Damage Assessment
Project No. 2012125
SITE: Byram Marina
DAMAGE AREA #1 ‐ NORTH BEACH & POOL AREA
Damage # Description Notes Photographs
1 Plastic walk Damaged & displaced 1
2 Erosion Erosion at opening in seawall 2, 3
3 S ll J tt D d 50' 6' ll j tt3 Seawall near Jetty Damaged 50' x 6' seawall near jetty
4 Seawall Damage 50' x 4' at north end of beach 4
5 Fence Damage South side of pool 5
6 Seawall Damage 50' x 2' x 3' parapet located east of pool house 6
7 Erosion Scour and grass damage +/‐500 around pool 7
8 Seawall Damage NW of pool house. 50' failed fence. 8
DAMAGE AREA #2 MARINA SEAWALLDAMAGE AREA #2 ‐MARINA SEAWALL
Damage # Description Notes Photographs
1 Gate Damage Loss of shoreline & vegetation
2 Seawall Damage 20' x 2' parapet seawall at north end 9
3 Displaced Stones Located on crest of wall at north section to 100' west 10
4 Seawall Damage Parapet wall failure. 50' x 3' adjacent to parking area north
of pier
11
5 Seawall Damage 3 Sections of failed parapet wall between north and south 125 Seawall Damage 3 Sections of failed parapet wall between north and south
piers. Total length 100'+/‐
12
6 Seawall Damage Loose stones on crest of seawall between north and south
piers
13
7 Seawall Damage Failed parapet south of south pier at end of wall 14
DAMAGE AREA #3 ‐ MARINA
Damage # Description Notes Photographs
1 Pile Failure Pile displaced
2 Dock Damage Flotation missing from tip of east dock

Town of Greenwich Marine Facility Storm Damage Assessment
ROBERGE ASSOCIATES COASTAL ENGINEERS, LLC
SECTION 6.2
Byram Marina Opinion of Probable Cost Tables

Opinion of Probable Costs
Project Information
Project Name: TOG Storm Damage ‐ Byram Park
Project Number: 2012125
Project Location: Greenwich, CT
Client: Town of Greenwich
Prepared By: D. Santa
Date: December 5, 2012
Cost Criteria
Project Manager 1.0%
General Conditions 10.0%
City Cost Index for Crew & Equipment 1.263
City Cost Index for Materials (see note 6) 1.000
Profit (on mat'ls and equip., see note 3 for profit on labor) 10.0%
Inflation 0.0%
Contingency 10.0%
Sales Tax on Materials 6.35%
Sales Tax on Labor (new construction only) 0.00%
Assumptions
1. Unrestricted site access with no disruptions
2. 2012 US Dollars
3. Standard Union Labor Rates Including O&P per RS Means adjusted for region.
4. Equipment Rates includes Profit only per RS Means adjusted for region.
5. City Cost Index for Crew per RS Means
6. City Cost Index = 1.0 for Materials provided by local supplier.
Summary of Costs
Professional Engineering Services 26,000$
Building Permit Fee ‐$
Mobilization & Demobilization 20,600$
Post Storm Site Clean Up (per Town of Greenwich) ‐$
Damage Area #1 ‐ North Beach & Pool Area 60,900$
Damage Area #2 ‐ Marina Seawall 48,700$
Damage Area #3 ‐ Marina 7,400$
Total OPC 163,600$
ROBERGE ASSOCIATES COASTAL ENGINEERS, LLC

Professional Engineering Services
A. Task Description Fee Comments
Permit Applications 4,000$
Preparation of Contract Documents 15,000$
Engineering Svcs During Construction 5,000$
Record As‐Built Documents 2,000$
‐$
Subtotal 26,000$
B. Sub‐consultants Fee Comments
Boring Contractor ‐$
Geotechnical Engineer ‐$
Ecologist ‐$
Surveyor ‐$
‐$
Subtotal ‐$
C. Reimbursable Expenses Amount Comments
Application Fees ‐$
Photocopies ‐$
Travel ‐$
Hotel & Meals ‐$
‐$
Subtotal ‐$
Total (A+B+C) 26,000$
All sums are rounded up to the nearest $100.
ROBERGE ASSOCIATES COASTAL ENGINEERS, LLC

Mobilization & Demobilization
A. Materials & Products Quantity Units Unit $ Extended $ Comments
Consumables 1 LS 1,500.00$ 1,500$
‐$
‐$ ‐$
Subtotal 1,500$
City Cost Index 1.000 ‐$
Adjusted Cost 1,500$
Profit 10.00% 150$
Subtotal 1,650$
Sales Tax 6.35% 105$ State Sales Tax
Total Material Cost 1,800$
B. Installation Tasks Crew No. of Shifts $ Shift Extended $ Comments
Mobilization N/A N/A 15,000$ Estimate
Subtotal 15,000$
Sales Tax (New Construction Only) 0.00% ‐$
Subtotal 15,000$
C. Subcontractor / Other Quantity Units Unit $ Extended $ Comments
‐$
‐$
Subtotal ‐$
Profit 10.00% ‐$
Subtotal ‐$
Item Totals Total Comments
A+B+C 16,800$
Project Manager 1.0% 168$
General Conditions 10% 1,697$
Inflation 0% ‐$
Contingency 10% 1,866$
Total 20,600$
All sums are rounded up to the nearest $100.
ROBERGE ASSOCIATES COASTAL ENGINEERS, LLC
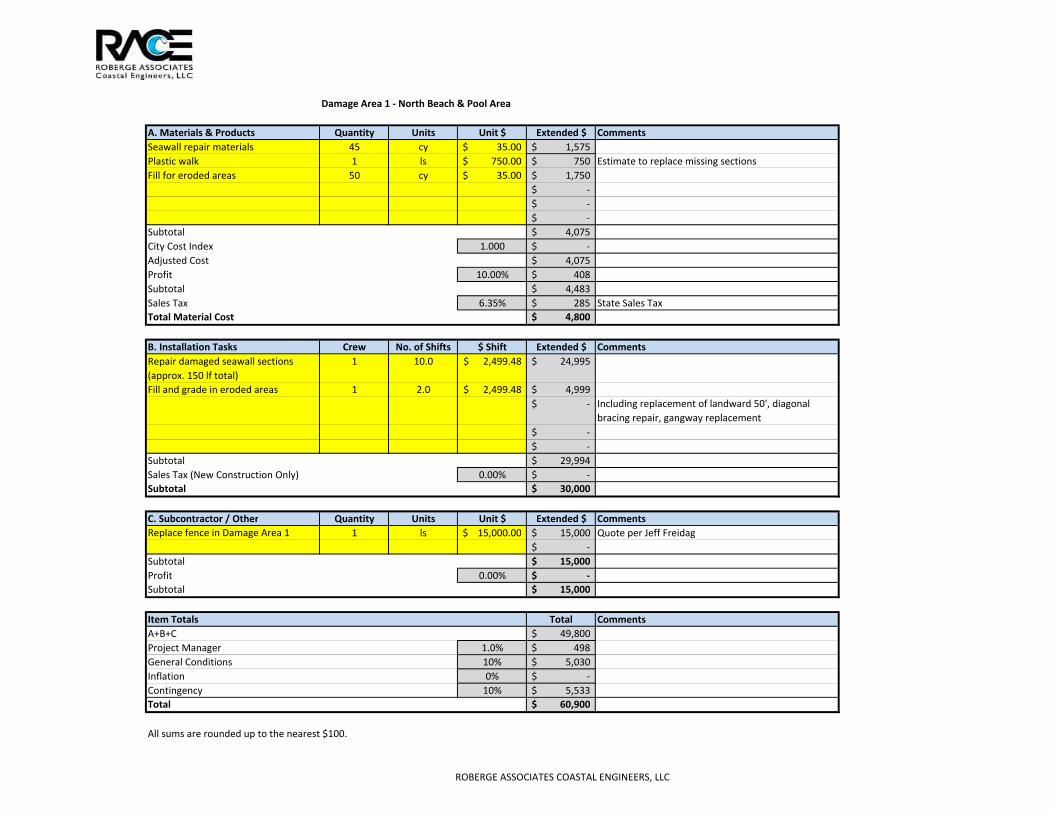
Damage Area 1 ‐ North Beach & Pool Area
A. Materials & Products Quantity Units Unit $ Extended $ Comments
Seawall repair materials 45 cy 35.00$ 1,575$
Plastic walk 1 ls 750.00$ 750$ Estimate to replace missing sections
Fill for eroded areas 50 cy 35.00$ 1,750$
‐$
‐$
‐$
Subtotal 4,075$
City Cost Index 1.000 ‐$
Adjusted Cost 4,075$
Profit 10.00% 408$
Subtotal 4,483$
Sales Tax 6.35% 285$ State Sales Tax
Total Material Cost 4,800$
B. Installation Tasks Crew No. of Shifts $ Shift Extended $ Comments
Repair damaged seawall sections
(approx. 150 lf total)
1 10.0 2,499.48$ 24,995$
Fill and grade in eroded areas 1 2.0 2,499.48$ 4,999$
‐$ Including replacement of landward 50', diagonal
bracing repair, gangway replacement
‐$
‐$
Subtotal 29,994$
Sales Tax (New Construction Only) 0.00% ‐$
Subtotal 30,000$
C. Subcontractor / Other Quantity Units Unit $ Extended $ Comments
Replace fence in Damage Area 1 1 ls 15,000.00$ 15,000$ Quote per Jeff Freidag
‐$
Subtotal 15,000$
Profit 0.00% ‐$
Subtotal 15,000$
Item Totals Total Comments
A+B+C 49,800$
Project Manager 1.0% 498$
General Conditions 10% 5,030$
Inflation 0% ‐$
Contingency 10% 5,533$
Total 60,900$
All sums are rounded up to the nearest $100.
ROBERGE ASSOCIATES COASTAL ENGINEERS, LLC
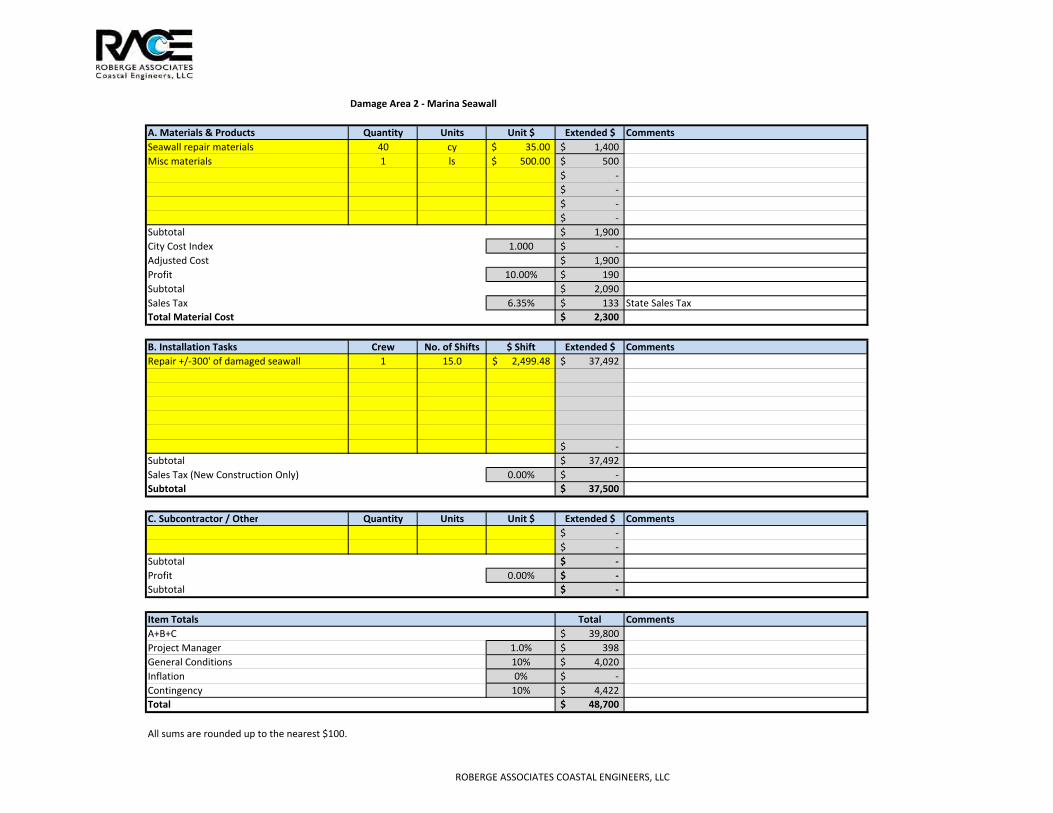
Damage Area 2 ‐ Marina Seawall
A. Materials & Products Quantity Units Unit $ Extended $ Comments
Seawall repair materials 40 cy 35.00$ 1,400$
Misc materials 1 ls 500.00$ 500$
‐$
‐$
‐$
‐$
Subtotal 1,900$
City Cost Index 1.000 ‐$
Adjusted Cost 1,900$
Profit 10.00% 190$
Subtotal 2,090$
Sales Tax 6.35% 133$ State Sales Tax
Total Material Cost 2,300$
B. Installation Tasks Crew No. of Shifts $ Shift Extended $ Comments
Repair +/‐300' of damaged seawall 1 15.0 2,499.48$ 37,492$
‐$
Subtotal 37,492$
Sales Tax (New Construction Only) 0.00% ‐$
Subtotal 37,500$
C. Subcontractor / Other Quantity Units Unit $ Extended $ Comments
‐$
‐$
Subtotal ‐$
Profit 0.00% ‐$
Subtotal ‐$
Item Totals Total Comments
A+B+C 39,800$
Project Manager 1.0% 398$
General Conditions 10% 4,020$
Inflation 0% ‐$
Contingency 10% 4,422$
Total 48,700$
All sums are rounded up to the nearest $100.
ROBERGE ASSOCIATES COASTAL ENGINEERS, LLC

Damage Area #3 ‐ Marina
A. Materials & Products Quantity Units Unit $ Extended $ Comments
Timber pile 1 ls 400.00$ 400$
Misc materials 1 ls 1,000.00$ 1,000$
‐$ Material based on $35/cy on mainland and
transported to site by barge and rehandled by
clamshell on island.
‐$
‐$
Subtotal 1,400$
City Cost Index 1.000 ‐$
Adjusted Cost 1,400$
Profit 10.00% 140$
Subtotal 1,540$
Sales Tax 6.35% 98$ State Sales Tax
Total Material Cost 1,700$
B. Installation Tasks Crew No. of Shifts $ Shift Extended $ Comments
Redrive failed pile 3 0.3 8,239.28$ 2,060$
Repair damaged finger dock 2 1.0 2,187.26$ 2,187$
‐$
‐$
‐$
‐$
‐$
Subtotal 4,247$
Sales Tax (New Construction Only) 0.00% ‐$
Subtotal 4,300$
C. Subcontractor / Other Quantity Units Unit $ Extended $ Comments
‐$
‐$
Subtotal ‐$
Profit 0.00% ‐$
Subtotal ‐$
Item Totals Total Comments
A+B+C 6,000$
Project Manager 1.0% 60$
General Conditions 10% 606$
Inflation 0% ‐$
Contingency 10% 667$
Total 7,400$
All sums are rounded up to the nearest $100.
ROBERGE ASSOCIATES COASTAL ENGINEERS, LLC

Crew 1 Seawall Repair
A. Labor Bare Cost Incl. O&P
Mason 44.35$ 66.95$
Mason 44.35$ 66.95$
Equipment Operator 44.75$ 67.55$
Subtotal 201.45$
Hours per Shift 8
Total Shift Labor Rate 1,611.60$
B. Equipment Bare Cost (Daily) Incl. Profit (Daily)
Backhoe/Loader 334.00$ 367.40$
Subtotal 367.40$
Adjustment for variable Shift ‐$
Total Shift Equipment Rate 367.40$
Total Daily Crew Rate 1,979.00$
City Cost Index 1.263 520.48$
Adjusted Daily Crew Rate 2,499.48$
ROBERGE ASSOCIATES COASTAL ENGINEERS, LLC

Crew 2 Dockbuilder
A. Labor Bare Cost Incl. O&P
Dockbuilder (foreman) 44.80$ 72.00$
Dockbuilder 42.80$ 68.80$
Dockbuilder 42.80$ 68.80$
Subtotal 209.60$
Hours per Shift 8
Total Shift Labor Rate 1,676.80$
B. Equipment Bare Cost (Daily) Incl. Profit (Daily)
Misc tool 50.00$ 55.00$
Subtotal 55.00$
Adjustment for variable Shift ‐$
Total Shift Equipment Rate 55.00$
Total Daily Crew Rate 1,731.80$
City Cost Index 1.263 455.46$
Adjusted Daily Crew Rate 2,187.26$
ROBERGE ASSOCIATES COASTAL ENGINEERS, LLC

Crew 3 Barge Crew
A. Labor Bare Cost Incl. O&P
Dockbuilder (foreman) 44.80$ 72.00$
Dockbuilder 42.80$ 68.80$
Equipment Operator 47.80$ 72.15$
Oiler 41.25$ 62.25$
Subtotal 275.20$
Hours per Shift 8
Total Shift Labor Rate 2,201.60$
B. Equipment Bare Cost (Daily) Incl. Profit (Daily)
Barge 779.20$ 857.20$
Pushboat 800.00$ 880.00$
Crane 1,257.00$ 1,382.70$
Diesel hammer 592.80$ 652.08$
Misc tools 50.00$ 550.00$
Subtotal 4,321.98$
Adjustment for variable Shift ‐$
Total Shift Equipment Rate 4,321.98$
Total Daily Crew Rate 6,523.58$
City Cost Index 1.263 1,715.70$
Adjusted Daily Crew Rate 8,239.28$
ROBERGE ASSOCIATES COASTAL ENGINEERS, LLC
Town of Greenwich Marine Facility Storm Damage Assessment
ROBERGE ASSOCIATES COASTAL ENGINEERS, LLC
SECTION 6.3
Byram Marina Aerial Photograph with Damage
Locations
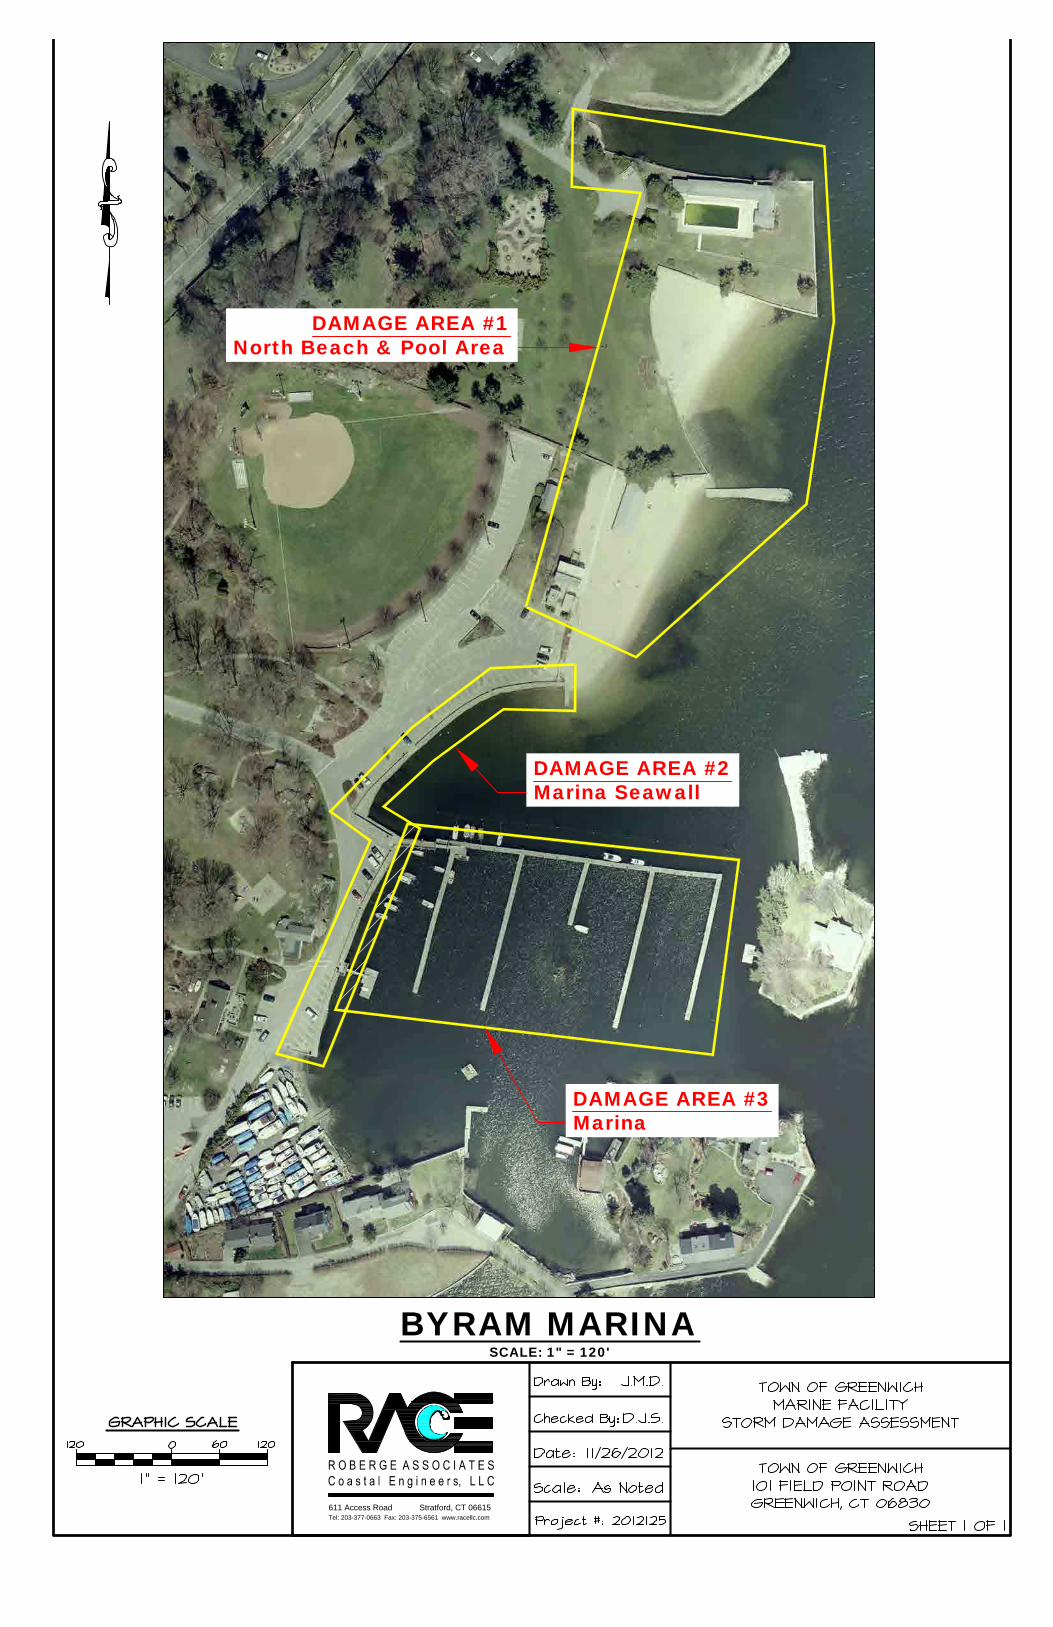
DAMAGE AREA #1North Beach & Pool Area
DAMAGE AREA #2Marina Seawall
DAMAGE AREA #3Marina
BYRAM MARINASCALE: 1" = 120'
611 Access Road Stratford, CT 06615Tel: 203-377-0663 Fax: 203-375-6561 www.racellc.com

Town of Greenwich Marine Facility Storm Damage Assessment
ROBERGE ASSOCIATES COASTAL ENGINEERS, LLC
SECTION 6.4
Byram Marina Representative Photographs

Town of Greenwich Marine Facility Storm Damage Assessment Section 6.4 – Byram Marina Photographs
ROBERGE ASSOCIATES COASTAL ENGINEERS, LLC Page 1 of 7
DAMAGE AREA #1 – NORTH BEACH & POOL AREA
PHOTOGRAPH 1: Damaged Plastic Walkway
PHOTOGRAPH 2: Scour at Seawall Opening
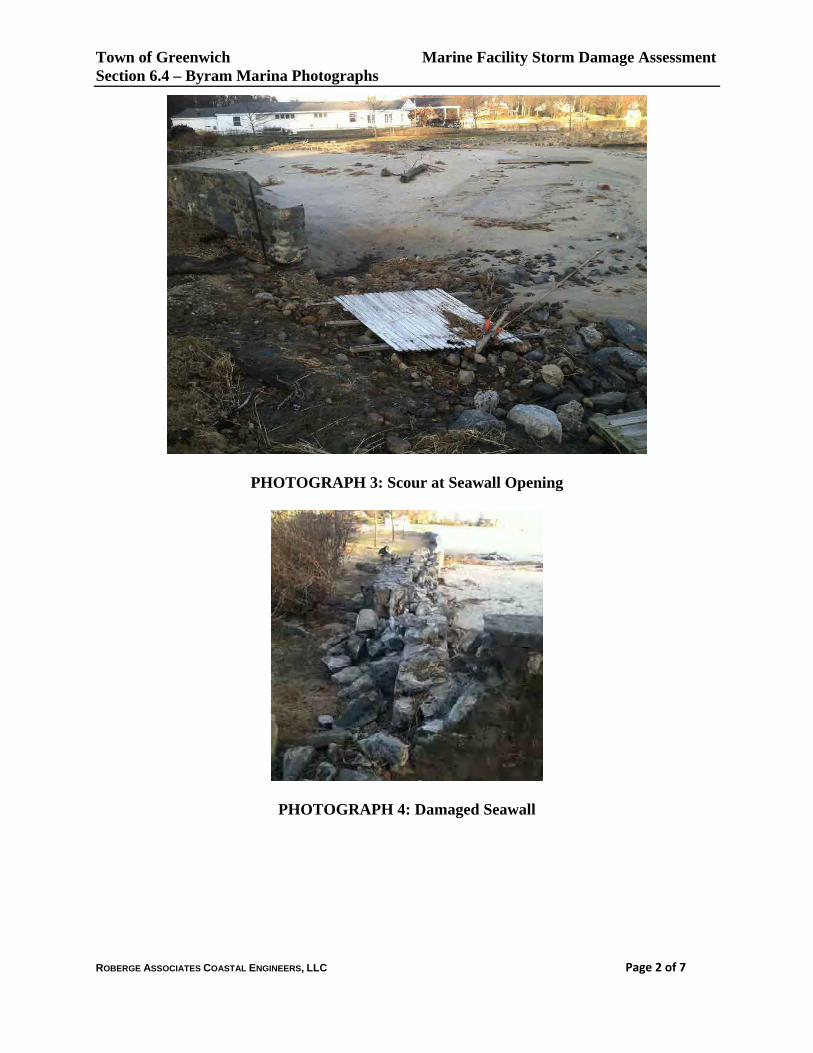
Town of Greenwich Marine Facility Storm Damage Assessment Section 6.4 – Byram Marina Photographs
ROBERGE ASSOCIATES COASTAL ENGINEERS, LLC Page 2 of 7
PHOTOGRAPH 3: Scour at Seawall Opening
PHOTOGRAPH 4: Damaged Seawall

Town of Greenwich Marine Facility Storm Damage Assessment Section 6.4 – Byram Marina Photographs
ROBERGE ASSOCIATES COASTAL ENGINEERS, LLC Page 3 of 7
PHOTOGRAPH 5: Fence Damage
PHOTOGRAPH 6: Damaged Seawall

Town of Greenwich Marine Facility Storm Damage Assessment Section 6.4 – Byram Marina Photographs
ROBERGE ASSOCIATES COASTAL ENGINEERS, LLC Page 4 of 7
PHOTOGRAPH 7: Scouring Behind Seawall
PHOTOGRAPH 8: Seawall Damage
DAMAGE AREA #2 MARINA SEAWALL

Town of Greenwich Marine Facility Storm Damage Assessment Section 6.4 – Byram Marina Photographs
ROBERGE ASSOCIATES COASTAL ENGINEERS, LLC Page 5 of 7
PHOTOGRAPH 9: Damaged Seawall
PHOTOGRAPH 10: Displaced Stones

Town of Greenwich Marine Facility Storm Damage Assessment Section 6.4 – Byram Marina Photographs
ROBERGE ASSOCIATES COASTAL ENGINEERS, LLC Page 6 of 7
PHOTOGRAPH 11: Damaged Seawall
PHOTOGRAPH 12: Damaged Seawall

Town of Greenwich Marine Facility Storm Damage Assessment Section 6.4 – Byram Marina Photographs
ROBERGE ASSOCIATES COASTAL ENGINEERS, LLC Page 7 of 7
PHOTOGRAPH 13: Damaged Seawall
PHOTOGRAPH 14: Seawall Damage

Department & Division:
Action Requested:
Date of Submission:
To:
From:
Fund
A
A
A A A A
z
Fund Balance
Justification of Request:
Dept
809
809
809
809
809 809
822
Town Of Greenwich Request Form For Budget Adjustments
P&R
Additional Appropriation
December 12, 2012
Object Project Desc
51070 Out of Class
51100 Overtime
51490 Prof Services
52950 Mise Services - NOC
53950 Supplies & Matl - NOC 54900 Maintenance - NOC
59830 13177 Trees at Risk
Request for funds to cover the costs associated with Super Storm Sandy
\\_ ---.......r1
1..... l'" Board Chairman Department Head: / l. ~
BET Meeting Date: ~ Application#: ~
Amount
183.73
107,968.58
163,091.05
5,360.97
5,688.50 24,773.00
10,478.61
317,544.44
))
Certffied correct as to computations and amounts shows as appropriations to date and ~Ored balances with an chan es iven. y g g Date: Comptroller:
The following action was taken at a meeting of the Board of Estimate and Taxation held on: Vote Clerk of the Board:
Email this form as a PDF along with any supporting documentation (in PDF Format)

Storm Sandy Costs
By Account
MUNIS Charges Consultant Tree 170' Boom Small Fund ORG Account Project Notes Storm Acct From GPO Fees Service Trans & Opn Tools etc Total
A 809 51070 ooc 183.73 183.73
A 809 51100 OT 107,968.58 107,968.58
A 809 51490 Roberge Assoc 12,000.00 A 809 51490 Aim stead 9,450.00 A 809 51490 Horthorne 7,755.00 A 809 51490 Horthorne 12,210.00 A 809 51490 Horthorne 71,215.30 A 809 51490 Horthorne 9,570.00 A 809 51490 A-Quick Crane Svc 2,015.75 A 809 51490 New England Timbr 38,875.00 163,091.05
A 809 52950 Services 5,360.97 5,360.97
A 809 53950 Supplies 4,252.15 A 809 53950 Grainger 101.76 A 809 53950 Grainger 196.29 A 809 53950 Grainger 13.88 A 809 53950 Lewis 234.48 A 809 53950 Canney Safety 253.57 A 809 53950 McMaster-Carr 281.18 A 809 53950 Interstate Lumber 321.59 A 809 53950 Interstate Lumber 33.60 5,688.50
A 809 54950 Maintenance 24,773.00 24,773.00
z 822 59830 13177 Trees at Risk 10,478.61 10,478.61
-
142,538.43 10,478.61 12,000.00 110,200.30 40,890.75 1,436.35 317,544.44
PR-4 Details by account.xlsx

Storm Sandy Costs
MUNIS Charges Consultant Tree 170' Boom Small Fund ORG Account Project Notes Storm Acct From GPO Fees Service Trans&Opn Tools etc Total
A 809 51070 ooc 183.73 A 809 51100 OT 107,968.58 A 809 52950 Services 5,360.97 A 809 53950 Supplies 4,252.15 A 809 54950 Maintenance 24,773.00
z 822 59830 13177 Trees at Risk 10,478.61
A 809 51490 Roberge Assoc 12,000.00
A 809 51490 Almstead 9,450.00 A 809 51490 Horthorne 7,755.00 A 809 51490 Horthorne 12,210.00 A 809 51490 Horthorne 71,215.30 A 809 51490 Horthorne 9,570.00 A 809 51490 A-Quick Crane Svc 2,015.75 A 809 51490 New England Timbr 38,875.00 A 809 53950 Grainger 101.76 A 809 53950 Grainger 196.29 A 809 53950 Grainger 13.88 A 809 53950 Lewis 234.48 A 809 53950 Conney Safety 253.57 A 809 53950 McMaster -Carr 281.18 A 809 53950 Interstate Lumber 321.59 A 809 53950 Interstate Lumber 33.60
142,538.43 10,478.61 12,000.00 110,200.30 40,890.75 1,436.35 317,544.44
PR-4 Details- Storm Sandy.xlsx
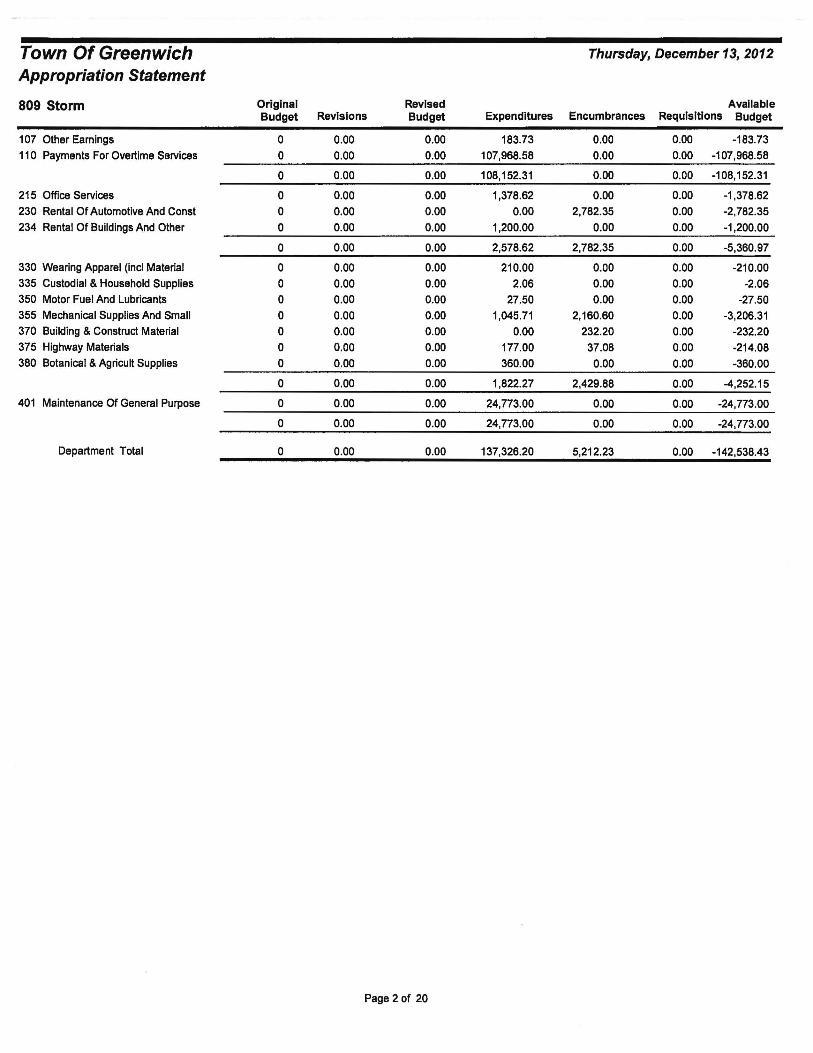
Town Of Greenwich Thursday, December 13, 2012
Appropriation Statement
809 Storm Original Revised Available Budget Revisions Budget Expenditures Encumbrances Requisitions Budget
107 Other Earnings 0 0.00 0.00 183.73 0.00 0.00 -183.73
11 0 Payments For Overtime Services 0 0.00 0.00 107,968.58 0.00 0.00 -107,968.58
0 0.00 0.00 108,152.31 0.00 0.00 -108,152.31
215 Office Services 0 0.00 0.00 1,378.62 0.00 0.00 -1,378.62
230 Rental Of Automotive And Cons! 0 0.00 0.00 0.00 2,782.35 0.00 -2,782.35
234 Rental Of Buildings And Other 0 0.00 0.00 1,200.00 0.00 0.00 -1 ,200.00
0 0.00 0.00 2,578.62 2,782.35 0.00 -5,360.97
330 Wearing Apparel (incl Material 0 0.00 0.00 210.00 0.00 0.00 -210.00
335 Custodial & Household Supplies 0 0.00 0.00 2.06 0.00 0.00 -2.06
350 Motor Fuel And Lubricants 0 0.00 0.00 27.50 0.00 0.00 -27.50
355 Mechanical Supplies And Small 0 0.00 0.00 1,045.71 2,160.60 0.00 -3,206.31
370 Building & Construct Material 0 0.00 0.00 0.00 232.20 0.00 -232.20
375 Highway Materials 0 0.00 0.00 177.00 37.08 0.00 -214.08
380 Botanical & Agricult Supplies 0 0.00 0.00 360.00 0.00 0.00 -360.00
0 0.00 0.00 1,822.27 2,429.88 0.00 -4,252.15
401 Maintenance Of General Purpose 0 0.00 0.00 24,773.00 0.00 0.00 -24,773.00
0 0.00 0.00 24,773.00 0.00 0.00 -24,773.00
Department Total 0 0.00 0.00 137,326.20 5,212.23 0.00 -142,538.43
Page 2 of 20
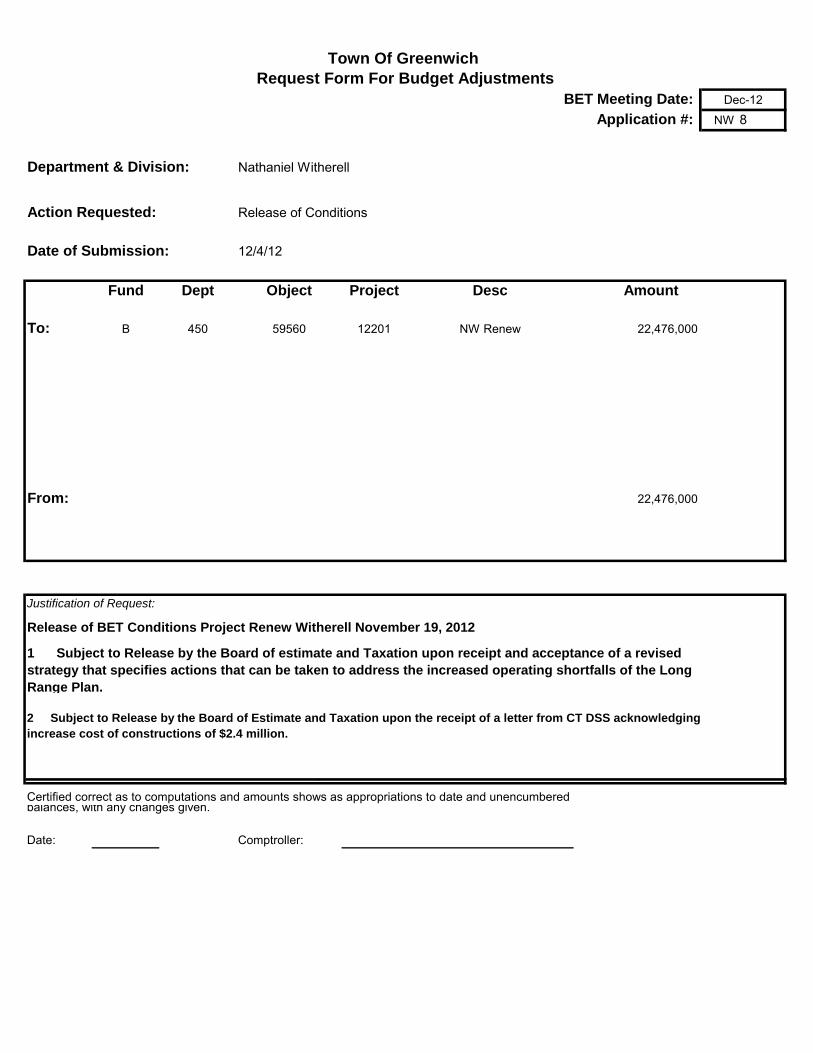
BET Meeting Date:
Application #: NW 8
Department & Division:
Action Requested: Release of Conditions
Date of Submission: 12/4/12
Fund Dept Object Project Desc Amount
To: B 450 59560 12201 NW Renew 22,476,000
From: 22,476,000
Justification of Request:
Board Chairman Department Head:
Certified correct as to computations and amounts shows as appropriations to date and unencumbered balances, with any changes given.
Date: Comptroller:
Town Of Greenwich
Request Form For Budget Adjustments
Nathaniel Witherell
Dec-12
Release of BET Conditions Project Renew Witherell November 19, 2012
1 Subject to Release by the Board of estimate and Taxation upon receipt and acceptance of a revised
strategy that specifies actions that can be taken to address the increased operating shortfalls of the Long
Range Plan.
2 Subject to Release by the Board of Estimate and Taxation upon the receipt of a letter from CT DSS acknowledging
increase cost of constructions of $2.4 million.

KATHLEEN M. BRENNAN
Deputy Commissioner December 5, 2012
STATE OF CONNECTICUT DEPARTMENT OF SOCIAL SERVICES
OFFICE OF THE DEPUTY COMMISSIONER
David Ormsby, Chairman, Board of Directors Allen Brown, Executive Director The-Nathaniel Witherell Short-Term Rehab and Skilled Nursing Center 70 Parsonage Road Greenwich, CT 06830
Subject: Docket #12-728 Request to modify Docket #10-705
Dear Mr. Ormsby and Mr. Brown:
TELEPHONE (860) 424-5693
TDDffTY 1-800-842-4524
FAX (860) 424-4860
EMAIL [email protected]
The Department of Social Services ("DSS") has reviewed your November 20, 2012 letter requesting a modification to Docket #10-705 which provided Certificate ofNeed approval for The Nathaniel Witherell Short-Term Rehab and Skilled Nursing Center ("Applicant") to undertake $22,500,000 in renovations to the existing nursing home. Your letter states that the project cost has increased to $25,664,000 but that you are not requesting any recognition of the increased costs for Medicaid reimbursement purposes. Based on the foregoing, DSS agrees to modify Docket # 1 0-705 as follows:
• The Applicant's request for a CON to undertake $25,664,000 in capital improvements at The Nathaniel Witherell Short-Term Rehab and Skilled Nursing Center located at 70 Parsonage·Road in Greenwich, is hereby approved at a maximum capital cost of $25,664,000 exclusive of capitalized financing costs. Should the final capital expenditure be less than the amount approved by the DSS, the Applicant is expressly limited to the expenditure, which is the lesser of $25,664,000 or the actual costs incurred.
• The DSS shall recognize the actual project costs for Medicaid reimbursement purposes, up to a maximum of$12,000,000 exclusive of capitalized financing, to be amortized over 20 years with the rate of return applicable to proprietary facilities in the year of project completion.
• If during the approved project period, the Applicant becomes aware of or anticipates a significant change in the scope of the project or the likelihood of the costs exceeding $25,664,000, exclusive of capitalized financing costs, the Applicant shall submit a request for change in scope and/or a cost overrun to the DSS and capital improvements shall not commence until such time as the DSS acts on such a request.
All other conditions and stipulations associated with Docket # 1 0-705 remain unchanged. Please contact Rich Wysocki, Principal Cost Analyst at 860-424-5103 if you need further assistance in this matter.
Sincerely,
IWrv~M-~. Kathleen M. Brennan, Deputy Commissioner
CC: Commissioner Bremby Chris LaVigne, Director, Reimbursement & Rate Setting Rich Wysocki, Principal Cost Analyst, Reimbursement & Rate Setting
25 SIGOURNEY STREET • HARTFORD, CONNECTICUT 06106-5033 An Equal Opportunity I Affirmative Action Employer
Printed on Recycled or Recovered Paper [email protected]

BET 11.12 1
TOWN OF GREENWICH
BOARD OF ESTIMATE and TAXATION ASSESSOR’S REPORT
December 12, 2012
OVERVIEW:
The annual Grand List Abstract for October 1, 2012 will be produced in January. The gross taxable 2012 Real Estate Grand List shows an increase of $138,748,400. We are in the midst of processing motor vehicle changes and valuing personal property declarations for the 2012 Grand List.
REPORT:
1. Normal Workload: Real Estate: Appraisers have completed all work for the 2012 Real Estate Grand List. Value changes were made to 1,587 parcels or 7.1% of all parcels in Town. The appraisers are assisting with personal property review and developing documents for pending court cases. 125 income properties that have not filed the required income and expense statements have had a 10% penalty applied for failure to report. Personal Property: Approximately 3,000 of the 2012 declarations have been received and the processing of the declarations is underway. Motor Vehicles: The 2011 Supplemental Motor Vehicle Grand List is complete (gross of $105,042,400; net of $104,876,580; taxes of $1,089,563) and has been forwarded to the Tax Collector. The 2012 Regular Motor Vehicle Grand List has been received from the Connecticut Department of Motor Vehicles. Entering values for non-priced vehicles will be completed in early January. Motor vehicle additions, deletions, corrections, pro-rations and inquiries continue. Administrative Support: The Daily Certificate Journals have been sent to Finance and the Tax Collector through December 12, 2012. All real estate veteran records have been updated. Building permits are being organized for the appraisers. Administrative staff continues to assist the public with real estate, personal property and motor vehicle questions, veteran and elderly adjustments and court stipulations.
2. Completion of the 2012 Grand Lists: On December 3, 2012 the October 1, 2012 real estate Grand List values were bridged from ProVal to the MUNIS system. Final processing and checking has commenced. The Grand List Abstract will be finished and sent for printing in January 2013. The printed Grand Lists will be signed on January 31, 2013. Archival copies of all 22,303 parcels have been generated in .pdf format reflecting status and values as of October 1, 2012.
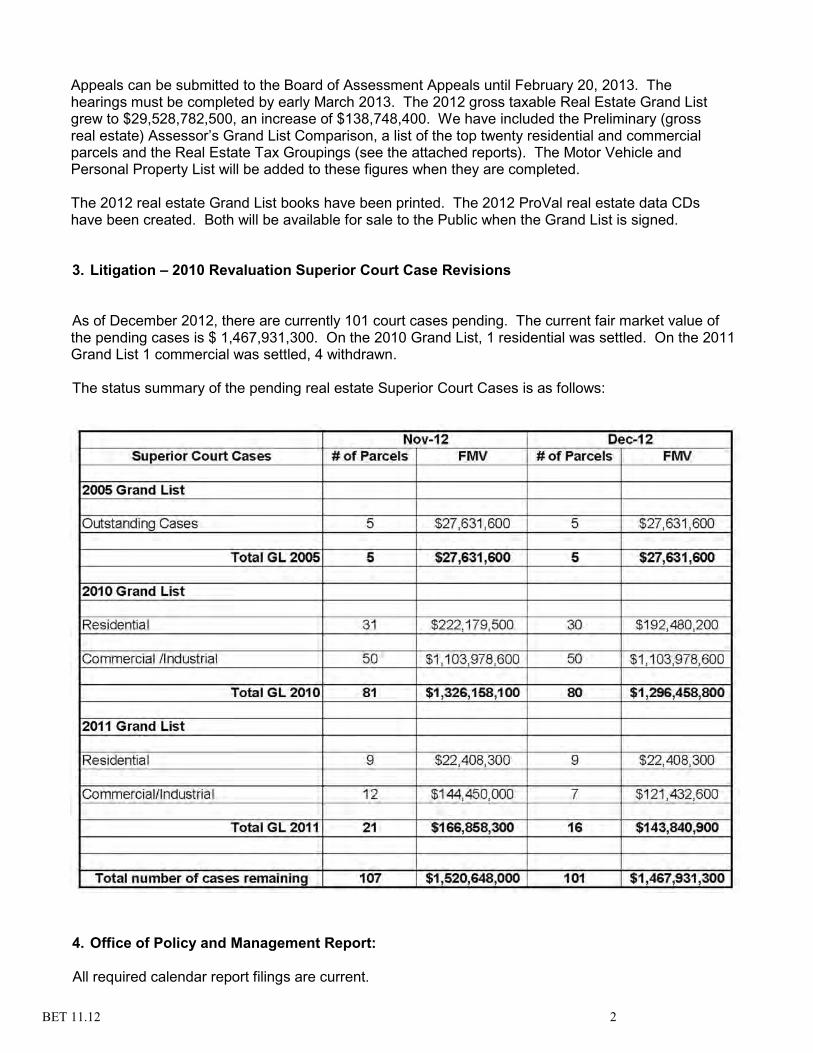
BET 11.12 2
Appeals can be submitted to the Board of Assessment Appeals until February 20, 2013. The hearings must be completed by early March 2013. The 2012 gross taxable Real Estate Grand List grew to $29,528,782,500, an increase of $138,748,400. We have included the Preliminary (gross real estate) Assessor’s Grand List Comparison, a list of the top twenty residential and commercial parcels and the Real Estate Tax Groupings (see the attached reports). The Motor Vehicle and Personal Property List will be added to these figures when they are completed. The 2012 real estate Grand List books have been printed. The 2012 ProVal real estate data CDs have been created. Both will be available for sale to the Public when the Grand List is signed. 3. Litigation – 2010 Revaluation Superior Court Case Revisions As of December 2012, there are currently 101 court cases pending. The current fair market value of the pending cases is $ 1,467,931,300. On the 2010 Grand List, 1 residential was settled. On the 2011 Grand List 1 commercial was settled, 4 withdrawn. The status summary of the pending real estate Superior Court Cases is as follows: 4. Office of Policy and Management Report:
All required calendar report filings are current.

BET 11.12 3
OBJECTIVES
1. Short Term:
Respond to public inquiries about property valuation resulting from tax bills. Prepare Certificates of Correction/Pro-ration Adjustments.
2. Ongoing: Continue entering changes of ownership and address changes. Continue processing pro-rations of motor vehicles.
Continue submitting monthly Certificate reports to Finance and the Tax Collector.
3. Long Term: Foster staff training and development. Continue monitoring the results of the revaluation.
Respectfully submitted,
Lauren Elliott, CCMA II Assessor, Town of Greenwich
Attachments:
1) (Preliminary) Assessor’s GL Comparison - Taxable 2) Top 20 Residential and Commercial Parcels 3) 2012 Real Estate Tax Groupings
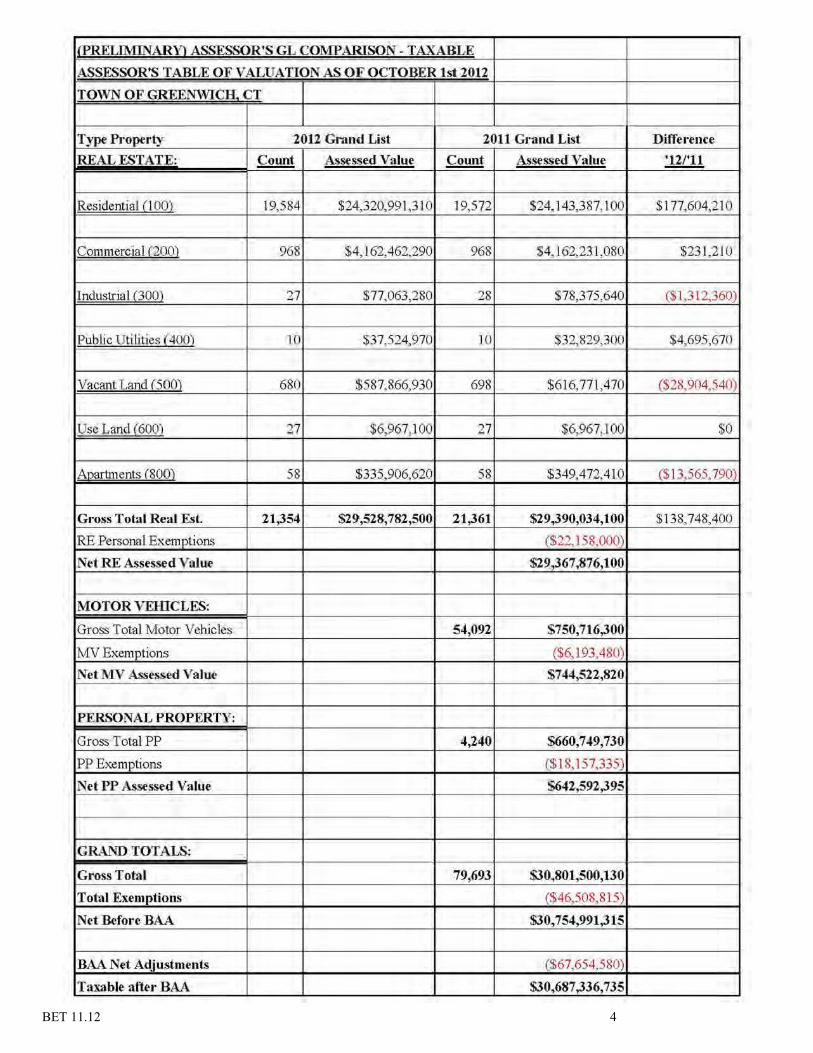
BET 11.12 4
(ERELIMINARY) ASSESSOR'S GL COMPARISON - TAXABLE
ASSESSOR'S TABLE OF VALUATION AS OF OCTOBER 1st 2012 -TOWN OF GREENVI'ICH1 CT
Type Property 1012 Grand List 2011 Grand List Diffe1·ence
REALEST ATE: Count Assessed Value Count Assessed Value 'U/'11
Residential (1 00') 19,584 $24,320,991,31 0 19,572 $24~ 143,387,100 $177,604,210
Commerc'ial (200) 968 $4, ] 62,462,290 968 $4,162,231,080 $231.210
Industrial {300) 27 $77,063,280 28 $78,375,640 ($1.312,360)
Public Utilities ( 400) 10 $37.524,970 10 $32,829,300 $4,695,670
Vacant Land (500) 680 $587,866,930 698 $616,771,470 ($28.904,540)
Use Land (600'1 27 $6,961,100 27 $6.967,100 $0
ADartments (800) 58 $335,906,620 58 $349.472,410 ($13,565, 790)
Gmss Total Real Est. 21,354 $29,528,782,500 21,361 $29,390,034,100 $138,748,400
RE Personal Ex.emptions cs;~2Jsg.ooo)
Ntt RE Assessed Value $29,367,876,100
MOTOR v'EIITCLE&
Gross Total Motor Vehicles 54,092 $750,716,300
MV Exemptions ($6,193,480)
Net MV Assessed VaJue $744,522,820
PERSONAL PROPERTY:
Gross Total PP 4,240 $660,749,730
PP Exemptions ($18,157,335)
Net PP Asse~d Value $642,592,395
GRAND TOTALS:
Gross Total 79,693 $30~801,500,130
Total Exemptions ($46.508,815)
Net Before B AA $30,754,991,315
BAA Net Adjustments ($67,654,580)
Taxable afte•· BAA $30.687,336,735
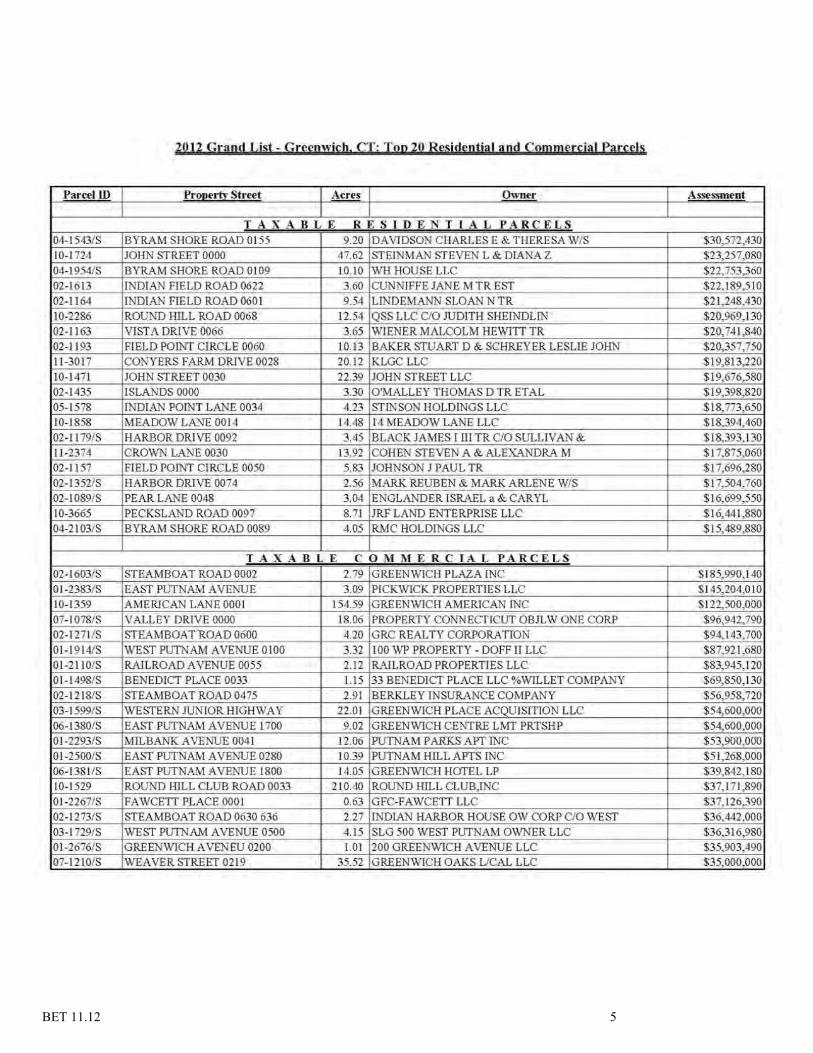
BET 11.12 5
1012 Grand List - Greenwich. CT: Top 20 Residentjal and Commercial Parcels
Parcel ID Prooer1T Street Acres Owner Assessment
TAXABL E R E S l D EN TIAL PAR C ELS 04-1543/S BYRM1 SHORE ROAD 0155 9.20 DA VlDSON CHARLES E & THERESA W/S $30,572,430 10-1724 JOHN STREET 0000 47.62 STEINMAN STEVEN L & DiANA Z $23,257,080 04-1954/S BYRAM SHORE ROAD 0109 10.10 WHHOUSELLC $22,753, 360
02-16 13 fNDIAN HELD ROAD 0622 3.60 CUNNIFF£ lANE M TREST $22, 189,510
02-11 64 INDIAN FiELD ROAD 0601 9.54 LINDEMANN SLOAN N TR $21,248,430
10-2286 ROUND HILL ROAD 0068 12.54 QSS LLC C/0 JUDITH SHEfNDLlN $20,969,130 02-1163 VlST A DRL VE 0066 3.65 WIENER MALCOLM HEW1TI TR $20,741 ,840 02-11 93 FIELD POINT CIRCLE 0060 10.13 BAKER STUART D & SCHREYER LESLIE JOHN $20,357,750 11-3017 CONYERS FARM DRIVE 0028 20.12 RLGC LLC $19,813,220 10-1471 JOHN STREET 0030 22.39 JOHN STREET LLC $19,676,580 02-1435 ISLANDS 0000 3.30 O'MALLEY THOMAS D TR ETAL $I 9,398,820
05-1578 INDIAN POINT LANE 0034 4.23 STINSON HOLDINGS LLC $18.773,650 10-1858 MEADOW LA..\J"E 0014 14.48 14 MEADOW LANE LLC $18.394,460
02-1179/S HARBOR DRIVE 0092 3.45 BLACK JAMES I nTTR C/0 SULLIVAN & $18393,130 11-2374 CROWN LANE 0030 13.92 COHEN STEVEN A & ALEX-\NDRA M $17,875,060 02-1157 FIELD POINI CIRCLE 0050 5.83 JOHNSON J PAUL TR $17,696,280
02-1352/S HARBOR DRIVE 0074 2.56 MARK REUBEN & MARK ARLENE W/S $17.504,760 02-1089/S PEAR LANE 0048 3.04 ENGLANDER fSRAEL a &CARYL $16.699,550
10-3665 PECKSLA.ND ROAD 0097 8.71 JRF LAND ENTERPRiSE LLC $1 6,441 ,880 04-2103/S BYRAM SHORE ROAD OOS9 4.05 RMC HOLDINGS LLC $15,489,880
T AXA BL E C OMMERCIAL PARCELS 02-1 603/S STEAMBOAT ROAD 0002 2.79 GREEN~CHPLAZAINC $185,990,140 01-1383/S EAST PUfNAM AVENUE 3.09 PICKWICK PROPERTIES LLC $145,204,010 10-1359 AMERICAN LANE 0001 154.59 GREENWICH AMERICAN lNC $122,500,000 07-1078/S VALLEY DRIVE 0000 18.06 PROPERTY CONNECTICUT OBJLW ONE CORP $96,942,790 02-1271/S STEAMBOAT ROAD 0600 4.20 GRC REALTY CORPORATION $94,143,700
01-1 914/S WEST PUTNAM AVENUE 0100 3 .32 100 WP PROPERTY- DOFF II LLC $8 7.921 ,680 01-21 10/S RAJLROAD A VENUE 0055 2.12 RAlLROAD PROPERTIES LLC $83.945,120 01-1 498/S BENEDICT PLACE 0033 1.15 33 BEN EDICT PLACE LLC %WILLET COMPANY $69,850,130
02-1218/S STEAMBOAT ROAD 0475 2.91 BERKLEYINSU~~NCECOMPANY $56.958,720 03-1599/S WESTER.t'll JUNIOR HIGHWAY 2201 GREENWICH PLACE ACQUISITION LLC $54,600,000 06-1380/S EAST PUTNAM A VENUE l 700 9.02 GREENWICH CENTRE LMT PRTSHP $54,600,000 01-2293/S MILBANK A VENUE 0041 12.06 PUTNAM PARKS APT INC $53,900,000 01-2500/S EAST PUfNAM A VENUE 0280 10.39 PUTNAM HrLL APTS INC $51,268,000 06-1381/S EAST PUfNAM A VENUE 1800 14.05 GREENWICH HafEL LP $39.842.180 10-1529 ROUND HILL CLUB ROAD 0033 210.40 ROUND HILL CL UB,INC $37,17 1,890 01-2267/S FAWCETT PLACE 0001 0.63 GFC-FAWCETT LLC $37,126, 390 02-1273/S STEAMBOAT ROAD 0630 636 2.27 INDIAN HARBOR HOUSE OW CORP C/0 WEST $36,442,000 03-1 729/S WEST PUTNAM AVENUE 0500 4.15 SLG 500 \VEST PUTNAM OWNER LLC $36.316,980
01-2676/S GREENWICH A VENEU 0200 101 200 GREENWICH A VENUE U.C $35,903~-490
07-1210/S WEAVER STREET 0219 35.52 G REENWICH OAKS UCAL LLC $35,000.000

BET 11.12 6
2012 Real EstateTax Groupings
Crite ria ' 12 # Parcels '11 Asmt (Post BAA) '12 Asmt (PrEN3AA) Percent Change
All Taxable RE 21,354 $29,317,715,980 $29,528,782,500 0.72% Taxable Residential RE 20,244 $24,691 ,040,850 $24,889,330,760 0.80% Taxable Non-Res"idential RE ----------J~1~~-1--------~~~2E~§??~!~~ --------11·§.3•9 ... ~.?.1.:?~E 0.28% ------------------------------------- ------------------All Taxable RE W{Sewer 16,007 $16,990,021,230 $17,137,582,420 0.87% Taxable Residential RE W[Sewer 14,985 $12,792,079,860 $12,937,234,450 1.13% Taxable Non-Residential RE W/Sewer 1,022 $4,197,941,.370 $4,200,347,970 0.06% Exempt Only RE 949 $2,523,496,710 $2,550,486,610 1.07% Exempt Residential R E 421 $80,225,460 $82,460,560 2.79% s~~~et~-~~:~~~~-~~~~L~s ____________ 528 $2,443,271,250 $2,468,026,050 1.01% ------------323 __________ $2~o23~62s:15o ---------------------~-~-----------------: Exempt Only RE Wfsewer $2,041,440,800 0.88% Exempt Residential R E W/Sewer· 50 $40,360,390 $41 '148,800 1.95% Exempt Non-Residential RE W/Sewer 273 $1,983,265,760 $2,000,292,000 0.86%
AliRE 22,303 $31 ,841 ,212,690 $32,079,269,110 0.75% All Residential RE 20,665 $24,771 ,266,.31 0 $24,971 '7'91 ,320 0.81% All Non-Residential RE 1,638 $7,069,946,.380 _________ $_~.~-0.~·~!! ... ?~2 0.53% Ain~ewisewer·-------------------- ---------16~33o- -------$1~~o13:s47:3ao $19,179,0<23,220 ------------6~87~
All Residential RE WJSewer 15,035 $12,832,440,250 $12,978,383,250 1.14% All Non-Residential RE W/Sewer 1,295 ' $6,181,207,130 $6,200,6·39,970 0.31%

1
COMPTROLLER’S REPORT November 20, 2012 – December 17, 2012
Retirement Board
The Preliminary Flash Report for November 30, 2012 listed an ending market value of $326,053,518, up from the $325,700,572 ending market value for October 31, 2012. The composite return for November 2012 was a positive 0.6% for the month. The composite investment returns for the previous twelve months were up 12.4% and up 1.8% annually for the previous five years. The June 30, 2012 year-ending balance of assets was $303,155,322. The revised market value of assets at June 30, 2011 (per the Flash Report) was $308,376,005 and is up from the reported value of $269,196,664 at June 30, 2010. The Retirement Board has decided to invest $10 million in the HarbourVest Fund by means of becoming a limited partner in three separate Delaware limited partnerships: a “Buyout Fund”, “Venture Fund” and “Credit Opportunities Fund”. This investment has been forwarded and approved at the BET Investment Advisory Committee at its November 19, 2012 meeting (Note: Mr. Norton abstained contingent upon the receipt of additional information relative to risk). Subsequent to the BET Law Department Committee review and approval on December 12, 2012, the agreement will be forwarded to the BET for approval at its December 17, 2012 meeting. If approved, the first capital contribution drawdown will be forwarded on December 18, 2012 for $1,551,881.
FY 2012 - 2013 Capital Project Financing The BET Investment Advisory Committee will hold an informational meeting in January 2013 with the Town’s financial advisor, Mr. William Lindsay of Independent Bond and Investment Consultants (IBIC), to review the upcoming capital projects financing. Subsequent to the meeting and prior to the borrowings, the credit rating reviews with Moody’s Investor Services (Aaa), Fitch Ratings (AAA) and Standard and Poor’s (AAA) will occur on January 8th and 9, 2013. The Town of Greenwich will go to market on January 17, 2013 to borrow approximately $55 million of one-year Bond Anticipation Notes (BANS) and $22 million in General Obligation Bonds to fund various capital projects. These amounts are preliminary, since the financing is still in the process of being sized. Last year (January 2012) there were 12 competitive bids for the $16.5 million General Obligation Bond financing ultimately purchased by UBS Financial Services Inc. at a blended effective rate of 1.52%. In addition, there were 13 competitive bids for the $40 million BANS with Bank of America Merrill Lynch winning with an effective rate of 0.13%.
Risk Management Hurricane Sandy Update – Hurricane Sandy has created the need for Risk Management’s participation in the Town’s insurance recovery effort. Risk Management, with the help of the Town’s Internal Auditor, has begun an inventory of property damage with an initial effort concentrating on the damage done to Town owned trees. The team has inventoried over 300 trees that have fallen or were deemed non-recoverable. Risk Management has contacted the Town’s insurance carriers and put them on notice that a
2
claim is pending. After filing the claim, Risk Management has contacted the adjusters assigned by our property insurance carrier, Lexington & Co. Risk Management has accompanied the insurance adjusters to ten Town properties for the purpose of reviewing and displaying to our carriers the damages incurred. There are many more properties to be inspected before the process is complete. There is also the distinct possibility that many of the locations will have to be revisited. The size of the potential claim raises the level of required documentation and due diligence performed by the adjusters. The adjusters are experts in processing tree claims. At this point, it is not clear if the tree adjusters will also be estimating non-tree property damage. This effort has to be coordinated with the Federal Emergency Management Agency (FEMA). Risk Management is in the process of receiving a $225,000 advance payment from the Town’s property insurance carrier for Hurricane Sandy damage. This amount does not represent a percentage of what we expect to receive. The initial claims for reimbursement are at $4.4 million and rising. The Workers Compensation Administrator and other Finance Department attendees, continue to hold periodic Department Head and Supervisor’s meetings with Connecticut Interlocal Risk Management Agency (CIRMA) representatives to keep the lines of communication open in the area of workers’ compensation loss control. The main purpose is to discuss the status of the more important workers’ compensation claims in need of attention within their respective departments. The latest meeting was held November 28, 2012 and the next meeting is scheduled for January 9, 2013 with CIRMA representatives meeting with various Town officials. In addition, the Workers’ Compensation Administrator attended the October 9, 2012, November 13, 2012 and December 14, 2012 BET Human Resources Committee meetings with an objective to supply the Committee with the status of workers’ compensation claims on a monthly basis. The First Selectman has formalized the previous ad hoc “Steering Committee Group” by announcing the appointment of the “First Selectman’s Safety Counsel” to oversee the Town’s safety efforts. The new First Selectman’s Safety Counsel had its first meeting on October 2, 2012. Added to the group was representation from the Police and Fire Departments, Nathaniel Witherell, Parks and Recreation, Public Works and the Board of Education. The Human Resources Director, Mary Pepe, has been chosen to chair the meetings. The group met again in November and December and will be meeting on a monthly basis prior to the monthly First Selectman’s staff meetings. In addition, there was a meeting of the Town of Greenwich Health and Safety Committee on December 11, 2012. The existence of a safety committee is a requirement and mandated by State of Connecticut statute.
Internal Audit As previously mentioned, Internal Audit is has been assisting with the effort of accumulating data for the insurance recovery claim for the Town of Greenwich. Due to this provided assistance, all audits were temporarily delayed, including the audit of the Greenwich Fire Department’s Fire Marshall’s Office. However, the Fire Marshal Audit has commenced. The Internal Audit Department was able to recently complete an audit of the Greenwich Police Department’s permitting process. The major points of the audit were presented to the Audit Committee at the November Audit Committee meeting. The Audit was further presented to the Audit Committee and formally approved at the December meeting.

3
Cash Management
Cash Flow Report - The Town’s cash position at November 30, 2012 was $83.4 million, $2.5 million higher than November 30, 2011. For the month, the Town used $16.1 million of net cash, resulting in a $4.2 million higher cash position than forecast last month. Spending was lower by $4 million, primarily due to timing of the payment of the healthcare insurance premiums for November. No adjustments for expenditures relating to Hurricane Sandy are in this cash forecast. When the estimates are available the forecast will be adjusted. It is anticipated that substantial amounts of reimbursement from Hurricane Sandy will be received from insurance policy coverage and FEMA reimbursements. However, the timing and amount of those receipts cannot be forecasted at this time. Interest Rates – Short term interest rates remain constant with little change since last reported. The Connecticut Short Term Investment Fund (STIF) which invests in higher yielding securities, such as commercial paper and longer term mortgage backed investments is currently yielding 0.23% (vs. last month 0.23%) Vanguard’s current rate remains at 0.01%. Below are current rates from various financial institutions as of December 11, 2012:
Webster JPM Bank of TD
Maturity Bank Chase America Bank Benchmark*
CD Rates
30 days 0.02% 0.10% 0.07% 0.13%
60 days 0.02% 0.10% 0.08% 0.17%
90 days 0.04% 0.10% 0.10% 0.13% 0.35%
180 days 0.10% 0.10% 0.17% 0.11% 0.50%
Money Market 0.23% 0.25% 0.07% 0.20%
*Source: Northern Capital
Bank Certificates of Deposit (CD) rates are a reflection of the respective banks’ appetite for deposits. Rates were flat compared to the October report, with the exception of Webster Bank which dropped its rates across all maturities by 5 to 7 basis points. The 180 day CD rate benchmark increased by 10 basis points. Bank depository accounts remain the best option for short-term fund investing.
4
Other Post Employee Benefits (OPEB) – As of the end of November, the OPEB Trust Fund had assets (excluding operating cash) totaling $20,669,794. The Portfolio was up 0.48% for the month, with a gain of $91,837. The portfolio lagged its benchmark by 15 bps. At the November 16th OPEB Trust Board meeting, the allocation to domestic equities was reduced by 6% and the allocation to DoubleLine Total Return Bond Fund was increased by 6%. The new target allocation is 50% fixed income and 50% equity, a more defensive position given the Fiscal Cliff negotiations in Washington and global economic risks.
The Fixed Income benchmark return was 0.17%. The fixed income allocation was short of its benchmark by 16 basis points returning 0.01% after adjusting for accrued dividends. The Vanguard Total Bond Fund was in line with its benchmark. Only the Credit Suisse Floating Rate Fund and the U.S. Preferred Shares ETF beat the benchmark, returning 0.54% and 0.18% respectively. CSJ (1-3 year Credit) recorded a loss of (0.19%) for the month, trailing the respective Barclays 1-3 Credit Index by 24 bps. During the month, there were significant inflows in the first half of the month and significant outflows at the end of the month. This may have impacted the returns. The High Yield Fund (MWHYX) was up 0.06% for the month trailing its benchmark by 74 basis points, and the preferred equity ETF (PFF) was up 0.18%. The PIMCO Foreign Bond was down (0.45%) yet still beat its benchmark by 17 bps.
The portfolio’s equity allocation was up 1.03%, beating its benchmark by 9 basis points. The Vanguard Domestic Equity Fund was up 0.74% in line with its benchmark. Yacktman (YAFFX) was up 1.33%, beating its benchmark (S&P Index) by 75 basis points. The return on the S&P Dividend ETF (SDY) was positive 0.86% beating its benchmark by 28 basis points. Fair Value adjustments of negative (4 bps) and 0 bps, respectively, for the month had little or no impact on the returns of Vanguard’s International Equity (VTSGX) and the Emerging Market Funds (VERSX). For the month of November these funds returned 1.81% and 1.32%, respectively. The Treasurer is coordinating with Vanguard and the Yacktman Funds to see if OPEB can exchange its current class (Service Class) shares for shares in the new Institutional Share class. The expense ratio is 16 basis points lower in the institutional share class of Yacktman Focused Fund.
As of November 30th, the portfolio is within 0.6% with the current target asset allocation. Fixed income is under weighted by $113,000.
The OPEB Trust Board members recommended that the Town look into options for the members to have access to a Bloomberg terminal to research investment options and to have the ability to generate analytical schedules including both technical and fundamental analyses which they currently review as a backdrop for their discussions of current market conditions to form a consensus for asset allocation of the portfolio. The Comptroller and the Treasurer met with representatives of Bloomberg to discuss the license options and see a demonstration of the capabilities. The license fee for one terminal that can be accessed by a multitude of users is $20,000 per year, with a two year minimum. Misc. -The Treasurer is working with the Department of Parks and Recreation to evaluate the costs and steps to set up the capability to pay online with a credit card for certain programs/services. Retirement Administration – the Treasurer coordinates payments of the Private Equity capital calls and distributions with State Street Bank (Custodian) on a routine basis.
5
The Treasurer coordinated with the Retirement Board, the Investment Advisor and the Custodian the approved redemption of the position in SSGA’s U.S. Aggregate Bond Fund and the investment in PIMCO’s Total Return Fund. The investment was deferred due to a concern that was raised by the Investment Advisor that there may be indemnification language in the prospectus that the legal department may need to review. The Treasurer assisted the external auditors in obtaining audited annual reports for the private equity funds. The Treasurer also responded to the auditor’s request for expanded footnote disclosure for the Pension Fund and OPEB regarding the fixed income holdings and the respective investment policies’ asset allocation ranges.
Request for Proposals (RFP’s) There are a number of contracts all expiring June 30, 2013. Since they are in their final contract year they all will have to be rebid through the RFP process. The Comptroller is updating the respective RFP documents. They are as follows: Workers’ Compensation Administration – The current provider is the Connecticut Interlocal Risk Management Agency (CIRMA). CIRMA is the third-party administrator for workers’ compensation. The RFP will be issued in January 2012 with interviews and selections in February or March 2013. Liability, Automobile and Property Claims Administration – The current provider is CIRMA for third-party administration of the above mentioned claims, working in conjunction with the Law Department and the Risk Manager. This RFP will also be issued in January 2012 and interviews and a selection will be in February or March 2013. Retirement Board/Pension Plan Actuary – The current actuary for the Retirement Board is EFI, Inc. Their five-year contract expires June 30, 2013. An RFP will be issued subsequent to the completion of their current year assignment in either December 2012 or January 2013. The Retirement Board will be interviewing and selecting the Retirement actuary. Other Post Employment Benefits (OPEB) Actuary – The current actuary for the OPEB Fund is Hooker and Holcomb. Their five-year contract expires June 30, 2013. An RFP will be issued subsequent to their current year assignment in either January or February 2013. Insurance Broker – The current insurance broker for the Town is Frenkel and Company. Their contract will be expiring June 30, 2013. The RFP will be issued in December with interviews and a selection in January or February 2013.
Year-End Closing The Finance Department has completed the process of closing the books for the fiscal year ending June 30, 2012. As previously mentioned in prior Comptroller’s Reports, a new auditor (McGladrey and Pullen) has been engaged to complete the audit this year. As with the previous auditors, the goal to have a completed Comprehensive Annual Financial Report (CAFR), Single Federal and State Audit and a Management Letter for approvals at the December BET Audit Committee and BET meetings has been

6
met. The full BET will vote to approve the previously mentioned audits and management letter at its December 2012 meeting. The Finance Department has completed updating the Town of Greenwich Departmental Annual Reports for the year ending June 30, 2012. _________________________ Peter Mynarski Jr. Comptroller
ebrown
Stamp

TOWN OF GREENWICHCASH FORECAST
FY 2012-2013
NOVEMBER 2012 Report
July-12 Aug-12 Sep-12 Oct-12 Nov-12 Dec-12 Jan-13 Feb-13 Mar-13 Apr-13 May-13 Jun-13 FY 2013
Receipts BUDGET Tax Receipts 328,114,587 128,603,202 47,535,000 2,075,214 1,463,065 1,315,000 16,376,826 107,433,192 20,568,445 1,543,831 1,741,646 1,248,942 730,124 330,634,488 Advance Tax collections 0 (31,131,191) 10,000,000 (21,131,191) Conveyance Tax 4,000,000 515,428 552,539 552,571 272,860 270,678 293,656 268,788 158,028 328,912 328,327 493,058 455,000 4,489,844 Building Permits 3,500,000 282,889 308,445 283,052 175,705 309,439 243,586 168,946 164,758 200,419 254,131 591,106 356,021 3,338,498 Interest Income 400,000 20,601 31,389 26,145 22,959 17,750 18,608 24,190 28,267 24,258 20,165 16,352 11,775 262,458 Employee Health Contributions 3,945,000 162,614 163,721 361,753 367,905 546,443 517,448 303,206 304,565 304,159 302,818 305,000 454,000 4,093,630 Retiree Health Contributions (OPEB) 2,981,000 374,470 321,000 334,759 377,000 328,591 231,750 231,750 231,750 231,750 231,750 231,750 231,750 3,358,070 BOE Grants & Other 8,954,577 308,506 290,830 1,208,119 1,455,415 962,437 126,584 1,556,921 1,384,763 513,480 2,383,270 464,476 126,584 10,781,385 Transfers (S+J+G+BOE) 3,474,000 - 23,654 - - 471,701 800,000 999,000 1,123,933 3,418,289 NW Fringe Transfer 5,799,000 - 466,386 488,118 600,000 - 650,000 650,000 650,000 650,000 650,000 4,804,503 Other Receipts 7,925,996 443,254 1,259,628 920,177 981,136 989,448 500,000 600,000 500,000 500,000 500,000 500,000 500,000 8,193,642
TOTAL 369,094,160 99,579,774 50,952,591 6,249,907 5,116,045 4,739,785 19,380,159 110,586,994 23,990,576 4,296,809 7,212,107 5,499,685 14,639,187 352,243,619
DisbursementsPayroll 16,986,145 13,331,118 16,251,013 23,861,024 16,921,162 15,873,628 16,780,000 16,310,000 16,330,000 16,320,000 22,720,000 16,320,000 208,004,091 Uniforms/Longevity/Holiday Pay - - - - 1,300,000 446,372 - - - - 1,300,000 - 3,046,372
Vendor 13,931,000 13,616,756 18,824,074 16,271,891 5,526,467 19,500,000 11,000,000 16,000,000 10,000,000 12,500,000 12,500,000 12,500,000 162,170,188 Net of Reimbursements: Capital Proj. (Bond Proceeds) (650,000) (1,804,428) (5,377,357) (3,318,540) (885,465) (600,000) (500,000) (1,250,000) 1,750,000 (1,250,000) (1,500,000) (1,600,000) (16,985,790) Nathaniel Witherell (1,200,000) (1,365,104) (1,165,675) (1,988,128) (1,475,000) (750,000) (750,000) (1,500,000) (1,700,000) (1,700,000) (1,500,000) (2,000,000) (17,093,908) Inter Fund receipts (485,970) (1,968,459) (774,025) (951,846) (1,900,000) (1,800,000) (1,750,000) (1,000,000) (1,200,000) (1,500,000) (1,600,000) (2,000,000) (16,930,300) NET General Fund - VENDOR 11,595,030 8,478,765 11,507,017 10,013,377 1,266,002 16,350,000 8,000,000 12,250,000 8,850,000 8,050,000 7,900,000 6,900,000 111,160,191
Pension Contribution-net 16,400,000 15,038,803 15,038,803 OPEB Contribution - Net (571,000) (1,500,000) (2,071,000) HSA Town Contribution 2,964,000 36,042 469 2,964,000 3,000,510 Town Match 401k etc. 2,150,000 60,620 2,150,000 2,210,620 Sewer Taxes Transfer 11,519,847 4,456,734 3,863,102 8,319,836 CAPITAL Reserve trnsfer 2,809,000 108,565 (2,410,087) 2,410,087 441,811 550,376 Risk finance Transfer 599,000 599,000 Transfer to NW 1,000,000 1,000,000 1,000,000 Caremark/ Stirling/MetLife 435,591 637,936 431,772 389,814 496,383 590,000 590,000 590,000 590,000 590,000 590,000 590,000 6,521,495 CIRMA Workman's Comp 2,448,000 476,843 - 345,953 258,181 212,816 190,206 132,395 337,870 211,513 220,873 207,821 197,159 2,791,631 Police Benefit 184,000 14,391 14,391 14,391 15,075 15,075 15,075 15,075 15,075 15,075 15,075 15,075 15,075 178,848 Debt Service: - B fund Transfer -Debt Premium amort. - BAN Interest Only 600,000 600,000 Clean Water bonds 225,175 225,175 225,175 225,175 225,175 225,175 225,175 225,175 225,175 225,175 225,175 225,175 2,702,097 $19 M Refunding Bonds 361,444 1,466,444 1,827,888 $11.385 GO Bond 2007 Matured - $45 M GO Bond 2010 518,019 8,648,019 9,166,038 $30 M GO Bond 2011 598,594 5,923,594 6,522,188 $16.5 M GO Bond 2012 207,538 2,786,047 R Belanger Note 105,788 105,788 Other - incl. Float - -
Total Cash Outflows 45,633,693 27,144,118 26,401,275 37,233,822 20,878,425 37,015,900 46,956,092 34,190,222 26,221,763 25,421,123 32,958,071 24,213,853 381,274,771
Borrowings Net GF
Net Cash Flows FY 2012-13 53,946,081 23,808,472 (20,151,368) (32,117,777) (16,138,640) (17,635,741) 63,630,902 (10,199,645) (21,924,954) (18,209,016) (27,458,386) (9,574,666) (32,024,738) Adjust for FY12 cash rec'd June 2012 31,131,191 Net Cash Flow FY 2012-13 (893,547)$
Fund Balance/investments
MBIA 264,028 337,188 209,039 163,088 304,909 92,095 TD Bank MM 30,241,882 59,811,907 62,868,186 47,576,898 39,543,280 23,459,891 B of A MM 252,023 251,994 251,865 251,834 251,805 251,857
JPMorgan Chase MM 37,188,479 61,490,111 82,369,151 77,128,625 52,573,119 52,172,606 Webster Bank 6,064,248 6,065,540 6,066,973 6,493,401 6,822,956 7,380,980 Total (Actual) 74,010,660 127,956,741 151,765,213 131,613,846 99,496,068 83,357,429 65,721,687 129,352,589 119,152,944 97,227,990 79,018,974 51,560,588 41,985,922
Total GF Investments FY2013 74,010,660 127,956,741 151,765,213 131,613,846 99,496,068 83,357,429 65,721,687 129,352,589 119,152,944 97,227,990 79,018,974 51,560,588 41,985,922 Prior Year comparisons:
2011-12 72,306,246 119,152,161 148,831,403 128,816,017 107,491,365 80,820,358 66,043,031 136,092,912 125,763,197 108,723,680 89,802,923 63,779,670 74,010,660 2010-11 28,305,987 39,183,793 130,247,614 108,666,462 90,687,384 72,700,462 66,501,180 116,705,959 122,446,603 104,692,380 90,095,166 67,123,652 72,306,246 2009-10 12,249,345 90,487,415 105,317,506 86,632,858 70,174,194 43,046,667 36,296,100 70,104,989 108,381,757 86,492,145 71,361,109 52,294,033 28,305,987 2008-09 21,238,440 106,678,339 101,230,065 81,668,153 59,788,506 41,428,228 30,947,621 104,227,534 95,441,210 71,906,493 56,202,707 37,731,885 12,249,345 2007-08 30,641,345 110,728,571 105,427,765 81,639,740 56,533,644 36,619,506 24,387,428 100,455,164 94,284,621 77,263,543 61,435,512 39,699,308 21,238,440

Market Value($) % of Portfolio Policy % 1 Mo
(%)YTD(%)
FiscalYTD(%)
1 Yr(%)
3 Yrs(%)
5 Yrs(%)
10 Yrs(%)
_
Total Composite 326,053,518 100.0 100.0 0.6 11.1 4.8 12.4 7.4 1.8 6.5Policy Index 0.7 11.2 4.7 11.2 8.1 1.9 6.5Allocation Index 0.7 10.6 4.6 10.5 7.5 2.2 6.6Financial Composite 278,964,708 85.6 86.0 0.8 11.9 5.4 12.1 7.3 2.0 6.7
Total Domestic Equity 114,652,739 35.2 32.0 0.7 14.4 4.8 15.3 11.6 1.8 6.6Russell 3000 0.8 15.0 5.2 16.0 11.8 1.7 6.9Large Cap Composite 81,233,356 24.9 22.0 0.8 15.3 5.3 16.3 11.5 1.5 6.5
SSgA Russell 1000 Fund 81,233,356 24.9 22.0 0.8 15.3 5.3 16.3 11.7 1.7 --Russell 1000 0.8 15.2 5.3 16.2 11.6 1.6 6.8
Small Cap Composite 33,419,383 10.2 10.0 0.5 12.3 3.5 13.1 12.3 2.9 7.4SSgA Russell 2000 Fund 33,419,383 10.2 10.0 0.5 12.3 3.5 13.1 -- -- --
Russell 2000 0.5 12.3 3.5 13.1 13.8 2.8 8.7Total International Equity 48,261,559 14.8 18.0 1.8 13.1 9.0 10.6 1.0 -6.5 7.6
SSgA MSCI EAFE Fund 26,463,151 8.1 10.0 2.4 14.1 10.5 13.0 -- -- --MSCI EAFE 2.4 13.7 10.4 12.6 3.0 -4.7 7.5
DFA Emerging Markets Fund 21,798,408 6.7 8.0 1.2 11.9 7.3 7.9 -- -- --MSCI Emerging Markets 1.3 12.7 8.4 11.4 4.4 -1.8 15.6
Total Fixed Income 97,654,655 30.0 32.0 0.4 10.4 5.1 11.7 6.9 6.5 5.9SSgA US Aggregate Bond Fund 27,696,837 8.5 15.0 0.2 4.4 2.0 5.5 -- -- --Loomis Sayles Fixed Income 11,650,574 3.6 0.6 14.6 6.7 16.5 -- -- --
Barclays Aggregate 0.2 4.4 1.9 5.5 5.7 6.0 5.4Loomis Sayles Inst'l High Income 14,513,176 4.5 5.0 0.3 15.7 6.6 18.1 -- -- --
Barclays High Yield 0.8 14.0 6.3 17.0 12.5 10.1 10.6SSgA US TIPS Index Fund 9,960,180 3.1 3.0 0.5 7.6 3.5 7.7 8.3 -- --
Barclays US TIPS 0.5 7.7 3.5 7.7 8.3 7.1 7.1Loomis Sayles Global Bond 13,262,466 4.1 4.0 0.2 8.5 4.7 9.3 6.3 7.0 --
Barclays Global Aggregate 0.0 4.7 3.1 5.4 3.9 5.4 6.4Stone Harbor EMD 20,571,421 6.3 5.0 0.9 16.4 8.6 17.6 -- -- --
JP Morgan EMBI Global Diversified 1.2 16.2 8.5 17.5 12.0 10.0 11.1
Town of GreenwichNovember 30, 2012
1

Town of GreenwichNovember 30, 2012
PE/PD SummaryTotal
CommittmentFYTD
ContributionFYTD
DistributionCumulative
ContributionCumulativeDistribution
Since InceptionIRR
Projected MarketValue
_
Welsh Carson CPIV $15,000,000 $0 $476,744 $13,500,000 $7,352,493 5.2% $9,096,776Gilbert Global Equity LP $10,000,000 $0 $1,839,784 $9,371,304 $5,257,360 -2.7% $2,433,762Pinebridge PEP V $10,000,000 $196,487 $104,377 $7,933,551 $847,782 0.8% $7,235,398Welsh Carson XI $5,000,000 $91,588 $0 $2,995,948 $0 8.7% $3,610,299Audax Mezzanine Fund III $5,000,000 $1,170,961 $196,101 $2,118,916 $245,326 4.0% $1,928,539TCW EIG Energy Fund XV $15,000,000 $1,275,000 $380,323 $8,400,000 $526,955 29.0% $9,410,020
XXXXX
Market Value($) % of Portfolio Policy % 1 Mo
(%)YTD(%)
FiscalYTD(%)
1 Yr(%)
3 Yrs(%)
5 Yrs(%)
10 Yrs(%)
_
Real Assets 11,314,258 3.5 3.0 DJ UBS Commodity Index Fund 11,314,258 3.5 3.0 0.1 1.6 5.5 -2.2 1.6 -- --
Dow Jones-UBS Commodity Index TR 0.1 1.6 5.5 -2.2 1.6 -3.8 4.9Cash 7,081,498 2.2 1.0 0.0 0.1 0.0 0.1 0.1 0.7 --
91 Day T-Bills 0.0 0.1 0.0 0.1 0.1 0.4 1.7Alternatives
Real Estate ING Clarion Lion Properties Fund 13,374,017 4.1 5.0 0.0 8.0 2.3 11.0 13.6 -3.5 --
NCREIF ODCE 0.0 8.4 2.8 11.6 12.2 -1.1 6.7Private Equity 22,689,478 7.0 8.0 0.0 8.9 2.6 24.1 9.3 3.9 6.4Private Debt 11,025,315 3.4 1.0 0.0 0.9 -0.9 8.5 -- -- --
Cambridge PE 1 Qtr Lag 0.0 10.9 -0.1 5.9 16.4 5.3 13.7XXXXX
2

Town of GreenwichNovember 30, 2012
Notes: Returns for traditional assets are gross of fee. Returns for alternative assets are reported net of fee.Fiscal year begins July 1stING Clarion Lion Properties Fund market value is based on reported 9/30/2012 valueWelsh Carson CPIV market value is based on reported 9/30/2012 value +/- Quarter-to-Date net cashflows - the Since Inception IRR is based off of 6/30/2012valuationsGilbert Global Equity LP market value is based on reported 6/30/2012 value +/- Quarter-to-Date net cashflows - the Since Inception IRR is based off of6/30/2012 valuationsPinebridge PEP V market value is based on reported 6/30/2012 values +/- Quarter-to-Date net cashflows - the Since Inception IRR is based off of 6/30/2012valuationsWelsh Carson XI market value is based on reported 9/30/2012 value +/- Quarter-to-Date net cashflows - the Since Inception IRR is based off of 6/30/2012valuationsAudax Mezzanine III market value is based on reported 9/30/2012 value +/- Quarter-to-Date net cashflows - the Since Inception IRR is based off of6/30/2012 valuationsTCW EIG Energy Fund XV market value is based on reported 10/31/2012 value +/- Quarter-to-date net cashflows - the Since Inception IRR is based off of6/30/2012 valuations
Composite: Calculated by taking the actual asset class weights times the actual manager return. When compared to the allocation index, it measures theeffectiveness of the managers.
Allocation Index: Calculated by taking the actual asset class weights times the return of the respective passive - benchmark. Measures the effectiveness ofdeviating from the target weights.
Policy Index: Calculated by taking the target asset class weights times the return of the respective passive - benchmark (re-balanced monthly). Measures theeffectiveness of Plan Structure
3
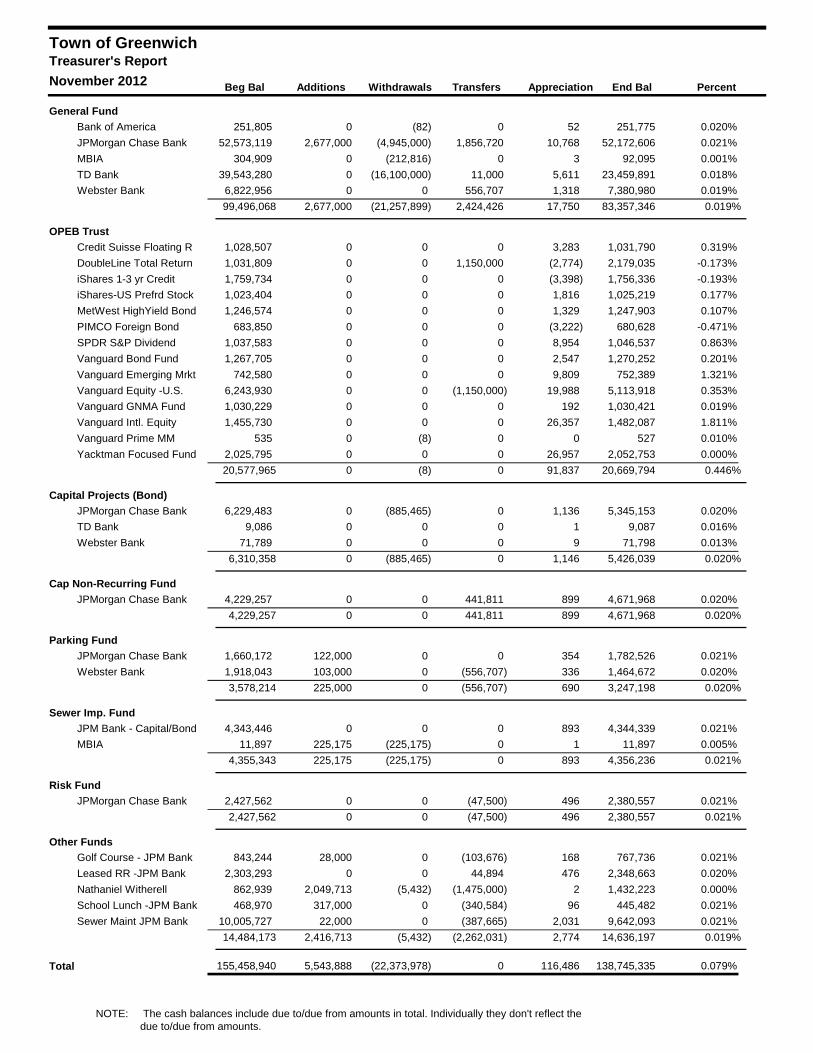
Beg Bal
Town of Greenwich
Additions Withdrawals Transfers Appreciation End Bal Percent
Treasurer's ReportNovember 2012
General Fund0 (82) 0 52 251,775 0.020%Bank of America 251,805
2,677,000 (4,945,000) 1,856,720 10,768 52,172,606 0.021%JPMorgan Chase Bank 52,573,1190 (212,816) 0 3 92,095 0.001%MBIA 304,9090 (16,100,000) 11,000 5,611 23,459,891 0.018%TD Bank 39,543,2800 0 556,707 1,318 7,380,980 0.019%Webster Bank 6,822,956
99,496,068 2,677,000 (21,257,899) 2,424,426 17,750 83,357,346 0.019%
OPEB Trust0 0 0 3,283 1,031,790 0.319%Credit Suisse Floating R 1,028,5070 0 1,150,000 (2,774) 2,179,035 -0.173%DoubleLine Total Return 1,031,8090 0 0 (3,398) 1,756,336 -0.193%iShares 1-3 yr Credit 1,759,7340 0 0 1,816 1,025,219 0.177%iShares-US Prefrd Stock 1,023,4040 0 0 1,329 1,247,903 0.107%MetWest HighYield Bond 1,246,5740 0 0 (3,222) 680,628 -0.471%PIMCO Foreign Bond 683,8500 0 0 8,954 1,046,537 0.863%SPDR S&P Dividend 1,037,5830 0 0 2,547 1,270,252 0.201%Vanguard Bond Fund 1,267,7050 0 0 9,809 752,389 1.321%Vanguard Emerging Mrkt 742,5800 0 (1,150,000) 19,988 5,113,918 0.353%Vanguard Equity -U.S. 6,243,9300 0 0 192 1,030,421 0.019%Vanguard GNMA Fund 1,030,2290 0 0 26,357 1,482,087 1.811%Vanguard Intl. Equity 1,455,7300 (8) 0 0 527 0.010%Vanguard Prime MM 5350 0 0 26,957 2,052,753 0.000%Yacktman Focused Fund 2,025,795
20,577,965 0 (8) 0 91,837 20,669,794 0.446%
Capital Projects (Bond)0 (885,465) 0 1,136 5,345,153 0.020%JPMorgan Chase Bank 6,229,4830 0 0 1 9,087 0.016%TD Bank 9,0860 0 0 9 71,798 0.013%Webster Bank 71,789
6,310,358 0 (885,465) 0 1,146 5,426,039 0.020%
Cap Non-Recurring Fund0 0 441,811 899 4,671,968 0.020%JPMorgan Chase Bank 4,229,257
4,229,257 0 0 441,811 899 4,671,968 0.020%
Parking Fund122,000 0 0 354 1,782,526 0.021%JPMorgan Chase Bank 1,660,172103,000 0 (556,707) 336 1,464,672 0.020%Webster Bank 1,918,043
3,578,214 225,000 0 (556,707) 690 3,247,198 0.020%
Sewer Imp. Fund0 0 0 893 4,344,339 0.021%JPM Bank - Capital/Bond 4,343,446
225,175 (225,175) 0 1 11,897 0.005%MBIA 11,8974,355,343 225,175 (225,175) 0 893 4,356,236 0.021%
Risk Fund0 0 (47,500) 496 2,380,557 0.021%JPMorgan Chase Bank 2,427,562
2,427,562 0 0 (47,500) 496 2,380,557 0.021%
Other Funds28,000 0 (103,676) 168 767,736 0.021%Golf Course - JPM Bank 843,244
0 0 44,894 476 2,348,663 0.020%Leased RR -JPM Bank 2,303,2932,049,713 (5,432) (1,475,000) 2 1,432,223 0.000%Nathaniel Witherell 862,939
317,000 0 (340,584) 96 445,482 0.021%School Lunch -JPM Bank 468,97022,000 0 (387,665) 2,031 9,642,093 0.021%Sewer Maint JPM Bank 10,005,727
14,484,173 2,416,713 (5,432) (2,262,031) 2,774 14,636,197 0.019%
155,458,940 5,543,888 (22,373,978) 0 116,486 138,745,335 0.079%Total
NOTE: The cash balances include due to/due from amounts in total. Individually they don't reflect the
due to/due from amounts.

Beg Bal
Town of Greenwich
Additions Withdrawals Transfers Appreciation End Bal Percent
Treasurer's ReportNovember 2012Year to Date
General Fund252,023 0 (512) 0 263 251,775 0.104%Bank of America
37,188,479 81,926,000 (74,136,840) 7,125,268 69,699 52,172,606 0.110%JPMorgan Chase Bank264,028 1,250,000 (1,421,948) 0 15 92,095 0.006%MBIA
30,241,882 55,888,000 (63,103,000) 391,000 42,008 23,459,891 0.089%TD Bank 6,064,248 0 0 1,309,874 6,858 7,380,980 0.107%Webster Bank
74,010,660 139,064,000 (138,662,300) 8,826,142 118,844 83,357,346 0.101%
OPEB Trust0 0 0 1,030,000 1,790 1,031,790Credit Suisse Floating R0 0 0 2,180,000 (965) 2,179,035DoubleLine Total Return
3,527,587 0 0 (1,824,817) 53,566 1,756,336 1.778%iShares 1-3 yr Credit976,520 0 0 0 48,699 1,025,219 4.783%iShares-US Prefrd Stock
1,176,542 0 0 0 71,361 1,247,903 5.876%MetWest HighYield Bond640,481 0 0 0 40,146 680,628 6.021%PIMCO Foreign Bond988,517 0 0 0 58,020 1,046,537 5.715%SPDR S&P Dividend
1,246,742 0 0 0 23,510 1,270,252 1.863%Vanguard Bond Fund700,168 0 0 0 52,221 752,389 7.252%Vanguard Emerging Mrkt
7,173,440 0 0 (2,415,000) 355,477 5,113,918 5.151%Vanguard Equity -U.S.0 0 0 1,030,000 421 1,030,421Vanguard GNMA Fund
1,353,447 0 0 0 128,641 1,482,087 9.173%Vanguard Intl. Equity571,718 0 (571,016) (183) 7 527 0.013%Vanguard Prime MM
1,985,683 0 0 0 67,069 2,052,753 3.325%Yacktman Focused Fund20,340,846 0 (571,016) 0 899,964 20,669,794 4.666%
Capital Projects (Bond)16,112,709 0 (10,779,956) 0 12,399 5,345,153 0.110%JPMorgan Chase Bank
9,080 0 0 0 8 9,087 0.085%TD Bank 71,750 0 0 0 48 71,798 0.067%Webster Bank
16,193,539 0 (10,779,956) 0 12,455 5,426,039 0.110%
Cap Non-Recurring Fund4,110,938 0 0 557,027 4,003 4,671,968 0.106%JPMorgan Chase Bank4,110,938 0 0 557,027 4,003 4,671,968 0.106%
Parking Fund218,901 1,897,000 0 (334,561) 1,185 1,782,526 0.108%JPMorgan Chase Bank
2,197,149 575,000 0 (1,309,874) 2,398 1,464,672 0.114%Webster Bank 2,416,050 2,472,000 0 (1,644,436) 3,583 3,247,198 0.112%
Sewer Imp. Fund5,593,000 0 0 (1,253,945) 5,284 4,344,339 0.111%JPM Bank - Capital/Bond
11,895 1,125,874 (1,125,874) 0 2 11,897 0.020%MBIA5,604,895 1,125,874 (1,125,874) (1,253,945) 5,286 4,356,236 0.111%
Risk Fund2,470,436 0 0 (92,500) 2,621 2,380,557 0.108%JPMorgan Chase Bank2,470,436 0 0 (92,500) 2,621 2,380,557 0.108%
Other Funds402,935 860,000 0 (495,993) 794 767,736 0.112%Golf Course - JPM Bank
1,910,639 0 0 435,814 2,210 2,348,663 0.106%Leased RR -JPM Bank351,756 9,807,365 (569,077) (8,157,833) 13 1,432,223 0.001%Nathaniel Witherell20,149 1,224,000 0 (798,984) 318 445,482 0.115%School Lunch -JPM Bank
6,907,881 100,000 0 2,624,707 9,505 9,642,093 0.104%Sewer Maint JPM Bank9,593,360 11,991,365 (569,077) (6,392,289) 12,839 14,636,197 0.098%
134,740,724 154,653,239 (151,708,223) 0 1,059,596 138,745,335Total
NOTE: The cash balances include due to/due from amounts in total. Individually they don't reflect the
due to/due from amounts.
Revaluation Team Report December 2012
Bill Finger and Leslie Tarkington December 17, 2012
The Revaluation Team met with Lauren Elliott, Town Assessor, and Bob Shipman, Assistant Assessor on September 19, October 15, November 14, November 15, and December 11. The Office of the Assessor (“Office”) has been closing its books on the Grand List as of October 1, 2012 including inspecting properties for new construction and preparing certificates of correction. During this period reports that would normally be circulated to the BET, such as the residential sales report, cannot be updated in ProVal, while the Grand List numbers are being finalized. Once the Grand List is closed and printed, the Office will again provide ancillary reporting. Only three commercial sales totaling $11.8 million have been recorded in the last quarter. Cumulatively, they sold at 95.1% of the Town’s market (100%) value. Also, during this period the Office prepared its Operational Plan and its Fiscal Year 2013-2014 Operating and Capital Budgets. The Budgets include preliminary preparation and budgeting for the next scheduled revaluation as of October 1, 2015. In coordination with Peter Mynarski and Roland Gieger, the revaluation is budgeted as capital appropriations. The Town must also comply with the State’s Office of Policy and Management’s requirement for a physical inspection of each property at least every 10 years. That schedule has also been incorporated into the capital budget. Further discussion will continue on this aspect of the revaluation, and it is expected that this process will begin in Fiscal Year 2013-2014. Approximately 14,000 residential properties remain to be inspected by October 1, 2015. The Office emphasized the importance of moving ahead immediately on an update or replacement of the MUNIS system. Ms. Elliott has made sure that the new technology is a priority on the list of Information Technology projects. Ms. Elliott and Mr. Shipman are aggressively waiting for the draft request for proposal from the Tax Collector’s Office. This software must be in place by May 31 to proceed with the July 1, 2013 tax billings. Also, it must be in place before the Department can upgrade its ProVal system required to begin the revaluation. Ms. Elliott continues to work with Gene McLaughlin, Assistant Town Attorney, to settle legal cases, to improve the reporting from the Law Department, and to improve the level of detail behind the legal cases charts.

MISA Building Committee and GHS Remediation Report December 2012
Leslie L. Tarkington December 17, 2012
GHS Remediation Greenwich High School environmental reports and community updates are available on line at http://www.greenwichschools.org/page.cfm?p=10019. The most recent updates are posted October 18 and December 5: Community Updates: GHS Environmental Project – Fields & MISA 12/5/12: Letter from US EPA – PCB Soil Disposal Approval for MISA
Footprint 10/18/12: Letter from U.S. Army Corps of Engineers – Determination:
“…no violation of Section 404 of the Clean Water Act” MISA/Greenwich High School Soil Remediation cost update prepared by the Finance Department:

MISA Building Committee and GHS Remediation Report December 2012
Leslie L. Tarkington December 17, 2012
MISA Building Committee The MISA Building Committee meets on the first and third Tuesday of the month at 7:30 am in the Havemeyer Building. The MISA cost update prepared by the Finance Department:
The Nathaniel Witherell Building Committee
The Nathaniel Witherell Building Committee met December 9, 2012 at the facility.
The Committee approved outstanding invoices for the architect, S/L/A/M Collaboration,
and Fogarty, Cohen, Selby, & Neimiroff, LLC, Attorneys. The total amount approved
was $71,061.5998.
The Committee business was to complete a monthly meeting schedule for 2013, and they
will be held the last Tuesday each month, commencing January 29, 2013. Next Tuesday,
December 18 10: AM, there will be contract signings at the facility for nineteen (19) sub
contractors. There will be a ground breaking ceremony on Tuesday, January 8, 2013, and
all will be invited.
The Committee reviewed with Construction Manager, Turner, and the expected project
work schedule with a start date of early January. The building permit is expected to be
issued by year end. The permit for the sprinkler system has been issued, and that work
will commence shortly.
Art Norton
IT Strategic Plan Dec. 13, 2012 Update
On Dec. 5, BerryDunn, the Town's consultant met with the users to review the "Preliminary List of Projects and Initiatives" which it developed from the prioritized issues which it obtained from the users in late November. BerryDunn presented the preliminary list and led a discussion of each item. Two projects – new software for the Tax Assessor and Tax Collector, and the HR IT project – were not included as these are already underway. The discussion of the projects was again followed by the users ranking the projects in importance. The ranked list should be available soon.
Other than the Tax and HR issues, most of the discussion focused on management, organizational and operational issues rather than software applications. Of the top ten ranked projects, only updating the Town's email system is a classic IT project. The BerryDunn cover memo and "Prioritized List of Projects" is attached.
Specific applications-related issues included providing support for departments use of CityView and training departments in the use of MUNIS.

Projects Ranking Memo December 13, 2012
Town of Greenwich Strategic Technology Planning Project
TO: Department Directors and Department Leads
FROM: Town Project Team
SUBJECT: Strategic Technology Issues Work Session
DATE: December 13, 2012
CC: Seth Hedstrom, Chad Snow, Gary Soucy, Tim Masse (BerryDunn)
Thank you again for your participation in the recent work session to confirm and rank the list of projects and initiatives submitted by Town departments and BerryDunn. As you will recall from the Project Kickoff and other subsequent meetings, the process to arrive at this ranked list of projects was iterative. This process began in October, as we facilitated individual fact-finding meetings with each department, and continued in November as we confirmed and prioritized the List of Strategic Issues. In this last work session, we confirmed and ranked projects and initiatives designed to address those Prioritized Strategic Issues. Enclosed with this memo is the ranking of the projects based on voting by all departments in the work session. A higher score for a project is reflective of the results of the voting process and an indication that the group felt that the particular project should be initiated sooner than others on the list. You will also see that we have updated the titles of several of the projects, based on our discussion during the work session. We will use the feedback of our discussion as we plan the specific scope and activities for each project, regardless of whether or not the title has been changed. The Strategic Technology Plan will contain a full description of each project. This project ranking will be one of the factors used to determine where and how each project will be ordered in the Strategic Technology Plan. Other factors include the maturity of technology associated with the project, the ease of the project’s implementation, and the cost benefit of the project, all on a relative scale. The order in the Plan will also account for dependencies among projects, and will include those projects already determined to be in-process, as discussed during the work session. In the coming weeks, we will be working closely with the Town Project Team to develop the initial versions of the Strategic Technology Plan. We may contact individuals for follow-up, and we appreciate your assistance with answering any questions. Please do not hesitate to let us know if you have any questions about this ranking or the next steps in the project. Thank you again for your continued participation and support of this important Town project.

ID Initiative Summary Score
F Establish Town IT Working Group(s); one with a focus on Town Departments and another as inter-agency (BOE, Police, Libraries). 12
I Evaluate the existing Help Desk model in the IT Department and develop a plan for functional improvements and staffing. 10
A Conduct a gap-fit analysis related to the Munis application's core financial modules. 9
C Develop a Document Management Action Plan. 9
E Identify deficiences in the Town's email system and develop an action plan to meet Town needs. 9
N Develop, update and communicate IT policies and procedures. 7
K Reorganize the PC Replacement Plan and identify the need for laptops and tablets. 7
L Update the Town's IT Disaster Recovery Plan. 7
B Conduct a needs assessment related to CityView for the Town departments not using the application. 6
J Create a Project Management focus in the Town for enterprise projects. 6
M Plan and implement technology training for end users and IT Department staff. 5
P Perform an analysis of the Municipal Area Network and Internet access. 4
D Document and communicate the procedure for managing content on the Town's website at the department level. 3
Q Conduct an IT Security Audit. 2
H Select and implement a Town-wide system for scheduling meeting rooms. 2
O Transition the Town to Voice over IP telephony (VoIP). 2
G Select and implement an Assessing and Tax Collection/Billing system. Determined to be in progress with funding committed. 0
Town of GreenwichStrategic Technology Planning Project
Prioritized List of Projects and Initiatives
Prioritized List of Projects and Initiatives December 13, 2012

HarbourVest Partners
Resolution for full Board of Estimate and Taxation for 12/17/12:
The Agreements for investment by the Retirement Board with HarbourVest
Partners in an amount not to exceed $10 million are hereby approved.

Oaktree Opportunities Fund IX
Resolution for full Board of Estimate and Taxation for 12/17/12:
The increase in investment commitment by the Retirement Board, under the prior
approved Agreement with Oaktree Opportunities Fund IX, from $8 Million to not to
exceed $10 million is hereby regularized and approved along with the side letter
accompanying this investment between the Retirement Board and Oaktree
Opportunities Fund IX.

One Main Street | Cambridge, MA 02142 | TEL: 617.374.1300 | www.nepc.com
CAMBRIDGE | ATLANTA | CHARLOTTE | CHICAGO | DETROIT | LAS VEGAS | SAN FRANCISCO
To: Greenwich Retirement Board
From: Douglas Moseley
Date: November 20, 2012
Subject: NEPC Private Equity Recommendation - Harbourvest Fund IX
NEPC recommends that the Greenwich Retirement System retain HarbourVest Partners as a new private equity fund-of-funds manager for the System, investing $10 m in their Fund IX. NEPC believes that the addition of this product is an appropriate way for the Greenwich Retirement Board to enhance the return and diversification characteristics of its overall private equity portfolio and is therefore an appropriate investment for the System to make.
Overview: As part of a review of the System’s private equity portfolio, NEPC recommended firms to interview as potential candidates to manage a fund-of-funds mandate. In September of this year the Board interviewed 3 firms and selected HarbourVest Fund IX as one of two candidates to manage the mandate. The Board then reviewed NEPC’s private equity pacing plan at its October 2012 meeting and voted to approve 2 managers as part of implementing NEPC’s recommendations. HarbourVest Partners is a 100% employee-owned private equity asset manager, founded in 1982 and headquartered in Boston. The firm is currently managing approximately $35 billion in total assets, all of which is managed in a group of US and international private equity products managed by a team of 80 investment professionals and a support staff of 170 people. Other public fund clients include the New York State Common Retirement Fund, State of Pennsylvania, Baltimore County, Virginia and Maryland. The firm and team have over a twenty-year record of managing private equity fund-of-funds products. Over that time the firm has delivered at least 3.0 – 5.0% annualized excess return over both private equity and public market benchmarks. Over the trailing history of firm their products have experienced volatility that is consistent with a diversified private equity portfolio and similar peer group benchmarks. The proposed $10 million allocation will be allocated to 3 sub-strategy commingled funds as follows: $5 million to Buyout Fund IX, $3 m to Venture Fund IX and $2 m to Credit Opportunities Fund IX. Each fund will allocate capital to 12-25 underlying private equity managers over a period of 3-4 vintage years to provide the System with its core allocation to private equity. NEPC has prepared a detailed Fund Review & Evaluation of the strategy that includes additional information on the firm, the investment process, track record and proposed fund terms. Please let us know if you require any additional information.
John Wayne Fox: Town Attorney
Eugene F. McLaughlin, Jr. Fernando F. de Arango Valerie Maze Keeney Aaminll Ahmad Abhy R. Wadler
LAW DEPARTMENT
Town Hall • 101 Field Point Road • P.O. Box 2540 • Greenwich, CT 06836-2540
Tel: (203) 622-7876 Fax: (203) 622-3816
John K. Wetmore Special Counsel
CONFIDENTIAL
Leslie L. Tarkington, Member JeffreyS. Ramer, Esq., Member
November 14, 2012
Law Committee, Board of Estimate and Taxation Town of Greenwich Town Hall 101 Field Point Road Greenwich, CT 06830
Re: HarbourVest Partners
Dear Members of the Law Committee:
The Retirement Board has decided to invest $10 million of the Retirement System Funds in the above captioned HarbourVest fund by means of becoming a limited partner in three separate Delaware limited partnerships. These HarbourVest partnerships will be for a "Buyout Fund", "Venture Fund" and "Credit Opportunities Fund". This letter is based on review of the limited partnership agreements, private placement memorandum, agreement with the investment adviser and brochure filed by the adviser with the Securities and Exchange Commission ("SEC"). We make this report to you as part of review and approval of such agreements by the Board of Estimate and Taxation under Section 208 of the Town Charter. A confidential Executive Summary, Summary of Principal Terms and Terms of the Offering from the Private Placement Memorandum are attached for your reference. This letter will go over legal issues that are encountered by the Retirement Board entering into this limited partnership agreement.
An Affirmative Action/Equal Opportunity Employer, M/F/H

Delaware Limited Partnership, Operative Law, Jurisdiction: Non-U.S. Regulated.
The particular limited partnerships in which the Retirement Board will invest are Delaware limited partnerships. There are also Cayman Island limited partnerships feeder funds in which other investors may invest. The pertinent limited partnerships for Greenwich will be governed under Delaware law and Delaware courts will have jurisdiction. The partnerships are specifically set up to be exempt from regulation or having to register with the Securities and Exchange Commission under United States securities laws. The investment adviser to the fund, HarbourVest Partners, LLC, is, however, registered as an investment adviser with the SEC. Each limited partner will enter into a direct agreement with HarbourVest Partners, LLC wherein this adviser recognizes its fiduciary duty to the Town's employee benefit plan.
Term, Risk, Illiquidity
We do not pass on the risks associated with this investment which is beyond our expertise and the scope of this letter. In addition to the attached summary, the full limited partnership agreement, private placement memorandum and brochure are available for your review. These documents themselves, however, state that this investment has significant investment risks, including risk of loss of the entire investment, is illiquid and that the interest in the limited partnership is generally nontransferrable during the term of the investment. Each limited partnership agreement states that the term of the partnership is fourteen (14) years, unless dissolved sooner, or extended later by limited partners holding at least three-fifths of the fund.
Private Equity Investments
The limited partnerships are described to invest the fund in private equity investments which, as the name of each fund describes, means investments in buyouts, recapitalization, turnaround and other private equity transactions. As in the past with other investments we advise that the Board obtain a letter from the Retirement Board's adviser, New England Pension Consultants, recommending the advisability of this investment.
Standard of Care
The HarbourVest general partner running the funds will generally not be liable for losses to the Town as a limited liability partner as long as HarbourVest is acting in good faith, in the absence of negligence, fraud, willful violation of law, material violation of the limited partnership agreements or breach of fiduciary duty.
Indemnification
The fund is required to indemnify the HarbourVest general partner and other covered persons for damages and expenses incurred in the operation of the fund. The Town, as a limited partner, is limited in its liability to its capital commitment. The fund indemnification of the general partner, however, can come from capital commitment

requirements and be taken back from the limited partners by return of distributions that have been made.
Financial Control
The books and records of the fund are required to be audited yearly by a nationally recognized independent accounting firm. HarbourVest has retained the custodial services of Merrill Lynch for direct investments in companies and stock distributions in private companies.
The standard to be applied by the Board for the approval of this investment is the care of a prudent investor, which includes consideration of the objective of the retirement fund, consideration of the risk relative to return of and on investment, the relation of this investment to other investments in the fund to achieve overall return and availability and liquidity to meet the needs of the fund.
We look forward to discussing this with you at the next meeting of the Committee.
Thank you for your assistance.
EFM:sh Ends. cc: Michael Mason, Chairman, BET
John Wayne Fox, Town Attorney Members of Retirement Board Peter Mynarski, Comptroller
very:alc~/l 0 ene F. M~La~;n~;) stan! Town Attorney
Gregory Bedrosian, Chairman, BET Investments Committee Sean B. Goldrick, BET Investments Committee

I. EXECUTIVE SUMMARY
Harbour Vest Partners L.P. is a deeply experienced and independently-owned private equity manager. Over the past 27 years and across multiple private equity cycles, Harbour Vest has provided fund programs for institutional investors to invest in buyout, venture capital, mezzanine debt, and distressed debt through primary partnerships, secondary purchases, and direct investments. \•Vith a global platform, the Harbour Vest team has developed long-term relationships \vith leading fund managers, established a time-tested due diligence and investment selection process, and created a local presence in private equity markets around the world.
Harbour Vest is offering investors the opportunity to invest in its ninth U.S. fund-of-funds program, Harbour Vest Partners IX ("Fund IX" or the "Investment Program"). Like its predecessor, Harbour Vest Partners VIII, Fund IX will be structured as three separate limited partnership vehicles, collectively known as the "Funds":
.~ Harbour Vest Partners IX-Buyout Fund L.P. or the "Buyout Fund" ~flj HarbourVest Partners IX-Venture Fund L.P. or the "Venture Fund"
0<:;'
Harbour Vest Partners IX-Credit Opportunities Fund L.P. or thc'~~:it Opportunities Fund" ~'\;
c.P
• • •
The Fund Manager - HarbourVest , The Investment Program's manager is Harbour Vest, a*-~,\\ing global private equity investment firm. The experience of the Harbour Vest team dates back to th~1; 1970s when the founders of Harbour Vest began making venture capital partnership investm~~ In 1982, the Harbour Vest team formed its first ~und, ;vit~ $14.8.0 milli~n in commit~cd capit~A)1rovidc ins~tutiona.l investors with an eflic.ient means of mvcstmg m pnvatc cqutty partnerships and o~1t.tmg compames. Thts fund was one of the hrst U.S. private equity fund-of-funds ever formed. ~rbourVest also has a long track record of direct and sccondaiy investing; the first investm~~~rere made in 1983 and 1986, respectively. Over the past 27 years, HarbourVest has committee~\;~ than 1)27.1 billion to primary and secondary investments and nearly $3.7 billion to direct invcs(j<"~~ts.
1978 _-2~<:::- 1986 Investment ,.<._ ~ ~rsidirecl First secondary team made fi1·~~ ' Investment investmer.t u.s. partnership Investment
1992 f.irstU.S. mezzanine/ distressed debt partnership investment
1997 fim independml1'j O.Wied
by management team
2009 Expected innlal
formation of Fund IX, nlnlh
U.S. fund-ol-furtds
, . ") . . . . . ~ . . . ', ..... ~ ,'--' ~ . . 1982•
Formed Fund I, ll1e o1 tt.eflrst
U.S. private-equity tund·of-lunds
•1985 First U.S. buyout partnership Investment
•1990 Lcndoo subsidiary opened: First non-U.S. lund-of-funds fooned (lliPEP I)
3
•1996 Hong Kong subsidiary opened
2007• 25 years of fund management by Investment team
:r

Harbour Vest is also a knowledgeable investor in the non-U.S. private equity markets. During the 1980s, the Finn began making investments outside the U.S. In 1990, the team began offering dedicated nonU.S. investment programs to its clients. To support its global investment platform, the Firm has its headquarters in Boston with subsidiaries in London and Hong Kong, which were established in 1990 and 1996, respectively.
While a lot has changed in the private equity markets over the past three decades, the individuals on Harbour Vest's investment team largely remain the same, and the same skills used to evaluate investments over the years remain at the root of the investment process. Today, the Firm manages capital on behalf of more than 300 institutional investors, including coq:>orate and public pension funds, endowments, foundations, insurance companies, and financial institutions from the U.S., Canada, Europe, Asia, South America and Australia.
HarbourVest Key Differentiators ~
There are many important factors that distinguish Harbour Vest and position it~~'?i manage the Investment Program including: flJ ~
,,>:--~ • Consistent and experienced investment team ~ ~
• Extensive private equity investment experience ()Q<::' • Proven investment strategy
• Demonstrated track record
.():' Consistent and Experienced Investment Te~1~ .
One of the most important attributes ofHarbot..~~~ is its experienced and cohesive investment team. This dedicated team is focused on the pri\'}~luity asset class on a global basis with 82 investment professionals and a total of235 cmplov•et~lated in three strategic geographic regions. The 19 managing directors ofHarbourVest ~Seen with the Firm for an average of 18 years. The experience and continuity of investment pcrso~~clts expected to provide a valuable historical base of knowledge for the Investment Program. Q Many of the most sought~~anagers are often oversubscribed when they raise new funds, making these funds difficult~ ~ess for many investors. The longevity and st:.Lbility of the Harbour Vest team have enabled the Firn~o cultivate relationships with many of these top-tier and exclusive firms, positioning the Investment Program as both a preferred prospective investor and a favored investment partner. Moreover) the information nehvork created by these relationships allows the Harbour Vest team to make investment decisions with extensive market knowledge.
Extensive Private Equity Experience
The private equity markets have evolved and grown significantly over the past three decades, and HarbourVest's professionals have continually navigated these changes to build private equity programs for clients. The team has actively monitored the development and maturation of the private equity markets, with a focus on evaluating and pursuing investment opportunities in the sectors which it believes may have the most return potential. Being an early investor in the asset class has positioned Harbour Vest as a market leader with a deep experience and knowledge base, as well as an extensive netvvork of private equity manager relationships.
4
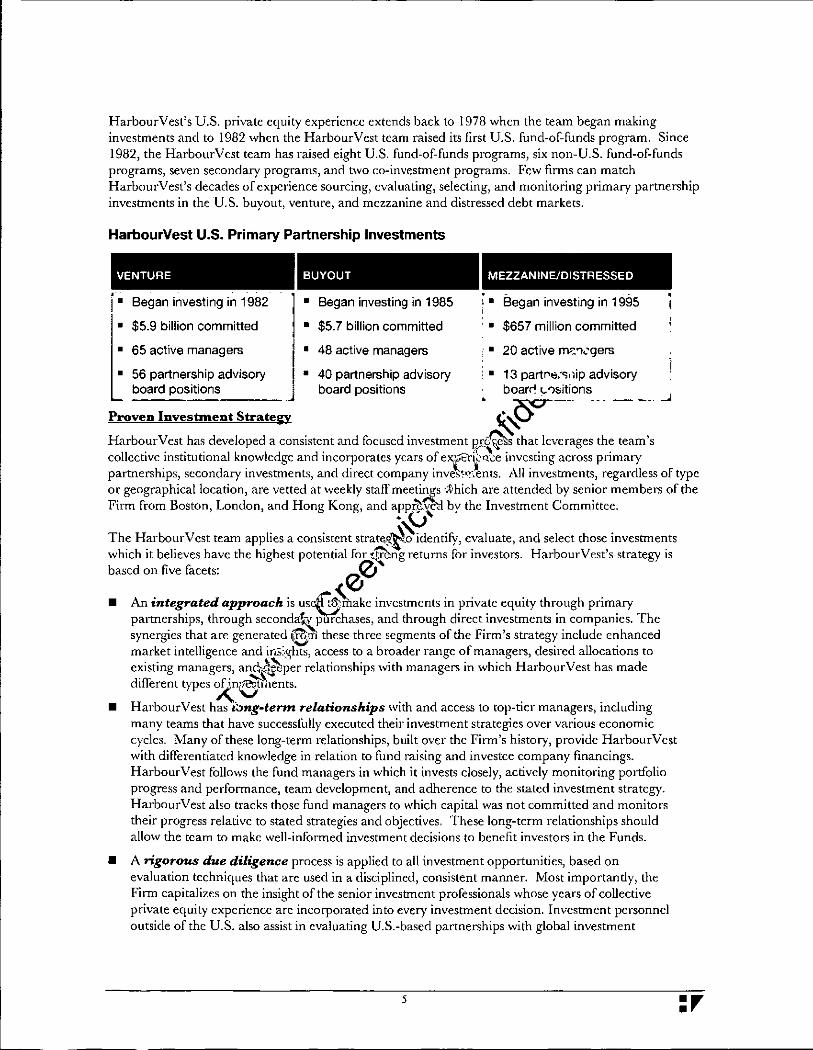
HarbourVest's U.S. private equity experience extends back to 1978 when the team began making investments and to 1982 when the Harbour Vest team raised its first U.S. fund-of-funds program. Since 1982, the Harbour Vest team has raised eight U.S. fund-of-funds programs, six non-U.S. fund-of-funds programs, seven secondary programs, and two co-investment programs. Fe,_ .... firms can match Harbour Vest's decades of experience sourcing, evaluating, selecting, and monitoring primary partnership investments in the U.S. buyout, venture, and mezzanine and distressed debt markets.
HarbourVest U.S. Primary Partnership Investments
VENTURE . 1 • Began investing in 1982
• $5.9 billion committed
• 65 active managers
• 56 partnership advisory board positions
---
BUYOUT
• Began investing in 1985
• $5.7 billion committed
• 48 active managers
• 40 partnership advisory board positions
MEZZANINE/DISTRESSED
- -: • Began investing in 1995
' • $657 million committed
• 20 active m;:.,,•gers
: • 13 part~e.-~olip advisory boar.-< <..%itions
.~-
::::~r~::~:=:e::l:::lt::nsistcnt and focused investment (l<C~hat leverages the team's collective institutional knowledge and incorporates years of ex~ri~qle investing across primaty partnerships, secondary investments, and direct company inve\-::~:.tnts. All investments, regardless of type o~· geographical location, are vetted at w~ekly st.ctfl' meeti~s :;Vhich are attended ~y sen~ or members of the Ftrm from Boston, London, and Hong Kong, and af~{j~ by the Investment Committee.
The Harbour Vest team applies a consistent strate,~~idcntify, evaluate, and select those investments which it believes have the highest potential for t~ng returns for investors. Harbour Vest's strategy is
based on five facets: eJ') • An integrated approach is use{!J;<.!nake investments in private equity through primary
partnerships, through seconda~urchases, and through direct investments in companies. The synergies that are generated 6m these three segments of the Firm's strategy include enhanced market intelligence and iu;:.ghts, access to a broader range of managers, desired allocations to existing managers, anQ??urer relationships with managers in which Harbour Vest has made d.,.. f' ...s, llterent types X,n(~,ht1Cnts.
• Harbour Vest has iJng-tenn relationships with and access to top-tier managers, including many teams that have successfully executed their investment strategies over various economic cycles. N1any of these long-term relationships, built over the Firm's history, provide Harbour Vest with ditTerentiatcd knowledge in relation to fund raising and invcstce company financings. Harbour Vest fOllows the fund managers in which it invests closely, actively monitoring portfolio progress and performance, team development, and adherence to the stated investment strategy. Harbour Vest also tracks those fund managers to which capital was not committed and monitors their progress relative to stated strategies and objectives. These long-term relationships should allow the team to make well-informed investment decisions to benefit investors in the Funds.
• A rigorous due diligence process is applied to all investment opportunities, based on evaluation techniques that arc used in a disciplined, consistent manner. Nlost importantly, the Firm capitalizes on the insight of the senior investment professionals whose years of collective private equity experience are incorporated into every investment decision. Investment personnel outside of the U.S. also assist in evaluating U.S.-based partnerships with global investment
5 :r

strategies. Harbour Vest relies extensively on knowledge gained from this effort to cross-reference a given manager)s capabilities with the Firm's broad network of industry contacts.
• Each Fund has flexible capital allocation targets which should allow it to be nimble in selecting investments and enables it to adjust for changes in market conditions. Investment selection takes into account geography, stage, size, focus, and investment type. :Manager-specific investment criteria are evaluated, as well as the potential impact of global political, macroeconomic, cultural, financial, and capital market factors. These factors can affect value creation, asset preservation, and exit opportunities in private equity portfolios.
• Harbour Vest's active local presence in principal private equity markets should enable it to acquire in-depth market knowledge and access to sought-after managers and investments. HarhourVest's professionals in Boston, London, and Hong Kong maintain close contact with investment opportunities and trends across all relevant countries and constantly update the Firm's understanding of these evolving markets.
.~ These key tenets should enable Harbour Vest funds to make selective and mean~~~'fufcommitments across market segments, focusing on opportunities with high-potential for superior r.t.~;s. The Firm's consistent strategy should ensure a diversified group of U.S. buyout, vcntrt~f?~czzaninc debt, distressed debt, and related private equity managers, generally chosen based on ~,~!renee, expertise, track record, and potential for future returns. Specific evaluation criteria vary bytfh;.'!,'brpe of investment.
rO', 8 Primary Partnerships VVhen investing in newly forme~E,S"'rtncrships, Harbour Vest searches
for and seeks to select high quality partnership investmelj.ts managed by experienced fund managers with the potential to generate superior rd.~Qf return.
• Secondary lnvestTnents When purchasing s~&~t,my interests in existing partnerships and portfolios, Harbour Vest seeks to identify undc~lued assets and unique structuring opportunities.
• Direct Investments When investing di[!2~ in operating companies, Harbour Vest seeks established or growing companies tha:tJS,cr a differentiated product or service with management teams that have achieved prior st:~~ Harbour Vest also targets investments alongside partners who have demonstrated succe~\;'/cir respective industries.
0 Demonstrated Track Re1j~·~dl
The Harbour Vest team !':'fl~s to generate strong returns by investing in primary partnerships, in secondary investmer~, {-!~ directly in operating companies that have the potential to generate superior performance. The ul'citnate test of any manager is its ability to demonstrate the effectiveness of its team and strategy through investment performance. The Harbour Vest team has built an extensive, strong track record of investing in U.S. partnerships and directly in operating companies. The performance of Harbour Vest's primary partnership and secondary investments made over the past 20 years in U.S. buyout, venture and, mezzanine and distressed debt is summarized in Figure 1. By adhering to the disciplined investment process and strategy outlined above, Harbour Vest's U.S. partnership investments have generated performance that exceeds public and private equity comparables.
In considering the prior performance information contained herein1 prospective investors should bear in mind that past performance is not necessarily indicative of future results, and there can be no assurance that the proposed funds will achieve comparable results.
6
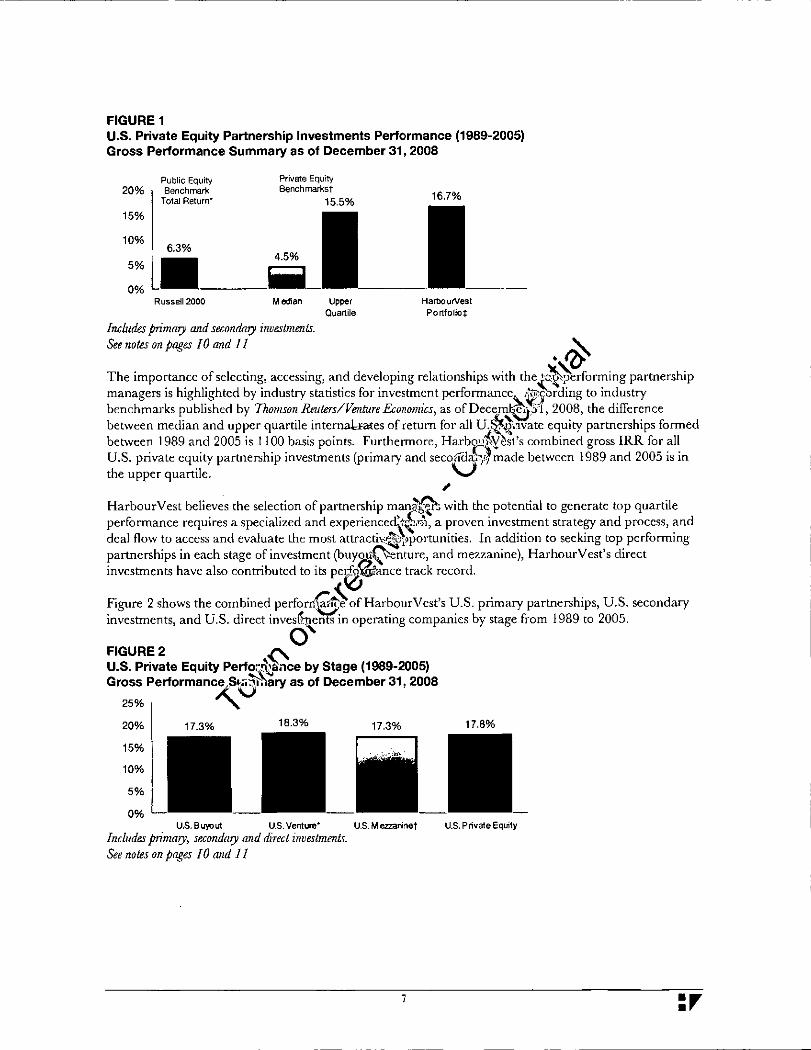
FIGURE 1 U.S. Private Equity Partnership Investments Performance (1989-2005) Gross Performance Summary as of December 31, 2008
Public Equity 20% Benchmark
Total Return·
15%
10%
5%
0% Russell2000 Median
lnch1des primary and secondary investments. See notes on pages I 0 and II
Upper
Quartile
Harbo urVest
Portfolio+
·~ The importance of selecting, accessing, and developing relationships with thei.-:;~~rfonning partnership managers is highlighted by industry statistics for investment performance. /~O~ing to industry benchmarks published by Thomson Reuters/Venture Economics, as of Dece.m~~-·1, 2008, the difference between median and upper quartile intcrn.aHates of return for all u.~~l.vatc equity partnerships formed between 1989 and 2005 is 1100 basis points. Furthermore, Harbo~£yest's combined gross IRR for all U.S. private equity partnership investments (primary and secoffcia:~;!;'made between 1989 and 2005 is in the upper quartile. V
~
Harbour Vest believes the selection of partnership man~::; with the potential to generate top quartile performance requires a specialized and experienced"~!1\ a proven investment strategy and process, and deal flow to access and evaluate the most attracti\-;~portunities. In addition to seeking top performing partnerships in each stage of investment (buyoti~enturc, and mezzanine), HarhourVest's direct investments have also contributed to its pel2,~ance track record.
Figure 2 shows the combined perfomb:-'lt'):ofHarbourVest's U.S. primary partnerships, U.S. secondary investments, and U.S. direct invesQ;e~in operating companies by stage from 1989 to 2005.
0' FIGURE2 ~ U.S. Private Equity Perfod~&nce by Stage (1989-2005) Gross Performanc.:tS~ ... ~ary as of December 31, 2008
25% .. '
20%
15%
10%
5%
0% U.S. Buyout U.S. Venture• U.S. M ezzaninet
Includes primary, secondary and diTect investments. See notes on pages 10 and 11
1
U.S. P livate Equity
:r

U.S. Fund-of-Funds Program - HarbourVest Partners IX
Fund IX will be comprised of three limited partnership vehicles similar to its predecessor. The Investment Program provides institutional investors with an efficient and effective way to access the U.S. private equity markets. The three-fund structure also enables investors to customize their commitments to meet their allocation needs.
The Buyout Fund, the Venture Fund, and the Credit Opportunities Fund expect to invest at least 80% of their commitments in ptimary partnerships. For additional information on HarbourVesfs track record of making investments in primary partnerships, secondary investments, and operating companies, please refer to Section I!! of this document.
HARBOURVEST PARTNERS IX
BUYOUT FUND Target Size $1.5 billion
~ Buyout, recapitalization, turnaround, and other private equity funds
• Primarily U.S.-focused
• Up to 20% in secondary and direct investments•
VENTURE FUND Target Size $1.0 billion
CREDIT OPPCilTUNlTlES r:(:~:i)
Target ~~~:i $500 million • Q:> ~-'
• Venture, growth equity and • Me>:...•;;:c,,ne debt, distressed other private equity funds .1~1.:; venture debt, and
-- ,,i;1er debt-related private • Primarily U.S.-focused ~-·equity funds
• Up to 20% in secondary (.J • U.S. and to a lesser extent direct investments• 1' Western Europe and Asia
• (}" Pacific
~" • Up to 20% in secondary . ~ and direct investments• .
• Secondary invesbnents available I~ the Fund IX In.{il;:nent Program will gen<ra/Jy be shared on a pro-ralll baris (}£TOSS the Funds, regardless of investment objective.
0\ 'lJ
Buyout Fund ~
The Buyout Fund seeks to build '?ortfolio that consists predominantly of primal)' partnership investments in U.S.-based b~~ut, recapitalization, turnaround, and other private equity funds. Up to 10% of the fund may be i'},~ted outside of the U.S. in Western Europe and Asia Pacific. In addition, up to 20°/o of the Buyoll[F@:{ may be invested in secondat)' and direct investments. The targeted size of this fund is $1.5 billio~
The Buyout Fund's goal is to create a diversified portfolio of partnerships that focus on mature, cash flowpositive companies in such sectors as industrial products, consumer products, services, media and entertainment, and retail, as well as growth industries such as communications, information technology, and healthcarc. Secondary investments due to their nature as commingled transactions are expected to be global and may include venture and mezzanine investments. Direct investments are expected to include primarily management buyout and recapitalization transactions.
The partnership portfolio of the Buyout Fund is expected to be diversified with respect to the industry focus of the individual partnerships, the various stages of company development in which they invest, and the enterprise value of the companies in which they invest. The Buyout Fund intends to make commitments to individual partnerships over approximately three to five years. The individual
8

partnerships, in turn, arc expected to make investments in companies over three to five years, which should create broad time diversification for the portfolio.
Venture Fund
The portfolio of the Venture Fund is expected to consist predominantly of primary partnership investments in U.S.-based venture capital, growth equity, and other private equity funds. Up to 10°/o of the fund may be invested outside of the U.S. in Western Europe and Asia Pacific. In addition, up to 20% of the Venture Fund may be invested in secondary and direct investments. The targeted size of the fund is $1.0 billion.
The Venture Fund's goal is to create a diversified portfolio of partnerships and companies that focus on high growth industries, such as information technology (software, hardware, Internet, communications), healthcare (biotechnology, medical devices and diagnostics) hcalthcare services), and cleantech. Secondary investments due to their nature as commingled transactions are expecte~to be global and may include buyout and mezzanine investments. Direct investments are expected to • .in~~ie primarily growth equity opportunities. ~
The partnership pmtfolio of the Venture Fund is expected to be diversifi~·lh respect to the industry and technology focus of the individual partnerships, the various stage~~\;Jmpany development in which they invest, and the geographic location of the companies. The Ver.~:e Fund intends to make commitments to individual partnerships over approximately th-~2Ghve years. The individual partnerships, in turn, are expected to make investments in con~!?J!-~lies over three to five years, which should create broad time diversification for the portfolio. ~
Credit Opportunities Fund ·~0' The Credit Opportunities Fund seeks to build a !"'~lio that consists predominantly of global primary partnership investments in mezzanine debt, ~~~ed debt, venture debt, and other private equity funds. Up to 20°/o of the Credit Opportunities Fue):!'"i1ay be invested in secondary and direct investments. The Credit Opportuntics Fund is expecte<}!!:l~nv~st in the U.S. and, to a lesser extent, \Vestern Europe and Asia Pacific. The targeted size ofthis~fis $500 million.
The goal of the Credit Opportur.~Fund is to create a diversified portfolio of partnerships and companies via mezzanine, 4$..:ssed debt, or venture debt investments across industries. Secondary investments due to their n,~'~}~ as commingled transactions arc expected to be global and may include buyout and venture);:v@llents. However, it is expected that mezzanine and distressed debt secondary investment oppottuniti~s available to the Fund IX Investment Program will generally be allocated solely to lhe Credit Opportunities Fund. Direct investments, arc expected to include primarily mezzanine opportunities.
The partnership portfolio of the Credit Opportunities Fund is expected to be diversified with respect to the strategic focus of the individual partnerships, position in the capital structure, and the terms and structure of the debt. The Credit Opportunities Fund intends to make commitments to individual partnerships over approximately three to five years. The individual partnerships, in tum, are expected to make investments in companies over three to five years, which should create time diversification for the portfolio.
9 :r
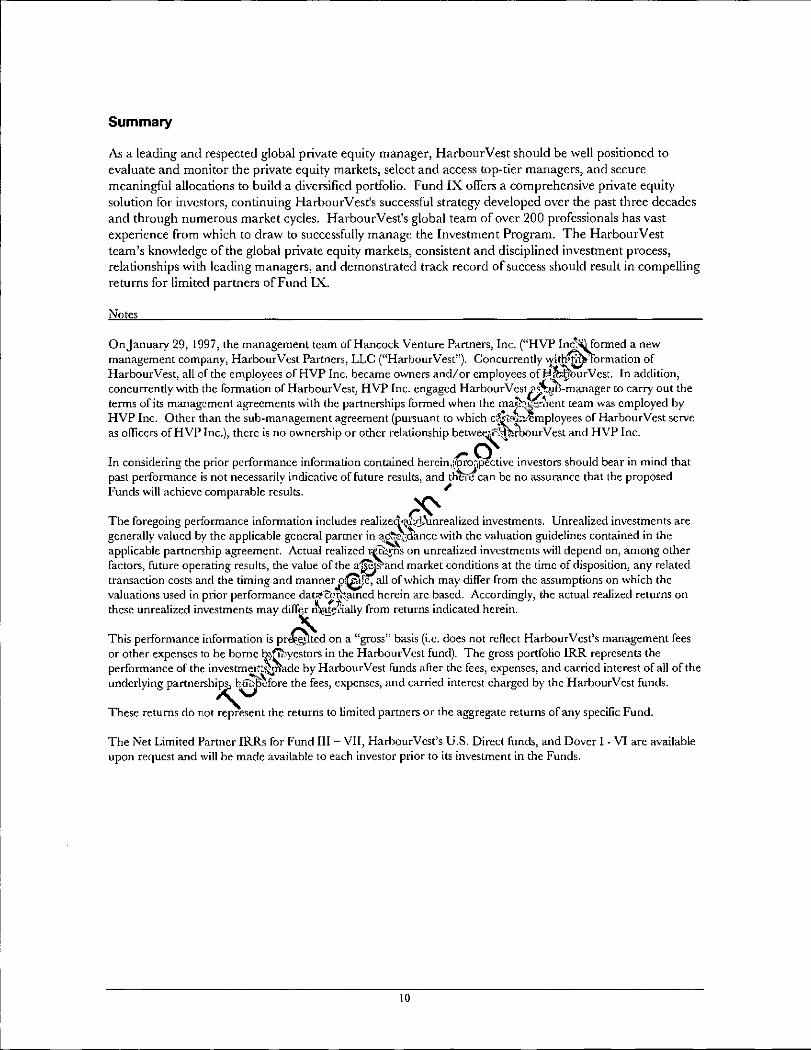
Summary
As a leading and respected global private equity manager, Harbour Vest should be well positioned to evaluate and monitor the private equity markets, select and access top-tier managers, and secure meaningful allocations to build a diversified portfolio. Fund IX offers a comprehensive private equity solution for investors, continuing HarbourVest's successful strategy developed over the past three decades and through numerous market cycles. Harbour Vest's global team of over 200 professionals has vast experience from which to draw to successfully manage the Investment Program. The Harbour Vest team's knowledge of the global private equity markets, consistent and disciplined investment process, relationships with leading managers, and demonstrated track record of success should result in compelling returns for limited partners of Fund IX.
Notes
On January 29, 1997; the management team of Hancock Venture Partners, Inc. ("HVP Inc":~ formed a new management company, Harbour Vest Partners, LLC ("HarbourVesf'). Concurrently with~ Tormation of Harbour Vest, all of the employees of HVP Inc. became owners and/or employees of f::!~~urVest. In addition, concurrently with the formation ofHarbourVest, HV-r Inc. engaged HarbourVcstl~~~~IJ-manager to carry out the terms of its management agreements with the partnerships formed when the m~[-~1Icnt team was employed by HVP Inc. Other_than the sub-management agreement (pursuant to which c~t.~.t:!.-'Cmployees of HarbourVest serve as officers ofHVP Inc.), there is no ownership or other relationship betwe:s::~"'h7bourVest and HVP Inc.
In considering the prior performance information contained hercin,:fro~ctive investors should bear in mind that past performance is not necessarily indicative of future results, and th't-lt can be no assurance that the proposed Funds will achieve comparable results. ~
The foregoing performance information includes realize~~~realized investments. Unrealized investments are generally valued by the applicable general partner in a~;.dance with the valuation guidelines contained in the applicable partnership agreement. Actual realized ~ns on unrealized investments will depend on, among other factors, future operating results, the value of the a~~ and market conditions at the time of disposition, any related transaction costs and the timing and manner o~ all of which may differ from the assumptions on which the valuations used in prior performance dat;:;!C~~~fllOCd herein arc based. Accordingly, the actual realized returns on these unrealized investments may diiTK\.l~;a]ly from returns indicated herein.
This performance information is prQ.ted on a "gross" basis (i.e. does not reflect HarbourVest's management fees or other expenses to be borne ~(n::yestors in the HarbourVest fund). The gross portfolio lRR represents the performance of the invcstmerdiJ!i-adc by Harbour Vest funds after the fees, expenses, and carried interest of all of the underlying partnersh~ ~fibfore the fees, expenses, and carried interest charged by the HarbourVest funds.
These returns do not represent the returns to limited partners or the aggregate returns of any specific Fund.
The Net Limited Partner IRRs for Fund III- VII, Harbour Vest's U.S. Direct funds, and Dover 1- Vl are available upon request and will be made available to each investor prior to its investment in the Funds.
10

Fi~rure 1:
•
t
+ '
Source: Bloomberg- Russell 2000 total returns. Dividends are not reinvested. These returns represent the value, as of December 31,2008: of an original investment made onJanuary I, 1989. These returns do not reflect the cash flows used to calculate the HarbourVest gross IRR and accordingly a direct comparison may not be meaningful.
Source: Thomson/Venture Economics VenlureXpert Database. Benchmark Summary Report as of December 31,2008. i\11 Private Equity -U.S., vintage years 1989-2005.
Performance of U.S. partnership investments (primary and secondary) made by the HarbourVest team in vintage years 1989-2005 after the fees, expenses, and carried interest of the underlying pannerships, but before the fees, expenses, and carried interest charged by the HarbourVest funds. Investments made after 2005 arc not included because they are still actively investing and performance is generally not meaningful during a partnership's early development. If the performance of investmems made after 2005 (investing phase) was included: the HarbourVest gross IRR would be lower and would not be in the upper quartile compared to the VentureXpcrt database benchmarks for 1989-2008.
The Harbour Vest gross IRR of all U.S. primary partnership investments in vintagec~989-2005 is 13.8%.
Composite Criteria: Includes U.S. primal)' and secondary investments made byt.E~!:laurVcst and/or by HVP Inc: throug~ Fund III: IV: V: VI: and VII, t~eir ~om!mnion funds; and ~ov;;.~) II~: IV, V, and VI for the penod spec1fied. HarbourVcst vmtage class1ficatwn ts based on the year Jn~v.:tl: cap1tal wac; first funded to each underlying partnership (for primary partnership investments) or th~~r ofHarbourVesc's purchase (for secondary investments). See calculation methodology below. ~
The VentureXpert Database is comprised of 1,355 U.S. private equfJtQnerships for vintage yea~> 1989-2005. The HarbourVest portfolio is comprised of 474 U.S. private eqmL1 -partncrships for vintage years 1989-2005. ,
Figure 2: • (}"
Performance of U.S. primary partnerships, secondary i~"i_\~Jnents: and direct investments made by the Harbour Vest team in vintage years 1989-2005 after the fees, e4~s, and carried interest of the underlying partnerships, but
before .the fees, ~xp~nses, and carried inter::~h£)ed by the Harbour~est funds. .
All U.S. Pnvate Equ1ty ts an aggregate of U.S., :~out, U.S. Venture, and U.S. Mezzanme.
Composite Criteria: Includes U.S. invesf:.jj;made by HarbourVest and/or by HVP Inc. through Fund Ill, IV, V, VI, and VII, their companion:'B.Jna:-., Dover I, II, III, IV, V, and VI; and 2004 Direct Fund for the period specified. HarbourVest vintag~~ification is based on the year in which capital was first funded to each underlying partnership (for r.cima:1y partnership investments), the year of HarbourVest's purchase (for secondary investments), on;.i~~intage year of the direct fund (for direct investments). Investments made after 2005 are not included b:?~~se they are still actively investing and performance is generally not meaningful during a partner~JP'Qriy development. See calculation methodology below.
* Direct investments ~U.S. venture include only investments classified as Growth Equity, which includes all venture investments in companies with revenues greater than $7 .S million at the time of initial investment. HarbourVest's prior U.S. direct funds also made early stage investments, defined as those companies with revenues less than $7.5 million at the time of initial investment, which arc outside of the focus of fund IX and are not included in the figures above. If early stage investments \.,.-ere included the performance would be 13.4%. Information concerning these early stage investments is available on request.
t Harbour Vest did not make any mezzanine/distressed partnership investments until 1992.
The following note applies to Figures I and 2:
Calculation Methodology: Gross Ponfolio IRR represents the annual return calculated using monthly cash flows from the funds managed by HarbourVest and/ or HVP Inc. to and from the various partnerships and companies in which the Harbour Vest funds invested! after all fees, expenses: and carried interest of the partnership investments but before the fees, expenses, and carried interest charged by the HarbourVest funds.
II :r
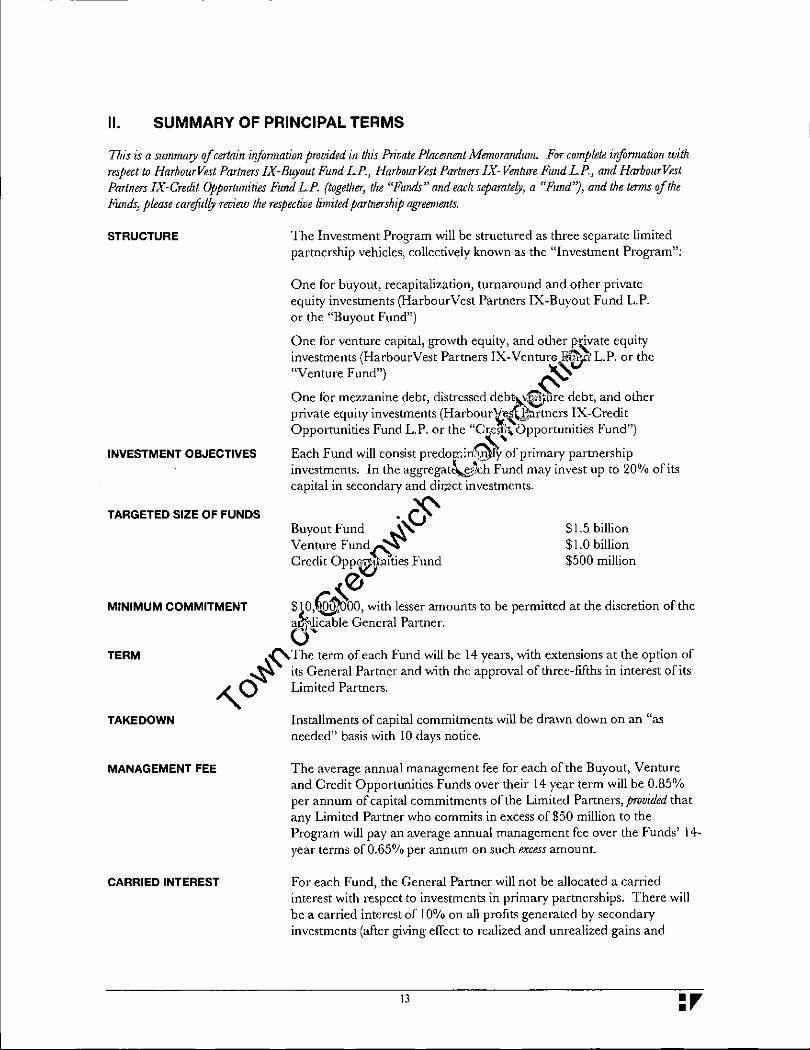
II. SUMMARY OF PRINCIPAL TERMS
This is a summary of certain injimnation prouided in this Prir;ate Plmernenl A1ernorandum. For complete i'!formation with respect w Harbour Vest Partners IX-Buyout Fund LP., Harbour Vest Partners IX- Venhlre Fund LP., and Harbour Vest Partners IX-Credit Opportunities fltnd L.P. (together, the "Funds" and each separately, a "Fund"), and the terms of the Funds, please carqitlly reuiew the respectu;e limited partnership ogreernents.
STRUCTURE
INVESTMENT OBJECTIVES
TARGETED SIZE OF FUNDS
MINIMUM COMMITMENT
The Investment Program will be structured as three separate limited partnership vehicles, collectively known as the "Investment Program":
One for buyout, recapitalization, turnaround and other private equity investments (Harbour Vest Partners IX-Buyout Fund L.P. or the "Buyout Fund")
One for venture capital, growth equity., and other p:~ate equity investments (Harbour Vest Partners IX-VenturG lit~ L.P. or the "Venture Fund") ~ One for mezzanine debt, distressed deb%. ve;~ure debt, and other private equity investments (HarbourYf-\~;artners IX-Credit Opportunities Fund L.P. or the "CK'~~Opportunitics Fund")
Each Fund will consist predo:ron9Iy of primary partnership investments. In the aggregat~lch Fund may invest up to 20% of its capital in secondary and dir;2ct investments.
·0' Buvout Fund ... \" Vent~re Fund~~.._. Credit Opp0:..Mttles Fund
S 1.5 billion $1.0 billion $500 million
~e; SlO,~OO, with lesser amount' to be permitted at the discretion of the a~1 .licable General Partner.
0" TERM ... ~The term of each Fund will be 14 years, with extensions at the option of
~., its General Partner and with the approval of three-fifths in interest of its "'., Q Limited Partners.
TAKE DOWN
MANAGEMENT FEE
CARRIED INTEREST
Installments of capital commitments will be drawn dmvn on an "as needed" basis with 10 days notice.
The average annual management fee for each of the Buyout, Venture and Credit Opportunities Funds over their 14 year term will be 0.85% per annum of capital commitments of the Limited Partners, provUled that any Limited Partner who commits in excess of $50 million to the Program will pay an average annual management fee over the Funds' 14-year terms of0.65°/o per annum on such excess amount.
For each Fund, the General Partner will not be allocated a carried interest with respect to investments in primary partnerships. There will be a carried interest of I 0% on all profits generated by secondary investments (after giving effect to realized and unrealized gains and
13 :r
EXPENSES
losses) and I 0% on all profits generated by direct investments in operating companies (after giving effect to realized and unrealized gains and losses). The General Partner will not be allocated a carried interest with respect to short-term money market investments.
Organizational, investment acquisition, legal, accounting, and certain other expenses of each Fund will be paid by the Fund and allocated in accordance with capital commitments to the Fund. Placement fees, if any, will be paid by the applicable Fund but borne by the General Partner of that Fund through a 100% offset against the management fee.
14
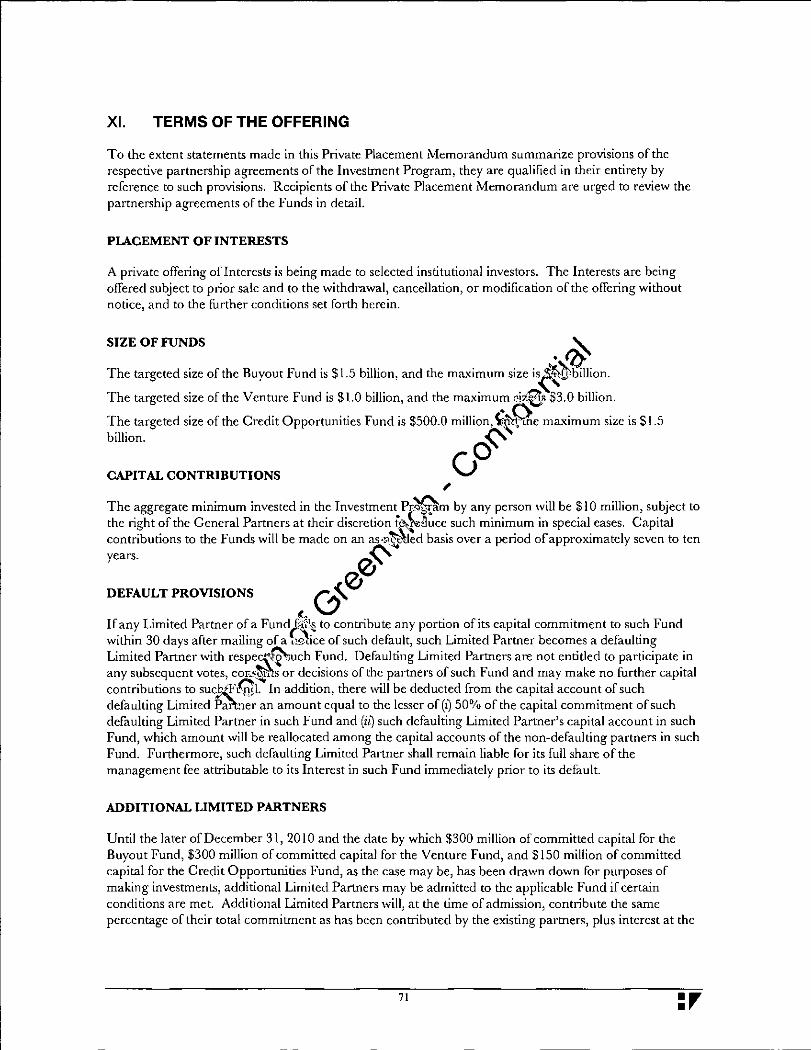
XI. TERMS OF THE OFFERING
To the extent statements made in this Private Placement Memorandum summarize provisions of the respective partnership agreements of the Investment Program, they are qualified in their entirety by reference to such provisions. Recipients of the Private Placement Memorandum are urged to review the partnership agreements of the Funds in detail.
PlACEMENT OF INTERESTS
A private offering of Interests is being made to selected institutional investors. The Interests arc being offered subject to prior sale and to the withdrawal, cancellation, or modification of the offering without notice, and to the further conditions set forth herein.
SIZE OF FUNDS ~
The targeted size of the Buyout Fund is $1.5 billion, and the maximum size i~"'tJ,~ion. The targeted size of the Venture Fund is $1.0 billion, and the maximum oiz~• $3.0 billion.
The targeted size of the Credit Opportunities Fund is $500.0 million, ~il'::t,(};e maximum size isS 1.5
billion. ~' 00
CAPITAL CONTRIBUTIONS , The aggregate minimum invested in th~ I~vest~ent. Pf~m by any person will be $10 million; subject to the nght of the General Partners at the1r discretiOn t?\,?leiluce such m1mmum m speoal cases. Capt tal contributions to the Funds will be made on an as·;;.'ltt\ted basis over a period of approximately seven to ten years. 0~ DEFAULTPROVISIONS (.. (:J'(Q If any Limited Partner of a Fund(~i~~ to contribute any portion of its capital commitment to such Fund within 30 days after mailing of a l-:9)ice of such default, such Limited Partner becomes a defaulting Limited Partner with respe~~uch Fund. Defaulting Limited Partners are not entitled to participate in any subsequent votes, cor-:~1: or decisions of the partners of such Fund and may make no further capital contributions to sucN.Fii!1L In addition, there will be deducted from the capital account of such defaulting Limited Pa1ber an amount equal to the lesser of (z) 50% of the capital commitment of such defaulting Limited Partner in such Fund and (i1) such defaulting Limited Partner's capital account in such Fund, which amount ,..,j_ll be reallocated among the capital accounts of the non-defaulting partners in such Fund. Furthermore, such defaulting Limited Partner shall remain liable for its full share of the management fee attributable to its Interest in such Fund immediately prior to its default.
ADDITIONAL UMITED PARTNERS
Until the later of December 31, 2010 and the date by which $300 million of committed capital for the Buyout Fund, $300 million of committed capital for the Venture Fund, and $150 million of committed capital for the Credit Opportunities Fund, as the case may be, has been drawn down for purposes of making investments, additional Limited Partners may be admitted to the applicable Fund if certain conditions are met. Additional Limited Partners will, at the time of admission, contribute the same percentage of their total commitment as has been contributed by the existing partners, plus interest at the
71 :r
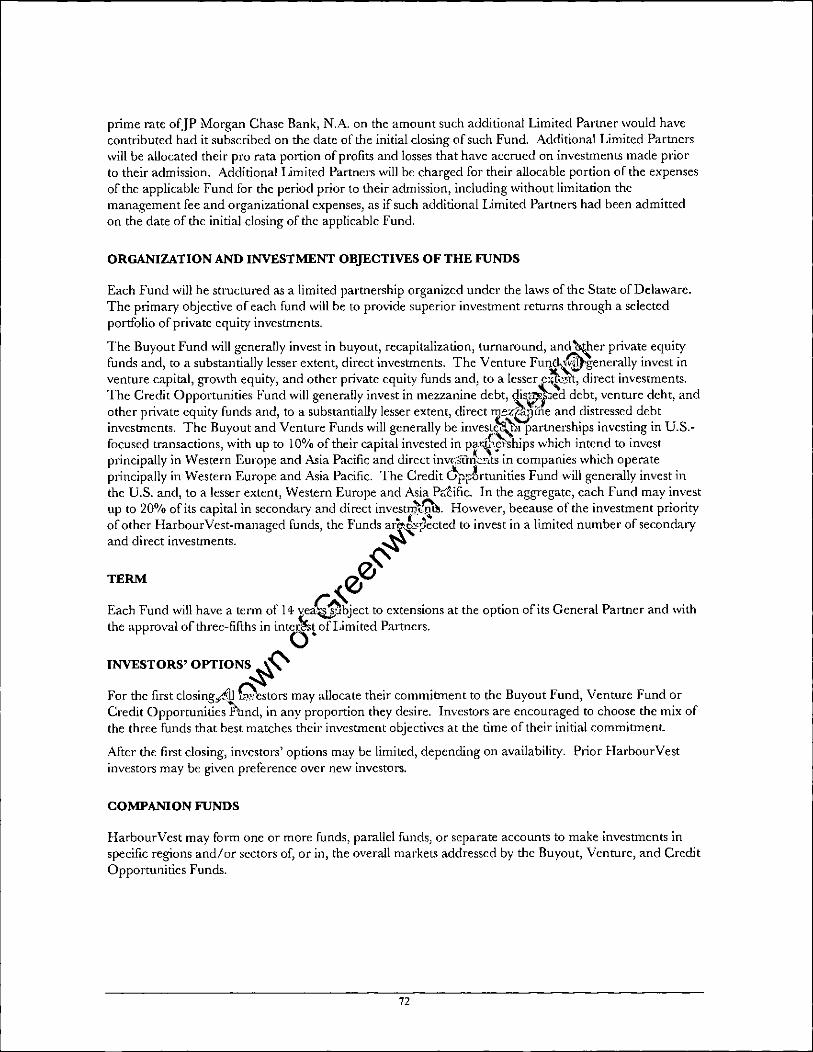
prime rate ofJP Morgan Chase Bank, N.A. on the amount such additional Limited Partner would have contributed had it subscribed on the date of the initial closing of such Fund. Additional Limited Partners will be allocated their pro rata portion of profits and losses that have accrued on investments made prior to their admission. Additional Limited Partners will be charged for their allocable portion of the expenses of the applicable Fund for the period prior to their admission, including without limitation the management fee and organizational expenses, as if such additional Limited Partners had been admitted on the date of the initial closing of the applicable Fund.
ORGANIZATION AND INVESTMENT OBJECTIVES OF THE FUNDS
Each Fund will he structured as a limited partnership organized under the laws of the State of Delaware. The primary objective of each fund will be to prO\,;de superior investment returns through a selected portfolio of private equity investments.
The Buyout Fund will g~nerally invest in b~yout? recapitalization, turnaround, and~er privat~ equi:r funds and, to a substantially lesser extent, dtrect mvestments. The Venture Fund':\...qg:generally mvest m venture capital, growth equity, and other private equity funds and, to a lesser {~.:5tt, direct investments. The Cre.dit Opp~rtunities Fund will general~y invest in mezzani~e debt, ~~~.;ed de~t, venture deht, and other pnvate equity funds and, to a substantially lesser extent, direct m~zb")iile and distressed debt investments. The Buyout and Venture Funds will generally be invest~• partnerships investing in U.S.focused transactions, with up to 1 0°/o of their capital invested in pa.{~ships which intend to invest principally in \tV estern Europe and Asia Pacific and direct invcg{m~-.ts in companies which operate principally in \tV estern Europe and Asia Pacific. The Credit ~;Jrtunities Fund will generally invest in the U.S. and, to a lesser extent, \tV estern Europe and Asia P&tific. In the aggregate, each Fund may invest up to 20°/o of its capital in secondary and direct investil)\~. However, because of the investment priority of other Harbour Vest-managed funds, the Funds a.!.._~:y.rJected to invest in a limited number of secondary and direct investments. ~"'
TERM 0~
~0 Each Fund will have a term of 14 ve~bject to extensions at the option of its General Partner and with the approval of three-fifths in int<5t of Limited Partners.
INVESTORS' OPTIONS~<::-For the first closing../-\ll Gestors may allocate their commitment to the Buyout Fund, Venture Fund or Credit Opportunities ~md, in any proportion they desire. Investors are cncou raged to choose the mix of the three funds that best matches their investment objectives at the time of their initial commitment.
After the first closing, investors' options may be limited, depending on availability. Prior Harbour Vest investors may be given preference over new investors.
COMPANION FUNDS
Harbour Vest may form one or more funds, parallel funds, or separate accounts to make investments in specific regions and/or sectors of, or in, the overall marketc; addressed by the Buyout, Venture, and Credit Opportunities Funds.
72
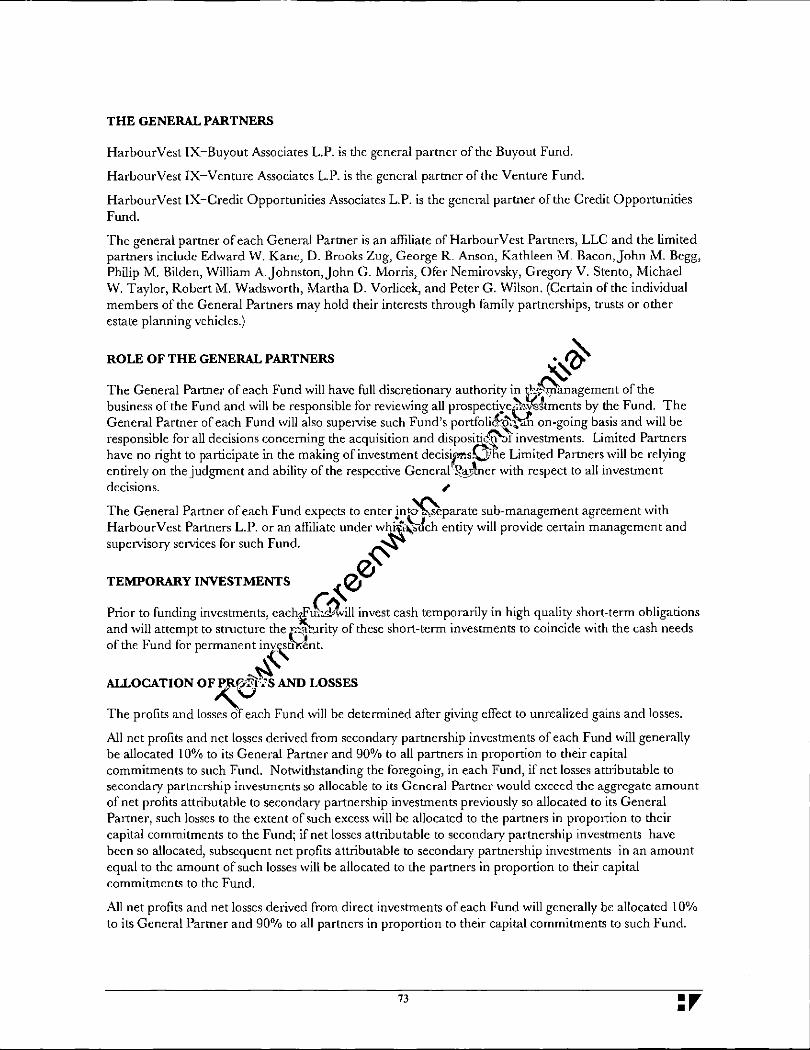
THE GENERAL PARTNERS
Harbour Vest IX-Buyout Associates L.P. is the general partner of the Buyout Fund.
Harbour Vest IX-Venturc Associates L.P. is the general partner of the Venture Fund.
Harbour Vest !X-Credit Opportunities Associates L.P. is the general partner of the Creclit Opportunities Fund.
The general partner of each General Partner is an affiliate of Harbour Vest Partners, LLC and the limited partners include Edward W. Kane, D. Brooks Zug, George R. Anson, Kathleen M. Racon,John M. Begg, Philip M. Bilden, William A.Johnston,John G. Morris, Ofer Nemirovsky, Gregory V. Stento, Michael W. Taylor, Robert M. Wadsworth, Martha D. Vorlicck, and Peter G. Wilson. (Certain of the individual members of the General Partners may hold their interests through family partncrshipsl trusts or other estate planning vehicles.)
ROLE OF THE GENERAL PARTNERS ~ ~qj
The General Partner of each Fund will have full discretionary authority in t"-~anagement of the business of the Fund and will be responsible for reviewing all prospecti¥eer~tments by the Fund. The General Partner of each Fund will also supervise such Fund's portfoli~1.,an on-going basis and will be responsible for all decisions concerning the acquisition and dispositi~f investments. Limited Partners have no right to participate in the making of investment decisi~sQ1he Limited Partners will be relying entirely on the judgment and ability of the respective General·~~;;'hter with respect to all investment decisions. '
The General Partner of each Fund expects to enter ln~paratc sub-management agreement with Harbour Vest Partners L.P. or an afliliatc under wll._~~ch entity will provide certain management and supervisory services for such Fund. ~'
TEMPORARY INVESTMENTS ~ 00 Prior to funding investments, each{cG,'\:ill invest cash temporarily in high quality short-term obligations and will attempt to structure the f:~.._',lrity of these short-term investments to coincide \'\rlth the cash needs
of the Fund for permanent i~~tfr:!nt.
ALLOCATION OF:<:.._~~ AND LOSSES
The profits and losses oT each Fund will be determined after giving effect to unrealized gains and losses.
All net profits and net losses derived from secondary partnership investments of each Fund will generally be allocated 10% to its General Partner and 90% to all partners in proportion to their capital commitments to such Fund. Notwithstanding the foregoing, in each Fund, if net losses attributable to secondary partnership investments so allocable to its General Partner would exceed the aggregate amount of net profits attributable to secondary partnership investments previously so allocated to its General Partner, such losses to the extent of such excess will be allocated to the partners in proportion to their capital commitments to the Fund; if net losses attributable to secondary partnership investments have been so allocated, subsequent net profits attributable to secondary partnership investments in an amount equal to the amount of such losses will be allocated lo the partners in proportion to their capital commitments to the Fund.
All net profits and net losses derived from direct investments of each Fund will generally be allocated 10% to its General Partner and 90°/o to all partners in proportion to their capital commitments to such Fund.
73 :r
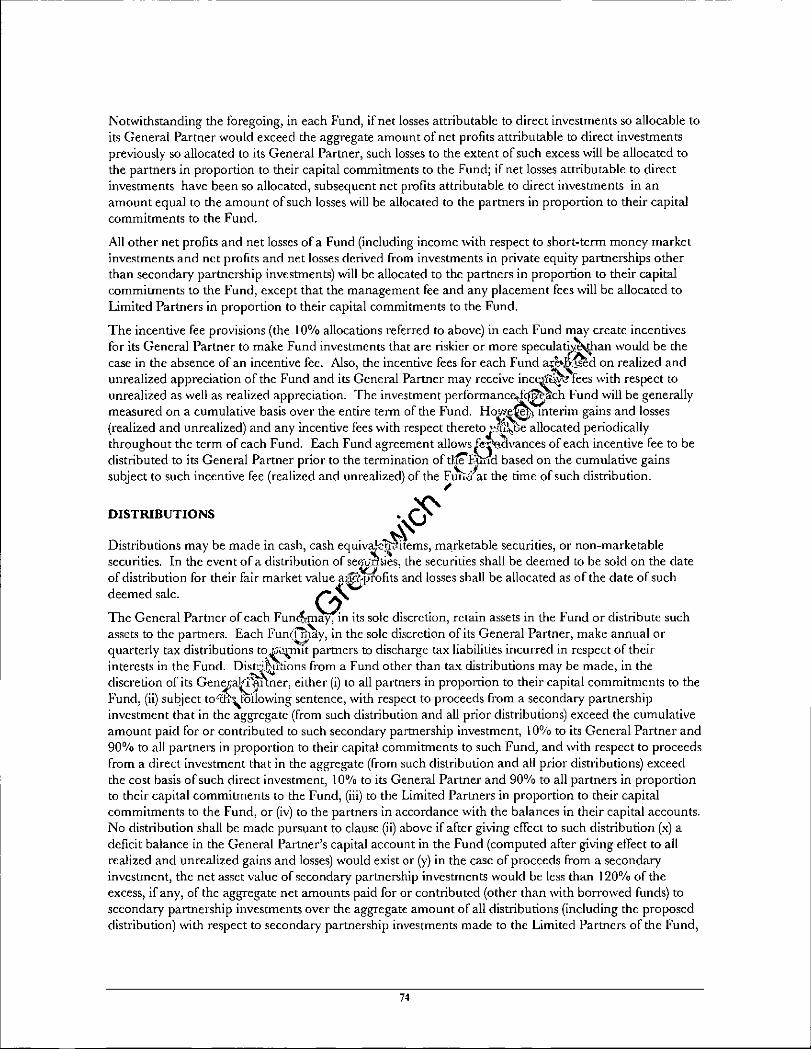
Notwithstanding the foregoing, in each Fund, if net losses attributable to direct investments so allocable to its General Partner would exceed the aggregate amount of net profits attributable to direct investments previously so allocated to its General Partner, such losses to the extent of such excess will be allocated to the partners in proportion to their capital commitments to the Fund; if net losses attributable to direct investments have been so allocated, subsequent net profits attributable to direct investments in an amount equal to the amount of such losses will be allocated to the partners in proportion to their capital commitments to the Fund.
All other net profits and net losses of a Fund (including income with respect to short-term money market investments and net prof1ts and net losses derived from investments in private equity partnerships other than secondary partnership investments) will be allocated to the partners in proportion to their capital commii:rnents to the Fund, except that the management fee and any placement fees will be allocated to Limited Partners in proportion to their capital commitments to the Fund.
The incentive fee provisions (the 10°/o allocations referred to above) in each Fund may create incentives for its General Partner to make Fund investments that are riskier or more speculatr~an would be the case in the absence of an incentive fCc. Also, the incentive fees for each Fund a;::bJ,?~d on realized and unrealized appreciation of the Fund and its General Partner may receive inc~~'fees with respect to unrealized as well as realized appreciation. The investment performance,J~dch Fund will be generally measured on a cumulative basis over the entire term of the Fund. Ho~e~ mterim gains and losses (realized and unrealized) and any inc:ntive fees with respect thereto ;.~~e allocated p~riodic:ally throughout the term of each Fund. Each Fund agreement allows '"r'l>.dvances of each mcennve fee to be distributed to its General Partner prior to the termination of tl:te'Fgd based on the cumulative gains subject to such incentive fee (realized and unrealized) of the F~~~at the time of such distribution.
~
DISTRIBUTIONS • 0' Distributions may be made in cash, cash equiv'l)<:~~~s, marketable securities, or non-marketable securities. In the event of a distribution of se~~ies, the securities shall be deemed to be sold on the date of distribution for their fair market value a~rnofits and losses shall be allocated as of the date of such deemed sale. 0. '<.;. The General Partner of each Functmay, in its sole discretion, retain assets in the Fund or distribute such assets to the partners. Each Fun((il..~y, in the sole discretion of its General Partner, make annual or quarterly tax distributions to{~lt partners to discharge tax liabilities incurred in respect of their interests in the Fund. Distt·;_~utions from a Fund other than tax distributions may be made, in the discretion of its Gen),(~·~·i'tner, either (i) to all partners in proportion to their capital commitments to the Fund, (ii) subject to~m~lOtlowing sentence, with respect to proceeds from a secondary partnership investment that in the aggTegate (from such distribution and all prior distributions) exceed the cumulative amount paid for or contributed to such secondary partnership investment, 10°/o to its General Partner and 90°/o to all partners in proportion to their capital commitments to such Fund, and with respect to proceeds from a direct investment that in the aggregate (from such distribution and all prior distributions) exceed the cost basis of such direct investment, 10% to its General Partner and 90°/o to all partners in proportion to their capital commitments to the Fund, (iii) to the Limited Partners in proportion to their capital commitments to the Fund, or (iv) to the partners in accordance with the balances in their capital accounts. No distribution shall be made pursuant to clause (ii) above if after giving effect to such distribution (x) a deficit balance in the General Pa1~ner's capital account in the Fund (computed after giving effect to all realized and unrealized gains and losses) would exist or (y) in the case of proceeds from a secondary investment, the net asset value of secondary partnership investments would be less than 120°/o of the excess, if any, of the aggTegate net amounts paid for or contributed (other than with borrowed funds) to secondary partnership investments over the aggregate amount of all distributions (including the proposed distribution) with respect to secondary partnership investments made to the Limited Partners of the Fund,
74

or in the case of proceeds from a direct investment, the net asset value of direct investments would be less than 120°/o of the excess, if any, of the aggregate cost basis (excluding borrowed funds used to purchase such investment) over the aggregate amount of all distributions (including the proposed distribution) with respect to direct investments made to the Limited Partners of the Fund. Notw-ithstanding the foregoing, if all or any part of a distribution has been made pursuant to clause (i) or (iii) above, then "catch-up'' distributions may be made 100% to the General Partner.
ALL PARTNER GIVEBACK
The General Partner of each Fund may require each partner to return distributions made to such partner for the purpose of meeting such partner's pro rata share of the Fund's obligations (including any indemnification obligations).
VALUATION AND REPORTS ~
Marketable securities held by a Fund will be valued at their last sales price on t~'?ttrading day on which such securities were traded immediately preceding the date of deter~·' . .JIOn or, if such determination cannot be so made, the mean of the last closing "bid'' aiJdf~i.~~;!d" prices on such last trading day. Assets other than marketable securities will be valued by~fu~G'cneral Partner at fair market value in accordance w-ith practices customarily employed by the pri~v\quity industry.
Within 150 days after th: en~ of each fiscal year, the Gencral,~yQr of ~ach Fund will send to each partner of the Fund audtted fmanoal st:-'ltemcnts for such Fund ·!Jreparcd m accordance with generally accepted accounting principles. Within 120 days after .the"ld of the first six month period of each fiscal year and within 150 days after the end of each fiscal y~tnc respective General Partner will send to each partner of each Fund reports for such Fund summadtu~g the status of the respective investments as of the end of such period. ~~
MANAGEMENT FEE AND EXPENSES~ 00 Each General Partner w-ill receive ,J. f~r the management and supervisory services it provides to the applicable Fund. Each fee will b<7~id by the applicable Fund quarterly in advance. For purposes of calculation of the managemeni,[&0r each Fund, the capital commitments of additional Limited Partners will be deemed included in !~aggregate amount of capital commitments to such Fund from the initial closing date of such Fund~ The average annua~~'JSJgement fee for each of the Buyout, Venture, and Credit Opportunities Funds over its 14 year term will be 0.85°/o per annum of the capital commitments of the limited partners, prom"ded that any Limited Partner who commits in excess of$50 million to the Program will pay an average annual management fcc over its 14-ycar term of0.65°/o per annum on such excess amount. The annual management fcc of the Limited Partners' committed capital up to $50 million of the Buyout, Venture, and Credit Opportunities Funds will be 0.25% to the Program in year one, 0.50% in year two, 0.75% in year three and 1.00°/o in each of years four through eleven and will decline 10°/o each year thereafter (including any extension period). The annual management fee of the Limited Partners' incremental committed capital over $50 million of each Fund will be 0.20% to the Program in year one, 0.40% in year two, 0.65% in year three and 0.75% in each of years four through eleven and will decline 10% each year thereafter (including any extension period).
Each General Partner will bear ordinary administrative costs and expenses relating to the Fund's operations. Organizational expenses, out-of-pocket costs (including travel expenses) in connection with the making, holding or selling of investments, out-of-pocket costs of reporting to the Limited Partners,
75 :r

taxes, fees or governmental charges levied against each Fund, fees of consult::"tnts, agents, custodians, outside counsel and independent public accountants, and extraordinary expenses will be borne by the partners of each Fund in accordance with their capital contributions.
Organizational expenses will be limited to a maxim urn of the lesser of (z] 1/2 of I% of the committed capital and (il] $2,250,000 for the Buyout Fund, (z]l/2 of I% of the committed capital and (il] $1,500,000 for the Venture Fund, and (t]l/2 of I% of the committed capital and (il] $750,000 for the Credit Opportunities Fund. Any organizational expenses in excess of this amount, and any placement fees, will be paid by each Fund, but borne by the applicable General Partner through a 100% offset against the management fee. The Funds have engaged and may pay placement agents in connection with marketing the Funds in certain non-U.S. jurisdictions.
INDEMNIFICATION
\-Vith respect to each Fund, the General Partner, its affiliates (including HarbourVc~nd their respective agents, partners, officers, employees, directors, members and shareholders will bX~¢mnified and held harmless by such Fund and released by the other partners of such Fund from :o~l}ims, demands, liabilities, costs, expenses, damage~,.losses, suits, proceedings and act~ons ~h~~~ay ac~rue to. such F~nd or any other partner of such Fund ansmg out of the conduct of the affauto~~n Fund (mcludmg servmg on an advisory board of a partnership or sen.ring on the board of director._:,·~f;a portfOlio company), provided that an indemnified person shall not be entitled to indemnification)/~t\hall have been determined by a court of competent jurisdiction that the indemnified person (zJ(iKl~~t'act in good f.:"tith or in a manner reasonably believed to be in or not opposed to the best interest$''"'! such Fund, (iz] materially violated the partnership agreement of such Fund or (iit) acted so as to be ';iable for gross negligence, fraud or willful violation of law. • ():'
CONFLICT OF INTEREST 't::::-~" Until each of the Buyout, Venture, and CifjJ;{?bpportunities Funds' capital has been invested or resen.red for follow-on investments in existing e~rn~~ip investments, in existing portfolio companies, or used to cover expenses of such Fund, investm~pportunitics meeting such Fund's investment objectives which are offered to its General Partner ~,II be allocated among such Fund and other funds or entities managed by Harbour Vest (including Har~Jl.Vest International Private Equity Partners VI-Partnership Fund L.P. and its companion funds, H;,~urVest Partners VIII-Venture Fund L.P., Harbour Vest Partners VIIIBuyout Fund L.P., HarbC\~~est Partners VIII-Mezzanine Fund L.P., Harbour Vest International Private Equity Partners V-9~_e(i)'und L.P., Harbour Vest Partners 2007 Direct Fund L.P., Dover Street VII L.P., Secondary Over:·]ow Fund L.P., HarbourVest Partners Cleantech Fund I L.P., or any successor funds as well as certain managed accounts) on a fair and equitable basis, taking into account the makeup of their respective investment portfolios, investment objectives and policies and cash available for investment in such investment opportunities.
Harbour Vest also has single investor pools of capital that invest in private equity partnerships, including partnerships in which the Funds may also invest.
The Fund IX Investment Program will be allocated secondary investments to the extent they exceed the investment capacity of Dover Street VII and its successor funds. The Investment Program will generally share such excess investments, pro-rata, with Secondary Overflow Fund and other HarbourVestmanaged funds and accounts investing in secondaties.
76

The Fund IX Investment Program will be allocated direct investments to the extent they exceed the investment capacity ofHarbourVest Partners 2007 Direct Fund and other Harbour Vest-managed funds and accounts investing directly in operating companies.
USE OF LEVERAGE
Each fund may leverage some or all of its investments, and in connection thereV~rith may enter into one or more credit facilities or guarantees that may be secured by an assignment of the Partners' unfunded capital commitments and/or the Funds' assets. No Fund will at any time have indebtedness for borrowed money in an amount exceeding 20°/o of its aggregate capital commitments.
77 :r

Town of Greenwich Retirement System John Morris, Managing Director
Aris Hatch, Principal
SEPTEMBER 21, 2012

CONFIDENTIAL 1
Biographies
JOHN MORRIS
Managing Director, HarbourVest Partners, LLC (Boston)
Relevant Experience: 23 Years
John Morris joined the Firm in 1996 and is a managing director specializing in U.S. buyout, venture, and mezzanine partnership
investments. John serves on the advisory boards of partnerships including those managed by ABRY Partners, The Blackstone
Group, Carmel Ventures, Court Square Capital, EOS Partners, Evergreen Partners, GTCR Golder Rauner, Hellman & Friedman, Irving
Place Capital, The Jordan Company, Oak Investment Partners, Pitango Venture Capital, Parthenon Capital, Providence Equity
Partners, Sterling Investments, Sun Capital, U.S. Venture Partners, and Windjammer Capital. He has also served on the Board of
Directors of NASDAQ-listed Applied Molecular Evolution, Inc. John joined the Firm from Abbott Capital Management and has also
served as a vice president in the Corporate Finance Department at CIBC (New York). John received a BA in Economics from Clark
University in 1986 and an MBA in Finance from Columbia University in 1994.
ARIS HATCH
Principal, Client and Consultant Relations, HarbourVest Partners, LLC (Boston)
Relevant Experience: 13 Years
Aris Hatch joined HarbourVest’s client relations team in 2008 as a vice president. She focuses on coordinating, monitoring, and
enhancing relationships with new and existing North America-based investors and consultants. Aris joined the Firm from Rock Maple
Funds, a New York-based asset manager and fund of hedge funds, where she served as a vice president of the client service group
responsible for global fund marketing and new business development. Prior to that, she spent four years with Advent International in
Boston, where she was responsible for relationship management and fundraising in North America. Aris also served as a market
strategy consultant at Ernst & Young LLP in Boston. She received a BA in English from Wellesley College in 1999 and speaks
Spanish and Greek.

CONFIDENTIAL 2
Table of Contents
I. HarbourVest Overview
II. Prior Performance
III. U.S. Fund-of-Funds Program
IV. Summary
Appendix
Dover Street Investment Program
09/05/2012
These materials do not constitute an offer to sell or the solicitation of an offer to buy interests in Dover Street VIII Program or HarbourVest Partners IX Program (each, the “Fund”) or any other investment sponsored by HarbourVest Partners L.P. or its affiliates. Any offering of interests in any Fund will be made solely pursuant to the Private Placement Memorandum of the Fund and subscriptions will be accepted solely pursuant to definitive documentation. Offers and sales of interests in the Fund will not be registered under the laws of any jurisdiction and will be made solely to “qualified purchasers” as defined in the U.S. Investment Company Act of 1940, as amended. These materials are highly confidential and must be read in conjunction with the Private Placement Memorandum of the Fund. These materials do not purport to contain all the information relevant to evaluating an investment in the Fund. See final pages for additional notes.

HarbourVest Overview

CONFIDENTIAL 4
Established Firm Team formed in 1982
More than $30 billion committed to investments over three decades
Registered investment adviser with the U.S. Securities and Exchange
Commission
Independent, employee owned
Experienced &
Stable Team
Deep team of more than 250 employees
25 managing directors with an average firm tenure of 16 years
80 investment professionals in Boston, Hong Kong, London, Tokyo,
Bogotá and Beijing
Focus on Private
Equity
Global expertise across all three investment areas:
primary partnerships, secondary investments, direct investments
Comprehensive and specialized programs
Proven Track Record One of the longest track records in the industry
Demonstrated performance across all strategies
Consistent approach to portfolio construction
Superior Client Service Distinguished global investor base – 300 active, institutional clients
Responsive to client needs
Broad infrastructure – accounting, treasury, tax, trading, investor relations
Strong Risk Controls SSAE16 (formerly SAS 70) reports on controls available to clients and their
auditors
HarbourVest Overview
* This does not indicate approval or endorsement of HarbourVest by the U.S. SEC

CONFIDENTIAL 5
1980
1985
1990
1995
2000
2005
2010
2015
Established Firm with Three Decades of Experience
See final pages for additional notes
1990 London subsidiary opened HIPEP I formed, first non-U.S. focused fund-of-funds
1996 Hong Kong subsidiary formed
1997 Firm became
independently owned by
management team
1986 Began secondary investing
1978 Began making primary investments
1982 Fund I formed, one of the first fund-of-funds
1984 First primary investments in Europe and Asia
1983 Began direct investing
2010 Japan
subsidiary established
2007 HVPE listed on Euronext Amsterdam
2007 Team
celebrated 25th year
of fund management
2010 HSLE listed on London stock exchange
2011 Colombia presence established
2012 Beijing presence established

CONFIDENTIAL 6
Seasoned, Stable, Local Investment Team
Firm Tenure
(in years)*
Related Experience
(in years) Education (Undergraduate / Graduate)
Managing Directors D. Brooks Zug, CFA (Sr. MD) George Anson (L) David Atterbury (L) Kathleen Bacon (L) Brett Gordon William Johnston Jeffrey Keay Tatsuya Kubo (T) Peter Lipson (B) Frederick Maynard John Morris Ofer Nemirovsky Julie Ocko Alex Rogers (HK) Sally Shan (Beijing) Gregory Stento Michael Taylor John Toomey Sebastiaan van den Berg (HK) Scott Voss (HK) Robert Wadsworth Peter Wilson (L)
35 22 8 19 14 29 13 3 13 27 17 26 12 12 1 14 14 13 7 13 26 17
42 29 18 24 15 33 16 23 14 29 24 30 24 14 20 29 20 15 16 13 30 22
Lehigh / Harvard, MBA Univ. of Iowa Univ. of Bath Dartmouth / Dartmouth, MBA Boston University / Babson, MBA Colgate / Syracuse, MBA Holy Cross Waseda University / Duke, MBA Univ. of CA / Univ. of VA, MS / Harvard, MBA Wesleyan / Dartmouth, MBA Clark / Columbia, MBA Univ. of Penn / Harvard, MBA Univ. of North Carolina / Univ. of Virginia, MBA Duke / Harvard, MBA Renmin University / Yale, MBA Cornell / Harvard, MBA U.S. Naval Academy / Wharton, MBA Harvard / Harvard, MBA Univ. of Amsterdam / London School Econ. MS Bryant / Babson, MBA Univ. of Virginia / Harvard, MBA McGill / Harvard, MBA
Principals Corentin du Roy, CFA (L) L. Carolina Espinal (L) Karim Flitti (L) Tim Flower (HK) Valérie Handal (L) Ian Lane Mark Nydam Amanda Outerbridge Michael Pugatch Claudio Siniscalco (L) Christopher Walker
10 9 2 4 6 9 1 12 9 6 14
13 11 14 14 16 13 27 12 11 13 14
Paris IX Dauphine University Rice / London Business School, MS ESSEC Univ. of Nottingham London School Econ. / Harvard, MBA Univ. of Florida / Harvard, MBA Yale, MS / University of Chicago, MA and MBA Babson Babson Harvard / Harvard, MBA Providence College / Boston College, MS
Vice Presidents Francisco Arboleda (B) Alex Barker (L) Arnold Berner (L) Till Burges (L) John Fiato McComma Grayson III Ryan Gunther Edward Holdsworth (L) Haide Lui (HK) Craig MacDonald (L) Tiffany Obenchain Rajesh Senapati Kelvin Yap, CA, CFA (HK) David Zug
1 2 2 6 19 5 7 2 6 7 1 5 6 7
9 11 9 12 19 8 8 8 10 10 7 7 10 12
Universidad de los Andes Oxford ESSEC University of Applied Science / IESE, MBA Salem State College Harvard / Harvard, MBA Williams / Columbia, MBA Bristol University Cambridge / Cambridge, MA Univ. of North Carolina Northwestern University / Harvard, MBA Univ. of Chicago / Northwestern, MBA Monash University Dartmouth / Univ. of Virginia, MBA
* Includes tenure with HarbourVest Partners, LLC (1997-today), Hancock Venture Partners, Inc. (1982-96), and John Hancock Life Insurance Co (1977-81) Note: Includes employees of HarbourVest Partners, LLC, HarbourVest Partners (U.K.) Limited, HarbourVest Partners (Asia) Limited, HarbourVest Partners (Japan) Limited, and HarbourVest Investment Consulting (Beijing) Company Limited

CONFIDENTIAL 7
Firm Tenure (in years)*
Related Experience
(in years) Education (Undergraduate / Graduate)
Operations Martha Vorlicek Managing Director, Chief Operating Officer 20 31 Babson
Listed Products Stuart Howard, ACA (L) Principal and Chief Operating Officer, European Listed Products
1 16 Swansea University
Accounting & Finance (40 Professionals)
Karin Lagerlund, CPA Managing Director, Chief Financial Officer 12 25 Washington State
John Nelson, CPA Vice President, Fund Controller 13 30 Stonehill / Babson, MBA
Client & Consultant Relations (27)
Laura Thaxter Principal, Marketing & Client Communications 12 17 Dartmouth
Alexandre Covello (L) Principal 1 20 Sorbonne / Institut d’Etudes Politiques, MA
Aris Hatch Principal 5 13 Wellesley and MIT
Simon Lund (HK) Principal 3 18 University of Edinburgh
Hannah Tobin (L) Principal 15 15 Univ. College Dublin
Nathan Bishop Vice President 5 13 Univ. of Rochester
Maggie Chan (HK) Vice President 5 9 New York University
Brian Chiappinelli Vice President 2 16 Hamilton / Boston University, MS
Wladimir Ortega Vice President 1 19 Pace University, BBA
Portfolio Analytics (26) Julie Eiermann Principal 20 26 Univ. of New Hampshire
Tax & Compliance (21)
Mary Traer, CPA Managing Director, Chief Administrative Officer 15 22 Univ. of Virginia / Univ. of Virginia, MS
Greg Pusch Senior Vice President, Chief Compliance Officer
1 15 U.S. Naval Academy / Univ. of Penn, J.D.
Monique Austin Vice President, U.S. Counsel 1 9 Boston College / Boston University, J.D.
Nicholas du Cros Vice President, U.K. Legal & Compliance Officer 1 14 Macquarie Univ. / Univ. of W. Australia, LLB
Bruce Pixler, CPA Vice President, Director of Taxation 8 29 Bowling Green State
Christine Horan Vice President, Compliance Officer 4 22 St. Anselm / Suffolk, MS
Treasury (12) Jack Wagner Vice President, Treasurer 5 30 Univ. of Conn. / Univ. of Hartford, MBA
Sandra Pasquale, CPA Vice President, Assistant Treasurer 14 21 Bentley / Suffolk, MBA
Trading (1) Jecca Auchterlonie Equity Trader and Distribution Manager 7 15 Lynchburg College / Simmons, MBA
HarbourVest – Deep Operational and Service Expertise
* Includes tenure with HarbourVest Partners, LLC (1997-today), Hancock Venture Partners, Inc. (1982-96), and John Hancock Life Insurance Co (1977-81) Note: Includes employees of HarbourVest Partners, LLC, HarbourVest Partners (U.K.) Limited, HarbourVest Partners (Asia) Limited, HarbourVest Partners (Japan) Limited, and HarbourVest Investment Consulting (Beijing) Company Limited

CONFIDENTIAL 8
The HarbourVest Platform – An Integrated Approach
Consistent approach for three
decades
Integrated investment platform
provides significant advantages
– Overlapping knowledge base
– Strong relationships across
the industry
– Collaborative environment
– Enhanced deal flow,
evaluation, and monitoring

CONFIDENTIAL 9
HarbourVest North American Public Pension Investors
AAFES
City of Aurora
Baltimore County
Belmont (MA) Contributory
British Columbia
Brookline (MA) Contributory
Chicago Park Employees
Chicago Teachers
Denver Public Schools
Duluth Teachers
Idaho National Labs
Imperial County
Iowa Fire and Police
Maryland
Metropolitan Employees
(Nashville & Davidson County)
Montana
Montgomery County
Montgomery County Schools
National Education Association
New York State Common
New York State Teachers
Ohio Police and Fire
Ohio Teachers
Ontario Teachers
Oregon
Pennsylvania
Sacramento County
San Jose Police and Fire
San Luis Obispo County
Tacoma
Tennessee Valley Authority
Virginia
Washington
Weymouth (MA) Retirement
This is a list of HarbourVest’s largest active limited partners within each region or investor type (as of June 30, 2011). It is not known whether the
investors listed here approve or disapprove of HarbourVest, HarbourVest funds, or the investment services provided. This list does not include limited
partners who have requested to remain confidential.

CONFIDENTIAL 10
Focused on Clients’ Needs
LP Login web site for real-time
access to documents
Full-service teams respond to
client needs for timely
estimates, cash flow
projections, and other requests
Flexible systems able to easily
provide historical client cash
flows or quarterly activity
HarbourView interactive
investor dashboard

CONFIDENTIAL 11
Interactive Investor Dashboard
Comprehensive view of all of your HarbourVest commitments
Increased transparency through your effective interest in the portfolio of
investments and underlying companies
Top 10 manager and company holdings
Ability to view all information as
of any quarter end (for the past 2 years)
24/7 access to this information via
the Investor Login website
Consultants can access
client information

CONFIDENTIAL 12
HarbourVest Accolades
These awards do not necessarily represent investor experience with HarbourVest Partners, LLC or its funds, nor do they constitute a recommendation of HarbourVest
Partners, LLC or its services. These awards are based on surveys that are not limited to investors in HarbourVest funds and may not have included all of the investors in
HarbourVest funds. These awards are not indicative of HarbourVest’s or HVPE’s future performance
Notes A-F: See notes in Additional Information
PRIVATE EQUITY FUND-OF-FUNDS AWARDS
SECONDARY AWARDS DIRECT / OTHER AWARDS
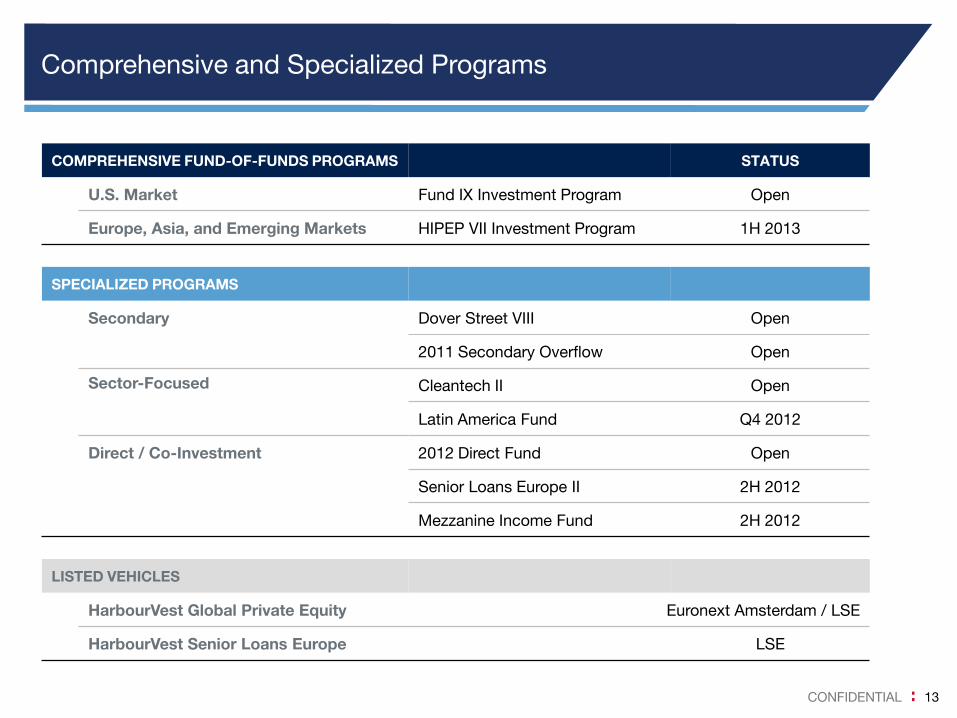
CONFIDENTIAL 13
Comprehensive and Specialized Programs
COMPREHENSIVE FUND-OF-FUNDS PROGRAMS STATUS
U.S. Market Fund IX Investment Program Open
Europe, Asia, and Emerging Markets HIPEP VII Investment Program 1H 2013
SPECIALIZED PROGRAMS
Secondary Dover Street VIII Open
2011 Secondary Overflow Open
Sector-Focused Cleantech II Open
Latin America Fund Q4 2012
Direct / Co-Investment 2012 Direct Fund Open
Senior Loans Europe II 2H 2012
Mezzanine Income Fund 2H 2012
LISTED VEHICLES
HarbourVest Global Private Equity Euronext Amsterdam / LSE
HarbourVest Senior Loans Europe LSE

Prior Performance

CONFIDENTIAL 15
Strong Long-Term Partnership Investment Performance
HarbourVest investments have produced strong private equity returns
– Disciplined approach, experience across many economic cycles, and access
to leading sponsors
HarbourVest performance does not represent the performance of any specific fund or the return to limited partners. This performance is presented on a gross basis. It
reflects the fees, expenses, and carried interest of the underlying partnership investments, but does not reflect management fees, carried interest, and other expenses borne
by investors in the HarbourVest Funds, which will reduce returns. The net returns of the applicable funds are presented on other pages of this presentation.
* Source: Bloomberg – annualized time weighted return. Dividends are not reinvested. MSCI is the MSCI All European Countries index, in euros. These returns do not
reflect the cash flows used to calculate the HarbourVest Portfolio IRR (gross) and accordingly a direct comparison may not be meaningful.
** Source: Thomson Reuters, Benchmark Summary Report. All Private Equity – U.S., vintage years 1992-2006. See Note 5. Industry Benchmark IRR is the pooled IRR
based on the combined cash flows of all funds in the benchmark. Median and Upper Quartile are based on the distribution of the IRRs of each fund in the benchmark,
with Upper Quartile being the point at which 25% of the sample has a higher IRR and 75% of the sample has a lower IRR.
*** Performance of U.S. partnership investments (primary and secondary) made by the HarbourVest team in vintage years 1992-2006. See Notes 2 and 4.
† Source: Thomson Reuters, Benchmark Summary Report. All Private Equity – Europe, vintage years 1992-2006; in euros. See Note 6 and additional detail in note ** above.
‡ Performance of European partnership investments (primary and secondary) made by the HarbourVest team in vintage years 1992-2006. See Notes 2 and 4.
See final pages for additional notes.
4.5%
0.0%
9.5% 9.6%
15.0%
0%
5%
10%
15%
20%
MSCI Median Upper
Quartile
Industry
Benchmark
IRR
HarbourVest
Portfolio
IRR ‡
7.0%
4.0%
13.9%
9.9%
13.8%
0%
5%
10%
15%
20%
Russell 2000 Median Upper
Quartile
Industry
Benchmark
IRR
HarbourVest
Portfolio
IRR***
Public Equity
Benchmarks * Private Equity Benchmarks ** Private Equity Benchmarks † Public Equity
Benchmarks *
Retu
rn
Retu
rn
U.S. PARTNERSHIP INVESTMENT PERFORMANCE AS OF DECEMBER 31, 2011 (VINTAGE YEARS 1992-2006)
EUROPEAN PARTNERSHIP INVESTMENT PERFORMANCE AS OF DECEMBER 31, 2011 (VINTAGE YEARS 1992-2006)
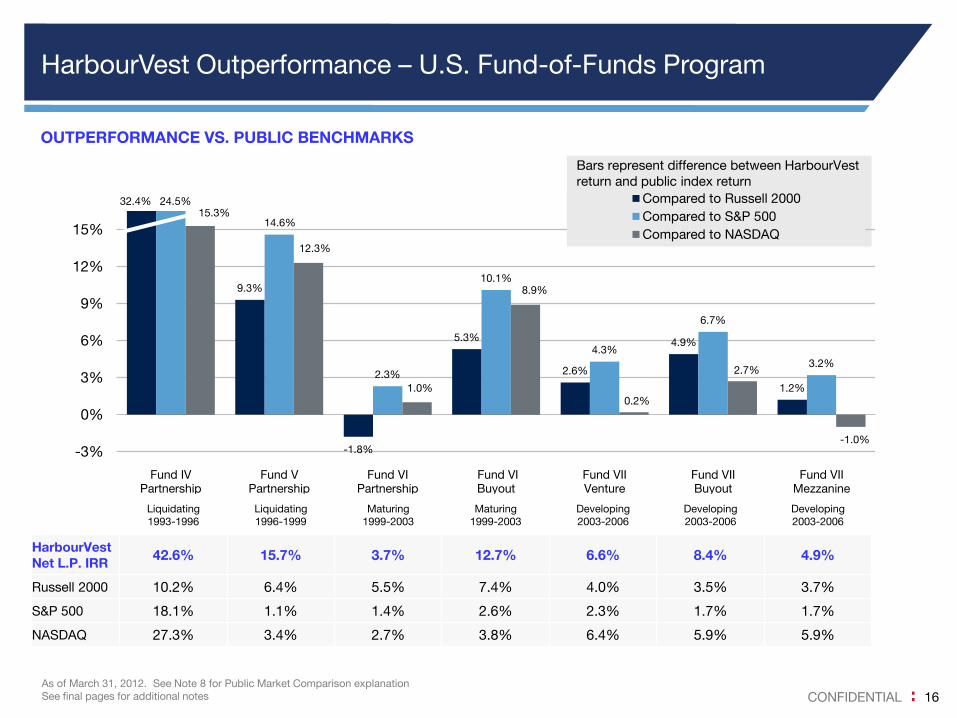
CONFIDENTIAL 16
Bars represent difference between HarbourVest
return and public index return
9.3%
-1.8%
5.3%
2.6%
4.9%
1.2%
14.6%
2.3%
10.1%
4.3%
6.7%
3.2%
15.3%
12.3%
1.0%
8.9%
0.2%
2.7%
-1.0%
-3%
0%
3%
6%
9%
12%
15%
Fund IV
Partnership
Fund V
Partnership
Fund VI
Partnership
Fund VI
Buyout
Fund VII
Venture
Fund VII
Buyout
Fund VII
Mezzanine
Compared to Russell 2000
Compared to S&P 500
Compared to NASDAQ
Liquidating
1993-1996
Liquidating
1996-1999
Maturing
1999-2003
Maturing
1999-2003
Developing
2003-2006
Developing
2003-2006
Developing
2003-2006
HarbourVest
Net L.P. IRR 42.6% 15.7% 3.7% 12.7% 6.6% 8.4% 4.9%
Russell 2000 10.2% 6.4% 5.5% 7.4% 4.0% 3.5% 3.7%
S&P 500 18.1% 1.1% 1.4% 2.6% 2.3% 1.7% 1.7%
NASDAQ 27.3% 3.4% 2.7% 3.8% 6.4% 5.9% 5.9%
HarbourVest Outperformance – U.S. Fund-of-Funds Program
As of March 31, 2012. See Note 8 for Public Market Comparison explanation
See final pages for additional notes
OUTPERFORMANCE VS. PUBLIC BENCHMARKS
32.4% 24.5%
U.S. Fund-of-Funds Program
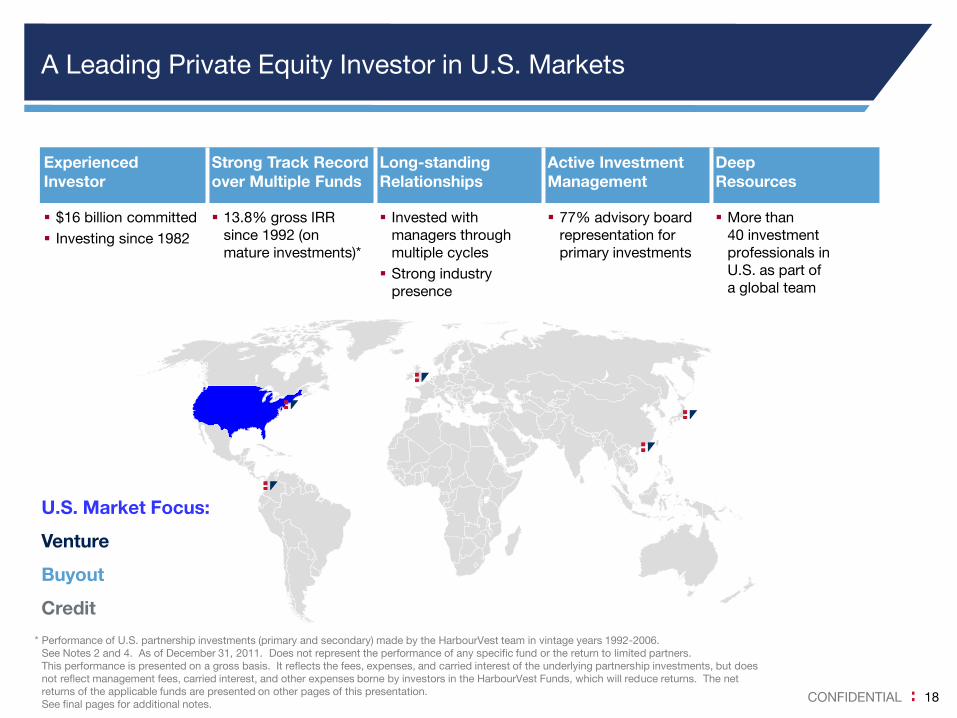
CONFIDENTIAL 18
A Leading Private Equity Investor in U.S. Markets
Experienced
Investor
Strong Track Record
over Multiple Funds
Long-standing
Relationships
Active Investment
Management
Deep
Resources
$16 billion committed
Investing since 1982
13.8% gross IRR
since 1992 (on
mature investments)*
Invested with
managers through
multiple cycles
Strong industry
presence
77% advisory board
representation for
primary investments
More than
40 investment
professionals in
U.S. as part of
a global team
U.S. Market Focus:
Venture
Buyout
Credit
* Performance of U.S. partnership investments (primary and secondary) made by the HarbourVest team in vintage years 1992-2006.
See Notes 2 and 4. As of December 31, 2011. Does not represent the performance of any specific fund or the return to limited partners.
This performance is presented on a gross basis. It reflects the fees, expenses, and carried interest of the underlying partnership investments, but does
not reflect management fees, carried interest, and other expenses borne by investors in the HarbourVest Funds, which will reduce returns. The net
returns of the applicable funds are presented on other pages of this presentation.
See final pages for additional notes.

CONFIDENTIAL 19
HarbourVest Approach
U.S. Venture
Focus on managers with
– Experience and deep, successful track records
– Unique deal flow
– Strong networks
U.S. Buyout
Focus on managers with
– Active and proprietary sourcing
– Strategic and operational expertise
– Demonstrated performance
Credit Opportunities
Focus on equity-oriented mezzanine managers
and control-focused distressed debt managers
Focus on managers with differentiated deal flow from
independent and affiliated sources
Seek to build a portfolio which produces current
income as well as potential for equity gains
Venture
30%
Buyout
60%
Credit
10%
Portfolio Construction
3 to 4-year commitment period
Venture: 20 to 25 managers
Buyout: 20 to 25 managers
Credit: 12 to 15 managers
Predominantly primary partnerships,
complemented by direct and secondary
investments

CONFIDENTIAL 20
The Value of Diversification
Venture, buyout, and credit cycles are not aligned
Each segment can outperform
Suggested allocation:
– Venture 25-35%
– Buyout 55-65%
– Credit 5-15%
Source: Thomson Reuters. Data represents a 5-year IRR for venture, buyout, or mezzanine calculated as of each year-end.
-10
0
10
20
30
40
50
’80 ’81 ’82 ’83 ’84 ’85 ’86 ’87 ’88 ’89 ’90 ’91 ’92 ’93 ’94 ’95 ’96 ’97 ’98 ’99 ’00 ’01 ’02 ’03 ’04 ’05 ’06 ’07 ’08 ’09 ’10
Venture
Buyout
Credit
FIVE-YEAR ROLLING AVERAGE RETURNS
IRR
%

CONFIDENTIAL 21
U.S. Buyout Industry Performance
Source: ThomsonReuters. Vintage year returns of buyout funds. As of March 31, 2012. Small, medium, large categorization based on a rolling definition.
1993-1996: Small: <$300M, Medium: $300-699, Large: >$700
1997-1998: Small: <$500M, Medium: $500-1,499, Large: >$1,500
1999-2002: Small: <$650M, Medium: $650-2,000, Large: >$2,000
2003-2006: Small: <$850M, Medium: $850-3,999, Large: >$4,000
2007-2008: Small: <$1,500M, Medium: $1,500-9,999, Large: >$10,000
VINTAGE YEAR PERFORMANCE BY SIZE
IRR
(%
)
-5
0
5
10
15
20
25
’93 ’94 ’95 ’96 ’97 ’98 ’99 ’00 ’01 ’02 ’03 ’04 ’05 ’06 ’07 ’08
Small
Medium
Large
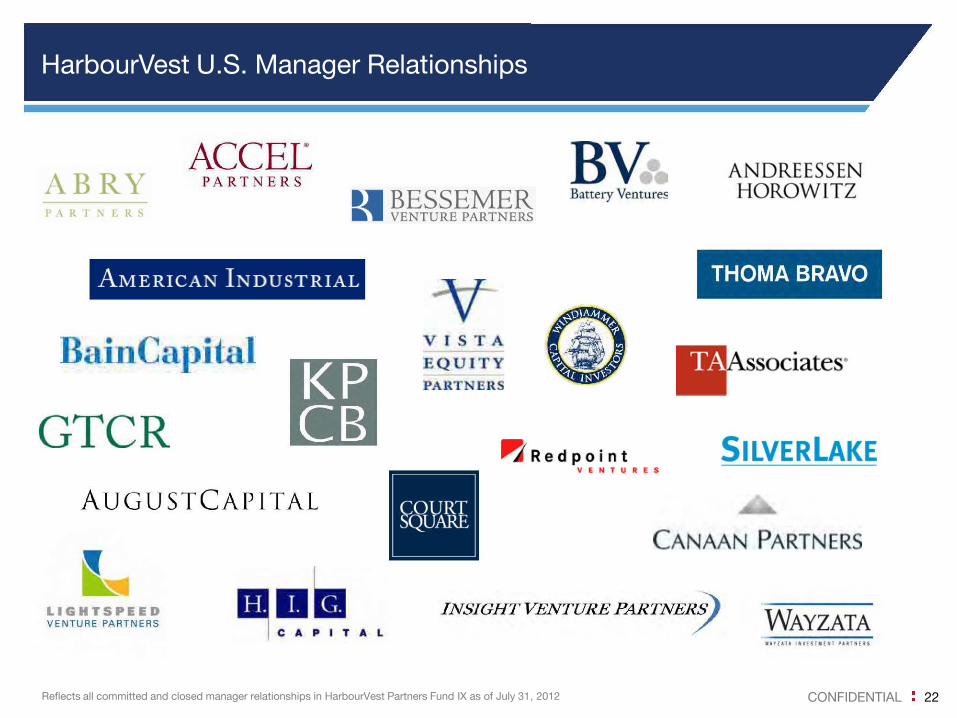
CONFIDENTIAL 22
HarbourVest U.S. Manager Relationships
Reflects all committed and closed manager relationships in HarbourVest Partners Fund IX as of July 31, 2012
ACCEC ABRY PARTNERS
P\RI!'.:ERc;;
AMERICAN INDUSTRIAL
GTCR KP CB
AUGUSTCAPITAL
LIGHTSPEED VENTURE PARTNE RS
V IS TA
E Q U I TY PARTNE RS
B¥ Battery Yenture5
~Redpoint V E N T U R E S
ANDRE ESSEN HOROWITZ
THOMA BRAVO
. sociates·
SILVE LAKE
CANAAN PARTNERS
INSIGHT VENTURE PARTNEif) WAYZATA Wl"'UU III'HST II [IH PARf/11 [1$
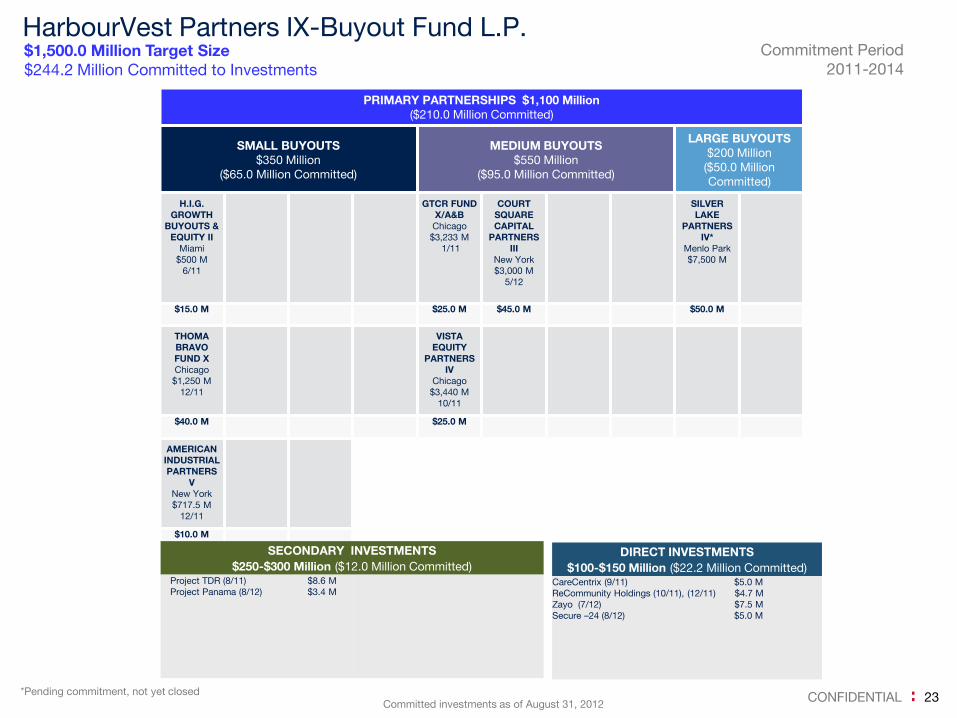
CONFIDENTIAL 23 Committed investments as of August 31, 2012
PRIMARY PARTNERSHIPS $1,100 Million
($210.0 Million Committed)
SMALL BUYOUTS
$350 Million
($65.0 Million Committed)
MEDIUM BUYOUTS
$550 Million
($95.0 Million Committed)
LARGE BUYOUTS
$200 Million
($50.0 Million
Committed)
H.I.G.
GROWTH
BUYOUTS &
EQUITY II
Miami
$500 M
6/11
GTCR FUND
X/A&B
Chicago
$3,233 M
1/11
COURT
SQUARE
CAPITAL
PARTNERS
III
New York
$3,000 M
5/12
SILVER
LAKE
PARTNERS
IV*
Menlo Park
$7,500 M
$15.0 M $25.0 M
$45.0 M $50.0 M
THOMA
BRAVO
FUND X
Chicago
$1,250 M
12/11
VISTA
EQUITY
PARTNERS
IV
Chicago
$3,440 M
10/11
$40.0 M $25.0 M
AMERICAN
INDUSTRIAL
PARTNERS
V
New York
$717.5 M
12/11
$10.0 M
$1,500.0 Million Target Size
$244.2 Million Committed to Investments
Commitment Period
2011-2014
*Pending commitment, not yet closed
HarbourVest Partners IX-Buyout Fund L.P.
SECONDARY INVESTMENTS
$250-$300 Million ($12.0 Million Committed) Project TDR (8/11) $8.6 M
Project Panama (8/12) $3.4 M
DIRECT INVESTMENTS
$100-$150 Million ($22.2 Million Committed) CareCentrix (9/11) $5.0 M
ReCommunity Holdings (10/11), (12/11) $4.7 M
Zayo (7/12) $7.5 M
Secure –24 (8/12) $5.0 M
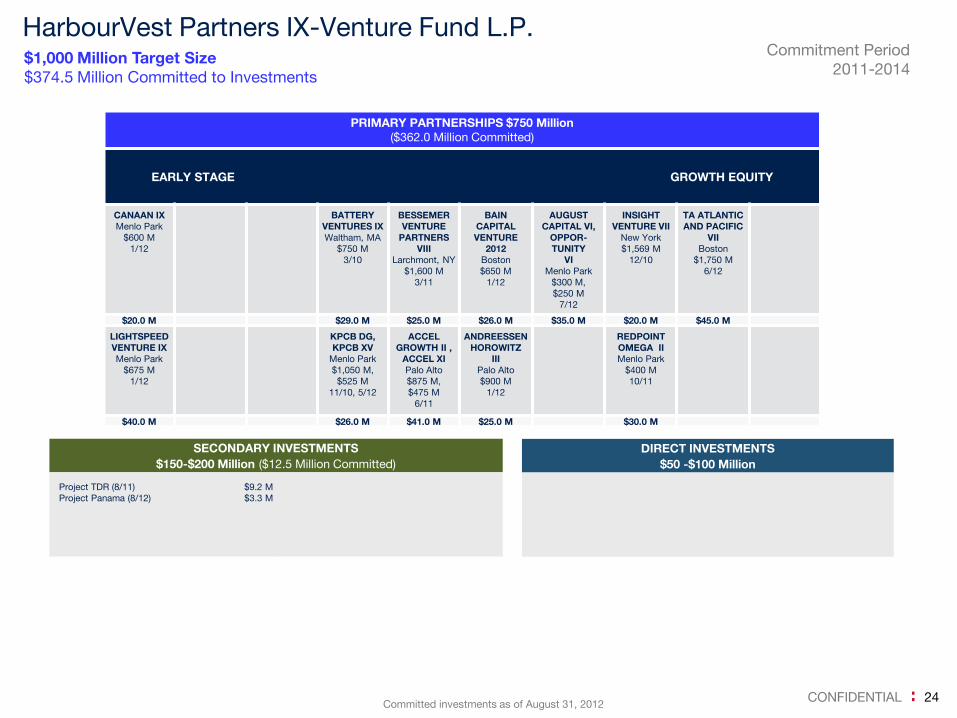
CONFIDENTIAL 24 Committed investments as of August 31, 2012
HarbourVest Partners IX-Venture Fund L.P.
PRIMARY PARTNERSHIPS $750 Million
($362.0 Million Committed)
EARLY STAGE GROWTH EQUITY
CANAAN IX
Menlo Park
$600 M
1/12
BATTERY
VENTURES IX
Waltham, MA
$750 M
3/10
BESSEMER
VENTURE
PARTNERS
VIII
Larchmont, NY
$1,600 M
3/11
BAIN
CAPITAL
VENTURE
2012
Boston
$650 M
1/12
AUGUST
CAPITAL VI,
OPPOR-
TUNITY
VI
Menlo Park
$300 M,
$250 M
7/12
INSIGHT
VENTURE VII
New York
$1,569 M
12/10
TA ATLANTIC
AND PACIFIC
VII
Boston
$1,750 M
6/12
$20.0 M $29.0 M $25.0 M $26.0 M $35.0 M $20.0 M $45.0 M
LIGHTSPEED
VENTURE IX
Menlo Park
$675 M
1/12
KPCB DG,
KPCB XV
Menlo Park
$1,050 M,
$525 M
11/10, 5/12
ACCEL
GROWTH II ,
ACCEL XI
Palo Alto
$875 M,
$475 M
6/11
ANDREESSEN
HOROWITZ
III
Palo Alto
$900 M
1/12
REDPOINT
OMEGA II
Menlo Park
$400 M
10/11
$40.0 M $26.0 M $41.0 M $25.0 M $30.0 M
SECONDARY INVESTMENTS
$150-$200 Million ($12.5 Million Committed)
Project TDR (8/11) $9.2 M
Project Panama (8/12) $3.3 M
DIRECT INVESTMENTS
$50 -$100 Million
$1,000 Million Target Size
$374.5 Million Committed to Investments
Commitment Period
2011-2014
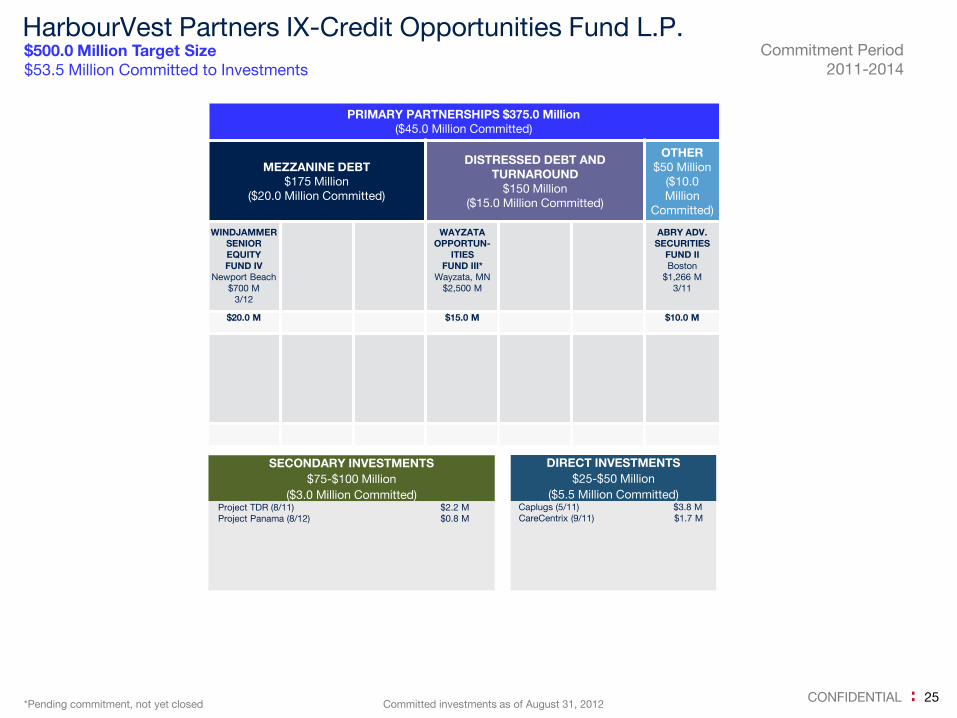
CONFIDENTIAL 25 Committed investments as of August 31, 2012
PRIMARY PARTNERSHIPS $375.0 Million
($45.0 Million Committed)
MEZZANINE DEBT
$175 Million
($20.0 Million Committed)
DISTRESSED DEBT AND
TURNAROUND
$150 Million
($15.0 Million Committed)
OTHER
$50 Million
($10.0
Million
Committed)
WINDJAMMER
SENIOR
EQUITY
FUND IV
Newport Beach
$700 M
3/12
WAYZATA
OPPORTUN-
ITIES
FUND III*
Wayzata, MN
$2,500 M
ABRY ADV.
SECURITIES
FUND II
Boston
$1,266 M
3/11
$20.0 M $15.0 M $10.0 M
$500.0 Million Target Size
$53.5 Million Committed to Investments
Commitment Period
2011-2014
*Pending commitment, not yet closed
HarbourVest Partners IX-Credit Opportunities Fund L.P.
SECONDARY INVESTMENTS
$75-$100 Million
($3.0 Million Committed) Project TDR (8/11) $2.2 M
Project Panama (8/12) $0.8 M
DIRECT INVESTMENTS
$25-$50 Million
($5.5 Million Committed) Caplugs (5/11) $3.8 M
CareCentrix (9/11) $1.7 M

CONFIDENTIAL 26
-4% -10%
-17% -20% -18%
-15% -10%
-6%
+0% +0% +1% +4%
+10% +17%
+29% +31%
+23% +17% +14% +12%
+8% +6% +2%
-75%
-50%
-25%
0%
25%
50%
75%
Through
2011
2012 2013 2014 2015 2016 2017 2018 2019 2020 2021 2022 2023 2024 2025
Year
Cash Flow Projections
Shown for illustrative purposes only. Provides an example of the mechanics and cash flows of a private equity fund. Not intended to project the
performance of any future fund. Cash flows are displayed as a % of capital committed. There is no assurance that distributions will be generated as
shown or that they will be sufficient to cover capital calls.
BASED ON PROPOSED COMMITMENT OF $10 MILLION TO FUND IX
Annual Capital Calls
Annual Distributions
Cumulative
Net Cash Flow
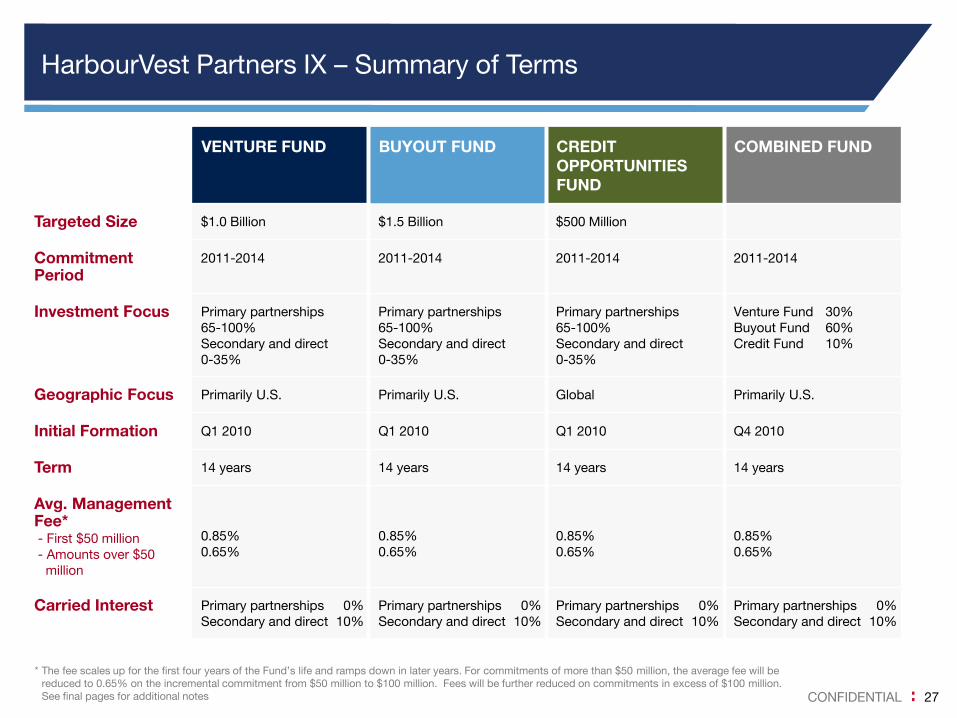
CONFIDENTIAL 27
* The fee scales up for the first four years of the Fund’s life and ramps down in later years. For commitments of more than $50 million, the average fee will be
reduced to 0.65% on the incremental commitment from $50 million to $100 million. Fees will be further reduced on commitments in excess of $100 million.
See final pages for additional notes
VENTURE FUND BUYOUT FUND CREDIT
OPPORTUNITIES
FUND
COMBINED FUND
Targeted Size $1.0 Billion $1.5 Billion $500 Million
Commitment Period
2011-2014 2011-2014 2011-2014 2011-2014
Investment Focus Primary partnerships
65-100%
Secondary and direct
0-35%
Primary partnerships
65-100%
Secondary and direct
0-35%
Primary partnerships
65-100%
Secondary and direct
0-35%
Venture Fund 30%
Buyout Fund 60%
Credit Fund 10%
Geographic Focus Primarily U.S. Primarily U.S. Global Primarily U.S.
Initial Formation Q1 2010 Q1 2010 Q1 2010 Q4 2010
Term 14 years 14 years 14 years 14 years
Avg. Management Fee* - First $50 million
- Amounts over $50
million
0.85%
0.65%
0.85%
0.65%
0.85%
0.65%
0.85%
0.65%
Carried Interest Primary partnerships 0%
Secondary and direct 10%
Primary partnerships 0%
Secondary and direct 10%
Primary partnerships 0%
Secondary and direct 10%
Primary partnerships 0%
Secondary and direct 10%
HarbourVest Partners IX – Summary of Terms

Summary
: r HARBOUR VEST

CONFIDENTIAL 29
A Trusted Private Equity Manager
Established Firm
Focus on
Private Equity
Deep, Stable Team
Proven
Track Record
Superior Client Service
Strong
Risk Controls

Appendix
: r HARBOUR VEST

CONFIDENTIAL 31
U.S. Program Performance
* Although Fund III was comprised of both partnership and direct investments, the figures shown above present partnership investments only to allow for
a relevant comparison across investment programs. The "Net L.P. IRR" for Fund III is a “net portfolio IRR” which reflects the performance of the fund's
partnership investments only, net of the fees, expenses, and carried interest of the partnership investments and the HarbourVest fund. See Note 7 for
further explanation. The actual Net L.P. IRR, which reflects the net performance of the entire fund (partnership and direct investments) and is based on
cash flows to and from limited partners, is 13.9%. The comparable public market comparison is NASDAQ 16.3% and S&P 500 11.2%.
N/M IRR not meaningful as the fund is still investing and a significant amount of capital is yet to be called
See Note 8 for Public Market Comparison explanation
The Fund IX Investment Program can invest up to 35%, in aggregate, in secondary transactions and direct investments with a limit of 10% for direct
investments. The net performance of HarbourVest’s prior secondary funds and prior U.S. direct funds is provided in Note 9.
See final pages for additional notes
AS OF MARCH 31, 2012
FUND III* FUND IV FUND V
Initial Capital Call December 1988 October 1993 January 1997
Status Liquidated Liquidating Liquidating
Commitment Period 1989-1993 1993-1996 1996-1999
($ Millions)
Partnership
Portfolio
Partnership
Fund
Partnership
Fund
Partnership
Fund
Buyout
Fund
Venture
Fund
Buyout
Fund
Mezzanine
Fund
Venture
Fund
Buyout
Fund
Mezzanine
Fund
Committed Capital $99.3 $196.4 $707.1 $3,030.3 $1,084.8 $2,020.2 $2,020.2 $428.4 $2,084.6 $2,937.9 $485.1
Contributed Capital 99.3 186.5 696.5 2,924.9 1,025.2 1,813.3 1,754.0 379.0 1,537.7 1,854.4 336.4
Distributions 229.8 725.0 1,113.5 2,315.9 1,424.2 497.0 827.9 185.0 114.9 172.2 72.2
Total Value 229.8 730.0 1,197.7 3,690.8 1,859.7 2,450.3 2,486.1 466.2 1,936.0 2,279.1 385.4
Distributions / Contributed 2.3x 3.9x 1.6x 0.8x 1.4x 0.3x 0.5x 0.5x 0.1x 0.1x 0.2x
Total Value / Contributed 2.3x 3.9x 1.7x 1.3x 1.8x 1.4x 1.4x 1.2x 1.3x 1.2x 1.1x
Net L.P. IRR 17.9%* 42.6% 15.7% 3.7% 12.7% 6.6% 8.4% 4.9% 8.2% 6.7% 5.2%
Public Market Comparison 8
Russell 2000 N/A 10.2% 6.4% 5.5% 7.4% 4.0% 3.5% 3.7% 8.2% 5.9% 8.3%
S&P 500 N/A 18.1% 1.1% 1.4% 2.6% 2.3% 1.7% 1.7% 6.3% 4.4% 6.4%
NASDAQ N/A 27.3% 3.4% 2.7% 3.8% 6.4% 5.7% 5.9% 11.5% 9.3% 11.9%
1999-2003
FUND VI
May 1999
Maturing
FUND VII
February 2003
Developing
2003-2006
FUND VIII
October 2006
Investing
2006-2011
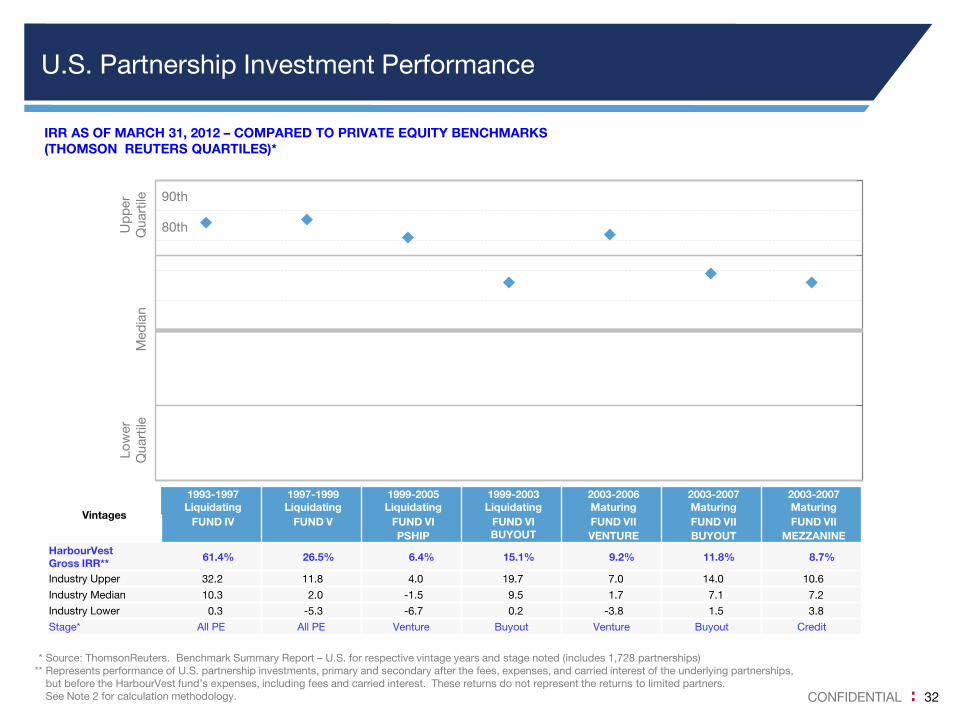
CONFIDENTIAL 32
U.S. Partnership Investment Performance
* Source: ThomsonReuters. Benchmark Summary Report – U.S. for respective vintage years and stage noted (includes 1,728 partnerships)
** Represents performance of U.S. partnership investments, primary and secondary after the fees, expenses, and carried interest of the underlying partnerships,
but before the HarbourVest fund’s expenses, including fees and carried interest. These returns do not represent the returns to limited partners.
See Note 2 for calculation methodology.
80th
90th
Med
ian
Lo
wer
Quart
ile
Up
per
Quart
ile
IRR AS OF MARCH 31, 2012 – COMPARED TO PRIVATE EQUITY BENCHMARKS
(THOMSON REUTERS QUARTILES)*
Vintages
1993-1997
Liquidating
1997-1999
Liquidating
1999-2005
Liquidating
1999-2003
Liquidating
2003-2006
Maturing
2003-2007
Maturing
2003-2007
Maturing
FUND IV FUND V FUND VI
PSHIP
FUND VI
BUYOUT
FUND VII
VENTURE
FUND VII
BUYOUT
FUND VII
MEZZANINE
HarbourVest
Gross IRR** 61.4% 26.5% 6.4% 15.1% 9.2% 11.8% 8.7%
Industry Upper 32.2 11.8 4.0 19.7 7.0 14.0 10.6
Industry Median 10.3 2.0 -1.5 9.5 1.7 7.1 7.2
Industry Lower 0.3 -5.3 -6.7 0.2 -3.8 1.5 3.8
Stage* All PE All PE Venture Buyout Venture Buyout Credit

CONFIDENTIAL 33
Regulatory and Control Environment
* This does not indicate approval or endorsement of HarbourVest by the U.S. SEC
REGISTERED WITH THE SEC
SINCE INCEPTION
AUDIT
ORIENTED
FOCUSED ON STRONG CONTROL
ENVIRONMENT
HarbourVest Partners, LLC is
registered with the U.S. Securities
and Exchange Commission (SEC)
under the Investment Advisors Act
of 1940*
Independently-owned
Dedicated Chief Compliance
Officer (CCO) supported by 2
additional staff members
Firm-wide Code of Ethics
Electronic monitoring of personal
securities transactions, political
contributions and hospitality
receipt or expenditures
Annual compliance training for all
global employees
Audit Committee meets semi-
annually and includes 2 managing
directors independent from the
financial reporting process
Auditor – Ernst & Young
Separate opinion issued regarding
equity allocation’s compliance with
limited partnership agreement
Semi-annual review of compliance
with limited partnership
agreements
Operational due diligence program
over general partners
(recalculating management fee,
carry allocation, comparison of
expense ratios, review GP
clawbacks and loss reallocations)
Annual operational questionnaire
to selected group
Review of auditor quality
Issue annual SSAE 16 (formerly
SAS 70) report by external
auditors, which includes review of
internal control environment and
identifies and tests key controls
– Vote sheet – documents
investment staff approval for all
transactions
– Review and approval of capital
calls, distributions,
management fees, and carry
– Authorized signatory required
to update wiring instructions
– Access to systems
documented and approved
– Segregation of duties

CONFIDENTIAL 34
Reporting and Investor Communications Schedule
COMMUNICATION FREQUENCY CONTENTS
Capital call notices As needed Amount of call and wiring instructions
Distribution notices As needed Amount of distribution and largest sources of distribution
Capital account
statements
Quarterly
(45-90 days after quarter end)
Value of individual investor’s capital account
Detail on changes in account value from prior period (calls, distributions,
gains / losses, expenses)
IRRs
December 31 Estimated
Statements
Annually (January) or upon
request
Estimated December 31 capital account statements based on best
information available and relative changes in S&P weighted indices
Update letters Bi-annually
January / February,
July / August
Update on the fund’s activity in prior period
Calls, distributions, new investments, and major portfolio developments
Annual reports Annually
March – May (within 150 days
after year end)
Portfolio summaries
Detailed update on the fund’s activity in prior period
Calls, distributions, new investments, liquidations
Major sources of investment gains and losses
Fair value of each investment, diversification, major holdings
Audited financial statements
Capital account values for each investor
Market update
Quarterly reports As of March, June, and
September
Quarterly updates on fund and portfolio activity throughout the year
Within 90-120 days of quarter end
SSAE 16 report Annually Type II report to be issued annually
Annual tax information Annually
May – August
Schedules K-1, withholding tax statements and other information necessary
to complete each limited partner’s tax return
Annual meeting Annually
Late May
Presentations are made available to limited partners who cannot attend
Location rotated between Boston and Europe
Advisory Board meetings Semi-annually
(May and December)
Agenda items include any topics / updates requested by members
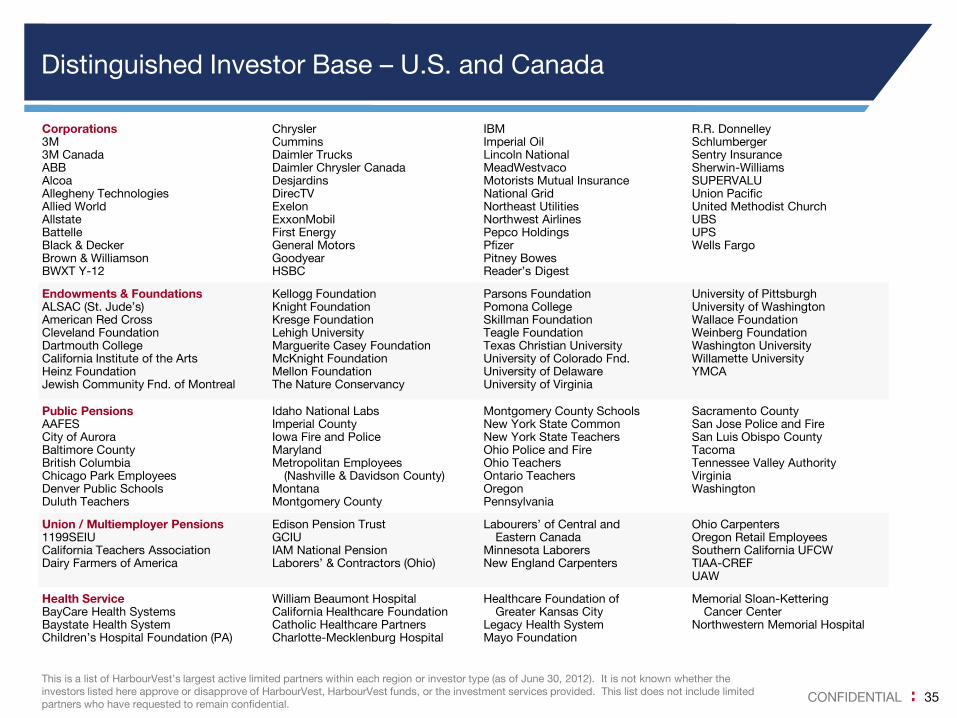
CONFIDENTIAL 35
Corporations 3M 3M Canada ABB Alcoa Allegheny Technologies Allied World Allstate Battelle Black & Decker Brown & Williamson BWXT Y-12
Chrysler Cummins Daimler Trucks Daimler Chrysler Canada Desjardins DirecTV Exelon ExxonMobil First Energy General Motors Goodyear HSBC
IBM Imperial Oil Lincoln National MeadWestvaco Motorists Mutual Insurance National Grid Northeast Utilities Northwest Airlines Pepco Holdings Pfizer Pitney Bowes Reader’s Digest
R.R. Donnelley Schlumberger Sentry Insurance Sherwin-Williams SUPERVALU Union Pacific United Methodist Church UBS UPS Wells Fargo
Endowments & Foundations ALSAC (St. Jude’s) American Red Cross Cleveland Foundation Dartmouth College California Institute of the Arts Heinz Foundation Jewish Community Fnd. of Montreal
Kellogg Foundation Knight Foundation Kresge Foundation Lehigh University Marguerite Casey Foundation McKnight Foundation Mellon Foundation The Nature Conservancy
Parsons Foundation Pomona College Skillman Foundation Teagle Foundation Texas Christian University University of Colorado Fnd. University of Delaware University of Virginia
University of Pittsburgh University of Washington Wallace Foundation Weinberg Foundation Washington University Willamette University YMCA
Public Pensions AAFES City of Aurora Baltimore County British Columbia Chicago Park Employees Denver Public Schools Duluth Teachers
Idaho National Labs Imperial County Iowa Fire and Police Maryland Metropolitan Employees
(Nashville & Davidson County) Montana Montgomery County
Montgomery County Schools New York State Common New York State Teachers Ohio Police and Fire Ohio Teachers Ontario Teachers Oregon Pennsylvania
Sacramento County San Jose Police and Fire San Luis Obispo County Tacoma Tennessee Valley Authority Virginia Washington
Union / Multiemployer Pensions 1199SEIU California Teachers Association Dairy Farmers of America
Edison Pension Trust GCIU IAM National Pension Laborers’ & Contractors (Ohio)
Labourers’ of Central and Eastern Canada
Minnesota Laborers New England Carpenters
Ohio Carpenters Oregon Retail Employees Southern California UFCW TIAA-CREF UAW
Health Service BayCare Health Systems Baystate Health System Children’s Hospital Foundation (PA)
William Beaumont Hospital California Healthcare Foundation Catholic Healthcare Partners Charlotte-Mecklenburg Hospital
Healthcare Foundation of Greater Kansas City
Legacy Health System Mayo Foundation
Memorial Sloan-Kettering Cancer Center
Northwestern Memorial Hospital
Distinguished Investor Base – U.S. and Canada
This is a list of HarbourVest’s largest active limited partners within each region or investor type (as of June 30, 2012). It is not known whether the
investors listed here approve or disapprove of HarbourVest, HarbourVest funds, or the investment services provided. This list does not include limited
partners who have requested to remain confidential.

CONFIDENTIAL 36
United Kingdom Aberdeen City Council Cambridgeshire County Council Cardiff County Council Clwyd Pension Fund Dorset County Council East Sussex Pension Fund Greater Manchester Pension Fund Hertfordshire County Council Kent County Council London Borough of Lewisham
London Borough of Newham London Pensions Fund Authority Norfolk Pension Fund Powys County Council Shropshire County Pension Fund South Yorkshire Pensions Authority Staffordshire County Council City and County of Swansea Tyne & Wear Pension Fund Warwickshire Pension Fund West Midlands
West Yorkshire Pension Fund ASDA Pension Fund BAe Systems Pension Fund Bank of Scotland BP Pension Fund British Coal Staff Cambridge College Edmundson Electrical Pension Foreign and Colonial Guy’s & St. Thomas’ Charity Howden Joinery Pension Plan
J Leon J Sainsbury Mineworkers’ Pension MMC UK Pension Fund Oxford Railpen (Railways Pension) Saint-Gobain U.K. Pension Scottish Widows Tesco Pension The Wellcome Trust Westland Pension
France Caisse des Dépôts Quartilium (Finama) Germany Daimler Pension Siemens
Italy Compagnia di San Paolo Nordic Region AP 3 AP 7 BankPension Norsk Hydro Pensjonkasse
Netherlands Horeca & Catering ING Pension Fund Interpolis Productschappen Shell SPF Beheer TNO
Switzerland CERN Comunitas Nestlé PKE Retraites Populaires Quilvest VEF Swissair
Australia AMP ARIA AUSCOAL Superannuation Austsafe
Australia Post Superannuation AustralianSuper Catholic Superannuation Fund Energy Super ExxonMobil Superannuation
Government Employees Superannuation Health Industry Plan Military Superannuation Tasplan Telstra Super
TWU Superannuation University of Queensland University of Sydney
Japan Aioi Insurance Company Ltd Asahi Kasei Pension Fund Daido Life Insurance Company Fujitsu Pension Fund
Hitachi KDDI Pension Fund Mitsubishi UFJ Trust & Banking National Construction
Association Pension Fund
Pension Fund Association Sompo Japan Insurance Inc. Sony Employees’ Pension Fund Sumitomo Pension Fund
Korea Korea Post Insurance Korea Post Savings
Hong Kong Grace Financial Limited New Zealand New Zealand Superannuation
Fund
Singapore Bank of Singapore Great Eastern Life Assurance Nanyang Technological University National University of Singapore NTUC Income Insurance
Colombia Colfondos ING Pensiones Porvenir Protección AFP Skandia AFP Suramericana
Chile AFP Habitat AFP Provida AFP Cuprum AFP Planvital Cruz del Sur Peru Prima Profuturo AFP
Distinguished Investor Base – Europe, Asia and Latin America
This is a list of HarbourVest’s largest active limited partners within each region or investor type (as of June 30, 2012). It is not
known whether the investors listed here approve or disapprove of HarbourVest, HarbourVest funds, or the investment services
provided. This list does not include limited partners who have requested to remain confidential.

CONFIDENTIAL 37
FUNDRAISING INVESTMENTS
Steady pipeline of opportunities
Top-tier managers oversubscribed at premium terms
Large exits creating some renewed LP interest
Continued selectivity among limited partners leads to
“Haves” and “Have-Nots”
Liquidity expected to drive future commitments
Convergence of, and advances in, technologies
creating new waves of innovation
– Social / Local / Mobile / Cloud / Big Data
Structural dynamics continue to improve for venture
investors
Fewer fund formations reduce competition, although
best entrepreneurs attract much interest
– Early stage investment valuations attractive
– Better ecosystem for portfolio company success
LIQUIDITY COMPANIES TO WATCH
Companies with high growth generating exciting returns
in a low growth environment
Companies preparing for IPOs are stronger than ever
After-market stock performance important to continued
IPO activity
Continued interest from strategic acquirers with
substantial cash reserves looking for new growth
opportunities
U.S. Venture Outlook

CONFIDENTIAL 38
U.S. Buyout Outlook
FUNDRAISING INVESTMENTS
2012 pipeline robust as managers delayed
fundraising in prior two years
Smaller fund sizes will be typical, especially at
larger end of the market
Increased selectivity among limited partners
Concerns about tax changes likely to result in
an increase in deal volume
Continued availability of cheap credit will lead
to increased deal activity
Purchase price multiples remain a concern,
particularly in light of fragile economy
LIQUIDITY COMPANIES TO WATCH
Existing portfolios have largely weathered the
storm and are positioned to create gains for
limited partners
M&A and recaps fuel distributions; IPO pipeline
increasing
Sponsor-to-sponsor activity increasing
Leveraged finance markets open but volatile
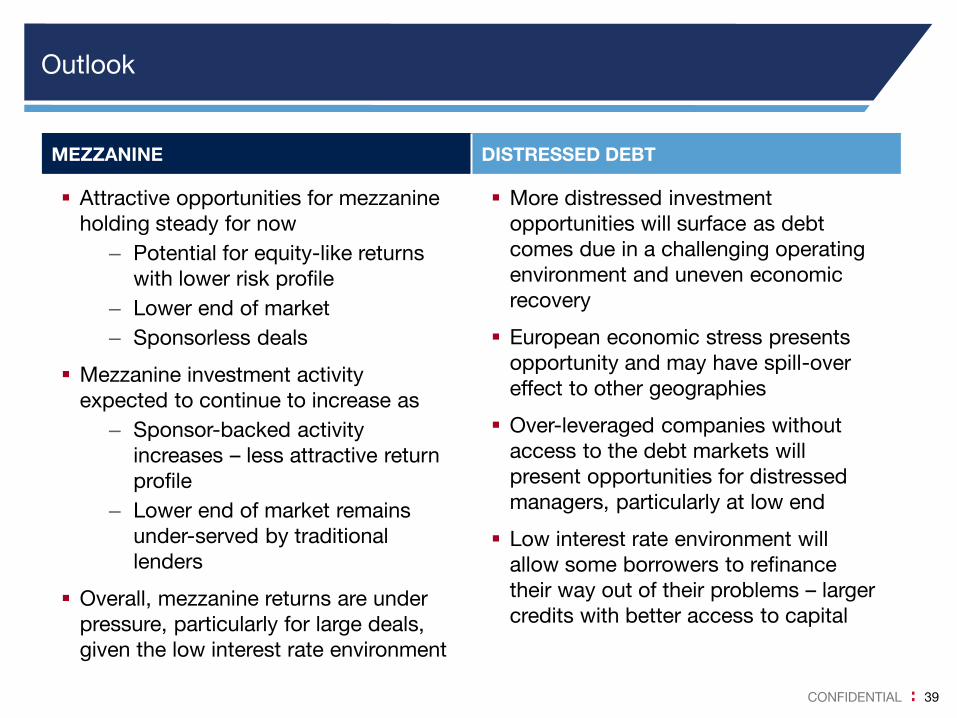
CONFIDENTIAL 39
Outlook
MEZZANINE DISTRESSED DEBT
Attractive opportunities for mezzanine
holding steady for now
– Potential for equity-like returns
with lower risk profile
– Lower end of market
– Sponsorless deals
Mezzanine investment activity
expected to continue to increase as
– Sponsor-backed activity
increases – less attractive return
profile
– Lower end of market remains
under-served by traditional
lenders
Overall, mezzanine returns are under
pressure, particularly for large deals,
given the low interest rate environment
More distressed investment
opportunities will surface as debt
comes due in a challenging operating
environment and uneven economic
recovery
European economic stress presents
opportunity and may have spill-over
effect to other geographies
Over-leveraged companies without
access to the debt markets will
present opportunities for distressed
managers, particularly at low end
Low interest rate environment will
allow some borrowers to refinance
their way out of their problems – larger
credits with better access to capital

Dover Street Investment Program

CONFIDENTIAL 41
HarbourVest Secondary Strategy
Seek to Generate
Top Quartile Returns
With Strong
Downside Protection
Focus on less efficient market subsets
Seek to generate outperformance through identifying hidden value,
transaction structuring, and pricing discipline
Diversify by geography, stage, industry, vintage year, and type,
which limits downside risk relative to more concentrated strategies
Capitalize On
Experience
Employ 25 years of experience providing sellers with innovative and timely
liquidity solutions
Lead, co-lead, or sole investor in 361 of 377 transactions completed since
inception
12 senior team members with average tenure of more than 11 years
Leverage
HarbourVest
Platform
Leverage relationships with general partners and limited partners to
generate proprietary deal flow and information advantage
Team of 24 dedicated professionals complemented by an additional
50 investment professionals
Potential source of primary and co-investment capital makes HarbourVest
an attractive partner
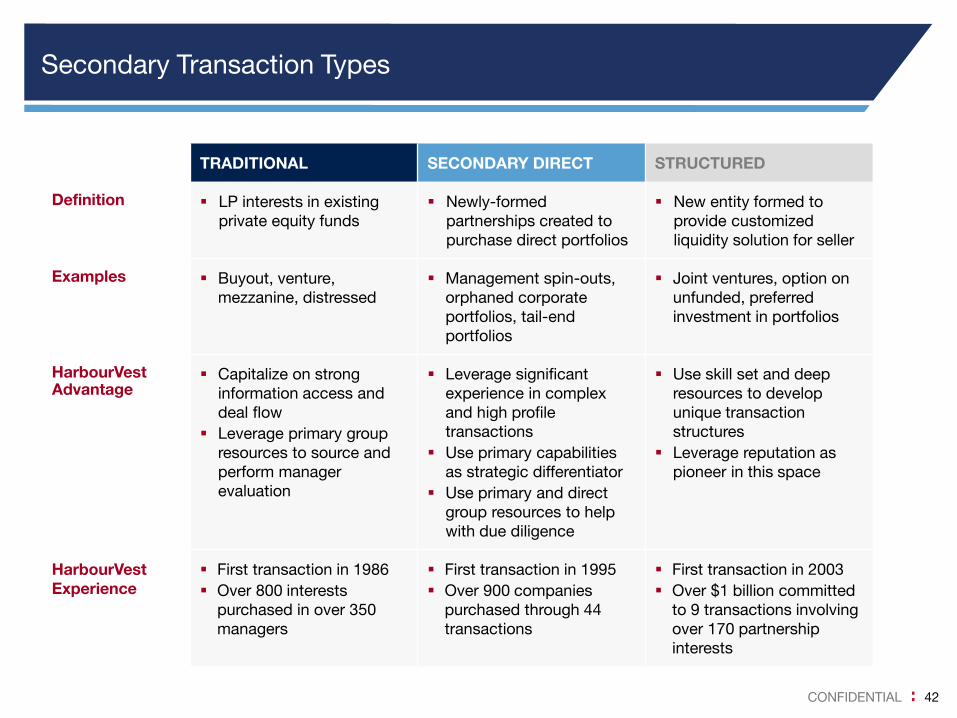
CONFIDENTIAL 42
TRADITIONAL SECONDARY DIRECT STRUCTURED
Definition LP interests in existing
private equity funds
Newly-formed
partnerships created to
purchase direct portfolios
New entity formed to
provide customized
liquidity solution for seller
Examples Buyout, venture,
mezzanine, distressed
Management spin-outs,
orphaned corporate
portfolios, tail-end
portfolios
Joint ventures, option on
unfunded, preferred
investment in portfolios
HarbourVest Advantage
Capitalize on strong
information access and
deal flow
Leverage primary group
resources to source and
perform manager
evaluation
Leverage significant
experience in complex
and high profile
transactions
Use primary capabilities
as strategic differentiator
Use primary and direct
group resources to help
with due diligence
Use skill set and deep
resources to develop
unique transaction
structures
Leverage reputation as
pioneer in this space
HarbourVest
Experience
First transaction in 1986
Over 800 interests
purchased in over 350
managers
First transaction in 1995
Over 900 companies
purchased through 44
transactions
First transaction in 2003
Over $1 billion committed
to 9 transactions involving
over 170 partnership
interests
Secondary Transaction Types

CONFIDENTIAL 43
Dover Street Program Performance Summary
* As of March 31, 2012. Reflects all secondary investments including those made by the Dover Street Program and by HarbourVest's comingled fund-of-
funds. This performance is presented on a gross basis. It reflects the fees, expenses, and carried interest of the underlying partnership investments,
but does not reflect management fees, carried interest, and other expenses borne by investors in the HarbourVest Funds, which will reduce
returns. See Note 2 for additional information.
Past performance is no guarantee of future returns.
See Note 8 for Public Market Comparison explanation
See final pages for additional notes
AS OF MARCH 31, 2012
$9.1 billion committed to secondary investments since 1986
Aggregate gross IRR for all secondary investments of 22.6%*
Dover Ia Dover Ib Dover II Dover III Dover IV Dover V Dover VI Dover VII
Date Formed August 1991 May 1992 August 1994 August 1996 March 1999 May 2002 Sept. 2005 Dec. 2007
Status Liquidated Liquidated Liquidated Liquidating Liquidating Liquidating Developing Investing
Geographic Focus U.S.
Continental
Europe Global Global Global Global Global Global
Performance Summary
($/£ Millions)
Committed Capital $10.1 £10.6 $38.4 $101.0 $213.8 $515.2 $621.2 $2,929.3
Paid-in Capital 10.1 10.6 38.4 101.0 202.0 492.0 557.4 2,460.7
Distributions 23.7 19.5 67.9 227.7 280.0 650.0 249.2 416.9
Total Value 23.7 19.5 67.9 229.7 299.3 806.5 731.7 3,443.6
Distributions/Contributed 2.3x 1.8x 1.8x 2.3x 1.4x 1.3x 0.4x 0.2x
Total Value/Contributed 2.3x 1.8x 1.8x 2.3x 1.5x 1.6x 1.3x 1.4x
Net L.P. IRR 31.5% 19.0% 24.0% 31.6% 8.5% 19.9% 5.9% 20.1%
Public Market Comparison8
MSCI AC World 10.6% N/A 12.8% 9.1% 2.1% 7.8% -1.7% 4.7%
S&P 500 11.8% N/A 22.2% 13.3% 0.3% 5.4% -0.1% 10.1%
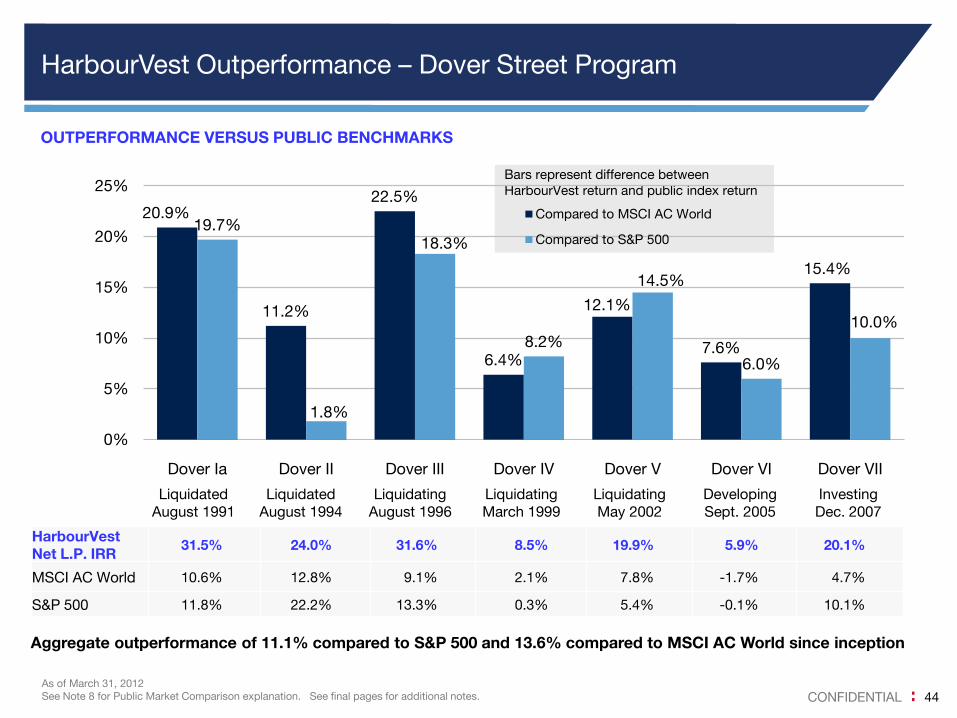
CONFIDENTIAL 44
Bars represent difference between
HarbourVest return and public index return
HarbourVest Outperformance – Dover Street Program
As of March 31, 2012
See Note 8 for Public Market Comparison explanation. See final pages for additional notes.
OUTPERFORMANCE VERSUS PUBLIC BENCHMARKS
HarbourVest
Net L.P. IRR 31.5% 24.0% 31.6% 8.5% 19.9% 5.9% 20.1%
MSCI AC World 10.6% 12.8% 9.1% 2.1% 7.8% -1.7% 4.7%
S&P 500 11.8% 22.2% 13.3% 0.3% 5.4% -0.1% 10.1%
Liquidated Liquidated Liquidating Liquidating Liquidating Developing Investing
August 1991 August 1994 August 1996 March 1999 May 2002 Sept. 2005 Dec. 2007
Aggregate outperformance of 11.1% compared to S&P 500 and 13.6% compared to MSCI AC World since inception
20.9%
11.2%
22.5%
6.4%
12.1%
7.6%
15.4%
19.7%
1.8%
18.3%
8.2%
14.5%
6.0%
10.0%
0%
5%
10%
15%
20%
25%
Dover Ia Dover II Dover III Dover IV Dover V Dover VI Dover VII
Compared to MSCI AC World
Compared to S&P 500

CONFIDENTIAL 45
Dover Street VIII Opportunity
* Source: UBS Private Placement Group
Motivated Sellers Financial institutions under unprecedented pressure to divest private
equity assets
– Volcker Rule, Basel III, Solvency II
Pension funds overallocated versus targets
Investors with too many GP relationships
Buyers Have Less
Capital
Net decrease of $19 billion* in secondary capital available for deals over
2010 and 2011, driven by:
– Record secondary transaction volume
– Challenging fundraising environment
Pricing Assets available at attractive discounts to net asset value
Purchase prices range from 58-86% of most recent NAVs for HarbourVest
deals completed YTD 2012
Some sellers willing to accept deferred purchase prices
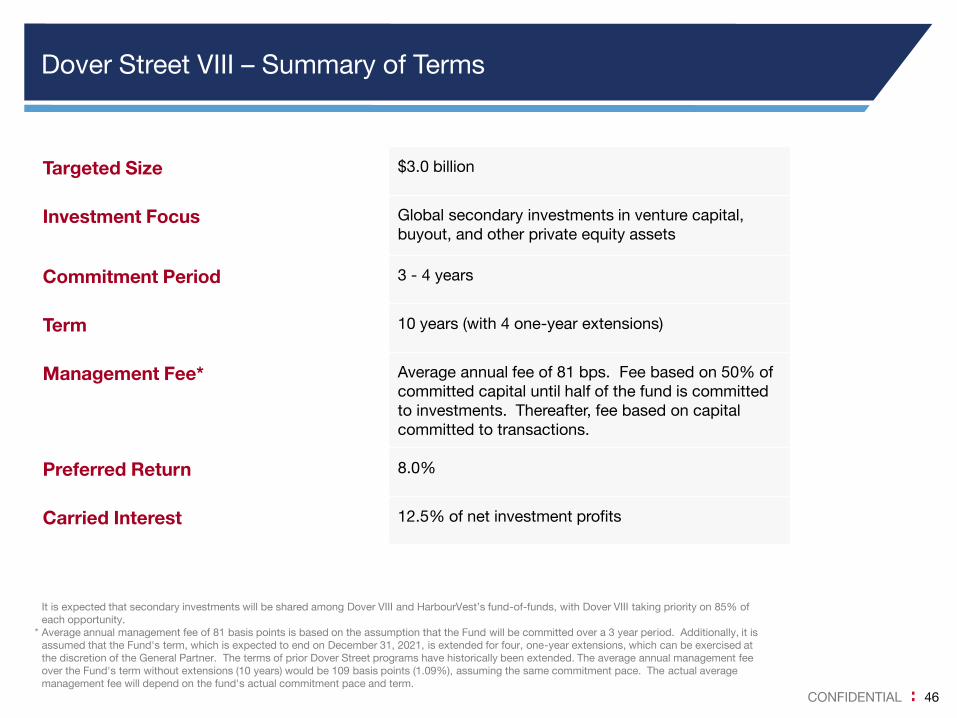
CONFIDENTIAL 46
Dover Street VIII – Summary of Terms
It is expected that secondary investments will be shared among Dover VIII and HarbourVest’s fund-of-funds, with Dover VIII taking priority on 85% of
each opportunity.
* Average annual management fee of 81 basis points is based on the assumption that the Fund will be committed over a 3 year period. Additionally, it is
assumed that the Fund's term, which is expected to end on December 31, 2021, is extended for four, one-year extensions, which can be exercised at
the discretion of the General Partner. The terms of prior Dover Street programs have historically been extended. The average annual management fee
over the Fund's term without extensions (10 years) would be 109 basis points (1.09%), assuming the same commitment pace. The actual average
management fee will depend on the fund's actual commitment pace and term.
Targeted Size $3.0 billion
Investment Focus Global secondary investments in venture capital,
buyout, and other private equity assets
Commitment Period 3 - 4 years
Term 10 years (with 4 one-year extensions)
Management Fee* Average annual fee of 81 bps. Fee based on 50% of
committed capital until half of the fund is committed
to investments. Thereafter, fee based on capital
committed to transactions.
Preferred Return 8.0%
Carried Interest 12.5% of net investment profits

CONFIDENTIAL 47 As of August 23, 2012. Includes employees of HarbourVest Partners, LLC, HarbourVest Partners (U.K.) Limited, HarbourVest Partners (Asia) Limited,
and HarbourVest Partners (Japan) Limited
PRIMARY PARTNERSHIPS SECONDARY INVESTMENTS DIRECT INVESTMENTS SENIOR MANAGEMENT
George Anson, Managing Director David Atterbury, Managing Director Bill Johnston, Managing Director Brooks Zug, Senior Managing Director
Kathleen Bacon, Managing Director Brett Gordon, Managing Director Peter Lipson, Managing Director FINANCE AND ADMINISTRATION
Tatsuya Kubo ,Managing Director Jeff Keay, Managing Director Ofer Nemirovsky, Managing Dir. Martha Vorlicek, Managing Director COO
John Morris, Managing Director Fred Maynard, Managing Director Alex Rogers, Managing Director Karin Lagerlund, Managing Director CFO
Julie Ocko, Managing Director John Toomey, Managing Director Rob Wadsworth, Managing Director Mary Traer , Managing Director CAO
Sally Shan, Managing Director Peter Wilson, Managing Director Corentin du Roy, Principal Julie Eiermann, Principal, Analytics
Greg Stento, Managing Director Tim Flower, Principal Karim Flitti, Principal Greg Pusch, SVP, CCO
Michael Taylor, Managing Director Valérie Handal, Principal Ian Lane, Principal Monique Austin, VP, U.S. Counsel
Sebastiaan van den Berg, Mng. Dir. Mike Pugatch, Principal Claudio Siniscalco, Principal Nick du Cros, VP, Legal/CO
Scott Voss, Managing Director John Fiato, Vice President Arnold Berner, Vice President Christine Horan, VP, CO
Carolina Espinal, Principal Edward Holdsworth, Vice President Craig MacDonald, Vice President John Nelson, VP, Fund Controller
Mark Nydam, Principal Rajesh Senapati, Vice President Tiffany Obenchain, Vice President Sandra Pasquale, VP, Asst. Treasurer
Amanda Outerbridge, Principal Dominic Goh, Senior Associate David Zug, Vice President Bruce Pixler, VP, Director of Tax
Chris Walker, Principal Barbara Quandt, Senior Associate Ryan Jones, Sr.Portfolio Associate Jack Wagner, VP, Treasurer
Francisco Arboleda, Vice President Matt Souza, Sr Portfolio Associate Matthew Cheng, Associate ACCOUNTING, 39 Professionals
Alex Barker, Vice President Stephen Campfield, Associate Julien Lajoie-Deschamps, Analyst TREASURY, 11 Professionals
Till Burges, Vice President Anthony Ciepiel, Associate Laura Swearingen, Associate IT, 17 Professionals
Mac Grayson, Vice President Thomas Joly, Associate Daniel Webb, Associate HR, 6 Professionals
Ryan Gunther, Vice President Roy Kim, Associate Don Zhang, Associate ANALYTICS, 25 Professionals
Haide Lui, Vice President Justin Lane, Associate CLIENT RELATIONS TAXATION, 15 Professionals
Kelvin Yap, Vice President Tom Liu, Associate Laura Thaxter, Principal TRADING, 1 Professional
Minjun Chung, Senior Associate Maria Lohner, Associate Alexandre Covello, Principal 31 ADMIN PROFESSIONALS
Shumin Gong, Senior Associate Alastair Seaman, Associate Aris Hatch, Principal HVPE and HSLE
Christine Patrinos, Senior Associate Pierre Tarantelli, Associate Simon Lund, Principal Stuart Howard, Principal
Stephen Tamburelli, Senior Associate Hannah Tobin, Principal Billy Macaulay, Sr. Portfolio Associate
Alex Wolf, Senior Associate Nate Bishop, Vice President
Julie Bernodat, Analyst Maggie Chan, Vice President SENIOR ADVISORS
Lauren Moffatt, Associate Brian Chiappinelli, Vice President John Begg
Saket Puri, Associate Wladimir Ortega, Vice President Philip Bilden
Eric Simas, Associate Nhora Otálora, Senior Associate Kevin Delbridge
Alice Song, Analyst 17 Professionals Ed Kane
CONFIDENTIAL 47
Strong Global Team

CONFIDENTIAL 48
Contact Information
BOSTON
HarbourVest Partners, LLC
+1 617 348 3707
LONDON
HarbourVest Partners (U.K.) Limited
+44 (0)20 7399 9820
HONG KONG
HarbourVest Partners (Asia) Limited
+852 2525 2214
TOKYO
HarbourVest Partners (Japan) Limited
+81 3 3284 4320
BOGOTÁ
HarbourVest Partners, LLC
Oficina de Representación
+57 1 658 5848
BEIJING
HarbourVest Investment Consulting
(Beijing) Company Limited
+86 10 5706 8600
www.harbourvest.com

CONFIDENTIAL 49
Additional Information
On January 29, 1997, the management team of Hancock Venture Partners, Inc. (HVP Inc.) formed a new management company known as HarbourVest Partners, LLC (HarbourVest). Concurrently with the formation of HarbourVest, all of the employees of HVP Inc. became owners and/or employees of HarbourVest. In addition, concurrently with the formation of HarbourVest, HVP Inc. engaged HarbourVest as sub-manager to carry out the terms of its management agreements with the partnerships formed when the management team was employed by HVP Inc. Other than the sub-management agreement, no relationship exists between HarbourVest and HVP Inc. For purposes of this presentation, historical data includes both partnerships managed directly by HarbourVest and its affiliates and partnerships currently managed by HarbourVest as sub-manager to HVP Inc. In addition, historical data includes periods when the partnerships were managed by the management team of HarbourVest when they were employees of HVP Inc.
In considering the prior performance information contained herein, prospective investors should bear in mind that past performance is not necessarily indicative of future results, and there can be no assurance that the Fund will achieve comparable results or be able to implement its investment strategy.
The foregoing performance information includes realized and unrealized investments. Unrealized investments are valued by the applicable general partner in accordance with the valuation guidelines contained in the applicable partnership agreement. Actual realized returns on unrealized investments will depend on, among other factors, future operating results, the value of the assets and market conditions at the time of disposition, any related transaction costs and the timing and manner of sale, all of which may differ from the assumptions on which the valuations used in prior performance data contained herein are based. Accordingly, the actual realized returns on these unrealized investments may differ materially from returns indicated herein.
1. Net L.P. Internal Rate of Return through the applicable date is the annualized return to limited partners after all fees, operating expenses and carried interest calculated using actual cash flows to and from limited partners. In this calculation, the final cash flow to limited partners is the fair market value of the limited partners’ capital accounts at the applicable date as determined by the General Partner in accordance with the valuation policies in the applicable Partnership Agreement.
2. Gross Portfolio IRR represents the annual return calculated using monthly cash flows from the funds managed by HarbourVest to and from the various partnerships in which the HarbourVest funds invested during the period specified, after the fees, expenses, and carried interest of the underlying partnership investments, but before the fees, expenses, and carried interest charged the HarbourVest Funds. HarbourVest vintage classification is based on year in which capital was first funded to each underlying fund (for primary fund investments) or the year of HarbourVest’s purchase (for secondary investments).
For the purposes of comparing HarbourVest’s gross return on European partnership investments to private equity benchmarks on a like basis, IRRs for European investments were calculated by converting U.S. $ denominated cash flows to euro at historic daily exchange rates. The euro-based IRR is a hypothetical return since certain of the partnership investments were denominated in currencies other than the euro. The IRR calculated based on U.S. $ cash flows is 17.2%. Non-U.S. / non-European partnership investments are not included because no relevant private equity benchmarks exist. If all non-U.S. partnership investments were included, the HarbourVest Portfolio return would be 14.7% in U.S. dollars. These returns do not represent the returns to limited partners or the aggregate returns of any specific fund.
3. A direct comparison of private equity returns with public index total returns may not be meaningful because the returns presented for venture capital and buyout funds are IRRs (dollar-weighted), while the public index returns are geometric mean returns (time-weighted). Specifically, dollar-weighted returns are affected by the time value of money by application of a discount rate (the IRR), while time-weighted returns are simply the geometric mean of various holding period returns.
4. Europe Composite Criteria: Includes all European partnership investments (primary and secondary) made by HarbourVest and/or by HVP Inc. through HIPEP I, II, III, IV, and V, their companion funds, Global Select, and Dover II, III, IV, V, and VI for the period specified. Investments made after 2006 are not included because they are still actively investing and performance is generally not meaningful during a partnership’s early development. If the performance of investments made after 2006 was included, the HarbourVest Portfolio gross IRR would be lower.
U.S. Composite Criteria: Includes all U.S. partnership investments (primary and secondary) made by HarbourVest and/or by HVP Inc. through Fund III, IV, V, VI, VII, and VIII, their companion funds, and Dover Ia, II, III, IV, V, and VI for the period specified. Investments made after 2006 are not included because they are still actively investing and performance is generally not meaningful during a partnership’s early development. If the performance of investments made after 2006 was included, the HarbourVest Portfolio gross IRR would be higher.
5. Vintage years 1992-2006: The ThomsonReuters Database is comprised of 1,342 U.S. private equity partnerships. The HarbourVest portfolio is comprised of 414 U.S. partnerships.
6. Vintage years 1992-2006: The ThomsonReuters Database is comprised of 998 European partnerships. The HarbourVest portfolio is comprised of 222 European partnerships.
Continued on next page.

CONFIDENTIAL 50
Additional Information
7. Net Portfolio IRR represents the annualized return calculated using monthly cash flows from the fund managed by HarbourVest to and from the various partnerships or companies in which the HarbourVest fund invested after all fees, expenses, and carried interest of the HarbourVest fund and any partnerships investments. The fees and expenses of the HarbourVest fund reflect a pro-rata share of the fund's actual fees and expenses, based on the amount that was committed to partnership or direct investments. The direct Net Portfolio IRR reflects deduction of the actual carried interest of the direct investments. The Net Portfolio IRR does not reflect the actual cash flow experience of limited partners; it does not represent the actual net performance of any specific fund or the return to limited partners of such fund. It should be noted that these funds called capital in set increments and/or on set schedules, which was industry standard at the time, and therefore held more cash than is customary today, creating a drag on the Net L.P. IRR.
8. Public market comparison represents performance if the respective index had been purchased and sold at the time of the limited partners’ capital calls and distributions, with the remainder held at the date noted. Dividends are not reinvested.
9. The Net L.P. IRRs of HarbourVest’s prior secondary funds as of March 31, 2012 (or their date of liquidation) are: Dover Ia 31.5%, Dover Ib 19.0%, Dover II 24.0%, Dover III 31.6%, Dover IV 8.5%, Dover V 19.9%, Dover VI 5.9%, and Dover VII 20.1% (this fund was formed in 2007 and the performance may not yet be meaningful). The Net L.P. IRRs of HarbourVest’s prior direct funds as of March 31, 2012 are as follows: 2004 Direct Fund 11.7%, 2007 Direct Fund 8.0%, Fund IV Direct 5.6%, Fund V Direct -3.4%, Fund VI Direct -0.9%, HIPEP II Direct 19.8%, HIPEP III Direct -5.3%, HIPEP IV Direct 13.7%, HIPEP V Direct 2.2%.
The information contained herein is highly confidential and is being provided to you at your request for informational purposes only and is not, and may not be relied on in any manner as, legal, tax or investment advice or as an offer to sell or a solicitation of an offer to buy an interest in any investment sponsored by HarbourVest Partners L.P. or it’s affiliates (the “Fund”). A private offering of interests in the Fund will only be made pursuant to a confidential private placement memorandum (the “Memorandum”) and the Fund’s partnership agreement and subscription documents, which will be furnished to qualified investors on a confidential basis at their request for their consideration in connection with such offering. The information contained herein will be superseded by, and is qualified in its entirety by reference to, the Memorandum, which will contain information about the investment objective, terms and conditions of an investment in the Fund and will also contain tax information and risk disclosures that are important to any investment decision regarding the Fund. No person has been authorized to make any statement concerning the Fund other than as will be set forth in the Memorandum and any such statements, if made, may not be relied upon. The information contained herein must be kept strictly confidential and may not be reproduced or redistributed in any format without the express written approval of HarbourVest Partners L.P. (together with its affiliates, “HarbourVest”).
Investment in the Fund will involve significant risks, including loss of the entire investment. Before deciding to invest in the Fund, prospective investors should pay particular attention to the risk factors contained in the Memorandum. Prospective investors should make their own investigations and evaluations of the information contained herein. Prior to the closing of a private offering of interests in the Fund, HarbourVest will give investors the opportunity to ask questions and receive additional information concerning the terms and conditions of such offering and other relevant matters. Each prospective investor should consult its own attorney, business advisor and tax advisor as to legal, business, tax and related matters concerning the information contained herein and such offering.
Certain information contained herein (including financial information and information relating to investments) has been obtained from published and non-published sources. Such information has not been independently verified by HarbourVest. Except where otherwise indicated herein, the information provided herein is based on matters as they exist as of the date of preparation and not as of any future date, and will not be updated or otherwise revised to reflect information that subsequently becomes available, or circumstances existing or changes occurring after the date hereof.
In considering any performance data contained herein, you should bear in mind that past performance is not indicative of future results. Certain information contained herein constitutes forward-looking statements, which can be identified by the use of terms such as “may”, “will”, “should”, “expect”, “anticipate”, “project”, “estimate”, “intend”, “continue” or “believe” (or the negatives thereof) or other variations thereof. Due to various risks and uncertainties, including those discussed above, actual events or results or actual performance of the Fund may differ materially from those reflected or contemplated in such forward-looking statements. As a result, investors should not rely on such forward-looking statements in making their investment decisions.
None of the information contained herein has been filed with the Securities and Exchange Commission, any securities administrator under any state securities laws or any other governmental or self-regulatory authority. No governmental authority has passed on the merits of the offering of interests in the Fund or the adequacy of the information contained herein. Any representation to the contrary is unlawful.

CONFIDENTIAL 51
Additional Information
Note A: The June 2007 issue of Private Equity International included the results of an annual survey on general partner attitudes to their LPs. Findings were based on investor relations and fundraising professionals at leading private equity firms globally.
Note B: The Global Private Equity Awards, sponsored by Private Equity International magazine and PrivateEquityOnline.com, is based on a one reader, one vote per category basis. There are no predetermined shortlists nor is there a panel of judges to influence votes; the person or firm with the greatest number of votes wins. The Editor’s Choice Award is chosen by the editors.
Note C: A Guide to Private Equity Fund of Funds Managers report included rankings voted on by limited partners who invest in funds of funds. Findings were based on phone interviews with senior executives representing 47 private equity fund of funds managers, as well as on the results of an online survey undertaken by 121 existing and potential limited partners and 41 private equity placement agents worldwide. Published by Private
Equity International, May 2005.
Note D: The Awards for Investment Excellence sponsored by Global Investor were determined by pension funds that voted on the best performing asset managers across a spectrum of asset classes. From the votes, Global Investor then developed a shortlist of asset managers, who were contacted to write a submission form. Judges evaluated the firms and determined winners based on number of votes, submission form, and other data including fund performance and asset gathering. HarbourVest was not required to pay any fees in connection with its submission.
Note E: The Private Equity Analyst Private Equity Hall of Fame was established in 1994 to honour individuals and organizations that made exemplary and enduring contributions to the private equity community. Considerations also include the creation, expansion, or reinvigoration of private companies. A Selection Committee chooses additional candidates for the Private Equity Hall of Fame annually. The Committee is organized by the editors of the Private Equity Analyst
Note F: The Private Equity Awards are presented by The British Private Equity and Venture Capital Association (BVCA) and Real Deals annually to recognize achievements in venture capital and private equity. The London Business School Private Equity Institute compiled the shortlists for each category based on submissions from private equity houses and professional advisers, and interviews were conducted with shortlisted candidates. The candidates were reviewed by the panel of judges at a session chaired by Real Deals and the London Business School.
TOWN OF GREENWICH CONNECTICUT
COMPREHENSIVE ANNUAL FINANCIAL REPORT
For the Fiscal Year July 1, 2011 – June 30, 2012
Greenwich
Greenwich Coat-of-Arms adopted by the Representative Town Meeting in 1940

TOWN OF GREENWICH, CONNECTICUT
COMPREHENSIVE ANNUAL FINANCIAL REPORT
FOR
THE FISCAL YEAR ENDED JUNE 30, 2012
Prepared By:
THE FINANCE DEPARTMENT
PETER P. MYNARSKI, COMPTROLLER

Introductory Section

TOWN OF GREENWICH, CONNECTICUT COMPREHENSIVE ANNUAL FINANCIAL REPORT TABLE OF CONTENTS
Page
I. INTRODUCTORY SECTION Letter of Transmittal .......................................................................................................... i-iii GFOA Certificate of Achievement ..................................................................................... iv Principal Town Officials ..................................................................................................... v Organization Chart ............................................................................................................ vi
II. FINANCIAL SECTION Independent Auditor’s Report ........................................................................................... 1-2 Management’s Discussion and Analysis ........................................................................... 3-10 BASIC FINANCIAL STATEMENTS
Exhibit
Government-Wide Financial Statements:
I. Statement of Net Assets ............................................................................... 11 II. Statement of Activities .................................................................................. 12
Fund Financial Statements:
III. Balance Sheet – Governmental Funds ......................................................... 13-14 IV. Statement of Revenues, Expenditures and Changes in Fund Balances
(Deficits) - Governmental Funds ................................................................ 15-16 V. Statement of Net Assets – Proprietary Funds .............................................. 17 VI. Statement of Revenues, Expenses and Changes in Fund Net Assets –
Proprietary Funds ....................................................................................... 18 VII. Statement of Cash Flows – Proprietary Funds ............................................. 19 VIII. Statement of Fiduciary Net Assets – Fiduciary Funds ................................. 20 IX. Statement of Changes in Fiduciary Net Assets – Fiduciary Funds .............. 21 Notes to Financial Statements ............................................................................... 22-52
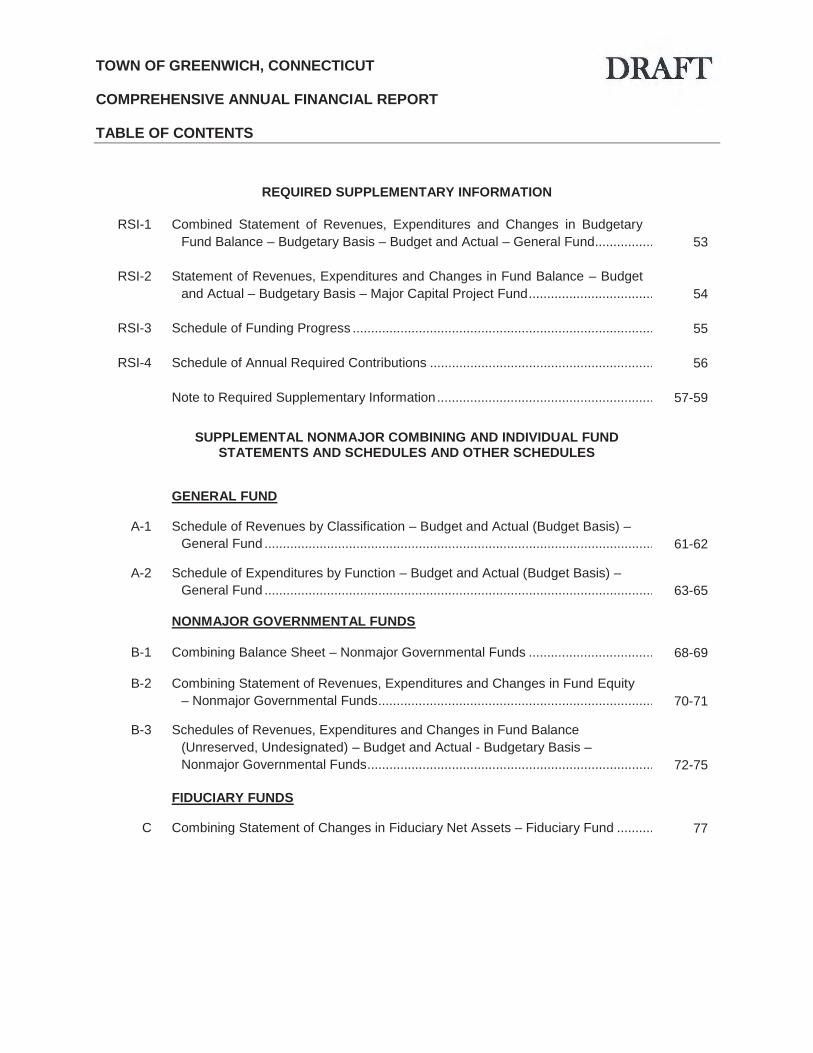
TOWN OF GREENWICH, CONNECTICUT COMPREHENSIVE ANNUAL FINANCIAL REPORT TABLE OF CONTENTS
REQUIRED SUPPLEMENTARY INFORMATION
RSI-1 Combined Statement of Revenues, Expenditures and Changes in Budgetary
Fund Balance – Budgetary Basis – Budget and Actual – General Fund................ 53
RSI-2 Statement of Revenues, Expenditures and Changes in Fund Balance – Budget and Actual – Budgetary Basis – Major Capital Project Fund .................................. 54
RSI-3 Schedule of Funding Progress .................................................................................. 55
RSI-4 Schedule of Annual Required Contributions ............................................................. 56
Note to Required Supplementary Information ........................................................... 57-59
SUPPLEMENTAL NONMAJOR COMBINING AND INDIVIDUAL FUND STATEMENTS AND SCHEDULES AND OTHER SCHEDULES
GENERAL FUND
A-1 Schedule of Revenues by Classification – Budget and Actual (Budget Basis) – General Fund .......................................................................................................... 61-62
A-2 Schedule of Expenditures by Function – Budget and Actual (Budget Basis) –
General Fund .......................................................................................................... 63-65 NONMAJOR GOVERNMENTAL FUNDS
B-1 Combining Balance Sheet – Nonmajor Governmental Funds .................................. 68-69
B-2 Combining Statement of Revenues, Expenditures and Changes in Fund Equity – Nonmajor Governmental Funds........................................................................... 70-71
B-3 Schedules of Revenues, Expenditures and Changes in Fund Balance
(Unreserved, Undesignated) – Budget and Actual - Budgetary Basis – Nonmajor Governmental Funds .............................................................................. 72-75
FIDUCIARY FUNDS
C Combining Statement of Changes in Fiduciary Net Assets – Fiduciary Fund .......... 77
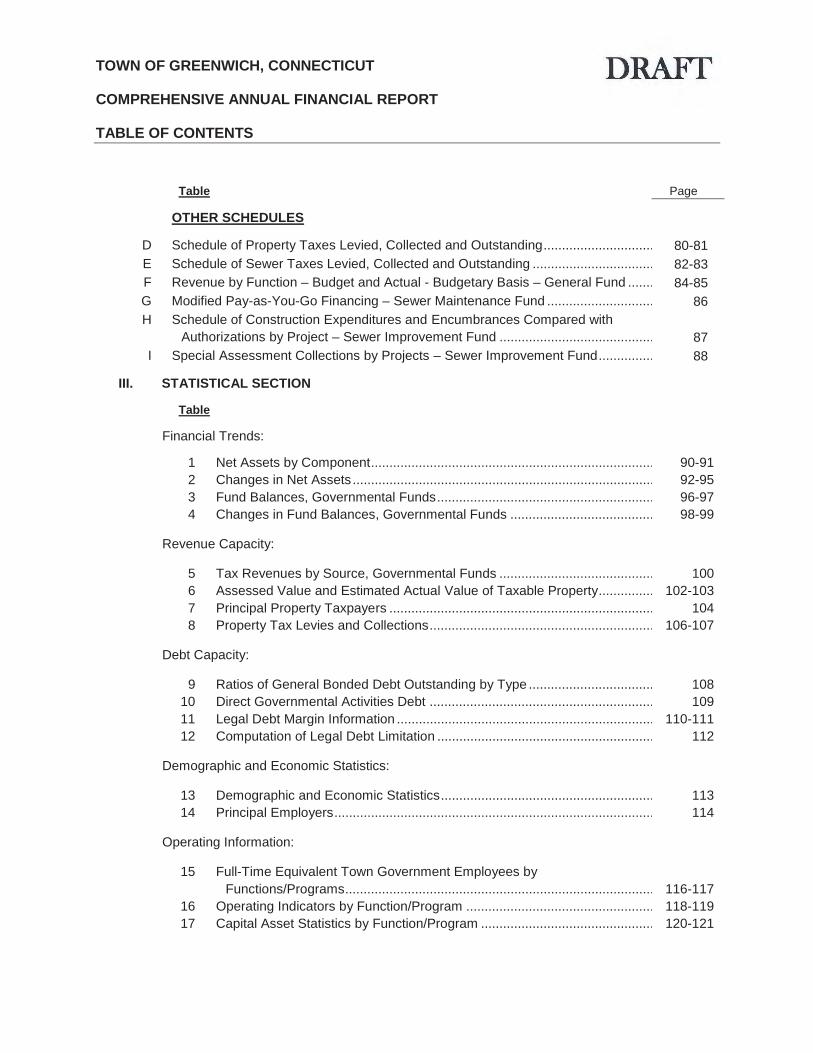
TOWN OF GREENWICH, CONNECTICUT COMPREHENSIVE ANNUAL FINANCIAL REPORT TABLE OF CONTENTS
Table Page
OTHER SCHEDULES
D Schedule of Property Taxes Levied, Collected and Outstanding .............................. 80-81 E Schedule of Sewer Taxes Levied, Collected and Outstanding ................................. 82-83 F Revenue by Function – Budget and Actual - Budgetary Basis – General Fund ....... 84-85 G Modified Pay-as-You-Go Financing – Sewer Maintenance Fund ............................. 86 H Schedule of Construction Expenditures and Encumbrances Compared with
Authorizations by Project – Sewer Improvement Fund .......................................... 87 I Special Assessment Collections by Projects – Sewer Improvement Fund ............... 88
III. STATISTICAL SECTION
Table
Financial Trends:
1 Net Assets by Component ............................................................................. 90-91 2 Changes in Net Assets .................................................................................. 92-95 3 Fund Balances, Governmental Funds ........................................................... 96-97 4 Changes in Fund Balances, Governmental Funds ....................................... 98-99 Revenue Capacity: 5 Tax Revenues by Source, Governmental Funds .......................................... 100 6 Assessed Value and Estimated Actual Value of Taxable Property ............... 102-103 7 Principal Property Taxpayers ........................................................................ 104 8 Property Tax Levies and Collections ............................................................. 106-107 Debt Capacity: 9 Ratios of General Bonded Debt Outstanding by Type .................................. 108 10 Direct Governmental Activities Debt ............................................................. 109 11 Legal Debt Margin Information ...................................................................... 110-111 12 Computation of Legal Debt Limitation ........................................................... 112 Demographic and Economic Statistics: 13 Demographic and Economic Statistics .......................................................... 113 14 Principal Employers ....................................................................................... 114 Operating Information:
15 Full-Time Equivalent Town Government Employees by
Functions/Programs .................................................................................... 116-117 16 Operating Indicators by Function/Program ................................................... 118-119 17 Capital Asset Statistics by Function/Program ............................................... 120-121
i
December ___, 2012
Board of Estimate and Taxation Town Of Greenwich Greenwich, CT 06830 State law requires that every general-purpose local government publish within six months of the close of each fiscal year a complete set of audited financial statements. This report is published to fulfill that requirement for the fiscal year ended June 30, 2012. Management assumes full responsibility for the completeness and reliability of the information contained in this report, based upon a comprehensive framework of internal control that it has established for this purpose. Because the cost of internal control should not exceed anticipated benefits, the objective is to provide reasonable, rather than absolute, assurance that the financial statements are free of any material misstatements. McGladrey LLP, Certified Public Accountants, have issued an unqualified (“clean”) opinion on the Town of Greenwich, Connecticut’s financial statements for the year ended June 30, 2012. The independent auditors’ report is located at the front of the financial section of this report. Management’s discussion and analysis (MD&A) immediately follows the independent auditors’ report and provides a narrative introduction, overview and analysis of the basic financial statements. MD&A complements this letter of transmittal and should be read in conjunction with it. Profile of the Town of Greenwich The Town of Greenwich was settled in July 1640 and is governed by the laws of the State of Connecticut and its own Charter. The Charter provides for a First Selectman, Board of Selectmen, Board of Estimate and Taxation (BET) and Representative Town Meeting (RTM) form of government. The RTM acts as the legislative unit while the BET is responsible for the proper administration of the financial affairs of the Town. There are 230 members of the RTM and 12 members of the BET. They are elected biennially by the voters, along with the First Selectman and Board of Selectmen. Today, the Town government can be characterized as a decentralized system of overlapping powers and responsibilities. It is also largely volunteer. Except for the First Selectman, Board of Selectmen and a few others (such as the members of the Board of Assessment Appeals), all members of the boards and commissions serve without pay. The Town of Greenwich is a residential community located in the southwestern corner of Fairfield County, Connecticut, adjacent to and west of the City of Stamford, Connecticut. The Town is also bounded by Long Island Sound on the south and New York State on the west and north. It is the nearest Connecticut town to New York City (28 miles) and is located on the main line of the Metro North Railroad. The Merritt Parkway (Route 15) and the New England Turnpike (Interstate Route 95) bring all Southern New England within easy driving distance. The Town encompasses 50.6 square miles and has a population of 61,171 as of the 2010 census.
ii
The Town provides a full range of municipal services, including general administration, education, public safety, public works (building maintenance, highways, waste disposal, engineering), parks and recreation (parks, beaches, golf course, civic centers), health (clinics, laboratory, residential patient care), social services, planning and zoning, and libraries. The annual budget serves as the foundation for the Town’s financial planning and control. All agencies of the Town are required to submit requests for appropriation to the BET Budget Committee, who, in turn, submit the recommended portion to the full BET. After public hearings, the budget is submitted to the RTM for approval in mid May. The adopted budget is in effect on July 1st. The appropriated budget is prepared by fund, function (e.g., public safety) and department (e.g., police). The BET and RTM meet often to review subsequent appropriations (those under $5,000 can be authorized by the BET; those over $5,000 must also be approved by resolution of the RTM except for labor contacts which are approved for financing by the RTM). Department heads may request transfers of appropriations within a department. Transfers of appropriations within departments of more than $5,000, however, require the special approval of the BET. Management can approve transfers of up to $5,000 but cannot add to the budget. Factors Affecting Financial Condition The information presented in the financial statements is perhaps best understood when it is considered from the broader perspective of the specific environment within which the Town operates. Local Economy The Town’s economic condition draws strength and stability from its recognition as a community in lower Fairfield County with high per capita income and housing values. The tax base is primarily residential with a number of commercial office buildings, including several corporate headquarters. The unemployment rate during the fiscal year for the Town was 5.9% in June, 2012 and 6.4% in 2011, while the statewide unemployment rate was 8.4% in June, 2012 and 9.1% in 2011. Property taxes comprise 89.0% of the Town’s General Fund revenues collected, and the property tax collection rate remains strong at 99.3%. General Fund intergovernmental revenues of $9.7 million represent 2.8% of General Fund revenues. $15,002,547 of The Nathaniel Witherell Nursing Home intergovernmental revenues are reported in a Nonmajor Governmental Fund. The Town’s Grand List, which is the highest in the State, contains the values of all taxable property (both real and personal), as well as the tax-exempt and non-taxable properties in the Town. The Grand List as of October 1, 2011 was $30,687,336,735, an increase of $312,121,558 or 2.75% from the previous year’s Grand List. This Grand List is used to bill taxes for fiscal year 2012-13. The Town has continued to exercise fiscal restraint while ensuring the level of quality and service that is considered vital and necessary. Taxpayers insist that services be obtained in the most efficient and economical manner which can include, but is not limited to, entering into public/private partnerships and utilizing other private or public entities both locally and regionally for Town facilities management, services and programs. Containing the size of the Town government is difficult, especially with Federal and State government proposals to push down mandated program responsibility to the local level. Long-term Financial Planning. The BET has a fifteen-year capital projects plan. Estimates are based on departmental projections and are listed in total in the 2012-13 budget. The total of all projects has an estimated cost of $705.6 million. A previously completed assessment of the Town’s infrastructure has turned into a long-term maintenance and replacement strategy, and that strategy has been reduced to specific capital projects and operating budget maintenance activities. The BET expects a continuing substantive dialogue on this subject throughout FY13, including a consideration of standards. Risk Management. The Town’s risk management program provides a safe environment for both employees and members of the public who utilize services and facilities of the Town. Major risks are covered by various insurance carriers, and risks are continually reviewed and insurance coverages are adjusted accordingly. Ongoing efforts are directed at preventing accidents and controlling exposure and financial loss by use of Town safety committees and facilities inspections by outside consultants. In

iii
addition, Risk Management embarked upon an ambitious loss-control program in a conscious effort to reduce risk and the associated costs incurred with claims against the Town. However, the Town is challenged with the ever-increasing costs of healthcare associated with workers’ compensation claims, in addition, the workers’ compensation program is a self-insured program and can be affected by catastrophic claims. Pension and Other Post-Employment Benefits. The Town sponsors a single-employer defined benefit pension plan for its employees. Each year, an independent actuary engaged by the pension plan calculates the amount of the annual contribution that the Town must make to the pension plan to ensure that the plan will be able to fully meet its obligations to retired employees on a timely basis. As a matter of policy, the Town fully funds each year’s annual required contribution to the pension plan as determined by the actuary. As a result of the Town’s conservative funding policy, the Town has succeeded as of June 30, 2012 in funding 100% of the present value of the projected benefits earned by employees. The professional staff of the Board of Education is also eligible for a pension. These benefits are provided through a statewide plan managed by the State Pension Board. The Town has no obligation in connection with teacher’s pensions. The Town also provides post-retirement benefits for certain employees for current and future health and life insurance benefit expenses. The assets that the Town has reserved for these benefits are reported in the Other Post-Employment Benefits Trust Fund. Awards and Acknowledgements The Government Finance Officers Association (GFOA) awarded a Certificate of Achievement for Excellence in Financial Reporting to the Town for its comprehensive annual financial report (CAFR) for the fiscal year ended June 30, 2011. Since the initial award for the Town’s 1960 fiscal year, the Town has received 51 consecutive awards, which represents 100% of the awards offered by the GFOA. In order to be awarded a Certificate of Achievement, the Town published an easily readable and efficiently organized CAFR. This report satisfied both GAAP and applicable legal requirements. A Certificate of Achievement is valid for a period of one year only. We believe that our current CAFR continues to meet the Certificate of Achievement Program’s requirements, and we are submitting it to the GFOA to determine its eligibility for another certificate. Respectfully submitted,
Peter Mynarski, Jr. Comptroller/Finance Officer

iv
Certificate of Achievement
for Excellence in Financial Reporting
Presented to
Town of Greenwich
Connecticut For its Comprehensive Annual
Financial Report
for the Fiscal Y car Ended
June 30, 2011
A Certificate of Achievement for Excellence in Financial Reporting is presented by the Government Finance Officers
Association of the United States and Canada to government units and public employee retirement systems whose comprehensive annual financial
reports (CAFRs) achieve the highest standards in government accounting
and financial reporting.
President
Executive Director
DRAFT
v
TOWN OF GREENWICH, CONNECTICUT
COMPREHENSIVE ANNUAL FINANCIAL REPORT
For the Year Ended June 30, 2012
Prepared By:
Comptroller and Finance Officer
Peter Mynarski, Jr.
Board of Estimate and Taxation
Michael S. Mason, Chairman Arthur D. Norton, Vice-Chairman
Mary Lee A. Kiernan, Clerk Gregory Bedrosian
Robert Brady William R. Finger
Sean Goldrick Randall Huffman
Marc Johnson Joseph L. Pellegrino
Jeffrey S. Ramer Leslie Tarkington

vi
Board of Social Services
Board of Health
Nathaniel Witherell Board
Planning & Zonmg CommiSSion
Inland Wetland Agency
TOWN OF GREENWICH CONNECTICUT ORGANIZATION CHART
Year Ended June 30, 2012
Voters
Finance
Assessor
Tax Collector
Publfc Safety
Public Works
Parlls &
Recreation
Law
Purchasing
Fleet
Human Resources
Information Technology
This chart reflects the pnnc1pal reporting responsibilities of the major functions of the Town. Not all departments, boards,
commissions or elected poslttons are Included.
tJ

Financial Section

INDEPENDENT AUDITOR’S REPORT To the Board of Estimate and Taxation Town of Greenwich, Connecticut We have audited the accompanying financial statements of the governmental activities, the business-type activities, each major fund and the aggregate remaining fund information of the Town of Greenwich, Connecticut, as of and for the year ended June 30, 2012 which collectively comprise the Town of Greenwich, Connecticut’s basic financial statements as listed in the table of contents. These financial statements are the responsibility of the Town’s management. Our responsibility is to express opinions on these financial statements based on our audit. We conducted our audit in accordance with auditing standards generally accepted in the United States of America and the standards applicable to financial audits contained in Government Auditing Standards issued by the Comptroller General of the United States. Those standards require that we plan and perform the audit to obtain reasonable assurance about whether the basic financial statements are free of material misstatement. An audit includes consideration of internal control over financial reporting as a basis for designing audit procedures that are appropriate in the circumstances, but not for the purpose of expressing an opinion on the effectiveness of the Town’s internal control over financial reporting. Accordingly, we express no such opinion. An audit also includes examining, on a test basis, evidence supporting the amounts and disclosures in the financial statements, assessing the accounting principles used and significant estimates made by management, as well as evaluating the overall financial statement presentation. We believe that our audit provides a reasonable basis for our opinions. In our opinion, the financial statements referred to above present fairly, in all material respects, the respective financial position of the governmental activities, the business-type activities, each major fund and the aggregate remaining fund information of the Town of Greenwich, Connecticut, as of June 30, 2012 and the respective changes in financial position and, where applicable, cash flows thereof in conformity with accounting principles generally accepted in the United States of America. In accordance with Government Auditing Standards, we have also issued our report dated _____________, 2012 on our consideration of the Town of Greenwich, Connecticut’s internal control over financial reporting and our tests of its compliance with certain provisions of laws, regulations, contracts and grant agreements and other matters. The purpose of that report is to describe the scope of our testing of internal control over financial reporting and compliance and the results of that testing, and not to provide an opinion on internal control over financial reporting or on compliance. That report is an integral part of an audit performed in accordance with Government Auditing Standards and should be considered in assessing the results of our audit. Accounting principles generally accepted in the United States of America require that the management’s discussion and analysis, and required supplementary information, as listed in the table of contents, be presented to supplement the basic financial statements. Such information, although not a part of the basic financial statements, is required by the Governmental Accounting Standards Board, who considers it to be an essential part of financial reporting for placing the basic financial statements in an appropriate operational, economic, or historical context. We have applied certain limited procedures to the required supplementary information in accordance with auditing standards generally accepted in the United States of America, which consisted of inquiries of management about the methods of preparing the information

2
and comparing the information for consistency with management’s responses to our inquiries, the basic financial statements, and other knowledge we obtained during our audit of the basic financial statements. We do not express an opinion or provide any assurance on the information because the limited procedures do not provide us with sufficient evidence to express an opinion or provide any assurance.
Our audit was conducted for the purpose of forming opinions on the financial statements that collectively comprise the Town of Greenwich, Connecticut’s basic financial statements. The introductory section, supplemental nonmajor combining and individual fund statements and schedules and other schedules, and statistical section are presented for purposes of additional analysis and are not a required part of the basic financial statements. Such information is the responsibility of management and was derived from and relates directly to the underlying accounting and other records used to prepare the basic financial statements. The supplemental nonmajor combining and individual fund statements and schedules and other schedules have been subjected to the auditing procedures applied in the audit of the basic financial statements and certain additional procedures, including comparing and reconciling such information directly to the underlying accounting and other records used to prepare the basic financial statements or to the basic financial statements themselves, and other additional procedures in accordance with auditing standards generally accepted in the United States of America. In our opinion, the supplemental nonmajor combining and individual fund statements and schedules and other schedules are fairly stated in all material respects in relation to the basic financial statements as a whole. The introductory section and statistical section have not been subjected to the auditing procedures applied in the audit of the basic financial statements and, accordingly, we do not express an opinion or provide any assurance on them. New Haven, Connecticut _______________, 2012
3
Town of Greenwich, Connecticut Management’s Discussion and Analysis
June 30, 2012 As management of the Town of Greenwich, Connecticut (the Town), we offer readers of the financial statements this narrative overview and analysis of the financial activities of the Town for the fiscal year ended June 30, 2012. We encourage readers to consider the information presented here along with additional information we have furnished in our letter of transmittal. Financial Highlights
On a government-wide basis, the assets of the Town exceeded its liabilities resulting in net assets at the close of the fiscal year of $439.6 million. Total net assets for governmental activities at fiscal year-end were $431.3 million, and total net assets for business-type activities were $8.3 million. Net assets for business-type activities increased by $0.3 million, while net assets for governmental activities increased by $22.6 million.
On a government-wide basis, during the year, the Town’s net assets increased by $23.0 million from $416.7 million to $439.6 million. Government-wide expenses were $386.0 million, while revenues were $409.0 million.
At the close of the year, the Town’s governmental funds reported, on a current financial resource basis, combined ending fund balances of $22.8 million, a decrease of $1.6 million from the prior fiscal year’s fund balances.
At the end of the prior fiscal year 2011, the fund balance for the General Fund was $21.8 million, an increase of $5.1 million from the 2010 fiscal year. For the current fiscal year the surplus of $21.8 million increased to $27.5 million. The Town of Greenwich had previously utilized a modified pay-as-you-go system of financing capital projects, which has been discontinued and phased out as of June 30, 2011.
The Town’s total debt decreased by $2.9 million. The net decrease is due to the issuance of $16.5 million in General Obligation Bonds with an offsetting payment of regularly scheduled principal amounts. Of significance, is the Town’s debt administration policy of paying down General Fund debt over a five-year period. Borrowings for funds other than the General Fund continue to be amortized over a twenty-year period. This does not include short-term Bond Anticipation Notes with $40 million outstanding as of June 30, 2012.
Overview of the Financial Statements This discussion and analysis are intended to serve as an introduction to the Town’s basic financial statements. The basic financial statements are comprised of three components: 1) government-wide financial statements, 2) fund financial statements and 3) notes to the financial statements. This report also contains other supplementary information, as well as the basic financial statements. Government-Wide Financial Statements The government-wide financial statements are designed to provide readers with a broad overview of the Town’s finances, in a manner similar to private-sector business. All of the resources the Town has at its disposal are shown, including major assets such as buildings and infrastructure. A thorough accounting of the cost of government is rendered because the statements present all costs, not just how much was collected and disbursed. They provide both long-term and short-term information about the Town’s overall financial status. The statement of net assets presents information on all of the Town’s assets and liabilities, with the difference reported as net assets. Over time, increases or decreases in net assets may serve as an indicator of whether the financial position of the Town is improving or deteriorating. It speaks to the question of whether or not the Town, as a whole, is better or worse off as a result of this year’s activities.

4
Other nonfinancial factors will need to be considered, however, such as changes in the Town’s property tax base and the condition of the Town’s infrastructure, to assess the overall health of the Town. The statement of activities presents information showing how the Town’s net assets changed during the most recent fiscal year. All of the current year’s revenues and expenses are taken into account, regardless of when cash is received or paid. Thus, revenues and expenses are reported in this statement for some items that will only result in cash flow in some future fiscal period, uncollected taxes and earned but unused vacation leave are examples. Both of the government-wide financial statements distinguish functions of the Town that are supported by taxes and intergovernmental revenues (governmental activities) from other functions that are intended to recover all or a significant portion of their costs through user fees and charges (business-type activities).
Governmental activities of the Town encompass most of the Town’s basic services and include general government, public safety, public works, health, The Nathaniel Witherell Nursing Facility, parks and recreation, social services, education and other activities. Property taxes, charges for services and state and federal grants finance most of these activities.
Business-type activities of the Town include the Parking Fund. It is reported here, as the Town charges a fee to customers to help cover all or most of the cost of the operations.
The government-wide financial statements include only the Town itself, as the Town has no component units.
The government-wide financial statements can be found on Exhibits I and II of this report.
Fund Financial Statements A fund is a grouping of related accounts that is used to maintain control and accountability over resources that have been segregated for specific activities or objectives. The Town, like other state and local governments, uses fund accounting to ensure and demonstrate compliance with finance-related legal requirements. All of the funds of the Town can be divided into three categories: governmental funds, proprietary funds and fiduciary funds. Governmental Funds. Governmental funds are used to account for essentially the same functions reported as governmental activities in the government-wide financial statements. However, unlike the government-wide financial statements, governmental fund financial statements focus on near-term inflows and outflows of spendable resources, as well as on balances of spendable resources available at the end of the fiscal year. Such information may be useful in evaluating a government’s near-term financing requirements. Because the focus of governmental funds is narrower than that of the government-wide financial statements, it is useful to compare the information presented for governmental funds with similar information presented for governmental activities in the government-wide financial statements. By doing so, readers may better understand the long-term impact of the government’s near-term financing decisions. Both the governmental fund balance sheet and the governmental fund statement of revenues, expenditures and changes in fund balances provide a reconciliation to facilitate this comparison between governmental funds and governmental activities.

5
The Town maintains 12 individual governmental funds. The Town has combined the two Capital Projects and Bonded Capital Projects funds into one fund and reclassified the Risk Fund as an Internal Service Fund. Information is presented separately in the governmental fund balance sheet and in the governmental fund statement of revenues, expenditures and changes in fund balances for the General Fund, Sewer Improvement Fund and Capital Projects Fund, which are all considered to be major funds. Data from the other ten governmental funds is combined into a single aggregated presentation. Individual fund data for each of these nonmajor governmental funds is provided in the form of combining statements elsewhere in this report. The basic governmental fund financial statements can be found on Exhibits III and IV. Proprietary Funds. The Town maintains one proprietary fund, which is an Enterprise Fund. Enterprise Funds are used to report the same functions presented as business-type activities in the government-wide financial statements. The Town uses enterprise funds to account for its parking activities. Proprietary funds provide the same type of information as the government-wide financial statements, only in more detail. The proprietary fund financial statements provide separate information for parking activities, which is considered to be a major fund of the Town. The basic proprietary fund financial statements can be found on Exhibits V through VII. Fiduciary Funds. Fiduciary funds are used to account for resources held for the benefit of parties outside the government. Fiduciary funds are not reflected in the government-wide financial statement because the resources of those funds are not available to provide services to the Town constituency. The Town has three pension trust funds and one agency fund. The accounting used for fiduciary funds is much like that used for proprietary funds. The basic fiduciary fund financial statements can be found on Exhibits VIII and IX.

6
Notes to the Financial Statements The notes provide additional information that is essential to a full understanding of the data provided in the government-wide and fund financial statements. The notes to the financial statements can be found on pages 22-52 of this report.
Government-Wide Financial Analysis As noted earlier, net assets may serve over time as a useful indicator of a government’s financial position and an important determinant of its ability to finance services in the future. In the case of the Town, assets exceeded liabilities by $439.6 million at June 30, 2012. This is an increase of $23.0 million from the previous fiscal year.
Governmental Business-type Governmental Business-type
Activities Activities Total Activities Activities Total
Current and other assets 161,978 $ 2,404 $ 164,382 $ 162,702 $ 1,848 $ 164,550 $
Capital assets 524,613 6,196 530,809 501,192 6,371 507,563
Total assets 686,591 8,600 695,191 663,894 8,219 672,113
Current liabilities 100,803 169 100,972 98,973 265 99,238
Long-term liabilities outstanding 154,453 158 154,611 156,218 - 156,218
Total liabilities 255,256 327 255,583 255,191 265 255,456
Net assets:
Invested in capital assets, net of
related debt 413,253 6,196 419,449 391,519 6,371 397,890
Restricted 686 - 686 - - -
Unrestricted 17,396 2,077 19,473 17,184 1,583 18,767
Total net assets 431,335 $ 8,273 $ 439,608 $ 408,703 $ 7,954 $ 416,657 $
June 30, 2012 June 30, 2011
Primary Government Primary Government
TOWN OF GREENWICH, CONNECTICUT
NET ASSETS ($000S)
At the end of the current fiscal year, the Town is able to report positive balances in all three categories of net assets, both for the Town as a whole, as well as for its separate governmental and business-type activities. On a government-wide basis, the assets of the Town exceeded its liabilities resulting in total net assets at the close of the fiscal year of $439.6 million. The total assets were up over last year due principally to additional capital asset additions and overall good operating results. The total net assets were up from last year’s net assets of $416.7 million and due principally to generally good operating results. Total net assets for governmental activities at fiscal year-end were $431.3 million (up from $408.7 million), and total net assets for business-type activities were $8.3 million (up from $8.0 million in the previous year). By far, the largest portion of the Town’s net assets ($419.4 million) reflects its investment in capital assets (e.g., land, buildings, machinery and equipment), less any related debt used to acquire those assets that is still outstanding. The Town uses these capital assets to provide services to citizens; consequently, these assets are not available for future spending. Although the Town’s investment in its capital assets is reported net of related debt, it should be noted that the resources needed to repay this debt must be provided from other sources, since the capital assets themselves cannot be used to liquidate these liabilities.

7
Governmental Business-type Governmental Business-type
Activities Activities Total Activities Activities Total
Revenues
Program revenues:
Charges for services 37,153 $ 3,327 $ 40,480 $ 38,674 $ 3,234 $ 41,908 $
Operating grants and contributions 44,804 - 44,804 41,328 - 41,328
Capital grants and contributions 3,258 - 3,258 4,509 - 4,509
General revenues:
Property taxes 316,442 - 316,442 305,874 - 305,874
Grants not restricted to specific
programs 2,299 2,299 2,527 - 2,527
Miscellaneous 1,047 - 1,047 614 - 614
Investment earnings 502 8 510 612 8 620
Total revenues 405,505 3,335 408,840 394,138 3,242 397,380
Expenses
General government 24,425 - 24,425 39,396 - 39,396
Public safety 42,538 - 42,538 41,350 - 41,350
Public works 40,596 - 40,596 42,287 - 42,287
Health 30,750 - 30,750 30,410 - 30,410
Social services 3,665 - 3,665 2,730 - 2,730
Schools 210,038 - 210,038 201,823 - 201,823
Libraries 12,395 - 12,395 12,441 - 12,441
Parks and recreation 15,856 - 15,856 15,791 - 15,791
Parking - 2,816 2,816 - 3,154 3,154
Interest on long-term debt 2,810 - 2,810 3,249 - 3,249
Total expenses 383,073 2,816 385,889 389,477 3,154 392,631
Change in net assets
before transfers 22,432 519 22,951 4,661 88 4,749
Transfers 200 (200) - 279 (279) -
Change in net assets 22,632 319 22,951 4,940 (191) 4,749
Net Assets, beginning of year 408,703 7,954 416,657 403,763 8,145 411,908
Net Assets, end of year 431,335 $ 8,273 $ 439,608 $ 408,703 $ 7,954 $ 416,657 $
Primary Government Primary Government
TOWN OF GREENWICH, CONNECTICUT
CHANGES IN NET ASSETS ($000s)
Year Ended
June 30, 2012 June 30, 2011
The Town’s net assets increased by $23.0 million during the fiscal year, with net assets of governmental activities increasing by $22.6 million, and net assets of business-type activities increasing by $0.3 million. The overall increase in net assets is principally due to overall good operating results. Government Activities Major revenue factors included: For governmental activities, more than $316.4 million or 78.0% of the revenues were derived from property taxes (up from $305.9 million in the prior year), followed by $85.2 million from program revenues, (up from $84.5 million in the prior year). The remaining revenue is higher by $0.1 million, due to higher miscellaneous receipts. The net increase in total revenues is principally due to an increase in property taxes.

8
Major expense factors included: For governmental activities, more than $210.0 million of the Town’s expenses relate to education, $42.5 million relates to public safety, $24.4 million for general government, $40.6 million for public works, $15.9 million for parks and recreation, $34.4 million for health and social services and $2.8 million for interest on long-term debt. The net increase in total expenses was due primarily to contractual salary increases. Financial Analysis of the Fund Financial Statements As noted earlier, the Town of Greenwich uses fund accounting to ensure and demonstrate compliance with finance-related legal requirements. Governmental Funds. The focus of the Town’s governmental funds is to provide information on near-term inflows, outflows and balances of spendable resources. Such information is useful in assessing the Town’s financing requirements. In particular, unreserved fund balance may serve as a useful measure of a government’s net resources available for spending at the end of the fiscal year. As of the end of the current fiscal year, the Town’s governmental funds reported combined ending fund balances of $22.8 million. This positive fund balance situation is partially offset by negative fund balances in the Sewer Improvement ($1.6 million) and Capital Projects Funds ($13.3 million). They are created by the issuance of Bond Anticipation Notes (BANS) of $40 million dollars collectively. When the BANS are converted to General Obligation Bonds, the proceeds will be recognized as revenues and that portion will reverse the negative fund balances. This is similar to the issuance of $30 million in General Obligation Bonds during fiscal year 2011 that help reverse a substantial amount of the previous negative fund balances from last year. The General Fund is the chief operating fund of the Town. With the recognition and implementation of GASB 54, the Town now has five categories for fund balance. At the end of the current fiscal year, the unassigned fund balance of the general fund was $12.6 million, while the total fund balance was a positive $27.5 million. The unassigned fund balance represents 3.7% of total General Fund expenditures, while total fund surplus represents 8.0% of that same amount. As previously stated, the Town’s fund balance was being replenished as the pay-as-you-go unwinds. The final year of the phasing out of pay-as-you-go was for the fiscal year ended June 30, 2011. The Town anticipated reaching a fund balance ratio of 5% to 10% of General Fund expenditures for that period. This was accomplished when combining unassigned and assigned fund balances with reserves in the Risk Fund and the Capital Non-recurring Fund, as per the Town’s Fund Balance Policy. The fund balance of the Town’s General Fund was $21.8 million for the year ended 2011. For the audit year, there was a net change in fund balances of $5.7 million. The surplus was the net result of a $16.3 million surplus of revenues over expenditures offset by ($10.6) million of net transfers out. The Capital Projects Fund has a negative fund balance of ($13.3) million. For the year ended June 30, 2012, the Town combined the previous Capital Projects and Bond Capital Projects Funds into one fund. Collectively, the two funds had a ($1.9) million fund balance in 2011. Proprietary Funds. The Town’s proprietary funds provide the same type of information found in the government-wide financial statements, but in more detail. The Parking Fund had revenues of $3.3 million and an increase of $0.1 million from the prior year, and expenses of $2.8 million for the current fiscal year, a decrease of $0.3 million from the prior year

9
General Fund Budgetary Highlights The difference between the original budget and the final amended budget for expenditures was $1.3 million. The major additional appropriations and transfers approved during the year are summarized below:
Board of Education miscellaneous additional appropriations of $0.7 million.
Public Work’s Snow Removal Accounts of $0.2 million.
Legal Expenses of $0.2 million.
During the year, actual revenues and transfers-in on a budgetary basis were $348.7 million, which were $3.7 million less than budgetary estimates. The most significant revenue negative variances were from budgeted shortfalls in Employee Healthcare Contributions = $1.2 million and Retirement Fund investment fees = $0.9 million. The largest budgeted revenue positive variances were from Property Tax = $1.2 million and building permits = $0.3 million. Actual expenditures and transfers out, on a budgetary basis, totaled $343.9 million, which were less than budgeted amounts by $9.8 million. The main reason for the favorable variance can be attributed to the cost cutting measures implemented to offset declining revenues in recent years. The largest favorable variances were for Schools = $1.2 million. Employee Benefits = $2.4 million and Public Works Waste Disposal = $0.9 million. The Town historically budgets for all positions and, on average, has 45 to 50 vacancies. This translates to an additional savings of almost $4.5 million dollars Town-wide. Capital Asset and Debt Administration Capital Assets. As of June 30, 2012, the Town’s investment in capital assets for its governmental and business-type activities amounted to $530.9 million, net of accumulated depreciation. This investment in capital assets includes land, building and land improvements, machinery and equipment and infrastructure. The total increase in the Town’s investment in capital assets for the current fiscal year was $23.2 million or 4.6%.
Governmental Business-type Governmental Business-type
Activities Activities Total Activities Activities Total
Land 63,651 $ 4,047 $ 67,698 $ 63,651 $ 4,047 $ 67,698 $
Land Improvements 11,517 - 11,517 10,392 - 10,392
Buildings 282,507 1,508 284,015 277,492 1,439 278,931
Machinery and equipment 25,015 641 25,656 23,297 885 24,182
Infrastructure 126,357 - 126,357 120,900 - 120,900
Construction in progress 15,566 - 15,566 5,460 - 5,460
Total 524,613 $ 6,196 $ 530,809 $ 501,192 $ 6,371 $ 507,563 $
TOWN OF GREENWICH, CONNECTICUT
June 30, 2012 June 30, 2011
Primary Government Primary Government
CAPITAL ASSETS (net of depreciation) ($000s)

10
Major capital asset events during the current fiscal year included the following:
Board of Education Facilities maintenance (e.g. roofs, boilers, HVAC, windows, etc.).
Town-wide infrastructure maintenance (e.g. paving, drainage, etc.).
Additional information on the Town’s capital assets can be found in Note 6 of this report. Long-Term Debt. At the end of the current fiscal year the Town had total debt outstanding of $93.2 million. All of this debt is backed by the full faith and credit of the Town.
Governmental Business-type Governmental Business-type
Activities Activities Total Activities Activities Total
General obligation bonds 85,495 $ -$ 85,495 $ 85,790 $ -$ 85,790 $
Notes payable 7,664 - 7,664 10,287 - 10,287
Total 93,159 $ -$ 93,159 $ 96,077 $ -$ 96,077 $
June 30, 2012 June 30, 2011
Primary Government Primary Government
TOWN OF GREENWICH, CONNECTICUT
OUTSTANDING DEBT ($000s)
The Town’s total debt decreased by $2.9 million during the current fiscal year. The Town maintains the following ratings from Wall Street’s credit agencies for general obligation debt: an Aaa rating from Moody’s Investors Service, and AAA from Standard and Poor’s and Fitch. The overall statutory debt limit for the Town is equal to seven times annual receipts from taxation or $2,147,711,674. As of June 30, 2012, the Town recorded long-term debt of $93.2 million related to governmental activities. Additional information on the Town’s long-term debt can be found in Note 9 of this report. Economic Factors and Next Year’s Budgets and Rates As of June 2012, the unemployment rate for the Town was 5.9%, a decrease from that of 6.4% in the prior year. Connecticut’s overall unemployment rate was 8.4% at June 30, 2012, down from 9.1% a year ago. Requests for Information The financial report is designed to provide a general overview of the Town of Greenwich’s finances for all those with an interest in the government’s finances. Questions concerning any of the information provided in this report or requests for additional financial information should be addressed to the Comptroller, Town Hall, 101 Field Point Road, Greenwich, CT 06830.

Basic Financial Statements

11
TOWN OF GREENWICH, CONNECTICUT EXHIBIT I
STATEMENT OF NET ASSETS
June 30, 2012
Governmental Business-Type
Activities Activities Total
Assets
Cash and cash equivalents 95,228,928 $ 2,428,808 $ 97,657,736 $
Receivables, net:
Property taxes 4,658,037 - 4,658,037
Accrued interest 3,216,297 - 3,216,297
Special assessments 20,589,209 - 20,589,209
Accounts receivable 2,786,430 - 2,786,430
Federal and state grants 2,181,562 - 2,181,562
Due from Housing Authority 1,236,755 - 1,236,755
Internal balances 24,750 (24,750) -
Due from fiduciary funds 3,235,515 - 3,235,515
Inventories and prepaids 723,371 - 723,371
Other post-employment assets 6,298,300 - 6,298,300
Restricted cash 21,798,434 - 21,798,434
Capital assets:
Capital assets, nondepreciable 79,216,990 4,047,002 83,263,992
Capital assets, net of accumulated depreciation 445,396,380 2,148,596 447,544,976
Total assets 686,590,958 8,599,656 695,190,614
Liabilities
Accounts payable 7,268,004 105,288 7,373,292
Accrued expenses 11,393,987 - 11,393,987
Deposits held for others 4,350,492 - 4,350,492
Due to State of Connecticut 245,245 - 245,245
Advance collections 36,784,704 - 36,784,704
Unearned revenue 760,275 63,500 823,775
Bond anticipation notes payable 40,000,000 - 40,000,000
Long-term liabilities:
Due within one year 24,264,507 39,516 24,304,023
Due in more than one year 130,188,500 118,549 130,307,049
Total liabilities 255,255,714 326,853 255,582,567
Net Assets
Investment in capital assets, net of related debt 413,252,862 6,195,598 419,448,460
Restricted for:
Public safety 545,624 - 545,624
Health 140,150 - 140,150
Unrestricted 17,396,608 2,077,205 19,473,813
Total net assets 431,335,244 $ 8,272,803 $ 439,608,047 $
The notes to the financial statements are an integral part of this statement.
Primary Government

12
TOWN OF GREENWICH, CONNECTICUT EXHIBIT II
For the Year Ended June 30, 2012
Operating Capital
Charges for Grants and Grants and Governmental Business-type
Functions/Programs Expenses Services Contributions Contributions Activities Activities Total
Primary government:
Governmental activities:
General government (24,424,333) $ 11,800,248 $ 33,088 $ 1,748,480 $ (10,842,517) $ -$ (10,842,517) $
Public safety (42,537,492) 1,414,426 265,461 - (40,857,605) - (40,857,605)
Public works (40,596,363) 5,820,689 1,633,425 1,509,539 (31,632,710) - (31,632,710)
Health (30,750,247) 7,462,390 15,019,360 - (8,268,497) - (8,268,497)
Social Services (3,665,284) 26,178 - - (3,639,106) - (3,639,106)
Schools (210,037,091) 4,851,991 26,735,154 - (178,449,946) - (178,449,946)
Libraries (12,395,193) 190,859 982,708 - (11,221,626) - (11,221,626)
Parks and recreation (15,855,817) 5,586,276 134,656 - (10,134,885) - (10,134,885)
Interest on long-term debt (2,810,361) - - - (2,810,361) - (2,810,361)
Total governmental activities (383,072,181) 37,153,057 44,803,852 3,258,019 (297,857,253) - (297,857,253)
Business-type activities:
Parking (2,816,041) 3,327,151 - - - 511,110 511,110
Total business-type activities (2,816,041) 3,327,151 - - - 511,110 511,110
Total primary government (385,888,222) $ 40,480,208 $ 44,803,852 $ 3,258,019 $ (297,857,253) 511,110 (297,346,143)
General revenues:
Property taxes 316,441,512 - 316,441,512
Grants and contributions not restricted to
specific programs 2,298,728 - 2,298,728
Miscellaneous income 1,047,249 - 1,047,249
Unrestricted investment earnings 502,142 7,775 509,917
Transfers 200,000 (200,000) -
Total general revenues and transfers 320,489,631 (192,225) 320,297,406
Change in net assets 22,632,378 318,885 22,951,263
Net assets - beginning 408,702,866 7,953,918 416,656,784
Net assets - ending 431,335,244 $ 8,272,803 $ 439,608,047 $
The notes to the financial statements are an integral part of this statement.
STATEMENT OF ACTIVITIES
Program Revenues Primary Government
Net (Expense) Revenue and Changes in Net Assets

13
TOWN OF GREENWICH, CONNECTICUT EXHIBIT III
BALANCE SHEET - GOVERNMENTAL FUNDS
June 30, 2012
Sewer Total
Improvement Capital Nonmajor Governmental
General Fund Projects Fund Governmental Funds
Assets
Cash and cash equivalents 78,269,019 $ 5,606,579 $ 16,193,539 $ 14,486,237 $ 114,555,374 $
Receivables, net of allowance for
collection losses:
Property taxes 4,549,058 17,387 - 91,592 4,658,037
Special assessments - 20,589,209 - - 20,589,209
Accrued Interest - 149,474 - - 149,474
Accounts receivable 40,172 - - 2,746,258 2,786,430
Federal and State grants 1,400,665 - - 780,897 2,181,562
Due from Housing Authority 807,413 - - 429,342 1,236,755
Prepaids 697,600 - - - 697,600
Inventories - - - 25,771 25,771
Due from other funds - - 11,923,596 1,483,016 13,406,612
Advances receivable
from other funds 2,474,238 - - - 2,474,238
Total assets 88,238,165 $ 26,362,649 $ 28,117,135 $ 20,043,113 $ 162,761,062 $
Liabilities
Accounts payable 3,204,507 $ 85,559 $ 1,496,267 $ 2,411,921 $ 7,198,254 $
Accrued expenses 11,389,217 - - - 11,389,217
Deposits held for others 3,708,478 - - 642,014 4,350,492
Due to State of Connecticut - - - 245,245 245,245
Due to other funds 1,716,803 7,224,269 - 1,230,025 10,171,097
Deferred revenues 4,856,928 20,606,596 - 1,872,843 27,336,367
Advance collections 35,818,145 - - 966,559 36,784,704
Advances to other funds - - - 2,474,238 2,474,238
Bond anticipation notes payable - - 40,000,000 - 40,000,000
Other accrued liabilities - 4,770 - - 4,770
Total liabilities 60,694,078 27,921,194 41,496,267 9,842,845 139,954,384
Fund Balances (Deficits)
Nonspendable 2,474,238 - - 25,771 2,500,009
Restricted - - - 685,774 685,774
Committed 21,140 - - 10,093,023 10,114,163
Assigned 12,417,458 - - - 12,417,458
Unassigned 12,631,251 (1,558,545) (13,379,132) (604,300) (2,910,726)
Total fund balances
(deficits) 27,544,087 (1,558,545) (13,379,132) 10,200,268 22,806,678
Total liabilities and
fund balances (deficits) 88,238,165 $ 26,362,649 $ 28,117,135 $ 20,043,113 $ 162,761,062 $
(Continued)

14
TOWN OF GREENWICH, CONNECTICUT EXHIBIT III, Cont'd.
BALANCE SHEET - GOVERNMENTAL FUNDS, Continued
June 30, 2012
Reconciliation of the Balance Sheet - Governmental Funds to the Statement of Net Assets:
Amounts reported for governmental activities in the statement of net assets (Exhibit) I)
are different because of the following:
Fund balances - total governmental funds (Exhibit III) 22,806,678 $
Capital assets used in governmental activities are not financial resources and,
therefore, are not reported in the funds:
Governmental capital assets 822,762,152 $
Less accumulated depreciation (298,148,782)
524,613,370
Certain assets are not available to pay for current-period expenditures
and, therefore, are deferred or not recorded in the funds:
Property tax receivables greater than 60 days 4,049,515
Assessments and other receivables not currently available 22,526,577
Interest receivable on property taxes 3,066,823
Other post-employment asset 6,298,300
Internal service funds are used by management to charge the costs of
risk management to individual funds. The assets and liabilities of
the internal service funds are reported with governmental activities
in the statement of net assets. 2,426,988
Long-term liabilities are not due and payable in the current period
and, therefore, are not reported in the funds:
Bonds payable (85,495,000)
Interest payable on bonds (1,920,105)
Premiums on bonds (5,682,523)
Clean water fund notes (7,468,943)
Installment note (195,000)
Compensated absences (19,466,726)
Self-insurance claims (17,474,710)
Pollution remediation (13,750,000)
Other claims (3,000,000)
Net Assets of Governmental Activities (Exhibit I) 431,335,244 $
The notes to the financial statements are an integral part of this statement.

15
TOWN OF GREENWICH, CONNECTICUT EXHIBIT IV
STATEMENT OF REVENUES, EXPENDITURES AND CHANGES IN FUND BALANCES (DEFICITS) -
GOVERNMENTAL FUNDS
For the Year Ended June 30, 2012
Sewer Other Total
Improvement Capital Governmental Governmental
General Fund Projects Fund Funds Funds
REVENUES
Property taxes 306,616,555 $ 3,167,962 $ -$ 8,323,316 $ 318,107,833 $
Licenses and permits 4,456,356 - - 613,854 5,070,210
Fines, forfeitures and penalties 1,598,939 - - - 1,598,939
Other revenues 8,387,126 - - 393,303 8,780,429
Charges for services 11,308,410 10,314 - 11,678,810 22,997,534
Use of money and property 1,104,778 21,287 43,173 68,806 1,238,044
Intergovernmental revenues 27,425,341 - 381,127 21,025,595 48,832,063
Total revenues 360,897,505 3,199,563 424,300 42,103,684 406,625,052
EXPENDITURES
Current:
General government 17,708,210 - - 1,204,697 18,912,907
Public safety 30,416,808 - - 141,975 30,558,783
Public works 20,884,513 - - 4,565,137 25,449,650
Health 6,866,405 - - 17,820,128 24,686,533
Social services 2,875,859 - - - 2,875,859
Schools 152,486,555 - - 6,304,898 158,791,453
Libraries 9,819,033 - - - 9,819,033
Parks and recreation 9,089,424 - - 1,339,006 10,428,430
Fixed charges 76,946,361 - - 5,248,479 82,194,840
Debt service:
State loan repayment - principal - 2,525,277 - - 2,525,277
Principal retirements 15,312,500 1,468,000 - 112,000 16,892,500
Interest and other charges 2,194,575 1,271,632 212,457 88,755 3,767,419
Capital outlay - 1,543,751 35,009,095 2,938,837 39,491,683
Total expenditures 344,600,243 6,808,660 35,221,552 39,763,912 426,394,367
Revenues over (under)
expenditures 16,297,262 (3,609,097) (34,797,252) 2,339,772 (19,769,315)
OTHER FINANCING SOURCES (USES)
Issuance of bonds - 5,050,000 11,450,000 - 16,500,000
Premium on bonds - 131,314 1,356,736 - 1,488,050
Transfers in 3,998,895 1,750,000 14,049,097 2,622,030 22,420,022
Transfers out (14,555,000) - (3,523,030) (4,141,992) (22,220,022)
Total other financing
sources (uses) (10,556,105) 6,931,314 23,332,803 (1,519,962) 18,188,050
Net changes in fund balances
(deficits) 5,741,157 3,322,217 (11,464,449) 819,810 (1,581,265)
FUND BALANCES (DEFICITS), beginning 21,802,930 (4,880,762) (1,914,683) 9,380,458 24,387,943
FUND BALANCES (DEFICITS), ending 27,544,087 $ (1,558,545) $ (13,379,132) $ 10,200,268 $ 22,806,678 $
(Continued)

16
TOWN OF GREENWICH, CONNECTICUT EXHIBIT IV, Cont'd.
STATEMENT OF REVENUES, EXPENDITURES AND CHANGES IN FUND BALANCES (DEFICITS) -
GOVERNMENTAL FUNDS, Continued
For the Year Ended June 30, 2012
Reconciliation of the Statement of Revenues, Expenditures and Changes in Fund Balances
to the Statement of Activities:
Amounts reported for governmental activities in the statement of activities (Exhibit II) are
different because of the following:
Net change in fund balances - total governmental funds (Exhibit IV) (1,581,265) $
Governmental funds report capital outlays as expenditures. However, in the statement
of activities, the cost of those assets is allocated over their estimated useful lives
and reported as depreciation expense.
Capital outlay 41,293,780
Depreciation expense (17,872,157)
Revenues in the statement of activities that do not provide current financial
resources are not reported as revenues in the funds.
Change in property taxes and assessments collected after 60 days (2,111,470)
Interest receivable on property taxes 445,149
Other receivables 545,827
Change in other post-employment asset (1,026,200)
The issuance of long-term debt (e.g., bonds, leases) provides current financial
resources to governmental funds, w hile the repayment of the principal of long-term
debt consumes the current financial resources of governmental funds. Neither
transactions, however, has any effect on net assets. Also, governmental funds report
the effect of issuance costs, premiums, discounts and similar items when debt is first
issued, whereas these amounts are deferred and amortized in the statement of
activities. The following is a listing of the differences:
Issuance of debt (16,500,000)
Premium on debt issuance (940,050)
Amortization of premium on refunding bond 83,464
Amortization of premium on general obligation bonds 1,100,252
Principal payments 19,417,777
Accrued interest (817,348)
Some expenses reported in the statement of activities do not require the use of current
financial resources and, therefore, are not reported as expenditures in governmental funds.
Change in long-term compensated absences (216,233)
Change in accrued other claims 1,502,500
Change in accrued self-insurance claims (762,907)
Internal service funds are used by management to charge costs to individual funds.
The net revenue of certain activities of internal service funds is reported with
governmental activities. 71,259
Change in Net Assets of Governmental Activities (Exhibit II) 22,632,378 $
The notes to the financial statements are an integral part of this statement.

17
TOWN OF GREENWICH, CONNECTICUT EXHIBIT V
STATEMENT OF NET ASSETS - PROPRIETARY FUNDS
June 30, 2012
Business-Type Governmental
Activities Activities
Enterprise Internal Service
Fund Fund
Parking Risk Reserve
Fund Fund
ASSETS
Current assets:
Cash and cash equivalents 2,428,808 $ 2,471,988 $
Noncurrent assets:
Capital assets, nondepreciable 4,047,002 -
Capital assets, net of accumulated depreciation 2,148,596 -
Total noncurrent assets 6,195,598 -
Total assets 8,624,406 2,471,988
LIABILITIES
Current liabilities:
Unearned revenue 63,500 -
Accounts payable 105,288 45,000
Due to other funds 24,750 -
Compensated absences 39,516 -
Total current liabilities 233,054 45,000
Long-term liabilities:
Compensated absences 118,549 -
Total liabilities 351,603 45,000
FUND NET ASSETS
Invested in capital assets 6,195,598 -
Unrestricted 2,077,205 2,426,988
Total fund net assets 8,272,803 $ 2,426,988 $
The notes to the financial statements are an integral part of this statement.
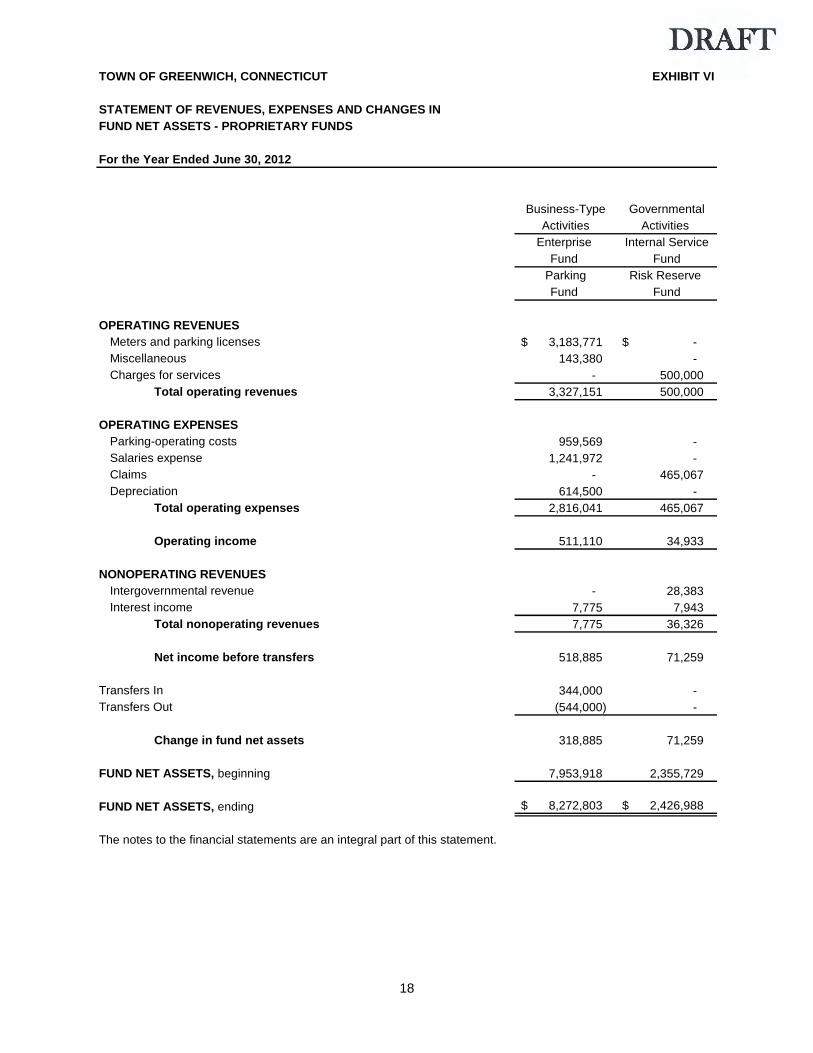
18
TOWN OF GREENWICH, CONNECTICUT EXHIBIT VI
STATEMENT OF REVENUES, EXPENSES AND CHANGES IN
FUND NET ASSETS - PROPRIETARY FUNDS
For the Year Ended June 30, 2012
Business-Type Governmental
Activities Activities
Enterprise Internal Service
Fund Fund
Parking Risk Reserve
Fund Fund
OPERATING REVENUES
Meters and parking licenses 3,183,771 $ -$
Miscellaneous 143,380 -
Charges for services - 500,000
Total operating revenues 3,327,151 500,000
OPERATING EXPENSES
Parking-operating costs 959,569 -
Salaries expense 1,241,972 -
Claims - 465,067
Depreciation 614,500 -
Total operating expenses 2,816,041 465,067
Operating income 511,110 34,933
NONOPERATING REVENUES
Intergovernmental revenue - 28,383
Interest income 7,775 7,943
Total nonoperating revenues 7,775 36,326
Net income before transfers 518,885 71,259
Transfers In 344,000 -
Transfers Out (544,000) -
Change in fund net assets 318,885 71,259
FUND NET ASSETS, beginning 7,953,918 2,355,729
FUND NET ASSETS, ending 8,272,803 $ 2,426,988 $
The notes to the financial statements are an integral part of this statement.
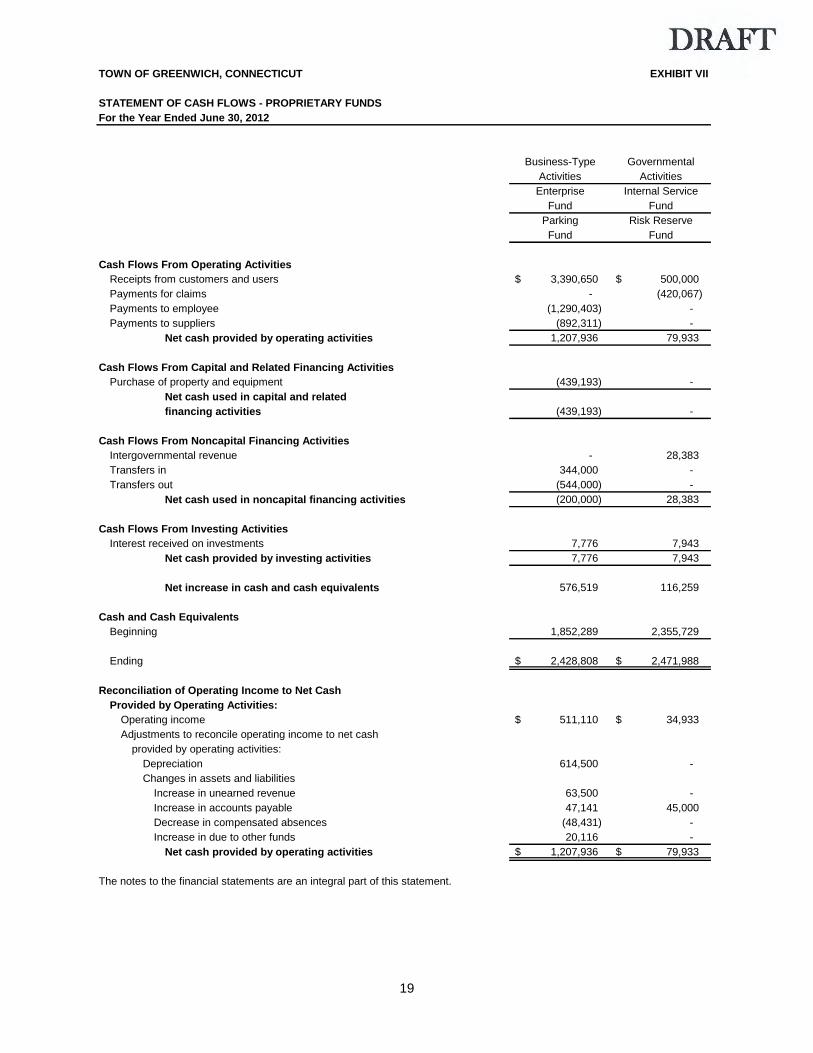
19
TOWN OF GREENWICH, CONNECTICUT EXHIBIT VII
STATEMENT OF CASH FLOWS - PROPRIETARY FUNDS
For the Year Ended June 30, 2012
Business-Type Governmental
Activities Activities
Enterprise Internal Service
Fund Fund
Parking Risk Reserve
Fund Fund
Cash Flows From Operating Activities
Receipts from customers and users 3,390,650 $ 500,000 $
Payments for claims - (420,067)
Payments to employee (1,290,403) -
Payments to suppliers (892,311) -
Net cash provided by operating activities 1,207,936 79,933
Cash Flows From Capital and Related Financing Activities
Purchase of property and equipment (439,193) -
Net cash used in capital and related
financing activities (439,193) -
Cash Flows From Noncapital Financing Activities
Intergovernmental revenue - 28,383
Transfers in 344,000 -
Transfers out (544,000) -
Net cash used in noncapital financing activities (200,000) 28,383
Cash Flows From Investing Activities
Interest received on investments 7,776 7,943
Net cash provided by investing activities 7,776 7,943
Net increase in cash and cash equivalents 576,519 116,259
Cash and Cash Equivalents
Beginning 1,852,289 2,355,729
Ending 2,428,808 $ 2,471,988 $
Reconciliation of Operating Income to Net Cash
Provided by Operating Activities:
Operating income 511,110 $ 34,933 $
Adjustments to reconcile operating income to net cash
provided by operating activities:
Depreciation 614,500 -
Changes in assets and liabilities
Increase in unearned revenue 63,500 -
Increase in accounts payable 47,141 45,000
Decrease in compensated absences (48,431) -
Increase in due to other funds 20,116 -
Net cash provided by operating activities 1,207,936 $ 79,933 $
The notes to the financial statements are an integral part of this statement.
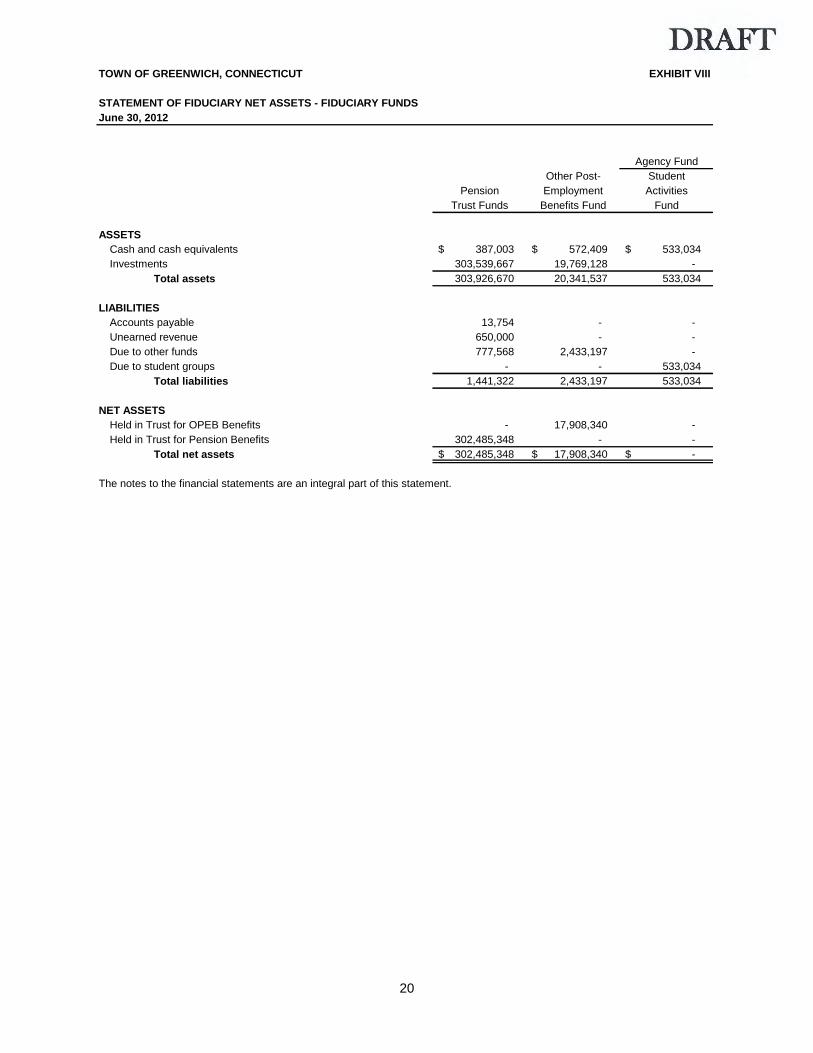
20
TOWN OF GREENWICH, CONNECTICUT EXHIBIT VIII
STATEMENT OF FIDUCIARY NET ASSETS - FIDUCIARY FUNDS
June 30, 2012
Agency Fund
Other Post- Student
Pension Employment Activities
Trust Funds Benefits Fund Fund
ASSETS
Cash and cash equivalents 387,003 $ 572,409 $ 533,034 $
Investments 303,539,667 19,769,128 -
Total assets 303,926,670 20,341,537 533,034
LIABILITIES
Accounts payable 13,754 - -
Unearned revenue 650,000 - -
Due to other funds 777,568 2,433,197 -
Due to student groups - - 533,034
Total liabilities 1,441,322 2,433,197 533,034
NET ASSETS
Held in Trust for OPEB Benefits - 17,908,340 -
Held in Trust for Pension Benefits 302,485,348 - -
Total net assets 302,485,348 $ 17,908,340 $ -$
The notes to the financial statements are an integral part of this statement.

21
TOWN OF GREENWICH, CONNECTICUT EXHIBIT IX
STATEMENT OF CHANGES IN FIDUCIARY NET ASSETS - FIDUCIARY FUNDS
For the Year Ended June 30, 2012
Other Post-
Pension Employment
Trust Funds Benefits Fund
Additions
Contributions:
Employer 14,672,813 $ 1,685,000 $
Plan members 2,257,241 3,904,742
Miscellaneous 329,679 154,880
Total contributions 17,259,733 5,744,622
Investment income:
Net depreciation in fair value of investments (1,153,450) (167,689)
Interest and dividends 4,521,103 379,716
3,367,653 212,027
Less investment expenses:
Investment management fees 259,091 21
Net investment income 3,108,562 212,006
Total additions 20,368,295 5,956,628
Deductions
Benefits 23,231,491 8,200,298
Administrative costs 452,105 56,968
Contributions refunded 114,350 -
Total deductions 23,797,946 8,257,266
Change in net assets (3,429,651) (2,300,638)
Net Assets
Beginning of year 305,914,999 20,208,978
End of year 302,485,348 $ 17,908,340 $
The notes to the financial statements are an integral part of this statement.
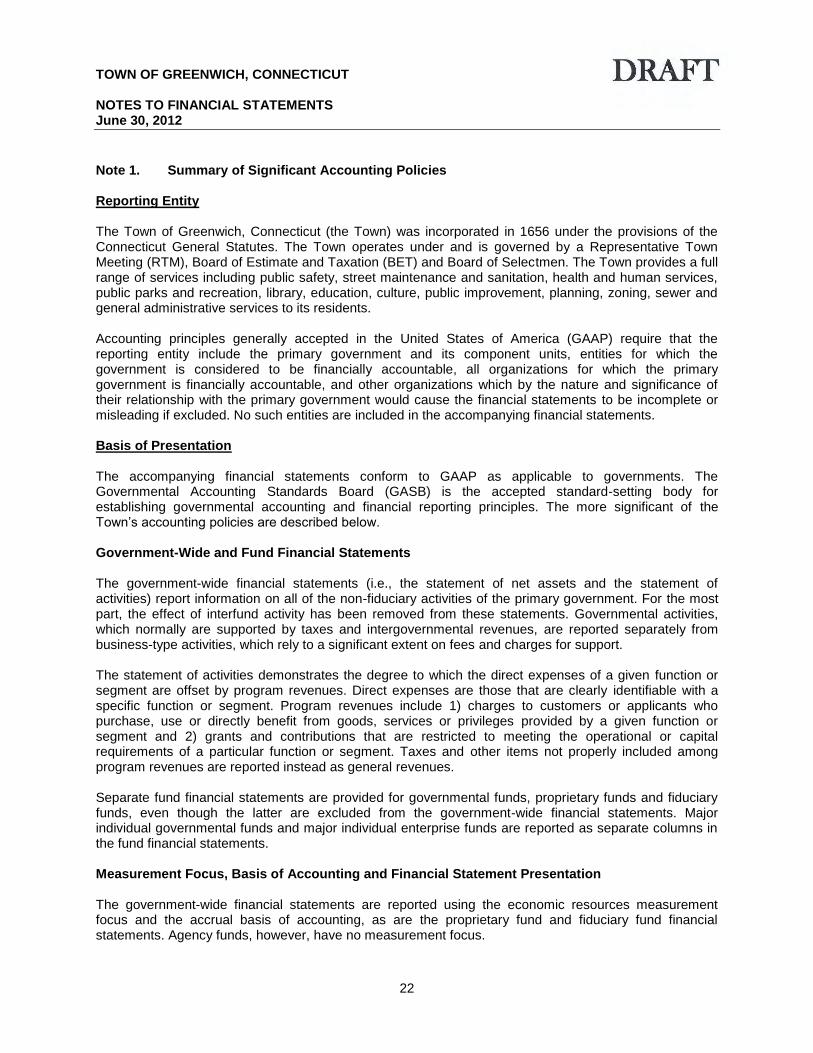
TOWN OF GREENWICH, CONNECTICUT NOTES TO FINANCIAL STATEMENTS June 30, 2012
22
Note 1. Summary of Significant Accounting Policies Reporting Entity The Town of Greenwich, Connecticut (the Town) was incorporated in 1656 under the provisions of the Connecticut General Statutes. The Town operates under and is governed by a Representative Town Meeting (RTM), Board of Estimate and Taxation (BET) and Board of Selectmen. The Town provides a full range of services including public safety, street maintenance and sanitation, health and human services, public parks and recreation, library, education, culture, public improvement, planning, zoning, sewer and general administrative services to its residents. Accounting principles generally accepted in the United States of America (GAAP) require that the reporting entity include the primary government and its component units, entities for which the government is considered to be financially accountable, all organizations for which the primary government is financially accountable, and other organizations which by the nature and significance of their relationship with the primary government would cause the financial statements to be incomplete or misleading if excluded. No such entities are included in the accompanying financial statements. Basis of Presentation The accompanying financial statements conform to GAAP as applicable to governments. The Governmental Accounting Standards Board (GASB) is the accepted standard-setting body for establishing governmental accounting and financial reporting principles. The more significant of the Town’s accounting policies are described below. Government-Wide and Fund Financial Statements The government-wide financial statements (i.e., the statement of net assets and the statement of activities) report information on all of the non-fiduciary activities of the primary government. For the most part, the effect of interfund activity has been removed from these statements. Governmental activities, which normally are supported by taxes and intergovernmental revenues, are reported separately from business-type activities, which rely to a significant extent on fees and charges for support. The statement of activities demonstrates the degree to which the direct expenses of a given function or segment are offset by program revenues. Direct expenses are those that are clearly identifiable with a specific function or segment. Program revenues include 1) charges to customers or applicants who purchase, use or directly benefit from goods, services or privileges provided by a given function or segment and 2) grants and contributions that are restricted to meeting the operational or capital requirements of a particular function or segment. Taxes and other items not properly included among program revenues are reported instead as general revenues. Separate fund financial statements are provided for governmental funds, proprietary funds and fiduciary funds, even though the latter are excluded from the government-wide financial statements. Major individual governmental funds and major individual enterprise funds are reported as separate columns in the fund financial statements. Measurement Focus, Basis of Accounting and Financial Statement Presentation The government-wide financial statements are reported using the economic resources measurement focus and the accrual basis of accounting, as are the proprietary fund and fiduciary fund financial statements. Agency funds, however, have no measurement focus.

TOWN OF GREENWICH, CONNECTICUT NOTES TO FINANCIAL STATEMENTS, Continued June 30, 2012
23
Revenues are recorded when earned and expenses are recorded when a liability is incurred, regardless of the timing of related cash flows. Property taxes are recognized as revenues in the year for which they are levied. Grants and similar items are recognized as revenue as soon as all eligibility requirements imposed by the provider have been met.
Governmental fund financial statements are reported using the current financial resources measurement focus and the modified accrual basis of accounting. Revenues are recognized as soon as they are both measurable and available. Revenues are considered to be available when they are collectible within the current period or soon enough thereafter to pay liabilities of the current period. For this purpose, the Town considers revenues to be available if they are collected within 60 days of the end of the current fiscal period.
Property taxes when levied for, intergovernmental revenue when eligibility requirements are met, licenses, charges for services and interest associated with the current fiscal period are all considered to be measurable and so have been recognized as revenue of the current fiscal period, if available. All other revenue items are considered to be measurable only when cash is received by the Town.
Expenditures generally are recorded when a liability is incurred, as under accrual accounting. However, debt service expenditures, as well as expenditures related to compensated absences, pension, other post-employment benefit obligations, claims and judgments, are recorded only when payment is due (matured).
The Town reports the following major governmental funds.
General Fund - The General Fund is the major operating fund of the Town. All unrestricted resources except those required to be accounted for in another fund are accounted for in this fund. The General Fund pays all general operating expenditures, debt service and the capital improvement costs of the Town which are not paid through other funds. The fund will also liquidate the liability for compensated absences, net pension obligation, and other post-employment benefit obligations.
Sewer Improvement Fund - This fund is authorized by Special Act No. 292 or 1949 (Town Charter or Code) to build sanitary sewers for the Town and benefited property owners. Expenditures are made for the construction of new sewers and the reconstruction of existing sewers. The major sources of revenue for this fund are special assessments levied to benefited property owners, issuance of connection (and other special) permits, a special property tax, if needed, and Federal and State grants/loans.
Capital Projects Fund - This fund is used to account for various acquisitions, renovations and construction projects. The major sources of revenue for this fund are capital grants and the proceeds from the issuance of general obligation bonds.
The Town reports the following major enterprise funds:
Parking Fund - This fund accounts for all the operations of public parking areas covered under the Public Parking Special Act. The primary source of revenue for this fund is parking permits/fees.
Additionally, the Town reports the following fund types:
The Internal Service Fund - Risk Reserve is used to accumulate funds to pay for future unanticipated claims within the Town.
The Pension Trust Funds account for the activities of the Town’s defined benefit pension plans, which accumulate resources for pension benefit payments to qualified employees.

TOWN OF GREENWICH, CONNECTICUT NOTES TO FINANCIAL STATEMENTS, Continued June 30, 2012
24
The OPEB Trust Fund accounts for monies used to fund retirees’ health benefits. The Agency Funds account for monies held as custodian for various student groups.
Private-sector standards of accounting and financial reporting issued prior to December 1, 1989 generally are followed in both the government-wide and enterprise fund financial statements to the extent that those standards do not conflict with or contradict guidance of the Governmental Accounting Standards Board. Governments also have the option of following subsequent private-sector guidance for their enterprise fund financial statements, subject to this same limitation. The Town has elected not to follow subsequent private-sector guidance. As a general rule, the effect of interfund activity has been eliminated from the government-wide financial statements. Exceptions to this general rule are charges between the parking fund and various other functions of the government. Elimination of these charges would distort the direct costs and program revenues reported for the various functions concerned. Amounts reported as program revenues include 1) charges to customers or applicants for goods, services or privileges provided, 2) operating grants and contributions, and 3) capital grants and contributions, including special assessments. Internally dedicated resources are reported as general revenues rather than as program revenues. Likewise, general revenues include all taxes. Proprietary funds distinguish operating revenues and expenses from nonoperating items. Operating revenues and expenses generally result from providing services in connection with a proprietary fund’s principal ongoing operations. The principal operating revenues of the proprietary funds are charges to customers for services. Operating expenses for the funds include the cost of operations and maintenance, and depreciation on capital assets. All revenues and expenses not meeting this definition are reported as nonoperating revenues and expenses. When both restricted and unrestricted resources are available for use, it is the Town’s policy to use restricted resources first, then unrestricted resources as they are needed. Unrestricted resources are used in the following order: committed, assigned then unassigned. Cash Equivalents The Town considers all highly liquid investments and those with original maturities of three months or less when purchased to be cash equivalents. Investments Investments are primarily stated at fair value using quoted market prices. The Connecticut State Treasurer’s Short-Term Investment Fund is an investment pool managed by the State of Connecticut Office of the State Treasurer. Investments must be made in instruments authorized by Connecticut General Statutes 3-27c through 3-27e. Investment guidelines are adopted by the State Treasurer. The fair value of the position in the pool is the same as the value of the pool shares. The balance of the pooled fixed income investments were invested in a pool similar to a 2a-7 and are recorded at fair value.

TOWN OF GREENWICH, CONNECTICUT NOTES TO FINANCIAL STATEMENTS, Continued June 30, 2012
25
Allowance for Doubtful Accounts Accounts and notes receivable, including property taxes receivable, for the primary government are reported net of allowance for doubtful accounts. The allowance for doubtful accounts represents those accounts that are deemed uncollectible based upon past collection history and an assessment of the debtor’s ability to pay. Interfunds Activity between funds that are representative of lending/borrowing arrangements outstanding at the end of the fiscal year are referred to as either “due to/from other funds” (i.e., the current portion of interfund loans) or “advances to/from other funds” (i.e., the noncurrent portion of interfund loans). All other outstanding balances between funds are reported as “due to/from other funds.” Property Taxes The Town’s property tax is levied each July 1, on the assessed value listed on the prior October 1, Grand List for all taxable property located in the Town. Although taxes are levied in June, the legal right to attach the property does not exist until July 1. Therefore, taxes are due and payable in equal installments on July 1, and January 1, following the date of the Grand List. Interest of 1 ½% per month is charged on delinquent taxes. Liens are effective on the attachment date and are continued by filing prior to the following levy date. Additional property taxes are assessed for motor vehicles registered subsequent to the Grand List date through July 31, and are payable in one installment due January 1. An amount of $855,239 has been established as an allowance for uncollectible taxes. At June 30, 2012, this represents approximately 15.5% of all property taxes receivable. Property tax receivables are reported net of an allowance for uncollectibles. Inventories Inventories of government fund types are stated at cost using the consumption method on the first-in, first-out basis. Capital Assets Capital assets, which include property, plant, equipment and infrastructure assets (e.g., roads, bridges, sidewalks and similar items), are reported in the applicable governmental or business-type activities columns in the government-wide financial statements and the proprietary fund financial statements. Capital assets are defined by the government as assets with an initial, individual cost of more than $10,000 for machinery and equipment and $25,000 for buildings and improvements and an estimated useful life in excess of two years. Such assets are recorded at historical cost or estimated historical cost if purchased or constructed. Donated capital assets are recorded at estimated fair value at the date of donation. Infrastructure assets acquired prior to fiscal years ending after June 30, 1980 are included. The costs of normal maintenance and repairs that do not add to the value of the asset or materially extend assets lives are not capitalized. Major outlays for capital assets and improvements are capitalized as projects are constructed.

TOWN OF GREENWICH, CONNECTICUT NOTES TO FINANCIAL STATEMENTS, Continued June 30, 2012
26
Property, plant and equipment of the Town is depreciated using the straight-line method over the following estimated useful lives:
Assets Years
Buildings 50
Land improvements 20
Public domain infrastructure 20-50
Machinery and equipment 5-20
Capital assets are reported as expenditures and no depreciation expense is reported in the governmental fund financial statements. Compensated Absences Town employees accumulate vacation, sick and compensatory leave hours for subsequent use or for payment upon termination or retirement. Vacation, sick and compensatory leave expenses to be paid in future periods are accrued when incurred in the government-wide and proprietary fund financial statements. A liability for these amounts is reported in governmental funds only for the amounts that have become due. Amounts for compensated absences are generally liquidated by the General Fund. Long-Term Obligations In the government-wide and proprietary fund financial statements, long-term debt and other long-term obligations are reported as liabilities in the applicable governmental activities, business-type activities or proprietary fund type statement of net assets. Bond premiums and discounts, as well as issuance costs, are deferred and amortized over the life of the bonds using the effective interest method. Bonds payable are reported net of the applicable bond premium or discount. Bond issuance costs are reported as deferred charges and amortized over the term of the related debt. In the fund financial statements, governmental fund types recognize bond premiums and discounts, as well as bond issuance costs, during the current period. The face amount of debt issued, including capital leases, is reported as other financing sources. Premiums received on debt issuances are reported as other financing sources while discounts on debt issuances are reported as other financing uses. Issuance costs, whether or not withheld from the actual debt proceeds received and principal payments, are reported as debt service expenditures. Fund Equity and Net Assets Equity in the government-wide and proprietary and fiduciary fund financial statements is defined as “net assets” and is classified in the following categories:
Invested in Capital Assets, Net of Related Debt - This component of net assets consists of capital assets, net of accumulated depreciation and reduced by the outstanding balances of any bonds, notes or other borrowings that are attributable to the acquisition, construction or improvement of those assets.

TOWN OF GREENWICH, CONNECTICUT NOTES TO FINANCIAL STATEMENTS, Continued June 30, 2012
27
Restricted Net Assets – This represents amounts constrained for a specific purpose by external parties, such as grantors, creditors, contributors or laws and regulations of their governments. Unrestricted Net Assets - This component consists of net assets that do not meet the definition of “restricted” or “invested in capital assets, net of related debt.”
The equity of the governmental fund financial statements is defined as “fund balance” and is classified in the following categories:
Nonspendable Fund Balance - This represents amounts that cannot be spent due to form (e.g., inventories and prepaid amounts). Restricted Fund Balance - This represents amounts constrained for a specific purpose by external parties, such as grantors, creditors, contributors or laws and regulations of their governments. Committed Fund Balance - This represents amounts constrained for a specific purpose by a government using its highest level of decision-making authority which would be the Board of Estimation and Taxation (BET). Assigned Fund Balance - For all governmental funds other than the General Fund, this represents any remaining positive amounts not classified as restricted or committed. For the General Fund, this includes amounts constrained for the intent to be used for a specific purpose by the BET, RTM, purchasing and finance departments, which have been delegated to assign amounts by the Town Charter. Unassigned Fund Balance - This represents fund balance in the General Fund in excess of nonspendable, restricted, committed and assigned fund balance. If another governmental fund has a fund balance deficit, it is reported as a negative amount in unassigned fund balance.
Improvement Appropriations Continued in Force Uncommitted balances of current year capital improvement appropriations can be extended for one year if approved by the BET. The authority to extend the uncommitted balances has been conferred on the BET under provisions of the Town Charter. For budgetary comparisons, the budget basis considers such improvement appropriations continued in force as expenditures. Encumbrances Encumbrance accounting, under which purchase orders, contracts and other commitments for the expenditure of monies are recorded in order to reserve that portion of the applicable appropriation, is used in all budgetary funds. For budgetary comparisons, the budget basis considers such encumbrances as expenditures. Pension Accounting Pension Trust Funds Employee contributions are recognized in the period in which the contributions are due. Employer contributions to the plan are recognized when due and the Town has made a formal commitment to provide the contributions. Benefits and refunds are recognized when due and payable in accordance with the terms of each plan.

TOWN OF GREENWICH, CONNECTICUT NOTES TO FINANCIAL STATEMENTS, Continued June 30, 2012
28
Government Funds and Activities
The net pension obligation (asset), the cumulative difference between annual pension cost and the Town’s contributions to the plan since 1986, is calculated on an actuarial basis consistent with the requirements of Government Accounting Standards Board Statement No. 27. Expenditures are recognized when they are paid or are expected to be paid with current available resources. The pension obligation (asset) is recorded as a non-current liability (asset) in the government-wide financial statements, and generally liquidated by the General Fund.
Funding Policy The Town is required to contribute 100% of the actuarially determined amount as mandated by Town Charter. Other Post-Employment Obligations (“OPEB”) accounting Employee contributions are recognized in the period in which the contributions are due. Employer contributions to the plan are recognized when due and the Town has made a formal commitment to provide the contributions. Benefits and refunds are recognized when due and payable in accordance with the terms of each plan. Plan members began contributing on July 1, 2007. Governmental Funds and Activities In governmental funds, expenditures are recognized when they are paid or are expected to be paid with current available resources. In governmental activities, expense is recognized based on actuarially required contributions. The net OPEB obligation, the cumulative difference between annual OPEB cost and the Town’s contributions to the plan since July 1, 2007, is calculated on an actuarial basis consistent with the requirements of Government Accounting Standards Board Statement No. 45. The OPEB obligation is recorded as a noncurrent liability in the government-wide financial statements. Funding Policy The Town makes annual contributions based on the BET’s decisions using the actuaries’ recommendation. Accounting Estimates The preparation of financial statements in conformity with GAAP requires management to make estimates and assumptions that affect the reported amounts of assets and liabilities and disclosures of contingent assets and liabilities at the date of the financial statements and the reported amounts of revenues and expenses during the reporting period. Actual results could differ from those estimates. Note 2. Deposits and Investments Deposit Policies - The Town has a policy that deposits can include demand and savings accounts and certificates of deposits. For custodial credit risk, the Town’s policy conforms to the State of Connecticut requirements that each depository maintain segregated collateral in an amount equal to a defined percentage of its public deposits based upon the bank’s risk-based capital ratio. Investment Policies - The investment and credit risk policies of the Town conform to the policies as set forth by the State of Connecticut. The Town policy allows investments in the following: 1) obligations of

TOWN OF GREENWICH, CONNECTICUT NOTES TO FINANCIAL STATEMENTS, Continued June 30, 2012
29
the United States and its agencies; 2) highly rated obligations of any state of the United States or of any political subdivision, authority or agency thereof; and 3) shares or other interests in custodial arrangements or pools maintaining constant net asset values and in highly rated no-load open end money market and mutual funds (with constant or fluctuating net asset values) whose portfolios are limited to obligations of the United States and its agencies, and repurchase agreements fully collateralized by such obligations. The Statutes (Sections 3-24f and 3-27f) also provide for investment in shares of the Connecticut Short-Term Investment Fund and the Tax Exempt Proceeds Fund, for non-fiduciary investments. Other provisions of the Statutes cover specific municipal pension and other post-employment benefit obligation funds with particular investment authority and do not specify permitted investments. Therefore, investment of such funds is generally controlled by the laws applicable to fiduciaries (i.e., prudent person rule) and the provisions of the applicable plan. Their approved policies target an asset mix to provide the probability of meeting or exceeding the return objectives at the lowest possible risk.
Pension Funds OPEB Funds
Asset Class Allocation % Range Allocation %
RangeEquities 35%-60% 25% - 75%
Domestic N/A 25% - 75%
Domestic Large Cap 10%-30% N/A
Domestic Small Cap 5%-15% N/A
International Equity 5%-15% 0% - 30%
Emerging Markets Equity 3%-12% 0% - 20%
Fixed Income 30%-50% 25% - 70%
Domestic Core 6% -30% 20% - 65%
High Yield Bonds 0%-10% Included in Fixed
Inc.- OtherFixed Income – Other* N/A 0% - 15%
Global Bonds 0%-10% 0% - 25%
Emerging Market Debt 0%- 10% Included in Fixed
Inc.- OtherPrivate Debt 0%– 12% N/A
Preferred Stock N/A 0% - 15%
TIPS Index 0%-10% 0% - 15%
Alternatives 10%-30% 0% - 20%
Real Estate 0%-10% 0% - 15%
Private Equity 0%-15% N/A
Real Assets / Commodities 0%- 10% 0% - 15%
Cash 0%-5% 0% - 20%
* Fixed Income-Other includes High Yield Bonds, Leveraged Loans, Emerging
Market Debt, etc.
Interest Rate Risk - The Town and the pension and OPEB funds limit exposure to fair value losses arising from changes in interest rates by structuring the investment portfolio so that securities mature to meet cash requirements for ongoing operations, thereby avoiding the need to sell securities on the open market prior to maturity, and investing operating funds primarily in shorter-term securities, money market mutual funds or similar investment pools.
Concentration Risk Policy – The Town has a policy limiting investment in any approved bank fund to no more than 5% of the total assets of the fund (Pension 8% and OPEB 5%). There is no limit expressed as a percent of the Town’s funds for investments in CT STIF and BET approved bank depository accounts,

TOWN OF GREENWICH, CONNECTICUT NOTES TO FINANCIAL STATEMENTS, Continued June 30, 2012
30
as well as direct obligations of the U.S. Government. There is a limit equal to 25% of total Town funds in CDs of a single approved bank, and a 25% limit on invested balances over 60 days in BET approved mutual fund accounts.
Custodial Credit Risk
Deposits - This is the risk that, in the event of failure of a depository financial institution, a government will not be able to recover its deposits or will not be able to recover collateral securities that are in the possession of an outside party.
Based on the criteria described in GASB Statement No. 40, Deposits and Investment Risk Disclosures, $116,866,689 of the Town’s bank balance of $123,666,383 was exposed to custodial credit risk as follows:
Uninsured and uncollateralized 37,774,861 $
Uninsured and collateral held by the pledging
bank's trust department, not in the Town's name 79,091,828
Total Amount Subject to Custodial Credit Risk 116,866,689 $
Cash Equivalents
Cash equivalents are short-term, highly liquid investments that are both readily convertible to known amounts of cash and purchased within 3 months of maturity. At June 30, 2012, the Town’s cash equivalents amount to $581,423. The following tables provides a summary of the Town’s cash equivalents (excluding U.S. government guaranteed obligations) as rated by nationally recognized statistical rating organizations. The pools all have maturities of less than one year.
Standard
Cash Equivalents Ratings and Poor's
State Short-Term Investment Fund (STIF) AAAm
Cutwater - Cooperative Liquid Assets
Securities System (CLASS) AAAm
Vanguard Money Market*
* Not rated

TOWN OF GREENWICH, CONNECTICUT NOTES TO FINANCIAL STATEMENTS, Continued June 30, 2012
31
Cash, cash equivalents and investments of the Town consist of the following at June 30, 2012:
Cash and Cash Equivalents
Deposits with financial institutions 120,367,193 $
Cash equivalents 581,423
Total cash and cash equivalents 120,948,616
Investments
Trust and Agency Funds:
Alternatives 45,057,782
Fixed income funds 80,683,065
Mutual funds 197,567,948
Total investments 323,308,795
Total cash, cash equivalents and investments 444,257,411 $
Cash and investments are classified in the accompanying financial statements as follows:
Statement of Net Assets
Cash and cash equivalents 119,456,170 $
Fiduciary Funds
Cash and cash equivalents 1,492,446
Investments 323,308,795
324,801,241
Total cash, cash equivalents and investments 444,257,411 $
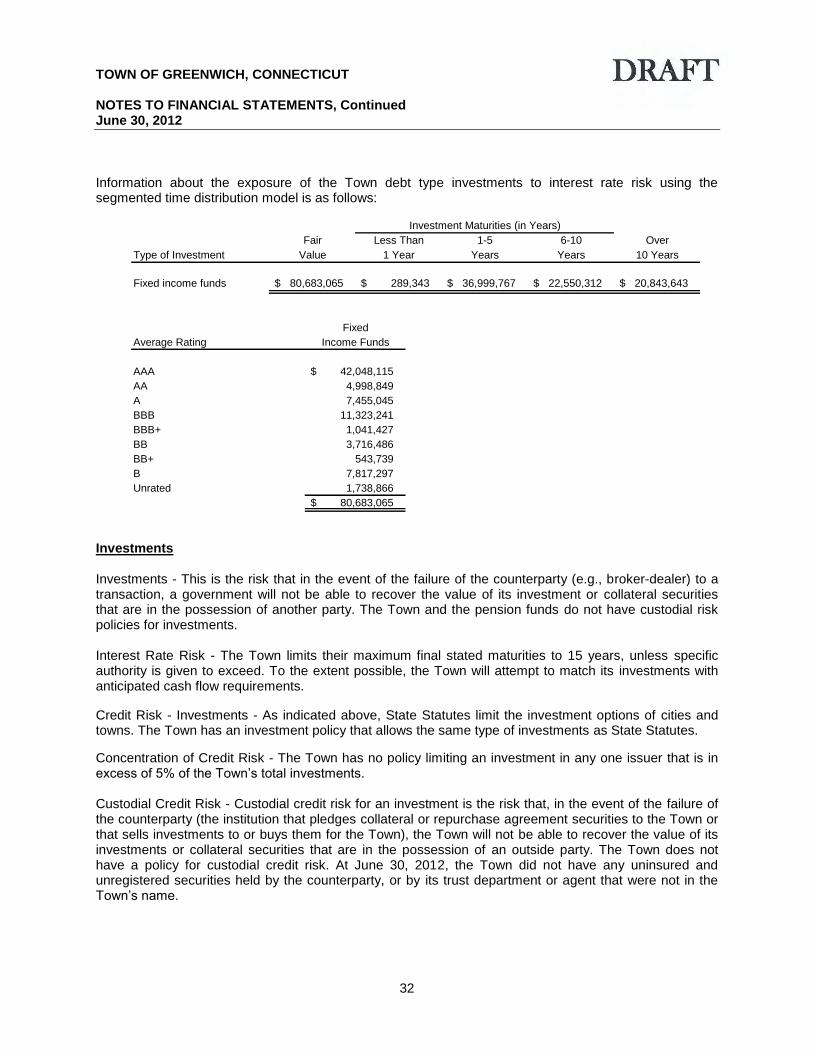
TOWN OF GREENWICH, CONNECTICUT NOTES TO FINANCIAL STATEMENTS, Continued June 30, 2012
32
Information about the exposure of the Town debt type investments to interest rate risk using the segmented time distribution model is as follows:
Fair Less Than 1-5 6-10 Over
Type of Investment Value 1 Year Years Years 10 Years
Fixed income funds 80,683,065 $ 289,343 $ 36,999,767 $ 22,550,312 $ 20,843,643 $
Investment Maturities (in Years)
Fixed
Average Rating Income Funds
AAA 42,048,115 $
AA 4,998,849
A 7,455,045
BBB 11,323,241
BBB+ 1,041,427
BB 3,716,486
BB+ 543,739
B 7,817,297
Unrated 1,738,866
80,683,065 $
Investments Investments - This is the risk that in the event of the failure of the counterparty (e.g., broker-dealer) to a transaction, a government will not be able to recover the value of its investment or collateral securities that are in the possession of another party. The Town and the pension funds do not have custodial risk policies for investments. Interest Rate Risk - The Town limits their maximum final stated maturities to 15 years, unless specific authority is given to exceed. To the extent possible, the Town will attempt to match its investments with anticipated cash flow requirements.
Credit Risk - Investments - As indicated above, State Statutes limit the investment options of cities and towns. The Town has an investment policy that allows the same type of investments as State Statutes.
Concentration of Credit Risk - The Town has no policy limiting an investment in any one issuer that is in excess of 5% of the Town’s total investments. Custodial Credit Risk - Custodial credit risk for an investment is the risk that, in the event of the failure of the counterparty (the institution that pledges collateral or repurchase agreement securities to the Town or that sells investments to or buys them for the Town), the Town will not be able to recover the value of its investments or collateral securities that are in the possession of an outside party. The Town does not have a policy for custodial credit risk. At June 30, 2012, the Town did not have any uninsured and unregistered securities held by the counterparty, or by its trust department or agent that were not in the Town’s name.

TOWN OF GREENWICH, CONNECTICUT NOTES TO FINANCIAL STATEMENTS, Continued June 30, 2012
33
Note 3. Receivables Receivables as of year-end for the Town’s individual major funds, and nonmajor and fiduciary funds in the aggregate, including the applicable allowances for uncollectible accounts are as follows:
Capital Nonmajor
Sewer Projects and Other
General Improvement Fund Funds Total
Receivables:
Taxes 5,404,297 $ 17,387 $ -$ 91,592 $ 5,513,276 $
Accounts 40,172 - - 3,582,965 3,623,137
Special assessments - 20,589,209 - - 20,589,209
Intergovernmental 1,400,665 - - 780,897 2,181,562
interest receivable - 149,474 - - 149,474
Due from Housing Authority 807,413 - - 429,342 1,236,755
Gross receivables 7,652,547 20,756,070 - 4,884,796 33,293,413
Less allowance for property
tax uncollectibles (855,239) - - (836,707) (1,691,946)
Net Total Receivables 6,797,308 $ 20,756,070 $ -$ 4,048,089 $ 31,601,467 $
Note 4. Deferred/Unearned Revenue Governmental funds report deferred revenue in connection with revenues that are not considered to be available to liquidate liabilities of the current period. Governmental funds and governmental activities also defer revenue recognition in connection with revenues that have been received, but not yet earned. At the end of the current fiscal year, the various components of deferred/unearned revenue were as follows:
Unavailable Unearned
General Fund:
Delinquent property taxes receivable 4,049,515 $ -$
Other receivables 807,413 -
Advanced collections - 35,818,145
Sewer Improvement Fund:
Special assessments and taxes receivable 20,606,596 -
Nonmajor Funds:
Taxes receivable 83,226 -
Loans receivable 429,342 -
Intergovernmental receivables 600,000 210,843
Advanced collections - 966,559
Other revenues - 549,432
26,576,092 $ 37,544,979 $

TOWN OF GREENWICH, CONNECTICUT NOTES TO FINANCIAL STATEMENTS, Continued June 30, 2012
34
Note 5. Special Assessments Payments of special assessments levied on benefited properties may be made over periods not to exceed 20 years from the initial assessment date, and terms of payment may be accelerated under certain conditions. Uncollected special assessments levied at June 30, 2012 consist of the following:
Areas of present benefit - delinquent 144,896 $
Areas of present benefit - current 99,345
Areas of present benefit - deferred 20,344,968
20,589,209 $
Note 6. Capital Assets Capital asset activity for governmental activities for the year ended June 30, 2012 was as follows:
Beginning Ending
Balance Increases Decreases Balance
Governmental activities:
Capital assets, not being depreciated:
Land 63,650,607 $ -$ -$ 63,650,607 $
Construction in progress 5,459,404 10,106,979 - 15,566,383
Total capital assets, not being depreciated 69,110,011 10,106,979 - 79,216,990
Capital assets, being depreciated:
Land improvements 21,072,625 1,839,526 - 22,912,151
Buildings 376,368,701 12,059,421 - 388,428,122
Machinery and equipment 92,049,394 5,283,315 (1,135,139) 96,197,570
Infrastructure 224,002,780 12,004,539 - 236,007,319
Total capital assets being depreciated 713,493,500 31,186,801 (1,135,139) 743,545,162
Less accumulated depreciation for:
Land improvements 10,680,365 714,382 - 11,394,747
Buildings 98,876,611 7,045,002 - 105,921,613
Machinery and equipment 68,752,317 3,565,118 (1,135,139) 71,182,296
Infrastructure 103,102,471 6,547,655 - 109,650,126
Total accumulated depreciation 281,411,764 17,872,157 (1,135,139) 298,148,782
Total capital assets, being depreciated, net 432,081,736 13,314,644 - 445,396,380
Governmental activities capital assets, net 501,191,747 $ 23,421,623 $ -$ 524,613,370 $

TOWN OF GREENWICH, CONNECTICUT NOTES TO FINANCIAL STATEMENTS, Continued June 30, 2012
35
Capital asset activity for the Parking Fund for the year ended June 30, 2012 was as follows:
Beginning Ending
Balance Increases Decreases Balance
Business-type activities:
Capital assets, not being depreciated:
Land 4,047,002 $ -$ -$ 4,047,002 $
Total capital assets, not being depreciated 4,047,002 - - 4,047,002
Capital assets, being depreciated:
Buildings and improvements 7,036,921 328,679 - 7,365,600
Machinery and equipment 3,535,517 106,033 (24,872) 3,666,422
Meters 705,926 4,481 - 710,407
Total capital assets, being depreciated 11,278,364 439,193 (24,872) 11,742,429
Less accumulated depreciation for:
Buildings and improvements 5,598,060 259,163 - 5,857,223
Machinery and equipment 3,115,987 316,004 (24,872) 3,456,863
Meters 240,414 39,333 - 279,747
Total accumulated depreciation 8,954,461 614,500 (24,872) 9,593,833
Total capital assets, being depreciated, net 2,323,903 (175,307) - 2,148,596
Governmental activities capital assets, net 6,370,905 $ (175,307) $ -$ 6,195,598 $
Depreciation expense was charged to functions/programs of the primary government as follows:
Governmental activities:
General government 1,256,410 $
Public safety 1,621,480
Public works, including depreciation of general
infrastructure assets 8,708,129
Nathaniel Witherell 95,986
Schools 4,471,144
Libraries 189,546
Parks and recreation 1,529,462
Total depreciation expense – governmental activities 17,872,157 $
Business-type activities:
Parking 614,500 $
Construction Commitments The Town has active construction projects as of June 30, 2012. The projects include building additions and rehabilitation, sewer line reconstruction, new sewer construction, bridge replacement and improvement, fire station rehabilitation, road reconstruction, sidewalk additions, school construction and construction of a new public safety facility. At June 30, 2012, the Town had commitments outstanding of approximately $11,326,000.
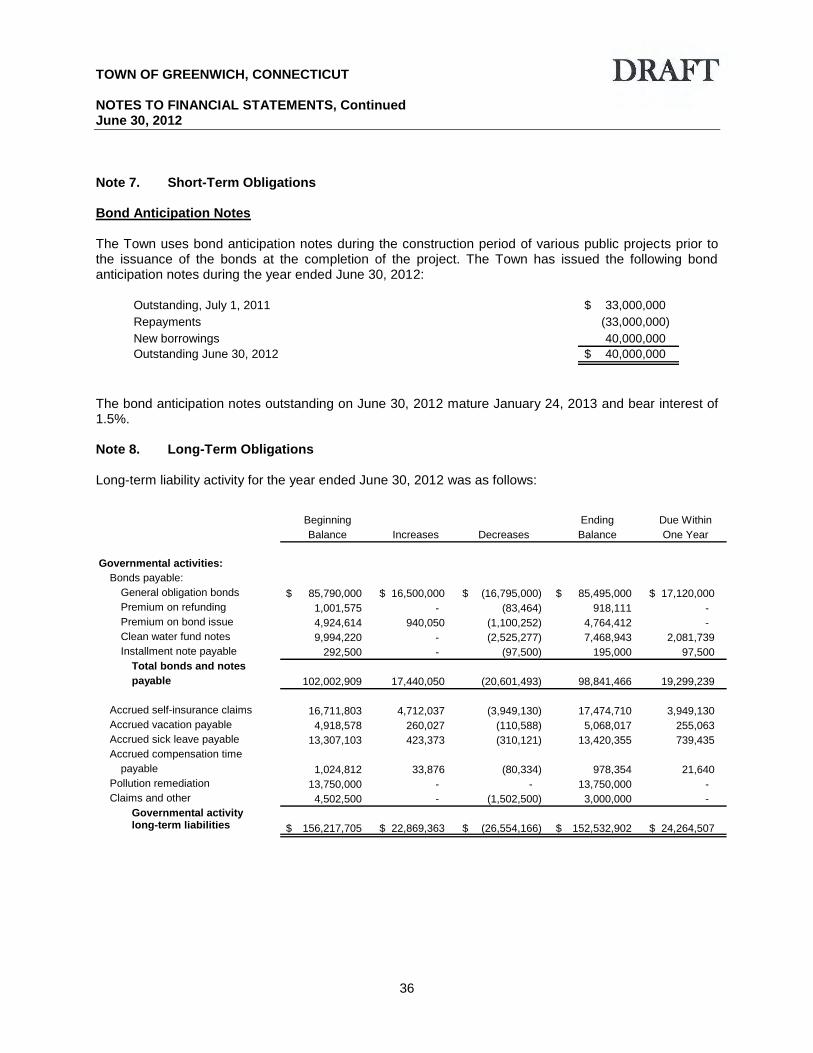
TOWN OF GREENWICH, CONNECTICUT NOTES TO FINANCIAL STATEMENTS, Continued June 30, 2012
36
Note 7. Short-Term Obligations Bond Anticipation Notes The Town uses bond anticipation notes during the construction period of various public projects prior to the issuance of the bonds at the completion of the project. The Town has issued the following bond anticipation notes during the year ended June 30, 2012:
Outstanding, July 1, 2011 33,000,000 $
Repayments (33,000,000)
New borrowings 40,000,000
Outstanding June 30, 2012 40,000,000 $
The bond anticipation notes outstanding on June 30, 2012 mature January 24, 2013 and bear interest of 1.5%. Note 8. Long-Term Obligations Long-term liability activity for the year ended June 30, 2012 was as follows:
Beginning Ending Due Within
Balance Increases Decreases Balance One Year
Governmental activities:
Bonds payable:
General obligation bonds 85,790,000 $ 16,500,000 $ (16,795,000) $ 85,495,000 $ 17,120,000 $
Premium on refunding 1,001,575 - (83,464) 918,111 -
Premium on bond issue 4,924,614 940,050 (1,100,252) 4,764,412 -
Clean water fund notes 9,994,220 - (2,525,277) 7,468,943 2,081,739
Installment note payable 292,500 - (97,500) 195,000 97,500
Total bonds and notes
payable 102,002,909 17,440,050 (20,601,493) 98,841,466 19,299,239
Accrued self-insurance claims 16,711,803 4,712,037 (3,949,130) 17,474,710 3,949,130
Accrued vacation payable 4,918,578 260,027 (110,588) 5,068,017 255,063
Accrued sick leave payable 13,307,103 423,373 (310,121) 13,420,355 739,435
Accrued compensation time
payable 1,024,812 33,876 (80,334) 978,354 21,640
Pollution remediation 13,750,000 - - 13,750,000 -
Claims and other 4,502,500 - (1,502,500) 3,000,000 -
Governmental activitylong-term liabilities 156,217,705 $ 22,869,363 $ (26,554,166) $ 152,532,902 $ 24,264,507 $
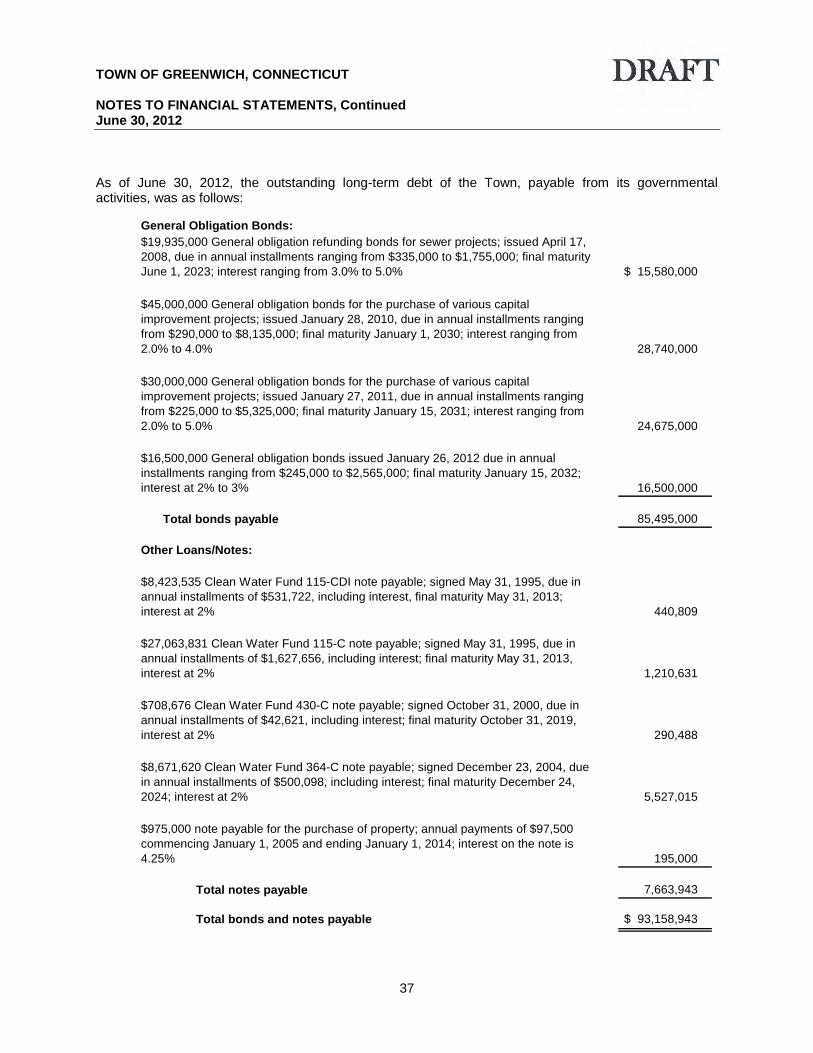
TOWN OF GREENWICH, CONNECTICUT NOTES TO FINANCIAL STATEMENTS, Continued June 30, 2012
37
As of June 30, 2012, the outstanding long-term debt of the Town, payable from its governmental activities, was as follows:
General Obligation Bonds:
$19,935,000 General obligation refunding bonds for sewer projects; issued April 17,
2008, due in annual installments ranging from $335,000 to $1,755,000; final maturity
June 1, 2023; interest ranging from 3.0% to 5.0% $ 15,580,000
$45,000,000 General obligation bonds for the purchase of various capital
improvement projects; issued January 28, 2010, due in annual installments ranging
from $290,000 to $8,135,000; final maturity January 1, 2030; interest ranging from
2.0% to 4.0% 28,740,000
$30,000,000 General obligation bonds for the purchase of various capital
improvement projects; issued January 27, 2011, due in annual installments ranging
from $225,000 to $5,325,000; final maturity January 15, 2031; interest ranging from
2.0% to 5.0% 24,675,000
$16,500,000 General obligation bonds issued January 26, 2012 due in annual
installments ranging from $245,000 to $2,565,000; final maturity January 15, 2032;
interest at 2% to 3% 16,500,000
Total bonds payable 85,495,000
Other Loans/Notes:
$8,423,535 Clean Water Fund 115-CDI note payable; signed May 31, 1995, due in
annual installments of $531,722, including interest, final maturity May 31, 2013;
interest at 2% 440,809
$27,063,831 Clean Water Fund 115-C note payable; signed May 31, 1995, due in
annual installments of $1,627,656, including interest; final maturity May 31, 2013,
interest at 2% 1,210,631
$708,676 Clean Water Fund 430-C note payable; signed October 31, 2000, due in
annual installments of $42,621, including interest; final maturity October 31, 2019,
interest at 2% 290,488
$8,671,620 Clean Water Fund 364-C note payable; signed December 23, 2004, due
in annual installments of $500,098, including interest; final maturity December 24,
2024; interest at 2% 5,527,015
$975,000 note payable for the purchase of property; annual payments of $97,500
commencing January 1, 2005 and ending January 1, 2014; interest on the note is
4.25% 195,000
Total notes payable 7,663,943
Total bonds and notes payable $ 93,158,943
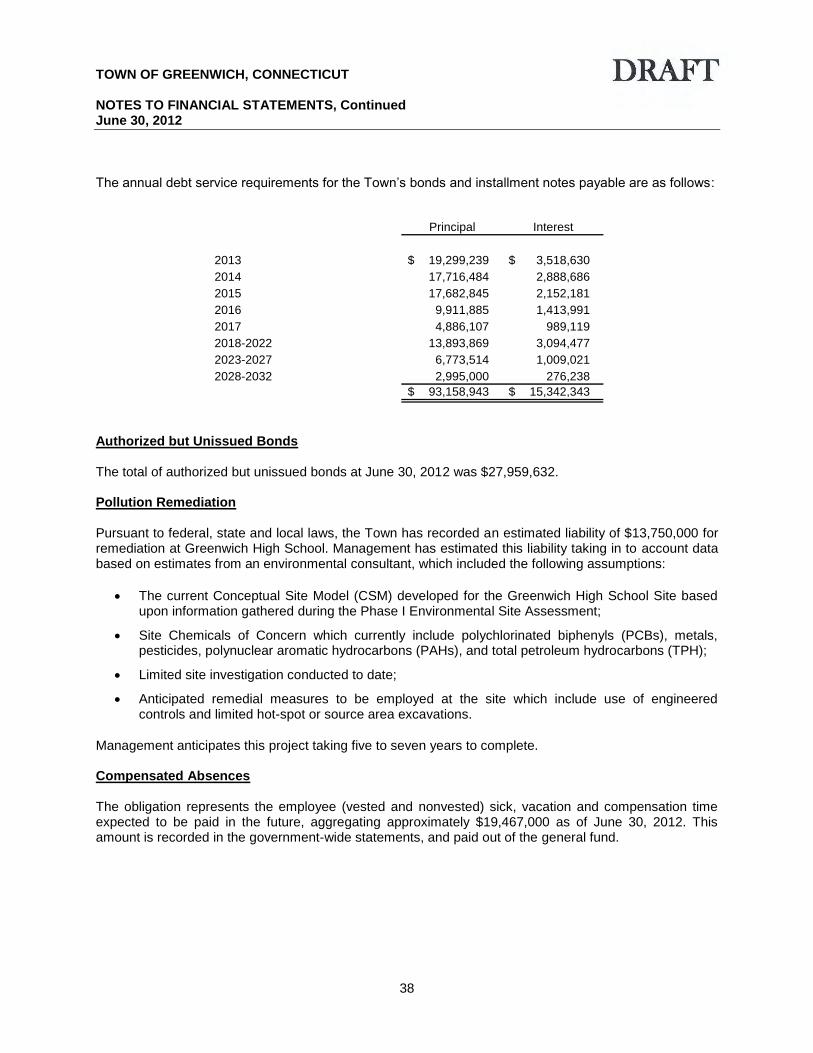
TOWN OF GREENWICH, CONNECTICUT NOTES TO FINANCIAL STATEMENTS, Continued June 30, 2012
38
The annual debt service requirements for the Town’s bonds and installment notes payable are as follows:
Principal Interest
2013 19,299,239 $ 3,518,630 $
2014 17,716,484 2,888,686
2015 17,682,845 2,152,181
2016 9,911,885 1,413,991
2017 4,886,107 989,119
2018-2022 13,893,869 3,094,477
2023-2027 6,773,514 1,009,021
2028-2032 2,995,000 276,238
93,158,943 $ 15,342,343 $
Authorized but Unissued Bonds The total of authorized but unissued bonds at June 30, 2012 was $27,959,632. Pollution Remediation Pursuant to federal, state and local laws, the Town has recorded an estimated liability of $13,750,000 for remediation at Greenwich High School. Management has estimated this liability taking in to account data based on estimates from an environmental consultant, which included the following assumptions:
The current Conceptual Site Model (CSM) developed for the Greenwich High School Site based upon information gathered during the Phase I Environmental Site Assessment;
Site Chemicals of Concern which currently include polychlorinated biphenyls (PCBs), metals, pesticides, polynuclear aromatic hydrocarbons (PAHs), and total petroleum hydrocarbons (TPH);
Limited site investigation conducted to date;
Anticipated remedial measures to be employed at the site which include use of engineered controls and limited hot-spot or source area excavations.
Management anticipates this project taking five to seven years to complete. Compensated Absences The obligation represents the employee (vested and nonvested) sick, vacation and compensation time expected to be paid in the future, aggregating approximately $19,467,000 as of June 30, 2012. This amount is recorded in the government-wide statements, and paid out of the general fund.
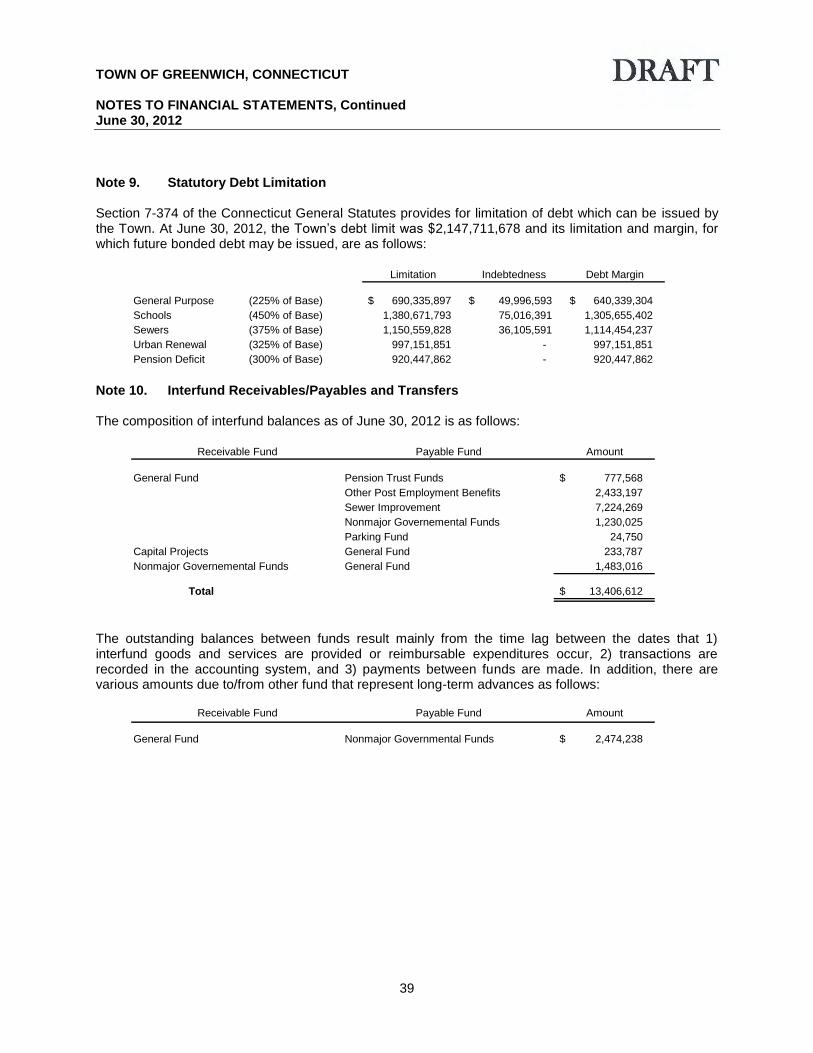
TOWN OF GREENWICH, CONNECTICUT NOTES TO FINANCIAL STATEMENTS, Continued June 30, 2012
39
Note 9. Statutory Debt Limitation Section 7-374 of the Connecticut General Statutes provides for limitation of debt which can be issued by the Town. At June 30, 2012, the Town’s debt limit was $2,147,711,678 and its limitation and margin, for which future bonded debt may be issued, are as follows:
Limitation Indebtedness Debt Margin
General Purpose (225% of Base) 690,335,897 $ 49,996,593 $ 640,339,304 $
Schools (450% of Base) 1,380,671,793 75,016,391 1,305,655,402
Sewers (375% of Base) 1,150,559,828 36,105,591 1,114,454,237
Urban Renewal (325% of Base) 997,151,851 - 997,151,851
Pension Deficit (300% of Base) 920,447,862 - 920,447,862 Note 10. Interfund Receivables/Payables and Transfers The composition of interfund balances as of June 30, 2012 is as follows:
Receivable Fund Payable Fund Amount
General Fund Pension Trust Funds 777,568 $
Other Post Employment Benefits 2,433,197
Sewer Improvement 7,224,269
Nonmajor Governemental Funds 1,230,025
Parking Fund 24,750
Capital Projects General Fund 233,787
Nonmajor Governemental Funds General Fund 1,483,016
Total 13,406,612 $
The outstanding balances between funds result mainly from the time lag between the dates that 1) interfund goods and services are provided or reimbursable expenditures occur, 2) transactions are recorded in the accounting system, and 3) payments between funds are made. In addition, there are various amounts due to/from other fund that represent long-term advances as follows:
Receivable Fund Payable Fund Amount
General Fund Nonmajor Governmental Funds 2,474,238 $

TOWN OF GREENWICH, CONNECTICUT NOTES TO FINANCIAL STATEMENTS, Continued June 30, 2012
40
The interfund transfers that occurred during the year are as follows:
Capital Nonmajor
General Projects Governmental Parking Total
Fund Fund Funds Fund Transfers-In
Transfers in:
General Fund -$ 1,034,000 $ 2,420,895 $ 544,000 $ 3,998,895 $
Sewer Improvement 1,750,000 - - - 1,750,000
Capital Projects 12,328,000 1,721,097 - - 14,049,097
Nonmajor Governmental
Funds 133,000 767,933 1,721,097 - 2,622,030
Parking 344,000 - - - 344,000
Total Transfers Out 14,555,000 $ 3,523,030 $ 4,141,992 $ 544,000 $ 22,764,022 $
Transfers Out
Transfers are used to account for unrestricted revenues collected mainly in the General Fund to finance various programs accounted for in other funds in accordance with budget authorizations. The transfers from the General Fund to the Capital Projects and Sewer Improvement Funds are to provide resources for various capital expenditures. Transfers to the pension and other post-employment benefit funds are to provide resources for benefit payments.

TOWN OF GREENWICH, CONNECTICUT NOTES TO FINANCIAL STATEMENTS, Continued June 30, 2012
41
Note 11. Fund Balance
The components of fund balance as of June 30, 2012 are as follows:
Sewer Capital Nonmajor
General Improvement Projects Governmental
Fund Fund Fund Funds Total
Fund balance:
Nonspendable:
Inventory -$ -$ -$ 25,771 $ 25,771 $
Long-term receivables 2,474,238 - - - 2,474,238
2,474,238 - - 25,771 2,500,009
Restricted to:
Public safety - - - 545,624 545,624
Health - - - 140,150 140,150
- - - 685,774 685,774
Committed to:
Capital projects - - - 2,729,759 2,729,759
General government 21,140 - - - 21,140
Public works - - - 7,363,264 7,363,264
21,140 - - 10,093,023 10,114,163
Assigned to:
Assigned to subsequent
year's budget 6,904,000 - - - 6,904,000
General government 906,973 - - - 906,973
Public safety 451,165 - - - 451,165
Public works 835,721 - - - 835,721
Health 20,982 - - - 20,982
Social services 28,178 - - - 28,178
Schools 2,193,292 - - - 2,193,292
Libraries 111,779 - - - 111,779
Parks and recreation 291,022 - - - 291,022
Fixed charges 674,346 - - - 674,346
12,417,458 - - - 12,417,458
Unassigned 12,631,251 (1,558,545) (13,379,132) (604,300) (2,910,726)
Total Fund Balances 27,544,087 $ (1,558,545) $ (13,379,132) $ 10,200,268 $ 22,806,678 $
Significant encumbrances at June 30, 2012 are contained in the above table in the assigned category of the General Fund.
Note 12. Employee Retirement Plans
The Town is responsible for the administration of two pension plans - the Retirement System of the Town of Greenwich (the System) and the Police Benefit Fund (PBF). All regular, full-time employees of the Town except certified teachers, who are covered under the State of Connecticut Teachers’ Retirement System, participate in the System. Under provisions of the System benefit formulae, retirement ages and vesting vary between police, fire and other covered employees. Certain retired police in Town service prior to 1953 participate in the PBF; however, no new members are allowed to participate.
TOWN OF GREENWICH, CONNECTICUT NOTES TO FINANCIAL STATEMENTS, Continued June 30, 2012
42
The Retirement System of the Town of Greenwich (the System)
The System began operations as of January 1, 1946. The System is a single-employer defined benefit pension plan supported by the contributions of the members and the Town. The annual actuarial valuation is made to determine whether the contributions are sufficient to meet the plan obligations. The latest actuarial valuation was made at July 1, 2010. The Town’s pension plans do not, however, issue stand-alone financial reports.
The System is authorized under Article 14 of the Town Charter, which, together with the pension provisions of the labor contracts, establishes all benefit provisions. Coverage is extended to all regular full-time employees in the service of the Town who are classified as General, Fire or Police personnel. Appointed or elected officials are also eligible for membership in the System if they serve on a paid full-time basis.
The normal form of benefit is an allowance payable during the life of the member with the excess of accumulated deductions at the time of retirement over the annuity payments made, if any, being payable to their designated beneficiary.
The plan provides a Service Retirement for general employees that are (a) age 65, or (b) have met the Rule of 80 (sum of age plus years of service). For firefighters and police officers, a Service Retirement is earned with the completion of 20 years of service. A general employee may retire on a reduced Early Service Retirement provided he/she has attained age 60, but has not completed the minimum requirements for a service retirement. The maximum benefit for a service retirement for a general employee, except MC employees (Management/Confidential) and full-time elected officials is 1/50 multiplied by final compensation multiplied by years of creditable service. The MC employees and full-time elected officials’ rate of benefit is 1/40 for the first 20 years of creditable service and 1/50 thereafter. The maximum benefit for a service retirement for a firefighter or police officer is 1/40 multiplied by final compensation multiplied by years of creditable service. The maximum benefit cannot exceed 2/3 of the employee’s final compensation for general employees and 3/4 for police officers and firefighters.
Disability benefits may be payable for those employees who become totally mentally or physically incapacitated for the further performance of duty, provided that a medical examiner appointed by the Retirement Board can certify that such incapacity is likely to be permanent and the Retirement Board concurs. Benefits are provided for both duty and non-duty related disabilities. The plan also provides for death benefits both before and after retirement.
Any general employee, police officer or firefighter who terminates service after completion of 10 years of creditable service (5 years for MC, LIUNA, GMEA, Teamsters and nurses), may elect to receive a vesting retirement allowance. The vesting retirement allowance is a deferred allowance commencing at age 65 or compliance with the Rule of 80 in the case of a general employee and age 55 in the case of a police officer and age 50 for a firefighter. The benefit is computed as a service retirement allowance on the basis of the employee’s final compensation and creditable service to the date of termination of service.
Employees should not rely solely upon this synopsis of pension benefit provisions. Article 14 of the Town Charter, together with the pension provisions of the labor contracts, are at all times the official source of plan provisions.
Employer Contributions
The Town’s annual contribution to the System is actuarially determined and is intended to set aside amounts to cover the costs related both to current and future service rendered by employees. In order to arrive at the Town’s annual contribution, these costs are calculated on an individual entry age basis.

TOWN OF GREENWICH, CONNECTICUT NOTES TO FINANCIAL STATEMENTS, Continued June 30, 2012
43
Member Contributions The contributions are based on a percentage of annual earnable compensation which is 5% for the police and fire employees and 4% for general employees. Management/Confidential employees and elected officials are not required to contribute to the plan. The mandatory contributions may be reduced by the amount withheld for FICA as an option available to general employees. The actuarial valuation method used was the entry age normal actuarial cost method. The Retirement Board had adopted assumptions for interest rate (7.75%) and salary scales as follows:
General Employees - 3.25%-8.68% for inflation with merit/seniority adjustments ranging from 2.0% to 0.5%.
Police and Fire Employees - 4.00%-11.00% for inflation with merit/seniority adjustments ranging from 7.5% to 0.5%.
The System uses a market-related method that recognizes 20% per year of the unrealized gain or loss in investments to develop an actuarial asset value. Other actuarial assumptions used include:
Remaining amortization period - 22 years.
Amortization method - level dollar on a closed basis.
Membership in the plan consisted of the following at July 1, 2010, the date of the last actuarial valuation:
Retirees and beneficiaries receiving benefits 1,092 $
Inactive vested members 171
Active plan members 1,177
Total 2,440 $
The Town’s plans, including the employer and employee obligations to contribute, are established under the authority of Article 14 of the Town’s Charter. The Town’s plans, by policy, (i) require annual actuarial valuations, with yearly updates, and (ii) require annual Town contributions based on actuarial determinations. During the year of actuarial valuation, the Town has historically contributed the annual required contribution (ARC) of the pension plan. Any difference between the ARC and the actual contribution made has been settled by the next actuarial valuation date, and thus the Town has never actually had, or had need to report, a net pension obligation (NPO).
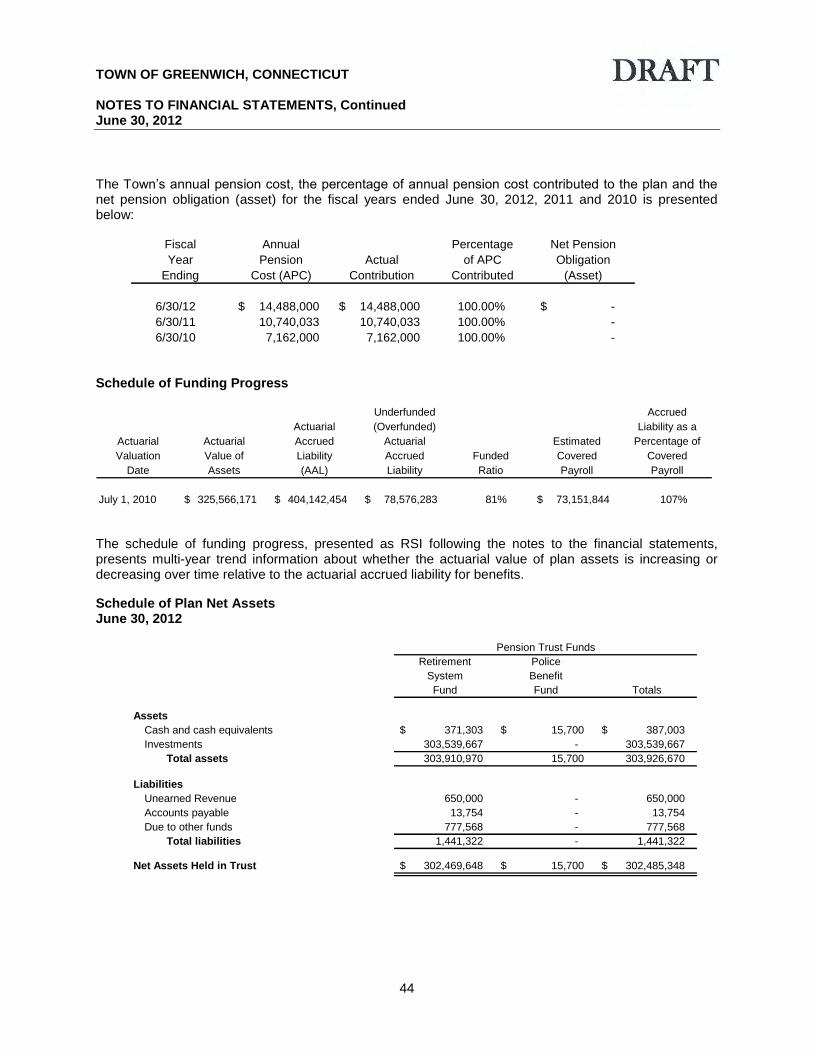
TOWN OF GREENWICH, CONNECTICUT NOTES TO FINANCIAL STATEMENTS, Continued June 30, 2012
44
The Town’s annual pension cost, the percentage of annual pension cost contributed to the plan and the net pension obligation (asset) for the fiscal years ended June 30, 2012, 2011 and 2010 is presented below:
Fiscal Annual Percentage Net Pension
Year Pension Actual of APC Obligation
Ending Cost (APC) Contribution Contributed (Asset)
6/30/12 14,488,000 $ 14,488,000 $ 100.00% -$
6/30/11 10,740,033 10,740,033 100.00% -
6/30/10 7,162,000 7,162,000 100.00% -
Schedule of Funding Progress
Underfunded Accrued
Actuarial (Overfunded) Liability as a
Actuarial Actuarial Accrued Actuarial Estimated Percentage of
Valuation Value of Liability Accrued Funded Covered Covered
Date Assets (AAL) Liability Ratio Payroll Payroll
July 1, 2010 325,566,171 $ 404,142,454 $ 78,576,283 $ 81% 73,151,844 $ 107%
The schedule of funding progress, presented as RSI following the notes to the financial statements, presents multi-year trend information about whether the actuarial value of plan assets is increasing or decreasing over time relative to the actuarial accrued liability for benefits.
Schedule of Plan Net Assets June 30, 2012
Retirement Police
System Benefit
Fund Fund Totals
Assets
Cash and cash equivalents 371,303 $ 15,700 $ 387,003 $
Investments 303,539,667 - 303,539,667
Total assets 303,910,970 15,700 303,926,670
Liabilities
Unearned Revenue 650,000 - 650,000
Accounts payable 13,754 - 13,754
Due to other funds 777,568 - 777,568
Total liabilities 1,441,322 - 1,441,322
Net Assets Held in Trust 302,469,648 $ 15,700 $ 302,485,348 $
Pension Trust Funds

TOWN OF GREENWICH, CONNECTICUT NOTES TO FINANCIAL STATEMENTS, Continued June 30, 2012
45
Schedule of Changes in Plan Net Assets Year Ended June 30, 2012
Reserves for Police
Membership Member Benefit
Annuities Contributions Total Fund Totals
Additions
Contributions:
Employer 14,488,000 - 14,488,000 $ 184,813 14,672,813
Plan members - 2,257,241 2,257,241 - 2,257,241
Other - 329,679 329,679 - 329,679
Total contributions 14,488,000 2,586,920 17,074,920 184,813 17,259,733
Investment earnings:
Net decrease in fair
value of investments (1,153,450) - (1,153,450) - (1,153,450)
Interest and dividends 4,161,182 359,921 4,521,103 - 4,521,103
Total investment earnings 3,007,732 359,921 3,367,653 - 3,367,653
Less investment expenses 259,091 - 259,091 259,091
Total additions 17,236,641 2,946,841 20,183,482 184,813 20,368,295
Deductions
Pension payments 23,046,678 - 23,046,678 184,813 23,231,491
Administrative costs 452,105 - 452,105 - 452,105
Contributions refunded - 114,350 114,350 - 114,350
Annuities Awarded (3,076,719) 3,076,719 - - -
Total deductions 20,422,064 3,191,069 23,613,133 184,813 23,797,946
Change in net assets (3,185,423) (244,228) (3,429,651) - (3,429,651)
Net Assets Held in Trust
Beginning of year 261,940,540 43,958,759 305,899,299 15,700 305,914,999
End of year 258,755,117 $ 43,714,531 $ 302,469,648 $ 15,700 $ 302,485,348 $
Pension Trust Funds
Retirement System Fund
Connecticut State Teachers’ Retirement System The faculty and professional personnel of the Board of Education participate in a contributory cost-sharing multi-employer defined benefit plan, established under Chapter 167a of the Connecticut General Statutes, which is administered by the Connecticut State Teachers’ Retirement Board. A teacher is eligible to receive normal retirement benefits if he or she has attained age 60 and has accumulated 20 years of credited service in the public schools of Connecticut or has attained any age and has accumulated 35 years of credited service, at least 25 of which are service in the public schools of Connecticut. The financial statements of the plan are available from the Connecticut State Teachers’ Retirement Board, 21 Grand Street, Hartford, CT 06105. Certain part-time and full-time certified teachers are eligible to participate in the plan and are required to contribute 7.25% of their annual earnings to the plan. The Town does not, and is not legally responsible to, contribute to the plan.
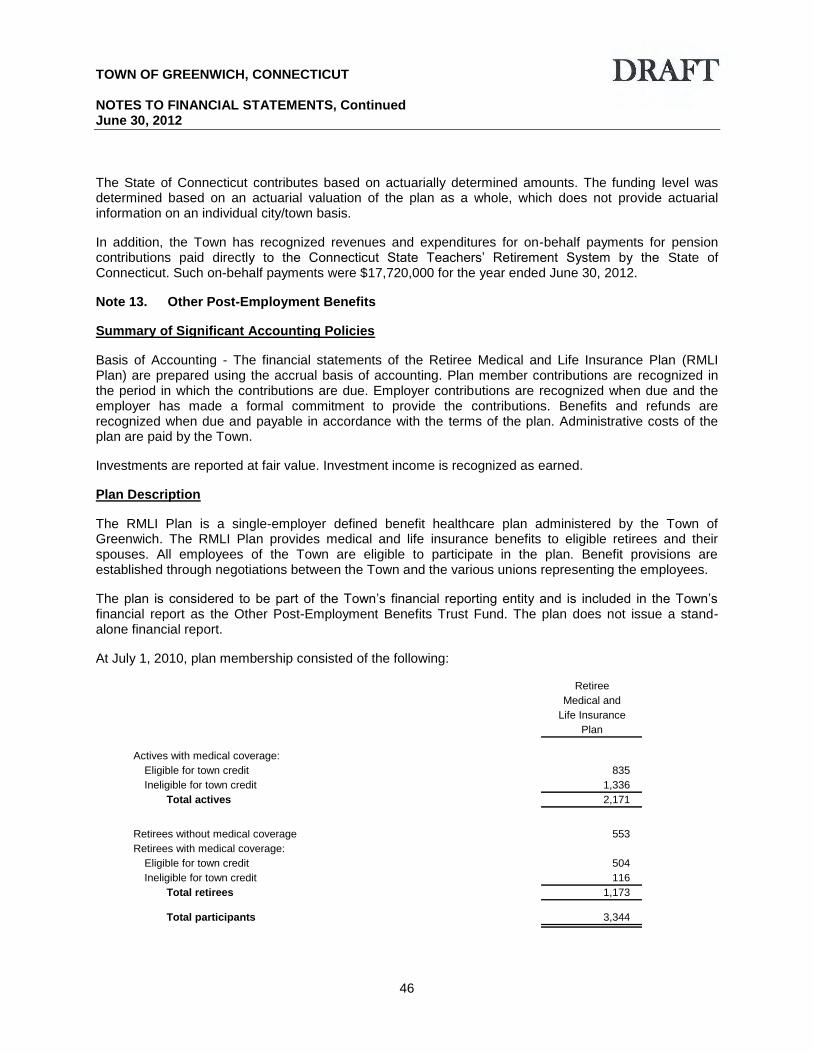
TOWN OF GREENWICH, CONNECTICUT NOTES TO FINANCIAL STATEMENTS, Continued June 30, 2012
46
The State of Connecticut contributes based on actuarially determined amounts. The funding level was determined based on an actuarial valuation of the plan as a whole, which does not provide actuarial information on an individual city/town basis.
In addition, the Town has recognized revenues and expenditures for on-behalf payments for pension contributions paid directly to the Connecticut State Teachers’ Retirement System by the State of Connecticut. Such on-behalf payments were $17,720,000 for the year ended June 30, 2012.
Note 13. Other Post-Employment Benefits
Summary of Significant Accounting Policies
Basis of Accounting - The financial statements of the Retiree Medical and Life Insurance Plan (RMLI Plan) are prepared using the accrual basis of accounting. Plan member contributions are recognized in the period in which the contributions are due. Employer contributions are recognized when due and the employer has made a formal commitment to provide the contributions. Benefits and refunds are recognized when due and payable in accordance with the terms of the plan. Administrative costs of the plan are paid by the Town.
Investments are reported at fair value. Investment income is recognized as earned.
Plan Description
The RMLI Plan is a single-employer defined benefit healthcare plan administered by the Town of Greenwich. The RMLI Plan provides medical and life insurance benefits to eligible retirees and their spouses. All employees of the Town are eligible to participate in the plan. Benefit provisions are established through negotiations between the Town and the various unions representing the employees.
The plan is considered to be part of the Town’s financial reporting entity and is included in the Town’s financial report as the Other Post-Employment Benefits Trust Fund. The plan does not issue a stand-alone financial report.
At July 1, 2010, plan membership consisted of the following:
Retiree
Medical and
Life Insurance
Plan
Actives with medical coverage:
Eligible for town credit 835
Ineligible for town credit 1,336
Total actives 2,171
Retirees without medical coverage 553
Retirees with medical coverage:
Eligible for town credit 504
Ineligible for town credit 116
Total retirees 1,173
Total participants 3,344
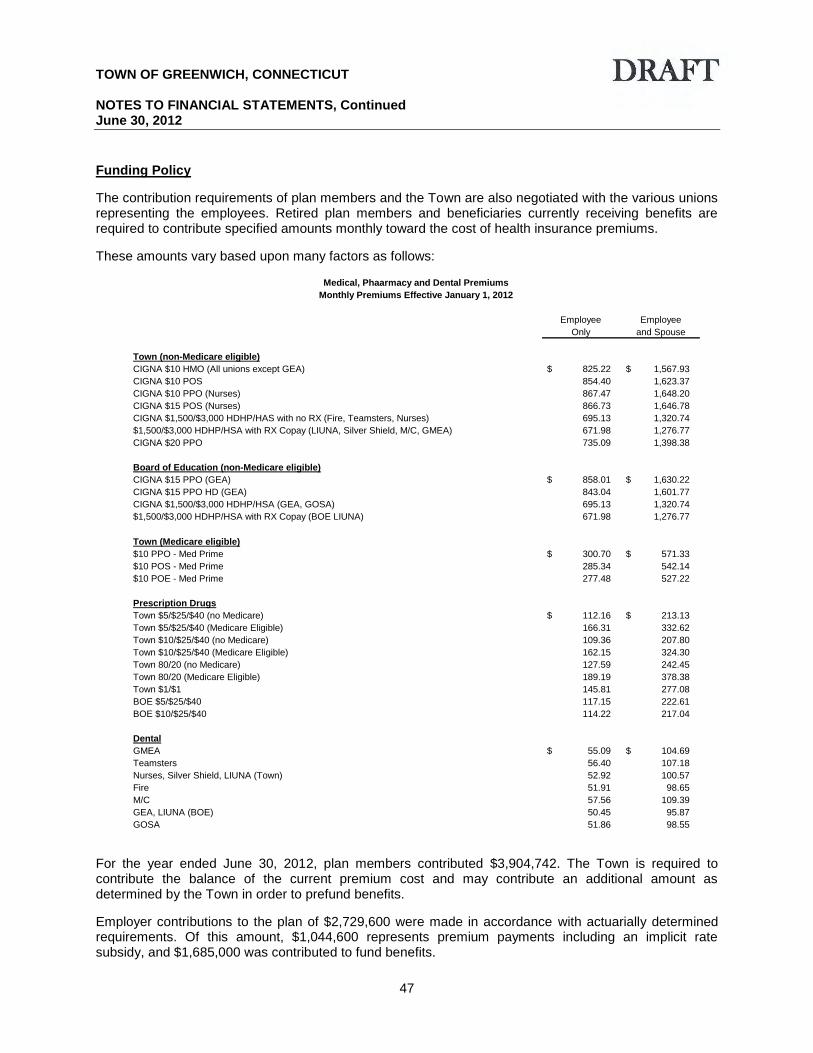
TOWN OF GREENWICH, CONNECTICUT NOTES TO FINANCIAL STATEMENTS, Continued June 30, 2012
47
Funding Policy
The contribution requirements of plan members and the Town are also negotiated with the various unions representing the employees. Retired plan members and beneficiaries currently receiving benefits are required to contribute specified amounts monthly toward the cost of health insurance premiums.
These amounts vary based upon many factors as follows:
Employee Employee
Only and Spouse
Town (non-Medicare eligible)
CIGNA $10 HMO (All unions except GEA) 825.22 $ 1,567.93 $
CIGNA $10 POS 854.40 1,623.37
CIGNA $10 PPO (Nurses) 867.47 1,648.20
CIGNA $15 POS (Nurses) 866.73 1,646.78
CIGNA $1,500/$3,000 HDHP/HAS with no RX (Fire, Teamsters, Nurses) 695.13 1,320.74
$1,500/$3,000 HDHP/HSA with RX Copay (LIUNA, Silver Shield, M/C, GMEA) 671.98 1,276.77
CIGNA $20 PPO 735.09 1,398.38
Board of Education (non-Medicare eligible)
CIGNA $15 PPO (GEA) 858.01 $ 1,630.22 $
CIGNA $15 PPO HD (GEA) 843.04 1,601.77
CIGNA $1,500/$3,000 HDHP/HSA (GEA, GOSA) 695.13 1,320.74
$1,500/$3,000 HDHP/HSA with RX Copay (BOE LIUNA) 671.98 1,276.77
Town (Medicare eligible)
$10 PPO - Med Prime 300.70 $ 571.33 $
$10 POS - Med Prime 285.34 542.14
$10 POE - Med Prime 277.48 527.22
Prescription Drugs
Town $5/$25/$40 (no Medicare) 112.16 $ 213.13 $
Town $5/$25/$40 (Medicare Eligible) 166.31 332.62
Town $10/$25/$40 (no Medicare) 109.36 207.80
Town $10/$25/$40 (Medicare Eligible) 162.15 324.30
Town 80/20 (no Medicare) 127.59 242.45
Town 80/20 (Medicare Eligible) 189.19 378.38
Town $1/$1 145.81 277.08
BOE $5/$25/$40 117.15 222.61
BOE $10/$25/$40 114.22 217.04
Dental
GMEA 55.09 $ 104.69 $
Teamsters 56.40 107.18
Nurses, Silver Shield, LIUNA (Town) 52.92 100.57
Fire 51.91 98.65
M/C 57.56 109.39
GEA, LIUNA (BOE) 50.45 95.87
GOSA 51.86 98.55
Medical, Phaarmacy and Dental Premiums
Monthly Premiums Effective January 1, 2012
For the year ended June 30, 2012, plan members contributed $3,904,742. The Town is required to contribute the balance of the current premium cost and may contribute an additional amount as determined by the Town in order to prefund benefits.
Employer contributions to the plan of $2,729,600 were made in accordance with actuarially determined requirements. Of this amount, $1,044,600 represents premium payments including an implicit rate subsidy, and $1,685,000 was contributed to fund benefits.
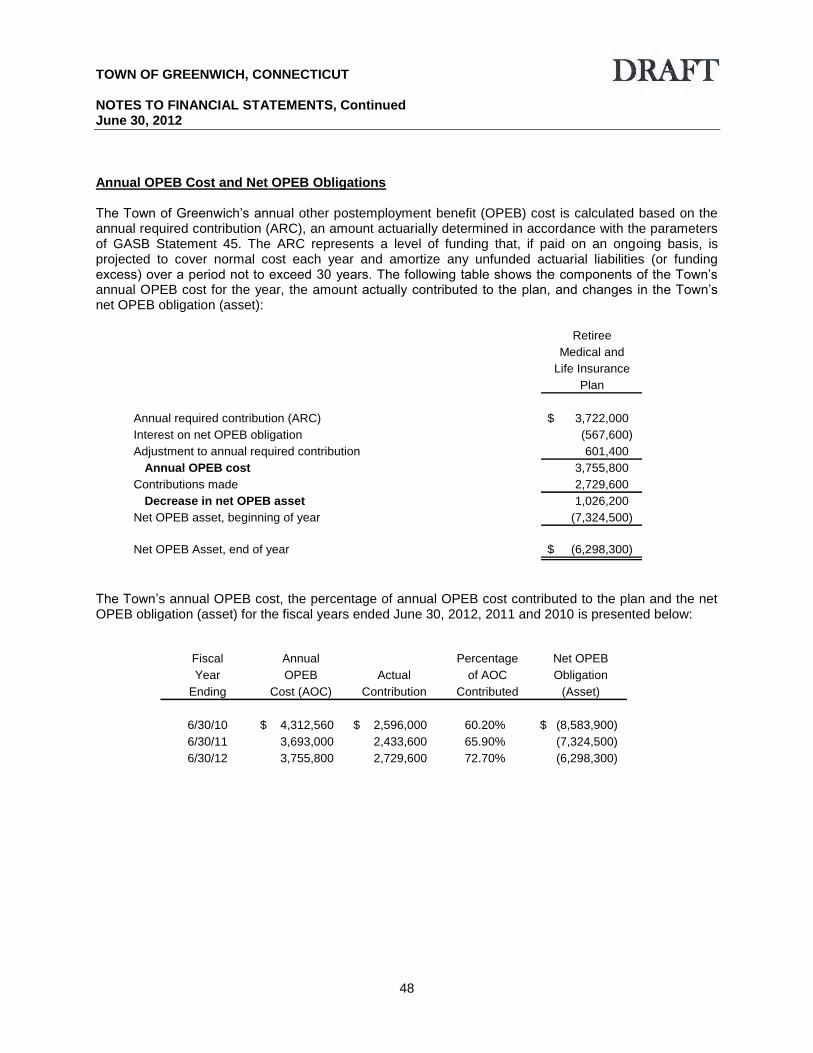
TOWN OF GREENWICH, CONNECTICUT NOTES TO FINANCIAL STATEMENTS, Continued June 30, 2012
48
Annual OPEB Cost and Net OPEB Obligations The Town of Greenwich’s annual other postemployment benefit (OPEB) cost is calculated based on the annual required contribution (ARC), an amount actuarially determined in accordance with the parameters of GASB Statement 45. The ARC represents a level of funding that, if paid on an ongoing basis, is projected to cover normal cost each year and amortize any unfunded actuarial liabilities (or funding excess) over a period not to exceed 30 years. The following table shows the components of the Town’s annual OPEB cost for the year, the amount actually contributed to the plan, and changes in the Town’s net OPEB obligation (asset):
Retiree
Medical and
Life Insurance
Plan
Annual required contribution (ARC) 3,722,000 $
Interest on net OPEB obligation (567,600)
Adjustment to annual required contribution 601,400
Annual OPEB cost 3,755,800
Contributions made 2,729,600
Decrease in net OPEB asset 1,026,200
Net OPEB asset, beginning of year (7,324,500)
Net OPEB Asset, end of year (6,298,300) $
The Town’s annual OPEB cost, the percentage of annual OPEB cost contributed to the plan and the net OPEB obligation (asset) for the fiscal years ended June 30, 2012, 2011 and 2010 is presented below:
Fiscal Annual Percentage Net OPEB
Year OPEB Actual of AOC Obligation
Ending Cost (AOC) Contribution Contributed (Asset)
6/30/10 4,312,560 $ 2,596,000 $ 60.20% (8,583,900) $
6/30/11 3,693,000 2,433,600 65.90% (7,324,500)
6/30/12 3,755,800 2,729,600 72.70% (6,298,300)

TOWN OF GREENWICH, CONNECTICUT NOTES TO FINANCIAL STATEMENTS, Continued June 30, 2012
49
Schedule of Funding Progress
Unfunded
Actuarial
Accrued
Actuarial Unfunded Liability as a
Actuarial Actuarial Accrued Actuarial Estimated Percentage of
Valuation Value of Liability Accrued Funded Covered Covered
Date Assets (AAL) Liability Ratio Payroll Payroll
July 1, 2010 16,323,000 $ 51,807,000 $ 35,484,000 $ 31.5% 166,004,000 $ 21.4%
The schedule of funding progress, presented as RSI following the notes to the financial statements, presents multi-year trend information about whether the actuarial value of plan assets is increasing or decreasing over time relative to the actuarial accrued liability for benefits.
Actuarial valuations of an ongoing plan involve estimates of the value of reported amounts and assumptions about the probability of occurrence of events far into the future. Examples include assumptions about future employment, mortality and the healthcare cost trend. Amounts determined regarding the funded status of the plan and the annual required contributions of the employer are subject to continual revision as accrual results are compared with past expectations and new estimates are made about the future. The schedule of funding progress presents multi-year trend information about whether the actuarial value of plan assets is increasing or decreasing over time relative to the actuarial accrued liabilities for benefits.
Projections for benefits for financial reporting purposes are based on the substantive plan (the plan as understood by the employer and plan members) and include the types of benefits provided at the time of each valuation and the historical pattern of sharing benefit costs between the employer and plan members to that point. The actuarial methods and assumptions used include techniques that are designed to reduce the effects of short-term volatility in actuarial accrued liabilities and the actuarial value of assets, consistent with the long-term perspective of the calculations.
In the July 1, 2010 actuarial valuation, the aggregate entry age normal actuarial cost method was used. The actuarial assumptions include a 7.75% investment rate of return, which is the rate of the expected long-term investment returns of plan assets calculated based on the funding policy of the plan at the valuation date. The annual healthcare cost trend rate is 10% initially, reduced by decrements to an ultimate rate of 5% after five years. The general inflation assumption is 4%. Projected salary increases were 3.75% per year. The actuarial value of assets is calculated based on a 5-year smoothing of the difference between the actual market value, and the expected actuarial value. The UAAL is being amortized as a level percentage of projected payroll on an open basis. The remaining amortization period at July 1, 2010 was 28 years.
Note 14. Contingencies
Other than as described in the next paragraph, there are several personal injury, negligence and personnel related lawsuits pending against the Town. The outcome and eventual liability of the Town, if any, in these cases is not known at this time. Based upon consultation with legal counsel, the Town’s management estimates that potential claims against the Town not covered by insurance resulting from such litigation would not materially affect the financial position of the Town. The Town has recorded in the government-wide financial statements $3 million to cover probable claims not covered by insurance.

TOWN OF GREENWICH, CONNECTICUT NOTES TO FINANCIAL STATEMENTS, Continued June 30, 2012
50
The Town is involved in a certain litigation matter in which the outcome is not possible to predict at this time. Although the Town believes it has a substantial defense in this matter, if the Town is found liable from such litigation, it could have a material effect on the financial position of the Town. As the amount is not possible to estimate at this time, no amount has been accrued. Note 15. Risk Management The Town is exposed to various risks of loss related to torts; theft of, damage to and destruction of assets; errors and omissions; injuries to employees; employee health; heart and hypertension benefits; and natural disasters. The Town carries commercial insurance for insurable risks of loss under most coverages with the exception of risks associated with dental, employee prescriptions, heart and hypertension benefits and workers’ compensation benefits. For the risk associated with worker compensation benefits, the Town purchases commercial insurance for individual claims in excess of $1 million. Coverage has not been materially reduced, nor have settled claims exceeded commercial coverage in any of the past three years. Liabilities for claims are recorded in the government-wide statements. A roll-forward of the current and prior years’ claims liability, for which the Town is self-insured, is reported is as follows:
Fiscal Fiscal
2011-2012 2010-11
Claims Liability, July 1 16,711,803 $ 15,447,958 $
Add:
Claims incurred 4,712,037 5,859,576
Deduct:
Payments (3,949,130) (4,595,731)
Claims Liability, June 30 17,474,710 $ 16,711,803 $
Note 16. Deficit Fund Equity The following funds had deficit fund balances at June 30, 2012:
Sewer Improvement Fund (1,558,545) $
Capital Projects Fund (13,379,132)
Public School Revolving Lunch Fund (90,686)
Griffith E. Harris Golf Course Revolving Fund (486,257)
Nathaniel Witherall (1,586) The deficits in the Sewer Improvement Fund and Capital Projects Fund will be eliminated by a future issuance of general obligation bonds and sewer assessment revenue. The deficit in the Public School Revolving Lunch Fund and the Griffith E. Harris Golf Course Revolving Fund will be eliminated through future revenues.

TOWN OF GREENWICH, CONNECTICUT NOTES TO FINANCIAL STATEMENTS, Continued June 30, 2012
51
Note 17. Governmental Accounting Standards Board (GASB) Statements The Governmental Accounting Standards Board (GASB) has issued several pronouncements that have effective dates that may impact future financial presentations. Management has not currently determined what, if any, impact implementation of the following statements may have on the financial statements:
GASB Statement No. 60, Accounting and Financial Reporting for Service Concession Arrangements, issued November 2010, will be effective for the Town beginning with its year ending June 30, 2013. This Statement is intended to improve financial reporting by addressing issues related to service concession arrangements (SCAs), which are a type of public-private or public-public partnership. Specifically, this Statement improves financial reporting by establishing recognition, measurement, and disclosure requirements SCAs for both transferors and governmental operators, requiring governments to account for and report SCAs in the same manner, which improves the comparability of financial statements. This Statement also improves the decision usefulness of financial reporting by requiring that specific relevant disclosures be made by transferors and governmental operators about SCAs.
GASB Statement No. 61, The Financial Reporting Entity: Omnibus an amendment of GASB Statements No. 14 and No. 34, issued November 2010, will be effective for the Town beginning with its year ending June 30, 2013. This Statement is intended to improve financial reporting for a governmental financial reporting entity by improving guidance for including, presenting, and disclosing information about component units and equity interest transactions of a financial reporting entity. The amendments to the criteria for including component units allow users of financial statements to better assess the accountability of elected officials by ensuring that the financial reporting entity includes only organizations for which the elected officials are financially accountable or that are determined by the government to be misleading to exclude. The amendments to the criteria for blending also improve the focus of a financial reporting entity on the primary government by ensuring that the primary government includes only those component units that are so intertwined with the primary government that they are essentially the same as the primary government, and by clarifying which component units have that characteristic.
GASB Statement No. 62, Codification of Accounting and Financial Reporting Guidance Contained in Pre-November 30, 1989 FASB and AICPA Pronouncements, issued January 2011, will be effective for the Town beginning with its year ending June 30, 2013. This Statement is intended to enhance the usefulness of the Codification of Governmental Accounting and Financial Reporting Standards by incorporating guidance that previously could only be found in certain FASB and AICPA pronouncements. This Statement incorporates into the GASB's authoritative literature the applicable guidance previously presented in the following pronouncements issued before November 30, 1989: FASB Statements and Interpretations, Accounting Principles Board Opinions, and Accounting Research Bulletins of the AICPA's Committee on Accounting Procedure. By incorporating and maintaining this guidance in a single source, the GASB believes that GASB 62 reduces the complexity of locating and using authoritative literature needed to prepare state and local government financial reports.
GASB Statement No. 63, Financial Reporting of Deferred Outflows of Resources, Deferred Inflows of Resources, and Net Position, issued July 2011, will be effective for the Town beginning with its year ending June 30, 2013. This Statement is intended to improve financial reporting by providing citizens and other users of state and local government financial reports with information about how past transactions will continue to impact a government's financial statements in the future. This Statement provides a new statement of net position format to report

TOWN OF GREENWICH, CONNECTICUT NOTES TO FINANCIAL STATEMENTS, Continued June 30, 2012
52
all assets, deferred outflows of resources, liabilities deferred inflows of resources, and net position (which is the net residual amount of the other elements). The Statement requires that deferred outflows of resources and deferred inflows of resources be reported separately from assets and liabilities. This Statement also amends certain provisions of Statement No. 34, Basic Financial Statements-and Management's Discussion and Analysis-for State and Local Governments, and related pronouncements to reflect the residual measure in the statement of financial position as net position, rather than net assets.
GASB Statement No. 65, Items Previously Reported as Assets and Liabilities, was issued March 2012. This Statement establishes accounting and financial reporting standards that reclassify, as deferred outflows of resources or deferred inflows of resources, certain items that were previously reported as assets and liabilities and recognizes, as outflows of resources or inflows of resources, certain items that were previously reported as assets and liabilities. The provisions of this Statement will be effective for the Town beginning with its year ending June 30, 2013.
GASB Statement No. 66, Technical Corrections—2012, was issued in March 2012. The objective of this Statement is to improve accounting and financial reporting for a governmental financial reporting entity by resolving conflicting guidance that resulted from the issuance of two pronouncements, Statements No. 54, Fund Balance Reporting and Governmental Fund Type Definitions, and No. 62, Codification of Accounting and Financial Reporting Guidance Contained in Pre-November 30, 1989 FASB and AICPA Pronouncements. The provisions of this Statement will be effective for the Town beginning with its year ending June 30, 2013.
GASB Statement No. 67, Financial Reporting for Pension Plans an amendment of GASB Statement No. 25, was issued in June 2012. The objective of this Statement is to improve financial reporting by state and local governmental pension plans. This Statement results from a comprehensive review of the effectiveness of existing standards of accounting and financial reporting for pensions with regard to providing decision-useful information, supporting assessments of accountability and inter-period equity, and creating additional transparency. This Statement replaces the requirements of Statements No. 25, Financial Reporting for Defined Benefit Pension Plans and Note Disclosures for Defined Contribution Plans, and No. 50, Pension Disclosures, as they relate to pension plans that are administered through trusts or equivalent arrangements (hereafter jointly referred to as trusts) that meet certain criteria. The requirements of Statements 25 and 50 remain applicable to pension plans that are not administered through trusts covered by the scope of this Statement and to defined contribution plans that provide postemployment benefits other than pensions. The provisions of this Statement will be effective for the Town beginning with its year ending June 30, 2013.
GASB Statement No. 68, Accounting and Financial Reporting for Pensions, an amendment of GASB Statement No. 27, was issued in June 2012. The primary objective of this Statement is to improve accounting and financial reporting by state and local governments for pensions. It also improves information provided by state and local governmental employers about financial support for pensions that is provided by other entities. This Statement results from a comprehensive review of the effectiveness of existing standards of accounting and financial reporting for pensions with regard to providing decision-useful information, supporting assessments of accountability and inter-period equity, and creating additional transparency. The provisions of this Statement will be effective for the Town beginning with its year ending June 30, 2014.

REQUIRED SUPPLEMENTARY INFORMATION
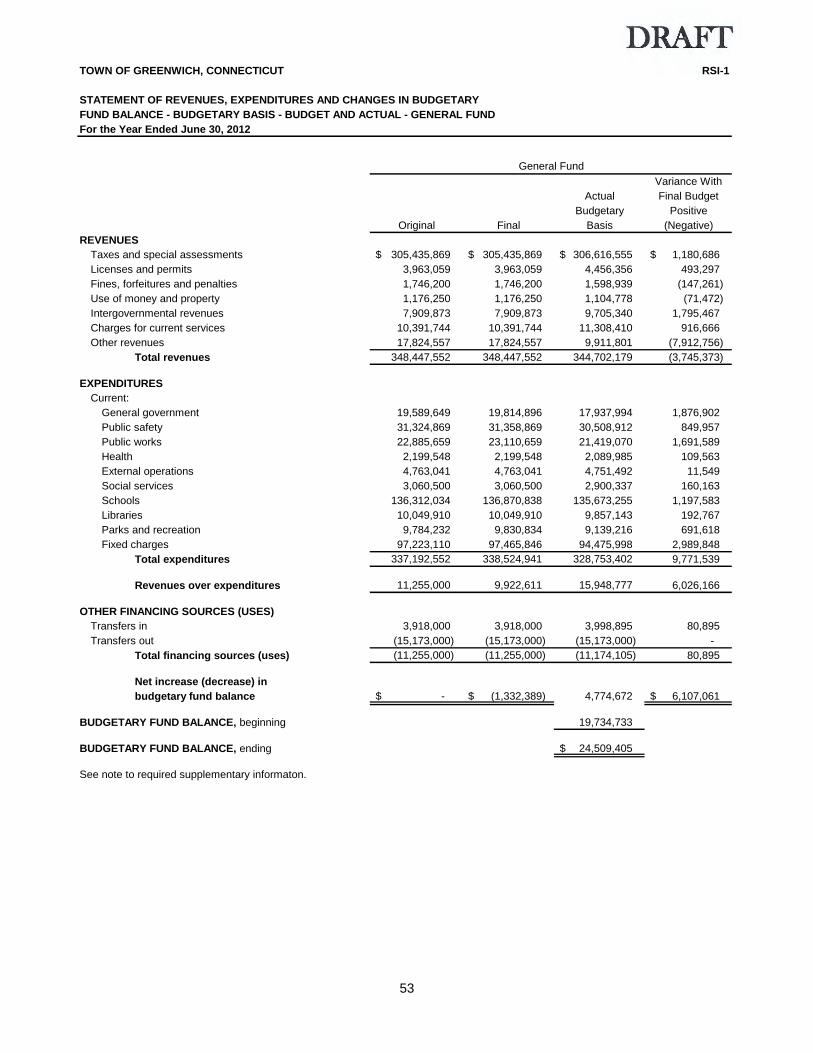
53
TOWN OF GREENWICH, CONNECTICUT RSI-1
STATEMENT OF REVENUES, EXPENDITURES AND CHANGES IN BUDGETARY
FUND BALANCE - BUDGETARY BASIS - BUDGET AND ACTUAL - GENERAL FUND
For the Year Ended June 30, 2012
Variance With
Actual Final Budget
Budgetary Positive
Original Final Basis (Negative)
REVENUES
Taxes and special assessments 305,435,869 $ 305,435,869 $ 306,616,555 $ 1,180,686 $
Licenses and permits 3,963,059 3,963,059 4,456,356 493,297
Fines, forfeitures and penalties 1,746,200 1,746,200 1,598,939 (147,261)
Use of money and property 1,176,250 1,176,250 1,104,778 (71,472)
Intergovernmental revenues 7,909,873 7,909,873 9,705,340 1,795,467
Charges for current services 10,391,744 10,391,744 11,308,410 916,666
Other revenues 17,824,557 17,824,557 9,911,801 (7,912,756)
Total revenues 348,447,552 348,447,552 344,702,179 (3,745,373)
EXPENDITURES
Current:
General government 19,589,649 19,814,896 17,937,994 1,876,902
Public safety 31,324,869 31,358,869 30,508,912 849,957
Public works 22,885,659 23,110,659 21,419,070 1,691,589
Health 2,199,548 2,199,548 2,089,985 109,563
External operations 4,763,041 4,763,041 4,751,492 11,549
Social services 3,060,500 3,060,500 2,900,337 160,163
Schools 136,312,034 136,870,838 135,673,255 1,197,583
Libraries 10,049,910 10,049,910 9,857,143 192,767
Parks and recreation 9,784,232 9,830,834 9,139,216 691,618
Fixed charges 97,223,110 97,465,846 94,475,998 2,989,848
Total expenditures 337,192,552 338,524,941 328,753,402 9,771,539
Revenues over expenditures 11,255,000 9,922,611 15,948,777 6,026,166
OTHER FINANCING SOURCES (USES)
Transfers in 3,918,000 3,918,000 3,998,895 80,895
Transfers out (15,173,000) (15,173,000) (15,173,000) -
Total financing sources (uses) (11,255,000) (11,255,000) (11,174,105) 80,895
Net increase (decrease) in
budgetary fund balance -$ (1,332,389) $ 4,774,672 6,107,061 $
BUDGETARY FUND BALANCE, beginning 19,734,733
BUDGETARY FUND BALANCE, ending 24,509,405 $
See note to required supplementary informaton.
General Fund
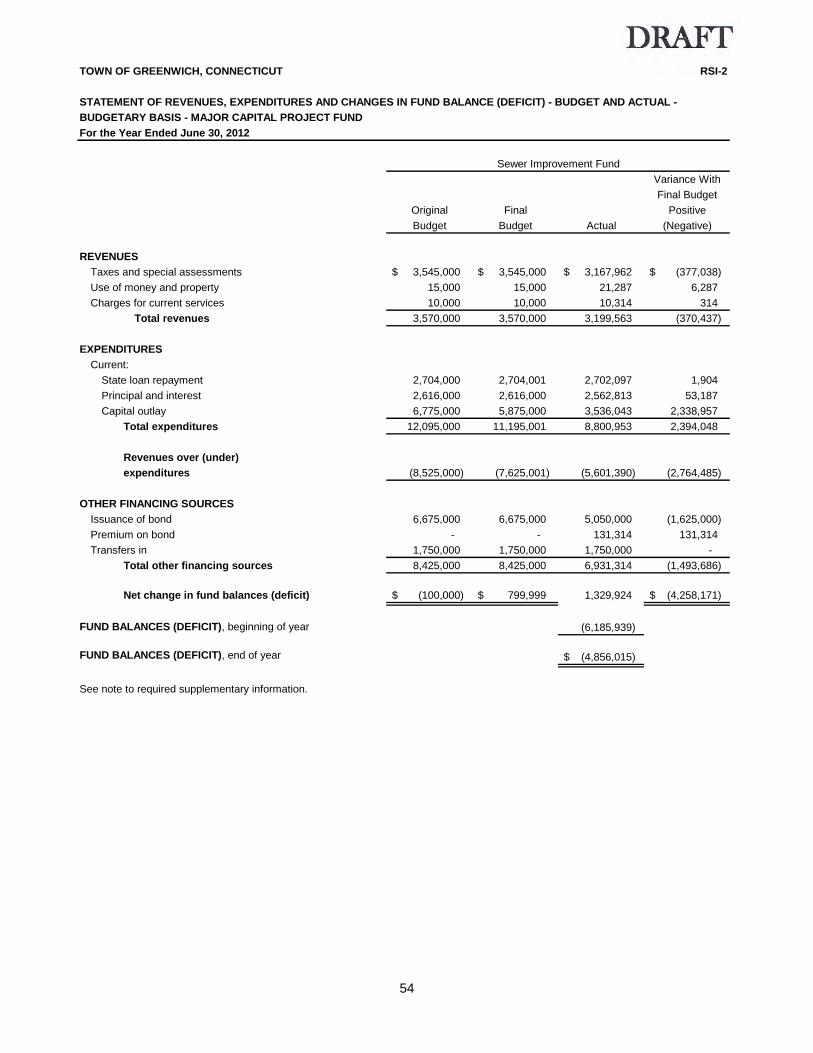
54
TOWN OF GREENWICH, CONNECTICUT RSI-2
STATEMENT OF REVENUES, EXPENDITURES AND CHANGES IN FUND BALANCE (DEFICIT) - BUDGET AND ACTUAL -
BUDGETARY BASIS - MAJOR CAPITAL PROJECT FUND
For the Year Ended June 30, 2012
Variance With
Final Budget
Original Final Positive
Budget Budget Actual (Negative)
REVENUES
Taxes and special assessments 3,545,000 $ 3,545,000 $ 3,167,962 $ (377,038) $
Use of money and property 15,000 15,000 21,287 6,287
Charges for current services 10,000 10,000 10,314 314
Total revenues 3,570,000 3,570,000 3,199,563 (370,437)
EXPENDITURES
Current:
State loan repayment 2,704,000 2,704,001 2,702,097 1,904
Principal and interest 2,616,000 2,616,000 2,562,813 53,187
Capital outlay 6,775,000 5,875,000 3,536,043 2,338,957
Total expenditures 12,095,000 11,195,001 8,800,953 2,394,048
Revenues over (under)
expenditures (8,525,000) (7,625,001) (5,601,390) (2,764,485)
OTHER FINANCING SOURCES
Issuance of bond 6,675,000 6,675,000 5,050,000 (1,625,000)
Premium on bond - - 131,314 131,314
Transfers in 1,750,000 1,750,000 1,750,000 -
Total other financing sources 8,425,000 8,425,000 6,931,314 (1,493,686)
Net change in fund balances (deficit) (100,000) $ 799,999 $ 1,329,924 (4,258,171) $
FUND BALANCES (DEFICIT), beginning of year (6,185,939)
FUND BALANCES (DEFICIT), end of year (4,856,015) $
See note to required supplementary information.
Sewer Improvement Fund

55
TOWN OF GREENWICH, CONNECTICUT RSI-3
REQUIRED SUPPLEMENTARY INFORMATION
PENSIONS AND OTHER POST RETIREMENT BENEFITS
SCHEDULE OF FUNDING PROGRESS
June 30, 2012
Schedules of Funding Progress
Underfunded
(Overfunded)
Actuarial
Underfunded Accrued
Actuarial (Overfunded) Liability as a
Actuarial Actuarial Accrued Actuarial Estimated Percentage of
Valuation Value of Liability Accrued Funded Covered Covered
Date Assets (AAL) Liability Ratio Payroll Payroll
July 1, 2005 316,137,276 $ 289,863,860 $ (26,273,415) $ 109% 75,514,945 $ (35%)
July 1, 2006 315,460,272 312,240,736 (3,219,536) 101% 78,834,768 (4%)
July 1, 2007 329,840,109 327,379,454 (2,460,655) 101% 78,183,097 (3%)
July 1, 2008 343,200,040 349,526,917 6,326,877 98% 73,698,287 9%
July 1, 2009 331,354,183 374,254,658 42,900,475 89% 73,125,475 59%
July 1, 2010 325,566,171 404,142,454 78,576,283 81% 73,151,844 107%
Unfunded
Actuarial
Accrued
Actuarial Unfunded Liability as a
Actuarial Actuarial Accrued Actuarial Estimated Percentage of
Valuation Value of Liability Accrued Funded Covered Covered
Date Assets (AAL) Liability Ratio Payroll Payroll
July 1, 2007 -$ 102,879,000 $ 102,879,000 $ 0.0% 156,800,000 $ 65.6%
July 1, 2008 18,840,000 60,678,000 41,838,000 31.0% 149,543,000 28.0%
July 1, 2009 16,873,000 54,086,000 37,213,000 31.2% 161,797,000 23.0%
July 1, 2010 16,323,000 51,807,000 35,484,000 31.5% 166,004,000 21.4%
Town of Greenwich Retirement Fund
OPEB
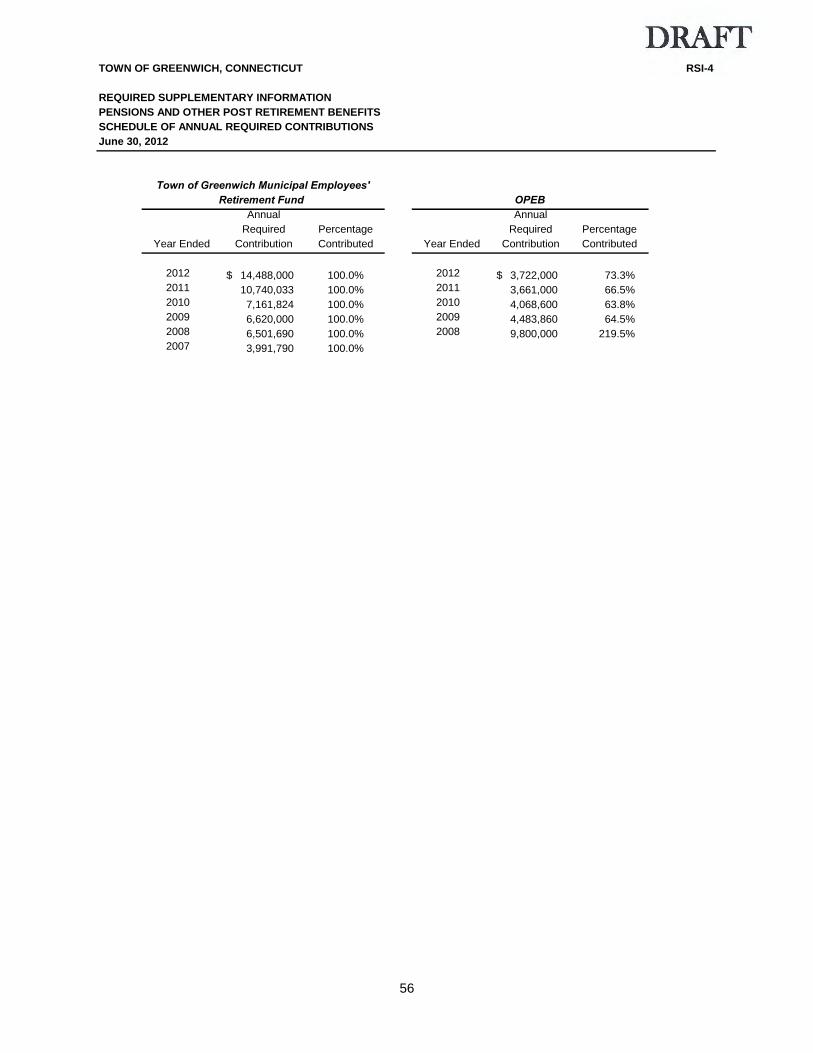
56
TOWN OF GREENWICH, CONNECTICUT RSI-4
REQUIRED SUPPLEMENTARY INFORMATION
PENSIONS AND OTHER POST RETIREMENT BENEFITS
SCHEDULE OF ANNUAL REQUIRED CONTRIBUTIONS
June 30, 2012
Annual Annual
Required Percentage Required Percentage
Year Ended Contribution Contributed Year Ended Contribution Contributed
2012 14,488,000 $ 100.0% 2012 3,722,000 $ 73.3%2011 10,740,033 100.0% 2011 3,661,000 66.5%2010 7,161,824 100.0% 2010 4,068,600 63.8%2009 6,620,000 100.0% 2009 4,483,860 64.5%2008 6,501,690 100.0% 2008 9,800,000 219.5%2007 3,991,790 100.0%
Town of Greenwich Municipal Employees'Retirement Fund OPEB

TOWN OF GREENWICH, CONNECTICUT REQUIRED SUPPLEMENTARY INFORMATION NOTE TO REQUIRED SUPPLEMENTARY INFORMATION June 30, 2012
57
Note 1. Stewardship, Compliance and Accountability Budgetary Information The Town’s Charter provides that: (i) prior to the commencement of a fiscal year, an operating budget (a plan of financial
operation embodying an estimate of proposed expenditures and the proposed means of financing them) for that year for the General Fund, Special Revenue Funds and the Enterprise Fund be submitted to the RTM by the BET;
(ii) the expenditure portion of the operating budget (appropriations) be given legal effect
through resolution of the RTM; (iii) the BET and RTM meet often to review subsequent appropriations (those under $5,000 can
be authorized by the BET; those over $5,000 must also be approved by a resolution of the RTM except for labor contracts which are approved for financing by the RTM). Only the BET and the RTM may modify the budget through interim appropriations. Management can approve transfers up to $5,000 but cannot add to the budget. There were interim appropriations (supplemental budgetary appropriations) of $1,332,390 for the General Fund, and $1,521,097 for the Capital Projects Fund during the fiscal year ended June 30, 2012;
(iv) expenditures cannot exceed appropriations for any department within each function unless
an appropriation change is approved by the BET and RTM; and (v) Unencumbered balances of appropriations lapse at the end of the fiscal year. Accordingly, the budgetary data presented in the financial statements represents both legal limitations and planned operating amounts. Annual budgets are legally adopted for the General Fund, Sewer Maintenance Fund, Sewer Improvement Fund, Public School Lunch Revolving Fund, Parking Fund, Leased Railroad Fund, Golf Course Fund and Nathaniel Witherell Fund. All annual appropriations lapse at fiscal year-end. Presentation of Revenues and Expenditures - Budget Basis For its General Fund, the Town reports actual revenues and expenditures in the fund statements in accordance with GAAP and in the budgetary comparison statement on a budget basis. The difference between these methods primarily relates to the treatment of encumbrances, improvement appropriations continued in force and on-behalf payments from the State for teachers’ retirement.

TOWN OF GREENWICH, CONNECTICUT REQUIRED SUPPLEMENTARY INFORMATION NOTE TO REQUIRED SUPPLEMENTARY INFORMATION, Continued June 30, 2012
58
The following is a reconciliation of these differences at June 30, 2012:
General
Fund
Revenues:
Revenues and other financing sources - GAAP basis 364,896,400 $
Cancelled encumbrances 1,503,535
Increase in reserved for future use 21,139
State on-behalf payments for teacher retirements (17,720,000)
Revenues and Other Financing Sources - Budget Basis 348,701,074 $
Expenditures:
Expenditures and other financing uses - GAAP basis 359,155,243 $
Changes in reserves for encumbrances, improvement
appropriations continued in force 6,480,432
Liquidation of encumbrances (4,330,813)
Difference in GAAP accruals 341,540
State on-behalf payments for teacher retirements (17,720,000)
Expenditures and Other Financing Uses - Budget Basis 343,926,402 $
For its Sewer Improvement Fund, the Town reports actual revenues and expenditures in the fund statements in accordance with GAAP and in the budgetary comparison statement on a budget basis. The difference between these methods primarily relates to the treatment of encumbrances, improvement appropriations continued in force. The following is a reconciliation of these differences at June 30, 2012:
Sewer
Improvement
Fund
Revenues:
Revenues and other financing sources - GAAP basis 10,130,877 $
Revenues and Other Financing Sources - Budget Basis 10,130,877 $
Expenditures:
Expenditures and other financing uses - GAAP basis 6,808,660 $
Liquidation of encumbrances (1,305,177)
Changes in reserves for encumbrances, and liquidation
of encumbrances 3,297,470
Expenditures and Other Financing Uses - Budget Basis 8,800,953 $

TOWN OF GREENWICH, CONNECTICUT REQUIRED SUPPLEMENTARY INFORMATION NOTE TO REQUIRED SUPPLEMENTARY INFORMATION, Continued June 30, 2012
59
The Town also finances some nonrecurring expenditures, principally capital projects and some major equipment acquisitions, by the modified “pay-as-you-go” plan, authorized by Connecticut General Statute 7-346. This statute permits the financing of nonrecurring expenditures over a period not to exceed five years. At June 30, 2012, the taxpayers’ financing obligations of nonrecurring expenditures to be financed by future tax levies amounted to $8,097,000 and are scheduled to be funded as follows:
Fiscal Year Sewer
Ended Maintenance
June 30, Fund
2013 2,557,000 $
2014 2,403,000
2015 2,222,000
2016 915,000
8,097,000 $

60
This page intentionally left blank.
SUPPLEMENTAL NONMAJOR COMBINING AND INDIVIDUAL FUND STATEMENTS AND SCHEDULES AND OTHER SCHEDULES


General Fund

General Fund The General Fund is used to account for resources traditionally associated with the Town which are not required legally or by sound financial management to be accounted for in another fund.

61
TOWN OF GREENWICH, CONNECTICUT EXHIBIT A-1
REVENUES BY CLASSIFICATION - BUDGET AND ACTUAL (BUDGET BASIS)
GENERAL FUND
For the Year Ended June 30, 2012
Variance With
Actual Final Budget
Budgetary Positive
Original Final Basis (Negative)
GENERAL PROPERTY TAXES
Current year's property tax 302,735,869 $ 302,735,869 $ 304,243,860 $ 1,507,991 $
Prior year's property tax 1,700,000 1,700,000 1,152,540 (547,460)
Interest and lien fees 1,000,000 1,000,000 1,220,155 220,155
Total 305,435,869 305,435,869 306,616,555 1,180,686
LICENSES AND PERMITS
Building permits 3,500,000 3,500,000 3,812,877 312,877
All other 463,059 463,059 643,479 180,420
Total 3,963,059 3,963,059 4,456,356 493,297
FINES, FORFEITS AND PENALTIES
Overtime parking fines 1,350,000 1,350,000 1,134,277 (215,723)
Library fines 180,000 180,000 190,860 10,860
Alarm ordinance 185,000 185,000 170,859 (14,141)
All other 31,200 31,200 102,943 71,743
Total 1,746,200 1,746,200 1,598,939 (147,261)
REVENUE FROM THE USE OF MONEY
AND PROPERTY
Interest earnings 450,000 450,000 368,876 (81,124)
Rental of facilities 726,250 726,250 735,902 9,652
Total 1,176,250 1,176,250 1,104,778 (71,472)
INTERGOVERNMENTAL REVENUES
Operating Aid - ECS - Schools 3,420,000 3,420,000 3,462,976 42,976
Special Education - Schools 1,354,821 1,354,821 1,276,740 (78,081)
PILOT - Housing Authority - - 94,640 94,640
PILOT - Tax Exempt Properties 722,000 722,000 721,374 (626)
Elderly Exemptions 200,000 200,000 199,399 (601)
Telephone Access Lines grant 600,000 600,000 435,119 (164,881)
Unrestricted Grants - Pequot Fund 100,000 100,000 85,808 (14,192)
Local Capital Improvement Program 375,000 375,000 327,880 (47,120)
All Other 1,138,052 1,138,052 3,101,404 1,963,352
7,909,873 7,909,873 9,705,340 1,795,467
(Continued)
Budgeted Amounts

62
TOWN OF GREENWICH, CONNECTICUT EXHIBIT A-1, Cont'd
REVENUES BY CLASSIFICATION - BUDGET AND ACTUAL (BUDGET BASIS), Continued
GENERAL FUND
For the Year Ended June 30, 2012
Variance With
Actual Final Budget
Budgetary Positive
Original Final Basis (Negative)
CHARGES FOR CURRENT SERVICES
Land Records - Recording Fees 400,000 400,000 425,220 25,220
Real Estate Conveyance Tax 4,000,000 4,000,000 3,734,578 (265,422)
Compliance and Application Fees-Inlands Wetlands 260,000 260,000 280,560
Non-Burnable Refuse Fees 475,000 475,000 474,561 (439)
Homemaker Service Fees 6,000 6,000 2,887 (3,113)
Tuition Fees - Schools 360,000 360,000 575,613 215,613
Beach Cards and Admissions 1,249,400 1,249,400 1,429,257 179,857
Boat Storage and Wharfage Fees 565,000 565,000 513,972 (51,028)
All Other 3,076,344 3,076,344 3,871,762 795,418
Total 10,391,744 10,391,744 11,308,410 916,666
OTHER REVENUES
Cancellation of Prior Years' Encumbrances 900,000 900,000 1,503,535 603,535
Retirement Reserve Investment Fees 1,634,000 1,634,000 711,197 (922,803)
OPEB 800,000 800,000 800,000 -
Greenwich Library - Peterson Trust 1,094,564 1,094,564 982,708 (111,856)
Use of unrestricted fund balance 7,042,013 7,042,013 - (7,042,013)
Health & Life Insurance, Employee & Retiree Co-Pay 6,127,000 6,127,000 4,916,759 (1,210,241)
All Other 226,980 226,980 997,602 770,622
Total 17,824,557 17,824,557 9,911,801 (7,912,756)
Total revenues 348,447,552 348,447,552 344,702,179 (3,745,373)
OTHER FINANCING SOURCES
Transfers from other funds:
Capital Projects 1,034,000 1,034,000 1,034,000 -
Griffith E. Harris Golf Course Fund 367,000 367,000 367,900 900
Community Development Block Grant Fund 38,000 38,000 32,400 (5,600)
Parking Fund 544,000 544,000 544,000 -
School Lunch 389,000 389,000 389,887 887
Sewer Maintenance Fund 999,000 999,000 999,000 -
BOE Grant Fund 540,000 540,000 593,327 53,327
Leased Railroad Fund 7,000 7,000 38,381 31,381
Total 3,918,000 3,918,000 3,998,895 80,895
Total 352,365,552 $ 352,365,552 $ 348,701,074 $ (3,664,478) $
Budgeted Amounts

63
TOWN OF GREENWICH, CONNECTICUT EXHIBIT A-2
EXPENDITURES BY FUNCTION - BUDGET AND ACTUAL (BUDGET BASIS)
GENERAL FUND
For the Year Ended June 30, 2012
Variance With
Actual Final Budget
Budgetary Positive
Original Final Basis (Negative)
GENERAL GOVERNMENT
Representative Town Meeting 14,100 $ 14,100 $ 11,097 $ 3,003 $
Ethics 2,400 2,400 1,334 1,066
Emergency Operations 129,301 129,301 124,579 4,722
Office of the First Selectman 971,382 971,382 848,002 123,380
Purchasing 1,012,778 1,012,778 981,978 30,800
Administrative Services 655,882 655,882 616,670 39,212
Human Resources 1,915,780 1,915,780 1,808,923 106,857
Probate Court 42,466 42,466 33,640 8,826
Registrar of Voters 421,213 421,213 312,519 108,694
Board of Estimate and Taxation:
Administration 1,873,137 1,873,137 1,674,996 198,141
Retirement 1,734,808 1,734,808 777,568 957,240
Information Technology 3,189,209 3,189,209 3,052,036 137,173
Assessor 997,982 997,982 994,332 3,650
Board of Tax Review 37,400 37,400 33,206 4,194
Tax Collector 524,703 504,703 492,204 12,499
Law 2,417,955 2,578,955 2,573,629 5,326
Town Clerk 571,753 632,930 588,673 44,257
Planning and Zoning Board of Appeals 345,848 368,918 330,152 38,766
Condemnation Commission 2,500 2,500 - 2,500
Planning and Zoning 861,172 861,172 856,889 4,283
Conservation Commission 283,449 283,449 265,139 18,310
Inland Wetlands and Water Courses Agency 472,399 472,399 470,743 1,656
Land Use Administration 312,068 312,068 304,019 8,049
Commission on Aging 169,540 169,540 168,616 924
Senior Center 630,424 630,424 617,050 13,374
Total general government 19,589,649 19,814,896 17,937,994 1,876,902
PUBLIC SAFETY
Fire Department:
Administration 1,416,839 1,416,839 1,404,598 12,241
Fire Training 582,484 582,484 551,969 30,515
Office of the Fire Marshall 655,465 655,465 583,313 72,152
Fire Fighting Force 9,103,918 9,267,918 9,206,626 61,292
Fire Apparatus and Equipment 56,200 56,200 55,617 583
Buildings 114,650 114,650 96,654 17,996
Volunteers 809,191 679,191 634,729 44,462
Total fire department 12,738,747 12,772,747 12,533,506 239,241
Police Department:
Administration 687,309 687,309 648,345 38,964
Dispatch 1,419,635 1,419,635 1,340,993 78,642
General Services 2,253,046 2,253,046 2,136,011 117,035
Criminal Investigation 2,860,462 2,860,462 2,646,339 214,123
Uniformed Patrol 11,365,670 11,365,670 11,203,718 161,952
Total police department 18,586,122 18,586,122 17,975,406 610,716
Total public safety 31,324,869 31,358,869 30,508,912 849,957
(Continued)
Budgeted Amount

64
TOWN OF GREENWICH, CONNECTICUT EXHIBIT A-2, Cont'd
EXPENDITURES BY FUNCTION - BUDGET AND ACTUAL (BUDGET BASIS), Continued
GENERAL FUND
For the Year Ended June 30, 2012
Variance With
Actual Final Budget
Budgetary Positive
Original Final Basis (Negative)
PUBLIC WORKS/VEHICLE MAINTENANCE
Administration 961,249 961,249 949,029 12,220
Engineering 937,925 937,925 847,851 90,074
Highway Division:
Streets and Bridges 5,662,669 5,887,669 5,802,030 85,639
Board of Ed Infrastructure Maintenance 236,000 236,000 139,149 96,851
Waste Disposal 6,885,897 6,885,897 5,952,264 933,633
Building Construction and Maintenance 4,058,148 4,058,148 3,931,683 126,465
Building Inspection 1,198,796 1,198,796 1,135,824 62,972
Vehicle Maintenance:
Fleet Department 2,944,975 2,944,975 2,661,240 283,735
Total Public Works/
Vehicle Maintenance 22,885,659 23,110,659 21,419,070 1,691,589
HEALTH
Administration 420,748 420,748 401,973 18,775
Environmental Health Program 676,253 676,253 627,935 48,318
Special Clinical 258,255 258,255 255,571 2,684
Division of Family Health 541,374 541,374 504,664 36,710
Laboratory Program 302,918 302,918 299,842 3,076
Total Health 2,199,548 2,199,548 2,089,985 109,563
EXTERNAL OPERATIONS 4,763,041 4,763,041 4,751,492 11,549
SOCIAL SERVICES
Administration 606,840 643,840 637,623 6,217
Adult and Family Services Division 1,747,617 1,712,617 1,697,824 14,793
Homemaker service 706,043 704,043 564,890 139,153
Total social services 3,060,500 3,060,500 2,900,337 160,163
SCHOOLS
Administration 5,057,202 4,631,713 4,407,365 224,348
Instruction 112,258,544 113,706,537 112,930,527 776,010
Operation of Plants 5,894,585 6,419,477 6,398,581 20,896
Maintenance of Plants 6,101,746 5,738,701 5,671,358 67,343
Pupil Transportation 5,136,971 4,539,926 4,533,641 6,285
Student Body Activities 1,862,986 1,834,484 1,731,783 102,701
Total schools 136,312,034 136,870,838 135,673,255 1,197,583
LIBRARIES
Greenwich Library 8,955,346 8,955,346 8,846,458 108,888
Perrot Memorial Library 1,094,564 1,094,564 1,010,685 83,879
Total libraries 10,049,910 10,049,910 9,857,143 192,767
(Continued)
Budgeted Amount
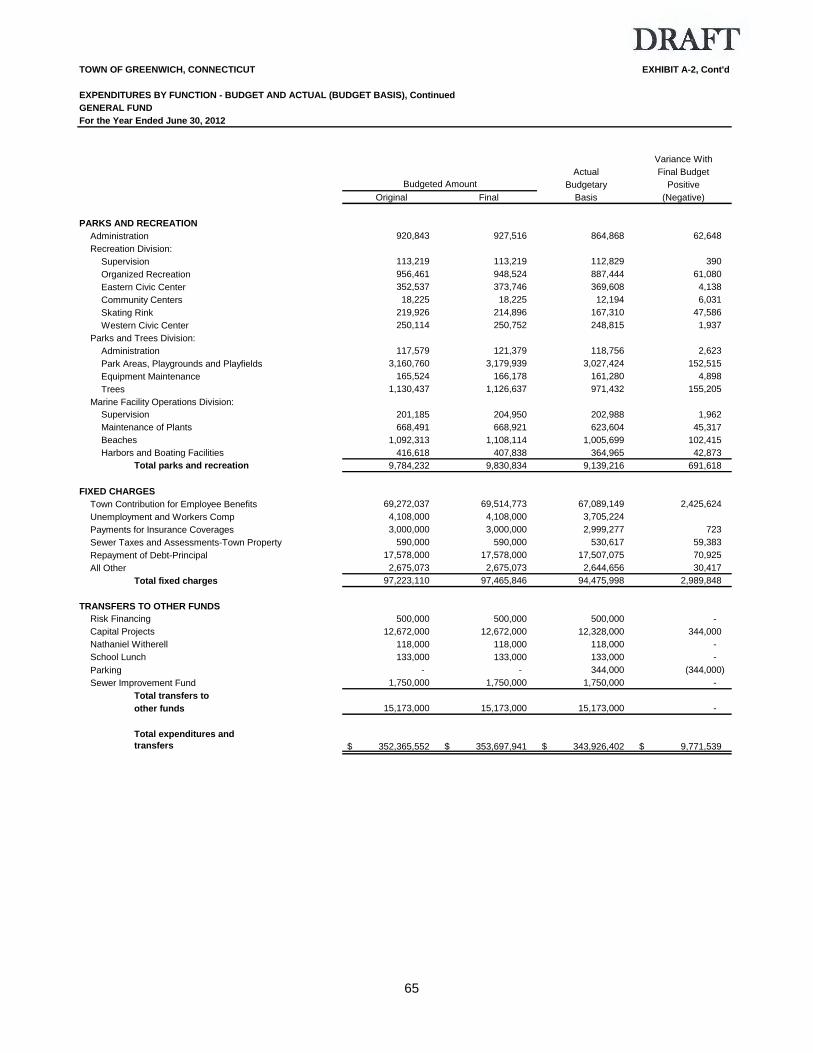
65
TOWN OF GREENWICH, CONNECTICUT EXHIBIT A-2, Cont'd
EXPENDITURES BY FUNCTION - BUDGET AND ACTUAL (BUDGET BASIS), Continued
GENERAL FUND
For the Year Ended June 30, 2012
Variance With
Actual Final Budget
Budgetary Positive
Original Final Basis (Negative)
PARKS AND RECREATION
Administration 920,843 927,516 864,868 62,648
Recreation Division:
Supervision 113,219 113,219 112,829 390
Organized Recreation 956,461 948,524 887,444 61,080
Eastern Civic Center 352,537 373,746 369,608 4,138
Community Centers 18,225 18,225 12,194 6,031
Skating Rink 219,926 214,896 167,310 47,586
Western Civic Center 250,114 250,752 248,815 1,937
Parks and Trees Division:
Administration 117,579 121,379 118,756 2,623
Park Areas, Playgrounds and Playfields 3,160,760 3,179,939 3,027,424 152,515
Equipment Maintenance 165,524 166,178 161,280 4,898
Trees 1,130,437 1,126,637 971,432 155,205
Marine Facility Operations Division:
Supervision 201,185 204,950 202,988 1,962
Maintenance of Plants 668,491 668,921 623,604 45,317
Beaches 1,092,313 1,108,114 1,005,699 102,415
Harbors and Boating Facilities 416,618 407,838 364,965 42,873
Total parks and recreation 9,784,232 9,830,834 9,139,216 691,618
FIXED CHARGES
Town Contribution for Employee Benefits 69,272,037 69,514,773 67,089,149 2,425,624
Unemployment and Workers Comp 4,108,000 4,108,000 3,705,224
Payments for Insurance Coverages 3,000,000 3,000,000 2,999,277 723
Sewer Taxes and Assessments-Town Property 590,000 590,000 530,617 59,383
Repayment of Debt-Principal 17,578,000 17,578,000 17,507,075 70,925
All Other 2,675,073 2,675,073 2,644,656 30,417
Total fixed charges 97,223,110 97,465,846 94,475,998 2,989,848
TRANSFERS TO OTHER FUNDS
Risk Financing 500,000 500,000 500,000 -
Capital Projects 12,672,000 12,672,000 12,328,000 344,000
Nathaniel Witherell 118,000 118,000 118,000 -
School Lunch 133,000 133,000 133,000 -
Parking - - 344,000 (344,000)
Sewer Improvement Fund 1,750,000 1,750,000 1,750,000 -
Total transfers to
other funds 15,173,000 15,173,000 15,173,000 -
Total expenditures and
transfers 352,365,552 $ 353,697,941 $ 343,926,402 $ 9,771,539 $
Budgeted Amount

66
This page intentionally left blank.
Nonmajor Governmental Funds

Nonmajor Governmental Funds
Special Revenue Funds Special revenue funds are used to account for specific revenues that are legally restricted to expenditures for particular purposes. Educational Projects Fund This fund is used to account for state and federal grants made to the Board of Education for various educational purposes. When the grant is approved by the State of Connecticut, an appropriation for the same amount is made against which commitments and expenditures for the authorized purpose are made. Sewer Maintenance Fund This fund consists of special assessments on all property within the Town’s sewer district on the basis of the assessed valuation of the land and the improvements thereon. Sewer permit fees and such other fees or charges collected are also funding resources. Expenditures from this fund are made on the basis of appropriations budgeted by the Town in the same manner as General Fund appropriations, for the operation, maintenance and repair of the Town’s sewers and sewerage system. Public School Lunch Revolving Fund This fund is used to operate the schools’ cafeteria system. Revenues are received from fees charged for lunches and from the State. While direct expenditures are charged to this fund, certain administrative costs remain in the General Fund. Community Development Block Grant Fund This fund is utilized to account for all monies received from the Federal government for block grants used for special projects as determined by the Board of Estimate and Taxation and Representative Town Meeting. All accounting follows federal guidelines. Griffith E. Harris Golf Course Revolving Fund This fund is used to operate the Town’s only municipal golf course. It includes all revenues and expenditures for the operation of the course. Leased Railroad Reinvestment Fund This fund is a result of the lease agreement between the State of Connecticut and the Town for the Cos Cob, Riverside and Old Greenwich Railroad stations. Under the terms of the lease agreement, the Town is required to reinvest a percentage of all cash receipts from the railroad stations, less certain disbursements, into the maintenance and improvement of these station properties. Grant Fund This fund is used to account for various multi-year health and public safety grants. Nathaniel Witherell Fund This fund is used to account for the Town’s nursing home. It includes all revenues and expenditures for its operation.
Capital Projects Fund Capital and Nonrecurring Fund This reserve fund is authorized by Sections 7-359 through 7-368 of the General Statutes of the State of Connecticut. These statutes authorize the payment of (1) amounts which may be transferred to this fund from the General Fund cash surplus available at the end of any fiscal year, or (2) amounts raised by the annual levy of a tax, not to exceed two mills, for the benefit of capital improvement. The money credited to this fund can be used only for the financing of equipment or the planning, construction, reconstruction or acquisition of capital improvements.

67
This page intentionally left blank.
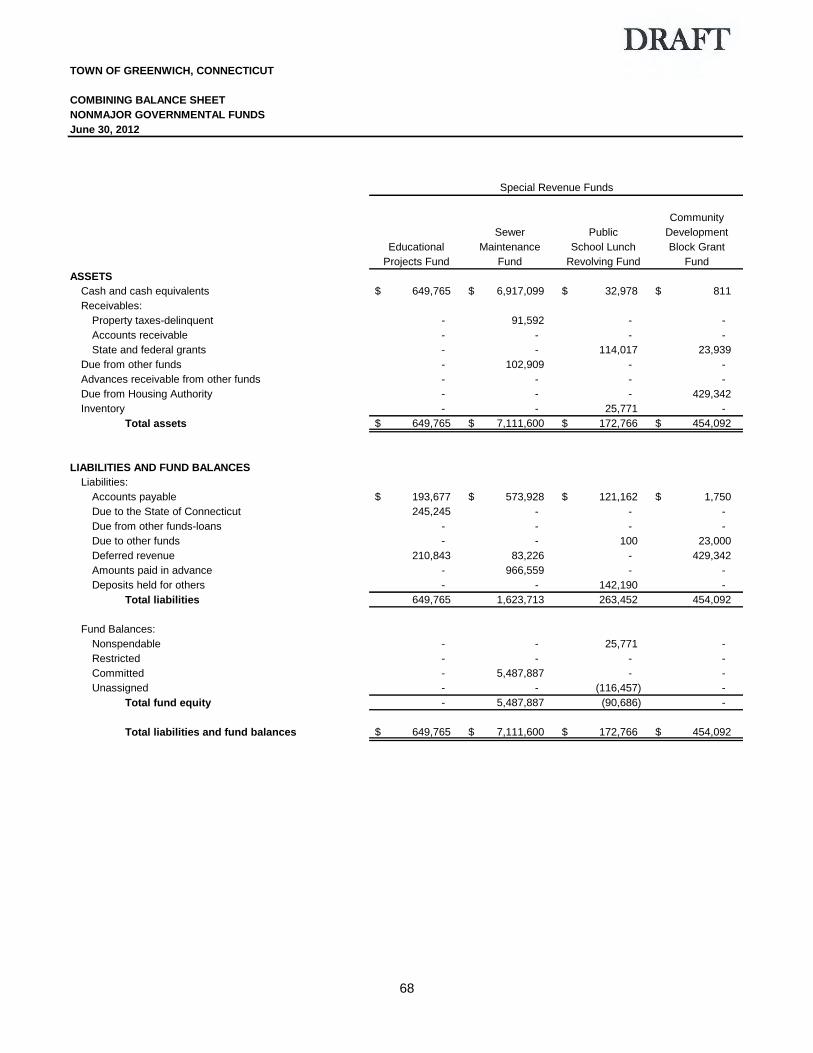
68
TOWN OF GREENWICH, CONNECTICUT
COMBINING BALANCE SHEET
NONMAJOR GOVERNMENTAL FUNDS
June 30, 2012
Community
Sewer Public Development
Educational Maintenance School Lunch Block Grant
Projects Fund Fund Revolving Fund Fund
ASSETS
Cash and cash equivalents 649,765 $ 6,917,099 $ 32,978 $ 811 $
Receivables:
Property taxes-delinquent - 91,592 - -
Accounts receivable - - - -
State and federal grants - - 114,017 23,939
Due from other funds - 102,909 - -
Advances receivable from other funds - - - -
Due from Housing Authority - - - 429,342
Inventory - - 25,771 -
Total assets 649,765 $ 7,111,600 $ 172,766 $ 454,092 $
LIABILITIES AND FUND BALANCES
Liabilities:
Accounts payable 193,677 $ 573,928 $ 121,162 $ 1,750 $
Due to the State of Connecticut 245,245 - - -
Due from other funds-loans - - - -
Due to other funds - - 100 23,000
Deferred revenue 210,843 83,226 - 429,342
Amounts paid in advance - 966,559 - -
Deposits held for others - - 142,190 -
Total liabilities 649,765 1,623,713 263,452 454,092
Fund Balances:
Nonspendable - - 25,771 -
Restricted - - - -
Committed - 5,487,887 - -
Unassigned - - (116,457) -
Total fund equity - 5,487,887 (90,686) -
Total liabilities and fund balances 649,765 $ 7,111,600 $ 172,766 $ 454,092 $
Special Revenue Funds

69
EXHIBIT B-1
Capital Project
Fund
Griffith E.
Harris Leased
Golf Course Railroad Nathaniel Capital and
Revolving Reinvestment Grant Witherell Nonrecurring
Fund Fund Fund Fund Fund Eliminations Totals
499,747 $ 1,921,788 $ -$ 351,752 $ 4,112,297 $ -$ 14,486,237 $
- - - - - - 91,592
- - - 2,663,123 83,135 - 2,746,258
- - 642,941 - - - 780,897
1,821 - 1,269,721 - 108,565 - 1,483,016
- - - - 900,000 (900,000) -
- - - - - - 429,342
- - - - - - 25,771
501,568 $ 1,921,788 $ 1,912,662 $ 3,014,875 $ 5,203,997 $ (900,000) $ 20,043,113 $
84,325 $ -$ 77,456 $ 1,359,623 $ -$ -$ 2,411,921 $
- - - - - - 245,245
900,000 - - - 2,474,238 (900,000) 2,474,238
- 46,411 - 1,160,514 - - 1,230,025
- - 1,149,432 - - - 1,872,843
- - - - - - 966,559
3,500 - - 496,324 - - 642,014
987,825 46,411 1,226,888 3,016,461 2,474,238 (900,000) 9,842,845
- - - - - - 25,771
- - 685,774 - - - 685,774
- 1,875,377 - - 2,729,759 - 10,093,023
(486,257) - - (1,586) - - (604,300)
(486,257) 1,875,377 685,774 (1,586) 2,729,759 - 10,200,268
501,568 $ 1,921,788 $ 1,912,662 $ 3,014,875 $ 5,203,997 $ (900,000) $ 20,043,113 $
Special Revenue Funds
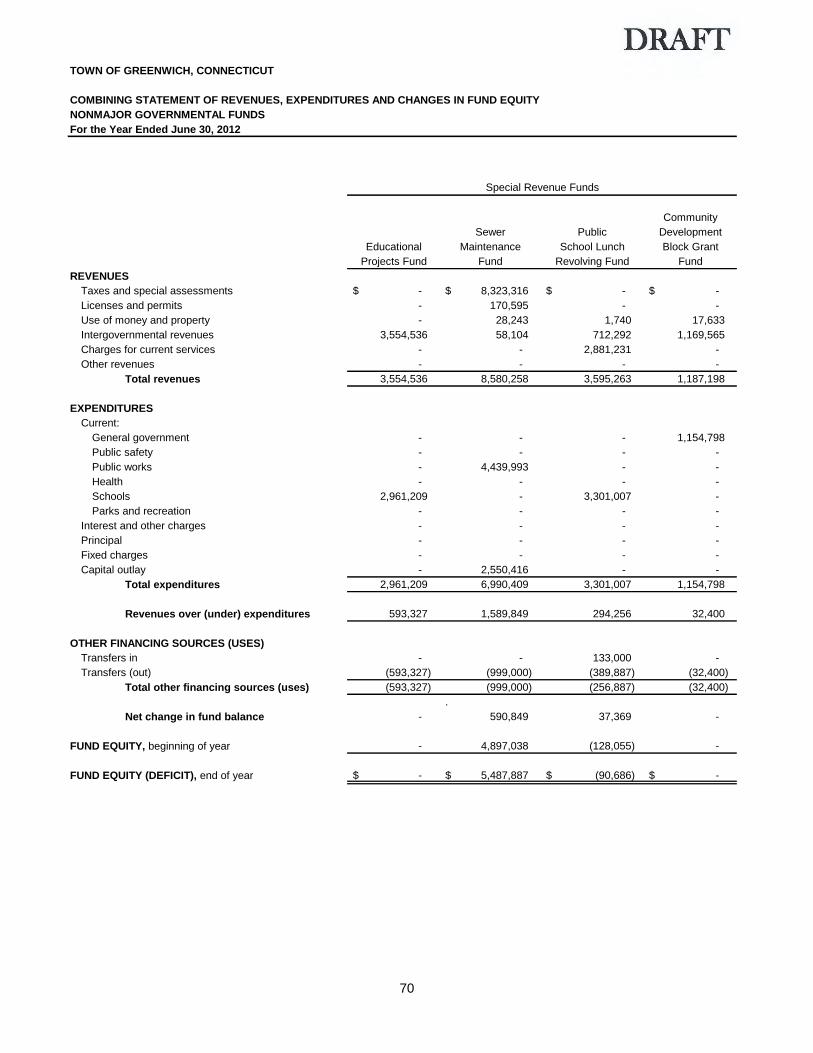
70
TOWN OF GREENWICH, CONNECTICUT
COMBINING STATEMENT OF REVENUES, EXPENDITURES AND CHANGES IN FUND EQUITY
NONMAJOR GOVERNMENTAL FUNDS
For the Year Ended June 30, 2012
Community
Sewer Public Development
Educational Maintenance School Lunch Block Grant
Projects Fund Fund Revolving Fund Fund
REVENUES
Taxes and special assessments -$ 8,323,316 $ -$ -$
Licenses and permits - 170,595 - -
Use of money and property - 28,243 1,740 17,633
Intergovernmental revenues 3,554,536 58,104 712,292 1,169,565
Charges for current services - - 2,881,231 -
Other revenues - - - -
Total revenues 3,554,536 8,580,258 3,595,263 1,187,198
EXPENDITURES
Current:
General government - - - 1,154,798
Public safety - - - -
Public works - 4,439,993 - -
Health - - - -
Schools 2,961,209 - 3,301,007 -
Parks and recreation - - - -
Interest and other charges - - - -
Principal - - - -
Fixed charges - - - -
Capital outlay - 2,550,416 - -
Total expenditures 2,961,209 6,990,409 3,301,007 1,154,798
Revenues over (under) expenditures 593,327 1,589,849 294,256 32,400
OTHER FINANCING SOURCES (USES)
Transfers in - - 133,000 -
Transfers (out) (593,327) (999,000) (389,887) (32,400)
Total other financing sources (uses) (593,327) (999,000) (256,887) (32,400)
.
Net change in fund balance - 590,849 37,369 -
FUND EQUITY, beginning of year - 4,897,038 (128,055) -
FUND EQUITY (DEFICIT), end of year -$ 5,487,887 $ (90,686) $ -$
Special Revenue Funds
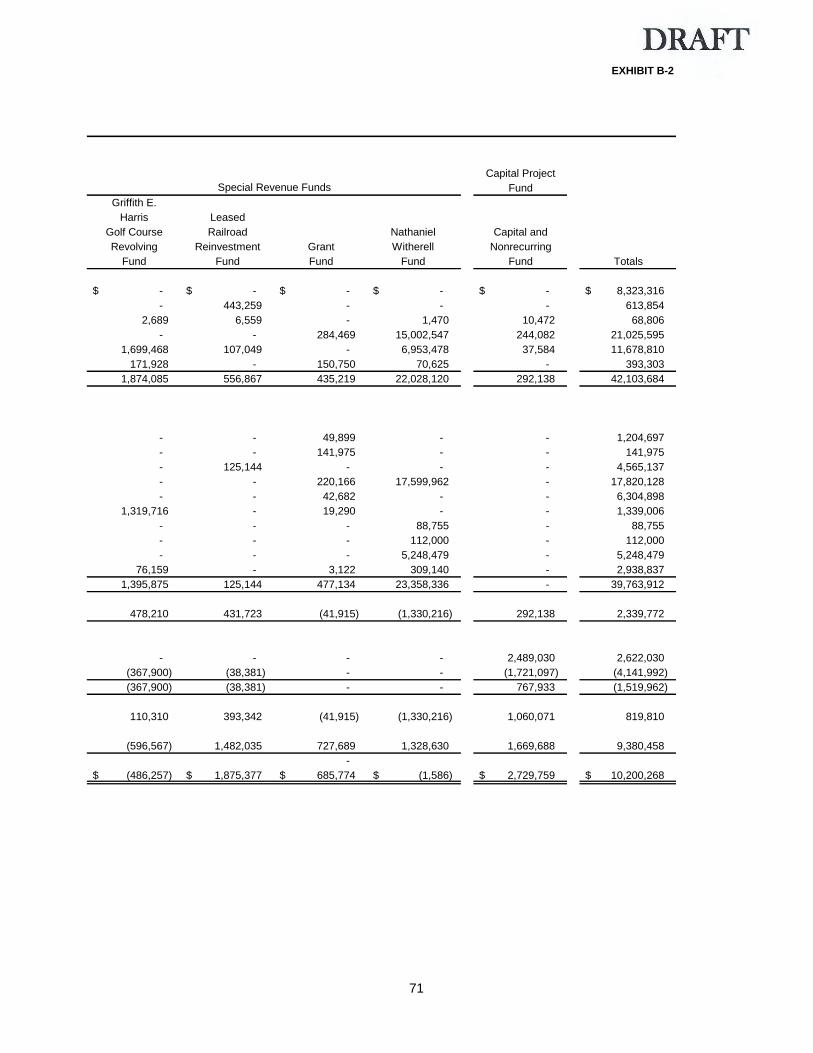
71
EXHIBIT B-2
Capital Project
Fund
Griffith E.
Harris Leased
Golf Course Railroad Nathaniel Capital and
Revolving Reinvestment Grant Witherell Nonrecurring
Fund Fund Fund Fund Fund Totals
-$ -$ -$ -$ -$ 8,323,316 $
- 443,259 - - - 613,854
2,689 6,559 - 1,470 10,472 68,806
- - 284,469 15,002,547 244,082 21,025,595
1,699,468 107,049 - 6,953,478 37,584 11,678,810
171,928 - 150,750 70,625 - 393,303
1,874,085 556,867 435,219 22,028,120 292,138 42,103,684
- - 49,899 - - 1,204,697
- - 141,975 - - 141,975
- 125,144 - - - 4,565,137
- - 220,166 17,599,962 - 17,820,128
- - 42,682 - - 6,304,898
1,319,716 - 19,290 - - 1,339,006
- - - 88,755 - 88,755
- - - 112,000 - 112,000
- - - 5,248,479 - 5,248,479
76,159 - 3,122 309,140 - 2,938,837
1,395,875 125,144 477,134 23,358,336 - 39,763,912
478,210 431,723 (41,915) (1,330,216) 292,138 2,339,772
- - - - 2,489,030 2,622,030
(367,900) (38,381) - - (1,721,097) (4,141,992)
(367,900) (38,381) - - 767,933 (1,519,962)
110,310 393,342 (41,915) (1,330,216) 1,060,071 819,810
(596,567) 1,482,035 727,689 1,328,630 1,669,688 9,380,458
-
(486,257) $ 1,875,377 $ 685,774 $ (1,586) $ 2,729,759 $ 10,200,268 $
Special Revenue Funds

72
TOWN OF GREENWICH, CONNECTICUT
SCHEDULES OF REVENUES, EXPENDITURES AND CHANGES IN FUND BALANCE
(UNRESERVED, UNDESIGNATED) - BUDGET AND ACTUAL - BUDGETARY BASIS
NONMAJOR GOVERNMENTAL FUNDS
For the Year Ended June 30, 2012
Variance With
Final Budget
Original Final Positive
Budget Budget Actual (Negative)
REVENUES
Taxes and special assessments 8,260,116 $ 8,260,116 $ 8,317,985 $ 57,869 $
Licenses and permits 75,000 75,000 170,595 95,595
Use of money and property 15,000 15,000 28,243 13,243
Intergovernmental revenues 100,000 100,000 58,104 (41,896)
Charges for current services - - - -
Other revenues - - 124,519 124,519
Total revenues 8,450,116 8,450,116 8,699,446 249,330
EXPENDITURES
Current:
General government - - - -
Nathaniel Witherell - - - -
Public works 4,731,116 4,731,116 4,467,761 263,355
Health - - - -
Schools - - - -
Parks and recreation - - - -
Fixed charges - - - -
Capital outlay 4,616,000 4,616,000 1,133,667 3,482,333
Total expenditures 9,347,116 9,347,116 5,601,428 3,745,688
Revenue over (under) expenditures (897,000) (897,000) 3,098,018 3,995,018
OTHER FINANCING SOURCES (USES)
Loan repayment -$ -$ -$ -$
Transfers in - - - -
Transfers out (999,000) (999,000) (999,000) -
Total other financing sources (uses) (999,000) (999,000) (999,000) -
Net change in fund balance (1,896,000) $ (1,896,000) $ 2,099,018 3,995,018 $
Modified Pay-As-You-Go Financing
Deferrment of current appropriations 3,662,000
Funding of prior year's appropriations (1,761,000)
BUDGETARY FUND BALANCE (DEFICIT),
beginning of year 8,001,214
BUDGETARY FUND BALANCE (DEFICIT),
end of year 12,001,232 $
Sewer Maintenance Fund

73
EXHIBIT B-3
Variance With Variance With
Final Budget Final Budget
Original Final Positive Original Final Positive
Budget Budget Actual (Negative) Budget Budget Actual (Negative)
-$ -$ -$ -$ -$ -$ -$ -$
- - - - - - - -
2,500 2,500 1,740 (760) 3,000 3,000 2,689 (311)
695,026 695,026 712,292 17,266 - - - -
3,184,909 3,184,909 2,881,231 (303,678) 1,763,430 1,763,430 1,699,468 (63,962)
- - 680 680 185,342 185,342 172,571 (12,771)
3,882,435 3,882,435 3,595,943 (286,492) 1,951,772 1,951,772 1,874,728 (77,044)
- - - - - - - -
- - - - - - - -
- - - - - - - -
- - - - - - - -
3,444,283 3,444,283 3,306,361 137,922 - - - -
- - - - 1,399,485 1,399,485 1,319,786 79,699
- - - - - - - -
- - - - 107,000 107,000 74,434 32,566
3,444,283 3,444,283 3,306,361 137,922 1,506,485 1,506,485 1,394,220 112,265
438,152 438,152 289,582 (148,570) 445,287 445,287 480,508 35,221
- - - (150,000) $ (150,000) $ (150,000) $ -$
133,000 133,000 133,000 - - - - -
(389,887) (389,887) (389,887) - (367,900) (367,900) (367,900) -
(256,887) (256,887) (256,887) - (517,900) (517,900) (517,900) -
181,265 $ 181,265 $ 32,695 (148,570) $ (72,613) $ (72,613) $ (37,392) 35,221 $
- -
- -
(172,611) 442,463
(139,916) $ 405,071 $
(Continued)
Public School Lunch Revolving Fund Griffith E. Harris Golf Course Revolving Fund
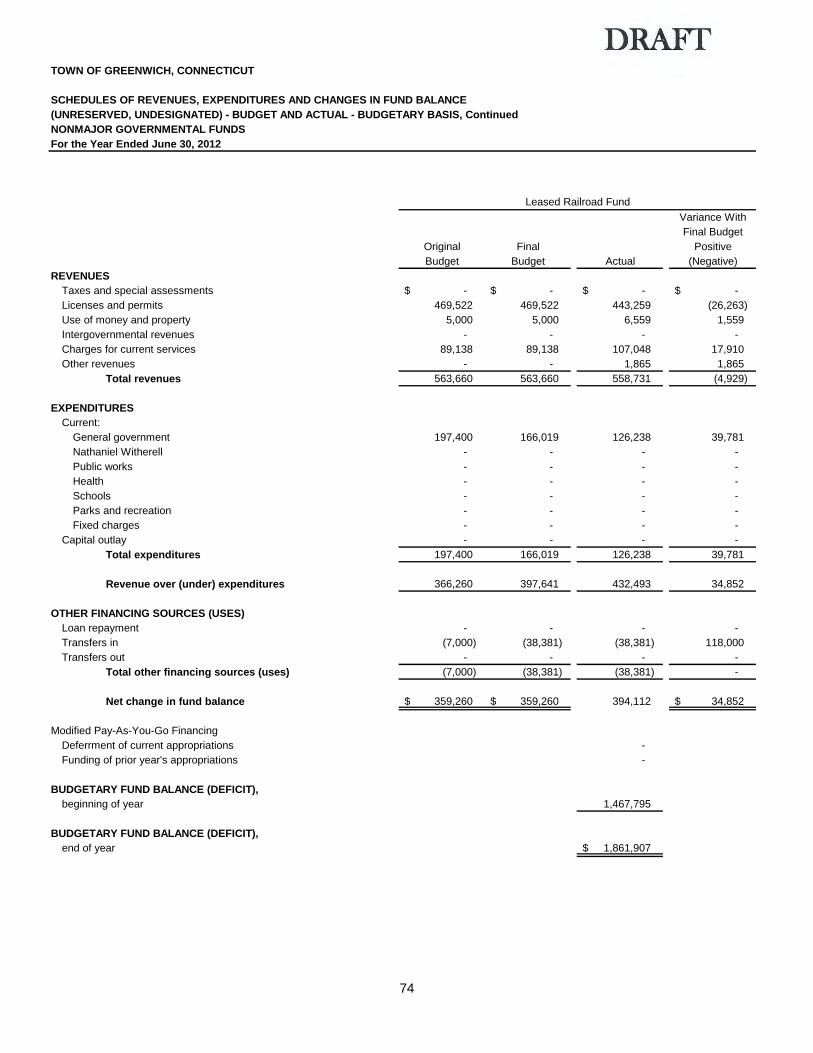
74
TOWN OF GREENWICH, CONNECTICUT
SCHEDULES OF REVENUES, EXPENDITURES AND CHANGES IN FUND BALANCE
(UNRESERVED, UNDESIGNATED) - BUDGET AND ACTUAL - BUDGETARY BASIS, Continued
NONMAJOR GOVERNMENTAL FUNDS
For the Year Ended June 30, 2012
Variance With
Final Budget
Original Final Positive
Budget Budget Actual (Negative)
REVENUES
Taxes and special assessments -$ -$ -$ -$
Licenses and permits 469,522 469,522 443,259 (26,263)
Use of money and property 5,000 5,000 6,559 1,559
Intergovernmental revenues - - - -
Charges for current services 89,138 89,138 107,048 17,910
Other revenues - - 1,865 1,865
Total revenues 563,660 563,660 558,731 (4,929)
EXPENDITURES
Current:
General government 197,400 166,019 126,238 39,781
Nathaniel Witherell - - - -
Public works - - - -
Health - - - -
Schools - - - -
Parks and recreation - - - -
Fixed charges - - - -
Capital outlay - - - -
Total expenditures 197,400 166,019 126,238 39,781
Revenue over (under) expenditures 366,260 397,641 432,493 34,852
OTHER FINANCING SOURCES (USES)
Loan repayment - - - -
Transfers in (7,000) (38,381) (38,381) 118,000
Transfers out - - - -
Total other financing sources (uses) (7,000) (38,381) (38,381) -
Net change in fund balance 359,260 $ 359,260 $ 394,112 34,852 $
Modified Pay-As-You-Go Financing
Deferrment of current appropriations -
Funding of prior year's appropriations -
BUDGETARY FUND BALANCE (DEFICIT),
beginning of year 1,467,795
BUDGETARY FUND BALANCE (DEFICIT),
end of year 1,861,907 $
Leased Railroad Fund

75
EXHIBIT B-3, Cont'd.
Variance With
Final Budget
Original Final Positive
Budget Budget Actual (Negative)
-$ -$ -$ -$
- - -
- - 1,470 1,470
15,529,030 15,529,030 15,002,547 (526,483)
7,896,563 7,896,563 7,403,478 (493,085)
80,900 80,900 111,879 30,979
23,506,493 23,506,493 22,519,374 (987,119)
- - - -
17,803,276 17,918,276 17,625,012
- - - -
- - - -
- - - -
- - - -
5,996,113 5,881,113 5,449,234 431,879
447,000 447,000 304,355 142,645
24,246,389 24,246,389 23,378,601 867,788
(739,896) (739,896) (859,227) (119,331)
- - -
118,000 - - -
- - - -
118,000 - - -
(621,896) $ (739,896) $ (859,227) (119,331) $
-
-
1,039,718
180,491 $
Nathaniel Witherell Revolving Fund

76
This page intentionally left blank.

Fiduciary Funds

Fiduciary Funds Fiduciary Funds are used to account for assets held in a trustee capacity for others, and include Pension Trusts and Agency Funds.
Agency Funds - Agency funds are custodial in nature (assets equal liabilities). The Town’s Agency Fund is listed below: Student Activities: Accounts for the various student activities and clubs.

77
TOWN OF GREENWICH, CONNECTICUT EXHIBIT C
COMBINING STATEMENT OF CHANGES IN FIDUCIARY NET ASSETS
FIDUCIARY FUNDS
June 30, 2012
Balance Balance
July 1, 2011 Additions Deductions June 30, 2012
STUDENT ACTIVITIES FUND
Assets:
Cash and cash equivalents 798,412 $ 2,404,650 $ (2,670,028) $ 533,034 $
LIABILITIES
Fiduciary deposits 798,412 $ 2,404,650 $ (2,670,028) $ 533,034 $

78
This page intentionally left blank.

Other Schedules


79
This page intentionally left blank.

80
TOWN OF GREENWICH, CONNECTICUT
SCHEDULE OF PROPERTY TAXES LEVIED, COLLECTED AND OUTSTANDING
For the Year Ended June 30, 2012
Balance
Grand Uncollected Current Adjusted
List Year July 1, 2011 Levy Additions Deletions Taxes Collections
2010 -$ 306,907,834 $ 252,889 $ (430,926) 306,729,797 304,715,359 $
2009 2,486,244 - 55,134 (99,753) 2,441,625 1,488,439
2008 833,465 - 53,960 (85,311) 802,114 328,292
2007 415,240 - 368 (11,980) 403,628 110,660
2006 193,280 - 31 (9,062) 184,249 38,856
2005 119,336 - 327 (36) 119,627 9,075
2004 163,017 - 2 (478) 162,541 1,147
2003 163,529 - - (784) 162,745 685
2002 139,804 - - (83) 139,721 791
2001 162,143 - - (296) 161,847 812
2000 314,484 - 1 (263) 314,222 779
1999 824 - - - 824 -
1998 5,000 - - - 5,000 -
1997 195 - - - 195 -
1996 120 - - - 120 -
4,996,681 $ 306,907,834 $ 362,712 $ (638,972) $ 311,628,255 $ 306,694,895 $
Lawful Corrections
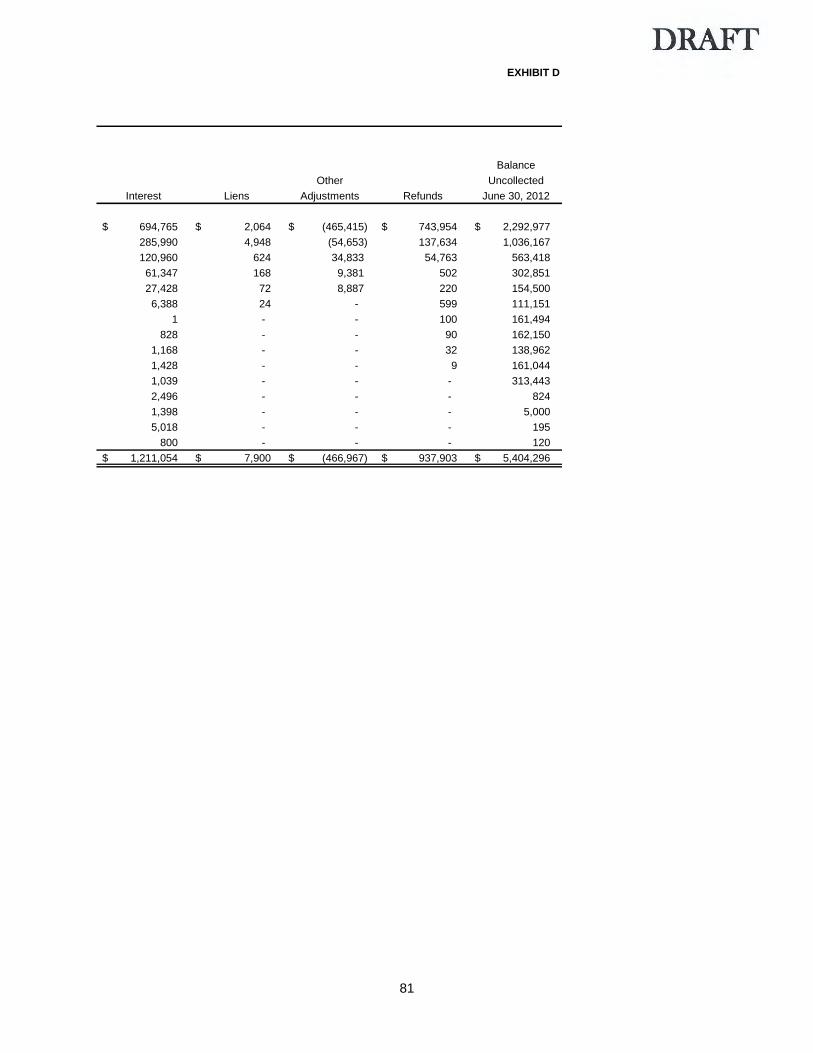
81
EXHIBIT D
Balance
Other Uncollected
Interest Liens Adjustments Refunds June 30, 2012
694,765 $ 2,064 $ (465,415) $ 743,954 $ 2,292,977 $
285,990 4,948 (54,653) 137,634 1,036,167
120,960 624 34,833 54,763 563,418
61,347 168 9,381 502 302,851
27,428 72 8,887 220 154,500
6,388 24 - 599 111,151
1 - - 100 161,494
828 - - 90 162,150
1,168 - - 32 138,962
1,428 - - 9 161,044
1,039 - - - 313,443
2,496 - - - 824
1,398 - - - 5,000
5,018 - - - 195
800 - - - 120
1,211,054 $ 7,900 $ (466,967) $ 937,903 $ 5,404,296 $

82
TOWN OF GREENWICH, CONNECTICUT
SCHEDULE OF SEWER TAXES LEVIED, COLLECTED AND OUTSTANDING
For the Year Ended June 30, 2012
Balance
Grand Uncollected Current Adjusted
List Year July 1, 2011 Levy Additions Deletions Taxes Collections
2010 -$ 9,971,580 $ 4,287 $ (4,218) 9,971,649 9,912,720 $
2009 66,729 - - (2,768) 63,961 39,511
2008 18,177 - - (2,619) 15,558 4,601
2007 7,155 - - (461) 6,694 1,540
2006 3,181 - - (445) 2,736 662
2005 1,020 - - - 1,020 301
2004 449 - - - 449 -
2003 86 - - - 86 -
2002 86 - - - 86 -
2001 74 - - - 74 -
2000 64 - - - 64 -
1999 700 - - - 700 -
1998 628 - - - 628 -
1997 746 - - - 746 -
99,095 $ 9,971,580 $ 4,287 $ (10,511) $ 10,064,451 $ 9,959,335 $
Lawful Corrections
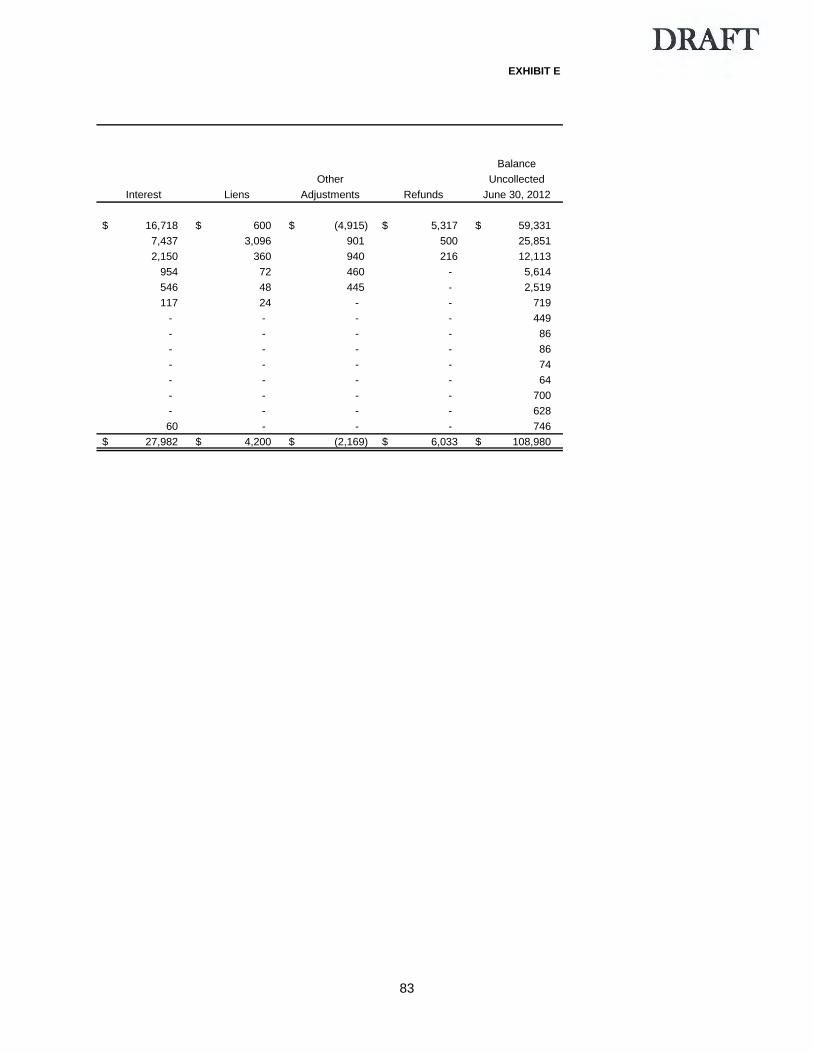
83
EXHIBIT E
Balance
Other Uncollected
Interest Liens Adjustments Refunds June 30, 2012
16,718 $ 600 $ (4,915) $ 5,317 $ 59,331 $
7,437 3,096 901 500 25,851
2,150 360 940 216 12,113
954 72 460 - 5,614
546 48 445 - 2,519
117 24 - - 719
- - - - 449
- - - - 86
- - - - 86
- - - - 74
- - - - 64
- - - - 700
- - - - 628
60 - - - 746
27,982 $ 4,200 $ (2,169) $ 6,033 $ 108,980 $

84
TOWN OF GREENWICH, CONNECTICUT EXHIBIT F
REVENUE BY FUNCTION - BUDGET AND ACTUAL - BUDGETARY BASIS - GENERAL FUND
For the Year Ended June 30, 2012
Variance With
Final Budget
Original Final Positive
Budget Budget Actual (Negative)
GENERAL GOVERNMENT
Emergency Operations -$ -$ -$ -$
Board of Selectman - - 560 560
Purchasing/Administrative Services - 134 134
Human Resources - - 296,179 296,179
Probate Court - - 106 106
Registrars of Voters - - 175 175
Board of Estimate & Taxation - Finance 6,978,000 6,978,000 5,576,636 (1,401,364)
IT Department 20,000 20,000 20,224 224
Assessor 18,000 18,000 5,309 (12,691)
Tax Collector 1,000,000 1,000,000 1,228,483 228,483
Law Department - - 3,966 3,966
Town Clerk 4,580,250 4,580,250 4,458,861 (121,389)
Planning and Zoning Boeard of Appeals 135,400 135,400 273,713 138,313
Planning and Zoning 245,250 245,250 301,184 55,934
Conservation Commission - - - -
Inland Wetlands and Water Courses Agency 339,195 339,195 425,563 86,368
Land Use Administration - - 880 880
Senior Center 62,000 62,000 65,329 3,329
Total general government 13,378,095 13,378,095 12,657,302 (720,793)
PUBLIC SAFETY
Fire Department - - 78,423 78,423
Police - Administration, et al 196,950 196,950 266,388 69,438
Police - Traffic Control 1,350,000 1,350,000 1,134,277 (215,723)
Total public safety 1,546,950 1,546,950 1,479,088 (67,862)
PUBLIC WORKS
Administration & Engineering Division - - 3,414 3,414
Highway Division 650,000 650,000 691,954 41,954
Waste Disposal Division 516,900 516,900 732,809 215,909
Building Construction and Maintenance - - - -
Building Inspection Division 3,705,400 3,705,400 4,160,100 454,700
Fleet - - 1,175 1,175
Total public works 4,872,300 4,872,300 5,589,452 717,152
HEALTH
Environmental Health Program 147,038 147,038 175,303 28,265
Division of Family Health 97,307 97,307 89,765 (7,542)
Laboratory Program 46,942 46,942 60,961 14,019
Total health 291,287 291,287 326,029 34,742
USE OF FUND BALANCE 7,042,013 7,042,013 - (7,042,013)
SOCIAL SERVICES
Homemaker Services 6,000 6,000 2,887 (3,113)
Adult Services 100 100 1,612 1,512
Total social services 6,100 6,100 4,499 (1,601)
(Continued)
Budgeted Amounts
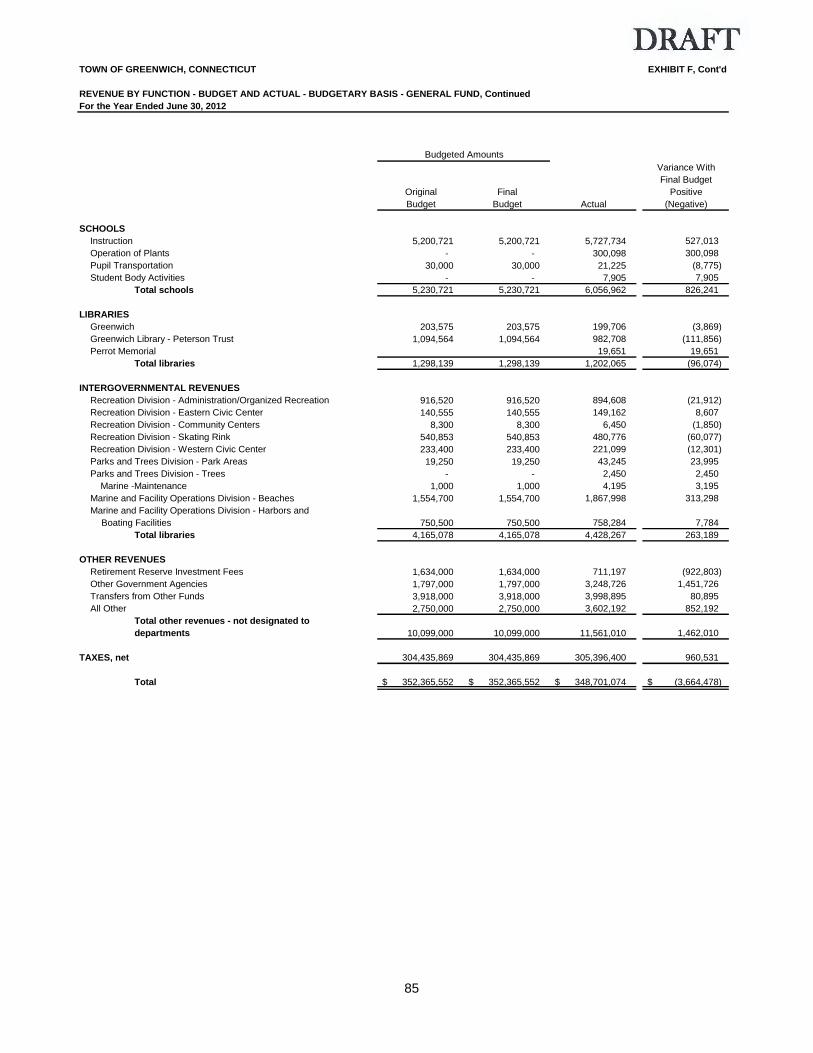
85
TOWN OF GREENWICH, CONNECTICUT EXHIBIT F, Cont'd
REVENUE BY FUNCTION - BUDGET AND ACTUAL - BUDGETARY BASIS - GENERAL FUND, Continued
For the Year Ended June 30, 2012
Variance With
Final Budget
Original Final Positive
Budget Budget Actual (Negative)
SCHOOLS
Instruction 5,200,721 5,200,721 5,727,734 527,013
Operation of Plants - - 300,098 300,098
Pupil Transportation 30,000 30,000 21,225 (8,775)
Student Body Activities - - 7,905 7,905
Total schools 5,230,721 5,230,721 6,056,962 826,241
LIBRARIES
Greenwich 203,575 203,575 199,706 (3,869)
Greenwich Library - Peterson Trust 1,094,564 1,094,564 982,708 (111,856)
Perrot Memorial 19,651 19,651
Total libraries 1,298,139 1,298,139 1,202,065 (96,074)
INTERGOVERNMENTAL REVENUES
Recreation Division - Administration/Organized Recreation 916,520 916,520 894,608 (21,912)
Recreation Division - Eastern Civic Center 140,555 140,555 149,162 8,607
Recreation Division - Community Centers 8,300 8,300 6,450 (1,850)
Recreation Division - Skating Rink 540,853 540,853 480,776 (60,077)
Recreation Division - Western Civic Center 233,400 233,400 221,099 (12,301)
Parks and Trees Division - Park Areas 19,250 19,250 43,245 23,995
Parks and Trees Division - Trees - - 2,450 2,450
Marine -Maintenance 1,000 1,000 4,195 3,195
Marine and Facility Operations Division - Beaches 1,554,700 1,554,700 1,867,998 313,298
Marine and Facility Operations Division - Harbors and
Boating Facilities 750,500 750,500 758,284 7,784
Total libraries 4,165,078 4,165,078 4,428,267 263,189
OTHER REVENUES
Retirement Reserve Investment Fees 1,634,000 1,634,000 711,197 (922,803)
Other Government Agencies 1,797,000 1,797,000 3,248,726 1,451,726
Transfers from Other Funds 3,918,000 3,918,000 3,998,895 80,895
All Other 2,750,000 2,750,000 3,602,192 852,192
Total other revenues - not designated to
departments 10,099,000 10,099,000 11,561,010 1,462,010
TAXES, net 304,435,869 304,435,869 305,396,400 960,531
Total 352,365,552 $ 352,365,552 $ 348,701,074 $ (3,664,478) $
Budgeted Amounts

86
TOWN OF GREENWICH, CONNECTICUT EXHIBIT G
MODIFIED PAY-AS-YOU-GO FINANCING - SEWER MAINTENANCE FUND
June 30, 2012
Amounts to be
Financed
June 30, 2012 2012-13 2013-14 2014-15 2015-16
Public Works
Force Main Program 154,000 154,000 - - -
Collection System Mgmnt 160,000 80,000 80,000 - -
Pump Upgrades 196,000 98,000 98,000 - -
Sewer Rehab 1,405,000 469,000 469,000 467,000 -
Pump Upgrades 2,520,000 840,000 840,000 840,000 -
Phase 1 & 2 SSES Private Inflow 248,000 62,000 62,000 62,000 62,000
Sewer Rehab 1,962,000 491,000 491,000 490,000 490,000
Force Maine Rehab 332,000 83,000 83,000 83,000 83,000
Sewer Maintenance 160,000 40,000 40,000 40,000 40,000
Pump Upgrades 960,000 240,000 240,000 240,000 240,000
Total 8,097,000 $ 2,557,000 $ 2,403,000 $ 2,222,000 $ 915,000 $

87
TOWN OF GREENWICH, CONNECTICUT EXHIBIT H
SCHEDULE OF CONSTRUCTION EXPENDITURES AND ENCUMBRANCES
COMPARED WITH AUTHORIZATIONS BY PROJECT
SEWER IMPROVEMENT FUND
For the Year Ended June 30, 2012
Uncommitted
Fiscal Year Expenditures Current Balance
Approved Appropriations Prior Years Year Total Encumbrances June 30, 2012
Milbrook Sewer 2000-01 4,399,171 $ 4,394,623 $ -$ 4,394,623 $ 4,548 $ -$
North Mianus Sewer 2000-01 18,691,472 18,509,836 - 18,509,836 181,636 -
Phase 2 SSES Strom Drainage 2007-08 500,000 65,385 63,462 128,847 6,651 364,502
Force Main Reconstruction 2007-08 1,500,000 1,330,562 150,442 1,481,004 11,821 7,175
Grass Island - Eval/Rehab 2007-08 2,034,824 2,019,428 15,396 2,034,824 - -
Wet Weather/Nutrient Rem 2008-09 475,000 287,138 71,751 358,889 48,331 67,780
Grass Island Pump-Aeration 2009-10 6,551,000 657,891 1,029,561 1,687,452 2,924,116 1,939,432
Grass Island Grit Screw 10 2009-10 50,000 43,417 6,583 50,000 - -
Grass Island Grit Screw 11 2010-11 300,000 - - - - 300,000
Collection Easement Machine 2011-12 60,000 - - - - 60,000
S Water St Relief Sewer 2011-12 850,000 - - - 65,000 785,000
Old Greenwich Force Main 2011-12 3,425,000 - 206,554 206,554 5,367 3,213,079
Grass Island Upgrade 2011-12 1,540,000 - - - 50,000 1,490,000
Total 40,376,467 $ 27,308,280 $ 1,543,749 $ 28,852,029 $ 3,297,470 $ 8,226,968 $

88
TOWN OF GREENWICH, CONNECTICUT EXHIBIT I
SPECIAL ASSESSMENT COLLECTIONS BY PROJECTS
SEWER IMPROVEMENT FUND
For the Year Ended June 30, 2012
Balance of Current Year Balance of
Date of Original Assessment Collections and Assessment
First Billing Assessment July 1, 2011 Adjustments June 30, 2012
North Mianus Sewer 9/1/1989 1,264,172 $ 490 $ 113 $ 377 $
Milbrook 1/1/2007 5,524,196 4,313,996 204,810 4,109,186
North Mianus 2 3/1/2008 21,314,114 19,064,441 2,584,795 16,479,646
Total 28,102,482 $ 23,378,927 $ 2,789,718 $ 20,589,209 $

Statistical Section

Statistical Section The objectives of statistical section information are to provide financial statement users with additional historical perspective, context and detail to assist in using the information in the financial statements, notes to financial statements and required supplementary information to understand and assess economic condition. Statistical section information is presented in the following categories:
Financial trends information is intended to assist users in understanding and assessing how financial position has changed over time.
Revenue capacity information is intended to assist users in understanding and assessing the factors affecting the ability to generate own-source revenues (property taxes, charges for services, etc.).
Debt capacity information is intended to assist users in understanding and assessing debt burden and the ability to issue additional debt.
Demographic and economic information is intended 1) to assist users in understanding the socioeconomic environment and 2) to provide information that facilitates comparisons of financial statement information over time and among governments.
Operating information is intended to provide contextual information about operations and resources to assist readers in using financial statement information to understand and assess economic condition.
The accompanying tables are presented in the above order. Refer to the Table of Contents for applicable page number locations. Sources: Unless otherwise noted, the information in the tables is derived from the comprehensive
annual financial reports for the relevant year.

89
This page intentionally left blank.

90
TOWN OF GREENWICH, CONNECTICUT
Net Assets By Component
Last Ten Fiscal Years
(Accrual Basis of Accounting)
2003 2004 2005 2006
Governmental activities:
Invested in capital assets, net of related debt 201,289,010 $ 227,717,199 $ 234,072,352 $ 258,858,851 $
Restricted - - - -
Unrestricted (19,384,450) 14,453,880 21,766,395 15,799,896
Total governmental activities
net assets 181,904,560 242,171,079 255,838,747 274,658,747
Business-type activities:
Invested in capital assets, net of related debt 5,956,098 5,769,461 5,724,415 5,714,040
Unrestricted 7,936,972 7,267,126 6,408,209 5,223,528
Total business-type activities
net assets 13,893,070 13,036,587 12,132,624 10,937,568
Primary government:
Invested in capital assets, net of related debt 207,245,108 233,486,660 239,796,767 264,572,891
Unrestricted (11,447,478) 21,721,006 28,174,604 21,023,424
Total primary government
net assets 195,797,630 $ 255,207,666 $ 267,971,371 $ 285,596,315 $
Fiscal Year

91
TABLE 1
2007 2008 2009 2010 2011 2012
304,124,219 $ 347,472,359 $ 374,257,444 $ 382,696,977 $ 391,518,906 $ 413,252,862 $
- - - - - 685,774
15,971,811 9,378,435 (5,471,098) 21,065,734 17,183,960 17,396,608
320,096,030 356,850,794 368,786,346 403,762,711 408,702,866 431,335,244
5,837,429 6,240,859 7,257,918 6,864,174 6,370,905 6,195,598
4,446,006 3,230,570 897,158 1,280,446 1,583,013 2,077,205
10,283,435 9,471,429 8,155,076 8,144,620 7,953,918 8,272,803
309,961,648 353,713,218 381,515,362 389,561,151 397,889,811 419,448,460
20,417,817 12,609,005 (4,573,940) 22,346,180 18,766,973 19,473,813
330,379,465 $ 366,322,223 $ 376,941,422 $ 411,907,331 $ 416,656,784 $ 438,922,273 $
Fiscal Year
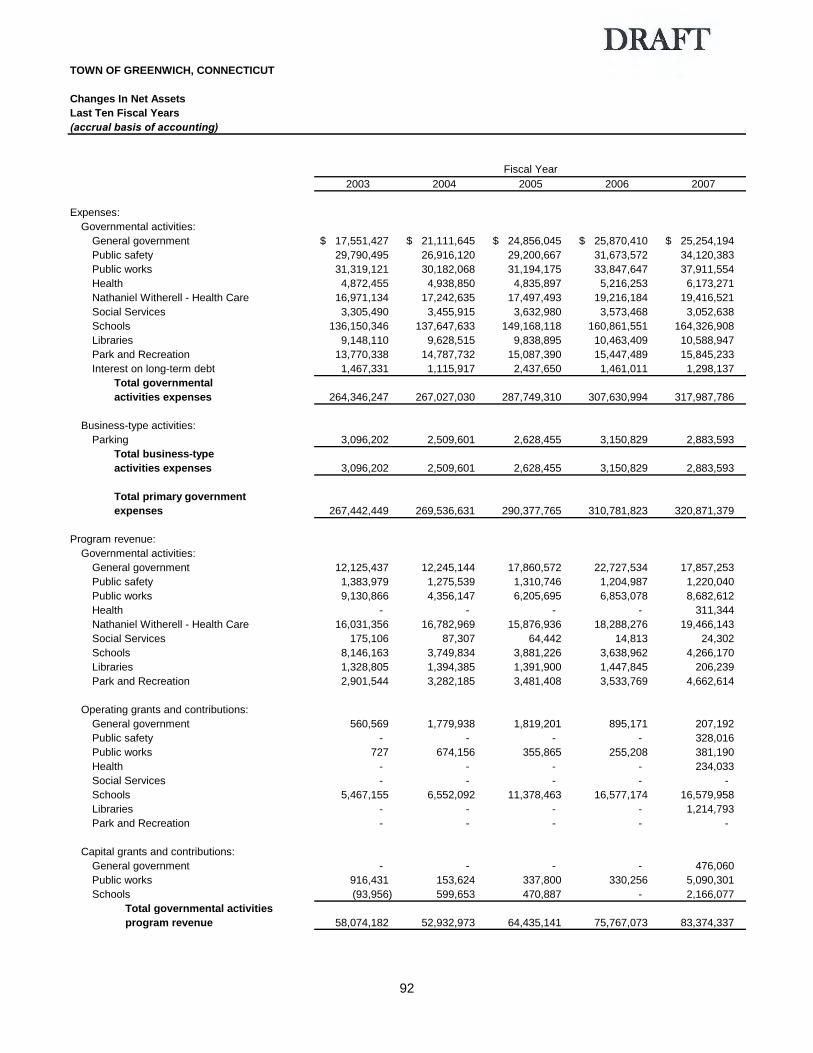
92
TOWN OF GREENWICH, CONNECTICUT
Changes In Net Assets
Last Ten Fiscal Years
(accrual basis of accounting)
2003 2004 2005 2006 2007
Expenses:
Governmental activities:
General government 17,551,427 $ 21,111,645 $ 24,856,045 $ 25,870,410 $ 25,254,194 $
Public safety 29,790,495 26,916,120 29,200,667 31,673,572 34,120,383
Public works 31,319,121 30,182,068 31,194,175 33,847,647 37,911,554
Health 4,872,455 4,938,850 4,835,897 5,216,253 6,173,271
Nathaniel Witherell - Health Care 16,971,134 17,242,635 17,497,493 19,216,184 19,416,521
Social Services 3,305,490 3,455,915 3,632,980 3,573,468 3,052,638
Schools 136,150,346 137,647,633 149,168,118 160,861,551 164,326,908
Libraries 9,148,110 9,628,515 9,838,895 10,463,409 10,588,947
Park and Recreation 13,770,338 14,787,732 15,087,390 15,447,489 15,845,233
Interest on long-term debt 1,467,331 1,115,917 2,437,650 1,461,011 1,298,137
Total governmental
activities expenses 264,346,247 267,027,030 287,749,310 307,630,994 317,987,786
Business-type activities:
Parking 3,096,202 2,509,601 2,628,455 3,150,829 2,883,593
Total business-type
activities expenses 3,096,202 2,509,601 2,628,455 3,150,829 2,883,593
Total primary government
expenses 267,442,449 269,536,631 290,377,765 310,781,823 320,871,379
Program revenue:
Governmental activities:
General government 12,125,437 12,245,144 17,860,572 22,727,534 17,857,253
Public safety 1,383,979 1,275,539 1,310,746 1,204,987 1,220,040
Public works 9,130,866 4,356,147 6,205,695 6,853,078 8,682,612
Health - - - - 311,344
Nathaniel Witherell - Health Care 16,031,356 16,782,969 15,876,936 18,288,276 19,466,143
Social Services 175,106 87,307 64,442 14,813 24,302
Schools 8,146,163 3,749,834 3,881,226 3,638,962 4,266,170
Libraries 1,328,805 1,394,385 1,391,900 1,447,845 206,239
Park and Recreation 2,901,544 3,282,185 3,481,408 3,533,769 4,662,614
Operating grants and contributions:
General government 560,569 1,779,938 1,819,201 895,171 207,192
Public safety - - - - 328,016
Public works 727 674,156 355,865 255,208 381,190
Health - - - - 234,033
Social Services - - - - -
Schools 5,467,155 6,552,092 11,378,463 16,577,174 16,579,958
Libraries - - - - 1,214,793
Park and Recreation - - - - -
Capital grants and contributions:
General government - - - - 476,060
Public works 916,431 153,624 337,800 330,256 5,090,301
Schools (93,956) 599,653 470,887 - 2,166,077
Total governmental activities
program revenue 58,074,182 52,932,973 64,435,141 75,767,073 83,374,337
Fiscal Year

93
TABLE 2
2008 2009 2010 2011 2012
49,373,894 $ 28,822,605 $ 23,219,744 $ 39,397,332 $ 24,424,333 $
35,640,906 37,989,706 39,650,090 41,349,824 42,537,492
36,988,837 38,769,104 35,090,914 42,287,137 40,596,363
6,387,336 6,994,793 29,006,247 30,410,192 30,750,247
19,338,924 20,873,323 - - -
3,355,086 3,089,381 2,904,224 2,730,455 3,665,284
213,221,853 183,788,787 186,283,008 201,822,776 210,037,091
11,276,991 11,955,144 11,728,468 12,440,099 12,395,193
15,687,025 16,089,359 15,125,432 15,790,609 15,855,817
1,713,467 2,536,175 2,087,019 3,249,282 2,810,361
392,984,319 350,908,377 345,095,146 389,477,706 383,072,181
3,315,643 3,525,799 2,842,245 3,154,417 2,816,041
3,315,643 3,525,799 2,842,245 3,154,417 2,816,041
396,299,962 354,434,176 347,937,391 392,632,123 385,888,222
18,061,725 8,973,708 15,416,669 13,063,704 11,800,248
1,170,180 1,168,578 1,376,693 1,393,976 1,414,426
8,312,033 5,390,714 5,396,015 5,772,716 5,820,689
332,296 314,228 7,255,136 8,175,703 7,462,390
20,821,314 21,625,499 - - -
23,015 24,760 24,590 2,653 26,178
4,317,943 4,302,575 4,032,051 4,024,805 4,851,991
188,827 198,813 201,223 222,362 190,859
4,784,157 4,677,296 4,924,079 6,017,987 5,586,276
310,189 280,349 153,876 867,981 33,088
368,269 62,331 22 133,547 265,461
376,808 376,699 762,930 550,305 1,633,425
187,012 151,527 15,147,419 14,772,816 15,019,360
- 77,000 - - -
85,264,167 20,989,200 21,947,284 23,779,699 26,735,154
1,241,122 1,260,892 1,236,578 1,153,481 982,708
- - 58,354 69,995 134,656
2,281,225 1,458,163 854,960 1,274,220 1,748,480
- - 2,131,835 2,462,140 1,509,539
1,287,196 647,293 3,065,492 772,502 -
149,327,478 71,979,625 83,985,206 84,510,592 85,214,928
Fiscal Year

94
TOWN OF GREENWICH, CONNECTICUT
Changes In Net Assets, Continued
Last Ten Fiscal Years
(accrual basis of accounting)
2003 2004 2005 2006 2007
Business-type activities:
Charges for services:
Parking 2,652,097 2,075,474 2,044,866 2,250,763 2,449,014
Total business-type activities
program revenues 2,652,097 2,075,474 2,044,866 2,250,763 2,449,014
Total primary government
program revenues 60,726,279 55,008,447 66,480,007 78,017,836 85,823,351
Net (expense) revenue:
Governmental activities (206,272,065) (214,094,057) (223,314,169) (231,863,921) (234,613,449)
Business-type activities (444,105) (434,127) (583,589) (900,066) (434,579)
Total primary government
net expense (206,716,170) (214,528,184) (223,897,758) (232,763,987) (235,048,028)
General revenues and other changes
in net assets:
Governmental activities:
Property taxes 206,263,573 221,217,185 230,327,963 241,937,971 253,667,275
Grants and contributions not
restricted to specific programs 4,119,384 2,775,793 2,550,557 2,184,345 2,394,823
Gain on sale of capital assets - - - - 26,639
Miscellaneous income - - - - 1,800,476
Unrestricted investment earnings 4,761,876 5,117,387 3,603,317 6,061,605 7,364,316
Transfers 469,000 480,000 500,000 500,000 534,000
Total governmental activities 215,613,833 229,590,365 236,981,837 250,683,921 265,787,529
Business-type activities:
Unrestricted investment earnings 260,445 57,644 179,626 205,010 314,444
Transfers (469,000) (480,000) (500,000) (500,000) (534,000)
Total business-type activities (208,555) (422,356) (320,374) (294,990) (219,556)
Total primary government 215,405,278 229,168,009 236,661,463 250,388,931 265,567,973
Changes in net assets:
Governmental activities 9,341,768 15,496,308 13,667,668 18,820,000 31,174,080
Business-type activities (652,660) (856,483) (903,963) (1,195,056) (654,135)
Total primary government 8,689,108 $ 14,639,825 $ 12,763,705 $ 17,624,944 $ 30,519,945 $
Fiscal Year

95
TABLE 2, Cont'd.
2008 2009 2010 2011 2012
2,751,362 2,878,374 3,324,979 3,234,325 3,327,151
2,751,362 2,878,374 3,324,979 3,234,325 3,327,151
152,078,840 74,857,999 87,310,185 87,744,917 88,542,079
(243,656,841) (278,928,752) (261,109,940) (304,967,114) (297,857,253)
(564,281) (647,425) 482,734 79,908 511,110
(244,221,122) (279,576,177) (260,627,206) (304,887,206) (297,346,143)
269,875,469 280,489,699 294,175,714 305,874,264 316,441,512
-
3,464,356 3,736,586 689,548 2,527,135 2,298,728
830,046 - - -
1,330,127 2,155,249 109,697 614,646 1,047,249
3,844,863 1,557,944 611,532 612,224 502,142
563,000 732,000 499,814 279,000 200,000
279,907,861 288,671,478 296,086,305 309,907,269 320,489,631
315,275 63,072 6,624 8,390 7,775
(563,000) (732,000) (499,814) (279,000) (200,000)
(247,725) (668,928) (493,190) (270,610) (192,225)
279,660,136 288,002,550 295,593,115 309,636,659 320,297,406
36,251,020 9,742,726 34,976,365 4,940,155 22,632,378
(812,006) (1,316,353) (10,456) (190,702) 318,885
35,439,014 $ 8,426,373 $ 34,965,909 $ 4,749,453 $ 22,951,263 $
Fiscal Year

96
TOWN OF GREENWICH, CONNECTICUT
Fund Balances, Governmental Funds
Last Ten Fiscal Years
(Modified Accrual Basis of Accounting)
2003 2004 2005 2006 2007
General Fund:
Reserved 5,572,788 $ 6,123,802 $ 6,759,341 $ 6,908,929 $ 6,111,361 $
Unreserved 10,800,031 12,417,195 8,249,377 (14,736,004) (43,443,133)
Nonspendable - - - - -
Committed - - - - -
Assigned - - - - -
Unassigned - - - - -
Total general fund 16,372,819 $ 18,540,997 $ 15,008,718 $ (7,827,075) $ (37,331,772) $
All Other Governmental Funds:
Reserved 16,202,808 $ 10,345,304 $ 17,796,803 $ 32,081,043 $ 43,086,338 $
Unreserved, reported in:
Special revenue funds 13,744,176 6,319,907 4,327,165 5,363,758 28,337,200
Capital projects funds 5,470,209 2,690,828 8,905,133 14,769,396 14,603,844
Nonspendable - - - - -
Restricted - - - - -
Committed - - - - -
Unassigned - - - - -
Total all other governmental
fund 35,417,193 $ 19,356,039 $ 31,029,101 $ 52,214,197 $ 86,027,382 $
Note: Information for years prior to the implementation of GASB Statement No. 54 has not been restated.
Fiscal Year

97
TABLE 3
2008 2009 2010 2011 2012
6,213,334 $ 5,673,319 $ 7,710,765 $ -$ -$
(30,231,914) (25,547,192) (2,633,255) - -
- - - 2,474,238 2,474,238
- - - 495,900 21,140
- - - 11,114,225 12,417,458
- - - 7,718,567 12,631,251
(24,018,580) $ (19,873,873) $ 5,077,510 $ 21,802,930 $ 27,544,087 $
33,278,626 $ 26,264,219 $ 12,999,995 $ -$ -$
(10,643,083) (11,458,027) 5,142,594 - -
(7,085,823) (45,183,198) (28,319,141) - -
- - - 132,729 25,771
- - - 2,056,319 685,774
- - - 8,048,761 10,093,023
- - - (7,652,796) (15,541,977)
15,549,720 $ (30,377,006) $ (10,176,552) $ 2,585,013 $ (4,737,409) $
Fiscal Year

98
TOWN OF GREENWICH, CONNECTICUT
Changes in Fund Balances, Governmental Funds
Last Ten Fiscal Years
(Modified Accrual Basis of Accounting)
2003 2004 2005 2006 2007
Revenues
Property taxes 210,884,356 $ 222,132,469 $ 230,327,963 $ 241,648,664 $ 254,912,059 $
Licenses and permits 4,202,670 4,400,576 6,358,174 6,987,019 6,771,251
Fines, forfeitures and penalties 1,632,556 1,509,802 1,554,490 1,449,836 1,799,787
Other revenues 9,529,405 4,317,779 7,721,449 11,305,667 7,908,258
Charges for services 19,302,352 22,084,837 25,419,089 24,435,721 27,227,044
Use of money and property 3,119,190 4,137,327 2,241,942 4,499,707 8,188,344
Intergovernmental revenues 25,998,029 29,161,079 26,293,148 34,310,653 36,455,574
Total revenues 274,668,558 287,743,869 299,916,255 324,637,267 343,262,317
Expenditures
General government 14,875,152 17,125,379 20,016,838 17,946,298 22,684,872
Public safety 22,191,291 22,599,182 22,925,925 24,927,228 26,173,436
Public works 24,067,062 22,005,777 23,303,969 24,013,970 25,296,706
Health 3,936,691 4,049,909 4,299,686 4,681,260 4,864,146
Nathaniel Witherell 13,374,160 13,666,995 13,871,105 15,164,322 15,619,661
Social services 2,515,133 2,725,469 2,878,439 2,798,367 3,052,638
Schools 105,608,460 111,202,367 116,539,220 126,386,537 129,523,696
Libraries 7,868,726 7,982,759 8,111,253 8,661,973 8,797,718
Parks and recreation 10,355,827 10,509,862 10,715,330 11,340,590 11,450,207
Fixed charges 45,773,774 50,964,714 50,562,076 53,320,795 54,846,497
Debt service:
State loan repayment - principal 1,787,667 1,824,081 2,462,483 2,239,944 2,285,156
Principal retirements 4,400,000 4,830,000 880,000 1,022,500 1,105,650
Interest and other charges 817,331 1,919,240 1,820,607 1,452,453 1,327,791
Capital outlay 34,059,911 22,271,322 22,560,109 33,709,227 58,193,791
Total expenditures 291,631,185 293,677,056 300,947,040 327,665,464 365,221,965
Excess of revenues (under)
expenditures (16,962,627) (5,933,187) (1,030,785) (3,028,197) (21,959,648)
Other Financing Sources (Uses)
Transfers in 27,881,828 21,958,415 42,028,924 66,559,329 94,674,135
Transfers out (27,412,828) (21,478,415) (41,528,924) (66,059,329) (94,140,135)
Issuance of notes payable - - 8,671,568 877,500 -
Proceeds from bonds 24,830,000 - - - 11,385,000
Payments to refunded note holders - - - - -
BAN repayments (10,000,000) - - - -
Premium on bonds issued - - - - -
Total other financing sources
(uses) 15,299,000 480,000 9,171,568 1,377,500 11,919,000
Net changes in fund balance (1,663,627) $ (5,453,187) $ 8,140,783 $ (1,650,697) $ (10,040,648) $
Debt Service as a Percentage of
Noncapital Expenditures 2.72% 3.16% 1.85% 1.60% 1.54%
Fiscal Year

99
TABLE 4
2008 2009 2010 2011 2012
269,700,763 $ 280,725,158 $ 293,534,263 $ 306,293,817 $ 318,107,833 $
6,928,175 4,477,311 4,557,697 5,290,147 5,070,210
1,738,223 1,698,809 1,977,543 2,002,214 1,598,939
8,779,960 7,590,987 8,647,378 9,459,315 8,780,429
29,224,633 20,578,277 22,375,672 23,229,680 22,997,534
4,846,685 2,648,585 1,601,927 1,636,705 1,238,044
86,298,634 42,294,746 46,048,298 46,698,227 48,832,063
407,517,073 360,013,873 378,742,778 394,610,105 406,625,052
44,791,752 19,453,480 19,697,775 19,101,483 18,912,907
27,882,216 28,404,546 30,046,868 29,831,788 30,558,783
26,376,413 27,428,481 25,741,371 26,815,913 25,449,650
5,216,074 5,547,497 23,267,636 23,420,400 24,686,533
15,844,070 16,533,576 - -
3,221,626 3,089,431 2,904,224 2,730,455 2,875,859
179,553,531 141,990,290 142,964,491 149,660,683 158,791,453
9,495,280 9,732,167 9,596,692 9,805,676 9,819,033
11,474,789 11,331,463 10,531,996 10,450,471 10,428,430
62,533,788 65,361,761 66,260,332 76,659,361 82,194,840
- -
2,702,097 2,378,336 2,427,168 2,475,315 2,525,277
3,746,506 4,303,082 3,362,500 11,522,500 16,892,500
1,371,905 1,660,078 2,109,298 2,554,994 3,767,419
72,115,207 65,313,703 42,739,638 30,850,127 39,491,683
466,325,254 402,527,891 381,649,989 395,879,166 426,394,367
(58,808,181) (42,514,018) (2,907,211) (1,269,061) (19,769,315)
36,750,708 26,895,577 16,816,514 14,587,354 22,420,022
(36,187,708) (26,163,577) (16,316,700) (14,308,354) (22,220,022)
- - - -
19,935,000 - 45,000,000 30,000,000 16,500,000
(20,610,000) - - -
- - - -
1,251,967 - 2,559,234 2,618,009 1,488,050
1,139,967 732,000 48,059,048 32,897,009 18,188,050
(57,668,214) $ (41,782,018) $ 45,151,837 $ 31,627,948 $ (1,581,265) $
1.98% 2.47% 2.33% 4.53% 10.67%
Fiscal Year
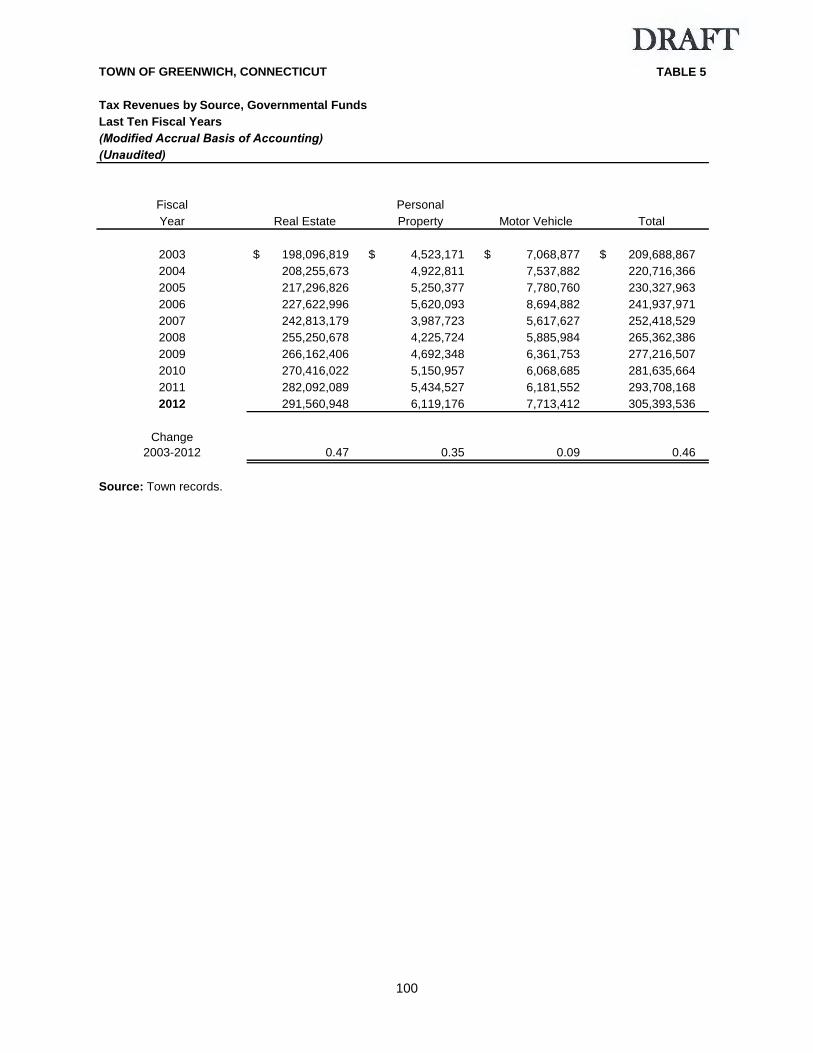
100
TOWN OF GREENWICH, CONNECTICUT TABLE 5
Tax Revenues by Source, Governmental Funds
Last Ten Fiscal Years
(Modified Accrual Basis of Accounting)(Unaudited)
Fiscal Personal
Year Real Estate Property Motor Vehicle Total
2003 198,096,819 $ 4,523,171 $ 7,068,877 $ 209,688,867 $
2004 208,255,673 4,922,811 7,537,882 220,716,366
2005 217,296,826 5,250,377 7,780,760 230,327,963
2006 227,622,996 5,620,093 8,694,882 241,937,971
2007 242,813,179 3,987,723 5,617,627 252,418,529
2008 255,250,678 4,225,724 5,885,984 265,362,386
2009 266,162,406 4,692,348 6,361,753 277,216,507
2010 270,416,022 5,150,957 6,068,685 281,635,664
2011 282,092,089 5,434,527 6,181,552 293,708,168
2012 291,560,948 6,119,176 7,713,412 305,393,536
Change
2003-2012 0.47 0.35 0.09 0.46
Source: Town records.

101
This page intentionally left blank.

102
TOWN OF GREENWICH, CONNECTICUT
Assessed Value and Estimated Actual Value of Taxable Property
Last Ten Fiscal Years
(Unaudited)
Fiscal Residential Commercial Industrial Miscellaneous Personal Motor
Year Property Property Property Land Property Vehicle
2003 16,227,628,720 2,195,179,770 66,755,780 487,921,070 413,011,579 618,271,512
2004 16,198,263,040 2,141,268,500 63,879,200 465,614,590 433,156,325 636,826,320
2005 16,346,545,580 2,155,969,410 63,920,010 449,099,770 458,514,110 623,923,350
2006 16,542,613,560 2,178,591,590 64,894,270 478,968,840 473,937,285 668,197,880
2007 26,366,293,010 4,523,325,730 127,482,740 821,147,460 534,677,072 690,033,640
2008 26,616,374,240 4,566,905,150 124,944,680 796,962,330 552,247,241 691,684,140
2009 27,056,262,380 4,611,662,790 124,702,270 766,581,340 599,961,883 717,342,700
2010 27,435,571,240 4,562,277,370 121,722,440 748,158,250 630,786,617 682,648,560
2011 27,638,240,800 4,591,437,690 122,325,980 755,535,410 650,786,672 660,359,320
2012 23,941,062,300 4,459,150,150 111,626,480 656,121,410 616,117,997 695,397,640
Source: Town Records
Note: The above information presents the information for each period for which it is levied. A tax levy provides taxes
remitted in the following year. There are no overlapping governments that collect property taxes from Town residents.
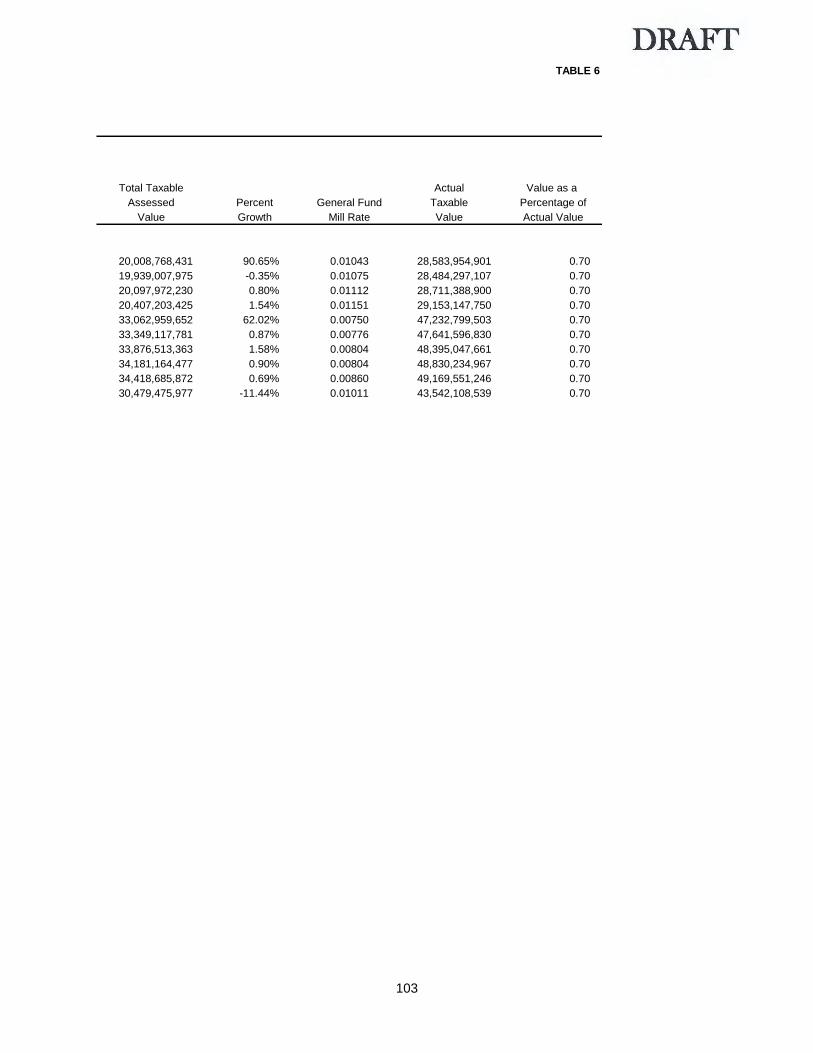
103
TABLE 6
Total Taxable Actual Value as a
Assessed Percent General Fund Taxable Percentage of
Value Growth Mill Rate Value Actual Value
20,008,768,431 90.65% 0.01043 28,583,954,901 0.70
19,939,007,975 -0.35% 0.01075 28,484,297,107 0.70
20,097,972,230 0.80% 0.01112 28,711,388,900 0.70
20,407,203,425 1.54% 0.01151 29,153,147,750 0.70
33,062,959,652 62.02% 0.00750 47,232,799,503 0.70
33,349,117,781 0.87% 0.00776 47,641,596,830 0.70
33,876,513,363 1.58% 0.00804 48,395,047,661 0.70
34,181,164,477 0.90% 0.00804 48,830,234,967 0.70
34,418,685,872 0.69% 0.00860 49,169,551,246 0.70
30,479,475,977 -11.44% 0.01011 43,542,108,539 0.70

104
TOWN OF GREENWICH, CONNECTICUT TABLE 7
Principal Property Taxpayers
Current Year and Nine Years Ago
(Unaudited)
2012 2003
Percentage Percentage
of Total Town of Total Town
Taxable Taxable Taxable Taxable
Assessed Assessed Assessed Assessed
Taxpayer Value Rank Value Value Rank Value
Greenwich Plaza Incorporated 185,990,140 $ 1 0.61% 72,338,000 $ 1 0.36%
Pickwick Plaza Associates 145,204,010 2 0.48% 58,138,500 3 0.29%
Greenwich American Incorporated 122,500,000 3 0.40% 71,260,000 2 0.36%
Property Connecticut-One Corp 100,764,860 4 0.33% 41,878,760 5 0.21%
GRC Realty Corporation 101,843,700 5 0.33% 37,333,310 6 0.19%
Antares 100WP LP c/o Antares Real Estate 87,921,680 6 0.29% - - -
Greenwich Centre Limited Partnership 70,970,130 7 0.23% 36,365,000 8 0.18%
Railroad Properties LLC 83,945,120 8 0.28% - - -
33 Benedict Place 69,850,130 9 0.23% - - 0.00%
Greenwich Place Acquisition LLC 58,772,490 10 0.19% - - 0.00%
Greenwich Hotel Limited - - - 52,005,800 4 0.26%
Allen Management Inc. - - - 38,350,900 7 0.19%
Putnam Park - - - 34,311,200 9 0.17%
UST Inc. - - - 29,470,000 10 0.15%
Total 1,027,762,260 $ 3.37% 471,451,470 $ 2.36%
Source: Town Records

105
This page intentionally left blank.

106
TOWN OF GREENWICH, CONNECTICUT
Property Tax Levies And Collections
Last Ten Fiscal Years
(Unaudited)
Collected Within the
Fiscal Year of the Levy
Taxes Levied
for the Percentage
Fiscal Year Ended June 30: Grand List Year Tax Year Amount of Levy
2003 2001 209,812,560 $ 207,721,880 $ 99.00%
2004 2002 220,782,314 216,671,909 98.14%
2005 2003 230,293,996 228,340,165 99.15%
2006 2004 242,327,912 240,670,219 99.32%
2007 2005 252,491,317 251,746,803 99.71%
2008 2006 267,110,961 265,384,723 99.35%
2009 2007 280,259,856 277,188,459 98.90%
2010 2008 293,327,279 289,975,889 98.86%
2011 2009 305,667,562 301,656,607 98.69%
2012 2010 318,016,915 314,158,807 98.79%
Source: Town Tax Records
Note: The above information presents the information for each period for which it is levied. A tax levy
provides taxes remitted in the following year.

107
TABLE 8
Total Collections to Date
Collections in
Subsequent Percentage
Years Amount of Levy
2,090,680 $ 209,812,560 $ 100.00%
720,300 218,762,589 99.09%
316,955 229,060,465 99.46%
671,726 240,987,174 99.45%
495,582 252,418,529 99.97%
1,055,416 265,880,305 99.54%
990,086 278,243,875 99.28%
1,027,133 290,965,975 99.19%
864,581 302,683,740 99.02%
314,158,807 98.79%

108
TOWN OF GREENWICH, CONNECTICUT TABLE 9
Ratios of General Bonded Debt Outstanding by Type
Last Ten Fiscal Years
(Unaudited)
Governmental
Activities
General Total Percentage of
Fiscal Obligation Notes Primary Per Capita Per
Year Bonds Payable Government Income(1)
Capita
2003 29,230,000 $ 19,745,236 $ 48,975,236 $ 1.078% 801.55 $
2004 24,400,000 17,921,155 42,321,155 0.932% 692.64
2005 23,520,000 24,130,312 47,650,312 1.049% 765.64
2006 22,595,000 22,670,368 45,265,368 0.996% 727.32
2007 33,005,000 20,287,991 53,292,991 1.173% 856.30
2008 28,710,000 62,818,983 91,528,983 1.983% 1,470.68
2009 25,480,000 87,383,376 112,863,376 2.445% 1,813.47
2010 67,215,000 57,859,535 125,074,535 2.697% 2,005.43
2011 85,790,000 43,286,720 129,076,720 2.815% 2,092.95
2012 85,495,000 47,663,943 133,158,943 2.765% 2,176.83
(1) See the Schedule of Demographic and Economic Statistics on page for personal income and populaion data
Note: Details regarding the Town's outstanding debt may be found in the notes to the basic financial statements.

109
TOWN OF GREENWICH, CONNECTICUT TABLE 10
Direct Governmental Activities Debt
For the Year Ended June 30, 2012
(Unaudited)
Debt
Governmental Unit Outstanding
General obligation debt 85,495,000 $
Less school construction grants receivable -
principal portion only -
Total direct debt 85,495,000 $
Sources: Town Records
Note: The Town is not subject to the debt of overlapping governments.
Note: School construction grants are receivable in substantially equal installments over the
life of outstanding school bonds, obtained from the Office of Policy and Management,
State of Connecticut.
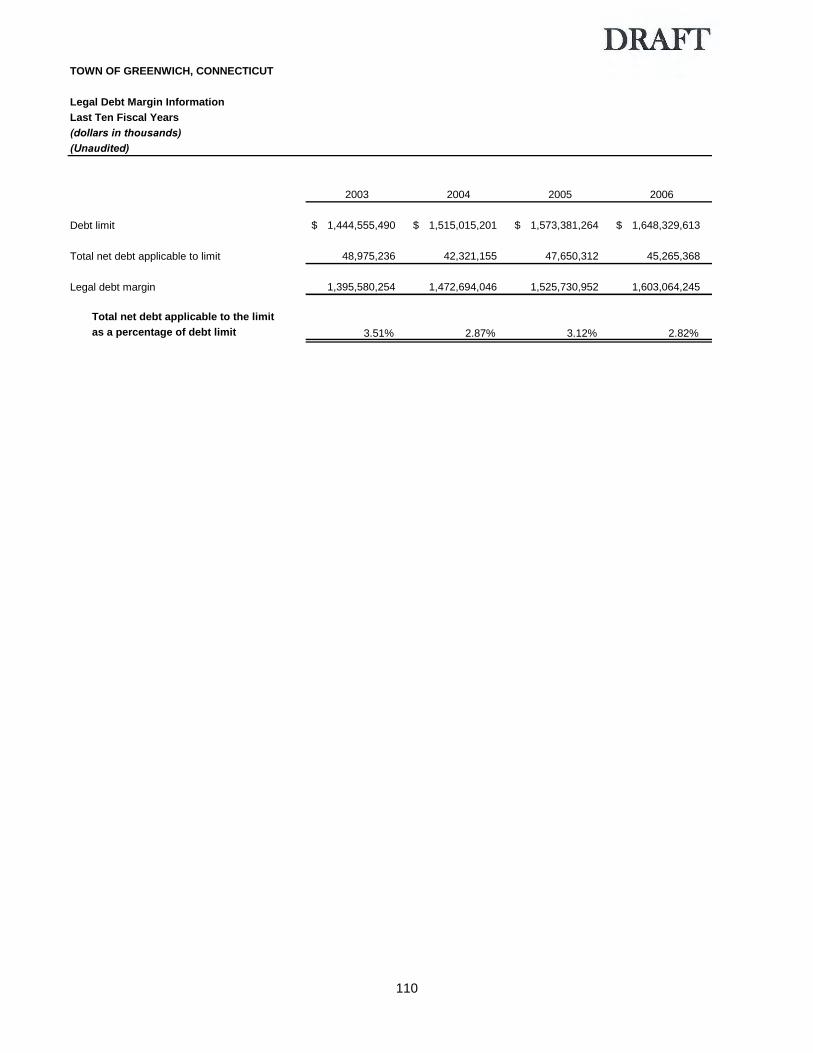
110
TOWN OF GREENWICH, CONNECTICUT
Legal Debt Margin Information
Last Ten Fiscal Years
(dollars in thousands)(Unaudited)
2003 2004 2005 2006
Debt limit 1,444,555,490 $ 1,515,015,201 $ 1,573,381,264 $ 1,648,329,613 $
Total net debt applicable to limit 48,975,236 42,321,155 47,650,312 45,265,368
Legal debt margin 1,395,580,254 1,472,694,046 1,525,730,952 1,603,064,245
Total net debt applicable to the limit
as a percentage of debt limit 3.51% 2.87% 3.12% 2.82%

111
TABLE 11
2007 2008 2009 2010 2011 2012
1,731,344,608 $ 1,816,329,620 $ 1,895,226,795 $ 1,978,017,041 $ 2,065,791,917 $ 2,147,711,678 $
66,495,991 109,782,983 126,782,376 137,057,192 150,567,877 161,118,575
1,664,848,617 1,706,546,637 1,768,444,419 1,840,959,849 1,915,224,040 1,986,593,103
3.99% 6.43% 7.17% 7.44% 7.86% 8.11%

112
TOWN OF GREENWICH, CONNECTICUT TABLE 12
COMPUTATION OF LEGAL DEBT LIMITATION
Total tax collections (including interest and lien
fees) for the year ended June 30, 2012 306,616,555 $
Reimbursement for revenue loss:
Tax relief for elderly 199,399
Base 306,815,954 $
Debt limit 2,147,711,678 $
June 30, 2012
Unfunded
Pension
General Urban Benefit
Debt Limitation Purpose Schools Sewer Renewal Obligation
2-1/4 times base 690,335,897 $ -$ -$ -$ -$
4-1/2 times base - 1,380,671,793 - - -
3-3/4 times base - - 1,150,559,828 - -
3-1/4 times base - - - 997,151,851 -
3 times base - - - - 920,447,862
Total debt limitation 690,335,897 1,380,671,793 1,150,559,828 997,151,851 920,447,862
Debt as defined by statute:
Bonds payable 22,862,600 34,635,400 27,997,000 - -
Clean water notes - - 7,468,943 - -
BANS 16,726,000 23,274,000 - - -
Installment note 195,000 - - - -
Bonds authorized but
not issued, issue dates 10,212,993 17,106,991 639,648 - -
not yet established - - - - -
Total indebtedness 49,996,593 75,016,391 36,105,591 - -
Debt Limitation in excess
of indebtedness 640,339,304 $ 1,305,655,402 $ 1,114,454,237 $ 997,151,851 $ 920,447,862 $

113
TOWN OF GREENWICH, CONNECTICUT TABLE 13
Demographic and Economic Statistics
Last Ten Fiscal Years
(Unaudited)
Fiscal
Year
Ended Personal Per Capita Median School Unemployment)
June 30 Population(1) Income Income(1) Age(1) Enrollment (2) Rate (3
2003 61,101 4,542,614,946 74,346 40.2 9,113 2.6%
2004 61,101 4,542,614,946 74,346 40.2 9,083 2.9%
2005 61,101 4,542,614,946 74,346 40.2 9,003 3.0%
2006 61,101 4,542,614,946 74,346 40.2 8,905 2.9%
2007 61,101 4,542,614,946 74,346 40.2 9,011 3.0%
2008 62,077 4,615,176,642 74,346 40.2 8,973 4.6%
2009 62,077 4,615,176,642 74,346 40.2 8,867 6.3%
2010 62,368 4,636,811,328 74,346 40.2 8,858 6.4%
2011 61,672 4,585,066,512 74,346 40.2 8,882 6.9%
2012 61,171 4,816,237,514 78,734 42.9 8,865 5.9%
Sources:
(1) Bureau of Census-Based on census data.
(2) Office of the Superintendent of Schools
(3) Connecticut Department of Labor, By Town, Not Seasonally Adjusted.
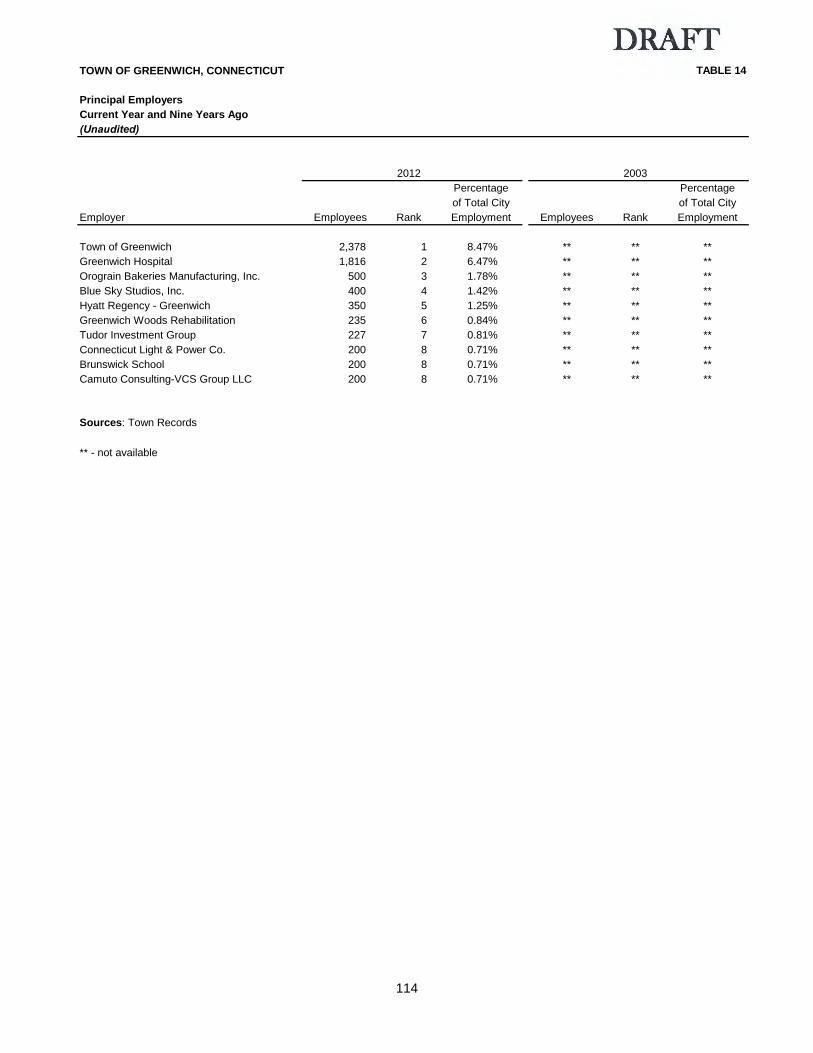
114
TOWN OF GREENWICH, CONNECTICUT TABLE 14
Principal Employers
Current Year and Nine Years Ago
(Unaudited)
2012 2003
Percentage Percentage
of Total City of Total City
Employer Employees Rank Employment Employees Rank Employment
Town of Greenwich 2,378 1 8.47% ** ** **
Greenwich Hospital 1,816 2 6.47% ** ** **
Orograin Bakeries Manufacturing, Inc. 500 3 1.78% ** ** **
Blue Sky Studios, Inc. 400 4 1.42% ** ** **
Hyatt Regency - Greenwich 350 5 1.25% ** ** **
Greenwich Woods Rehabilitation 235 6 0.84% ** ** **
Tudor Investment Group 227 7 0.81% ** ** **
Connecticut Light & Power Co. 200 8 0.71% ** ** **
Brunswick School 200 8 0.71% ** ** **
Camuto Consulting-VCS Group LLC 200 8 0.71% ** ** **
Sources: Town Records
** - not available

115
This page intentionally left blank.

116
TOWN OF GREENWICH, CONNECTICUT
Full-Time Equivalent Town Government Employees By Functions/Programs
Last Ten Fiscal Years
(Unaudited)
Full-Time Equivalent Employees as of June 30 Full-Time Equivalent Employees as of June 30
2003 2004 2005 2006
Functions/Program
Governmental Services:
First Selectman 5 7 6 8
Purchasing 6 7 7 7
Administrative Services 7 6 6 6
Human Resources 10 10 10 11
Registrars of Voters 3 3 3 5
Finance 24 24 23 23
Retirement 1 2 2 2
Information Technology 10 10 10 10
Assessor 12 14 14 13
Tax Collector 7 7 7 7
Law 11 11 11 11
Town Clerk 8 8 8 8
Planning & Zoning 5 5 5 5
Planning & Zoning Brd of Appeals - - - -
Conservation Commission 2 2 2 2
Inland Wetlands Watercourse Agency 4 5 5 4
Land Use Administration 5 5 5 5
Commission on Aging 2 2 2 2
Community Development 2 2 2 2
Senior Center - - - -
Parks and Recreation:
General & Administrative 10 10 10 10
Recreation 15 15 15 14
Marine 20 20 20 20
Parks & Trees 82 81 81 79
Golf Course 9 9 9 9
Police:
Officers 152 152 152 157
Civilians 12 12 12 18
Fire:
Firefighters and Officers 101 100 100 104
Civilians 3 3 3 3
Public Works:
Administration 15 14 14 14
Engineering 7 7 7 8
Highway, Streets & Bridges 70 70 69 67
Waste Disposal 8 8 8 7
Building Construction & Maintenance 23 23 23 22
Building Inspection 14 14 14 15
Fleet 15 15 15 15
Health 45 25 25 24
Nathaniel Witherell 171 174 173 172
Social Services 38 37 36 34
Schools 1,302 1,326 1,343 1,349
Libraries 78 78 78 77
Other Programs/Functions:
School Lunch 27 27 27 27
Parking 23 24 26 22
Sewer Maintenance & Improvement 25 25 25 25
Total 2,389 2,399 2,413 2,423
Source: Town Records
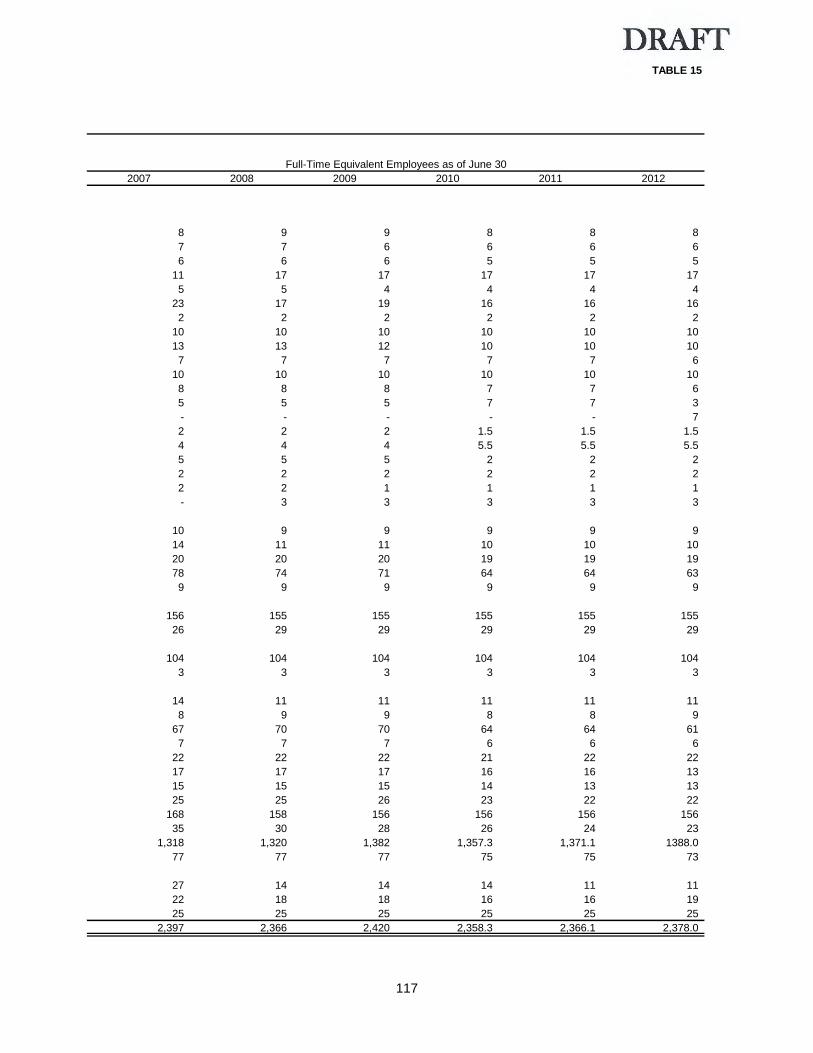
117
TABLE 15
Full-Time Equivalent Employees as of June 30
2007 2008 2009 2010 2011 2012
8 9 9 8 8 8
7 7 6 6 6 6
6 6 6 5 5 5
11 17 17 17 17 17
5 5 4 4 4 4
23 17 19 16 16 16
2 2 2 2 2 2
10 10 10 10 10 10
13 13 12 10 10 10
7 7 7 7 7 6
10 10 10 10 10 10
8 8 8 7 7 6
5 5 5 7 7 3
- - - - - 7
2 2 2 1.5 1.5 1.5
4 4 4 5.5 5.5 5.5
5 5 5 2 2 2
2 2 2 2 2 2
2 2 1 1 1 1
- 3 3 3 3 3
10 9 9 9 9 9
14 11 11 10 10 10
20 20 20 19 19 19
78 74 71 64 64 63
9 9 9 9 9 9
156 155 155 155 155 155
26 29 29 29 29 29
104 104 104 104 104 104
3 3 3 3 3 3
14 11 11 11 11 11
8 9 9 8 8 9
67 70 70 64 64 61
7 7 7 6 6 6
22 22 22 21 22 22
17 17 17 16 16 13
15 15 15 14 13 13
25 25 26 23 22 22
168 158 156 156 156 156
35 30 28 26 24 23
1,318 1,320 1,382 1,357.3 1,371.1 1388.0
77 77 77 75 75 73
27 14 14 14 11 11
22 18 18 16 16 19
25 25 25 25 25 25
2,397 2,366 2,420 2,358.3 2,366.1 2,378.0
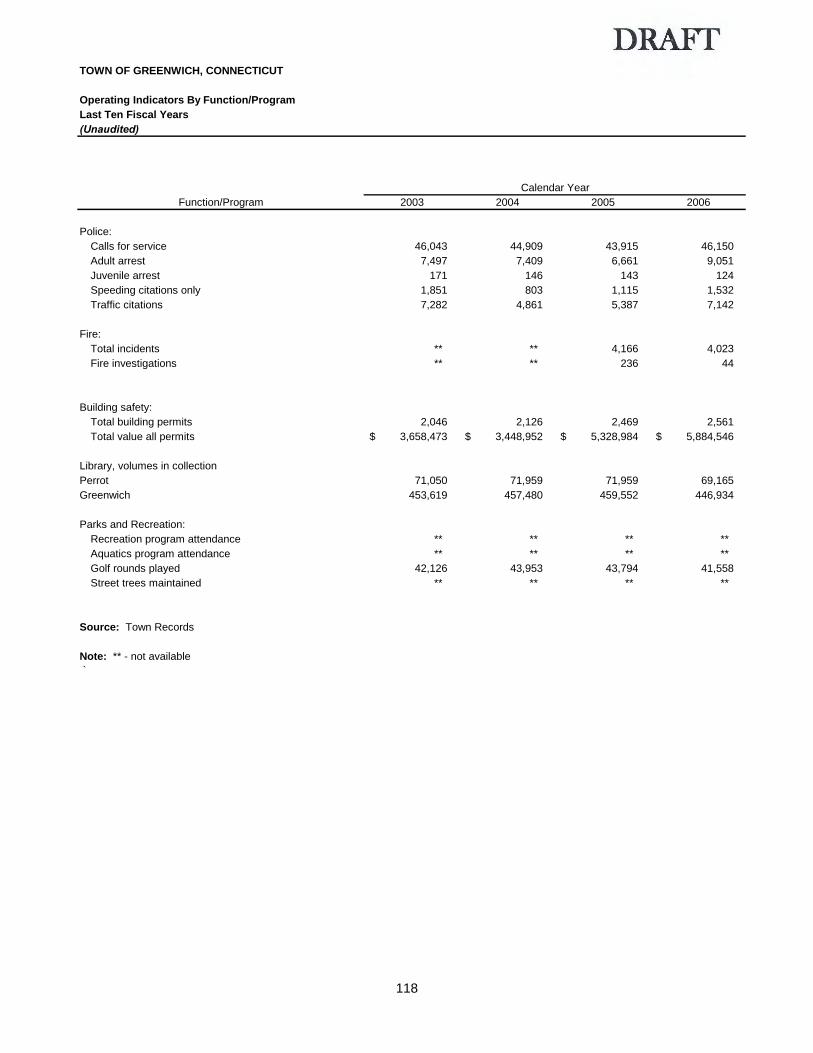
118
TOWN OF GREENWICH, CONNECTICUT
Operating Indicators By Function/Program
Last Ten Fiscal Years
(Unaudited)
Calendar Year Calendar Year
Function/Program 2003 2004 2005 2006
Police:
Calls for service 46,043 44,909 43,915 46,150
Adult arrest 7,497 7,409 6,661 9,051
Juvenile arrest 171 146 143 124
Speeding citations only 1,851 803 1,115 1,532
Traffic citations 7,282 4,861 5,387 7,142
Fire:
Total incidents ** ** 4,166 4,023
Fire investigations ** ** 236 44
Building safety:
Total building permits 2,046 2,126 2,469 2,561
Total value all permits 3,658,473 $ 3,448,952 $ 5,328,984 $ 5,884,546 $
Library, volumes in collection
Perrot 71,050 71,959 71,959 69,165
Greenwich 453,619 457,480 459,552 446,934
Parks and Recreation:
Recreation program attendance ** ** ** **
Aquatics program attendance ** ** ** **
Golf rounds played 42,126 43,953 43,794 41,558
Street trees maintained ** ** ** **
Source: Town Records
Note: ** - not available
`
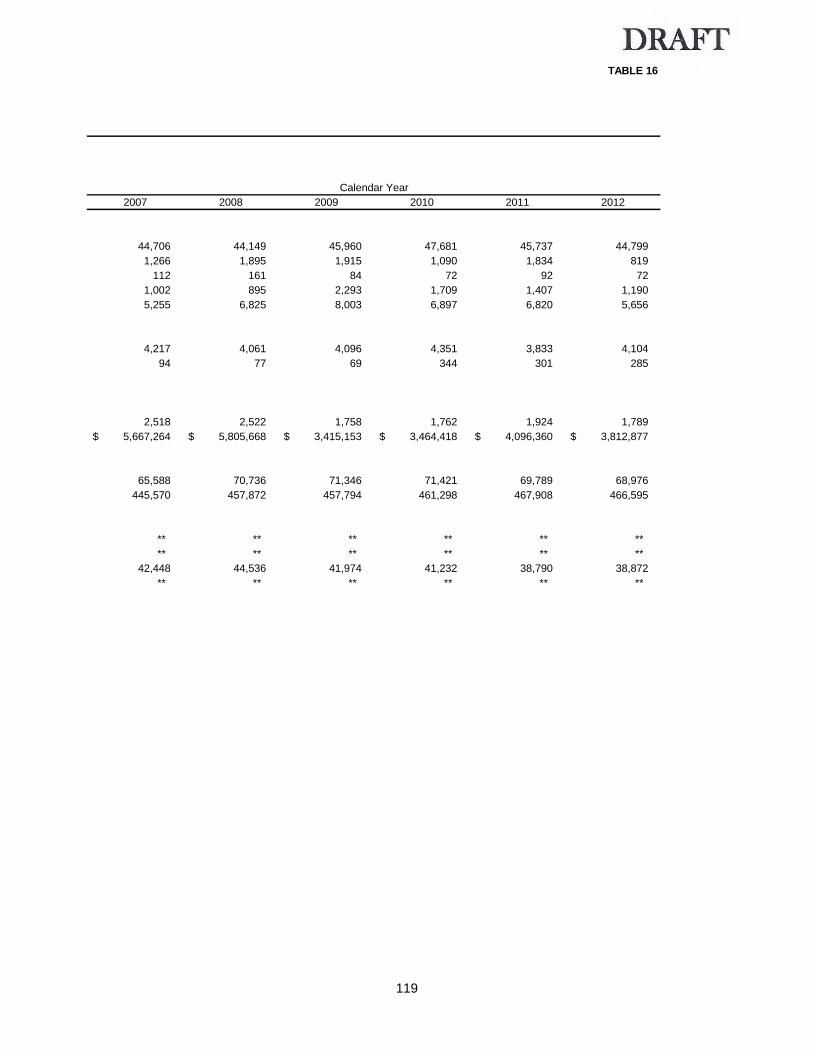
119
TABLE 16
Calendar Year
2007 2008 2009 2010 2011 2012
44,706 44,149 45,960 47,681 45,737 44,799
1,266 1,895 1,915 1,090 1,834 819
112 161 84 72 92 72
1,002 895 2,293 1,709 1,407 1,190
5,255 6,825 8,003 6,897 6,820 5,656
4,217 4,061 4,096 4,351 3,833 4,104
94 77 69 344 301 285
2,518 2,522 1,758 1,762 1,924 1,789
5,667,264 $ 5,805,668 $ 3,415,153 $ 3,464,418 $ 4,096,360 $ 3,812,877 $
65,588 70,736 71,346 71,421 69,789 68,976
445,570 457,872 457,794 461,298 467,908 466,595
** ** ** ** ** **
** ** ** ** ** **
42,448 44,536 41,974 41,232 38,790 38,872
** ** ** ** ** **

120
TOWN OF GREENWICH, CONNECTICUT
Capital Asset Statistics By Function/Program
Last Ten Fiscal Years
(Unaudited)
Function/Program 2003 2004 2005 2006
Police:
Stations 1 1 1 1
Fire, Fire Stations 7 7 7 7
Public Works:
Streets (Miles) 265 265 265 265
Traffic Signals 62 62 62 62
Parks & Recreation:
Parks 20 20 20 20
Golf Course 1 1 1 1
Skating Rinks 1 1 1 1
Tennis Courts 11 11 11 11
Beaches 4 4 4 4
Playgrounds 12 12 12 12
Community Centers 2 2 2 2
Library:
Facilities 4 4 4 4
Water:
Average Daily Consumption (MGPD) 857 ** ** **
Wastewater:
Sanitary Sewers (miles) 138 140 140 185
Storm Sewers (miles) ** ** ** **
Combination Sanitary and Storm (miles) N/A N/A N/A N/A
Source: Town Records
N/A Greenwich does not have combined sanitary & storm sewers
Note: ** Indicator not available
Fiscal Year

121
TABLE 17
2007 2008 2009 2010 2011 2012
1 1 1 1 1 1
7 7 7 7 7 7
265 265 265 265 265 265
62 62 63 64 64 64
20 20 20 20 20 20
1 1 1 1 1 1
1 1 1 1 1 1
11 11 11 11 11 11
4 4 4 4 4 4
12 12 12 12 12 12
2 2 2 2 2 2
4 4 4 4 4 4
** ** ** ** ** **
185 185 185 185 185 185
** ** ** ** ** **
N/A N/A N/A N/A N/A N/A
Fiscal Year

122
This page intentionally left blank.

TOWN OF GREENWICH, CONNECTICUT FEDERAL AND STATE FINANCIAL AND COMPLIANCE REPORT Fiscal Year Ended June 30, 2012

TOWN OF GREENWICH, CONNECTICUT FEDERAL AND STATE FINANCIAL AND COMPLIANCE REPORTS TABLE OF CONTENTS Page REPORT REQUIRED BY THE FEDERAL SINGLE AUDIT ACT AND
OMB CIRCULAR A-133 Report on Compliance with Requirements that Could Have a Direct and Material Effect
on Each Major Program, on Internal Control Over Compliance in Accordance with OMB Circular A-133 and on the Schedule of Expenditures of Federal Awards ............................ 1-2
Schedule of Expenditures of Federal Awards ......................................................................... 3-5 Note to Schedule of Expenditures of Federal Awards ............................................................ 6 Schedule of Findings and Questioned Costs .......................................................................... 7 Summary of Prior Year Audit Findings .................................................................................... 8
REPORT REQUIRED BY GOVERNMENT AUDITING STANDARDS
Report on Internal Control Over Financial Reporting and on Compliance and Other Matters Based on an Audit of the Financial Statements Performed in Accordance with “Government Auditing Standards” ........................................................................................ 9-10
REPORT REQUIRED BY THE CONNECTICUT STATE SINGLE AUDIT ACT
Report on Compliance with Requirements That Could have a Direct and Material Effect on Each Major Program, on Internal Control over Compliance in Accordance with the State Single Audit Act and on the Schedule of Expenditures of State Financial Assistance ............................................................................................................................. 11-12
Schedule of Expenditures of State Financial Assistance ........................................................ 13-14 Notes to Schedule of Expenditures on State Financial Assistance ........................................ 15 Schedule of State Single Audit Compliance Findings and Questioned Costs ........................ 16-17
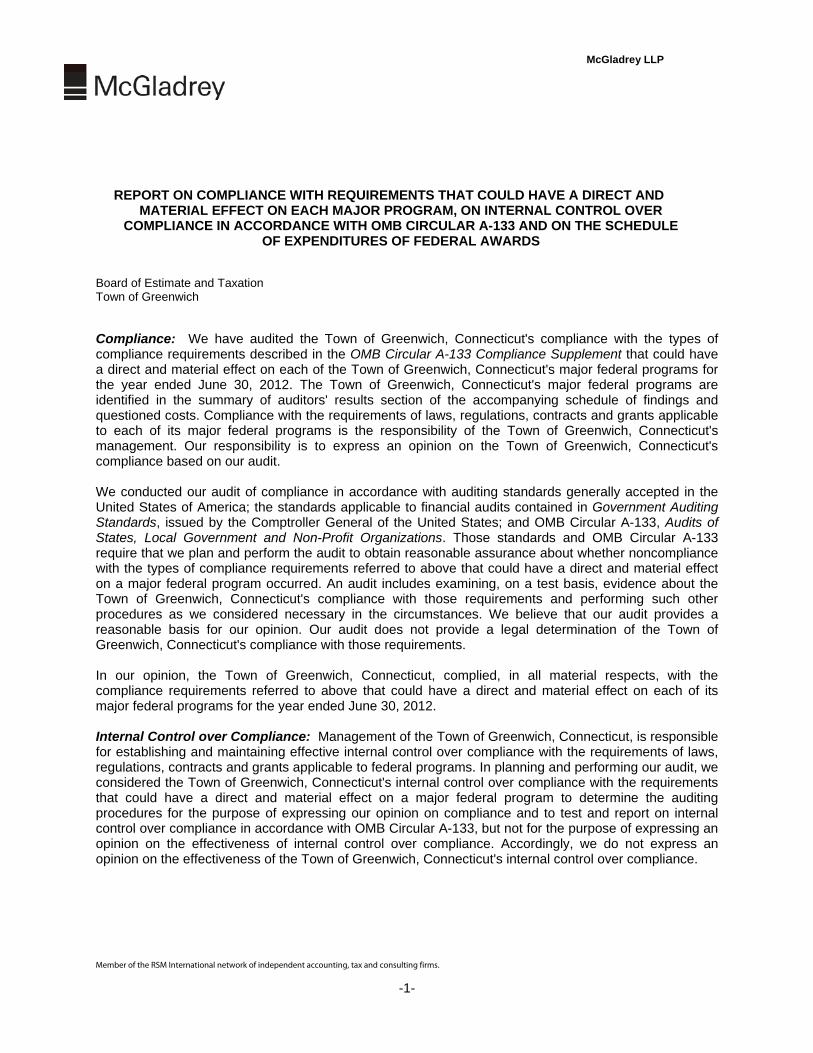
McGladrey LLP
Member of the RSM International network of independent accounting, tax and consulting firms.
-1-
REPORT ON COMPLIANCE WITH REQUIREMENTS THAT COULD HAVE A DIRECT AND MATERIAL EFFECT ON EACH MAJOR PROGRAM, ON INTERNAL CONTROL OVER
COMPLIANCE IN ACCORDANCE WITH OMB CIRCULAR A-133 AND ON THE SCHEDULE OF EXPENDITURES OF FEDERAL AWARDS
Board of Estimate and Taxation Town of Greenwich Compliance: We have audited the Town of Greenwich, Connecticut's compliance with the types of compliance requirements described in the OMB Circular A-133 Compliance Supplement that could have a direct and material effect on each of the Town of Greenwich, Connecticut's major federal programs for the year ended June 30, 2012. The Town of Greenwich, Connecticut's major federal programs are identified in the summary of auditors' results section of the accompanying schedule of findings and questioned costs. Compliance with the requirements of laws, regulations, contracts and grants applicable to each of its major federal programs is the responsibility of the Town of Greenwich, Connecticut's management. Our responsibility is to express an opinion on the Town of Greenwich, Connecticut's compliance based on our audit. We conducted our audit of compliance in accordance with auditing standards generally accepted in the United States of America; the standards applicable to financial audits contained in Government Auditing Standards, issued by the Comptroller General of the United States; and OMB Circular A-133, Audits of States, Local Government and Non-Profit Organizations. Those standards and OMB Circular A-133 require that we plan and perform the audit to obtain reasonable assurance about whether noncompliance with the types of compliance requirements referred to above that could have a direct and material effect on a major federal program occurred. An audit includes examining, on a test basis, evidence about the Town of Greenwich, Connecticut's compliance with those requirements and performing such other procedures as we considered necessary in the circumstances. We believe that our audit provides a reasonable basis for our opinion. Our audit does not provide a legal determination of the Town of Greenwich, Connecticut's compliance with those requirements. In our opinion, the Town of Greenwich, Connecticut, complied, in all material respects, with the compliance requirements referred to above that could have a direct and material effect on each of its major federal programs for the year ended June 30, 2012. Internal Control over Compliance: Management of the Town of Greenwich, Connecticut, is responsible for establishing and maintaining effective internal control over compliance with the requirements of laws, regulations, contracts and grants applicable to federal programs. In planning and performing our audit, we considered the Town of Greenwich, Connecticut's internal control over compliance with the requirements that could have a direct and material effect on a major federal program to determine the auditing procedures for the purpose of expressing our opinion on compliance and to test and report on internal control over compliance in accordance with OMB Circular A-133, but not for the purpose of expressing an opinion on the effectiveness of internal control over compliance. Accordingly, we do not express an opinion on the effectiveness of the Town of Greenwich, Connecticut's internal control over compliance.

-2-
A deficiency in internal control over compliance exists when the design or operation of a control over compliance does not allow management or employees, in the normal course of performing their assigned functions, to prevent, or detect and correct, noncompliance with a type of compliance requirement of a federal program on a timely basis. A material weakness in internal control over compliance is a deficiency, or combination of deficiencies, in internal control over compliance such that there is a reasonable possibility that material noncompliance with a type of compliance requirement of a federal program will not be prevented, or detected and corrected, on a timely basis. Our consideration of the internal control over compliance was for the limited purpose described in the first paragraph of this section and was not designed to identify all deficiencies in internal control over compliance that might be deficiencies, significant deficiencies or material weaknesses. We did not identify any deficiencies in internal control over compliance that we consider to be material weaknesses, as defined above. Schedule of Expenditures of Federal Awards: We have audited the financial statements of the governmental activities, the business-type activities, each major fund, and the aggregate remaining fund information of the Town of Greenwich, Connecticut as of and for the year ended June 30, 2012, and have issued our report thereon dated _________, 2012, which contained an unqualified opinion on those financial statements. Our audit was conducted for the purpose of forming our opinions on the financial statements that collectively comprise the Town of Greenwich, Connecticut’s financial statements. The accompanying schedule of expenditures of federal awards is presented for purposes of additional analysis as required by OMB Circular A-133 and is not a required part of the financial statements. Such information is the responsibility of management and was derived from and relates directly to the underlying accounting and other records used to prepare the financial statements. The information has been subjected to the auditing procedures applied in the audit of the financial statements and certain additional procedures, including comparing and reconciling such information directly to the underlying accounting and other records used to prepare the financial statements or to the financial statements themselves, and other additional procedures in accordance with auditing standards generally accepted in the United States of America. In our opinion, the schedule of expenditure of federal awards is fairly stated in all material respects in relation to the financial statements as a whole. This report is intended solely for the information and use of management, the Board of Estimate and Taxation, the Board of Selectmen, others within the Town, federal awarding agencies and pass-through entities and is not intended to be and should not be used by anyone other than these specified parties. New Haven, Connecticut _______________, 2012

-3-
TOWN OF GREENWICH, CONNECTICUT
SCHEDULE OF EXPENDITURES OF FEDERAL AWARDSFor the Year Ended June 30, 2012
Catalog ofFederal
Domestic Pass-ThroughFederal Grantor Pass-Through Assistance Entity Identifying FederalGrantor Program or Cluster Title Number Number Expenditures
U.S. Department of Agriculture/Passed through the State of ConnecticutDepartment of Education
Child Nutrition Cluster:School Breakfast 10.553 12060-SDE64370-20508 50,480 $ National School Lunch Program 10.555 12060-SDE64370-20560 505,693
Total Child Nutrition Cluster 556,173
Total U.S. Department of Agriculture 556,173
U.S. Department of Education/Passed through the State of ConnecticutDepartment of Education
Title I Cluster:Title I - Grants 84.010A 12060-SDE64370-20679 483,620
Total Title I Cluster 483,620
Special Education Cluster:Special Education - Grants to States 84.027A 12060-SDE64370-20977 2,163,914 Special Education - Grants to States (IDEA Part B), ARRA 84.391A 12060-SDE64370-29011 201,551 Handicapped Preschool Incentive Grant 84.173A 12060-SDE64370-20983 58,633 Handicapped Preschool Incentive Grant, ARRA 84.392A 12060-SDE64370-20983 1,194
Total Special Education Cluster 2,425,292
Immigrant and Youth Education Program 84.365A 12060-SDE64370-20868 134,847
Vocational Education - Carl Perkins 84.048A 12060-SDE64370-20742 55,687
Education Jobs Fund 84.410 12060-SDE64370-22405 96,131
Title III - Part A English Language Acquisition 84.365A 12060-SDE64370-20868 68,373
Title II - Part A - Improving Teacher Quality 84.367A 12060-SDE64370-20858 154,508
See Note to Schedule (Continued)N/A - Not Applicable

-4-
TOWN OF GREENWICH, CONNECTICUT
SCHEDULE OF EXPENDITURES OF FEDERAL AWARDS, ContinuedFor the Year Ended June 30, 2012
Catalog ofFederal
Domestic Pass-ThroughFederal Grantor Pass-Through Assistance Entity Identifying FederalGrantor Program or Cluster Title Number Number Expenditures
U.S. Department of Education/Passed through the State of ConnecticutDepartment of Education, Continued
State Fiscal Stabilization Fund Cluster:State Fiscal Stabilization Fund - Education State
Services, ARRA 84.394 12060-SDE64370-29054 4,945 State Fiscal Stabilization Fund - Government Services,
ARRA 84.397 12060-SDE64370-29053 2,563 Total State Fiscal Stabilization Fund Cluster 7,508
Total U.S. Department of Education 3,425,966
U.S. Department of Housing and Urban Development/Passed through State Department of Economic and Community Development
CDBG-State-Administered Small CitiesProgram Cluster:
Community Development Block Grant 14.218 12060-ECD46350-29044 1,377,098 Total CDBG-State-Administered SmallCities Program Cluster 1,377,098
U.S. Department of Public Health/Passed through the State Department of Public Health
Public Health Emergency Response 93.069 12060-DPH48557-22333 54,927 Preventative Health Services Block Grant 93.991 12060-DPH48558-21530 8,267
Total U.S. Department of Public Health 63,194
U.S. Department of JusticeBulletproof Vest Partnership Grant 16.607 6,180
Total U.S. Department of Justice 6,180
See Note to Schedule (Continued)N/A - Not Applicable

-5-
TOWN OF GREENWICH, CONNECTICUT
SCHEDULE OF EXPENDITURES OF FEDERAL AWARDS, ContinuedFor the Year Ended June 30, 2012
Catalog ofFederal
Domestic Pass-ThroughFederal Grantor Pass-Through Assistance Entity Identifying FederalGrantor Program or Cluster Title Number Number Expenditures
U.S. Department of Transportation/Passed through State Department of Transportation
Highway Planning and Construction Cluster:Highway Planning and Construction 20.205 12062-DOT57931-22108 1,160,484
Total Highway Planning and ConstructionCluster 1,160,484
Highway Safety Cluster:Federal Highway Safety Grants 20.600 12062-DOT57513-20559 889 Alcohol Traffic Safety Grants 20.601 12062-DOT57343-22091 26,405
Total Highway Safety Cluster 27,294
Total U.S. Department of Transportation 1,187,778
U.S. Department of Homeland Security/Passed through State Department of Emergency Management and Homeland Security
FEMA-Public Assistance Grants 97.036 12060-EHS99660-21891 832,897 Total U.S. Department of Homeland Security 832,897
Total expenditures of federal awards 7,449,286 $
See Note to ScheduleN/A - Not Applicable

TOWN OF GREENWICH, CONNECTICUT NOTE TO SCHEDULE OF EXPENDITURES OF FEDERAL AWARDS For the Year Ended June 30, 2012
-6-
Various agencies of the Federal Government have made financial assistance available to the Town of Greenwich, Connecticut. These grants fund several programs including housing, education, human services, transportation and general government activities. Note 1. Basis of Presentation The accounting policies of the Town of Greenwich, Connecticut conform to accounting principles generally accepted in the United States of America as applicable to government entities. The following is a summary of the more significant policies relating to the aforementioned grants. The accompanying schedule of expenditures of federal awards includes the federal grant activity of the Town of Greenwich and is presented on the modified accrual basis of accounting. The information in this schedule is presented in accordance with the requirements of OMB Circular A-133, “Audits of States, Local Governments, and Non-Profit Organizations.” Therefore, some amounts presented in this schedule may differ from amounts presented in, or used in the preparation of, the basic financial statements.
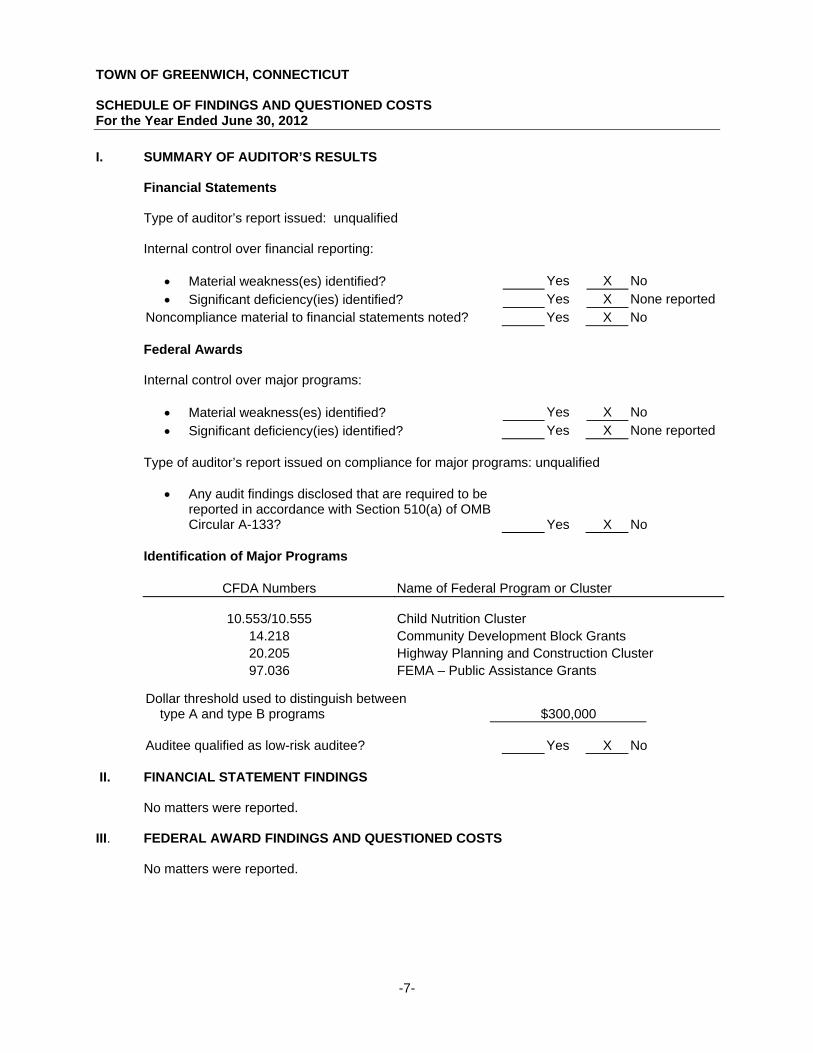
TOWN OF GREENWICH, CONNECTICUT SCHEDULE OF FINDINGS AND QUESTIONED COSTS For the Year Ended June 30, 2012
-7-
I. SUMMARY OF AUDITOR’S RESULTS Financial Statements Type of auditor’s report issued: unqualified Internal control over financial reporting: Material weakness(es) identified? Yes X No Significant deficiency(ies) identified? Yes X None reported Noncompliance material to financial statements noted? Yes X No Federal Awards Internal control over major programs: Material weakness(es) identified? Yes X No Significant deficiency(ies) identified? Yes X None reported Type of auditor’s report issued on compliance for major programs: unqualified
Any audit findings disclosed that are required to be reported in accordance with Section 510(a) of OMB Circular A-133? Yes X No
Identification of Major Programs CFDA Numbers Name of Federal Program or Cluster 10.553/10.555 Child Nutrition Cluster 14.218 Community Development Block Grants 20.205 Highway Planning and Construction Cluster 97.036 FEMA – Public Assistance Grants
Dollar threshold used to distinguish between
type A and type B programs $300,000 Auditee qualified as low-risk auditee? Yes X No II. FINANCIAL STATEMENT FINDINGS No matters were reported. III. FEDERAL AWARD FINDINGS AND QUESTIONED COSTS
No matters were reported.

-8-
TOWN OF GREENWICH, CONNECTICUT SUMMARY OF PRIOR YEAR AUDIT FINDINGS
For the Year Ended June 30, 2012 Finding ICII-1. – Financial Statement Finding Accounts Receivable – Grant Accounting Condition:
The Town did not record all necessary revenue and receivable entries in prior years, resulting in incorrect revenue recognition. Current Status:
The corrective action plan was implemented and the finding has been corrected. Finding FCF 11-2- Federal Award Findings and Questioned Costs Procurement and Suspension and Debarment Condition:
The only person involved in the procurement process is the Food Services Director.
Current Status:
The corrective action plan was implemented and the finding has been corrected. Finding FCF 11-3 – Federal Award Findings and Questioned Costs Reporting
Condition:
A Connecticut Department of Transportation 1589 report, which satisfies the ARRA Section of 1512 quarterly reporting requirement, was not submitted to the State of Connecticut Department of Transportation timely.
Current Status:
The corrective action plan was implemented and the finding has been corrected.

McGladrey LLP
Member of the RSM International network of independent accounting, tax and consulting firms.
-9-
REPORT ON INTERNAL CONTROL OVER FINANCIAL REPORTING AND ON COMPLIANCE AND OTHER MATTERS BASED ON AN AUDIT OF THE FINANCIAL STATEMENTS PERFORMED IN
ACCORDANCE WITH GOVERNMENT AUDITING STANDARDS To the Members of the Board of Estimate and Taxation Town of Greenwich, Connecticut We have audited the financial statements of the governmental activities, the business-type activities, each major fund, and the aggregate remaining fund information of the Town of Greenwich, Connecticut as of and for the year ended June 30, 2012, which collectively comprise the Town of Greenwich, Connecticut’s basic financial statements, and have issued our report thereon dated __________, 2012. We conducted our audit in accordance with auditing standards generally accepted in the United States of America and the standards applicable to financial audits contained in “Government Auditing Standards,” issued by the Comptroller General of the United States. Internal Control Over Financial Reporting: Management of the Town of Greenwich, Connecticut is responsible for establishing and maintaining effective internal control over financial reporting. In planning and performing our audit, we considered the Town of Greenwich, Connecticut's internal control over financial reporting as a basis for designing our auditing procedures for the purpose of expressing our opinion on the basic financial statements, but not for the purpose of expressing an opinion on the effectiveness of the Town of Greenwich, Connecticut's internal control over financial reporting. Accordingly, we do not express an opinion on the effectiveness of the Town of Greenwich, Connecticut's internal control over financial reporting. A deficiency in internal control exists when the design or operation of a control does not allow management or employees, in the normal course of performing their assigned functions, to prevent, or detect and correct misstatements on a timely basis. A material weakness is a deficiency, or combination of deficiencies, in internal control, such that there is a reasonable possibility that a material misstatement of the entity’s financial statements will not be prevented, or detected and corrected on a timely basis. Our consideration of internal control over financial reporting was for the limited purpose described in the first paragraph of this section and was not designed to identify all deficiencies in internal control over financial reporting that might be deficiencies, significant deficiencies or material weaknesses. We did not identify any deficiencies in internal control over financial reporting that we consider to be material weaknesses, as defined above. Compliance and Other Matters: As part of obtaining reasonable assurance about whether the Town of Greenwich, Connecticut's financial statements are free of material misstatement, we performed tests of its compliance with certain provisions of laws, regulations, contracts and grant agreements, noncompliance with which could have a direct and material effect on the determination of financial statement amounts. However, providing an opinion on compliance with those provisions was not an objective of our audit and, accordingly, we do not express such an opinion. The results of our tests disclosed no instances of noncompliance or other matters that are required to be reported under “Government Auditing Standards.”
-10-
We noted certain other matters that we reported to management of the Town of Greenwich, Connecticut in a separate letter dated December ___________, 2012. This report is intended solely for the information and use of the Board of Estimate and Taxation, the Board of Selectman, others within the Town, the management of the Town of Greenwich, Connecticut and federal and state awarding agencies and pass-through entities and is not intended to be and should not be used by anyone other than those specified parties. New Haven, Connecticut _______________, 2012

McGladrey LLP
Member of the RSM International network of independent accounting, tax and consulting firms.
-11-
REPORT ON COMPLIANCE WITH REQUIREMENTS THAT COULD HAVE A DIRECT AND MATERIAL EFFECT ON EACH MAJOR PROGRAM, ON INTERNAL CONTROL OVER
COMPLIANCE IN ACCORDANCE WITH THE STATE SINGLE AUDIT ACT AND ON THE SCHEDULE OF EXPENDITURES OF STATE FINANCIAL ASSISTANCE
Board of Estimate and Taxation Town of Greenwich, Connecticut Compliance: We have audited the Town of Greenwich, Connecticut's compliance with the types of compliance requirements described in the Office of Policy and Management's Compliance Supplement that could have a direct and material effect on each of the Town of Greenwich, Connecticut's major state programs for the year ended June 30, 2012. The Town of Greenwich, Connecticut's major state programs are identified in the summary of auditors' results section of the accompanying schedule of findings and questioned costs. Compliance with the requirements of laws, regulations, contracts and grants applicable to each of its major state programs is the responsibility of the Town of Greenwich, Connecticut's management. Our responsibility is to express an opinion on the Town of Greenwich, Connecticut's compliance based on our audit. We conducted our audit of compliance in accordance with auditing standards generally accepted in the United States of America; the standards applicable to financial audits contained in Government Auditing Standards, issued by the Comptroller General of the United States; and the State Single Audit Act (C.G.S. Sections 4-230 to 4-236). Those standards and the State Single Audit Act require that we plan and perform the audit to obtain reasonable assurance about whether noncompliance with the types of compliance requirements referred to above that could have a direct and material effect on a major state program occurred. An audit includes examining, on a test basis, evidence about the Town of Greenwich, Connecticut's compliance with those requirements and performing such other procedures as we considered necessary in the circumstances. We believe that our audit provides a reasonable basis for our opinion. Our audit does not provide a legal determination of the Town of Greenwich, Connecticut's compliance with those requirements. In our opinion, the Town of Greenwich, Connecticut, complied, in all material respects, with the compliance requirements referred to above that could have a direct and material effect on each of its major state programs for the year ended June 30, 2012. Internal Control over Compliance: Management of the Town of Greenwich, Connecticut, is responsible for establishing and maintaining effective internal control over compliance with the requirements of laws, regulations, contracts and grants applicable to state programs. In planning and performing our audit, we considered the Town of Greenwich, Connecticut's internal control over compliance with the requirements that could have a direct and material effect on a major state program to determine the auditing procedures for the purpose of expressing our opinion on compliance and to test and report on internal control over compliance in accordance with the State Single Audit Act, but not for the purpose of expressing an opinion on the effectiveness of internal control over compliance. Accordingly, we do not express an opinion on the effectiveness of the Town of Greenwich, Connecticut's internal control over compliance.

-12-
A deficiency in internal control over compliance exists when the design or operation of a control over compliance does not allow management or employees, in the normal course of performing their assigned functions, to prevent, or detect and correct, noncompliance with a type of compliance requirement of a state program on a timely basis. A material weakness in internal control over compliance is a deficiency, or combination of deficiencies, in internal control over compliance such that there is a reasonable possibility that material noncompliance with a type of compliance requirement of a state program will not be prevented, or detected and corrected, on a timely basis. Our consideration of internal control over compliance was for the limited purpose described in the first paragraph of this section and was not designed to identify all deficiencies in internal control over compliance that might be deficiencies, significant deficiencies or material weaknesses. We did not identify any deficiencies in internal control over compliance that we consider to be material weaknesses, as defined above. Schedule of Expenditures of State Financial Assistance: We have audited the financial statements of the governmental activities, the business-type activities, each major fund, and the aggregate remaining fund information of the Town of Greenwich, Connecticut as of and for the year ended June 30, 2012, and have issued our report thereon dated __________, 2012, which contained an unqualified opinion on those financial statements. Our audit was conducted for the purpose of forming our opinions on the financial statements that collectively comprise the Town of Greenwich, Connecticut’s financial statements. The accompanying schedule of expenditures of state financial assistance is presented for purposes of additional analysis as required by the State Single Audit Act and is not a required part of the financial statements. Such information is the responsibility of management and was derived from and relates directly to the underlying accounting and other records used to prepare the financial statements. The information has been subjected to the auditing procedures applied in the audit of the financial statements and certain additional procedures, including comparing and reconciling such information directly to the underlying accounting and other records used to prepare the financial statements or to the financial statements themselves, and other additional procedures in accordance with auditing standards generally accepted in the United States of America. In our opinion, the schedule of expenditure of state financial assistance is fairly stated in all material respects in relation to the financial statements as a whole. This report is intended solely for the information and use of management, the Board of Estimate and Taxation, the Board of Selectmen, others within the Town, the Office of Policy and Management and state awarding agencies and is not intended to be and should not be used by anyone other than these specified parties. New Haven, Connecticut _______________, 2012

-13-
TOWN OF GREENWICH, CONNECTICUT
SCHEDULE OF EXPENDITURES OF STATE FINANCIAL ASSISTANCEFor the Year Ended June 30, 2012
State Grantor Pass-Through State Grant ProgramGrantor Program Title CORE-CT Number Expenditures
State Department of Education:School Readiness and Child Care in Severe Needs Schools 11000-SDE64000-12113 107,000 $ Competitive School Readiness 11000-SDE64000-17097 3,912 School Breakfast 11000-SDE64000-17046 13,013 Bilingual Education 11000-SDE64000-17042 15,282 Child Nutrition Program - School Lunch State Match 11000-SDE64000-16211 22,702 Adult Education 11000-SDE64000-17030 172,437 Nonpublic Health Services 11000-SDE64000-17034 7,870
342,216
Judicial Department:Motor Vehicle Fines 34001-JUD95162-40001 69,835
Connecticut State Library:Historic Documents Preservation 12060-CSL66094-35150 6,000
State Office of Policy and Management:Property Tax Relief for Elderly and Totally Disabled Homeowners 11000-OPM20600-17018 194,232 Property Tax Relief for Elderly Homeowners - Freeze Program 11000-OPM20600-17021 5,166 Property Tax Relief for Veterans 11000-OPM20600-17024 29,580 Local Capital Improvement Program 12050-OPM20600-40254 570,641 Reimburse Property Tax-Disabled Exemption 11000-OPM20600-17011 379 Payment in Lieu of Taxes (PILOT) on State Owned Property 11000-OPM15910-17004 25,140 Payment in Lieu of Taxes (PILOT) on Private Colleges
and General Hospitals 11000-OPM15910-17006 721,374 1,546,512
Board of Education and Services for the Blind:Sales & Serv Bus Entrpr Prg 12060-ESB65060-35149 83
Department of Public Safety:Telecommunications Fund/911 Enhancement 12060-DPS32741-35190 177,459
State Department of Transportation:Bus Operations 12001-DOT57000-12175 58,289 Town Aid Road Grant 12001-DOT57000-17036 92,167
150,456
State Department of Public Health:Per Capita Grant 11000-DPH48000-17009 62,897 Bioterrorsm Hosptl Prepardnss 12060-DPH48000-20760 8,000
70,897
See Notes to Schedule (Continued)

-14-
TOWN OF GREENWICH, CONNECTICUT
SCHEDULE OF EXPENDITURES OF STATE FINANCIAL ASSISTANCE, ContinuedFor the Year Ended June 30, 2012
State Grantor Pass-Through State Grant ProgramGrantor Program Title CORE-CT Number Expenditures
State Department of Energy and Environmental Protection:Nitrogen Credit Exchange 21016-OTT14230-42407 149,106 Remediation of Cos Cob Power Plant Site 12052-DEP43750-43145 1,094,409
1,243,515
Department of Public Safety:Drug Assets Forfeiture Funds 12060-DPS32155-35142 1,830
Department of Economic and Community Development:Payment In Lieu of Taxes (PILOT) 11000-ECD46400-17012 94,640 Endangered Property Grants 12060-ECD46840-90455 14,813 Emergency System for Advance Registration of Volunteer Health
Professionals 12060-DPH48557-22372 7,000 116,453
Total State Financial Assistance BeforeExempt Programs 3,725,256
EXEMPT PROGRAMSDepartment of Education:
Education Cost Sharing 11000-SDE64000-17041 3,462,976 Transportation of School Children 11000-SDE64000-17027 321 Excess Cost - Student Based 11000-SDE64000-17047 1,276,740
4,740,037
Office of Policy and Management:Mashantucket Pequot/Mohegan Fund 12009-OPM20600-17005 85,809 Municipal Video Competition 12060-OPM20600-35362 163,702 Municipal Revenue Sharing 12060-OPM20600-35458 52,922
302,433
Total Exempt Programs 5,042,470
Total State Financial Assistance 8,767,726 $
See Notes to Schedule

TOWN OF GREENWICH, CONNECTICUT NOTES TO SCHEDULE OF EXPENDITURES OF STATE FINANCIAL ASSISTANCE For the Year Ended June 30, 2012
-15-
The accompanying schedule of expenditures of state financial assistance includes state grant activity of the Town of Greenwich, Connecticut under programs of the State of Connecticut for the fiscal year ended June 30, 2012. Various departments and agencies of the State of Connecticut have provided financial assistance through grants and other authorizations in accordance with the General Statutes of the State of Connecticut. These financial assistance programs fund several programs including education, public safety, road construction, school construction, community development and general government. Note 1. Summary of Significant Accounting Policies The accounting policies of the Town of Greenwich, Connecticut conform to accounting principles generally accepted in the United States of America as applicable to governments. The information in the Schedule of Expenditures of State Financial Assistance is presented based upon regulations established by the State of Connecticut, Office of Policy and Management. Basis of Accounting The expenditures reported on the Schedule of State Financial Assistance are reported on the modified accrual basis of accounting. In accordance with Section 4-236-22 of the Regulations to the State Single Audit Act, certain grants are not dependent on expenditure activity, and accordingly, are considered to be expended in the fiscal year of receipt. These grant program receipts are reflected in the expenditures column of the Schedule of Expenditures of State Financial Assistance. Note 2. Loan Programs In accordance with Section 4-236-23(a)(4)(F) of the Regulations to the State Single Audit Act, the notes to the schedule of expenditures of state financial assistance shall include loans and loan activities. The following is a summary of the various loan program activity for the year ended June 30, 2012: Department of Environmental Protection
Clean Water Funds 6865 3100 888:
Issue Interest Original Balance Balance Date Rate Amount Beginning Issued Retired Ending
115CD1 5/31/1995 2% 8,423,535 $ 958,093 $ -$ (517,284) $ 440,809 $ 115CD1 7/30/1993 2% 27,063,832 2,796,838 - (1,586,207) 1,210,631 430C 10/31/2000 2% 708,676 326,903 - (36,415) 290,488 364C 12/31/2004 2% 8,671,620 5,912,386 - (385,370) 5,527,016
9,994,220 $ -$ (2,525,276) $ 7,468,944 $
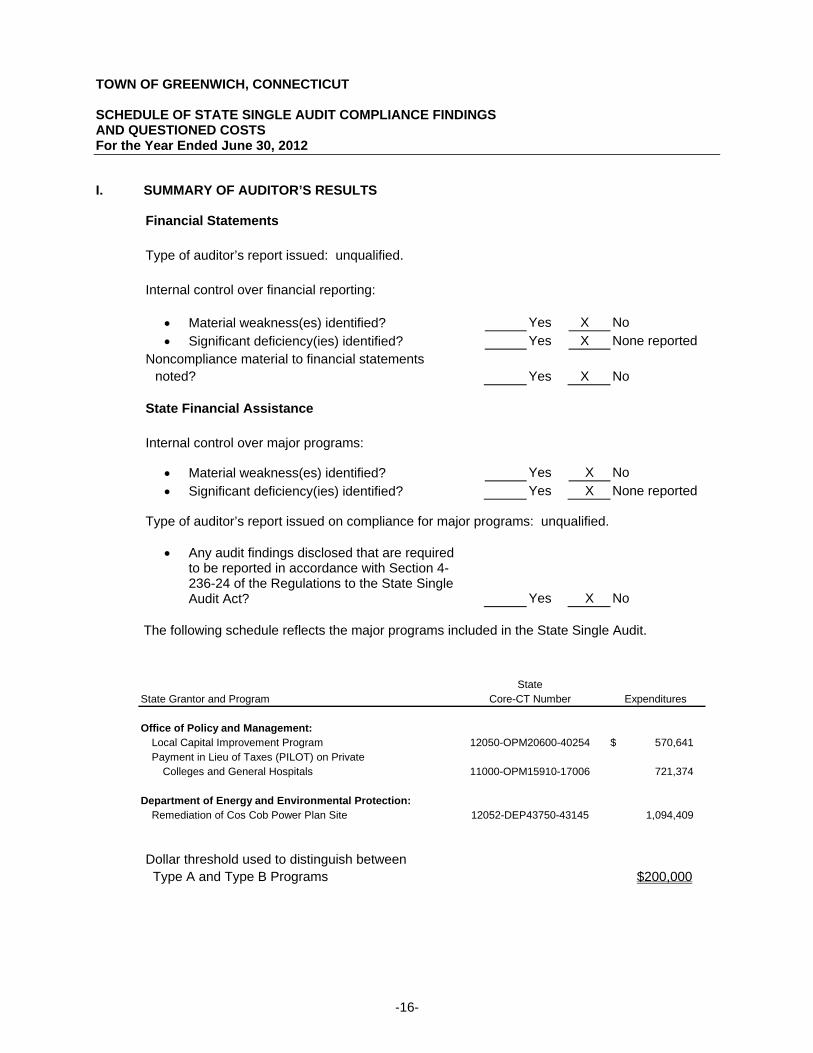
TOWN OF GREENWICH, CONNECTICUT SCHEDULE OF STATE SINGLE AUDIT COMPLIANCE FINDINGS AND QUESTIONED COSTS For the Year Ended June 30, 2012
-16-
I. SUMMARY OF AUDITOR’S RESULTS Financial Statements Type of auditor’s report issued: unqualified. Internal control over financial reporting: Material weakness(es) identified? Yes X No Significant deficiency(ies) identified? Yes X None reported
Noncompliance material to financial statements
noted? Yes X No State Financial Assistance Internal control over major programs: Material weakness(es) identified? Yes X No Significant deficiency(ies) identified? Yes X None reported Type of auditor’s report issued on compliance for major programs: unqualified.
Any audit findings disclosed that are required to be reported in accordance with Section 4-236-24 of the Regulations to the State Single Audit Act? Yes X No
The following schedule reflects the major programs included in the State Single Audit.
StateState Grantor and Program Core-CT Number Expenditures
Office of Policy and Management:Local Capital Improvement Program 12050-OPM20600-40254 570,641 $ Payment in Lieu of Taxes (PILOT) on Private
Colleges and General Hospitals 11000-OPM15910-17006 721,374
Department of Energy and Environmental Protection:Remediation of Cos Cob Power Plan Site 12052-DEP43750-43145 1,094,409
Dollar threshold used to distinguish between Type A and Type B Programs $200,000
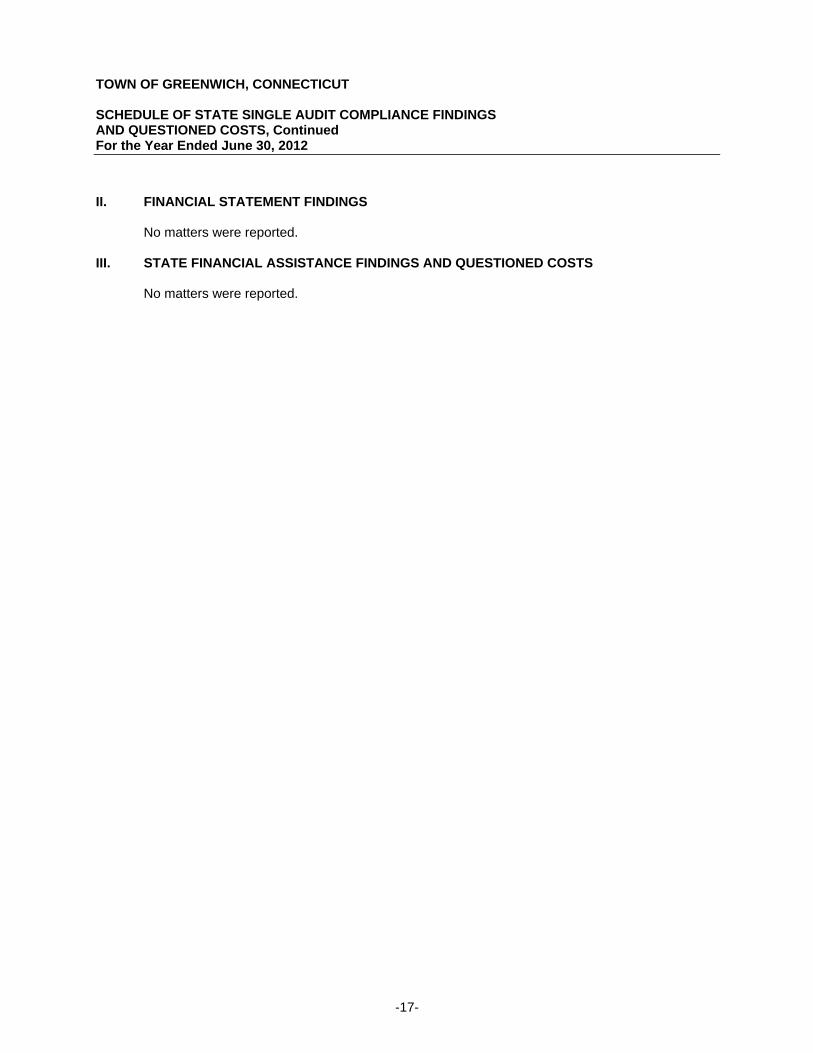
TOWN OF GREENWICH, CONNECTICUT SCHEDULE OF STATE SINGLE AUDIT COMPLIANCE FINDINGS AND QUESTIONED COSTS, Continued For the Year Ended June 30, 2012
-17-
II. FINANCIAL STATEMENT FINDINGS
No matters were reported.
III. STATE FINANCIAL ASSISTANCE FINDINGS AND QUESTIONED COSTS No matters were reported.

Page 2
To the Board of Estimate and Taxation Town of Greenwich, Connecticut In connection with our audit of the basic financial statements of the Town of Greenwich, Connecticut, as of and for the year ended June 30, 2012, we identified deficiencies in internal control over financial reporting (control deficiencies). A control deficiency exists when the design or operation of a control does not allow management or employees, in the normal course of performing their assigned functions, to prevent, or detect and correct misstatements on a timely basis. A deficiency in design exists when a control necessary to meet the control objective is missing, or when an existing control is not properly designed so that even if the control operates as designed, the control objective would not be met. A deficiency in operation exists when a properly designed control does not operate as designed, or when the person performing the control does not possess the necessary authority or qualifications to perform the control effectively.
A material weakness is a deficiency, or a combination of deficiencies, in internal control, such that there is
a reasonable possibility that a material misstatement of the financial statements will not be prevented, or
detected and corrected on a timely basis.
A significant deficiency is a deficiency, or a combination of deficiencies, in internal control that is less severe than a material weakness, yet important enough to merit attention by those charged with governance. The Town’s written response to the control deficiencies identified in our audit has not been subjected to the auditing procedures applied in the audit of the financial statements and, accordingly, we express no opinion on it. The following is a description of identified control deficiencies that we determined did not constitute significant deficiencies or material weaknesses:
1. PENSION BENEFIT PAYMENTS
Observation:
During our testing of pension benefit payments, we noted several instances where pensioner files did not have the most recent information regarding cost of living adjustments (COLA’s). Recommendation:
We recommend pensioner files be updated with the most recent payment documentation. This will help ensure retirees are being paid the correct amount. Managements Response: The Town has been providing a contractual COLA increase since 2005 and every time a retiree has an annual change to their retirement payment, a letter is sent to the Retiree and put into the file. In addition, the Town maintains a spreadsheet of all changes by retiree by year. The last AD-HOC Cola increase was in 2005 with different increases depending on the length of retirement. The Town has a file of all retirement amounts prior to the increase and a file of all payments after the increase. Although there was never documentation put into individual retirement folders, the Town does maintain complete documentation. Lastly, there are some retirees who receive an increase in the retirement when they turn 65 years of age. This was a result of the 1995 Ad-Hoc Cola increases. Notices were not provided in the past to these retirees but going forward they will be put into individual folders.

Page 3
This covers the last 12 years. We have similar documentation from 2000 and less information back to 1995 and before that no information.
2. STUDENT ACTIVITIES
Observation:
During our testing of student activities, there were several instances where proper approval was
not documented on the “Deposit/Disbursement Voucher Sheet.”
Recommendation:
We recommend that all necessary approvals be documented on the “Deposit/Disbursement
Voucher Sheet” in order to ensure all transactions are properly approved.
Management’s Response:
This comment was uncovered and reported on by the Town of Greenwich Internal Audit Staff to
the BET Audit Committee. The comment and Board of Education response, from the Internal
Audit Report, is listed below:
7 - The Student Activity Disbursement Voucher, required by BOE’s Standard Operating Procedure (SOP) to initiate all expenditures, did not always contain an authorizing signature. During the Internal Audit, test results of Greenwich High School’s disbursements disclosed that 14 out of 108 disbursement vouchers did not contain a signature as required by BOE’s Standard Operating Procedure. This signature serves as an approval to initiate the transactions and functions similar to a purchase order. This internal control weakness is offset by the fact that two employees must sign the check, however, this control is an after the fact control that approves a transaction that has already occurred. To comply with the SOP and strong internal control practices, we recommend compliance with this requirement. Response from the BOE The BOE agrees with the recommendation from the Internal Audit Report. The BOE will immediately implement the recommendation.
3. CAPITAL ASSETS*
Observation:
We noted that there is no formal review of capital asset listings performed by each department to
determine that all assets exist or that records are complete. Furthermore, the last physical
inventory of all Town assets was performed in January 2002 by an independent appraisal
company. This information was not uploaded into the MUNIS system. Therefore, all fixed assets
records exist outside of the financial reporting system and are manually updated for additions,
disposals and depreciation.
Recommendation:
The Town should consider establishing procedures for the formal review of fixed assets by
department at least on an annual basis. The Town should also consider exploring the option
available to them to incorporate its fixed assets records into the financial reporting system to
enhance controls over recordkeeping.
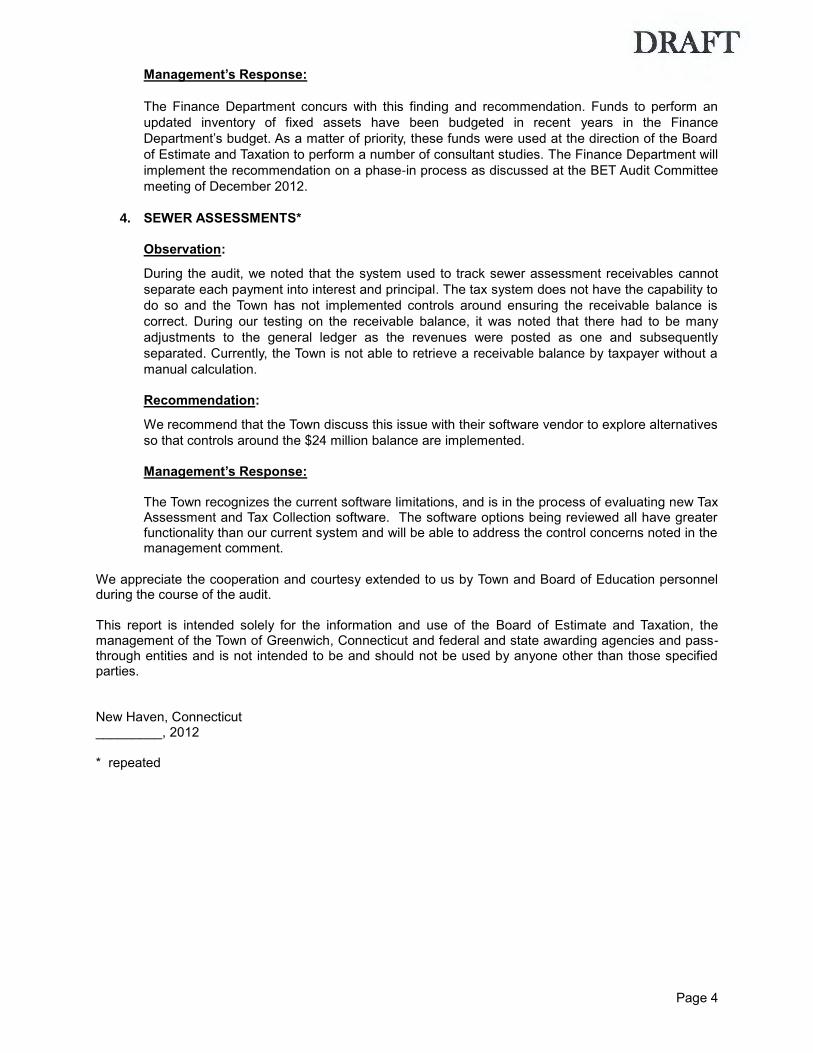
Page 4
Management’s Response:
The Finance Department concurs with this finding and recommendation. Funds to perform an
updated inventory of fixed assets have been budgeted in recent years in the Finance
Department’s budget. As a matter of priority, these funds were used at the direction of the Board
of Estimate and Taxation to perform a number of consultant studies. The Finance Department will
implement the recommendation on a phase-in process as discussed at the BET Audit Committee
meeting of December 2012.
4. SEWER ASSESSMENTS*
Observation:
During the audit, we noted that the system used to track sewer assessment receivables cannot
separate each payment into interest and principal. The tax system does not have the capability to
do so and the Town has not implemented controls around ensuring the receivable balance is
correct. During our testing on the receivable balance, it was noted that there had to be many
adjustments to the general ledger as the revenues were posted as one and subsequently
separated. Currently, the Town is not able to retrieve a receivable balance by taxpayer without a
manual calculation.
Recommendation:
We recommend that the Town discuss this issue with their software vendor to explore alternatives
so that controls around the $24 million balance are implemented.
Management’s Response: The Town recognizes the current software limitations, and is in the process of evaluating new Tax Assessment and Tax Collection software. The software options being reviewed all have greater functionality than our current system and will be able to address the control concerns noted in the management comment.
We appreciate the cooperation and courtesy extended to us by Town and Board of Education personnel during the course of the audit. This report is intended solely for the information and use of the Board of Estimate and Taxation, the management of the Town of Greenwich, Connecticut and federal and state awarding agencies and pass-through entities and is not intended to be and should not be used by anyone other than those specified parties. New Haven, Connecticut _________, 2012 * repeated

MINUTES of the regular meeting of the Board of Estimate and Taxation held on Monday, November 19, 2012 in the Cone Meeting Room, Greenwich, CT. Chairman Michael Mason called the meeting to order at 6:31 P.M., after which the members pledged allegiance to the flag. Board members in attendance:
Michael S. Mason, Chairman Arthur D. Norton, Vice Chairman
Mary Lee A. Kiernan, Clerk Gregory Bedrosian
Robert Brady William R. Finger
Sean Goldrick Randall Huffman Marc V. Johnson
Joseph L. Pellegrino Jeffrey S. Ramer
Leslie L. Tarkington
Selectmen: Peter Tesei, First Selectman; David Theis; Drew Marzullo Staff: Peter Mynarski, Comptroller; Roland Gieger, Budget Director; Lauren Elliott, Assessor;
Robert Shipman, Assistant Assessor; Allen Brown, Executive Director, Nathaniel Witherell; Ray Augustine, Director of Financial Operations, Nathaniel Witherell; Mary Pepe, Director of Human Resources, TOG; Robert Lichtenfeld, Director of Human Resources, BOE; John Crary, Town Administrator
Other: David Ormsby, Lloyd Bankson, Nathaniel Witherell Board; Andy Fox, Nathaniel Witherell Building Committee; Leslie Moriarty, Barbara O’Neill, Jennifer Dayton, BOE.
ROUTINE APPLICATIONS HD-6 Health – Approval to Use $72,120.42 Approval to Use: $15,000.00 to F403-51300 Part-time Payroll $11,000.00 to F403-51420 Prof. Services Medical $ 5,000.00 to F403-52010 Advertising $ 4,000.00 to F403-52240 Telephone, Telegraph $10,672.92 to F403-53010 Office Supplies $12,300.00 to F403-53250 Med., Surg., Lab. Supplies $ 2,000.00 to F403-54150 Maintenance Furn., Fixtures, Office Equip. $11,000.00 to F403-54200 Maintenance Mach., Tools, Instruments

Minutes of the Regular Meeting of the Board of Estimate and Taxation November 19, 2012 – Subject to Approval Page 2 of 8
$ 1,147.50 to F403-57050 Benefits $72,120.42 from Public Act Grant FY2013 PUR-1 Purchasing – Release of Conditions $15,000 Release of Conditions: $ 15,000 to General 106-925 Circuit Packs PD-2 Police – Approval to Use $56,025 Approval to Use: $ 55,213 to F217-51100 Overtime Services $ 812 to F217-57050 Benefits $ 56,025 from Federal Highway Safety Program Grant – DUI Enforcement Program
Upon a motion by Ms. Kiernan, seconded by Mr. Pellegrino, the Board voted 12-0-0 to approve the applications.
NON-ROUTINE APPLICATIONS PR-2 Parks & Recreation – Additional Appropriation $82,390 Additional Appropriation: $ 82,390 to Z832-59620 Maintenance of Roads & Bridges $ 82,390 from Capital Non-Recurring
Upon a motion by Mr. Goldrick, seconded by Mr. Huffman, this item was moved to the non-routine portion of the Agenda.
Mr. Pellegrino gave an explanation for the request to replace two walking bridges at Binney Park. The vote of the Budget Committee on this item was 4-0. Mr. Goldrick expressed concerns regarding the cost of the project. Mr. Huffman expressed the need for additional information. A discussion followed regarding the scope of the project and the project information available to members.
Upon a motion by Mr. Pellegrino, seconded by Ms. Tarkington, the Board voted 10-2-0 (Mr. Goldrick and Mr. Huffman opposed) to approve the application.
NW-6 Nathaniel Witherell – Release of Conditions $155,000 Release of Conditions: $ 155,000 to B450-59560-12201 NW Renew-Sprinklers Mr. Pellegrino explained that this request is in compliance with State mandates regarding fire sprinklers, although funding is included in Project Renew. The Budget Committee voted 4-0 on this item.
Upon a motion by Mr. Pellegrino, seconded by Mr. Finger, the Board voted 12-0-0 to approve the application.
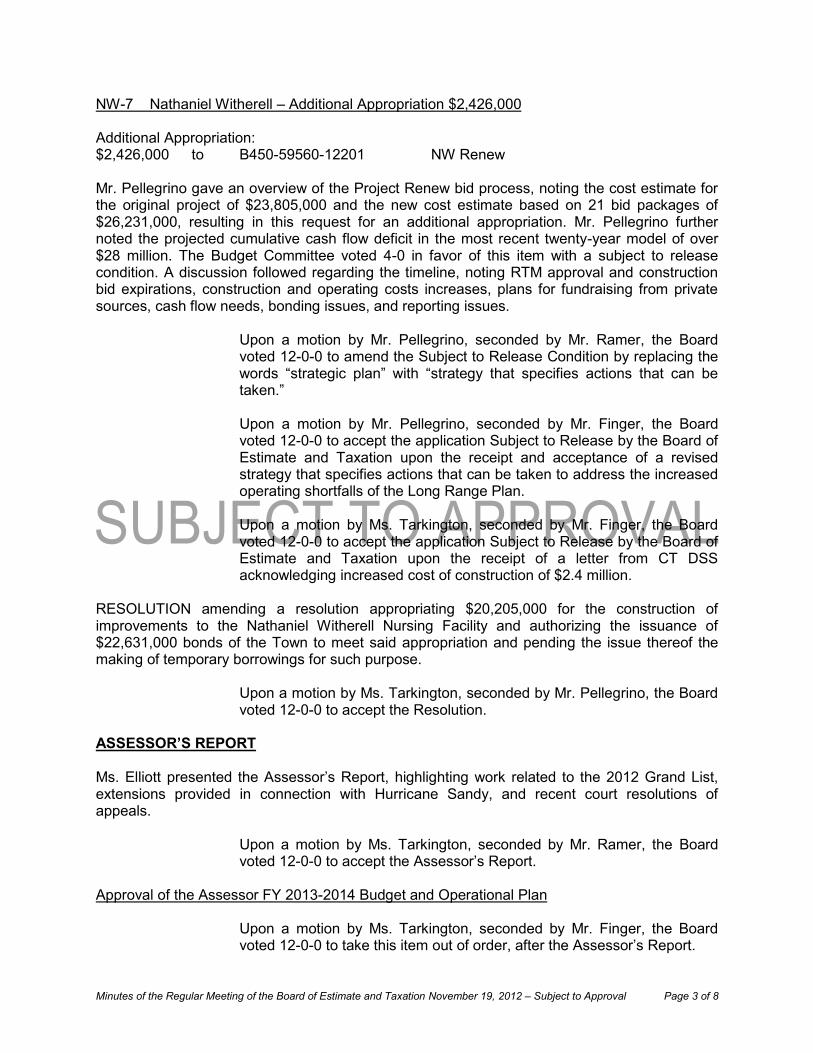
Minutes of the Regular Meeting of the Board of Estimate and Taxation November 19, 2012 – Subject to Approval Page 3 of 8
NW-7 Nathaniel Witherell – Additional Appropriation $2,426,000 Additional Appropriation: $2,426,000 to B450-59560-12201 NW Renew Mr. Pellegrino gave an overview of the Project Renew bid process, noting the cost estimate for the original project of $23,805,000 and the new cost estimate based on 21 bid packages of $26,231,000, resulting in this request for an additional appropriation. Mr. Pellegrino further noted the projected cumulative cash flow deficit in the most recent twenty-year model of over $28 million. The Budget Committee voted 4-0 in favor of this item with a subject to release condition. A discussion followed regarding the timeline, noting RTM approval and construction bid expirations, construction and operating costs increases, plans for fundraising from private sources, cash flow needs, bonding issues, and reporting issues.
Upon a motion by Mr. Pellegrino, seconded by Mr. Ramer, the Board voted 12-0-0 to amend the Subject to Release Condition by replacing the words “strategic plan” with “strategy that specifies actions that can be taken.” Upon a motion by Mr. Pellegrino, seconded by Mr. Finger, the Board voted 12-0-0 to accept the application Subject to Release by the Board of Estimate and Taxation upon the receipt and acceptance of a revised strategy that specifies actions that can be taken to address the increased operating shortfalls of the Long Range Plan. Upon a motion by Ms. Tarkington, seconded by Mr. Finger, the Board voted 12-0-0 to accept the application Subject to Release by the Board of Estimate and Taxation upon the receipt of a letter from CT DSS acknowledging increased cost of construction of $2.4 million.
RESOLUTION amending a resolution appropriating $20,205,000 for the construction of improvements to the Nathaniel Witherell Nursing Facility and authorizing the issuance of $22,631,000 bonds of the Town to meet said appropriation and pending the issue thereof the making of temporary borrowings for such purpose.
Upon a motion by Ms. Tarkington, seconded by Mr. Pellegrino, the Board voted 12-0-0 to accept the Resolution.
ASSESSOR’S REPORT Ms. Elliott presented the Assessor’s Report, highlighting work related to the 2012 Grand List, extensions provided in connection with Hurricane Sandy, and recent court resolutions of appeals.
Upon a motion by Ms. Tarkington, seconded by Mr. Ramer, the Board voted 12-0-0 to accept the Assessor’s Report.
Approval of the Assessor FY 2013-2014 Budget and Operational Plan
Upon a motion by Ms. Tarkington, seconded by Mr. Finger, the Board voted 12-0-0 to take this item out of order, after the Assessor’s Report.
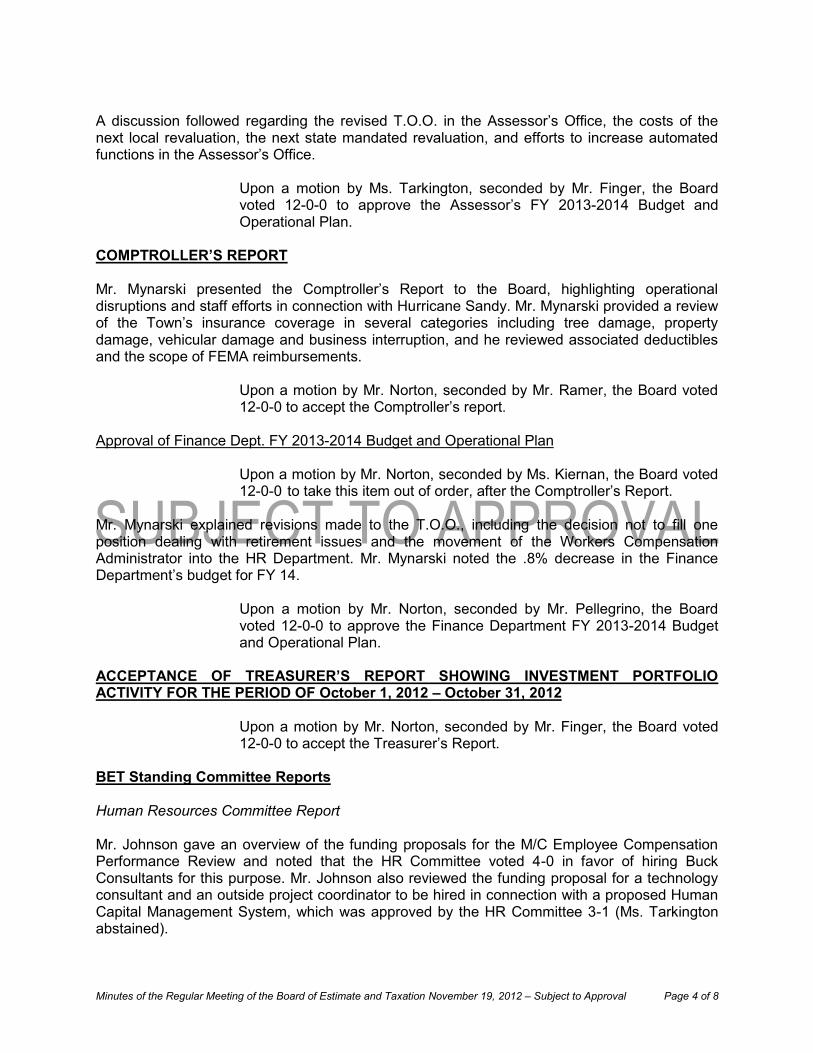
Minutes of the Regular Meeting of the Board of Estimate and Taxation November 19, 2012 – Subject to Approval Page 4 of 8
A discussion followed regarding the revised T.O.O. in the Assessor’s Office, the costs of the next local revaluation, the next state mandated revaluation, and efforts to increase automated functions in the Assessor’s Office.
Upon a motion by Ms. Tarkington, seconded by Mr. Finger, the Board voted 12-0-0 to approve the Assessor’s FY 2013-2014 Budget and Operational Plan.
COMPTROLLER’S REPORT Mr. Mynarski presented the Comptroller’s Report to the Board, highlighting operational disruptions and staff efforts in connection with Hurricane Sandy. Mr. Mynarski provided a review of the Town’s insurance coverage in several categories including tree damage, property damage, vehicular damage and business interruption, and he reviewed associated deductibles and the scope of FEMA reimbursements.
Upon a motion by Mr. Norton, seconded by Mr. Ramer, the Board voted 12-0-0 to accept the Comptroller’s report.
Approval of Finance Dept. FY 2013-2014 Budget and Operational Plan
Upon a motion by Mr. Norton, seconded by Ms. Kiernan, the Board voted 12-0-0 to take this item out of order, after the Comptroller’s Report.
Mr. Mynarski explained revisions made to the T.O.O., including the decision not to fill one position dealing with retirement issues and the movement of the Workers Compensation Administrator into the HR Department. Mr. Mynarski noted the .8% decrease in the Finance Department’s budget for FY 14.
Upon a motion by Mr. Norton, seconded by Mr. Pellegrino, the Board voted 12-0-0 to approve the Finance Department FY 2013-2014 Budget and Operational Plan.
ACCEPTANCE OF TREASURER’S REPORT SHOWING INVESTMENT PORTFOLIO ACTIVITY FOR THE PERIOD OF October 1, 2012 – October 31, 2012
Upon a motion by Mr. Norton, seconded by Mr. Finger, the Board voted 12-0-0 to accept the Treasurer’s Report.
BET Standing Committee Reports Human Resources Committee Report Mr. Johnson gave an overview of the funding proposals for the M/C Employee Compensation Performance Review and noted that the HR Committee voted 4-0 in favor of hiring Buck Consultants for this purpose. Mr. Johnson also reviewed the funding proposal for a technology consultant and an outside project coordinator to be hired in connection with a proposed Human Capital Management System, which was approved by the HR Committee 3-1 (Ms. Tarkington abstained).

Minutes of the Regular Meeting of the Board of Estimate and Taxation November 19, 2012 – Subject to Approval Page 5 of 8
Upon a motion by Mr. Ramer, seconded by Ms. Kiernan, the Board voted 11-0-1 (Mr. Pellegrino abstained) to accept the HR Committee report.
BET Liaison Reports There were no Liaison reports. BET Special Project Team Reports BET I.T. Upgrade Report Mr. Brady gave an update on the Town-wide IT study, highlighting the recent ranking of projects based on criticality. These projects included payroll, the Town website, Town IT support of operations, and how the Town upgrades systems and deals with associated incompatibilities. Mr. Brady also reviewed the process for interviewing consultants in connection with the proposed 800 MHz Radio System, and he updated the Board on the 311 CRM System RFP process. NEW BUSINESS There was no New Business. OLD BUSINESS Acceptance of the TOG/BOE HR Working Group Study Ms. Kiernan gave an overview of both the process used and the analysis and findings of the TOG/BOE HR Working Group Study. She reviewed the recommendations provided on fifteen functional areas and recommendations on cross-departmental topics, highlighting the payroll/HRIS and termination functions. Ms. Kiernan noted that the monitoring of efforts and outcomes in connection with this Study will reside with the BET’s HR Committee, and their first task will be to design appropriate accountability and performance measures. The HR Committee voted 4-0 to accept this Study. Mr. Pellegrino shared comments concerning delivering HR services, cost efficiencies, and revisions in technology leading to organizational and structure changes. Both Ms. Kiernan and Mr. Pellegrino acknowledged the efforts of the Working Group and professional staff, highlighting the work of Ms. Pepe and Dr. Lichtenfeld. A brief discussion followed regarding the predecessor Hay Study, the working relationship between the TOG and BOE Human Resources Departments, HR strategies, potential cost savings, and efficiencies resulting from the recommendations contained in the Study.
Upon a motion by Ms. Kiernan, seconded by Mr. Johnson, the Board voted 12-0-0 to accept the TOG/BOE HR Working Group Study.
Approval of FY 2013-2014 Budget Guidelines Mr. Pellegrino gave an overview of the Budget Committee’s Guidelines process, including meetings held, the collection of BET member comments, and subsequent revisions. Mr. Pellegrino stated that the motion before the Budget Committee to approve the Guidelines draft dated November 13, 2012 failed 2-2.

Minutes of the Regular Meeting of the Board of Estimate and Taxation November 19, 2012 – Subject to Approval Page 6 of 8
Mr. Pellegrino made a motion to approve the Guidelines draft dated November 13, 2012. Ms. Tarkington seconded this motion. Mr. Finger moved to amend Mr. Pellegrino’s motion for the purpose of substituting an alternate set of Guidelines dated November 15, 2012. Mr. Ramer seconded this motion. Mr. Mason stated that Mr. Finger’s motion to amend should be put to a vote before discussion on the motion could proceed. A discussion ensued about appropriate parliamentary procedure. Mr. Pellegrino asked Mr. Mason to obtain a ruling after the meeting on Mr. Ramer’s statement that discussion on the motion to amend should proceed after such motion is seconded, but before the vote on such motion.
Upon a motion by Mr. Finger, seconded by Mr. Ramer, the Board voted 12-0-0 to bring forward the Guidelines draft dated November 15, 2012 for discussion.
Mr. Finger stated that the BET’s Budget Guidelines should not be an inflexible budget directive, but rather a guideline for departments and appointing authorities to follow in preparing their budgets. Compared to the November 13th draft of guidelines, Mr. Finger believed the November 15th draft of Budget Guidelines presented a more balanced approach and better road map for the Town departments to follow. Mr. Finger also recommend that the BET's Debt Policy, scheduled to be reviewed in Spring 2013, be reviewed prior to the commencement of the BET's FY 14 budget reviews and deliberations. Mr. Ramer commented that the BET's governmental responsibility is to balance the needs of the community for municipal services against the tax burden placed on the citizens who must pay for them. For the past thirteen years, the declared objective in the Guidelines has always been the maintenance of services at a high and predictable level, while keeping taxes low, at a customary mill rate increase within two to four percent per year. The objection to the earlier draft of the Guidelines is that it purports to declare a decision as to a mill rate increase at 2.5%, without seeking any mechanism for properly understanding what services may have been needed, but were sacrificed to achieve the arbitrary 2.5% level, and the alternative Guidelines dated November 15, 2012 offer an opportunity to understand service levels at various mill rate increases, including the 2.5%. Mr. Huffman stated that he is very concerned about the increasing costs of out town government, and how we should address these cost factors, as indicated earlier in this meeting. In addition, Mr. Huffman has long recommended that the town pursue longer term financing for major capital projects, as is done by virtually every governmental unit, major non-profit organization and significant corporate organization. The use of longer term financing in our fiscal plans could decrease the necessary increase in next year's real property taxes, or could permit us to pursue more important capital investment needs currently, or both. Mr. Goldrick shared comments regarding long-term financing, cash reserves, maintenance costs, fund balance, CIP, and public input. Mr. Brady said that he concurred with his colleagues in support of the November 15, 2012 Guidelines. Ms. Kiernan concurred with the comments in support of the November 15, 2012 Guidelines, and added that this draft suggests a useful, data-driven approach to reducing costs, finding

Minutes of the Regular Meeting of the Board of Estimate and Taxation November 19, 2012 – Subject to Approval Page 7 of 8
efficiencies and maintaining quality municipal services and municipal assets. Ms. Kiernan suggested that the November 15, 2012 Guidelines add value to the budgeting process and are relevant to the Guidelines’ intended audience. She further stated that the November 15, 2012 Guidelines would not cut services to those living below $50,000 per year in income, and these Guidelines would support local property values by signaling to potential real estate investors that municipal services and quality education are priorities for this community.
Upon a motion by Mr. Finger, seconded by Mr. Ramer, the Board voted 6-6-0 to amend Mr. Pellegrino’s motion to approve the Guidelines draft of November 13, 2012 by substituting an alternate set of Guidelines dated November 15, 2012 (Mr. Mason, Mr. Bedrosian, Mr. Johnson, Mr. Pellegrino, Mr. Norton, Ms. Tarkington opposed). The motion to amend failed.
Mr. Pellegrino stated that there is a perception that benefits experienced by municipal employees have deviated from those experienced by our citizens, and for any number of reasons, many people think the pendulum has swung too far in one direction and needs to come back to center. It should also be noted that at least one RTM Committee – BOC – took up the thread of our discussion and supported the 2.0% operating limit and reconfirmed our debt policy ceiling. Mr. Pellegrino further stated that the majority of our citizens want the highest level of services in the most efficient manner possible, and sometimes the specter of limited funding is required to affect change, and he emphasized his belief in economy of government, prudence and frugality in government spending, and that government should do what people can’t do for themselves. Mr. Pellegrino stated that the guidelines presented on November 13th are fair and appropriate when all factors are taken into consideration and he recommended them for passage.
Mr. Bedrosian shared comments regarding the economic forecast, unemployment rates, pension costs, and the Grand List. Mr. Johnson, supporting Mr. Pellegrino's proposed guidelines, provided some observations on disproportional falling property values and the implication that taxpayers in certain parts of Town will have to shoulder a larger share of taxes after the coming revaluation effort. As a member of the BET HR Committee, he mentioned that he had understood from outside compensation consultants that most neighboring communities have not provided any salary increases to their employees over the past several years. He also noted that the preliminary guidelines received support from several nonpartisan RTM groups such as the Budget Overview Committee and committees from Districts 5 and 7. Ms. Tarkington supports the targeted mill rate increase for the general fund of 2.5%, but this increase addresses only the general fund mill rate. Approximately 76% of tax payers reside and 66% of the Town’s real estate values are within the sewer district, and in FY 2013 taxpayers in the sewer district saw their sewer fund taxes increase by 16% and their mill rate in total rose by 3.48%, substantially above the 2.75% of taxpayers outside the sewer district. Over the 12 years that the Town has had Budget Guidelines, the general fund tax levy has increased by 69%, an average of 5.71% per year, and the sewer fund tax levy has increased by 126%, an average 10.47% per year, and Greenwich residents over decades expected value for their property taxes and that tradition should be respected. Mr. Norton spoke about Greenwich’s government structure, including the RTM, BET, and OFS, and how they provide input to the budget process. Mr. Norton added that he had visited the two

Minutes of the Regular Meeting of the Board of Estimate and Taxation November 19, 2012 – Subject to Approval Page 8 of 8
delegations that he had chaired, District 12 and District 9, and that there was no expressed opposition to the proposed guidelines. At District 12, there was an extensive discussion about the continual budget size growth, and Mr. Norton noted that the fiscal 1976 budget was $35M. Mr. Norton expressed confidence that the fiscal 2014 recommended budget guidelines of November 13, 2012 were reasonable, and that they would serve well the needs of our town. Mr. Mason shared comments regarding fiscal stability, the Budget process, decreased revenues, level services, recent acquisitions and upgrades, operating increases, seeking efficiencies, shared services, departmental standards and services, single source vending, bonding requirements, payroll costs, Fire Department requirements, education costs, implementation of the TOG/BOE HR Plan, and infrastructure requirements.
Upon a motion by Mr. Pellegrino, seconded by Ms. Tarkington, the Board voted 7-6-0 to approve the Guidelines draft dated November 13, 2012 as the FY 2013-2014 Budget Guidelines (Mr. Brady, Mr. Finger, Mr. Goldrick, Mr. Huffman, Ms. Kiernan, Mr. Ramer opposed) (Mr. Mason cast tie-breaking vote to approve).
APPROVAL OF MINUTES BET Regular Meeting, October 15, 2012
Upon a motion by Ms. Kiernan, seconded by Mr. Norton, the Board voted 11-0-1 (Mr. Huffman abstained) to approve the Regular Meeting Minutes of the BET from October 15, 2012.
CHAIRMAN’S REPORT Mr. Norton shared comments regarding the Northeast Greenwich Association meeting discussion of the pension plan and BET’s role with respect to the pension plan. Mr. Mason acknowledged the EOC for their effort during the recent hurricane and snowstorm. ADJOURNMENT
Upon a motion by Mr. Brady, seconded by Mr. Goldrick, the Board voted unanimously to adjourn at 9:44 P.M.
Respectfully submitted,
___________________________________ Maria Bocchino, Recording Secretary ___________________________________ Mary Lee A. Kiernan, Clerk of the Board ___________________________________ Michael S. Mason, Chairman