The evolution of cooperation in an arid-zone bird: bet-hedging ...
256
The evolution of cooperation in an arid-zone bird: bet-hedging, plasticity and constraints Submitted by Pablo Capilla Lasheras to the University of Exeter as a thesis for the degree of Doctor of Philosophy in Biological Sciences In September 2019 This thesis is available for Library use on the understanding that it is copyright material and that no quotation from the thesis may be published without proper acknowledgement. I certify that all material in this thesis which is not my own work has been identified and that no material has previously been submitted and approved for the award of a degree by this or any other University. Signature: …………………………………………………………..
-
Upload
khangminh22 -
Category
Documents
-
view
1 -
download
0
Transcript of The evolution of cooperation in an arid-zone bird: bet-hedging ...

The evolution of cooperation in an arid-zone bird:
bet-hedging, plasticity and constraints
Submitted by
Pablo Capilla Lasheras
to the University of Exeter as a thesis for the degree of
Doctor of Philosophy in Biological Sciences
In September 2019
This thesis is available for Library use on the understanding that it is copyright material and that no quotation from the thesis may be published without proper acknowledgement. I certify that all material in this thesis which is not my own work has been identified and that no material has previously been submitted and approved for the award of a degree by this or any other University.
Signature: …………………………………………………………..

ii

iii
The evolution of cooperation in an arid-zone bird:
bet-hedging, plasticity and constraints
Summary
The evolution of cooperation represents a long-standing puzzle in evolutionary
biology. From insects to mammals, this behaviour has evolved multiple times in
separate lineages. Even though inclusive fitness theory provides a solid theoretical
framework to understand the evolution of cooperation, there are still many research
challenges in the evolutionary study of cooperation. First, most of the evidence for
the effects of cooperation on the reproductive success of beneficiaries in vertebrate
societies is based on correlational studies, which can be confounded by several
environmental factors. Second, there are recent theoretical formulations to explain
the evolution of cooperation that have not been empirically tested yet but could shed
new light on the selective pressures that facilitate the evolution of cooperation. Third,
we still have a poor understanding of the sources of among individual variation in
cooperative behaviours. In particular, few studies have investigated whether the
level of cooperation expressed by individuals is heritable and, therefore, could
respond to natural selection. In this thesis, I combine nine years of life-history and
behavioural information with field experiments and genomics to investigate (i) the
routes for non-breeding individuals to acquire indirect fitness benefits and (ii) the
sources of among-individual variation in cooperation in white-browed sparrow-
weavers (Plocepasser mahali), an arid-zone cooperative breeder. After a general
introduction to the subject of cooperative breeding, in Chapter 2 I test a novel
hypothesis for the evolution of cooperation, the ‘altruistic bet-hedging’ hypothesis.
There, I show that non-breeding helpers reduce variation in the reproductive
success of breeders without affecting their arithmetic mean reproductive success.
Furthermore, I show that this reproductive variance compression appears to arise
because helpers specifically reduce unpredictable rainfall-induced variation in
reproductive success, just as hypothesised by global comparative studies of the
evolution of cooperative breeding in birds. Then, I investigate alternative routes

iv
through which helpers may gain indirect fitness benefits. Specifically, in Chapter 3 I
investigate the effects of helpers on pre- and post-natal maternal investment in
reproduction. The findings in Chapter 3 provide clear evidence for maternal
plasticity in pre-natal investment in reproduction (egg volume) in response to the
number of helpers. Moreover, the helper effect of increased pre-natal maternal
investment is associated with a decrease in post-natal maternal investment. In
Chapter 4, I test the philopatry hypothesis for the evolution of sex differences in
cooperation within animal societies and find strong support for this hypothesis in
white-browed sparrow-weavers. Furthermore, Chapter 4 highlights the need to
consider both sex differences in direct fitness benefits and costs when trying to
understand sex differences in cooperation. Finally, in Chapter 5 I investigate among-
helper variation in cooperative generosity, finding consistent individual differences
and providing evidence for heritable variation in this trait. To conclude, in Chapter 6
I discuss the implications of these results for our general understanding of the
evolution of cooperation in animal societies and highlight methodological
approaches for future empirical studies of cooperation in the wild.

v
For Natalia, Teresa, Jose Luis C. S. and Jose Luis C. L.

vi
Acknowledgments
Writing a PhD thesis was never the purpose per se but rather an opportunity to
spend four years of my life doing what I have felt passionate about since I was a
young teenager. I owe this opportunity to many people. Once that opportunity was
given, many others helped me complete the journey successfully and made my life a
lot more joyful.
Right from the beginning I was very lucky. Having a better mentor to guide me
through the uncertainties of this thesis would have been very unlikely. I am very
pleased to realise that enthusiasm, support, unlimited time, positivity and
thoroughness are probably the best words to define the relationship with my thesis
supervisor. Andy, thanks for creating this opportunity and offering it to me, for your
trust when things did not work as expected and for your brilliant support all
throughout this thesis. You have extremely improved the way I work and think about
scientific questions and, made a huge positive effect on how I approach life in general.
Similar words can be used to describe the support of and the relationship with my
other two supervisors, Alastair and Xavier. I have only completed this thesis because
of your guidance and support. Learning from you has been a real pleasure, thank you.
It would be impossible to list everyone that helped me in the past and hence
indirectly contributed to this thesis. However, Barbara Helm deserves a very warm
mention and all my gratitude. She was the one that first gave me an opportunity to
do research, laying the foundational stones that then formed the basis of this thesis.
Carrying out long field seasons in an isolated location taught me many things. One
of the most important lessons was that good quality data can only be collected by
happy field workers. During my time in Tswalu, making sure that everyone in the
team was well was the best insurance against failures in data collection. In a very
similar way, I have only been able to complete this thesis because there was someone
making sure that I was well, looking after my physical and mental well-being.
Natalia, you are my insurance against failure and the inspiration to be the best
version of myself. I cannot thank you enough for placing life back into context when

vii
the importance of this thesis was taking up too much of my mental space. This
achievement is only possible because you have kept an eye on me. I look forward to
many future adventures with you.
Living in Tswalu was a truly unique experience due to the people I shared my time
with. Many of them also helped me in the field and the greatest thanks must go to all
of them: Emma Wood, Darragh Murphy, Bryony Baker, Joe Gosling, Ellen Somerwill,
Claire Buchan, Ciara Sexton, Ben Harrington, Marine Quintin, Shane Sommers,
Charlotte Martin-Taylor, Anthony Lowney, Wendy Panaino, Nina Bircher and Marc
Naguib. Amongst all of them, I would like to especially thank Emma Wood, who was
an excellent field mentor; Bryony Baker for being such an amazing friend and
offering me her support in my first months in Tswalu; and, Ciara Sexton for her
endless energy and for looking after me when an angry ant that dropped from a tree
decided to bite my eyeball in an attempt to save its life. I must also show my gratitude
to the boomslang that decided to get in the car and wake me up from a nap stroking
my ankle: I will always be grateful that you decided not to bite my leg. I would also
like to thank the Tswalu foundation and people at Tswalu, very especially Dylan
Smith, Cornelia le Roux and many anonymous workers at the workshop who helped
me out when the harshness of the desert took its toll and ‘white’ or ‘blue’, our field
cars, needed to be fixed.
Antony Brown and Melanie Weedon have been brilliant colleagues, office mates and
friends. My experience as a PhD student improved significantly when they became
part of Andy’s research group. Ant and Mel, it has been a real pleasure to share life
with you in the last two years; you will always be very welcome wherever I am. I
have shared and enjoyed life in Cornwall with many people in the last four years. On
many occasions, they helped me get through difficult situations when the progress
of this thesis was not moving forward as expected. Greatest thanks must also go to:
Jesica Soria Pascual (also known as ‘the passport finder’), Giovanni Rinaldi, Eva
Jimenez-Guri, Franscisca Garcia Garcia, Karl Wotton, David March Morla, Martina
Cecchetti, Tomasa Sbaffi, Vinka Anic Thomas, Atta Ajayebi, Israa Kadhim, Alice
Maestri, Xiao-Lin Chu, Lauri Mikonranta, Ossi Nokelainen, Paula Marjama ki, Ian
Skicko, Alice Williams, David Pascal and Beth Clark. I would like to send a very warm
thanks to Andrea Soriano and Jorge Gutierrez. These two fellows have been an

viii
integral part of my PhD experience; they were outstanding friends, inspiring
colleagues and understanding flat mates. Thank you both for your support and
friendship.
Finally, it is very difficult to succinctly describe how much my family have supported
me in the last 10 years, all the way until the completion of this thesis. Without their
support, freedom and love, exploring my own path in life would not have been
possible. I will never be able to thank them enough for what they offered me,
although I know they do not need nor want to be thanked:
Jose Luis and Teresa, it is impossible to write words of acknowledgement that
compensate for all the time invested in this thesis, away from you. Thanks for giving
me the opportunity to get here. I will try not to forget the effort that you have made
for me. Jose Luis, brother, the prospect of sharing some time with you in the last four
years has been my motivation and revitalised me to carry on. Writing this thesis has
been a lot more difficult because of the distance between us. Thank you for your
support throughout the years.
[Last paragraph in Spanish: José Luis y Teresa, es imposible escribir palabras de
agradecimiento que compensen el tiempo que he dedicado a esta tesis, demasiado lejos
de casa. Gracias por permitirme llegar hasta aquí. Intentaré no olvidarme nunca del
esfuerzo que muchas veces os ha supuesto. José Luis, hermano, la idea de compartir
algo de tiempo contigo en los últimos cuatro años me ha mantenido con energía para
continuar hacia adelante. Escribir esta tesis se ha hecho mucho más complicado por la
distancia entre nosotros. Gracias por tu apoyo durante todos estos an os.]
1
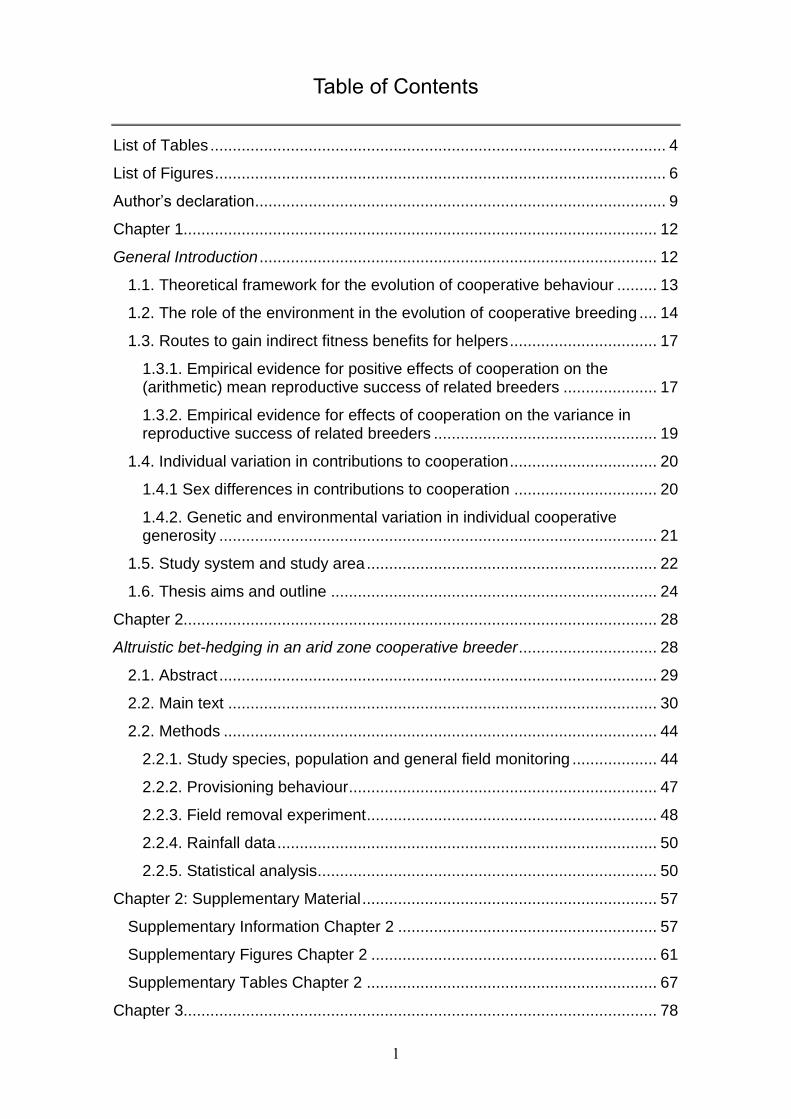
Table of Contents
List of Tables ...................................................................................................... 4
List of Figures ..................................................................................................... 6
Author’s declaration ............................................................................................ 9
Chapter 1.......................................................................................................... 12
General Introduction ......................................................................................... 12
1.1. Theoretical framework for the evolution of cooperative behaviour ......... 13
1.2. The role of the environment in the evolution of cooperative breeding .... 14
1.3. Routes to gain indirect fitness benefits for helpers ................................. 17
1.3.1. Empirical evidence for positive effects of cooperation on the (arithmetic) mean reproductive success of related breeders ..................... 17
1.3.2. Empirical evidence for effects of cooperation on the variance in reproductive success of related breeders .................................................. 19
1.4. Individual variation in contributions to cooperation ................................. 20
1.4.1 Sex differences in contributions to cooperation ................................ 20
1.4.2. Genetic and environmental variation in individual cooperative generosity .................................................................................................. 21
1.5. Study system and study area ................................................................. 22
1.6. Thesis aims and outline ......................................................................... 24
Chapter 2.......................................................................................................... 28
Altruistic bet-hedging in an arid zone cooperative breeder ............................... 28
2.1. Abstract .................................................................................................. 29
2.2. Main text ................................................................................................ 30
2.2. Methods ................................................................................................. 44
2.2.1. Study species, population and general field monitoring ................... 44
2.2.2. Provisioning behaviour ..................................................................... 47
2.2.3. Field removal experiment ................................................................. 48
2.2.4. Rainfall data ..................................................................................... 50
2.2.5. Statistical analysis ............................................................................ 50
Chapter 2: Supplementary Material .................................................................. 57
Supplementary Information Chapter 2 .......................................................... 57
Supplementary Figures Chapter 2 ................................................................ 61
Supplementary Tables Chapter 2 ................................................................. 67
Chapter 3.......................................................................................................... 78

2
Maternal plasticity in a cooperative bird: opposing effects of helping on pre- and post-natal maternal investment ........................................................................ 78
3.1 Abstract ................................................................................................... 79
3.2. Introduction ............................................................................................ 80
3.3. Methods ................................................................................................. 85
3.3.1. White-browed sparrow-weaver study population ............................. 85
3.3.2. Provisioning behaviour ..................................................................... 87
3.3.3. Environmental data .......................................................................... 88
3.3.4. Statistical analysis ............................................................................ 89
3.4. Results ................................................................................................... 95
3.4.1. Patterns and implications of maternal plasticity in egg volume ........ 95
3.4.2. Maternal plasticity in egg volume: individual mothers lay larger eggs when they have more female helpers ........................................................ 95
3.4.3. Maternal plasticity in nestling provisioning: individual mothers provision less when they have more female helpers ................................. 98
3.4.4. No evidence of maternal adjustment of clutch size or number of clutches laid per year according to helper numbers ................................... 99
3.5. Discussion ............................................................................................ 103
Chapter 3: Supplementary Material ................................................................ 111
Supplementary Information Chapter 3 ........................................................ 111
Supplementary Figures Chapter 3 .............................................................. 115
Supplementary Tables Chapter 3 ............................................................... 119
Chapter 4........................................................................................................ 131
Dispersal and the evolution of sex differences in cooperation ........................ 131
4.1. Abstract ................................................................................................ 132
4.2. Introduction .......................................................................................... 133
4.3. Methods ............................................................................................... 139
4.3.1. White-browed sparrow-weaver study population ........................... 139
4.3.2. Provisioning behaviour and weaving behaviour ............................. 140
4.3.3. Prospecting behaviour ................................................................... 142
4.3.4. Statistical methods ......................................................................... 145
4.4. Results ................................................................................................. 149
4.4.1. Female-biased natal cooperation in the absence of sex differences in relatedness to recipients .......................................................................... 149
4.4.2. Female-biased philopatry without a female bias in the probability of inheriting the breeding position within the natal group ............................. 153
4.4.3. Male-biased extra-territorial prospecting from the natal group ....... 155

3
4.5. Discussion ............................................................................................ 158
Chapter 4: Supplementary Material ................................................................ 167
Supplementary Figures Chapter 4 .............................................................. 167
Supplementary Tables Chapter 4 ............................................................... 172
Chapter 5........................................................................................................ 181
Heritable variation in cooperative generosity in a wild social bird ................... 181
5.1. Abstract ................................................................................................ 182
5.2. Introduction .......................................................................................... 183
5.3. Methods ............................................................................................... 185
5.3.1. Field monitoring ............................................................................. 185
5.3.2. Provisioning behaviour ................................................................... 187
5.3.3. Restriction site associated DNA (RAD) sequencing....................... 188
5.3.4. Bioinformatics processing of RAD sequencing data ...................... 189
5.3.5. Creating the Genetic Relationship Matrix (GRM) ........................... 192
5.3.6. Statistical analysis .......................................................................... 193
5.4. Results ................................................................................................. 197
5.4.1. Among-individual variation in helping effort ................................... 197
5.4.2. Additive genetic variation in helping effort ...................................... 200
5.5. Discussion ............................................................................................ 202
Chapter 5: Supplementary Material ................................................................ 208
Supplementary Figures Chapter 5 .............................................................. 208
Supplementary Tables Chapter 5 ............................................................... 213
Chapter 6........................................................................................................ 216
General Discussion ........................................................................................ 216
6.1. Altruistic bet-hedging and the global distribution of cooperative breeders 218
6.2. The importance of direct fitness payoffs in the evolution of cooperation 220
6.3. Complications in the study of the evolution of helping .......................... 222
6.2.1. The importance of isolating the effects of helping per se ............... 222
6.2.2. Avoiding the confounding effect of variation in quality among territories .................................................................................................. 223
6.4. Final summary ...................................................................................... 225
7. References ................................................................................................. 227

4
List of Tables
Chapter 2
Table S1. ...............................................................................................................................................67
Table S2. ...............................................................................................................................................68
Table S3. ...............................................................................................................................................69
Table S4. ...............................................................................................................................................70
Table S5. ...............................................................................................................................................72
Table S6. ...............................................................................................................................................73
Table S7. ...............................................................................................................................................74
Chapter 3
Table 1. The top-performing models explaining variation in egg volume ............... 100
Table 2. The top-performing models explaining variation in egg volume
partitioning within- and among-mother variation in male and female helper
number ................................................................................................................................................ 101
Table 3. The top-performing models explaining variation in maternal provisioning
rates ...................................................................................................................................................... 102
Table S1. ............................................................................................................................................ 119
Table S2. ............................................................................................................................................ 120
Table S3. ............................................................................................................................................ 122
Table S4. ............................................................................................................................................ 123
Table S5. ............................................................................................................................................ 125
Table S6. ............................................................................................................................................ 128
Table S7. ............................................................................................................................................ 129
Chapter 4
Table 1. Model coefficients of the best supported negative-binomial generalised
linear mixed model explaining variation in the cooperative contributions to
offspring provisioning of subordinates within their natal groups .............................. 152
Table 2. Analysis of daily rate of prospecting movements ............................................. 158
Table S1. ............................................................................................................................................ 172
Table S2. ............................................................................................................................................ 173

5
Table S3. ............................................................................................................................................ 174
Table S4. ............................................................................................................................................ 175
Table S5. ............................................................................................................................................ 176
Table S6. ............................................................................................................................................ 177
Table S7. ............................................................................................................................................ 179
Chapter 5
Table 1. Results of a generalised (Poisson) mixed model explaining variation in
helper provisioning rates ............................................................................................................. 200
Table 2. Results of a generalised animal model explaining variation in helper
provisioning rates ........................................................................................................................... 202
Table S1. ............................................................................................................................................ 213
Table S2. ............................................................................................................................................ 214

6
List of Figures
Chapter 2
Figure 1. Helping and its impact on offspring provisioning .............................................32
Figure 2. Female helper effects on mean and variance in reproductive success of
related breeders .................................................................................................................................35
Figure 3. Helpers mitigate rainfall-induced variation in reproductive success ........37
Figure 4. Environmental variation across the white-browed sparrow-weaver’s
range .......................................................................................................................................................43
Figure S1. .............................................................................................................................................61
Figure S2. .............................................................................................................................................62
Figure S3. .............................................................................................................................................63
Figure S4. .............................................................................................................................................64
Figure S5. .............................................................................................................................................66
Chapter 3
Figure 1. Patterns and implications of maternal plasticity in egg volume .................96
Figure 2. Maternal plasticity in egg volume ...........................................................................97
Figure 3. Maternal plasticity in post-natal provisioning ...................................................99
Figure S1. .......................................................................................................................................... 115
Figure S2. .......................................................................................................................................... 116
Figure S3. .......................................................................................................................................... 117
Figure S4. .......................................................................................................................................... 118
Chapter 4
Figure 1. Sex differences in the cooperative contributions to nestling provisioning
of subordinates within their natal groups............................................................................. 151
Figure 2. Sex differences in philopatry but not sex difference in probability of
dominance acquisition in the natal territory ....................................................................... 154
Figure 3. The extra-territorial prospecting behaviour of subordinates within their
natal groups ...................................................................................................................................... 157
Figure S1. .......................................................................................................................................... 167
Figure S2. .......................................................................................................................................... 168

7
Figure S3. .......................................................................................................................................... 169
Figure S4. .......................................................................................................................................... 170
Figure S5. .......................................................................................................................................... 171
Chapter 5
Figure 1. Partitioning of phenotypic variation in helper provisioning rates .......... 199
Figure 2. Partitioning of phenotypic variance in helper provisioning rates,
including additive genetic variance ......................................................................................... 201
Figure S1. .......................................................................................................................................... 208
Figure S2. .......................................................................................................................................... 209
Figure S3. .......................................................................................................................................... 210
Figure S4. .......................................................................................................................................... 211
Figure S5. .......................................................................................................................................... 212

8

9
Author’s declaration
All chapters of this thesis have been written by Pablo Capilla-Lasheras with
comments and editing by Dr. Andrew Young. Guidance was provided throughout by
Dr. Andrew Young. Prof. Alastair Wilson provided additional guidance for Chapter 5.
Prof. Alastair Wilson, Dr. Xavier Harrison and Dr. Emma Wood commented and
edited Chapter 2 and Chapter 5. Antony Brown, Melanie Weedon, Dr. Natalia Bravo-
Santano and Nina Bircher provided comments that improved Chapters 3, 4 and 5. Dr.
Simon Evans provided useful comments that improved Chapter 5.
Many volunteering field assistants and previous members of Dr. Andrew Young’s
research group contributed to create the long-term field data base that Pablo Capilla-
Lasheras analyses throughout this thesis. Especially relevant in the creation of this
data set were Dr. Thomas Reed, Dr. Jenny E. York, Dr. Dominic L. Cram and Dr. Lindsay
Walker. Pablo Capilla-Lasheras contributed towards the completion of this data base
between 2015 and 2017. The long-term white-browed sparrow-weaver project is
led by Dr. Andrew Young, who also manages the data base. Nina Bircher and Prof.
Mark Naguib provided essential field guidance and equipment for the deployment
of Encounternet technology (Chapter 4). Dr. Christian Rutz contributed to Chapter 4
providing Encounternet basenodes. Nina Bircher did also advise on the analysis of
Encounternet data. Laboratory work was carried out by Pablo Capilla-Lasheras with
important guidance provided by Dr. Xavier Harrison and the assistance of Antony
Brown. Floragenex Inc. (Portland, OR, United States) carried out restriction site
associated DNA sequencing to generate the data used in Chapter 5.

10
Chapters 2, 3, 4 and 5 are the result of the scientific endeavour and collaboration of
several people throughout many years. Therefore, I acknowledge their contribution
at the beginning of each chapter and use the pronoun ‘we’ throughout. This
grammatical use by no measure means that any part of this thesis is not my own
work but instead aims to appreciate the collaborative aspect of the mentioned thesis
chapters.
This work was made possible thanks to the Biotechnology and Biological Sciences
Research Council-funded South West Biosciences Doctoral Training Partnership
(BB/M009122/1). Paintings and drawings by Dr. Emma Wood.

11

12
Chapter 1
General Introduction

13
1.1. Theoretical framework for the evolution of cooperative behaviour
As Darwin intuited and the modern synthesis in evolutionary biology formalised,
natural selection filters populations by removing genes, and hence traits, of those
individuals that are not well adapted to their environment (Darwin, 1859; Gould,
2002). How is it then possible that natural selection maintains or even favours the
existence of altruistic genes in individuals that sacrifice their own reproduction and
instead assist to raise the offspring of others? A solution for this paradoxical
question was proposed in 1964, when W. D. Hamilton published a pivotal theoretical
formulation and defined the concept of inclusive fitness (Hamilton, 1964). Inclusive
fitness theory acknowledges that individuals can transmit copies of their own genes
not only via direct reproduction (i.e. ‘direct fitness’) but also by increasing the
reproductive success of related individuals, with whom they share genes (i.e.
‘indirect fitness’). Hamilton thus proposed that selection acts upon ‘inclusive fitness’,
the combination of direct and indirect fitness (Hamilton, 1964). Hamilton predicted
that cooperation would be favoured by natural selection when the reproductive
costs to the altruistic individual (‘c’) did not exceed the reproductive benefits to the
recipient (‘b’) weighed by the genetic relatedness (‘r’) between the altruistic actor
and the recipient individual (i.e. Hamilton’s rule: 𝑟 × 𝑏 > 𝑐, Hamilton, 1964). While
Hamilton’s rule provided a powerful model to explain the evolution of cooperation
in nature, more than 50 years after Hamilton’s pivotal papers many questions about
the evolution and maintenance of cooperative behaviours are still unanswered
(West & Griffin, 2007). In particular, we are still lacking a clear understanding of the
origins of variation in cooperative tendencies, how environmental factors affect the
evolution of cooperation and the role of direct fitness benefits in shaping
cooperation in animal societies.

14
In cooperatively breeding species, defined as species in which some individuals help
to rear the offspring of others (Griffin & West, 2002; West et al., 2007; Koenig &
Dickinson, 2016), there is variation in the level of cooperation expressed among and
within individuals (Komdeur, 2006; Bergmu ller et al., 2010). Among species, genetic
relatedness between breeders and helpers has been found to positively predict the
amount of help provided by helpers (Griffin & West, 2003; Green et al., 2016),
consistent with the predictions of inclusive fitness theory (Hamilton, 1964). Within
species, individual roles (e.g. whether individuals act as breeders or helpers) and the
level of help that individuals provide can also vary markedly (Bergmu ller et al.,
2010). Crucially, differences in genetic relatedness among individuals are often low
within species and social groups (e.g. Clutton-Brock et al., 2002; but see Russell &
Hatchwell, 2001 for an exception), suggesting that individual diversity in
cooperative behaviour may be a product of variation in other factors.
To set the scene for the empirical chapters that follow I summarise below our
current understanding of the role that (i) the environment, (ii) indirect fitness
benefits, and (iii) direct fitness payoffs have played in the evolution of cooperative
breeding, highlighting in the process a number of complications that represent
current research challenges in this field. I then outline the aims and structure of this
thesis, which seeks to address these challenges.
1.2. The role of the environment in the evolution of cooperative breeding
Hamilton himself noted that cooperation could only be selected for when
complementary factors created the conditions for related individuals to interact
(Hamilton, 1987). Indeed, the evolution of cooperation needs to be understood as a
two-step process: first, the evolution of the delayed dispersal of offspring and the

15
consequent origin of family living and / or kin neighbourhoods (e.g. Hatchwell, 2016)
and, second, the evolution of cooperative activities per se (Griesser et al., 2017).
Environmental factors have been traditionally suggested to play an important role
promoting delay dispersal and family living. Early studies trying to explain the
existence of cooperatively breeding species acknowledged the role of the
environment imposing high costs to dispersal and / or independent breeding and,
therefore, promoting local dispersal or no dispersal at all (Emlen, 1982b, 1994;
Cockburn, 1998; Hatchwell, 2009). The environment can constrain dispersal and
independent breeding, thereby creating extended family living and kin
neighbourhoods, if environmental conditions (i) impose high survival costs to
dispersal (Ridley et al., 2008; Bonte et al., 2012) or (ii) promote habitat saturation
and a shortage of breeding positions (Koenig et al., 1992; Komdeur, 1992; Kingma et
al., 2016). It should be noted that the selective pressures favouring the evolution of
delayed dispersal and kin-structured populations need not match those that select
for the evolution of cooperation per se (Emlen, 1982b; a; Griesser et al., 2017).
Failure to appreciate this nuance may have contributed to confusion about the
general role of the environment in the evolution of cooperatively breeding societies,
which typically show both delayed dispersal and cooperation (e.g. Gonzalez et al.,
2013; Cornwallis et al., 2017). Indeed, in a global comparative analysis of
cooperative breeding in birds, Griesser et al. (2017) showed that the environmental
factors promoting group living (i.e. delayed dispersal) are different from those that
promoted the evolution of helping per se (i.e. cooperation). Once delayed dispersal
has evolved, individuals can accrue indirect fitness benefits by helping relatives,
leading to the evolution of cooperative behaviours (Brown, 1987; Emlen, 1991).

16
The fact that cooperative breeding is associated with unpredictable environments
led to the idea, first conceptually proposed by Rubenstein (2011), that helping acts
as a bet-hedging strategy (Rubenstein, 2011). Bet-hedging is an adaptive strategy
that increases the long-term fitness of a lineage not by increasing its (arithmetic)
mean reproductive success but by reducing its variance in reproductive success (see
Starrfelt & Kokko, 2012, and references therein). Bet-hedging is of particular
relevance in unpredictable environments, where plasticity cannot evolve as
organisms do not have reliable cues (i) to predict the environment in which a given
trait will be expressed and (ii) to predict the relationship between fitness and the
expression of a given trait across different environments (Simons, 2011). Bet-
hedging strategies for adaptation to unpredictable environments have been, and still
are, intensively study both theoretically (Lehmann & Balloux, 2007; Starrfelt &
Kokko, 2012) and empirically (Beaumont et al., 2009; Olofsson et al., 2009; Simons,
2011). However, until very recently, no studies had integrated bet-hedging theory
and the general Hamiltonian framework for the evolution of cooperation.
Such integration between bet-hedging theory and Hamiltonian social theory was
recently carried out by Kennedy et al. (2018), proposing altruistic bet-hedging as a
new formulation to understand the evolution of cooperation in unpredictable
environments (Kennedy et al., 2018). Altruistic bet-hedging integrates traditional
bet-hedging theory and inclusive fitness theory, and acknowledges that the
reproductive benefits of cooperation to the recipient and the reproductive costs of
cooperation for the actor (‘b’ and ‘c’ in classical Hamilton’s rule) can also be affected
by changes in variation of reproductive success and not only by changes in
(arithmetic) mean reproductive success (Kennedy et al., 2018). Altruistic bet-
hedging describes a specific scenario where even in the absence of positive effects

17
of cooperation on mean reproductive success, cooperation can still be selected for if
it reduces variation in the reproductive success of breeding individuals (Kennedy et
al., 2018). Cooperative individuals can therefore gain indirect fitness benefits by
increasing the mean reproductive success of related breeders (as proposed by
classical Hamilton’s rule, Hamilton, 1964) and / or by reducing variation in the
reproductive success of related breeders (as envisaged by altruistic bet-hedging
theory, Kennedy et al., 2018).
1.3. Routes to gain indirect fitness benefits for helpers
1.3.1. Empirical evidence for positive effects of cooperation on the
(arithmetic) mean reproductive success of related breeders
Helpers in cooperatively breeding species can gain indirect fitness benefits by
engaging in cooperative activities if they increase the reproductive success of related
reproductive individuals (Hamilton, 1964; Brown, 1987; Emlen, 1991). There are
several potential routes to acquire these indirect benefits.
First, helpers can increase the survival of offspring produced by breeding individuals.
In many animal societies, helpers provide food for offspring of other individuals (i.e.
‘alloparental care’), positively impacting offspring survival (Brown, 1987; Emlen,
1991; Field et al., 2000; Clutton-Brock et al., 2001; Magrath, 2001; Russell et al.,
2003a; Dickinson & Hatchwell, 2004; Young et al., 2015; Koenig & Dickinson, 2016).
Helper contributions can not only increase offspring survival but also increase the
future reproductive success of offspring (Hatchwell et al., 2004; Russell et al., 2007b;
Meade et al., 2010). However, experimental approaches are rarely used in the study
of cooperative breeders (for an exception, see Liebl et al., 2016) and a number of

18
confounding factors may affect the conclusions of correlational studies regarding the
impact of helpers on the reproductive success of breeders. In particular, variation in
territory quality can create spurious correlations between the presence or number
of helper and the reproductive success of breeders (Cockburn, 1998). Territory
quality is likely to positively affect the size of the group that occupies it by offering
more resources for successful upbringing of offspring or by reducing competition
among helpers and breeders and, thus, allowing more individuals to delay dispersal
(Cockburn, 1998; Ekman et al., 2001). If this is the case, high quality territories may
accumulate more helpers and, independently, increase the reproductive success of
breeders (Cockburn, 1998).
Second, helpers may lighten offspring provisioning workloads of related breeders
(i.e. ‘load-lightening’, Heinsohn, 2004). Load lightening occurs when the presence of
helpers is associated with a decrease in the workload of breeders after offspring
hatch or are born (Hatchwell, 1999; Russell et al., 2003a; Heinsohn, 2004). Load
lightening may allow breeding individuals to re-allocate resources for other
reproductive bouts or for own survival (Heinsohn, 2004). In meerkats (Suricata
suricatta), for example, breeding females have more litters per year when they are
assisted by more helpers (Russell et al., 2003a). Alternatively or in combination with
the latter effect, there is evidence from several species suggesting that load
lightening by helpers can also lead to increase survival of breeding individuals (Khan
& Walters, 2002; Kingma et al., 2010; Langmore et al., 2016).
Load-lightening effects by helpers have been traditionally investigated at a post-
natal stage, measuring helper contributions towards offspring food provisioning
(Hatchwell, 1999). In recent years, however, there has been an increasing interest in

19
understanding the causes and consequences of load-lightening at a pre-natal stage,
when helpers lighten the workloads of breeders before offspring hatch or are born
(Russell et al., 2007a; Dixit et al., 2017). For example, in superb-fairy wrens (Malurus
cyaneus) helpers are associated with decreases in maternal pre-natal investment
(egg size) under certain environmental conditions (Russell et al., 2007a; Langmore
et al., 2016). However, as it is the case for studies on helper effects on reproductive
success of breeders (see above), most studies of cooperative breeders investigating
load-lightening at a pre- or post-natal stage do not adequately control for variation
in territory quality or, indeed, breeder quality. As detailed above, high quality
territories can accumulate a high number of helpers and, independently, allow
females to, for example, lay larger eggs (Cockburn, 1998; Lejeune et al., 2016). In the
latter scenario, a correlation between helper number and pre-natal maternal
investment would arise, potentially leading to the erroneous conclusion that females
lay larger eggs when assisted by more helpers. To circumvent this problem, the effect
of helpers on the reproductive success of breeders should be assessed by
experimentally manipulating cooperative contributions of helpers (e.g. Taborsky et
al., 2007) or by statistically controlling for variation in reproductive success among
territories (van de Pol & Wright, 2009; Lejeune et al., 2016).
1.3.2. Empirical evidence for effects of cooperation on the variance in
reproductive success of related breeders
Evidence that cooperation reduces variance in the reproductive success of related
breeders, as envisaged under altruistic bet-hedging (Kennedy et al., 2018), is much
scarcer than evidence for effects of cooperation on arithmetic mean reproductive
success. Such variance reductions effects have been suggested in birds (Rubenstein,
2011; Koenig & Walters, 2015), mammals (Ebensperger et al., 2014) and some

20
invertebrates (Stevens et al., 2007; Kocher et al., 2014). Two studies of cooperatively
breeding species have investigated whether groups with more helpers show lower
variance in reproductive success, resulting in some evidence to suggest that they
may (superb starlings, Lamprotornis superbus, Rubenstein, 2011; and acorn
woodpeckers, Melanerpes formicivorus, Koenig & Walters, 2015). However, whether
such patterns arise because helping behaviour per se reduces variance in the
reproductive success of relatives is unknown. Individuals in larger groups may have
lower variance in reproductive success not because larger groups contain more
helpers but due to benefits of group size that arise independent of helping (e.g.
improved foraging success) or because larger groups of these particular species may
also contain more breeders (which could itself reduce variance in reproductive
success via a range of mechanisms, see Stevens et al., 2007).
1.4. Individual variation in contributions to cooperation
1.4.1 Sex differences in contributions to cooperation
Strikingly, in many animal societies, there is a difference in the contributions of male
and females helpers to cooperation within their natal group (Cockburn, 1998;
Clutton-Brock et al., 2002; Young et al., 2005; Hodge, 2007; Williams & Hale, 2007).
This is the case despite the fact that both subordinate males and females are often
equally related to breeding individuals and to the future generations of offspring
they help rear (Clutton-Brock et al., 2002). It follows that both subordinate males
and female should accrue similar indirect fitness benefits by helping and thus kin
selection alone cannot readily explain sex differences in cooperation in this context
(Clutton-Brock et al., 2002).

21
Several hypotheses have been proposed to explain sex differences in cooperation in
the absence of sex differences in relatedness to the recipients of help (Whitney, 1976;
Charnov, 1978; Clutton-Brock et al., 2002). Among them, the philopatry hypothesis
has received the strongest support to date (Clutton-Brock et al., 2002). This
hypothesis predicts that the more philopatric sex will show higher levels of
cooperation due to increased direct fitness benefits or reduced direct fitness cost
(Clutton-Brock et al., 2002). Indeed, sex differences in direct fitness benefits and /
or costs of cooperation can generate sex differences in cooperation (Field et al., 2006;
Downing et al., 2018). The role of sex differences in direct fitness benefits has been
particularly highlighted (Clutton-Brock et al., 2002; Downing et al., 2018). In general,
if survival and breeding opportunities for helpers increase with group size (Kokko
et al., 2001; Kokko & Ekman, 2002; Kingma et al., 2014), those individuals that stay
in their natal territories as helpers for longer are expected to gain more direct
benefits from cooperation (assuming that cooperation has a positive effect on
offspring production and, therefore, increases group size). The role of sex differences
in the direct fitness cost of cooperation has been much less investigated but it could,
however, play a key role in generating sex differences in cooperation (Young et al.,
2005; Hodge, 2007). Understanding the relative importance of direct fitness effects
in the generation of variation in cooperation would shed new light to our
comprehension of the evolution of cooperative breeding.
1.4.2. Genetic and environmental variation in individual cooperative generosity
After accounting for sex differences in levels of cooperation, it is common that help-
ing individuals still vary in their levels of cooperation (Komdeur, 2006). While vari-
ation in abiotic (e.g. weather) and biotic (e.g. social interactions) factors can impact
individual contributions to cooperation (Hatchwell & Russell, 1996; Hatchwell,

22
1999; Clutton-Brock et al., 2002, 2003; Russell et al., 2003b; Johnstone, 2011; Adams
et al., 2015; Wiley & Ridley, 2016), helpers often show consistent cooperative levels
throughout their lives (Bergmüller et al., 2010). The origin of such consistent indi-
vidual variation in cooperation is unclear but two general explanations are pro-
posed: the existence of additive genetic variation for cooperative generosity and /
or the existence of early-life environmental effects that persists throughout an indi-
vidual’s life (English et al., 2015; Taborsky, 2017). The existence of heritable genetic
variation for cooperative generosity is especially relevant for our understanding of
the evolution of cooperation (Kasper et al., 2017b). Whether heritable variation for
cooperation exists will determine its potential to respond to natural selection. De-
spite its evolutionary importance, compelling evidence that heritable variation con-
tributes appreciably to inter-individual variation in cooperative generosity is lack-
ing.
1.5. Study system and study area
In this thesis, I investigate the evolution of cooperation in white-browed sparrow-
weavers (Plocepasser mahali Smith 1836, subspecies mahali) using a long-term data
set, behavioural experiments and molecular tools. White-browed sparrow-weavers
live in semi-arid regions of East and Southern Africa (Collias & Collias, 1978; Lewis,
1981, 1982a; Ferguson, 1988). The study population is located in Tswalu Kalahari
Reserve in the Kalahari Desert of South Africa. This site is placed in the southern belt
of the Kalahari Desert, close to the Korannaberg mountain range, a savannah-like
habitat, where camelthorn (Vachellia erioloba) and shepherd’s tree (Boscia
albitrunca) are the predominant tree species. Between 2007 and 2016, Tswalu
received on average 357 mm (standard deviation = 153 mm; range = 213-670) of
total rainfall per year, mostly between December and March, corresponding to the

23
wet season. Rainfall conditions were very variable both within and among years
(Chapter 2). Average temperature per year between 2007 and 2016 was 21.1 Celsius
degrees (°C) (standard deviation = 0.83 °C), with maximum average temperatures in
January (27.9 ± 4.52 °C) and minimum average temperatures in July (12.2 ± 4.95 °C).
The study population consists of 30-40 white-browed sparrow-weaver social groups
occupying an area of approximately 1.5 Km2 that have been monitored since 2007.
White-browed sparrow-weavers breed cooperatively in social groups that consist of
a dominant pair and up to ten subordinate helping individuals of both sexes (Lewis,
1982a; Harrison et al., 2013a). Dominance was assessed weekly throughout the
study period based on dominant-related behavioural observations (Walker et al.,
2016; York et al., 2019). Dominant individuals are readily identified in the field as
they are often in close association with each other and often display a conspicuous
singing duet (York et al., 2019). The dominant male displays a characteristic dawn
song (York et al., 2014) and is the individual that invests most in sentinelling within
groups (Walker et al., 2016). Molecular work on the study population has revealed
that the dominant pair monopolises reproduction within each social group, while
12-18% of offspring sired by extra-group dominant males (Harrison et al., 2013a; b).
The dominant female completely monopolises reproduction; she is the only
individual within each social group ever known to lay or incubate eggs (Harrison et
al., 2013a). Furthermore, this molecular work confirmed that dominance status
assigned using behavioural observations also accurately identifies the breeding pair.
Individuals in our study population were observed in the field, their reproductive
activity monitored and their cooperative contributions quantified between
September and April of the following year, period that covers the wet season in
Tswalu when birds are more likely to breed.

24
In white-browed sparrow-weavers, offspring of both sexes typically delay dispersal
from their natal group for a variable amount of time (median = 1.91 years; inter-
quantile range = 1.17 – 2.43 years) during which they engage in several cooperative
activities as non-breeding subordinates. Subordinates of both sexes cooperatively
contribute to nest and roost weaving (Collias & Collias, 1978), vigilance against
predators (Walker et al., 2016), territorial defence (Collias & Collias, 1978; Walker
et al., 2016; York et al., 2019) and offspring food provisioning (Lewis, 1982a; Walker,
2015). Early work on another subspecies (subspecies pectoralis) in a different
location suggests that the presence of helpers may increase the total rate of food
delivery to broods (i.e. there may be ‘additive helper effects’, Lewis, 1982a) and
lighten the workload of the dominant female (i.e. ‘load lightening’, Lewis, 1982a).
Consistently with these findings, (i) offspring reared in groups with more helpers in
our study population appear to show lower rates of telomere erosion during
development (Wood, 2017; which could have beneficial effects on performance,
Young, 2018), and (ii) experimental work on our study population suggests that
rearing offspring entails a physiological cost (body mass loss and a rise in oxidative
damage) and that this cost appears to be lower in groups with more helpers (Cram
et al., 2015).
1.6. Thesis aims and outline
In this thesis, I utilise the white-browed sparrow-weaver as a model system for (i)
testing the altruistic bet-hedging hypothesis for the evolution of cooperation, by
investigating whether helping in white-browed sparrow-weaver societies affects the
(arithmetic) mean and variance in reproductive success of related breeders, (ii)
investigating pre- and post-natal maternal investment responses to the presence of

25
helpers, to shed light on the mechanisms through which helpers impact recipients,
(iii) investigating whether sex differences in direct fitness payoffs from cooperation
(arising from sex differences in philopatry) could explain sex differences in
cooperation, and (iv) whether there is evidence of consistent individual differences
in helper contributions to cooperative provisioning, and to what extent these reflect
heritable (additive genetic) variation in this trait. To accomplish these aims, I
combine a 9-year data set containing life-history and behavioural observations of a
natural population of white-browed sparrow-weavers with field experiments and
genomic information. Throughout this thesis, I apply an analytical technique
(within-subject centring, van de Pol & Wright, 2009) that allows me to investigate
the relationship between helper number and a given life-history or behavioural trait
while controlling for potentially confounding trait variation attributable instead to
variation in quality among territories and/or parents (Cockburn, 1998; van de Pol &
Wright, 2009). Briefly, the chapters will address the following:
Chapter 2 tests the altruistic bet-hedging hypothesis for the evolution of
cooperation (Kennedy et al., 2018). Specifically, I investigate whether helping affects
the (arithmetic) mean and variance in reproductive success of related breeders. This
work provides strong support for this hypothesis, revealing that helping appears to
have no effect on the mean reproductive success of related breeders but instead
compresses their variance in reproductive success. Moreover, this reproductive
variance compression appears to arise because helpers specifically reduce
unpredictable rainfall-induced variation in reproductive success, just as
hypothesised by global comparative studies of the evolution of cooperative breeding
in birds (Griesser et al., 2017).

26
Chapter 3 investigates pre- and post-natal maternal investment responses to the
presence of helpers. Utilising repeated observations of egg volume (i.e. pre-natal
investment) and feeding rates to the offspring (post-natal investment) per dominant
female, this chapter provides evidence for opposing effects of (female) helpers on
pre- and post-natal maternal investment in reproduction.
Chapter 4 tests the philopatric hypothesis for the evolution of sex differences in
cooperation within animal societies. I find support for this hypothesis in white-
browed sparrow-weavers: natal subordinates of the more philopatric sex (females)
contribute more towards cooperative care of offspring than the less philopatric sex
(males). Furthermore, I highlight the importance of sex differences in both direct
fitness benefits and direct fitness costs of cooperation for the evolution of sex
differences in helping behaviours in animal societies.
Chapter 5 investigates the existence of consistent individual differences in helping
behaviour and quantifies additive genetic variance for cooperation generosity. This
chapter provides evidence for consistent among-individual differences in
cooperative generosity and for the existence of additive genetic variation in this trait.
Chapter 6 summarises the results of this thesis, places them in a broader context
and discusses their implications for our understanding of the evolution of
cooperation in the wild.

27

28
Chapter 2
Altruistic bet-hedging in an arid zone cooperative breeder
Contributions by:
Pablo Capilla-Lasheras, Xavier Harrison, Emma Wood, Alastair J. Wilson,
Andrew J. Young
Affiliations:
Centre for Ecology and Conservation, University of Exeter, Penryn, TR10
9FE, UK

29
2.1. Abstract
Analyses of the global biogeography of altruism suggest that unpredictable
environments have favoured the evolution of altruistic helping behaviour (helping
to rear the offspring of others, Jetz & Rubenstein, 2011; Griesser et al., 2017). It has
therefore been hypothesised that selection for altruism may frequently arise
because helping reduces variance in the reproductive success of relatives in
unpredictable environments (a scenario termed ‘altruistic bet-hedging’, Kennedy et
al., 2018). Here we show that helping behaviour does reduce environmentally-
induced variance in the reproductive success of relatives in a wild cooperative bird,
the white-browed sparrow-weaver (Plocepasser mahali). Our decade-long study in
the Kalahari desert reveals that non-breeding helpers have no overall effect on the
mean reproductive success of related breeders, but instead reduce variance in the
reproductive success of related breeders. Moreover, this variance reduction arises in
part because helpers specifically reduce unpredictable rainfall-induced variance in
reproductive success, just as hypothesised by global comparative analyses (Jetz &
Rubenstein, 2011; Griesser et al., 2017). Our novel analytical approach implicates
effects of helping per se rather than correlated effects of group size and isolates
within-mother effects of helping from potentially confounding among-mother
variation in performance. Our findings lend new strength to the leading explanation
for the global biogeography of altruism and highlight the wider importance of
considering the impacts of altruism on both the mean and variance in performance
of recipients.

30
2.2. Main text
Explanations for the evolution of altruism via kin selection typically focus on
scenarios in which altruistic acts yield indirect fitness benefits to the actor by
increasing the mean reproductive success of relatives (Hamilton, 1964). However,
recent theory has highlighted that kin selection can also favour altruistic acts that
decrease variance in the reproductive success of relatives in unpredictable
environments; a scenario termed ‘altruistic bet-hedging’ (Kennedy et al., 2018).
Altruistic bet-hedging thus integrates the rationale of kin selection (Hamilton, 1964)
with the long-recognised potential for selection to favour bet-hedging strategies that
decrease variance in performance in unpredictable environments (Starrfelt & Kokko,
2012).
This theoretical development was stimulated by the empirical observation that
altruistic helping behaviour (helping to rear the offspring of others) is globally
associated with unpredictable environments (Jetz & Rubenstein, 2011; Griesser et
al., 2017; see also Sheehan et al., 2015) and the ensuing hypothesis that selection for
helping arises in part from it reducing environmentally-induced variance in the
reproductive success of relatives. While these global associations highlight the
potentially widespread importance of altruistic bet-hedging, compelling evidence
that altruistic helping behaviour does indeed reduce variance in the reproductive
success of relatives in unpredictable environments remains elusive (Cockburn &
Russell, 2011). Breeders in larger social groups of two cooperative bird species do
appear to show lower reproductive variance under some circumstances
(Rubenstein, 2011; Koenig & Walters, 2015) but whether such patterns reflect
effects of helping on environmentally-induced variance in reproductive success is
unknown.

31
White-browed sparrow-weavers live in extended family groups in which a single
dominant female (hereafter the ‘mother’) and male completely monopolise within-
group reproduction and 0-10 non-breeding subordinates (hereafter ‘helpers’) of
both sexes help to feed the dominants’ nestlings (Figure 1a; Harrison et al., 2013a).
Helping behaviour has the potential to yield indirect fitness benefits, as helpers are
typically offspring of the dominant pair, leaving them closely related to the offspring
that they help to rear (Figure 1b). As this species’ environment is characterised by
highly unpredictable rainfall patterns (see Supplementary Information A & B and
Figure S1 for the high inter-annual rainfall variation and low temporal auto-
correlations for our Kalahari study population), helping could well yield indirect
fitness benefits in part via reductions in environmentally-induced variance in the
reproductive success of related breeders, as envisaged under altruistic bet-hedging
(Kennedy et al., 2018).
While helpers of both sexes feed nestlings, female helpers do so at substantially
higher rates than males (Figure 1c). Accordingly, partitioning natural variation in
helper numbers into its within- and among-mother components (to isolate the
effects of within-mother variation in helper number from the potentially
confounding effects of variation among mothers or their territories; see methods),
revealed that within-mother variation in female helper number strongly positively
predicts the total rate at which her brood is fed (Figure 1d, Table S1). By contrast,
within-mother variation in male helper number did not predict total provisioning
rate (Table S1). Indeed, the experimental removal of helpers from wild social groups
confirmed that the presence of female helpers has a causal positive effect on total
provisioning rate (Figure 1e), while the same is not true for male helpers (Table S2).

32
Figure 1. Helping and its impact on offspring provisioning. (a) Frequency of
female and male helpers in 400 broods in 36 social groups. (b) Genetic relatedness
of helpers to the dominant (breeding) pair and their offspring (see methods). (c)
Female helpers feed nestlings at a significantly higher rate than male helpers (linear
model of log-transformed provisioning rate: estimate for sex effect (± SE) = 0.17 (±
0.02); ΔAIC on removal of helper sex predictor = 52.43). (d) Within-mother variation
in female helper number (Δ female helper number) predicted total brood
provisioning rate (Table S1). (e) Experimental removal of female helpers reduced
total provisioning rate (relative to preceding day) significantly more than a non-
removal treatment (Table S2). Grey dots show raw data. Mean model predictions (±
SE) are shown in d and e.
33
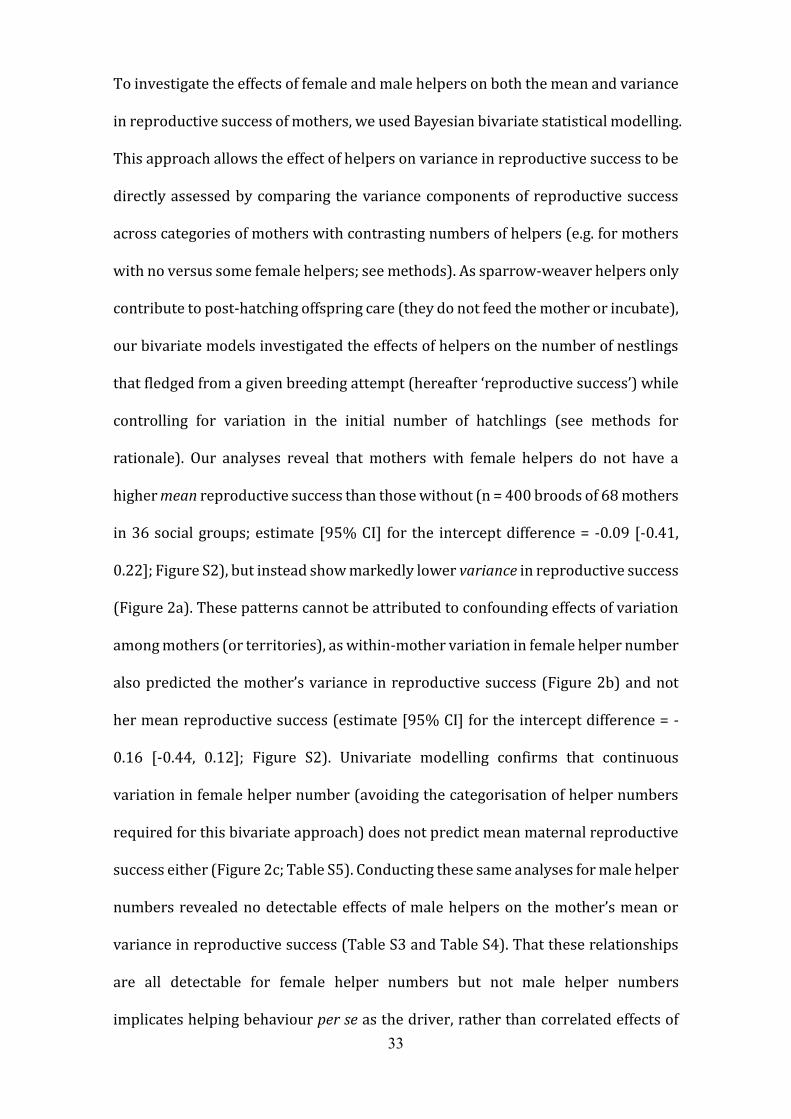
To investigate the effects of female and male helpers on both the mean and variance
in reproductive success of mothers, we used Bayesian bivariate statistical modelling.
This approach allows the effect of helpers on variance in reproductive success to be
directly assessed by comparing the variance components of reproductive success
across categories of mothers with contrasting numbers of helpers (e.g. for mothers
with no versus some female helpers; see methods). As sparrow-weaver helpers only
contribute to post-hatching offspring care (they do not feed the mother or incubate),
our bivariate models investigated the effects of helpers on the number of nestlings
that fledged from a given breeding attempt (hereafter ‘reproductive success’) while
controlling for variation in the initial number of hatchlings (see methods for
rationale). Our analyses reveal that mothers with female helpers do not have a
higher mean reproductive success than those without (n = 400 broods of 68 mothers
in 36 social groups; estimate [95% CI] for the intercept difference = -0.09 [-0.41,
0.22]; Figure S2), but instead show markedly lower variance in reproductive success
(Figure 2a). These patterns cannot be attributed to confounding effects of variation
among mothers (or territories), as within-mother variation in female helper number
also predicted the mother’s variance in reproductive success (Figure 2b) and not
her mean reproductive success (estimate [95% CI] for the intercept difference = -
0.16 [-0.44, 0.12]; Figure S2). Univariate modelling confirms that continuous
variation in female helper number (avoiding the categorisation of helper numbers
required for this bivariate approach) does not predict mean maternal reproductive
success either (Figure 2c; Table S5). Conducting these same analyses for male helper
numbers revealed no detectable effects of male helpers on the mother’s mean or
variance in reproductive success (Table S3 and Table S4). That these relationships
are all detectable for female helper numbers but not male helper numbers
implicates helping behaviour per se as the driver, rather than correlated effects of

34
group size (that could arise independent of helping), as females helpers help at
substantially higher rates than males (Figure 1c) and only female helpers have
causal additive effects on the group’s total provisioning rate (Figure 1d,e). Our
inability to detect a helper effect on the mean reproductive success of mothers
cannot be attributed to correlated variation in maternal egg investment concealing
a helper effect (sensu Russell et al., 2007a), as no mean helper effect is revealed when
variation in egg volume or hatchling mass are statistically controlled (Table S4).

35
Figure 2. Female helper effects on mean and variance in reproductive success
of related breeders. (a) Bivariate modelling revealed that mothers with some
female helpers experience lower variance in reproductive success than mothers
with no female helpers. (b) This result holds when we isolate the effect of within-
mother variation in female helper number (Δ female helper number). Panels a and
b show estimates of the residual variance in reproductive success for mothers
assisted by (a) ‘None’ or ‘Some’ female helpers, and (b) ‘Less’ or ‘More’ female
helpers than each mother’s mean female helper number within the data set. In both
cases we found a significant difference between the variance estimates for the two
helper number classes (difference estimate [95% CI]: (a) ‘None’–‘Some’ = 0.197
[0.002, 0.392]; (b) ‘Less’–‘More’ = 0.205 [0.025, 0.386]). Shaded areas reflect the
posterior distributions from two MCMC runs, and the points and error bars inside
the shaded areas reflect the median values and 95% CIs for the estimate of residual
variance. (c) Univariate modelling confirmed that continuous variation in female

36
helper number does not predict mean reproductive success either (Figure S4). Raw
data (transparent grey dots) and mean model predictions (± SE) are shown.
The above findings suggest that altruistic helping behaviour in sparrow-weaver
societies reduces variance in the reproductive success of related breeders. However,
‘altruistic bet-hedging’ refers to a more specific scenario in which altruism reduces
reproductive variance arising from unpredictable environmental variation
(Kennedy et al., 2018) and global comparative studies of the evolution of
cooperation in birds hypothesise that the relevant environmental variable is rainfall
(Jetz & Rubenstein, 2011; Griesser et al., 2017). To investigate whether sparrow-
weaver helpers specifically mitigate rainfall-induced variation in reproductive
success, we tested for the required statistical interaction between female helper
number and rainfall in a univariate model of nestling survival to fledging (see
methods). As rainfall could impact reproductive success over a range of timescales
in this arid-zone species, we first used a sliding window optimisation approach
(Supplementary information D; van de Pol et al., 2016) to establish that nestling
survival was most strongly predicted by the total rainfall that fell between 36 days
pre-hatching and 9 days post-hatching (Figure S3). Our modelling then confirmed
that the statistical interaction between the total rainfall during this window and
female helper number strongly predicts nestling survival (Figure 3a; Table S5), as
expected under altruistic bet-hedging. The number of female helpers positively
predicted nestling survival in dry conditions but negatively predicted nestling
survival in wet conditions, an interaction that leaves mothers with markedly lower
rainfall-related variation in nestling survival when they have more female helpers
(Figure 3a). Again, this pattern holds when we isolate the effects of within-mother
variation in female helper number (Figure 3b; Figure S6). Male helper numbers, by

37
contrast, did not predict nestling survival, either in isolation or via interactions with
rainfall (Table S6).
Figure 3. Helpers mitigate rainfall-induced variation in reproductive success.
(a) While rainfall-induced variation in nestling survival to fledging is high in the
absence of female helpers (zero on the x axis), mothers with more female helpers
experience lower rainfall-related variation in nestling survival because nestling
survival is strongly predicted by an interaction between rainfall and female helper
number: under dry conditions nestling survival increases with increasing female
helper number, while in wet conditions it decreases with increasing female helper
number. This interaction was apparent both (a) when modelling the effects of
population-level variation in female helper number and (b) when isolating the effect
of within-mother variation in female helper number (Δ Female helper number).
Rainfall and Female helper number (or Δ Female helper number) were not
correlated (Pearson’s correlation, r [95%CI] = 0.006 [-0.093, 0.104]). The plots
present mean model predictions ± SE (thick coloured lines and shaded area
respectively) for broods that experienced either (i) no rainfall during the focal
rainfall window (‘Dry’, orange), (ii) a medium level of rainfall (‘Medium’, light blue,
the prediction for total rainfall = 47.5 mm, the lower tertile of the non-zero total
rainfall distribution) or (iii) a high level of rainfall (‘Wet’, dark blue, the prediction
for total rainfall = 115 mm, the upper tertile of the non-zero total rainfall
distribution).

38
This striking interaction suggests that the apparent negative effect of female helpers
on variance in maternal reproductive success revealed by our bivariate analyses
(Figures 2a,b) may indeed arise in part from helpers reducing rainfall-induced
variance in reproductive success, as envisaged by global comparative studies of the
evolution of cooperation in birds (Jetz & Rubenstein, 2011; Griesser et al., 2017). To
demonstrate that this is the case, we then integrated rainfall (in the focal window)
into our original bivariate models as an additional fixed effect predictor. This
confirmed that rainfall has a stronger effect on reproductive success in groups with
fewer female helpers than in groups with more female helpers (Figure S4; as
expected given Figure 3). Allowing for this effect reduces the residual variance in
reproductive success for mothers with fewer female helpers, without affecting the
residual variance for mothers with more female helpers (Figure S4), thereby
accounting in part for the overall effect of female helpers on residual reproductive
variance shown in Figure 2.
Together, our findings strongly suggest that helping behaviour in sparrow-weaver
societies reduces variance in the reproductive success of related breeders arising
from unpredictable environments, as envisaged for an altruistic bet-hedging
strategy (Kennedy et al., 2018), and that it does so in part by mitigating rainfall-
related reproductive variance, as hypothesised by global comparative analyses of
the evolution of cooperation in birds (Jetz & Rubenstein, 2011; Griesser et al., 2017).
While selection for helping as an altruistic bet-hedging strategy (sensu Kennedy et
al., 2018) need not arise solely from beneficial effects on the reproductive variance
of relatives, the absence here of a detectable net effect of helpers on the mean
reproductive success of relatives highlights the likely importance of such variance
compression effects in this species. Indeed, while the above analyses focus

39
specifically on helper effects on nestling survival to fledging, additional analyses
reveal that helpers also have no detectable effect on the mean clutch size or re-
clutching rate of mothers (Chapter 3) or on the apparent reproductive value of
fledglings (i.e. alternative routes through which helping could yield indirect fitness
benefits; Table S7). Helping might also yield direct fitness benefits to helpers, which
could act in concert with kin selection to favour helping in this species. The most
credible mechanism through which helping could yield direct benefits across the
social vertebrates is if it increases group size by improving offspring survival or by
increasing breeders’ reproductive rate, as helpers may stand to benefit from living
in a larger group (‘group augmentation’ hypothesis, Kingma et al., 2014). It is
notable then that helping in sparrow-weaver societies actually does not improve
offspring survival on average (Figure 3) or reproductive rates (Chapter 3), and so
will not tend to augment group size. Helpers do appear to reduce the variance in
offspring survival though (Figure 2a, b), highlighting the possibility that helping
yields hitherto unexplored direct fitness benefits that also arise via bet-hedging
processes (i.e. helping may reduce rainfall-related variance in the helper’s future
group size).
The lack of a net effect of helpers on the mean reproductive success of relatives
arises because the apparent positive effect of helping in dry conditions is countered
by a surprising negative effect of helpers under wet conditions (see Simons, 2009,
2011 for a discussion about bet-hedging and fluctuating selection). We suspect that
this negative effect reflects a change in the primary cause of nestling mortality from
starvation under dry conditions (which would be mitigated by the causal positive
effects of female helpers on provisioning rate; Figure 1) to nest predation under
wetter conditions (which could conceivably be exacerbated when more helpers are

40
visiting the nest). While nest predators (snakes, mongooses, birds and ants, Wood &
Young, 2019) rarely leave signs of their actions in our study population, analyses of
the subset of cases in which the circumstances of nestling mortality do suggest a
particular cause of death are consistent with this view. With increasing rainfall, the
probability of nestling starvation decreases, while the probability of whole-brood
predation increases (Figure S5). The overall negative effect of rainfall on nestling
mortality suggests that the former effect typically dominates (Figure S3).
Theoretical treatments of bet-hedging typically envisage that selection for strategies
that reduce reproductive variance arises because additional offspring contribute
disproportionately to relative fitness when competitors are producing few (Starrfelt
& Kokko, 2012; Kennedy et al., 2018) (i.e. that helping’s positive effect on offspring
production in ‘dry’ conditions will outweigh its negative effect on offspring
production in ‘wet’ conditions when expressed in relative fitness terms [Kennedy et
al., 2018], in Figure 3). While such a mechanism is certainly plausible here, ecological
processes will also impact selection for variance reduction strategies. For example,
the ability to produce offspring in harsh conditions could have even stronger effects
on relative fitness if harsh conditions also reduce adult survival. Biological traits of
the species will also have an impact on the importance of selection for variance
reduction strategies (e.g. iteroparity – (Kennedy et al., 2018).
Our findings also highlight an important general point: whenever helping behaviour
shows the properties of altruistic bet-hedging, the extent to which (kin) selection for
helping arises via helper effects on the mean versus the variance in reproductive
success of relatives will be extraordinarily sensitive to environmental conditions.
This is because helping behaviour can only compress environmentally induced

41
variance in reproductive success by having different effects on performance in
different environments (e.g. see Figure 3). Where this is the case, changes in the
relative frequency of these environments over space (e.g. a species range) or time
(e.g. under historical and future climate change) will impact whether selection for
helping arises principally from reproductive variance compression or instead from
classical net effects of helping on the mean reproductive success of relatives. For
example, white-browed sparrow-weavers range throughout the semi-arid regions of
East and Southern Africa, and while rainfall throughout the region is unpredictable,
there is appreciable spatial variation in both its mean and variability (Figure 4).
Selection for helping behaviour in this species could therefore currently arise from
(i) classical net positive effects of helping on mean reproductive success in more
consistently arid regions (as helping improves offspring survival in dry
environments; Figure 3), coupled with (ii) weaker positive selection arising more
from reproductive variance compression (as envisaged under altruistic bet-hedging)
in the more variable and intermediate conditions currently experienced at our
Kalahari study site (‘X’ symbol in Figure 4). Selection could also conceivably act
against helping behaviour in more mesic parts of the species’ range. Indeed, such a
pattern of positive selection for helping in both dry and variable environments
concords well with the frequent finding in large-scale comparative analyses that
cooperatively breeding species are globally associated with both arid and
unpredictable rainfall regimes (Cornwallis et al., 2017; Griesser et al., 2017; Lukas &
Clutton-Brock, 2017). Recognising the potential for marked temporal variation in
climatic conditions over evolutionary timescales also highlights the difficulty of
evaluating the role of reproductive variance compression in the evolutionary origins
of helping in the cooperative breeders observed today (Cockburn & Russell, 2011;
Koenig, 2017). Our findings do nevertheless highlight that the evolutionary history

42
of helping could well have been characterised by fluctuations in the relative
importance of classical net effects of helping on the mean reproductive success of
relatives (Hamilton, 1964) and the reproductive variance compression effects more
recently envisaged under altruistic bet hedging (Kennedy et al., 2018).

43
Figure 4. Environmental variation across the white-browed sparrow-weaver’s
range. Approximate range of the white-browed sparrow-weaver (area within the
solid black line) in Africa, showing (a) annual rainfall (mm) and (b) coefficient of
variation in weekly rainfall (%). Across its range, the species experiences a wide
range of rainfall regimes. As helping has rainfall-dependent effects (Figure 3), the
extent to which selection on helping at any given locality arises from effects on the
reproductive variance of breeders versus classical net positive effects on the mean
reproductive success of breeders will likely vary across the species range. Species
distribution drawn based on GBIF records (www.gbif.org, accessed on 23/01/2019).
‘X’ shows the location of our study population. Climatic data extracted from
WorldClim v2 (Fick & Hijmans, 2017).

44
2.2. Methods
2.2.1. Study species, population and general field monitoring
White-browed sparrow-weavers live in semi-arid regions of South and Southeast
Africa. Our study population is located in Tswalu Kalahari Reserve in the Northern
Cape Province of South Africa (27°16’S, 22°25’ E). Data were collected continuously
from September/October to April/May, coinciding with the wet season, between
2007 and 2016 (nine consecutive field seasons). Approximately 40 social groups of
white-browed sparrow-weavers were monitored every year, each one inhabiting a
small territory in an area of approximately 1.5 Km2 (Harrison et al., 2014). White-
browed sparrow-weaver social groups contained a dominant pair and a varying
number of subordinate individuals of both sexes, ranging from none to ten
subordinate birds (Harrison et al., 2013; Lewis, 1982; Figure 1a). Individual
dominant pairs and social groups were easily monitored and distinguished in the
field as all group members foraged together, engaged in weaving, territory defence
and roosted together in individual woven chambers in a single tree or cluster of trees
close to the centre of their territory (Harrison et al., 2013a; Walker et al., 2016). All
birds in the population were fitted with a single metal ring and three colour rings for
identification from the beginning of the study period (under SAFRING license 1444).
Every white-browed sparrow-weaver group contained a single dominant
(reproductive) female and male (Harrison et al., 2013a). Previous studies carried out
in the same population of white-browed sparrow-weavers showed that only
dominant females laid eggs (i.e. there is no in-group or extra-group maternity;
Harrison et al., 2013a). Genetic analysis confirmed that nests always contained eggs
from a single female and that that individual could be readily identified as the
dominant female using behavioural observations (Harrison et al., 2013a). Dominant

45
males commonly gained paternity in their social groups, with a low percentage of
extra-group, but not extra-pair within-group, paternity (Harrison et al., 2013a).
Dominant pairs were easily identified in the field because they displayed a distinct
set of behaviours (Walker et al., 2016). In every group, dominant female and male
are in very close association with each other and these two birds spend much time
foraging and duetting together (Walker et al., 2016). Dominant and subordinate
individuals are, therefore, easily identified in the field. The sex of every individual
could be determined after the first six months of life as our study population present
beak colour sexual dimorphism (Leitner et al., 2009).
White-browed sparrow-weaver groups were monitored every one or two days to
detect new clutches. Once a new clutch was found, nests were checked daily until the
clutch had been completed (i.e. when no new eggs appeared in two consecutive nest
checks). Then, clutches were checked eight days after the first egg was laid to
confirm successful progress of the incubation. Following this latter mid-incubation
check, clutches were checked daily starting 15 days after the first egg was laid until
the fate of every egg was determined (hatched or failed). Nestlings were monitored
in the nest every four days, ringed at age 13 and followed until their 17th day of life.
After the nest check on day 17th, we discontinued nest checks to avoid premature
fledging. Behavioural observations as well as targeted catching and ringing sessions
were carried out in the population and we determined successful fledging for
individual nestlings if they were observed or caught outside their nests. Fledglings
do not disperse in their first six months of life but remain in their natal territories
where they typically become subordinate individuals.

46
White-browed sparrow-weaver group composition was assessed every week
throughout every field season. Social groups were observed at least once every week
and birds were identified on the basis of their colour-ring combination. Additionally,
birds were routinely caught while roosting at night and this information was also
used to define group memberships. For every brood in our analysis, number of male
and female helpers were calculated based on field observations over a 24-day period
spanning from egg laying to the predicted fledgling date. Young individuals hatched
in a given season, and whose contribution towards provisioning offspring is very
small (Lewis, 1982a), were not considered as helpers until they reach their second
season of life and were, therefore, at least six month old.
When entire broods or individual nestlings disappeared from nests, we determined
the most likely cause of death between predation or starvation as follows:
• Predation:
I. Presence of signals of predation. Mongooses and goshawks are
common predators of white-browed sparrow-weaver broods and
they leave visible damage to the nest structure.
II. In the absence of nest damage and in broods larger than one nestling,
when every nestling disappeared in the same time interval (e.g.
between two consecutive nest-checks, within less than four days).
Snakes are also a potential predator of weaver nests (Spottiswoode,
2007). They predate whole broods but normally do not leave signs of
damaged in the nest.
• Starvation:
I. In broods larger than one nestling, when individual nestlings died (most
often the lightest individual) leaving another sibling alive.

47
II. In single-nestling broods, when field observations suggested starvation
as the most probable cause of death; e.g. finding a nestling dead inside the
nest when both dominant adults were alive and holding social dominance.
As our ability to categorise broods between these two causes of death depends on
brood size, we restricted our analysis of the temporal variation of starvation versus
predation to broods of two nestlings (n = 113). Then, we fitted a binomial
generalised linear mixed model to the probability of predation (value = 1) versus
starvation (value = 0), controlling for among-mother and among-season variation
(included as random effect intercepts). Rainfall, as calculated for the analysis of
fledgling success was included as fixed predictor.
Out of 764 nestlings detected in the field with ± 4 days of uncertainty in their
hatching date, 374 survived to fledging and 48 of them (12.83%) became dominant
individuals between October 2007 and April 2016. We modelled the probability of
dominance acquisition as a binomial trait using a GLMM including clutch ID, year
and dominant female ID as random terms. Additionally, we included as fixed effect
predictors: the numbers of female and male helpers, brood size, total rainfall (as a
linear and quadratic terms - see sliding window analysis) and the interactions
between female and male helper number and rainfall.
2.2.2. Provisioning behaviour
Provisioning behaviour was recorded for breeding attempts between the 2007 and
2016 (180 broods in 35 social groups and a total of 459 days of recordings). We
collected provisioning behaviour data using video-recordings between 8 and 13
days after the first egg of a given clutch hatched. Video recordings were watched
using VLC media player and data were extracted from every provisioning event: time

48
of the feed, duration of the feed, feeder sex (based on beak coloration, Leitner et al.,
2009), feeder identity based on a unique vent pattern and colour-ring combination,
and feeder social rank (dominant or subordinate). For every recorded breeding
event, we always followed a standardised protocol: at least five days before data
collection started, we (i) caught and marked the vent of every bird in the group apart
from the dominant female using black hair dye to aid video identification and (ii)
deployed tripods in the field to acclimatise the birds to its presence. On recording
days, video cameras were set up in the morning at standard times that tracked
monthly changes in sunrise. Provisioning behaviour was recorded for approximately
three hours per brood and day. Within-nest cameras have confirmed that all nest
visits in which the birds are not conspicuously carrying grass entail the visiting bird
carrying a single food item to the nest and delivering it to the chicks (Walker, 2015).
No visits were non-provisioning visits and in no cases were visiting birds observed
to eat the delivered food item themselves (Walker, 2015).
2.2.3. Field removal experiment
To investigate the causal link between the number of helpers in a given group and
the total feeding rate that the offspring received, we carried out a field removal
experiment in February and March in 2017. During this period, broods were
included in the experiment and allocated to a ‘removal’ or ‘control’ treatment
sequentially once a focal brood reached 10 days after hatching. Provisioning
behaviour was monitored in every brood following the standard protocol (see
above).
On the last day of provisioning recordings (day 12 or 13 of the breeding attempts, N
= 18 and 5 broods respectively), we caught every subordinate individual in ‘removal’
broods from their sleeping chambers within one hour before sunrise time. White-

49
browed sparrow-weavers roost in individual chambers at night and catching
individuals while roosting is readily done with tailored catching poles. Dominant
males were identified from underneath the roost by their vent marks and were not
caught. Dominant females, who roosted inside nests, were not disturbed either.
Caught subordinate birds were kept in individual cages following approved ethical
guidelines until the end of provisioning data collection 3-4 hours after sunrise. Every
caught subordinate bird was released back in their territories. Field observations
confirmed that these birds did always establish back in their territories immediately
or within a few hours after release. Subordinate birds in ‘control’ broods were not
caught and caged. However, the experimenter (PC-L) walked underneath the
roosting tree without catching the birds in order to expose dominant individuals in
‘control’ broods to the same disturbance as in ‘removal’ broods.
We then investigated the change in total feeding rate between the day of
experimentation and the previous provisioning day. Brood size did not change
across sequential days within treatments or between treatments (linear model:
Ncontrol = 16, Nremoval = 13, t = 0.67, df = 26.81, p = 0.510). Likewise, provisioning
behaviour was recorded for similar durations within breeding attempts (linear
model: t = -0.64, df = 27, p = 0.528) and between experimental groups (linear model:
t = -0.33, df = 27, p = 0.745).
Using these experimental data, we investigated the effect of female helpers on total
provisioning rates. We compared the change in total feeding rate pre- and post-
manipulation between groups with female helpers not caught (n = 14) and groups
where all female helpers had been removed (n = 9). Likewise, we isolated the effect
of male helpers on total provisioning rates by comparing the change in total feeding

50
rate between groups with male helpers present (n = 9) and groups were male
helpers were experimentally removed (n = 9).
2.2.4. Rainfall data
Daily rainfall data were collected from two rainfall gauges located in the west (27°
16’ 58.9’’ S, 22° 23’ 02.1’’ E) and east (27° 17’ 42.1’’ S, 22° 27’ 34.9’’ E) of our study,
7.60 Km apart from each other. These two rainfall measurements were highly
correlated during the study period (Pearson’s product-moment correlation: r =
0.875, 95% CI = 0.867 – 0.882, df = 3,347). We, therefore, calculated average daily
values across both gauges and used this as a proxy for rainfall conditions at our study
site.
2.2.5. Statistical analysis
2.2.5.1. Subordinate contributions to provisioning offspring
Total feeding rate to the brood was analysed using linear mixed models including
date of observation, social group ID and brood ID as random intercept terms.
Number of female helpers, number of male helpers, brood age and brood size were
included as fixed effect predictors. For the removal field experiment, we analysed
the change in feeding rate caused by our experimental removal of helpers. We tried
to explain variation in that change associated with the manipulation (removal of all
female or male helpers) and the age of the brood using linear mixed models. Social
group ID was included as a random intercept term.

51
2.2.5.2. Effects of female helper number on variance and mean of reproductive
success
To investigate the effects of female helpers on the variance of reproductive success
as well as on its mean, we fitted a bivariate linear mixed model in which the response
variables where:
1. Number of nestlings that fledged from breeding attempts with no
female helpers (185 broods, 63 dominant females)
2. Number of nestlings that fledged from breeding attempts with some
female helpers (215 broods, 51 dominant females).
46 dominant females had broods across both response terms. We carried out an
additional analysis using a bivariate model that contained two response terms as
(excluding breeding females with only one breeding event and, therefore, no within-
mother variation in the number of female helpers, n = 388):
1. Number of nestlings that fledged from breeding attempts in which the
within-mother number of female helpers was lower or equal to the
within-mother mean (227 broods, 56 dominant females).
2. Number of nestlings that fledged from breeding attempts in which the
within-mother number of female helpers was higher than the within-
mother mean (161 broods, 49 dominant females – all of which also
appeared in the data set for the first response).
The last model aimed to investigate if differences in variance components found in
our first analysis were due to within-mother variation in the number of female
helpers.

52
In every case, bivariate models contained an independent intercept for each
response term as well as independent random effect (co)variances for breeding year
(season) and mother ID (i.e. dominant female ID). We also allowed for response-
specific residual variances (i.e. within mother variance in number of fledglings) that
informed us about within-mother variance in reproductive success across different
response terms. In these models, we controlled for number of hatchlings; thus,
investigating the number of fledged nestlings conditional upon hatching, phase in
which we show that helping females are important to rear offspring.
We fitted bivariate linear mixed models using the ‘MCMCglmm’ R package (Hadfield,
2010), running two independent MCMCs of 210,000 iterations with an initial burn-
in period of 10,000 iterations and a thinning interval of 100 iterations. MCMC
effective sample size for every model estimate always higher than 1,000. We
assessed the convergence of MCMC models by visualising MCMC traces and
calculating the Gelman-Rubin diagnostic (upper confidence interval < 1.01 in every
case). Statistical differences between model coefficients and variance components
were extracted calculating the 95% credible interval for the difference between
pairs of estimates. Default priors were used for fixed effects (Normal distribution, µ
= 0, σ2 = 108) and residual variances (inverse Wishart, V = 1, nu = 0.002). Parameter
expanded priors were used for random (co)variances with µα = 0 and σ2α = 252).
2.2.5.3. Sliding window approach for rainfall effects on proportion of nestlings
that fledged
White-browed sparrow-weavers can breed continuously during the wet season in
the Northern Cape of South Africa, between September and April, and can show high
among-female asynchrony in laying dates. Hence, we used a relative sliding window

53
approach to find the rainfall windows most associated with the proportion of
nestlings that fledged from individual breeding attempts. Personal observations
(Capilla-Lasheras & Young personal observations) suggested that rainfall was linked
with reproduction in white-browed sparrow-weavers in a short time scale (Lewis,
1982a). We investigated relative sliding windows backdating up to 80 days from the
predicted fledging date (18 days after hatching). Sliding rainfall windows were
inspected in one-day intervals. To decrease the likelihood of false positive results,
that are more probable for very short windows, only sliding windows longer than
four days were considered.
For each sliding window, total amount of rainfall was calculated and used as a rainfall
index. Rainfall index was then included as a predictor in an appropriate statistical
model (see below for baseline model specifications) to test the importance of a given
rainfall window. The AIC of models including rainfall index was compared to the AIC
of a baseline model not containing this environmental predictor (but keeping a
similar model structure), yielding a ΔAIC value (‘AIC support’). We investigated
linear and quadratic rainfall effects. For each of these model structures (linear and
quadratic), the sliding window protocol was carried out independently.
Several factors may compete with rainfall to explain variation in fledging success.
We, therefore, built a baseline model that included, as fixed terms: number of female
helpers, number of male helpers, brood size, number of female helpers x Brood size,
number of male helpers x Brood size; and, as random effects: year and mother ID.
To assess the likelihood of a false positive result regarding the rainfall window in the
quadratic model structure (model structure with highest rainfall support), we
carried out 10 randomisations of the data set. In each randomisation, the biological

54
reference date (predicted fledging date) for the sliding window approach was
randomised by re-shuffling – similar to the approach implemented in the R package
‘climwin’ (Bailey & van de Pol, 2016). For each randomisation, the sliding window
protocol was fully applied and the AIC support for the top-performing rainfall
window recorded. This analytical routine was implemented using an customised R
script ‘Sliwin_routine.R’ available at:
https://github.com/PabloCapilla/WeaverTools (inspired by the R package ‘climwin’
v1.2.0, Bailey & van de Pol, 2016).
2.2.5.4. Effects of rainfall and the number of female helpers on the proportion of
nestlings that fledged
After applying the sliding window approach, we fitted a binomial mixed model to
investigate the relative contribution of variables explaining variation in the
proportion of nestlings that fledged (‘nestling survival’). The initial (‘global’) model
contained every fixed and random effect in the baseline sliding window model and
total amount of rainfall (‘rainfall’ hereafter) calculated for the most supported
sliding window. We also included the interactions between rainfall and number of i)
male and ii) female helpers. This global model, incorporating every variable of
interest, was not over-dispersed (Residual deviance = 668.82, df = 383) and a
simulation of scaled model residuals, using the R package ‘DHARMa’ (Hartig, 2018),
suggested a uniform distribution of model residuals (500 model simulations,
Kolmogorov-Smirnov Test, D = 0.057, p = 0.156). The global model was, then,
subjected to AIC model selection (see more details below).

55
2.2.5.5. Confounding effect of territory quality: within-mother centering
A common concern in studies of cooperative species is that group size can be
associated with territory quality, creating a spurious correlation between
reproductive output and group size (both of which can be positively associated with
territory quality) (Cockburn, 1998). We addressed this concern in three different
ways:
1. Showing experimental evidence for a positive causal link between the
number of female helpers and the total provisioning rate to the offspring
2. Excluding young individuals from our calculations of the number of male and
female helpers
3. Carrying out our analyses using number of helpers and then partitioning this
variable to untangle effects born of within-mother and among-mother
variation in number of helpers, Δ number of helpers and µ number of helpers
respectively (van de Pol & Wright, 2009). Within-mother (Δ) number of
helpers accounts for variation in number of helpers within-mother and per
territory and, therefore, its effects cannot be attributed to maternal or
territory quality, which operates at the among-mother level. We carried out
within-mother centering per territory, thus, simultaneously accounting for
among-territory and among-dominant female differences in quality. Within-
group centering was carried out using a R function, d_centering, available
here: https://github.com/PabloCapilla/WeaverTools
2.2.5.6. General modelling approach
All statistical models and visualisations were carried out in R (version 3.5.1 to 3.6.1.,
R Core Team, 2019). The importance of single predictors and statistical hypotheses
(e.g. a given combination of model predictor) in univariate models was assessed

56
using an information-theoretic (IT) approach. Starting from a global model,
containing every predictor of interest (as described above), simpler combinations of
fixed predictors were fitted to the data and ranked based on Akaike’s Information
Criterion (AIC, Burnham & Anderson, 2002). Linear mixed models compared by AIC
were fitted using maximum likelihood (ML). ΔAIC values were then calculated for
every model (i.e. AIC difference between a given model and the best model – thus,
ΔAIC for the best model equals 0).
We gave further consideration to models within a ΔAIC value of six (Richards, 2008)
and subsequently reduced this Δ6 top model set by applying the ‘nesting rule’
described by Richards (2008). This rule aims to avoid the retention of overly-
complex models that do not improve model fit by discarding models that are more
complex versions of simpler (nested) models with lower AIC support. Adding
variables with no or little explanatory power to a well-supported model is known to
decrease AIC by less 6 points, therefore, being retained in our Δ6 top-model set
(Arnold, 2010). The nesting rule tries to reduce the chance of considering models
with such un-informative variables. When quadratic terms were included in a given
model, linear coefficients were always present. Every model set included intercept-
only models. Unless otherwise stated, model selection tables show standardised
model coefficients (mean centered and scale to one standard deviation) to aid
comparison of effect sizes across predictors (Gelman & Rubin, 1992). In model
selection tables each line presents a model from the top model set (within ΔAIC =6
of the ‘top model’ [the model with the lowest AIC]), while each of the fixed effect cells
presents the estimate for that fixed effect in that model (or is blank if the focal fixed
effect was absent from that model).

57
Chapter 2: Supplementary Material
Supplementary Information Chapter 2
A – Rainfall conditions in our study site are highly variable
Rainfall conditions in our study site in the Kalahari Desert of South Africa were
highly variable both within and among years. Average total amount of rainfall
between 2007 and 2016 was 357 mm (standard deviation = 153 mm) with a
minimum of 194 mm in 2007 and a maximum of 670 mm in 2011. The among-year
coefficient of variation in total rainfall was 42.86%, a value 5 and 39% higher than
those reported by Koenig and Walters (2015) (CV = 40.8%) and Rubenstein (2011)
(CV = 26.09%). Among-year variation in rainfall conditions during the wet season
(October to April) was also high, with average values for years ranging between a
maximum of 585 mm in 2011 to a minimum of 174 mm in 2015 (mean ± standard
deviation among years: 321 mm ± 137 mm). Within years, January was the wettest
month (mean ± sd: 3.35 mm ± 11.4 mm) and August the driest (mean ± sd: 0.05 mm
± 0.45 mm), with monthly coefficients of variation ranging between 339% in January
to 1,231% in July.
B – Rainfall cannot be predicted based on current conditions
Auto-correlation analyses strongly suggested that current rainfall conditions did not
provide information about future rainfall (Figure S1). The correlation between the
amount of rainfall on a given day was very weakly correlated with that of the
previous day (r = 0.068). Allowing for auto-correlation lags of up to 1,095 days (three
years), 0.12 was the highest rainfall correlation found, for a time lag of 1,042.

58
C – Subordinate contributions to provisioning offspring
We analysed 180 broods between 2007 and 2016. On average, provisioning data
were collected 2.55 days for every brood.
Within-mother and among-mother number of female helpers was positively
associated with total provisioning rate to the offspring (controlling for brood age
and brood size, whose effect on total provisioning rate was also positive; Table S1).
Within-mother variation in number of female helpers appeared in every model with
ΔAIC < 8.86, providing strong statistical support for a positive effect of the number
of female helpers on total provisioning rates (Table S1). Likewise, total provisioning
rate in groups that were, on average, large were higher than the rate of small groups
(‘µ Number of female helpers’ and ‘µ Number of female helpers’, Table S1).
Effect sizes for within-mother number of male helpers were estimated as three times
smaller than the size of the effect of within-mother number of female helpers and
did always receive much less statistical support that the terms for female helpers
(Table S1). Including within-mother number of male helpers (‘Δ male helper
number’) in the top model shown in Table S1 did not change the estimates of within-
or among-mother number of female helpers. Carrying out a complementary analysis
that did not separate within- and among-group effects of number of helpers, we
found similar results, with strong support for a positive effect of the number of
helping females.
Results from the removal field experiment, indicated that temporarily removing the
contribution of female helpers towards provisioning offspring caused a significant

59
decrease of total provisioning rate compared to a previous day of provisioning. This
factor was associated with an increase in AIC of 2.66 (Table S2). To further support
the differential effect of female and male helpers, we repeated the analysis of the
field experiment. This time, we compared total provisioning rate of groups where
every male helper was removed and groups with subordinate male helpers present.
The removal of male helpers did not impact total provisioning rate to the offspring
(Table S2b). For the experimental manipulation of the number of male helpers, the
intercept-only model scored the lowest AIC, with experimental treatment (i.e.
removal of male helpers) appearing in the model set after ΔAIC > 1.43 and not being
retained after application of the nesting rule (Table S2b).
D - Rainfall effects on the proportion of nestlings that fledged
Total amount of rainfall between 36 days prior hatching and 9 days after hatching
strongly predicted the proportion of nestlings that fledged following a quadratic
relationship (Figure S3). A quadratic rainfall relationship between rainfall and
nestling survival to fledgling was much more supported by the data than a simpler
linear association (the AIC for quadratic model was in both cases approximately 5
points lower than the AIC for the linear relationship).
None of the top performing models in ten randomisations of the data showed
stronger AIC support than the -29.07 AIC points achieved by the quadratic model
using the real data set (Figure S3b). The strongest AIC support across the ten
randomisations ranged from -21.91 to -11.65. The distribution of values for AIC
support within each randomisation also suggested that the likelihood of achieving -
29.07 AIC support was very unlike under random conditions (Figure S3b).

60
The most-supported rainfall model suggested that rainfall had a strong positive
effect on the proportion of nestlings that fledged between 0 mm and approximately
185 mm of total rainfall. Rainfall negatively impacted fledging success in broods
associated with more than 185 mm of total rainfall. Only a low percentage of broods
in our 9-season data set experienced such high rainfall conditions (14.75%, 59 out
of 400). Negative rainfall effects in our system are very likely due to heavy rainfall
events, causing nests to collapse. Field observations provided some evidence for this
hypothesis and our data also supported this idea. Maximum daily rainfall (i.e. highest
rainfall amount fell on a single day) during the nestling phase was higher for clutches
with total rainfall above 185 (mean ± standard error = 44.30 mm ± 3.0 mm) than for
those broods with total rainfall below 185 mm (mean ± standard error = 10.30 mm
± 0.78 mm; Mann-Whitney-Wilcoxon test, W = 17,381, p < 0.001). Brood failure due
to very intensive rainfall events is likely to be independent from helping effects on
offspring survival. In contrast, helping effects have been hypothesised to be
differentially important when environmental conditions are harsh versus benign (i.e.
dry versus moderately wet). Therefore, we focused our attention here on the range
of circumstances where rainfall had a positive effect on the proportion of nestlings
that fledged (341 clutches with total rainfall below 185 mm). However, note that an
additional analysis of the whole data set, including every rainfall level, yielded
similar results that when focusing on positive rainfall conditions, with the
interaction between the number of female helpers and rainfall appearing in the
model with lowest AIC (i.e. strongest statistical support).

61
Supplementary Figures Chapter 2
Figure S1. Temporal predictability of rainfall. (a) Rainfall auto-correlation for day
lags from 0 (present day) to 1,095 days (three years). Rainfall on a given day was not
correlated with that of previous days. The inset shows an amplification of the grey-
shaded area, representing lags of up to 60 days. (b) Rainfall auto-correlation
calculated over the window of 45 days in which rainfall was found to be most
associated with the proportion of nestlings that fledged (see results section on
rainfall effects on fledging success). The black line represents the average rainfall
auto-correlation across all broods.

62
Figure S2. Female helper effects on mean and variance of reproductive success.
Model estimates and 95% credible intervals from bivariate mixed models explaining
variation in reproductive success for mothers assisted by none or some helping
females (a, b) and higher or lower number of female helpers than the average for
individual females (c, d). The left-hand side column (a, c) shows estimated and 95%
CI for (co)variance components, whereas fixed term estimations are shown on the
right-hand column (b, d).

63
Figure S3. Sliding window analysis for the effects of rainfall on the proportion of
nestlings that fledged. (a) AIC support for rainfall models of varying start and stop
values (in days to hatching). Tile colour represents AIC support, the redder the tile,
the stronger the support for a given rainfall window. Dotted lines mark hatching
dates. (b) Density distribution of AIC support values for ten randomised sliding
window analyses. These density distributions illustrate AIC support values expected
by chance (i.e. assuming no relationship between total rainfall and nestling survival).
Each randomisation is shown in a different colour. The vertical red dashed line gives
the AIC support for the quadratic rainfall model fitted to the real data, a value that is
highly unlikely assuming no relationship between total rainfall and nestling survival.
(c) Predicted mean effect (± SE) of total rainfall over the best sliding window on the
proportion of fledged nestlings (i.e. ‘nestling survival’). Shaded area represents one
standard error around the mean prediction (black line). Raw data points are
illustrated as transparent grey dots with a slight offset in the y-axis to aid
visualisation of overlaying points.

64
Figure S4. Effect of rainfall on variance of reproductive success. Bivariate model
estimates and 95% credible intervals for fixed effects (a) and (co)variance
components (b) explaining variation in the number of fledged nestlings per brood.
The inclusion of the rainfall variable (triangles) in the baseline model (circles)
caused a reduction of residual variance for broods with a low within-mother number
of female helpers (‘less’ - purple) but did not change the variance estimation for
broods with a high within-mother number of female helpers (‘more’ - green),
suggesting that within-mother variance differences between large and small groups
are, in part, explained by their response to rainfall. Rainfall positively predicted
reproductive success, but this effect was stronger when within-mother number of

65
helper females was low compared to broods assisted a high number of helper
females (rainfall estimate for ‘less’ and ‘more’ number of female helpers [95% CI]:
‘less’ = 0.30 [0.18, 0.422], ‘more’ = 0.08 [-0.06, 0.22]. Difference between model
estimates, ‘more’ – ‘less’ [95% CI] = -0.22 [-0.41, -0.04]). Random effect co-variances
are illustrated in grey. Baseline and rainfall bivariate mixed models were fitted using
MCMCglmm in R (Hadfield, 2010) (for MCMC details see Methods).

66
Figure S5. Mortality analysis. Probability of an entire brood being predated (i.e. y-
axis value = 1) against the probability of starvation for nestlings (i.e. y-axis value =
0). When a mortality event occurred, there was an increasing probability of it being
a predation event as rainfall increased (GLMM: ΔAIC after dropping the ‘Rainfall’
predictor = 9.67; see methods). We did not detect an effect of helpers on the
probability of predation under any environmental conditions. The dashed black line
represents an equal probability of predation or starvation (y-intercept = 0.5)
whereas the blue line gives model predictions ± se. Black dots illustrate raw data
points (n = 113).

67
Supplementary Tables Chapter 2
Table S1. Analysis of the effect of the number of male and female helpers on total provisioning rate to the brood, following the partitioning of
variation in helper numbers in to its within- (Δ) and among-mother (µ) components (see methods). Models within ΔAIC of six of the top model
are shown. We found strong support for an effect of Δ female helper number but not Δ male helper number on total provisioning rate. k = number
of model parameters. w = Akaike’s weights. N = 459 provisioning days.
Intercept Δ Female helper
number Δ Male helper
number µ Female helper
number µ Male helper
number Brood Age Brood Size k AIC ΔAIC w
-0.006 0.212 0.087 0.094 0.342 9 1157.5 0 0.115
-0.008 0.210 0.113 0.334 8 1157.6 0.18 0.105
-0.005 0.193 0.077 0.089 0.098 0.356 10 1157.8 0.30 0.099
-0.008 0.192 0.074 0.118 0.347 9 1158.1 0.60 0.085
-0.006 0.215 0.109 0.339 8 1158.1 0.66 0.083
-0.004 0.221 0.092 0.093 -0.048 0.338 10 1158.2 0.75 0.079
-0.004 0.202 0.073 0.094 0.097 -0.045 0.351 11 1158.7 1.21 0.063
-0.007 0.218 0.114 -0.043 0.330 9 1158.7 1.22 0.063
-0.005 0.197 0.071 0.112 0.352 9 1158.7 1.23 0.062
-0.004 0.224 0.114 -0.049 0.335 9 1158.9 1.40 0.057
-0.006 0.200 0.071 0.118 -0.040 0.342 10 1159.2 1.78 0.047
-0.004 0.207 0.067 0.117 -0.046 0.347 10 1159.6 2.11 0.040
-0.009 0.213 0.327 7 1159.7 2.21 0.038
-0.009 0.197 0.066 0.339 8 1160.4 2.98 0.026
-0.008 0.220 -0.042 0.323 8 1160.8 3.30 0.022
-0.007 0.205 0.063 -0.039 0.334 9 1161.7 4.19 0.014

68
Table S2. Analysis of a helper removal experiment to test the effect of (a) female and (b) male helpers on total provisioning rate (feeds / hour)
to the brood. Model coefficients are not standardised to ease biological interpretation. (a) The change in total provisioning rate between two
consecutive days of experiment was 13 feeds / hour lower when all female helpers in a group were removed compared to when female helpers
were left in place (N = 23). (b) With a similar sample size (N = 18), we did not find statistical evidence for a causal effect of removing all male
helpers on the total provisioning rate (the removal treatment effect was not present in the top model). k = number of model parameters. w =
Akaike weights.
a Intercept
Brood age
Female helper removal treatment
effect k AIC ΔAIC w
3.668 -13.000 4 193.5 0 0.494 85.300 -6.700 -11.560 5 194.8 1.32 0.256 140.700 -11.570 4 196.2 2.66 0.131 -1.062 3 196.4 2.84 0.119
b Intercept
Brood age
Male helper removal treatment
effect k AIC ΔAIC W
-6.717 3 157.6 0 0.469 -3.563 -5.908 4 159.0 1.43 0.230 89.180 -7.930 4 159.2 1.64 0.207 80.240 -6.966 -5.174 5 160.8 3.20 0.095

69
Fixed effect estimates Lower Median Upper
Intercept (No MH) 0.481 0.659 0.843
Intercept (Some MH) 0.443 0.623 0.805
Number of hatchlings (No MH) 0.314 0.412 0.513
Number of hatchlings (Some MH) 0.246 0.329 0.408
Variance component estimates
Residual Variance (No MH) 0.437 0.535 0.661
Residual Variance (Some MH) 0.408 0.476 0.560
Season (No MH) 0.000 0.023 0.195
Season (Some MH) 0.011 0.044 0.205
Season Covariance -0.010 0.022 0.128
Mother ID (No MH) 0.000 0.007 0.059
Mother ID (Some MH) 0.000 0.003 0.032
Mother ID Covariance -0.014 0.000 0.014
Table S3. Male helper effects on mean and variance of reproductive
success (number of nestlings fledged, while controlling for variation in
the number of hatchlings). The posterior distributions are presented
for a bivariate model in which the two response terms correspond to
the number of fledged nestlings in broods fed by (i) no male helpers
(the ‘No MH’ estimates in the table; n = 137 broods) or (ii) some male
helpers (the ‘Some MH’ estimates in the table; n = 263 broods). There
was no evidence of a difference between the two contexts (i.e. with and
without male helpers) in either the mean reproductive success of
mothers (i.e. no difference in the ‘Intercept’ estimates; 95% CI for the
difference, ‘Some MH’ - ‘No MH’ = -0.228 to +0.154) or variance in
reproductive success of mothers (i.e. no difference in the ‘Residual
Variance’ estimates; 95% CI for the difference, ‘Some MH’ – ‘No MH’ = -
0.198 to +0.068). The model controlled for a positive effect of the
number of hatchlings in the brood (as a fixed effect) and for variation
in reproductive success among seasons and mothers (using random
effects). Median model estimates and their 95% credible intervals are
shown for each term based on two independent MCMCs (see
methods). ‘Covariance’ refers to the covariance between the two
response terms for a given random effect.

70
Table S4. Summary of results for the analysis of reproductive success (i.e. number of nestlings fledged) controlling for variation in (a) maternal
egg investment (‘egg volume’ in mm3; N = 348 clutches) and (b) hatchling mass (g; N = 310 broods). Egg volume was averaged for each clutch,
and hatchling mass for each brood, to allow their fitting as predictors in a clutch-level or brood-level analysis respectively. Including these
predictors did not reveal an association between either female or male helper number and mean reproductive success. Models within ΔAIC of
six of the top model are shown. k = number of model parameters. w = Akaike’s weights. Extending the analysis also yielded no support for
interactions between either female or male helper number and either egg volume or hatchling mass.
a Intercept Brood size Female helper
number Male helper
number Egg volume (mm3) k AIC ΔAIC w
0.284 0.293 5 850.5 0 0.307 -0.152 0.298 0.0001 6 851.6 1.06 0.181 0.314 0.292 -0.026 6 852.1 1.59 0.139 0.261 0.294 0.018 6 852.4 1.86 0.121 -0.157 0.297 -0.031 0.0001 7 853.0 2.48 0.089 -0.163 0.299 0.015 0.0001 7 853.5 2.95 0.070 0.29 0.294 -0.028 0.021 7 853.9 3.39 0.056 -0.171 0.298 -0.033 0.019 0.0001 8 854.8 4.31 0.036
b Intercept Brood size Female helper
number Male helper
number Hatchling mass k AIC ΔAIC w
-0.228 0.261 0.170 6 753.3 0 0.403 -0.199 0.259 -0.030 0.172 7 754.8 1.52 0.188 -0.273 0.266 0.031 0.170 7 754.8 1.55 0.185 -0.247 0.265 -0.033 0.035 0.173 8 756.3 2.97 0.091

71
0.346 0.250 5 756.8 3.49 0.070 0.302 0.254 0.031 6 758.3 5.05 0.032 0.377 0.248 -0.025 6 758.4 5.16 0.031

72
Table S5. Summary of results for the analysis of the proportion of hatchlings per brood that successfully fledged. Only one model (the top model)
appeared within ΔAIC of six of the top model. This model contained an interaction between the number of female helpers and total rainfall
during the rainfall window. The removal of this interaction caused an increase of AIC of 7.14, suggesting very strong support for this interaction.
k = number of model parameters. w = Akaike’s weights. N = 341 broods (those broods that experienced <185mm total rainfall during the focal
window (see methods); repeating the analysis with the whole data set and the quadratic rainfall effect on fledging success revealed the same
result, with the interaction between number of female helpers and rainfall appearing in the top model, improving AIC 1.65 points compared to
second best model).
Intercept Brood
size Female helper
number Male helper
number Rainfall
Female helpers
x Rainfall
Male helpers x Rainfall
k AIC ΔAIC w
-0.161 -0.348 -0.036 0.532 -0.316 7 687.7 0.00 0.424

73
Table S6. Analysis of the proportion of nestlings that survived to fledging (per brood), partitioning variation in female number in to their within-
(Δ) and among-mother (µ) components. This analysis confirms that the results shown in Table S5 were principally due to effects of within-
mother variation in female helper number, whose interaction with rainfall appeared here in the top three models (ΔAIC < 3.33). k = number of
model parameters. w = Akaike’s weights. Standardised model estimates are presented to aid the comparison of effect sizes across predictors. N
= 341 broods (those that experienced rainfall below 185 mm; see methods).
Intercept Brood
size ΔFemale helper
number µFemale helper
number Rainfall
ΔFemale helpers x Rainfall
µFemale helpers x Rainfall
k AIC ΔAIC w
-0.160 -0.351 -0.080 0.051 0.540 -0.250 -0.204 9 690.8 0.00 0.399
-0.162 -0.334 -0.060 0.502 -0.255 7 691.5 0.69 0.283
-0.164 -0.333 -0.056 0.033 0.504 -0.251 8 693.4 2.57 0.110
-0.131 -0.338 0.086 0.570 -0.197 7 694.2 3.32 0.076
-0.131 -0.320 0.530 5 694.9 4.03 0.053
-0.128 -0.341 -0.059 0.080 0.568 -0.203 8 695.8 5.00 0.033
-0.134 -0.320 0.064 0.533 6 696.4 5.57 0.025
-0.129 -0.321 -0.042 0.527 6 696.7 5.86 0.021

74
Table S7. Summary of results within a ΔAIC value of six for the analysis of the probability of dominance acquisition for nestlings fledged before
May 2014 (i.e. every individual had at least two years to become dominant; N = 330). Neither the number of female helpers, male helpers or
rainfall (or their interaction) predicted whether a fledgling acquired dominance between 2007 and 2016. Brood size was not either associated
with dominance acquisition. The intercept-only model scored the lowest AIC by ~1 point. Similar results were obtained when modelling the
probability of dominance acquisition for hatchlings (i.e. combining probability of survival to fledging and of acquiring dominance – n = 620). k
= number of model parameters. w = Akaike’s weights.
Intercept Brood
Size
Number female helpers
Number male
helpers Rainfall1 Rainfall2
Number female helpers
x Rainfall1
Number female helpers
x Rainfall2
Number of male helpers
x Rainfall1
Number of male helpers
x Rainfall2
k AIC ΔAIC w
-2.234 4 262.30 0 0.105
-2.269 -0.219 5 263.20 0.92 0.066
-2.209 -0.226 5 263.20 0.96 0.065
-2.249 -0.272 -0.265 6 263.70 1.46 0.051
-2.208 0.130 5 263.80 1.50 0.049
-2.215 -0.096 5 264.00 1.79 0.043
-2.233 -0.025 5 264.20 1.99 0.039
-2.243 0.148 -0.235 6 264.50 2.29 0.033
-2.256 -0.289 -0.197 6 264.60 2.31 0.033
-2.287 -0.378 -0.257 -0.245 7 264.70 2.40 0.032
-2.187 0.129 -0.224 6 264.70 2.46 0.031

75
-2.227 0.150 -0.273 -0.283 7 265.00 2.79 0.026
-2.268 -0.058 -0.228 6 265.10 2.85 0.025
-2.200 -0.215 -0.062 6 265.10 2.87 0.025
-2.209 -0.231 0.021 6 265.20 2.95 0.024
-2.244 -0.252 -0.319 -0.159 7 265.30 3.07 0.023
-2.198 0.118 -0.072 6 265.60 3.38 0.019
-2.249 -0.270 -0.010 -0.267 7 265.70 3.45 0.019
-2.208 0.130 -0.007 6 265.80 3.50 0.018
-2.215 -0.020 -0.095 6 266.00 3.78 0.016
-2.267 0.144 -0.378 -0.277 -0.244 8 266.00 3.78 0.016
-2.238 0.130 -0.300 -0.176 7 266.10 3.82 0.015
-2.291 -0.371 -0.330 -0.184 -0.269 8 266.20 3.95 0.015
-2.310 -0.115 -0.226 -0.177 7 266.30 4.04 0.014
-2.256 -0.052 -0.296 -0.195 7 266.50 4.25 0.013
-2.243 0.144 -0.037 -0.240 7 266.50 4.26 0.012
-2.286 -0.379 0.003 -0.257 -0.245 8 266.70 4.40 0.012
-2.186 0.134 -0.234 0.041 7 266.70 4.42 0.011
-2.183 0.124 -0.218 -0.035 7 266.70 4.43 0.011
-2.227 0.136 -0.256 -0.330 -0.135 8 266.80 4.53 0.011
-2.295 -0.279 -0.073 -0.269 -0.194 8 266.80 4.54 0.011
-2.276 -0.271 -0.344 -0.203 0.137 8 267.00 4.76 0.010
-2.212 -0.223 -0.081 0.064 7 267.00 4.78 0.010

76
-2.226 0.151 -0.276 0.014 -0.281 8 267.00 4.79 0.010
-2.199 -0.220 0.022 -0.063 7 267.10 4.86 0.009
-2.244 -0.250 -0.009 -0.320 -0.159 8 267.30 5.07 0.008
-2.309 -0.132 -0.313 -0.240 -0.230 8 267.40 5.18 0.008
-2.198 0.118 -0.005 -0.072 7 267.60 5.38 0.007
-2.285 0.150 -0.098 -0.239 -0.186 8 267.70 5.40 0.007
-2.275 0.130 -0.373 -0.341 -0.160 -0.265 9 267.70 5.45 0.007
-2.218 -0.024 -0.099 0.031 7 268.00 5.75 0.006
-2.266 0.147 -0.384 0.027 -0.274 -0.245 9 268.00 5.76 0.006
-2.238 0.127 -0.035 -0.304 -0.176 8 268.00 5.79 0.006
-2.273 0.159 -0.285 -0.053 -0.285 -0.205 9 268.10 5.81 0.006
-2.302 -0.257 -0.093 -0.343 -0.208 -0.241 9 268.20 5.91 0.005
-2.290 -0.372 0.004 -0.329 -0.184 -0.269 9 268.20 5.95 0.005
-2.291 -0.371 -0.330 -0.184 -0.270 -0.001 9 268.20 5.95 0.005
-2.312 -0.366 -0.048 -0.261 -0.192 -0.142 9 268.20 5.97 0.005

77

78
Chapter 3
Maternal plasticity in a cooperative bird:
opposing effects of helping on pre- and post-natal maternal
investment
Contributions by:
Pablo Capilla-Lasheras, Alastair J. Wilson, Andrew J. Young
Affiliations:
Centre for Ecology and Conservation, University of Exeter, Penryn, TR10
9FE, UK

79
3.1 Abstract
It has been hypothesised that mothers in cooperatively breeding societies adjust
their pre-natal investment in offspring according to the availability of help with
post-natal care, with important implications for our understanding of both maternal
and helper effects. While relationships between helper number and egg size have
been reported in some cooperative birds, whether such patterns reflect within-
mother plasticity rather than among-mother correlations between egg size and
helper numbers is unknown. Here we provide the first formal evidence of helper-
related maternal plasticity in egg size in a cooperative bird. Using a reaction-norm
approach we show that individual mothers lay larger eggs when they are assisted
by more female helpers. That this plastic response is predicted by female helper
numbers and not male helper numbers implicates post-natal helping per se as the
likely cause of this relationship, rather than general effects of group size, as female
helpers feed nestlings at substantially higher rates than males. This plastic response
could reflect an adaptive maternal response to post-natal effects of helpers on the
mother’s net payoff from egg investment. Indeed, further reaction-norm analyses
reveal that female (but not male) helpers lighten the post-natal workloads of
mothers, which may reduce the cost of egg investment. The known causal positive
effect of female (but not male) helpers on total nestling provisioning rate could also
increase the benefits of egg investment in this species. Both explanations require the
post-natal social environment to be predictable at the time of egg laying, which we
demonstrate is very much the case.

80
3.2. Introduction
Maternal effects are widely recognised to have downstream fitness consequences
for mothers and offspring (Mousseau & Fox, 1998; Lindstro m, 1999; Krist, 2011;
Pick et al., 2016) and there is growing evidence for plastic variation in maternal pre-
natal investment (i.e. egg production or gestation, Russell et al., 2003a; Kvalnes et al.,
2013; Langmore et al., 2016). In social organisms, social conditions can be highly
variable and mothers are predicted to evolve investment strategies that maximise
their fitness returns on investment according to their social environment (Russell &
Lummaa, 2009). Cooperatively breeding species are of particular interest in this
context. In these species, helpers typically contribute to the post-natal feeding of the
offspring of breeding females (hereafter ‘mothers’) and thus have the potential to
impact the net payoffs to mothers from pre-natal investment (Russell et al., 2007a;
Russell & Lummaa, 2009). That mothers can be assisted by variable numbers of
helpers throughout their lives leads to an expectation of selection for plastic
strategies in which mothers adjust pre-natal investment in offspring according to
the likely availability of help during post-natal care. Different maternal strategies for
adjusting pre-natal investment to the presence of helpers are hypothesised to arise
depending on how helpers impact the net payoff to mothers from pre-natal
reproductive investment.
Helpers have the potential to reduce the marginal benefit to mothers of increasing
pre-natal investment, leading to strategies in which mothers reduce pre-natal
investment when assisted by more helpers (Russell & Lummaa, 2009; Savage et al.,
2015). For example, such a strategy might be favoured if helpers compensate for
maternal reductions in pre-natal investment by increasing the overall provision of
post-natal care (i.e. additive care, Savage et al., 2015). Indeed, it has been highlighted

81
that such compensatory reductions in egg size in the presence of helpers have the
potential to conceal beneficial effects of helpers on the offspring that they raise if
empirical studies fail to control for associated variation in pre-natal maternal
investment (Russell et al. 2007a). Notably though, the rationale for predicting such
a compensatory maternal response requires that helper-derived post-natal
investment can indeed compensate for reductions in maternal pre-natal investment,
which may not always be the case. Indeed, there is ample evidence highlighting the
potential for pre-natal conditions, and pre-natal maternal investment more
specifically, to have formative effects on offspring phenotype and performance
(Henry & Ulijaszek, 1996; Hales & Barker, 2001; Krist, 2011; Pick et al., 2016, 2019).
Helpers also have the potential to reduce the marginal cost to mothers of increasing
pre-natal investment, leading to strategies in which mothers instead increase pre-
natal investment when assisted by more helpers (e.g., Woxvold & Magrath, 2005).
For example, helpers are often thought to lighten the post-natal provisioning
workloads of mothers (Hatchwell, 1999; Heinsohn, 2004; Meade et al., 2010), which
could allow mothers to pre-emptively increase their levels of pre-natal investment,
to which helpers cannot directly contribute. Indeed, where maternal investment in
utero/ovo does have formative effects on offspring fitness (see above), allowing
higher maternal pre-natal investment could constitute an important and otherwise
cryptic mechanism through which helpers impact offspring fitness. Notably, this
hypothesis highlights the potential for empirical studies of helper effects that control
for variation in pre-natal maternal investment (so as to reveal potentially ‘concealed’
helper effects; sensu Russell et al. 2007a; see above) to instead underestimate helper
effects, by shrouding beneficial helper effects on offspring that arise indirectly by
allowing mothers to increase pre-natal investment.

82
In cooperatively breeding birds, relationships between the presence or number of
helpers and pre-natal maternal investment in the egg (typically egg volume) have
now been detected in at least nine species, with both negative and positive
associations reported (Dixit et al., 2017). Typically, such relationships suggest that
females with (more) helpers lay smaller eggs (Malurus cyaneus, Russell et al., 2007a;
Corvus corone corone, Canestrari et al., 2011; Philetairus socius, Paquet et al., 2013),
with just one study reporting the reverse relationship (i.e. females with helpers lay
larger eggs; Cyanopica cooki, Valencia et al., 2017). However, no study to date has
provided compelling evidence that such patterns arise specifically from plasticity in
egg size within individual mothers, rather than among-mother variation in egg size
being correlated with among-mother variation in helper presence or number (e.g.
females on higher quality territories might simply lay larger eggs and have more
offspring that survive to become helpers). Indeed, the one study to date that has
utilised within-individual centring statistical techniques to explicitly tease apart the
effects of within and among-mother variation in helper number found that the
negative relationship detected between helper number and egg volume in red-
winged fairy wrens (Malurus elegans) arose from among-mother differences rather
than maternal plasticity, illustrating the importance of taking this approach (Lejeune
et al., 2016). The rationale typically invoked to explain relationships between egg
volume and helper number rests on the central importance of the cooperative
contributions that helpers provide to post-natal care. However, correlations
between egg size and helper number could equally reflect maternal responses to
variation in social group size which could itself impact the optimal level of pre-natal
investment independent of the availability of post-natal help per se (Taborsky et al.,
2007).

83
Here we use a long-term field study of cooperatively breeding white-browed
sparrow-weaver, Plocepasser mahali, societies to (i) explicitly test for maternal
plasticity in pre-natal egg investment in response to the availability of help, and (ii)
investigate the selective pressures that may have shaped the plastic response that
we detect. Throughout, we use a statistical approach (‘within-individual centring’,
van de Pol & Wright, 2009) that allows us to isolate effects of within-mother
variation in social environment on egg investment (i.e. maternal plasticity) from
potentially confounding effects of variation among mothers. White-browed
sparrow-weavers live in social groups of 2-12 birds, in which a single dominant male
and female (hereafter ‘the mother’) monopolise within-group reproduction and
non-breeding subordinates of both sexes help to rear the dominant pair’s young by
feeding nestlings (Lewis, 1982a; Harrison et al., 2013a). Female helpers feed
nestlings at approximately twice the rate of male helpers (Chapter 2) and,
accordingly, within-mother variation in the number of female helpers has a causal
positive effect on the total rate at which broods are provisioned, and positively
predicts offspring survival under dry conditions (Chapter 2). The greater effect of
female helpers on the group’s overall offspring provisioning rate provides an
unusual opportunity to tease apart maternal responses to the availability of post-
natal help per se from maternal responses to group size (which could readily
influence maternal investment independent of effects of help, Kokko et al., 2001;
Kingma et al., 2014). We focus our attention on variation in egg volume, which in this
species strongly predicts both egg mass at laying and nestling mass at hatching (see
results, Figure 1). Maternal variation in egg volume may therefore have fitness
implications for offspring, not least because hatchling mass also predicts nestling
survival in this species (Chapter 2). White-browed sparrow-weavers have a modal

84
clutch size of two eggs (range 1-3) and so marginal adjustments in pre-natal
maternal investment per clutch may be more readily achieved through changes in
egg size than clutch size, leaving this species a strong candidate for maternal
plasticity in egg size.
First, we utilise a large longitudinal data set of 271 clutches (490 eggs) laid by 62
mothers (1-21 clutches per mother; median 7) to investigate whether within-
mother variation in the number of female and/or male helpers at laying predicts
(within-mother) variation in egg volume. Experimental evidence has already
confirmed additive effects of female (but not male) helper number on the total rate
at which offspring are provisioned in this species (Chapter 2). Therefore, if additive
helper effects on post-natal care do indeed reduce the marginal benefit to mothers
from increasing egg size (e.g. by compensating for maternal reductions in egg
investment, Russell et al., 2007a), all else being equal, we would predict that mothers
should reduce egg volume when they have more female (but not male) helpers.
However, if mothers show plastic reductions in their own post-natal feeding of
nestlings when they have more (female) helpers (i.e. maternal load-lightening
occurs, Hatchwell, 1999), this could reduce the marginal cost to mothers from
increasing pre-natal investment, given the prospect of a reduced need to invest in
post-natal care. Where the latter effect dominates, we would instead predict that
mothers should increase egg volume when they have more (female) helpers. Second,
we thus utilise a large longitudinal data set of maternal post-natal nestling
provisioning behaviour (48 mothers making 4,621 feeding visits to 108 broods; 1-
10 clutches per mother; median 4 clutches) to establish whether such post-natal
maternal workload-lightening occurs in this species. Specifically, we investigate
whether within-mother variation in the number of female and/or male helpers

85
predicts (within-mother) variation in maternal nestling feeding rate. Third, we
investigate whether the maternal egg plasticity findings could be explained instead
by parallel maternal adjustments of clutch size or the number of clutches laid per
season according to helper numbers, as might be expected if helpers instead impact
the maternal resolution of trade-offs between egg volume and clutch size or number.
In our analyses, we also control for variation in environmental conditions (rainfall
and temperature) as these have been suggested to influence maternal investment in
reproduction (Bennion & Warren, 1933; Blanckenhorn, 2000; Langmore et al., 2016).
As female helpers contribute substantially more to post-natal care than male helpers
(Chapter 2), we predict that plasticity in all maternal traits should be more sensitive
to the number of female helpers than the number of male helpers (a finding that
would also implicate maternal responses to help per se rather than group size).
Finally, plastic maternal adjustments in egg size at laying according to the likely
availability of female and male helpers during the post-natal provisioning period
(approximately 16-40 days later in this species) require that the latter is predictable
at the time of laying. Hence, we also investigate whether this is indeed the case.
3.3. Methods
3.3.1. White-browed sparrow-weaver study population
White-browed sparrow-weavers live in semi-arid regions of South and Southeast
Africa. Our study population is located in Tswalu Kalahari Reserve in the Northern
Cape Province of South Africa (27°16’S, 22°25’ E). Fieldwork was carried out from
September to May between 2007 and 2016. Approximately 40 social groups of
white-browed sparrow-weavers (where its group is a reproductive unit) were
monitored, each one dominating a small territory in an area of approximately 1.5

86
km2. Sparrow-weaver reproductive groups were easily monitored and distinguished
in the field as all group members foraged together, engaged in weaving and territory
defence, and roosted together in individual woven chambers in a single tree or
cluster of trees close to the centre of their territory. All birds in our population are
fitted with a single metal ring and three colour rings for identification from the
beginning of the study period, or from the time they are first detected in the
population (under SAFRING license 1444). The sex of every individual could be
determined after the first six months of life as our study population present beak
colour sexual dimorphism (Leitner et al., 2009).
Every white-browed sparrow-weaver group contains a single dominant
(reproductive) female (i.e. mother) that lays every egg in the group (Harrison et al.,
2013a). Mothers are easily identified in the field because they display a distinct set
of behaviours. In every group, mothers are in very close association with a single
dominant male. These two birds spend much time foraging and duetting together
(Walker et al., 2016). Only mothers have been observed incubating the eggs or
entering the nest during the incubation phase. Furthermore, genetic analysis
confirmed that, in our study population, nests always contain eggs from a single
female and that this individual could be readily identified as the mother using
behavioural observations (Harrison et al., 2013a).
White-browed sparrow-weaver groups were regularly monitored every one or two
days to detect new clutches. Once a new clutch was found, egg length and maximum
width were measured with a plastic calliper to the nearest 0.1 mm. Nests were
checked daily until the clutch had been completed. Then, clutches were checked 8
days after the first egg was laid to confirm successful progress. Following this latter

87
mid-incubation check, clutches were checked daily starting 15 days after the first
egg was laid until the fate of every egg was determined (hatch or failure). Hatchlings
were weighed on their first day of life using a portable scale to the nearest 0.01 g.
White-browed sparrow-weaver group composition was assessed every week
throughout every field season. Each social group was observed at least once every
week and birds were identified on the basis of their colour-ring combination.
Additionally, birds were routinely caught while roosting at night and this
information was also used to define group memberships. For every egg and clutch in
our analysis, number of male and female helpers were calculated based on field
observations as individuals present in a given group on the day of laying (for eggs)
or the day of clutch initiation (for clutches). Young individuals hatched in a given
breeding year, and whose contribution towards provisioning offspring is very small
(Lewis, 1982a), were not considered as helpers until they were at least 6-month old.
3.3.2. Provisioning behaviour
Natural maternal provisioning behaviour was recorded for 174 breeding attempts
between September 2007 and April 2016. We collected provisioning behaviour data
using video-recordings between the 10th and 12th day after the first egg of a given
clutch hatched. Video recordings were watched using VLC media player and data
were extracted from every provisioning event: time of the feed, duration of the feed,
feeder sex (based on beak coloration; Leitner et al., 2009) and feeder identity based
on a unique vent pattern (see below) and colour-ring combination. For every
recorded breeding event, we always followed a standardised protocol: at least five
days before data collection started, we (i) caught and marked the vent of every bird
in the group apart from the dominant female using hair dye (Chapter 2) to aid video
identification and (ii) deployed tripods in the field to acclimatise the birds to their

88
presence. On recording days, video cameras were set up in the morning at standard
times that tracked monthly changes in sunrise. Provisioning behaviour was recorded
for approximately three hours per brood and day.
We then calculated the provisioning rate of mothers (feeds / hour). In a few cases,
we did not get reliable bird identifications from the provisioning videos, adding
uncertainty to our estimation of the maternal provisioning rate. We cleaned the
original data set to retain only those days of observation where i) there were fewer
than 3 feeds / hour of uncertainty in maternal feeding rate and ii) where the
maternal feeding rate estimated based on reliable observations was higher than 75%
of the maximum maternal feeding rate including all the uncertainty in feeder identity.
We analysed the cleaned data set containing 108 broods in 34 social groups for 48
different dominant females with reliable maternal provisioning rate data. To avoid
pseudo-replication, we calculated the mean maternal provisioning rate for a given
brood (i.e. averaging over successive days of video recording).
3.3.3. Environmental data
Daily rainfall data were collected from two rainfall gauges located to the west (27°
16’ 58.9’’ S, 22° 23’ 02.1’’ E) and east (27° 17’ 42.1’’ S, 22° 27’ 34.9’’ E) of the study
site, 7.60 km apart from each other. These two rainfall measurements were highly
correlated during the study period (Pearson’s product-moment correlation: r =
0.875, 95% CI = 0.867 – 0.882, df = 3,347). We therefore calculated average daily
values across both gauges and used this as a proxy for rainfall conditions at the study
site.

89
Temperature data for a 0.25-0.25 (latitude-longitude) area that encompassed the
study site was extracted from the GLDAS-2.1 Noah 0.25 degree 3-hourly data set
(Rodell et al., 2016), accessed via the NASA’s Goddard Earth Sciences Data and
Information Services Center online data system (Giovanni;
http://disc.sci.gsfc.nasa.gov/giovanni). We calculated daily maximum and mean
temperatures (i.e. the original data set contained eight temperature recordings per
day). We inspected the daily correlation between this data set and temperature
readings directly collected on our study site (2700 Watchdog weather station,
Spectrum Technologies, Inc.) every 10 to 30 minutes for a limited period of time
(partially between 2010 and 2015). Daily mean temperatures from these two data
sources were highly correlated (Pearson’s product-moment correlation: r = 0.973,
95%CI = 0.970 – 0.975, df = 1,771) validating the use of the GLDAS-2.1 Noah 0.25
degree 3-hourly data set to study temperature variation in the study site.
3.3.4. Statistical analysis
3.3.4.1. Identification of environmental windows of importance: sliding window
approach
White-browed sparrow-weavers can breed continuously during the wet season,
between September and April, and can show high among-female asynchrony in
laying dates. Therefore, we used a relative sliding window approach to find the
environmental windows most associated with egg volume and maternal
provisioning rate (e.g. Kruuk et al., 2015). We investigated relative sliding windows
backdating up to 80 days from egg laying. Sliding windows were inspected in 1-day
intervals (van de Pol et al., 2016) and, given a maximum of ± 4 days of uncertainty in
exact laying dates in the data set, sliding windows of at least 4 days of length were

90
investigated. The number of days with maximum temperatures above 35°C (‘heat
wave’ index hereafter) and total amount of rainfall (‘rainfall’ hereafter) in a given
temporal window were used as environmental indexes. We investigated linear and
quadratic effects of rainfall and linear effects of heat waves.
We applied the sliding window approach for heat waves and rainfall independently.
For each temporal window, an appropriate statistical model (see below for baseline
models) was fitted including rainfall or heat wave index. The AIC of models including
an environmental index was compared to the AIC of a baseline model (see below)
not containing the environmental predictor under investigation, resulting in a ΔAIC
value (also termed ‘AIC support’ hereafter). The environmental window yielding the
highest reduction in AIC compared to the baseline model (i.e. lowest ΔAIC) was
chosen and used in subsequent analyses if it represented an improvement of more
than 6 AIC points (a conservative threshold – Richards, 2008). We further tested the
results of the sliding window analysis for heat waves and rainfall by carrying out 25
randomisations of the data set and assessing the probability of false positive results
(van de Pol et al., 2016). In each randomisation, the biological reference date (egg
laying date) for the sliding window approach was randomised by re-shuffling – this
approach is used in the R package ‘climwin’ (Bailey & van de Pol, 2016). For each
randomisation, the sliding window protocol was fully applied and the AIC support
for the top-performing model recorded. This analytical routine was implemented
using our own R scripts, available at:
https://github.com/PabloCapilla/WeaverTools; that were inspired by the R package
‘climwin’ v1.2.0 (Bailey & van de Pol, 2016). Baseline models were linear mixed
models for egg size and maternal provisioning rates. Due to the need to control for

91
multiple factors affecting egg size and clutch size, we fitted a global baseline model
with every variable a priori predicted to explain variation in the trait of interest.
3.3.4.2. Structure of statistical models
Egg volume.
Linear mixed models were employed to explain variation in egg volume, calculated
based on length and maximum breadth following the formula given by Narushin
(2005). Four terms were included as random intercepts: breeding year (a 9-level
factor from 2007 to 2015), social group ID, clutch ID and maternal ID. We also
included, as fixed effects: egg position within the clutch, clutch size, number of
female helpers, number of male helpers and the interaction between helper number
(both females and males) and (i) egg position, and (ii) clutch size. Environmental
indexes for heat waves and rainfall were included as determined by the sliding
window approach.
Between 2007 and 2016, we collected length and width information, and therefore
volume, from 906 eggs that were detected in the field with less than four days of
uncertainty around their laying date. Out of these, laying order information was
available for 490 eggs (i.e. final sample size for analysis), with an average of 54 eggs
per season (range: 23 – 93) from 271 clutches in total sampled from 62 dominant
females across 37 social groups (mean = 7.90 eggs per female; range 1 - 21).
Provisioning rate of breeding females.
Linear mixed models were used to explain variation in maternal provisioning rate.
Three terms were included as random intercepts: breeding year (a 9-level factor
from 2007 to 2015), social group ID, and maternal ID. Fixed effects included brood

92
size, number of female helpers, number of male helpers as well as the interactions
between helper number and brood size. Following the sliding window analysis and
the calculation of the heat wave and rainfall indexes, we included these two
environmental predictors as fixed terms. The final data set for maternal provisioning
rate contained 108 broods in 34 social groups for 48 different dominant females.
Clutch size.
Clutch size was modelled as a Gaussian trait (ranging from 1 to 3) using linear mixed
models. Three terms were included as random intercepts: breeding year (a 9-level
factor from 2007 to 2015), social group ID and maternal ID. As fixed terms, we
included clutch order within the breeding year, number of female helpers and
number of male helpers. This analysis comprised clutches that were found in the
field with less than four days of uncertainty in laying dates; thereby reducing the
probability that any egg in the clutch disappeared before we recorded it. Out of a
total of 344 clutches, 284 clutches (82.56%) were found the day the first egg was
laid. For 37 clutches (10.76%), there was one day of uncertainty around the date the
first egg was laid, two days for 16 clutches (4.65%) and three days of 7 clutches
(2.03%). Clutches for 66 different dominant females in 37 distinct territories (i.e.
social groups) appeared in the final data set (n = 344 clutches). The number of
female and male helpers for each clutch was calculated as adult birds (i.e. those not
hatched in the focal breeding year and, therefore, older than six months) on the day
that the 1st egg of the clutch was laid. Repeating this analysis utilising a zero-
truncated Poisson error structure yielded qualitatively identical results.
Number of breeding attempts per year.

93
We calculated the number of clutches laid by mothers between the beginning and
the end of every breeding year. For this analysis, we only retained observations for
females that remained breeders for the whole breeding season (208 observations of
56 breeding females in 38 social groups). We explained variation in the number of
clutches laid per year using a generalised mixed model (for Poisson-distributed
data), including social group ID and female ID as random effects. We also included
total rainfall in the whole breeding year (i.e. from 1st of September to 30th of April)
as well as the mean number of female and male helpers.
3.3.4.3. General statistical procedures
To investigate the importance of factors explaining variation in egg volume, maternal
provisioning rate, clutch size, number of breeding attempts per year and maternal
pre-laying body condition we employed an information-theoretic (IT) approach.
Starting from a global model (that contained only those variables and interactions
predicted to have an effect – see above), simpler combinations of fixed predictors
were fitted to the data and ranked based on Akaike’s Information Criterion (AIC,
Burnham & Anderson, 2002; Burnham, 2004). ΔAIC values were then calculated for
every model (i.e. AIC difference between a given model and the best model – thus,
the ΔAIC for the best model equals zero). We gave further consideration to models
within a ΔAIC value of six (Richards, 2008; Richards et al., 2011) and reduced this
“Δ6 model set” by applying the ‘nesting rule’ described in (Richards, 2008). This rule
aims to avoid the retention of overly complex combinations of predictor by
discarding models that are more complex versions of simpler (nested) models with
poorer AIC support. Adding variables with no or little explanatory power to a well-
supported model is known to decrease AIC (Arnold, 2010) and, therefore, the

94
nesting rule tries to reduce the chance of considering models with such
uninformative variables. When quadratic terms were included in a given model,
linear coefficients were always present. Intercept-only models were always
considered. For AIC comparisons, models were fitted using maximum likelihood
(ML). Model coefficients were standardised by mean centering and dividing by one
standard deviation; effect sizes are therefore comparable across different predictors.
Statistical analyse were performed in R version 3.6.1. (R Core Team, 2019).
A common concern in studies of cooperative species is that group size can be
associated with territory quality, creating a spurious correlation between fitness
traits and group size (both of which can be positively associated with territory
quality; Cockburn, 1998; Cockburn et al., 2008). We addressed this concern in two
different ways. First, we excluded young individuals with less than six months of life
from our calculations of the number of male and female helpers. Second, we carried
out the analyses using number of helpers and then partitioned this variable to
untangle effects born of within-mother and among-mother variation in number of
helpers, Δ number of helpers and µ number of helpers respectively (van de Pol &
Wright, 2009). Within-mother (Δ) number of helpers accounts for variation in
number of helpers experienced by a given dominant female and, therefore, its effects
cannot be attributed to territory quality, which operates at the among-mother level.
We carried out within-mother centering per territory, thus, simultaneously
accounting for among-mother and among-territory differences in quality. Within-
mother centering was carried out using a customised R function, d_centering,
available here: https://github.com/PabloCapilla/WeaverTools

95
3.4. Results
3.4.1. Patterns and implications of maternal plasticity in egg volume
We analysed the volume of 490 eggs laid in 271 clutches of 1-3 (median = 2) eggs by
62 mothers in 37 social groups, with 1-21 clutches (median = 7) measured per
mother. Our data set reveals substantial within-mother variation in egg volume
(Figure 1a x axis) in addition to among-mother variation in egg volume (Figure 1a y
axis). Moreover, within-mother variation in egg volume positively predicted egg
mass on the day of laying (LM: β = 0.484 ± 0.016; ΔAIC = 456.40; Figure 1c) as well
as nestling mass on the day of hatching (LM: β = 0.282 ± 0.048; ΔAIC = 31.32; Figure
1d). It is quite plausible that sparrow-weaver mothers could adjust their egg volume
according to the likely future availability of help during the post-natal period,
because helper numbers at laying strongly predict those during the post-natal
period (Figure 1b; for female helper number, LM: N = 271, β = 0.94 ± 0.017; and for
male helper number, LM: N = 271, β = 0.93 ± 0.022).
3.4.2. Maternal plasticity in egg volume: individual mothers lay larger eggs
when they have more female helpers
Mothers that had more female helpers at laying laid larger eggs (ΔAIC = 3.71; Table
1). Partitioning variation in female helper number into its within- and among-
mother components revealed evidence of maternal plasticity: individual mothers
laid larger eggs when they had more female helpers (Δ female helper number effect;
ΔAIC = 3.79; Table 2; Figure 2). We found much weaker evidence that male helper
numbers predicted variation in egg volume, both at the population level (Table 1;
the best supported model containing a ‘male helper number’ effect was 3.71 AIC
points below the top model) and within mothers (Table 2; the top model containing

96
a ‘Δ male helper’ effect after applying the nesting rule, see methods, was 3.79 AIC
points below the top model). We also found evidence for consistent and large
among-mother variation in egg volume: the ‘maternal ID’ random effect in both
models explained approximately 70% of the variation in egg volume (‘maternal ID’
random effect variance = 0.569; likelihood ratio-test: χ12 = 136, p < 0.001).
Figure 1. Patterns and implications of maternal plasticity in egg volume. (a)
Egg volume showed high variation both within (x-axis) and among females (y-axis).
Among-mother variation in egg volume was calculated as the mean egg volume per
female, while within-mother variation in egg volume represents deviations from the
female-specific mean egg volume (hence the negative and positive values). (b)
Helper number at laying strongly predicted helper number during the nestling

97
rearing phase (mean ± standard deviation (SD) are presented for both male and
female helpers; dashed line indicates a 1:1 relationship). Within-mother variation in
egg volume positively predicted (c) egg mass (g) on the day of laying and (d)
hatchling mass (g). Mean model predictions ± standard error (SE) are plotted in red.
Figure 2. Maternal plasticity in egg volume. (a) Female helper number positively
predicts egg volume at the population level (prior to partitioning variation in helper
number). (b) Within-mother variation in female helper number (‘Δ female helper
number’) also positively predicts egg volume, providing evidence of maternal
plasticity. Grey dots illustrate raw data points and red lines present model
predictions for mean egg volume (± SE).
Egg volume was also negatively predicted by the number of days above 35°C in a
window of 13 days before egg laying (‘heat wave’ index; see methods for window
optimisation): the higher the heat wave index, the smaller the eggs (Tables 1 & 2;
Supplementary information A; Figure S1; Table S1). We also found that total rainfall
44 to 49 days before laying negatively predicted egg volume (negative linear and
quadratic terms; Table 1). However, our sliding window analyses suggest that this
result has a fair likelihood, 12%, of being generated by chance (i.e. it could well be a
false positive; Supplementary information A; Figure S2, Table S1). Clutch size did not
predict egg volume (Tables 1 & 2) but egg position within the clutch did: later laid

98
eggs were smaller than first laid eggs (Tables 1 & 2). Egg volume was not affected by
the interactions between the number of male or female helpers and clutch size or
egg position (Table 1 & 2).
3.4.3. Maternal plasticity in nestling provisioning: individual mothers
provision less when they have more female helpers
Mothers that had more female helpers during the nestling period showed lower
nestling provisioning rates (ΔAIC = 3.23; Figure 3a; Table 3). Partitioning variation
in female helper number into its within- and among-mother components revealed
evidence of maternal plasticity: individual mothers decreased their nestling
provisioning rate when they had more female helpers (Δ female helper number
effect; Table S5). Again, we found much weaker evidence that male helper numbers
predicted variation in maternal provisioning rate, both at the population level (Table
3; the best supported model containing a ‘male helper number’ effect was 3.04 AIC
points below the top model) and within mothers (Δ male helper number effect; Table
S5; the best supported model containing a ‘Δ male helper number’ effect was 1.79
AIC points below the top model).
There was evidence to suggest that maternal provisioning rates increased with the
number of days above 35°C (i.e. ‘heat waves’ index) 51 to 58 days pre-laying and with
total rainfall 63 to 77 days pre-laying (Tables 3) but our analyses revealed a high
probability that both of these results are false positives (Supplementary Information
B; Table S1; Figure S3 & S4). The interactions between the number of male or female
helpers and brood size did not explain appreciable variation in maternal
provisioning rates (Tables 3).

99
3.4.4. No evidence of maternal adjustment of clutch size or number of
clutches laid per year according to helper numbers
We did not find evidence that mothers adjusted their clutch size according to the
number of female or male helpers in their group (Tables S6). The intercept-only
model was the best supported model. We also found no evidence that mothers
adjusted the total number of clutches that they laid in a given breeding season
according to the number of female or male helpers in their group (Table S7). We did
find strong evidence of a positive effect of the total rainfall during a given breeding
season on the total number of clutches laid in that breeding season (ΔAIC = 10.12;
Table S7).
Figure 3. Maternal plasticity in post-natal provisioning. (a) The number of
female helpers negatively predicts maternal nestling provisioning rate at the
population level (Table 3). (b) Within-mother variation in the female helper number
(‘Δ female helper number’) also negatively predicts maternal nestling provisioning
rate, providing evidence of maternal plasticity. Grey dots illustrate raw data points
and red lines present model predictions for mean egg volume (± SE). Grey dots
illustrate raw data points and red lines present model predictions for mean maternal
nestling provisioning rates (± SE).

100
Table 1. The top-performing models (i.e. those within ΔAIC < 6 of the top model) explaining variation in egg volume (linear mixed model; N =
490). Only those models retained after applying the nesting rule (see ‘Methods’; Richards, 2008) are presented (for the full table see Table S2).
Standardised model coefficients are shown along with number of model parameters (‘k’), AIC, and ΔAIC. Other tested predictors not shown in
this table (as they were not present in the models retained after applying the nesting rule) were as follows: clutch size, clutch size х female helper
number, clutch size х male helper number, egg position х female helper number and egg position х male helper number.
Intercept Female helper
number
Male helper
number
Heat waves
Rainfall1 Rainfall2 Egg
position k AIC ΔAIC
0.006 0.078 -0.114 -0.069 -0.107 -0.119 11 890.4 0 -0.001 0.051 -0.115 -0.067 -0.105 -0.120 11 894.1 3.71 -0.008 -0.109 -0.071 -0.104 -0.121 10 894.4 4.05

101
Table 2. The top-performing models (i.e. those within ΔAIC < 6 of the top model) explaining variation in egg volume partitioning within- (prefix
‘Δ’) and among-mother (prefix ‘µ’) variation in male and female helper number. Only those models retained after applying the nesting rule (see
‘Methods’; Richards, 2008) are presented (see full table in table S3). Standardised model coefficients are shown along with number of model
parameters (‘k’), AIC, and ΔAIC. Other tested predictors not shown in this table (as they were not present in the models retained after applying
the nesting rule) were as follows: µ female helper number and µ male helper number.
Intercept Δ Female
helper number
Δ Male helper
number
Heat waves
Rainfall1 Rainfall2 Egg
position k AIC ΔAIC
-0.006 0.061 -0.114 -0.068 -0.108 -0.119 11 890.5 0
-0.006 0.038 -0.115 -0.066 -0.106 -0.120 11 894.3 3.79
-0.008 -0.109 -0.071 -0.104 -0.121 10 894.4 3.90
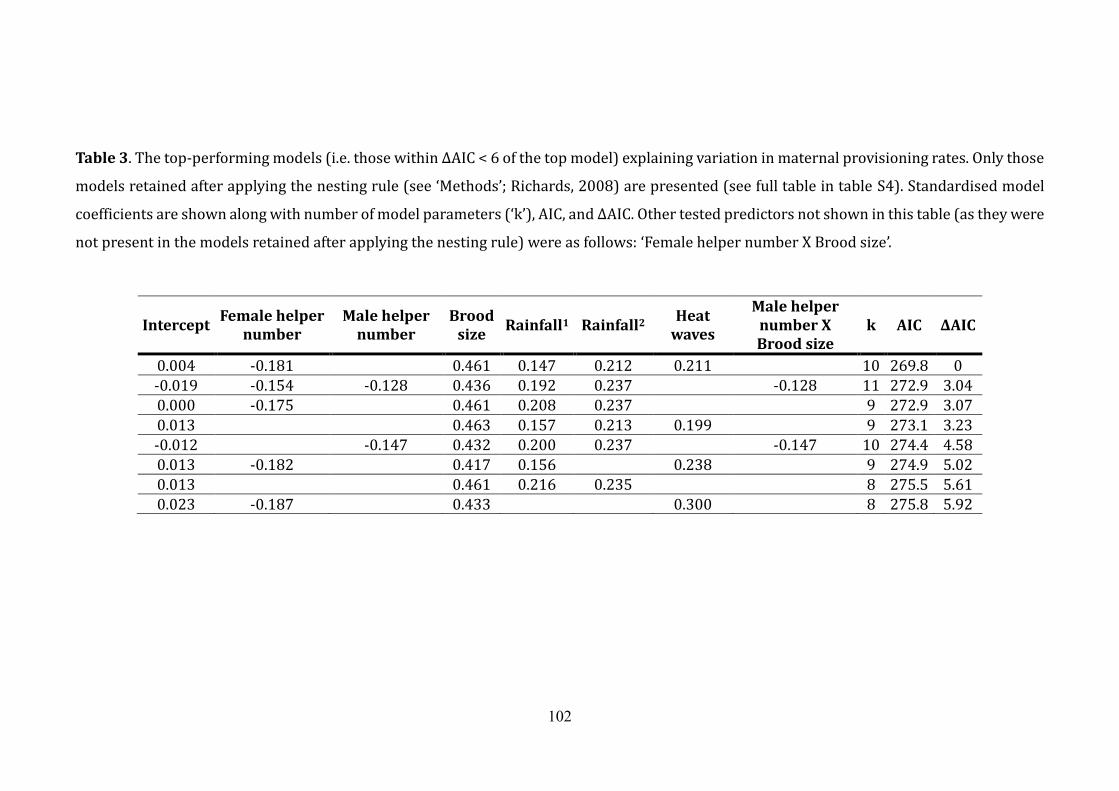
102
Table 3. The top-performing models (i.e. those within ΔAIC < 6 of the top model) explaining variation in maternal provisioning rates. Only those
models retained after applying the nesting rule (see ‘Methods’; Richards, 2008) are presented (see full table in table S4). Standardised model
coefficients are shown along with number of model parameters (‘k’), AIC, and ΔAIC. Other tested predictors not shown in this table (as they were
not present in the models retained after applying the nesting rule) were as follows: ‘Female helper number X Brood size’.
Intercept Female helper
number Male helper
number Brood
size Rainfall1 Rainfall2
Heat waves
Male helper number X Brood size
k AIC ΔAIC
0.004 -0.181 0.461 0.147 0.212 0.211 10 269.8 0 -0.019 -0.154 -0.128 0.436 0.192 0.237 -0.128 11 272.9 3.04 0.000 -0.175 0.461 0.208 0.237 9 272.9 3.07 0.013 0.463 0.157 0.213 0.199 9 273.1 3.23 -0.012 -0.147 0.432 0.200 0.237 -0.147 10 274.4 4.58 0.013 -0.182 0.417 0.156 0.238 9 274.9 5.02 0.013 0.461 0.216 0.235 8 275.5 5.61 0.023 -0.187 0.433 0.300 8 275.8 5.92

103
3.5. Discussion
We used a long-term data set containing extensive repeated measures of egg volume
from mothers experiencing variable numbers of helpers to investigate whether
mothers plastically adjust their pre-natal investment according to the availability of
help with post-natal care. As helper number at laying strongly predicts helper
number during post-natal care in this species, mothers should have sufficient
information at laying to adjust their egg volume to the availability of post-natal help,
were it adaptive to do so. Indeed, our analyses did reveal evidence of plasticity in
maternal pre-natal investment according to helper numbers: individual mothers
increased the volume of their eggs when assisted by more female helpers. While
relationships between helper number and egg size have previously been reported in
other cooperative breeders (see introduction), our analyses are the first to
demonstrate that such a pattern arises from within-mother plasticity rather than
variation among mothers. Our findings also revealed plasticity in maternal post-
natal investment according to female helper numbers: individual mothers decreased
their investment in post-natal nestling provisioning when assisted by more female
helpers. Female helpers in white-browed sparrow-weaver societies provide post-
natal care at twice the rate of male helpers (and only female helpers provide additive
care; Chapter 2). Thus, the evidence of maternal plasticity in both pre- and post-natal
investment according to variation in the number of female helpers, but not male
helpers, implicates helping behaviour per se as the likely cause of these plastic
responses, rather than correlated variation in group size. It seems unlikely that the
observed maternal plasticity in egg volume reflects an effect of female helpers on the
optimal resolution of a trade-off between egg volume and either clutch size or the
number of clutches laid per year, as mothers did not vary clutch size or number

104
according to helper numbers. Instead, it seems more likely that the presence of
female helpers increases the marginal payoff to mothers of increasing egg
investment, either by reducing the marginal cost of increasing egg investment (e.g.
because they lighten the post-natal workloads of mothers) or by increasing the
marginal benefit (e.g. if increasing egg investment has a greater effect on the
reproductive value of offspring that will receive more post-natal care). We discuss
these potential explanations for our findings in more detail below, along with their
implications for our understanding of maternal and helper effects in cooperative
breeders.
While relationships between egg size and helper number are typically interpreted
as adaptive responses to effects of the anticipated availability of post-natal care on
the payoffs from egg investment (see introduction), alternative explanations for such
patterns exist. First, the relationship could arise as a by-product of trade-offs
between egg volume and other pre-natal maternal investment traits (specifically
clutch size or the number of clutches laid per year) that are themselves adjusted
according to helper number (Lejeune et al., 2016). This is unlikely to explain the
relationship observed here, however, as our analyses reveal that neither clutch size
nor the number of clutches laid per breeding season are related to helper number in
this species. Indeed, white-browed sparrow-weavers show very little variation in
clutch size (1-3 eggs; mode 2 [72.38% of clutches]) and so pre-natal adjustments in
maternal investment may be more readily achieved via changes in egg size rather
than clutch size. Second, maternal plasticity in egg size according to helper number
could also arise not because mothers pre-emptively adjust egg investment to the
likely availability of post-natal care for the eggs being laid, but because the past
actions of helpers have impacted maternal condition (e.g. via lightening maternal

105
workloads in previous breeding attempts; Russell et al., 2003a), which itself affects
the payoff from egg investment. This scenario cannot readily explain our findings
either, as (i) helper numbers have no detectable effect on maternal body condition
(see Supplementary material C), and (ii) the time since the last breeding attempt
does not predict egg volume (either in isolation or via interactions with helper
numbers), suggesting that egg volume is not appreciably impacted by carryover
effects of past reproductive effort (see Supplementary material D). As such, it would
seem quite plausible that the egg size plasticity observed here does reflect past
selection for maternal strategies that adjust pre-natal investment to the likely future
availability of post-natal help (Russell et al 2007a; Russell & Lummaa 2009). Indeed,
as the number and composition of helpers at laying strongly predicts those during
the ensuing post-natal care period in this species, sparrow-weaver mothers should
have sufficient information at laying to adjust their egg volume according to the
future availability of help, were it adaptive to do so.
The leading hypothesis for adaptive variation in maternal pre-natal investment in
cooperative breeders proposes that where helpers increase the overall rate at which
offspring are fed (i.e. provide additive care), selection may favour mothers that
reduce their pre-natal investment, given the potential for the additive contributions
of helpers to compensate for this (Russell et al., 2007a). Our findings run precisely
counter to this prediction and are consistent instead with female helpers reducing
the marginal costs of pre-natal investment. We show that helpers lighten the post-
natal workloads of mothers, potentially allowing mothers to invest more at the pre-
natal stage of reproduction (i.e. reducing the marginal costs of increasing pre-natal
investment in eggs). Indeed, mothers assisted by more female helpers increased
their pre-natal investment laying larger eggs. Helpers load-lighten parental

106
workload in a wide range of cooperative species (e.g. Hatchwell, 1999; Zo ttl et al.,
2013a; Brouwer et al., 2014) and, therefore, positive effects of helpers on maternal
pre-natal investment may potentially be more common than previously thought.
It is also conceivable that the positive association between female helper numbers
and egg volume arises in part because female helpers increase the marginal benefits
of increasing maternal investment in the egg. For example, if female helpers increase
juvenile survival (Clutton-Brock et al., 2001; Russell et al., 2002; Hatchwell et al.,
2004; Ridley, 2007; Kingma et al., 2010), female helpers might also increase the
probability of a return on maternal pre-natal investment in the egg. Such a
mechanism may not apply in sparrow-weavers, however, as helpers actually have no
net positive effect (when averaged across all ecological conditions) on offspring
survival to fledging (Chapter 2). Additive helper effects (i.e. more post-natal care)
might also increase the marginal benefits of pre-natal investment when the
relationship between total investment in offspring (the sum of pre- and post-natal
investment) and offspring fitness is accelerating (as envisaged in the ‘silver spoon’
hypothesis; Grafen, 1988). This possibility warrants closer attention but is likely to
prove challenging to robustly test. One approach to test this hypothesis could be to
experimentally allocate eggs of different sizes among different post-natal care
environments (i.e. groups with different number of helpers) and demonstrate that
the relationship between egg size and offspring fitness is steeper in groups with
more helpers. Lastly, helpers might additionally increase the marginal benefits of
pre-natal investment when mothers stand to gain the full benefits of increasing egg
investment when additive care from helpers can cover the increased costs of
meeting the potentially higher demand of the resulting nestlings (Clutton-Brock et

107
al., 1985; Klaassen & Bech, 1992; Figure 1d).
While we found a positive relationship between female helper number and pre-natal
maternal investment, most studies of cooperative breeders to date have found
negative relationships (Russell et al., 2007a; Taborsky et al., 2007; Canestrari et al.,
2011; Santos & Macedo, 2011; Paquet et al., 2013; Sharp et al., 2013; Dixit et al.,
2017). The apparent inter-specific diversity of relationships between helper number
and egg size could well be attributable in part to the possibility in some species (i)
that this relationship at the population level actually reflects among-mother
variation rather than a plastic maternal response (e.g. Lejeune et al., 2016; see
Taborsky et al., 2007, for one exception in a cooperatively breeding fish), and/or (ii)
that this relationship actually reflects a response to correlated variation in group
size rather than the availability of help per se. At least three key factors may
ultimately help to explain inter-specific variation in the direction and magnitude of
maternal plasticity in egg size according to the availability of help per se.
First, there may be variation among species in the relative importance of pre- and
post-natal investment for offspring fitness. The potential for maternal reductions in
pre-natal investment when helpers provide post-natal care for offspring relies on
the assumption that pre-natal and post-natal investments are exchangeable (Savage
et al., 2015). While this assumption might be valid for some species, there is ample
evidence highlighting the potential for in ovo and in utero conditions to have life-long
formative effects on offspring phenotypes and fitness (Henry & Ulijaszek, 1996;
Hales & Barker, 2001; Krist, 2011; Pick et al., 2016, 2019) leaving it unlikely to be
valid for all. Indeed, helpers in some species principally protect rather than
provision offspring, leaving it unlikely that helping directly compensates for

108
reductions in pre-natal investment (e.g. Taborsky et al., 2007). Second, there may be
variation among species in the shape of the relationship between total (pre- and
post-natal) investment and offspring fitness; specifically, whether the relationship is
accelerating or decelerating. When helpers have additive effects on the total amount
of post-natal care that offspring receive, selection might favour mothers increasing
their egg investment in the presence of helpers if the relationship is accelerating (as
suggested above), but actually decreasing it if the relationship is decelerating. Third,
there may be variation among species in the extent to which helpers lighten the
workloads of mothers and/or provide additive care (see Hatchwell, 1999), given the
key role that both phenomena could play in impacting the marginal payoff to
mothers of increasing egg investment (see above). More empirical studies of
maternal plasticity in pre-natal investment in cooperative breeders will ultimately
be needed if we are to better understand the relative importance of these factors; in
particular investigations that statistically or experimentally tease apart within-
mother (i.e. plasticity) and among-mother variation in pre-natal investment (e.g
Taborsky et al., 2007; Lejeune et al., 2016).
Like the social environment, abiotic environmental conditions also have the
potential to modulate the net fitness payoff to mothers from pre-natal investment
(Kruuk et al., 2015; Langmore et al., 2016), and our analyses did yield some evidence
that abiotic conditions predict egg volume in this species. Total amount of rainfall
between approximately 20 days pre-laying and 24 days post-hatching is a strong
predictor of nestling survival in white-browed sparrow-weavers (Chapter 2).
Therefore, rainfall in this window also has a strong potential to influence the payoff
from egg investment. It is then surprising that we found no compelling evidence that
mothers adjust their egg size at laying according to rainfall (as analysis of the

109
outcomes of the moving window approach optimisation of the rainfall effects in our
models suggests that they have a high likelihood of having arisen by chance). One
potential explanation for the absence of maternal plasticity in this context is that
rainfall is highly unpredictable for our Kalahari study population (Chapter 2).
Additionally, most of the rainfall window that affects offspring survival occurs after
laying and mothers may then be unable to accurately predict how rainfall will
ultimately impact the fate of their offspring. In contrast to rainfall effects, we found
strong evidence suggesting that the number of days with maximum temperatures
above 35°C in the thirteen days before laying (i.e. the ‘heat wave’ index revealed by
sliding window modelling; see methods) had a clear negative association with egg
volume (a result that our analyses suggest is not likely to have arisen by chance).
High temperatures have been shown to have associations with egg size and our
results are in line with previous findings (Bennion & Warren, 1933; Blanckenhorn,
2000; Langmore et al., 2016). It is conceivable that this pattern reflects an adaptive
strategy (e.g. smaller eggs may be easier to keep cool) but it is also plausible this
response rather reflects a detrimental effect of heat stress on pre-laying maternal
condition or physiology (Ernsting et al., 1997; Blanckenhorn, 2000).
By partitioning the effects of within- and among-mother variation in helper
numbers on maternal egg volume, we have provided robust evidence for maternal
plasticity in egg volume to the social environment. Mothers laid larger eggs when
assisted by more female helpers, with the potential for fitness implications for
offspring, given that egg volume predicts both egg and hatchling mass in this species
and the latter predicts offspring survival (Chapter 2). We also demonstrate that
mothers contributed less to post-natal care when assisted by more female helpers,
providing a simple explanation for the egg size plasticity observed: mothers with

110
more female helpers may invest more heavily in pre-natal investment because
female helpers lighten their post-natal workloads. As such, our findings highlight a
novel mechanism through which helpers might frequently accrue fitness benefits
that remain virtually unexplored. While it has long been recognised that helpers may
accrue indirect fitness benefits by lightening the workloads of related mothers if this
improves maternal survival or reduces inter-clutch or inter-birth intervals
(Woxvold & Magrath, 2005; Kingma et al., 2010), our findings reveal that mothers
might instead exploit post-natal load-lightening pre-emptively, reallocating
maternal resources to pre-natal investment to which helpers cannot directly
contribute. Indeed, while it has been suggested that studies of helper effects on
offspring should control for variation in egg size in order to ensure that maternal
reductions in egg size by helped mothers do not ‘conceal’ helper effects on offspring
(Russell et al., 2007a), our findings highlight a danger of this approach. If, as here,
plastic mothers actually lay larger eggs in the presence of helpers, controlling for
variation in egg size could lead instead to the underestimation of helper effects on
offspring, by factoring out helper effects that arise indirectly from load-lightened
mothers pre-emptively reallocating their resources from post-natal care to pre-
natal investment in the egg. Indeed, given the widespread evidence across species
that helpers lighten maternal workloads (e.g. Hatchwell, 1999; Kingma et al., 2010),
it is conceivable that such a pre-emptive reallocation of resources to pre-natal
investment has actually contributed to the positive relationships already described
in numerous species between helper numbers and offspring survival and/or
performance.

111
Chapter 3: Supplementary Material
Supplementary Information Chapter 3
A - Egg volume: sliding window analysis
I. Heat waves (number of days above 35°C)
The sliding window analysis for heat waves revealed a significant negative effect on
egg volume occurring in a window of 13 days pre-laying (Figure S1a). The model for
this temporal window scored an AIC value 11.13 points lower than the baseline
model. Furthermore, the analysis clearly identified a single and localised peak in the
AIC landscape (Figure S1b) with no clear alternative windows supported by the data.
None of our 25 randomisations scored a lower AIC value than the real data (Figure
S1c – AIC support for randomised analysis ranged from 0.24 to -9.30).
II. Total rainfall
The sliding window analysis for total amount of rainfall indicated a negative
quadratic effect on egg volume 49 to 44 days before egg laying (AIC support = -12.90
- Figure S2a). Simulating a random relationship between quadratic rainfall and egg
volume 25 times (i.e. 25 randomisation tests as per the heat wave effect - van de Pol
et al., 2016), we obtained equal or stronger AIC support for three randomisations,
revealing a 12% probability of a false positive result (Figure S2c). Furthermore, the
peak in AIC support in the sliding window landscape using the real data revealed
scattered support for a number of different windows without clear localisation of
maximum support (Figure S2b). It is also biologically unlikely that rainfall during
only five days, 44 days before laying, affects egg volume.

112
B - Maternal provisioning rate: sliding window analysis
I. Heat waves (number of days above 35°C)
Mothers increased their provisioning rates with increasing heat wave index
calculated between 58 and 51 days prior to hatching (AIC support = -6.33; Table S1;
Figure S3a). However, a high percentage of random tests (7 out of 25; Table S1)
showed equal or higher AIC support than what we observed in the real data set
(Figure S3c). This fact suggests that the relationship that we found in the data may
be spurious. Furthermore, there was no single and clear peak in the landscape of ‘AIC
support’ (Figure S3b).
II. Total rainfall
The sliding window analysis for total amount of rainfall indicated a positive
quadratic effect on maternal provisioning rate 78 to 63 days before egg laying (AIC
support = -10.97; Table S1; Figure S4a). Total rainfall did not affect maternal
provisioning rate for most of the range in rainfall values but breeding females
seemed to increase their provisioning rate in very wet conditions (Figure S4a). There
appeared to be a clear peak in the landscape of AIC support (Figure S4b). However,
three random simulations showed higher AIC support than the real data set,
representing a probability of 12% of a false positive result (Figure S4c).
C – Helper effects on maternal body condition
We routinely caught and measured body weight (g) and tarsus length (mm) of
mothers throughout the study period. We used this information to investigate if
maternal body condition before laying a given clutch was associated with the
number of helpers present in a previous clutch. We restricted the analysis to those

113
‘previous’ clutches in which at least one nestling fledged and, therefore, helpers had
time to contribute towards post-natal care and, potentially, reduce the costs of
maternal post-natal investment. We used weight measurements from mothers up to
45 days before they produced a new clutch (i.e. pre-laying). The data set comprised
45 clutches by 33 mothers in 26 social groups. We calculated scale mass index of
body condition following (Peig & Green, 2009) and built a linear mixed model to
explain variation in this variable (hereafter ‘maternal pre-laying body condition’).
We investigated the effect of female and male helper number in a previous breeding
attempt (included as fixed effects) on maternal pre-laying body condition. We also
included a fixed effect for the number of previous clutches laid by the mother within
breeding years (from 0 to 4 clutches). Mother ID, social group ID and breeding year
were included as random effect intercepts. Given the small sample size, random
intercept variance for Mother ID and year could not be estimated. Dropping these
terms from the initial model did not change the results. We found no evidence
suggesting that the number of male or female helpers in a given breeding attempt
affected maternal pre-laying body condition in a subsequent breeding attempt. The
intercept-only model scored the lowest AIC and no other model passed the nesting
rule (Richards, 2008). Female helper number appeared, having a negative effect, in
the third model being 1.84 AIC points worse than the intercept-only model.
D – Female helper effects on egg volume do not depend on time since the
last breeding attempt
To investigate if maternal variation in egg volume according to helper number could
actually reflect load-lightening by helpers in past reproductive events (rather than a
pre-emptive response given an ‘expectation’ of receiving post-natal help with the
clutch currently being laid), we re-fitted the egg volume model presented in the main

114
text to include ‘time since last breeding attempt’ as an additional fixed effect
predictor if such previous breeding attempt had been successful (i.e. nestlings were
fledged and, therefore, helpers did have the opportunity to lighten maternal post-
natal workload; n = 136 eggs). If mothers lay larger eggs when assisted by more
female helpers as a consequence of past female helper contributions, we would
expect the female helper effect to decrease in magnitude with increasing time since
the last breeding attempt (i.e. an interaction between female helper number and
time since last breeding attempt). Time since last breeding attempt did not explain
variation in egg volume either as a simple predictor or as an interaction with female
or male helper number (these latter predictors only appeared in the model set after
a ΔAIC value of 5.03 and 4.86 respectively).

115
Supplementary Figures Chapter 3
Figure S1. Sliding window analysis for the effect ‘heat waves’ (days above 35°C) on
egg volume. (a) Effect of ‘heat waves’ on egg size. Raw data points in black and
regression line (± SE) in blue. (b) AIC support (i.e. difference in AIC between a given
sliding window model and the baseline model) for sliding windows up to 80 days
before egg laying. The darker the colour of the tiles, the stronger the support for a
given window. (c) Histogram representing the best AIC support for 25 randomised
sliding window analyses (e.g. AIC support expected if no relationship exists between
egg volume and heat waves). The blue dashed line illustrates the AIC support
achieved using the real data set. No randomised test scored better (i.e. lower) AIC
support than the real data set, strongly suggesting that the relationship between egg
volume and heat waves was very unlike to have been generated by chance and,
therefore, indicating that such relationship was a real signal present in the data.

116
Figure S2. Sliding window analysis for the effect of total rainfall (mm) on egg volume.
(a) Effect of total rainfall on egg size. Raw data points in black and regression line (±
SE) in blue. (b) AIC support (i.e. difference in AIC between a given sliding window
model and the baseline model) for sliding windows up to 80 days before egg laying.
The darker the colour of the tiles, the stronger the support for a given window. (c)
Histogram representing the best AIC support for 25 randomised sliding window
analyses (e.g. AIC support expected if no relationship exists between egg volume and
heat waves). The red dashed line illustrates the AIC support achieved using the real
data set. Three randomised test scored better (i.e. lower) AIC support than the real
data set, suggesting that the relationship found in the data set has a 12% probability
of representing a false positive result (i.e. strong AIC support with no real
relationship between rainfall and egg volume).

117
Figure S3. Sliding window analysis for the effect of ‘heat waves’ (days above 35°C)
on maternal provisioning rate. (a) Effect of ‘heat waves’ on maternal provisioning
rate (i.e. post-natal investment in reproduction). Raw data points in black and
regression line (± SE) in blue. (b) AIC support (i.e. difference in AIC between a given
sliding window model and the baseline model) for sliding windows up to 80 days
before egg laying. The darker the colour of the tiles, the stronger the support for a
given window. (c) Histogram representing the best AIC support for 25 randomised
sliding window analyses (e.g. AIC support expected if no relationship exists between
maternal provisioning rate and heat waves). The blue dashed line illustrates the AIC
support achieved using the real data set. Seven randomised test scored better (i.e.
lower) AIC support than the real data set, suggesting that the relationship found in
the data set has a 28% probability of representing a false positive result (i.e. strong
AIC support with no real relationship between heat waves and maternal
provisioning rate).

118
Figure S4. Sliding window analysis for the effect of total rainfall (mm) on maternal
provisioning rate. (a) Effect of total rainfall on maternal provisioning rate (i.e. post-
natal investment in reproduction). Raw data points in black and regression line (±
SE) in blue. (b) AIC support (i.e. difference in AIC between a given sliding window
model and the baseline model) for sliding windows up to 80 days before egg laying.
The darker the colour of the tiles, the stronger the support for a given window. (c)
Histogram representing the best AIC support for 25 randomised sliding window
analyses (e.g. AIC support expected if no relationship exists between maternal
provisioning rate and rainfall). The blue dashed line illustrates the AIC support
achieved using the real data set. Three randomised tests scored better (i.e. lower)
AIC support than the real data set, suggesting that the relationship found in the data
set has a 12% probability of representing a false positive result (i.e. strong AIC
support with no real relationship between rainfall and maternal provisioning rate).

119
Supplementary Tables Chapter 3
Table S1. Summary of the sliding window analysis for the effect of heat waves and total rainfall on i) egg volume (i.e. pre-natal maternal
investment) and ii) maternal feeding rate (i.e. post-natal maternal investment). The start (‘Best Start’) and end (‘Best Stop’) of the top-performing
windows (‘0’ = laying date; their value represents days before egg laying) for each environmental index are shown along with their AIC support
(i.e. improvement in AIC compared to the baseline model). Randomisation tests (assessing the probability of false positive result) for
environmental effects on egg volume suggested a considerable probability of false positive regarding the quadratic rainfall effect, whereas this
probability was very low for the heat wave effect. For maternal feeding rates, random tests suggested a considerable probability of false positive
results for both the heat wave and the rainfall effects.
Biological response
Environmental index
Best Start (days) Best Stop (days) AIC AIC
support
Probability of false positive
i) Egg volume
Heat wave 13 0 918.07 -11.13 0%
Rainfall1 10 0 925.31 -3.90 -
Rainfall1 + Rainfall2 49 44 916.36 -12.90 12%
ii) Maternal feeding rate
Heat wave 58 51 282.23 -6.85 28%
Rainfall1 77 63 279.77 -7.23 -
Rainfall1 + Rainfall2 78 61 276.02 -10.97 12%

120
Table S2. Model selection table containing every model within ΔAIC < 6 explaining variation in egg volume. Three models passed the nesting
rule (‘Retained’, Richards, 2008). Standardised model coefficients are shown along with number of model parameters (‘k’), AIC, ΔAIC and
Akaike’s weight (‘w’).
Intercept
Number female helpers
Number male
helpers
Clutch size
Rainfall1 Rainfall2 Egg
position Heat
waves
Clutch size x
Number female helpers
Clutch size x
Number male
helpers
Egg position
X number female helpers
Egg position
X number
male helpers
k AIC ΔAIC w Retained
0.006 0.078 -0.069 -0.107 -0.119 -0.114 11 890.4 0 0.237 ✓
0.007 0.069 0.026 -0.068 -0.106 -0.118 -0.117 12 891.8 1.40 0.117
0.007 0.079 -0.069 -0.107 -0.116 -0.114 0.015 12 892.0 1.59 0.107
0.006 0.078 0.000 -0.069 -0.107 -0.118 -0.114 12 892.4 2.00 0.087
0.008 0.070 0.025 -0.068 -0.107 -0.116 -0.116 0.014 13 893.4 3.03 0.052
0.006 0.069 0.025 -0.068 -0.106 -0.120 -0.117 -0.011 13 893.5 3.16 0.049
0.007 0.069 0.026 0.003 -0.068 -0.106 -0.119 -0.116 13 893.8 3.39 0.043
0.011 0.081 0.006 -0.068 -0.108 -0.119 -0.113 0.021 13 893.8 3.47 0.042
0.007 0.079 0.001 -0.069 -0.107 -0.117 -0.114 0.015 13 894.0 3.59 0.039
-0.001 0.051 -0.067 -0.105 -0.120 -0.115 11 894.1 3.71 0.037 ✓
-0.008 -0.071 -0.104 -0.121 -0.109 10 894.4 4.05 0.031 ✓
0.008 0.071 0.024 -0.068 -0.108 -0.118 -0.117 0.021 -0.019 14 894.8 4.44 0.026
0.012 0.072 0.025 0.009 -0.068 -0.107 -0.119 -0.115 0.020 14 895.3 4.93 0.020
0.009 0.070 0.026 0.004 -0.068 -0.107 -0.117 -0.116 0.014 14 895.4 5.01 0.019
0.004 0.070 0.024 -0.004 -0.067 -0.107 -0.118 -0.118 -0.019 14 895.4 5.08 0.019
0.006 0.069 0.026 0.002 -0.068 -0.106 -0.121 -0.117 -0.011 14 895.5 5.15 0.018

121
0.011 0.081 0.006 -0.069 -0.108 -0.117 -0.113 0.017 0.009 14 895.7 5.33 0.017
-0.002 0.051 -0.067 -0.106 -0.122 -0.116 -0.010 12 895.9 5.51 0.015
-0.002 0.050 -0.003 -0.067 -0.105 -0.119 -0.115 12 896.1 5.70 0.014
-0.008 -0.009 -0.071 -0.105 -0.118 -0.109 11 896.3 5.97 0.012

122
Table S3. Summary of models within a ΔAIC value of six explaining variation in egg volume, partitioning within- (prefix ‘Δ’) and among-mother
(prefix ‘µ’) variation in the number of helpers. Three models passed the nesting rule (‘Retained’; see ‘Methods’; Richards, 2008). Standardised
model coefficients are shown along with number of model parameters (‘k’), AIC, ΔAIC and Akaike’s weight (‘w’).
Intercept Δfemale helpers
µfemale helpers
Δmale helpers
µmale helpers
Rainfall1 Rainfall2 Egg
position Heat
waves k AIC ΔAIC w Retained
-0.006 0.061 -0.068 -0.108 -0.119 -0.114 11 890.5 0 0.285 ✓
-0.006 0.055 0.019 -0.067 -0.107 -0.118 -0.116 12 892.0 1.45 0.138
0.001 0.061 0.032 -0.068 -0.107 -0.118 -0.114 12 892.2 1.72 0.121
-0.002 0.061 0.030 -0.068 -0.107 -0.118 -0.114 12 892.3 1.74 0.120
0.001 0.055 0.032 0.019 -0.067 -0.107 -0.118 -0.116 13 893.7 3.16 0.059
-0.002 0.055 0.019 0.030 -0.067 -0.107 -0.118 -0.116 13 893.7 3.18 0.058
0.001 0.061 0.022 0.019 -0.068 -0.107 -0.118 -0.114 13 894.2 3.64 0.046
-0.006 0.038 -0.066 -0.106 -0.120 -0.115 11 894.3 3.79 0.043 ✓
-0.008 -0.071 -0.104 -0.121 -0.109 10 894.4 3.90 0.041 ✓
0.001 0.055 0.022 0.019 0.019 -0.067 -0.107 -0.118 -0.116 14 895.6 5.08 0.022
0.001 0.031 0.039 -0.067 -0.105 -0.120 -0.115 12 896.0 5.52 0.018
-0.002 0.039 0.029 -0.067 -0.105 -0.120 -0.115 12 896.1 5.54 0.018
-0.002 0.024 -0.071 -0.104 -0.121 -0.109 11 896.3 5.74 0.016
-0.004 0.021 -0.071 -0.104 -0.121 -0.109 11 896.3 5.77 0.016

123
Table S4. Models within a ΔAIC of six explaining variation in maternal provisioning rate. Twenty-six models scored a ΔAIC lower than six of which
8 passed the nesting rule (‘Retained’, Richards, 2008). Standardised model coefficients are shown along with number of model parameters (‘k’),
AIC, ΔAIC and Akaike’s weight (‘w’).
Intercept Number female helpers
Number male
helpers
Brood size
Rainfall1 Rainfall2 Heat
waves
Number female
helpers X Brood
size
Number male
helpers X Brood
size
k AIC ΔAIC w Retained
0.004 -0.181 0.461 0.147 0.212 0.211 10 269.8 0 0.172 ✓
-0.019 -0.167 -0.091 0.448 0.143 0.217 0.188 -0.121 12 270.8 0.93 0.108
0.000 -0.176 -0.076 0.453 0.140 0.211 0.196 11 271.0 1.18 0.095
0.005 -0.180 0.463 0.150 0.211 0.209 0.014 11 271.8 1.97 0.064
-0.037 -0.172 -0.057 0.456 0.134 0.220 0.200 -0.124 13 272.0 2.19 0.058
-0.018 -0.163 -0.092 0.458 0.153 0.214 0.183 0.054 -0.134 13 272.4 2.56 0.048
-0.013 -0.182 -0.049 0.458 0.133 0.213 0.203 12 272.4 2.57 0.048
-0.019 -0.154 -0.128 0.436 0.192 0.237 -0.128 11 272.9 3.04 0.038 ✓
0.000 -0.175 0.461 0.208 0.237 9 272.9 3.07 0.037 ✓
0.001 -0.175 -0.076 0.456 0.143 0.210 0.194 0.015 12 273.0 3.15 0.036
0.013 0.463 0.157 0.213 0.199 9 273.1 3.23 0.034 ✓
-0.007 -0.170 -0.111 0.449 0.193 0.233 10 273.2 3.40 0.031
-0.013 -0.114 0.446 0.158 0.219 0.163 -0.135 11 273.3 3.46 0.031
-0.037 -0.168 -0.056 0.468 0.144 0.217 0.194 0.061 -0.139 14 273.6 3.71 0.027

124
0.009 -0.090 0.453 0.152 0.211 0.179 10 274.0 4.16 0.021
-0.017 -0.150 -0.127 0.449 0.203 0.232 0.067 -0.146 12 274.3 4.49 0.018
-0.012 -0.180 -0.049 0.462 0.136 0.212 0.201 0.018 13 274.4 4.53 0.018
-0.012 -0.147 0.432 0.200 0.237 -0.147 10 274.4 4.58 0.017 ✓
-0.028 -0.155 -0.114 0.439 0.186 0.240 -0.129 12 274.7 4.81 0.016
0.001 -0.172 0.467 0.213 0.235 0.031 10 274.8 4.95 0.014
0.013 -0.182 0.417 0.156 0.238 9 274.9 5.02 0.014 ✓
-0.017 -0.173 -0.096 0.453 0.188 0.236 11 275.0 5.15 0.013
-0.006 -0.168 -0.110 0.455 0.198 0.231 0.027 11 275.2 5.31 0.012
0.013 0.461 0.216 0.235 8 275.5 5.61 0.010 ✓
0.009 -0.124 0.445 0.201 0.230 9 275.5 5.62 0.010
0.023 -0.187 0.433 0.300 8 275.8 5.92 0.009 ✓

125
Table S5. Summary of models within a ΔAIC value of six explaining variation in maternal provisioning rate, partitioning within- (prefix ‘Δ’) and
among-mother (prefix ‘µ’) variation in the number of helpers. The first three models (i.e. strongest statistical support from the data) suggest a
negative effect of within-mother variation in female helper number on maternal provisioning rate (i.e. plasticity to the number of female helpers).
There was much lower support for such an effect of the number of male helpers. ‘Retained’ refers to whether a given model passes the nesting
rule by Richards (2008). Standardised model coefficients are shown along with number of model parameters (‘k’), AIC, ΔAIC and Akaike’s weight
(‘w’).
Intercept Δ female helpers
µ female helpers
Δ male helpers
µ male helpers
Brood size
Rainfall1 Rainfall2 Heat waves k AIC ΔAIC w Retained
0.004 -0.130 -0.117 0.462 0.147 0.212 0.211 11 271.8 0 0.101 ✓
0.004 -0.150 -0.112 0.468 0.147 0.215 0.194 11 272.2 0.34 0.086 ✓
0.008 -0.135 0.478 0.150 0.214 0.206 10 272.2 0.37 0.084 ✓
0.009 -0.122 0.447 0.154 0.210 0.204 10 272.5 0.70 0.071 ✓
0.002 -0.142 -0.092 -0.082 0.458 0.146 0.213 0.201 12 272.8 0.99 0.062
0.013 0.463 0.157 0.213 0.199 9 273.1 1.23 0.055 ✓
0.002 -0.124 -0.123 -0.038 0.457 0.143 0.211 0.204 12 273.6 1.79 0.041
0.011 -0.094 0.454 0.159 0.213 0.185 10 273.7 1.88 0.040
0.008 -0.105 -0.060 0.444 0.156 0.210 0.195 11 274.0 2.18 0.034
0.005 -0.132 -0.060 0.442 0.148 0.208 0.193 11 274.0 2.18 0.034
0.004 -0.151 0.005 -0.113 0.469 0.148 0.215 0.195 12 274.2 2.34 0.032
0.007 -0.133 -0.014 0.477 0.149 0.214 0.203 11 274.2 2.34 0.031
0.002 -0.144 -0.131 0.465 0.203 0.238 10 274.5 2.66 0.027 ✓

126
0.001 -0.138 -0.097 -0.021 -0.078 0.456 0.143 0.212 0.198 13 274.8 2.94 0.023
0.011 -0.036 0.461 0.153 0.212 0.191 10 274.9 3.05 0.022
0.000 -0.123 -0.116 0.461 0.208 0.237 10 274.9 3.07 0.022 ✓
0.006 -0.126 0.476 0.210 0.238 9 275.0 3.19 0.021 ✓
0.008 -0.121 0.445 0.214 0.234 9 275.2 3.38 0.019 ✓
0.013 0.461 0.216 0.235 8 275.5 3.61 0.017 ✓
-0.003 -0.139 -0.084 -0.102 0.457 0.203 0.237 11 275.5 3.64 0.016
0.011 -0.114 0.449 0.213 0.234 9 275.6 3.76 0.015
0.011 -0.025 -0.092 0.452 0.156 0.213 0.180 11 275.6 3.79 0.015
0.005 -0.115 -0.051 -0.051 0.440 0.150 0.209 0.187 12 275.7 3.82 0.015
0.002 -0.136 -0.090 0.435 0.200 0.229 10 276.1 4.22 0.012
-0.005 -0.112 -0.129 -0.072 0.452 0.197 0.233 11 276.2 4.33 0.012
0.008 -0.096 -0.082 0.440 0.212 0.233 10 276.3 4.49 0.011
0.000 -0.139 -0.030 -0.127 0.462 0.198 0.236 11 276.4 4.54 0.010
0.004 -0.119 -0.048 0.471 0.203 0.235 10 276.7 4.86 0.009
0.011 -0.067 0.454 0.206 0.232 9 276.8 4.97 0.008
0.013 -0.126 -0.122 0.416 0.156 0.238 10 276.9 5.02 0.008 ✓
-0.006 -0.129 -0.097 -0.053 -0.091 0.451 0.195 0.234 12 277.1 5.26 0.007
0.010 -0.054 -0.108 0.444 0.205 0.232 10 277.2 5.34 0.007
0.017 -0.132 0.432 0.157 0.235 9 277.3 5.42 0.007 ✓
0.017 -0.128 0.404 0.166 0.228 9 277.3 5.42 0.007 ✓

127
0.013 -0.147 -0.109 0.422 0.152 0.225 10 277.5 5.61 0.006
0.003 -0.114 -0.078 -0.067 0.432 0.200 0.229 11 277.5 5.65 0.006
0.023 -0.134 -0.121 0.433 0.300 9 277.8 5.92 0.005 ✓

128
Table S6. Summary of Gaussian models explaining variation in clutch size. The intercept-only model received the strongest support from the
data and was the only one passing the nesting rule (‘Retained’, Richards, 2008). Standardised model coefficients are shown along with number
of model parameters (‘k’), AIC, ΔAIC and Akaike’s weight (‘w’).
Intercept Number female
helpers Number male
helpers Clutch order k AIC ΔAIC w Retained
-0.044 5 945.40 0 0.213 ✓
-0.039 -0.071 6 946.10 0.68 0.152
-0.047 -0.071 6 946.10 0.69 0.151
-0.035 0.061 6 946.20 0.76 0.146
-0.039 -0.068 0.058 7 947.00 1.56 0.098
-0.032 -0.065 0.055 7 947.10 1.66 0.093
-0.042 -0.062 -0.062 7 947.10 1.69 0.092
-0.035 -0.060 -0.057 0.053 8 948.20 2.74 0.054

129
Table S7. Summary of Poisson mixed models explaining variation in the number of clutches laid per year. The model with ‘Total rainfall’ as a
single predictor received the strongest support from the data and was the only one passing the nesting rule (‘Retained’, Richards, 2008).
Removing this term caused a decrease in AIC of 10.12. Standardised model coefficients are shown along with number of model parameters (‘k’),
AIC, ΔAIC and Akaike’s weight (‘w’).
Intercept Number female
helpers Number of
male helpers Total
rainfall k AIC ΔAIC w Retained
0.832 0.159 4 710.4 0 0.468 ✓
0.831 0.039 0.158 5 711.7 1.25 0.251 0.832 0.019 0.155 5 712.3 1.82 0.188 0.831 0.009 0.037 0.156 6 713.7 3.21 0.094

130
131
Chapter 4
Dispersal and the evolution of sex differences in cooperation
Contributions by:
Pablo Capilla-Lasheras1, Nina Bircher2, Xavier Harrison1, Thomas Reed3, Jenny
E. York4, Dominic L. Cram4, Christian Rutz5, Lindsay Walker6, Marc Naguib2,
Andrew J. Young1
Affiliations:
1 Centre for Ecology and Conservation, University of Exeter, Penryn, TR10
9FE, UK
2 Behavioural Ecology Group, Wageningen University & Research, Wageningen, The
Netherlands
3 School of Biological, Earth and Environmental Sciences, University College
Cork, Cork, Ireland
4Department of Zoology, Downing Street, University of Cambridge, Cambridge,
CB2 3EJ, UK.
5 Centre for Biological Diversity, School of Biology, University of St Andrews, Sir
Harold Mitchell Building, St Andrews KY16 9TH, UK
6Phychology, Washington Singer Building, University of Exeter, Exeter, EX4 4QG,
UK

132
4.1. Abstract
Sex differences in contributions to cooperation within the natal group are
widespread in animal societies but their evolutionary origins remain poorly
understood. The philopatry hypothesis proposes that the more philopatric sex may
contribute more to natal cooperation as it stands to gain a greater downstream
direct fitness payoff from natal cooperation. Here we provide novel support for the
philopatry hypothesis by demonstrating that a cooperative bird with female-biased
philopatry (a rare reversal of the typical avian pattern of philopatry) shows an
unusual female bias in natal cooperative generosity. That this occurs in the absence
of a sex difference in relatedness to recipients is consistent with the hypothesised
role for direct fitness payoffs in shaping sex differences in cooperation. While it is
typically suggested that the more philopatric sex stands to gain a greater direct
fitness benefit from natal cooperation if it is more likely to breed within the natal
group, this mechanism cannot readily account for our findings, as this species shows
no sex difference in the probability of inheriting a dominant (breeding) position
within the natal group. Our findings point instead to a role for sex differences in the
direct costs of cooperation: where investment in cooperation trades-off against
extra-territorial prospecting, the less philopatric sex may experience a greater direct
cost of natal cooperation, given its greater need to prospect for dispersal
opportunities. Using a large-scale automated radio-tracking study, we demonstrate
that the less philopatric sex (males) does indeed prospect at higher rates, both
during and outside peak periods of cooperation. Our findings lend new strength to
the philopatry hypothesis and highlight the possibility that patterns of philopatry
shape sex differences in cooperation via impacts on the sex-specific costs, as well as
benefits, of cooperation.

133
4.2. Introduction
Sex differences in contributions to cooperative behaviour are widespread in social
species but their evolutionary origins remain poorly understood (Cockburn, 1998;
Clutton-Brock et al., 2002; Hodge, 2007; Williams & Hale, 2007). In many
cooperatively breeding societies, for example, offspring of both sexes delay dispersal
from their natal groups and help to rear future generations of offspring born to a
dominant breeding pair; these male and female helpers often differ in their
contributions to this cooperative care (Cockburn, 1998; Koenig & Dickinson, 2016).
These sex differences in natal cooperation are interesting as they can occur in the
absence of sex differences in relatedness to recipients, suggesting a role for sex
differences in direct fitness payoffs in shaping their evolution (Johnstone & Cant,
2008). The philopatry hypothesis proposes that such sex differences in natal
cooperation arise because the more philopatric sex stands to gain a greater
downstream direct fitness payoff from cooperation (Clutton-Brock et al., 2002;
Young et al., 2005). The observation that female helpers frequently contribute more
to natal cooperation in cooperative mammals (e.g. Ostermeyer & Elwood, 1984;
Owens & Owens, 1984; Clutton-Brock et al., 2002; Zo ttl et al., 2016; which typically
show female-biased philopatry, Greenwood, 1980) while the reverse is often true in
cooperatively breeding birds (Stallcup & Woolfenden, 1978; Curry, 1988; Cockburn,
1998; Legge, 2000; Canestrari et al., 2005; which typically show male-biased
philopatry) is broadly consistent with this view. However, the rarity of sex-reversed
philopatry within either clade leaves the hypothesis challenging to test (though see
Williams & Hale, 2007). It is also unclear whether sex differences in philopatry may
shape sex differences in natal cooperation principally via impacts on the sex-specific
direct fitness benefits or costs of cooperation (Clutton-Brock et al., 2002; Young et
al., 2005; Hodge, 2007; Downing et al., 2018).

134
It is typically suggested that the more philopatric sex may contribute more to natal
cooperation because it stands to gain a greater direct fitness benefit from
cooperation (Clutton-Brock et al., 2002; Downing et al., 2018). The more philopatric
sex may stand to gain greater downstream direct fitness benefits from natal
cooperation whenever the continued accrual of such benefits is contingent upon
remaining within the natal group. For example, the more philopatric sex may be
more likely to inherit a breeding position within the natal group, and so could be
more likely to be helped back by those individuals that they have helped to rear
(Woolfenden & Fitzpatrick, 1978; Clutton-Brock et al., 2002; Downing et al., 2018).
The more philopatric sex could also stand to gain differential direct fitness benefits
from natal cooperation prior to dominance (breeding position) acquisition, if, for
example, helping increased the size of the natal group and group size enhanced the
survival of all residents (e.g. as envisaged under the group augmentation hypothesis
for the evolution of helping; Kokko et al., 2001; Kingma et al., 2014). Given the rarity
of evidence of a role for direct fitness benefits in shaping animal cooperation,
compelling evidence that sex differences in cooperation are a product of sex
differences in direct benefits would be of particular interest. While a number of
studies have suggested that this is the case (Clutton-Brock et al., 2002; Downing et
al., 2018), empirical associations between sex differences in philopatry and
cooperation could instead reflect a role for sex differences in the direct costs of
cooperation (Young et al., 2005; Hodge, 2007; Williams & Hale, 2007).
Helping has the potential to be more costly for the more dispersive (i.e. less
philopatric) sex if individuals face a trade-off between investing in helping within
the natal group and activities that enhance their dispersal prospects, such as

135
prospecting for dispersal opportunities outside the natal territory (Young et al.,
2005). Helpers in many animal societies are known to carry out extra-territorial
prospecting movements (Doerr & Doerr, 2005; Young et al., 2005, 2007; Mares et al.,
2014). Prospecting can yield direct fitness benefits if it increases the likelihood of
successful dispersal to a breeding position outside the natal group (Doerr & Doerr,
2005) and could also yield an immediate fitness payoffs if prospectors also engage
in extra-group mating (Young et al., 2007). Prospecting movements are likely to
trade off against helping at the natal group, simply because helping and prospecting
cannot be carried out at the same time, but also because costs associated with
prospecting (e.g. energetic costs and/or exposure to stressors; Young & Monfort,
2009; Kingma et al., 2016) have the potential to reduce the ability of individuals to
help upon their return to the natal territory (Young et al., 2005; Ridley et al., 2008;
Young & Monfort, 2009; Kingma et al., 2016). Frequent prospectors may also reduce
their contributions to cooperation more generally, in order to maintain traits (e.g.
competitive body condition) that promote successful prospecting and/or dispersal.
There are, however, very few studies of extra-territorial prospecting behaviour,
doubtless due in part to the difficulty of studying the cryptic, fast and long distance
movements that prospectors make (Doerr & Doerr, 2005; Young et al., 2007; Kingma
et al., 2016). As such, whether sex differences in prospecting have the potential to
explain sex differences in cooperation via impacts on the sex-specific costs of
cooperation remains poorly understood (Young et al., 2005; Williams & Hale, 2007).
The philopatry hypothesis has received comparatively little attention to date due in
part to the rarity of species that show sex-reversed philopatry relative to the
mammalian and avian norms, with which to test the prediction that such species
should also show sex-reversed patterns of cooperation. In meerkats (Suricata

136
suricatta), for example, female helpers are more philopatric than male helpers and,
as predicted by the philopatric hypothesis, female helpers contribute more than
male helpers towards cooperative care of offspring (Clutton-Brock et al., 2002).
Brown jays (Cyanocorax morio) are unusual among birds in that they also show
female-biased philopatry, and in this species female helpers also invest more than
male helpers in cooperative care of offspring (Williams & Hale, 2007). A comparative
study of cooperatively breeding birds has also recently tested the hypothesis that
sex differences in the probability of inheriting a breeding position within the natal
group drive sex differences in cooperative effort (i.e. one route through which sex
differences in philopatry could yield a sex difference in the direct benefits of
cooperation; Downing et al., 2018). Downing et al. (2018) found that the sex that is
more likely to breed in their natal territory invests more in cooperative helping.
However, this analysis could be confounded by sex differences in the mean
relatedness of helpers to their recipients, as it did not explicitly isolate sex
differences in cooperative effort of individuals within their natal groups. As such,
helpers of the sex that is less likely to inherit a natal breeding position (most likely
the more dispersive sex) may be more likely to contain immigrants, who may help
less given their likely lower mean relatedness to recipients. It is therefore unclear to
what extent the association is attributable to a role for kin selection versus sex
differences in the direct benefits of helping (or indeed sex differences in its direct
costs, which may be higher for the more dispersive sex; see above).
Here we test the philopatry hypothesis in a cooperatively breeding bird that shows
female-biased philopatry; a rare reversal of the typical avian sex bias in philopatry
(Greenwood, 1980). Note that we follow a broad definition of this hypothesis, an
association between sex differences in natal cooperation and sex differences in

137
philopatry due to sex differences in downstream direct fitness payoffs from
cooperation (Young et al., 2005), regardless of whether sex differences in
cooperation principally arise from sex-specific direct fitness benefits or costs of
cooperation. If the hypothesis holds, female helpers should contribute more to natal
cooperation than male helpers, a pattern rarely seen in birds (Cockburn, 1998;
Williams & Hale, 2007; Downing et al., 2018). We then investigate the potential for
sex differences in the species dispersal behaviour to have selected for sex differences
in natal cooperation via impacts on the sex-specific direct fitness benefits and costs
of cooperation. White-browed sparrow-weavers are passerine birds distributed
across East and Southern Africa (Collias & Collias, 1978; Lewis, 1982a). This species
lives in social groups of 2-12 birds, in which a single dominant male and female
monopolise within-group reproduction and offspring of both sexes delay dispersal,
forego reproduction and help to feed future generations of nestlings produced by
the dominant pair (Lewis, 1982a; Harrison et al., 2013a). Analyses of population
genetic structure, coupled with direct observations of dispersal distances between
birth and breeding locations, reveal that this species is unusual among birds in
showing female-biased philopatry (Harrison et al., 2014). Whether, as the philopatry
hypothesis would predict (see definition above), subordinate females do contribute
more to the cooperative feeding of offspring within the natal group is unknown.
While female subordinates do feed offspring at higher rates on average than male
subordinates (Chapter 2), this pattern could reflect a higher incidence of
subordinate immigrant males than females in our study population given female-
biased philopatry (as immigrants may help less than natal birds, given their likely
lower relatedness to recipients; see above). Field observations also suggest that this
species conducts extra-territorial prospecting forays (Lewis, 1982b; Harrison et al.,
2014), and the rarity of extra-group parentage by subordinates in this species

138
(Harrison et al. 2013) suggests that the primary function of such forays is to assess
dispersal opportunities in the surrounding population. Whether there is a sex
difference in prospecting in this species, and whether such prospecting occurs
during peak periods of natal cooperation (i.e. nestling feeding periods) is as yet
unknown.
Specifically, we first test the key prediction of the philopatry hypothesis: that female-
biased philopatry in this cooperative bird should have led to the evolution of female-
biased helping within the natal group (i.e. female helpers cooperatively feeding the
offspring of breeders at higher rates than male helpers). We then investigate in more
detail the nature of the sex difference in dispersal behaviour in this species, with a
view to shedding light on the extent to which it could have led to selection for sex
differences in natal cooperation via impacts on the sex-specific direct fitness benefits
or costs of cooperation. First, we investigate whether the more philopatric sex
(females) (i) is more likely to inherit a breeding position within its natal group,
and/or (ii) resides for longer within its natal group (due to either a lower incidence
or later mean age of dispersal from the natal group), given the potential for each to
impact a helper’s accrual of downstream direct fitness benefits from natal
cooperation (see above). Second, we conduct a unique large-scale automated radio-
tracking study to investigate whether the less philopatric sex (males) conducts
extra-territorial prospecting forays at higher rates (both during and outside peak
periods of cooperation), given the potential for trade-offs between cooperation and
prospecting to leave the direct fitness costs of cooperation higher in the sex that
relies more heavily on prospecting.

139
4.3. Methods
4.3.1. White-browed sparrow-weaver study population
White-browed sparrow-weavers live in semi-arid regions of South and Southeast
Africa. Our study population is located in Tswalu Kalahari Reserve in the Northern
Cape Province of South Africa (27°16’S, 22°25’ E). Field work was carried out from
September to May between 2007 and the 2017. Approximately 40 reproductive
units of white-browed sparrow-weavers were monitored, each one dominating a
small territory in an area of approximately 1.5 km2. Sparrow-weaver reproductive
groups were easily monitored and distinguished in the field as all group members
foraged together, engaged in weaving and territory defence, and roosted together in
individual woven chambers in a single tree or cluster of trees close to the centre of
their territory. All birds in our population are fitted with a single metal ring and three
colour rings for identification from the beginning of the study period (under
SAFRING license 1444).
Every white-browed sparrow-weaver group contains a single dominant
(reproductive) pair (Harrison et al., 2013a) and a variable number of subordinate
individuals (Chapter 2). Dominant and subordinate individuals are easily identified
in the field because they display a distinct set of behaviours. In every group,
dominant birds are in very close association and these two birds spend much time
foraging and duetting together (Walker et al., 2016). White-browed sparrow-weaver
groups were regularly monitored every one or two days to detect new clutches. Once
a new clutch was found, nests were checked daily until the clutch had been
completed. Then, clutches were checked 8 days after the first egg was laid to confirm
successful progress. Following this latter mid-incubation check, clutches were

140
checked daily starting 15 days after the first egg was laid until the fate (hatch or
failure) and hatching date of every egg was determined. Nestlings were ringed 13
days after hatching and were last observed in the nests 17 days after hatching. After
this day we did not inspect nests anymore to avoid premature fledging. The sex of
every individual could be determined after the first six months of life as our study
population present beak colour sexual dimorphism (Leitner et al., 2009).
White-browed sparrow-weaver group composition was assessed every week in the
early morning throughout every field season. Social groups were observed at least
once every week and birds were identified on the basis of their colour-ring
combination. In the course of these behavioural observations, we sometimes
observed non-resident birds (i.e. prospecting birds) in a given focal group. The
colour-ring combination of these prospecting birds was recorded when possible
between October 2011 and April 2017 but due to aggression from resident members
of the focal group, this information could be rarely collected. Additionally, birds were
routinely caught while roosting at night and this information was also used to define
group memberships.
4.3.2. Provisioning behaviour and weaving behaviour
Natural provisioning behaviour for subordinate individuals was recorded for
breeding attempts between 2007 and 2016. We collected provisioning behaviour
data using video-recordings between the 6th and 12th day after the first egg of a
given clutch hatched. Video recordings were watched using VLC media player and
data were extracted from every provisioning event: time of the feed, duration of the
feed, feeder sex (based on beak coloration; Leitner et al., 2009) and feeder identity
based on a unique vent pattern (see below) and colour-ring combination. For every

141
recorded breeding event, we always followed a standardised protocol at least five
days before data collection started, we (i) caught and marked the vent of every bird
in the group apart from the dominant female using hair dye (Chapter 2, Walker, 2015)
to aid video identification and (ii) deployed tripods in the field to acclimatise the
birds to its presence. On recording days, video cameras were set up in the morning
at standard times that tracked monthly changes in sunrise (Table S1). Provisioning
behaviour was recorded for approximately three hours per brood and day.
We calculated the number of feeds delivered by every individual in a given group. In
few cases, we did not get reliable bird identifications from the provisioning videos,
adding uncertainty to our observation of the individual feeds. We cleaned the
original data set to retain only those days of observation and individuals where there
were fewer than five feeds of uncertainty in our calculation (158 observations
excluded). We also discarded provisioning data from individuals of unknown sex
(one observation excluded) and of unknown social rank at a given time (six
observations excluded). The final data set contained 994 observations for the
number of feeds delivered by natal (i.e. part of the social unit in which they hatched)
subordinate individuals with accurate hatching date and therefore age (largest
possible error in individual’s age = ± 60 days). Within-nest cameras have confirmed
that all nest visits in which the birds are not conspicuously carrying grass entail the
visiting bird carrying a single food item to the nest and delivering it to the chicks
(Walker, 2015). No visits were non-provisioning visits and in no cases were visiting
birds observed to eat the delivered food item themselves (Walker, 2015). Using the
same data stream, we were also able to quantify individual contributions towards
weaving. Natal subordinates were recorded bringing grass to the nest and weaving

142
37 times (3.72% of a total of 994 days and individuals observed). With these data,
we investigated sex-differences in the probability of weaving.
4.3.3. Prospecting behaviour
4.3.3.1. Tracking of prospecting movements of subordinate individuals using
Encounternet
We used Encounternet to investigate prospecting movements of subordinate white-
browed sparrow-weavers. This technology allows automated simultaneous tracking
of multiple individuals (i.e. tags; Mennill et al., 2012). In short, the Encounternet
system is formed by stationary wireless receivers (hereafter ‘basenodes’) that log
tag pulses and record the ID number of the tag, the time and signal strength of the
tag pulse (Received Signal Strength Indication – RSSI). We set up Encounternet tags
(1.2 grams) to broadcast a digital pulse with their number ID every five seconds.
Between March and April 2017, we tagged 32 adult subordinate birds using a figure-
eight leg harness made of a stretchable, porous material obtained from common bike
baggage straps (Snijders et al., 2014, 2017). Tagged birds were all resident on their
natal territory (hereafter referred to as their ‘home’ territories for the purposes of
prospecting analyses) at the time of tagging and remained so for the duration of the
Encounternet deployement. Additionally, we built an array of 35 Encounternet
basenodes placed in a central tree of 35 contiguous white-browed sparrow-weaver
territories (Figure S1). Clock synchronisation across the 35 basenodes was checked
regularly with a maximum basenode time error of six seconds but normally between
0 and 1 second (hence logging times across basenodes were comparable). Basenode
batteries were changed every 10 days, before they were discharged.

143
To account for between receiver variation in detection sensitivity, we calibrated all
receivers before deployment. We attached two tags to a wooden pole with one of the
tag antennas positioned parallel and the other perpendicular relative to the
receiver’s antenna to account for different antenna angles when the tags were on
birds. To calibrate receivers, we held the tags on the pole at a fixed distance of two
meters and height of 1.70 meters for two minutes, resulting in 48 pulses with signal
strength values for each receiver. We then calculated the mean signal strength logged
by each receiver (meanRECEIVER) and the mean signal strength over all receivers
(meanRSSI). For 10 receivers with meanRECEIVER lower or higher than meanRSSI 1 sd,
we adjusted the signal strength value of all logs during analysis by |meanRSSI-
meanRECEIVER| to avoid an over or underestimation of the distance between tagged
birds and respective receivers.
We used RSSI signal strength values logged by receivers to estimate distances
between detected tags and receivers (Mennill et al., 2012; Snijders et al., 2014) using
a calibration RSSI-distance curve (Figure S2). To determine the relationship between
signal strength and distance we placed two tags (one with antenna placed parallel
and one perpendicular relative to the receiver antenna) on a wooden pole at
different distances along 10 transects throughout the study site. At each distance, we
held the pole in position for four minutes, placing tags for two minutes at 1.70
meters of height and two minutes on the ground, simulating birds in different
positions and different heights. We chose transects between receivers placed on
roosting trees of neighbouring groups and measured signal strength values every 10
meters, starting at two meters from the receiver up to a maximum of 120 meters.
For one transect, we started at eight meters from the receiver, measuring every 10
meters up to 108 meters. We then used a RSSI-distance regression including all

144
transect measures to predict the signal strength at 50 m (obtaining a value of -11.48
RSSI). We subsequently used the signal strength at 50 meters to inform the decision
of whether or not to treat a bird as present in its home territory (Figure S3). Tags
were detected 89% 23% of the time (mean standard deviation, SD) when within
20 meters and 76% 34% of the time (mean SD) when within 50 meters of a
receiver.
4.3.3.1. Encounternet data processing
Basenode log files were arranged to generate files that contained logs from a given
bird only. This produced 32 files, each corresponding to a different tagged bird.
These ‘bird files’ were then processed one at a time. First, we discarded logs in the
first day that a given bird carried a tag and we also discarded logs from the day
following a catching session at a bird’s home territory. Then, logs were explored in
moving windows of 15 seconds of total length, in time steps of 5 seconds. For each
of these 15-sec windows, a basenode location was assigned following the set of rules
described in Figure S3. This algorithm resulted in a location assignment every 5
seconds. Individual birds were assigned known locations (either their ‘home’
territory or any other territory in the study site with an Encounternet basenode) on
average 64% of their total tracked time (ranging between 94% and ~0% per bird;
Figure S4). Five birds were excluded from further analyses as they were assigned to
known locations only for a low percentage of their total tracked time (< 30% - Figure
S4a), due most likely to tag failure (Figure S4b). Excluding these five birds, the
average proportion of the time that birds were assigned locations within the study
site increased to 73%. Consecutive time intervals assigned to the same location were
then combined to represent time intervals of presence in a given territory. Location
information was not recorded when birds were not assigned to any basenode. Using

145
this data set, we identified individual forays as time periods when birds were not
present at home and were assigned elsewhere. In order to ensure that movements
of birds to the boundaries of their home territory were not misclassified as extra-
territorial prospecting forays, we defined forays as incidences in which the bird’s
furthest assigned location was more than 250 meters from their home territory and
the foray lasted more than 15 seconds (i.e. three location assignments in a row, at
five second intervals). As neighbouring groups within our study site are always
within 250 m of each other (Figure S1), all ‘forays’ constituted movements beyond
the territories of neighbouring groups. This conservative approach will leave our
analyses underestimating the true incidence of local forays by excluding true forays
to neighbouring groups, but shared territory boundaries already provide the
members of neighbouring groups with ample opportunity to interact without the
need to conduct dedicated extra-territorial forays. For each foray, we calculated the
time elapsed between the focal bird’s first detection outside their home territory to
their subsequent first detection back on their home territory (‘foray duration’) and
the linear distance between the bird’s home territory and the furthest assigned
territory location for the foray (‘foray distance’).
4.3.4. Statistical methods
4.3.4.1. Modelling individual provisioning rate, feed duration, feed type and
individual contributions to weaving
Variation in the number of provisioning events recorded for individual subordinate
white-browed sparrow-weavers was analysed using a zero-inflated negative
binomial generalised linear mixed model using the R package ‘glmmADMB’
(Fournier et al., 2012). When there was uncertainty in our observations for
individual number of feeds per video session (always < ± 2.5 feeds, see above), we
146
calculated the average between the lowest and the highest possible values (for 754
out of 994 observations of individual number of feeds, we observed the number of
individual feeds accurately; there was ± 0.5 feeds of uncertainty for 116 individual
observations, ± 1 feed for 56 observations, ± 1.5 feeds for 37 observations, and > ± 2
feeds for 21 individual observations of the number of feeds). We included the sex of
the provisioning individual, their age (a 3-level factor: “age < 1 year”, “1 year < age <
2 years” and “age > 2 years”), the interaction between sex and age, brood size (1 to
3 nestlings) and brood age (from 6 to 12 days old) as fixed effect predictors. We
added the duration of data collection per session as an offset to model variation in
provisioning rate (feeds / hour). Social group ID, clutch ID, season and individual ID
were included as random intercepts. The model was fitted to 994 observations of
the number of individual feeds in 321 video sessions from 243 subordinate
individuals for 132 different clutches in 32 different social groups. We found
evidence for important zero-inflation (zero-inflation parameter = 0.168 ± 0.052 SE)
and over-dispersion (dispersion parameter = 3.047 ± 0.527 SE) accounted by our
zero-inflated negative binomial model.
Using the same data set (containing a total of 4,736 feeding events), we analysed
feeding duration fitting a linear mixed model and including the same fixed and
random effects as for the analysis of feeding rates (see above). Feeding visit duration
was ‘log+1’ transformed to fulfil the assumption of normality in model residuals.
For 1,287 feeding events, the beak of the provisioning bird was visible and we
categorised the food item as ‘small’ or ‘large’ if it was smaller or larger than the beak
of the bird. Using this data set, we analysed the probability of feeding a large food

147
item fitting a (binomial) generalised linear mixed model which contained the same
fixed and random effects as for the analysis of individual feeding rates (see above).
Lastly, the probability of weaving was analysed using a binomial generalised linear
mixed model including the same fixed and random effects than for the model of
individual provisioning rate (as described above).
4.3.4.2. Modelling individual dispersal timing
Sex differences in direct benefits from cooperation may arise if each sex spends a
different amount of time in their natal territory. Therefore, we investigated any sex
difference in the length of the natal tenure by modelling the age-specific probability
of disappearance form the natal territory for birds older than one year (before this
age, dispersal from the natal territory is very low). This analysis contained
individuals hatched between 2007 and April 2014 but utilised group census data up
until April 2016, and so every individual included in the analysis was given at least
two years to disperse. Whether or not an individual dispersed in a given twelve
month window of their life was evaluated until the point of their disappearance from
the group (i.e. individuals were only included in the analysis for those twelve-month
windows of their lives for which they present within their natal group at the start
and in a subordinate position. Individuals ceased to feature in the data set for any
twelve-month windows in their life that either followed their disappearance from
the natal group or started beyond April 2016). Then, we modelled the probability of
disappearance from the natal group fitting a binomial generalised linear mixed
model. The model included age as a categorical variable (with four level: ‘1-2y’,2-3y’,
3-4y’, ‘>4y’), sex and the interaction between age and sex as fixed effects. Breeding
season of hatching and individual ID were included as random effect intercepts. For

148
85 individuals with known dispersal territories, we explained variation in dispersal
distance using a liner mixed model that included sex as a fixed effect and, breeding
season of hatching and natal group as random intercepts.
4.3.4.3. Modelling prospecting behaviour
Following our definition of prospecting forays (see above), we carried out three
complementary analyses to explain variation in (i) the daily number of prospecting
forays (Poisson trait; number of prospecting forays per day; ‘prospecting rate’); (ii)
prospecting foray duration (Gaussian trait) and (iii) distance between the home
territory and the furthest away visited territory per prospecting foray (‘foray
maximum distance ‘Gaussian trait). We used generalised linear mixed models
(GLMM) for the daily rate of prospecting and linear mixed models (LMM) for foray
duration and foray maximum distance. Poisson GLMMs were checked for over-
dispersion by simulating scaled model residuals 1,000 times in the R package
‘DHARMa’ (Hartig, 2018) and assessing their uniformity. These models were also
checked for zero-inflation in a similar way (i.e. assessing whether the model
predicted significantly fewer zeros than observed in the data). We did not find
statistical evidence for over-dispersion or zero-inflation in these models.
In the four models outlined above, we included the same set of fixed effect predictors:
age of the individual, its sex, breeding stage (‘provisioning’ yes or no for whether
offspring existed in the home territory) as well as the interaction between sex and
breeding stage. Bird ID, home territory ID and day of the year were included as
random intercept terms. The analysis of prospecting behaviour comprised 27
individuals, 13 males and 14 females, hatched between September 2013 and January
2017; there was no statistical difference between the age of male and female

149
subordinates included in the prospecting analysis (linear model, ‘sex’ (male) effect
= 208.4 ± 170.8 days, t = 1.22, p = 0.234).
4.3.4.4. General statistical approach
Unless otherwise stated, we used Akaike’s Information Criterion (AIC, Burnham et
al., 2011) to rank models based on their fit to the data. We fully considered models
within a ΔAIC value of six (i.e. AIC difference between a given model and the most-
supported model, whose ΔAIC equals to zero) and applied the nesting rule suggested
by Richards (2008) to simplify the final set of candidate models (Harrison et al.,
2018). We then discuss our results based on the statistical evidence (i.e. ΔAIC) from
a set of models explaining the data. Statistical analyses were carried out using R 3.6.0.
(R Core Team, 2019). Continuous model predictors were mean centered and
standardise to one standard deviation to ease the comparison of their effect sizes
(Gelman & Hill, 2007).
4.4. Results
4.4.1. Female-biased natal cooperation in the absence of sex differences
in relatedness to recipients
Statistical modelling of the cooperative provisioning rates of subordinate males and
females within their natal groups revealed strong support for sex, age, brood size
and brood age effects (Table S2 & see Table 1 for the effect sizes for the top model).
The top model (i.e. that which scored the lowest AIC) contained these four predictors
and no interaction terms. Removing any one of these terms from the top model
reduced support for the model by 10.86 or more AIC points (Table S2). Subordinate
females fed broods at higher rates than subordinate males (Figure 1a). Subordinate

150
provisioning rates increased initially with advancing age and then plateaued (Figure
S5). There was no statistical support for an interaction between sex and age,
indicating that the magnitude of the sex difference in provisioning rate remained
stable with age (Figure S5; Table S2). Brood size and brood age both positively
predicted subordinate provisioning rates (Table 1).
We also found strong evidence of a sex difference in the duration of provisioning
visits. Subordinate females spent longer than subordinate males in the nest with the
brood on each provisioning visit (Figure 1c; Table S3a). The higher provisioning
rates of subordinate females cannot be readily attributed to them feeding the
offspring with smaller food items than males, as there was no sex difference in the
probability that subordinates provisioned offspring with a food item that was large
(Figure 1d; Table S3b). These sex differences in the cooperative provisioning
behaviour of subordinates within their natal groups occurred in the absence of sex
differences in relatedness to recipients (i.e. the dominant breeding pair or the
offspring being fed; Figure 1b; Table S4).

151
Figure 1. Sex differences in the cooperative contributions to nestling
provisioning of subordinates within their natal groups. Analyses are based on
994 observation periods of individual provisioning rates by 243 natal subordinates
to 132 broods in 32 social groups. (a) Natal subordinate females provisioned
offspring at higher rates than natal subordinate males (see Tables 1 & S2). (b) These
sex differences in helping behaviour occurred in the absence of a sex difference in
the genetic relatedness of these natal subordinates to the dominant (breeding) birds
(‘Dom. female’ and ‘Dom. male’) or the offspring that they were feeding (Table S4;

152
based on 12 microsatellite markers; for details see Harrison et al. (2013a). (c) Natal
subordinate females also spent more time with nestlings (i.e. time within the nest)
than natal subordinate males, during each provisioning visit (Table S3). (d) There
was no sex difference in the probability of subordinates provisioning the brood with
a food item that was large (Table S3). Transparent points represent raw data
whereas larger black points and error bars give mean model predictions ± SE
(standard errors; in panel b SEs are not visible as they do not extend beyond the
marker for the mean estimate).
Table 1. Model coefficients of the best supported negative-binomial generalised
linear mixed model explaining variation in the cooperative contributions to
offspring provisioning of subordinates within their natal groups. The model
response term was the number of provisioning visits by the individual during a given
observation period, and the model included the duration of these observation
periods as an offset (thereby effectively modelling provisioning rate; feeds / hour).
The model accounted for zero-inflation (zero-inflation parameter = 0.16, SE = 0.03)
and over-dispersion (negative binomial dispersion parameter = 2.59, SE = 0.40).
Model coefficients are shown in the link-function scale (‘log’).
Fixed Effects
Terms Estimate SE Z Value
Intercept -1.762 0.454 -3.88
Sex (Male effect) -0.512 0.135 -3.80
Age (1 y -2 y) 0.499 0.132 -3.79
Age (> 2 y) 0.591 0.171 3.45
Brood age 0.097 0.027 3.58
Brood size 0.535 0.150 3.57
Random Intercepts
Variance estimate
Individual ID 0.518
Clutch ID 0.398
Group ID < 0.001
Year < 0.001

153
4.4.2. Female-biased philopatry without a female bias in the probability of
inheriting the breeding position within the natal group
Sex differences in dispersal incidence and timing
We observed 54 subordinate males and 31 subordinate females dispersing away
from their natal group, to another social group within our study population where
they then became resident. This pattern suggests a significantly male-biased
incidence of dispersal from the natal group (Binomial test against 50:50 distribution;
z = 2.46, p = 0.014). Indeed, statistical modelling of the age-specific probability of
dispersal from the natal group revealed robust evidence that subordinate males are
more likely to disperse from their natal groups than subordinate females across all
age classes (Figure 2a; Table S5; ‘sex’ appeared in every model within a ΔAIC value
of 8.70). There was also strong evidence that dispersal probability initially increased
with age before plateauing (Figure 2a; Table S5; ‘age’ appeared in every model
within a ΔAIC value of 47.12). There was no compelling evidence that the pattern of
age-related change in age-specific dispersal probability differed between the sexes
(Table S5; the best-fitting model containing the sex-by-age interaction scored 4.08
AIC higher [i.e. weaker support] than the top model).
Probability of inheriting the dominant (breeding) position within the natal group
We found no evidence of a sex difference in the probability that subordinates that
had survived to adulthood (one year old) within their natal group ultimately
attained dominance within their natal group (Figure 2b; the intercept-only model
outperformed the model containing the ‘sex’ predictor by 1.58 AIC points). This
pattern may arise despite the evidence above of female-biased philopatry (Harrison
et al., 2014; and above) because when dominance turnovers did occur, it was rare in
both sexes for an individual born within the focal group to become the new dominant

154
(7 of 32 (21.86%) male dominance turnovers, 9 of 32 (28.13%) female dominance
turnovers; there was also no evidence of a sex difference in this likelihood: Fisher’s
exact test: χ2 = 0.33, df = 1, p = 0.564).
Figure 2. Sex differences in philopatry but not sex difference in probability of
dominance acquisition in the natal territory. (a) The probability of dispersal
from the natal territory after the first year of life was higher for subordinate males
than for subordinate females, across all age classes (Table S5). (b) However, there
was no evidence of a sex difference in the probability of inheriting a dominant
(breeding) position within the natal group (see results text). Raw data points along
with predicted means ± SE are shown for female and male subordinates (in panel b
SEs are not visible as they do not extend beyond the marker for the mean estimate).

155
4.4.3. Male-biased extra-territorial prospecting from the natal group
Direct observations of prospecting behaviour
On 678 occasions between October 2011 and April 2017 unexpected birds were
observed visiting groups in which they were not currently resident. While these
birds were often rapidly attacked by resident birds, leaving them difficult to identify,
we were able to identify the bird in 293 (43.2%) cases. Out of these 293 observed
events with identified birds, 185 involved males (63.1%), 107 involved females
(36.5%) and 1 (0.3%) involved birds of unknown sex. Although these observations
suggest male-biased prospecting behaviour given the approximately equal adult sex
ratio in our population, sex differences in the incidence of prospector sightings could
reflect sex differences in traits other than the incidence of, or time spent, prospecting
(e.g. sex differences in their behaviour when visiting other territories or in how they
are treated by resident birds could both generate sex differences in the probability
that forays are detected by human observers). We therefore utilised a novel
automated radio-tracking technology, Encounternet, to provide continuous high-
resolution information on the prospecting movements of subordinate natal males
and females for the first time in a cooperatively breeding species.
Automated radio-tracking study of prospecting behaviour
We deployed an Encounternet array of 35 receivers across our study population
(Figure S1) and tagged 32 subordinate birds living within their natal groups (but
used 27 birds for final analysis of prospecting movements, 13 males and 14 females;
Figure S4) with Encounternet radio tags (Mennill et al., 2012). Birds were tracked
for an average of 37 days (range = 11-59 days) generating a total of 22,518,022
detection logs (individual base-nodes log all tags that they detect, every 5 seconds).
After processing the data (see Methods), we detected a total of 953 extra-territorial

156
prospecting forays. A single foray was defined as a single continuous run (in time) of
location estimates for the bird which suggested that the bird was not on its resident
(natal) territory, during which the bird’s location was also estimated to be > 250m
away from the centre of its resident territory for > 15 seconds (Figure S1). As the
mean (± SE) distance between the centres of two neighbouring territories was 93.7
m (± 4.56 m), this typically meant that forays constituted movements beyond the
territories of neighbouring groups (Figure S1). This conservative approach will
minimise the chance that resident bird’s interactions with its neighbouring groups
are falsely interpreted as extra-territorial prospecting but is likely to underestimate
the true incidence of extra-territorial prospecting by excluding more local forays.
The 953 forays detected principally occurred between 06:00h and 19:00h (Figure
3a), with a median duration of 60 seconds (inter-quantile range = 30 - 160 seconds;
range 20 – 1,730 seconds (28.8 minutes)). The furthest from the natal group at
which we detected the birds on each of these forays showed a median of 359.8 m
(inter-quantile range = 269.2 – 396.4 m; range 251.1 – 1,013.1 m). This is likely to
be an underestimation of the true maximum prospecting distance for many forays
as our ability to detect forays over longer distances is constrained by the spatial scale
of our receiver array (see Figure S1).
This unique data set provides clear evidence for male-biased prospecting behaviour
in subordinates residing within their natal groups. Subordinate males showed
higher daily rates of prospecting than subordinate females (Figure 3b; Table 2) and
the magnitude of this sex difference was not affected by whether the bird’s social
group was provisioning young at the time (Figure 3b; Table 2). There was also some
evidence to suggest that prospecting rates were lower on average during
provisioning periods, when helping occurs, than at other times (Figure 3b; the

157
‘provisioning’ term was present in the top model, but was absent from a model 1.24
AIC points below; Tables 2). There was no evidence of an effect of subordinate sex
or provisioning periods on either foray duration or foray maximum distance (Table
S6); in both cases, the intercept-only model received the strongest support. Variation
in subordinate age did not explain variation in any of the three variables tested for
prospecting behaviour (Tables 2 & S6).
Figure 3. The extra-territorial prospecting behaviour of subordinates within
their natal groups. (a) Number of forays per hour of the day (mean ± SE) across 27
birds with Encounternet tags. The shaded light blue area illustrates night hours
(using as an approximation the civil twilight times for our study site on March 11th
2017 [06:05 and 19:14 hours]; the date in the middle of our 6-week long prospecting
study. The few forays appear to occur at night could reflect rare incidences of the
focal birds being flushed from their roost chambers by predators. (b) The analysis
of the daily rate (forays / day) of prospecting forays reveals that subordinate males
have a higher daily rate of prospecting than subordinate females, both inside and
outside peak periods of cooperative provisioning (i.e. nestling provisioning periods).
Mean predictions and standard errors are plotted based on the top models in Table
2.

158
Table 2. Analysis of daily rate of prospecting movements. The rate of forays per day
was most strongly predicted by the sex of the subordinate individual. The interaction
between ‘sex’ and ‘provisioning’ appeared in the second-best model with 1.06 ΔAIC
points poorer fit than the top model and was not retained after applying the nesting
rule. Models within a ΔAIC value of six that passed the nesting rule (Richards, 2008)
are shown. Full model sets within a ΔAIC value of six are shown in Table S6a. k =
number of estimated model parameters. ‘age’ was included in the analysis but was
not retained in any model within a ΔAIC value of six that passed the nesting rule.
Intercept Sex ('female'
effect) Provisioning ('YES' effect)
Sex
('female' effect) x Provisioning ('YES' effect)
k AIC ΔAIC
-0.334 -0.165 -0.080 6 2397.0 0.00
-0.299 -0.166 5 2398.2 1.24
-0.332 -0.079 5 2399.6 2.61
-0.296 4 2400.7 3.74
4.5. Discussion
We combined a long-term data set of cooperative provisioning and a large-scale
automated radio-tracking study of white-browed sparrow-weavers to test the
predictions of the philopatry hypothesis for the evolution of sex differences in natal
cooperation. Our findings provide novel support for the philopatry hypothesis.
White-browed sparrow-weavers show a rare sex-reversal of the typical avian
pattern of philopatry: females are more philopatric than males (Harrison et al., 2014;
and Table 1). As predicted by the philopatry hypothesis, this female-biased
philopatry is accompanied by female-biased natal cooperation (itself unusual among
birds; Cockburn, 1998; Downing et al., 2018): female helpers cooperatively
provisioned offspring at higher rates than male helpers and spent longer in the nest
during each provisioning visit. These sex differences in cooperation arise without
sex differences in the genetic relatedness of helpers to recipients (the dominant

159
[breeding] birds or their offspring), suggesting that they cannot be readily attributed
to a role for kin selection alone. That female helpers provision offspring at higher
rates than male helpers is ultimately reflected in apparent sex differences in the
impact of their help upon recipients. First, the number of female helpers in a group
strongly predicts the overall rate at which broods are provisioned and the
probability of nestling survival to fledging in harsh conditions (Chapter 2). Second,
dominant females (Chapter 3) and males (Capilla-Lasheras &, Young, unpublished
data) both reduce their offspring provisioning rates when aided by more female
helpers. Third, dominant females increase their egg investment when assisted by
more female helpers (Chapter 3). By contrast, none of these relationships hold for
the number of male helpers. Below, we (i) consider the potential for the philopatry
hypothesis and alternative hypotheses to explain the evolution of the observed sex
difference in natal cooperation, and (ii) utilise our dissection of sex differences in
key dispersal traits (dispersal incidence, natal inheritance, and prospecting
behaviour) to shed light on whether the observed association between philopatry
and cooperation is likely to have arisen via impacts on the sex-specific direct benefits
or costs of cooperation.
To what extent might evolutionary explanations other than sex differences in
philopatry account for the observed sex difference in natal cooperation? Kin
selection (Hamilton, 1964) cannot readily explain the observed sex difference in
cooperation because these natal subordinates of both sexes were equally related to
the recipients of their cooperative care (i.e. dominant individuals and their
offspring). The heterogamety hypothesis for the evolution of sex differences in
cooperation (Whitney, 1976) notes that, while sons and daughters may be equally
related to the recipients of their help in their natal territory from the perspective of

160
autosomal genes, the same need not be true for genes on sex chromosomes (Whitney,
1976). However, this hypothesis cannot explain the observed sex difference as it
predicts lower rates of cooperative investment in the homogametic sex (females in
birds), whereas our findings reflect the reverse. The paternity hypothesis for the
evolution of sex differences in cooperation (Charnov, 1978) proposes that when
there is extra-pair paternity (and therefore paternity uncertainty) the expected
fitness returns from breeding compared to helping will be devalued for males,
increasing the relative net fitness payoffs of helping versus breeding for males
(Charnov, 1978). This hypothesis thus predicts male-biased cooperation wherever
extra-pair paternity occurs (Charnov, 1978). As such, this too cannot explain the
observed female-biased cooperation in white-browed sparrow-weavers (despite
this species showing 12-18% extra-group paternity; Harrison et al., 2013b).
It has also been suggested that the sex that shows higher variance in lifetime
reproductive success may invest more in helping as their chance of ultimately
securing direct fitness returns may be lower (Koenig et al., 1983). It seems unlikely
that this hypothesis can explain our findings as in white-browed sparrow-weavers
(i) both sexes only breed as dominants (Harrison et al., 2013a), (ii) there is no
apparent sex difference in the probability of acquiring dominance during the lifetime
(in the natal group or anywhere else; Capilla-Lasheras & Young, unpublished data),
and (iii) while there is scope for the modest amount of extra-group paternity in this
species (Harrison et al., 2013b) to enhance variance in reproductive success among
males relative to females, this would leave the hypothesis predicting male-biased
cooperation in this species. Our results also cannot be readily attributed to a sex
difference in the division of different types of cooperative labour between the helper
sexes (e.g. in meerkats, male helpers contribute more to cooperative anti-predator

161
behaviour while female helpers feed offspring at higher rates; Clutton-Brock et al.,
2002), as female white-browed sparrow-weavers contribute just as much as males
to all other forms of cooperative behaviour in this species: cooperative territorial
defence (York et al., 2019), sentinelling (Walker et al., 2016) and weaving (Table S7).
Our analyses reveal that white-browed sparrow-weavers show sex-reversed
patterns of both philopatry and cooperation relative to those generally observed in
birds (Greenwood, 1980; Cockburn, 1998). As both of these phenomena are rare in
isolation (Greenwood, 1980; Cockburn, 1998; Williams & Hale, 2007) it seems
unlikely that their association in this species is coincidental. While only a small
proportion of female and male helpers ultimately acquire a dominant (breeding)
position within their natal group (Figure 2b), multiple lines of evidence indicate
female-biased philopatry in this species: (i) the age-specific probability of dispersal
from the natal group is higher for subordinate males than females across all age
classes (Figure 2a), (ii) males conduct extra-territorial prospecting forays at higher
rates than females (Figure 3b), and (iii) analyses of both population genetic
structure and direct observations suggest that birth to breeding distances are also
higher for males than females in this species (Harrison et al., 2014). While some of
these findings are based on the subset of dispersal events that were possible to
observe directly (as they were between groups within our study population), several
lines of evidence suggest that the sex differences observed are unlikely to have
arisen as an artefact of undetected dispersal events beyond the boundaries of our
study population. First, dispersal is extremely local in this species even within the
spatial scale of our study population (Harrison et al., 2014). Second, there is a low
overall rate of arrival of birds dispersing in from outside the population (suggesting
that the rate of birds leaving our population may also be low) and those that do
162
disperse in show a clear male bias, suggesting that if anything undetected long-
distance dispersals are more likely to have occurred among males (Harrison et al.,
2014). Overall, this sex difference in philopatry could therefore explain the evolution
of the observed sex difference in natal cooperation, through potential impacts on the
sex-specific net direct fitness payoff from natal cooperation (see Introduction; Kokko
et al., 2001; Clutton-Brock et al., 2002; Downing et al., 2018).
It is typically suggested that the more philopatric sex may help more because they
stand to gain a greater downstream direct fitness benefit from cooperation given
their greater likelihood of ultimately becoming a breeder within the natal group and
thus benefiting themselves from the future presence and/or cooperative behaviour
of the offspring that they are helping to rear (Woolfenden & Fitzpatrick, 1978;
Clutton-Brock et al., 2002; Downing et al., 2018). However, this alone cannot readily
account for the sex difference in cooperation observed here as, while females are
more philopatric than males they are not ultimately more likely to secure a dominant
breeding position within their natal group. This result appears to have arisen
because inheritance of the natal group is generally rare in this species, with newly
dominant individuals in both sexes typically having dispersed in from other groups.
Accordingly, the sex difference previously documented in birth-to-breeding distance
in this species appears to be attributable to a sex difference in the distance dispersed
between birth and breeding, rather than the incidence of dispersal between birth
and breeding (Harrison et al., 2014). While subordinate females are no more likely
to become dominant within their natal group, it is conceivable that they stand to gain
greater direct fitness benefits from cooperation via benefits that accrue during their
time as natal subordinates (given that the lower age-specific dispersal probabilities
of females are likely to leave females living in their natal group for longer on average

163
than males). Previous work on this species suggests that the payment of rent (Gaston,
1978) and social prestige (Clarke, 1989; Zahavi, 1995) mechanisms for the accrual
of direct benefits from cooperation are unlikely to apply in this species (Walker,
2015). Arguably the most widely applicable mechanism by which helping could yield
direct benefits is group augmentation, in which helpers are envisaged to benefit
directly from cooperation if it increases group size and doing so is beneficial (Kokko
et al., 2001; Kingma et al., 2014). However, the group augmentation hypothesis, at
least as traditionally formulated, cannot be readily applied to white-browed
sparrow-weavers, as our work to date suggests that helping does not increase
offspring survival on average (Chapter 2) or reproductive rates (Chapter 3) and so
may not increase group size. Positive effects of helping on the survival of the
dominants are conceivable (given that helping appears to lighten their workloads;
see above), but whether prolonging dominant survival would yield a net direct
benefit to helpers is unclear, particularly given the potential (albeit limited) for a
helper to inherit dominance when their same-sex breeder dies. As such, while it is
conceivable that sex differences in the direct benefits of cooperation have yielded the
sex difference in cooperation observed in this species (as invoked in the original
formulation of the philopatry hypothesis in Clutton-Brock et al., 2002; Downing et
al., 2018), our findings do suggest a need to attend to the possibility of a role for sex
differences in the direct costs of cooperation.
Sex differences in the direct costs of cooperation could arise whenever investment
in cooperation trades off against alternative routes to fitness in a sex-specific manner
(Young et al., 2005; Hodge, 2007). The less philopatric sex specifically (males here),
could suffer a greater direct cost of cooperation if investment in cooperation trades
off against activities that promote successful dispersal to independent breeding

164
positions (Ridley et al., 2008; Bonte et al., 2012; Kingma et al., 2016, 2017). One such
activity is extra-territorial prospecting, which numerous social species use to assess
dispersal opportunities in the surrounding population prior to committing to a
permanent transfer (Waser, 1996; Young, 2003; Doerr & Doerr, 2005). While few
studies have investigated prospecting behaviour given the difficulty of tracking
forays, there is evidence to suggest that prospecting can entail significant costs
(Young et al., 2005; Ridley et al., 2008; Young & Monfort, 2009; Kingma et al., 2016),
which may leave frequent prospectors contributing less to cooperation (Young et al.,
2005). Our automated radio-tracking study revealed that subordinate male
sparrow-weavers (the less philopatric sex) do indeed conduct extra-territorial
prospecting forays at higher rates than subordinate females, both during and outside
provisioning periods. It seems unlikely that this sex difference in prospecting rate is
itself a product of the observed sex difference in cooperation (i.e. a reversal of the
causal direction suggested above) as subordinate males still prospected at higher
rates than females outside provisioning periods. Our findings also revealed some
evidence to suggest that prospecting rates are lower during provisioning periods
than at other times, consistent with the expectation of a trade-off between
cooperation and prospecting.
Our findings do, however, suggest that prospecting forays (at least those beyond
neighbouring groups, which were the focus of our analyses; see results) are typically
short in duration (median duration = 60 seconds) and are only conducted on average
about once a day, even among males outside provisioning periods. These findings
render it unlikely that a simple trade-off between energy expenditure during
cooperation and prospecting can explain the observed sex difference in cooperation,
as the energetic costs of forays of this duration and rate seem unlikely to be

165
substantial. Instead, prospecting is likely to entail significant risks, as prospectors
are typically attacked when detected by members of other groups (Harrison et al.,
2014; Young et al. unpublished data) and could also face elevated predation risk
while moving alone. As such, regular prospectors (i.e. males) may stand to benefit
more than others from maintaining a competitive phenotype (e.g. good body
condition), to both mitigate the risk of injury and maximise the chance of success
while prospecting. Experimental work does suggest that cooperative provisioning
entails body mass costs in this species (Cram et al., 2015), lending strength to the
suggestion that investment in cooperation may indeed trade off against the
maintenance of optimal prospecting condition.
It is increasingly appreciated that the accrual of direct fitness returns of helping
could play an important role in the evolution and maintenance of cooperation
(Clutton-Brock, 2002; Clutton-Brock et al., 2002; Downing et al., 2018). The
observation that the philopatric sex contributes to cooperation more than the
dispersive sex in animal societies has been interpreted as an indication of a role for
direct fitness benefits in shaping animal societies (Clutton-Brock et al., 2002;
Downing et al., 2018). Our findings, however, suggest that female-biased
cooperation in white-browed sparrow-weavers accompanies female-biased
philopatry in the absence of an evident mechanisms through which females could
gain greater direct benefits of cooperation than males. Instead, our results indicate
that a sex difference in direct costs associated with a sex difference in philopatry is
a more credible explanation for the observed sex-reversed pattern of cooperation in
white-browed sparrow-weavers. Given the potential for patterns of philopatry to
impact the sex-specific costs of cooperation in other species too, our findings
highlight a need for caution when interpreting associations between sex differences

166
in philopatry and cooperation as evidence of a role for direct fitness benefits only in
shaping animal cooperation.

167
Chapter 4: Supplementary Material
Supplementary Figures Chapter 4
Figure S1. Encounternet receiver array (i.e. basenodes) and detection of forays.
Panel a and b show two simplified maps of the study site with the location of the 35
receivers (i.e. Encounternet basenodes – black and red dots – most of which have
been placed in the centre of distinct sparrow-weaver territories; see methods). In
each panel, a circle of 250 meters radius around a focal receiver (red dot) is
illustrated with a blue line. Movements of a bird from a focal territory on which they
were resident (e.g. red dots) were considered to be prospecting forays if the bird
visited a territory outside the blue circle and if the foray lasted for longer than 15
seconds.

168
Figure S2. Signal strength (a) and percentage of detected signals (b) decreased with
the distance between tags and receiver. The number of measurements varied
between different distances. Tags were detected by receivers up to 120 meters but
detectability highly varied for distances larger than 20 meters.
a
b

169
Figure S3. Decision tree applied to assign locations to logs from Encounternet
receivers in 15-second moving time windows. A signal strength value of -11.484
refers to the mean signal strength at 50m from a given basenode, based on our field
calibrations (see main text).

170
Figure S4. (a) Proportion of time that a tagged bird (x axis) was located within the
study site (dark blue) out of the total time that the bird was tagged for (dark blue
plus light blue). (b) Encounternet signal strength (RSSI) at the ‘home’ territory for
all 32 tagged subordinate birds against the number of days after tag deployment.
Stars signify the five birds that were removed from the analysis due to low
percentage of time located within the study site.

171
Figure S5. Age effects on natal subordinate cooperative care. Subordinate natal
birds increased their provisioning rates with age and subordinate females
consistently showed higher provisioning rates than subordinate males. Model
predictions based on the top model in Table S2. Transparent points represent raw
data whereas larger points and error bars give mean model predictions ± SE.

172
Supplementary Tables Chapter 4
Table S1. Monthly calendar of morning start times for provisioning data collection.
Provisioning data collection started within the placement window specified for
every month and lasted for approximately three hours.
Month Placement window
September 07:00-07:30
October 06:45-07:15
November 06:30-07:00
December 06:15-06:45
January 06:30-07:00
February 06:45-07:15
March 07:00-07:30
April 07:15-07:45

173
Table S2. Model selection table for the analysis of provisioning rates for natal
subordinate individuals. A terms absent from the focal model relative to the top
model (i.e. that with the lower AIC score); presented for ease of comparison. B added
variable in comparison with the top model.
Terms in model Terms absentA AIC ΔAIC
age + sex + brood age + brood size + intercept
4843.2 0.00
age x sexB + age + sex + brood age + brood size + intercept
4843.4 0.24
age + sex + brood size + intercept brood age 4854.1 10.86
age + sex + brood age + intercept brood size 4854.5 11.26
sex + brood age + brood size + intercept age 4857.3 14.14
age + brood age + brood size + intercept sex 4857.4 14.18
Intercept age + sex + brood age + brood size
4889.5 46.32

174
Table S3. Model selection for the analysis of (a) provisioning visit duration and (b)
probability of provisioning a large food item. (a) When provisioning offspring,
subordinate females spent more time in the nest than subordinate males.
Provisioning birds reduced the length of their feeding visits with offspring age. (b)
For the probability of a large food item being delivered, the intercept only model
received the strongest support from the data and was the only model that passed the
nesting rule (Richards, 2008). The interaction between sex and age was also
considered as a predictor in both the feed duration and food item size models but
did not appear in any models within a ΔAIC value of six. Models within a ΔAIC of size
are presented. Model coefficients are standardised to ease comparison of effect sizes
across models.
(a) Provisioning visit duration (‘log+1’ transformed)
Intercept Sex ('female'
effect) Brood age
Brood size
Age k AIC ΔAIC
0.050 0.142 -0.087 7 12471.9 0
0.040 0.141 -0.089 -0.053 8 12476.7 4.88
(b) Probability that a provisioning subordinate delivers a large food item
Intercept Sex ('female'
effect) Brood age
Brood size
Age k AIC ΔAIC
-2.256 5 931.8 0
-2.257 -0.118 6 932.7 0.94
-2.280 0.139 6 932.8 1.01
-2.252 0.022 6 933.8 1.98
-2.280 0.132 -0.112 7 933.8 2.04
-2.257 -0.118 0.002 7 934.7 2.94
-2.275 0.14 0.028 7 934.8 2.98
-2.174 + 7 934.8 2.99
-2.279 0.132 -0.111 0.009 8 935.8 4.04
-2.204 0.129 + 8 935.9 4.15
-2.188 -0.101 + 8 936.0 4.22
-2.172 0.012 + 8 936.8 4.99
-2.216 0.124 -0.098 + 9 937.2 5.43

175
Table S4. Microsatellite relatedness of subordinate birds, dominant birds and offspring. This table shows the results of linear models explaining
variation in microsatellite relatedness (Queller & Goodnight, 1989) between subordinate individuals (males and females) and (a) the dominant
male, (b) the dominant female and (c) the offspring that they are helping to rear. In every model ‘sex’ was included as a fixed effect predictor. For
details of microsatellite genotyping, see Harrison et al., 2013a.
Estimate SE t value (df) p
(a) Relatedness to dominant male (n = 191)
Intercept 0.364 0.028
Subordinate sex ('males')
-0.011 0.039 -0.285 (189) 0.776
(b) Relatedness to dominant female (n = 184)
Intercept 0.464 0.021
Subordinate sex ('males')
-0.053 0.029 -1.801 (182) 0.074
(c) Relatedness to offspring (n = 478)
Intercept 0.386 0.016
Subordinate sex ('males')
-0.030 0.022 -1.33 (476) 0.184

176
Table S5. Analysis of age-specific dispersal probability from the natal group. A Model estimates for the 4-level factor ‘age’ are given as follow:
‘age 2-3y / age 3-4y / age >4y’, with ‘age 1-2y’ being the reference level. k = number of estimated model parameters.
Intercept Sex
('male' effect) AgeA
AgeA x sex
('male' effect) k AIC ΔAIC
-4.239 0.888 1.651 / 2.382 / 2.549 7 480.7 0
-4.396 1.120 1.601 / 2.812 / 2.668 0.095 / -0.669 / -0.739 10 484.8 4.08
-3.638 1.609 / 2.281 / 2.157 6 489.4 8.70
-2.707 0.6504 4 527.8 47.12
-2.321 3 532.5 51.82

177
Table S6. Analysis of (a) daily rate of prospecting movements, (b) (log-transformed) foray duration and (c) foray maximum distance. Models
within a ΔAIC value of six are shown. k = number of estimated model parameters. Model coefficients are standardised to ease comparison of
effect sizes across models.
(a) intercept Sex
('female' effect)
Provisioning ('YES' effect)
Sex ('female' effect) x Provisioning ('YES' effect)
Age k AIC ΔAIC
-0.334 -0.165 0.080 6 2397.0 0 -0.327 -0.155 -0.074 0.040 7 2398.0 1.06 -0.299 -0.166 5 2398.2 1.24 -0.339 -0.148 -0.080 0.055 7 2398.4 1.44 -0.331 -0.139 -0.075 0.038 0.052 8 2399.5 2.57 -0.332 -0.079 5 2399.6 2.61 -0.304 -0.148 0.056 6 2399.6 2.67 -0.340 -0.079 0.099 6 2400.0 3.09 -0.296 4 2400.7 3.74 -0.305 0.100 5 2401.2 4.22
(b) intercept Sex
('female' effect)
Provisioning ('YES' effect)
Sex ('female' effect) x Provisioning ('YES' effect)
age k AIC ΔAIC
0.133 5 2535.5 0 0.129 -0.033 6 2536.9 1.34 0.142 0.022 6 2537.2 1.66 0.132 0.006 6 2537.5 1.96 0.139 0.022 -0.033 7 2538.6 3.02

178
0.129 -0.005 -0.034 7 2538.9 3.33 0.142 0.005 0.022 7 2539.2 3.64 0.138 -0.002 0.017 -0.031 8 2540.5 4.92 0.139 -0.007 0.022 -0.035 8 2540.5 5.00
(c) Intercept Sex
('female' effect)
Provisioning ('YES' effect)
Sex ('female' effect) x Provisioning ('YES' effect)
Age k AIC ΔAIC
-0.003 5 2501.2 0 -0.009 -0.013 6 2503.1 1.89 -0.005 -0.020 6 2503.1 1.89 -0.002 0.015 6 2503.2 1.95 -0.011 -0.013 -0.020 7 2505.0 3.78 -0.008 0.015 -0.013 7 2505.0 3.83 -0.004 0.009 -0.018 7 2505.1 3.87 -0.013 0.004 -0.019 -0.037 8 2506.0 4.83 -0.010 0.009 -0.013 -0.018 8 2507.0 5.76

179
Table S7. Model selection summary for binomial generalised linear mixed models
for the individual probability of weaving. Models within a ΔAIC value of six and
passing the nesting rule are shown. We found little support for a statistical sex
difference in weaving. The top model contains the ‘sex’ predictor but there is
relatively similar support for a second model without this effect and for the
intercept-only model. Model coefficients are standardised to ease comparison of
effect sizes across models.
Intercept Sex ('female'effect ) Brood age k AIC ΔAIC
-5.018 0.445 -0.329 7 310.8 0
-6.388 -0.399 6 311.2 0.32
-4.842 0.427 6 311.4 0.53
-5.368 5 311.8 1.00

180

181
Chapter 5
Heritable variation in cooperative generosity in a wild social bird
Contributions by:
Pablo Capilla-Lasheras, Xavier Harrison, Antony Brown, Alastair J. Wilson,
Andrew J. Young
Affiliations:
Centre for Ecology and Conservation, University of Exeter, Penryn, TR10
9FE, UK

182
5.1. Abstract
Consistent individual differences in cooperative behaviour have now been docu-
mented in a wide range of organisms, but few studies have investigated the relative
importance of genetic and environmental variation in generating these differences.
Indeed, given the substantial work to date on the evolution of cooperation, it is no-
table that we still lack compelling empirical evidence of additive genetic variation in
cooperative generosity. Here we investigate the existence and determinants of con-
sistent individual differences in cooperative breeding behaviour (helping to rear the
offspring of others) in a wild population of white-browed sparrow-weavers, Ploce-
passer mahali. First, using assessments of helping behaviour by 256 individuals ob-
served provisioning offspring in 160 broods, we find strong evidence of consistent
variation among non-breeding helpers in how much food they provide to offspring.
Second, using high-resolution genomic information (>38,000 SNPs) and animal
models that account for shared environmental effects, we detect moderate additive
genetic variation (i.e. heritability) for cooperative provisioning rates (h2 = 0.117).
This heritability estimate for cooperative food provisioning by non-breeding help-
ers is similar in magnitude to the few existing heritability estimates for parental pro-
visioning rates in non-cooperative species. Our estimates of the among-individual
and additive genetic variance in helper provisioning rates were similar in magnitude,
suggesting that the consistent individual differences detected in cooperative gener-
osity are primarily attributable to additive genetic effects rather than other mecha-
nisms. The fitness consequences of cooperative helping in white-browed sparrow-
weaver societies are known to vary with environmental conditions, likely yielding
spatial and temporal variation in selection on cooperative generosity. Our findings
suggest that the heritable variation required for an evolutionary response to such
pressures is present in this species.

183
5.2. Introduction
In cooperatively breeding species, non-breeding helpers typically vary in their lev-
els of cooperation (Komdeur, 2006). These cooperative individuals can adjust their
cooperative behaviour according to changes in their physical (Wiley & Ridley, 2016)
and / or social environment (Hatchwell & Russell, 1996; Hatchwell, 1999; Clutton-
Brock et al., 2002, 2003; Russell et al., 2003b; Johnstone, 2011; Adams et al., 2015).
While many extrinsic factors have the potential to affect individual levels of cooper-
ation, consistent individual differences in cooperative behaviours have been found
in a wide number of species (reviewed in Bergmüller et al., 2010). For example, in
meerkats (Suricata suricatta), subordinate individuals show consistent differences
in their cooperative contributions towards babysitting and pup provisioning
(English et al., 2010). Similarly, consistent individual differences in babysitting and
juvenile care have also been found in banded mongooses (Mungos mungo,
Sanderson et al., 2015). Moreover, consistent individual differences have also been
found in other cooperative activities, such as group hunting (Gazda et al., 2005).
Theoretical modelling highlighted the potential adaptive value of consistent individ-
ual differences in cooperative activities (Wolf et al., 2007; Biro & Stamps, 2008;
McNamara et al., 2009; Dall et al., 2012). The empirical evidence for the existence of
consistent individual differences in cooperation and its theoretical adaptive value
poses the question of whether this trait is heritable and, therefore, can respond to
selection, but we lack compelling empirical evidence of additive genetic variation in
cooperative generosity.
184
Few studies have investigated the genetic basis of cooperative behaviours. Additive
genetic variation for the propensity to help at the nest has been quantified in west-
ern bluebirds (Sialia mexicana, Charmantier et al., 2007) and Tibetan ground tits
(Pseudopodoces humilis, Wang & Lu, 2018). In both species, whether or not a given
individual ever became a helper was found to be heritable (Charmantier et al., 2007;
Wang & Lu, 2018). However, estimates of additive genetic variation in Wang and Lu
(2018) have been questioned (Engelhardt et al., 2018; Gilbert, 2018) and may in-
deed have been confounded by the propensity to delay dispersal (as the act of help
is dependent on delaying dispersal in Tibetan ground tits and the authors did not
uncouple these two processes; Griesser et al., 2017; Gilbert, 2018). In contrast to
studies on bird species, a laboratory study on a cooperatively breeding fish found
that additive genetic variance in cooperative behaviour was negligible, despite being
conducted in controlled laboratory conditions (Kasper et al., 2017a). Indeed, this
work led the authors to conclude that heritable genetic variation plays only a minor
role in generating the consistent individual differences in cooperative behaviour ob-
served in their study species (Kasper et al., 2017a). Compelling evidence that herit-
able variation contributes appreciably to inter-individual variation in cooperative
generosity is therefore lacking.
Here, we investigate the existence of consistent individual differences in cooperative
helping effort (non-breeding helpers feeding the offspring of breeders) and its ge-
netic basis in a cooperatively breeding bird, the white-browed sparrow-weaver
(Plocepasser mahali; Collias & Collias, 1978; Lewis, 1982a). White-browed sparrow-
weavers live in family groups in which a dominant breeding pair monopolises re-
production (Harrison et al., 2013a) and 0-10 non-breeding subordinate birds of both
sexes (hereafter termed ‘helpers’) help to feed their young (Lewis, 1982a; Harrison

185
et al., 2013a). Helpers are typically offspring from previous breeding attempts of the
dominant pair, having delayed dispersal from their natal group (Harrison et al.,
2013a). The presence of female helpers increases the total rate at which offspring
are fed, which appears to increase offspring survival in dry conditions (Chapter 2).
Furthermore, breeding females appear to respond to the presence of female helpers
by increasing their pre-natal investment in the egg and reducing their post-natal in-
vestment in nestling feeding (Chapter 3). In this chapter, we use long-term data from
a wild population (501 hours of observations of helper provisioning behaviour cov-
ering 256 helpers feeding 160 broods in 32 social groups) to investigate whether
there is evidence of consistent among-individual differences in cooperative gener-
osity (specifically, the rate at which non-breeding helpers provision young). We then
use detailed genomic data to carry out an animal model analysis of 212 helpers and
investigate the extent to which the detected consistent individual differences in co-
operative generosity are attributable to additive genetic variation in cooperative
generosity.
5.3. Methods
5.3.1. Field monitoring
Our study population of white-browed sparrow-weavers is located in Tswalu
Kalahari Reserve in the Northern Cape Province of South Africa (27°16’S, 22°25’ E).
Data was collected from the field from September to May (the Southern summer,
when the birds breed) between 2007 and 2017. During this period, 32 social groups
of white-browed sparrow-weavers were monitored. Each group occupied a distinct
territory in an area of approximately 1.5 km2 and groups were easily distinguished
in the field as all group members forage together, engage in roost weaving and

186
territorial defence, and roost in a single tree or cluster of trees close to the centre of
their territory (Collias & Collias, 1978; Lewis, 1982a). All birds in our population are
fitted with a uniquely numbered metal ring and three colour rings for identification
(under SAFRING license 1444). Social group composition was assessed at least once
a week via behavioural observations during the study period. Individual birds were
identified on the basis of their colour ring combination. Group composition was also
informed by targeted catching sessions in which birds were caught at night from
their roosting chambers.
Every white-browed sparrow-weaver group contains a single dominant
(reproductive) female (that lays every egg in the group) and a dominant
(reproductive) male (Harrison et al., 2013a). Dominant birds are easily identified in
the field because they display a distinct set of behaviours. In every group, the
dominant female and male are in very close association, spending much time
foraging and performing vocal duets together (Walker et al., 2016). Only dominant
females have been observed incubating eggs or entering the nest during the
incubation phase. Furthermore, genetic analysis confirmed that, in our study
population, nests always contain eggs from a single female and that this individual
could be readily identified using behavioural observations (Harrison et al., 2013a).
Previous work also detected a low percentage of extra-group paternity (circa 15%
of broods contained extra-group nestlings (Harrison et al., 2013a) but most broods
contained offspring from a single male and this individual, again, could be readily
identified as the dominant male from behavioural observations (Harrison et al.,
2013a). Non-breeding helpers are typically offspring of the dominant pair that delay
dispersal and help feed subsequent broods of the dominant pair (Harrison et al.,

187
2013a). Beak coloration was used to determine the sex of individual birds, as this is
sexually distinct in our study subspecies (P. mahali mahali, Leitner et al., 2009).
5.3.2. Provisioning behaviour
The protocol to collect provisioning behaviour data has been described elsewhere;
for details, see Chapters 2, 3 and 4. In brief, we collected provisioning behaviour data
using video recordings at nests between the 6th and 14th day after the first egg of a
given clutch hatched (for details about the monitoring of breeding activity, see Chap-
ters 2 and 3). Previous research on this study population has confirmed that indi-
viduals visiting the nest during our focal recording periods always deliver a food
item to the nestlings, unless they are conspicuously carrying a long piece of grass
which they then weave in to the nest structure (Walker, 2015). Such rare grass-de-
livery events were removed from the provisioning visit data set prior to analysis.
From these video recordings, we extracted information for every feeding event:
feeder sex (based on beak coloration) and feeder identity (using a unique vent pat-
tern placed on the birds during the incubation phase; Walker, 2015). Video cameras
were set up in the morning at standard times that tracked monthly changes in sun-
rise (Table S1). Provisioning behaviour was recorded for approximately three hours
for each brood and day. Using this data stream, we calculated the number of feeds
delivered by every subordinate individual during every day of recording. In a small
proportion of feeding events, individual birds could not be identified, adding uncer-
tainty to the number of feeds delivered by each individual. We thus cleaned the orig-
inal data set to retain only those days of observation for a focal helper where there
were less than five feeds of uncertainty in the total number of feeds carried out by
the focal individual per day of recording. As environmental conditions were likely
correlated between consecutive provisioning days for a given brood (which could

188
artefactually generate data suggestive of consistent individual differences in coop-
erative behaviour), we calculated the mean number of feeds delivered per individual,
per brood (i.e. averaging over successive days of video recording). In our analysis of
provisioning rates, we only include data for natal subordinate individuals, who are
most often highly related to the dominant pair and their offspring (Chapter 4).
5.3.3. Restriction site associated DNA (RAD) sequencing
Animal models estimate the amount of phenotypic variation explained by the herit-
able genetic differences between individuals (Kruuk, 2004). Traditionally, animal
models include a pedigree from which to estimate the genetic relatedness (i.e. simi-
larity) between individuals (Kruuk, 2004; Wilson et al., 2010). However, animal
models can also be fitted based on genomic relatedness data (Yang et al., 2010). We
therefore used restriction site associated DNA (RAD) sequencing to genotype indi-
viduals, calculate their genomic relatedness and build a genetic relationship matrix
(GRM, Yang et al., 2010). We then used this GRM to estimate additive genetic vari-
ance of provisioning rate among non-breeding helping individuals.
Between 2007 and 2017, blood samples from white-browed sparrow-weavers were
routinely collected (stored > 96% ethanol; Walker, 2015; Wood, 2017). DNA
extracted from these blood samples was used to carry out single-end RAD
sequencing following the original protocol (Baird et al., 2008), using SbfI as the
restriction enzyme. DNA was extracted using a DNAeasy Blood & Tissue QIAGEN kit.
DNA concentrations were measured using a Qubit dsDNA HS Kit (ThermoFisher)
and DNA fragmentation was assessed by electrophoresis on a 1.0% agarose gel.
Library preparation and RAD Sequencing was carried out by Floragenex Inc. on an
Ilumina HiSeq instrument. DNA concentrations and quality passed Floragenex

189
criteria (> 50 µg of high molecular weight DNA at a concentration of 20 ng/µl) for
optimal sequencing results. We carried out two RAD sequencing runs to sequence a
total of 238 DNA samples from 212 individual white-browed sparrow-weavers. This
set of 212 individuals contained every breeding bird in our study population
between 2007 and 2016. Library preparation and sequencing was performed
independently for these two runs. In the first run, 48 samples were prepared
together, barcoded and sequenced on a single HiSeq lane. They included single
samples from 38 individuals and five pairs of replicate samples (these replicates
consisted of three replicates coming from different blood samples of the same bird
and two replicates representing DNA from the same blood sample extracted at
different times). The second run contained 190 samples, each from a different
individual, which were prepared across two 95 sample libraries. Each library was
then sequenced across two HiSeq lanes. This run contained 21 samples (each from
a different individual) that also appeared in the first run, to facilitate the resolution
of any among-run differences in sequencing performance should they arise (these
21 replicated samples originated from two independent DNA extractions of the same
blood sample).
5.3.4. Bioinformatics processing of RAD sequencing data
We used Stacks 2.4 (Catchen et al., 2013) to recover genotypes from the RAD
sequencing data. First, we de-multiplexed raw data using process_radtags, including
the –c and –q flags to filter out low quality reads. For each of the three DNA libraries
(one library for the first run and two for the second run), 90.6% (358,044,906 reads),
75.5% (295,884,741 reads) and 71.7% (240,934,241 reads) of the total raw reads
were retained and assigned to individual barcodes by process_radtags. Data from the
three libraries were analysed together and we assessed the consistency of the results

190
of the Stacks pipeline (number of RAD tags assembled, number of polymorphic RAD
tags and number of single nucleotide polymorphisms) to varying its main
parameters: –m, –M and –bound_high in ustacks, and –n in cstacks. For this first
assessment we closely followed published guidelines for the analysis of RAD
sequencing data (Mastretta-Yanes et al., 2015; Paris et al., 2016) (Figure S1 & Figure
S2).
We performed this initial assessment to understand how changing the values of the
main parameters in the Stacks pipeline affected the recovery of RAD tags,
polymorphic tags and SNPs following Paris et al. (2016). We ran the de novo script
in Stacks (version 2.41; Catchen et al., 2011) varying the values of –m and –M (from
2 to 9 in both cases) in ustacks, --bound_high also in ustacks (testing values: 0.001,
0.01, 0.05, 0.10, 0.15, 0.25, 0.50, 0.75) and –n in cstacks (from 0 to 9). Each parameter
was tested independently from the others and when a given parameter was tested,
the other parameters were kept at fixed values as follows: –m = 3, –M = 2, --
bound_high = 0.05 and –n = 2. As expected given previous assessments of Stacks
(Mastretta-Yanes et al., 2015; Paris et al., 2016), we found a decreasing number of
total RAD tags built, polymorphic tags and SNPs recovered with increasing values of
–m (Figure S1). Changing values of –M and –n had little effect on the performance of
the pipeline (Figure S1 & Figure S2). Low values of –bound_high caused the pipeline
to recover more polymorphic tags and SNPs; after a value of 0.05 the number of RAD
tags, polymorphic tags and SNPs levelled off (Figure S2). Given this initial
assessment, we chose –m = 3, –M = 2, –bound_high = 0.05 and –n = 2 as parameter
values to carry on the analysis. Based on this initial assessment, we chose values for
Stacks parameters that yielded consistent results as advised by Paris et al. (2016): –
m = 3, –M = 2, –bound_high = 0.05 and –n = 2 (Figure S1 & Figure S2).

191
Second, given the potential for differences in sequencing performance across runs
to generate noise in our relatedness estimates, we sought to identify SNP filtering
parameters that maximised the congruence of the outputs from the two runs for the
21 replicate samples. We thus used the 21 replicated samples (i.e. that were
sequenced in both the first and second runs) to assess the effect of different SNP
filtering strategies on the within-replicate similarity for several genome-wide
metrics: differences in genome-wide heterozygosity, percentage of mismatching
genotypes and number of shared loci. We ran the populations function in Stacks
setting –R to 0.8, --min-maf to 0.05 and selecting loci only if they had been built in
both runs and in more than 80% of samples within each run. Then, we filtered
genotypes based on different minimum read depths and calculated, for each
replicate pair separately, the number of loci shared across the replicate pair, the
heterozygosity for each member of the replicate pair and the proportion of
mismatching genotypes across the replicate pair (Figure S3). We recovered highly
consistent metrics for these 21 replicates across the two runs when genotype read
depth was set to be equal to or higher than 40x (Figure S3). We therefore applied
this genotype read depth threshold to the full data set of 212 samples to generate a
table of high quality SNPs per sample (Table S1). The final parameter values used in
Stacks to produce genotypes can be found in Table S1. We genotyped 63,815 SNPs
at 39,668 variant loci with, on average, 90.71% of the 212 samples genotyped per
locus. Filtering to retain genotypes with read depths > 40x, as well as those loci in
Hardy-Weinberg equilibrium (Exact Test, p < 0.01; Wigginton et al., 2005), yielded a
final data set of 60,422 SNPs at 38,166 variant loci, 34.58% of samples were
genotyped per locus. This data set was then used to calculate the genetic relationship

192
matrix (GRM) following the method described in (Yang et al., 2010) and
implemented in PLINK 1.9 (F3, Chang et al., 2015) and GCTA (Yang et al., 2011).
5.3.5. Creating the Genetic Relationship Matrix (GRM)
In animal models, additive genetic variation for a trait of interest can be estimated
using pedigree-based assignments of parental links (established via social or genetic
information; Kruuk, 2004; Wilson et al., 2010) or directly with high quality genomic
data (Yang et al., 2010). Here we used a combination of both given (i) the availability
of high accurate genomic data for all breeders in our study population and (ii) the
ability to extend the GRM to include most of the helpers in our behavioural data set
that did not themselves become breeders (as most of these helpers are known to be
the offspring of genotyped breeders (see below for details).
We directly calculated the genetic relationship matrix (GRM) based on 38,166
variant loci recovered from RAD sequencing (see methods above) for 212
individuals. Out of these 212 individuals, 94 individuals appeared in the data set for
the analysis of provisioning effort. A further 162 individuals appearing in the data
set for provisioning behaviour were not sequenced and, therefore, they did not
initially appear in the GRM. However, we were able to show that using parental links
between dominant (breeding) individuals and helpers (based on microsatellite
markers), we could include most of these non-sequenced birds in the relatedness
matrix (118 out of 162 individuals; Figure S5).
Every reproductive female and male between 2007 and 2016 were RAD sequenced.
Additionally, most individuals (regardless of whether or not they ever reproduced)
in the study population were genotyped using 13 microsatellite loci (for details see

193
Harrison et al., 2013a). Therefore, we use microsatellite data to assess genetic
paternity and maternity for individuals that had not been RAD sequenced (i.e. ‘the
focal bird’). We assumed that the dominant female and male in a given group were
the genetic parents of a focal individual when the parental genotypes could generate
the focal individual’s genotype with fewer than two mismatching loci. Previous
analyses in our study population have revealed that dominant females are always
the genetic mothers of nestlings hatched in their territory, and extra-group paternity
is rare (circa 15% of broods contain extra-group sires, Harrison et al., 2013a). Once
parental links were established (which was done successfully for 118 out of 162
individuals that appeared in our data set for provisioning effort but had not been
directly RAD sequenced), we included focal individuals in the genetic relationship
matrix (GRM) by adding half of the relatedness of their father and mother to every
individual already present in the GRM. Using a subset of individuals that had been
RAD sequenced and whose parents were also present in the GRM, we were able to
validate this method to incorporate new individuals in our GRM (Figure S5). Thus,
in total, our GRM contained 212 individuals for which data on provisioning effort
was available.
5.3.6. Statistical analysis
In order to investigate the existence of among-individual variation in cooperative
generosity (and subsequently evidence of additive genetic variation in this trait), we
built a series of Bayesian Poisson generalised linear mixed models (with a ‘log’ link
function), using the R package ‘MCMCglmm’ (version 2.29) in R version 3.4.1.
(Hadfield, 2010; R Core Team, 2019). Evidence for consistent individual differences
in cooperation can be assessed by calculating the repeatability of this behaviour (i.e.
the proportion of the phenotypic variation explained by among-individual variation).

194
To calculate repeatability in generalised linear models, model estimates in the link
scale need to be back transformed to the original data scale. We performed this back
transformation using the R package ‘QGglmm’ (de Villemereuil et al., 2016) and thus
calculated among-individual repeatability. A similar problem applies when
calculating heritability for non-Gaussian traits (de Villemereuil et al., 2016);
therefore, we used ‘QGglmm’ to convert our estimates of additive genetic variance
from the link scale to the observed data scale before calculating the proportion of
phenotypic variance explained by additive genetic variation (i.e. heritability, h2).
Transformations from the link scale to the original data scale were performed by
averaging across fixed effects (de Villemereuil et al., 2016).
A detailed study of individual contributions to cooperative care in white-browed
sparrow-weavers (Chapter 4) revealed that age (as a 3-level factor: ‘< 1 year’,
‘between 1-2 years’ or ‘> 2 years’), brood size (as a continuous predictor, mean-
centered and scaled to one standard deviation; Gelman & Hill, 2007) and sex were
important predictors of individual provisioning rates. Therefore, we also include
them here as fixed effects in our models. In order to model provisioning rate within
a Poisson framework (i.e. number of observed feeds corrected for the duration of the
observation period), the duration of the provisioning observation period was fitted
as a fixed effect in our models with a fixed slope of one. Investigating the effects of
these fixed effect predictors was not the focus of this study (see Chapter 5 for full
details) but we included them in our mixed models to control for other sources of
phenotypic variation in helper provisioning rates. We interpreted median values of
posterior distributions of model coefficients as their best estimates and assessed
their statistical importance by inspecting their 95% credible intervals. Default priors
were used for fixed effects (Normal distribution, µ = 0, σ2 = 108) and residual

195
variances (inverse Wishart, V = 1, nu = 1). Parameter expanded priors were used for
random variances with V = 1, nu = 1, µα = 0 and σ2α = 103.
5.3.6.1. Assessing evidence for among-individual variation in helping effort
Using repeated behavioural observations of the provisioning effort of helpers, we
first investigated the existence of consistent among-individual variation in this trait.
We fitted a Bayesian Poisson generalised linear mixed model to partition phenotypic
variation in provisioning rate into among individual, among brood, among territory
and residual variation (Expression 1):
𝑉𝑃 = 𝑉𝐼 + 𝑉𝐵 + 𝑉𝑇 + 𝑉𝑅
Expression 1. Consistent among-individual variation in helper provisioning
rates. Partitioning of phenotypic variation (𝑉𝑃 – conditional upon fixed effects
structure) in the number of feeds delivered by helpers between among individual
variation (𝑉𝐼), among brood variation (𝑉𝐵; i.e. this random effect refers to the identity
of the brood that receives cooperative care), among territory variation (𝑉𝑇 ) and
residual variation (𝑉𝑅).
The model was fitted three times, running three independent Markov chain Monte
Carlo (MCMC) and assessing their convergence to similar results (visually and
computing the Gelman and Rubin’s convergence diagnostic; Gelman & Hill, 2007).
Each chain was run for a total of 5,000,000 iterations with a burn-in of 1,000,000
iterations. Chains were sampled every 1,000 iterations, yielding a total of 4,000
sampled iterations used to estimate posterior probabilities.
5.3.6.2. Additive genetic variation in helping effort
We expanded the model above (Expression 1) to disentangle additive genetic (𝑉𝐴)
and non-additive-genetic (i.e. permanent individual environment, 𝑉𝑃𝐸 ) sources of

196
among-individual variation in helper provisioning rates (Expression 2) using an
(generalised) animal model.
𝑉𝑃 = 𝑉𝐴 + 𝑉𝑃𝐸 + 𝑉𝐵 + 𝑉𝑇 + 𝑉𝑅
Expression 2. Animal model to explain individual variation in repeated
measures of helper provisioning rates. Partitioning of phenotypic variation (𝑉𝑃 –
conditional upon fixed effects structure) in the number of feeds delivered by helpers
between additive genetic variation (𝑉𝐴 ), permanent environment variation (𝑉𝑃𝐸 ),
among brood variation (𝑉𝐵; i.e. this random effect refers to the identity of the brood
that receives cooperative care), among territory variation (𝑉𝑇) and residual variation
(𝑉𝑅).
However, fitting a generalised animal model to our data following Expression 2
revealed analytical problems disentangling 𝑉𝐴 and 𝑉𝑃𝐸 (Figure S4). We therefore
calculated an overall mean number of feeds (rounded to the closest integer) and
mean duration of provisioning watches for every individual in the data set (by
averaging across all of the broods for which it was assessed) and then fitted a
generalised animal model without repeated measures per individual, partitioning
variation in provisioning rates as:
𝑉𝑃 = 𝑉𝐴 + 𝑉𝑇 + 𝑉𝑅
Expression 3. Animal model to explain individual variation in mean helper
provisioning rates. Partitioning of phenotypic variation (𝑉𝑃 – conditional upon
fixed effects structure) in the number of feeds delivered by helpers between additive
genetic variation (𝑉𝐴), among territory variation (𝑉𝑇) and residual variation (𝑉𝑅). For
this model, we used averaged provisioning rates per individual, ending up with one
single observation per individual.

197
This model structure resulted in appropriate MCMC convergence with posterior
distributions for model coefficients not bounded near zero and approximately
distributed following a Gaussian curve. Fixed effect predictors for the latter model
were sex, and averaged age and brood size across all of the provisioning events for
each individual. Following the model description above, the GRM was employed to
fit a generalised animal model using the R package ‘MCMCglmm’ (Hadfield, 2010).
The GRM was inversed in R using ginv() (‘MASS’ R Package) and we computed its
nearest positive definite matrix using the nearPD() function (‘nadiv’ R Package;
Wolak, 2012). Then, the inversed GRM was included in a Poisson mixed model to
capture additive genetic variation in provisioning rates of helping individuals. This
model was fitted three times, running three independent MCMCs and assessing their
convergence to similar results. Each chain was run for a total of 1,750,000 iterations
with 50,000 initial burn-in iterations. Chains were sampled every 1,000 iterations,
yielding a total of 1,700 sampled iterations used to estimate posterior probabilities.
5.4. Results
5.4.1. Among-individual variation in helping effort
Among-individual variation in provisioning effort by individual helpers was
calculated using a data set containing 5,742 feeding events by 256 individuals (134
females and 122 males) at 160 broods (mean [range] of 1.7 [1-7] broods observed
per helper; 117 helpers observed feeding one brood, 63 feeding two broods and 32
feeding three or more broods), across 32 territories (i.e. social groups).
We found significant among-individual variation in provisioning effort, with a non-
zero estimate for 𝑉𝐼 on the observed data scale (𝑉𝐼 = 11.11, 95% confidence interval
(CI) = 3.39 - 29.24; Figure 1a; Expression 1). Variation among individuals in

198
provisioning effort accounted for 9.45% of the observed phenotypic variation in this
trait conditional on fixed effects (95%CI = 3.09% - 18.40%; Figure 1b). We also found
non-zero among-brood variation (Figure 1). In contrast, our models revealed
among-territory variation close to zero (Figure 1; variation among territories was
likely captured by among-brood variation). As expected given previous studies
(Chapter 4), we found important effects of brood size, sex of the individual and age
on provisioning rates (Table 1). Individual variation in provisioning rates was
similar for male and female helpers (see Table S2 for details).

199
Figure 1. Partitioning of phenotypic variation in helper provisioning rates (see
Expression 1). (a) Combined posterior medians and 95% credible intervals (‘CI’) of
three independent MCMCs for each variance component in the observed data scale.
Phenotypic variation conditional on fixed effects, VP = 116.74; residual variation, VR
= 90.82. (b) Proportion of the phenotypic variance explained by each variance
component (median and 95%CI) in the observed data scale. Residual variance
accounted for 77.80% of the phenotypic variance conditional on fixed effects.
Variance estimates are shown on the observed data scale (i.e. back transforming
from the latent scale of the data – a ‘log’ scale in the case of the employed Poisson
GLMMs).

200
Table 1. Results of a generalised (Poisson) mixed model explaining variation in
helper provisioning rates. Model estimates are shown in the link scale (‘log’).
Phenotypic variance conditional on the fixed effect structure was partitioned as
detailed in Expression 1. Posterior median and 95% credible intervals (‘CI’) of three
independent MCMCs are displayed.
Fixed effects
Median 95%CI
Intercept -0.127 -0.402 0.131
Brood size 0.279 0.132 0.428
Sex('male' effect) -0.519 -0.778 -0.265
Age (1 - 2y) 0.385 0.109 0.665
Age (> 2y) 0.447 0.119 0.776
Variance components
Median 95%CI
Among individual (VI) 0.302 0.108 0.551
Among brood (VB) 0.370 0.179 0.641
Among territory (VT) 0.021 0.000 0.188
Residuals (VR) 0.567 0.362 0.850
5.4.2. Additive genetic variation in helping effort
The additive genetic variance in mean provisioning effort by individual helpers was
calculated using a data set containing 355 feeding events by 212 individuals (116
females and 96 males) helping to feed 146 broods (mean [range] of 1.68 [1-7]
broods observed per helper). The sample size for this analysis differs from the
previous one as we are now only including individuals that could be connected in
the genetic relationship matrix (GRM).

201
The estimate of additive genetic variance in helper feeding effort (in the observed
data scale) was distinct from zero ( 𝑉𝐴 = 6.73; 95%CI = 1.73 – 28.38; Figure 2a). The
narrow-sense heritability on the observed data scale was estimated as 0.117 (95%CI
= 0.046 - 0.234; Figure 2b). Among-territory variation also explained a non-
negligible proportion of the variance in helper provisioning rates (𝑉𝑇
𝑉𝑃 = 8.30%;
95%CI = 3.58% – 17.55%; Figure 2b). The estimates for residual variation and fixed
effects in the animal model were similar to those of the individual-level model (Table
2).
Figure 2. Partitioning of phenotypic variance in helper provisioning rates,
including additive genetic variance (see Expression 3). (a) Combined posterior
medians and 95% credible intervals (‘CI’) of three independent MCMCs for each
variance component. Phenotypic variation dependent on fixed effects, 𝑉𝑃 = 58.78;
residual variation, 𝑉𝑅 = 46.95. (b) Proportion of the phenotypic variance explained
by each variance component (median and 95%CI). Residual variance accounted for
79.88% of the total phenotypic variance. As provisioning rates were averaged per
individual, this second model could not estimate among-brood variation ( 𝑉𝐵 ) in
helper provisioning rates. Variance estimates are shown in the observed data scale
(i.e. back transforming from the latent scale of the data – a ‘log’ scale in the case of
the employed Poisson GLMMs).

202
Table 2. Results of a generalised animal model explaining variation in helper
provisioning rates. Model estimates are shown in the link scale (‘log’). Phenotypic
variance conditional on the fixed effect structure was partitioned as detailed in
Expression 3. Posterior median and 95% credible intervals (‘CI’) of three
independent MCMCs are displayed.
Fixed effects
Median 95%CI
Intercept -0.358 -0.997 0.263
Brood size 0.268 0.120 0.416
Sex ('male' effect) -0.433 -0.716 -0.149
Age 0.336 0.336 0.099
Variance components
Median 95%CI
Additive genetic (VA) 0.247 0.101 0.567
Among territory (VT) 0.161 0.074 0.373
Residuals (VR) 0.439 0.439 0.211
5.5. Discussion
We combined behavioural observations and genomic information from a long-term
study of a cooperatively breeding bird species to investigate the existence of con-
sistent among-individual differences in cooperative generosity and whether they
are explained by heritable variation. Our results provide strong evidence for the ex-
istence of consistent among-individual variation in cooperative generosity, meas-
ured as the rates at which helpers provision the offspring of breeders, which trans-
lated into an adjusted repeatability of ~ 0.10 on the observed scale. Despite the evi-
dence suggesting the existence of consistent individual differences in cooperative
behaviours (Bergmüller et al., 2010), only a few studies have attempted to identify

203
the relative importance of genetic factors generating such differences. Here we re-
port unique evidence from a wild animal population with appreciable additive ge-
netic variation in the cooperative provisioning rates of helpers. We discuss these
findings and their implications for the evolution of cooperation in more detail below.
Among-individual differences in cooperative behaviour could potentially arise from
territory- or brood-level differences in environmental conditions that themselves
affect cooperative behaviour. However, these confounds are unlikely to explain our
results. First, consistent among-brood variation cannot explain our results of con-
sistent individual differences simply because our analyses did not contain repeated
individual provisioning rates within broods. Second, our models estimated con-
sistent individual differences in provisioning effort after controlling for among-ter-
ritory variation in provisioning effort, accounting for correlated environmental con-
ditions among territories. Additionally, correlated environmental conditions
throughout the life of individual helpers could also have generated the apparent
consistent among-individual differences in helper provisioning effort observed here.
The likelihood of the this explanation generating consistent among-individual dif-
ferences will decline as within-individual observations span longer periods. Two
sources of evidence suggest that this latter explanation does not confound our re-
sults of consistent individual differences in cooperation. First, environmental condi-
tions in our study site are temporally highly variable (Chapter 2) and are very likely
to differ between repeated individual provisioning events. Second, a complementary
analysis in this species has revealed a positive correlation between the provisioning
rates of individuals when they were helpers and when they were breeders (Capilla-
Lasheras & Young, data unpublished), events which are often separated by multiple
years and typically occur on different territories (Harrison et al., 2013a, 2014).

204
Overall, it would seem that consistent differences in environmental conditions
among territories or breeding attempts, or environmental correlations throughout
individuals’ lives, cannot readily explain our finding of consistent among-individual
differences in cooperative provisioning effort.
Consistent individual differences in cooperative behaviours could also be generated
through formative developmental responses to early-life environmental conditions
(English et al., 2015; Taborsky, 2017). For example, enhanced social conditions dur-
ing early life have been found to have positive transgenerational effects on parental
care, social interactions and brain development in rodents and fish (Curley et al.,
2009; Fischer et al., 2015). Early life conditions have also been found to impact the
likelihood of becoming a helper in banded mongooses: pups that received more help
during early life had a lower probability of becoming helpers than breeders
(Vitikainen et al., 2019). Similarly, the physiological state of breeding females in
meerkats has been suggested to have transgenerational effects on the cooperative
behaviours of offspring (Dantzer et al., 2019). It is possible that formative early-life
environmental effects on cooperative behaviour contribute to the consistent
among-individual variation in helper provisioning rates observed here. However, it
is worth noting that the magnitude of the additive genetic variance estimated in the
animal model (Figure 2) was similar to the amount of among-individual variance in
provisioning rates calculated by our initial (non-genetic) model (Figure 1). Although
comparison across these two models may be only approximate, this indicates that
environmental sources of variation may contribute little to differences in individual
provisioning rates.

205
Individuals may show consistency in their provisioning behaviour if genetic
variation underpins the expression of the trait (Kasper et al., 2017b). Here,
integration of genomic data and behavioural observations in an animal model
(Kruuk, 2004; Wilson et al., 2010), indeed, provides evidence for additive genetic
variation in helper provisioning behaviour in white-browed sparrow-weavers. We
estimated narrow-sense heritability for helper provisioning effort to be 0.117
(95%CI = [0.046 - 0.234]), a value in the low range for behavioural traits as
suggested by a recent meta-analysis (Dochtermann et al., 2019). Indeed, our
heritability estimation for helper provisioning rate is much lower than the
previously reported result for the heritability of the propensity to help in western
Bluebirds (h2 ± standard error =0.76 ± 0.25: Sialia mexicana, Charmantier et al.,
2007) and Tibetan ground tits (h2 = 0.47, 95%CI = 0.16 – 0.75: Pseudopodoces
humilis, Wang and Lu 2018). This contrast may be due to a difference in the nature
of the traits under investigation. Charmantier et al., (2007) and Wang and Lu (2018)
analysed helping as a binary trait, thereby, investigating the probability of helping,
whereas our analysis considers continuous variation in helper provisioning rates.
Furthermore, Wang and Lu (2018) could not separate helping from delayed
dispersal and, therefore, their heritability estimate may indicate heritable variation
in delaying dispersal rather than in helping per se (Gilbert, 2018). Despite the
difference in heritability estimates across species, heritability values can be difficult
to compare and interpret across studies given their dependency on the fixed effects
used to control for additional sources of variation (Wilson, 2018). Interestingly, one
other study that analysed provisioning rates of breeders (not helpers) in a
cooperatively breeding bird found a similar proportion of the total phenotypic
variation explained by additive genetic effects (approximately 10%; Adams et al.,
2015). The extent to which feeding behaviour in breeders and helpers is determined

206
by similar genetic components is unknown to date and deserves attention in its own
right.
Besides additive genetic effects, permanent environmental effects can generate con-
sistent individual differences (Kasper et al., 2017b; a). Under certain scenarios,
early-life environmental effects shared among individuals can bias heritability esti-
mations upwards (Kruuk & Hadfield, 2007). This problem is expected to be of par-
ticular importance when lineages always occupy the same environments (e.g. terri-
tories) such that additive genetic effects and environmental effects are strongly con-
founded. In our study system, individuals express their cooperative behaviour in the
territory where they hatched (as we are analysing the provisioning rate of natal in-
dividuals). However, inheritance of the breeding position in a given territory to a
natal individual is rare in both sexes in white-browed sparrow-weavers (Chapter 4).
Helpers need to disperse from the natal territory to become dominant individuals
and breed, eventually producing helpers in a new territory. This process ensures
that close relatives are observed in multiple territories, aiding analytical disentan-
glement of additive genetic and environmental effects.
In animal societies, helpers often respond to the presence of other helpers by mod-
ulating their provisioning effort (Zöttl et al., 2013a; Brouwer et al., 2014; but see also
Liebl et al., 2016). Given that provisioning is heritable, an individual’s behavioural
phenotype may thus be influenced by genes expressed in other group members (i.e.
subject to indirect genetic effects, ‘IGEs’, Wolf et al., 1998; Wilson et al., 2009, 2011;
Bailey et al., 2018). IGEs have been shown to be important in determining the evo-
lutionary potential of populations (Wilson, 2014; Bailey et al., 2018), particularly in

207
situations where inter-individual interactions have antagonistic effects on pheno-
typic expression (Bijma, 2010). Preliminary analyses suggest that the provisioning
effort of helpers does not change with the presence of other helpers in white-
browed sparrow-weavers (Capilla-Lasheras & Young unpublished data); however,
the extent to which helper provisioning behaviour is sensitive to IGEs in this species
is unknown.
Overall, our results indicate that white-browed sparrow-weaver helpers show con-
sistent individual differences in cooperative generosity and that this variation arises
in part from direct additive genetic variation. To our knowledge this is the only evi-
dence of appreciable heritable variation in cooperative generosity in a wild animal
population. The fitness consequences of cooperative helping in white-browed spar-
row-weaver societies have been suggested to vary with environmental conditions
(Chapter 2). The findings of the present study suggest that the heritable variation
required for an evolutionary response to selection is present in this species.
.

208
Chapter 5: Supplementary Material
Supplementary Figures Chapter 5
Figure S1. Initial assessment of the Stacks pipeline, –m and –M. Number of RAD tags
built (left-hand side column), number of polymorphic RAD tags (central column)
and number of SNPs (right-hand side column) recovered by Stacks for different
values of –m (upper row) and –M (lower row) (both parameters from ustacks). Raw
data are represented by grey dots whereas boxes illustrate median (horizontal thick
black line), quartiles (ends of the box) and 1.5 times the inter-quartile range of the
raw data distribution.

209
Figure S2. Initial assessment of the Stacks pipeline, –bound_high and –n. Number of
RAD tags built (left-hand side column), number of polymorphic RAD tags (central
column) and number of SNPs (right-hand side column) recovered by Stacks for
different values of –bound_high (upper row; ustacks) and –n (lower row; cstacks).
Raw data are represented by grey dots whereas boxes illustrate median (horizontal
thick black line), quartiles (ends of the box) and 1.5 times the inter-quartile range of
the raw data distribution.
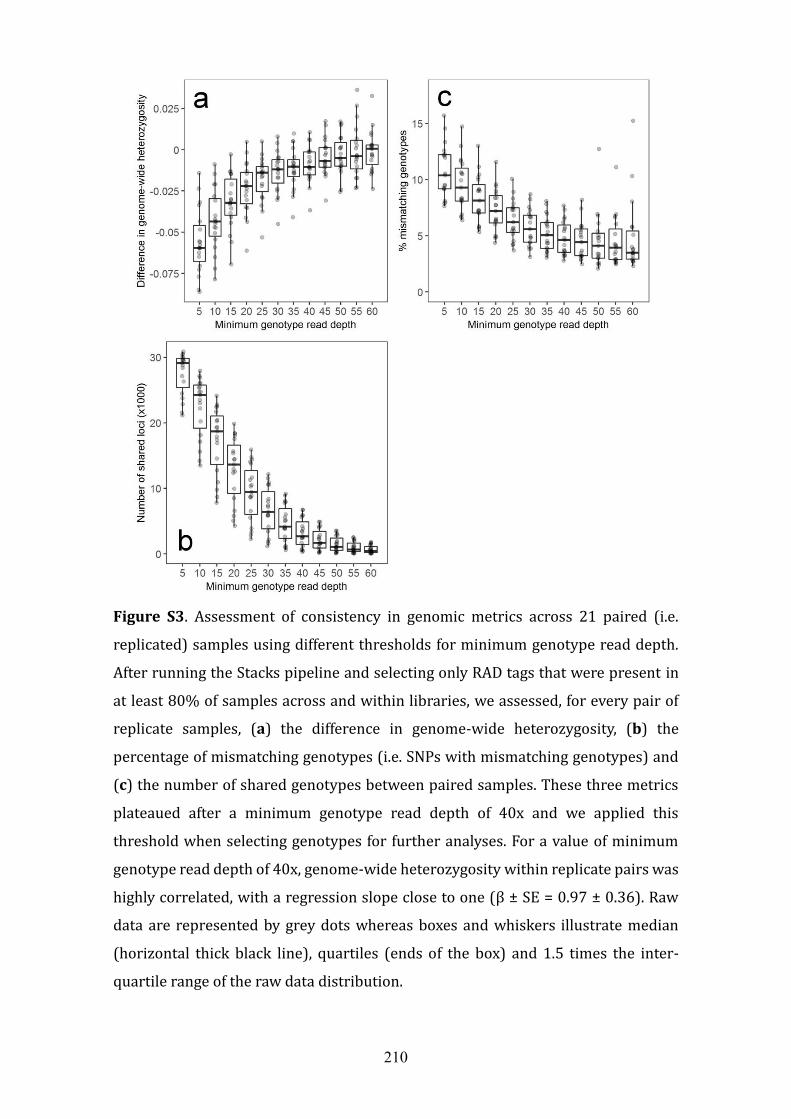
210
Figure S3. Assessment of consistency in genomic metrics across 21 paired (i.e.
replicated) samples using different thresholds for minimum genotype read depth.
After running the Stacks pipeline and selecting only RAD tags that were present in
at least 80% of samples across and within libraries, we assessed, for every pair of
replicate samples, (a) the difference in genome-wide heterozygosity, (b) the
percentage of mismatching genotypes (i.e. SNPs with mismatching genotypes) and
(c) the number of shared genotypes between paired samples. These three metrics
plateaued after a minimum genotype read depth of 40x and we applied this
threshold when selecting genotypes for further analyses. For a value of minimum
genotype read depth of 40x, genome-wide heterozygosity within replicate pairs was
highly correlated, with a regression slope close to one (β ± SE = 0.97 ± 0.36). Raw
data are represented by grey dots whereas boxes and whiskers illustrate median
(horizontal thick black line), quartiles (ends of the box) and 1.5 times the inter-
quartile range of the raw data distribution.

211
Figure S4. Repeated measures animal model for helper feeding rates. MCMC traces
for (a) additive genetic variance (VA) and (b) permanent environment variance (VPE)
(1,500 final iterations in both cases). (c) Values of VA and VPE at every MCMC iteration
(dark dots) showed a negative relationship, suggesting that, given the data structure,
the model is not able to appropriately split phenotypic variation between VA and VPE.
Blue line represents the fit of a cubic regression spline.

212
Figure S5. Validation of the indirect method to include individuals in the genetic
relationship matrix (GRM). Using individuals that had been RAD sequenced and
whose parents had also been RAD sequenced, we estimated their relatedness to
every bird in the GRM using the indirect method described in Supplementary
information (x axis - i.e. the sum of half the relatedness between their father and
mother to every bird in the matrix). This indirect estimation of relatedness strongly
predicted relatedness estimated directly from genomic data (r2 = 0.93). Dashed blue
line represents a line with slope of one and intercept of zero; red dotted line
illustrates the estimated regression line between the indirect and direct estimation
of relatedness (slope ± SE = 0.944 ± 0.003; intercept ± SE = -0.005 ± 0.0003).

213
Supplementary Tables Chapter 5
Table S1. Summary of the bioinformatics pipeline used to genotype 212 individual
RAD-sequenced samples. ‘Samples per locus’ refers to the mean number of samples
genotyped per locus (in percentage to the total number of samples).
Software Parameters Values Variant
loci Variant
sites Samples per locus
Stacks; ustacks
--high_bound 0.05
39,668 63,815 90.7%
Stacks; ustacks
-m 3
Stacks; ustacks
-M 2
Stacks; cstacks
-n 2
Stacks; populations
Genotype call rate total (-R) 0.8
Stacks; populations
Minimum allele frequency (--min-maf)
0.05
vcftools Minimum genotype read
depth 40
38,166 60,422 34.6% vcftools
Hardy-Weinberg Equilibrium (p-value)A
0.01
A Exact Test (Wigginton et al., 2005)

214
Table S2. Bivariate generalised mixed model explaining variation in male and female
helper provisioning rates. The initial model for provisioning rates was expanded into
a bivariate model that explained variation for provisioning rates of male and female
helpers. For each of those responses, fixed effects and variance partitioning was
applied as outlined in the main text. Posterior median and 95% credible intervals
(‘CI’) of three independent MCMCs are displayed (estimates in the link scale).
Fixed effects Helper sex Median 95%CI
Intercept males -0.717 -1.084 -0.364
females -0.100 -0.423 0.189
Brood size males 0.335 0.130 0.546
females 0.240 0.038 0.434
Age (1 - 2y) males 0.452 0.016 0.893
females 0.343 -0.026 0.721
Age (> 2y) males 0.426 -0.126 0.977
females 0.549 0.121 0.978
Variance components Median 95%CI
Among individual (VI) males 0.428 0.068 0.994
females 0.288 0.041 0.618
Among territory (VT) males 0.052 0.000 0.428
females 0.016 0.000 0.185
Among brood (VB) males 0.325 0.007 0.846
females 0.452 0.162 0.856
Residuals (VR) males 0.731 0.343 1.317
females 0.428 0.216 0.798

215

216
Chapter 6
General Discussion

217
Understanding the evolutionary origin and maintenance of cooperation in nature is
a long-standing question in evolutionary biology (Skutch, 1935; Boland & Cockburn,
2002). New theoretical formulations (Kennedy et al., 2018), recent analyses of the
global patterns of occurrence of cooperative species (Cornwallis et al., 2017;
Griesser et al., 2017) and the appreciation that both direct and indirect fitness
payoffs of cooperation are important to understand its evolution (Clutton-Brock et
al., 2002; Young et al., 2005) provide new avenues to investigate and better
understand this long-standing evolutionary puzzle. To that end, in this thesis I have
investigated the routes through which helpers may acquire indirect fitness benefits,
the role of sex differences in direct fitness payoffs from helping in generating sex
differences in cooperation, and the genetic basis of cooperative generosity in a wild
cooperatively breeding bird. In Chapter 2, I found evidence of (female) helpers
reducing the variance in reproductive success of related breeders as envisaged by
the altruistic bet-hedging hypothesis (Kennedy et al., 2018). Furthermore, this
reproductive variance compression appears to arise because helpers specifically
reduce unpredictable rainfall-induced variation in reproductive success, just as
hypothesised by global comparative studies of the evolution of cooperative breeding
in birds (Griesser et al., 2017). In Chapter 3, I then investigated the effect of helpers
on the pre- and post-natal reproductive investment of female breeders (‘mothers’).
I found compelling evidence that mothers plastically adjusting their pre-natal
reproductive investment in the egg according to the number of (female) helpers in
their group. In Chapter 4, I provided novel support for the idea that sex differences
in the direct fitness payoffs from cooperation, arising from sex differences in
philopatry, can explain sex differences in natal cooperation. These findings also
highlighted the need to consider the potential for sex differences in both the direct
fitness benefits and costs of cooperation when trying to understand the evolutionary

218
origin of sex differences in cooperation (or, more broadly, among-individual
variation in cooperative behaviour). Lastly, in Chapter 5 I provided evidence of
consistent individual differences in cooperative generosity and rare evidence that
these arise in large part from additive genetic variance in cooperative generosity,
suggesting that this trait could respond to selection. The latter result may be of
particular importance as my analyses in Chapter 2 suggest that both the sign and
magnitude of the effects of cooperation on breeder reproductive success (a key
component of selection on cooperation) depend upon the prevailing environmental
conditions, leading to the expectation of temporal and spatial variation in selection
on cooperation in this species. Below, I briefly discuss the wider implications of
these results for our understanding of the evolution of cooperation and highlight the
potential wider utility for the field of the analytical approaches used throughout this
thesis to identify helper effects.
6.1. Altruistic bet-hedging and the global distribution of
cooperative breeders
Cooperatively breeding species are, in many taxa, globally associated with
unpredictable environments (Jetz & Rubenstein, 2011; Sheehan et al., 2015; Griesser
et al., 2017). Variation in environmental productivity and variability in rainfall
conditions have been suggested as the main environmental drivers of this
association (Jetz & Rubenstein, 2011; Rubenstein, 2011; Griesser et al., 2017). This
observation has led to the hypothesis that cooperative breeding reduces variance in
reproductive success of breeding individuals (Rubenstein, 2011; Starrfelt & Kokko,
2012). Indeed, a recent theoretical formulation, altruistic bet-hedging (Kennedy et
al., 2018), predicts that helping acts as a bet-hedging strategy that reduces variance
in reproductive success of the recipients of help (Starrfelt & Kokko, 2012; Kennedy
219
et al., 2018). The formulation of altruistic bet-hedging theory also highlights that
inclusive fitness benefits arising from helpers reducing variation in reproductive
success of related recipients are expected to increase with the extent on
unpredictable environmental variation (Kennedy et al., 2018).
In Chapter 2, I show that altruistic helping in white-browed sparrow-weavers fulfills
the properties of an altruistic bet-hedging strategy, in that it reduces variance in the
reproductive success of related breeders. Furthermore, helping appears to do so in
part by reducing unpredictable rainfall-induced variation in reproductive success.
Furthermore, my finding that helper effects on the mean and variance in
reproductive success of breeders will depend on environmental conditions (Chapter
2) leads to a prediction about the nature of selection for cooperation in different
environments. As suggested in Chapter 2, whether altruistic helping will be
positively selected at all, and the extent to which selection for it will arise from
reproductive variance reduction or increases in the mean reproductive success of
breeders, will depend on the relative frequency of different environmental
conditions (Chapter 2). My findings suggest that in dry environments cooperation
may be selected for principally on the basis of its net positive effects on the
reproductive success of related breeders. While in environments in which dry and
wet conditions occur at similar frequencies (such as our study site), selection for
cooperation may arise more from its reproductive variance reduction properties. As
the relative frequency of different environmental conditions varies across time and
space, selection for cooperation is predicted to vary with future effects of climate
change (i.e. in time) and across the current distribution range of a given cooperative
species (i.e. in space). Investigations of the effects of helping on reproductive success

220
of breeders (mean and variance) along an environmental gradient for a given species
(e.g. its distribution range) would help confirm or reject this prediction.
6.2. The importance of direct fitness payoffs in the evolution of
cooperation
When cooperative individuals do not differ in their genetic relatedness to the
recipients of help within a society, indirect fitness returns from cooperation (i.e. kin
selection) alone cannot readily explain among-individual variation in cooperation
(Clutton-brock, 2002; Griffin & West, 2002). Sex differences in cooperation are
common within animal societies (Stallcup & Woolfenden, 1978; Owens & Owens,
1984; Curry, 1988; Cockburn, 1998; Clutton-Brock et al., 2002; Dickinson &
Hatchwell, 2004; Canestrari et al., 2005; Koenig & Dickinson, 2016; Zo ttl et al., 2016).
In the absence of sex differences in indirect fitness returns, sex differences in the
direct fitness benefits and costs of cooperation have been hypothesized to play a key
role in generating sex differences in cooperation (Clutton-Brock et al., 2002; Young
et al., 2005).
The philopatry hypothesis for the evolution of sex differences in cooperation
predicts that the more philopatric sex will invest more in natal cooperation (Clutton-
Brock et al., 2002). There are two potential mechanisms through which a sex
difference in philopatry could generate a sex difference in natal cooperation. Firstly,
the more philopatric sex may stand to gain a greater direct fitness benefit from
cooperating within the natal group than the less philopatric sex. This would be the
case when, for example, the more philopatric sex is more likely to inherit a breeding
position within their natal group, and hence be helped back by those individuals that
they have helped to rear (Woolfenden & Fitzpatrick, 1978; Clutton-Brock et al., 2002;

221
Downing et al., 2018). If cooperation increased the size of the natal group and group
size enhanced the survival of all residents (Ekman et al., 2000; Kokko et al., 2001;
Kingma et al., 2014; Nelson-flower & Ridley, 2016), then the more philopatric sex
could also stand to gain differential direct fitness benefits from natal cooperation
prior to dominance acquisition. Alternatively, the less philopatric sex may be faced
with higher costs of cooperation, arising from trades-off between cooperation and
traits that promote dispersal success (Young et al., 2005; Williams & Hale, 2007).
Sex differences in direct fitness benefits of cooperation have been emphasized as the
key mechanism creating sex differences in cooperation (Clutton-Brock et al., 2002;
Downing et al., 2018). However, the role of sex differences in the direct fitness costs
of cooperation driving sex differences in cooperative contributions remains largely
unknown (Young et al., 2005; Hodge, 2007; Williams & Hale, 2007). In my analyses
in Chapter 4, I investigated the potential for sex differences in both the direct fitness
benefits and costs of cooperation to explain the sex difference in natal cooperation
in white-browed sparrow-weavers. My findings highlighted that sex differences in
the direct fitness costs of cooperation may be more important than previously
assumed in generating sex differences in natal cooperation. Indeed, a role for sex
differences in direct fitness costs provides a credible alternative explanation for the
role of direct fitness benefits implicated in previous studies (Clutton-Brock et al.,
2002; Downing et al., 2018). The last idea is particularly relevant given the
comparatively little compelling evidence of a role for direct fitness benefits in
shaping patterns of helping in cooperatively breeding societies (Zo ttl et al., 2013b).

222
6.3. Complications in the study of the evolution of helping
Studies on cooperatively breeding species typically investigate the effects of helping
by examining relationships between helper number and performance. However,
there are two key problems with this approach. First, in many cooperative societies,
helper number strongly correlates with group size, leaving it unclear whether any
apparent effects of helpers are attributable instead to simple effects of group size,
which could arise independent of helping per se. Second, variation in territory qual-
ity (or in the quality of the breeders on them) may yield among-territory associa-
tions between helper number and reproductive performance that confounds any
causal association between helper numbers and reproductive performance.
Throughout this thesis, I adopted two novel analytical approaches that allowed me
to address both challenges, increasing confidence that the evidence of helper effects,
while typically not experimentally determined, is unlikely to be attributable to ei-
ther of the mentioned confounds.
6.2.1. The importance of isolating the effects of helping per se
Cooperative breeding has likely evolved in a two-step process. First, selection needs
to favour the delayed dispersal (and parental toleration) of offspring, leading to their
retention in the natal group (Koenig et al., 1992). Several ecological explanations
have been proposed for the evolution of delay dispersal, amongst them habitat
saturation (Zack, 1990; Komdeur, 1992), inheriting a high quality territory (Emlen,
1984; Ekman et al., 2001) and the benefits of group living (Ekman et al., 2000; Kokko
et al., 2001; Kokko & Ekman, 2002; Kingma et al., 2014). Secondly, the most common
explanation for the subsequent evolution of helping behavior proposes that helping
is then selected for due to the indirect fitness benefits that individuals can accrue by
helping kin (Hamilton, 1964), while awaiting a breeding opportunity of their own

223
(Khan & Walters, 2002; Russell et al., 2003b; a; Dickinson & Hatchwell, 2004;
Heinsohn, 2004; Koenig & Dickinson, 2016). Therefore, studies trying to understand
the evolution of helping in cooperative breeders need to, in theory, isolate the effects
of helping per se from the benefits of groups living (e.g. ‘group augmentation’; Kokko
et al., 2001; Kingma et al., 2014). In practice, uncoupling these two effects in
cooperative breeders is difficult because helpers cooperate and are part of the social
group, thereby contributing to group augmentation benefits, at the same time (for
an exception see Hatchwell, 2016).
I utilised the sex difference in the helping contributions of subordinate females and
males to pin helper effects on cooperation per se rather than correlated effects of
group size that might arise independent of helping. It is conceivable that such a fe-
male helper number effect arises instead from some differential effect of subordi-
nate females relative to subordinate males that arises independent of their sex dif-
ference in helping. However, there is no evidence to suggest that that is the case in
white-browed sparrow-weavers as subordinates of both sexes contribute equally to
territorial defence (York et al., 2019), sentinelling (Walker et al., 2016) and weaving
(Chapter 4).
6.2.2. Avoiding the confounding effect of variation in quality among
territories
Territory quality is likely to positively affect the size of the group that occupies it by
offering more resources for successful upbringing of offspring or by reducing
competition and, thus, allowing more individuals to delay dispersal (Cockburn, 1998;
Ekman et al., 2001). In this situation, a spurious positive relationship has the
potential to arise between group size and reproductive success: large groups are

224
associated with increased reproductive success not because there is an actual
relationship between them but because territory quality is positively affecting both
at the same time (Cockburn, 1998). The same logic applies to the study of helper
effects on any other trait when territory quality may affect the presence of helpers
(or their cooperative contributions) and the expression of the trait of interest. This
is a common pitfall in studies of cooperative breeders, which can be circumvented
by experimental approaches (e.g. Brouwer et al., 2005; Liebl et al., 2016) or by
applying particular analytical techniques (van de Pol & Wright, 2009), which has
been rarely done (Lejeune et al., 2016). In this thesis, I avoid this potential pitfall by
carrying out an experimental manipulation (Chapter 2) and controlling for variation
in quality among territories and breeding individuals (Chapter 2 & 3) by applying
within-territory and within-individual centering techniques (van de Pol & Wright,
2009; Lejeune et al., 2016).
In particular, investigating the effects of within-individual changes in helper number
on pre-natal maternal investment has revealed the first evidence to my knowledge
that breeding females respond plastically by changing the size of their eggs when
assisted by more (female) helpers (Chapter 3). Indeed, the direction of the
relationship (an increase in egg size with increasing female helper numbers) also
contrasts with the general pattern found in other cooperative breeders, where egg
investment typically negatively correlates with the presence of helpers (Russell et
al., 2007a; Dixit et al., 2017; but see Valencia et al., 2017). However, very few studies
in this body of literature have controlled for the potential confounding effect of
variation in quality among territories or individuals. Indeed, the only study that did
so found that the correlation between helper number and egg size actually arose
from helper effects on among-mother variation in egg size rather than from helper

225
effects on within-mother variation (Lejeune et al., 2016). Therefore, the real extent
to which our results in Chapter 3 contrast with the general pattern of maternal
plasticity in pre-natal investment in cooperative breeders in reality will only be
elucidated once more empirical studies either apply experimental approaches (e.g.
Taborsky et al., 2007) or separate the effects of variation in territory and/or breeder
quality from the effects of helping.
6.4. Final summary
Throughout this thesis, I have investigated the evolution of helping behavior in a
wild cooperatively breeding bird. I have shown how indirect fitness benefits may
arise from helper effects on both offspring survival (via mean and variance effects
on the reproductive success of breeders; Chapter 2) and, potentially, the post-natal
workloads of mothers (Chapter 3). In Chapter 4, I provided evidence for the
philopatry hypothesis for the evolution of sex differences in cooperation and
highlighted the importance of investigating direct fitness benefits and costs of
cooperation to understand sex differences in cooperation. Finally, in Chapter 5 I have
provided rare evidence for the existence of heritable variation in cooperative
generosity, suggesting that this trait can potentially respond to selection.

226

227
7. References
Adams, M.J., Robinson, M.R., Mannarelli, M.E. & Hatchwell, B.J. 2015. Social genetic
and social environment effects on parental and helper care in a cooperatively
breeding bird. Proc. R. Soc. B 282: 20150689.
Arnold, T.W. 2010. Uninformative parameters and model selection ssing Akaike’s
Information Criterion. J. Wildl. Manage. 74: 1175–1178.
Bailey, L.D. & van de Pol, M. 2016. Climwin: An R toolbox for climate window
analysis. PLoS One 11: e0167980.
Bailey, N.W., Marie-Orleach, L. & Moore, A.J. 2018. Indirect genetic effects in
behavioral ecology: does behavior play a special role in evolution? Behav. Ecol.
29: 1–11.
Baird, N.A., Etter, P.D., Atwood, T.S., Currey, M.C., Shiver, A.L., Lewis, Z.A., et al. 2008.
Rapid SNP discovery and genetic mapping using sequenced RAD markers.
PLoS One 3: 1–7.
Beaumont, H.J.E.E., Gallie, J., Kost, C., Ferguson, G.C. & Rainey, P.B. 2009.
Experimental evolution of bet hedging. Nature 462: 90–93.
Bennion, N.L. & Warren, D.C. 1933. Temperature and its effect on egg size in the
domestic fowl. Poult. Sci. XII: 69–82.
Bergmu ller, R., Schu rch, R. & Hamilton, I.M. 2010. Evolutionary causes and
consequences of consistent individual variation in cooperative behaviour.
Philos. Trans. R. Soc. B 365: 2751–2764.
Bijma, P. 2010. Fisher’s fundamental theorem of inclusive fitness and the change in
fitness due to natural selection when conspecifics interact. J. Evol. Biol. 23:
194–206.
Biro, P.A. & Stamps, J.A. 2008. Are animal personality traits linked to life-history
productivity? Trends Ecol. Evol. 23: 361–368.
Blanckenhorn, W.U. 2000. Temperature effects on egg size and their fitness

228
consequences in the yellow dung fly Scathophaga stercoraria. Evol. Ecol. 14:
627–643.
Boland, C.R.J. & Cockburn, A. 2002. Short sketches from the long history of
cooperative breeding in Australian birds. Emu 102: 9–17.
Bonte, D., Van Dyck, H., Bullock, J.M., Coulon, A., Delgado, M., Gibbs, M., et al. 2012.
Costs of dispersal. Biol. Rev. 87: 290–312.
Brouwer, L., Heg, D. & Taborsky, M. 2005. Experimental evidence for helper effects
in a cooperatively breeding cichlid. Behav. Ecol. 16: 667–673.
Brouwer, L., Van de Pol, M. & Cockburn, A. 2014. The role of social environment on
parental care: Offspring benefit more from the presence of female than male
helpers. J. Anim. Ecol. 83: 491–503.
Brown, J.L. 1987. Helping and communal breeding in birds. Princeton Univeristy
Press.
Burnham, K.P. 2004. Multimodel inference: Understanding AIC and BIC in model
selection. Sociol. Methods Res. 33: 261–304.
Burnham, K.P. & Anderson, D.R. 2002. Model Selection and Multimodel Inference,
2nd ed. (K. P. Burnham & D. R. Anderson, eds). Springer-Verlag New York, New
York.
Burnham, K.P., Anderson, D.R. & Huyvaert, K.P. 2011. AIC model selection and
multimodel inference in behavioral ecology : some background , observations ,
and comparisons. Behav. Ecol. Sociobiol. 65: 23–35.
Canestrari, D., Marcos, J.M. & Baglione, V. 2005. Effect of parentage and relatedness
on the individual contribution to cooperative chick care in carrion crows
Corvus corone corone. Behav. Ecol. Sociobiol. 57: 422–428.
Canestrari, D., Marcos, J.M. & Baglione, V. 2011. Helpers at the nest compensate for
reduced maternal investment in egg size in carrion crows. J. Evol. Biol. 24:
1870–1878.
Catchen, J., Hohenlohe, P.A., Bassham, S., Amores, A. & Cresko, W.A. 2013. Stacks: an

229
analysis tool set for population genomics. Mol. Ecol. 22: 3124–3140.
Catchen, J.M., Amores, A., Hohenlohe, P., Cresko, W., Postlethwait, J.H. & De Koning,
D.-J. 2011. Stacks: Building and genotyping loci de novo from short-read
sequences. G3 Genes, Genomes, Genet. 1: 171–182.
Chang, C.C., Chow, C.C., Tellier, L.C.A.M., Vattikuti, S., Purcell, S.M. & Lee, J.J. 2015.
Second-generation PLINK: rising to the challenge of larger and richer datasets.
Gigascience 4: 1–16.
Charmantier, A., Keyser, A.J. & Promislow, D.E.L.L. 2007. First evidence for heritable
variation in cooperative breeding behaviour. Proc. R. Soc. B 274: 1757–1761.
Charnov, E.L. 1978. Kin selection and helpers at the nest: effects of paternity. Anim.
Behav. 29: 631–632.
Clarke, M.F. 1989. The pattern of helping in the Bell miner (Manorina
melanophrys). Ethology 80: 292–306.
Clutton-brock, T. 2002. Breeding together: kin selection and mutualism in
cooperative vertebrates. Science 296: 69–72.
Clutton-Brock, T. 2002. Breeding together: Kin selection and mutualism in
cooperative vertebrates. Science 296: 69–72.
Clutton-Brock, T., Albon, S.D. & Guinness, F.E. 1985. Parental investment and sex
mortality in birds and mammals. Nature 313: 131–133.
Clutton-Brock, T.H., Russell, A.F. & Sharpe, L.L. 2003. Meerkat helpers do not
specialize in particular activities. Anim. Behav. 66: 531–540.
Clutton-Brock, T.H., Russell, A.F., Sharpe, L.L., Brotherton, P.N.M., Mcllrath, G.M.,
White, S., et al. 2001. Effects of helpers on juvenile development and survival
in meerkats. Science 293: 2446–2449.
Clutton-Brock, T.H., Russell, A.F., Sharpe, L.L., Young, A.J., Balmforth, Z., McIlrath,
G.M., et al. 2002. Evolution and development of sex differences in cooperative
behavior in meerkats. Science 297: 253–256.
Cockburn, A. 1998. Evolution of helping behavior in cooperatively breeding birds.

230
Annu. Rev. Ecol. Syst. 29: 141–177.
Cockburn, A. & Russell, A.F. 2011. Cooperative breeding: a question of climate?
Curr. Biol. 21: 195–197.
Cockburn, A., Sims, R.A., Osmond, H.L., Green, D.J., Double, M.C. & Mulder, R.A. 2008.
Can we measure the benefits of help in cooperatively breeding birds: the case
of superb fairy-wrens Malurus cyaneus ? J. Anim. Ecol. 77: 430–438.
Collias, N.E. & Collias, E.C. 1978. Cooperative breeding behaviour in the white-
browed sparrow weaver. Auk 95: 472–484.
Cornwallis, C.K., Botero, C.A., Rubenstein, D.R., Downing, P.A., West, S.A. & Griffin,
A.S. 2017. Cooperation facilitates the colonization of harsh environments. Nat.
Ecol. Evol. 1: 1–26.
Cram, D.L., Blount, J.D. & Young, A.J. 2015. The oxidative costs of reproduction are
group-size dependent in a wild cooperative breeder. Proc. R. Soc. B 282:
20152031.
Curley, J.P., Davidson, S., Bateson, P., Champagne, F.A., Curley, J.P., Davidson, S., et al.
2009. Social enrichment during postnatal development induces
transgenerational effects on emotional and reproductive behavior in mice.
Front. Behav. Neurosci. 3: 1–14.
Curry, R.L. 1988. Influence of kinship on helping behavior in Gala pagos
mockingbirds. Behav. Ecol. Sociobiol. 22: 141–152.
Dall, S.R.X., Bell, A.M., Bolnick, D.I. & Ratnieks, F.L.W. 2012. An evolutionary ecology
of individual differences. Ecol. Lett. 15: 1189–1198.
Dantzer, B., Dubuc, C., Goncalves, I.B., Cram, D.L., Bennett, N.C., Ganswindt, A., et al.
2019. The development of individual differences in cooperative behaviour:
Maternal glucocorticoid hormones alter helping behaviour of offspring in wild
meerkats. Philos. Trans. R. Soc. B 374: 20180117.
Darwin, C. 1859. On the origin of species. London, John Murray.
de Villemereuil, P., Schielzeth, H., Nakagawa, S. & Morrissey, M. 2016. General

231
methods for evolutionary quantitative genetic inference from generalized
mixed models. Genetics 204: 1281–1294.
Dickinson, J.L. & Hatchwell, B.J. 2004. Fitness consequences of helping. In: Ecology
and evolution of cooperative breeding in birds (W. D. Koenig & J. L. Dickinson,
eds), pp. 48–66. Cambridge University Press, Cambridge.
Dixit, T., English, S. & Lukas, D. 2017. The relationship between egg size and helper
number in cooperative breeders: a meta-analysis across species. PeerJ 5:
e4028.
Dochtermann, N.A., Schwab, T., Berdal, M.A., Dalos, J., Royaute , R., Anderson Berdal,
M., et al. 2019. The heritability of behavior: a Meta-analysis. J. Hered. 110:
403–410.
Doerr, E.D. & Doerr, V.A.J. 2005. Dispersal range analysis: Quantifying individual
variation in dispersal behaviour. Oecologia 142: 1–10.
Downing, P.A., Griffin, A.S. & Cornwallis, C.K. 2018. Sex differences in helping effort
reveal the effect of future reproduction on cooperative behaviour in birds.
Proc. R. Soc. B 285: 20181164.
Ebensperger, L.A., Villegas, A ., Abades, S. & Hayes, L.D. 2014. Mean ecological
conditions modulate the effects of group living and communal rearing on
offspring production and survival. Behav. Ecol. 25: 862–870.
Ekman, J., Bylin, A. & Tegelstro m, H. 2000. Parental nepotism enhances survival of
retained offspring in the Siberian jay. Behav. Ecol. 11: 416–420.
Ekman, J., Eggers, S., Griesser, M. & Tegelstro m, H. 2001. Queuing for preferred
territories: Delayed dispersal of Siberian jays. J. Anim. Ecol. 70: 317–324.
Emlen, S.T. 1994. Benefits, constrainsts and the evolution of the family. Trends Ecol.
Evol. 9: 282–285.
Emlen, S.T. 1984. Cooperative breeding in birds and mammals. In: Behavioural
ecology: An evolutionary approach (J. R. Krebs & N. B. Davies, eds), pp. 305–
335. Blackwell Scientific Publications, Oxford, UK.

232
Emlen, S.T. 1991. Evolution of cooperative breeeding in birds and mammals. In:
Behavioural ecology: An evolutionary approach (J. R. Krebs & N. B. Davies, eds),
pp. 301–337. Blackwell Science, Oxford, UK.
Emlen, S.T. 1982a. The evolution of helping. II. The role of behavioral conflict. Am.
Nat. 119: 40–53.
Emlen, S.T. 1982b. The evolution of helping I. An ecological constrains model. Am.
Nat. 119: 29–39.
Engelhardt, S.C., Kingma, S.A. & Taborsky, M. 2018. No evidence for a heritable
altruism polymorphism in Tibetan ground tits. Proc. Natl. Acad. Sci. 115:
E11208–E11209.
English, S., Browning, L.E. & Raihani, N.J. 2015. Developmental plasticity and social
specialization in cooperative societies. Anim. Behav. 106: 37–42.
English, S., Nakagawa, S. & Clutton-Brock, T.H. 2010. Consistent individual
differences in cooperative behaviour in meerkats (Suricata suricatta). J. Evol.
Biol. 23: 1597–1604.
Ernsting, G., Isaaks, J.A. & Universiteit, V. 1997. Effects of temperature and season
on egg size, hatchling size and adult size in Notiophilus biguttatus. Ecol.
Entomol. 22: 32–40.
Ferguson, J.W.H. 1988. Geographic variation in social behaviour of white-browed
sparrow-weavers, Plocepasser mahali . South African J. Zool. 23: 1–6.
Fick, S.E. & Hijmans, R.J. 2017. Worldclim 2: New 1-km spatial resolution climate
surfaces for global land areas. Int. J. Climatol.
Field, J., Cronin, A. & Bridge, C. 2006. Future fitness and helping in social queues.
Nature 441: 214–217.
Field, J., Shreeves, G., Sumner, S. & Casiraghi, M. 2000. Insurance-based advantage
to helpers in a tropical hover wasp. Nature 404: 869–871.
Fischer, S., Bessert-Nettelbeck, M., Kotrschal, A. & Taborsky, B. 2015. Rearing-group
size determines social competence and brain structure in a cooperatively

233
breeding cichlid. Am. Nat. 186: 123–140.
Fournier, D.A., Skaug, H.J., Ancheta, J., Ianelli, J., Magnusson, A., Maunder, M.N., et al.
2012. AD Model Builder: Using automatic differentiation for statistical
inference of highly parameterized complex nonlinear models. Optim. Methods
Softw. 27: 233–249.
Gaston, A.J. 1978. The evolution of group territorial behaviour and cooperative
breeding. Am. Nat. 112: 1091–1100.
Gazda, S.K., Connor, R.C., Edgar, R.K. & Cox, F. 2005. A division of labour with role
specialization in group-hunting bottlenose dolphins (Tursiops truncatus) off
Cedar Key, Florida. Proc. R. Soc. B 272: 135–140.
Gelman, A. & Hill, J. 2007. Data analysis using regression and multilevel/hierarchical
models. NY: Cambridge University Press, New York.
Gelman, A. & Rubin, D.B. 1992. Inference from iterative simulation using multiple
sequences. Stat. Sci. 7: 457–511.
Gilbert, O.M. 2018. Altruism or association? Proc. Natl. Acad. Sci. 115: E3069–
E3070.
Gonzalez, J.-C.T., Sheldon, B.C. & Tobias, J. a. 2013. Environmental stability and the
evolution of cooperative breeding in hornbills. Proc. R. Soc. B 280: 20131297.
Gould, S.J. 2002. The Structure of Evolutionary Theory. Belknap Press of Harvard
University Press.
Grafen, A. 1988. On the uses of data on lifetime reproductive success. In:
Reproductive Success (T. H. Clutton-Brock, ed), pp. 454–463. University of
Chicago Press, Chicago.
Green, J.P., Freckleton, R.P. & Hatchwell, B.J. 2016. Variation in helper effort among
cooperatively breeding bird species is consistent with Hamilton’s Rule. Nat.
Commun. 7: 12663.
Greenwood, P.J. 1980. Mating systems, philopatry and dispersal in birds and
mammals. Anim. Behav. 28: 1140–1162.

234
Griesser, M., Drobniak, S.M., Nakagawa, S. & Botero, C.A. 2017. Family living sets the
stage for cooperative breeding and ecological resilience in birds. PLoS Biol. 15:
e2000483.
Griffin, A.S. & West, S.A. 2003. Kin discrimination and the benefit of helping in
cooperatively breeding vertebrates. Science (80-. ). 302: 634–636.
Griffin, A.S. & West, S.A. 2002. Kin selection: fact and fiction. Trends Ecol. Evol. 17:
15–21.
Hadfield, J.D. 2010. MCMC Methods for Multi-Response Generalized Linear Mixed
Models in R: The MCMCglmm R package. J. Stat. Softw. 33: 1–22.
Hales, C.N. & Barker, D.J.P. 2001. The thrifty phenotype hypothesis. Bristish Med.
Bull. 60: 5–20.
Hamilton, W.D. 1987. Discriminating nepotism: expectable, common and
overlooked. In: Kin recognition in animals (D. J. C. Fletcher & C. D. Michener,
eds). Wiley, New York.
Hamilton, W.D. 1964. The genetical evolution of social behaviour I & II. J. Theor.
Biol. 7: 1–52.
Harrison, X., York, J.E., Cram, D.L., Hares, M.C. & Young, A.J. 2013a. Complete
reproductive skew within white-browed sparrow weaver groups despite
outbreeding opportunities for subordinates of both sexes. Behav. Ecol.
Sociobiol. 67: 1915–1929.
Harrison, X., York, J.E., Cram, D.L. & Young, A.J. 2013b. Extra-group mating increases
inbreeding risk in a cooperatively breeding bird. Mol. Ecol. 22: 5700–5715.
Harrison, X., York, J.E. & Young, A.J. 2014. Population genetic structure and direct
observations reveal sex-reversed patterns of dispersal in a cooperative bird.
Mol. Ecol. 23: 5740–5755.
Harrison, X.A., Donaldson, L., Correa-cano, M.E., Evans, J., Fisher, D.N., Goodwin,
C.E.D., et al. 2018. A brief introduction to mixed effects modelling and multi-
model inference in ecology. PeerJ 6: e4794.

235
Hartig, F. 2018. DHARMa: Residual diagnostics for hierarchical (multi-Level /
mixed) regression models. R package version 0.2.4.
Hatchwell, B.J. 1999. Investment Strategies of Breeders in Avian. Am. Nat. 154:
205–219.
Hatchwell, B.J. 2016. Long-tailed tits: ecological causes and fitness consequences of
redirected helping. In: Cooperative breeding in vertebrates: studies of ecology,
evolution, and behaviour (W. D. Koenig & J. L. Dickinson, eds), pp. 39–57.
Cambridge University Press, Cambridge.
Hatchwell, B.J. 2009. The evolution of cooperative breeding in birds: kinship,
dispersal and life history. Philos. Trans. R. Soc. B Biol. Sci. 364: 3217–3227.
Hatchwell, B.J. & Russell, A.F. 1996. Provisioning rules in cooperatively breeding
long-tailed tits Aegithalos caudatus: an experimental study. Proc. R. Soc. B 263:
83–88.
Hatchwell, B.J., Russell, A.F., MacColl, A.D.C.C., Ross, D.J., Fowlie, M.K. & McGowan, A.
2004. Helpers increase long-term but not short-term productivity in
cooperatively breeding long-tailed tits. Behav. Ecol. 15: 1–10.
Heinsohn, R.G. 2004. Parental care, load-lightening, and costs. In: Ecology and
Evolution of cooperative breeding in birds (W. D. Koenig & J. L. Dickinson, eds),
pp. 67–80. Cambridge University Press, Cambridge.
Henry, C. & Ulijaszek, S. 1996. Long-term consequences of early environment.
Cambridge University Press, Cambridge.
Hodge, S.J. 2007. Counting the costs: the evolution of male-biased care in the
cooperatively breeding banded mongoose. Anim. Behav. 74: 911–919.
Jetz, W. & Rubenstein, D.R. 2011. Environmental uncertainty and the global
biogeography of cooperative breeding in birds. Curr. Biol. 21: 72–78.
Johnstone, R.A. 2011. Load lightening and negotiation over offspring care in
cooperative breeders. Behav. Ecol. 22: 436–444.
Johnstone, R.A. & Cant, M.A. 2008. Sex differences in dispersal and the evolution of

236
helping and harming. Am. Nat. 172: 318–330.
Kasper, C., Ko lliker, M., Postma, E. & Taborsky, B. 2017a. Consistent cooperation in a
cichlid fish is caused by maternal and developmental effects rather than
heritable genetic variation. Proc. R. Soc. B 284: 20170369.
Kasper, C., Vierbuchen, M., Ernst, U., Fischer, S., Radersma, R., Raulo, A., et al. 2017b.
Genetics and developmental biology of cooperation. Mol. Ecol. 26: 4364–4377.
Kennedy, P., Higginson, A., Radford, A.N. & Sumner, S. 2018. Altruism in a volatile
world. Nature 555: 359–362.
Khan, M. & Walters, J. 2002. Effects of helpers on breeder survival in the red-
cockaded woodpecker (Picoides borealis). Behav. Ecol. Sociobiol. 51: 336–344.
Kingma, S.A., Hall, M.L., Arriero, E. & Peters, A. 2010. Multiple benefits of
cooperative breeding in purple-crowned fairy-wrens: A consequence of
fidelity? J. Anim. Ecol. 79: 757–768.
Kingma, S.A., Komdeur, J., Burke, T. & Richardson, D.S. 2017. Differential dispersal
costs and sex-biased dispersal distance in a cooperatively breeding bird.
Behav. Ecol. 28: 1113–1121.
Kingma, S.A., Komdeur, J., Hammers, M. & Richardson, D.S. 2016. The cost of
prospecting for dispersal opportunities in a social bird. Biol. Lett. 12:
20160316.
Kingma, S.A., Santema, P., Taborsky, M. & Komdeur, J. 2014. Group augmentation
and the evolution of cooperation. Trends Ecol. Evol. 29: 476–484.
Klaassen, M. & Bech, C. 1992. Resting and peak metabolic rates of arctic tern
nestlings and their relations to growth rate. Physiol. Zool. 65: 803–814.
Kocher, S.D., Pellissier, L., Veller, C., Purcell, J., Nowak, M.A., Chapuisat, M., et al.
2014. Transitions in social complexity along elevational gradients reveal a
combined impact of season length and development time on social evolution.
Proc. R. Soc. B 281: 20140627.
Koenig, W.D. 2017. What drives cooperative breeding? PLoS Biol. 15: e2002965.

237
Koenig, W.D. & Dickinson, J.L. 2016. Cooperative Breeding in Vertebrates: Studies of
Ecology, Evolution, and Behavior (W. D. Koenig & J. L. Dickinson, eds).
Cambridge University Press, Cambridge.
Koenig, W.D., Mumme, R.L. & Pitelka, F.A. 1983. Female roles in cooperatively
breeding acorn woodpeckers. In: Social behaviour of female vertebrates (S. K.
Wasser, ed), pp. 235–261. Academic Press.
Koenig, W.D., Pitelka, F.A., Carmen, W.J., Mumme, R.L. & Stanback, M.T. 1992. The
Evolution of Delayed Dispersal in Cooperative Breeders. Quartely Rev. Biol. 67:
111–150.
Koenig, W.D. & Walters, E.L. 2015. Temporal variability and cooperative breeding :
testing the bet-hedging hypothesis in the acorn woodpecker. Proc. R. Soc. B
282: 20151742.
Kokko, H. & Ekman, J. 2002. Delayed dispersal as a route to breeding: territorial
inheritance, safe havens, and ecological constraints. Am. Nat. 160: 468–484.
Kokko, H., Johnstone, R.A. & Clutton-Brock, T.H. 2001. The evolution of cooperative
breeding through group augmentation. Proc. R. Soc. B 268: 187–196.
Komdeur, J. 1992. Importance of habitat saturation and territory quality for
evolution of cooperative breeding in the Seychelles warbler. Nature 358: 493–
495.
Komdeur, J. 2006. Variation in individual investment strategies among social
animals. Ethology 112: 729–747.
Krist, M. 2011. Egg size and offspring quality: A meta-analysis in birds. Biol. Rev.
86: 692–716.
Kruuk, L.E.B. 2004. Estimating genetic parameters in natural populations using the
‘animal model.’ Philos. Trans. R. Soc. London B 359: 873–890.
Kruuk, L.E.B. & Hadfield, J.D. 2007. How to separate genetic and environmental
causes of similarity between relatives. J. Evol. Biol. 20: 1890–1903.
Kruuk, L.E.B., Osmond, H.L. & Cockburn, A. 2015. Contrasting effects of climate on

238
juvenile body size in a Southern Hemisphere passerine bird. Glob. Chang. Biol.
21: 2929–2941.
Kvalnes, T., Ringsby, T.H., Jensen, H. & Sæther, B.-E. 2013. Correlates of egg size
variation in a population of house sparrow Passer domesticus. Oecologia 171:
391–402.
Langmore, N.E., Bailey, L.D., Heinsohn, R.G., Russell, A.F. & Kilner, R.M. 2016. Egg
size investment in superb fairy-wrens: Helper effects are modulated by
climate. Proc. R. Soc. B 283: 20161875.
Legge, S. 2000. Helper contributions in the cooperatively breeding laughing
kookaburra: Feeding young is no laughing matter. Anim. Behav. 59: 1009–
1018.
Lehmann, L. & Balloux, F. 2007. Natural selection on fecundity variance in
subdivided populations: Kin Selection meets bet hedging. Genetics 176: 361–
377.
Leitner, S., Mundy, P. & Voigt, C. 2009. Morphometrics of White-browed Sparrow-
Weavers Plocepasser mahali in south-western Zimbabwe. Ostrich 80: 99–102.
Lejeune, L., van de Pol, M., Cockburn, A., Louter, M. & Brouwer, L. 2016. Male and
female helper effects on maternal investment and adult survival in red-winged
fairy-wrens. Behav. Ecol. 27: 1841–1850.
Lewis, D.M. 1982a. Cooperative breeding in a population of white-browed sparrow
weavers Plocepasser mahali. Ibis 124: 511–522.
Lewis, D.M. 1981. Determinants of reproductive success of the White-Browed
sparrow weaver, Plocepasser mahali. Behav. Ecol. Sociobiol. 9: 83–93.
Lewis, D.M. 1982b. Dispersal in a population of white-browed sparrow weavers.
Condor 84: 306–312.
Liebl, A.L., Nomano, F.Y., Browning, L.E. & Russell, A.F. 2016. Experimental evidence
for fully additive care among male carers in the cooperatively breeding
chestnut-crowned babbler. Anim. Behav. 115: 47–53.

239
Lindstro m, J. 1999. Early development in birds and mammals. Trends Ecol. Evol. 14:
343–348.
Lukas, D. & Clutton-Brock, T. 2017. Climate and the distribution of cooperative
breeding in mammals. R. Soc. Open Sci. 4: 160897.
Magrath, R.D. 2001. Group breeding dramatically increases reproductive success of
yearling but not older female scrubwrens: a model for cooperatively breeding
birds? J. Anim. Ecol. 70: 370–385.
Mares, R., Bateman, A.W., English, S., Clutton-Brock, T.H. & Young, A.J. 2014. Timing
of predispersal prospecting is influenced by environmental, social and state-
dependent factors in meerkats. Anim. Behav. 88: 185–193.
Mastretta-Yanes, A., Arrigo, N., Alvarez, N., Jorgensen, T.H., Pin ero, D. & Emerson,
B.C. 2015. Restriction site-associated DNA sequencing, genotyping error
estimation and de novo assembly optimization for population genetic
inference. Mol. Ecol. Resour. 15: 28–41.
McNamara, J.M., Stephens, P.A., Dall, S.R.X. & Houston, A.I. 2009. Evolution of trust
and trustworthiness: Social awareness favours personality differences. Proc. R.
Soc. B 276: 605–613.
Meade, J., Nam, K.B., Beckerman, A.P. & Hatchwell, B.J. 2010. Consequences of “load-
lightening” for future indirect fitness gains by helpers in a cooperatively
breeding bird. J. Anim. Ecol. 79: 529–537.
Mennill, D.J., Doucet, S.M., Ward, K.A.A., Maynard, D.F., Otis, B. & Burt, J.M. 2012. A
novel digital telemetry system for tracking wild animals: A field test for
studying mate choice in a lekking tropical bird. Methods Ecol. Evol. 3: 663–672.
Mousseau, T. & Fox, C.W. 1998. Maternal effects as adaptations. Oxford University
Press, Oxford, UK.
Narushin, V.G. 2005. Egg geometry calculation using the measurements of length
and breadth. Poult. Sci. 84: 482–484.
Nelson-flower, M.J. & Ridley, A.R. 2016. Nepotism and subordinate tenure in a
cooperative breeder. Bioloy Lett. 12: 20160365.

240
Olofsson, H., Ripa, J., Jonze n, N. & Jonze, N. 2009. Bet-hedging as an evolutionary
game : the trade-off between egg size and number. Proc. R. Soc. B 276: 2963–
2969.
Ostermeyer, M.C. & Elwood, R.W. 1984. Helpers - at the Nest in the Mongolian
Gerbil, Meriones Unguiculatus. Behaviour 91: 61–76.
Owens, D.D. & Owens, M.J. 1984. Helping behaviour in brown hyenas. Nature 306:
1983–1985.
Paquet, M., Covas, R., Chastel, O., Parenteau, C. & Doutrelant, C. 2013. Maternal
effects in relation to helper presence in the cooperatively breeding sociable
weaver. PLoS One 8: e59336.
Paris, J.R., Stevens, J.R. & Catchen, J.M. 2016. Lost in parameter space: A road map
for Stacks. Methods Ecol. Evol. 8: 1360–1373.
Peig, J. & Green, A.J. 2009. New perspectives for estimating body condition from
mass/length data: The scaled mass index as an alternative method. Oikos 118:
1883–1891.
Pick, J.L., Ebneter, C., Hutter, P. & Tschirren, B. 2016. Disentangling genetic and
prenatal maternal effects on offspring size and survival. Am. Nat. 188: 628–
639.
Pick, J.L., Postma, E. & Tschirren, B. 2019. The more you get, the more you give:
Positive cascading effects shape the evolutionary potential of prenatal
maternal investment. Evolution Letters. Evol. Lett. 3: 412–423.
Queller, D.C. & Goodnight, K.F. 1989. Estimating Relatedness Using Genetic Markers.
Evolution 43: 258–275.
R Core Team. 2019. R: A language and environment for statistical computing.
Statistical Computing, Vienna, Austria.
Richards, S.A. 2008. Dealing with overdispersed count data in applied ecology. J.
Appl. Ecol. 45: 218–227.
Richards, S.A., Whittingham, M.J. & Stephens, P.A. 2011. Model selection and model

241
averaging in behavioural ecology : the utility of the IT-AIC framework. Behav.
Ecol. Sociobiol. 65: 77–89.
Ridley, A.R. 2007. Factors affecting offspring survival and development in a
cooperative bird: Social, maternal and environmental effects. J. Anim. Ecol. 76:
750–760.
Ridley, A.R., Raihani, N.J. & Nelson-Flower, M.J. 2008. The cost of being alone: The
fate of floaters in a population of cooperatively breeding pied babblers
Turdoides bicolor. J. Avian Biol. 39: 389–392.
Rodell, M., Beaudoing, H.K. & NASA/GSFC/HSL. 2016. GLDAS Noah Land Surface
Model L4 3 hourly 0.25 x 0.25 degree V2.1, Greenbelt, Maryland, USA, Goddard
Earth Sciences Data and Information Services Center (GES DISC).
Rubenstein, D.R. 2011. Spatiotemporal environmental variation, risk aversion, and
the evolution of cooperative breeding as a bet-hedging strategy. Proc. Natl.
Acad. Sci. 108: 10816–10822.
Russell, A.F., Brotherton, P.N.M., Mcilrath, G.M., Sharpe, L.L. & Clutton-Brock, T.H.
2003a. Breeding success in cooperative meerkats: Effects of helper number
and maternal state. Behav. Ecol. 14: 486–492.
Russell, A.F., Clutton-Brock, T.H., Brotherton, P.N.M., Sharpe, L.L., Mcilrath, G.M.,
Dalerum, F.D., et al. 2002. Factors affecting pup growth and survival in co-
operatively breeding meerkats Suricata suricatta. J. Anim. Ecol. 71: 700–709.
Russell, A.F. & Hatchwell, B.J. 2001. Experimental evidence for kin-biased helping in
a cooperatively breeding vertebrate. Proc. R. Soc. B 268: 2169–2174.
Russell, A.F., Langmore, N.E., Cockburn, A., Astheimer, L.B. & Kilner, R.M. 2007a.
Reduced egg investment can conceal helper effects in cooperatively breeding
birds. Science 317: 941–944.
Russell, A.F. & Lummaa, V. 2009. Maternal effects in cooperative breeders: From
hymenopterans to humans. Philos. Trans. R. Soc. B 364: 1143–1167.
Russell, A.F., Sharpe, L.L., Brotherton, P.N.M. & Clutton-Brock, T.H. 2003b. Cost
minimization by helpers in cooperative vertebrates. Proc. Natl. Acad. Sci. 100:

242
3333–3338.
Russell, A.F., Young, A.J., Spong, G., Jordan, N.R. & Clutton-Brock, T.H. 2007b. Helpers
increase the reproductive potential of offspring in cooperative meerkats. Proc.
R. Soc. B 274: 513–520.
Sanderson, J.L., Stott, I., Young, A.J., Vitikainen, E.I.K., Hodge, S.J. & Cant, M.A. 2015.
The origins of consistent individual differences in cooperation in wild banded
mongooses, Mungos mungo. Anim. Behav. 107: 193–200.
Santos, E.S.A.A. & Macedo, R.H. 2011. Load lightening in southern lapwings: Group-
Living mothers lay smaller eggs than pair-living mothers. Ethology 117: 547–
555.
Savage, J.L., Russell, A.F. & Johnstone, R.A. 2015. Maternal allocation in cooperative
breeders: Should mothers match or compensate for expected helper
contributions? Anim. Behav. 102: 189–197.
Sharp, S.P., English, S. & Clutton-Brock, T.H. 2013. Maternal investment during
pregnancy in wild meerkats. Evol. Ecol. 27: 1033–1044.
Sheehan, M.J., Botero, C.A., Hendry, T.A., Sedio, B.E., Jandt, J.M., Weiner, S., et al.
2015. Different axes of environmental variation explain the presence vs. extent
of cooperative nest founding associations in Polistes paper wasps. Ecol. Lett.
18: 1057–1067.
Simons, A.M. 2009. Fluctuating natural selection accounts for the evolution of
diversification bet hedging. Proc. R. Soc. B 276: 1987–1992.
Simons, A.M. 2011. Modes of response to environmental change and the elusive
empirical evidence for bet hedging. Proc. R. Soc. B 278: 1601–1609.
Skutch, A.F. 1935. Helpers at the nest. Auk 52: 257–273.
Snijders, L., van Oers, K. & Naguib, M. 2017. Sex-specific responses to territorial
intrusions in a communication network: evidence from radio-tagged great tits.
Ecol. Evol. 7: 918–927.
Snijders, L., van Rooij, E.P., Burt, J.M., Hinde, C.A., van Oers, K. & Naguib, M. 2014.

243
Social networking in territorial great tits: Slow explorers have the least central
social network positions. Anim. Behav. 98: 95–102.
Spottiswoode, C.N. 2007. Phenotypic sorting in morphology and reproductive
investment among sociable weaver colonies. Oecologia 154: 589–600.
Stallcup, J.A. & Woolfenden, G.E. 1978. Family status and contributions to breeding
by Florida scrub jays. Anim. Behav. 26: 1144–1156.
Starrfelt, J. & Kokko, H. 2012. Bet-hedging-a triple trade-off between means,
variances and correlations. Biol. Rev. 87: 742–755.
Stevens, M.I., Hogendoorn, K. & Schwarz, M.P. 2007. Evolution of sociality by
natural selection on variances in reproductive fitness: Evidence from a social
bee. BMC Evol. Biol. 7: 1–9.
Taborsky, B. 2017. Developmental Plasticity: Preparing for Life in a Complex World.
Elsevier Ltd.
Taborsky, B., Skubic, E. & Bruintjes, R. 2007. Mothers adjust egg size to helper
number in a cooperatively breeding cichlid. Behav. Ecol. 18: 652–657.
Valencia, J., Mateos, C., Cruz, C. De & Carranza, J. 2017. Maternal allocation in eggs
when counting on helpers in a cooperatively breeding bird. J. Avian Biol. 48:
536–543.
van de Pol, M., Bailey, L.D., McLean, N., Rijsdijk, L., Lawson, C.R. & Brouwer, L. 2016.
Identifying the best climatic predictors in ecology and evolution. Methods Ecol.
Evol. 7: 1246–1257.
van de Pol, M. & Wright, J. 2009. A simple method for distinguishing within- versus
between-subject effects using mixed models. Anim. Behav. 77: 753–758.
Vitikainen, E.I.K., Thompson, F.J., Marshall, H.H. & Cant, M.A. 2019. Live long and
prosper: Durable benefits of early-life care in banded mongooses. Philos.
Trans. R. Soc. B 374: 20180114.
Walker, L.A. 2015. The evolution and regulation of cooperation in the wild. PhD
Thesis. Univ. Exet. 1–226.

244
Walker, L.A., York, J.E. & Young, A.J. 2016. Sexually selected sentinels? Evidence of a
role for intrasexual competition in sentinel behavior. Behav. Ecol. 27: 1461–
1470.
Wang, C. & Lu, X. 2018. Hamilton’s inclusive fitness maintains heritable altruism
polymorphism through rb = c . Proc. Natl. Acad. Sci. 115: 1860–1864.
Waser, P.M. 1996. Patterns and consequences of dispersal in gregarious carnivores.
In: Carnivore behaviour, ecology and evolution (J. L. Gittleman, ed), pp. 267–
295. Cornell Univeristy Press, New York.
West, S.A. & Griffin, A.S. 2007. Evolutionary Explanations for Cooperation. Curr.
Biol. 17: 661–672.
West, S.A., Griffin, A.S. & Gardner, A. 2007. Social semantics: Altruism, cooperation,
mutualism, strong reciprocity and group selection. J. Evol. Biol. 20: 415–432.
Whitney, G. 1976. Genetic substrates for the initial evolution of human sociality. I.
Sex chromosome mechanisms. Am. Nat. 110: 867–875.
Wigginton, J.E., Cutler, D.J. & Abecasis, G.R. 2005. A note on exact tests of Hardy-
Weinberg equilibrium. Am. J. Hum. Genet. 76: 887–93.
Wiley, E.M. & Ridley, A.R. 2016. The effects of temperature on offspring
provisioning in a cooperative breeder. Anim. Behav. 117: 187–195.
Williams, D.A. & Hale, A.M. 2007. Female-biased helping in a cooperatively breeding
bird: Female benefits or male costs? Ethology 113: 534–542.
Wilson, A.J. 2014. Competition as a source of constraint on life history evolution in
natural populations. Heredity (Edinb). 112: 70–78.
Wilson, A.J. 2018. How should we interpret estimates of individual repeatability?
Evol. Lett. 2: 4–8.
Wilson, A.J., Gelin, U., Perron, M.-C. & Reale, D. 2009. Indirect genetic effects and the
evolution of aggression in a vertebrate system. Proc. R. Soc. B 276: 533–541.
Wilson, A.J., Morrissey, M.B., Adams, M.J., Walling, C.A., Guinness, F.E., Pemberton,
J.M., et al. 2011. Indirect genetics effects and evolutionary constraint: an

245
analysis of social dominance in red deer, Cervus elaphus. J. Evol. Biol. 24: 772–
783.
Wilson, A.J., Re ale, D., Clements, M.N., Morrissey, M.M., Postma, E., Walling, C.A., et
al. 2010. An ecologist’s guide to the animal model. J. Anim. Ecol. 79: 13–26.
Wolak, M.E. 2012. Nadiv: An R package to create relatedness matrices for
estimating non-additive genetic variances in animal models. Methods Ecol.
Evol. 3: 792–796.
Wolf, J.B., Brodie III, E.D., Cheverud, J.M., Moore, A.J. & Wade, M.J. 1998.
Evolutionary consequences of indirect genetic effects. Trends Ecol. Evol. 13:
64–69.
Wolf, M., Sander van Doorn, G., Leimar, O. & Weissing, F.J. 2007. Life-history trade-
offs favour the evolution of animal personalities. Nature 447: 581–584.
Wood, E. 2017. Causes and fitness consequences of telomere dynamics in a wild
social bird. PhD Thesis. Univ. Exet. 1–236.
Wood, E.M. & Young, A.J. 2019. Telomere attrition predicts reduced survival in a
wild social bird, but short telomeres do not. Mol. Ecol. 00: 1–12.
Woolfenden, G.E. & Fitzpatrick, J.W. 1978. The inheritance of territory in group-
breeding birds. Bioscience 28: 104–108.
Woxvold, I.A. & Magrath, M.J.L. 2005. Helping Enhances Multiple Components of
Reproductive Success in the Cooperatively Breeding Apostlebird. J. Anim. Ecol.
74: 1039–1050.
Yang, J., Benyamin, B., McEvoy, B.P., Gordon, S., Henders, A.K., Nyholt, D.R., et al.
2010. Common SNPs explain a large proportion of the heritability for human
height. Nat. Genet. 42: 565–569.
Yang, J., Lee, S.H., Goddard, M.E. & Visscher, P.M. 2011. GCTA: A tool for genome-
wide complex trait analysis. Am. J. Hum. Genet. 88: 76–82.
York, J.E., Wells, K.J. & Young, A.J. 2019. Dominance-related contributions to
collective territorial defence are adjusted according to the threat. Anim. Behav.

246
in press.
York, J.E., Young, A.J. & Radford, A.N. 2014. Singing in the moonlight: dawn song
performance of a diurnal bird varies with lunar phase. Biol. Lett. 10:
20130970.
Young, A.J. 2003. Subordinate tactics in cooperative meerkats: helping, breeding
and dispersal. PhD Thesis. Univ. Cambridge.
Young, A.J. 2018. The role of telomeres in the mechanisms and evolution of life-
history trade-offs and ageing. Philos. Trans. R. Soc. B 373: 20160452.
Young, A.J., Carlson, A.A. & Clutton-Brock, T. 2005. Trade-offs between
extraterritorial prospecting and helping in a cooperative mammal. Anim.
Behav. 70: 829–837.
Young, A.J., Jarvis, J.U.M., Barnaville, J. & Bennett, N.C. 2015. Workforce effects and
the evolution of complex sociality in wild Damaraland mole rats. Am. Nat. 186:
302–311.
Young, A.J. & Monfort, S.L. 2009. Stress and the costs of extra-territorial movement
in a social carnivore. Biol. Lett. 5: 439–41.
Young, A.J., Spong, G. & Clutton-Brock, T.H. 2007. Subordinate male meerkats
prospect for extra-group paternity: alternative reproductive tactics in a
cooperative mammal. Proc. R. Soc. London B 274: 1603–1609.
Zack, S. 1990. Coupling delayed breeding with short-distance dispersal in
cooperatively breeding birds. Ethology 86: 265–286.
Zahavi, A. 1995. Altruism as a handicap: the limitations of kin selection and
reciprocity. J. Avian Biol. 26: 1–3.
Zo ttl, M., Fischer, S. & Taborsky, M. 2013a. Partial brood care compensation by
female breeders in response to experimental manipulation of alloparental
care. Anim. Behav. 85: 1471–1478.
Zo ttl, M., Heg, D., Chervet, N. & Taborsky, M. 2013b. Kinship reduces alloparental
care in cooperative cichlids where helpers pay-to-stay. Nat. Commun. 4: 1341.

247
Zo ttl, M., Vullioud, P., Mendonça, R., Torrents Tico , M., Gaynor, D., Mitchell, A., et al.
2016. Differences in cooperative behavior among Damaraland mole rats are
consequences of an age-related polyethism. Proc. Natl. Acad. Sci. 113: 10382–
10387.

248