A Thiol Peroxidase Is an H2O2 Receptor and Redox-Transducer in Gene Activation
Upload
independentCategory
view
2download
0
Accepted Manuscript
Benthic fluxes of copper, complexing ligands and thiol compounds in shallow
lagoon waters
Conrad S Chapman, Gabriele Capodaglio, Clara Turetta, Constant M.G. van den
Berg
PII: S0141-1136(08)00217-1
DOI: 10.1016/j.marenvres.2008.07.010
Reference: MERE 3293
To appear in: Marine Environmental Research
Received Date: 17 April 2008
Revised Date: 29 July 2008
Accepted Date: 30 July 2008
Please cite this article as: Chapman, C.S., Capodaglio, G., Turetta, C., van den Berg, C.M.G., Benthic fluxes of
copper, complexing ligands and thiol compounds in shallow lagoon waters, Marine Environmental Research (2008),
doi: 10.1016/j.marenvres.2008.07.010
This is a PDF file of an unedited manuscript that has been accepted for publication. As a service to our customers
we are providing this early version of the manuscript. The manuscript will undergo copyediting, typesetting, and
review of the resulting proof before it is published in its final form. Please note that during the production process
errors may be discovered which could affect the content, and all legal disclaimers that apply to the journal pertain.peer
-005
0197
7, v
ersi
on 1
- 13
Jul
201
0Author manuscript, published in "Marine Environmental Research 67, 1 (2008) 17"
DOI : 10.1016/j.marenvres.2008.07.010

ACCEPTED MANUSCRIPT
� ��
Benthic fluxes of copper, complexing ligands and thiol compounds in shallow lagoon waters ��
Conrad S Chapman1, Gabriele Capodaglio2, Clara Turetta3 and Constant M. G. van den Berg1* ��
1Department of Earth and Ocean Sciences, University of Liverpool, Liverpool L69 3GP (UK) ��
2University Ca’ Foscari, Venice, Italy. ��
3IDPA-CNR, Venice, Italy ��
* To whom correspondence should be addressed: [email protected] ��
Keywords ��
Heavy metals; speciation; ligands; thiols; benthic flux; salt marsh; Venice Lagoon �
Abstract �
Benthic fluxes of copper, copper complexing ligands and thiol compounds in the shallow ���
waters of Venice Lagoon (Italy) were determined using benthic chambers and compared to ���
porewater concentrations to confirm their origin. Benthic copper fluxes were small due to small ���
concentration differences between the porewaters and the overlying water, and the equilibrium ���
concentration was the same at both sites, suggesting that the sediments acted to buffer the copper ���
concentration. Thiol fluxes were ~10 x greater at 50 - 60 pmol cm-2 h-1, at the two sites. ���
Porewater measurements demonstrated that the sediments were an important source of the thiols ���
to the overlying waters. The overlying waters were found to contain at least two ligands, a strong ���
one, L1 (log K�CuL1 = 14.2) and a weaker one, L2 (log K�CuL2 = 12.5). The concentration of L1 ��
remained relatively constant during the incubation and similar to that of copper, whereas that of ��
L2 was in great excess of copper, its concentration balanced by porewater releases and ���
breakdown, probably due to uptake by microorganisms, similar to that of the thiol compounds. ���
Similarity of the thiol and L2 concentrations and similar complex stability with copper suggest ���
that L2 was dominated by the thiols. The free copper concentration ([Cu�]) in the Lagoon waters ���
was lowered by a factor of 105 as a result of the organic complexation. ���
peer
-005
0197
7, v
ersi
on 1
- 13
Jul
201
0
ACCEPTED MANUSCRIPT
� ��
Introduction ���
Sediments can act as a source of copper (Klinkhammer, 1980), copper complexing ���
ligands(Skrabal et al., 2000), sulfur species and thiol compounds (Luther III et al., 1986). Metal ���
complexing ligands (Croot et al., 2000; Moffett and Brand, 1996) and thiol compounds are also ��
known to be released by marine phytoplankton (Dupont and Ahner, 2005; Leal et al., 1999) into ��
surface waters. Specific thiols like glutathione have been found in oceanic�(Dupont et al., 2006; ���
Le Gall and van den Berg, 1998) and estuarine (Tang et al., 2004) waters. As thiol compounds ���
form stable complexes with copper(I) (Leal and Van den Berg, 1998) it is likely that the thiols are ���
part of the pool of copper complexing ligands in natural waters and could play a role in ���
controlling the bioactivity and biogeochemistry of copper. ���
In this study we investigated whether benthic interactions are an important source for thiols, ���
copper and copper-binding ligands in shallow surface waters as occurring in lagoons and salt ���
marshes. Venice Lagoon (Italy) was selected for this study as it is an extensive, shallow lagoon, ���
with salt marshes on the boundaries. Benthic interactions are likely to be relatively important to ��
its water composition due to a shallow water depth of typically 1 m. Benthic fluxes were ��
determined by placing large benthic chambers on the sediments and following changes in the ���
water composition as a function of time. Porewaters were collected from sediment cores to ���
identify the source of the thiols and copper, and the concentration difference with the overlying ���
water was used to estimate comparative thiol fluxes. ���
Materials and Methods ���
Instrumentation and reagents ���
Voltammetric equipment was a �Autolab potentiostat attached to a Metrohm VA 663 ���
electrode stand and controlled by a personal computer. The working electrode was a hanging ���
mercury drop electrode (HMDE), the reference electrode was double junction, Ag/AgCl, 3 M ��
peer
-005
0197
7, v
ersi
on 1
- 13
Jul
201
0

ACCEPTED MANUSCRIPT
� ��
KCl and the counter electrode was a glassy carbon rod. ��
Water used for dilutions was obtained from a Milli-Q (MQ) system. HCl and NH3 were ���
purified by sub-boiling distillation on a quartz condenser. Copper standards were prepared by ���
dilution of atomic adsorption standards (Spectrosol, BDH) and acidified to pH 2.2 using 11 M ���
HCl. Stock solutions of 0.01 salicylaldoxime (SA) (BDH) were prepared in 0.1 M HCl. ���
Speciation ���
Copper, copper complexing ligands (Campos and van den Berg, 1994) and copper - thiol ���
interactions (Leal and Van den Berg, 1998) were determined by cathodic stripping voltammetry ���
(CSV). Copper complexing capacity titrations were at pH 7.8 (NBS scale), using 0.01 M HEPES ���
buffer, diluted from 1 M HEPES (N-2 hydroxyethylpiperazine-N’-2 ethanesulfonic acid, Merck) ��
and 0.55 M NaOH, using ligand competition against 2 �M SA (Campos and van den Berg, 1994). ��
Reactive copper is part of the total dissolved copper which is bound by the added SA, which is a ���
function of the competition between the added SA and the natural ligand. The reactive copper ���
concentration ([Cureactive]) was determined by CSV after deposition at -0.1 V, deposition time 90 s ���
and the scan used the square-wave mode. Uncalibrated reactive copper concentrations (peak ���
heights) were used to fit [Cureactive]/[CuL] as a function of [Cureactive]; a linear least squares ���
regression was used unless curvature of a plot of [Cureactive]/[CuL] as a function of [Cureactive] ���
showed the presence of more ligands, which were then fitted using iterative, linear, least-squares ���
regressions of the data. The sensitivity was corrected for the degree of unsaturation of the ligands ���
with copper at the end of the titrations(Leal and Van den Berg, 1998; Turoczy and Sherwood, ��
1997). The uncertainties in the values for the ligand concentrations and stability constants were ��
calculated from the standard deviation of the least-squares regressions. ���
Samples used for total dissolved copper were acidified to pH 2.5 and UV-digested for 1 h in ���
acid cleaned silica tubes, prior to CSV using 30 �M SA at pH 8.3 using 10 mM borate pH buffer. ���
peer
-005
0197
7, v
ersi
on 1
- 13
Jul
201
0
ACCEPTED MANUSCRIPT
� ��
The deposition potential was -1.1 V, the re-oxidation potential -0.1 V and the CSV scan was in a ���
negative direction using the square-wave modulation. The sensitivity was calibrated for each ���
sample by standard additions of copper. ���
Reactive thiol concentrations were determined by CSV as before (Leal et al., 1999). ���
Voltammetric parameters were as for reactive copper with calibration against glutathione which ���
was found to behave similarly to the unknown thiol species. Our method differed from that used ��
before in that the peak height of the total thiol concentration (Imax) was determined after addition ��
of 100 µM EDTA to free any thiols bound by copper and other metals by lowering the, free, ionic ��
metal concentrations. The peak height of the reactive thiol species was measured during the ��
complexing ligand titrations along with reactive copper, and used to compute conditional stability ��
constants of the copper thiol complexes (Laglera and van den Berg, 2003). Stock solutions of ��
glutathione, thioacetamide, thiourea, cysteine (BDH) and 3-mercaptopropanoic acid (Fluka) were ��
prepared freshly before use by dissolution in MQ. ��
Study sites ��
Venice Lagoon, Italy, lies on the northern Adriatic coast and consists of salt marshes and ��
shallow waters. It is constituted of three main basins and several sub-basins. During the 1960s �
and 1970s it was subjected to sizable anthropogenic inputs that have gradually impaired the �
quality of the lagoon ecosystem (Pavoni et al., 1987). Significant amounts of these pollutants, ��
both organic and inorganic, have accumulated in the sediments and may constitute a potential ��
secondary source of contaminants. The water exchange rate is 140 km3 yr-1, it has an area of 549 ��
km2 and an average depth of 1 m, causing a residence time of the water of about one day, but this ��
can increase to three days in areas of lower dynamics. In remote parts of the lagoon, atmospheric ��
deposition of contaminants is thought to dominate (Cochran et al., 1998) but run-off is the main ��
source near an industrial area (Donazzolo et al., 1984). ��
peer
-005
0197
7, v
ersi
on 1
- 13
Jul
201
0
ACCEPTED MANUSCRIPT
� ��
Two sites were studied, both in relatively contaminated waters: Tresse (Site 1), near the ��
industrial area of Marghera, and Campalto (Site 2), near to an area with a history of solid waste �
disposal (Turetta et al., 2005) (Fig. 1). The experiment at Tresse was from 28 to 31 October 2002 �
and at Campalto from 25 to 27 May 2003; both started at 1:00 PM. The sediment from site 1 (the ����
first cm) had a mean organic carbon content of 0.4 % and was classified as silt clay loam. The ����
mean organic carbon concentration in the sediment of site 2 was 1.0 % which was classified as ����
silty clay. ����
Benthic chambers ����
Benthic chambers were constructed at Venice University with a volume of 90 L with ����
collapsible, polyethylene, sides to enable sample extraction without water exchange (Turetta et ����
al., 2005). The chambers (60 cm x 60 cm) had a water height of 25 cm and the water was mixed ����
slowly by a paddle (120 cm2) rotating at 10 rpm. The stirring ensured mixing of the internal water ���
in about 2 min with a diffusive boundary layer thickness of about 0.5 mm and a current speed ���
close to the bottom of about 2 cm s-1, at which sediment resuspension should be minor (Tengberg ����
et al., 2005). Samples were collected by battery operated peristaltic pump. Oxygen, pH, ����
conductivity and temperature were monitored continuously using a multi-probe (YSI, model 556, ����
Ohio, USA). ����
Water samples for metal analyses were collected every 3 h and for metal speciation at 9 h ����
intervals. All samples were filtered using two-stage cartridge filters containing 0.45 �m and 0.2 ����
�m membranes (Sartorius Sartobran 300) and collected in low density polyethylene (LDPE) ����
bottles. Speciation samples were subsequently stored frozen and other samples were acidified. ����
The sample bottles were cleaned by soaking sequentially in hot detergent and dilute (2 M) acid ���
and were stored partially filled with 0.01 M HCl. The bottles were rinsed with water from the ���
chamber before filling. ����
peer
-005
0197
7, v
ersi
on 1
- 13
Jul
201
0

ACCEPTED MANUSCRIPT
� ��
Porewater sampling ����
30 cm box cores were collected from the sediments at the sampling sites (June 2003) using ����
a piston corer. The cores were sealed and stored in a nitrogen-flushed box to maintain an oxygen-����
free atmosphere. The overlying water column was sampled at the same time. The cores were ����
sliced at intervals of 0.5-2 cm with more detail at the top of the core. The slices were centrifuged ����
to extract the porewater, which was quickly filtered under an inert atmosphere and frozen until ����
analysis. Copper in the porewaters was determined by ICP-SFMS (inductively coupled plasma - ����
sector field mass spectrometry) (Turetta et al., 2005). ���
Calculation of the benthic flux from the benthic chamber data ���
Benthic fluxes were calculated from the change in the concentrations as a function of time ����
where each change was corrected for the volume change after sampling: ����
�mol �t-1 = (�moli(rem) + moli) �ti-1 ����
where �moli(rem) was the sum of the moles removed of the chamber as a result of sampling at time ����
i, �ti the time lapsed during time interval i (h), and moli was the actual number of moles in the ����
chamber at time i. The values for �mol �t-1 were used to calculate the flux, F: ����
F = �mol �t -1 A-1 ����
where A was the sediment area (cm2) covered by the chamber. The flux F (pmoles cm-2 h-1) was ����
obtained by linear regression of the data. ���
Calculation of the benthic flux from the gradient at the sediment/water interface ���
Estimates of the molecular diffusion of thiols across the sediment-water interface were ����
calculated from the sediment/water gradient using the following equation (Berner, 1980): ����
Fd = -Ds �C �x-1 ����
where Fd = the diffusion flux of the species (pmol cm-2 h-1), Ds = the diffusion coefficient of the ����
species in sedimentary porewaters (10-6 cm2 s-1), �C �x-1 = concentration gradient of the species ����
peer
-005
0197
7, v
ersi
on 1
- 13
Jul
201
0

ACCEPTED MANUSCRIPT
� ��
across the sediment-water interface (pmol cm-4), and where x = 0.05 cm (diffusion boundary ����
layer thickness) was set by the stirring rate in the chamber. Uncertainties in the fluxes were ����
calculated from the standard deviation of the measured thiol concentrations. Differences in the ����
composition of porewater from the top 0.5 cm of the sediment and from surface water from a ���
depth of ~20 cm (total water depth ~1 m) were used to establish the gradients. ���
The porewater diffusion coefficient (Ds) was calculated using (Iversen and Jorgensen, ����
1993): ����
Ds = D0 (1 + n (1 - �))-1 ����
where parameter n depends on the type of sediment and the diffusing species: a value of 3 was ����
selected as before for similar sediments (Iversen and Jorgensen, 1993). Changing n in the ����
porosity range of the sample sites (0.5 – 0.75) created differences of less than 10 % in Ds per unit ����
of n. D0 was the diffusion coefficient of the species at infinite dilution (cm2 s-1)(Li and Gregory, ����
1974) and � was the porosity of the sediment (% volume/weight). The flux value included ����
tortuosity (constrained diffusion) and molecular diffusion within the porewaters, but did not ���
account for other processes such as adsorption, wave shear and bioturbation (Berner, 1980). ���
Results and discussion ����
Temperature, oxygen and salinity ����
The chambers were placed on the sediments, carefully pushed into the top of the sediments ����
and then the cover was closed; the stirrer was started and the measurements were initiated. The ����
chambers were fully submerged and the water depth was ~1 m. It is likely that the placing of the ����
benthic chamber and the starting of the stirrer would have disturbed the original gradients across ����
the sediment – water interface. However, this is an unavoidable problem with using benthic ����
chambers. In this case any effects were minimized by using a large chamber which was open at ����
the time of placing and by using a slow stirring rate. The absence of abrupt variability in the ���
peer
-005
0197
7, v
ersi
on 1
- 13
Jul
201
0

ACCEPTED MANUSCRIPT
� �
major parameters (oxygen, pH) suggests that the water in the chamber had equilibrated within an ���
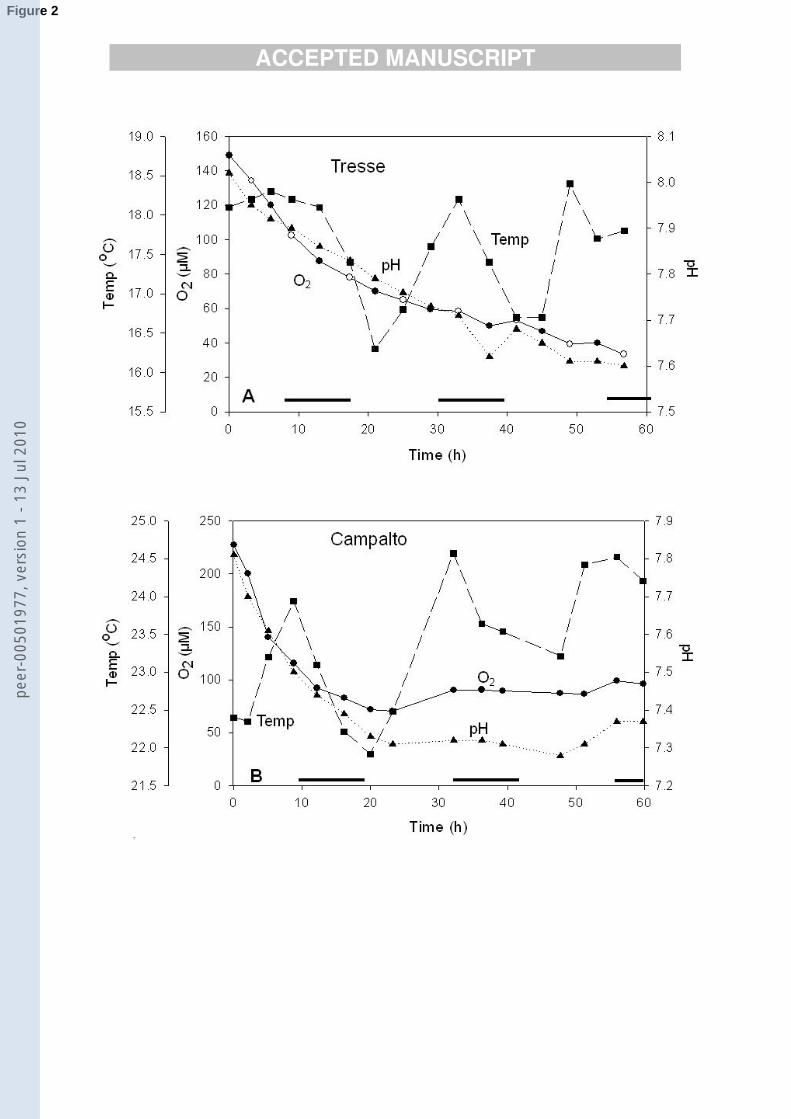
hour, possibly minutes. The oxygen concentration in both chambers dropped to ~94 �M O2 (~30 ����
% air saturation) during the first 12-15 h (Fig. 2), after which it continued to drop more gradually ����
at Tresse and became more or less constant at Campalto. The overall decrease was greatest at ����
Campalto which started from a higher concentration of oxygen (219 �M O2 compared to 156 �M ����
O2 at Tresse). The temperature variation in the chambers can be used as a measure of possible ����
effects of solar radiation and from this it can be seen that the leveling off of the oxygen ����
concentration at Campalto, and the slower drop at Tresse, coincided with daylight, indicating that ����
further oxygen uptake was balanced by oxygen production by benthic or planktonic algae. ����
The pH dropped from 8 to 7.6 at Tresse and from 7.8 to 7.3 at Campalto presumably due to ���
diffusion of CO2 out of the sediments, or bacterial activity in the chamber water itself. The drop ���
in pH paralleled that in O2 which stabilized after 22 h at the Campalto site and gradually leveled ���
off at Tresse (Fig. 2). The parallel behaviour of O2 and CO2 is consistent with the release of CO2 ���
by heterotrophic organisms as they use oxygen, either in the benthic chamber itself or due to ���
diffusion of CO2 from the sediments and O2 into the sediments. Dissolved organic carbon (DOC) ���
showed comparatively small variability: at Tresse the decrease was from 160 at the beginning to ���
150 µM carbon by the end of the experiment, and at Campalto from ~600 to 500 µM carbon ���
except for an outlier of 750 µM carbon after 25 h(Manodori et al., 2006). The decreases in DOC ���
in the benthic chambers were much less than those of dissolved oxygen indicating that the much ���
larger variations in O2 and CO2 were not related to bulk breakdown of the DOC in the chamber ��
but due to benthic processes. ��
The oxygen flux (nmol cm2 h-1), calculated from the change in the benthic chamber ���
composition as a function of time, was -86 (negative means into the sediments) at Tresse and -���
163 at Campalto for the first 25 h of the experiment. These values are similar to oxygen fluxes ���
peer
-005
0197
7, v
ersi
on 1
- 13
Jul
201
0
ACCEPTED MANUSCRIPT
� �
found in other estuarine sediments; for instance, a flux of -150 nmol O2 cm-2 h-1 has been found ���
previously in estuarine sediments of sandy mud (Clavero et al., 1992). The oxygen flux decreased ���
after the first 25 h to ~-23 nmol cm-2 h-1 at Tresse, and became insignificant at Campalto, as the ���
chamber became equilibrated with the sediments and further oxygen decreases were offset by in-���
situ oxygen production. ���
Copper fluxes derived from the benthic chamber data ��
The copper concentration in the chambers was initially greater at Tresse (40 nM) than at ��
Campalto (14 nM) (Fig. 3). With time the concentrations converged to similar levels at the two ����
sites: ~24 nM at Campalto and ~19-24 nM at Tresse, compared to outside chamber values of 40 ����
nM (Tresse) and 24 nM (Campalto). Because of the greater than equilibrium concentration of ����
copper in the water at Tresse station, the copper flux was negative, -4.4 ± 0.2 pmol cm-2 h-1, ����
whereas it was positive 3.8 ± 0.1 pmol cm-2 h-1 at Campalto (out of the sediments). ����
It is possible that 19 - 24 nM Cu is the steady state level for copper in these waters, a ����
balance of adsorption on particles, uptake by phytoplankton and other algae, releases or uptake ����
from the sediments and possible interactions with strong complexing ligands. This steady state ����
level (19 - 24 nM) is similar to levels of 8-21 nM found previously in the north of the lagoon ���
(Martin et al., 1994). It is likely that the proximity of an industrial zone (Porto Maghera) near ���
Tresse may have been the cause for the initially higher copper levels in the lagoon water at Tresse ����
than at Campalto. The steady state copper levels in the Venice Lagoon were greater than those (2-����
15.5 nM) in San Diego Bay (Zirino et al., 1998), similar to those (10-25 nM), in the lagoons of ����
Jacarepaguá, Rio de Janeiro, Brazil (Fernandes et al., 1994), and less than those (31-95 nM) in ����
the Pom-Atasta Lagoon, Mexico (Vazquez et al., 1999), suggesting that, relative to other shallow ����
lagoon waters, Venice Lagoon does not suffer from major contamination with copper. ����
Organic copper complexing ligands ����
peer
-005
0197
7, v
ersi
on 1
- 13
Jul
201
0

ACCEPTED MANUSCRIPT
� ���
Curvature in the linearised form of the speciation data showed that copper complexation ����
was affected by more than one ligand (Fig. 3). A good fit of the data was obtained to a model ���
containing two ligands at both stations: L1 and L2, with complex stabilities (log K�CuL1 and log ���
K�CuL2) of 14.2 ± 0.5 and 12.5 ± 0.3 respectively (Table 1). The overall α-coefficient, αCuL, was ����
106 (Table 1) predominantly as a result of complexation with L1, causing the free copper ����
concentration to be low with pCu values of 13.7 ± 0.2 (pCu = -log [Cu2+]). These levels are well ����
below where free copper affects marine microorganisms: for instance, cupric ion concentrations ����
>1 pM are thought to influence cyanobacteria (Brand et al., 1986). ����
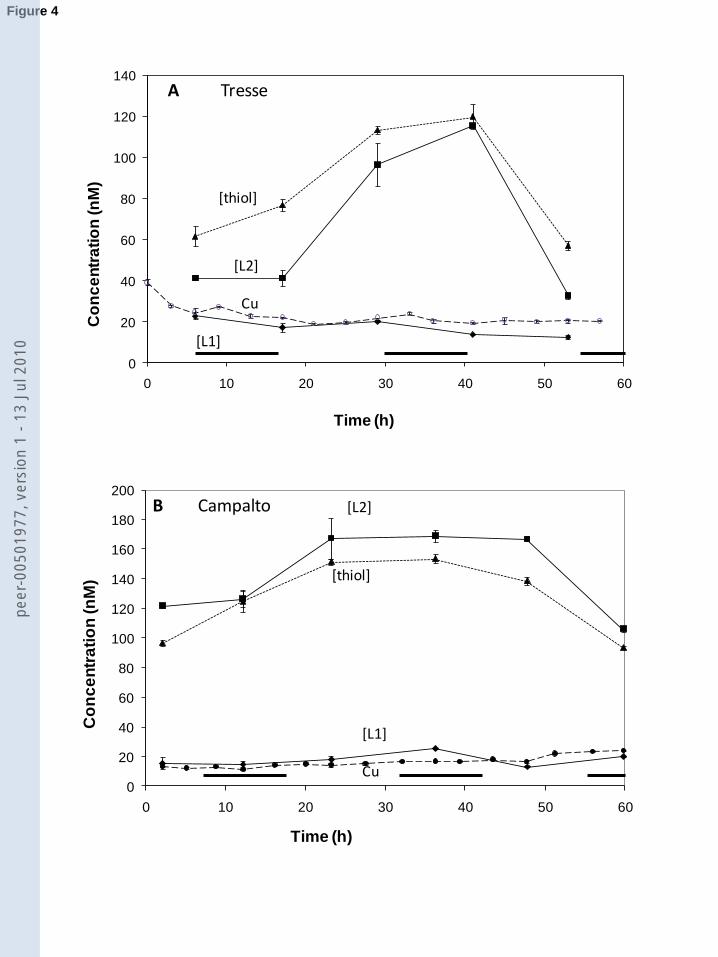
The concentration of L1 was on average 17 ± 4 nM at the two stations, much less than that ����
(108 ± 51 nM) of L2 (Fig. 4). During the titrations L1 became saturated and subsequent copper ����
additions were bound to the weaker ligand (L2). The change in the slope (indicating saturation of ����
L1) occurred at pCu ~13.1 at both stations. Due to the higher copper concentrations at the start of ���
the Tresse experiment, L1 was largely saturated and L2 bound there more copper (up to 50 %) ���
than at Campalto. The difference between the complex stability of L1 and L2 was 1.7 log-units, ����
indicating that L1 and L2 are of a different nature or that different sites are responsible for copper ����
complexation. ����
The equilibrium concentration of copper at ~19 - 22 nM at both sites was similar to that of ����
L1, suggesting that this ligand may play an important role in keeping copper at a level ����
approximately equal to its concentration. Possibilities are that copper-complexed L1 is stabilized ����
from photochemical (Laglera and van den Berg, 2006), or bacterial breakdown, or because ����
copper-L1 species are released from porewaters, or a combination of these. ����
The concentration of L2 was much greater than that of copper. Because L2 forms weaker ���
complexes with copper than L1, L2 played a secondary role with respect to copper complexation ���
peer
-005
0197
7, v
ersi
on 1
- 13
Jul
201
0
ACCEPTED MANUSCRIPT
� ���
in these waters in spite of its higher concentration, whereas L1 was generally fully complexed ����
with copper. During the incubation in the chambers the concentration of L2 increased from 40 to ����
120 nM at Campalto, and from 120 to 160 nM at Tresse, as a result of diffusion from the ����
sediments as will be shown below, before dropping back to the original level near the end of the ����
experiment, probably due to photodegradation. ����
There is no previous published work on the chemical speciation of copper in this lagoon. ����
The ligand concentrations and complex stability are similar to those in estuarine waters or ����
productive shelf waters, but greater than those expected for deeper coastal waters. For instance at ����
the higher salinity end of the estuary of the river Scheldt the concentration of L1 was 12.9 nM ���
with a complex stability of log K�CuL1 = 14.8 (Laglera and van den Berg, 2003); the concentration ���
of L2 in that water was 35 nM with a value for log K�CuL2 of 13.2. Guanabara Bay, a shallow ����
lagoon adjacent to Rio de Janeiro, had copper complexing ligands at greater concentrations of 40 ����
- 300 nM and log K�CuL values of 9.6 to 12.4 (Van Den Berg and De Luca Rebello, 1986). These ����
results are directly comparable as they had been determined at a similar detection window but ����
using a different ligand (catechol) as competing ligand. The much greater ligand concentrations ����
in Guanabara Bay were likely caused by a high primary productivity. Complex stabilities of log ����
K�CuL1 > 12.5 have been reported for Gullmar Fjord, Sweden (Croot, 2003), and of log K�CuL1 > ����
13.5 and log K�CuL2 of 9.0 – 9.6 in waters of San Francisco Bay (Donat et al., 1994). The complex ����
stabilities cover therefore several log-units, and the ligand concentrations several decades, in near ���
coastal or estuarine waters. Part of the reason for this variability may be that the analytical ���
methods have difficulties in discriminating between the ligands, but at the same time it is likely ����
that several ligands are present and that competition reactions with other metals can cause the ����
complex stabilities to vary. ����
Thiols as a candidate for the natural ligands ����
peer
-005
0197
7, v
ersi
on 1
- 13
Jul
201
0
ACCEPTED MANUSCRIPT
� ���
Thiol compounds are known to form strong complexes with copper (Leal and van den Berg, ����
1998) and have been shown to exist in estuarine waters (Laglera and van den Berg, 2003; Tang et ����
al., 2000) and salt marsh sediments (Luther III et al., 1986). For this reason a method (Laglera ����
and van den Berg, 2003) was used in this work that identifies thiol-type ligands directly from ����
their specific voltammetric response. The thiol peak was apparent in the voltammetric scans of all ���
the samples of this study, in the potential range -0.55 and -0.65V, typical for thiols (Al-Farawati ���
and Van Den Berg, 2001; Leal and Van den Berg, 1998), and sulphide species (Rozan et al., ����
2000). Stability of the peak indicated that the response was due to thiols, as the sulphide peak is ����
known to be unstable, except at very high concentration, decreasing rapidly in height due to ����
reaction with mercury traces in the voltammetric cell (Al-Farawati and van den Berg, 1997). The ����
sensitivity was calibrated with glutathione which matched the electrochemical characteristics of ����
the peak with respect to peak potential and shape and its response at different deposition ����
potentials. Copper additions caused the thiol peak to decrease and shift to a more negative ����
potential (Fig. 5 A) due to a change from a mercury-thiol species to a copper-thiol species on the ����
surface of the electrode with increasing copper concentration (Le Gall and van den Berg, 1993): ���
HgThiolads + CuSA + 2e- � CuThiolads + Hg + SAH ���
Copper-binding thiol concentrations and values for their complex stability (K`CuThiol) were ���
determined by fitting the voltammetric thiol response to the free, Cu2+, concentration obtained ���
during the copper complexing capacity titrations (Laglera and van den Berg, 2003) and are shown ���
in Table 1. ���
The total thiol concentrations were determined by adding EDTA (100 µM, log �CuEDTA =6) ���
to each sample to mask ambient copper from the thiol to obtain the overall thiol peak current ���
(Imax), where the �-coefficient indicates the ratio of complexed over free copper ���
([CuEDTA]/[Cu2+]). The EDTA addition was found to increase the reactive thiol concentration ���
peer
-005
0197
7, v
ersi
on 1
- 13
Jul
201
0
ACCEPTED MANUSCRIPT
� ���
by 20-25% compared to that in the presence of 10 µM SA (log �CuSA ~5) in line with expectation ��
for a high complex stability of the thiol species. The CSV scans for the total thiol determinations ��
were similar to the scan shown at the lowest copper concentration in Fig. 5A, but then with a ���
smaller peak height for copper and a greater peak height for the thiol. ���
Plots of Ip / Imax showed that the thiol compounds started to bind copper at 10-14 Cu2+ and ���
were saturated at 10-12 M Cu2+ consistent with a value for log K�Cuthiol near 13 (Fig. 5 B). The ���
fitted log K�Cuthiol values were similar at the two study sites with an average of 13.1 ± 0.2. The ���
complex stability of the copper thiols is near that of the CuL2 species (logK�CuL2 = 12.5 ± 0.3). ���
The alpha-coefficient for copper binding by the thiols, �Cu-thiol = [CuThiol] / [Cu2+], was ~106.1 ���
(for 100 nM thiols with average complex stability), compared to a value of �CuL2 = 105.5 for 100 ���
nM of L2 and �CuL1 = 106.5 for 20 nM of L1. The higher value for Cu2+ complexation with L1 is ��
due to the high stability of the L1 species, but it does not reflect that L1 is mostly saturated with ��
copper causing any excess copper to be bound with L2. ����
Identification and quantification of the thiol compounds ����
The CSV response of the thiols in Venice Lagoon was compared to that of several thiols ����
(thioacetamide, thiourea, cysteine and glutathione) and glutathione was found to give a good ����
match. 100 nM additions caused a small 10 mV negative shift in peak position and a slight ����
broadening of the peak. The thiol peak height is known to be dependent on pH, deposition ����
potential as well as on concentration (Laglera and van den Berg, 2003; Le Gall and van den Berg, ����
1993) so this shift was not unusual. The CSV response for the thiols in Venice Lagoon varied ����
upon variation of the deposition potential similarly to that of glutathione, with a much smaller ���
change in response than for thiourea or thioacetamide consistent with a response due to mercury ���
species typical for glutathione (Hg(II)-glutathione) (Leal and Van den Berg, 1998). Because of its ����
similar response characteristics, glutathione was used to calibrate the sensitivity for the thiol ����
peer
-005
0197
7, v
ersi
on 1
- 13
Jul
201
0

ACCEPTED MANUSCRIPT
� ���
determinations. ����
Fluxes of thiols from the benthic chamber data ����
Thiol concentrations in the chambers at both sites were found to initially increase with time ����
and subsequently decrease after about 40 h. At Tresse the thiols increased from 60 nM to 120 nM ����
(glutathione equivalents), and at Campalto from 100 to 160, so the overall increase was the same ����
magnitude. The thiol concentration in the external water was 40 nM at Tresse and 110 nM at ����
Campalto. The average thiol fluxes were 63 ± 1 pmol cm-2 h-1 at Campalto and 51 ± 1 pmol cm-2 ���
h-1 at Tresse for the first 25 h of the experiment. The decreasing thiol concentrations at the end of ���
the experiment may be due to activities of suspended or benthic organisms, or to photochemical ����
breakdown as the chamber was exposed to sunlight in these very shallow waters and as thiols and ����
other ligands are known to be liable to photochemical breakdown (Laglera and van den Berg, ����
2006; Shank et al., 2006). Biological breakdown may also have played a role as thiols are a ����
known substrate for marine bacteria (Tripp et al., 2008; Visscher and Taylor, 1993), ����
phytoplankton (Ietswaart et al., 1994) and the microphytobenthic community generally (Linares ����
and Sundback, 2006). ����
Thiols in the sedimentary porewaters ����
The thiol concentrations (60 - 170 nM) during these benthic chamber experiments were ���
much greater than those (0.7 - 3.6 nM) typical for the deeper coastal waters of the North Sea (Al-���
Farawati and Van Den Berg, 2001). In view of the similar increase in both chambers it is likely ����
that benthic processes are the source of the much greater thiol concentrations in these marsh ����
waters. For this reason porewaters were subsampled from sediment box-cores at the experimental ����
sites. The cores were collected about 2 weeks after the benthic chamber experiment, but this ����
should not affect the basic findings as the benthic processes are established over long time scales. ����
The porewaters were found to contain extremely high (micromolar) thiol concentrations ����
peer
-005
0197
7, v
ersi
on 1
- 13
Jul
201
0
ACCEPTED MANUSCRIPT
� ���
(1.2 �M at a depth of 2 cm, 6 �M at 8 cm) much greater than in the overlying waters (~100 nM) ����
(Fig. 4). The large difference explains that the high apparent thiol flux in the benthic chamber ����
could easily have originated from the sediments, not from in-situ production in the chamber. The ���
thiol identity (similar to glutathione as based on the electrochemical characteristics) was the same ���
in the porewaters as in the overlying water, confirming that the porewater thiols are the source of ����
the thiols in the overlying water. ����
The porewater concentrations of the thiols increase with depth, which is consistent with an ����
in-situ production by reaction of sulfide with sedimentary organic matter (Vairavamurthy and ����
Mopper, 1987). Similar trends but at higher levels (0.1-2.5 mM organic thiol) have been observed ����
previously in salt-marsh porewaters (Luther III et al., 1986). Our benthic chamber experiments ����
demonstrate that the porewaters are the main source of thiols in the overlying waters, and that the ����
steady state level of thiols is a balance of porewater releases and biological uptake and ����
photochemical reactions in the surface waters. ���
Porewater fluxes were estimated from the concentration difference between the top of the ���
porewaters and the overlying waters (Table 2). These thiol fluxes are much greater than those ����
from the benthic chamber data (7x at Tresse and 1.3x at Campalto), suggesting that there is a ����
rapid loss of the thiols in the overlying water, which may be due to rapid uptake by ����
microorganisms, or photolysis, of the thiols. It is also possible that a benthic boundary diffusive ����
sublayer (Morse, 1974; Sundby et al., 1986) inhibited transport from the benthic interface to the ����
overlying water. ����
Although the gradient in the sediment core itself is evidence for an outward flux, the ����
calculation of the magnitude of the flux is subject to large uncertainty due to the difficulty of ����
finding the thiol concentration at the surface of the sediments which is responsible for the flux ���
into the overlying water in case of a steep gradient inside the sediment. The difference in the thiol ���
peer
-005
0197
7, v
ersi
on 1
- 13
Jul
201
0
ACCEPTED MANUSCRIPT
� ���
fluxes at Tresse and Campalto is probably due to this uncertainty, so the best we can establish ����
from the porewater data is a) that the porewaters are a source of thiols to the overlying waters ����
because the porewater thiol concentration is much greater than in the overlying water, and b) that ����
the flux must be large in view of the large gradient in the sediments and because of the ����
concentration difference with the overlying water. ����
The porewater concentration of copper of 16-20 nM (Fig. 4B) was similar to or slightly less ����
than in the overlying water in the benthic chambers, except for high values (83 nM at Tresse and ����
47 nM at Campalto) at the sediment surface (this had been sampled separately using an in-situ ����
pump, close to the sediment surface). The porewater concentrations are similar to those found in ���
other coastal sediments (Ciceri et al., 1992; Westerlund et al., 1986). The much greater levels at ���
the sediment surface are possibly associated with a fluffy layer of organic-rich material ����
(Hlawatsch et al., 2002) enriched in copper, which could have been sucked up into the sampling ����
tube. These high values were not used for the porewater flux calculations as it is likely that this ����
copper was not free but associated with flocs of organic matter, but they are of interest as it ����
illustrates the variability at the sediment surface. The lack of a clear gradient in the sediments ����
suggests that any copper flux into, or out of the overlying waters is small. Any copper diffusing ����
out of, or into these sediments would have to pass through, and could be trapped by, this fluffy ����
layer. It will be interesting to investigate the copper speciation exactly at the interface in further ����
work, as stabilization of copper at this location, rather than the deeper porewater concentration, ���
could control the copper concentration in the overlying waters. ���
Acknowledgments ���
This work was financially supported by the Consortium for Coordination of Research ���
Activities concerning the Venice Lagoon System (CORILA, Venice, Italy). The authors are ���
grateful to M. Frignani for the porosity data, Luis M. Laglera for assistance with data fitting, and ���
peer
-005
0197
7, v
ersi
on 1
- 13
Jul
201
0

ACCEPTED MANUSCRIPT
� ���
anonymous referees for constructive comments. ���
peer
-005
0197
7, v
ersi
on 1
- 13
Jul
201
0
ACCEPTED MANUSCRIPT
� ��
References ����
�������������������������������� �!�������"#�������$�����%��%&�'(�&�������'��������)*����
&�%������*'�'����#��%���$$����+�����+��%��� �������#�$�'��*���������������� ����������������,���-����������� �!���������"#�%�'����+%�'���������'�%&��#����'�������
.%��#�/�������0����'#��#�������0����%�$������/+���+��1�"�+#�%�%�*�������������������
���������� �������0���*�-������'�'�� �"#�%����+��� 22�%�+#��3���+��%��4�����'��*�3��''�����
3���+��%�������22������������5�0���/(�����6 �!���!(������������5����������(+��%��%&�$������2#*�%2���7�%�����
��2�%�(+��%������'�)*�+%22�������+��$�($��8%(�����%&�092���$������ ��������%�%�*��������0+%�%�*����������������
��$2%'�� �5� � ������������������� �!�������-����$�����%��%&�+%22���+%$2��9���%��������'���������)*�+��#%��+�'���22�����%���$$���*������������+%$2�����%�����#����'���+*����%9�$��� ���*��+���#�$�+�� +����������������
��+�����!��� ������/��� �����%�����6 ���:(����;;���!�������!�%+#�$�+����*+�����<&�=���*��� ����'�>�� � �������%�'���� ����������#�+���(9�-����$�����%����%$�3%���6 ���������
3�%&���'� ���>�'��(� ��'(��$���'�4'��������#�+��#�$)��'��=*��%)�%�%��������������������������
������%��,�����������;��8� ���.��������?���������%�(�)���%��)*�.����'�/2�����>�'�0&&�+�'�%�������#��3#%'2#������(9��+�%''��#��/���$����6 �����>����&�+������#��3��$%��'�����������0'�(��*��=*��%)�%�%��������������������
�%+#�����8�@������������� ���/���$��+��� �������(++���5�!���!(��;%����/������5�������������'������+���%&���$%'2#���+���2(��%&�#���*�$����'�����#���%��#����,���+��5��%%�������
�������#�$�'��*����������������%%���3�5���������/��'%����+*+���%&�+%22���'2�+����%�����!(��$����A%����/����������
5�$�%�%�*�����<+���%���2#*�������������������%%���3�5��� %&&�����8�6 ����������5�0���������3�%�(+��%��%&��9���+���(�����(�+%$2��9��������
������'�)*��(+��*%��+�2#*�%2���7�%�������'2%�'���%��(�'���''��5�$�%�%�*���������
<+���%���2#*�����������������-%�����8�����5�%��@� �����(������@�6 �������/2�+����%��%&���''%�����+%22���������+7����������
/%(�#�/�������+�'+%���*B���$(����$��#%���22�%�+#�� ���*��+���#�$�+�� +������������������������
-%��;;%�%������<��%�� � ���3��%��������3������!�������=���*�$����'����'���$���'�%&��#������,���+��5��%%���<+���%�%��+�� +����������������
-(2%������5��� #������� ���������0&&�+�'�%&�+%22����+��$�($������;��+�%���#��2�%�(+��%�����
�����9(����%��%&��#�%�'�)*������������������5�$�%�%�*� ���<+���%���2#*������������
���������
-(2%������5��� %&&�����8�6 ������������������� #������� ���������-�'���)(��%�'�%&���''%�������������2����+(�����)�%����+��#�%�'�����#��'()����+�3�+�&�+�<+�����-��2�/�����'���+#�3��������
>�<+���%���2#�+���'���+#�3�2��'��������������������������'��=� ������%����0�-���,������5�=�/���3��+#������$��/���������=���*� ���������
3%��(��%�� ''�''$����>��"#���%�'����5��%%�'�<&�8�+���2��(�����%�-��8�����%���������;����0����%�$������3%��(��%�����������������
=�����'+#��/������������������'����%������'#���%��������&���%�$������'���%�(��'�&�%$��#�����
��'����������+�/��B�%����������$%��'�%&����+�����$������+%�2%����%��� ������!�%�%�*��������������������
peer
-005
0197
7, v
ersi
on 1
- 13
Jul
201
0

ACCEPTED MANUSCRIPT
� ��
>��'�������"���/+#��������3�8���3���'���� �������4����;���%��%&�<�����+�.���%����/%(�+�'�)*�������3#*�%2���7�%��/2�+��'���������+�������>'%��������3(������� �9����(��(��'�� 22���������
����0����%�$������ �+�%)�%�%�*��������������������>���'����.���8%����'��������������-�&&('�%��+%�&&�+����'�%&�'(�&��������$��#�������$�����������
'���$���'�����&�(��+��%&�2%�%'��*��!�%+#�$�+��0���%'$%+#�$�+�� +�������������������@���7#�$$����!�������0���*��������'�'����'���$����&�%$��#����'������C(��%�����3�+�&�+��>>������
3%���������$�������'(��'��0���#�����3�������*�/+���+��5�����'���������������
5��������5� ������������������� �!����������%22���+%$2��9���%��)*��#�%��+%$2%(��'��������'�(�����������'�� �������#�$�'��*������������
5��������5� ������������������� �!���������3#%�%+#�$�+���%9�����%��%&��#�%�'�����+%22�������+%$2��9����������'�����'�(�����������'�� �������#�$�'��*�������������������
5��!����� ���������������������� �!����������#%��+�'���22�����%���$$���*�%&���(���#�%�������������(���������'�� ���*'���������������������
5��!����� ���������������������� �!�������%��+��+���������(���#�%�������#��������+%�($������
%&��#��.%��#�0�'�� ������+��-��2�/�����'���+#�3����>�<+���%���2#�+���'���+#�����3�2��'�����������������
5����� �������,��������������� �!������0�����+��&%��'��%���+%22��D>E�+%$2��9���%��)*�����%�����+�������'����'��������� C(���+�!�%+#�$�'��*�������������
5����� �������,�'+%�+��%'�� �"�/�-������������������� �!�������%22������(+��������'�����%&�+%$2��9����������'�'�$������%��#�%�'�)*�0$��������#(9��*�����'��������+(��(��'������5�$�%�%�*�����<+���%���2#*��������������������
5���F�=���!���%�*��/��������-�&&('�%��+%�&&�+����'�%&��%�'����'������������������2�'�������'���$���'��!�%+#�$�+���%'$%+#�$�+�� +�������������������
5�����'������/(��)�+7��@���������42��7��%&���''%�����&�����$��%��+��'�D-� E�)*�����$�+�%2#*�%)���#�+�+%$$(�����'�� C(���+� �+�%)����0+%�%�*�����������������
5(�#���>>>��!�6 ����#(�+#��"� ���/+(�����7��8������%'$���� �������>�%�����+�����%�����+�����'(�&(��+*+��������'����$��'#�2%��������'��/+���+�������������������
��%�%����5����������������3��'�����3 ='����'���'(�&�+��$�+�%��*�������'()�'(�&�+�����������
'�$2��'�%&��#��,���+��5��%%��D>���*E�� ������3%��(��%���(��������������������� %&&�����8�6 ����������5�0�������3�%�(+��%��%&�'��%�����9���+���(�����(�+#����%�'�)*�$����������
+*��%)�+�����������'2%�'���%��(�'���''��5�$�%�%�*�����<+���%���2#*��������������� %�'���8�6 �����������+(����%��%&�-�&&('������(9�'��+�%''�/���$����6 �����>����&�+�������
8%(�����%&�!�%2#*'�+�����'���+#������������������3��%��������-%��;;%�%������ ��+%$����� ���-��%))�'��-���<��%�� � �������=�'�%��+�������
�����%2$����%&��#��,���+��5��%%��+%���$�����%���'���+%������������%����������
'���$����+%��'�� ������3%��(��%���(���������������������%;����"�����"#�)������/� ���5(�#���>>>��!�6 ���������:(����&*�������$������'(�&(��D/��E������
)�'(�&����D=/�E�����2%�*'(�&���'�D/�9D��EE�('�������%���$$����+�$��#%��� ���*��+������#�$�+�� +�������������������
/#��7��!�����6 #���#�����������/$��#�� �5���/7��)����/� ���@��)������8�������������3#%�%���������%��%&�'��%���+%22���+%$2��9����������'����%�����+���+#��'�(���������������'��5�$�%�%�*�����<+���%���2#*��������������
/7��)����/� ���-%�����8������(�������-�8���������3%�����������'���)(��%�'�%&���''%�����+%22�����������+%22����+%$2��9����������'�����'�(����������+%�'����$������'���$���'������
!�%+#�$�+��0���%'$%+#�$�+�� +��������������������
peer
-005
0197
7, v
ersi
on 1
- 13
Jul
201
0
ACCEPTED MANUSCRIPT
� ���
/(��)*�����������������"#���&&�+��%&�%9*����%�������'������(2��7��%&�+%)�����$������'���������%������2#%'2#��������#��'���$���������������&�+���!�%+#�$�+������%'$%+#�$�+������
+������������������"�����-�!���=(����������6 ���7����@�6 ���/���'+#���3�=���������"#����'���)(��%��%&����
)�%����+��#�%�'����'(�&�+�������'�%&�!����'�%����*��5�$�%�%�*�����<+���%���2#*�������������������
"�����-�!���/#�&���� � ���@�������-� ���<���������8��� �$'��%����-�0�����������+�%�'����
�&&�+������#��2��'��+��%&���''%�������(���#�%�������'�(�����������'��0����%�$���������/+���+��1�"�+#�%�%�*������������������
"��22��=�8���������������/ ����$������)�+��������C(�����9%���%('����(+���'(�2#(��&%�������%��#��.��(��������������������
"(�������������2%�����%��!��������'��6 �����)����/�����'+%���3�������������#�+�&�(9�'�%&����+�����$����'�����#�����%%��%&�,���+��� �+�%+#�$�+���8%(�����������������
"(�%+;*��.�8���/#���%%���8�0������� %��&�+���%��%&��#��������������G�(;�+�$��#%��&%����
�#������'������%��%&�+%$2��9���%��2���$����'�%&����(���������'�� ���*��+���#�$�+����� +������������������
,������$(��#*�� ��� %22����@�������!�%+#�$�+���&%�$���%��%&�%����%'(�&(��+%$2%(��'����D�#�%�'E�)*�������%��%&�=�/��%�'���$�����*�%�����+�$�������.��(�������������������
,���-����������� �!���-��5(+����)���%�� �������<�����+�+%22���������+��%�'�������!(���)������*�����;����������+��%+#�$�+���'�(�*�%&�+%22���+%$2��9���%��)*������''%�����%�����+�$���������������%2�+���)�*��/+���+��%&��#��"%����0����%�$�������������
�������,�;C(�;��!��������������� ������%�'��������������'���$���'�%&��#��3%$� ��'���5��%%�����
�9�+%��0����%�$����>��������%�����������������,�''+#����3�"���"�*�%�������������<�����+�"#�%�'��'�<����%���#%��%2#�+�/()'�����'�&%������
!�%��#�%&�3#%�%��%2#�+���+������� 22���������0����%�$������ �+�%)�%�%�*�����������������
6 �'����(����/���!������������������#�+���(9�'�%&����$�($���%22����.�+7����H��+���������
5��������#���%�'����0����%�$�����!�%+#�$�+��0���%'$%+#�$�+�� +�����������������������
H����%�� ���,�����6 ������-� ����������/�5���-� ��+%������ �+7�*��-�8������-���+������$��'(��$����%&��(D>>ED�CE����'�����������2=�����#��#��A��2������%��'���+���������
���+��%���� �������#�$�'��*�������������������� ����
����
����
����
peer
-005
0197
7, v
ersi
on 1
- 13
Jul
201
0

ACCEPTED MANUSCRIPT
� ���
Table 1 Copper speciation and ligand concentrations in Venice Lagoon. CL1 and CL2 (nM), K�CuL1 ����
and K�CuL2 were determined by copper complexing capacity titrations, while K�CuThiol was ����
determined from the cathodic stripping voltammetry (CSV) response for thiols during the copper ����
complexing capacity titrations; thiol concentrations were separately measured and are in ����
glutathione equivalents. The standard deviation of the log K�CuThiol values is ± 0.1 (n = 12). ���
Site / time
from start (h)
CCu
(nM) CL1 (nM)
Log
K�CuL1
CL2
(nM)
Log
K�CuL2 pCu
Log
αCuL
Thiols
(nM)
Log
K�CuThiol
Tresse / 6 24.4 22.9 ± 1.9 14.8±0.6 41 ± 1 12.8 ± 0.1 13.8 6.2 62 13.1
Tresse / 17 23.0 17.3 ± 2.2 13.9±0.3 41 ± 4 12.8 ± 0.2 13.3 5.6 77 13.0
Tresse / 29 21.7 20.2 ± 0.4 14.7±0.1 97 ± 10 12.4 ± 0.1 13.8 6.1 113 13.2
Tresse / 41 19.1 13.7 ± 0.5 15.0±0.3 116 ± 1 12.4 ± 0.1 13.7 6.0 120 13.3
Tresse / 53 18.8 12.4 ± 1.1 14.3±0.4 33 ± 2 13.0 ± 0.2 13.5 5.7 57 13.1
Campalto /2 16.5 15.1 ± 4.0 13.8±0.2 122 ± 2 12.7 ± 0.1 13.9 5.9 97 13.3
Campalto /12 10.3 14.3 ± 1.8 13.7±0.1 127 ± 6 12.6 ± 0.1 14.0 6.0 125 13.2
Campalto /23 13.9 17.7 ± 2.1 13.5±0.1 168±14 12.5 ± 0.1 13.8 5.9 152 13.4
Campalto /36 18.0 25.2 ± 0.4 13.7±0.2 169 ± 4 12.1 ± 0.1 13.7 5.9 154 13.5
Campalto /48 20.7 12.7 ± 0.3 14.2±0.1 167 ± 1 12.2 ± 0.1 13.4 5.8 139 13.5
Campalto/60 24.2 19.7 ± 0.2 14.2±0.1 106 ± 2 12.4 ± 0.1 13.5 5.9 94 13.2 peer
-005
0197
7, v
ersi
on 1
- 13
Jul
201
0

ACCEPTED MANUSCRIPT
� ���
Table 2. The measured flux (Fm in pmol cm-2h-1) from the benthic chamber data and the modelled ���
diffusion flux (Fd in pmol cm-2h-1) from porewater data. Diffusion coefficients used for the ����
calculation: thiol: 14.8 x 10⁻⁶ cm2 s-1 and copper: 7.3 x 10⁻⁶ cm2 s-1. The values shown are the mean ± ����
SD for 3 repeated analyses. ����
����
����
Thiol Copper
Site name Tresse Campalto Tresse Campalto
Fm 51 ± 1 63 ± 1 -4.4 ± 0.2 3.8 ± 0.1
Fd 344 ± 2 84 ± 8 - 2.1 ± 0.1 - 3.8 ± 0.2
peer
-005
0197
7, v
ersi
on 1
- 13
Jul
201
0

ACCEPTED MANUSCRIPT
� ���
Figure Captions ����
Figure 1. Map showing the locations of the sample sites in Venice Lagoon, Italy. ����
����
Figure 2. Temperature, pH and dissolved oxygen (µM), inside the benthic chambers during the ���
experiments. A) Tresse: 28 – 31 October 2002 (salinity 29.4); B Campalto: 25 – 27 May 2003 ���
(salinity 28.6). Solid black bars show night time hours. ����
����
Figure 3. Complexing capacity titration of copper in the presence of 2 µM SA. A) Curvature in ����
the plot of reactive copper as a function of total copper showed the presence of complexing ����
ligands; B) linearization of the data: curvature shows the presence of at least two ligands. A good ����
data fit was obtained to a two-ligand model. ����
����
Figure 4. Changes in the concentrations of copper, ligands and thiols (glutathione equivalents) as ����
a function of time in the benthic chambers at Tresse (A) and Campalto (B). Mean and standard ���
deviation values are shown for 3 repeated analyses are shown. ���
����
Figure 5. Effect of varying the copper concentration on the response for the thiol species. A) CSV ����
scans for copper and thiols in Lagoon water showing the decrease in the thiol peak (which is an ����
Hg-thiol species) as the copper-SA peak increases; the copper-SA peak is off scale at -0.35 V; B) ����
change in the thiol peak height (R = relative peak height = ip / ipmax) as a function of pCu showing ����
that the thiols started to bind copper from pCu ~14, becoming saturated at pCu ~12.5. Individual ����
pCu values were calculated from [Cureactive] / αCuSA. ����
����
peer
-005
0197
7, v
ersi
on 1
- 13
Jul
201
0
ACCEPTED MANUSCRIPT
� ���
Figure 6. Concentrations of dissolved thiols (glutathione equivalents) (A) and copper (B) in ���
porewaters from sediment cores taken at the study sites. Mean values and standard deviations for ���
3 repeated analyses are shown (n = 3).�����
peer
-005
0197
7, v
ersi
on 1
- 13
Jul
201
0

ACCEPTED MANUSCRIPT
Figure 1.
Figure 1pe
er-0
0501
977,
ver
sion
1 -
13 J
ul 2
010
ACCEPTED MANUSCRIPT
Figure 2pe
er-0
0501
977,
ver
sion
1 -
13 J
ul 2
010

ACCEPTED MANUSCRIPT
0
100
200
300
400
500
600
0 100 200 300 400 500
Pe
ak h
eig
ht (n
A)
Total copper (nM)
`
0.0
0.5
1.0
1.5
2.0
2.5
3.0
3.5
4.0
0 100 200 300 400
Cu r
eactive/C
uL
Cu reactive (nM)
B
A
Figure 3pe
er-0
0501
977,
ver
sion
1 -
13 J
ul 2
010
ACCEPTED MANUSCRIPT
0
20
40
60
80
100
120
140
0 10 20 30 40 50 60
Co
nc
en
tra
tio
n (
nM
)
Time (h)
A
[thiol]
[L2]
Cu
[L1]
Tresse
0
20
40
60
80
100
120
140
160
180
200
0 10 20 30 40 50 60
Co
nc
en
tra
tio
n (
nM
)
Time (h)
[L1]
Cu
[L2]
[thiol]
B Campalto
Figure 4pe
er-0
0501
977,
ver
sion
1 -
13 J
ul 2
010

ACCEPTED MANUSCRIPT
pCu
11.011.512.012.513.013.514.0
R
0.0
0.2
0.4
0.6
0.8
-26
-22
-18
-14
-10
-0.8-0.7-0.6-0.5-0.4
Potential (V)
Cu
rren
t (n
A)
higher Cu concentration
[Cu] (nM)380240140804030150
thiol peak
A
B
Figure 5pe
er-0
0501
977,
ver
sion
1 -
13 J
ul 2
010

ACCEPTED MANUSCRIPT
Figure 6pe
er-0
0501
977,
ver
sion
1 -
13 J
ul 2
010
Copyright © 2022 FDOKUMEN