Observation of the Crab pulsar wind nebula and microquasar ...

i
COMMUNITY STRUCTURE OF BRACHYURAN
CRAB IN SETIU LAGOON, TERENGGANU
ZAKIRAH BT MOHAMAD TAUFEK
Thesis Submitted in Fulfillment of the requirement for the Degree of
Master of Science in the Institute of Oceanography and Environment
Universiti Malaysia Terengganu
July 2013
ii
DEDICATION
The work in this thesis is dedicated to my late father
Mohamad Taufek Bin Shahran
&
My beloved mother
Mazenah Bt. Simpol

iii
ABSTRACT
Abstract of thesis presented to the Senate of Universiti Malaysia Terenggganu in fulfillment of the requirements of degree of Master of Science
COMMUNITY STRUCTURE OF BRACHYURAN CRAB IN SETIU LAGOON, TERENGGANU
ZAKIRAH BT. MOHAMAD TAUFEK
July 2013
Main Supervisor : Associate Prof. Zainudin B. Bachok, Ph.D.
Co- Supervisor : Associate Prof. Mhd. Ikhwanuddin Abdullah, Ph.D.
Institute : Institute of Oceanography and Environment (INOS)
A study on the diversity and community structure of Brachyuran crab was
conducted in the Setiu lagoon, Terengganu. The sampling has been done once
in every two months for a year starting from July 2011 until May 2012. The study
aims to investigate the abundance and community structure of Brachyuran crab
in the Setiu lagoon. In addition, this study also investigated the relationship
between Brachyuran crab community and selected physico-chemical
parameters of waters such as salinity, pH and Dissolved oxygen) and sediment
grain size and total organic matter.

iv
The Setiu lagoon is stretched from Benting Lintang at the Northern part
and Penarik to the South. Totally, eight stations were placed. At the Northern
region (ST1 and ST2) the surrounding area covered mainly by Rhizophora sp.,
Nypa fruticans (Nipah palm) and Casuarina forest. In the middle region of the
lagoon (ST3, ST4, ST5) the area received seawater input from the nearest river
mouth. Meanwhile, at the southern region (ST6, ST7, ST8) the area received
freshwater input mainly from Setiu and Chalok river.The crab was sampled by
conducting 100 m2 quadrate. Within the quadrate, the crabs were collected in
five 1 m x 1 m subplot (five replicates) for 15-20 minutes time-based collection.
The physical parameters were measured in situ. The additional qualitative
method by using fishing device (crab trap and gill net) was employed as an
attempt to investigate subtidal species in order to increase the number of
Brachyuran species occurred in Setiu lagoon. However, results for subtidal was
not included for statistical analysis.
Totally, forty-four Brachyuran species were identified and grouped into 13
Families (Sesarmidae, Varunidae, Grapsidae, Ocypodidae, Macropthalmidae,
Dotillidae, Camptandriidae, Pilumnidae, Portunidae, Eriphiidae, Oziidae,
Dorippidae and Leucosiidae). Most of the species contributed by Sesarmidae
(18 species). Meanwhile, Portunidae accounted for 76% of total crab caught in
subtidal. The species obtained were mostly contributed by mangrove species.
Parasesarma plicatum recorded highest total number of individual crab caught

v
(359 Individual) and followed by Scopimera sp. (199 Individual), Uca lactea
annulipes (156 Individual), Metaplax elegans (152 Individual), and
Cleistocoeloma merguiense (124 Individual).
The Brachyuran abundance was significantly varied between the stations
(p<0.05). The highest abundance was recorded at ST6 and ST2 (12 Ind.m-2 and
10 Ind.m-2 ) at the exposed area of intertidal flat with undergrowth of young
mangrove vegetations. ST1 (beach) was accounted for the lowest abundance
(2.12 Ind.m-2). Parasesarma plicatum (3-4 Ind.m-2), Scopimera sp. (2-3 Ind.m-2)
and Dotilla sp.(3-2 Ind.m-2) were occurred in high density at ST2, and ST6. In
turn, contribute to high density of Brachyuran crab in these stations. Though the
highest density was recorded in ST2, ST6, but ST5 (mix mangrove forest)
recorded the highest number of species, (S) (12 Ind.m-2), species richness (D)
(2.68±0.72), species evenness; (J’) (0.90±0.06) and species diversity (H’)
(2.17±0.32) as compared to othes stations. In contrast to ST5, ST7 (Nypa
mangrove forest) showed decreasing the number of species (7±3.32 Ind.m-2)
and diversity indices (D=2.29±1.16, J’= 0.80±0.11, H’=1.73±0.60,) and
occurrence of M.elegans in high abundance (3 Ind.m-2). The presence of M.
elegans and low number of species might influence by high Total Organic
Matter recorded in this stations. Similarly to ST7, the stations with less
vegetation covered (ST1 and ST8) also showed the reduction in number of
species (2-6 ind.m-2), and this lead to decreasing of H’ (0.51±0.26). Suggesting

vi
that heterogeneity of habitat and environmetal variables are responsible in
influencing the distribution of Brachyuran in this lagoon.
Seven species (P.plicatum, P.eumolpe, C.merguiense, Haberma sp., U.
lactea annulipes, U. vocans vocans, and M. aloutos) were widely distributed in
the Setiu lagoon (ST2, ST3, ST4, ST5, ST6, and ST8). ST1 (beach) and ST7
(Nypa forest) discriminate from the others stations in this lagoon by species-
specific occurred in both stations and totally absent at others station where ST1
discriminate by Ocypode ceratopthalmus and O.coridamanus while Labuanium
politum is presence only in ST7. Multi-Dimension Scaling (MDS) ordination
performed was clearly distinguished the stations into five distinct group; Group 1
(ST1), Group 2 (ST7), Group 3 (ST4), Group 4 (ST8), and Group 5 (ST2, ST6,
ST3 and ST5).
Pearson-correlation and linear regression analysis showed that salinity
and pH strongly correlated with D (pH, r= -0.83,p=0.01; salinity, r= -0.75,
p=0.03), and H’ (pH, r=-0.89, p=0.003; salinity, r=-0.82, p= 0.013). The
environmental variables might responsible for the Brachyuran occurrence in this
lagoon.The data obtain from this study might contribute to current information on
the brachyuan crab at the Setiu lagoon in turn provide importance baseline data
for future work and comparison with other habitat elsewhere in Malaysia.

vii
Abstrak thesis yang dikemukakan kepada pihak Senat Universiti Malaysia
Terengganu sebagai memenuhi keperluan ijazah Master Sains
KEPELBAGAIAN DAN STRUKTUR KOMUNITI KETAM BRACHYURA DI
KAWASAN LAGUN, TANAH BENCAH SETIU, TERENGGANU
ZAKIRAH BT. MOHAMAD TAUFEK
Julai 2013
Penyelia Utama : Prof Madya Zainudin B. Bachok, Ph.D.
Penyelia Bersama : Prof Madya Mhd. Ikhwanuddin B. Abdullah, Ph.D.
Institut : Institut Oseanografi dan Sekitaran (INOS)
Kajian mengenai kepelbagaian dan struktur komuniti ketam Brachyura
telah dijalankan dilagun Setiu,Terengganu. Persampelan telah dilakukan sekali
dalam setiap dua bulan bermula dari bulan Julai 2011 sehingga Mei 2012.
Kajian ini bertujuan untuk menyiasat kelimpahan dan struktur komuniti ketam
Brachyura di lagun Setiu. Di samping itu, kajian ini juga bertujuan untuk
mengenalpasti sama ada komuniti ketam Brachyura mempunyai perkaitan
dengan parameter terpilih fiziko-kimia air dan sedimen seperti kemasinan, pH,
oksigen terlarut, saiz pasir dan jumlah bahan organik.

viii
Kawasan lagun meliputi Benting Lintang di bahagian utara sehingga ke
Penarik di bahagian selatan. Terdapat lapan stesen secara keseluruhan. Di
bahagian utara (ST1 dan ST2), kawasan persekitaran dilitupi oleh Rhizophora
sp., Nypa fruticans (Nipah) dan hutan Casuarina, sementara ST3, ST4 dan ST5
di bahagian tengah lagun pula menerima kemasukan air laut daripada muara
sungai yang berdekatan. Di kawasan selatan iaitu ST6, ST7 dan ST8 ianya
menerima kemasukan air tawar dari Setiu dan Sungai Chalok. Persampelan
ketam telah dijalankan dengan menggunakan 100 m2 kuadrat. Dalam setiap
kuadrat, ketam telah disampel di dalam 1 m x 1 m subplot (5 replikasi).
Parameter fizikal telah diukur secara in situ. Kaedah kualitatif tambahan dengan
menggunakan alat memancing (perangkap ketam dan pukat tiga lapis) telah
digunakan sebagai satu usaha untuk mengenal pasti spesies subtidal.
Secara keseluruhannya, 44 spesies ketam Brachyura telah berjaya
diidentifikasi dan dikelaskan kepada 13 Famili (Sesarmidae, Varunidae,
Grapsidae, Ocypodidae, Macropthalmidae, Dotillidae. Camptandriidae,
Pilumnidae, Portunidae, Eriphiidae, Oziidae, Leucosiidae and Dorippiidae).
Kebanyakan spesies adalah daripada Famili Sesarmidae (18 spesies).
Sementara itu, Portunidae menyumbang sebanyak 76% daripada jumlah
keseluruhan ketam yang ditangkap di subtidal. Parasesarma plicatum
mencatatkan rekod bilangan individu tertinggi dalam 100 m2 kuadrat (359
Individu) diikuti oleh Scopimera sp. (199 Individu), Uca lactea annulipes (156

ix
Individu), Metaplax elegans (152 Individu) dan Cleistocoeloma merguiense (124
Individu).
Kelimpahan ketam Brachyura adalah lebih tinggi di kawasan terbuka
yang mempunyai tumbuh-tumbuhan bakau muda seperti di ST6 (12.43 Ind.m-2)
dan ST2 (10.33 Ind.m-2). Kepadatan terendah (2.12 Ind.m-2) direkodkan di ST1
(kawasan pantai). Terdapat perbezaan struktur komuniti yang signifikan pada
stesen-stesen ini (p<0.05). Kepadatan spesies Parasesarma plicatum (3-4
Ind.m-2), Scopimera sp. (3-4 Ind.m-2) dan Dotilla sp. (2-3 Ind.m-2) adalah tinggi di
stesen ST2 dan ST6. Walaupun kepadatan tertinggi direkodkan di ST2 dan
ST6, namun ST5 (hutan bakau) mencatatkan struktur komuniti yang tertinggi
berbanding stesen-stesen lain dari segi bilangan spesies (S)(12 Ind.m-2),
kekayaan spesies (D)(2.68±0,72), kesamarataan spesies (J')(0.90 ± 0.06) dan
kepelbagaian spesis (H')(2.17 ±0.32). Berbanding ST5, ST7 (hutan bakau
nipah) menunjukkan penurunan bilangan spesis (7±3,32Ind.m-2) dan indeks
kepelbagaian (D = 2,29±1,16, J '= 0.80± 0.11, H' = 1,73± 0.60) serta kehadiran
M. Elegans dalam kepadatan yang tinggi (3 Ind.m-2).
Kehadiran kepadatan yang tingggi untuk spesies M.elegans di ST7
mungkin antara faktor pengurangan bilangan spesies ketam Brachyura dan ini
mungkin dipengaruhi oleh jumlah bahan organik yang tinggi direkodkan di
stesen ini. Seperti ST7, stesen yang mempunyai kurang kepadatan tumbuh-
x
tumbuhan (ST1 dan ST8) juga menunjukkan pengurangan bilangan spesies (2-
6 ind.m-2), dan seterusnya membawa kepada kepelbagaian spesies yang
rendah (0.51 ± 0.26). Stesen ini mempunyai peratusan jumlah bahan organik
yang tinggi dan sedimen bercirikan pasir halus, kelodak dan sedimen tanah liat.
.
Kajian menunjukkan bahawa ciri-ciri sedimen dan bahan organik
mungkin juga menyumbang kepada taburan Brachyura. Sebaliknya, ST1
(pantai) dan ST7 (hutan nipah) berbeza dari stesen-stesen lain di lagun ini
kerana kewujudan spesies yang spesifik dikedua-dua stesen ini dan tiada
terdapat di stesen lain di mana ST1 didiami oleh Ocypode ceratopthalmus dan
O. coridamanus manakala Labuanium politum hanya dijumpai di ST7 sahaja.
Ini menunjukkan bahawa kepelbagaian habitat dan pembolehubah persekitaran
bertanggungjawab dalam mempengaruhi taburan ketam Brachyura di lagun ini.
Tujuh spesies (P.plicatum, P.eumolpe, C.merguiense, Haberma sp., U.
lactea annulipes, U.vocans vocans dan M.aloutos) tertabur secara meluas di
lagun Setiu (ST2, ST3, ST4, ST5, ST6, and ST8). MDS ordinasi telah jelas
membezakan kesemua stesen kepada lima kumpulan yang berbeza; Kumpulan
1 (ST1), kumpulan 2 (ST7), kumpulan 3 (ST4), kumpulan 4 (ST8) dan kumpulan
5 (ST2, ST3, ST5, ST6).

xi
Pembolehubah persekitaran mungkin bertanggungjawab untuk taburan
dan kewujudan Brachyura di dalam lagun ini. Data yang diperolehi daripada
kajian ini dapat menyumbang kepada maklumat semasa mengenai ketam
Brachyura di lagun Setiu seterusnya menyediakan data asas yang penting
untuk kajian pada masa depan dan perbandingan dengan habitat di tempat
yang lain di Malaysia.
xii
ACKNOWLEDGEMENT
The most gracious and merciful of Allah to give the oppurtunity for me to
complete this thesis to finish my study within the time frame given. First of all, I
wish to express my greatest appreciation to my supervisor, Associate Prof. Dr.
Zainudin Bachok and Associate Prof Dr. Mhd Ikhwanudin Abdullah for their
patience and undying support. This thesis would not have been completed
without his expert advice and unfailing patience.
I would also like to express a special word of thanks to my family, and
Ahmad Syafiq. This thesis would not be accomplished without their endless
support, love and prayers. A special thanks to my labmates Nurul Zalizahana
Zakaria and Fatimah A’tirah which always on my side through the hard time,
tirelessly listen to my ideas and offered encouragement when it was most
needed. I am also most grateful for their faith in my study especially in the
sometimes difficult circumstances in which it was written.
I am very thankful for INOS staff for their friendliness and encouragement
during my hard times especially Mr. Joseph Bidai, Mr. Asmadi and Madam Siti
Tafzil Maryam, which assist me a lot in sampling from the beginning till the end.

xiii
APPROVAL
I certify that an Examination Committee has met on 19th May 2013 to conduct the final examination of Zakirah Bt. Mohamad Taufek on her Master in Science thesis entitled “Community Structure of Brachyuran Crab in Setiu Lagoon, Terengganu” in accordance with the regulations approved by the Senate of Universiti Malaysia Terengganu. The Committee recommends that the candidate be awarded the relevant degree. The members of the Examination committee are as follows: Saifullah Ariffin B. Jaaman @ Sharman, Ph.D Associate Professor Institute of Oceanography and Environment (INOS) Universiti Malaysia Terengganu (Chaiperson)
Sulong B. Ibrahim Associate Professor South China Sea and Respirotory Centre Institute of Oceanography and Environment (INOS) (Internal Examiner)
Shabdin Mohd. Long, Ph.D. Professor Faculty of Resource Science & Technology Department of Aquatic Science Universiti Malaysia Sarawak (External Examiner)
______________________________
MOHD LOKMAN BIN HUSAIN, Ph.D Professor/Director of Institute of Oceanography and Environment Universiti Malaysia Terengganu
Date:
xiv
APPROVAL
This thesis has been accepted by the Senate of University Malaysia Terengganu as fulfilment of the requirements for the degree of Master of Science.
______________________________ MOHD LOKMAN BIN HUSAIN, Ph.D Professor/Director of Institute of Oceanography and Environment Universiti Malaysia Terengganu
Date:

xv
DECLARATION
I hereby declare that the thesis is based on my original work except for
quotations and citations which have been duly acknowledge. I also declare that
it has been previously or concurrently submitted for any other degree at UMT or
other instituitions.
___________________________
ZAKIRAH BT MOHAMAD TAUFEK
Date:
xvi
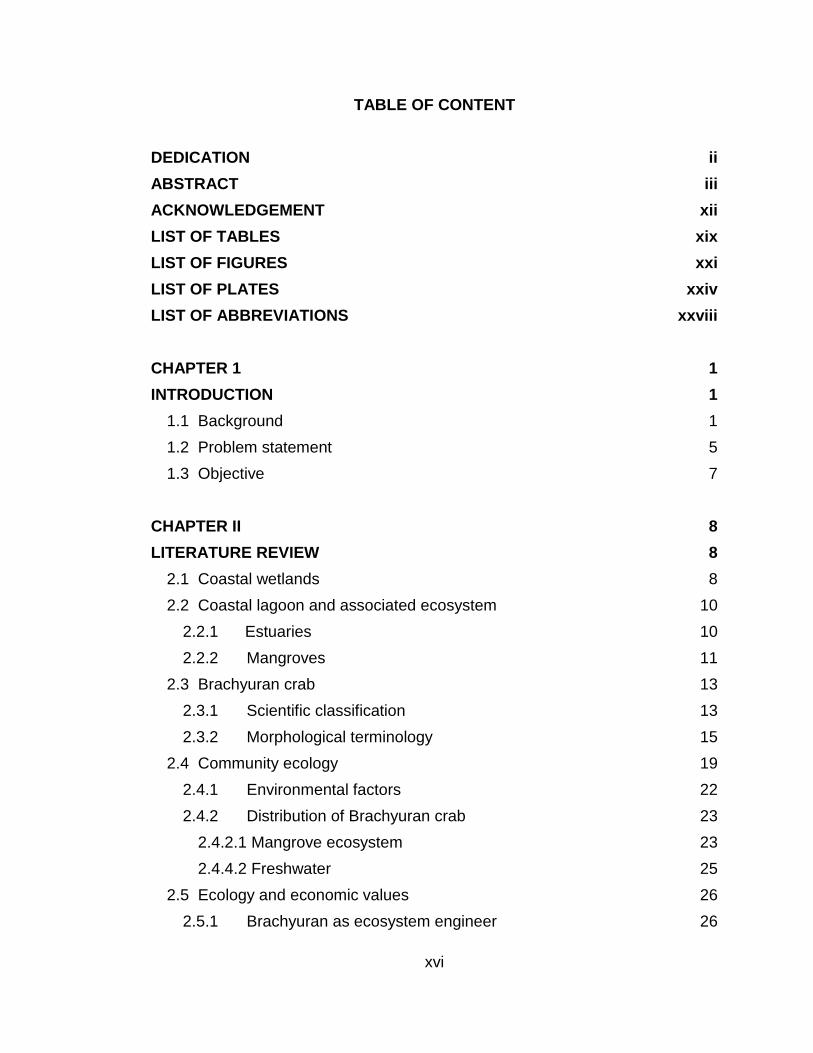
TABLE OF CONTENT
DEDICATION ii
ABSTRACT iii
ACKNOWLEDGEMENT xii
LIST OF TABLES xix
LIST OF FIGURES xxi
LIST OF PLATES xxiv
LIST OF ABBREVIATIONS xxviii
CHAPTER 1 1
INTRODUCTION 1
1.1 Background 1
1.2 Problem statement 5
1.3 Objective 7
CHAPTER II 8
LITERATURE REVIEW 8
2.1 Coastal wetlands 8
2.2 Coastal lagoon and associated ecosystem 10
2.2.1 Estuaries 10
2.2.2 Mangroves 11
2.3 Brachyuran crab 13
2.3.1 Scientific classification 13
2.3.2 Morphological terminology 15
2.4 Community ecology 19
2.4.1 Environmental factors 22
2.4.2 Distribution of Brachyuran crab 23
2.4.2.1 Mangrove ecosystem 23
2.4.4.2 Freshwater 25
2.5 Ecology and economic values 26
2.5.1 Brachyuran as ecosystem engineer 26

xvii
2.5.2 Economic value 30
2.6 Brachyuran crab as bioindicator 31
2.7 Population estimation of Brachyuran crab 34
CHAPTER III 35
METHODOLOGY 35
3.1 Study Site 35
3.2 Field sampling 41
3.2.1 Brachyuran crab collection 41
3.2.2 in situ parameters 44
3.2.3 Sediment collection 44
3.3 Laboratory analyses 45
3.3.1 Brachyuran crab analyses 45
3.3.2 Sediment analysis 47
3.3.2.1 Grain size analysis 47
3.3.2.2 Organic matter analysis 49
3.4 Data analysis 50
3.4.1 Species composition and community structure 50
3.4.2 Correlation and ordination 51
CHAPTER IV 52
RESULTS 52
4.1 Environmental factors 52
4.1.1 in situ physico-chemical parameters 52
4.1.2 Sediment 57
4.1.2.1 Grain size distribution 57
4.1.2.2 Total Organic Matter 61
4.2 Brachyuran community structure 63
4.2.1 Species composition 63
4.2.2 Abundance of Brachyuran community 70
4.2.3 Brachyuran diversity 74
xviii
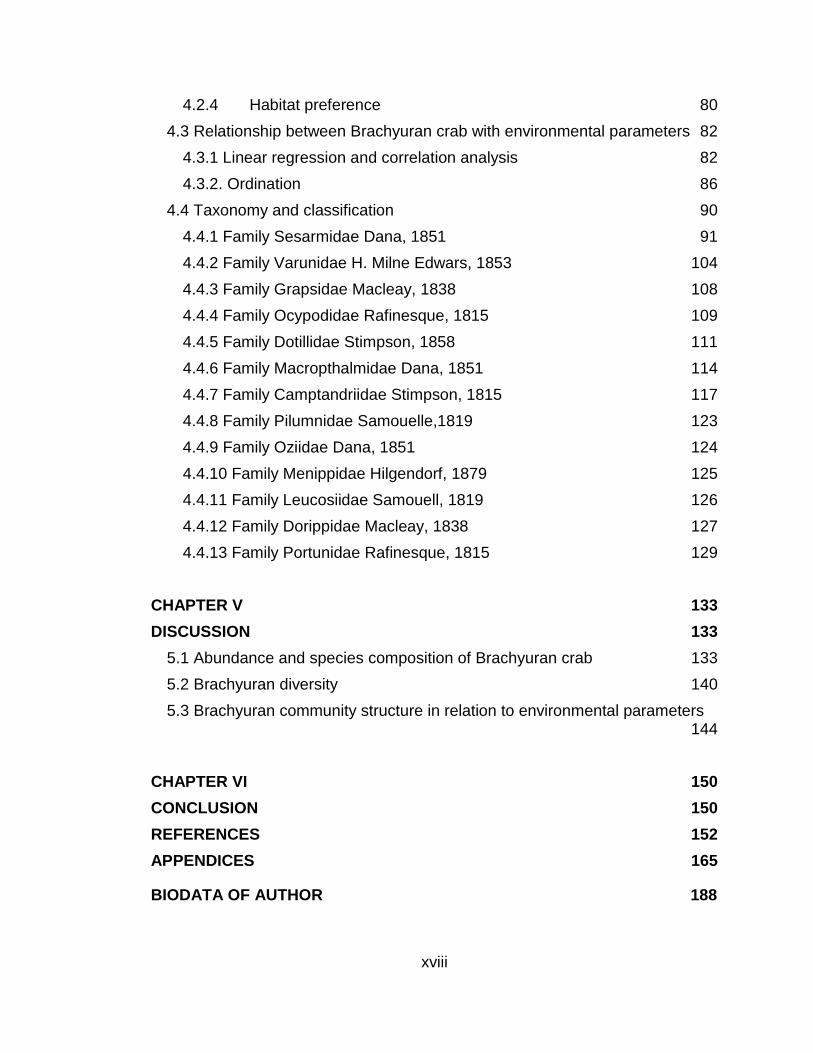
4.2.4 Habitat preference 80
4.3 Relationship between Brachyuran crab with environmental parameters 82
4.3.1 Linear regression and correlation analysis 82
4.3.2. Ordination 86
4.4 Taxonomy and classification 90
4.4.1 Family Sesarmidae Dana, 1851 91
4.4.2 Family Varunidae H. Milne Edwars, 1853 104
4.4.3 Family Grapsidae Macleay, 1838 108
4.4.4 Family Ocypodidae Rafinesque, 1815 109
4.4.5 Family Dotillidae Stimpson, 1858 111
4.4.6 Family Macropthalmidae Dana, 1851 114
4.4.7 Family Camptandriidae Stimpson, 1815 117
4.4.8 Family Pilumnidae Samouelle,1819 123
4.4.9 Family Oziidae Dana, 1851 124
4.4.10 Family Menippidae Hilgendorf, 1879 125
4.4.11 Family Leucosiidae Samouell, 1819 126
4.4.12 Family Dorippidae Macleay, 1838 127
4.4.13 Family Portunidae Rafinesque, 1815 129
CHAPTER V 133
DISCUSSION 133
5.1 Abundance and species composition of Brachyuran crab 133
5.2 Brachyuran diversity 140
5.3 Brachyuran community structure in relation to environmental parameters 144
CHAPTER VI 150
CONCLUSION 150
REFERENCES 152
APPENDICES 165
BIODATA OF AUTHOR 188

xix
LIST OF TABLES
Table 2.1 Systematic classification of Brachyuran crab (Pechenik, 2010).
13
Table 2.2 Report on Brachyuran crab use as bioindicator species for selected contaminants.
33
Table 3.1 Location and sampling coordinates of stations in the Setiu lagoon
37
Table 4.1 Mean ± standard deviation of in situ water parameters recorded in all stations of the Setiu lagoons from six month sampling periods starting from July 2011 to May 2012 (July 2011, September 2011, November 2011, January 2012, March 2012 and May 2012).
53
Table 4.2 Mean of surface sediment grain size distribution and total organic matter in all stations of Setiu lagoons collected from six sampling period from July 2011 untill May 2012 (July 2011,September 2011, November 2011, January 2012, March 2012 and May 2012).
58
Table 4.3 Statistical parameters of the sediment grain size in all stations in the Setiu lagoon in phi (ø) value.
59
Table 4.4 A list of identified Brachyuran crab caught in intertidal station and total number of individual crab caught in 15-minutes time based collection.
59
Table 4.5 A list of identified Brachyuran crab caught in subtidal stations and their relative abundance
60
Table 4.6 An additional identified Brachyuran crab species (The by-catch crab caught not included in the stations).
60
Table 4.7 Abundance (Ind.m-2) of Brachyuran crab species in each station. Data are recorded from six month sampling periods starting July 2011 untill May 2012 (July 2011, September 2011, November 2011, January 2012, March 2012 and May 2012) (n=6).
72
Table 4.8 Univariate measures of community structure parameters of Brachyuran crab caught from 6 sampling periods starting July
75

xx
2011 untill May 2012 ( July 2011, September 2011, November 2011, January 2012, March 2012 and May 2012). The data was mean and standard deviation.
Table 4.9 Habitat preference of Brachyuran crab in intertidal and subtidal of Setiu lagoons.
80
Table 4.10 Pearson-Linear Correlation r between each environmental variables and community indices; Abundance (A), Richness (D), Evenness (J’), and Shannon-Wiener Diversity (H’).
83
Table 4.11 Summary of Redundancy analysis (RDA) results of Brachyuran community in the lagoon area of Setiu Wetland.
87
Table 5.1 Report of occurrence the intertidal Brachyuran crab in Malaysia and adjacent region.
137

xxi
LIST OF FIGURES
Figure 2.1 General shape (dorsal view) of Uca sp. from Family Ocypodidae (the terminology use adapted by Crane, 1975)
15
Figure 2.1 Descriptive terms of: A) the dorsal view of the carapace; B) Frontal view (illustration by Lovett, 1981)
17
Figure 2.2 Descriptive terms of: A) Frontal view of carapace; B) Eyes, antennae and antennules (illustration by Lovett, 1981).
18
Figure 2.4 The ecological process involvement by Brachyuran through feeding and burrowing behaviour (adapted by Kristensen, 2008).
27
Figure 2.5 Schematic drawing showing a crab burrow; A) The typical shape and dimension of fiddler crab burrows; B) Sesarmid crab burrows (source Kristensen, 2008).
29
Figure 4.1 Rainfall recorded from July 2011, September 2011, November 2011, January 2012, March 2012 and May 2012) (n=3).
54
Figure 4.2 Mean ± Standard deviation for seasonal variations of In-situ water salinity in July 2011 to May 2012 with two month interval (n=3); (July 2011, September 2011, November 2011, January 2012, March 2012 and May 2012).
54
Figure 4.3 Mean ± Standard deviation for seasonal variations of in situ pH value in July 2011 to May 2012 with two month interval (n=3); (July 2011, September 2011, November 2011, January 2012, March 2012 and May 2012).
56
Figure 4.4 Mean ± Standard deviation for seasonal variations of in situ Dissolved oxygen in July 2011 to May 2012 with two month interval (n=3); (July 2011, September 2011, November 2011, January 2012, March 2012 and May 2012).
56
Figure 4.5 The sediment mean size value in all stations of Setiu lagoon. The surface sediment collected from six sampling period from July 2011 untill May 2012 (July 2011, September 2011, November 2011, January 2012, March 2012 and May 2012).
59
Figure 4.6 Principal component analysis (PCA) ordination derived from the mean percentage of particle fractions in each station.
60

xxii
G=Granule (4mm), VCS=Very coarse sand (2mm); CS= Coarse sand (1mm); MS=Medium Sand (250µm); FS= Fine sand (150 µm); VFS= very fine sand (63µm); SC= Silt and clay (<63µm)
Figure 4.7 Percentage of surface sediment Total Organic Matter for 6 month sampling period starting July 2011 to May 2012 (July 2011, September 2011, November 2011, January 2012, March 2012 and May 2012).in the Setiu lagoon. The data were mean with standard deviation (n=6).
61
Figure 4.8 The pie chart showed Brachyuran number of individual in the main Family in percentage of total number of individuals, A) Intertidal; B) Subtidal of Setiu lagoon. Data were mean from six sampling periods (n=6) (July 2011, September 2011, November 2011, January 2012, March 2012 and May 2012).
64
Figure 4.9 Percentage distribution of Brachyuran based on major Family in each station; intertidal (ST1-ST8) and subtidal (SF1-SF3). Data were mean from six sampling periods (n=6) (July 2011, September 2011, November 2011, January 2012, March 2012 and May 2012).
65
Figure 4.10 Mean abundance of Brachyuran crab in intertidal stations. Data was collected from six month sampling periods starting July 2011 untill May 2012 (July 2011, September 2011, November 2011, January 2012, March 2012 and May 2012) (n=6).
70
Figure 4.11 Temporal variation of Brachyuran abundance in the Setiu lagoon from 6 sampling period starting July 2012 until May 2012 with two month interval. Data are recorded starting July 2011 untill May 2012 (July 2011, September 2011, November 2011, January 2012, March 2012 and May 2012) (n=6).
73
Figure 4.12 Temporal variation of diversity indices of Brachyuran in the Setiu Lagoon from six sampling periods starting July until May 2012.
77
Figure 4.13 Dendogram produced by cluster analysis showing the percentage of similarity between the intertidal stations by using mean abundance of Brachyuran species collected from one year sampling periods with two month interval (July 2011, September 2011, November 2011, January 2012, March 2012, and May 2012).
78
Figure 4.14 MDS ordination constructed from the mean abundance of Brachyuran species collected from one year sampling periods
79

xxiii
with two month interval (July 2011, September 2011, November 2011, January 2012, March 2012, and May 2012).
Figure 4.15 The scattered plot of linear regression between; (A) species richness and; (B) Species diversity in relation to increasing of salinity.
84
Figure 4.16 The scattered plot of linear regression between species richness (D); and species diversity (H’) in relation to increasing of salinity.
85
Figure 4.17 Triplot diagram of RDA showing the relationship between Brachyuran communities with the environmental variables in the Setiu lagoon.
89

xxiv
LIST OF PLATES
Plate 4.1 A, B) Overall view of Perisesarma indiarum (UMTCrust00138) and Perisesarma eumolpe (UMTCrust00103); Ventral view of C) P.indiarum; D) P.eumolpe E) P. indiarum foraging near the water edge during low tide (CL=12-29mm)
91
Plate 4.2 A) Overall view of Parasesarma plicatum (Latreille, 1806) (UMTCrust00116) (CL= 14.31); B). P.plicatum were abundance in open area covered with grass and undergrowth of mangrove vegetation; C) Ventral view with the aspect of chela; D) Right male chela (drawing illustration adapted from Naderloo and Schubart, 2010).
93
Plate 4.3 Clistocoeloma merguiense (De Man, 1888) (CL=27.5mm) (UMTCrust00146). A) Overall view; B) Carapace, dorsal view C) Frontal view; D) Left cheliped; E) Male abdomen (the illustration was adapted from Hsueh and Huang, 1996).
95
Plate 4.4 A, C) Overall view of Nanosesarma sp.1 (UMTCrust00125) (CL=1.4mm) and Nanosesarma sp. 2 (UMTCrust00124) (CL=1.3mm); B) Ventral view of Nanosesarma sp.1; D) Ventral view Nanosesarma sp.2; E) Cavities made by wood boring isopoda where these species collected.
97
Plate 4.5 Labuanium politum (De Man, 1888) (CL=30.0mm) (UMTcrust00146). A) Overall view; B) Ventral view; C) Nypa fruticans mangrove forest.
99
Plate 4.6 Episesarma singaporense (Tweedie, 1936) (CL=32.0mm) (UMTcrust00146). A, overall view; B) Ventral view; C,D) E.singaporense feed on fallen leaf of Rhizophora sp.
100
Plate 4.7 Haberma nanum (UMTCrust00107) (CL=1.5mm). A) Overall view; B) Dorsal view; C) Ventral view of female abdomen; D) H.nanum was found over a burrow of mud lobster mounds.
101
Plate 4.8 Neosermatium sp. (UMTcrust00108)(CL=11.5 mm); A) overall view; B) Ventral view with the aspect of male abdomen and chela; C) ST4, the specimen collected; D) Ventral view with the aspect of berried female abdomen and chela; E) Life colouration in natural habitat.
102

xxv
Plate 4.9 Plate 4.1: Varuna litterata, (UMTCrust00115) (CL=29 mm); A) dorsal view; B) ventral view; C) Ventral view with aspect of outer faces of chelae; D) Intertidal flat of ST3.
103
Plaet 4.10 Hemigrapsus sp. (UMTCrust00133) (CL=16.3 mm); A) Dorsal view of carapace; B) Ventral view; C) Frontal view.
105
Plate 4.11 A) Overall view of Metaplax elegans (UMTCrust00122) (CL=17.4mm); B) Ventral view with the emphasize of chela; C) M.elegans foraging during low tide.
106
Plate 4.12 A) Overall view Metopograpsus frontalis (UMTCrust 00105)(CL=30.2mm); B) Metopograpsus latifron (White)(UMTCrust 00151)(CL=30 mm); Ventral view with the emphasize of cheliped C) Metopograpsus frontalis; D) Metopograpsus latifrons; E) Half of carapace in dorsal view Of M.frontalis F) Half of carapace in dorsal view Of M.latifron (drawing illustration adapted from Banerjee, 1960).
108
Plate 4.13 Overall view of, A) Ocypode ceratopthalmus (Pallas, 1772) (UMTCrust00150) (CL=34.5); B) Ocypode cordimanus (Latreille, 1818) (UMTCrust00147) (CL=21mm).
109
Plate 4.14 Different of male claw of A) U. vocans (UMTCrust00101) (CL=11.2 mm) and; B) U. annulipes (UMTCrust00148) (CL=9.8mm); C) U. parplexa H.Milne Edwars, 1852 (UMTCrust00102) (CL=10.1); D) A group of Uca spp. foraged in the exposed sandy substratum along the banks during low tide.
110
Plate 4.15 Dotilla sp. (Stimpson, 1858) (UMTCrust 00111)(CL=9.6mm); A) Overall view; coloured altered by preservation; B)Ventral view; C) Red circle indicate the open intertidal sand-flat where the Dotilla sp. collected.
111
Plate 4.16 Overall view of Scopimera sp. (UMTCrust00109); B) Ventral view with the aspect of chelae and male abdomen; C) Red circle show the burrows of Scopimera sp.
113
Plate 4.17 Macropthalmus sp.1 (UMTCrust00104) (CL= 35 mm). A) Overall view; B) Female ventral view; C) Male ventral view ; D) crabs were collected in the muddy substratum.
114
Plate 4.18 Macropthalmus sp.2 (UMTCrust00137) (CL= 36.7 mm). A) Overall view; B) Male ventral view.
115

xxvi
Plate 4.19 Ilyograpsus nodulosus (UMTCrust00136) (CL= 4.7 mm); A-B) Dorsal View; C) Ventral view with the aspect of male abdomen and chelae; D) Frontal view.
116
Plate 4.20 Plate 4.2: Paracleistostoma eriophorum (UMTCrust00113) (CL= 6.32 mm) A-C) Dorsal View; D) Ventral view with the aspect of male abdomen and chelae.
117
Plate 4.21 Plate 4.3: Paracleistostoma sp.1 (UMTCrust00112) (CL=8.25 mm). A) Dorsal View; B) Ventral view.
117
Plate 4.22 Plate 4.22: Moguai aloutos (UMTCrust00119) (CL=0.97 mm) A) Overall view; B) Ventral view of female; C) Ventral view of male.
119
Plate 4.23 Plate 4.23: Baruna socialis (UMTCrust00135) (CL=3.2 mm); A) Overall view; B) Dorsal view of carapace region; C) Female abdomen; D) Male abdomen.
120
Plate 4.24 Baruna mangromunphia Stebbing, 1904 A) Dorsal view; B) Ventral view of berried female; C-H C) Dorsal view of male carapace D) Dorsal view of female carapace E) Inner surface view of right fourth ambulatory leg; F) Inner surface view of left third ambulatory leg Female abdomen; G) Female abdomen; H) Male abdomen (illustration adapted from Harminto & Ng, 1991).
121
Plate4.25 Xenopthalmus sp. (UMTCrust00149) (CL=5.1 mm) A) Overall view; B) Frontal view.
122
Plate 4.26 Heteropanope glabra (UMT00134) (CL=8.97mm); A) Overall view; B) Dorsal view of carapace region; C) Ventral view with the aspect of chela and abdomen.
123
Plate 4.27 Overall view of Epixanthus dentatus White, 1848 (UMTCrust00141) (CL= 43.7-74.5 mm).
124
Plate 4.28 A) Overall view of Myomenippe hardwickii; B) Vental view with the aspect of chela (UMTCrust00140) (CL=42.3-94.6 mm).
125
Plate 4.29 Praosia punctata (UMTCrust00118) (CL 1.4mm) A) Overall view; B) Ventral view showing male abdomen; C) Ventral view showing female abdomen.
126
Plate 4.30 A leaf porter crab (Neodorippe callida) (UMTCrust0017) 127

xxvii
(CL=13.6mm) A) Overall view; B) Ventral view.
Plate 4.31 Thalamita crenata (UMTCrust00110) (CL=72.53-97.8mm). A) Overall view; B) Ventral view aspect of chela.
130
Plate 4.32 Portunus pelagicus (UMTCrust00139) (CL=129.21 mm). A) Overall view; B) Ventral view aspect of male abdomen.
131
Plate 4.33 A-C) Overall view of Scylla spp.; A) S.paramamosain Estampador, 1949 (UMT00142) (CL=58.24-124.40mm); B) S.tranquebarica Fabricius, 1798 (UMT00143)(CL=47.31-111.33mm); C) S.olivacia Herbst, 1796 (UMT00144)(CL=50.15-109.03 mm); D-F) Frontal view with the aspect of cheliped; D) S.paramamosain; E) S.tranquebarica; F) S.olivacia.
132

xxviii
LIST OF ABBREVIATIONS
mm - millimetre
cm - centimetre m - meter g - gram µm Micrometer mg/L - Milligram per litter No.Ind.m-2 - Number of individual per square meter °C - Degree celcius PSU - Practical Salinity Unit DO - Dissolved oxygen TOM - Total organic matter SD - Standard deviation ANOVA - Analysis of Variance PCA - Principal Component Analysis CCA - Cananonical Correspondence Analysis RDA - Redundant Analysis sp. - Species UMTCrust - INOS Museum Collection number for crustacean
sample ST - Stations in intertidal SF - Stations in subtidal Jul-11 - July 2011 Sep-11 - September 2011 Nov-11 - November 2011 Jan-12 - January 2012 Mar-12 - March 2012 May-12 - May 2012 S - Number of species D - Species richness index J’ - Species evenness index H’ - Species diversity index Ø - phi

1
CHAPTER 1
INTRODUCTION
1.1 Background
Wetland is a productive ecosystem that contributes to aquatic and
terrestrial biodiversity (Woodroffe and Davies, 2009) and plays a great role in
sustaining biological diversity and provide significant ecological, social and
economics functions (Mann, 2000; Woodroffe and Davies, 2009).
Terengganu is situated at the East-coast of Peninsular Malaysia. Setiu
wetland is located along the coastal area facing South China Sea in the
northern state of Terengganu with total water surface area about 880 ha (Ong et
al., 2009). The wetlands comprise unique inter-connected ecosystem including
Melaluecae forest (known as Gelam forest), mangrove, estuaries, beach, river,
intertidal mud-sandy flats and lagoons (Ibrahim and Abdullah, 2003).These

2
ranges of habitats provide a variety of flora communities which in turn support
suitable habitat to animal communities. Natural resources derived from this
wetland create socio-economic opportunities to local communities, including
artisanal and commercial fisheries, small scale to extensive cage and earthern
pond aquaculture, charcoal production and small-scale manufacturing of
traditional food (Yaacob et al., 2006).
The Setiu lagoon is the largest coastal lagoon that can be found in
Terengganu coast stretching with approximately 20 km from Penarik at the north
to Benting Lintang at the south. Previously, there were several research that has
been done in depth in Setiu lagoon, including targeted seagrass distribution
(Gan, 2011), specific faunal groups such as mud crab (Ikhwanuddin et al., 2010,
Zaidi et al., 2011), river terrapin, bird and bat (Tamblyn et al., 2006) and
environmental health assessment such as heavy metal (Ong et al., 2009) and
sedimentology (Husain et al., 1995; Kasawani et al., 2010; Yaacob and Zaini,
2010).
Brachyuran crabs are one of the most important decapod members
inhabiting wetland ecosystem. Wetland ecosystem offers a vast array of habitat
for Brachyuran crab in turn contribute to biological diversity for this ecosystem.
Within the wetland, Brachyuran crab covers wide range of distribution ranging

3
from terrestrial, semi terrestrial and aquatic environment. These include
mangrove forest, intertidal flats, river, swamp forest, estuaries, lagoon and
beach. In Malaysia, previously there were several studies has been done to
investigate the distribution of brachuyuran species in targeted ecosystem
including the mangrove (Tan and Ng 1994; Sasekumar and Chong, 1998;
Ashton et al., 2003a, 2003b), freshwater ecosystem (Ng, 1988; Ng, 1995,
Cumberlidge et al., 2009; Yeo et al., 2008), island (Yeo and Ng, 1999), and
even in the cave (Mcfarlane et al., 2011). Their distribution also influence by
several environmental factors such as water salinity, water temperature and
tidal inundation, soil pH, salinity, organic content, sediment characteristic (Smith
et al., 1991; Koch et al., 2005) and how they adapted and tolerate with these
environmental factors. They also contribute a significant role in ecological
functions (Smith et al., 1991; Nourdhaus et al., 2006; Kristensen, 2008) and
form important link in food web between detritus at the base of trophic level and
higher consumers (Koch et al., 2005).
The mangroves ecosystem contributes to high proportion number of
Brachyuran species which dominated by two families, Ocypodidae and
Grapsidae, in terms of abundance and biomass in the Indo West Pacific
mangrove forests (Lee 1989; Lee 1998; Ashton et al., 2003a; Cannicci et al.,
2008). The distribution of Brachyuran crab in intertidal mangrove ecosystems
has been explained by various authors (Smith et al., 1991; Sasekumar and

4
Chong, 1998; Ashton et al., 2003a, 2003b; Nagelkerken et al., 2008; Ng et al.,
2008). The Brachyuran crab makes up about 80% of the macrofauna biomass
and can reach densities of 80-90 per m2 (Smith et al., 1991; Nordhaus et al.,
2006; Bandekar et al., 2011) also result in high percentage (76%) of the total
biomass of mangrove fauna (Smith et al., 1991). Sanchez and Raz-Ghuzman
(1997) has reported that some Brachyuran crab species have been recognized
as regulators of the estuaries structure and importance in terms of their
abundance and support high species richness in this ecosystem.

5
1.2 Problem statement
To date, there is little study on Brachyuran crab in the Setiu lagoon. The
number of Brachyuran crab species in this lagoon is still undiscovered and yet
little study was conducted. As consequences, this area constitutes a gap in the
known distribution of Brachyuran crab. Previous studies have been done in this
lagoon focusing on targeted species Scylla spp. (Ikhwanuddin et al., 2010)
which is commercially important species and has high demand from local
consumers and for aquaculture purpose. Hence, there is a need to explore
these valuable crab communities as a whole and should not be neglected as
they are important in foodweb and economic development in this area.
A fundamental property of understanding any ecosystem habitat is the
number of species it contains (Henderson, 2003; Likens, 2005). Therefore, it is
a need to explore in-depth the occurrence of Brachyuran crab species in this
lagoon. Nowadays, anthropogenic disturbance to natural ecosystems often
result in degradation of ecosystem and may lead to diversity loss. However, the
consequences on the ecosystem are often unrecorded due to lack of baseline
studies in interest ecosystem.

6
They are crucial for the maintenances of biodiversity in this lagoon since
coastal areas across the world are under increasing population and
development pressures. Alteration on this ecosystem such as land clearing will
directly cause habitat destruction for Brachyuran and others flora and fauna
especially for those species that live in a semi-terrestrial life, breathing air, living
in burrows and dividing their time between water and land, appear most at risk,
possibly because their habitats are most easily disturbed by human activities.
Unfortunately, it appears that there is still less of detailed published
information on the occurrence of Brachyuran crab in the Setiu lagoon.
Moreover, there seems to be limited published data on these faunal
documented in the Terengganu. Several reports are available from Malaysia
was recorded by Leh and Sasekumar, (1985); Tan and Ng, (1994); and Ashton
et al., (2003a, 2003b). Unlike other countries where continues research update
of recent new Brachyuran species were discovered from time to time.
Hence, finding of this study especially the current list of Brachyuran
species is expected to be useful as baseline information for future systematic
and ecological studies in this area. Wihout detail documentation and systematic
studies on the interest species in particular ecosystem or habitat, an animal may
no longer exist to humans. Without a name, we have no framework with which
to study the organism, and no way to understand its unique ecological role (Ng
et al., 2008).

7
1.3 Objective
This study specifically focuses on the following objectives:
1. To identify the Brachyuran crabs in the lagoon area of Setiu Wetland up
to their lowest taxonomic level.
2. To investigate the community structure of Brachyuran crab within the
Setiu lagoon ecosystem.
3. To determine the relation of Brachyuran crab community structure with
selected environmental parameters of Setiu lagoon.

8
CHAPTER II
LITERATURE REVIEW
2.1 Coastal wetlands
Nowadays, protection and conservation of wetland ecosystem has
received high concern by many organizations. Comparing to the other
ecosystem, wetland was the first ecosystem to receive international attention
through the convention of Wetland International, opened for signature at
Ramsar, Iran, in February, 1971 (Woodroffe and Davies, 2009). According to
definition by Ramsar Convention, wetland is “the areas of marsh, fen, peat land,
whether natural, artificial, permanent or temporal, with water that is static or
flowing, fresh, brackish or salt, including areas of marine water the depth of
which at low tide does not exceed six meters. These areas may incorporate
riparian and coastal zones adjacent to the wetlands, and islands or bodies of
marine water deeper than six metres at low tide lying within the wetlands”. In
Malaysia, there are 105 wetland areas. However, over the hundred only six
wetlands were gazetted as a Ramsar site and Setiu wetland was listed as
potential Ramsar site in Malaysia (Wetland International Malaysia, 2007).

9
Vegetation composition and water fluctuations make a range of wetland
ecosystem available at different times of the year for aquatic and terrestrial
animals. In the intertidal ecosystem the distribution of Brachyuran species are
related to their adaptations to abiotic conditions, vegetation density and
composition, their social and feeding behaviour (Dahdouh-Guebas et al., 2002;
Ashton et al., 2003b, Joscha et al., 2012).
Within a wetland, the environmental characteristic is the main factors to
produce a great range of wetland types (Mann, 2000; Woodroffe and Davies,
2009). Kjerfve, (1994) define the coastal lagoon ecosystem as “shallow coastal
water body separated from the ocean by a barrier, connected at least
intermittently to the ocean by one or more restricted inlets, and usually oriented
shore-parallel” while Vadineanu, (2005) define coastal lagoon ecosystem as
transition area of land and sea or more related to wetland, the interface areas
between land and water.
10
2.2 Coastal lagoon and associated ecosystem
2.2.1 Estuaries
Definition of an estuary is adapted from Kjerfve, (1994). “An estuary is the
semi-enclosed region, as freshwater and saltwater mixing. Estuaries water
varies from freshwater to salty, with much of it an intermediate mixture that is
described as brackish. Estuary is dynamic water systems where there is
continuously changing of physical, chemical and biological activity”. Estuaries
may take the form of semi enclosed bays, or shallow lagoons often associated
with sandbars at their seaward edge (Walker and Wood, 2005).
The mixing of this water affects the overall salinity of the estuary and
which organisms can live to this environment (Walker and Wood, 2005).
According to Mann, (2000) the special feature of estuaries is related to two main
physical processes. First feature is water density characteristic. Freshwater is
lighter than saltwater and often gives rise to a two-layered system. The second
special feature is that rivers commonly bring a load of suspended sediment to
the estuary. Settlement of the sediment in the estuary produces fertile ground
for the growth of salt-tolerant flowering plants such as seagrass and mangroves
which give estuaries a special biological characteristic (Walker and Wood,
2005).
11
Mangroves, seagrass beds, salt marshes, mudflats considered as
subsystem of an estuary (Mann, 2000). Estuaries are the only kind of
environment capable to support a great diversity of freshwater and saltwater
residents and passerby. Some of these species use the estuaries as nurseries
ground (Walker and Wood, 2005). Within the tropics, estuarine habitats are well
developed, with mangroves as the characteristic large plant (Mann, 2000).
2.2.2 Mangroves
In the coastal lagoon ecosystem, mangroves forests usually occur at river
mouths and the intertidal zone at the interface between land and sea. The
vegetation must have the ability to withstand inundation (Mohd-Lokman, 2004).
Mangroves defined as trees and shrubs or palms that reach the height
exceeding 0.5 m (Woodroffe and Davies, 2009) throughout the tropics and
subtropics region with latitude between 25°N and 25°S (Mann, 2000).
The root system is another unique feature of mangrove forest. Generally,
mangrove forest divided into several zone according to tree assemblages. The
zones is determined by the interaction by several environmental factors such as
tidal flooding, soil types, salinity of ground floor, frequency of inundation by

12
seawater, water flow and soil humidity and geographical condition in mangroves
(Pernetta, 1993; Dahdouh-Guebas et al., 2002; Koch et al., 2005).
The Indo-west pacific possesses the most abundant mangrove forest in
terms of species richness and species diversity (Siddiqi, 2001). At least 105
recorded mangrove vegetation species were occurred in the Malaysia and
Terengganu in particular comprise 29 exclusive mangrove vegetation species
(Appendix). Most of the mangroves in the Terengganu were classified as
estuarine type (Husain and Ibrahim, 2001). The Setiu Wetland was the second
largest area of mangroves stand in Terengganu. The mangroves were
flourishing inside the lagoon-estuary ecosystem which facing the South China
Sea. The mangroves are characterised as fringing type and primarily dominated
by Rhizhopora spp.and Nypa fruticans (Husain and Ibrahim, 2001).

13
2.3 Brachyuran crab
2.3.1 Scientific classification
Table 2.1: Systematic classification of Brachyuran crab (Pechenik, 2010).
Phylum Arthropoda
Subphylum Mandibulata
Class Crustacea
Subclass Malacostraca
Order Decapoda
Infraorder Brachyura
Phylum Arthropoda, one of the largest arthropod groups in the animal
kingdom with over 42,000 extant species. Globally, there are currently 6,700
species of Brachyuran crab were recorded (Yeo et al., 2008). The term
crustacea refers to the hard chitinous exoskeleton. Brachyuran crabs (true crab)
belong to infraorder Brachyuran. Normally, they are referring to the members of
shrimp, lobster and crayfish and hermit crabs. They are also sometimes
confused with hermit and porcelain crab from infraorder anomura. A full
classification is represented in Table 2.1 according to Pechenik (2010).
14
Brachyuran crab is also classified regarding to their feeding types. For
example, species of the family Ocypodidae are group as sediment feeders and
the Grapsid species are generally omnivorous (Bouillon et al., 2002).
Nowadays, advance research in systematic studies was introduced based on
molecular technique. The molecular biologist suggest that this technique are
considered powerful tools to be used in order to have better understanding of
Brachyuran phylogeny and systematic classification as compared to
conventional method by using morphological data to solve systematic problems
(Ng et al., 2008). However, down site of this matter, the morphologists must
take into account that molecular data as an additional information to be
assessed. Indeed, the conventional method of morphological data should not be
ignored (Ng et al., 2008). Therefore, integrated approaches of systematic
studies and available knowledge such as through adult and larval morphology
(Guerao, et al., 2004), molecular (Silva, et al., 2010), ecology (Ng et al., 2010),
and physiology (Ng et al., 2008) are required in order for better understanding
of Brachyuran taxonomy and classification.

15
2.3.2 Morphological terminology
Basically, Brachyuran crab body consists of broad carapace consisting of
the head (cephalic) and strongly reduced abdomen that is tightly tucked
underneath the body (Figure 2.1). The external morphology of crabs has
evolved into a body with modified segments and appendages (Figure 2.2 and
Figure 2.3) that are specialized for distinct purposes such as feeding, defence,
swimming, reproduction and respiration. These modifications enable them to
adapt and exist within their respective habitats (Warner, 1977).
Figure 2.3: General shape (dorsal view) of Uca sp. from Family Ocypodidae; 1,2,3, and 4 refer to walking leg (the terminology use adapted from Crane, 1975)
1
2
3
4
Copyright © 2022 FDOKUMEN