Bending of single crystal micro cantilever beams of cube orientation: Finite element model and...
14
Bending of single crystal microcantilever beams of cube orientation: Finite element model and experiments Eralp Demir , Franz Roters, Dierk Raabe Max-Planck-Institut f¨ ur Eisenforschung, Max-Planck Str. 1, 40237 D¨ usseldorf, Germany article info Article history: Received 15 December 2009 Received in revised form 24 June 2010 Accepted 5 July 2010 Keywords: Cube orientation Single crystal Bending size effect Strain gradient hardening Crystal plasticity abstract The aim of this work is to investigate the microstructure evolution, stress–strain response and strain hardening behavior of microscale beams. For that purpose, two single crystal cantilever beams in the size dependent regime were manufactured by ion beam milling and beams were bent with an indenter device. A crystal plasticity material model for large deformations was implemented in a finite element framework to further investigate the effect of boundary constraints. Simulations were performed using bulk material properties of single crystal copper without any special treatment for the strain gradients. The difference between the slopes of the experimental and the simulated force displacement curves suggested negligible amount of strain gradient hardening compared to the statistical hardening mechanisms. & 2010 Elsevier Ltd. All rights reserved. 1. Introduction Bending is an alternative small scale testing method to pillar compression and indentation. It is advantageous compared to pillar compression in which both the surface of the tool and the top surface of the sample must be strictly parallel to each other (Volkert and Lilleodden, 2006; Greer et al., 2005; Shade et al., 2009; Uchic et al., 2006; Nix et al., 2007) and to indentation which has a complicated deformation geometry. In addition, bending allows the deformed region to be studied far away from the tool contact zone, hence free of contact and friction effects. In recent cantilever beam bending experiments, size dependent flow stresses were measured (Demir et al., 2010; Gong and Wilkinson, 2009; Motz et al., 2005). Stolken and Evans performed uniform bending experiments on Ni polycrystal thin films having a thickness range of 12:5250 mm(Stolken and Evans, 1998) and they related the size dependence of normalized bending moment to the strain gradients. In the Demir et al. (2010), size dependent flow stresses were measured during bending of cantilevers of single crystals and shear localizations were found from the electron backscatter diffraction (EBSD) measurements. The size dependence of the yield strengths in the Demir et al. (2010) was explained with a mean field breakdown theory for beams that were thinner than 1 mm. They concluded that cantilever beam bending can be used as a reliable means to characterize strength of materials at micro scale. Size dependence of strain hardening was related to the strain gradients in deformations that involve plastic curvature of crystal lattice (Stolken and Evans, 1998; Fleck et al., 1994; Shi et al., 2008). In those works, strain gradients were expressed in terms of the dislocation densities using the gradients of either the lattice shear (Ashby, 1970) or the lattice rotations (Nye, 1953). The strain gradient hardening is included to the models using Taylor relation as in the Wang et al. (2007) and Contents lists available at ScienceDirect journal homepage: www.elsevier.com/locate/jmps Journal of the Mechanics and Physics of Solids 0022-5096/$ - see front matter & 2010 Elsevier Ltd. All rights reserved. doi:10.1016/j.jmps.2010.07.007 Corresponding author. Current address: 191 Rhodes Hall, Cornell University, Ithaca, NY 14853, USA. E-mail addresses: [email protected], [email protected] (E. Demir). Journal of the Mechanics and Physics of Solids 58 (2010) 1599–1612
Transcript of Bending of single crystal micro cantilever beams of cube orientation: Finite element model and...

Contents lists available at ScienceDirect
Journal of the Mechanics and Physics of Solids
Journal of the Mechanics and Physics of Solids 58 (2010) 1599–1612
0022-50
doi:10.1
� Cor
E-m
journal homepage: www.elsevier.com/locate/jmps
Bending of single crystal microcantilever beams of cube orientation:Finite element model and experiments
Eralp Demir �, Franz Roters, Dierk Raabe
Max-Planck-Institut fur Eisenforschung, Max-Planck Str. 1, 40237 Dusseldorf, Germany
a r t i c l e i n f o
Article history:
Received 15 December 2009
Received in revised form
24 June 2010
Accepted 5 July 2010
Keywords:
Cube orientation
Single crystal
Bending size effect
Strain gradient hardening
Crystal plasticity
96/$ - see front matter & 2010 Elsevier Ltd. A
016/j.jmps.2010.07.007
responding author. Current address: 191 Rho
ail addresses: [email protected], eralpdemir
a b s t r a c t
The aim of this work is to investigate the microstructure evolution, stress–strain
response and strain hardening behavior of microscale beams. For that purpose, two
single crystal cantilever beams in the size dependent regime were manufactured by ion
beam milling and beams were bent with an indenter device. A crystal plasticity material
model for large deformations was implemented in a finite element framework to further
investigate the effect of boundary constraints. Simulations were performed using bulk
material properties of single crystal copper without any special treatment for the strain
gradients. The difference between the slopes of the experimental and the simulated
force displacement curves suggested negligible amount of strain gradient hardening
compared to the statistical hardening mechanisms.
& 2010 Elsevier Ltd. All rights reserved.
1. Introduction
Bending is an alternative small scale testing method to pillar compression and indentation. It is advantageous comparedto pillar compression in which both the surface of the tool and the top surface of the sample must be strictly parallel toeach other (Volkert and Lilleodden, 2006; Greer et al., 2005; Shade et al., 2009; Uchic et al., 2006; Nix et al., 2007) and toindentation which has a complicated deformation geometry. In addition, bending allows the deformed region to be studiedfar away from the tool contact zone, hence free of contact and friction effects.
In recent cantilever beam bending experiments, size dependent flow stresses were measured (Demir et al., 2010; Gongand Wilkinson, 2009; Motz et al., 2005). Stolken and Evans performed uniform bending experiments on Ni polycrystal thinfilms having a thickness range of 12:5250mm (Stolken and Evans, 1998) and they related the size dependence ofnormalized bending moment to the strain gradients. In the Demir et al. (2010), size dependent flow stresses weremeasured during bending of cantilevers of single crystals and shear localizations were found from the electron backscatterdiffraction (EBSD) measurements. The size dependence of the yield strengths in the Demir et al. (2010) was explained witha mean field breakdown theory for beams that were thinner than 1mm. They concluded that cantilever beam bending canbe used as a reliable means to characterize strength of materials at micro scale.
Size dependence of strain hardening was related to the strain gradients in deformations that involve plastic curvature ofcrystal lattice (Stolken and Evans, 1998; Fleck et al., 1994; Shi et al., 2008). In those works, strain gradients were expressedin terms of the dislocation densities using the gradients of either the lattice shear (Ashby, 1970) or the lattice rotations(Nye, 1953). The strain gradient hardening is included to the models using Taylor relation as in the Wang et al. (2007) and
ll rights reserved.
des Hall, Cornell University, Ithaca, NY 14853, USA.
[email protected] (E. Demir).

E. Demir et al. / J. Mech. Phys. Solids 58 (2010) 1599–16121600
Nix and Gao (1998). Therefore, strain gradients were believed to be the source of size dependence of mechanical strengthfor bending at microscale (Stolken and Evans, 1998).
To gain a better understanding of bending at microscale and to search for the effect of strain gradients, a critical bendingexperiment was designed and finite element simulations were performed. Two single crystal cantilever beams of cubeorientation having approximate thicknesses of 5mm were manufactured by ion beam milling. Each beam was loaded in anindenter setup with a different moment arm. Ex situ EBSD measurements were performed to investigate themicrostructural evolution after each displacement increment. The anisotropic elastic and elastic–plastic behavior of thecrystal was implemented in a commercial finite element software to simulate the force displacement behavior and tomodel the strain distributions inside the beams for the same real test sample geometry with the actual boundaryconstraints. A conventional crystal plasticity model was implemented to incorporate the strain localization effects (Asaroand Rice, 1977) as observed in the experiments (Demir et al., 2010). The hardening contribution from the strain gradientswas neglected in the model and a constitutive law using bulk single crystal material properties was utilized. The beamthickness was selected in the size effected regime (Demir et al., 2010; Motz et al., 2005; Stolken and Evans, 1998) toinvestigate the effect of strain gradients. For that purpose, the simulated and experimentally measured strain hardeningresponses were compared as obtained from the force displacement curves.
2. Experiments
2.1. Details of experimental procedure
Copper single crystals were produced by directional solidification in a Bridgeman furnace by the use of a cube orientedseed crystal. Rectangular samples were cut by wire electro discharge machining. The two surfaces of the sample were firstwet ground and then polished with diamond pastes of 3 and 1mm, respectively. The top surface of the sample was electropolished with D2 solution of Struers using default device settings for copper.
Fig. 1 shows the final dimensions of the beam after focused ion beam (FIB) milling. All dimensions were machined usinggrazing incident milling in order to minimize the ion beam damage (Kiener et al., 2007). Final milling current was 100 pAat 30 keV emission voltage.
Table 4 shows the important final dimensions of the beams after milling. text, tint, w, l and y refer to exterior thickness,interior thickness, width, length and moment arm, respectively. The beam width was greater than three times thethickness in order to ensure plain strain deformation. Moreover the taper along the width of the beams was minimized byadditionally tilting the beams 71:53 with respect to the FIB milling axis. However, there was 0:620:7mm thicknessvariation as a manufacturing error due to the curved geometry of the ion beam over long milling distances of 15217mm.The average thickness of the beams was nearly 5mm in order to minimize the effect of damaged layer by ion milling (50 nmthick layer for a milling current of 1 nA at 30 keV from Kiener et al., 2007) and to remain away from the dislocation sourcelimitation regime (Demir et al., 2010).
Average Euler angles of j1 ¼ 1:43, F¼ 3:13 and j2 ¼ 8:03 (Bunge notation) were measured before loading the beams,Fig. 2, with an average noise of approximately 0.21.
Beams were bent with two different moment arms in an indenter as in Table 1. Beams a and b refer to the beams withmoment arms of 12:170:1 and 5:270:1mm, respectively. A cono-spherical indenter tip of diamond with 5mm radius(Hys Ti-45) was used in the experiments. The indenter was located using the piezo-scanning tool with the indenter tip.An approximate offset, z, from the center of the beams of 1:5mm was measured as a positioning inaccuracy. The indentertip radius was selected as large as possible to minimize the indentation of the surface of the beams while it allowed the useof piezo-scanning for accurate positioning. The beams were loaded interruptly with a displacement increment of 1mmwhile a constant displacement rate of 0:1mm=s was maintained (displacement controlled). Ex situ SEM and EBSDmeasurements were performed after each displacement increment.
side view
10 μm
top view
10 μm
textt
int
w
l
Fig. 1. Dimensions measured from the top and the side views of the beams before loading. w, l, tint, text refer to the width, length, thickness at the exterior
and the interior surfaces, respectively.

10 μm
5 μm
10 μm
5 μm
100 110
111RD
TD
Fig. 2. Inverse pole figure maps of the undeformed beams along the normal direction (ND). The step sizes of 100 and 50 nm were used in the large and
the small maps, respectively. Confidence index of the EBSD maps were greater than 0.1. Average Euler angles of both beams were (1.41, 3.11 and 8.01)
in Bunge convention.
Table 1Beam dimensions; text, tint, w, l, y, z are the thickness at the exterior and the interior surfaces, width, length, moment arm and the offset of the contact
point from the center line of the beam, respectively.
text ðmmÞ tint ðmmÞ w ðmmÞ l ðmmÞ y ðmmÞ z ðmmÞ
Beam a 4.670.1 5.770.1 15.070.4 18.470.3 12.170.1 1.570.1
Beam b 4.570.2 5.970.1 15.070.4 15.970.3 5.270.1 1.670.1
Dimensions are measured using scanning electron microscope. Beams a and b refer to the beams with moment arms of 12.170.1 and 5:270:1mm,
respectively.
RD
TD beam a beam b
1μm
dis
p.2μ
m d
isp.
3μm
dis
p.4μ
m d
isp.
5μm
dis
p.
0° 5°
Fig. 3. SEM images and Kernel average misorientation (KAM) maps of beams a and b after deformation. Beams a and b refer to the beams with moment
arms of 12.170.1 and 5:270:1mm, respectively. The EBSD measurement of beam a after 3mm displacement is not shown in this figure because of the
significant amount of drift in that measurement. All the scale bars have 10mm length. The confidence index is 0.1 for all the KAM maps.
E. Demir et al. / J. Mech. Phys. Solids 58 (2010) 1599–1612 1601
2.2. Experimental results
Fig. 3 shows the SEM pictures of the beams after five steps of loading. The indentation of the beam surfaces are observed(maximum contact radius of the indent was 1:6mm on beam b). However, the indentation signs allow repeatablepositioning of the indenter before each loading step. Moreover, the indentation signs reveal sliding of the indenter tip overthe beam surface as the beams rotate after 4 and 3 mm displacements of beams a and b, respectively. Furthermore, grid-likeregular patterns on the top surface of the both beams are observed (SEM images in Fig. 4). The dislocations leaving thecrystal during bending from the top surface of the beams produce the grid-like patterns since the patterns are not parallelto the FIB milling direction.
10 μm 5 μm
beam a - after 4 μm disp. beam b - after 2 μm disp.
5 μm5 μm
indentation mark
Fig. 4. EBSD image quality maps and SEM images at 701 tilt position of beams a and b at approximately the same magnitude of strain. Beams a and b refer
to the beams with moment arms of 12.170.1 and 5:270:1mm, respectively.
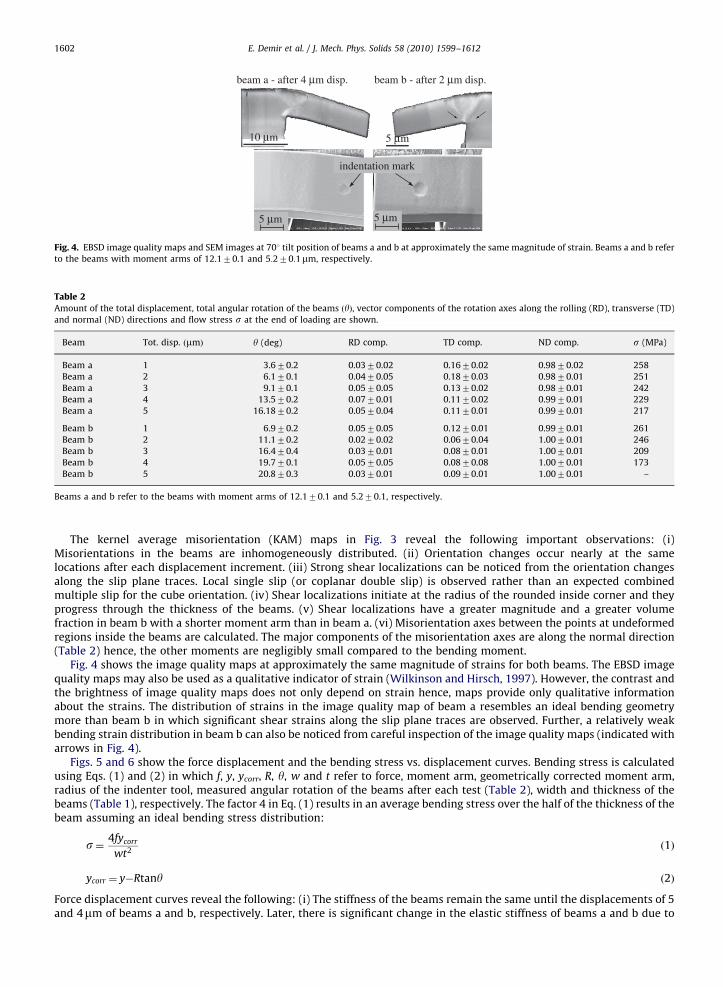
Table 2
Amount of the total displacement, total angular rotation of the beams ðyÞ, vector components of the rotation axes along the rolling (RD), transverse (TD)
and normal (ND) directions and flow stress s at the end of loading are shown.
Beam Tot. disp. ðmmÞ y (deg) RD comp. TD comp. ND comp. s (MPa)
Beam a 1 3.670.2 0.0370.02 0.1670.02 0.9870.02 258
Beam a 2 6.170.1 0.0470.05 0.1870.03 0.9870.01 251
Beam a 3 9.170.1 0.0570.05 0.1370.02 0.9870.01 242
Beam a 4 13.570.2 0.0770.01 0.1170.02 0.9970.01 229
Beam a 5 16.1870.2 0.0570.04 0.1170.01 0.9970.01 217
Beam b 1 6.970.2 0.0570.05 0.1270.01 0.9970.01 261
Beam b 2 11.170.2 0.0270.02 0.0670.04 1.0070.01 246
Beam b 3 16.470.4 0.0370.01 0.0870.01 1.0070.01 209
Beam b 4 19.770.1 0.0570.05 0.0870.08 1.0070.01 173
Beam b 5 20.870.3 0.0370.01 0.0970.01 1.0070.01 –
Beams a and b refer to the beams with moment arms of 12.170.1 and 5.270.1, respectively.
E. Demir et al. / J. Mech. Phys. Solids 58 (2010) 1599–16121602
The kernel average misorientation (KAM) maps in Fig. 3 reveal the following important observations: (i)Misorientations in the beams are inhomogeneously distributed. (ii) Orientation changes occur nearly at the samelocations after each displacement increment. (iii) Strong shear localizations can be noticed from the orientation changesalong the slip plane traces. Local single slip (or coplanar double slip) is observed rather than an expected combinedmultiple slip for the cube orientation. (iv) Shear localizations initiate at the radius of the rounded inside corner and theyprogress through the thickness of the beams. (v) Shear localizations have a greater magnitude and a greater volumefraction in beam b with a shorter moment arm than in beam a. (vi) Misorientation axes between the points at undeformedregions inside the beams are calculated. The major components of the misorientation axes are along the normal direction(Table 2) hence, the other moments are negligibly small compared to the bending moment.
Fig. 4 shows the image quality maps at approximately the same magnitude of strains for both beams. The EBSD imagequality maps may also be used as a qualitative indicator of strain (Wilkinson and Hirsch, 1997). However, the contrast andthe brightness of image quality maps does not only depend on strain hence, maps provide only qualitative informationabout the strains. The distribution of strains in the image quality map of beam a resembles an ideal bending geometrymore than beam b in which significant shear strains along the slip plane traces are observed. Further, a relatively weakbending strain distribution in beam b can also be noticed from careful inspection of the image quality maps (indicated witharrows in Fig. 4).
Figs. 5 and 6 show the force displacement and the bending stress vs. displacement curves. Bending stress is calculatedusing Eqs. (1) and (2) in which f, y, ycorr, R, y, w and t refer to force, moment arm, geometrically corrected moment arm,radius of the indenter tool, measured angular rotation of the beams after each test (Table 2), width and thickness of thebeams (Table 1), respectively. The factor 4 in Eq. (1) results in an average bending stress over the half of the thickness of thebeam assuming an ideal bending stress distribution:
s¼ 4fycorr
wt2ð1Þ
ycorr ¼ y�Rtany ð2Þ
Force displacement curves reveal the following: (i) The stiffness of the beams remain the same until the displacements of 5and 4mm of beams a and b, respectively. Later, there is significant change in the elastic stiffness of beams a and b due to

0 0.2 0.4 0.6 0.8 1.0
0
500
1000
1500
2000
2500
3000
3500
displacement (μm)
forc
e (μ
N)
beam b 0-1μm disp.
beam b 1-2μm disp.
beam b 2-3μm disp.
beam b 3-4μm disp.
beam a 0-1μm disp.
beam a 1-2μm disp.
beam a 2-3μm disp.
beam a 3-4μm disp.
beam a 4-5μm disp.
Fig. 5. Experimental indenter force vs. indenter displacement curves of beams a and b. Beams a and b refer to the beams with moment arms of 12.170.1
and 5:270:1mm, respectively.
0 0.2 0.4 0.6 0.8 1.0
0
50
100
150
200
250
beam a, 0-1 μm disp.
beam a, 2-3 μm disp.
beam a, 3-4 μm disp.
beam a, 4-5 μm disp.
beam b, 0-1 μm disp.
beam b, 1-2 μm disp.
beam b, 2-3 μm disp.
beam b, 3-4 μm disp.
stre
ss (
MPa
)
displacement (μm)
beam
tool
ycorr = y - Rtanθ
θR
θ
d y
beam a, 1-2 μm disp.
Fig. 6. Bending stress vs. displacement curves of the beams at certain displacement intervals. The small sketch at the top right corner illustrates the correction
used for the moment arms. y, ycorr, R and y refer to moment arm, geometrically corrected moment arm, radius of the indenter tip and total measured angular
rotation of the beam (Table 2), respectively. Beams a and b refer to the beams with moment arms of 12.170.1 and 5:270:1mm, respectively.
E. Demir et al. / J. Mech. Phys. Solids 58 (2010) 1599–1612 1603
sliding of the indenter tip over the beam surface. (ii) The constant drifts in the forces between the end of loading and thebeginning of reloading of the same beam are due to a repeatable decrease in the moment arm between each unloading andreloading cycle. (iii) The slopes of the first force displacement curves in the elastic-plastic regime (indicated in red color inFig. 5) are greater than the following displacement increments. (iv) The drops/rises (small bumps) in the loadingcurves may be linked to the dislocations leaving the crystal since these force transients are not present in the linearelastic regime.
Average flow stresses (stresses at the end of loading) are 245713 and 239727 MPa for beams a and b, respectively,excluding the curves that have drastic changes in the elastic stiffness (between 4–5 and 324mm displacement incrementsfor beams a and b, respectively). The stresses at the end of loading are considered as the flow stress in this work. There is
E. Demir et al. / J. Mech. Phys. Solids 58 (2010) 1599–16121604
nearly 19% maximum difference in the elastic stiffness of the remaining beams which is due to the change in the contactpoint after unloading and reloading.
3. Single crystal finite element model
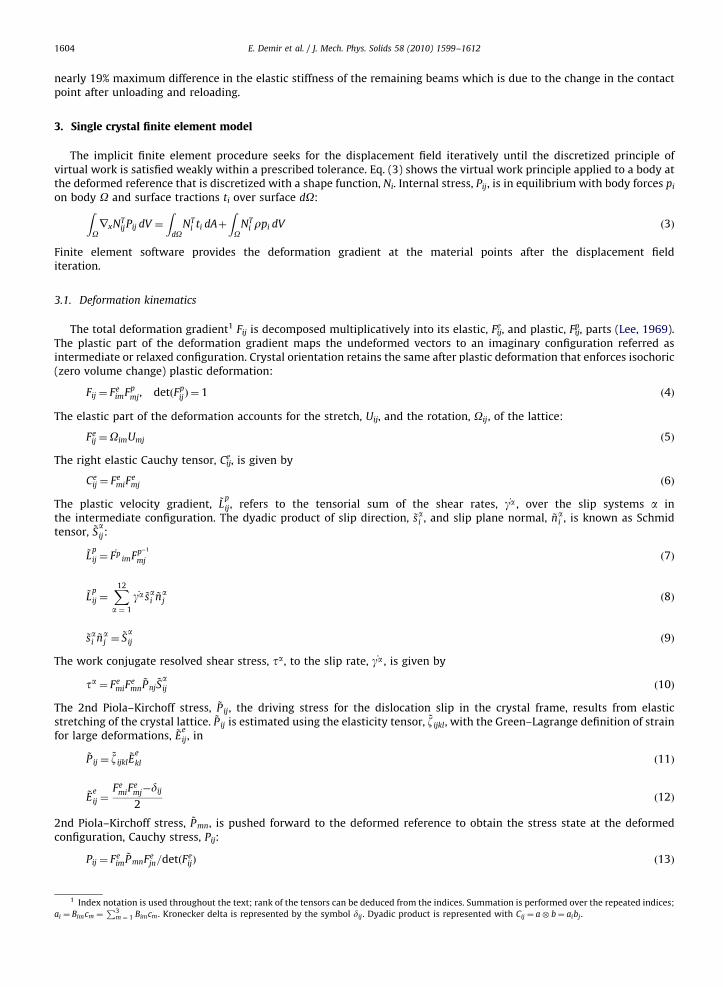
The implicit finite element procedure seeks for the displacement field iteratively until the discretized principle ofvirtual work is satisfied weakly within a prescribed tolerance. Eq. (3) shows the virtual work principle applied to a body atthe deformed reference that is discretized with a shape function, Ni. Internal stress, Pij, is in equilibrium with body forces pi
on body O and surface tractions ti over surface dO:ZOrxNT
ijPij dV ¼
ZdO
NTi ti dAþ
ZO
NTi rpi dV ð3Þ
Finite element software provides the deformation gradient at the material points after the displacement fielditeration.
3.1. Deformation kinematics
The total deformation gradient1 Fij is decomposed multiplicatively into its elastic, Feij, and plastic, Fp
ij, parts (Lee, 1969).The plastic part of the deformation gradient maps the undeformed vectors to an imaginary configuration referred asintermediate or relaxed configuration. Crystal orientation retains the same after plastic deformation that enforces isochoric(zero volume change) plastic deformation:
Fij ¼ FeimFp
mj, detðFpij Þ ¼ 1 ð4Þ
The elastic part of the deformation accounts for the stretch, Uij, and the rotation, Oij, of the lattice:
Feij ¼OimUmj ð5Þ
The right elastic Cauchy tensor, Ceij, is given by
Ceij ¼ Fe
miFemj ð6Þ
The plastic velocity gradient, ~Lp
ij, refers to the tensorial sum of the shear rates, _ga , over the slip systems a inthe intermediate configuration. The dyadic product of slip direction, ~sai , and slip plane normal, ~na
i , is known as Schmidtensor, ~S
aij:
~Lp
ij ¼_Fp
imFp�1
mj ð7Þ
~Lp
ij ¼X12
a ¼ 1
_ga ~sai ~naj ð8Þ
~sai ~naj ¼
~Saij ð9Þ
The work conjugate resolved shear stress, ta, to the slip rate, _ga , is given by
ta ¼ FemiF
emn~Pnj~Saij ð10Þ
The 2nd Piola–Kirchoff stress, ~Pij, the driving stress for the dislocation slip in the crystal frame, results from elasticstretching of the crystal lattice. ~Pij is estimated using the elasticity tensor, ~z ijkl, with the Green–Lagrange definition of strainfor large deformations, ~E
e
ij, in
~Pij ¼~z ijkl
~Ee
kl ð11Þ
~Ee
ij ¼Fe
miFemj�dij
2ð12Þ
2nd Piola–Kirchoff stress, ~Pmn, is pushed forward to the deformed reference to obtain the stress state at the deformedconfiguration, Cauchy stress, Pij:
Pij ¼ Feim~PmnFe
jn=detðFeijÞ ð13Þ
1 Index notation is used throughout the text; rank of the tensors can be deduced from the indices. Summation is performed over the repeated indices;
ai ¼ Bimcm ¼P3
m ¼ 1 Bimcm . Kronecker delta is represented by the symbol dij . Dyadic product is represented with Cij ¼ a� b¼ aibj.

Table 3Slip systems in the undeformed crystal reference for fcc metals.
Slip planes, nci ð1 1 1Þ ð1 1 1Þ ð1 1 1Þ ð1 1 1Þ
Slip directions, sci ½0 1 1� ½1 0 1� ½1 1 0� ½0 1 1� ½1 0 1� ½1 1 0� ½0 1 1� ½1 0 1� ½1 1 0� ½0 1 1� ½1 0 1� ½1 1 0�
E. Demir et al. / J. Mech. Phys. Solids 58 (2010) 1599–1612 1605
3.2. Constitutive laws
Elastic anisotropy for cubic materials is included using the three stiffness parameters, C11, C12, C44, to constructelasticity tensor, zc
ijkl, in the crystal frame:
zcijkl ¼ C12dijdklþC44ðdikdjlþdildjkÞ ð14Þ
þðC11�C12�2C44Þdirdjrdkrdlr ð15Þ
Table 3 shows 12 distinct slip systems for single phase fcc metal in the crystal frame.2 The slip direction, scaj , slip plane
normal, ncaj , and the elasticity tensor, zc
ijkl, are transformed from the crystal frame to the reference (and intermediate)configuration only once at the beginning of the calculations.
The shear rate on slip system a is calculated using a classical power law relation in which _ga0 ,m,tac and ta are referred asthe reference shear rate, slip rate sensitivity parameter, slip resistance (may be referred as slip system hardness, criticalresolved shear strength or threshold shear strength) and the resolved shear stress, respectively.
_ga ¼ _g0
ta
tac
��������1=m
signðtaÞ ð16Þ
The hardening rate at the slip system a is linearly proportional to the absolute amount of the shear rate on any slip system,b. The hardening matrix, hab, includes the latent hardening effect through the latent hardening matrix, Hab. Latenthardening refers to dislocation slip on slip system b causing hardening of slip system a. In Eq. (19), q is the latent hardeningcoefficient (Asaro and Rice, 1977) and A is a 3 by 3 matrix of ones (Kalidindi et al., 1992):
_tac ¼X12
b ¼ 1
habj_gb j ð17Þ
hab ¼Habhb ð18Þ
Hab ¼
A qA qA qA
qA A qA qA
qA qA A qA
qA qA qA A
0BBBB@
1CCCCA ð19Þ
The single slip hardening rate is estimated using three different slip hardening parameters; h0, a and tsatc , that refer to the
reference hardening rate, the hardening exponent and the saturation value for the slip resistance:
hb ¼ h0 1�tbctsat
c
!a
ð20Þ
The two level implicit integration method to solve the above constitutive equations, developed by Maniatty et al. (1992), isrevisited in the Appendix part. The method is implemented in Hypela2, a material user subroutine of MSC-Marc finiteelement software. The material tangent is calculated by the perturbation method as proposed by Kalidindi et al. (1992).
Table 4 shows the values of the numerical parameters used in the simulations from Kalidindi et al. (1992) and elasticconstants from Reid (1973). Bulk single crystal properties in Table 4 are frequently used in literature for well annealed copper.
3.3. Effects of beam geometry and friction
The effect of the taper along beam width, the radius of the rounded inside corner and the friction coefficient on the forcedisplacement behavior of beam a are investigated with eight (23) parameter combinations using a two level factorialanalysis (DeVor et al., 2007). The relative effects of taper, friction and radius on the force displacement response areestimated using the area under the force displacement curves as the output parameter. The values of radius, frictioncoefficient and the taper angle used in the simulations are shown in Table 5. A dry friction coefficient of 0.4 that is greaterthan the common friction coefficient for metal to diamond contact (0.15) and a slip resistance of 16 MPa are used.
2 scaj and nca
j : the superscript c indicate the crystal frame, a represents the slip system and subscript j refer to the jth component of vector.

Table 5The values for taper along the beam width, friction coefficient between the tool and the sample surface and radius of the rounded inside corner used in
the 23 factorial analysis are shown.
Beam Id Radius ðmmÞ Fric. coeff. Taper (deg) f :d ðmNmmÞ f :d
Beam a p1 0 0 0 49 684 0.56
Beam a p2 0.6 0 0 89 681 0.99
Beam a p3 0 0.4 0 49 684 0.55
Beam a p4 0.6 0.4 0 89 681 0.99
Beam a p5 0 0 2 74 369 0.83
Beam a p6 0.6 0 2 89 808 1.00
Beam a p7 0 0.4 2 74 369 0.83
Beam a p8 0.6 0.4 2 89 809 1.00
Standard order of variables is used in the analysis DeVor et al. (2007). The area of the resulting force displacement curves and the normalized magnitudes
are indicated with f.d and f :d , respectively.
beam a
Z
X
Y
X
Y
fixed faces
Fig. 7. The mesh used for beam a with solid brick type of elements and boundary conditions.
Table 4Numerical parameters that are used in the simulations.
_g0 (1/s) m t0c (MPa) C11 (MPa) C12 (MPa) C44 (MPa) h0 (MPa) tsat
c (MPa) a q
0.001 0.012 16/44 168 400 121 400 75 400 180 148 2.25 1.4
Two different slip resistances were used in Section 3.4.
E. Demir et al. / J. Mech. Phys. Solids 58 (2010) 1599–16121606
The normalized magnitudes of main effects (DeVor et al., 2007) for the radius of the rounded inside corner, the frictioncoefficient and the taper angle are 0.15, 0.00 and 0.07, respectively. The friction between the indenter and the beam surfacehas negligible influence on the force displacement curves. The radius has 45% greater effect on the force displacementcurves than the taper. In addition, interaction (DeVor et al., 2007) exists only between the parameters; radius of therounded inside corner and the taper angle. Therefore, the effect of taper on the force displacement curve strongly dependson the magnitude of the radius.
3.4. Simulation results
The actual dimensions of beams and the moment arms (Table 1) are used in the simulations. The models for beam a andbeam b consist of 2528 and 2208 eight node solid brick elements, respectively. The mesh and the boundary conditions forbeam a are shown in Fig. 7. Euler angles before loading (271.41, 3.11, 981) and (88.61, 3.11, 2621) for beam a and beam b,respectively. The coordinate frames (X,Y,Z) of the finite element models of beams a and b are different than that of the EBSDmaps (RD, TD, ND), Fig. 2 hence, crystal orientations of the beams are transformed to their corresponding finite elementreferences. The indenter is modeled as a rigid sphere with 5mm radius. The friction and the taper are ignored in the beammodels.
Fig. 8 shows the force displacement curves during the first displacement increments. The simulated elastic stiffness ofthe beams are approximately 20% greater than the experimentally measured ones. That difference is not due to the angularmisalignment of the indenter axis from ideal (which is not considered in the model) since, 20% change in the elastic

displacement (μm)
forc
e (μ
N)
0 0.2 0.4 0.6 0.8 1.0
0
1000
2000
3000
4000
5000
beam a (exp.)beam b (exp.)
beam a (model, τc0 = 16 MPa)
beam b (model, τc0 = 16 MPa)
beam a (model, τc0 = 44 MPa)
beam b (model, τc0 = 44 MPa)
Fig. 8. The experimentally obtained and simulated (for initial slip resistances, t0c , of 16 and 44 MPa) indenter force vs. indenter displacement curves of
beams a and b. Beams a and b refer to the beams with moment arms of 12.170.1 and 5:270:1mm, respectively.
X
Y
beam b after 2μm disp.
X
Y
0.2300.1840.1380.0920.0460.000
beam a after 4 μm disp.
Fig. 9. Simulated Von Mises equivalent total strains on the side of the beams a and b after test 4 and test 2, respectively. The simulated strain
distributions provide comparison to the EBSD image quality maps shown in Fig. 4. Beams a and b refer to the beams with moment arms of 12.170.1 and
5:270:1mm, respectively.
E. Demir et al. / J. Mech. Phys. Solids 58 (2010) 1599–1612 1607
stiffness corresponds to an unreasonable amount of (36.81) angular misalignment. The top surfaces of the beams have acurved shape due to the fish-eye geomerty of FIB over long milling distances (manufacturing artifact). Therefore, the use ofthe average of external and internal thicknesses (as indicated in Fig. 1) in the model causes overestimation of the thicknessand results in a stiffer than actual model. However, any artificial scaling to correct that difference is avoided.
The experimental magnitude of force at the onset of plasticity is approximately 100–120% greater than the simulatedforces for a slip resistance of 16 MPa. The difference in the flow strength may be related with the initial microstructure(i.e. initial dislocation density). For reliable comparison of simulated and experimental force displacement curves,simulations were repeated for 44 MPa slip resistance since a greater slip system hardness would lead to a more saturatedhardening response.
The simulated slopes of force displacement curves in the plastic flow regime (not exactly equal but proportional to thestrain hardening rates) are approximately 1.6 and 3.3 times higher than the experimentally measured values, respectively,for beams a and b. The simulations overestimate the hardening inside the beams.
Simulations show that beam b undergoes greater strain hardening than beam a. The additional shearing of beam b dueto short moment arm causes greater number of active slip systems in beam b compared to beam a. This leads to greaterinteractions between the slip systems hence, the greater strain hardening of beam b.
Fig. 9 shows the equivalent strain distributions on the side surface of the beams. Both the moment arm and the radius ofthe rounded inside corner effect the resulting strain distributions as in the experiments, Fig. 4. In addition, the deformedregion underneath the indenter interferes with the bent region in beam b.
E. Demir et al. / J. Mech. Phys. Solids 58 (2010) 1599–16121608
4. Discussion
Plane strain bending is accomplished for the dimensions of the cube oriented cantilever beams. Regular dislocationpatterns that are observed along the width of the beams (Fig. 4) indicate the presence of plane strain inside the beams.Indentation of the top surface of the beams is observed for the selected beam dimensions. The maximum contact radius ofthe indent (� 1:6mm on beam b) corresponds to a plastically deformed volume of nearly 8:3mm3 and the correspondingbent volume is approximately 191mm3 (�wt2=2, from Fig. 4). The maximum plastically deformed region underneath theindent constitutes approximately 4.3% of the bent volume. Therefore, the effect of indentation on the force displacement isexpected to be very low and reliable mechanical strength can be measured by cantilever beam bending tests.
Bending is achieved by shearing along the slip directions. The shear stress is the driving force for the dislocation glideand it is maximum at 451 plane with respect to the horizontal axis (TD in Fig. 3). Therefore, slip systems nearest to thatplane are the primary slip systems, Fig. 3.
Shear localizations along the maximum shear stress direction occur as a combined effect of the moment arm and theradius of the rounded inside corner. Shearing along slip plane traces through the thickness of the beams (as observed fromthe misorientation maps) is only possible with the aid of the radius of the rounded inside corner acting as a stress raiser.Moreover, misorientation maps revealed greater fraction of shear localizations for beam b which has a shorter momentarm. Therefore, the radius of the rounded inside corner and the moment arm significantly influence the distribution ofmisorientations (Fig. 3) and strains (Fig. 4). In addition, the repulsive forces between the moving dislocations and theattractive forces from the surfaces (image dislocations) on the mobile dislocations are believed to enhance the formation ofshear localizations.
Cube orientation is stable during microscale bending in contrast to macroscopic tests (Raabe et al., 2004). Orientationchanges occur nearly at the same locations after each displacement increment (Fig. 3) hence, same nucleation sites for thegeneration of dislocations are expected.
The symmetric nature of cube orientation allows in-plane bending with negligible amount of twist. The twistcomponents of the misorientation axis are negligible compared to bending (Table 2). Imperfections regarding theexperiments (i.e. tool alignment) leads to slight twisting of the beams. However, for cube orientation provides sufficientnumber of active slip systems to compensate the changes in the external boundary constraints and internal localdifferences in the slip resistance.
The change in the moment arm, as an external boundary constraint, causes a 2.7% and 6.7% drops in the measured flowstresses in between displacement intervals of beams a and b, respectively. The constant drops might be linked with arepeatable change in the contact point which shows the strong effect of the moment arm on the measured forces.
Average flow stresses (245713 and 239727 MPa, respectively, for beams a and b) are significantly higher than thetensile test results of cube oriented copper (less than 50 MPa at 5% elongation from Takeuchi, 1975). The measured flowstresses are within the range of the literature findings for copper cantilever beams (for 5mm thickness from Motz et al.,2005: 260–281 MPa, and for 4:23mm thickness from Demir et al., 2010: 180–200 MPa). The disagreement between themeasured flow stresses and the literature results may be related to the difference in the sample geometry (i.e. magnitudeof radius) and/or the initial crystal orientation.
The first stress displacement curves of both beams have greater slopes in the elastic–plastic regime compared to thelatter curves, Fig. 6. This may be due to the indentation of the surface during first tests. At later displacement increments,the deformed region underneath the indent gets enough hard and the contact radius of the indents do not change until thesliding of the indenter tip.
The crystal plasticity model captures the essential features of microscale bending. The simulated, (Fig. 9), and measured,(Fig. 4), strain distributions are in qualitative agreement.
The simulated force displacement match well the experiments when the initial slip resistance of 44 MPa is used. This isgreater than the slip resistance of well annealed copper (16 MPa) which may be linked with the initial microstructure.Strain gradients are not measured before bending (Fig. 2) hence, the initial increase in the flow strength might not beassociated with the strain gradients. Moreover, force displacement curves are linear in the elastic regime which indicatesno early transition to plastic flow. Therefore, the initial strengthening may not be associated with the geometricallynecessary dislocations that may possibly stem from early plasticity.
The magnitudes of the slopes of the force displacement curves in the plastic flow regime (will be referred as hardeningrates) in the experiments are significantly lower compared to the simulated slopes. In the simulations common bulk singlecrystal material properties are used and the hardening contribution of the strain gradients is not incorporated to themodel. However, the simulated slope of the force displacement curves are 1.6 and 3.3 times greater, respectively, for beamsa and b, compared to the experiments. This suggests negligible amount of experimentally measured strain gradienthardening for single crystal beams with 5mm thickness. These results contradict with the literature findings (Stolken andEvans, 1998; Motz et al., 2005) since, strain gradient hardening is expected for beams with 5mm thickness. Lattice rotationsare confined to a smaller region in cantilever beam bending than in a uniform bending situation. Moreover, greater straingradients exist in the shear localizations than in a bent lattice. Although a greater strain gradient hardening is expected incantilever beam bending compared to uniform bending, the experimentally measured hardening rates are lower than thesimulated bulk material behavior. Therefore, strain hardening is believed to be controlled by the statistical dislocationreactions in the microscale beams instead of the strain gradients.

E. Demir et al. / J. Mech. Phys. Solids 58 (2010) 1599–1612 1609
The dislocations leaving the crystal (strain softening) may cause softening of the beams. The size of the beams are evensmaller than the substructure sizes that are observed in bulk crystal copper after straining (i.e. dislocation cells haveapproximately 10mm size Kocks and Mecking, 2003). The surfaces in such small dimensions may alter hardening behavior incomparison to bulk material behavior. Active slip systems are always inclined with respect to the horizontal (beam axis) sincethe primary slip systems are the ones that are closest to the maximum shear stress direction. Therefore, dislocations duringmicroscale bending may leave the crystal before they get stored that might cause the lower strain hardening compared to bulkhardening behavior of single crystals. This effect is believed to have a minor role on the hardening behavior of the beams sincethe beams are already bent which gives rise to a demand for the geometrically necessary dislocations.
5. Conclusions
Bending can be used as a reliable testing method to find the mechanical strength of materials at micrometer scale.Several important findings are outlined as follows:
�
the
Bending without twist can be achieved for cube oriented microcantilever beams.
� Bending takes the form of localized shearing as the moment arm gets shorter. The moment arm must be greater thantwo times the size of the thickness to obtain a pure bending state.
� Local stress concentrations, in particular the radius of the rounded inside corner, may alter bending to localizedshearing. The deviation from bending increases as the moment arm gets smaller.
� Indentation signs may be used to set or determine the moment arm with a negligible influence on the mechanics ofwide beams.
� Simulations revealed the negligible influence of the friction between the indenter and the beam surface on thesimulated force displacement curves. In addition, the thickness variation along the width of the beams has 45% lesseffect than the radius of the rounded inside corner.
� Slip resistance of 44 MPa rather than 16 MPa is estimated for single crystal copper by the simulations. The difference islinked with the initial microstructure of the beams.
� The finite element model using conventional crystal plasticity with bulk single crystal properties, resulted in greaterstrain hardening in the simulations than the experiments. The simulations validate the importance of statisticalhardening mechanisms in comparison to the strain gradient based hardening.
� The experimentally observed low strain hardening behavior compared to the simulated bulk material response mayalso be partly related to the leaving of dislocations through the surfaces of the beams (annihilation/strain softening).
Appendix A. Crystal plasticity solution method
Given: Fij; Fijt; Fp
ijt; tc
at .
Find: Fpij ; t
ac .
Following Maniatty et al. (1992), Fpij and tac are determined using a two-level implicit iterative procedure. At the inner
level of iterations, the solution for Fpij is seeked by Newton Raphson method for a fixed value of slip resistance, tac . Once, the
correct value of Fpij is determined, kinematically coupled quantities can be calculated: e.g. Fe
ij, Eij, ~Pij, ta, _ga and ~Lp
ij using the
Eqs. (4), (12), (11), (10), (16) and (8), respectively. The outer level of iterations is to find the correct value for tac .~L
p
ij can also be estimated by Euler backward difference approximation from the differential equation in Eq. (7).
Fpjtt¼ Fp
ij�_FpijDt ð21Þ
Fpimt
Fp�1mj ¼ dij�
_Fpin Fp�1
nj Dt ð22Þ
¼ dij�~L
p
ijDt
~Lp
ij ¼dij�Fp
imtFp�1
mj
Dtð23Þ
In Eq. (21) Fpijt
belongs to the previous time increment3 and Dt is the corresponding time step between thedeformation increments. The residual, cij, is calculated from the difference between the Euler backward differenceapproximation, Eq. (23) and the ~L
p
ij that is estimated from the constitutive relations, Eq. (8). The penalty term withthe penalty factor lp in Eq. (24) enforces zero volume change during plastic deformation. The magnitude of the penalty
3 The variables that belong to the previous time step are indicated with the subscript ’t’ and the remaining variables without any indicator belong to
current time step (t þDt) for simplicity.

E. Demir et al. / J. Mech. Phys. Solids 58 (2010) 1599–16121610
factor, lp, is 1000.
cij ¼X12
a¼1
_ga ~sai ~naj|fflfflfflfflfflfflffl{zfflfflfflfflfflfflffl}
c1ij
�dij�Fp
imtFp�1
mj
Dt|fflfflfflfflfflfflfflfflffl{zfflfflfflfflfflfflfflfflffl}c2
ij
þ lp½detðFpij Þ�1�dij|fflfflfflfflfflfflfflfflfflfflfflfflffl{zfflfflfflfflfflfflfflfflfflfflfflfflffl}c3
ij
ð24Þ
At the inner level of iterations, the correct value of kFpij is calculated using Newton–Raphson (NR) iterative scheme. In
Eqs. (25), (26) and (28) the superscripts k and kþ 1 indicate the estimates at the end of the k and kþ 1 inner level iterationsEq. (25). The increment in the plastic deformation gradient, kDFp
ij , is obtained, Eq. (27) considering only the first term inTaylor expansion of the residual around kFp
ij and setting kþ1cij to zero as Eq. (26).
kþ1cij ¼kcij þ
d½kcij �
d½kFpmn �
kDFpmn ð25Þ
kþ1cij ¼ 0 ð26Þ
kDFpij ¼ �J�1
ijmnkcmn; Jijmn ¼
d½kcij�
d½kFpmn �
ð27Þ
kþ1Fpij ¼
kFpij þ
kDFpij ð28Þ
The differential of the residual, cij, with respect to Fpkl refers to the Jacobian, Jijkl, the tangent used in the NR scheme. A fully
plastic initial guess is used to start iterations, Eq. (29):
0Fpij ¼ Fe�1
imtFmj ð29Þ
d½c1ij�
d½Fpkl�
in Eq. (24) is calculated in order to estimate the Jacobian. Therefore,d½ _ga �d½ta�
is estimated from Eq. (16), as in Eq. (31).
d½c1ij�
d½Fpkl�¼
d½ _ga �d½ta�
d½ta�d½Fp
kl�
~Saij ð30Þ
d½ _ga �d½ta�
¼_g0
tac m
ta
tac
��������1=m�1
ð31Þ
In addition, the derivative of the resolved shear stress with respect to Fpij ,
d½ta�d½Fp
kl�has to be calculated. Hence, ta in Eq. (32) is
expressed in terms of Fpij using Eq. (10) together with the Eqs. (6), (11) and (12)
ta ¼ Fp�1mi CmnFp�1
np~zpjru
~Ee
ru~Saij ð32Þ
~Ee
ru ¼Fp�1
sr CstFp�1tu �dru
2ð33Þ
The partial derivative of the resolved shear stress in Eq. (32) with respect to Fpij becomes4
d½ta�d½Fp
kl�
~Saij ¼
1
2
d½Fp�1mi �
d½Fpkl�
CmnFp�1np þ Fp�1
mi Cmnd½Fp�1
np �
d½Fpkl�
!(~zpjruðC
eru�druÞ
~Saij þ Ce
ip~zpjru
d½Fp�1sr �
d½Fpkl�
CstFp�1tu þ Fp�1
sr Cstd½Fp�1
tu �
d½Fpkl�
!~Saij
)
ð34Þ
d½ta�d½Fp
kl�~Saij ¼
1
2ð�Fp�1
ml Cekp þ Ce
mkFp�1pl Þ
~zpnrsðCers�drsÞ
nþCe
mp~zpnrsðF
p�1rl Ce
ks þ CerkFp�1
sl Þ
o~Samn~Saij ð35Þ
Jacobian, Jijkl, for the NR scheme5 is calculated using Eq. (38).
d½c2ij�
d½Fpkl�¼ �Fp
imtFp�1
mk Fp�1lj =Dt ð36Þ
d½c3ij�
d½Fpkl�¼ dijlpdetðFp
ij ÞFp�Tkl ð37Þ
Jijkl ¼d½c1
ij�
d½Fpkl�þ
d½c2ij�
d½Fpkl�þ
d½c3ij�
d½Fpkl�
ð38Þ
4 FimF�1mj ¼ dij and dFim Fmj
�1 + Fin dFnj�1= 0, hence dFij
�1 = �Fim�1 dFmn Fnj
�1.5
The derivative of the determinant is the adjugate matrixd½detðFij Þ�
d½Fkl �¼ detðFijÞF
�Tkl .

E. Demir et al. / J. Mech. Phys. Solids 58 (2010) 1599–1612 1611
The inner loop converges when kFpkl gives a solution which has a L2-norm of the residual, cij
��� ���, is lower than the tolerance.
Next in the outer loop, the increment of the slip resistance is estimated using the converged values of the shear ratesaccording to Eq. (17). In Eqs. (39) and (40) the superscripts r and r+1 indicate the estimates for the slip resistance at the endof r and r+1 outer level iterations. The outer level iteration continues until the relative change in the slip resistance
ðr _tac Dt=rtac Þ becomes less than the prescribed tolerance. 10�6 is used as the relative tolerance value for both the inner and
the outer loops. The slip resistance at the previous time step, 0tac , is used to start the iterations, Eq. (40).
rþ1tac ¼rtac þ
r _tac Dt ð39Þ
0tac ¼ tact ð40Þ
The numerical algorithm used is as follows:
1.
Calculate the initial guess, 0Fpij , using Eq. (29).2.
Calculate Feij; Eij; ~Pij; ta and _ga by Eqs. (4), (12), (11), (10) and (16), respectively.k k
3. Compute residual, cij, from Eq. (24) and its norm J cijJ.(i) if JkcijJotolerance: converged (go to step 6).(ii) elseif ka1 and JkcijJ4 tolerance and J
kcijJ4Jk�1cijJ: scale back kFp
ij using the scaling factor x. A magnitude of0.75 for x is used in the simulations.
kFpij ¼ xk�1Fp
ij þ ð1�xÞkFp
ij ð41Þ
(iii) else start/continue iterations using the Jacobian in Eq. (27), (go back to step 2).
4. Calculate kþ1Fpij , using Eq. (28).
5. Go back to step 2 (inner loop). 6. Update slip resistivity, rþ1tac with Eq. (39). 7. Go back to step 2 (outer loop). 8. Calculate and store the output variables: misorientations, sum of shear rates, etc.References
Asaro, R.J., Rice, J.R., 1977. Strain localization in ductile single-crystals. Journal of the Mechanics and Physics of Solids 25 (5), 309–338.Ashby, M.F., 1970. Deformation of plastically non-Homogeneous materials. Philosophical Magazine 21 (170), 399.DeVor, R.E., Chang, T.-h., Sutherland, J.W., 2007. Statistical Quality Design and Control: Contemporary Concepts and Methods. Pearson, Prentice Hall,
Upper Saddle River, NJ.Demir, E., Raabe, D., Roters, F., 2010. The mechanical size effect as a mean-field breakdown phenomenon: example of microscale single crystal beam
bending. Acta Materialia 58 (5), 1876–1886.Fleck, N.A., Muller, G.M., Ashby, M.F., Hutchinson, J.W., 1994. Strain gradient plasticity—theory and experiment. Acta Metallurgica Et Materialia 42 (2),
475–487.Gong, J.C., Wilkinson, A.J., 2009. Anisotropy in the plastic flow properties of single-crystal alpha titanium determined from micro-cantilever beams. Acta
Materialia 57 (19), 5693–5705.Greer, J.R., Oliver, W.C., Nix, W.D., 2005. Size dependence of mechanical properties of gold at the micron scale in the absence of strain gradients. Acta
Materialia 53 (6), 1821–1830.Kalidindi, S.R., Bronkhorst, C.A., Anand, L., 1992. Crystallographic texture evolution in bulk deformation processing of fcc metals. Journal of the Mechanics
and Physics of Solids 40 (3), 537–569.Kiener, D., Motz, C., Rester, M., Jenko, M., Dehm, G., 2007. FIB damage of Cu and possible consequences for miniaturized mechanical tests. Materials
Science and Engineering A—Structural Materials Properties Microstructure and Processing 459 (1–2), 262–272.Kocks, U.F., Mecking, H., 2003. Physics and phenomenology of strain hardening: the FCC case. Progress in Materials Science 48 (3), 171–273.Lee, E.H., 1969. Elastic–plastic deformation at finite strains. Transactions of the ASME. Series E, Journal of Applied Mechanics 36 (1), 1–6.Maniatty, A.M., Dawson, P.R., Lee, Y.S., 1992. A time integration algorithm for elastoviscoplastic cubic-crystals applied to modeling polycrystalline
deformation. International Journal for Numerical Methods in Engineering 35 (8), 1565–1588.Motz, C., Schoberl, T., Pippan, R., 2005. Mechanical properties of micro-sized copper bending beams machined by the focused ion beam technique. Acta
Materialia 53 (15), 4269–4279.Nix, W.D., Gao, H.J., 1998. Indentation size effects in crystalline materials: a law for strain gradient plasticity. Journal of the Mechanics and Physics of
Solids 46 (3), 411–425.Nix, W.D., Greer, J.R., Feng, G., Lilleodden, E.T., 2007. Deformation at the nanometer and micrometer length scales: effects of strain gradients and
dislocation starvation. Thin Solid Films 515 (6), 3152–3157.Nye, J.F., 1953. Some geometrical relations in dislocated crystals. Acta Metallurgica 1, 153–162.Raabe, D., Zhao, Z., Roters, F., 2004. Study on the orientational stability of cube-oriented FCC crystals under plane strain by use of a texture component
crystal plasticity finite element method. Scripta Materialia 50 (7), 1085–1090.Reid, C.N., 1973. Deformation Geometry for Materials Scientists. Pergamon Press, Oxford, New York.Shade, P.A., Wheeler, R., Choi, Y.S., Uchic, M.D., Dimiduk, D.M., Fraser, H.L., 2009. A combined experimental and simulation study to examine lateral
constraint effects on microcompression of single-slip oriented single crystals. Acta Materialia 57 (15), 4580–4587.Shi, Z.F., Huang, B., Tan, H., Huang, Y., Zhang, T.Y., Wu, P.D., Hwang, K.C., Gao, H., 2008. Determination of the microscale stress–strain curve and strain
gradient effect from the micro-bend of ultra-thin beams. International Journal of Plasticity 24 (9), 1606–1624.Stolken, J.S., Evans, A.G., 1998. A microbend test method for measuring the plasticity length scale. Acta Materialia 46 (14), 5109–5115.

E. Demir et al. / J. Mech. Phys. Solids 58 (2010) 1599–16121612
Takeuchi, T., 1975. Work-hardening of copper single-crystals with multiple glide orientations. Transactions of the Japan Institute of Metals 16 (10),629–640.
Uchic, M.D., Dimiduk, D.M., Wheeler, R., Shade, P.A., Fraser, H.L., 2006. Application of micro-sample testing to study fundamental aspects of plastic flow.Scripta Materialia 54 (5), 759–764.
Volkert, C.A., Lilleodden, E.T., 2006. Size effects in the deformation of sub-micron Au columns. Philosophical Magazine 86 (33–35), 5567–5579.Wang, H., Hwang, K.C., Huang, Y., Wu, P.D., Liu, B., Ravichandran, G., Han, C.S., Gao, H., 2007. A conventional theory of strain gradient crystal plasticity
based on the Taylor dislocation model. International Journal of Plasticity 23 (9), 1540–1554.Wilkinson, A.J., Hirsch, P.B., 1997. Electron diffraction based techniques in scanning electron microscopy of bulk materials. Micron 28 (4), 279–308.