BEMSIQ CALJAN HULTAFORS GROUP NORD ... - Latour
142
-
Upload
khangminh22 -
Category
Documents
-
view
1 -
download
0
Transcript of BEMSIQ CALJAN HULTAFORS GROUP NORD ... - Latour

BEMSIQCALJANHULTAFORS GROUPNORD-LOCK GROUPSWEGONLATOUR INDUSTRIESLATOUR FUTURE SOLUTIONSALIMAK GROUPASSA ABLOYCTEKFAGERHULTHMS NETWORKSNEDERMANSECURITASSWECOTOMRATROAX


Latour makes long-term investments in sustainable com-panies that have proprietary products and brands, consid-erable growth potential supported by global megatrends, and good prospects for internationalisation. Its operations are primarily carried out in two business lines; a wholly- owned industrial operations and a portfolio of ten listed holdings of which Latour is the principal owner or one of
the principal owners.
A N N U A L R E P O R T 2 0 2 1

Feel good inside. Swegon’s products deliver an indoor climate that is designed to make people feel, think and perform better.
4 L A T O U R A N N U A L R E P O R T 2 0 2 1

ContentsThis is Latour 6Highlights of the year 8Comments from the CEO 10Business development 14Sustainability report 18Net asset value 32The Latour share 34Total return 36
Industrial operations 38
Investment portfolio 68Other holdings 82
Annual Report 2021 84Auditor’s report 126Auditor’s opinion on the sustainability report 130Corporate governance 131Auditor’s opinion on the Corporate Governance Statement 135Board of Directors 136Latour, Group management, Auditors 137Information by quarter 138Ten-year overview 139Shareholder information 140
L A T O U R A N N U A L R E P O R T 2 0 2 1 5

LATOUR’S OPERATIONS are primarily carried out in two busi-ness lines: wholly-owned industrial operations and a portfolio of listed holdings. There are also a handful of other holdings, mainly in Latour Future Solutions. In all holdings, Latour acts as an active principal owner, where the work of the Board is the most important platform for the sustainable creation of value.
IN ALL HOLDINGS, there is a structured approach to the work of the Board, acquisition processes and integration processes. Latour’s interests in several global groups help the companies to develop in line with the adopted international expansion strategy, by enabling the hold-ings to exchange experiences and knowledge.
LEADERSHIP PLAYS A central role in the corporate govern-ance. Leaders at Latour should be culture carriers and role models. They should assume responsibility for per-formance, sustainable value creation and the well-being of the organisation. The leadership style is character-ised by freedom with responsibility and is favourably combined with feedback and transparency.
VISION Latour’s vision is to be a sustainable and attractive choice for long-term invest- ors that want good returns. Latour creates added value in its holdings by being an active and steadfast owner that, with financial strength and solid industrial know- how, contributes to the sus-tainable development of the companies.
BUSINESS CONCEPTLatour’s main business concept is to invest in sus-tainable companies with proprietary products, strong growth potential supported by global megatrends and good future prospects. Its long-term ambition is to create international growth and added value in these holdings by means of active ownership.
CORE VALUES f Long-term perspective
f Businessmanship
f Trust & Accountability
f Development
Governance is characterised by a delegated decision-making structure, with each holding having a unique corporate cul-ture and its own strategic pro-cess. However, Latour’s core values permeate all holdings.
A SUSTAINABLE STRATEGYSustainability is integrated in Latour’s investment strategy. Long-term values are created by developing sustainable operations. Latour has its greatest impact by being an active and responsible owner. Through the work of Boards, Latour places high expecta-tions on and drives the sus-tainable development of the holdings.
INVESTMENT PORTFOLIO
Alimak Group
ASSA ABLOY
CTEK
Fagerhult
HMS Networks
Nederman
Securitas
Sweco
TOMRA
Troax
WHOLLY-OWNED OPERATIONS
Bemsiq
Caljan
Hultafors Group
Nord-Lock Group
Swegon
Latour Industries
OTHER HOLDINGS:
Latour Future Solutions
Part-owned holdings
We believe in active ownershipThis is Latour
Latour makes long-term investments in companies that have proprietary products and brands, considerable growth potential supported by global megatrends, and good prospects for internationalisation.
T H I S I S L A T O U R
6 L A T O U R A N N U A L R E P O R T 2 0 2 1

LOW NET DEBT Latour’s total net debt cap is set at 10 per cent of the investment portfolio’s value and 2.5 times the wholly-owned industrial opera-tions’ EBITDA, measured as an average for the last three years and adjusted for acquisitions and divestitures.
CORPORATE GOVERNANCE WORTH ITS PRICELatour’s shareholders are offered active corporate governance for a management fee of approximately 0.1 per cent of the managed market value.
FINANCIAL TARGETS FOR THE INDUSTRIAL OPERATIONS OVER A BUSINESS CYCLEAverage annual growth >10 per centOperating margin >10 per centReturn on operating capital 15–20 per cent
DIVIDEND POLICYFurther payment of dividend received from the investment portfolio and part-owned holdings 100 per centProfit after tax in wholly-owned companies 40–60 per cent
GROWING INTERNATIONALLY
2016
2021
54%
67%
THE NET ASSET VALUE AND ITS COMPONENTS
Latour’s net asset value is dominated by the investment portfolio and the wholly-owned industrial operations. A description of the method used to calculate the value of the wholly- owned industrial operations can be found on Latour’s website, latour.se.
Since the start in 1985, the Latour share has had a total return of approximately 398,000 per cent. This can be compared with 10,000 per cent for the SIXRX. Latour’s market value was SEK 235.9 billion (127.8 billion the previ-ous year) at the end of 2021.
398,000 PER CENT TOTAL RETURN
All amounts are in SEK billion unless stated otherwise. These figures apply as at 31 December 2021.
CREATING LONG-TERM VALUE
Latour is a long-term investor. The diagram shows that 60 per cent of the total net asset value comes from companies that have been in the portfolio for more than 20 years.
10–20 years
0–5 years
5–10 years
>20 years
LATOUR’S NET VALUE
137.8
LESS NET DEPT, ETC.
8.8
WHOLLY-OWNED OPERATIONS
48.0
INVESTMENT PORTFOLIO
98.4
OTHER HOLDINGS
0.2
>20 yearsSecuritas Hultafors GroupASSA ABLOYFagerhultSwegonNord-Lock Group Sweco
10–20 yearsOxeon NedermanHMS Networks
5–10 yearsTOMRALatour IndustriesTroax
0–5 yearsNeuffer Alimak GroupCaljanLatour Future SolutionsCTEKBemsiq
Latour398,000%
SIXRX10,000%
SEK PER SHARE
216
Latour’s holdings have a solid foundation on which to grow with their own prod-ucts and through international expansion. The wholly-owned operations’ sal- es outside the Nordic region have increased from 54 per cent in 2016 to 67 per cent in 2021.
L A T O U R A N N U A L R E P O R T 2 0 2 1 7
T H I S I S L A T O U R

Strong end for the industrial operations, with good organic growth in both order intake and invoicing. The best fourth quarter to date in absolute terms as regards of earnings.
Bemsiq was recognised as a separate business area from the start of the fourth quarter.
Hultafors Group acquired the Danish company Scangrip A/S and Latour Future Solutions invested in Swedish Hydro Solutions.
In the listed companies,
Securitas entered into an agreement to acquire Stanley Black & Decker Security Solutions, their largest acquisition to date.
Industrial operations deliv-ered record earnings with good organic growth. Significant challenges regarding the supply of goods. Extensive investments in order to meet the high demand.
Initiated the implementation of TCFD (Task Force on Climate- related Financial Disclosures).
Produal, part of Bemsiq, acquired the Finnish company HK Instruments, while Latour Future Solutions made an investment in the Swedish company Aqua Robur Technologies.
Continued positive develop-ment for the industrial opera-tions with strong organic order intake. Challenges regarding the supply chains affected all the companies, although to varying degrees.
Swegon acquired a majority shareholding in the Finnish software company 720° (Seven Twenty degrees). Within Latour Industries, Aritco acquired the Swedish company Motala Hissar and Densiq acquired DEPAC Anstalt, based in Liechten-stein. Bemsiq acquired the Canadian company Greystone Energy System Inc.
In the listed companies, ASSA ABLOY announced its largest acquisition ever, HHI based in North America.
Positive start to the year with good organic growth in both order intake and invoicing. The pandemic had varying effects, with disruptions to logistics affecting all operations negatively.
Continued focus on sustaina-bility and digitalisation. Latour signed up to the UN Global Compact.
The acquisitions of VEGA for Latour Industries and Elsys for Bemsiq were completed. Hultafors Group finalised the acquisition of Fristads, Kansas and Leijona. Densiq, within Latour Industries, acquired the Danish company VM Kompensator.
Strong underlying development and continued high acquisition activity
Highlights of the year
Q4Q2 Q3Q1
8 L A T O U R A N N U A L R E P O R T 2 0 2 1
H I G H L I G H T S O F T H E Y E A R

TARGET ACHIEVEMENT – LATOUR’S FINANCIAL TARGETS
f Net sales increased in total by 24 per cent (9) to SEK 18.3 billion (14.8 billion). f Net sales increased by 14 per cent (2) when adjusted for foreign exchange effects and acquisitions. f Operating profit increased to SEK 2.6 bil-lion (2.1 billion).
f At the end of 2021, Latour’s estimated net asset value reached SEK 216 (153) per share, representing an increase of 43 per cent, adjusted for paid divi-dends.
f The total return on the Latour share for 2021 was 86.8 per cent (31.8), and 368 per cent for the 2017–2021 period.f The Board of Directors proposes a div-idend of SEK 3.30 (3.00) per share for the 2021 financial year.
f The value increased by 44.6 per cent (9.1) when adjusted for portfolio changes and dividends.f Dividends to Latour in spring 2022 are expected to increase by 21 per cent for comparable portfolios, to SEK 1,257 m (1,042 m).
NET ASSET VALUEINVESTMENT PORTFOLIOINDUSTRIAL OPERATIONS TOTAL RETURN
24% 45% SEK 216 87%Total growth of the industrial operations
Increase in value of the investment portfolio
Net asset value per share
Total return on the share
2012 2013 2014 2015 2016 2017 2018 2019 2020 2021
0.50
1.00
0
1.50
2.00
2.50
3.00
1.251.38
1.501.69
2.00
2.25
2.50
3.001.25*
3.30**
* Due to Covid-19, the original proposal of SEK 2.75 per share was reduced to SEK 1.25 per share.** Dividend 2021 is the proposed dividend.
Average annual growth
2021 20182020 20172019Minimum
requirement
Operating margin
Return on operating capital
23.7 19.6
14.6 12.7
16.4 16.1
9.4 18.9
14.3 12.1
14.5 15.1
16.7 >10%
13.4 >10%
17.8 15–20%
EFFECT FOR SHAREHOLDERSDEVELOPMENT OF ORDINARY DIVIDEND, SEK/SHARE
L A T O U R A N N U A L R E P O R T 2 0 2 1 9
H I G H L I G H T S O F T H E Y E A R

W hat word do you feel best sums up 2021 for Latour?
“Pride. Without any doubt. I feel proud of how we have managed all the challenges, how we have been able to grow, and gain market share in differ-ent areas. The year has certainly
offered us the right conditions to perform well and grow, but the way we have done it is impressive. For example, how the organisation has handled the shortage of com-ponents and rising prices. I believe this has been possi-ble because we have a decentralised structure where responsibility and decisions are taken in close interface with customers. I have the privilege of working with an amazing team. They should be extremely proud of what they have achieved.”
Which particular achievement stands out for you?“Picking out one single event from such a busy year
is not easy. One really important development has been the networking that is taking place within our group of companies. We have seen a considerable increase here. When the talented people who work in our fantastic companies start talking to and meeting one another, they help move each other’s position forward. This is true in many areas including recruitment, skills devel- opment, sustainability and digitalisation initiatives. For instance, all companies take part in our Sustaina- bility Day and Digitalisation Day, and we have a CFO day for all CFOs. And let’s not forget the daily dialogues to discuss acquisitions and business.”
Would you like to comment on developments in the wholly-owned industrial operations?
“It was yet another year of strong performance. Bemsiq is a new business area that Latour Industries has
built up and delivered. They can now focus on building a new business area again, but in a completely different industry. Meanwhile, Bemsiq will be able to expand in a market where there is a huge worldwide need for new energy-saving solutions for properties. Its acquisition of the Canadian company Greystone shows where it is heading and what its long-term ambitions are. Organic growth is starting to pick up in Nord-Lock Group, and following structuring of operations, including produc-tion capacity, it stands well prepared for continued growth. Caljan has done the same thing, building up competitive production capacity in key markets to ena-
ble organic growth. And it is growing. At a really swift rate. Its strategy to grow in pace with major key strate- gic customers has proved to be spot on and will enable it to continue to deliver strong growth moving forward. Hultafors Group is also experiencing a high rate of growth, both organically and by acquisition. It has made many important and interesting acquisitions in recent years, but has so far only scratched the surface of the opportunities afforded within its market. The pandemic, which has held the world in its grip for the past two years, has underscored the importance of healthy indoor envi-ronments. In this area, Swegon has the solutions needed and has built up an impressive order book during the year, which it will be fulfilling as it moves ahead.”
“I have the privilege of working with an amazing team. They should be extremely proud of what they have achieved.”
Johan Hjertonsson on the importance of Latour’s employees to its performance in 2021.
“WE ARE BUILDING AN EVEN STRONGER AND BETTER LATOUR”
Johan Hjertonsson, President and CEO:
The people and the culture. These are crucial to Latour’s success. Johan Hjertonsson feels proud of his fantastic team as he looks back on yet another year of record performance.
1 0 L A T O U R A N N U A L R E P O R T 2 0 2 1
C O M M E N T S F R O M T H E C E O

Position: President and CEO
Years at Latour: 12 years, including those as CEO of AB Fagerhult, one of Latour’s ten listed portfolio companies.
Previous experience: CEO of AB Fagerhult and Lammhult Design Group AB. Senior positions within the Electrolux Group.
JOHAN HJERTONSSON
L A T O U R A N N U A L R E P O R T 2 0 2 1 1 1
C O M M E N T S F R O M T H E C E O

From four to six business areas in two years. Is there a limit?
“No, there really isn’t. All the business areas are oper-ated independently and we provide the support needed for them to concentrate fully on their business and con-tinued growth. We have expanded the central business development resources to enable us to assist our opera-tions in all practical aspects of, for example, acquisition analysis and agreement processes. We have had a brisk pace of acquisition activity, with over ten acquisitions. Exactly as it should be.”
Do you have any comments on the performance of the investment portfolio companies?
“I’m very pleased with the way they have handled the disruptions in the supply chain and other challenges. The portfolio is also comprised of companies that con-tinue to improve their position when it comes to sus-tainability. TOMRA, for example, holds a globally lead-ing and increasingly strong position in the recycling market, and Fagerhult is expanding its energy-efficient lighting solutions into more and more areas. And the companies are continuing to make acquisitions. ASSA ABLOY and Securitas signed agreements for their largest ever acquisitions at the end of last year. ASSA wants to consolidate its presence in North America, and Securi-tas wants to advance its position in digital solutions, which is a key area and we believe it is absolutely right for the company. I would like to take this opportunity to extend a warm welcome to Tove Andersen, the new CEO of TOMRA, and also to CTEK, now the tenth company in our portfolio, and to Jon Lind, its CEO.”
CTEK takes you into the field of electrification. What is your vision for this area?
“Naturally, we have been monitoring developments and want to be on board, and CTEK is perfect for that exposure. It is a fantastic company that had built up a world-leading position in the battery charger market even before the electric car boom. This platform will enable continued growth and development of the com-pany in an exciting market. I am delighted that we were able to be an anchor investor for its IPO.”
In respect of digitalisation of operations, how does Latour compare with others?
“Rather well, I would say. It is high on our agenda and, just as with sustainability, we are using our network to address key issues in the area, such as the expansion of our offering, how we can make our own operations more efficient, and of course review every part of the value chain from a digitalisation perspective. It is essential that we maintain a leading edge in this area in order to be able to compete and increase market share. It is also important to continuously assess the risks associated with this. For example, we have invested heavily in improving cyber security within the Group. This is a top priority.”
THREE THINGS ON MY RADAR FOR 2022
END OF THE PANDEMICI travelled quite a bit in the autumn of 2021, when
it was finally possible to do so. We develop best when we meet people and visit businesses in the flesh. We need to resume face-to-face interactions this year.
TALENT MANAGEMENTThere are lots of opportunities for development
and many employees have progressed far. A range of initiatives will allow us to become even better at identifying talents, both new and those that we have in our business today.
ENVIRONMENTAL ISSUESIt goes without saying that we will continue
to reduce our carbon footprint, and we will also become even better at finding new business oppor- tunities in the area.
1 2 L A T O U R A N N U A L R E P O R T 2 0 2 1
C O M M E N T S F R O M T H E C E O

In just a few years, Latour has established itself as a company that takes sustainability seriously. What is the next step?
“Sustainability encompasses so much and I think all companies and employees have embraced it. The issues are discussed in all contexts at board meetings and during business activities and acquisitions. We have made it very clear that we are not interested in owning companies that do not take sustainability seriously, and that we expect progress in this area right across our operations. We acquire companies that are leaders in, for example, recy-cling and circular business models from which other com-panies can learn, or we acquire businesses that can learn from existing companies to enhance their market position and competitive strength. I am constantly seeing new examples of this sharing and exchange process and it is an incredible strength. Future Solutions is also making pro-gress. In 2021, it invested in two companies with leading water management solutions that we can all learn from. We have also signed the UN Global Compact, whereby we commit to operating our business in line with the Ten Principles of labour, human rights, anti-corruption and the environment.”
Latour’s performance is strong and its shareholders are doing very well. What do you think investors appreciate most about what you do?
“The exposure to a broad portfolio of robust busi-nesses that are well positioned to take advantage of long-term and strong trends. Delivering returns to sharehold-ers is, and always has been, important to us. It makes me feel proud that the Board is proposing to increase the dividend by 10 per cent to SEK 3.30 per share for the past financial year. It sends out a strong signal and is important to us.”
What would you say is the best recipe for success?“The people and the culture. We must create a work
climate that makes people feel safe and included, so they can perform to the best of their abilities. Which is exactly what all our fantastic employees did in 2021. A year of record performance for Latour and a continua-tion of our exciting journey that I expect will last for some considerable time.”
Gothenburg, March 2022Johan HjertonssonPresident and CEO
“We have made it very clear that we
are not interested in owning companies
that do not take sustainability
seriously, and that we expect progress
in this area right across our
operations.Johan Hjertonsson on how Latour has stepped up its focus on sustainability.
”
L A T O U R A N N U A L R E P O R T 2 0 2 1 1 3
C O M M E N T S F R O M T H E C E O

Latour's business development team: Johan Menckel, Gustav Samuelsson, Fredrika Ekman,
Fredrik Lycke, Ida Saalman and Niclas Nylund.
1 4 L A T O U R A N N U A L R E P O R T 2 0 2 1
B U S I N E S S D E V E L O P M E N T

Latour’s business is growing, both organically and through new acquisitions. In 2021, the team that will be helping to
create new opportunities doubled from three to six people, with Johan Menckel as manager.
Latour’s business development team
LARGER TEAM SUPPORTS CONTINUED
GROWTH
Y ou joined Latour in September. What attracted you to the company?
“The strong corporate culture and the oppor-tunity to be involved in scaling up a portfolio of exciting companies. Latour is a unique invest-ment company with its mix of wholly-owned and part-owned companies that work in similar ways to identify the right opportunities, what-ever the company. The businesses are sup-
ported by solid industrial expertise that helps them to grow profitably in their niches in a lasting and sustainable way. My extensive international experience and skills as an oper-ations manager fit well into this structure. While at Gränges, I had the privilege of making a number of major and strate-gically important acquisitions in various countries, includ-ing Poland and the USA.”
So you are responsible for a growing business development team?
“That is correct. Latour has expanded greatly in recent years and this team will help create new opportunities and take Latour into the future. Our team now com-prises six people with well-defined roles and specialist areas. Two new team members, apart from myself, have
started during the year. Fredrika Ekman and Niclas Nylund have brought exciting experience with them from McKinsey, Klarna, Ratos, PwC and other companies. There is real strength and energy in the team with everyone working towards the same goal – to create long-term values in our companies.”
What does the trend forecast look like?“We have expanded our horizons when it comes to
companies we want to invest in. Partly because we now have Latour Future Solutions with investments that bring additional dimensions, and partly because we are focusing more on accelerating megatrends such as electrification and hydrogen energy. Digitalisation and sustainability are, of course, two other trends that were brought to the fore by the pandemic. There is a rapid change taking place across the industry. It’s the next phase in the so-called industrial revolution, where smart, connected and energy-efficient manufacturing processes are being implemented in more and more sectors. Industrial software and hardware is a huge future market where our investment portfolio HMS Networks has an exciting position.”
What does work look like otherwise on a daily basis?“We have a constant and ready inflow of potential
acquisitions that need to be assessed and considered. We receive input from the wholly-owned companies, and each person in the team monitors and maintains dialogues with two of the listed companies in order to provide support in the acquisition discussions. Our companies maintain an ongoing dialogue with one another, with our team often acting as a coordinator and helping with the analysis.”
What are the strengths of Latour’s acquisition strategy?“We have specific criteria for the companies that we
want to acquire. If they do not meet the criteria, we do not pursue matters further. A company has to match our strategy and also meet company-specific require-ments regarding proprietary products, sustainability, profitability and, very importantly, strong management.
We focus on segments where we see good opportuni-
Position: Business developmentYears with the Group: 1 yearPrevious experience:
CEO of Gränges for eight years, various positions at Sapa and consultant at Accenture.
JOHAN MENCKEL
L A T O U R A N N U A L R E P O R T 2 0 2 1 1 5
B U S I N E S S D E V E L O P M E N T

ties for long-term growth through add-on acquisitions to existing businesses. Hultafors Group and Bemsiq are excellent examples of this. They both added profitable growth, step by step, through acquisitions.”
Bemsiq is now its own business area and CTEK is new in the investment portfolio. Any comments?
“Bemsiq holds a leading position in Europe and is now taking its next international step with the acquisition of the Canadian company Greystone. We have taken this business operation out of Latour Industries and appointed a board with some external expertise – simi-lar to a listed company.
Latour has long been interested in acquiring CTEK, partly because of its great passion for innovation. We didn’t hesitate when we were given the opportunity to step in as an anchor investor at its IPO in September. We want to be involved in supporting the transition to a sustainable transport sector.”
Which acquisitions made in 2021 do you want to throw the spotlight on?
“It probably has to be the acquisition of Greystone in Canada. The pandemic made it more difficult to com-plete the transaction but we were helped by Swegon’s North American CEO who visited the facility. Other due
diligence was conducted via video communications. In fact, we have established really good digital methods for conducting business, whatever the market situation.
Fristads, Kansas and Leijona is another exciting acqui-sition, which we completed early on in the year and it makes a very strong addition to Hultafors Group. Among other things, it has a smart and sustainable warehouse concept that delivers high productivity. We will be able to learn from this and apply it to other parts of the business. The integration process has also gone very smoothly.”
Future Solutions’ portfolio is growing, what does that mean for Latour?
“It has been operational for just over a year now and we have completed three acquisitions. We have gained important insights into new industries and technolog- ies that offer inspiration and major opportunities. We assist companies with knowledge and capital during the early stages to drive the important environmental change in society.”
Finally, what is the outlook for 2022?“We are starting to see a bit of a delayed effect follow-
ing our many, intense dialogues with companies. One of the things we will be continuing to do is to create values linked to the electrification trend.”
“Our companies maintain an ongoing dialogue with one another, with our team often acting as a coordinator and helping with the analysis.”
Johan Menckel on the everyday Business Development process.
1 6 L A T O U R A N N U A L R E P O R T 2 0 2 1
B U S I N E S S D E V E L O P M E N T

INVESTMENT CRITERIA
MARKET AND TRENDSf Addresses identified trendsf The industry is showing profitable growth
DEVELOPMENT POTENTIALf Next wave of development has begunf Potential for geographic expansionf Sustainable business with high ethical standardsf Latour adds value
BUSINESS AND MARKET POSITIONf Development and manufacture of proprie-tary products under their own brandsf Sustainable products with high added valuef Favourable position in the value chainf Strong management
FINANCIAL PERFORMANCEf Ability to meet Latour's long-term financial targets
Latour sees major growth opportunities for companies specialising in unique products related to the electrification of the transport sector. One such company is CTEK from Dalarna in central Sweden, of which Latour became the principal owner during the year.
C TEK has developed unique low-voltage chargers and built up a wealth of knowledge about battery charging, which has made the company a global leader. A few years ago, CTEK acquired the com-pany Chargestorm in Norrköping, which makes
chargers for electric cars. This enabled CTEK to apply its market-leading knowledge of chargers to electric car charg-ers. CTEK is now actively involved in the transformation of the electric vehicle industry and the development and expan-sion of the charging infrastructure. Its products are sold through global distributors and dealers to more than 50 of the world’s leading vehicle manufacturers, as well as through charge point operators, real estate owners and other organi-sations to provide access to electric charging infrastructure.
LATOUR HAS HAD its eye on CTEK for several years and when the opportunity to invest arose in the spring of 2021, it initi-ated a detailed analysis of the company. As an anchor inves-tor, Latour undertook to purchase 31 per cent of the shares in CTEK for SEK 69 per share, for the total sum of SEK 1,054 million. The acquisition took place on the date of the compa-ny’s listing on Nasdaq Stockholm in September 2021. During the autumn, Latour assumed a seat on the board of CTEK. CTEK has been added to Latour’s portfolio of listed holdings, which now consists of ten holdings with a total value of SEK 98 billion at the end of the year.
Positioned for the electric vehicle boom
Acquisition of unique technology
CTEK’s battery charger expertise has made the company a world leader. Its products are sold to over 50 of the top global automotive manufacturers.
“We saw this as a unique opportunity to create value linked to develop-ments in electric vehicles.”
Fredrik LyckeResponsible for the analysis of CTEK.
L A T O U R A N N U A L R E P O R T 2 0 2 1 1 7
B U S I N E S S D E V E L O P M E N T

The systematic work aimed at strengthening the Group’s sustainability initiatives has accelerated in recent years. One reason for this, and one of Latour’s strengths, is increased collaboration and networking between the companies.
I n October 2021, Latour Sustainability Day was arranged for the second consecutive year. Panel discussions and presentations were interspersed with group discussions about important sustaina-bility areas. Just as the year before, the event was
much appreciated and was attended by participants from virtually all the companies in the Latour Group.
“With this initiative, Latour is signalling that sustainability is a high priority, as well as creating a forum for inspiration and networking between the companies,” says Katarina Rautenberg, Head of Sustainability at Latour.
Latour recognises the value of this collaboration and has established further initiatives to help drive developments by learning from each other. The investment area Latour Future Solutions contributes with knowledge about new industries and drives the development of other companies in the Group when collaborations and projects can be initiated. Another important initiative is the Latour Sustainability Forum. This is a network for people within Latour who are working with sustainability and who meet on a regular basis to exchange thoughts and ideas. In its first year, 2020, the network consisted solely of employees from Latour’s wholly-owned companies,
but due to the high level of interest in participating, it has been expanded in 2021 to also include employ-ees from the Group’s listed holdings.
“Almost all of Latour’s companies are now repre-sented. This provides tremendous strength, bearing in mind how far many of the companies have come in this area, and it is obviously helping to accelerate the development of the Group as a whole,” says Katarina.
During 2021, Latour has signed the UN Global Com-pact and thereby commits to operating the business in line with the Ten Principles of labour, human rights, anti-corruption and the environment. In addition, the UN’s 17 Sustainable Development Goals (SDGs) have been analysed on the basis of which Latour can con-tribute most to as an investment company and active owner. This analysis resulted in seven goals on which Latour will primarily be focusing. Finally, Latour has initiated the implementation of TCFD (Task Force on Climate-related Financial Disclosures).
“This relates to incorporating climate-related finan-cial opportunities and risks in the strategy and risk analysis work. We haven’t identified any urgent and significant risks, but we are seeing many opportunities bearing in mind the fantastic products our companies offer,” concludes Katarina.
The strength of our sustainability work: Learning from each other
SUSTAINABILITY REPORT
1 8 L A T O U R A N N U A L R E P O R T 2 0 2 1
S U S T A I N A B I L I T Y R E P O R T

“Latour has a responsibility when it comes to what investments are made and how active ownership helps to drive sustainable development.”Katarina RautenbergGroup Finance Director
SEVEN SELECTED GLOBAL GOALS TO WHICH LATOUR CAN CONTRIBUTE MOST
Latour has identified seven of the UN’s 17 Sustainable Development Goals (SDGs) where Latour, as an investment company and active owner, is judged to have the great-est positive impact and to whose achievement it is thereby able to contribute. Fourteen people work at Latour’s head office and its hold-ings employ more than 435,000 people worldwide. The head office’s direct impact in the field of sustaina-bility is therefore small compared to that of the holdings. Through active Board work, Latour is a driving force in, and has high expectations regarding, sustainable development in its holdings. The SDGs that Latour has identified are primarily met by the holdings in the portfolio – Latour has a responsibility for what invest-ments are made and how its active ownership will drive sustainable development.
L A T O U R A N N U A L R E P O R T 2 0 2 1 1 9
S U S T A I N A B I L I T Y R E P O R T

Greater focus on the climate
Working in accordance with TCFD’s recommendations
Tackling climate change is becoming an increasingly important issue in society, where companies have a responsibility to contribute both by reducing their own environmental impact and by using their knowledge for the development of climate-friendly customer solutions.
A s an investment company with a large number of operations around the world, Latour has the potential to make a difference. An impor-tant part of this work relates to efficient pro-cesses for managing climate-related risks
and opportunities in the company’s operations. Dur-ing the year, Latour has worked on the recommenda-tions from the Task Force on Climate-relatedFinancial Disclosures (TCFD) with the aim of continuing work-ing on these aspects in a structured and integrated manner.
Risk assessments, including sustainability-related risks and opportunities, are carried out on a regular basis. A comprehensive risk assessment is carried out in the wholly-owned industrial operations every year, which the management teams present to their respec-tive boards of directors. For the listed investment port-folio companies, the primary supervision of sustaina-bility-related risks and opportunities takes place at the board meetings in which Latour participates. An initial TCFD analysis of climate-related risks and opportunities has been carried out in the listed invest-ment portfolio companies and will be further devel-oped through the work of their respective boards.
During the year, Latour has focused primarily on strengthening the wholly-owned industrial operations’
strategic analysis in the climate field, with the aid of external sustainability specialists. Through a number of workshops, all the wholly-owned companies have evalu-ated their climate-related risks and opportunities and the financial impact of these. It has been possi-ble to look in greater depth at var-ious types of climate risks, and their management and financial impact were discussed at the investment portfolio’s annual risk review in June 2021. The climate-related opportunities and risks that the Group identi-fied can be found on page 21.
ONE IMPORTANT TASK for the com-panies over the coming years is to identify suppliers at which climate- related risks could entail significant costs. In some businesses, in-house production operations can also be dis-rupted by extreme weather events in the long term. The location of existing and future production units will therefore be analysed from
2 0 L A T O U R A N N U A L R E P O R T 2 0 2 1
S U S T A I N A B I L I T Y R E P O R T

a physical climate risk perspective. In future, the companies are also expected to make a number of
investments with the aim of accelerating the green transi-
tion. It can be difficult to esti-mate the scope of such invest-
ments, and they can there-fore pose a financial risk. The same applies to future political decisions that may lead to increased costs, such as the pricing of car-bon dioxide emissions. To support the companies and
accelerate this critical tran-sition, Latour has estab-
lished a sustainability fund from which the companies can
apply for investment support. At the listed companies, climate-
related risks are managed in accor- dance with regular risk management
systems and the climate-related oppor- tunities are integrated into the regular inno-
vation and strategy process.
Katarina RautenbergGroup Finance Director
LATOUR’S CLIMATE-RELATED RISKS AND OPPORTUNITIES ACCORDING TO TCFD’S RECOMMENDATIONS
RISKS
Latour’s climate-related financial risks can be found in the investment portfolio
Physical risksf Risks in the supply chain f Risks in own production
Transition risksf Political and regulatory risks f Investments – green transition f Market
OPPORTUNITIES
Latour’s opportunities are largely found within governance as well as in relation to investing in and promoting the transition
f An entrepreneurial culture that promotes transition
f A strong networkf Investment aidf An active ownerf An overall sustainability strategy that is driving change
f Investment strategy with the focus on sustainability
“As an investment company with a large number of
operations around the world, Latour has the potential to
make a difference.”
L A T O U R A N N U A L R E P O R T 2 0 2 1 2 1
S U S T A I N A B I L I T Y R E P O R T

Taxonomy reporting 2021
LATOUR HAS OPTED to make certain simplifications to the report- ing in 2021 in order to take the analysis to a more detailed level in 2022. The industrial operations’ net sales have been analysed in relation to the sectors defined in the taxonomy, and it has been possible to identify the economic activities that, according to the taxonomy, contribute significantly to the green transition. An assessment has been conducted regarding which items should be included in the taxonomy’s definition of Opex and Capex, and the operating costs and investments attributa-ble to taxonomy-eligible net sales have subsequently been identified. Latour has opted to exclude Opex and Capex, which are not related to taxonomy-eligible net sales, even though they
could meet the taxonomy criteria, as not all suppliers have reported the taxonomy compliance of their products to date.
The outcome shows that 23 per cent of Latour’s net sales are defined according to the taxonomy and 77 per cent are neutral. Latour supports the EU taxonomy initiative and its underlying idea. At the same time, it is important to remember that operations that are not included in the sectors defined in the taxonomy should not be equated with unsustainable operations. They are not included in the sectors that the EU considers have the greatest impact in the green transition, but may well be important and sustainable in the sector in which they operate.
RISK MANAGEMENT PAGE
a) Processes for identifying and assessing climate-related risks 20–21, 130–132
b) Processes for managing climate-related risks 130–132
c) Integrating the above processes into the organisation’s overall risk management 20–21, 130–132
INDICATORS AND OBJECTIVES PAGE
a) Indicators for evaluating climate-related risks and opportunities 24, 30
b) Scope 1, 2 and 3 emissions according to the Greenhouse Gas Protocol and related risks 30
c) Targets for management and performance in relation to climate- related risks and opportunities 30
MANAGEMENT PAGE
a) The Board’s monitoring of climate-related risks and opportunities 6, 20–21, 130–132
b) The role of the management in assessing and managing climate-related risks and opportunities 6, 20–21, 130–132
STRATEGY PAGE
a) Identified climate-related risks and opportunities 20–21, 130–132
b) The impact of risks and opportunities on operations, strategy and financial planning 20–21, 130–132
c) The resilience of the strategy with regard to various climate- related scenarios 20–21
TCFD INDEXThe following index shows where Latour provides information about climate-related risks and opportunities according to the recommendations in the TCFD framework.
Net sales
Total (SEK million)
Percentage of taxonomy- eligible activities (%)
Percentage of taxonomy- non-eligible activities (%)
CAPEX
OPEX
18,280
402
1,375
23% 77%
22% 78%
27% 73%
During the year, Latour has carried out an initial analysis of which financial activities in the wholly-owned industrial operations fall within the framework of the EU taxonomy, known as taxonomy-eligible.
S U S T A I N A B I L I T Y R E P O R T
2 2 L A T O U R A N N U A L R E P O R T 2 0 2 1

In the wholly-owned businesses, Latour works as an active owner, stipulating demands and providing support. Sustainability issues have become even more important for the companies in 2021, and a number of activities have been carried out to advance their positions.
A few years ago, the minimum requirements regarding sustainability that apply to all busi-ness areas were expanded. The aim was to make sustainability a recurring item on the agenda at all board meetings, for all companies to conduct
a stakeholder and materiality analysis, as well as to an- chor Latour’s central KPIs and add individual, relevant key ratios and associated goals. This has now been im- plemented. The common, central KPIs are reported to Latour quarterly for compilation and analysis. At the central level, material is also collected every year and reconciliations are made about what the companies have worked on in the field of sustainability. This is in addition to the Board’s responsibility to follow up the work on an ongoing basis during the year.
SUSTAINABILITY IS A key part of the companies’ strategies and risk analyses. The implementation of TCFD during the year has further increased knowledge about sustain-ability and, in particular, the impact of climate change on operations. The recruitment of new resources in the field of sustainability has continued, in order to place even greater focus on the ongoing work and implement
constant improvements. In parallel with this, invest-ments are being made in new system support to further improve the quality of data collection and reporting.
LATOUR SUPPORTS the sustainable development of the holdings in various ways. In addition to various net-working initiatives (read more on page 18), a sustainabil-ity fund has been established to which all wholly-owned companies can apply. The fund relates to investments aimed at achieving one or more sustainability goals and where the requirements as regards the financial returns are not as stringent. The focus is placed instead on sus-tainable benefits. Four investments have been granted during the year, all for the installation of solar cells at factories in countries where the national energy mix consists primarily of coal power.
ALL GROUP-WIDE POLICIES and steering documents are communicated to the managements of the relevant busi-ness areas. Latour’s participation in the business areas’ boards of directors ensures that the companies will draw up their own, more detailed and relevant policies and guidelines, and then work according to these.
Sustainability commitments in the wholly-owned operation
WHOLLY-OWNED OPERATION
THE STATUTORY sustainability report describes the parent company’s and the wholly-owned industrial operations’ work to achieve sus-tainable development, as well as how Latour, as an active owner, works for long-term sus-tainable growth and development. The work is reported from three different perspectives (see illustration). All key performance indica-
tors are a compilation of data from the Group’s six business areas, along with corre-sponding key ratios from the parent company. Latour’s business model for the wholly-owned operations and the portfolio holdings is pre-sented on pages 6–7. The auditor’s opinion on the statutory sustainability report is pre-sented on page 130.
EMPLOYEE PERSPECTIVE
ENVIRONMENTAL PERSPECTIVE
BUSINESS ETHICS PERSPECTIVE
ABOUT THE SUSTAINABILITY REPORT 2021
L A T O U R A N N U A L R E P O R T 2 0 2 1 2 3
S U S T A I N A B I L I T Y R E P O R T

Reduced climate impact in products and production
THE ENVIRONMENT
Sustainability always represents a central part of product development, and our companies are continually striving to develop new products that help to reduce our environmental impact. In addition, continuous environmental improvements are being implemented in the operations.
T here are currently four key targets for lower environmental impact that are presented in the Group’s sustainability report. Furthermore, most of our companies have set additional tar-gets that are relevant for their own operations.
Latour has a central environmental policy that the companies follow, although they have also designed their own policies adapted to their operations. As the owner, Latour supports the companies in their envi-ronmental work and carries out a number of central initiatives, such as joint procurement of electricity produced solely from renewable sources.
LATOUR FOCUSES ON THE ENVIRONMENT continuously throughout the value chain, from product development and purchasing to distribution and end-use. In 2021, the companies have also placed even greater focus on products that satisfy stringent climate demands. This provides considerable long-term benefits in terms of Latour’s environmental impact from both production and products, as well as representing a clear competi- tive advantage. Several companies have conducted life cycle assessments (LCAs) to calculate the products’ total CO2 emissions, providing the opportunity to label the products with an EPD (Environmental Product Declaration) and thereby make it easier for customers
to choose the products that achieve the best environ-mental performance.
AS AN OWNER, LATOUR PLACES HIGH DEMANDS on the holdings to continually reduce their negative environ-mental impact in their own operations. Continued investments are being made in energy-efficient and sustainable in-house production, with several large factory projects having been inaugurated in 2021. The focus is on constant improvements. Investments in in-house production should have a clear focus on sustainability, where factors such as a higher degree of automation and increased use of renewable energy will contribute to both lower energy consumption and reduced greenhouse gas emissions. All processes should be designed in a way that promotes efficient use of energy and resources, and minimises waste and by-products. All companies have agreements with certified waste recycling companies to deal with waste, which ranges from electrical and metal scrap to waste from packaging materials. All operations must measure and monitor waste and hazardous waste, with the aim of reducing spillage and by-prod-ucts. This is not summarised at Latour level, however, and is therefore not presented in the Group’s sustaina-bility reporting.
An annual relative decrease in energy consumption of at least 5 per cent in rela-tion to net sales.
By 2030 at the latest, all operations should only be using renewable energy.
An annual relative decrease in CO
2 of at least
5 per cent in relation to net sales.
By 2025, all production facilities must be environ-mentally certified.
-5%ENERGY CONSUMPTION
ENERGY MIX
CO2 EMISSIONS
ENVIRONMENTALLY CERTIFIED FACILITIES
Four goals for lower environmental impact
S U S T A I N A B I L I T Y R E P O R T
2 4 L A T O U R A N N U A L R E P O R T 2 0 2 1

SWEGON
First, for the sake of the environmentSWEGON IS WORKING TO always be at the forefront when it comes to reducing the environmental impact of its products. In 2021, the company delivered its first Environmental Product Declarations (EPDs) for four product groups: sound attenuators, comfort modules, air diffusers and commissioning boxes. They were also among the first in Europe in the indoor climate products sector.
“We have a competitive offering of compact, energy-efficient products with a low environmental impact. We have not been able to demonstrate this in the past, but with the EPDs we are able to quan- tify the environmental impact based on an interna-tionally recognised standard,” says Mirko Sauvan, Sustainability Manager at Swegon.
An EPD is based on a life cycle assessment for the products and helps customers to compare the envi-ronmental impact of various products. As a result, it enables them to improve their rating in relation to green building certifications such as Miljöbyggnad, BREEAM and LEED. In addition, a manufacturer such as Swegon is able to acquire greater knowledge about its environmental impact.
“These insights enable our product development and R&D departments to make well-founded decisions
when selecting materials, energy sources and production processes. For example, the life cycle assessments demonstrated that the material included in the product, especially steel, had the greatest impact,” says Ingvar Hagström, project manager regarding sustainability at Swegon.
IN THE VENTILATION SECTOR, there are currently no credible environmental figures. It is not enough to describe a product as being sustainable, rather there has to be a foundation for all parts of the process in order for the customer to be able to make the right choices. The fact that Swegon was one of the first com-panies to issue EPDs is due in part to pressure from the sales organisation, which realised that customers would value this. It is also due to the fact that the com-pany has long had a considerable focus on sustainabil-ity within its operations; for example, a high proportion of renewable energy is used in the manufacturing oper-ation in Sweden, and investments are continually being made in new, energy-efficient production technology.
“In future, we anticipate that all manufacturers will have EPDs in place. However, we’re still going to be at the forefront. We are now continuing with the same process for other product groups.”
WHAT IS AN EPD? An EPD (Environmental Product Declaration) is an independently veri-fied document that provides transparent and comparable infor-mation about the envi-ronmental impact of products and services. It is widely used within a number of sectors and on most markets around the world to communi-cate the environmental performance of prod-ucts to customers and other stakeholders.
Swegon is at the forefront when it comes to products that create a better indoor climate for various environments.
Mirko SauvanSustainability Manager, Swegon
“We make it easier for customers to choose
items that are best for the environment.”
L A T O U R A N N U A L R E P O R T 2 0 2 1 2 5
S U S T A I N A B I L I T Y R E P O R T

The Latour Group is growing rapidly, in new regions and new sectors, through both organic growth and acquisitions. Developing and looking after employees is crucial in order for Latour to continue to grow profitably in the long term.
T he wholly-owned industrial operations employ almost 8,000 people worldwide. As a long-term owner, Latour aims to utilise and develop the skills that exist in the operations, including through the transfer of knowledge and the ex-
change of experiences. As a result, the entire Group is viewed as an internal labour market, and mobility is deemed a natural part of the development of the indi-vidual and the company. As Latour grows and the busi-ness becomes increasingly international, the network for employees is also being broadened and deepened at all levels. Investments are made in skills-building initi-atives such as the Latour Executive Programme, which is a tailored leadership course run in collaboration with the Gothenburg School of Business, Economics and Law, with participants from both wholly-owned companies and listed investment portfolio companies.
ALL THE BUSINESS AREAS conduct ongoing employee sur-veys and follow up the outcomes with various activities and measures. A pleasant, healthy and safe working environment is a priority in all businesses. Latour has a vision of zero accidents at work. Preventive actions, including consequence analyses, safety inspections and risk reports, are conducted on a continual basis. In addition, the reporting of both incidents and work-
place accidents have been central KPIs since 2020, with the goal of preventing accidents. The number of reported incidents and workplace accidents has in- creased sharply since then, which is considered to be a result of having worked hard on the corporate culture and the importance of high transparency, rather than more accidents actually occurring. If employees are confident when it comes to reporting incidents, future accidents can be prevented in the long run.
ACTIVELY STRIVING to have a variety of experiences and backgrounds promotes a stimulating and equal work-place, and is prioritised within the Group. Each busi-ness area has an equal opportunities and diversity pol-icy that is carefully complied with. The focus is on increasing diversity among employees and striving to achieve diversification during recruitment. Initiatives are also being implemented to balance age and gender in various working groups. Latour collaborates with various organisations to promote inclusion and diver-sity, which has led to new recruitment and participa-tion in mentoring programmes. The companies have points of contact with universities and colleges all over the world. This includes research collaborations, internships, summer jobs and opportunities to write dissertations.
Commitment and talent building Latour’s success
EMPLOYEES
A gender ratio of 40–60 will be achieved by 2030. We measure the Board of Direct- ors, senior executives and salary-setting managers.
Latour has a vision of zero accidents at work. This key ratio measures workplace accidents that have led to at least one day’s sick leave.
Report everything and work proactively. It is important to pick up on incidents to prevent future accidents from occurring.
GENDER RATIO
WORKPLACE ACCIDENTS
WORKPLACE INCIDENTS
Three goals for safe and inclusive workplaces
S U S T A I N A B I L I T Y R E P O R T
2 6 L A T O U R A N N U A L R E P O R T 2 0 2 1

CALJAN
Safety is everythingCALJAN HAS UNDERGONE a dramatic expansion in recent years in terms of sales and customers, but also in relation to the number of employees and its own manufacturing. The most comprehensive investment has been carried out in the small town of Liepāja in Latvia. Five small units have been replaced by one new, modern plant with twice the production capacity and upgraded technology and equip-ment, resulting in a significant improvement in productivity.
“As safety is the top priority for Caljan, we have stipulated very high demands regarding a safe working environment in the new facility right from the outset. We have also estab-lished an organisation that handles the day-to-day work on safety issues,” says Alex Christensen, Group QHSE Manager at Caljan.
PRODUCTION BEGAN in the 13,500 m2 facility at the end of 2020. Strong demand for telescopic conveyor belts, in combination with successful partnerships with major play-ers in the field of e-commerce, soon resulted in significant pressure on production.
“We introduced two shifts and recruited a large number of people in 2021. This has not been entirely easy in a pandemic, but we succeeded as a result of being such a large and well-known employer in the region,” says Rigmor
Ellemann Bartels, Group Human Resource Manager at Caljan.Everyone who works in the manufacturing operation
receives sound safety training, and all the elements are carefully adapted to minimise the risk of accidents. How- ever, the most important thing is to create a strong aware-ness of never leaving anything to chance, Rigmor believes.
“We have invested in activities and exercises that create a greater understanding of what is the right behaviour in various situations. We refer to this as our Strategic Safety Campaign, and it has been greatly appreciated. We have also introduced a reporting system that has made a clear difference.”
The new system means that the companies’ employees can now submit a report when there is a risk of an inci- dent, and not just when something has occurred. In this way, it has been possible to implement measures and eliminate dangerous operations before they have led to an accident.
“This has brought us closer to our vision of zero workplace accidents,” emphasises Alex. “We always focus on safety, and it will obviously permeate the new facilities in the USA and Germany as well. We now have dedicated safety speci- alists within the Group who are ensuring that we learn from each other and become even better.”
Bus moluptateces etu-sapide voluptatis quodi
desecte scidem ani-molorest, odit.
Caljan is a large and much-appreciated employer in the Latvian city of Liepāja. In addition to offering a modern and safe workplace, the company invests in health and wellness facilities.
“Safety and a good working environment are the top priority.
Alex Christensen, Group QHSE Manager, Caljan
”
L A T O U R A N N U A L R E P O R T 2 0 2 1 2 7
S U S T A I N A B I L I T Y R E P O R T

BUSINESS ETHICS
Latour works with a decentralised decision-making model within the Group. This is accompanied by responsibility among managers around the Group to develop their respective operations and meet established goals and guidelines.
L atour’s role as an active and responsible owner is a prerequisite for creating added value in the holdings. The delegated decision-making struc-ture is firmly anchored in corporate governance and means that leadership is an integral part of
our corporate governance. There are clear require-ments for how leaders within the Latour Group should act and behave, in order for this subsequently to be passed on within their respective organisations.
Latour’s Code of Conduct emphasises the principles that govern the relationship with its employees, busi-ness partners and other stakeholders. The Code is approved by Latour’s Board and applies to all employ-ees in the Group. It constitutes a minimum require-ment for the holdings, and most have developed their own guidelines, policies and objectives based on Latour’s Code of Conduct, although more relevant to their own operations.
AS THE GLOBAL presence increases, the companies face problems associated with corruption, which can be more prevalent in certain regions of the world. In addition to the Code of Conduct, Latour has a central anti-corruption and anti-bribery policy that sets the framework for responsible work on these issues. An
important aspect is Latour’s standpoint that employ-ees should not engage in any business transaction where the grounds are dubious. All the holdings com-ply with this policy, as well as with local laws and regu-lations. In order to ensure a high level of knowledge and compliance with the Code of Conduct, policies and principles, Latour demands that all management team members as well as employees with purchasing or sales positions must carry out online training on the topic every two years. This training was carried out in 2021, and the majority of the operations have included more employees in the training than is required according to Latour’s minimum require-ments, underlining the importance of compliance.
LATOUR SUPPORTS AND RESPECTS the protection of human rights and guarantees, through internal pro-cesses and steering documents, that it is not involved in crimes against human rights. Suppliers, distributors, consultants and other business partners must apply the principles of Latour’s Code of Conduct.
Latour’s whistleblowing support system, WhistleB, provides employees with the opportunity to report sus-pected irregularities within the business anonymously and has been implemented in all business areas.
Decentralised decisions provide strong local responsibility
All operations must imple-ment Latour’s Code of Conduct, or develop their own code of conduct internally.
There were a total of three instances of whistleblowing in 2021, of which one was HR-related and two involved violations or suspected violations of the Code of Conduct. All have been dealt with and have either been completed or are under investigation.
The focus on taking responsibility in the supply chain has increased further during the year. All the business areas are work-ing to encourage all relevant suppliers to sign the companies’ Code of Conduct. The same applies to distributors and agents.
CODE OF CONDUCT
WHISTLEBLOWING 2021
SUPPLIER CODE OF CONDUCT
Maintaining a high level of business ethics
S U S T A I N A B I L I T Y R E P O R T
2 8 L A T O U R A N N U A L R E P O R T 2 0 2 1

SNICKERS WORKWEAR
Strong partnerships deliver
Strong, long-lasting relationships with suppliers contribute to Snickers Workwear’s high quality.
SNICKERS WORKWEAR SOLD more than 4.8 million prod-ucts in 2021. The products can include up to 30 com-ponents, such as fabric, buttons, thread and other details, making the workwear some of the most dura-ble and highly appreciated among professional users right across Europe. This position is a result of strate-gic work, including with the supplier base.
“We have always been highly selective about which suppliers and production countries we work with. This includes a close and constructive dialogue in order to meet all of our and our customers’ needs,” says Ulrika Lindgren, Supply Chain Director at Snickers Workwear.
OUT OF THE SUPPLIER BASE, ten operations account for some 80 per cent of the value of Snickers’ garment production. Most of these are located in Vietnam and China. To take care of the ongoing management work, local purchasing teams are situated close to the sup-plier base. Both these teams and most of the suppli-ers have been working with Snickers for decades. This has provided a solid foundation during the chal-lenging pandemic, and contributed to Snickers’ sales managing to increase by 16 per cent in 2021.
“However, we had to come up with new ways of get-
ting everything to work. At the same time as being able to keep our promises regarding fixed volumes with our producers, we have moved production around depending on which materials we were re- ceiving at the time and which region was open. This was possible since our largest garment manu- facturers are able to sew most of our models, based on the detailed technical descriptions we provide to them,” says Ulrika.
TRANSPARENCY AND CONTINUOUS monitoring are key concepts in the work of suppliers. Snickers stipulates high demands regarding quality, the working environ-ment, chemicals management and, increasingly, the climate impact of operations.
“We have set ambitious climate targets, in line with the Paris Agreement’s goal of limiting global warming to a maximum of 1.5 degrees. Since almost 99 per cent of our greenhouse gas emissions come from the sup-ply chain, we have a great deal of work ahead of us. However, our strong relationships with suppliers who are prepared to ‘go the extra mile’ provide us with the conditions to succeed in this respect as well,” says Maria Schartau, CSR Coordinator at Snickers.
THE STRENGTHS OF SNICKERS’ SUPPLIER WORK f Centralised ordering that provides fabric suppliers better pro-duction efficiency.
f Local teams in Asia working closely with the suppliers.
f Fixed volumes, which facilitates long-term planning.
f Potential to move pro-duction between gar-ment manufacturers, as they can sew most of the models.
f Audits of both gar-ment manufacturers and material suppli-ers, responsibility for several stages of the supply chain.
“We and our suppliers stand up for each other.”Maria SchartauCSR Coordinator, Snickers Workwear
L A T O U R A N N U A L R E P O R T 2 0 2 1 2 9
S U S T A I N A B I L I T Y R E P O R T

Target: To achieve a gender ratio of 40–60% by 2030
ENERGY MIX:Share of renewable energy out of total energy consumption
Target: 5% relative annual decrease.Comment: The results are not fully comparable due to the change in scope as from 2021. The adjusted change results in a decrease of approximately –7 per cent.
ENERGY CONSUMPTION:Consumed MWh in relation to net sales (SEK m)
202120200
2.0
6.0
4.0
8.06.6
6.1
MWh/SEKm –6.9%
Performance in 2021 Central key ratios
202120200
20
80
60
100
40
%
Sweden Other countries
8376
10 12
GENDER RATIOS ON THREE LEVELS
CODE OF CONDUCT
Proportion of women and men respectively (%)
Target: 100% implemented in the Group
All business areas have implemented the Code of Conduct in their operations. Work is under way to further ensure that all employees study it.
Salary setting managers
23% (20%) 77% (80%)
Senior executives
15% (13%) 85% (87%)
Board members in Latour’s Board of Directors
33% (25%) 67% (75%)
Board members in industrial operations
17% (13%) 83% (87%)
Target: 100% by 2030.Comment: Due to a stricter definition of when an energy source may be reported as renewable, the share in Sweden is decreasing in 2021 compared to previous years.
CARBON DIOXIDE EMISSIONS:In absolute terms (tonnes of CO2)
CARBON DIOXIDE EMISSIONS:Tonnes of carbon dioxide in relation to sales (SEK m)
2021: 1.4 tonnes/SEK m2020: 1.5 tonnes/SEK m
Target: 5% relative annual decrease.Comment: The reduction is the result of several projects and investments aimed at reducing our CO
2 footprint.
2021: 24,688 tonnes2020: 21,828 tonnes
It does not take into account our relative size, but is presented for the sake of transparency.
INCIDENTS IN OUR OPERATIONSIndex per 1,000 employees
Target: Zero visionComment: The increase is a result of having worked hard to improve procedures and processes for reporting incidents, as preventive health and safety management.
ACCIDENTS IN OUR OPERATIONSIndex per 1,000 employees
Target: Zero visionComment: The increase is a result of having worked hard to improve procedures and processes for reporting occupational accidents.
ENVIRONMENTALLY CERTIFIED FACILITIESProduction facilities that are ISO 14001 certified
Target: 100% by 2025.Comment: 13 facilities have been added during the year, but only four are environmentally certified. Several certification processes are in progress.
2021: 176 per 1,0002020: 120 per 1,000
2021: 21 per 1,0002020: 17 per 1,000
(21/53)
–8.4%
25/66
As sustainability work is developed, higher demands are placed on the way companies measure their key ratios. For example, the scope of what is included in energy consumption has been expanded, with the result that the key ratio for 2020 has been recalculated to achieve comparability between the years.
S U S T A I N A B I L I T Y R E P O R T
3 0 L A T O U R A N N U A L R E P O R T 2 0 2 1

THE ENVIRONMENTAL TECHNOLOGY COMPANY NEDERMAN is driving the global development of sustainable solutions for indus-trial air purification. The entire operation is based on a pro- mise to protect people, the environment and production, at the same time as contributing to more efficient and profitable production processes. As a market leader, the company is also involved in educating the market about the importance of clean air in industrial environments. The debate is being driven, for example, through in-house events such as the well-attended Green Awakening con- ference in Stockholm in November. Read more about the event at nedermanfuturedays.com.
Nederman A driving force behind better air within industry
Sustainability commitments in the portfolio of listed companies
INVESTMENT PORTFOLIO
Latour has invested in, and is the principal owner of, ten listed companies. The companies have international operations, have a combined turnover of SEK 260 billion and have more than 425,000 employees.
T he companies hold leading positions in their respective fields, as well as having clear agendas to contribute to a better and more sustainable world.
The listed companies have their own organisations that conduct their sus-tainability commitments. As the principal owner, Latour is involved in conducting this development by placing demands on the companies through their boards of directors, on which Latour is always represented. In close cooperation with the group manage-ment, goals are established and strategies are implemented that also include sustaina-bility commitments. There is a clear focus on ensuring that the work being carried out will create value for all
stakeholders, which in turn will lead to a better position for the company. Latour monitors and analyses all listed holdings on an ongoing basis, which also includes their sustainability commitments. At owner-ship level, three-year plans are drawn up for each holding, which Latour’s Board of Directors studies and discusses as a standing item on the agenda at its board meetings. These plans are also included in the annual risk analysis that the Board of Directors studies and discusses. The companies’ com-pliance with Latour’s sustainability require-ments is monitored through reporting to the
Board of Directors and through the companies’ sustaina-bility reports.
OUR TEN COMPANIES
f 5 reports in line with GRI
f 8 (5) have signed the UN Global Com-pact
f 10 (9) have defined how they contrib-ute to the UN’s global goals
f 4 (2) are affiliated to the SBTi
Nederman is placing considerable emphasis on strengthening the debate about the importance of clean air in industrial environments, for example through the Green Awakening event.
L A T O U R A N N U A L R E P O R T 2 0 2 1 3 1
S U S T A I N A B I L I T Y R E P O R T

Continued increase in Latour’s net asset value
THE NET ASSET VALUE increased from SEK 153 to SEK 216 per share in 2021, which is an increase in value of 43.4 per cent, adjusted for paid dividends. This can be compared with an increase of 39.3 per cent for Nasdaq OMX Stockholm (SIXRX).
LATOUR PRIMARILY CONSISTS of two parts: the investment portfolio and the wholly-owned industrial operations. The market value of the listed holdings is simple to calculate, since clearly stated market prices are available. Determining the value of the wholly-owned operations is more difficult. This is because the market value, the price that potential buyers are willing to pay for the operations, is not as clearly defined. In order to facilitate the evaluation of the net asset value, Latour provides an estimated range for the value (Enterprise Value) of each business area based on EBIT multiples (see the table at the bottom of page 33). In some cases, the valuation multiples for comparable companies span a very large range. For this reason the used multiples may be adjusted in order to avoid unreasonable values. The method used to calculate the value of the wholly-owned industrial operations is described in greater detail on the company’s website, latour.se
LATOUR’S GUIDELINE for the net asset value has, for some time, been considerably lower than the value that the stock market has set for Latour’s listed share. The share price was SEK 369 at 31 December 2021, compared with the indicated net asset value of SEK 216. As previously stated, Latour does not claim that the valuation of the wholly-owned industrial operations is anything other than a cautious indication. A net asset value can also be calculated from a number of starting points. For example, the industrial operations as a whole could be meas-ured against other established listed industrial groups with mixed industrial holdings and a clear growth agenda, where the EV/EBIT multiple is currently significantly higher. Depending on the measurement model and the selected comparison group, the net asset premium may consequently vary, and it would be lower with the given example.
LATOUR’S LARGEST HOLDINGS at the end of the year, based on net asset value, were ASSA ABLOY, TOMRA, Sweco, Hultafors Group and Swegon. The wholly-owned industrial operations now make up approximately 35 per cent of the Group’s total net asset value, compared to 27 per cent five years ago. This is a result of an extremely good profitability trend in combi-nation with completed investments and acquisitions.
Net asset value
The diagram shows the net asset discount/premium on the last day of trading of every quarter. The trend is that the previous discount has become a valuation premium.
NET ASSET DISCOUNT/PREMIUM RELATIVE TO LISTED PRICE
20132011 2014 2015 2016 2017 2018 20200
50
100
150
400
250
200
−40
−80
–20
0
40
20
−60
2012 2019
350
300
20212010
Listed price No asset discount/premium Trend net asset discount/premium
SEK/share Net asset discount/premium, %
NET ASSET VALUE IN RELATION TO NET DEBT
2006 2007
2008 2002
2003 2004
2005 2009
20102011
2012 2013
2014 2015
2016 2018
2019 2017
0
20202021
Mkr
Substansvärde
10 000
−10 000
30 000
70 000
50 000
Nettoskuld
90 000
110 000
130 000
150 000
3 2 L A T O U R A N N U A L R E P O R T 2 0 2 1
N E T A S S E T V A L U E

137.8SEK billion
ASSA ABLOY 21% (22%) further information on page 73
ALIMAK GROUP 1% (2%) further information on page 72
HULTAFORS GROUP10% (8%)
further information on page 50
NORD-LOCK GROUP 5% (6%)further information on page 54
OTHER HOLDINGS 0% (0%)further information on page 82
LATOUR INDUSTRIES 3% (5%)further information on page 62
SWEGON 9% (13%)further information on page 58
This diagram shows each holding’s
share of Latour’s total net assets value. Investment portfolio holdings. Total: 72% (70%)
Wholly-owned holdings. Total: 34% (35%)
Other holdings. Total: 0% (0%)
In addition to the assets presented above the net loan debt is –5%.
CALJAN 4% (4%)further information on page 46
BEMSIQ 3% (0%)further information on page 42
TOMRA 15% (13%)further information on page 80
TROAX 6% (5%)further information on page 81
NEDERMAN 2% (2%)further information on page 77
HMS NETWORKS 5% (3%) further information on page 76
SECURITAS 4% (5%)further information on page 78
SWECO 12% (15%)further information on page 79
FAGERHULT 4% (4%) further information on page 75
CTEK 2% (0%)further information on page 74
NET ASSET VALUE AT 31 DECEMBER 2021
SEK m Netsales 1) EBIT 1)
EBIT multiple or EV/sales
multiple Range
Valuation SEK m 2)
RangeValution 2)
Aveage
Valuation SEK/share 3)
Range
Bemsiq 1,095 211 18–22 3,981–4,865 4,423 6–8
Caljan 1,527 276 20–24 5,520–6,624 6,072 9–10
Hultafors Group 5,993 906 13–17 11,778–15,402 13,590 18–24
Latour Industries 3,229 263 16–20 4,208–5,260 4,734 6–8
Nord-Lock Group 1,439 637 15–19 5,505–6,973 6,239 9–11
Swegon 5,828 717 16–20 11,472–14,340 12,906 18–22
19,111 2,750 42,464–53,464 66–84
Valuation of industrial operations, average 47,964 75
Listed shares (see table on page 63) 98,438 154
Latour Future Solutions 68 0
Unlisted partly-owned holdings 4) 163 0
Other items –345 0
Net debt –8,443 –13
Estimated value 137,845 216
(132,345–143,346) (207–224)
1) Trailing 12 months for current company structure (pro forma). Where appropriate, EBIT is reported before restructuring costs. 2) EBIT and EV/SALES restated based on the listed share price at 31 December 2021 for comparable companies in each business area. 3) Calculated on the number of outstanding shares. 4) Valued according to book value.
L A T O U R A N N U A L R E P O R T 2 0 2 1 3 3
N E T A S S E T V A L U E

Continued strong price increase and even more shareholders
Latour’s share is listed on the Nasdaq OMX Stockholm Large Cap list, which includes companies with a market value in excess of EUR 1 billion.
THE EFFECTS OF the Covid-19 pandemic resulted in significant stock market movements in 2020, although the year ended positively. This trend was further strengthened in 2021. The price of Latour’s shares also continued to rise. The share price rose by 84.6 per cent for the year as a whole, compared to OMXSPI (Nasdaq OMX Stockholm) which rose by 35.0 per cent. In the last year, the highest price the stock achieved was SEK 373.40 on 30 December and the lowest was SEK 186.20 on 28 January. The final price paid on 30 Decem-ber was SEK 368.70.
In 2021, the total return (share development in- cluding reinvested dividends) for Latour’s class B share was 86.8 per cent, compared to SIXRX which increased by 39.3 per cent in the same period.
MARKET VALUE At the end of the year, Latour’s total market value, calculated on the number of issued shares, amounted to SEK 235.9 billion. This makes Latour the 14th largest of the 367 companies listed on the Nasdaq OMX Stockholm market.
SALES Latour shares were traded for a value of just over SEK 24.0 billion during the year. This is a decrease of SEK 4.7 billion compared to 2020.
SHARE CAPITAL At 31 December 2021, the com- pany’s share capital was unchanged and amounted to SEK 133,300,000. Class A shares totalled 47,629,848 and class B shares totalled 592,210,152, of which 517,200 were repur-chased shares. The number of voting rights was 1,068,508,632.
SHAREHOLDERS The number of shareholders increased in 2021 from 90,819 to 111,811. At the end of the year, holdings of foreign investors amounted to 5.8 per cent (6.3).
DIVIDEND The Board of Directors proposes a dividend payout of SEK 3.30 (3.00) per share for the 2021 financial year. The dividend yield is 0.9 per cent based on the final share price at the end of the year.
ANALYSTS The following analysts were following Latour at the end of 2021: f Derek Laliberte, ABG Sundal Collierf Johan Sjöberg, Danske Bank Marketsf Joachim Gunell, DNB f Rasmus Engberg, Handelsbanken f Herman Wartoft, Pareto Securities
SHAREHOLDER FACTS
f The number of shareholders increased to 111,811 (90,819). f 76.0 per cent of the capital is owned by the principal shareholder family and companies.f Other Board members own 0.4 per cent of the capital.f Foreign ownership accounts for 5.8 per cent.
368%TOTAL RETURN
The last five years (cf. SIXRX 126%)
The Latour share
IR CONTACTIf you have any questions you are welcome to contact:
Anders Mörck, CFO:
tel: +46 31 89 17 90 or
email: [email protected]
3 4 L A T O U R A N N U A L R E P O R T 2 0 2 1
T H E L A T O U R S H A R E

TYPE OF SHARENumber of shares % Number of voting rights %
Class A (10 voting rights) 47,629,848 7.4 476,298,480 44.6
Class B (1 voting right) 592,210,152 92.6 592,210,152 55.4
Total number of shares 639,840,000 100.0 1,068,508,632 1) 100.0
1) Including 517,200 repurchased non-voting class B shares.
DISTRIBUTION OF SHAREHOLDING
Distribution of shareholders in size categories.
LATOUR SHARE PRICE DEVELOPMENT
100
50
150
200
400
250
300
2017 2018 2019 2020 2021
Latour OMX Stockholm PI
350
AVERAGE TOTAL RETURN, LATOUR COMPARED AGAINST SIXRX
%
20210
302010
708090
100
405060
Latour SIXRX
5 years 10 years 20 years
SUBSTANTIAL SHAREHOLDINGS AT 31 DECEMBER 2021
Shareholders
Number of class A shares,
thousands
Number of class B shares,
thousands
% ofshare
capital% of
voting rights
The Douglas family with companies 39,958 446,554 76.0 79.2
The Palmstierna family with companies 6,409 3,370 1.5 6.3
AMF – Insurance and Funds 10,372 1.6 1.0
The Nordström family with companies 800 1,720 0.4 0.9
State Street Bank and Trust Co, W9 9,433 1.5 0.9
JM Morgan Chase Bank 6,542
1.0 0.6
SEB Investment Management 4,518 0.7 0.4
Bertil Svensson, family and companies 4,251 0.7 0.4
Spiltan Fonder 4,173 0.6 0.4
Handelsbanken Sverige Index, Criteria 3,561 0.6 0.3
Other 463 97,199 15.3 9.6
Investment AB Latour, repurchased shares 517 0.1 —
47,630 592,210 100.0 100.0
DIVIDENDS THE LAST 10 YEARS
20122013
20142015
2016 20172018
20202021
20190
1
2
4
5
3
6
Ordinary dividend Direct return
Direct return, %SEK/share
The striped section of the bar for 2019 is the proportion of the proposed dividend that was not distributed due to Covid-19.
2.50
3.00
3.50
2.00
1.50
1.00
0.50
0.00
20,001– 15,001–20,000 10,001–15,000
5,001–10,000
1,001–5,000
1–500
501–1,000
L A T O U R A N N U A L R E P O R T 2 0 2 1 3 5
T H E L A T O U R S H A R E

398,000 per cent since the startLatour’s history stretches back to the end of 1985. Since then the total return, including share price growth and dividends, has reached 398,000 per cent. This means that a SEK 10,000 investment in Latour at start-up would have given a total return of almost SEK 39.8 m at the end of 2021.
Total return
Total return Latour B including dividendsShare price growth Latour BDevelopment for Nasdaq OMX Stockholm, including dividends (SIXRX)
The diagram shows the total return on the Latour share, which includes the share price growth and the distributed dividends, in relation to the Nasdaq OMX Stockholm as a whole.
400,000
350,000
300,000
250,000
200,000
50,000
100,000
0
150,000
%
1986 1987 1988 1989 1990 1991 1992 1993 1994 1995 1996 1997 1998 1999 2000 2001 2002 2003
Increased shareholding 1999 in Fagerhult and Sweco.
Sales of holdings in 2000 Piren and BT Industries.
1988 Acquisition of Fagerhult. The Securitas Group made several large acquisitions, among them the lock company ASSA.
1993 Latour sells most of its holding in Trelleborg.
1997 Dividend of Fagerhult and SäkI. Acquisition of major share-holding in Sweco.
1991 Securitas is listed.
1994 Latour helps createEurope’s largest lock group,ASSA ABLOY. Acquisition of Swegon.
1985 Operations start, but the name Latour was not used until 1987. Major acquisitions in Securitas and Trelleborg.
T O T A L R E T U R N
3 6 L A T O U R A N N U A L R E P O R T 2 0 2 1

2004 2005 2006 2007 2008 2009 2010 2011 2012 2013 2014 2015 20172016 20192018 2020 2021
Increased shareholding in TOMRA and HMS Networks. 2013
Increased shareholding in TOMRA. 2014
Acquisition of shares in Troax, Terratech and Neuffer. 2015Sale of Specma Group and large blocks of shares in Nobia.
Increased shareholding in TOMRA. 2016 Divestment of all class B shares in Loomis.
Five acquisitions in the wholly-owned industrial operations. 2018Increased shareholding in Alimak Group.
Five acquisitions in the wholly-owned industrial operations. Establishment of Latour Future Solutions. Divestment of 2020 7.8 million shares in TOMRA, but remains largest shareholder in the company. Increased holding in Fagerhult and Alimak.
Ten acquisitions in the wholly-owned industrial operations and two investments in Latour Future Solutions. 2021 Acquisition of shares in CTEK to the investment portfolio. Divestment of all shares in Neuffer.
Six acquisitions in the wholly-owned industrial operations whereof Caljan 2019 was added as a fifth business area. Divestment of all shares in Loomis in the investment portfolio and increased investment in Fagerhult.
Seven acquisitions in the wholly-owned operations. Acquisition of shares in 2017Alimak Group to the investment portfolio and increased shareholding in TOMRA.
2004Start of concentration in the wholly-owned industrial operations.
Acquisition of major 2007in Nederman.
2008Acquisition of shareholding in HMS Networks. Securitas distributes shares in Loomis.
Merger of Latour and SäkI. 2011 Acquisition of shares in Norwegian TOMRA.
L A T O U R A N N U A L R E P O R T 2 0 2 1 3 7
T O T A L R E T U R N

Aritco is an award-winning manufacturer of platform lifts and home lifts. Aritco has a lift for every location, regardless of whether it is to be used in a shopping centre, a home, in a church or in an office.
I N D U S T R I A L O P E R A T I O N S

Industrial operationsBemsiq 42
Caljan 46
Hultafors Group 50
Nord-Lock Group 54
Swegon 58
Latour Industries 62
Latour Future Solutions 66
Significant events in 2021f Bemsiq AB, a business unit within Latour Industries, was hived off to form a separate business area.f Net sales increased by a total of 24 per cent. Organic growth reached 14 per cent.f Continued international growth. Sales generated outside Europe increased from 19 per cent to 21 per cent.f The operating profit rose 26 per cent and the operating margin reached 14.6 per cent (14.3). f 10 businesses were acquired. These contribute annual sales of just over SEK 2,300 m.
L A T O U R A N N U A L R E P O R T 2 0 2 1 3 9
I N D U S T R I A L O P E R A T I O N S

GROUP – TRAILING 12 MONTHS
20082007 2009 2010 2011 2012 2013 2014 2015 2016 2017 2018 2020 20212019
SEK m SEK m
Operating profit
Invoiced sales
Orders intake
Quarterly earnings
00
28,000
26,000
14,000
16,000
18,000
20,000
22,000
24,000
12,000
4,000
2,000
6,000
8,000
10,000
2,800
2,600
1,400
1,600
1,800
2,000
2,200
2,400
1,200
400
200
600
800
1,000
Continued profitable growth and a new business areaDespite supply chain challenges and rising raw material prices, Latour’s wholly-owned industrial operations continued to grow profitably in 2021. Furthermore, Bemsiq was added as a new business area, having previously been part of Latour Industries.
LATOUR’S WHOLLY-OWNED INDUSTRIAL operations comprise six business areas with over 100 companies and generate annual sales of approximately SEK 18 billion. All the business areas are strongly positioned in their respective niches with companies that develop, manufac-ture and market proprietary products for cus-tomer segments that represent considerable and growing international demand.
DESPITE CHALLENGES IN THE FORM of disruptions in global supply chains and steep rises in the costs of raw materials and transport, all the business areas continued to take a forward- looking view and invested continuously in vari-ous initiatives within product development, sales and marketing. Above all, there has been a strong focus on forging ahead with sustaina-bility and digitalisation, areas that are key to underpinning future growth. Latour’s new busi-ness area, Bemsiq, is a fine example of a busi-ness well at the forefront of both areas, with
smart digital solutions that enhance the energy efficiency of properties. An acceleration in the development and launch of climate-friendly products has been seen in all the business areas during the year. Recruitment of new employees has been stepped up to meet the strong market demand and need for new essential skills. The international presence has been further bolstered both organically and by acquisition. Covid-19 restrictions have impeded the international expansion in some regions, especially in Asia.
THE FINANCIAL TARGETS are for the operations to achieve a minimum of 10 per cent average annual growth and operating margin and 15 to 20 per cent return on operating capital over a business cycle. The pandemic presented chal-lenges to the achievement of the targets in 2021. Despite this, 5 out of the 6 business areas surpassed the targets for operating margin and growth.
26%The industrial operations increased their operating
profit by 26% in 2021.
4 0 L A T O U R A N N U A L R E P O R T 2 0 2 1
I N D U S T R I A L O P E R A T I O N S

FIVE-YEAR OVERVIEW
2021 2020 2019 2018 2017
Net sales (SEK m) 18,280 14,783 13,519 11,586 9,705
(of which export) 14,949 12,232 11,125 8,981 7,209
Operating profit (SEK m) 2,559 2,041 1,817 1,476 1,179
Average operating capital (SEK m) 16,254 14,545 10,620 9,167 7,791
Total assets (SEK m) 26,090 19,977 18,720 14,680 13,002
Number of employees 7,684 6,257 5,868 5,068 4,834
Return on operating capital (%) 16.4 14.6 17.2 16.1 15.1
Operating margin (%) 14.6 14.3 13,5 12.7 12.1
PROFIT/LOSS BUSINESS AREASNet sales Operating profit Operating margin %
SEK m2021
Full year2020
Full year2021
Full year2020
Full year2021
Full year2020
Full year
Bemsiq 927 725 198 165 21.4 22.7
Caljan 1,527 1,176 276 207 18.1 17.6
Hultafors Group 5,544 3,641 860 561 15.5 15.4
Latour Industries 3,022 2,356 244 147 8.1 6.3
Nord-Lock Group 1,439 1,275 367 316 25.5 24.8
Swegon 5,824 5,614 718 721 12.3 12.8
Eliminations –3 –4 0 0 0 0
18,280 14,783 2,663 2,117 14.6 14.3
Gain/loss from purchase/sale of companies — — –51 –38
Other companies and items 0 0 –53 –38
Total 18,280 14,783 2,559 2,041
Operating capital1) Return on operating capital %2) Growth in net sales %
SEK m2021
Full year2020
Full year2021
Full year2020
Full year Gross Organic Currency Acquisitions
Bemsiq 1,711 1,346 11.6 12.2 27.9 8.7 –1.9 19.8
Caljan 2,551 2,706 10.8 7.6 29.9 33.9 –3.0 —
Hultafors Group 4,763 3,853 18.1 14.6 52.3 20.7 –2.6 29.5
Latour Industries 2,765 2,233 8.8 6.6 28.3 14.0 –1.7 14.5
Nord-Lock Group 1,199 1,207 30.6 26.2 12.9 17.2 –3.6 —
Swegon 3,265 3,239 22.0 22.3 3.7 3.4 –1.6 2.0
Total 16,254 14,584 15.2 13.4 23.7 13.6 –2.2 11.3
1) Calculated as total assets less cash and cash equivalents and other interest-bearing assets and less non-interest-bearing liabilities. Calculated on the average for the past 12 months.2) Operating profit as a percentage of average operating capital.
14% (13%)
79% (81%)
7% (6%)
GLOBAL BREAKDOWN OF NET SALESEurope still dominates, but the indus-trial operations are growing in both North America and Asia in 2021.
L A T O U R A N N U A L R E P O R T 2 0 2 1 4 1
I N D U S T R I A L O P E R A T I O N S

Mikael J. Albrektsson, CEO of Bemsiq:
T he road to becoming an independent business area began in 2016 with a clear ambition – to take advantage of identified investment oppor-tunities in the smart building market. Today, Bemsiq is made up of seven companies with net sales of more than SEK 1 billion and a
profitability well above Latour’s financial targets. CEO Mikael J. Albrektsson, who has been in charge of the business since 2018, is satisfied with the development.
“We have had an solid organic and acquisition-driven growth agenda in recent years, which has strengthened our position on a market that is driven by long-term, important trends.”
A greater focus on sustainability and indoor air quality is leading to investments in technologies to lower energy consumption and improve energy and air quality report-ing. Growth in Bemsiq’s market is being further driven by the general trend towards digitalised processes and more wireless products that are easy to install in existing buildings. It is expected that these trends will continue for decades due to the low penetration of the required technology in buildings globally.
“By being a leading global supplier of technology and products for measurement, control and connectivity, we are able to make buildings both smarter and greener.”
THE POTENTIAL TO offer the products globally was improved significantly in 2021, as Bemsiq was given the opportunity to acquire the Canadian company Grey-stone, which has more than 30 years’ experience in the design, manufacture and sale of HVAC sensors within building automation. The company constitutes a perfect geographical match, with routes to both the North American and the Asian markets.
“I met Greystone’s CEO at a trade fair in Dubai just over two years ago and realised how well the businesses fitted in with each other. We have remained in contact since then, and last summer he called and said that the
owner wanted to sell. We managed to position ourselves as the preferred buyer and were able to complete the deal in September.”
Greystone is now one of seven companies operating independently on the market, with Bemsiq acting as the shared platform for collaboration. The companies are independent, with proprietary products, brands, organi-sations and business plans. They also make their own acquisitions.
Maintaining entrepreneurship in the Bemsiq compa-nies is extremely important in order to create long-term value. At the same time, the operations benefit from hav-ing an organisation they can lean on. Certain purchases, the development of common technology and the supple-menting of the product portfolio take place generally and in collaboration.
“In addition, all the CEOs meet quarterly, which is greatly appreciated. To be able to focus fully on your own business, yet still be able to discuss aspects you can help each other with.”
One thing that the companies have in common is the customer segments to which the products are sold. The primary segment consists of large system integrators, such as Bravida, Caverion and Nordomatic, who pur-chase the products and carry out the projects for the end customer, who is usually a property owner. The compa-nies also sell to OEMs, who incorporate the parts into
After a few intensive years of expansion and value creation, Bemsiq took up its place as Latour’s sixth business area at the end of 2021. The journey is now continuing, with no let up in the pace.
“SMART TECHNOLOGY FOR GREENER BUILDINGS”
“All the CEOs meet quarterly, which is greatly appreciated. To be able to focus fully on your own business, yet still be able to discuss aspects you can help each other with.”
Mikael J. Albrektsson on the dynamic collaboration between the companies in the group.
4 2 L A T O U R A N N U A L R E P O R T 2 0 2 1
I N D U S T R I A L O P E R A T I O N S

Position: CEO, Bemsiq Years in the Group: 5 years, of which 1.5 years in Latour’s business develop-ment team. Previous experience: Investment manager at Fourier- transform AB and strategy consultant at Arthur D. Little.
MIKAEL J. ALBREKTSSON
“By being a leading global supplier of technology and products for
measurement, control and connec- tivity, we are able to make build-
ings both smarter and greener.”
L A T O U R A N N U A L R E P O R T 2 0 2 1 4 3
I N D U S T R I A L O P E R A T I O N S

their own solutions. The products are also sold directly to property and energy companies to some extent.
“The main driving force for the end cus-tomers is the desire to achieve better energy and climate performance in the properties. This requires more technology, and that’s where our solutions come in.”
THE PRODUCTS THAT ARE DEVELOPED and sold by the companies in the group are often complex and innovative. The products found in the portfolio include energy-effi-cient measurement and control of building automation, innovative wireless sensor technology for smart building applications, cloud-based systems and services, as well as the development of systems that are used to control and monitor ventilation, heating, cooling and other technical systems in buildings.
“We have also started investigating the possibility of using recyclable materials in our products and powering sensors with solar cells to avoid batteries in our wireless products.”
Bemsiq’s market has demonstrated good growth for a long time, and this trend is predicted to continue. There are a number of factors pointing towards an even higher rate of growth, including the fact that properties around the world account for a large proportion of global CO2 emissions.
“We are just at the beginning of this growth wave. The trend is moving towards all property owners having to accept greater responsibility, whereupon measuring,
controlling and optimising technology will become a natural part.”
As the CEO of Bemsiq, Mikael views the market from a long-term perspective, try-ing to see where the sector is heading, qui- te simply. This includes evaluating acqui- sitions in order to expand the portfolio.
“We are good at what we do, but we con-stantly need to ask ourselves whether there are any other parts of our segment where we could take positions.”
Mikael’s background is very suitable for the role of CEO of Bemsiq. He studied
industrial economics at Chalmers, before working as a strategy consultant with a good insight into the venture capital industry. This was followed by a position at an investment company, focusing on developing companies through a board perspective. This provided a natural transition to Latour and the Business Development unit, before taking over responsibility for Bemsiq in July 2018.
MIKAEL IS NOW RESPONSIBLE FOR Latour’s sixth business area, in a small yet effective central organisation com- prising three people. However, they are at the hub of a network of companies with an important mission
– to accelerate the journey towards smart and climate- neutral buildings. The current year has all the condi-tions in place to be exciting.
“We are now about to take the next step in Bemsiq’s journey, to grow in North America through Greystone, which is already looking at a number of complementary acquisitions, and so on out into the world.”
Bemsiq’s subsidiary Produal is a complete partner for everything relating to measurement and regulation for customers in the field of building automation. The offering encompasses solutions that deliver energy efficiency, high quality indoor air, convenience and return on investment.
Companies included:f Bastec
f Elsys
f Elvaco
f Greystone
f Produal
f Sensortec
f S+S Regeltechnik
BEMSIQ
4 4 L A T O U R A N N U A L R E P O R T 2 0 2 1
I N D U S T R I A L O P E R A T I O N S

PERCENTAGE OF NET ASSET VALUE, OPERATING PROFIT AND SALES
BREAKDOWN OF SALES BY BUSINESS UNIT
BEMSIQ AT A GLANCEBemsiq’s mission is to accelerate the jour-ney towards SMART and GREEN commer-cial buildings by being a leading global supplier of sensor, control and connectiv-ity technologies and products. Bemsiq is a group of international companies that deliver innovative products to the building automation and energy metering sector. The products that these companies develop and sell are used in an extensive range of applications that enhance the smartness and environmental perfor-mance of buildings.
SIGNIFICANT EVENTS IN 2021f New separate business area within
Latour from the fourth quarter of 2021. f Continued good demand resulted in
high sales growth with good profitabil-ity, despite supply challenges.
f Acquisition of Swedish Elsys, a manu-facturer of sensors for SMART buildings.
f Acquisition of the Canadian company Greystone, with over 30 years of experi-ence of HVAC sensors and transmitters for the building automation industry.
f Produal acquired Finnish HK Instru-ments, which supplies advanced meas-uring devices for building automation.
STRATEGY FOR PROFITABLE EXPANSIONf Continued high pace of development of
new products and technology for the building automation and energy meter-ing sectors.
f Further expansion of position in key European markets by stepping up activ-ities in existing operations.
f Continue to develop a presence in North America and select parts of Asia.
f Pursue an active acquisition agenda.
BemsiqBemsiq comprises a portfolio of companies in the sectors of building automation and energy efficiency.
At a glance
S+S Regeltechnik23%
Produal36%
Bastec7%
Elsys6%
Sensortec5%
Elvaco18%
Greystone Energy Systems
5%
Percentage of the Group’s net
asset value
3%
Percentage of industrial operations’
operating profit
7%
Percentage of industrial
operations’ sales
5%
FIVE-YEAR OVERVIEW
2021 2020 2019 2018 2017
Latour’s minimum
targets
Net sales (SEK m) 927 725 499 436 350 >10%
(of which outside of Sweden) 704 504 279 231 160
Operating profit (SEK m) 198 165 89 76 52
Operating capital1) (SEK m) 1,711 1,346 837 863 789
Operating margin (%) 21.4 22.7 17.8 17.4 14.8 >10%
Return on operating capital (%) 11.6 12.2 10.0 4.2 3.8 15–20%
Investments (SEK m) 15 13 2 3 4
Number of employees 475 266 187 203 187
1) Average
22%(15%)
PROPORTION OF FEMALE MANAGERS
SALES AND EARNINGS
2017 2018 2019 2020 2021 0
250
500
1,000
1,250
750
0
100
50
150
250
200
SEK mSEK m
Net sales Operating profit
L A T O U R A N N U A L R E P O R T 2 0 2 1 4 5
I N D U S T R I A L O P E R A T I O N S

“GROWTH ACCELERATING – ENTIRELY ACCORDING TO PLAN”
T he trend is clear. The high level of growth on Caljan’s market is expected to continue for a long time to come. Both the opportunities within e-commerce and the proportion of people who shop online are increasing every year. With its leading offering in the field of
automation technology, Caljan is an integral part of this development.
“We supply solutions that enable our customers to keep their promises to their customers,” says Henrik Olesen, CEO of Caljan.
Just as before, it is the biggest players who are setting the tone. They have been investing in infrastructure for many years and have gradually been able to increase their market share, including when demand took off during the pandemic. The world’s largest e-commerce company, Amazon, is leading this development, although other major players such as FedEx, DHL, Zalando and Walmart are following closely behind with their own expansion plans.
“The biggest operators are getting bigger, and they are setting a standard that other players have to adapt to.”
A NUMBER OF YEARS AGO, Caljan established a clear objec-tive of growing with large strategic key customers in the field of e-commerce. This has been a successful plan, which in 2021 resulted in net sales increasing by 34 per cent and order intake more than doubling.
“We are receiving both more and bigger orders, for ever larger projects. And we are also growing rapidly in terms of our workforce, by more than 20 per cent in 2021.”
These successes encompass all parts of Caljan’s offer-ing – telescopic conveyors, solutions for labelling and document handling, and in particular aftersales services. With a rapidly growing base of installed equipment
around the world, the need for a close and proactive service operation is growing. Caljan has an ambitious agenda in order to accommodate this.
“Our aftermarket sales increased by more than 50 per cent in 2021, but still only represents a small part of our overall business. There is a great deal more to do, both in terms of our own expertise in this field and when it comes to strengthening our geographical presence.”
Right now, the main focus is delivering on a record-breaking order book and pipeline. The condi-tions for this are good, given the company’s large-scale expansion of production in recent years. The new world-leading plant in Latvia, which was commissioned at the end of 2020, has doubled capacity, and assembly work at the company’s plant in the USA began in 2021.
“This investment is absolutely essential in order for us to grow in the world’s largest market for e-commerce and logistics. We doubled our sales in the USA during the year, and we have the potential to do so again in 2022. We are now continuing with a large new facility in Germany for the manufacture of equipment for label-ling and document handling, as well as planning further expansion in Latvia.”
The new plant in Germany is being built in line with the market’s toughest energy efficiency standard, which entails 60 per cent lower energy consumption
Caljan’s strategy of growing with major global players within e-commerce has proven to be successful, and is also contributing to a more sustainable development in the sector as a whole.
“We doubled our sales in the USA during the year, and we have the potential to do so again in 2022.”
Henrik Olesen on the growth potential in the USA, now based on in-house manufacturing.
Henrik Olesen, CEO of Caljan:
4 6 L A T O U R A N N U A L R E P O R T 2 0 2 1
I N D U S T R I A L O P E R A T I O N S

Position: CEO of Caljan since 2000Years in the Group: 2 yearsPrevious experience: Includes various senior positions within Scanio Group, such as 8 years as CEO.
HENRIK OLESEN
L A T O U R A N N U A L R E P O R T 2 0 2 1 4 7
I N D U S T R I A L O P E R A T I O N S

than traditional production. There is also a major focus on safety in all the facilities, minimising, or ideally eliminating, the risk of occupational injuries.
“Safety has always been the top priority for Caljan, and this is something we are focusing on heavily in the development of solutions for our customers. In the same way, our own organisation is permeated with a safety approach in everything we do – this is fundamental to our business.”
IT HAS PRODUCED RESULTS. Through systems that enable employees to report risks, it has been possible to implement measures before an incident has occurred, thereby greatly improving the company’s key figures in the area. This proactive way of working internally is also appreciated by the company’s customers.
“Our customers are global leaders that place high demands on their suppliers. During the year, one of our largest customers conducted a comprehensive audit of our operations, down to the smallest detail, in which we were able to satisfy all their high expectations and requirements.”
Growing with large, strategic customers who are at the forefront of their sector entails a need to produce solu-tions that continue to develop the sector in a sustainable direction. Solutions that reduce waste and streamline transport are being developed at an ever faster rate. Caljan is contributing with smart solutions for scanning, labelling and validating, which are leading to increased efficiency, safety and lower environmental impact. The
latest concept is called BulkLoader.“BulkLoader makes it easier to handle
extremely high volumes of packages and boxes without damaging the load. This is something that has been long awaited by customers.”
The solution is in line with the sector’s need for increased automation, where Caljan’s previous groundbreaking innova-tions such as AutoLoader and Flying Applicator are also helping to eliminate the need for manual intervention. Caljan’s
rate of innovation and product development will be able to increase in future, based in part on a strong patent portfolio. The partnership with the largest players in the sector is also enabling Caljan to help others.
“We bring knowledge and initiatives from these collab-orations and make it possible for the sector as a whole to create higher and more sustainable growth.”
CALJAN’S GROWTH RATE IS impressive, yet at the same time not surprising. The company is following a detailed plan, in which tangible activities and goals exist for all parts of the business, in order to be able to deliver at all times.
“As a result we have rarely suffered surprises, even when growth has been stronger than anticipated and we have had to deal with additional major challenges in the supply chain, such as in 2021. We are now starting a year in which we are witnessing an even higher rate of growth, but where we are well prepared, partly thanks to all our committed employees across eight countries.”
Current product areasf Telescopics
f Document Handling & Labelling
f Automated Solutions
f Aftermarket
CALJAN
Producing large volumes of high-quality telescopic conveyors requires both automation and manual specialist knowledge about the components.
4 8 L A T O U R A N N U A L R E P O R T 2 0 2 1
I N D U S T R I A L O P E R A T I O N S

CALJAN AT A GLANCECaljan is a leading supplier of equipment, solutions and services that optimize load-ing and unloading processes within logis-tics. Caljan supports customers handling FMCG at many stages of their supply chain, typically centered around e-com-merce, postal and distribution. Caljan’s solutions are used by large international customers for whom fast, secure and cost-effective parcel handling represents an important competitive advantage. The business comprises four global divisions.
SIGNIFICANT EVENTS IN 2021f Strong demand produced robust sales
growth with sustained high profitability.f Order intake increased significantly and
the order book reached a new record level. f Recruitment of a large number of new
employees to match the strong growth.f Focus on securing supply chains and
access to essential components.f Establishment of factory in the USA com-
pleted and the first products delivered. Establishment under way of new factory in Germany for Document Handling & Labelling.
STRATEGY FOR PROFITABLE EXPANSIONf Grow alongside strategic customers,
especially within e-commerce. f Expand production capacity and growth
in Europe and the USA.f Rollout of service, and subsequently
solutions for automated labelling and document handling, country by country.
f The large and rapidly growing installed base of telescopic equipment provides a good foundation for strong customer contacts and recurring revenue streams.
Caljan
17%
Since 1963, Caljan has specialised in helping packing companies, distributors and manufacturers around the world to manage loose cargo efficiently. Today, Caljan is a global leader in a strong growth market.
PERCENTAGE OF NET ASSET VALUE, OPERATING PROFIT AND SALES
FIVE-YEAR OVERVIEW
2021 2020 20191) 20181) 20171)
Latour’s minimum
targets
Net sales (EUR m) 151 112 92 86 73 >10%
(of which outside of Sweden) 148 112 92 86 73
Operating profit (EUR m) 27 20 13 12 12
Operating capital (EUR m) 251 258
Operating margin (%) 18.1 17.6 14.2 14.3 15.9 >10%
Return on operating capital (%) 10.8 7.6 15–20%
Investments (EUR m) 6 17
Number of employees 580 493 465 456 430
1) Pro forma
Percentage of the Group’s net
asset value
4%
Percentage of industrial operations’
operating profit
10%
Percentage of industrial
operations’ sales
8%
At a glance
BREAKDOWN OF SALES BY PRODUCT AREA
Telescopics 50%
Document Handling & Labelling 12%
AutomatedSolutions 15%
Aftermarket24%
SALES AND EARNINGS
2017 2018 2019 2020 2021
EUR mEUR m
Net sales Operating profit
0 0
50
100
150
200 40
20
30
10
PROPORTION OF FEMALE MANAGERS
(17%)
L A T O U R A N N U A L R E P O R T 2 0 2 1 4 9
I N D U S T R I A L O P E R A T I O N S

“DESPITE NEW RECORDS – THE JOURNEY HAS ONLY JUST BEGUN”
W hen Martin Knobloch took up the posi-tion of CEO of Hultafors Group in Janu-ary 2021, his plan was to get to know the business quickly and to visit all the busi-ness units. The pandemic meant that the plan had to be adjusted.
“I initially got to meet many people digitally, which worked well, and I was able to visit all the Swedish oper-ations. During the autumn, I travelled to our sales com-panies, logistics centres, production companies and partners in Europe and North America.”
Hultafors Group currently consists of 15 robust brands with products offered by distributors in 70 coun-tries. Sales have increased from SEK 1.9 billion in 2017 to more than SEK 5.5 billion in 2021. This strong devel-opment is underpinned by both a successful organic growth strategy as well as growth through acquisitions.
“I am impressed by what the company has managed to achieve in recent years, and for me it was important to understand and identify which success factors we can develop even further. The outstanding products, some of the finest brands in the sector as well as our deep under-standing of the market and our customers are just a few of these factors.”
ONE THING THAT BECAME CLEAR was that a more decentral-ised organisation was required in order to grow sustain-ably over time. A small and efficient central unit will act as a sounding board and provide support to three inde-pendent divisions, PPE (Personal Protection Equip-ment) Europe, Hardware Europe and Hardware North America, which own the entire agenda for their business, including acquisitions. The new organisation is in place from 1 January 2022.
“With this business-oriented working method, we will be able to accelerate both organic and acquisition-driven growth. There are still significant opportunities for further development.”
Hultafors Group has built up a strong position in both
Europe and North America, and is operating on a market that is still highly fragmented with many small, niche and often family-owned companies.
“We have developed a new strategy with ambitious targets for both organic and acquisition-based growth. There are many businesses that meet our acquisition criteria and can contribute to our long-term goal, namely of becoming a leader in the premium segment in Europe and North America by 2030 within both PPE and Hardware.”
PPE has been the fastest growing product area in recent years. The Snickers Workwear brand has demon-strated strong organic growth, with new collections that have been greatly appreciated by craftsmen and other users. At the start of 2021, Snickers was joined by another leading workwear brand, Fristads. As a result, this segment now accounts for almost half of Hultafors Group’s sales.
“These are two strong premium brands that have wind in their sails and are gaining market share, both in the Nordic region and across Europe. During the autumn, we have also launched Snickers and one of our shoe brands, Solid Gear, in the USA, where we can see consid-erable opportunities in the premium segment.”
PPE encompasses protective equipment for the whole person, including everything from helmets to shoes. With a total of nine brands, Hultafors Group has a strong offering for almost every part of the body. Through acquisitions, there are many opportunities to expand the offering within Hardware, which until now has only
With strong brands and a driven new organisation, Hultafors Group’s successful growth journey is now set to accelerate even further.
“Economic growth goes hand in hand with sus-tainable development, where we have a holistic view of the entire life cycle of a product.”
Martin Knobloch on the link between growth and the focus on sustainability.
Martin Knobloch, CEO of Hultafors Group:
5 0 L A T O U R A N N U A L R E P O R T 2 0 2 1
I N D U S T R I A L O P E R A T I O N S

Position: CEO of Hultafors GroupYears in the Group: 1 yearPrevious experience: Most recently CEO of BSH Home Appli-ances Northern Europe within Bosch Group, where he has had a long international career. Prior to that he worked at Siemens Group.
MARTIN KNOBLOCH
Hultafors Group’s brand, Hultafors, offers reliable hand tools that can be depended on in every situation, including handmade axes made from Swedish steel.
L A T O U R A N N U A L R E P O R T 2 0 2 1 5 1
I N D U S T R I A L O P E R A T I O N S

included hand tools and ladders. “In 2021, we acquired the Danish com-
pany Scangrip, which supplies LED work lights. This expanded our product portfo-lio with an entirely new area.”
The acquisition strengthens the Group’s sustainable offering, where sev-eral of the operations are now at the fore-front. The Dutch company EMMA Safety Footwear offers safety shoes developed on the basis of a completely circular model. Hultafors manufactures tools in recycla-ble materials, while Fristads Green Col-lection, which comprises extra sustaina-ble workwear and was launched during the autumn, helps end customers in vari-ous sectors to achieve their own sustaina-bility goals. In addition, intensive work is underway in all parts of the Group to reduce the environmental footprint.
However, the primary focus over the past year has been the supply chain.
“All sectors and companies have probably been strug-gling with the same issues: rising prices of raw materials and energy combined with disruptions in production and transport at suppliers. We have not been spared, although our long-standing relationships with our sup-pliers have proved invaluable.”
For decades, Snickers Workwear has been building up close relationships with manufacturers in Asia, and has become an important customer for all of them. Snickers has also set the standard for sustainable supplier work.
“Our closeness to our suppliers is also making the next phase of our climate work easier, measuring CO2 emissions throughout the value chain.”
This will contribute to the goal of reducing the Group’s total CO2 emissions by at least five per cent per year, and to only be using renewable energy by 2030. The work with the value chain also includes the digital processing of orders and deliveries, which is necessary to be able to compete on a market where users are becoming increasingly accustomed to ordering at the touch of a button on their mobile.
“Even though we don’t usually sell directly to the end user, we have good insight into their needs. We have to be able to promise fast and easy delivery based on digital dialogue, which is why we work with leading distributors in this
field, such as Amazon.”
AFTER A YEAR in which sales increased by just over 52 per cent and the operating margin grew significantly, it may be difficult to think that this can be repeated every year. But Martin believes that the journey has only just begun.
“We have chosen to think big, on a market that is offer-ing fantastic opportunities. With our new organisation, we now have three strong engines that, with their own growth agendas and by learning from each other, will help Hultafors Group to grow even faster in the future.”
Current brandsf Snickers Workwear
f Hultafors
f Wibe Ladders
f Solid Gear
f Toe Guard
f Dunderdon
f Hellberg Safety
f Johnson Level
HULTAFORS GROUP Current brandsf Snickers Workwear
f Fristads
f Kansas
f Leijona
f Hultafors
f SolidGear
f EMMA Safety Footwear
f ToeGuard
f Hellberg Safety
f Wibe Ladders
f Scangrip
f CLC
f Johnson Level & Tool
f Kuny’s
f EripioWear
HULTAFORS GROUP
Hultafors’ axes are hand-forged in Swedish steel and are manufactured by Hults Bruk in Åby, near Norrköping, where the forging tradition dates back as far as 1696. Only a few manufacturers around the world employ blacksmiths who are able to master this type of craftsmanship.
5 2 L A T O U R A N N U A L R E P O R T 2 0 2 1
I N D U S T R I A L O P E R A T I O N S

HULTAFORS GROUP AT A GLANCEHultafors Group is one of Europe’s largest companies providing professional users with workwear, safety footwear, head pro-tection, hand tools and ladders. The prod-ucts are developed, manufactured and sold through the company’s own brands and are available via leading distributors in nearly 70 countries globally, with the emphasis on Europe and North America.
SIGNIFICANT EVENTS IN 2021f Good demand in all product areas
resulted in strong sales growth. f Disruptions in supply chains from Asia
resulted in an increase in shipping and purchasing costs. Price increases were implemented. Cost control remains tight.
f Digitalisation and sustainability initia-tives to improve competitive edge.
f Acquisition of the Danish company Scangrip A/S, a leading manufacturer of innovative LED worklights for professional users.
f The acquisition of Fristads, Kansas and Leijona was completed.
f New distribution centre in Poland inau-gurated.
STRATEGY FOR PROFITABLE EXPANSIONf Create organic growth through product
development, more efficient use of sales and distribution channels, increased investment in marketing, and stronger relationships with end users.
f Pursue complementary acquisitions of brands with strong positions among distributors and end users.
Hultafors GroupHultafors Group offers a portfolio of leading brands to help professional users stay at the forefront when it comes to performance, safety and productivity.
PERCENTAGE OF NET ASSET VALUE, OPERATING PROFIT AND SALES
BREAKDOWN OF SALES BY PRODUCT AREA
FIVE-YEAR OVERVIEW
2021 2020 2019 2018 2017
Latour’s minimum
targets
Net sales (SEK m) 5,544 3,641 2,896 2,407 1,901 >10%
(of which outside of Sweden) 4,281 2,955 2,257 1,752 1,298
Operating profit (SEK m) 860 561 412 375 287
Operating capital1) (SEK m) 4,763 3,853 2,746 1,982 1,256
Operating margin (%) 15.5 15.4 14.2 15.6 15.1 >10%
Return on operating capital (%) 18.1 14.6 15.0 18.9 22.8 15–20%
Investments (SEK m) 100 51 23 11 9
Number of employees 1,686 977 885 821 696
1) Average
Percentage of the Group’s net
asset value
10%
Percentage of industrial operations’
operating profit
32%
Percentage of industrial
operations’ sales
30%
Hardware 33%
PPE67%
At a glance
36%
PROPORTION OF FEMALE MANAGERS
SALES AND EARNINGS
2017 2018 2019 2020 2021 0
1,000
3,000
6,000
5,000
4,000
2,000
0
200
1,200
800
1,000
400
600
SEK mSEK m
Net sales Operating profit
(31%)
L A T O U R A N N U A L R E P O R T 2 0 2 1 5 3
I N D U S T R I A L O P E R A T I O N S

Fredrik Meuller, CEO of Nord-Lock Group:
F ollowing the slowdown during much of 2020, the global industrial economy really took off in 2021. Even though the pandemic has continued to affect the market in various ways, it is clear that there is a large pent-up need for invest-ment. This is a development that Nord-Lock
Group’s CEO, Fredrik Meuller, is pleased about. “We are able to sum up a record year, characterised by
strong organic growth. The project business has also started to pick up, as a result of all the infrastructure packages that have been launched and where we have been involved in the discussions at an early stage.”
OTHER THAN THIS, THE YEAR has primarily entailed follow-ing the established plan, in this case the company’s strat-egy with its three cornerstones – efficiency, growth and innovation. After upgrading and expanding the three main production units, which constitutes the company’s largest ever expansion project, there is capacity to increase the rate of growth with continued good profita-bility. These efforts have also attracted attention.
“In October, we opened the factory in Mattmar, in Jämtland county. There was a great deal of interest from both the media and customers. But the inauguration of our brand new facility in Pittsburgh in the USA probably surpassed everything.”
Customers, partners and the local press were present, and the television channel KDKA Channel 2 broadcast live from the inauguration for four hours. The state’s governor and Senate also sent representatives.
“There is a sense of local pride when foreign compa-nies make significant direct investments and contribute to new jobs. We are now also making plans for a techni-cal centre in connection with the production operation.”
The investments in the factory have resulted in more employees, all with the aim of guaranteeing customers that they will have access to the products during a period characterised by great challenges.
Recruitment has also been carried out in other areas,
to secure the expertise needed to satisfy the company’s priorities in areas such as sales and product develop-ment. The fact that Nord-Lock Group is a well-known name has made things easier. Recruiting the best availa-ble talent is extremely important, given the company’s ambitions.
“Our aim is to become even better at following our customers throughout the installation phase, from joint problem solving and product design to aftermarket services and other services.”
A great deal is therefore being invested in training in relation to these aspects, both for the individual organi-sation as well as for various customer groups. For exam-ple, there is a need for customers to learn more about how digital solutions can simplify the monitoring of critical installations.
“Many sectors that we previously perceived as con-servative are requesting greater knowledge about how best to handle this, as well as asking whether we have the solutions.”
Sensor technology is a priority area. The next genera-tion of smart sensor technology, Superbolt Load Sensing Flexnut (LSF), is being launched at the start of 2022. This is aimed at an even broader market to facilitate the remote monitoring of tensioners. Innovation and prod-uct development are prerequisites for being able to increase market share in the long term, and are a key part of the strategy. In addition to launching new, cut-ting-edge solutions and upgrading existing products, an investment is being made in testing and documenting
The roadmap is being followed. From an upgraded operational plat-form with state-of-the-art production and strengthened resources, Nord-Lock Group is ready for continued high organic growth.
“WE HAVE JUMPED ONTO A NEW GROWTH CURVE”
“There is a sense of local pride when foreign companies make significant direct investments and contribute to new jobs.”
Fredrik Meuller on the inauguration of the Group’s new factory in Pittsburgh, USA.
5 4 L A T O U R A N N U A L R E P O R T 2 0 2 1
I N D U S T R I A L O P E R A T I O N S

Position: CEO of Nord-Lock GroupYears in the Group: 4 yearsPrevious experience: Senior posi-tions within the Trelleborg Group for 16 years, as well as several years within McKinsey & Company and JP Morgan.
FREDRIK MEULLER
Nord-Lock Group’s locking washers with wedge-locking
technology secure structures in a range of sectors, from
infrastructure to football stadi-ums around the world.
L A T O U R A N N U A L R E P O R T 2 0 2 1 5 5
I N D U S T R I A L O P E R A T I O N S

the performance of the various technolo-gies. This has accelerated, often in collab-oration with customers.
“We are witnessing a clear increase in the need among customers to have us as partners for the development of common solutions for complex projects, such as investments in next-generation technol-ogies for nuclear power, wind power and other critical future industries.”
Collaborations of this type demonstrate the confi-dence customers have in Nord-Lock Group’s quality and expertise. In addition, the pandemic and the subsequent disruptions in global supply chains have meant that quality and delivery reliability have become increasingly important.
“Despite all the challenges on the market, we have maintained the right exposure locally, as well as suffi-cient stock. This has resulted in many new customers and increased market share.”
ANOTHER SUCCESS FACTOR is the awareness of how good Nord-Lock Group’s four world-leading technologies actually are and what they can be used for. During the year, extensive work has been devoted to spreading knowledge through various channels, and dedicated sales resources have been set aside for each individual technology.
“We have been working to highlight the benefits of Nord-Lock’s wedge-locking washers, which has led to a significant number of project discussions. At the same time, we have intensified communications regarding
Expander’s pivot pins. Large, interna-tional machinery companies such as John Deere and Komatsu have embraced this, and Expander is now included in their own marketing.”
One way of raising awareness is to draw attention to the company in various ways. The video ‘When Safety Really Matters’, which was produced in-house, won silver in the Video B2B category at the Swedish
Content Awards, and Boltight was nominated for the Operational Excellence Award at the World Nuclear Exhibition in Paris. In addition, it has been reaffirmed that the company is a much-appreciated employer.
“Employees at some 1,500 companies in the Pittsburgh region were asked for their views about their workplace. The results were published in the Pittsburgh Post- Gazette, and we were one of the companies to be named Top Workplace Winner 2021.”
The knowledge and commitment of the employees is crucial in order for Nord-Lock Group to take the next step on its ambitious development journey. New core values where launched during the autumn – Passion, Speed, Quality and Sustainability – strengthening the sense of togetherness and the interaction between the company’s nearly 700 employees in 25 locations around the world.
“The platform, in the form of upgraded production, digital structure, talent management processes and dedi-cated resources within sales and product development, is allowing us to focus fully on increasing the rate of growth and thereby helping our customers to make the world a little safer.”
Brands in the portfolio:f Nord-Lock
f Superbolt
f Boltight
f Expander
NORD-LOCK GROUP
The Expander brand’s custom-made pivot pins are used by the world’s largest machinery manufacturers to reduce maintenance, while at the same time increasing the safety of those who operate the machines.
5 6 L A T O U R A N N U A L R E P O R T 2 0 2 1
I N D U S T R I A L O P E R A T I O N S

PERCENTAGE OF NET ASSET VALUE, OPERATING PROFIT AND SALES
BREAKDOWN OF SALES BY MARKET
NORD-LOCK GROUP AT A GLANCENord-Lock Group focuses on customers in all major industrial segments where qual-ity and safety standards are high and the consequences of failure would be serious. Over 90 per cent of production is exported. Sales take place through its own compa-nies and a worldwide network of distribu-tors.
SIGNIFICANT EVENTS IN 2021f Strong organic growth and sustained
high profitability. f The Group’s best result ever, excluding
major project deliveries in 2019.f The upgrade and expansion of the
Group’s three largest production units was completed and inaugurated.
f Growth initiatives within Expander, including online stores in Japan and the USA.
f Named Top Workplace Winner 2021 in Pittsburgh, USA.
STRATEGY FOR PROFITABLE EXPANSIONf Development of capacity and produc-
tivity in production and supply chain processes to meet customer demand in a cost-effective manner.
f Expansion of operations through organic growth and value-adding acquisitions.
f Maintain its position as an industry leader through customer-oriented R&D driven by digital and smart technologies.
Nord-Lock GroupNord-Lock Group is a world-leading manufacturer of safe and reliable bolt-securing solutions. Since 1982, Nord-Lock Group has been using its innovative products and extensive expertise to provide reliable and effective bolted joints to customers in all major industries.
At a glance
Americas 28%
Asia Pacific 27% EMEA 45%
Percentage of the Group's net
asset value
5%
Percentage of industrial operations'
operating profit
14%
Percentage of industrial
operations’ sales
8%
FIVE-YEAR OVERVIEW
2021 2020 2019 2018 2017
Latour’s minimum
targets
Net sales (SEK m) 1,439 1,275 1,448 1,309 1,114 >10%
(of which outside of Sweden) 1,369 1,217 1,382 1,244 1,054
Operating profit (SEK m) 367 316 411 397 340
Operating capital1) (SEK m) 1,199 1,207 1,106 1,033 950
Operating margin (%) 25.5 24.8 28.4 30.3 30.5 >10%
Return on operating capital (%) 30.6 26.2 37.1 38.4 35.8 15–20%
Investments (SEK m) 56 152 23 35 28
Number of employees 617 566 594 542 488
1) Average
11%
PROPORTION OF FEMALE MANAGERS
SALES AND EARNINGS
2017 2018 2019 2020 20210
1,800
1,200
1,500
300
600
900
SEK mSEK m
Net sales Operating profit
0
900
750
300
150
600
450
(16%)
L A T O U R A N N U A L R E P O R T 2 0 2 1 5 7
I N D U S T R I A L O P E R A T I O N S

Andreas Örje Wellstam, CEO of Swegon:
A ndreas Örje Wellstam is able to sum up his first full calendar year as CEO of Swegon. A year that offered drama in the wake of Covid-19, with high demand for the company’s ener-gy-efficient solutions for a better indoor cli-mate at the same time as a challenging supply
chain.“We have enjoyed a record order intake, but the second
half of the year has been characterised by the disrup-tions in the supply chain and delays to our deliveries.”
Short-term challenges always need to be addressed, and the company has done this well. At the same time, the organisation is working in the long term to build an even stronger Swegon on a market that has a growing need for solutions for a healthy and productive indoor environment. Investments have been made during the year that are further advancing the company’s positions.
“We have upgraded our production process, opened or taken the decision to open new factories, and we have accelerated developments in the IT field. We also made an exciting acquisition.”
IN TERMS OF NET SALES, the acquisition of the majority stake in the Finnish software company 720° (Seven Twenty degrees) was small, but the investment is accel-erating Swegon’s focus on digital services for property owners and tenants.
“720° offers software that helps to analyse the complex and invisible indoor environment and make it visible, and thereby be able to contribute to knowledge and improvement measures.”
In recent years, more and more people have become aware of how health, well-being and productivity can be affected by being indoors. However, a great deal remains to be done to increase this knowledge among property owners, authorities and companies. Swegon is working intensively on this issue, including through conferences,
collaborations with universities and organisations, and in particular through a close dialogue with property own-ers and tenants. The development of smart solutions to gain a better insight into the indoor climate is also pro-gressing more rapidly since 720° became part of Swegon.
“We will be launching a number of digital services under the collective name Swegon Inside, with the first service, Inside Analytics, being launched as soon as the first quarter of 2022. Swegon Inside Analytics will facili-tate the visualisation and predictive analysis of indoor environmental data (e.g. CO2, temperature and humid-ity) with the aim of improving decision-making pro-cesses and the properties’ net operating income.”
Solutions of this type have considerable potential and will contribute to the growth of Swegon’s market, as well as helping customers and other stakeholders to realise the importance of investments that make people feel better.
“We are also collaborating with other companies, including Fagerhult in the Latour sphere, to jointly raise awareness.”
Feeling good indoors is essential. At the same time, it is important for Swegon’s products to be manufactured in a sustainable way and to help reduce properties’ energy consumption. New progress has been made in this area during the year. The company launched Titan Sky, the first Eurovent-certified heat pump using the refrigerant propane for commercial properties. Smart Link+ is a feature that connects and optimises ventilation and cooling/heat production, which significantly reduces energy consumption. In addition, Swegon is the first in
The growing interest in better indoor environments benefits a leading indoor climate company like Swegon. The company is now set to accelerate this development and at the same time continue its own expansion.
“WE MAKE THE INVISIBLE VISIBLE”
“Feeling good indoors is essential.”
Andreas Örje Wellstam on the overall purpose of Swegon’s indoor climate solutions.
5 8 L A T O U R A N N U A L R E P O R T 2 0 2 1
I N D U S T R I A L O P E R A T I O N S

Position: CEO of Swegon Years in the Group: 11 years, of which 2 years in Latour’s business development team followed by a number of different senior posi-tions within Swegon. Previous experience: Just over ten years at Accenture Management Consulting, primarily in various roles within strategy for a number of sectors.
ANDREAS ÖRJE WELLSTAM
L A T O U R A N N U A L R E P O R T 2 0 2 1 5 9
I N D U S T R I A L O P E R A T I O N S

the sector to have EPDs (environmental product declarations) for products based on a life cycle perspective.
“After extensive work, we were able to publish EPDs for four of our product cat-egories. We are making it easier for our customers to choose the products with the lowest environmental footprint. The life cycle assessment is also helping us to develop as a company, by choosing recy-clable materials and investing in renewa-ble energy in our manufacturing pro-cesses. We’ve come a long way, but we can always do better.”
AT THE SAME TIME, SUSTAINABILITY is about more than the environment. In 2021, equal opportunities have been a priority issue for Swegon. It has been highlighted in training courses and in the dialogue with various stakeholders. Although it cannot yet be seen in the key ratios, a number of women have been recruited to important positions in the company, including within acquisitions, business development, system development and marketing.
“These are people who will be able to go far, both in Swegon and in the sector.”
Attracting talent is a key issue in order to grow in the long term and gain market share. There has to be a strong culture and good opportunities for career and development. Since Andreas took over as CEO in Sep-tember 2020, the work of further developing the culture in the company has been a high priority and is followed
up with frequent employee surveys. “We now take the pulse of our employ-
ees once a quarter, asking them what they consider to be good and bad. This pro-vides us with a good foundation to work on. It is a much-appreciated dialogue that increases engagement.”
THE PANDEMIC, which has characterised the world’s societies for two years, has led to increased investments in ventilation in all kinds of buildings. The EU is support-ing this development, both with financial
means for energy renovation as well as new directives relating to ventilation and the energy performance of buildings. In Germany and the UK, Europe’s two largest ventilation markets, Swegon has enjoyed particularly high levels of activity in recent years and has established strong market positions, including through acquisitions.
“We are witnessing extremely good local commitment and drive, and we are now working to become even better when it comes to selling our energy efficient systems and emphasising our responsibility as a sustainable company.”
Swegon has an advantage through its leading position in the Nordic region, and is able to apply this knowledge in other regions and increase market shares.
“We operate on a market that is characterised by good long-term growth opportunities. At the same time as tackling short-term challenges in the supply chain, we will be continuing to promote our strategy in 2022 as well as raising awareness of the importance of feeling good on the inside when you are indoors.”
Current business units:f Air Handling Units
f Cooling & Heating
f Room Units
f Services
f Residential
f North America
f UK & Ireland
SWEGON
We spend most of the day indoors, which is why we need a good indoor climate in order to function and feel good. Swegon supplies products and services for a healthy indoor climate, with solutions for ventilation, heating, cooling and climate optimisation.
6 0 L A T O U R A N N U A L R E P O R T 2 0 2 1
I N D U S T R I A L O P E R A T I O N S

PERCENTAGE OF NET ASSET VALUE, OPERATING PROFIT AND SALES
BREAKDOWN OF SALES BY BUSINESS UNIT
SWEGON AT A GLANCESwegon supplies the market with high-quality products and efficient sys-tem solutions that promote a healthy indoor environment and contribute to lower energy consumption and life-cycle costs for all types of buildings. Sales and marketing activities are conducted through its own companies in 16 countries and through distributors in other markets. Swegon has production units in Europe, North America and India.
SIGNIFICANT EVENTS IN 2021f Strong improvement in the order intake
and profitability remains healthy.f Due to supply chain disruptions and
delays in construction projects, invoiced sales did not have the same growth rate as order intake.
f Acquisition of the majority of the shares in the Finnish company 720° (Seven Twenty degrees), which offers software that measures, analyses and visualises the indoor environments of buildings.
STRATEGY FOR PROFITABLE EXPANSIONf Differentiate the offering through mar-
ket-leading, innovative system solu-tions for a better indoor environment.
f Greater focus on providing a superior customer experience via digital solu-tions and service.
f Establish strong positions in key Euro-pean markets through acquisitions and development of existing operations, and continue to develop a presence in North America.
SwegonSwegon maintains its clear focus on creating quality indoor climate to promote the well-being, health and comfort of those who use the buildings. Feel good inside.
At a glance
Residential9%
Services7%
Room Units21%
Air Handling Units 27%
Cooling & Heating 19%
North America5%
UK & Ireland 12%
Percentage of the Group’s net
asset value
9%
Percentage of industrial operations’
operating profit
27%
Percentage of industrial
operations’ sales
32%
FIVE-YEAR OVERVIEW
2021 2020 2019 2018 2017
Latour’s minimum
targets
Net sales (SEK m) 5,824 5,614 5,986 5,137 4,378 >10%
(of which outside of Sweden) 4,555 4,435 4,798 4,000 3,356
Operating profit (SEK m) 718 721 717 514 381
Operating capital1) (SEK m) 3,265 3,239 3,284 3,094 2,903
Operating margin (%) 12.3 12.8 12.0 10.0 8.7 >10%
Return on operating capital (%) 22.0 22.3 21.8 16.6 13.1 15–20%
Investments (SEK m) 120 61 91 57 62
Number of employees 2,655 2,625 2,454 2,293 2,228
1) Average
16%
PROPORTION OF FEMALE MANAGERS
SALES AND EARNINGS
2017 2018 2019 2020 2021 0
1,500
7,500
9,000
6,000
4,500
3,000
0
300
150
600
450
900
750
SEK mSEK m
Net sales Operating profit
(15%)
L A T O U R A N N U A L R E P O R T 2 0 2 1 6 1
I N D U S T R I A L O P E R A T I O N S

Björn Lenander, CEO of Latour Industries:
I t’s easy to mention the most important event of the year for Latour Industries. The fact that Bemsiq has become a separate business area within Latour is the result of more than five years of systematic and suc-cessful work aimed at developing a leading business within building automation and energy efficiency.
“It is this type of value creation that shows why Latour Industries exists. The goals we establish for Bemsiq have now been met, following a number of acquisitions and strong organic growth in a sector enjoying good future prospects,” says Björn Lenander, CEO of Latour Indus-tries.
It was a given that Bemsiq would become a separate business area in 2021; the company is a leading Euro-pean player in its segment and enjoys high profitability. At the same time, one of its long-term goals has been to grow globally, if given the right opportunities.
“That’s why we acted when the chance to acquire the Canadian company Greystone arose. It’s a company we have been following for a long time, and that comple-ments Bemsiq perfectly with its position in North Amer-ica and Asia.”
OTHER BUSINESS UNITS WITHIN Latour Industries have also made acquisitions. Mechanical seals have been added to Densiq’s offering through Depac Anstalt in Liechten-stein. These represent an important part for many cus-tomers in the processing industry, and the acquisition is creating good conditions to accelerate growth in the future. The Danish company VM Kompensator, a lead-ing business in the field of compensators, was also acquired.
“The level of deferred maintenance has grown in the processing industry during the pandemic, and it is becoming increasingly important to deal with this issue. That’s why the outlook for Densiq’s operations is good.”
Within Accessibility & Mobility, which now has net sales of more than SEK 2 billion, the Swedish company
Motala Hissar was acquired, strengthening Aritco’s offer when it comes to platform lifts. The acquisition of the Italian company Vega was also completed, which has become a new business unit within Latour Industries.
“The integration process was a little unusual due to the pandemic, but we have benefited greatly from the fact that Latour has already had operations in Italy for several years.”
As with most of the industry, there have been disrup-tions in the supply chain such as component shortages and high freight and raw material prices, which have increased gradually during the year. Latour Industries’ companies have focused heavily on addressing these challenges and have been successful at compensating for the cost increases in their own pricing.
WITH BEMSIQ AS a separate business area and no changed management teams in the other business units, Björn has been able to shift the focus, from coaching and recruiting to looking for new investments. He is receiv-ing support in this work from the expanded Business Development team at Latour. Working together, they have intensified the search and are looking on average at one new company per day.
“There are many exciting targets, so I hope there will be a significant number of investments in 2022. The work with Bemsiq shows that we are good at what we do, and we are now working to achieve something similar in another sector.”
2021 has been characterised by a high rate of acquisitions and the successful tackling of challenges in the supply chain. Above all it has been characterised by a new business area: Bemsiq.
“WITH BEMSIQ WE ARE SHOWING WHY WE EXIST”
“There are many exciting targets, so I hope there will be a significant number of invest-ments in 2022.”
Björn Lenander on Latour Industries’ goals for the year.
6 2 L A T O U R A N N U A L R E P O R T 2 0 2 1
I N D U S T R I A L O P E R A T I O N S

Position: CEO of Latour IndustriesYears in the Group: 7 yearsPrevious experience: 20 years’ experience from executive posi-tions in international industrial B2B and medtech companies.
BJÖRN LENANDER
Aritco’s lifts for the home environment exude Scandinavian design, with their clean forms and playful light-ing details. They are also elevating accessi-bility to the next level.
L A T O U R A N N U A L R E P O R T 2 0 2 1 6 3
I N D U S T R I A L O P E R A T I O N S

Current business unitsLatour Industries
HAS ITS HEAD OFFICE in Stockholm. Develops, manufactures and sells platform lifts for private, commer-cial and public use around the world. Sales, installation and ser-vice activities are performed through a global network of part-ners. Aritco’s customers are mainly located in Europe and Asia.
AritcoHAS ITS HEAD OFFICE IN Gothen-burg. Is an end-to-end supplier in the field of advanced sealing tech-nology and works with the pro-cessing industry. Densiq provides total solutions based on services, products and technical consulta-tion, enabling it to offer its custom-ers high levels of operating reliabil-ity. Its customers are mainly located in the Nordic region.
Densiq
MS GROUP HAS its head office in Gothenburg. The company devel-ops, manufactures and sells mobil-ity systems and electrical drive systems to the global mobility rehab market for electric and man-ual wheelchairs under the REAC, AAT and Batec brand names.
MS Group
VEGA HAS ITS HEAD OFFICE in Pon-zano di Fermo, Italy. The company is a leading designer and manufac-turer of passenger interface sys-tems and electronic systems for elevators. Vega has an R&D unit in Italy and its own subsidiaries in the USA, Brazil and Albania. Its customers are mainly located in Europe, although its products are sold all over the world.
VegaHAS ITS HEAD OFFICE IN Luzarra, Italy. Develops, produces and sells chair lifts, platform lifts and stair lifts for enhanced access in private homes and public spaces. The company has its own sales and installation operations in Italy, while in other countries these take place via local partners.
Vimec
LSABLSAB, WITH ITS HEAD OFFICE in Gothenburg, develops, manufac-tures and sells services and tool solutions for chip removal pro-cesses mainly for the woodwork-ing and metal industries. Its pri-mary market is Europe. LSAB has its own operations in Scandinavia, the Baltics and Russia.
6 4 L A T O U R A N N U A L R E P O R T 2 0 2 1
I N D U S T R I A L O P E R A T I O N S

LATOUR INDUSTRIES AT A GLANCELatour Industries comprises six wholly-owned holdings and one partly-owned holding whose proprietary products contain high-tech components and have considerable potential for growth. All hold-ings have their own business concept and business model.
SIGNIFICANT EVENTS IN 2021f Bemsiq reported separately as an inde-
pendent business area within Latour.f Order intake and invoiced sales growth
remains strong. f Supply chain disruptions and increased
raw material prices had an adverse effect on profitability.
f Acquisition of Italian company Vega. f Aritco acquired Motala Hissar, a leading
manufacturer of platform lifts. f Densiq acquired DEPAC Anstalt based in
Lichtenstein and the Danish company VM Kompensator.
STRATEGY FOR PROFITABLE EXPANSIONf Drive expansion in current holdings by
strengthening sales organisations, escalating product development and pursuing complementary acquisitions.
f Continue to implement new platform acquisitions in line with Latour’s criteria for investment.
Latour IndustriesLatour Industries is a miniature Latour, in which active and careful ownership will result in stable and independent development of the holdings. One of the main goals for the holdings is to become independent business areas within Latour at some point in the future.
PERCENTAGE OF NET ASSET VALUE, OPERATING PROFIT AND SALES
BREAKDOWN OF SALES BY BUSINESS UNIT
At a glance
FIVE-YEAR OVERVIEW
2021 2020 2019 2018 2017
Latour’s minimum
targets
Net sales (SEK m) 3,022 2,356 2,579 2,295 1,824 >10%
(of which outside of Sweden) 2,542 1,950 2,077 1,754 1,334
Operating profit (SEK m) 244 147 184 153 136
Operating capital1) (SEK m) 2,765 2,233 2,207 2,206 1,890
Operating margin (%) 8.1 6.3 7.1 6.7 7.5 >10%
Return on operating capital (%) 8.8 6.6 8.3 6.9 7.2 15–20%
Investments (SEK m) 46 30 36 49 47
Number of employees 1,606 1,281 1,278 1,209 1,157
1) Average
Percentage of the Group’s net
asset value
3%
Percentage of industrial operations’
operating profit
9%
Percentage of industrial
operations’ sales
17%
Aritco 35%
Vimec 16%
MS Group17%
VEGA 8%
LSAB 17%
Densiq 7%
29%
PROPORTION OF FEMALE MANAGERS
SALES AND EARNINGS
2017 2018 2019 2020 2021
SEK mSEK m
Net sales Operating profit
0
200
150
350
300
250
100
50
0
500
3,500
3,000
1,500
1,000
2,500
2,000
(24%)
L A T O U R A N N U A L R E P O R T 2 0 2 1 6 5
I N D U S T R I A L O P E R A T I O N S

TWO NEW ACQUISITIONS Latour Future Solutions
L atour Future Solutions was launched at the end of 2020 as an investment area that targets growth companies specialising in the develop-ment of solutions for a sustainable society. Over the past year, the business has evolved from the concept stage into an established investment
area within Latour. Pelle Mattisson is CEO and respon-sible for the business operations:
“Latour has now become well-known as an industrial investor in sustainability too, which opens up more opportunities. During the year, we looked at nearly 200 companies and have been in direct contact with half of them.
Aqua Robur Technologies and Swedish Hydro Solu-tions are two of the companies in which we invested. Both are active in one of Future Solutions' focus areas
– water treatment and water management. “Water is no longer looked upon as an infinite re-
source with no value, but is now regarded as a finite and extremely valuable resource that requires careful stewardship. Our two companies are at the forefront of their niches.”
AQUA ROBUR DIGITALISES mains water networks and helps water utility companies to monitor flow performance and prevent leakages. Swedish Hydro Solutions offers a bio-based treatment technology for large volumes of water in infrastructure projects and for industries.
“The company is involved in major infrastructure pro-jects, including Västlänken and Förbifart Stockholm. Using its technology, enormous volumes of water are managed and treated before being released into the stormwater system.”
Being part of Latour and its strong brand is an asset when Pelle meets new companies and customers. He is also supported by the business flow of Latour's business development team, and partnerships have already been developed in product development and elsewhere with some of the companies in the domain.
“For example, there is great interest in working with Gaia BioMaterials, our first investment, to find solutions to replace plastic materials with biomaterials in various end uses.”
IN 2022, PELLE WILL continue to look for new investments and place high priority on the process of expanding and developing existing companies. The conditions for this are favourable.
“Gaia has an agreement with Japan's Mitsubishi that we will now take forward, and as soon as the restrictions are removed, we will be visiting European water utilities to introduce Aqua Robur's solution. When Swedish Hydro was awarded Di Gasell's newly established Impact Gazelle of the Year award in December, it confirmed the importance of the company's role in society. Quite simply, we are building part of Latour's future.”
Position: CEO Latour Future SolutionsYears with the Group: 1 yearPrevious experience: CEO at Moment Group and at Stampen Media Group,
PELLE MATTISSON
“Water is no longer looked upon as an infinite resource with no value, but is now regarded as a finite and extremely valuable resource that requires careful stewardship.”
6 6 L A T O U R A N N U A L R E P O R T 2 0 2 1
I N D U S T R I A L O P E R A T I O N S

Current business unitsLatour Future Solutions
GAIA BIOMATERIALS AB develops and manufactures biode-gradable biomaterials from renewable sources to replace fossil-based plastics. With its patented biomaterial BioD-oloMer®, the company is involved in changing the plastics industry. Their material helps to reduce climate change and does not create microplastics as it breaks down. The com-pany was founded in 2011 and its head office and manufac-turing facility are in Helsingborg, Sweden.
AQUA ROBUR TECHNOLOGIES AB designs and manufactures IoT devices, sensors, energy-harvesting products and software for the water industry. The company offers water utilities complete solutions for digitalising their water networks by collecting data from all types of water pipes to enable them to secure safe and efficient water supply systems for the future. The company was founded in 2015 and its head office is in Gothenburg, Sweden.
SWEDISH HYDRO SOLUTIONS AB offers sustainable solutions for water treatment via mobile and stationary treatment sys-tems for bilge and stormwater, process water and remedia-tion of polluted areas. The company’s offering includes anal-ysis support, patented bio-based products and adapted equipment for efficient purification of very large volumes of water. The increased efficiency enables decision-makers and regulatory authorities to set higher requirements for water treatment. The company was founded in 2015 and has offices in Alingsås and Stockholm.
Gaia BioMaterials AB
Aqua Robur Technologies AB
Swedish Hydro Solutions AB
L A T O U R A N N U A L R E P O R T 2 0 2 1 6 7
I N D U S T R I A L O P E R A T I O N S

With its lighting solutions, Fagerhult aims to contribute to a sustainable and inspirational environment, such as in the new Grow concept in Stockholm, which has offices, a restaurant and a hotel all under the same roof.
I N V E S T M E N T P O R T F O L I O
6 8 L A T O U R A N N U A L R E P O R T 2 0 2 1

Significant events in 2021f The investment portfolio had a market value of SEK 98.4 billion (68.1 billion) at the end of the year.f The total return on the investment portfolio was 44.6 per cent, compared to 39.3 per cent for SIXRX.f The dividends from the investment portfolio companies in the spring of 2022 are expected to total SEK 1,257 m (1,042 m).
f Income from equity investment in 2021 totalled SEK 2,391 m (3,969 m).f New holding. 31.0 per cent of the shares in CTEK AB were acquired when the company was listed on Nasdaq Stockholm in September. CTEK is a leading global supplier of premium battery chargers.
Portfolio companiesAlimak Group 72
ASSA ABLOY 73
CTEK 74
Fagerhult 75
HMS Networks 76
Nederman 77
Securitas 78
Sweco 79
TOMRA 80
Troax 81
Other holdings 82
L A T O U R A N N U A L R E P O R T 2 0 2 1 6 9
I N V E S T M E N T P O R T F O L I O

LATOUR’S INVESTMENT PORTFOLIO consists of ten companies where Latour is the principal owner, or one of the principal owners, and where it has a voting power of at least 10 per cent. Regardless of the ownership stake, a clear working method is applied to the work of the Board of Directors, where Latour often has the role of chairman. Latour operates as a trans-parent principal owner that contributes to initiatives to ensure sustainable growth and profitability in its companies. All its businesses are at the forefront of their respective sectors and have further advanced their positions.
The investment portfolio enjoyed strong growth during the year. The return, adjusted for dividends and net investments, amounted to 44.6 per cent. This can be compared with Nas-daq OMX Stockholm (SIXRX), which increased by 39.3 per cent. The portfolio had a market value of SEK 98.4 billion at the end of 2021.
Income from equity investment in 2021 totalled SEK 2,391 m (3,969 m). The majority of the income comes from the investment portfolio companies’ profit shares. The divi-dends from the investment portfolio compa-nies in the spring of 2022 are expected to total SEK 1,257 m (1,042 m), in accordance with the proposals of each respective board. This is an increase of 21 per cent for comparable portfolios.
ONLY ONE TRANSACTION was carried out in the investment portfolio during the year. Latour took principal ownership of CTEK in Septem-ber, with 31.0 per cent of the shares, when the company was listed on the stock exchange. CTEK, from Dalarna in Sweden, is a leading global supplier of premium battery chargers and also specialises in chargers and charging accessories for electric vehicles.
The total return, including share price growth and dividend, for each portfolio company compared with the SIXRX benchmark index in 2021.
Movements in the investment portfolio value (SEK billion). These figures do not include divi-dends, but do include acquired and divested shares. *Refers to acquisitions in CTEK.
Nederm
an
%
–20
0
20
200
180
160
140
120
100
80
60
40
Fagerh
ultHMSCTEK Alim
akSw
ecoTroax
Securit
as
ASSA A
BLOYTOMRA
SIXRX 39.3%
The investment portfolio 44.6%
TOTAL RETURN FOR THE INVESTMENT PORTFOLIO IN 2021 MOVEMENTS IN THE INVESTMENT PORTFOLIO VALUE IN 2021
TOMRAAlim
akHMSCTEK
ASSA A
BLOY
Nederm
an
Securit
asTro
ax
Fagerh
ultSw
eco60
70
80
85
90
95
100
105
75
65
SEK billion
31 Dec
2020
31 Dec
2021
30.3SEK billion
Acquire
d dive
sted
68.1 1.1*
98.4
7.8
7.6
4.9
3.6
1.91.3 0.8 –0.3 –0.3
2.0
44.6%TOTAL RETURN ON THE
INVESTMENT PORTFOLIO IN 2021
Active and responsible principal owner of ten listed companies
I N V E S T M E N T P O R T F O L I O
7 0 L A T O U R A N N U A L R E P O R T 2 0 2 1

INVESTMENT PORTFOLIO
Share 1) Number Market value 2) SEK m Listed price 2) SEK Cost SEK m Dividend SEK mShare of voting rights
3) % Share of equity 4) %
Alimak Group 16,016,809 1,832 114 2,134 48 29.7 29.6
ASSA ABLOY 5) 105,495,729 29,138 276 1,697 411 29.5 9.5
CTEK 15,280,810 3,088 202 1,054 0 31.0 31.0
Fagerhult 84,708,480 5,159 61 1,899 42 48.1 47.8
HMS Networks 12,109,288 6,757 558 250 24 26.0 25.9
Nederman 10,538,487 2,297 218 306 11 30.0 30.0
Securitas 5) 39,732,600 4,953 125 1,081 159 29.6 10.9
Sweco 5) 97,867,440 16,657 170 479 6) 215 21.2 26.9
TOMRA 7) 31,210,000 20,186 631 (NOK) 1,605 94 21.1 21.1
Troax 18,060,000 8,371 464 397 37 30.2 30.1
TOTAL 98,438 10,903 1,042
1) All holdings are recognised as associated companies in the balance sheet.2) The last price paid is used as the listed price.3) Percentage of voting rights, not including repurchased shares. 4) Percentage of equity calculated on total number of issued shares.5) Due to limited trading in class A shares in Sweco, and because ASSA ABLOY and Securitas class A shares are unlisted, they have been given the same listed price as the company’s class B shares.
In those cases where the holding consists of both class A and class B shares, they are reported in the table as an entity.6) The cost of the class B shares in the Group is SEK 34 m higher than in the parent company through the exercise of call options.7) At the end of the reporting period, the listed share price was NOK 631.0, which has been translated to SEK at the exchange rate prevailing at the balance sheet date.
NET CHANGE IN LATOUR’S INVESTMENT PORTFOLIO IN 2021
ShareNumber
01/01/2021 Purchase SaleNumber
31/12/2021
CTEK 0 15,280,810 — 15,280,810
TOMRA 31,200,000 10,000 — 31,210,000
BREAKDOWN OF INVESTMENT PORTFOLIO’S VALUE PERCENTAGE OF RECEIVED DIVIDENDS
Alimak Group 2%
TOMRA 20%
HMS Networks 7%
Nederman 2%
Troax 9%
Fagerhult 5%
Securitas 5%
Sweco 17%
CTEK 3%
ASSA ABLOY 30%
Alimak Group 5%Troax 4%
Fagerhult 4%
Sweco 21%
TOMRA 9%
Securitas 15%
Nederman 1%
HMS Networks 2%
ASSA ABLOY 39%
L A T O U R A N N U A L R E P O R T 2 0 2 1 7 1
I N V E S T M E N T P O R T F O L I O
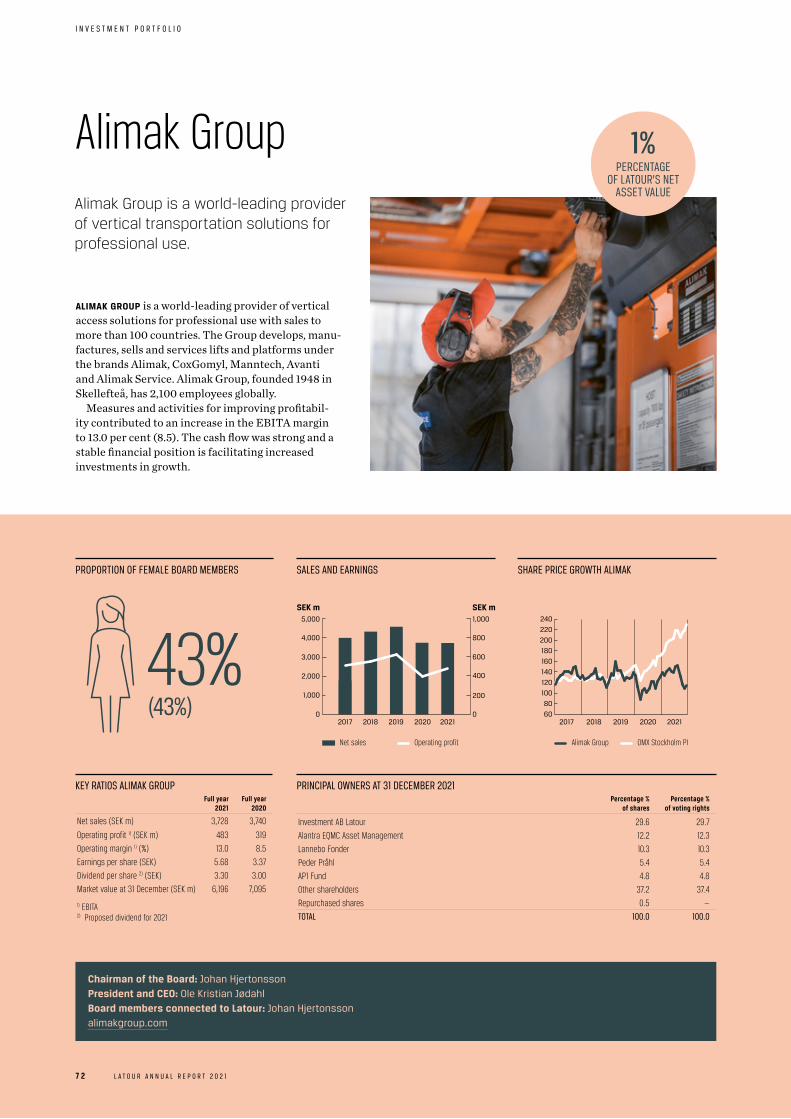
PRINCIPAL OWNERS AT 31 DECEMBER 2021Percentage %
of sharesPercentage %
of voting rights
Investment AB Latour 29.6 29.7
Alantra EQMC Asset Management 12.2 12.3
Lannebo Fonder 10.3 10.3
Peder Pråhl 5.4 5.4
AP1 Fund 4.8 4.8
Other shareholders 37.2 37.4
Repurchased shares 0.5 —
TOTAL 100.0 100.0
KEY RATIOS ALIMAK GROUPFull year
2021Full year
2020
Net sales (SEK m) 3,728 3,740
Operating profit 1) (SEK m) 483 319
Operating margin 1) (%) 13.0 8.5
Earnings per share (SEK) 5.68 3.37
Dividend per share 2) (SEK) 3.30 3.00
Market value at 31 December (SEK m) 6,196 7,095
1) EBITA2) Proposed dividend for 2021
Chairman of the Board: Johan HjertonssonPresident and CEO: Ole Kristian JødahlBoard members connected to Latour: Johan Hjertonssonalimakgroup.com
Alimak Group
SALES AND EARNINGS SHARE PRICE GROWTH ALIMAK
2017 2018 2019 2020 2021
SEK mSEK m
Net sales
0
1,000
3,000
2,000
4,000
5,000
0
800
1,000
200
400
Operating profit
600
2017 2018 2019
Alimak Group OMX Stockholm PI
202060
100
80
120
160
140
180
220
200
240
2021
ALIMAK GROUP is a world-leading provider of vertical access solutions for professional use with sales to more than 100 countries. The Group develops, manu-factures, sells and services lifts and platforms under the brands Alimak, CoxGomyl, Manntech, Avanti and Alimak Service. Alimak Group, founded 1948 in Skellefteå, has 2,100 employees globally.
Measures and activities for improving profitabil- ity contributed to an increase in the EBITA margin to 13.0 per cent (8.5). The cash flow was strong and a stable financial position is facilitating increased investments in growth.
Alimak Group is a world-leading provider of vertical transportation solutions for professional use.
1%PERCENTAGE
OF LATOUR’S NET ASSET VALUE
PROPORTION OF FEMALE BOARD MEMBERS
43%(43%)
I N V E S T M E N T P O R T F O L I O
7 2 L A T O U R A N N U A L R E P O R T 2 0 2 1

PRINCIPAL OWNERS AT 31 DECEMBER 2021Percentage %
of sharesPercentage %
of voting rights
Investment AB Latour 9.5 29.5
Fidelity Investments 4.1 2.8
Capital Group 3.9 2.6
Black Rock 3.5 2.4
Melker Schörling AB 3.1 10.9
Other shareholders 75.8 51.8
Repurchased shares 0.2 —
TOTAL 100.0 100.0
KEY RATIOS ASSA ABLOYFull year
2021Full year
2020
Net sales (SEK m) 95,007 87,649
Operating profit 1) (SEK m) 14,181 11,916
Operating margin 1) (%) 14.9 13.6
Earnings per share (SEK) 9.81 7.54
Dividend per share 2) (SEK) 4.20 3.90
Market value at 31 December (SEK m) 307,294 225,296
1) Adjusted EBIT2) Proposed dividend for 2021
ASSA ABLOY is the global leader in access solutions. Everyday, ASSA ABLOY helps billions of people experi-ence a more open world through innovations that enable safe, secure and convenient physical and digital access solutions. The Group is a world leader in access solutions with products and services such as locks, doors, gates and entrance automation solutions.
Despite continued challenges, ASSA ABLOY reported a strong organic sales growth of 11 per cent and an operating margin of 14.9 per cent (13.6). In addition, agreements were entered into regarding 15 acquisitions, including of the US company HHI, although this requires regulatory approval before it can be completed.
Chairman of the Board: Lars RenströmPresident and CEO: Nico DelvauxBoard members connected to Latour: Carl Douglas, Lena Olving, Johan Hjertonsson assaabloy.com
ASSA ABLOY
SALES AND EARNINGS SHARE PRICE GROWTH ASSA ABLOY
2017 2018 2019 2020 2021
SEK mSEK m
Net sales
0
20,000
40,000
80,000
100,000
0
Operating profit
60,000
16,000
20,000
4,000
12,000
8,000
ASSA ABLOY is a world leader in access solutions.
21%PERCENTAGE
OF LATOUR’S NET ASSET VALUE
PROPORTION OF FEMALE BOARD MEMBERS
50%20182017
Assa Abloy
2019 2020 2021
OMX Stockholm PI
140
190
240
290
340
(50%)
L A T O U R A N N U A L R E P O R T 2 0 2 1 7 3
I N V E S T M E N T P O R T F O L I O

Chairman of the Board: Hans StråbergPresident and CEO: Jon LindBoard members connected to Latour: Bjorn Lenanderctek.se
PRINCIPAL OWNERS AT 31 DECEMBER 2021Percentage %
of sharesPercentage %
of voting rights
Investment AB Latour 31.0 31.0
Altor Fund III GP Limited 20.3 20.3
AP4 Fund 5.2 5.2
Odin Small cap 3.4 3.4
AMF Equity Fund Small cap 3.4 3.4
Other shareholders 36.7 36.7
Repurchased shares — —
TOTAL 100.0 100.0
SALES AND EARNINGS SHARE PRICE GROWTH CTEK
2017 2018 2019 2020 20210 0
SEK mSEK m
Net sales Operating profit
200
400
1,000
600
200
800
40
80
120
160
CTEK OMX Stockholm PI
202120
70
120
170
220
KEY RATIOS CTEKFull year
2021Full year
2020
Net sales (SEK m) 922 706
Operating profit 1) (SEK m) 82 143
Operating margin 1) (%) 8.9 20.2
Earnings per share (SEK) 0.10 1.88
Dividend per share 2) (SEK) 0 —
Market value at 31 December (SEK m) 3) 9,962 —
1) EBIT2) Proposed dividend for 20213) The company was launched on the stock exchange in autumn 2021
CTEK
CTEK is the leading global brand in battery charging solutions, mainly for vehicles. CTEK develops a range of products, from 12V & 24V battery chargers to charging solutions for electrical vehicles. Products are sold via global distributors and retailers, to more than 50 of the world’s leading vehicle manufacturers, and through operators and property owners to pro-vide access to electric charging infrastructure.
CTEK continued to advance its position in a strongly growing market, including through new part-nerships with major customers in respect of electric car chargers. Net sales rose by 31 per cent and the adjusted EBITA margin stood at 16.3 per cent (17.8).
CTEK from Vikmanshyttan in Dalarna is an international leader in the field of battery charging solutions, principally for vehicles.
PROPORTION OF FEMALE BOARD MEMBERS
29%
2%PERCENTAGE
OF LATOUR’S NET ASSET VALUE
(29%)
I N V E S T M E N T P O R T F O L I O
7 4 L A T O U R A N N U A L R E P O R T 2 0 2 1

Fagerhult
FAGERHULT DESIGNS AND manufactures innovative and energy-efficient lighting solutions in four business areas – Collection, Premium, Professional and Infra-structure. The business is conducted locally through several companies with strong brands. Sales are also made via agents & distributors to over 40 markets.
Activity on Fagerhult’s markets increased in 2021, driven by a recovery in the willingness to invest and increased demand for energy-efficient lighting solu-tions. The Group’s order intake increased by 9.6 per cent and the operating margin strengthened to 10.0 per cent (6.5).
Fagerhult is one of Europe’s leading lighting companies with subsidiaries in a total of 28 countries.
PRINCIPAL OWNERS AT 31 DECEMBER 2021Percentage %
of shares Percentage %
of voting rights
Investment AB Latour 47.8 48.0
AP Fonder 7.3 7.3
BNP Paribas SEC Services 5.1 5.1
Lannebo Fonder 5.0 5.1
Nordea Fonder 4.2 4.2
Other shareholders 30.1 30.3
Repurchased shares 0.6 —
TOTAL 100.0 100.0
Chairman of the Board: Jan SvenssonPresident and CEO: Bodil SonessonBoard members connected to Latour: Eric Douglas, Jan Svenssonfagerhultgroup.com
SALES AND EARNINGS SHARE PRICE GROWTH FAGERHULT
20182017
Fagerhult
2019 2020 2021
OMX Stockholm PI
20
40
60
80
120
100
140
2017 2018 2019 2020 2021 0
2,000
4,000
8,000
6,000
0
400
800
1,200
1,600
SEK mSEK m
Net sales Operating profit
KEY RATIOS FAGERHULTFull year
2021Full year
2020
Net sales (SEK m) 7,088 6,816
Operating profit 1) (SEK m) 706 442
Operating margin 1) (%) 10.0 6.5
Earnings per share (SEK) 2.64 3.21
Dividend per share 2) (SEK) 1.30 0.50
Market value at 31 December (SEK m) 10,791 8,062
1) EBITA2) Proposed dividend for 2021
PROPORTION OF FEMALE BOARD MEMBERS
43%
4%PERCENTAGE
OF LATOUR’S NET ASSET VALUE
(43%)
L A T O U R A N N U A L R E P O R T 2 0 2 1 7 5
I N V E S T M E N T P O R T F O L I O

2017 2018 2019 2020 20210
SEK mSEK m
Net sales Operating profit
100
200
500
300
0
2,000
1,500
1,000
500
2,500
400
PRINCIPAL OWNERS AT 31 DECEMBER 2021Percentage %
of shares Percentage %
of voting rights
Investment AB Latour 25.9 26.0
Staffan Dahlström with companies 13.0 13.1
SEB Fonder 8.3 8.4
AMF Insurance and Funds 7.2 7.3
Swedbank Robur Funds 4.2 4.2
Other shareholders 41.0 41.1
Repurchased shares 0.4 —
TOTAL 100.0 100.0
SALES AND EARNINGS SHARE PRICE GROWTH HMS
20182017
HMS Networks
2019 2020 2021
OMX Stockholm PI
50
100
200
300
600
500
400
KEY RATIOS HMSFull year
2021Full year
2020
Net sales (SEK m) 1,972 1,467
Operating profit 1) (SEK m) 446 288
Operating margin 1) (%) 22.6 19.6
Earnings per share (SEK) 7.61 4.79
Dividend per share 2) (SEK) 3.00 2.00
Market value at 31 December (SEK m) 26,125 12,173
1) EBIT2) Proposed dividend for 2021
OVER 90 PER CENT OF HMS NETWORKS’ SALES are outside of Sweden, to some 60 countries. The head office is located in Halmstad and there are offices are in 16 countries. The company markets industrial communi-cation solutions under the Anybus®, Ewon®, Ixxat® and Intesis® brands. The products make it possible for industrial devices such as robots, motors and sensors to communicate with their surroundings.
The company experienced strong growth in 2021, order intake increased by 75 per cent and the operating margin rose to 22.6 per cent. In addition, 60 per cent of the Spanish company Owasys was acquired, as well as a minority stake in the Swedish company Connectitude.
HMS NetworksHMS Networks is a world-leading supplier of software and hardware for industrial ICT (Information & Communication Technology).
Chairman of the Board: Charlotte BrogrenPresident and CEO: Staffan DahlströmBoard members connected to Latour: Anders Mörckhms.se
PROPORTION OF FEMALE BOARD MEMBERS
33%
5%PERCENTAGE
OF LATOUR’S NET ASSET VALUE
(33%)
I N V E S T M E N T P O R T F O L I O
7 6 L A T O U R A N N U A L R E P O R T 2 0 2 1

PRINCIPAL OWNERS AT 31 DECEMBER 2021Percentage %
of sharesPercentage %
of voting rights
Investment AB Latour 30.0 30.0
Ernström Kapitalpartner 10.0 10.0
IF Skadeförsäkring 9.9 9.9
Swedbank Robur Funds 7.2 7.2
AP4 Fund 7.2 7.2
Other shareholders 35.6 35.6
Repurchased shares 0.2 —
TOTAL 100.0 100.0
SALES AND EARNINGS SHARE PRICE GROWTH NEDERMAN
2017 2018 2019 2020 20210
100
200
300
400
500
SEK mSEK m
Net sales Operating profit
0
1,000
2,000
3,000
4,000
5,000
Nederman OMX Stockholm PI
20182017 2019 2020 202140
80
120
160
200
240
KEY RATIOS NEDERMANFull year
2021Full year
2020
Net sales (SEK m) 4,042 3,675
Operating profit 1) (SEK m) 431 296
Operating margin 1) (%) 10.7 8.0
Earnings per share (SEK) 8.7 3.2
Dividend per share 2) (SEK) 3.50 0.00
Market value at 31 December (SEK m) 7,662 4,745
1) Adjusted EBIT2) Proposed dividend for 2021
Chairman of the Board: Johan HjertonssonPresident and CEO: Sven KristenssonBoard members connected to Latour: Johan Hjertonsson, Johan Menckelnederman.se
NEDERMAN’S SOLUTIONS protect people, production and the environment from the harmful effects of industrial processes. The portfolio includes individual products, complete future-proof IIoT solutions, planning, installation, commissioning and service. Sales are made to more than 50 markets through the company’s own sales organisation, agents or distributors.
A leading digital offering and a recovery in customer investments resulted in a strong year for Nederman. Net sales reported an organic growth of 14.9 per cent, order intake increased by 38.9 per cent and the adjusted oper-ating margin strengthened to 10.7 per cent (8.0).
NedermanNederman is a world-leading environ-mental technology company that develops advanced air purification products and systems.
PROPORTION OF FEMALE BOARD MEMBERS
33%
2%PERCENTAGE
OF LATOUR’S NET ASSET VALUE
(33%)
L A T O U R A N N U A L R E P O R T 2 0 2 1 7 7
I N V E S T M E N T P O R T F O L I O

Chairman of the Board: Jan SvenssonPresident and CEO: Magnus AhlqvistBoard members connected to Latour: Jan Svensson, Johan Menckelsecuritas.com
PRINCIPAL OWNERS AT 31 DECEMBER 2021Percentage %
of shares Percentage %
of voting rights
Investment AB Latour 10.9 29.6
Macquarie Investment Management Limited 4.8 3.4
M&G Investment Management 4.5 3.2
Melker Schörling AB 4.5 10.9
Lannebo Fonder 3.6 2.5
Other shareholders 71.7 50.4
Repurchased shares 0.0 0.0
TOTAL 100.0 100.0
SALES AND EARNINGS SHARE PRICE GROWTH SECURITAS
2017 2018 2019 2020 2021
2,500
5,000
10,000
7,500
0
12,500
SEK mSEK m
Net sales Operating profit
0
125,000
25,000
50,000
100,000
75,000
Securitas OMX Stockholm PI
20182017 2019 2020 2021100
150
200
250
300
KEY RATIOS SECURITASFull year
2021Full year
2020
Net sales (SEK m) 107,700 107,954
Operating profit 1) (SEK m) 5,978 4,892
Operating margin 1) (%) 5.6 4.5
Earnings per share (SEK) 10.41 8.02
Dividend per share 2) (SEK) 4.40 4.00
Market value at 31 December (SEK m) 64,736 48,462
1) Adjusted EBITA2) Proposed dividend for 2021
Securitas
SECURITAS is a leading global partner within intelli- gent security solutions. The company has a flat and decentralized structure with 345,000 employees in 46 countires. Securitas offers services withinguarding, electronic security, fire and safety as well as risk management that enable the company’s over 150,000 customers to see a different world.
Securitas’ organic growth amounted to 4 per cent, and the operating margin rose to 5.6 per cent (4.5). At the end of the year, an agreement was entered into for the acquisition of Stanley Security, which will be Securitas’ largest acquisition ever and provide a unique position in the field of electronic security.
Securitas is a world-leading partner within intelligent security solutions.
PROPORTION OF FEMALE BOARD MEMBERS
38%
4%PERCENTAGE
OF LATOUR’S NET ASSET VALUE
(38%)
I N V E S T M E N T P O R T F O L I O
7 8 L A T O U R A N N U A L R E P O R T 2 0 2 1
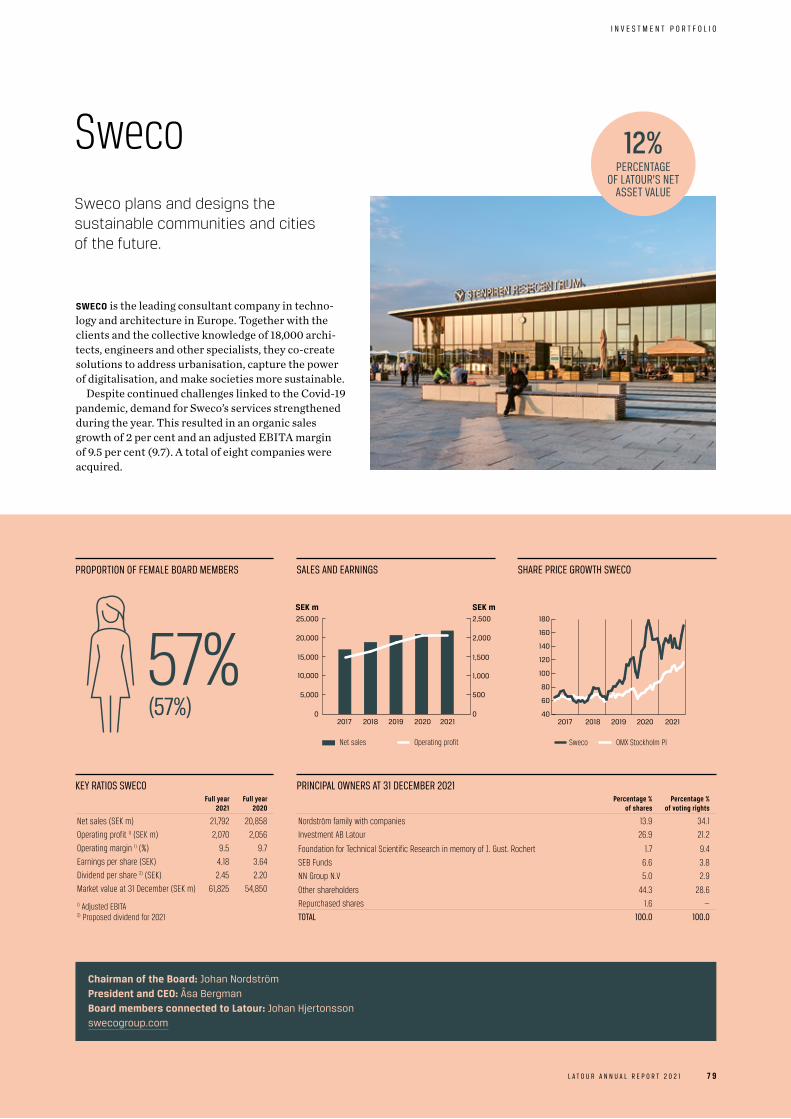
Chairman of the Board: Johan NordströmPresident and CEO: Åsa BergmanBoard members connected to Latour: Johan Hjertonssonswecogroup.com
PRINCIPAL OWNERS AT 31 DECEMBER 2021Percentage %
of sharesPercentage %
of voting rights
Nordström family with companies 13.9 34.1
Investment AB Latour 26.9 21.2
Foundation for Technical Scientific Research in memory of J. Gust. Rochert 1.7 9.4
SEB Funds 6.6 3.8
NN Group N.V 5.0 2.9
Other shareholders 44.3 28.6
Repurchased shares 1.6 —
TOTAL 100.0 100.0
SALES AND EARNINGS SHARE PRICE GROWTH SWECO
2017 2018 2019 2020 20210
10,000
5,000
15,000
25,000
20,000
0
1,000
2,500
1,500
2,000
500
SEK mSEK m
Net sales Operating profit Sweco OMX Stockholm PI
20182017 2019 2020 202140
60
80
100
120
140
160
180
KEY RATIOS SWECOFull year
2021Full year
2020
Net sales (SEK m) 21,792 20,858
Operating profit 1) (SEK m) 2,070 2,056
Operating margin 1) (%) 9.5 9.7
Earnings per share (SEK) 4.18 3.64
Dividend per share 2) (SEK) 2.45 2.20
Market value at 31 December (SEK m) 61,825 54,850
1) Adjusted EBITA2) Proposed dividend for 2021
SWECO is the leading consultant company in techno- logy and architecture in Europe. Together with the clients and the collective knowledge of 18,000 archi-tects, engineers and other specialists, they co-create solutions to address urbanisation, capture the power of digitalisation, and make societies more sustainable.
Despite continued challenges linked to the Covid-19 pandemic, demand for Sweco’s services strengthened during the year. This resulted in an organic sales growth of 2 per cent and an adjusted EBITA margin of 9.5 per cent (9.7). A total of eight companies were acquired.
SwecoSweco plans and designs the sustainable communities and cities of the future.
PROPORTION OF FEMALE BOARD MEMBERS
57%
12%PERCENTAGE
OF LATOUR’S NET ASSET VALUE
(57%)
L A T O U R A N N U A L R E P O R T 2 0 2 1 7 9
I N V E S T M E N T P O R T F O L I O

Chairman of the Board: Jan SvenssonPresident and CEO: Tove AndersenBoard members connected to Latour: Jan Svenssontomra.com
PRINCIPAL OWNERS AT 31 DECEMBER 2021Percentage %
of sharesPercentage %
of voting rights
Investment AB Latour 21.1 21.1
Folketrygdfondet 8.5 8.5
The Bank of New York Mellon 5.4 5.4
Clearstream Banking 4.0 4.0
State Street Bank 3.1 3.1
Other shareholders 57.7 57.8
Repurchased shares 0.2 —
TOTAL 100.0 100.0
SALES AND EARNINGS SHARE PRICE GROWTH TOMRA
2017 2018 2019 2020 20210
NOK mNOK m
Net sales Operating profit
2,000
400
800
1,200
1,600
2,000
4,000
12,000
6,000
0
8,000
10,000
TOMRA OMX Stockholm PI
20182017 2019 2020 202150
150
250
450
350
550
650
KEY RATIOS TOMRAFull year
2021Full year
2020
Net sales (NOK m) 10,909 9,941
Operating profit 1) (NOK m) 1,769 1,522
Operating margin 1) (%) 16.2 15.3
Earnings per share (NOK) 7.39 5.25
Dividend per share 2) (NOK) 3.30 3.00
Market value at 31 December (SEK m) 95,672 59,738
1) EBITA2) Proposed dividend for 2021. In addition to the regular dividend, an additional dividend of NOK 2.70 is proposed.
TOMRA
TOMRA WAS FOUNDED in Norway in 1972 and today has approximately 4,600 employees and operations in over 80 countries worldwide. Its products and services are offered in three business areas: TOMRA Collec-tion, TOMRA Recycling Mining and TOMRA Food.
TOMRA experienced strong growth in 2021, with a currency-adjusted increase in net sales of 16 per cent and a strengthening of EBITA to NOK 1,769 m (1,522 m). Megatrends such as urbanisation, population growth and a growing middle class are driving demand for the company’s solutions for increased resource productivity.
TOMRA is a world leader in sorting and recycling technologies for optimal resource productivity.
PROPORTION OF FEMALE BOARD MEMBERS
40%
15%PERCENTAGE
OF LATOUR’S NET ASSET VALUE
(40%)
I N V E S T M E N T P O R T F O L I O
8 0 L A T O U R A N N U A L R E P O R T 2 0 2 1

Chairman of the Board: Anders MörckPresident and CEO: Thomas WidstrandBoard members connected to Latour: Anders Mörcktroax.com
PRINCIPAL OWNERS AT 31 DECEMBER 2021Percentage %
of sharesPercentage %
of voting rights
Investment AB Latour 30.1 30.2
Thomas Widstrand 5.7 5.8
State Street Bank and Trust 5.1 5.1
Svolder AB 4.2 4.2
BNY Mellon SA/NY 4.1 4.1
Other shareholders 50.6 50.7
Repurchased shares 0.2 —
TOTAL 100.0 100.0
SALES AND EARNINGS SHARE PRICE GROWTH TROAX
2017 2018 2019 2020 2021
EUR mEUR m
Net sales Operating profit
0 0
100
150
300
200
20
60
30
10
40
250
50
50
20182017 2019 2020
Troax OMX Stockholm PI
0
300
400
500
2021
100
200
KEY RATIOS TROAXFull year
2021Full year
2020
Net sales (EUR m) 253 164
Operating profit 1) (EUR m) 52.4 30.8
Operating margin 1) (%) 20.8 18.8
Earnings per share (EUR) 0.66 0.39
Dividend per share 2) (EUR) 0.30 0.20
Market value at 31 December (SEK m) 27,810 11,532
1) EBIT2) Proposed dividend for 2021
TROAX MISSION is to develop sustainable, high quality and innovative safety solutions to protect people, property and processes. Since the start in 1955, Troax has developed into a successful listed international group with about 1,100 employees and local presence in 45 countries.
Troax experienced strong growth during 2021. Order intake and sales both increased by more than 50 per cent, while EBIT strengthened to 20.8 per cent (18.8).
TroaxTroax is a world-leading supplier of perimeter protection for indoor use.
PROPORTION OF FEMALE BOARD MEMBERS
33%
6%PERCENTAGE
OF LATOUR’S NET ASSET VALUE
(33%)
L A T O U R A N N U A L R E P O R T 2 0 2 1 8 1
I N V E S T M E N T P O R T F O L I O

Latour has a small portfolio of other holdings in which, for various reasons, it has decided against a wholly-owned ownership relationship.
PART-OWNED HOLDINGSThe part-owned unlisted holdings are mainly to be found in the investment area Latour Future Solutions. In addition to this, Latour is a minority shareholder in Oxeon AB, which, based on its core technology, has in turn established a number of interesting application companies with unique customer benefits. The other holdings jointly constitute only a small part of Latour’s net asset value.
OXEONOxeon is a research-based materials company that develops, produces and sells extremely thin carbon fibre materials. The company, which was founded in 2003, is a leading player in the field and the material is marketed under the brand name TeXtreme®. In appli-cations in which TeXtreme® is used, customers benefit from higher mechanical performance and signifi-cantly reduced weight. The company’s thin materials are now used within aerospace, industrial and sports applications. For example, the rotor blades for NASA’s Ingenuity helicopter, which conducted the historic first flight on the planet Mars in 2021, were manufac-tured by TeXtreme®.
In addition to developing materials, Oxeon also con-ducts application development. This has resulted in two application companies to date, Composite Sound AB and PPR AB.
Oxeon is continuing to identify opportunities for
new application areas where, based on Textreme®, additional new future applications can be created for sustainable customer solutions.
COMPOSITE SOUND In order to improve its cultivation of the market, Oxeon has formed a number of application companies. One of these is Composite Sound, in which Latour is the owner both indirectly through Oxeon as well as through a small direct ownership stake. In a short space of time, Composite Sound has managed to establish itself as a leading manufacturer of speaker cones. The products, which are based on Oxeon’s basic technology, deliver superior sound performance over a large frequency band. The company has succeeded, in a short space of time, in attracting a great deal of interest from estab-lished speaker manufacturers, and is about to imple-ment a significant expansion of its production capacity.
PPR Another application company is PPR, which markets a product for relining district heating pipes under the CarboSeal brand. This product is also based on Oxeon’s basic technology and is about to be launched dynamically. CarboSeal has the advantage that it is not necessary to perform excavations in complicated urban environments in order to carry out the relining procedure. The world’s district heating networks are considered to be massively in need of renovation.
Other holdings
O T H E R H O L D I N G S
8 2 L A T O U R A N N U A L R E P O R T 2 0 2 1

Composite Sound is a leading manufacturer of speaker cones, with products that deliver the very best sound performance.
L A T O U R A N N U A L R E P O R T 2 0 2 1 8 3
O T H E R H O L D I N G S

You need a good indoor climate in order to feel good and be able to perform. Swegon offers leading solutions for ventilation, heating, cooling and climate optimisation.
A N N U A L R E P O R T
8 4 L A T O U R A N N U A L R E P O R T 2 0 2 1

Annual Report 2021The Board of Directors and the Chief Executive Officer of Investment AB Latour (publ) herewith present the Annual Report and consolidated financial statements for 2021.
Directors’ report 86
Consolidated income statement 89
Consolidated balance sheet 90
Consolidated cash flow statement 92
Change in consolidated equity 93
Change in interest-bearing net debt 93
Parent company income statement 94
Parent company balance sheet 95
Parent company cash flow statement 96
Parent company statement of changes in equity 96
Notes to the financial statements 97
Proposed allocation of profits 125
Auditor’s report 126
L A T O U R A N N U A L R E P O R T 2 0 2 1 8 5
A N N U A L R E P O R T
Directors’ report The GroupINVESTMENT AB LATOUR is a mixed investment company. Latour’s investments mainly consist of a wholly-owned indus-trial operation grouped into six business areas and an invest-ment portfolio containing ten holdings in which Latour is the principal owner or one of the principal owners. At 31 Decem-ber 2021, the market value of the investment portfolio was SEK 98 billion. In addition to the above two operational branches, Latour has an investment area that focuses on sus-tainability-oriented growth companies, Latour Future Solutions, as well as a small portfolio of part-owned holdings.
Group-wide activities are carried out in Latour’s subsidiar-ies Nordiska Industri AB and Latour-Gruppen AB. The sub-sidiary Karpalunds Ångbryggeri AB trades in shares and other securities and the subsidiary Latour Förvaltning AB special-ises in the management of securities.
CHANGES TO INDUSTRIAL OPERATIONS Latour’s aim is at least 10 per cent annual growth of its indus-trial operations over a business cycle through a combination of organic growth and acquisitions. The goal is to own stable and sustainable industrial companies with proprietary prod-ucts and favourable conditions for international expansion.
In 2021, ten acquisitions were made in the business areas. These contributed an aggregate of just over SEK 2,300 m to sales, of which approximately SEK 1,680 m is included in the net sales for 2021.
Bemsiq, formerly a business unit within Latour Industries, is being recognised as a separate business area as from the fourth quarter of 2021. Bemsiq made three acquisitions during the year. In January, the acquisition of 70 per cent of the Swed-ish company Elsys was finalised. There is an option to acquire remaining outstanding shares within the next few years. The company is an internationally leading manufacturer and seller of LoRaWAN® sensors for applications for smart buildings and cities. Elsys has 7 employees and generates sales of approxi-mately SEK 50 m. On 27 May, Produal, within Bemsiq, acquired the entire shareholding of the Finnish company HK Instruments Oy, which generates net sales of approximately EUR 8 m and has 50 employees. HK Instruments has its head office and manufacturing operations in Muurame, Finland, and is a supplier of advanced measuring devices for building automation. The company specialises in technologically advanced measuring instruments for applications within heat-ing, ventilation and air conditioning, encompassing various pressure transmitters, switches, liquid meters and gas detec-tors. On 29 September, Bemsiq acquired the entire sharehold-ing of the Canadian company Greystone Energy System Inc. The company has over 30 years of experience in designing, manufacturing and supplying HVAC sensors and transmitters for the building automation industry. The company’s head office and manufacturing facilities are in Moncton, Canada, and it has over 120 employees globally, with sales offices in Canada, USA, Dubai, India, Singapore and Malaysia. Grey-stone has sales of approximately CAD 27 m, with a level of profitability well above Latour’s financial targets.
The Hultafors Group business area made two acquisitions during the year. On 1 March, the acquisitions of the entire
shareholdings of Fristads AB, Kansas A/S, Kansas GmbH and Leijona Group Oy were finalised. The companies are leading brands in professional workwear and have strong footholds in their respective key markets. The companies’ net sales total approximately EUR 130 m and they employ more than 600 people altogether. On 29 October, the entire shareholding of the Danish company Scangrip A/S was acquired. The com-pany is a leading manufacturer of innovative LED work lights (e.g. floodlights, hand-held lamps, headlamps and torches) for professionals. The company is based in Svendborg, Denmark, with the majority of sales in Europe and North America. The company’s net sales amount to just over DKK 220 m with a profitability well in line with Hultafors Group’s other opera-tions. The company has about 50 employees.
The Latour Industries business area completed four acquisi-tions during the year. In January, the acquisition of the entire shareholding of the Italian company Vega S.R.L. was finalised. The company is a leading designer and manufacturer of pas-senger interface systems and electronic systems for elevators and platform lifts. Sales amount to approximately EUR 25 m and the company has 200 employees. On 8 January, Densiq, within Latour Industries, acquired the entire shareholding of the Danish company VM Kompensator A/S, which has net sales of approximately DKK 20 m. The company is a leading Danish designer and manufacturer of compensators for use in industrial applications. On 9 July, Aritco, within Latour Indus-tries, signed an agreement to acquire the entire shareholding of the Swedish company Motala Hissar. The agreement was concluded in August. Motala Hissar is a well-established and leading manufacturer of platform lifts. The company has its head office, development operations and production facilities in Motala, while sales are handled primarily by distributors spread across much of Europe. Net sales total approximately SEK 200 m, with the majority being export sales. The com-pany has about 50 employees. On 30 September, Densiq, within Latour Industries, acquired DEPAC Anstalt based in Liechtenstein, a leading designer and manufacturer of mechanical seals used in industrial applications. The company is headquartered in Liechtenstein and has a subsidiary in Aus-tria. It reports sales of approximately EUR 8 m, with a strong operating margin and robust growth.
The Swegon business area made one acquisition during the year. On 5 July, an agreement was signed to acquire a majority shareholding of the Finnish software company 720° (Seven Twenty degrees). The agreement was concluded in August. The company offers software that can analyse, measure and visualise the indoor environments of buildings. 720° has eight employees and generates sales of approximately EUR 0.5 m. The services offered by 720° are currently used in more than 200 buildings, primarily in Finland.
Further information regarding company acquisitions is presented in Note 45.
CHANGES TO THE INVESTMENT PORTFOLIOLatour acquired 31.0 per cent of the shares in CTEK AB when the company began trading on the Nasdaq Stockholm market. CTEK is a leading global supplier of premium battery chargers.
D I R E C T O R S ’ R E P O R T
8 6 L A T O U R A N N U A L R E P O R T 2 0 2 1

CHANGES IN LATOUR FUTURE SOLUTIONS AND IN OTHER HOLDINGSLatour Future Solutions has made two investments during the year, both through directed share issues, where Latour Future Solutions has become a minority shareholder in Aqua Robur Technologies AB and Swedish Hydro Solutions AB. Aqua Robur offers water utilities a complete solution for digitalising their water networks by collecting data from all types of water pipes. Swedish Hydro Solutions offers sustainable solutions for water treatment via mobile and stationary treatment systems for bilge and stormwater, process water and remediation of polluted areas.
In December, Latour-Gruppen AB signed an agreement to sell its shares in Neuffer Fenster + Türen GmbH (“Neuffer”). The sale was concluded in January 2022.
EVENTS AFTER THE REPORTING PERIODOn 1 February, Hultafors Group acquired the entire share-holding of Telesteps AB, which reported net sales of SEK 87 m in 2021. On 7 February, Bemsiq entered into an agreement to acquire the entire shareholding of Consens GmbH, which reported net sales of EUR 2.9 m in 2021. On 9 February, Latour Industries acquired the entire shareholding of Esse-Ti S.r.l., which has net sales of approximately EUR 10 m.
RESULTS AND FINANCIAL POSITIONThe Group’s profit after financial items was SEK 4,985 m (5,753 m). Profit after tax was SEK 4,381 m (5,324 m), which is equiva-lent to SEK 6.85 (8.32) per share. A revaluation of the holding in Alimak has adversely impacted the income statement by SEK
–282 m. Capital gains and other items that affect the compara-bility of results had a favourable SEK 1,856 m impact on last year’s income statement. The Group’s cash in hand and liquid investments reached SEK 1,516 m (4,033 m). Interest-bearing debt, excluding pension liabilities and lease liabilities, totalled SEK 9,866 m (8,778 m). The Group’s net debt was SEK 9,513 m (5,273 m). Net debt, excluding lease liabilities, was SEK 8,443 m (4,613 m). The equity ratio was 88 (86) per cent calculated on reported equity in relation to total assets, including undisclosed surpluses in associated companies. For further information, see the ten-year overview on page 139.
INVESTMENTSDuring the period, SEK 835 m (604 m) was invested in prop-erty, plant and equipment, of which SEK 417 m (310 m) was machinery and equipment, SEK 0 m (13 m) was vehicles, and SEK 418 m (281 m) was buildings. Fixed assets in newly acquired companies account for SEK 467 m (127 m) of invest-ments for the year.
Parent companyPARENT COMPANY PROFIT The parent company’s profit after financial items was SEK 1,823 m (3,328 m). The parent company’s equity ratio was 57 (66) per cent.
THE LATOUR SHARE Not including repurchased shares, the number of outstanding
shares at 31 December 2021 amounted to 639,322,800. The share option scheme from 2017 expired in 2021 and 93,300 repurchased shares were sold net through redemption of call options. Remaining options from the share option scheme from 2017 were redeemed at market value. During November, Latour implemented the repurchase of its own shares, after which Latour holds a total of 517,200 class B shares. At 31 December 2021, the number of call options issued to senior executives was 2,269,200, which give the right to purchase the same number of shares. 674,300 of the call options were issued during the year according to the resolution of the 2021 Annual General Meeting. 5,200 class A shares were converted to class B shares in Decem-ber. After this, the allocation of issued shares is 47,629,848 class A shares and 592,210,152 class B shares. Further share informa-tion can be found on pages 34 and 35 and in Note 35.
PERSONNELThe average number of employees in the Group was 7,684 (6,262). Of these, 5,651 (4,534) were employed abroad. Infor-mation about salaries and remuneration and a breakdown of the number of employees are presented in Note 10.
CURRENCY EXPOSUREThe subsidiaries’ sales and purchases in foreign currencies are balanced through the Group’s joint finance function. At the balance sheet date, sales covered by forward exchange contracts totalled SEK 453 m. Currency hedging amounted to SEK 446 m, not including hedging through currency clauses in major import deals. There is a relatively good balance between purchases and sales in foreign currencies, with the exception of net sales in NOK, GBP and EUR and net pur-chases in USD. For further information, see Note 34.
RISKS IN INDUSTRIAL OPERATIONSAs an owner of diversified industrial operations and an invest-ment portfolio with ten holdings, Latour automatically has a relatively good diversification of risks. The Group has custom-ers in a range of industries with a preponderance in the con-struction industry. Sales in the construction industry are well distributed between new construction and repairs and main-tenance. Moreover, there is a good geographical spread and a relatively even distribution between commercial premises, public premises and housing. The Board conducts an annual, structured risk analysis, including sustainability-related risks and opportunities, to assess and evaluate Latour’s risk expo-sure. Read more about risk management on page 133.
FINANCIAL RISKSInformation concerning financial instruments and risk expo-sure is presented in Note 34.
RELATED PARTY TRANSACTIONSThe Group did not enter into any related party transactions that had a material effect on its performance and financial position, except for dividend payments.
Cont.
L A T O U R A N N U A L R E P O R T 2 0 2 1 8 7
D I R E C T O R S ’ R E P O R T

BOARD OF DIRECTORS Latour’s Board of Directors consists of nine members, including the Chief Executive Officer. There are no deputies. All members are elected for a one-year term. Except for the Chief Executive Officer, no members have an operational role in the Group. The secretary of the Board is the Chief Financial Officer of the Group. Olle Nordström was elected Chairman of the Board by the 2021 Annual General Meeting.
Members of the Board represent 79 per cent of the compa-ny’s voting power and 75 per cent of its share capital. Employ-ees are represented in the subsidiary Latour-Gruppen AB, which is the parent company of the wholly-owned companies within industrial operations. They are therefore not repre-sented in the investment company’s board.
Each year, the Board establishes written rules of procedure that regulate the Board’s meetings, the business of these meetings, the division of responsibilities among Board mem-bers and the Chief Executive Officer and certain other mat-ters. The Board issues instructions for the Chief Executive Officer that regulate his work tasks and reporting obligation to the Board of Directors.
The Board has had four ordinary meetings during the year to date, not including the inaugural Board meeting, and four additional Board meetings. One of the Board members was unable to attend on two occasions and one of the Board mem-bers was unable to attend on one occasion. Otherwise there has been full attendance.
The company’s auditor attended two Board meetings and presented reports and observations from the audits per-formed.
Matters dealt with by the Board include strategic changes in the investment portfolio, acquisitions and sales of subsidi-aries, the company’s strategic process and risk exposure, budgets and forecasts for the subsidiaries, as well as a finan-cial review and the outcome of the sustainability commit-ments in the operations.
Under the direction of the Chairman, the Board has evaluated its work and all Board members have presented their views.
The Corporate Governance Statement is presented on pages 131–134 and 136.
GUIDELINES FOR REMUNERATION TO SENIOR EXECUTIVESThe following guidelines were approved at the 2021 Annual General Meeting: Remuneration to the Chief Executive Officer and other senior executives consists of basic salary, variable remuneration and pension. Other senior executives refer to other senior executives who are part of the parent company’s management team, as well as business area managers. Variable remuneration is based on the achievement of targets and can amount to 0 to 100 per cent of the basic salary. To promote a long-term perspective, the Board may decide on compensa-tion, in addition to the annual variable remuneration, related to the long-term development of the business area’s value over a period of three years, capped at one-third of the basic salary per year over a three-year period.
Variable remuneration will not be pensionable for the CEO or other senior executives who are members of the parent company’s management team. For business area managers, variable remuneration can only be pensionable to the extent deriving from mandatory collective agreement provisions.
The pension premiums for defined contribution pensions will amount to a maximum of 35 per cent of the basic salary.
The Board of Directors may waive the guidelines approved at the Annual General Meeting should there be particular rea-son for doing so in any individual case.
The Board also has the right to approve additional remu-neration to the company management in the form of share-related incentive schemes (e.g. a call option pro-gramme) provided that they promote long-term commitment to the organisation and they are provided on market-related terms.
SUSTAINABILITY REPORTSustainability issues have always played a central role within Latour, and this is presented in Latour’s sustainability report on pages 18–31. The auditor’s opinion on the statutory sus-tainability report is presented on page 130.
ENVIRONMENTAL IMPACTThe Latour Group’s wholly-owned companies run operations requiring licensing and registration under the Swedish En - vironmental Code. In Sweden, one of the Group’s subsidiaries is required to have a licence and eight of the subsidiaries are required to register under the Code. The companies that are required to be licensed and registered have production opera-tions in the engineering industry. The environmental impact comprises emissions to the air and discharges into municipal treatment plants.
All of these companies have the necessary permits and have complied with the current requirements for their operations.
COVID-19The Covid-19 pandemic has affected Latour’s operations dur-ing the year, although to a minor extent and in different ways depending on geography and market segment. The compa-nies in Europe and North America have been less affected than the companies in Asia. The business areas have availed themselves of various government support schemes in con-nection with Covid-19, but only to a very small extent. Latour has received a total of SEK 2 (64) m, of which SEK 0 (11) m in Sweden.
PROPOSED DIVIDENDS AND ALLOCATION OF PROFITSThe Board of Directors proposes that the Annual General Meeting approve an increase in the ordinary dividend to SEK 3.30 (3.00) per share, which in absolute terms equates to a payout of SEK 2,110 m.
The Board’s proposal for the allocation of profits is pre-sented in full on page 125.
OUTLOOK FOR 2022The holdings continued to develop positively during 2021, with strong growth in terms of order intake. Supply short-ages and disruptions to global logistics chains meant that invoicing did not grow at the same rate, and the margins were negatively affected in the short term due to increases in raw material and freight costs. The order book is at a record level as we move into 2022, and the conditions look good for operations to continue growing profitably and for us to fur-ther advance our positions, although no forecast is being provided for 2022.
Parent company cont.
D I R E C T O R S ’ R E P O R T
8 8 L A T O U R A N N U A L R E P O R T 2 0 2 1

Consolidated income statement
SEK m Note 2021 2020
Net sales 4–6 18,567 15,028
Cost of goods sold –11,479 –9,151
Gross profit 7,088 5,877
Sales costs –2,807 –2,254
Administrative costs –1,327 –1,189
Research and development costs –476 –406
Other operating income 13 190 134
Other operating expenses 13 –112 –105
Operating profit 7–12 2,556 2,057
Income from interests in associates 14 2,379 3,977
Income from equity investment 15 12 –8
Management costs attributable to the investment portfolio –28 –28
Profit before financial items 4,919 5,998
Finance income 16 186 31
Finance expense 17 –120 –276
Profit after financial items 4,985 5,753
Taxes 18 –604 –429
Profit for the year 4,381 5,324
Attributable to:
Parent company shareholders 4,377 5,320
Non-controlling interests 4 4
Earnings per share, based on earnings attributable to shareholders of the parent company 35
Basic share SEK 6.85 SEK 8.32
Diluted share SEK 6.82 SEK 8.29
Statement of comprehensive incomeSEK m 2021 2020
Profit for the year 4,381 5,324
Other comprehensive income:
Items that will not be recycled to the income statement
Restatement of net pension obligations 8 3
8 3
Items that may subsequently be recycled to the income statement (net after tax)
Translation differences 418 –571
Change in fair value reserve for the year 0 0
Change in hedging reserve for the year –58 125
Share of other comprehensive income from associates –239 –994
121 –1,440
Other comprehensive income, net after tax 39 129 –1,437
Comprehensive income for the year 4,510 3,887
Attributable to:
Parent company shareholders 4,506 3,883
Non-controlling interests 4 4
L A T O U R A N N U A L R E P O R T 2 0 2 1 8 9
C O N S O L I D A T E D I N C O M E S T A T E M E N T

Consolidated balance sheet
SEK m Note 2021 2020
ASSETS
Fixed assets
Intangible assets 19 12,595 10,304
Property, plant and equipment
Buildings 20 1,925 1,207
Land and land improvements 21 111 76
Machinery 22 545 383
Equipment 23 392 305
Construction work in progress and advances 24 47 102
Financial assets
Interests in associates 26 22,184 19,997
Other long-term securities holdings 27 54 43
Deferred tax asset 39 454 372
Other long-term receivables 28 31 27
38,338 32,816
Current assets
Inventories etc. 29
Raw materials and consumables 1,269 721
Work-in-progress 453 166
Finished work and goods for resale 2,012 1,225
Work in progress 19 9
Advance payments to suppliers 43 6
Listed shares – trading 30 0 0
Current receivables
Accounts receivable 31 3,511 2,397
Current tax asset 141 103
Derivative instruments 32 130 201
Other current receivables 246 221
Prepaid expenses and accrued income 259 189
Cash and cash equivalents 33 1,516 4,033
9,599 9,271
Total assets 47,937 42,087
C O N S O L I D A T E D B A L A N C E S H E E T
9 0 L A T O U R A N N U A L R E P O R T 2 0 2 1

Consolidated balance sheet
SEK m Note 2021 2020
EQUITY
Capital and reserves attributable to parent company shareholders 35
Share capital 133 133
Repurchased shares –164 –83
Reserves 357 –1
Profit brought forward 31,227 29,018
31,553 29,067
Non-controlling interests 133 81
Total equity 31,686 29,148
LIABILITIES
Long-term liabilities
Retirement benefit obligations 37 227 91
Deferred tax liability 39 535 418
Other provisions 40 190 169
Leasing liabilities 12 846 516
Interest-bearing liabilities 38 9,429 6,903
11,227 8,097
Current liabilities
Bank overdraft facilities 41 114 85
Debts to credit institutions 34 240 1,781
Advances from customers 810 334
Accounts payable 1,568 977
Current tax liability 222 125
Other provisions 40 14 2
Derivative instruments 32 1 1
Leasing liabilities 12 224 144
Other liabilities 455 345
Accrued expenses and deferred income 42 1,376 1,048
5,024 4,842
Total liabilities 16,251 12,939
Total equity and liabilities 47,937 42,087
L A T O U R A N N U A L R E P O R T 2 0 2 1 9 1
C O N S O L I D A T E D B A L A N C E S H E E T

Consolidated cash flow statement
SEK m Note 2021 2020
Operating profit 2,556 2,057
Depreciation/amortisation 573 424
Capital gains 4 1
Other adjustments to non-cash items 0 6
Paid tax –442 –368
Operating cash flows before movements in working capital 2,691 2,120
Movements in working capital
Inventories –1,121 87
Accounts receivable –714 204
Current receivables –15 42
Current operating liabilities 941 –118
–909 215
Operating cash flows 1,782 2,335
Investments
Acquisition of subsidiaries 45 –2,289 –692
Sale of subsidiaries 0 0
Acquisition of fixed assets –306 –540
Sale of fixed assets 24 10
Investing cash flows –2,571 –1,222
Equity investment
Dividends received 1,029 927
Management costs etc. –19 –19
Purchase of listed shares etc. –103 –70
Purchase of shares in associates –1,098 –133
Sale of listed shares 105 35
Sales of shares in associates 0 2,484
Cash flows from equity investment –86 3,224
Cash flows after investments and equity investment –875 4,337
Financial payments
Interest received 168 32
Interest paid –136 –274
Net change in borrowings 36 276 –165
Dividends paid –1,918 –799
Exercise of call options –42 –40
Issued call options 22 11
Repurchase of own shares –81 0
Cash flows from financial payments –1,711 –1,235
Change in cash and cash equivalents –2,586 3,102
Cash and cash equivalents at beginning of the year 4,033 1,029
Exchange rate difference in cash and cash equivalents 69 –98
Cash and cash equivalents at end of the year 33 1,516 4,033
C O N S O L I D A T E D C A S H F L O W S T A T E M E N T
9 2 L A T O U R A N N U A L R E P O R T 2 0 2 1

Change in consolidated equity
Change in consolidated interest-bearing net debt
SEK m 31/12/2020
Change in cash and cash
equivalentsChange in loans
Other changes 31/12/2021
Receivables 22 1 23
Swap 200 –89 111
Cash and cash equivalents 4,033 –2,643 126 1,516
Retirement benefit obligations –91 –137 –228
Lease liability, long-term –516 –330 –846
Long-term liabilities –6,904 –1,535 –989 –9,428
Utilised bank overdraft facilities –85 –29 –114
Lease liability, short-term –144 –80 –224
Current liabilities –1,788 1,465 –323
Interest-bearing net debt –5,273 –2,643 –99 –1,498 –9,513
Attributable to parent company shareholders
Non- controlling
interests TotalNote Share
capitalRepurchased
own shares Reserves
Profit broughtforward
Opening equity 1 Jan 2020 36 133 –67 442 25,502 80 26,090
Total comprehensive income –443 4,329 1 3,887
Change in non-controlling interests 0
Issued call options 11 11
Exercise of call options 79 –25 54
Repurchased shares –95 –95
Dividends –799 –799
Closing balance 31 Dec 2020 133 –83 –1 29,018 81 29,148
Opening balance 1 Jan 2021 36 133 –83 –1 29,018 81 29,148
Total comprehensive income 358 4,147 5 4,510
Change in non-controlling interests 47 47
Issued call options 22 22
Exercise of call options 102 –42 60
Repurchased shares –183 –183
Dividends –1,918 –1,918
Closing equity 31 Dec 2021 133 –164 357 31,227 133 31,686
L A T O U R A N N U A L R E P O R T 2 0 2 1 9 3
C H A N G E I N C O N S O L I D A T E D E Q U I T Y

Parent company income statement
SEK m Note 2021 2020
Income from interests in Group companies – dividends 970 499
Income from interests in associates 14 871 2,842
Income from equity investment — —
Management costs –22 –22
Profit before financial items 1,819 3,319
Interest income 41 44
Interest expense –37 –35
Profit after financial items 1,823 3,328
Taxes 18 — —
Profit for the year 1,823 3,328
Statement of comprehensive income for the parent companySEK m Note 2021 2020
Profit for the year 1,823 3,328
Other comprehensive income:
Items that may subsequently be recycled to the income statement
Change in fair value reserve for the year — —
Other comprehensive income, net after tax 0 0
Comprehensive income for the year 1,823 3,328
P A R E N T C O M P A N Y I N C O M E S T A T E M E N T
9 4 L A T O U R A N N U A L R E P O R T 2 0 2 1

Parent company balance sheet
SEK m Note 2021 2020
ASSETS
Fixed assets
Financial assets
Interests in subsidiaries 25 3,746 3,746
Interests in associates 26 9,694 8,639
Receivables from Group companies 7,300 5,650
20,740 18,035
Current assets
Current receivables
Receivables from Group companies 75 16
Prepaid expenses and accrued income 21 12
Cash and cash equivalents 390 706
486 734
Total assets 21,226 18,769
EQUITY AND LIABILITIES
Equity 35
Restricted equity
Share capital 133 133
Other funds 96 96
Non-restricted equity
Profit brought forward 10,100 8,791
Profit for the year 1,823 3,328
12,152 12,348
Long-term liabilities
Debts to credit institutions 9,050 6,400
Other non-interest-bearing liabilities — —
9,050 6,400
Current liabilities
Debts to Group companies — —
Prepaid income and accrued expenses 24 21
24 21
Total equity and liabilities 21,226 18,769
L A T O U R A N N U A L R E P O R T 2 0 2 1 9 5
P A R E N T C O M P A N Y B A L A N C E S H E E T

Parent company cash flow statement
Change in parent company equity
SEK m Note 2021 2020
Current receivables –1 12
Current operating liabilities –6 1
Operating cash flows –7 13
Equity investment
Dividends received 871 757
Management costs etc. –22 –34
Purchase of listed shares etc. –1,054 –128
Sale of listed shares 0 2,497
Cash flows from equity investment –205 3,092
Cash flows after investments and equity investment –212 3,105
Financial payments
Interest received 41 43
Interest paid –37 –39
New borrowings 941 –574
Dividends received from subsidiaries 970 499
Shareholder contribution made 0 –1,500
Dividends paid –1,918 –799
Exercise of call options –42 –40
Issued call options 22 11
Repurchase of own shares –81 0
Cash flows from financial payments –104 –2,399
Change in cash and cash equivalents –316 706
Cash and cash equivalents at beginning of the year 706 0
Cash and cash equivalents at end of the year 390 706
Other funds
SEK m NoteShare
capitalReserve
fundFair
value fund
Profit broughtforward Total
Closing balance 31 Dec 2019 36 133 96 0 9,620 9,849
Total comprehensive income 3,328 3,328
Dividends paid –799 –799
Repurchase of own shares –95 –95
Exercise of call options 54 54
Issued call options 11 11
Closing balance 31 Dec 2020 36 133 96 0 12,119 12,348
Total comprehensive income 1,823 1,823
Dividends paid –1,918 –1,918
Repurchase of own shares –81 –81
Exercise of call options –42 –42
Issued call options 22 22
Closing balance 31 Dec 2021 133 96 0 11,923 12,152
P A R E N T C O M P A N Y C A S H F L O W S T A T E M E N T
9 6 L A T O U R A N N U A L R E P O R T 2 0 2 1

Notes to the financial statements (All amounts are in SEK m unless stated otherwise)
NOTE 1 General information
Investment AB Latour (publ), corporate registration number 556026-3237, is a mixed investment company with wholly-owned industrial operations and an investment portfolio, which consists of ten substantial holdings. The parent company is a limited company registered in Gothenburg, Sweden. The head office address is J A Wettergrens gata 7, Box 336, SE-401 25 Goth-enburg, Sweden. The parent company is listed on the Nasdaq OMX Stock-holm Large Cap list.
The Board of Directors and the Chief Executive Officer have approved these consolidated financial statements for publication on 15 March 2022. The Annual Report and consolidated financial statements will be presented to the Annual General Meeting on 10 May 2022 for approval.
NOTE 2 Accounting policies
Basis of preparation of the consolidated financial statementsThe consolidated financial statements for Investment AB Latour have been prepared in accordance with the International Financial Reporting Stand-ards (IFRS) published by the International Accounting Standard Board (IASB) and the interpretations of the International Financial Reporting Interpretations Committee (IFRIC IC) which have been approved by the EU. Furthermore, the Group has applied the Swedish Annual Accounts Act and RFR 1 Supplementary Accounting Rules for Groups.
The consolidated financial statements have been prepared using the cost method except for revaluations of available-for-sale financial assets, and financial assets and liabilities (including derivative instruments) measured at fair value through the income statement.
The preparation of statements in conformity with the IFRS requires the use of certain estimates for accounting purposes. It also requires manage-ment to exercise its judgement in the process of applying the company’s accounting policies. The areas that involve a significant degree of estimation that are complex, or where assumptions and estimates are critical to the consolidated financial statements, are set out in Note 48.
The parent company applies the same accounting policies as the Group, except in the cases presented below in “Parent company accounting poli-cies”. The differences between the parent company’s and the Group’s poli-cies are due to limitations in the ability to apply the IFRS in the parent com-pany because of the Swedish Annual Accounts Act and the Pension Obligations Vesting Act (Tryggandelagen) and also, in some cases, because of tax reasons.
New and amended accounting policies New and amended standards that are mandatory for the first time for the financial year beginning 1 January 2021.The new standards and interpretations that became mandatory on 1 January 2021 have not had a material impact on the financial performance or posi-tion of Investment AB Latour.
New standards, amendments to and interpretations of existing standards that have not yet come into effect and have not been adopted early. A number of new standards and interpretations are effective for annual reporting periods starting after 1 January 2021 and have not been adopted for the preparation of these financial statements. These new standards and inter-pretations are not expected to have any significant impact on the Group’s financial statements in current or future periods, nor on future transactions.
Consolidated financial statementsSubsidiariesSubsidiaries are all entities controlled by the Group. Control is achieved when the Group is exposed, or has rights, to variable returns from its involvement with the entity and has the ability to affect those returns through its power over the entity.
Business combinations are accounted for using the acquisition method. This method means that equity, including the capital portion of untaxed reserves in the subsidiary at the acquisition date, is entirely eliminated. Con-sequently, only profit generated after the acquisition date is included in Group equity.
The purchase price for the acquisition of a subsidiary is the fair value of transferred assets, liabilities and the shares issued by the Group. The purchase price includes the fair value of all assets or liabilities resulting from an agreement on conditional consideration. If the group-wise cost of the shares exceeds the book value of the company’s net assets in the acquisi-tion analysis, the difference is recognised as goodwill in the consolidated statement. If the acquisition cost is lower than the fair value of the acquired subsidiary’s net assets and any contingent liabilities, the difference is recog-nised directly in the income statement. Acquisition-related costs are expensed as they occur. Identifiable acquired assets and transferred liabili-ties in a business combination are initially valued at fair value at the acqui-sition date. The Group determines, for each acquisition, whether all the non-controlling interests in the acquired entity will be recognised at fair value or at the proportional share of the acquired entity’s net assets.
Companies acquired during the year are included in the consolidated financial statements with amounts relating to the post-acquisition period. Profits from companies sold during the year have been included in the con-solidated income statement for the period up to the disposal date.
The assets and liabilities of Latour’s foreign Group companies are trans-lated at the exchange rate prevailing at the balance sheet date. All items in the income statement are translated at the average exchange rate for the year. Translation differences are recognised directly in Group equity.
Internal Group transactions, balance sheet items, income and expenses on transactions between Group companies are eliminated. Gains and losses arising from internal Group transactions reported under assets are also eliminated.
Associated companiesAssociated companies are entities over which the Group exercises signifi-cant influence, but not control. As a rule, significant influence exists when the Group holds between 20 per cent and 50 per cent of the voting rights.
Latour holds shares in AB Fagerhult representing 48 per cent of the vot-ing rights. The management has concluded that Latour does not have a con-trolling influence over Fagerhult and the holding is therefore regarded as an associated company. This is based on the following factors:
Even though Latour has a significant ownership interest, there are several other large shareholders, the three largest of which (apart from Latour) have approximately 21 per cent. Moreover, two of these shareholders are represented in the Nomination Committee. Fagerhult’s Board operates as a professional board with a majority of members with no relationship to Latour. Fagerhult is operated as a wholly independent company and not as an integrated company. The companies’ management functions are com-pletely separate from one another and there is no exchange or other practi-cal circumstances whatsoever to suggest that Fagerhult’s executive manage-ment reports to Latour.
Investment in associates is accounted for using the equity method. This method entails that the book value of shares in associated companies in the Group’s accounts corresponds to the Group’s participation in associated companies’ equity and any residual value in group-wise surpluses and defi-cits. The Group’s share of the profit after tax of its associates, with any adjustment for amortisation or reversal of acquired surpluses or deficits, is recognised in the Group’s income statement as “Income from interests in associates”.
When the Group no longer has a controlling or significant influence, each retained holding is remeasured to fair value and the change in carrying amount is recognised in the income statement. The fair value is used as the first carrying amount and forms the basis for further reporting of the
Cont.
L A T O U R A N N U A L R E P O R T 2 0 2 1 9 7
N O T E S

retained holding as an associated company, joint venture or financial asset. All amounts relating to the divested entity previously reported in other comprehensive income are reported as if the Group had directly sold the associated assets or liabilities. This may result in amounts that were previ-ously reported in other comprehensive income being reclassified to the income statement.
If the ownership stake in an associated company is reduced, but a signifi-cant influence is retained, only a proportional share of the amounts previ-ously reported in other comprehensive income are, where relevant, reclassi-fied to the income statement.
RevenueRevenue in the ordinary operations comprises the sale of goods or services. Revenue from the sale of services is defined as invoiced business activities that do not include physical goods, or where the physical good is of subordi-nate importance to the service in the agreement. Goods that are not covered by a service agreement are recognised as separate performance obligations and classified as revenue from the sale of goods. Revenue is recognised when control has passed to the buyer. The sale is recognised net of volume dis-counts, returns and other variable remuneration. Revenue from the sale of goods is recognised at a point in time. Revenue from service and/or mainte-nance agreements is recognised either at a point in time or over a period of time. For income and expenses arising from the rendering of services, reve-nue and costs should be recognised by reference to the stage of completion of the transaction at the balance sheet date (the percentage-of-completion method). The stage of completion of a transaction is determined by compar-ing the costs incurred at the balance sheet date with estimated total costs.
Any expected losses on agreements are recognised in full in the period when the loss is likely to occur and can be estimated. See Notes 3, 4 and 6 for a breakdown of revenue by segment, geographic area and category.
Other operating income and operating expensesOther operating income and operating expenses include income and expenses from activities outside ordinary operations. See Note 13.
Finance income and expense Finance income and finance expense comprise interest income and interest costs, dividend revenue and realised and unrealised foreign exchange losses and gains.
Interest income on receivables and interest costs on liabilities are calculated using the effective interest rate method. Interest costs are recognised in the period they occur regardless of how the borrowed funds are used. Interest costs include transaction costs for loans which have been recorded over the term of the contract, which is also valid for any difference between received funds and repayment amounts. Dividend revenue is recognised when the dividend has been approved and the right to receive the payment has been established.
Borrowing costsBorrowing costs that are directly attributable to the production of an asset, for which borrowing costs can be added to the cost, are capitalised during the period of time required to complete the work and get the asset ready for its intended use. Other borrowing costs are expensed as incurred.
InventoriesInventories are stated at the lower of cost and net realisable value. Cost is determined by the first-in first-out method or the weighted average cost method if this is a good estimate of FIFO. The net realisable value is the estimated sales price in the operating activities, with a deduction for appli-cable variable sales costs. The value of finished goods and work-in-progress includes raw materials, direct work, other direct costs and production-re-lated overheads. Obsolescence is depreciated separately. When assessing net realisable values, consideration is given to the age and turnover rate for the items in question. The change between the opening and closing provi-sion for obsolescence for the year affects operating profit in its entirety.
Translation of foreign currenciesFunctional and presentation currencies Items included in the financial statements of each of the Group’s entities are measured using the currency of the primary economic environment in which the entity operates (“the functional currency”). The consolidated financial statements are presented in Swedish crowns (SEK), which is the parent company’s functional and presentation currency.
Transactions and balances Transactions in foreign currencies are translated into the functional cur-
rency at the exchange rates ruling at the date of the transaction. Currency gains and losses arising on payment of such transactions and on translation of monetary assets and liabilities denominated in foreign currencies at the exchange rate ruling at the balance sheet date are recognised in the income statement. The exception to this is when the transactions relate to qualify-ing cash flow hedges and qualifying net investment hedges, in which case gains/losses are recognised in equity.
Translation differences on non-monetary items, such as shares measured at fair value through the income statement, are recognised as part of the fair value gain/loss. Translation differences on non-monetary items, such as equities classified as available-for-sale financial assets, are taken to a reserve for fair value in equity.
Group companies The results and financial position of all Group companies (none of which has the currency of a hyperinflationary economy) that have a functional currency different from the presentation currency are translated into the Group’s presentation currency as follows:• assets and liabilities for each balance sheet presented are translated at
the closing rate at the date of that balance sheet, • income and expenses for each income statement are translated at average
exchange rates (unless this average rate is not a reasonable approxima-tion of the cumulative effect of the rates prevailing on the transaction dates, in which case income and expenses are translated at the dates of the transactions), and
• all exchange differences arising are presented as a separate line item under equity. On consolidation, exchange differences arising from the translation of
net investment in foreign operations, and of borrowings and other currency instruments designated as hedges of such investments, are taken to equity. On disposal of a foreign operation, the exchange differences are recognised in the income statement as part of the gain or loss on sale.
Goodwill and changes in fair value arising on the acquisition of a foreign operation are treated as assets and liabilities of that operation and are translated at the exchange rate ruling at the balance sheet date.
Property, plant and equipmentLand and buildings largely comprise factories, warehouses and offices. Prop-erty, plant and equipment are stated at historical cost less depreciation. Historical cost includes expenditure that is directly attributable to the acquisition of the asset.
Subsequent costs are included in the asset’s carrying amount or recog-nised as a separate asset, as appropriate, only when it is probable that the future economic benefits associated with the asset will flow to the Group and the cost of the asset can be measured reliably. All other repairs and maintenance are charged to the income statement during the reporting period in which they are incurred.
Depreciation of assets is calculated using the straight line method over the following estimated useful economic lives: Buildings 25–50 yearsLand improvements 10–20 yearsMachinery 5–10 yearsVehicles and computers 3–5 yearsOther inventories 5–10 years
The residual values and useful lives of the assets are reviewed, and adjusted if necessary, at each balance sheet date.
An asset’s carrying amount is written down immediately to its recovera-ble amount if the asset’s carrying amount is greater than its estimated recoverable amount.
Profits and losses in divestitures are determined by comparing sales reve-nue and carrying amount and are reported in the income statement.
Intangible assetsGoodwillGoodwill is the amount by which the cost exceeds the fair value of the Group’s share of the acquired subsidiary’s or associated company’s identifia-ble net assets on the date of acquisition. Goodwill arising on acquisition of subsidiaries is recognised as an intangible asset. Goodwill arising on acqui-sition of associated companies is included in the value of holdings in associ-ates.
Goodwill is tested for impairment annually and is carried at cost less any accumulated impairment losses. Impairment losses recognised in respect of goodwill are not reversed. Gains or losses on the disposal of an entity include the remaining carrying amount of goodwill relating to the entity sold.
Note 2 cont.
N O T E S
9 8 L A T O U R A N N U A L R E P O R T 2 0 2 1

Goodwill is allocated to cash-generating units for the purpose of impair-ment testing.
Trademarks and licences Trademarks and licences are recognised at cost. Trademarks and licences have finite useful lives and are carried at cost less accumulated amortisa-tion. Amortisation is charged on a straight-line basis over the estimated useful lives (5–20 years) of the trademarks and licences.
ImpairmentAssets that have an indefinite useful life are not subject to amortisation but are tested for impairment annually. Assets that are subject to amortisation are assessed for impairment whenever events or changes in circumstances indicate that the carrying amount may not be recoverable. An impairment charge is recognised as the amount by which the carrying amount of the asset exceeds its recoverable amount. The recoverable amount is the higher of an asset’s fair value less costs to sell and its value in use. For the purpose of assessing impairment, assets are grouped at the lowest levels for which there are separately identifiable cash flows (cash-generating units). With the exception of financial assets and goodwill, the recoverability of assets, for which impairment losses have been recognised previously, is assessed at each balance sheet date.
Research and developmentResearch expenditure is expensed as incurred. Development expenditure is capitalised if it is expected to yield economic benefits in the future. The carrying amount includes expenditure for materials, direct costs for wages and salaries and indirect expenditure attributable to the asset in a reasona-ble and consistent manner. Other development expenditure is recognised in the income statement as an expense as incurred.
Financial instrumentsFinancial instruments recognised in the balance sheet comprise accounts receivable, securities, loan receivables and derivatives. Accounts payable, any issued debt or equity instruments, loan liabilities and derivatives are recorded as liabilities and equity.
All financial instruments are initially recognised at cost equal to the fair value of the instrument plus transaction costs, except those classified as Financial assets, which are recognised at fair value through the income statement. Recognition then takes place on the basis of classification as specified below.
A financial asset or financial liability is recognised in the balance sheet when the company becomes a party to the contractual provisions of the instrument. Accounts receivable are recognised in the balance sheet when an invoice has been sent. Liabilities are recognised when an item has been delivered and a contractual obligation to pay exists, even if an invoice has not yet been received. Accounts payable are recognised when an invoice has been received.
A financial asset is derecognised from the balance sheet when the rights in the contract are realised, mature or the company loses control over them. The same holds true for part of a financial asset. A financial liability is derec-ognised from the balance sheet when the commitment in the contract is met or otherwise extinguished. The same holds true for part of a financial liability.
Acquisitions and disposals of financial assets are recognised on the transac-tion date. This is the date on which the company pledges to acquire or dispose of the asset.The fair value of listed financial assets is the equivalent of the asset’s listed purchase price at the balance sheet date. The basis of fair value for unlisted financial assets is determined using valuation techniques, such as recent transactions, the price of comparable instruments or discounted cash flows. See Note 35 for further details.
The Group measures future expected credit losses on investments in debt instruments that are recognised at amortised cost or fair value, with changes in value recognised in other comprehensive income based on for-ward-looking information. The Group uses the provision method based on whether there has been a significant increase in credit risk or not.
The classification of investments in debt instruments depends on the Group’s business model for managing financial assets and the contractual cash flow characteristics of the assets. Measurement of an equity investment not held for trading depends on whether the Group made an irrevocable elec-tion at initial recognition to measure it at fair value through other compre-hensive income.
Financial assets are classified in three categories, which are based on the Group’s business model and the asset’s contractual cash flows.
Financial assets measured at fair value through comprehensive income This category includes equity instruments not held for trading for which the
Group made an irrevocable election at initial recognition to measure the holding at fair value through other comprehensive income. Latour’s listed shares that are not held for trading are included in this category.
At the time of disposal of equity instruments, items previously recognised in other comprehensive income are transferred to profit brought forward and are not reclassified to the income statement.
Under IFRS 9, the classification has not led to any change or reclassifica-tion compared with previous recognition in this category.
Financial assets measured at fair value through the income statementAssets that do not meet the requirements to be recognised at amortised cost or fair value through other comprehensive income are measured at fair value through the income statement. A gain or loss on debt instruments recognised at fair value through the income statement and which is not in a hedging relationship is recognised net in the income statement in the period in which the gain or loss occurs. Latour’s listed shares that are held for trad-ing are included in this category. Derivates that do not meet the eligibility criteria for hedge accounting are recognised at fair value through the income statement.
Under IFRS 9, the classification has not led to any change or reclassifica-tion compared with previous recognition in this category.
Amortised cost Assets held with the objective of collecting the contractual cash flows that are solely payments of principal and interest, and that are not designated as measured at fair value through the income statement, are measured at amortised cost. The carrying amount of these assets is adjusted for any rec-ognised expected credit losses.
The Group applies the simplified approach for accounts receivable whereby the provision will equal the expected credit loss over the entire life of the receivable. To measure the expected credit losses, accounts receivable have been put into groups based on shared credit risk characteristics and days past due. The Group uses forward-looking factors for expected credit losses. Expected credit losses are recognised under Sales and administrative costs in the consolidated statement of comprehensive income.
Under IFRS 9, the classification has not led to any change in value. How-ever, the previous categories “Derivatives used for hedging purposes” and “Loans and receivables, cash and cash equivalents” are now included in the Amortised cost category.
Loans and receivablesLoans and receivables are non-derivative financial assets with fixed or deter-minable payments that are not quoted in an active market. Receivables arise when the company provides money, goods or services directly to a debtor with no intention of trading the receivable. This category also includes acquired receivables. Assets in this category are measured at amortised cost. Amortised cost is calculated based on expected contractual cash flows that are solely payments of principal and interest.
Other financial liabilitiesFinancial liabilities not held for trading are initially measured at fair value, net after transaction costs, and thereafter at amortised cost. Amortised cost is determined using the effective interest rate calculated when the liability was recognised. This means that surpluses or deficits as well as direct issue costs are amortised over the term of the liability.
Derivatives used in hedge accountingDerivative instruments are initially recognised at fair value in the balance sheet on the contract date and are subsequently remeasured at their fair value. The method of recognising the resulting gain or loss arising from remeasurement depends on whether the derivative is designated as a hedg-ing instrument, and if so, the nature of the item being hedged. The Group identifies certain derivatives as either: a hedge of a very probable forecast transaction (cash flow hedge); or a hedge of a net investment in a foreign operation.
When a transaction is entered into, the Group documents the relation-ship between the hedge instrument and the hedged item as well as the pur-pose of the risk management and strategy in order to take various hedging measures. The Group also documents its assessment when initiating the hedge and continuously thereafter to see if the derivative instruments used in hedging transactions are effective as an offset to changes in the fair value or cash flows of hedged items.
Note 2 cont.
Cont.
L A T O U R A N N U A L R E P O R T 2 0 2 1 9 9
N O T E S

Cash flow hedgesThe effective portion of changes in the fair value of derivative instruments that are designated and qualify as cash flow hedges is recognised in other comprehensive income and becomes a component of equity.
The gain or loss relating to the ineffective portion is recognised immedi-ately in the income statement.
Amounts accumulated in equity are recycled in the income statement in the periods when the hedged item affects profit or loss (e.g. when the fore-cast sale that is hedged takes place).
When a hedging instrument expires or is sold, or when the hedge no longer meets the criteria for hedge accounting, any cumulative gain or loss relating to the hedge that exists in equity at that time remains in equity and is recog-nised when the forecast transaction is ultimately recognised in the income statement. When a forecast transaction is no longer expected to occur, the cumulative gain or loss that was reported in equity is immediately transferred to the income statement.
Net investment hedges Hedges of net investments in foreign operations are recognised in the same way as cash flow hedges. Gains or losses attributable to the hedging instru-ment associated with the effective portion of the hedge are recognised in equity. Gains or losses associated with the ineffective portion are trans-ferred directly to the income statement.
Gains and losses accumulated in equity are recognised in the income statement when the foreign operations are sold.
Derivatives that do not qualify for hedge accountingCertain derivative instruments do not qualify for hedge accounting. Changes in the fair value of any derivative instrument that does not qualify for hedge accounting are recognised immediately in the income statement under Other income or Other expenses.
Cash and cash equivalents Cash and cash equivalents comprise cash balances, and immediately availa-ble balances in banks and similar institutions, and short-term liquid invest-ments with an original maturity of three months or less which are subject to insignificant risk of changes in value.
Long-term receivables and other current receivables Long-term receivables and other current receivables are receivables that arise when the company supplies money without intending to trade on the receivable rights. Receivables that are expected to be held for longer than one year are long-term receivables. If they are expected to be held for less than one year, they are other receivables. These receivables belong to the category of amortised cost. Amortised cost is calculated based on expected contractual cash flows that are solely payments of principal and interest.
Income taxesRecognised income taxes comprise tax that is payable or receivable for the current year, adjustment of tax attributable to previous years and changes in deferred taxes.
All tax liabilities and assets are measured at nominal amounts using the tax rates and tax laws that have been enacted or substantively enacted by the balance sheet date.
Tax is reported in the income statement except when the underlying transac-tion is recognised directly in equity, in which case the related tax effect is also recognised in equity.
Deferred tax is calculated using the balance sheet method, based on all temporary differences arising between the carrying amounts and tax bases of assets and liabilities.
Deferred tax assets relating to future tax deductions are recognised only if it is probable that taxable profits will be available against which the deductible temporary differences can be utilised.
In legal entities, untaxed reserves are reported including deferred tax liabilities.
Deferred tax is not recognised for temporary differences associated with interests in subsidiaries and associates where the Group is able to control the timing of the reversal of the temporary difference and it is probable that the temporary difference will not reverse in the foreseeable future.
Cash flow statementThe cash flow statement is prepared using the indirect method. The reported cash flow includes only transactions involving inflows and outflows of cash. Cash and cash equivalents comprise, besides bank and cash balances, short-term financial investments with maturities of three months or less.
LeasingThe Group’s leases primarily consist of rights-of-use to facilities and equip-ment. The leases are recognised as a right-of-use asset with a corresponding lease liability when the leased asset is available for use by the Group. Short-term leases and leases for which the underlying asset is of low value are exempted.
Each lease payment is apportioned between the reduction of the out-standing liability and the finance charge. The finance charge should be allo-cated to periods during the lease term so as to produce a constant periodic rate of interest on the outstanding balance of the liability for each period.
The lease term is defined as the non-cancellable period, plus periods covered by a lessee’s extension option if extension is reasonably certain and periods covered by a lessee’s termination option if the lessee is reasonably certain not to terminate.
The Group’s lease liabilities are reported at the present value of the Group’s fixed payments (including in-substance fixed payments). The pay-ments include purchase options if the lessee is reasonably certain to exercise those options to acquire the underlying asset. Penalties associated with termination of the lease are included if the lease term reflects that the lessee will exercise an option to terminate the lease. Leasing payments are dis-counted using the implied interest rate of the lease if this rate can easily be determined, otherwise the Group’s marginal borrowing rate is used.
The Group’s right-of-use assets are reported at cost, which includes the ini-tial present value of the lease liability, adjusted for any lease payments made at or before the commencement date, along with any initial direct expenditure. Restoration costs are included in the asset if a corresponding provision for restoration costs exists. The right-of-use asset is depreciated on a straight-line basis over the shorter of the useful life of the asset and the lease term.
Government grantsGovernment grants are recognised in the income statement and balance sheet when there is reasonable assurance that they will be received and that the conditions associated with the grant will be met. Grants that are com-pensation for expenses incurred are recognised on a systematic basis in the same way and in the same periods in which the expenses are recognised. Grants pertaining to investments in property, plant and equipment have reduced the carrying amounts of the assets in question.
ProvisionsA provision is recognised when the Group/company has a legal or construc-tive obligation as a result of a past event and it is probable that an outflow of resources will be required to settle the obligation and a reliable estimate can be made of the amount of the obligation.
Provisions for warranties are based on the previous years’ actual costs.
PensionsThe Group has several defined contribution and defined benefit pension plans. In Sweden, Norway, Germany, Switzerland and Italy, employees are covered by defined benefit, alternatively defined contribution, pension plans. In other countries, the employees are covered by defined contribution plans.
In defined contribution plans, the company pays fixed fees to a separate legal entity and has no obligation to pay any additional fees. Costs are expensed to the consolidated income statement as the benefits are earned.
In defined benefit plans, remuneration to employees and ex-employees is paid on the basis of salary at the point of retirement and the number of years of service. The Group bears the risk for payment of the pledged remu-neration.
The liability recognised in the balance sheet for defined benefit pension plans is the present value of the defined benefit obligation at the end of the reporting period less the fair value of the plan assets.
The pension cost and the pension obligation of defined benefit plans are calculated using the Projected Unit Credit Method. The method allocates the cost for pensions at the same rate as employees carry out services for the company which increase their right to future remuneration. The calculation is made annually by independent actuaries.
The company’s obligations are measured at the present value of antici-pated future payments by using a discount rate. The Group primarily deter-mines this rate using the interest rate for high-quality government bonds measured in the currency in which the benefits are to be paid. For obliga-tions in Sweden, the Group uses the interest rate for 12-year mortgage bonds which are then extrapolated with the growth rate estimate for the 23-year government bond rate to correspond to the remaining maturity period for the obligations in question.
The most important actuarial assumptions are set out in Note 36.The net interest amount is calculated by applying the discount rate to the
Note 2 cont.
N O T E S
1 0 0 L A T O U R A N N U A L R E P O R T 2 0 2 1

defined benefit plans and to the fair values of plan assets. This cost is recog-nised as personnel costs in the income statement.
Prior service costs are recognised directly in the income statement. Other pension expense items are charged to comprehensive income.
Actuarial gains and losses arising from experience adjustments and changes in actuarial assumptions are recognised in other comprehensive income in the period in which they arise.
Contingent liabilitiesA contingent liability is reported when an obligation may result from events that have occurred and its existence is only confirmed by one or several uncertain future events or when an obligation is not recorded as a liability or provision because it is improbable that an expenditure of resources will be required to regulate it.
Segment reportingThe Group’s operations are managed and grouped into Industrial opera-tions and Equity investment. The Industrial operations are in turn divided into six business areas. Together with equity investment, these business lines make up the Group’s operating segments. Revenue, operating profit, assets and liabilities pertaining to the segments include directly attributa-ble items together with items that can be allocated to the respective seg-ment in a reliable way. Non-allocated items generally comprise inter-est-bearing assets and liabilities, interest income, interest expenses, costs common to the Group and taxes.
Non-current assets (or disposal groups) held for sale and discontinued operationsNon-current assets (or disposal groups) are classified as assets held for sale if their carrying amounts will be recovered principally through a sale trans-action and a sale is considered highly probable. They are stated at the lower of carrying amount and fair value less costs to sell. This measurement requirement does not apply to deferred tax assets, assets arising from employee benefits, financial assets, management properties and contractual rights under insurance contracts.
Assets within a disposal group classified as held for sale are recognised separately from other assets in the balance sheet. Liabilities associated with a disposal group classified as held for sale are recognised separately from other liabilities in the balance sheet.
A discontinued operation is a component of an entity that either has been disposed of or is classified as held for sale and represents a separate major line of business. The profit or loss from discontinued operations is recognised separately in the income statement.
Parent company accounting policiesThe parent company complies with the requirements of the Swedish Annual
Accounts Act and the Swedish Financial Accounting Standards Council’s rec-ommendation RFR 2 Accounting for legal entities. RFR 2 requires the par-ent company to comply with IFRS/IAS as far as possible. Differences between parent company and Group accounting policies are primarily due to the Swedish Annual Accounts Act and the Pension Obligations Vesting Act (Tryggandelagen) and, in certain cases, special tax regulations. In the following cases, the parent company’s accounting policies are not consistent with the IFRS.
IFRS 9 does not apply to the parent company. Instead, the parent com-pany applies those items set out in RFR 2 (IFRS 9 Financial Instruments, p. 3–10). Financial instruments are valued at cost. In subsequent periods, financial assets that have been acquired with the intention of being held in the short term will be recognised in accordance with the lowest value prin-ciple, at either the cost or the fair value, whichever is the lowest. Derivative instruments will also be valued according to the lowest value principle.
For financial fixed assets in respect of shares in subsidiaries and associated companies, impairment takes place to the fair value or the present value of the executive management’s best assessment of the future cash flows that the asset is expected to provide, whichever is the highest. For other financial assets, IFRS 9 is applied, in accordance with p.8 of RFR 2. This means that impairment testing is carried out in the same way as for receivables recog-nised as current assets (see below).
When calculating the net realisable value of receivables that are recog-nised as current assets, the principles for impairment testing and loss risk provisioning in IFRS 9 should be applied. For a claim that is recognised at amortised cost at Group level, this means that the loss risk reserve that is recognised in the Group in accordance with IFRS 9 should also be recog-nised in the parent company.
The parent company recognises associated companies using the cost method.
The parent company’s defined benefit pension plans have been calculated according to the Pension Obligations Vesting Act (Tryggandelagen) and the Swedish Financial Supervisory Authority’s regulations since this is a pre-requisite for fiscal deductions.
A currency interest rate swap that is linked to part of issued option loans is not considered to be an item in the parent company that satisfies the cri-teria for hedge accounting. The derivative is valued in the company accord-ing to the lowest value principle.
From a fiscal perspective, Investment AB Latour is an investment com-pany. Profits on sales of shares are not liable to tax and losses are not deductible. The company must however declare 1.5 per cent of the market value of all shareholdings at the beginning of the year as standard taxable income. However this is only valid for listed shares where the share of votes is under 10 per cent. Dividends received are taxable and dividends paid are deductible. Interest income is taxable while management costs and interest expenses are deductible.
Note 2 cont.
L A T O U R A N N U A L R E P O R T 2 0 2 1 1 0 1
N O T E S

NOTE 3 Segment reporting
The executive management has determined the operating segments based on the reports reviewed by Latour’s Board of Directors that are used to make strategic decisions. The Board primarily assesses the business areas from an operational perspective but also on the basis of geographic area of interest.
The operations can be divided into two main areas: wholly-owned indus-trial operations and equity investment. The industrial operations are grouped into six business areas: Bemsiq, Caljan, Hultafors Group, Latour Industries, Nord-Lock Group and Swegon.
Equity investment primarily consists of portfolio management of long-term holdings where Latour owns at least 10 per cent of the votes.
Segment results, assets and liabilities include items directly attributable to the segment as well as those that can be allocated on a reasonable and reliable basis. Segment assets and liabilities do not include tax assets and tax liabilities (deferred and current), nor do they include interest-bearing assets and liabilities. Segment investments in property, plant and equip-ment and intangible assets include all investments, except for those in expendable equipment and low-value equipment.
DEVELOPMENT BY BUSINESS AREA 1 JAN 2021 – 31 DEC 2021Industrial operations
SEK m Bemsiq CaljanHultafors
GroupLatour
IndustriesNord-Lock
Group Swegon OtherPortfolio
management Total
REVENUEExternal sales 925 1,527 5,543 3,022 1,439 5,824 287 18,567Internal sales 2 1 3INCOMEOperating profit 198 276 860 244 367 718 –107 2,556Income from equity investment 2,363 2,363Finance income 186Finance expense –120Taxes –604Profit for the year 4,381
OTHER DISCLOSURESAssets 2,365 3,594 7,008 3,854 1,549 4,699 572 22,543 46,184Unallocated assets 1,753Total assets 47,937
Liabilities 158 768 1,213 786 213 1,271 160 28 4,597Unallocated liabilities 11,654Total liabilities 16,251
Investments in: property, plant and equipment 46 63 486 59 55 124 2 835 intangible assets 538 2 908 611 0 39 2,098Depreciation/amortisation 9 21 75 55 45 89 279 573
DEVELOPMENT BY BUSINESS AREA 1 Jan 2020 – 31 Dec 2020Industrial operations
SEK m Bemsiq CaljanHultafors
GroupLatour
IndustriesNord-Lock
Group Swegon OtherPortfolio
management TotalREVENUEExternal sales 723 1,176 3,641 2,356 1,274 5,613 245 15,028Internal sales 2 1 1 4INCOMEOperating profit 165 207 561 147 316 721 –60 2,057Income from equity investment 3,941 3,941Finance income 31Finance expense –276Taxes –429Profit for the year 5,324
OTHER DISCLOSURESAssets 1,517 2,862 4,463 2,855 1,347 4,361 573 20,705 38,683Unallocated assets 3,404Total assets 42,087
Liabilities 121 272 550 660 163 1,119 109 48 3,042Unallocated liabilities 9,897Total liabilities 12,939
Investments in: property, plant and equipment 18 177 139 33 151 73 13 604 intangible assets 474 6 313 28 1 81 5 908Depreciation/amortisation 7 13 41 55 37 86 185 424
N O T E S
1 0 2 L A T O U R A N N U A L R E P O R T 2 0 2 1

NOTE 4 Geographic markets
Breakdown of sales by geographic markets:
2021 2020Sweden 3,331 2,552Nordics, excl. Sweden 2,733 2,343Europe, excl. Nordics 8,707 7,215Other markets 3,796 2,918Total 18,567 15,028
Breakdown of assets by geographic markets:
2021 2020Sweden 39,910 36,673Nordics, excl. Sweden 2,296 1,485Europe, excl. Nordics 4,467 3,219Other markets 1,264 710Total 47,937 42,087
Breakdown of investments by geographic markets:
2021 2020Sweden 1,057 170Nordics, excl. Sweden 940 38Europe, excl. Nordics 561 1,243Other markets 375 1,277Total 2,933 2,728
Historically, the Group’s domestic market has been the Nordic countries, with the majority of production located in Sweden. Today, the Group’s main area of expansion is Europe although it is moving into other parts of the world too. Based on the size criteria, no specific countries are deemed large enough to be reported separately.
NOTE 5 Related party transactions
The Douglas family has a controlling influence over Investment AB Latour. Privately and through companies, the Douglas family controls 79.2 per cent of the voting rights in Latour. Two members of the family each received Board fees of SEK 1,050,000, i.e. a total of SEK 2,100,000. Investment AB Latour has a holding of 517,200 own shares at the end of the period. The total number of call options issued to senior executives in the Latour Group is 2,269,200, which give the right to purchase the same number of shares. The Board was authorised by the Annual General Meeting on 10 May 2021 to resolve on the repurchase and transfer of the company’s own shares. The options are based on market-related terms. See Note 10 for details about salaries and other remuneration to the Board, the Chief Exec-utive Officer and other senior executives. Purchasing and sales for the year between Group companies in the Latour Group total SEK 8,217 m (6,480 m). There were no purchases or sales with the parent company. There have been no transactions with other related parties or other com-panies during the year.
NOTE 7 Breakdown of expenses by type of cost
THE GROUP 2021 2020Change in inventories 9,303 7,345Remuneration to personnel 4,623 3,860Depreciation/amortisation 573 424Other expenses 1,512 1,342Total 16,011 12,971
NOTE 8 Exchange rate differences
Operating profit includes exchange rate differences relating to operating receivables and liabilities as follows:
THE GROUP 2021 2020Net sales 23 –39Cost of goods sold 9 –5Administrative expenses –1 –7Other income 8 2Other operating expenses –1 –13Total 38 –62
NOTE 9 Remuneration to auditors
GROUP – fees to Ernst & Young 2021 2020Ernst & YoungAudit services 14 12of which to Ernst & Young AB 5 4
Non-audit work 0 0of which to Ernst & Young AB 0 0
Tax advisory services 1 0of which to Ernst & Young AB 0 0
Other services 3 0of which to Ernst & Young AB 1 0
Total 18 12
Audit fees to others 6 6Total 24 18
Remuneration to auditors for audit services in the parent company amounted to SEK 51,000 (0) and for other services SEK 0 (0).
NOTE 6 Breakdown of revenues
THE GROUP 2021 2020Revenue from the sales of goods 17,551 14,161Revenue from services 1,016 867
18,567 15,028
Revenue reported at one point in time 14,598 11,672Revenue reported over time 3,969 3,356
18,567 15,028
Sales directly to customers 10,108 8,954Sales via distributors 8,459 6,074Total 18,567 15,028
Latour’s revenues are derived from a variety of operations that are con-ducted in more than a hundred subsidiaries. For more information about revenue recognition principles, see page 98.
L A T O U R A N N U A L R E P O R T 2 0 2 1 1 0 3
N O T E S

Remuneration to senior executivesPoliciesThe Chairman of the Board and Board members receive the remunerat- ion decided by the Annual General Meeting. They are not paid extra for committee work.
Remuneration to the Chief Executive Officer and other senior execu- tives is comprised of basic salary, variable remuneration, other benefits and pension. The pension includes health insurance, and the defined contribution premium may not exceed 35 per cent of the basic salary. Other senior executives are the members of Group management and busi-ness area managers, who report directly to the Chief Executive Officer.
The variable remuneration to the Chief Executive Officer is based on goals achieved during the year and amounted to 94 per cent of basic salary in 2021. Variable remuneration for other senior executives is based
on growth and profits. Under current agreements for the annual vari- able remuneration, the remuneration is capped at six months of salary. To promote a long-term perspective, the Board may, in addition to the annual variable remuneration, also decide on remuneration that is con- nected to the business areas’ long-term value development over a three- year period.
The Board may also allow a supplemental remuneration to company management in the form of share-related incentive schemes (for example a call option programme), provided that they promote long-term commit-ment to the business and they are on market-related terms. The Board of Directors may waive the guidelines approved at the Annual General Meet- ing should there be particular reason for doing so in any individual case.
2021 Remuneration and other benefits during the year
(SEK 000)Basic salary/
board feesVariableg
remuneration 3)g
LTI 7)Otherg
benefits 2)Pension
costs TotalChairman of the Board 2,300 — — — — 2,300Other Board members (7 people) 1) 7,350 — — — — 7,350Chief Executive Officer 8,837 5) 8,312 4) 101 3,032 20,282Other senior executives (7 people) 22,920 6) 9,226 1,820 579 6,348 40,893
1) Other Board members have received SEK 1,050,000 each. 2) Other benefits relate mainly to car benefits. 3) Variable remuneration to the Chief Executive Officer was equal to 94 per cent of his basic salary and to other senior executives it ranged from 0–48 per cent of their basic salary.4) SEK 3,200,000 of the variable remuneration is conditional on the acquisition of shares and/or options in Latour. 5) Includes change in holiday pay debt amounting to SEK 146,000. 6) Includes change in holiday pay debt.7) LTI – Long term incentive is part of variable remuneration.
NOTE 10 Personnel
Salaries, other remuneration and social costs
2021 2020Salaries and other
remunerationSocial costs (of which
pension costs)Salaries and other
remunerationSocial costs (of which
pension costs)Parent company 9 3 8 3Subsidiaries 3,713 913 3,080 777The Group 3,722 916 3,088 780
SEK 26 m (26 m) of the Group’s pension costs relate to boards and chief executive officers.
Breakdown of salaries and other remuneration by country and between board members and others, and employees:
2021 2020Board and CEO Board and CEO
(of which bonus) Other employees (of which bonus) Other employeesParent companySweden 9 (0) — 8 (0) —
SubsidiariesSweden 78 (19) 1,029 57 (12) 838Germany 19 (2) 453 17 (1) 382UK 16 (3) 347 16 (2) 311USA 5 (1) 247 5 (1) 244Italy 8 (0) 283 6 (0) 211Norway 7 (1) 140 6 (0) 136Finland 9 (1) 173 14 (1) 129Spain 1 (0) 20 4 (0) 83Poland 3 (0) 88 3 (0) 75Switzerland 7 (0) 75 9 (2) 75Australia 3 (0) 6 0 (0) 58Denmark 14 (3) 163 8 (1) 133Thailand 1 (0) 2 1 (0) 34Ireland 0 (0) 24 3 (0) 22The Netherlands 7 (1) 70 6 (0) 53Other countries 8 (1) 363 8 (0) 137Group total 195 (32) 3,527 167 (20) 2,921
Periods of notice within the Group are between 3 and 24 months, depending on age and position.
N O T E S
1 0 4 L A T O U R A N N U A L R E P O R T 2 0 2 1

PensionsThe Chief Executive Officer is entitled to retire at the age of 65.
The retirement age for other senior executives is 65, whereupon a pen-sion is paid in accordance with the defined-benefit ITP pension scheme or the equivalent. Premiums are paid on an ongoing basis.
Option schemesShare option schemes from 2017 vested during 2021, whereupon 568,000 options were exercised for the purchase of shares. The table below shows the option schemes outstanding at the end of the year.
THE GROUPNumber of
options issued
Equivalent to the number
of shares Option price Exercise price2018/2022 455,000 455,000 10.80 111.302019/2023 552,500 552,500 13.40 137.152020/2024 547,400 547,400 19.50 214.752020/2024 40,000 40,000 21.00 234.002021/2025 674,300 674,300 30.50 345.20
Severance paymentThe period of notice between the company and Chief Executive Officer is 6 months. In the case of dismissal by the company, the Chief Executive Officer will receive a severance payment equal to 12 months of salary. The sever-ance payment is not set off against any other income. The Chief Executive Officer is required to give at least 6 months’ notice of resignation and does not receive a severance payment.
Notice of termination of employment between the company and other senior executives varies from 6 to 12 months. In the case of dismissal by the company, the senior executives receive their salary during their notice period. Senior executives must give 6 months’ notice and do not receive severance pay.
Preparation and decision processThe policies for remuneration to senior executives are decided by the Annual General Meeting. The pay and terms of employment of the Chief Executive Officer are determined by the Board of Directors. The Board has given the Chairman the task of reaching an agreement with the Chief Execu-tive Officer after contact with the Remuneration Committee. The Board is then informed of the outcome of the negotiations.
Remuneration to other senior executives is determined by the Chief Executive Officer in consultation with the Chairman of the Board.
Gender ratios on the Board and within the executive management
2021 2020Men % Women % Men % Women %
Board members 67 33 75 25Group management 100 0 100 0
Average number of employees
2021 2020
PARENT COMPANYNumber
employeesOf which
men %Number
employeesOf which
men %Sweden — — — —
SUBSIDIARIESSweden 2,033 75 1,728 79UK 768 73 754 74Germany 768 71 722 74Italy 583 81 438 90
USA 380 74 337 73Poland 450 72 250 70Latvia 330 68 265 69Finland 359 73 241 82Norway 234 76 243 77Denmark 212 70 168 74Romania 135 36 115 41Other countries 1,432 61 1,001 77Total in subsidiaries 7,684 71 6,262 76Total 7,684 71 6,262 76
OPERATING AREAS 2021 2020
Industrial operations 7,683 6,261Equity investment 1 1Total 7,684 6,262
Note 10 cont.
2020 Remuneration and other benefits during the year
(SEK 000)Basic salary/
board fees
Variableg remuneration
3)Otherg
benefits 2)Pension
costs TotalChairman of the Board 2,200 — — — 2,200Other Board members (6 people) 1) 6,000 — — — 6,000Chief Executive Officer 8,690 5) 4,108 4) 80 2,873 15,751Other senior executives (6 people) 17,826 6) 3,106 562 5,445 26,939
1) Other Board members have received SEK 1,000,000 each. 2) Other benefits relate mainly to car benefits.
3) Variable remuneration to the Chief Executive Officer was equal to 47 per cent of his basic salary and to other senior executives it ranged from 0–51 per cent of their basic salary.
4) SEK 1,600,000 of the variable remuneration is conditional on the acquisition of shares and/or options in Latour. 5) Includes change in holiday pay debt amounting to SEK 488,000. 6) Includes change in holiday pay debt.
L A T O U R A N N U A L R E P O R T 2 0 2 1 1 0 5
N O T E S

NOTE 11 Depreciation/amortisation
Amortisation of intangible fixed assets in the Group amounts to SEK 66 m (61 m) and depreciation of property, plant and equipment amounts to SEK 507 m (363 m). Of depreciation of property, plant and equipment, SEK 263 m (164 m) refers to depreciation of leasing assets. A breakdown of depreciation/amortisation by function in the income statement is shown below:
THE GROUP 2021 2020Trademarks, licencesCost of goods sold 7 7Sales costs 14 17Administrative costs 29 21Research and development costs 16 16Total 66 61
Buildings Cost of goods sold 26 19Sales costs 2 2Administrative costs 187 154Research and development costs 1 1Total 216 176
Land and land improvementsCost of goods sold 1 1Total 1 1
MachineryCost of goods sold 92 66Sales costs 2 1Administrative costs 7 6Research and development costs 6 6Total 107 79
EquipmentCost of goods sold 48 37Sales costs 21 19Administrative costs 112 49Research and development costs 2 2Total 183 107
Total depreciation 573 424
NOTE 12 Leasing
Recognising the amortisation of right-of-use assets instead of lease payments has affected operating profit by SEK –6 m (5 m). Interest on lease liabilities has had a negative impact on net financial items of SEK –10 m (–7 m). Earnings before tax have been negatively impacted by SEK –16 m (–3 m) due to IFRS 16. As the main payment is recognised as a financing activity, the cash flow from financing activities decreases with a corresponding increase in the cash flow from operating activities. The interest rate part of the lease payment remains cash flow from operating activities and is included in net financial items. The Group recognises a right-of-use asset in the balance sheet as well as a lease liability at the present value of future lease payments. The leased asset is depreciated on a straight-line basis over the lease term or over the useful life of the underlying asset if it is deemed reasonably certain that the Group will take over ownership at the end of the lease term. The lease cost is recognised as depreciation within operating profit and interest expense within net financial items. If the lease is considered to include a low-value asset or has a lease term that ends within 12 months, or includes service components, these lease payments are recognised as operating expenses in the income statement over the lease period.
Information is presented below about these leases, as well as short-term leases and leases of little value.
Amounts reported in the balance sheetThe following amounts related to leases are reported in the balance sheet:Right-of-use assets 2021 2020Building 977 608Vehicles 68 40Machinery 4 4
1,049 652
Lease liabilityLong-term 846 516Current 224 144Total 1,070 660
Amounts reported in the income statementThe following amounts related to leases are reported in the income state-ment:Amortisation of right-of-use assets 2021 2020Building –179 –146Vehicles –81 –16Machinery –3 –2
–263 –164
Interest expenses (included in finance expense) –10 –7Expenditure attributable to short-term leases and to leases for which the underlying asset is of a low value –393 –31
No significant variable lease payments that are not included in the lease liability have been identified.
The total cash flow related to leases amounted to SEK 262 m (170 m).
N O T E S
1 0 6 L A T O U R A N N U A L R E P O R T 2 0 2 1

NOTE 13 Operating income and operating expenses
Other operating income
THE GROUP 2021 2020Capital gains on sales — 3Exchange rate differences 8 2Adjustment of earn-out 12 36Other income 170 93Total 190 134
Other operating expenses
THE GROUP 2021 2020Acquisition costs –47 –22Impairment of goodwill — —Share of earnings in associated companies — –6Exchange rate differences –1 –14Other expenses –64 –63Total –112 –105
NOTE 14 Income from interests in associates
THE GROUP 2021 2020Income from interests after tax 2,620 2,116Dilutive effect 41 5Impairment –282 –108Profit on sale of interests 0 1,964Total 2,379 3,977
Individual holdings have affected results as follows:2021 2020
Alimak Group –204 –57ASSA ABLOY 890 933CTEK 6 0Fagerhult 450 50HMS Networks 94 68Nederman 89 29Securitas 323 296Sweco 352 435TOMRA 251 2,149Troax 128 74Total 2,379 3,977
Since Latour normally cannot wait for the income statements from each associated company, Latour applies the principle of basing each company’s quarterly financial report on the outcome of the previous quarter and then extrapolating an estimated outcome. The companies’ results vary, which means the reported profit share can deviate from the recorded outcome. This is corrected in the next quarterly financial report. The book value of interests in associates is compared with the market value, which is adjusted for impairment if necessary.
Parent companyIn the parent company, the dividend income from associates comprises SEK 871 m (757 m) and capital gains SEK 0 m (2,085 m).
NOTE 15 Income from equity investment
THE GROUP 2021 2020Income from fixed assetsDividends — —Capital gains — —
0 0Income from current assetsDividends — —Capital gains 3 –6Overheads 9 –2
12 –8Total equity investment 12 –8
NOTE 16 Finance income
THE GROUP 2021 2020Interest income 1 1Exchange gains 184 28Other finance income 1 2Total 186 31
NOTE 17 Finance expense
THE GROUP 2021 2020Lease interest –10 –7Other cost interest –62 –79Exchange losses –45 –186Other finance expense –3 –4Total –120 –276
NOTE 18 Tax on profit for the year
THE GROUP 2021 2020Current tax expense for the period –500 –371Deferred tax attributable to changes in temporary differencesDeferred tax income 58 22Deferred tax expense –162 –80Total –604 –429
SEK –3 m (–3 m) of deferred tax is included in consolidated comprehen-sive income in Change in hedging reserve for the year SEK –58 m (125 m).
Difference between actual tax expense and tax expense based on the effec-tive tax rate.
THE GROUP 2021 2020Profit before tax 4,985 5,753Tax according to effective tax rate, 20.6% (21.4%) –1,027 –1,231Tax effect of special taxation rules for investment companies 176 605Effect of associated company accounts 314 246Tax effect of non-deductible costs –31 –37Tax effect of previous year adjustments –10 6Tax effect of non-taxable income 3 6Other tax effects –29 –24Tax on profit for the year according to the income statement –604 –429
PARENT COMPANY 2021 2020Profit before tax 1,823 3,328Tax according to effective tax rate, 20.6% (21.4%) –376 –712
Tax effect of special taxation rules for investment companies 376 712
Tax on profit for the year according to the income statement 0 0
The effective tax rate for the Group and the parent company is 20.6 per cent. Investment companies are allowed a tax deduction for the dividend approved at the subsequent Annual General Meeting. Capital gains are not taxable while capital losses are not deductible. Investment companies are taxed on a standardised basis instead. See Note 38.
L A T O U R A N N U A L R E P O R T 2 0 2 1 1 0 7
N O T E S

Assumptions for the Group’s significant goodwill items are given below.
31/12/2021Book value,
SEK m
Growthassumption(forecast) %
Marginassumption(forecast) %
Caljan 2,060 5.0–30.2 16.9–20.0Snickers Workwear 390 3.2–10.0 20.0–21.6Johnson 535 3.1–8.0 12.0–12.3CLC 791 5.0–15.5 17.3–20.0MS Group 400 3.0–11.7 8.0–10.0Aritco 820 3.0–35.7 10.0–10.0Produal 555 5.0–19.5 17.0–20.0Vimec 327 3.0–4.0 6.5–10.0Commercial Swegon 1,389 5.0–10.3 11.4–11.4Swegon UK 479 5.0–8.3 14.2–14.2
31/12/2021
Discount rate
(before tax) %
Growthassumption(terminal) %
Marginassumption(terminal) %
Caljan 8.4 2 20.0Snickers Workwear 9.0 2 20.0Johnson 9.4 2 12.0CLC 9.9 2 20.0MS Group 8.0 2 10.0Aritco 7.0 2 10.0Produal 6.9 2 20.0Vimec 7.8 2 10.0Commercial Swegon 9.2 2 11.4Swegon UK 9.3 2 14.2
31/12/2020Book value,
SEK m
Growthassumption(forecast) %
Marginassumption(forecast) %
Caljan 2,021 5–16.4 15.8–20.0Snickers Workwear 390 3–3 15.0–15.0Johnson 483 10–10 12.5–17.0CLC 718 5–5 20.0–20.0Reac 396 8–12.5 7.9–12.0Aritco 711 10–10.6 9.0–14.2Produal 396 6.3–9 14.8–18.0Vimec 321 7–27.8 7.7–12.0Commercial Swegon 1,389 2–5.9 12.5–12.5Swegon UK 479 2–2 12.0–13.1
31/12/2020
Discount rate
(before tax) %
Growthassumption(terminal) %
Marginassumption(terminal) %
Caljan 8.8 2 20.0Snickers Workwear 11.5 2 15.0Johnson 9.4 2 17.0CLC 12.1 2 20.0Reac 9.8 2 12.0Aritco 9.6 2 14.0Produal 9.2 2 18.0Vimec 10.1 2 12.0Commercial Swegon 8.5 2 12.5Swegon UK 8.2 2 12.0
All Group goodwill items have been evaluated, as required by IAS 36, in order to determine the individual recoverable amount for all of the smallest cash-generating units. The valuations are not market value. Individual assumptions about growth, profit margins, tied-up capital, investment needs and risk premiums have been made for each of the Group’s goodwill items. The risk premium increment that has been added to the risk-free interest level is made up of a general risk premium for company invest-ments and a specific risk premium for individual operations based on their circumstances.
Key assumptionsTests were performed with forecasts for up to 10 years. This was justified by the nature of the companies that Latour owns. The companies are posi-tioned within long-term sustainable megatrends, which generally demon-strate higher predictable growth. Future cash flows have been estimated on the basis of the assets’ existing structure and do not include future acquisi-tions. The required return after tax varies from 6.8–9.8 per cent (8.1–12.0 per cent).
NOTE 19 Intangible assets
THE GROUP GoodwillTrademarks,
licences TotalAccumulated costOpening balance 1 Jan 2020 10,361 577 10,938Acquisitions for the year 869 39 908Reclassification –200 — –200Translation difference –519 –21 –540Closing balance 31 Dec 2020 10,511 595 11,106
Opening balance 1 Jan 2021 10,511 595 11,106Opening cost from acquisitions 0 108 108Acquisitions for the year 1,935 37 1,972Sales for the year — –18 –18Reclassification — –5 –5Translation difference 373 19 392Closing balance 31 Dec 2021 12,819 736 13,555
Accumulated depreciationOpening balance 1 Jan 2020 0 –305 –305Depreciation for the year — –62 –62Sales for the year — 0 0Translation difference — 13 13Closing balance 31 Dec 2020 0 –354 –354
Opening balance 1 Jan 2021 0 –354 –354Depreciation for the year — –66 –66Sales for the year — 18 18Reclassification — 5 5Translation difference — –10 –10Closing balance 31 Dec 2021 0 –407 –407
Accumulated impairment lossesOpening balance 1 Jan 2020 –448 0 –448Impairment for the year — — 0Closing balance 31 Dec 2020 –448 0 –448
Opening balance 1 Jan 2021 –448 0 –448Impairment for the year –105 — –105Closing balance 31 Dec 2021 –553 0 –553
Book value 12,266 329 12,595
Carrying amounts
At 1 Jan 2020 9,913 272 10,185At 31 Dec 2020 10,063 241 10,304At 1 Jan 2021 10,063 241 10,304At 31 Dec 2021 12,266 329 12,595
See Note 11 for the impact of depreciation on earnings.All goodwill refers to the segment Industrial operations. An impairment
test on goodwill resulted in a write-down of SEK 105 m (0 m).
Testing goodwill for impairmentCertain valuation assumptions, which are the basis of the evaluation, have been given for the Group’s most significant goodwill items.
A breakdown of the Group’s value of goodwill is shown below: THE GROUP Book value, SEK mBemsiq 1,776Caljan 2,060Hultafors Group 3,127Latour Industries 2,224Nord-Lock Group 605Swegon 2,243Neuffer 231
12,266
N O T E S
1 0 8 L A T O U R A N N U A L R E P O R T 2 0 2 1

NOTE 20 Buildings
THE GROUP 2021 2020Opening cost 1,744 1,417Opening cost from acquisitions 296 26Purchases 696 460Sale –213 –76Reclassification 31 –3Translation differences 65 –80Closing cost 2,619 1,744
Opening depreciation –537 –451Sale 80 70Depreciation for the year –216 –176Reclassification –6 0Translation differences –15 20Closing depreciation –694 –537
Book value 1,925 1,207
Depreciation for the year, see Note 11.
The item buildings includes a property owned by the Group through a finance lease with the following amounts:
2021 2020Cost – capitalised finance lease 161 157Accumulated depreciation –79 –70Carrying amount 82 87
NOTE 21 Land and land improvements
THE GROUP 2021 2020Opening cost 84 66Opening cost from acquisitions 36 0Purchases 4 22
Sales and disposals –7 –1Translation differences 2 –3Closing cost 119 84
Opening depreciation –8 –8Depreciation for the year 1 1Sales and disposals –1 –1Translation differences 0 0Closing depreciation –8 –8
Book value 111 76
Depreciation for the year, see Note 11.
NOTE 22 Machinery
THE GROUP 2021 2020Opening cost 1,286 1,222Opening cost from acquisitions 104 38Purchases 158 138Sale –29 –44Reclassification –7 –12Translation differences 38 –56Closing cost 1,550 1,286
Opening depreciation –903 –909Sale 26 40Depreciation for the year –107 –79Reclassification 4 10Translation differences –25 35Closing depreciation –1,005 –903Book value 545 383
Depreciation for the year, see Note 11.
NOTE 23 Equipment
THE GROUP 2021 2020
Opening cost 866 793Opening cost from acquisitions 31 42Purchases 234 134Sale –122 –64Reclassifications –7 –4Translation differences 25 –35Closing cost 1,027 866
Opening depreciation –561 –533Sale 107 55Depreciation for the year –183 –107Reclassifications 19 1Translation differences –17 23Closing depreciation –635 –561
Book value 392 305
Depreciation for the year, see Note 11.
NOTE 24 Construction work in progress and advances for property, plant and equipment
THE GROUP 2021 2020Opening cost 102 72Costs expended during the year 21 142Translation differences –77 –110Completed facilities 1 –3Book value 47 102
Market, growth and marginThe forecasts are based on previous experience and external sources of information.
Personnel expensesThe forecast for personnel expenses is based on anticipated inflation, a certain real wage increase (historical average) and planned rationalisations in company production. The forecast concurs with previous experience and external sources of information.
Exchange rates Exchange rate forecasts are based on current listed exchange rates and for-ward rates. The forecast concurs with external sources of information.
Exchange rate CAD 6.82Exchange rate CHF 9.40Exchange rate DKK 1.37Exchange rate EUR 10.2Exchange rate GBP 11.8Exchange rate NOK 0.99Exchange rate PLN 2.26Exchange rate USD 8.60
The recoverable amount for the Group’s most important units exceeds the carrying amounts by a clear margin. The effect of a minor change to a key assumption is not so great that the recoverable amount could fall below its carrying amount. This applies to all cash-generating units where significant value is created. However, the risk is greater for some of the smallest good-will items because the margin is smaller. Yet they have no significant impact on the Latour Group. The greatest risk of the occurrence of impairment is when disruptive changes in an industry radically alter the position of a com-pany in the market. Each company conducts a comprehensive risk analysis every year to review and modify its operations in the light of such risks.
L A T O U R A N N U A L R E P O R T 2 0 2 1 1 0 9
N O T E S

Company name CRN Domicile No. shares Share of equity (%) Book value (SEK m)Karpalunds Ångbryggeri AB 556000-1439 Stockholm 3,600 100 1Latour Förvaltning AB 556832-2209 Stockholm 500 100 1,005Latour-Gruppen AB 556649-8647 Gothenburg 400,000 100 2,549
Bemsiq AB 559013-7351 Gothenburg 100Elsys AB 556694-5548 Umeå 70Elvaco AB 556248-6687 Kungsbacka 100Elvaco GmbH HRB7421 Germany 100Bastec AB 556346-6738 Malmö 100Greystone Energy Systems Inc. 705521 Canada 100Greystone Energy Systems Private Limited U7499KA2016FTC093450 India 100Greystone Energy Systems SDN BHD 201701003861 Malaysia 100Greystone Energy Systems Pte Ltd 201133155D Singapore 100Greystone Energy Systems DMCC DMCC56028 Dubai 100HK Instruments OY 0873072-9 Finland 100Produal Holding Oy 2497873-2 Finland 100Produal Oy 0680909-7 Finland 100Produal Sverige AB 556538-4236 Stockholm 100Produal A/S 33378203 Denmark 100Produal S.A.S. 75264028400010 France 100Produal Sp. z.o.o 0000800683 Poland 100Produal S.R.L 03122740214 Italy 100Sensortec AG CHE-110.126.181 Switzerland 100Sensortec Holding AG CH-036-3055894-8 Switzerland 100Sensir AG CHE-105.140.229 Switzerland 100SyxthSense Ltd 04657762 UK 100S+S Regeltechnik GmbH HRB 17846 Nürnberg 100
Caljan ApS 30205618 Denmark 100Caljan Limited 03223165 UK 100Caljan 52103036881 Latvia 100Caljan Gmbh HRB 10918 Germany 100Caljan America 84-1274707 USA 100Caljan France SARL 849 333 653 France 100
Hultafors Group AB 556365-0752 Bollebygd 100Hultafors AB 556023-7793 Bollebygd 100Hultafors Group Finland OY 0664406-9 Finland 100Hultafors Group Norge AS 983513328 Norway 100Hultafors Group Danmark AS 14252533 Denmark 100Hultafors UMI S.R.L. J32/572/22.11.1996 Romania 100Hultafors Group Italy 1660130210 Italy 100Fisco Tools Ltd. 755735 UK 100Hultafors Group NL BV 8054149 The Netherlands 100Hultafors Group Sverige AB 556113-7760 Bollebygd 100Hultafors Group UK Ltd. 01952599 UK 100Snickers Production SIA Latvia 40003077239 Latvia 100Hultafors Group Belgium NV 0444.346.706 Belgium 100Hultafors Group France SARL 529 004 046 France 100Hultafors Group Poland Sp. z o.o. 146309299 Poland 100Hultafors Group Switzerland AG CH 036.3.044.124-4 Switzerland 100Hultafors Group Ireland Ltd 65695194 Ireland 100Hultafors Group Germany GmbH 147860778 Germany 100Hultafors Group Austria GmbH ATU 65856344 Austria 100Hultafors Group Holding Inc 38-4080874 USA 100Fristads AB 556023-8486 Borås 100Fristads AS 915463568 Norway 100Fristads Kansas Ltd 08828565 UK 100Fristads BV 27185890 The Netherlands 100Sanctuary Kansas Austria GmbH FN95014b Austria 100Fristads Kansas Group Asia Ltd 1092659 China 100Fristads Production Sia 40003693027 Latvia 100Fristads Finland Oy 0949961-0 Finland 100Fristads GmbH HRB3322NO Germany 100Kansas A/S 11987273 Denmark 100Stritex 05468127 Ukraine 100Fristads Production AMC 31755115 Ukraine 100Scangrip A/S 54274718 Denmark 100Scangrip Asia Ltd 91310000MA1GW2PU8W China 100Scangrip North America 61-1857435 USA 100Johnson Level & Tool Mfg. Co. 39-1041797 USA 100Custom LeatherCraft Mfg. LLC 81-0966824 USA 100Kuny’s Corp. 884737818 USA 100
NOTE 25 Interests in subsidiaries
2021 2020Opening cost 3,746 2,246Change for the year — 1,500Closing cost 3,746 3,746
N O T E S
1 1 0 L A T O U R A N N U A L R E P O R T 2 0 2 1

Company name CRN Domicile No. shares Share of equity (%) Book value (SEK m)
Skillers GmbH HRB 755172 Germany 100Puvab AB 556346-4600 Borås 100Hultafors Group Logistics Sp. z.o.o 8622663376 Poland 100Daan Holding BV 57162581 The Netherlands 100Dentgen Vastgoed BV 68643896 The Netherlands 100Emma Holding BV 57164371 The Netherlands 100Emma Safety Footwear BV 59429038 The Netherlands 100Protag Shoe Supply BV 14128428 The Netherlands 100Hellberg Safety AB 556214-4898 Lerum 100
Latour Industries AB 556018-9754 Gothenburg 100LSAB Group AB 556655-6683 Hedemora 100Fortiva AB 556563-6742 Malmö 100Fortiva Danmark A/S 182650 Denmark 100Bergmans Chuck AB 556059-1736 Hässleholm 100LSAB Norge AS 95882479 Norway 100LSAB Sverige Försäljning AB 556248-1936 Långshyttan 100LSAB Sverige Produktion AB 556222-1746 Hedemora 100LSAB Instrument Service 1089847103950 Russia 100LSAB Suomi OY 0140601-0 Finland 100LSAB Vändra AS 10120018 Estonia 100LSAB Latvia SIA 40003381260 Latvia 100LSAB Westlings AB 556442-0767 Vansbro 100Micor AB 556557-7862 Laholm 100MachToolRent 1107847394687 Russia 100Densiq AB 556198-5077 Gothenburg 100Densiq AS 997495365 Norway 100Specma Seals ApS 35645144 Denmark 100Densiq Oy 2494676-5 Finland 100MS Group AB 559201-8328 Gothenburg 100REAC AB 556520-2875 Åmål 100REAC A/S 19 353 508 Denmark 100REAC Poland Sp. z.o.o. 0000444016 Poland 100REAC Components Sp. z.o.o 0000551205 Poland 100AAT GmbH 401006 Germany 100Aritco Group AB 556720-1131 Kungsängen 100Aritco Lift AB 556316-6114 Kungsängen 100Aritco DE GmbH HRB 753033 Germany 100Artico Homelift Ltd 91310000MA1GBK649Y China 100Aritco Lift Thailand Ltd 105560115885 Thailand 100Aritco UK Limited 07920808 UK 100Gartec Ltd 02898632 UK 100TKS Heis AS 940568420 Norway 100Steeco Lifts Ltd 08104893 UK 100Invalifts Ltd 03950068 UK 100Ability Lifts Ltd 05307764 UK 100Vimec Srl 00758850358 Italy 100Vimec Polska Sp. z.o.o. 5252490288 Poland 100Vimec Accessibility Ltd GB 898121786 London 100Vimec Iberica Accesibilidad SL ES B84584457 Spain 100Vimec France Accessibilité Sarl FR 08492484357 France 100Vimec Accessibility LLC 7810693099 Russia 100Motala Hissar 556212-3066 Laholm 100Vega s.r.l 01578140442 Italy 100Vega Style Italia LTDA 07.416.646/0001-01 Brazil 100Vega Elevator Components Shanghai Co Ltd. 913100003295710797 China 100V America LLC 83-0576366 USA 100Claddagh Indùstria e comerico de produtos eletricos e eletronicos LTDA 36.472.339/001-38 Brazil 100LCP S.r.l. 02425820442 Italy 100VR Elettromeccanica L31330501G Albania 100VM Kompensator A/S 36937963 Denmark 100Depac Anstalt FL-0002.010.123-3 Liechtensstein 100Inoxa GmbH 981323769 Austria 100Latour Future Solutions 556863-5964 Gothenburg 100
Nord-Lock International AB 556610-5739 Gothenburg 100Nord-Lock AG CH-320.3.028.873-7 Switzerland 100Nord-Lock ApS 33 878 605 Denmark 100Nord-Lock Co. Ltd 310000400676819 China 100Nord-Lock AB 556137-1054 Åre 100Nord-Lock Inc. 38-3418590 USA 100Nord-Lock Australia Pty Ltd 602531279 Australia 100Superbolt Inc. 25-1478791 USA 100Nord-Lock Benelux BV 2050318 The Netherlands 100Nord-Lock Ltd 4117670 UK 100Nord-Lock Poland Sp. z.o.o. 0000273881 Poland 100Nord-Lock France 439-251-901 France 100Nord-Lock Japan Co, Ltd 1299-01-047553 Japan 100Nord-Lock OY 0893691-1 Finland 100
Note 25 cont.
Cont.
L A T O U R A N N U A L R E P O R T 2 0 2 1 1 1 1
N O T E S

Note 25 cont.
Company name CRN Domicile No. shares Share of equity (%) Book value (SEK m)
Nord-Lock s.r.o. 27294714The Czech Republic 100
Nord-Lock Latin America SpA 76.921.019-9 Argentina 100Nord-Lock GmbH HRB 510204 Germany 100Nord-Lock Switzerland GmbH CH 020.4.041.709-1 Switzerland 100Nord-Lock AS 895 421 812 Norway 100Nord-Lock Italy s.r.I 2 464 160 015 Italy 100Nord-Lock PTE. LTD. 201110682R Singapore 100Boltight Ltd 03832926 UK 100Boltight Inc 814794151 USA 100Twin-Lock AB 559009-2614 Gothenburg 100Nord-Lock Korea Co Ltd. 606-86-01043 South Korea 100Nord-Lock India Pvt. Ltd. U28999MH2017FTC301839 India 100Nord-Lock Iberia S.L A81843575 Spain 100Expander System Sweden AB 556392-6442 Åtvidaberg 100Expander America Inc 0967510-8 USA 100
Swegon Group AB 559078-3964 Gothenburg 100Swegon Operation AB 556077-8465 Gothenburg 100Swegon Sverige AB 559078-3931 Gothenburg 100Swegon GmbH HRB209158 Germany 100Swegon Germany GmbH HRB187767 Germany 100Swegon A/S 247231 Denmark 100Swegon Ltd 01529960 UK 100Swegon Cooling Ltd 01744381 UK 100Swegon Service Ltd 03443661 UK 100Swegon Air Management Ltd 00738495 UK 100Swegon SARL 409-770-195 France 100Swegon AG 48-205-4517 Switzerland 100Swegon North America Inc 1916764 Canada 100Swegon Inc. 26-1934480 USA 100Swegon BVA System Inc 98-0149314 USA 100Swegon BVA System (Tennessee) Inc 98-0150566 USA 100Swegon BVA System (Texas) Inc 46-0524581 USA 100Zent-Frenger GmbH HRB21013 Germany 100Swegon AS 933-765-806 Norway 100Klimax AS 983221726 Norway 100Bergen Klima AS 913445139 Norway 70Østlandet Klima 917535639 Norway 50OY Swegon AB 10108352-2 Finland 100Waterloo Group Limited 04934917 UK 100Waterloo IPR Limited 07809705 UK 100Waterloo Air Products Limited 04911865 UK 100Aircell Ventilation Limited 07507522 UK 100SLT Schanze Lufttechnik GmbH & Co. KG HRA 205482 Germany 100Safegard Systems Limited IE 213635 UK 100720 Holding Oy 3208705-9 Finland 68720 Degrees Oy 2512103-6 Finland 100720 Degrees USA Ltd 81-1518242 USA 100Swegon Sp. z.o.o. 0000106255 Poland 100Swegon BV 24408522 The Netherlands 100Swegon Belgium S.A. 893.224.696 Belgium 100Safeguard Systems Ltd IE8213635D Ireland 100Swegon ILTO OY 1615732-8 Finland 100Swegon BB s.r.I 03991770276 Italy 100Swegon Operations s.r.I 02481290282 Italy 100Swegon Blue Box Private Limited U74210MH2008 India 100bluMartin GmbH HRB187767 Germany 100Swegon Operations Belgium S.A 829.386.721 Belgium 100Swegon Esti OU 101323712 Estonia 100SLT Schanze Lufttechnik GmbH & Co. KG HRA 205482 Germany 100Safegard Systems Limited IE 213635 UK 100P L Group S.A. 429.188.970 Belgium 100
Neuffer Fenster + Türen GmbH HRB 4339 Germany 66.1FOV Fodervävnader i Borås AB 556057-3460 Gothenburg 100
Nordiska Industri AB 556002-7335 Gothenburg 840,000 100 191Total book value 3,746
Smaller inactive subsidiaries are not included above.
N O T E S
1 1 2 L A T O U R A N N U A L R E P O R T 2 0 2 1

THE GROUPDescription of business
Number of shares
Equityinterest
Market value 1) Cost
Equityrights %
Votingrights %
Alimak Group (CRN 556714-1857 Domicile Stockholm) 2) See page 64 16,016,809 1,832 1,832 2,134 30 30ASSA ABLOY AB (CRN 556059-3575 Domicile Stockholm) 2) See page 65 105,495,729 7,053 29,138 1,697 10 29CTEK AB (CRN 556217-4659 Domicile Vikmanshyttan) See page 66 15,280,810 1,061 3,088 1,054 31 31AB Fagerhult (CRN 556110-6203 Domicile Habo) See page 66 84,708,480 3,410 5,159 1,899 48 48HMS Networks AB (CRN 556661-8954 Domicile Halmstad) See page 67 12,109,288 487 6,757 250 26 26Nederman Holding AB (CRN 556576-4205 Domicile Helsingborg) See page 68 10,538,487 673 2,297 306 30 30Securitas AB (CRN 556302-7241 Domicile Stockholm) 2) See page 69 39,732,600 2,191 4,953 1,081 11 30Sweco AB (CRN 556542-9841 Domicile Stockholm) See page 70 97,867,440 2,380 16,657 480 27 21TOMRA Systems ASA (CRN NO927124238 Domicile Asker) See page 71 31,200,000 2,297 20,186 1,605 21 21Troax Group AB (CRN 556916-4030 Domicile Hillerstorp) See page 72 18,060,000 736 8,371 397 30 30Other smaller holdings 65 65 72
22,185 98,503 10,976
1) Listed holdings at purchase price. Unlisted holdings firstly at the last valuation, secondly at the last traded price and thirdly at the acquisition price.2) Class A shares in Assa Abloy, Loomis and Securitas are unlisted. In this table they have been given the same listed price as corresponding class B shares.3) The cost of Sweco B is SEK 34 m higher in the Group due to the exercise of a call option.
PARENT COMPANY 2021 2020Opening book value 8,639 8,911Acquisitions during the year 1,055 128Sold during the year 0 –400Closing value 9,694 8,639
Alimak Group AB 2,129 2,129ASSA ABLOY AB 1,199 1,199CTEK 1,054 0AB Fagerhult 1,728 1,728HMS Networks AB 250 250Nederman Holding AB 306 306Securitas AB 585 585Sweco AB 445 445TOMRA Systems ASA 1,600 1,600Troax Group AB 397 397Closing value 9,693 8,639
NOTE 26 Interests in associates
THE GROUP 2021 2020Opening book value 19,997 20,297Acquisitions during the year 1,087 134Sold during the year 0 –521Profit share for the year after tax 2,620 2,110Dilutive effect 41 5Dividends received –1,041 –927Impairment –282 –108Net change in capital –238 –993Closing value 22,184 19,997
Summary of balance sheet information
2021Fixed
assetsCurrentassets
Totalassets
Long-termliabilities
Currentliabilities
Totalliabilities
Netassets
Alimak Group AB 3,718 2,184 5,902 1,017 1,045 2,061 3,840ASSA ABLOY AB 90,707 39,267 129,974 29,108 31,276 60,384 69,590AB Fagerhult 8,333 4,320 12,653 4,278 2,156 6,434 6,219HMS Networks AB 1,486 717 2,203 564 462 1,026 1,177Nederman Holding AB 2,646 2,083 4,729 1,654 1,357 3,012 1,717Securitas AB 36,494 26,869 63,363 17,328 25,235 42,563 20,800Sweco AB 11,792 7,865 19,657 4,562 6,490 11,052 8,605TOMRA Systems ASA 6,334 5,255 11,589 1,666 3,759 5,425 6,164Troax Group AB 1,655 1,311 2,967 1,042 465 1,508 1,459
Cont.
L A T O U R A N N U A L R E P O R T 2 0 2 1 1 1 3
N O T E S

Summarised reconciliation of financial information 1)
2021Opening
net assets Profit/lossChanges in
changes DividendsClosing
net assets
Holdings in associated
companies GoodwillBook value
Alimak Group AB 3,528 285 132 –162 3,783 1,125 1,249 2,374ASSA ABLOY AB 58,879 10,202 2,807 –4,332 67,556 6,416 637 7,053AB Fagerhult 637 20 0 0 657 204 857 1,061HMS Networks AB 5,803 491 –21 –88 6,185 2,975 435 3,410Nederman Holding AB 1,220 376 –311 –93 1,192 309 178 487Securitas AB 1,301 301 100 –35 1,667 500 172 672Sweco AB 17,707 3,189 713 –1,460 20,149 2,191 0 2,191TOMRA Systems ASA 7,557 1,388 210 –782 8,373 2,293 87 2,380Troax Group AB 5,340 1,114 385 –454 6,385 1,349 948 2,297
2020Alimak Group AB 3,684 208 –68 –94 3,730 849 1,249 2,098ASSA ABLOY AB 59,154 10,002 –2,460 –4,277 62,419 5,929 637 6,566AB Fagerhult 5,501 127 –104 0 5,524 2,657 435 3,092HMS Networks AB 1,010 233 10 0 1,253 326 178 504Nederman Holding AB 1,378 115 –85 0 1,408 423 172 595Securitas AB 19,599 2,642 –1,063 –1,752 19,426 2,113 0 2,113Sweco AB 7,164 1,507 –25 –730 7,916 2,181 87 2,268TOMRA Systems ASA 5,551 755 –121 –367 5,818 1,229 887 2,116Troax Group AB 998 256 –96 –57 1,101 332 284 616
1) The carrying amounts are estimated full-year values, based on each company’s Q3 report, which may include some differences from the actual results presented in previous tables (Sum-mary of information from the balance sheet, income and comprehensive income statements).
Note 26 cont.
The following table summarises information from profit/loss and comprehensive income
2021 Revenue Profit/loss
Other comprehen-sive income
Total comprehen-sive income
Dividends received
Alimak Group AB 3,728 308 179 487 48ASSA ABLOY AB 95,007 10,901 4,149 15,050 411AB Fagerhult 7,087 470 166 636 42HMS Networks AB 1,972 362 –5 357 24Nederman Holding AB 4,042 305 146 452 11Securitas AB 107,700 3,134 1,410 4,544 159Sweco AB 21,792 1,492 184 1,676 215TOMRA Systems ASA 10,909 1,133 –64 1,069 94Troax Group AB 2,581 406 8 414 37
2020Alimak Group AB 3,740 183 –245 –62 28ASSA ABLOY AB 87,649 9,172 –5,197 3,975 406AB Fagerhult 6,816 572 –267 305 0HMS Networks AB 1,467 220 –13 207 0Nederman Holding AB 3,675 110 –192 –82 0Securitas AB 110,899 3,362 231 3,593 191Sweco AB 20,858 1,293 –348 945 202TOMRA Systems ASA 9,941 798 71 869 81Troax Group AB 1,716 243 20 263 19
Summary of balance sheet information
2020Fixed
assetsCurrentassets
Totalassets
Long-termliabilities
Currentliabilities
Totalliabilities
Netassets
Alimak Group AB 3,606 2,013 5,619 1,208 884 2,092 3,527ASSA ABLOY AB 86,178 31,250 117,428 32,683 25,865 58,548 58,880AB Fagerhult 8,347 3,915 12,262 4,802 1,657 6,459 5,803HMS Networks AB 1,339 498 1,837 326 290 616 1,221Nederman Holding AB 2,481 1,769 4,250 1,894 1,055 2,949 1,301Securitas AB 35,124 27,066 62,190 22,671 19,920 42,591 19,599Sweco AB 11,548 8,400 19,948 5,963 6,428 12,391 7,557TOMRA Systems ASA 6,569 4,408 10,977 2,564 2,821 5,386 5,591Troax Group AB 1,535 921 2,456 1,009 302 1,311 1,145
N O T E S
1 1 4 L A T O U R A N N U A L R E P O R T 2 0 2 1
NOTE 27 Other securities owned
THE GROUP 2021 2020Opening cost 44 4Purchases 11 40Sales — —Reclassification — —Closing cost 55 4
Opening impairment –1 –1Impairment for the year — —Closing impairment –1 –1
Book value 54 43
NOTE 33 Cash and cash equivalentsCash and cash equivalents comprise SEK 1,504 m (4,016 m) in bank balances and SEK 12 m (17 m) in short-term bank deposits. The Group receives inter-est on bank balances according to a floating interest rate based on the bank’s daily rate.
NOTE 30 Listed shares – trading
THE GROUP 2021 2020Book value at beginning of the year 0 15Acquisitions for the year 103 30Sales –103 –49Revaluation, booked in the income statement 0 4Book value at end of the year 0 0
Individually assessed accounts receivable that are considered uncollectable are written off by directly reducing the carrying amount. Other receivables are assessed collectively to determine whether there is objective evidence of impairment. For these receivables, the estimated impairment losses are recognised in a separate provision for doubtful debts. Objective evidence of impairment is considered to exist if any of the following indicators are pres-ent: a debtor has significant financial difficulties, default or delinquency in payments (more than 30 days), or a probability that the debtor will enter into bankruptcy or financial reorganisation. Receivables for which an impairment provision was previously recognised are written off against the provision when the Group is no longer expected to recover additional cash. Impairment losses are recognised in the income statement within other expenses. If, in a subsequent period, the amount of the impairment loss decreases, the amount of the reversal of the previously recognised impair-ment is recognised in the consolidated income statement.
Apart from impairment losses made, the credit risk is deemed to be small since the receivables relate to bona fide, paying customers.
Age analysis of accounts receivable 2021 2020Not past due 2,895 1,908
Past due but not impaired at 31 DecemberDue less than 3 months 557 407Due 3 to 6 months 28 23Due more than 6 months 31 59
3,511 2,397
NOTE 29 InventoriesThe value of goods pledged as security for loans or other obligations is SEK 0 (0).
Inventory value: 2021 2020At net realisable valueRaw materials and consumables 95 12Work-in-progress 4 4Finished work and goods for resale 27 87
At costRaw materials and consumables 1,174 709Work-in-progress 449 162Finished work and goods for resale 1,985 1,138Work in progress 19 9 3,753 2,121
NOTE 28 Long-term receivables
THE GROUP 2021 2020Opening cost 27 51Increase for the year 9 5Decrease for the year –5 –29Book value 31 27
The Group’s interest-bearing receivables have an average interest rate of 0 per cent and run for an average period of 12 months.
NOTE 31 Accounts receivable
THE GROUP 2021 2020Nominal value 3,579 2,468Provision for bad debts –68 –71Net accounts receivable 3,511 2,397
Reserve for bad debtsOpening reserve –71 –85Opening reserve for acquired companies –9 –4Provisions for bad debts for the year –4 –2Realised losses during the year 12 10Reversed unutilised amount 6 8Exchange rate differences –2 2
–68 –71
NOTE 32 Derivative instruments
THE GROUP 2021 2020AssetsForward exchange contracts – cash flow hedging 19 1Currency interest rate swap 111 200
130 201Liabilities 1 1Forward exchange contracts – cash flow hedging 0 0
1 1
Forward exchange contractsThe nominal amount of outstanding forward exchange contracts at 31 December was SEK 899 m (788 m). See Note 35.
It is considered that the cash flow hedges meet the terms for effective hedge accounting and the change is therefore recognised in its entirety in other comprehensive income. The impact from the hedging on other com-prehensive income during the year was SEK 11 m (–4 m).
Currency interest rate swapsThe gain or loss associated with the effective portion of a currency interest rate swap, which hedges variable-rate bond funding and currency changes, is recognised in other comprehensive income and amounts to SEK –69 m (129 m).
L A T O U R A N N U A L R E P O R T 2 0 2 1 1 1 5
N O T E S

Fair value through comprehensive income
Fair value through the income statement
Amortised cost
Total carrying amountGroup 2021
Financial assetsListed shares management 0 1) 0Other long-term securities holdings 54 2) 54Other long-term receivables 27 3) 31Listed shares – trading 0 1) 0Unrealised gains, currency derivatives 130 2) 130Other current receivables 4,042 3) 4,042Cash and cash equivalents 1,516 3) 1,516Total 184 – 5,589 5,773Financial liabilitiesLong-term loans 9,429 3) 9,429Bank overdraft facilities 114 3) 114Current loans 323 3) 323Other current liabilities 2,748 3) 2,748Unrealised gains, currency derivatives 2 2) 2Total 2 – 12,614 12,616
1) Level 1 – fair value is measured using quoted prices in an active market for identical assets.2) Level 2 – fair value is measured using inputs other than quoted market prices included within Level 1 that are observable for the assets and liabilities.3) Level 3 – fair value is measured using inputs for the assets and liabilities that are not based on observable market inputs.
Fair value through comprehensive income
Fair value through the income statement
Amortised cost
Total carrying amountGroup 2020
Financial assetsListed shares management 0 1) 0Other long-term securities holdings 43 2) 43Other long-term receivables 27 3) 27Listed shares – trading 0 1) 0Unrealised gains, currency derivatives 201 2) 201Other current receivables 2,618 3) 2,618Cash and cash equivalents 4,033 3) 4,033Total 244 — 6,678 6,922Financial liabilitiesLong-term loans 6,905 3) 6,905Bank overdraft facilities 86 3) 86Current loans 1,787 3) 1,787Other current liabilities 1,650 3) 1,650Unrealised gains, currency derivatives 1 2) 0Total 1 — 10,428 10,492
1) Level 1 – fair value is measured using quoted prices in an active market for identical assets.2) Level 2 – fair value is measured using inputs other than quoted market prices included within Level 1 that are observable for the assets and liabilities.3) Level 3 – fair value is measured using inputs for the assets and liabilities that are not based on observable market inputs.
Hedge accountingLatour uses hedge accounting on forward exchange contracts. Changes in market values of cash flow hedges are recognised in other comprehensive income when they are considered effective, otherwise directly in the income statement. Latour also uses currency interest rate swaps on the Group’s short-term borrowing by converting the interest rates from variable to fixed and, like forward exchange contracts, the change is recognised in the market value in other comprehensive income if efficiency is achieved. Accumulated amounts in other comprehensive income are recycled to the income state-ment during the periods the hedged item affects results. Unrealised gains or losses that arise from market valuation of derivative instruments attributa-ble to hedges of net investments, and which are attributable to exchange rate fluctuations, are recognised in other comprehensive income.
NOTE 34 Financial instruments and financial risk management
Book value and fair value of financial assets and liabilitiesThe table below discloses how fair value is determined for the financial instruments measured in the statement on financial position. Fair value is determined according to three different levels. There were no transfers between the different levels of the fair value hierarchy and there were no changes in the valuation techniques and/or principles used in 2021 com-pared with the 2020 annual accounts.
N O T E S
1 1 6 L A T O U R A N N U A L R E P O R T 2 0 2 1

The basis of fair value for listed financial assets is the quoted market price at the balance sheet date. The basis of fair value for unlisted financial assets is determined using valuation techniques, such as recent transactions, the price of comparable instruments or discounted cash flows.
Currency derivatives comprise forward exchange contracts and are included in level 2. Valuation at fair value of forward exchange contracts is based on forward rates established by banks on an active market.
The fair value of accounts receivable and other receivables, current receivables, cash and other liquid funds, accounts payable and other liabili-ties as well as long-term liabilities are estimated to have the same value as their carrying amount. The market interest rate for the interest-bearing long-term liabilities is not expected to deviate significantly from the dis-count rate. The carrying amounts are therefore assumed in essence to approximate their fair values.
The Group’s valuation process is carried out by the Group finance and treasury department where a team works with valuation of the financial assets and liabilities held by the Group.
Financial risk managementThe Group’s financing operations and management of financial risks is pri-marily centralised to Group staff. Operations are run according to the finance policy adopted by the Board and are characterised by a low level of risk. The aim is to secure the Group’s long-term financing, minimise the Group’s capital expense and effectively manage and control the Group’s financial risks.
Currency exposureThe Group’s operations face currency exposure in the form of exchange rate fluctuations. The Group’s currency exposure consists partly of transaction exposure relating to purchases and sales in foreign currency, and partly to translation exposure relating to net investments in foreign subsidiaries and exchange rate fluctuations when the results from foreign subsidiaries are translated into Swedish crowns.
Transaction exposureThe Group’s goal for transaction exposure is to hedge 50 per cent of the com-ing 12 months’ budgeted cash inflows and outflows. The impact of hedging transactions on income was SEK –4 m (–1 m) and is recognised in other com-prehensive income. See Note 35.
A breakdown of the net currency flows for Swedish entities for the year is shown below:
Currencies (amounts in SEK m) 2021 2020NOK 511 517DKK 156 166GBP 338 341USD –999 –489EUR 989 591CHF 115 97Total 1,110 1,223
+ = net inflow, – = net outflow
Assuming the same net transaction exposure as in 2021 and provided no hedging has been used, profit would have been positively impacted by SEK 12 m (11 m) if the Swedish crown had increased by one percentage point against all transaction currencies. The effect per currency would have been SEK 5 m in NOK, SEK 8 m in EUR, SEK 1 m in DKK, SEK 3 m in GBP and SEK –7 m in USD.
A breakdown by currencies and due dates of the Group’s outstanding forward foreign exchange contracts at 31 December 2021 is shown below:
Amount in SEK m 2022 2023 TotalSell EUR 231 – 231Sell NOK 43 – 43Sell USD 38 – 38Sell DKK 55 – 55Sell GBP 67 – 67Sell CHF 19 – 19Sell total 453 0 453
Buy EUR 0 – 0Buy USD 446 – 446Buy total 446 0 446
Net 899 0 899
The measurement of fair value of forward foreign exchange contracts is accounted for as derivative instruments and totals SEK 19 m (0 m), which is recognised in the consolidated balance sheet.
Translation exposureThe need to hedge net assets in foreign subsidiaries is decided on a case-to-case basis and hedges are based on the group-wise value of the net assets. Hedging is conducted through loans in foreign currencies. Profit/loss from hedges in foreign operations is SEK 0 m (0 m). The amount is reported in other comprehensive income and in reserves in equity. See Note 35.
A breakdown of the net assets of the foreign subsidiaries is shown below:
2021 2020
CurrencyAmount
SEK m %Amount
SEK m %EUR 1,564 53 1,319 65DKK 35 1 –66 –3NOK 95 3 54 3USD 501 17 236 12GBP 258 9 109 5RON 31 1 28 1CAD –24 –1 –34 –2PLN 272 9 251 12CHF 95 3 67 3JPY 17 1 12 1CNY 132 4 86 4Other –22 –1 –33 –2Total 2,954 100 2,029 100
The exchange rate difference for the year arising on the translation of for-eign net assets was SEK 418 m (–571 m) and is reported in other comprehen-sive income and reserves in equity. See Note 35.
Financing risk and liquidity riskThe Group handles the more short-term liquidity risk within the framework of the financing risk. In a business like Latour’s, where long-term financial resources are procured centrally, the short-term liquidity risk is automati-cally handled within long-term financing. Nonetheless, high demands are placed on the regular reporting of the cash flow situation in each of the indi-vidual business units.
In order to reduce the risk of difficulties in procuring capital in the future and refinancing of matured loans, the Group has the following contracted lines of credit:
Of which has been
usedOverdraft facility etc. 292 114Credits granted through 2022 2,003 1,024Credits granted through 2023 3,303 1,938Credits granted through 2024 5,562 2,989Credits granted through 2025 1,650 1,792Credits granted through 2026 184 87Credits granted through 2027< 1,825 1,922
14,819 9,866
1) Promissory notes with maturities of up to 1 year are recognised in the balance sheet as current liabilities, even though they are included under long-term credit facilities.
At 31 December 2021, the Group’s net financial liabilities, excluding share-holdings and other securities, stood at SEK 9,513 m. The majority of the Group’s loans, SEK 9,050 m, are included in the bond market, with the remainder, amounting to SEK 1,980 m, through the Group’s lines of credit. SEK 4,850 m of the liability has exposure to EUR through Swap derivatives.
The interest-bearing liabilities of SEK 9,866 m, due through 2028, are equivalent to a cash outflow, including interest, of SEK 10 billion.
Contracts for granted credits with terms longer than one year contain financial covenants, which state that net debt may not exceed a certain level in relation to the listed market price of the Group’s listed securities. This condition was complied with in 2021.
Note 34 cont.
Cont.
L A T O U R A N N U A L R E P O R T 2 0 2 1 1 1 7
N O T E S

Interest rate riskThe Latour Group’s main sources of financing are cash flows from its oper-ating activities and its equity investment, as well as from loans. The loans are interest-bearing and thus expose the Group to interest rate risk. The Group uses interest rate swaps to minimise the interest rate risk. See Note 32.
Interest rate risk relates to the possibility of changes in the interest rate level having an adverse impact on the Group’s net interest and/or cash flows. The Group’s financing policy establishes guidelines for setting fixed rates and average loan periods for borrowings. The Group strives to achieve a balance between the estimated cost of servicing loans and the risk that major interest rate fluctuations might adversely affect profits. At the end of 2021, the average fixed loan period was about 36 months.
If the interest rate level had been one percentage point higher, profit/loss for the year would have been impacted by SEK –98 m (–79 m). No other effects on equity.
The average cost for outstanding long-term and short-term borrowing at the balance sheet date (see Note 38 for long-term liabilities):
Debt 2021 Debt in 2020% SEK m % SEK m
Long-term borrowing SEK 0.5 9,086 0.5 6,460Long-term borrowing EUR 0.7 301 1.0 417Long-term borrowing DKK 1.6 41 0.7 16Long-term borrowing GBP 0.0 0 0.0 12Long-term borrowing other 0.0 0 0.0 0
0.5 9,428 0.5 6,905
Short-term borrowing SEK 1.0 117 1.1 1,315Short-term borrowing EUR 0.6 306 0.8 229Short-term borrowing USD 0.0 0 0.8 329Short-term borrowing GBP 1.3 14 0.0 0Short-term borrowing PLN 0.0 0 0.0 0
0.7 437 1.5 1,873
Capital managementThe Group’s long-term capital structure goals are to ensure that the Group is able to continue developing its operations, so that it can generate returns for shareholders and benefits for other stakeholders, and to maintain an optimal capital structure in order to keep capital expenses low. The Group is able to change the dividend that is paid to the shareholders or sell assets to reduce debt in order to maintain or adjust the capital structure. The Group assesses its capital adequacy by reference to its debt levels. Latour’s Board of Directors has set limits on debt levels. The Group’s debt cap is set at 10 per cent of the investment portfolio’s value and 2.5 times the wholly-owned industrial operations’ EBITDA, measured as an average for the last three years and adjusted for acquisitions and disposals. The debt has always been well below this threshold.
Credit riskThe Group has limited exposure to credit risks. These risks are primarily related to outstanding accounts receivable. Losses on accounts receivable arise when customers become insolvent or for other reasons fail to meet their payment obligations. The risks are limited through credit insurance policies. Certain businesses also require payment in advance. Group man-agement is of the opinion that there is no significant credit risk concentra-tion in relation to any specific customer or counterparty or in relation to any specific geographic region.
Price riskThe Group is exposed to a price risk concerning shares due to investments held by the Group and which, in the Group’s balance sheet, are classified as either available-for-sale financial instruments or assets measured at fair value through the income statement. The price risk on shares consists of share price risks, liquidity risks and counterparty risks. Share price risk is the risk of value loss due to changes in prices on the stock market. This is the greatest risk in Latour’s business and occurs primarily in the valuation of the investment portfolio. If the market value of holdings in the invest-ment portfolio were to change by 5 per cent, it would affect comprehensive income and equity by SEK 0 m (0 m). Share prices are regularly analysed and monitored by Latour’s group management. Latour has an influence on the companies’ strategies and decisions through its active ownership, exer-cised through board representation and in other ways. Liquidity risk can occur if a share is hard to sell, for example. However, liquidity risk is limited. Counterparty risk is the risk that a party in a transaction with a financial instrument cannot fulfil its obligations and thereby creates a loss for the other party.
The Group is not exposed to any price risk concerning raw materials or commodities.
Operational risksOperational risk is the risk of loss due to inadequate or failed internal pro-cesses and systems. A number of internal guidelines and regulations, as well as policies adopted by the Board, are the basis of Latour’s risk management. Legal reviews of contracts and relations are performed regularly. The Group also has a system of continuous controls that regulate and ensure responsi-bility and authority in operating activities.
Insurance risks in the Group are managed according to the assessed need for insurance. Matters concerning confidentiality and information security are highly prioritised at Latour and are regulated by internal guidelines. Latour also continuously controls and develops its systems and procedures for IT security.
NOTE 35 Equity
Reserves THE GROUP
Hedging reserve
Translation reserve
Fair value reserve 1) Total
Opening balance 1 Jan 2020 –13 455 0 442Translation differences for the year –568 –568Available-for-sale financial assets: Revaluations recognised directly in equity 0 Recognised in the income statement on disposal 0Cash flow hedges –4 –4Interest rate swaps 129 129Hedge of net investment 0Closing other reserves 31 Dec 2020 112 –113 0 –1
Opening balance 1 Jan 2021 112 –113 0 –1Translation differences for the year 416 416Available-for-sale financial assets: Revaluations recognised directly in equity 0 Recognised in the income statement on disposal 0Cash flow hedges 11 11Interest rate swaps –69 –69Hedge of net investment 0Closing other reserves 31 Dec 2021 54 303 0 357
Note 34 cont.
N O T E S
1 1 8 L A T O U R A N N U A L R E P O R T 2 0 2 1

Share capital The parent company’s share capital. The par value of each share is SEK 0.21.
Other contributed capital Refers to equity contributed by the shareholders. Contributed capital is included here as a form of issue in kind and a new issue at a rate exceeding the par value.
Repurchased sharesRepurchased shares comprise the historic cost of the company’s shares held by the parent company and are recognised as a deduction from equity. Pro-ceeds from the sale of own shares are recognised as an increase in equity and transactions costs are recognised directly in equity.
ReservesTranslation reserveThe translation reserve includes all exchange rate differences arising when the currencies of the financial statements of foreign operations are trans-lated into the presentation currency of the consolidated financial state-ments. The parent company and the Group present their financial state-ments in Swedish krona (SEK).
Hedging reserve The hedging reserve comprises foreign exchange differences arising from the translation of debts, derivatives classified as hedging instruments of net investments in a foreign operation and interest rate swaps.
Fair value reserveThe fair value reserve includes the accumulated net change of the fair value of available-for-sale financial assets until the asset is derecognised in the balance sheet.
Profit brought forward including part of comprehensive income for the yearProfit brought forward including part of comprehensive income for the year contains profits earned in the parent company, its subsidiaries and associ-ates. Previous provisions to the statutory reserve, not including transferred share premium reserves, are included in this equity item.
Non-controlling interests Non-controlling interests comprise the share of equity not owned by the parent company.
DividendsDividends are proposed by the Board of Directors in accordance with the rules laid down by the Swedish Companies Act and are approved by the Annual General Meeting. The dividend proposed, but not as yet approved, for 2021 is SEK 2,110 m (SEK 3.30 per share). The amount has not been reported as a liability.
The par value of own holdings that were repurchased was SEK 0.1 m at 31 December 2021. This corresponds to 0.1 per cent of the share capital. The trans-action costs relating to the repurchases are recognised as a deduction from equity. These costs have not affected recognised tax expenses. A repurchase of own shares has been performed to create added value for continuing shareholders in Latour. Call options have been issued to senior executives on all repurchased shares.
Outstanding shares Class A Class B TotalNumber of shares at 1 January 2020 47,635,048 591,744,452 639,379,500Net disposal of own shares 0 –56,700 –56,700Conversion –5,200 5,200 0Total outstanding shares at 31 December 2020 47,629,848 591,692,952 639,322,800
Own shareholding Class A Class B TotalShares held at 1 January 2021 – 460,500 460,500Repurchase during the year – 624,700 624,700Disposal – –568,000 –568,000Total own shareholding at 31 December 2021 0 517,200 517,200
Total number of shares at 31 December 2021 47,629,848 592,210,152 639,840,000
2021 2020Own shareholding Number Cost Number CostAccumulated at beginning of the year 460,500 83 557,500 67Repurchase during the year 624,700 183 565,000 95Disposal –568,000 –102 –662,000 –79Accumulated at end of the year 517,200 164 460,500 83
Earnings per shareTHE GROUP 2021 2020Profit for the year 4,377 5,320Average number of shares outstanding before dilution 639,409,289 639,338,951Average number of shares outstandingafter dilution 641,454,398 641,434,414
Earnings per share related to profit attributable to parent company shareholdersBasic share SEK 6.85 SEK 8.32 Diluted share SEK 6.82 SEK 8.29
Note 35 cont.
NOTE 36 Reconciliation of loans related to financing activities
Changes with no cash-flow effects
31/12/2020 Cash flow
Effect of move-ments in for-
eign exchange Impairment InterestAcquisition
company 31/12/2021Interest-bearing receivables 22 1 23Pension provisions –91 8 –1 –1 –142 –227Long-term liabilities –6,647 –1,802 41 –809 –9,217Earn-out –257 43 105 –180 –289Liabilities, leasing –660 –374 –36 –1,070Utilised bank overdraft facilities –85 –29 –114Interest-bearing current liabilities –1,788 1,542 –246Net debts related to financing activities –9,506 –611 4 105 –1 –1,131 –11,140
L A T O U R A N N U A L R E P O R T 2 0 2 1 1 1 9
N O T E S

2021
Defined benefit obligations by country
Present value of
obligationsFair value of plan assets Total
Sweden 140 0 140Norway 35 –30 5Switzerland 62 –43 19Germany 56 –29 27Italy 34 0 34Other 3 0 3Total 330 –102 228
2020
Defined benefit obligations by country
Present value of
obligationsFair value of plan assets Total
Sweden 15 0 15Norway 34 –28 6Switzerland 68 –43 25Germany 49 –29 20Italy 23 0 23Other 2 0 2Total 191 –100 91
At the last measurement date, the present value of the defined benefit obligation of approximately SEK 77 m was attributable to active employ-ees and SEK 14 m to retired employees.
Amounts reported in the income statement 2021 2020Interest on pension provision 1 1Cost of defined benefit plans 1 1Costs of defined contribution plans 230 188Special employer’s tax and taxes on return 37 30Total pension costs 268 219
The actuarial calculation of pension obligations and pension costs is based on the following principal assumptions:
2021
%Switzer-
land Germany Italy Norway SwedenDiscount rate 1) 0.2 0.7 1.0 1.5 1.9Inflation 1.0 1.0 1.0 2.3 2.2Pay increases 1.0 — 2.0 2.5 0Pension indexation 0.0 2.0 0.0 0.0 0.0
2020
%Switzer-
land Germany Italy NorwayDiscount rate 1) 0.2 0.7 0.3 1.5Inflation 0.8 1.0 0.5 1.8Pay increases 1.0 — 2.0 2Pension indexation 0.0 2.0 0.0 0.0
1) See policies in Note 2 on page 81.
If the discount rate is lowered by 0.5 per cent, the present value of the obligations increases by 5.7 per cent. If the interest rate is raised by 0.5 per cent, the present value of the obligations decreases by 5.2 per cent.
Nearly all Latour Group employees are covered by either defined benefit or defined contribution pension plans. Defined benefit pension plans mean that the employee is guaranteed a pension corresponding to a certain per-centage of his or her salary. The pension plans comprise retirement pension, sickness pension and family pension. The pension obligations are secured through provisions in the balance sheet and through premiums to insurance companies which thereby assume the obligations towards the employees. The Group’s employees outside of Sweden, Norway, Italy, Germany and Switzerland are covered by defined benefit pension plans. Payments for these plans normally constitute a percentage of the employee’s salary.
Obligations for retirement and family pensions for white-collar workers in Sweden are largely secured through insurance with Alecta. Since Alecta is unable to provide sufficient details to report the ITP plan as a defined bene-fit plan, it is reported as a defined contribution plan. Payments for pension insurance policies with Alecta are SEK 63 m for the year. Alecta’s surplus can be divided amongst the insurance policy holders and/or the insured. At the end of 2021, Alecta’s surplus in the form of the collective consolida-tion level was 172 per cent. Pension plans for blue-collar workers in Sweden are defined contribution plans.
The company’s costs and the value of outstanding obligations for defined benefit plans are calculated using actuarial calculations which aim to estab-lish the present value of the obligations.
THE GROUP 2021 2020Defined benefit obligationsPresent value at the beginning of the period 191 223Reclassification 0 0Acquisitions 131 0Pension earned 15 10Interest 1 1Pension payments –12 –28Actuarial gain/loss –2 –1Translation difference 3 –14Closing balance 327 191
Plan assetsOpening balance 100 101Reclassification 0 0Change in reserves –1 –1Closing balance 99 100
Net defined benefit obligations 228 91
NOTE 37 Retirement benefit obligations
NOTE 38 Financial liabilities
At 31 December 2021Less than
1 year
Between 1 year
and 5 yearsMore than
5 years
Total contractual cash flows
Carrying amount
Financial liabilities
Debts to credit institutions 240 9,153 15 9,408 9,408Other financial liabilities 83 276 359 359Leasing liabilities 224 201 645 1,070 1,070Accounts payable 1,568 1,568 1,568
2,115 9,630 660 12,405 12,405
N O T E S
1 2 0 L A T O U R A N N U A L R E P O R T 2 0 2 1

NOTE 39 TaxesDeferred tax in the balance sheetTemporary differences exist where the carrying amount and taxation value differ for a given asset or liability. Temporary differences have resulted in total deferred tax assets and deferred tax liabilities for the Group as follows:
THE GROUP 2021 2020Deferred tax assetsIntangible assets 258 231Land and buildings 10 0Machinery and equipment 5 10Inventories 101 60Current receivables 27 26Provisions 33 32Current liabilities 3 5Other items 17 8
454 372Deferred tax liabilitiesIntangible assets –131 –91Land and buildings –3 –4Machinery and equipment –17 –13
Current receivables –4 –2Untaxed reserves –332 –282Provisions –16 –15Other items –32 –11
–535 –418
Deferred tax assets and deferred tax liabilities are offset if a legally enforce-able right exists to set off current tax assets against current tax liabilities and the deferred taxes relate to the same tax system. Deferred tax recog-nised in other comprehensive income amounts to SEK –3 m (–3 m).
No current tax is recognised in the Group’s or the parent company’s state-ment of comprehensive income.
The SEK 3,173 m (2,727 m) tax loss carryforward with an unlimited carry-forward period in the parent company has not taken deferred tax into account.
NOTE 41 Bank overdraft facilities
The overdraft facility available to the Group is SEK 250 m (250 m), of which SEK 114 m (85 m) has been used.
NOTE 40 Other provisions
THE GROUPGuaranteeprovisions
Otherprovisions Total
Opening value 1 Jan 2020 89 65 154Acquisition (company) 0 25 25Provisions for the year 26 6 32Amounts claimed during the year –16 –16 –32Exchange rate difference –4 –4 –8Closing value 31 Dec 2020 95 76 171Acquisition (company) 2 5 7Provisions for the year 25 32 57Amounts claimed during the year –16 –18 –34Exchange rate difference 2 1 3Closing value 31 Dec 2021 108 96 204
The provisions consist of: 2021 2020Long-term part 190 169Current part 14 2
204 171
Other provisions primarily consist of provisions for restructuring costs.
NOTE 42 Accrued expenses and deferred income
THE GROUP 2021 2020Accrued interest expenses 20 18Accrued social security fees 163 134Accrued other pay-related costs 498 371Other items 695 525Total 1,376 1,048
NOTE 43 Pledged assets
THE GROUP 2021 2020For own liabilities and provisionsRelating to pension obligations– Floating costs – –– Other securities 1 1
Shares as collateral for net loans 1) 3,623 3,410
Other– Floating costs 0 0– Property mortgages 93 95– Other securities 36 32Total 3,753 3,538
PARENT COMPANY 2021 2020For the Group’s liabilities Shares as collateral for net loans 1) 516 516Total collateral pledged 516 516
1) As collateral for loans from credit institutions, 37,200,000 Assa Abloy class B and 20,600,000 Securitas class B shares have been pledged at a market value of SEK 12,842 m and a book value in the Group of SEK 3,623 m and in the company of SEK 516 m. The collateral is for the duration of the loan.
NOTE 44 Contingent liabilities
THE GROUP 2021 2020Underwriting agreements 1,055 –Other obligations 21 15Total 1,076 15
PARENT COMPANY 2021 2020Guarantees for subsidiaries 872 1,382Total 872 1,382
The parent company has pledged to assume certain obligations that may befall Group companies.
NOTE 45 Business combinations
2021 2020Intangible assets 441 36Property, plant and equipment 472 124Financial assets 551 3Inventories 548 117Accounts receivable 399 108Other current receivables 55 25Cash 126 52Long-term net borrowing –963 –252Current liabilities –490 –154Net identifiable assets and liabilities 1,139 59Group goodwill 1,536 845Total purchase price 2,675 904Earn-out –180 –159Cash settlement purchase price 2,495 745Acquisition of non-cash items –80 –1Cash and cash equivalents in acquired companies –126 –52Effect on Group cash and cash equivalents 2,289 692
L A T O U R A N N U A L R E P O R T 2 0 2 1 1 2 1
N O T E S

January 2021, the company’s revenues would have been SEK 1,829 m and profit/loss for the year would have been SEK –3 m. Goodwill is attributable to the synergies that will be created when the manufacturing and sales organisation is merged with Hultafors Group’s existing operations. Transac-tion costs of SEK 9 m for this acquisition were charged to the income state-ment for the period.
Intangible assets 124Property, plant and equipment 407Financial assets 497Inventories 326Accounts receivable 182Other receivables 9Cash 20Long-term net borrowing –711Current liabilities –243Net identifiable assets and liabilities 611Group goodwill 131Acquisition of non-cash items –31Cash and cash equivalents in acquired companies –20Change in Group cash and cash equivalents on acquisition 691
HK Instrument OyOn 1 June 2021, the Group acquired the entire shareholding of HK Instru-ment Oy. The acquired operations contributed SEK 54 m in revenues and SEK 8 m in net profit for the period 1 June to 31 December 2021. If the acquisition had been made on 1 January 2021, the company’s revenues would have been SEK 88 m and profit/loss for the year would have been SEK 13 m. Goodwill is attributable to the synergies that will be created when the manufacturing and sales organisations are merged with Bemsiq’s exist-ing operations. Transaction costs of SEK 7 m for this acquisition were charged to the income statement for the period.
Property, plant and equipment 1Inventories 13Accounts receivable 13Other receivables 1Cash 35Current liabilities –8Net identifiable assets and liabilities 55Group goodwill 97Earn-out –12
Cash and cash equivalents in acquired companies –35Change in Group cash and cash equivalents on acquisition 105
720 OyOn 31 August 2021, the Group acquired the entire shareholding of 720 Oy. The acquired operations contributed SEK 11 m in revenues and SEK –3 m in net profit for the period 31 August to 31 December 2021. If the acquisition had been made on 1 January 2021, the company’s revenues would have been SEK 5 m and profit/loss for the year would have been SEK –4 m. Transac-tion costs of SEK 2 m for this acquisition were charged to the income state-ment for the period.
Intangible assets 10Property, plant and equipment 3Financial assets 2Other receivables 2Long-term net borrowing –15Current liabilities –1Net identifiable assets and liabilities 1Group goodwill 0Cash settlement purchase price 1
Motala Hissar ABOn 31 August 2021, the Group acquired the entire shareholding of Motala Hissar AB. The acquired operations contributed SEK 73 m in revenues and SEK 4 m in net profit for the period 31 August to 31 December 2021. If the acquisition had been made on 1 January 2021, the company’s revenues would have been SEK 195 m and profit/loss for the year would have been SEK 16 m. Goodwill is attributable to the earning capacity and the synergies that will be created when the manufacturing and sales organisations are merged with Latour Industries’ existing operations. Transaction costs amounted to SEK 2 m for this acquisition.
VM Kompensator A/SOn 8 January 2021, the Group acquired the entire shareholding of VM Kom-pensator A/S. The acquired operations contributed SEK 23 m in revenues and SEK 1 m in net profit for the period 8 January to 31 December 2021. If the acquisition had been made on 1 January 2021, the company’s revenues would have been SEK 23 m and profit/loss for the year would have been SEK 1 m. Goodwill is attributable to the earning capacity and the synergies that will be created when the manufacturing and sales organisations are merged with Latour Industries’ existing operations. Transaction costs amounted to SEK 1 m for this acquisition.
Property, plant and equipment 1Inventories 2Accounts receivable 5Cash 1Current liabilities –2Net identifiable assets and liabilities 7Group goodwill 48Earn-out –27Cash and cash equivalents in acquired companies –1Change in Group cash and cash equivalents on acquisition 27
Vega SrlOn 11 January 2021, the Group acquired the entire shareholding of Vega Srl. The acquired operations contributed SEK 245 m in revenues and SEK 36 m in net profit for the period 11 January to 31 December 2021. If the acquisi-tion had been made on 1 January 2021, the company’s revenues would have been SEK 265 m and profit/loss for the year would have been SEK 38 m. Goodwill is attributable to the earning capacity and the synergies that will be created when the manufacturing and sales organisations are merged with Latour Industries’ existing operations. Transaction costs amounted to SEK 5 m for this acquisition.
Intangible assets 1Property, plant and equipment 10Inventories 55Accounts receivable 65Other receivables 14Cash 14Long-term net borrowing –16Current liabilities –63Net identifiable assets and liabilities 81Group goodwill 334Earn-out –65Cash and cash equivalents in acquired companies –14Change in Group cash and cash equivalents on acquisition 336
Elsys ABOn 20 January 2021, the Group acquired 70 per cent of the shares in Elsys AB. The acquired operations contributed SEK 55 m in revenues and SEK 10 m in net profit for the period 20 January to 31 December 2021. If the acqui-sition had been made on 1 January 2021, the company’s revenues would have been SEK 55 m and profit/loss for the year would have been SEK 10 m. Goodwill is attributable to the earning capacity and the synergies that will be created when the manufacturing and sales organisations are merged with Bemsiq’s existing operations. Transaction costs amounted to SEK 1 m for this acquisition.
Inventories 2Accounts receivable 10Cash 15Long-term net borrowing –3Current liabilities –3Net identifiable assets and liabilities 21Group goodwill 94Acquisition of non-cash items 3Cash and cash equivalents in acquired companies –15Change in Group cash and cash equivalents on acquisition 103
FristadsOn 28 March 2021, the Group acquired the entire shareholding of Fristads AB, Kansas AS, Kansas GmbH and Leijona Group OY. The acquired opera-tions contributed SEK 1,576 m in revenues and SEK 1 m in net profit for the period 28 March to 31 December 2021. If the acquisition had been made on 1
N O T E S
1 2 2 L A T O U R A N N U A L R E P O R T 2 0 2 1

Intangible assetsProperty, plant and equipment 4Inventories 25Accounts receivable 15Other receivables 3Cash 24Long-term net borrowing –3Current liabilities –25Net identifiable assets and liabilities 43Group goodwill 102Earn-out 0Cash and cash equivalents in acquired companies –24Change in Group cash and cash equivalents on acquisition 121
Greystone Energy System Inc.On 29 September 2021, the Group acquired the entire shareholding of Grey-stone Energy System Inc. and its underlying subsidiaries. The acquired operations contributed SEK 50 m in revenues and SEK 6 m in net profit for the period 29 September to 31 December 2021. If the acquisition had been made on 1 January 2021, the company’s revenues would have been SEK 184 m and profit/loss for the year would have been SEK 31 m. Goodwill is attrib-utable to the synergies that will be created when the manufacturing and sales organisations are merged with Bemsiq’s existing operations. Transac-tion costs of SEK 13 m for this acquisition were charged to the income state-ment for the period.
Intangible assets 305Property, plant and equipment 33Financial assets 48Inventories 52Accounts receivable 38Other receivables 4Cash 4Long-term net borrowing –201Current liabilities –67Net identifiable assets and liabilities 216Group goodwill 0Acquisition of non-cash items –48Cash and cash equivalents in acquired companies –4Change in Group cash and cash equivalents on acquisition 164
Depac AnstaltOn 30 September 2021, the Group acquired the entire shareholding of Depac Anstalt. The acquired operations contributed SEK 23 m in revenues and SEK 1 m in net profit for the period 30 September to 31 December 2021. If the acquisition had been made on 1 January 2021, the company’s revenues would have been SEK 87 m and profit/loss for the year would have been SEK 5 m. Goodwill is attributable to the synergies that will be created when the manufacturing and sales organisations are merged with Latour Industries’ existing operations. Transaction costs of SEK 4 m for this acquisition were charged to the income statement for the period.
Intangible assetsProperty, plant and equipment 7Financial assets 2Inventories 15Accounts receivable 12Other receivables 5Cash 3Long-term net borrowing –14Current liabilities –6Net identifiable assets and liabilities 24Group goodwill 114Earn-out –76Cash and cash equivalents in acquired companies –3Change in Group cash and cash equivalents on acquisition 59
Scangrip A/SOn 29 October 2021, the Group acquired the entire shareholding of Scangrip A/S and its underlying subsidiaries. The acquired operations contributed SEK 52 m in revenues and a SEK –1 m in net profit for the period 29 October to 31 December 2021. If the acquisition had been made on 1 January, the company’s revenues would have been SEK 315 m and profit/loss for the year would have been SEK 43 m. Goodwill is attributable to the synergies that
Note 45 cont.
NOTE 46 Government grants
Government grants have affected the Group’s income statement and balance sheet as follows:
THE GROUP 2021 2020Grants that affected income for the year 15 64Grants that affected assets 0 3
Received grants that have affected profit for the year in 2021, and that refer to support related to Covid-19, amount to approximately SEK 2 m, of which none was in Sweden. No companies within the Group have received any reorientation support, only support for short-term layoffs.
will be created when the manufacturing and sales organisation is merged with Hultafors Group’s existing operations. Transaction costs of SEK 3 m for this acquisition were charged to the income statement for the period.
Intangible assetsProperty, plant and equipment 6Financial assets 2Inventories 58Accounts receivable 59Other receivables 17Cash 10Current liabilities –72Net identifiable assets and liabilities 80Group goodwill 616Acquisition of non-cash items –4Cash and cash equivalents in acquired companies –10Change in Group cash and cash equivalents on acquisition 682
The Director’s Report on page 76 provides further details about business combinations.All acquired goodwill relates to Group goodwill on acquisition which is non tax-deductible.
NOTE 47 Events after the reporting period
On 1 February, Hultafors Group acquired he entire shareholding of the Swedish company Telesteps AB, a leading manufacturer of telescopic lad-ders for professional users. Telesteps has net sales of SEK 87 with a profita-bility on a par with Hultafors Group’s other operations. On 7 February, Bem-siq entered into an agreement to acquire the entire shareholding of the German company Consens GmbH, which has net sales of EUR 2.9 m. Cons-ens manufactures devices, sensors, components and testing technology for humidity, temperature and air quality. On 9 February, Latour Industries acquired the entire shareholding of the Italian company Esse-Ti S.r.l., a leading manufacturer of alarm systems for lifts. Esse-Ti has net sales of approximately EUR 10 m, of which 40 per cent is exported, and has 33 employees. On 18 February 2022, the Swedish Financial Supervisory Authority approved an updated base prospectus for the existing MTN programme. In conjunction with the updating of the base prospectus, Latour decided to increase the framework amount from SEK 12 billion to SEK 15 billion, or the equivalent in EUR. The war in Ukraine may have a negative impact on Latour’s business in both the short and the long term. The business impact is very difficult to predict, however, due to the uncertainty regarding market conditions, but the health and safety of our employees is our top priority.
L A T O U R A N N U A L R E P O R T 2 0 2 1 1 2 3
N O T E S

NOTE 49 Definitions
Return on equity Net profit in the income statement as a percentage of average shareholders’ equity.Return on operating capital Operating profit as a percentage of average operating capital.Return on total capital Profit/loss after net financial items plus financial expense in relation to the average balance sheet total.Direct return Dividends as a percentage of the share purchase price.Operating profit (EBITDA) Earnings before interest, tax, depreciation of property, plant and equipment and amortisation of acquisition-related intangible assets, acquisition-related costs
and income, and items impacting comparability. Operating profit (EBITA) Earnings before interest, tax, amortisation of acquisition-related intangible assets, acquisition-related costs and income, and items impacting comparability.Operating profit (EBIT) Earnings before interest and taxes.Operating margin (EBITA) % Earnings before interest, tax, amortisation of acquisition-related intangible assets, acquisition-related costs and income, and items impacting comparability, as
a percentage of net sales. Operating margin (EBIT) % Operating profit divided by net sales. EBIT multiple Operating profit in relation to market value adjusted for net debt. EV (Enterprise Value) The company’s market value plus net debt.Adjusted equity Equity and the difference between book value and fair value in associated companies.Adjusted equity ratio Equity and the difference between book value and fair value in associated companies in relation to adjusted total assets.Net gearing ratio Interest-bearing liabilities and interest-bearing provisions less cash and cash equivalents in relation to adjusted equity.Net debt Interest-bearing liabilities plus interest-bearing provisions less cash and cash equivalents and interest-bearing receivables.Operating capital Total assets less cash and cash equivalents and other interest-bearing assets and non-interest-bearing liabilities.Organic growth Increase in revenue for the period, adjusted for acquisitions/disposals and exchange rate changes, as a percentage of the previous year’s revenue adjusted for
acquisitions and disposals.P/E ratio The share purchase price in relation to profit after paid tax.Basic earnings per share Profit for the period divided by the number of outstanding shares in the period.
Calculations:Jan–Dec 2021: 4,377/639,409,289 x 1,000’ = 6.85Jan–Dec 2020: 5,320/639,338,951 x 1,000’ = 8.32
Diluted earnings per share Calculations:Jan–Dec 2021: 4,377/641,454,398 x 1,000’ = 6.82Jan–Dec 2020: 5,320/641,434,414 x 1,000’ = 8.29The call options that had been issued as at the balance sheet date were included in the calculation of diluted earnings.
Equity ratio Equity in relation to total assets.Net asset value The difference between the company’s assets and liabilities, when the investment portfolio (incl. associated companies) is recognised at market value and
operative subsidiaries that are owned at the end of the period are recognised in an interval based on EBIT multiples for comparable listed companies in each business area.
Total growth Increase in revenue for the period as a percentage of the previous year’s revenue.Currency-driven growth Increase in revenue due to currency changes for the period as a percentage of the previous year’s revenue.Profit margin Profit after net financial items plus finance expense as a percentage of invoiced sales.Other The amounts in tables and other charts have each been rounded off. There may therefore be minor differences in the totals due to rounding-off.
NOTE 48 Significant estimates and judgements
To be able to prepare the financial statements in accordance with generally accepted accounting practice, the executive management and the Board of Directors must make judgements and assumptions that affect the asset and liability items and the revenue and expense items reported in the annual accounts, as well as other disclosures, for example contingent liabilities. These judgements are based on historic experience and the various assump-tions that the management and the Board of Directors consider reasonable in the current circumstances. In cases where it is not possible to ascertain the carrying amounts of assets and liabilities through information from other sources, these estimations and assumptions form the basis of the valuation. Actual outcomes could differ from these estimates if other assumptions are made or other circumstances arise.
The assumptions can have a significant effect on Latour’s result and finan-cial position especially in the areas of income accounting and uncertain receiv-ables, measurement of intangible and fixed assets, obsolescence assessment of inventories, restructuring measures, pension obligations, taxes, disputes and contingent liabilities (see each respective note).
The executive management and the audit committee have discussed the development, selection and disclosures concerning the Group’s critical accounting policies and estimates and the application of these policies and estimates.
Goodwill impairmentEach year, the Group assesses whether goodwill has suffered any impair-ment loss, based on the accounting policy described in Note 2.
The recoverable amounts of cash-generating units have been determined based on value in use calculations. These calculations require the use of certain estimates (Note 19).
Business combinations The business combinations are accounted for using the acquisition method, which means that acquired assets and liabilities are recognised at fair value at the time of acquisition. To determine fair values, the executive management uses valuation models with elements of estimates and assumptions. The pur-chase price includes an assessment of any contingent earn-outs.
Pension obligations The present value of the pension obligations depends on a number of factors that are established on an actuarial basis using a number of assumptions. Discount interest is included in the assumptions used to determine the net cost (income) of pensions.
The Group establishes appropriate discount interest rates at the end of every year. This is the interest used to determine the present value of esti-mated future payments that are assumed necessary to pay for pension obli-gations. See Accounting Policies Note 2 for information on how the Group determines an appropriate discount rate.
Other principal actuarial assumptions for pension obligations are based in part on current market conditions. Further details are given in Note 37.
WarrantiesThe management of each subsidiary estimates necessary reserves to guar-antee future warranty requirements based on information about past war-ranty requirements and current trends that indicate that the past informa-tion may differ from future requirements.
The factors that may affect the information about warranty requirements include the success of the Group’s productivity and quality initiatives and the cost of labour and materials.
N O T E S
1 2 4 L A T O U R A N N U A L R E P O R T 2 0 2 1

The following profits in the parent company are at the disposal of the Annual General Meeting:
Profit brought forward SEK 10,099.8 mProfit for the year SEK 1,823.0 m SEK 11,922.9 m
At 15 March 2022, the number of shares entitling the holder to receive dividends was 639,322,800 after the exclusion of repurchased shares. The Board of Directors proposes the following allocation:
A total dividend of SEK 3.30 per share is paid to the shareholders SEK 2,109.8 mTo be carried forward SEK 9,813.1 m SEK 11,922.9 m
The Board of Directors is of the opinion that the proposed dividend payment is justified in view of the demands that the operations place on the amount of equity, taking into consideration the scope and risks of the business and the company’s and the Group’s consolidation requirements, liquidity and overall position.
The income statement and balance sheet will be presented for approval by the Annual General Meeting on 10 May 2022.
The Board of Directors and the Chief Executive Officer declare that the consolidated financial statements have been prepared in accordance with the International Financial Reporting Standards (IFRS), as approved by the European Union, and that they give a true and fair view of the Group’s financial position and performance. The Annual Report has been prepared in line with generally accepted accounting practice in Sweden and gives a true and fair view of the parent company’s financial position and performance. The Directors’ Report for the Group and the parent company gives a true and fair view of the development of Group and parent company operations, financial positions and performance, and describes the principal risks and uncertainties faced by the parent company and the Group’s companies.
Gothenburg, 15 March 2022
Olle NordströmChairman
Ulrika KolsrudBoard member
Our independent Auditor’s Report was given on 18 March 2022Ernst & Young AB
Proposed allocation of profits
Mariana Burenstam LinderBoard member
Anders BöösBoard member
Carl DouglasBoard member
Johan HjertonssonChief Executive Officer
Lena OlvingBoard member
Eric DouglasBoard member
Joakim RosengrenBoard member
Staffan LandénAuthorised Public Accountant
Principal Auditor
L A T O U R A N N U A L R E P O R T 2 0 2 1 1 2 5
P R O P O S E D A L L O C A T I O N O F P R O F I T S

Description of the area How this area was taken into account in the audit
Valuation of goodwillOn 31 December 2021, reported goodwill amounts to SEK 12,266 m, which corre-sponds to 26% of total assets in the Group. As described in Notes 2, 19 and 48 of the Annual Report, goodwill is tested annually for impairment in accordance with IAS 36. This testing is based on an assessment of the recoverable amount for all of the smallest cash-generating units identified by the executive management, with individual assumptions about growth, profit margins, tied-up capital, invest-ment needs as well as discount rates. The executive management’s estimate of future cash flows is based on market, growth and margin on the basis of the asset’s existing structure with no effect from future acquisitions. The test is based on complex valuation models, key assumptions and assessments with inherent uncertainty. Changes in assumptions can have a significant impact on the recoverable amount. In addition, the value of goodwill amounts to significant sums. In view of that set out above, we consider that the valuation of goodwill constitutes a particularly significant area in our audit.
Our audit procedures for evaluating the Group’s impairment testing have included:f evaluation of the Group’s model and assumptions. The evaluation has included whether the model has been prepared according to generally accepted valuation techniques, as well as the appropriateness of applied discount rates and assump-tions compared to comparable companies;f testing of the executive management’s sensitivity analysis, as well as conducting an independent sensitivity test of key assumptions in order to identify whether a reasonable future change in these might lead to an impairment requirement;f assessment of the reasonableness of future cash flows against the adopted budget, forecast and business plan, as well as other information received following discussion with the executive management and a review of the minutes of board meetings and other management meetings;f evaluation of the executive management’s accuracy in estimating future cash flows by comparing historical forecasts against outcomes; andf evaluation of whether the executive management has provided the necessary information in the Annual Report as at 31 December 2021.
Statement on the Annual Report and the consolidated financial statementsOPINIONWe have conducted an audit of the Annual Report and consoli-dated financial statements of Investmentaktiebolaget Latour for 2021. The company’s Annual Report and consolidated finan-cial statements are presented on pages 85–125 of this document.
In our opinion, the Annual Report has been prepared as required by the Swedish Annual Accounts Act and presents fairly, in all material respects, the financial position of the parent company at 31 December 2021, and its financial per-formance and cash flows for the year, in accordance with the Swedish Annual Accounts Act. The consolidated financial statements have been prepared as required by the Swedish Annual Accounts Act and present fairly, in all material respects, the financial position of the Group at 31 December 2021, and its financial performance and cash flows for the year, in accordance with the International Financial Report-ing Standards (IFRS), as approved by the European Union, and the Swedish Annual Accounts Act. The Directors’ Report is consistent with the other sections of the Annual Report and the consolidated financial statements.
We therefore recommend that the General Meeting of Share-holders adopts the income statement and the balance sheet of the parent company and the Group.
Our opinion in this statement on the Annual Report and the consolidated financial statements is consistent with the content of the additional report that has been presented to the parent company’s Audit Committee in accordance with Article 11 of Regulation (EU) No. 537/2014 on requirements regarding statutory audit of public-interest entities.
BASIS FOR OPINIONWe conducted our audit in line with International Standards on Auditing (ISA) and generally accepted auditing practices
in Sweden. Our responsibility under these standards is described in more detail in the section “Auditor’s responsibil-ity”. We are independent from the parent company and the Group in accordance with generally accepted auditing prac-tices in Sweden and have otherwise executed our audit responsibilities in compliance with professional ethics as required by these standards. This means that, to the best of our knowledge and belief, no prohibited non-audit services as referred to in Article 5.1 of the Regulation (EU) No. 537/2014 on specific requirements regarding statutory audit of pub-lic-interest entities have been provided to the audited entity or, where applicable, to its parent company or its regulated entities within the EU, with the exception of two services with very limited scope that have been completed and reported to the Audit Committee.
We believe that the audit evidence we have obtained is suffi-cient and appropriate to provide a basis for our audit opinion.
KEY AUDIT MATTERSKey audit matters are those matters that, in our professional judgement, were of most significance in our audit of the con-solidated financial statements for the current period. These matters were addressed in the context of our audit of the Annual Report and the consolidated financial statements as a whole, and in forming our opinion thereon, and we do not provide a separate opinion on these matters. The description below regarding the implementation of the audit in these areas must be read in this context.
We have fulfilled the obligations described in the Auditor’s responsibility section in our statement on the Annual Report within these areas as well. As a result, audit measures were implemented that have been designed to take into account our assessment of the risk of material errors in the Annual Report and the consolidated financial statements. The outcome of our audit and the audit procedures that have been implemented to add- ress those areas listed below form the basis of our Auditor’s report.
Auditor’s reportTo the General Meeting of Shareholders of Investment AB Latour (publ), corporate registration number 556026-3237
Valuation of goodwill
A U D I T O R ’ S R E P O R T
1 2 6 L A T O U R A N N U A L R E P O R T 2 0 2 1

Information other than the Annual Report and the consolidated financial statements THIS DOCUMENT also contains other disclosures than the Annual Report and the consolidated financial statements, and these can be found on pages 1–83 and 126–140. The remunera-tion report for the 2021 financial year also constitutes other information. The Board of Directors and the Chief Executive Officer are responsible for this other information. Our opinion on the Annual Report and consolidated finan-cial statements does not cover this other information and we do not express any form of assurance conclusion thereon. In connection with our audit of the Annual Report and con-solidated financial statements, our responsibility is to read the other information and, in doing so, consider whether the other information is materially inconsistent with the Annual Report and consolidated financial statements. In this proce-dure, we also take into account the knowledge we have other-wise obtained in the audit and assess whether the information otherwise appears to be materially misstated. If, based on the work we have performed, we conclude that there is a material misstatement of this other information, we are required to report that fact. We have nothing to report in this regard.
RESPONSIBILITIES OF THE BOARD OF DIRECTORS AND THE CHIEF EXECUTIVE OFFICER The Board of Directors and the Chief Executive Officer are responsible for the preparation of the Annual Report and the consolidated financial statements and for ensuring that they give a fair presentation in accordance with the Swedish Annual Accounts Act and, concerning the consolidated financial statements, in accordance with the International Financial Reporting Standards (IFRS), as approved by the European Union. The Board of Directors and the Chief Exec-utive Officer are also responsible for such internal control as they determine necessary to enable preparation of an Annual Report and consolidated financial statements that are free from material misstatement, whether caused by fraud or error.
In preparing the Annual Report and the consolidated finan-cial statements, the Board of Directors and the Chief Execu-tive Officer are responsible for the assessment of the compa-ny’s ability to continue as a going concern. They disclose, as applicable, matters that can impact the ability to continue as a going concern and to use the going concern basis of account-ing. The Board of Directors and the Chief Executive Officer cannot use the going concern basis of accounting, however, if
they intend to liquidate the company, cease trading or have no realistic alternative but to do so.
The Board’s Audit Committee must oversee the company’s financial reporting activities, without it affecting the respon-sibilities and duties of the Board.
AUDITOR’S RESPONSIBILITYThe objectives of our audit are to obtain reasonable assurance that the Annual Report and the consolidated financial state-ments as a whole are free from material misstatement, whether caused by fraud or error, and to issue an auditor’s report that includes our opinion. Reasonable assurance is a high level of assurance, but is not a guarantee that an audit conducted in accordance with ISA and generally accepted auditing standards in Sweden will always detect a material misstatement when it exists. Misstatements can arise from fraud or error and are considered material if, individually or in the aggregate, they could reasonably be expected to influ-ence the economic decisions of users taken on the basis of the Annual Report and the consolidated financial statements.
As part of an audit in accordance with ISA, we use profes-sional judgment and adopt a professionally sceptical attitude throughout the audit. In addition:
fwe identify and assess the risks of material misstatement in the Annual Report and the consolidated financial state-ments, whether due to fraud or error, we design and per-form audit procedures based in part on these risks, and we obtain audit evidence that is sufficient and appropriate to provide a basis for our audit opinion. The risk of failing to detect a material misstatement as a result of fraud is higher than for a material misstatement due to error, since fraud may include actions carried out in collusion, forgery, inten-tional omissions, misinformation or the disregard of inter-nal controls. fwe gain an understanding of the part of the company’s internal controls that is relevant to our audit, in order to design audit procedures that are appropriate in the circum-stances, but not in order to comment on the effectiveness of the internal controls.
fwe evaluate the appropriateness of the accounting policies that are used and the reasonableness of the Board of Directors’ and CEO’s estimates in the accounts and related disclosures.
fwe draw a conclusion on the appropriateness of the Board of Directors and the CEO using the going concern basis of accounting in the preparation of the Annual Report and the consolidated financial statements. We also draw a conclu-sion, based on the audit evidence obtained, on whether there is any material uncertainty regarding such events or
Description of the area How this area was taken into account in the audit
Valuation of inventoriesTen business combinations have been made during the financial year, corresponding to an acquisition value of SEK 2,675 m. These can be seen from Note 45 in the Annual Report. The business combinations are accounted for using the acquisition method, which means that acquired assets and liabilities are recognised at fair value at the time of acquisition. Goodwill is recognised corresponding to the remaining portion of the purchase price that is not allocated to the acquired net assets. The purchase price includes an assessment of contingent earn-outs. To determine fair values, the execu-tive management uses valuation models with elements of estimates and assumptions. Given the scope of this year’s business combinations, we believe that accounting for acquisitions is a particularly important area in our audit.
Our audit procedures for evaluating the Group’s reporting of business combinations have included: f review of prepared acquisition analyses,f review of acquisition agreements,f evaluation of assessments related to contractual earn-outs,f audit of acquisition balances and acquired net assets,f evaluation of the suitability of assumptions made in connection with the calculation of fair values of acquired assets and liabilities, andf evaluation of whether the executive management has provided the necessary information in the Annual Report as at 31 December 2021.
Accounting for acquisitions
L A T O U R A N N U A L R E P O R T 2 0 2 1 1 2 7
A U D I T O R ’ S R E P O R T
circumstances that could lead to significant doubt regard-ing the company’s ability to continue operations. If we con-clude that there is a material uncertainty, we must draw attention in the Auditor’s report to the disclosures in the Annual Report relating to the material uncertainty or, if such disclosures are insufficient, we must modify our state-ment on the Annual Report and the consolidated financial statements. Our conclusions are based on the audit evi-dence obtained up to the date of the Auditor’s report. How-ever, future events or circumstances may result in a com-pany no longer being able to continue its operations. fwe evaluate the overall presentation, structure and content of the Annual Report and the consolidated financial state-ments, including the disclosures, and whether the Annual Report and the consolidated financial statements reflect the underlying transactions and events in a manner that gives a true and fair view.
fwe obtain sufficient and appropriate audit evidence regard-ing the financial information for the entities or business activities within the Group to make a statement regarding the consolidated financial statements. We are responsible for the governance, monitoring and execution of the Group audit. We are solely responsible for our statements.
We must notify the Board of Directors about e.g. the planned scope and focus of the audit as well as its timing. We must also provide information about significant observa-tions made during the audit, including any significant defi-ciencies that we have identified in the internal controls.
We must also provide the Board of Directors with a state-ment confirming that we have complied with relevant profes-sional ethical requirements in respect of independence, and address any relationships and other circumstances that might reasonably affect our independence, as well as, where applica-ble, measures that have been implemented to eliminate threats or countermeasures that have been taken.
Of the areas that are communicated with the Board of Directors, we determine which of these areas have been the most significant for the audit of the Annual Report and the consolidated financial statements, including the most impor-tant assessed risks of material misstatement, and which therefore constitute the areas of particular importance for the audit. We describe these areas in the Auditor’s report, unless legal or statutory requirements prevent disclosures regarding this matter.
Statement on other legal and statutory requirements
THE AUDITOR’S AUDIT OF THE ADMINISTRATION AND THE PROPOSAL FOR APPROPRIATION OF THE COMPANY’S PROFIT OR LOSS
OPINIONIn addition to our audit of the Annual Report, we have also audited the administration of the Board of Directors and the Chief Executive Officer of Investmentaktiebolaget Latour for the year 2021 and the proposed appropriations of the compa-ny’s profit.
We recommend that the General Meeting of Shareholders appropriate the profit as proposed in the Directors’ Report and grant the members of the Board and the Chief Executive Officer discharge from liability for the financial year.
BASIS FOR OPINIONWe conducted the audit in line with generally accepted audit-ing practice in Sweden. Our responsibility under this practice is described in more detail in the section Auditor’s responsibil-ity. We are independent from the parent company and the Group in accordance with generally accepted auditing prac-tices in Sweden and have otherwise executed our audit responsibilities in compliance with professional ethics as required by these standards.
We believe that the audit evidence we have obtained is suffi-cient and appropriate to provide a basis for our audit opinion.
RESPONSIBILITIES OF THE BOARD OF DIRECTORS AND THE CHIEF EXECUTIVE OFFICERThe Board of Directors is responsible for the proposal for appropriations of the company’s profit or loss. A proposal for a dividend payout includes an assessment of whether the divi-dend is justifiable considering the requirements placed by the company’s and the Group’s type of operations, scope and risks on the size of the parent company’s and the Group’s equity, consolidation requirements, liquidity and position in general.
The Board is responsible for the company’s organisation and management of the company’s affairs. This involves regularly assessing the company’s and the Group’s financial situation and ensuring that the company’s organisation is structured to allow satisfactory controls of its accounts, funds management and financial affairs in general. The Chief Executive Officer is in charge of day-to-day management in accordance with guide-lines and instructions from the Board of Directors and is responsible for taking necessary measures to ensure that the company’s accounts are prepared in accordance with legal requirements and that funds management is controlled in a satisfactory manner.
AUDITOR’S RESPONSIBILITYOur objective concerning the audit of the management of the company’s affairs, and thereby our opinion about discharge from liability, is to obtain audit evidence to ascertain, with a reasonable degree of assurance, whether any Board member or the Chief Executive Officer, in any material respect:
f has undertaken any action or been guilty of any omission which can give rise to liability to the company. f in any other way has acted in non-compliance with the Swedish Companies Act, the Swedish Annual Accounts Act or the Articles of Association.Our objective concerning the audit of the proposed appro-
priations of the company’s profit or loss, and thereby our opinion on this, is to ascertain, with a reasonable degree of assurance, whether the proposal is in accordance with the Swedish Companies Act.
Reasonable assurance is a high level of assurance, but is not a guarantee that an audit conducted in accordance with gen-erally accepted auditing standards in Sweden will always detect actions or omissions that can give rise to liability to the company, or that the proposed appropriations of the compa-ny’s profit or loss are not in accordance with the Swedish Companies Act.
As part of an audit in accordance with generally accepted auditing practice in Sweden, we use professional judgment and adopt a professionally sceptical attitude throughout the audit. The audit of the administration and the proposal for appropriation of the company’s profit or loss are mainly based on the audit of the accounts. Which additional audit proce-dures are performed are based on our professional assess-
A U D I T O R ’ S R E P O R T
1 2 8 L A T O U R A N N U A L R E P O R T 2 0 2 1

ment, on the basis of risk and materiality. This means that we focus the audit on those measures, areas and circumstances that are significant for the business, and where any deviations or breaches would be particularly important for the compa-ny’s situation. We review and examine decisions taken, deci-sion-making data, implemented measures and other circum-stances that are relevant to our opinion about discharge from liability. As a basis for our opinion on the Board of Directors’ proposal for appropriation of the company’s profit or loss, we have examined the Board of Directors’ reasoned statement and a selection of supporting evidence in order to be able to assess whether the proposal is in compliance with the Swed-ish Companies Act.
Auditor’s review of the ESEF report
OPINIONIn addition to our audit of the Annual Report and the consoli-dated financial statements, we have also examined whether the Board of Directors and the CEO have prepared the Annual Report and the consolidated financial statements in a format that enables uniform electronic reporting (the ESEF report) in accordance with Chapter 16, section 4(a) of the Securities Market Act (2007:528) for Investmentaktiebolaget Latour for the year 2021.
Our review and opinion relate solely to the statutory requirement.
In our opinion, the ESEF report #[checksum] has been pre-pared in a format that, in all material respects, enables uni-form electronic reporting.
BASIS FOR OPINIONWe have conducted our audit in accordance with FAR’s rec-ommendation RevR 18 Auditor’s review of the ESEF Report. Our responsibility under this recommendation is described in more detail in the section Auditor’s responsibility. We are independent from Investmentaktiebolaget Latour in accord-ance with generally accepted auditing practices in Sweden and have otherwise executed our audit responsibilities in compliance with professional ethics as required by these standards.
We believe that the evidence we have obtained is sufficient and appropriate to provide a basis for our audit opinion.
RESPONSIBILITIES OF THE BOARD OF DIRECTORS AND THE CHIEF EXECUTIVE OFFICERThe Board of Directors and the CEO are responsible for ensur-ing that the ESEF report has been prepared in accordance with Chapter 16, section 4(a) of the Securities Market Act (2007:528), and for such internal control that the Board of Directors and the CEO deem necessary to prepare the ESEF report without mate-rial misstatement, whether due to fraud or error.
AUDITOR’S RESPONSIBILITYOur task is to express our opinion with reasonable certainty as to whether the ESEF report has, in all material respects, been prepared in a format that meets the requirements of Chapter 16, section 4(a) of the Securities Market Act (2007:528), based on our review.
RevR 18 requires us to plan and implement our audit proce-dures to achieve reasonable assurance that the ESEF report has been prepared in a format that meets these requirements.
Reasonable assurance is a high level of assurance, but is not a guarantee that a review conducted in accordance with RevR
18 and generally accepted auditing standards in Sweden will always detect a material misstatement when it exists. Mis-statements can arise from fraud or error and are considered material if, individually or in the aggregate, they could rea-sonably be expected to influence the economic decisions of users taken on the basis of the ESEF Report.
The audit firm applies ISQC 1 Quality control for firms that perform audits and reviews of financial statements, and other assurance and related services engagements and accordingly has a comprehensive quality control system, which includes documented guidelines and procedures regarding compliance with professional ethical requirements, professional stand-ards and applicable legal and regulatory requirements.
The review includes obtaining evidence, through various measures, that the ESEF report has been prepared in a format that enables uniform electronic reporting of the Annual Report and the consolidated financial statements. The auditor decides which procedures to use, by assessing the risks of material misstatement in the Report, whether due to fraud or error. In making these risk assessments, the auditor considers the elements of the internal control that are relevant to how the Board of Directors and the Chief Executive Officer pro-duce the data, in order to design audit procedures that are appropriate in the circumstances, but not for the purpose of expressing an opinion on the effectiveness of the company’s internal control. The review also includes an evaluation of the appropriateness and reasonableness of the assumptions made by the Board of Directors and the CEO.
The review measures principally encompass a technical validation of the ESEF report, i.e. whether the file containing the ESEF report meets the technical specification set out in Commission Delegated Regulation (EU) 2019/815 and a rec-onciliation of the ESEF report’s compliance with the audited Annual Report and consolidated financial statements.
Furthermore, the review also includes an assessment of whether the ESEF report has been marked with iXBRL, which enables a fair and complete machine-readable version of the consolidated income statement, balance sheet and equity statement as well as the cash flow statement.
Ernst & Young AB, with Staffan Landén as the principal auditor since 2020, was appointed Investmentaktiebolaget Latour’s auditor by the Annual General Meeting on 10 May 2021.
Gothenburg, 18 March 2022Ernst & Young AB
Staffan LandénAuthorised Public Accountant
L A T O U R A N N U A L R E P O R T 2 0 2 1 1 2 9
A U D I T O R ’ S R E P O R T

DUTIES AND RESPONSIBILITIESThe Board of Directors is responsible for the sustainability report for 2021, presented on pages 18–31, and for ensur-ing that it has been properly prepared in accordance with the Swedish Annual Accounts Act.
SCOPE AND APPROACH OF THE REVIEWWe conducted our review in accordance with FAR’s auditing standard RevR 12 The auditor’s opinion on the statutory sustainability report. This means that our review of the sustainability report has a different approach and is substan-tially less in scope than an audit conducted in accordance with International Standards on Auditing and generally accepted auditing practices in Sweden. We believe that this review provides us with sufficient evidence on which to base our opinion.
OPINIONA sustainability report has been prepared.
Gothenburg, 18 March 2022Ernst & Young AB
Staffan LandénAuthorised Public Accountant
Principal Auditor
Auditor’s opinion on the statutory sustainability report To the General Meeting of Shareholders of Investment AB Latour (publ), corporate registration number 556026-3237
A U D I T O R ’ S O P I N I O N O N T H E S T A T U T O R Y S U S T A I N A B I L I T Y R E P O R T
1 3 0 L A T O U R A N N U A L R E P O R T 2 0 2 1

INVESTMENT AB LATOUR (publ) is a Swedish public limited com-pany whose shares are listed on the Nasdaq OMX Stockholm Large Cap list. Latour’s corporate governance is based on laws, listing agreements, guidelines and best practice. This corpo-rate governance statement has been prepared in accordance with the provisions of the Swedish Corporate Governance Code (“the Code”), and chapter 6, sections 6–9 of the Swedish Annual Accounts Act and chapter 9, section 31 of the Swedish Companies Act and is applicable to the 2021 financial year. The auditor is of the opinion that the corporate governance statement has been prepared and that disclosures according to chapter 6, section 6, second paragraph, items 2–6 of the Swedish Annual Accounts Act (for example, the most impor-tant parts of the company’s system for internal control and risk management pertaining to financial reporting) are con-sistent with other parts of the Annual Report. Latour’s Arti-cles of Association and further information about Latour’s corporate governance practices can be found on the website latour.se under Corporate Governance.
ANNUAL GENERAL MEETINGThe Annual General Meeting must be held within six months of the end of the financial year. The Annual General Meeting may be held in Gothenburg or Stockholm. Only those share-holders who are entered in the register of members before the Annual General Meeting and who have announced their intention to attend are entitled to attend and vote for their entire shareholding.
The 2021 Annual General Meeting authorised the Board to decide on the acquisition of Latour shares on one or more occa-sions until the next Annual General Meeting. Both class A and class B shares may be acquired and the total number of shares may be such that, after acquisition, the company does not hold more than ten (10) per cent of all shares issued in the company.
NOMINATING COMMITTEEAt the Annual General Meeting, the Nomination Committee presents proposals for a chairman for the meeting, the Chair-man and other members of the Board, remuneration to the Board and possible remuneration for committee work.
The Nomination Committee is appointed after the Chair-man of the Board has ascertained which are the company’s four largest shareholders, based on the number of voting rights and according to the shareholder statistics available on the last banking day in August prior to the Annual General Meeting. Representatives of the four largest shareholders make up the Nomination Committee and the names of these representatives shall be published on the company’s website as soon as they are appointed and no later than six months prior to the Annual General Meeting.
Since then, the following members have been appointed to the Nomination Committee for the 2022 Annual General Meeting: Jan Svensson, Chairman (Förvaltnings AB Wasator-net including related entities), Eric Douglas (Wasatornet Holding AB including related entities), Fredrik Palmstierna
Corporate governance
(own holding including related entities) and Johan Nord-ström (Skirner AB). The Nomination Committee’s represent-atives have extensive experience of board and nomination committee work.
The Nomination Committee shall take into consideration at all times the applicable requirements and regulations of the Swedish Code of Corporate Governance. The Nomination Committee is required to present proposals for members of the Board and in so doing shall ensure that the Board has an appropriate composition characterised by diversity and breadth in the expertise, experience and backgrounds of the elected members of the Board, and shall also strive to achieve a gender balance.
None of them has received any remuneration for their work in the Nomination Committee.
BOARD OF DIRECTORSLatour’s Board of Directors is comprised of nine members, including the Chief Executive Officer (see page 136). There are no deputies. All members are elected for a one-year term. The secretary of the Board is the Chief Financial Officer of the Group. Olle Nordström was elected Chairman of the Board by the 2021 Annual General Meeting. All members except the CEO are independent of the company and the company man-agement. Two of the members, Eric Douglas and Carl Douglas, are not independent from the company’s principal owner. Together with the family, they control 79 per cent of the com-pany’s voting power and 76 per cent of its share capital. Employees are represented in the subsidiary Latour-Gruppen AB, which is the parent company of the wholly-owned compa-nies within industrial operations. They are therefore not rep-resented in the investment company’s board.
Each year, the Board establishes written rules of procedure that regulate the Board’s meetings, the business of these meetings, the division of responsibilities among Board mem-bers and the Chief Executive Officer and certain other mat-ters. The Board issues instructions for the Chief Executive Officer that regulate his work tasks and reporting obligation to the Board of Directors.
The present Board has had four ordinary meetings to date,
THE COMPOSITION OF THE BOARD OF DIRECTORS, THE NUMBER OF MEETINGS AND ATTENDANCE TO DATE IN THE 2021/2022 FINANCIAL YEAR
Name Board meetings 1)
Remuneration, SEK 000
Mariana Burenstam Linder 9 of 9 1,050Anders Böös 9 of 9 1,050Carl Douglas 9 of 9 1,050Eric Douglas 7 of 9 1,050Johan Hjertonsson 9 of 9 0Ulrika Kolsrud 9 of 9 1,050Olle Nordström 9 of 9 2,300Lena Olving 8 of 9 1,050Joakim Rosengren 9 of 9 1,050
1) Of which one was the inaugural Board meeting.
L A T O U R A N N U A L R E P O R T 2 0 2 1 1 3 1
C O R P O R A T E G O V E R N A N C E

not including the inaugural meeting, and four additional Board meetings. One of the Board members was unable to attend on two occasions and one of the Board members was unable to attend on one occasion. Otherwise there has been full attendance. The company’s auditor attended two Board meetings and presented reports and observations from the audit performed.
The Board of Directors is responsible for the company’s overall strategy, including how the management of risks and opportunities linked to sustainability is integrated into the business. Guidelines and policies adopted by the Board of Directors provide a framework for the supervision of risks and opportunities. Latour’s overall measurement tools for sustain-ability governance are anchored in the Board of Directors.
Matters dealt with by the Board include strategic changes in the investment portfolio, acquisitions and sales of subsidiaries, the company’s risk exposure, including sustainability-related risks and opportunities, budgets and forecasts for the subsidi-aries as well as a financial review of operations. Commitment to sustainability permeates all aspects of the Board’s work.
Under the direction of the Chairman, the Board has evalu-ated its work and all Board members have presented their views. The purpose of the evaluation is to develop the day-to-day work of the Board of Directors and establish the direction of its work in the future. It also acts as a check to ascertain that the Board has the requisite skills and competencies and to analyse its current set of skills. The Chairman has compiled the comments that were submitted and has reported them to the Board for discussion. The evaluation also serves as a basis for the Nomination Committee’s task of proposing new Board members, which means that the results of the evaluation have been presented to the Nomination Committee.
COMMITTEESThe Board has appointed a Remuneration Committee and an Audit Committee. The Remuneration Committee consists of
Olle Nordström (chairman), together with Anders Böös and Eric Douglas. The Audit Committee is comprised of the entire Board except the Chief Executive Officer.
The Remuneration Committee has held one meeting and all members were present. The Committee presents proposals to the Board concerning remuneration to the Chief Executive Officer and supports him in determining remuneration to the other senior executives. The Board then decides on these matters.
The Chief Executive Officer receives fixed and variable remuneration. Variable remuneration is based on the achievement of individual goals. Remuneration to other sen-ior executives consists of a basic salary and variable remuner-ation based on a fixed key ratio. The variable remuneration is capped at a certain number of monthly salaries.
The Audit Committee has met twice. All members and the company’s auditor were present. The business of the meetings has included the Group’s financial risks and the focus of auditing. The auditor also presented observations made during the audit.
AUDITORSThe 2021 Annual General Meeting elected Ernst & Young AB to serve as auditors. Staffan Landén is the Principal auditor. Staffan Landén has worked at the auditing firm since 1987 and has been involved in the audit of Latour’s financial statements since 2020. Apart from Latour, he also performs auditing ser-vices for the companies Alfa Laval AB, Nederman Holding AB and Ambea AB, which are included on the main list. He is also an exchange auditor appointed by Nasdaq. The auditors pre-sented oral and written reports at the Board meetings in December 2021 and March 2022 concerning auditing and internal control, to the extent that it is relevant to the Group’s financial reporting.
GROUP MANAGEMENTLatour’s industrial operations are grouped into six business
Latour’s corporate governance process from owner to Group management. The Annual General Meeting is the highest decision-making body in the Group, where the company’s Board of Directors is elected.
AUDIT COMMITTEE
AUDITORS
GROUP MANAGEMENT
CHIEF EXECUTIVE OFFICER
REMUNERATION COMMIT-TEE
NOMINATION COMMITTEE
BOARD OF DIRECTORS
LATOUR’S SHAREHOLDERS
ANNUAL GENERAL MEETING
C O R P O R A T E G O V E R N A N C E
1 3 2 L A T O U R A N N U A L R E P O R T 2 0 2 1
areas. The investment portfolio is managed by the parent com-pany, Investment AB Latour, and the wholly-owned subsidiary Latour Förvaltning AB. The wholly-owned subsidiary Latour-Gruppen AB is the parent company for all the business areas that are part of the wholly-owned industrial operations.
The Group management consists of the Group’s Chief Exec-utive Officer, Investment Director and Chief Financial Officer. The business area managers lead the operations in their respective business area and are responsible for the perfor-mance and management of their business area. The Group’s business organisation is built on decentralisation of responsi-bilities and powers. The business areas are responsible for the respective operation’s sustainable, strategic and operational development and for meeting financial and non-financial tar-gets, including return on operating capital, tied-up capital, operating margins, growth and emissions reduction.
Latour’s management team is responsible for driving and implementing Latour’s strategy. The Company’s CEO, together with the CFO, is responsible for ensuring that cli-mate-related risks and opportunities are integrated into the overall risk and strategy identification and management, although each individual business area has its own responsi-bility as regards assessing where the business has the greatest opportunities and risks related to climate change and further managing these at individual company level. The guidelines and tools that Latour uses for risk assessment are also imple-mented in the wholly-owned companies to address risks and opportunities in a cohesive way.
INTERNAL CONTROLIn 2021, Group-wide internal control guidelines have been implemented to further clarify which procedures and pro-cesses are expected to be in place in all operations. These guidelines cover five areas: policies and steering documents, risk analysis, risk management, evaluation and reporting.
Internal control, both for financial reporting and in general,
is based on a control environment that includes the organisa-tional structure, decision-making channels, authorisation and responsibilities documented and communicated in steering documents, such as the Group’s Code of Conduct, the delega-tion of duties between the Board and the Chief Executive Officer, and instructions for authorisation, accounting and reporting. The risks identified concerning financial reporting are managed by the Group’s control structure.
Steering documents have been distributed to the appropri-ate staff to support complete and correct financial reporting. Follow-up of efficiency and compliance is conducted through programmed controls and manual procedures. All reporting is done in the Group’s common reporting system. The Group management conducts regular reviews of the subsidiaries’ performance and growth. The financial review of their opera-tions is an important part of this process. There is also active participation in the Boards of the subsidiaries, at which finan-cial reporting as well as feedback on sustainable development and risk management are reviewed.
The Board of Latour receives monthly financial reports and the Group’s financial situation is discussed at every Board meeting.
A review of the Group’s internal control of essential pro-cesses has been carried out. The majority of the companies have presented a self-assessment concerning the reliability of their procedures. The inadequacies that were noted did not affect the reliability of control over reporting, but necessary measures are being taken. This is followed up throughout the year.
The above information concerning internal control has not been reviewed by an auditor.
STRUCTURED PROCESS FOR RISK MANAGEMENT Risk assessments are carried out regularly in Latour’s day-to-day operational activities. Every year, a coherent and struc-tured analysis is performed of the risk exposure in the com-
Latour analyses risk exposure in the company and the investment portfolio every year. The assessment of each business area is based on a number of critical factors shown in the diagram.
POTENTIAL ESTABLISHERS
COMPETING PRODUCTS
OTHER FACTORS
Financial risk
Risk of errors in reporting
Risks connected to the IT environment
EXTERNAL FACTORS
Business cycle
Environmental impact
Political decisions CUSTOMERS
SUPPLIERS
Risk exposure analysis
THE COMMERCIAL AND LONG-TERM POSITION OF THE
INDIVIDUAL OPERATIONS
L A T O U R A N N U A L R E P O R T 2 0 2 1 1 3 3
C O R P O R A T E G O V E R N A N C E

pany and the aggregate investment portfolio. This analysis assesses each business area on the basis of a number of exter-nal and internal factors. External factors include business cycles, environmental impact and political decisions. Internal factors are financial risk and risks connected to IT structure and management, as well as customer, competition and sup-plier trends and developments, the company’s position as regards sustainability, and analysis of alternative technolo-gies that may pose a risk in the future. The identification and assessment of climate-related risks is integrated into the overall risk management at Latour. The environmental and climate perspective takes both acute and long-term risks into account, and includes environmental, political, regulatory, technological, market and reputational risks. The risk analy-sis is divided into financial, industrial and geographical per-spectives.
Each identified risk is handled by the relevant whol-ly-owned company based on guidelines from Latour.
During 2021, each business area has worked to ensure that sufficient knowledge exists to identify, assess and tackle cli-mate-related risks. For example, the wholly-owned compa-nies’ CFOs and personnel with sustainability-related skills have participated in workshops and discussed climate-related risks in order to link financial knowledge with sustainability.
Latour’s investment portfolio companies are analysed from financial, industrial and geographic perspectives. The primary supervision of sustainability-related risks and opportunities takes place at the regular Board meetings in which Latour’s Board representative is involved. Latour’s ambition is to con-tinue to discuss climate-related risks and opportunities related to the financial impact at the listed companies through the work of the Board.
When both of the portfolios have been analysed, a balanced risk assessment is performed for Latour’s total portfolio.
An important risk exposure that was identified from an investment portfolio perspective is the fact that many hold-ings have customers in construction-related sectors. However, construction-related sectors have multiple dimensions as described in the Directors’ Report.
From a financial perspective, another potential risk is the need for new share issues in the larger listed holdings. How-ever, the risk of defensive new share issues or crisis issues is considered low at present. Offensive new share issues for expansion are not considered a risk. They are considered the same as any other investment opportunity.
An account of how Latour manages financial risks is pre-sented in Note 34.
Latour’s policy is that it will own high-quality, sustainable companies with long-term, sound profitability, and minimise risks by investing in product development, focusing on qual-ity in internal processes, maintaining cost awareness and ensuring access to competent employees and managers. Latour stipulates high demands in association with acquisi-tions and only invests in companies that meet Latour’s sus-tainability requirements. Latour’s business development team is responsible for ensuring that sustainability is an inte-gral factor in acquisition analyses.
The Board is of the opinion that, from a business perspec-tive, the Group has a well-balanced spread of risk in line with the comprehensive and communicated company policy.
APPLICATION OF THE SWEDISH CODE OF CORPORATE GOVERNANCELatour applies the Swedish Code of Corporate Governance with the following exceptions.
The special auditing function in the form of internal audit-ing does not exist in the Latour Group. Discussions with the company’s external auditors concerning the focus of auditing, together with the controls performed by Group management and existing control functions in the various business areas, are considered to be of an acceptable level.
Gothenburg, 15 March 2022Board of Directors
Investment AB Latour (publ)
C O R P O R A T E G O V E R N A N C E
1 3 4 L A T O U R A N N U A L R E P O R T 2 0 2 1

DUTIES AND RESPONSIBILITIESA Corporate Governance Statement has been prepared covering pages 131–134 and 136 of the Annual Report. The Board of Directors is responsible for the Corporate Governance Statement and for ensuring that it has been properly prepared in accordance with the Swedish Annual Accounts Act and the Swedish Code of Corporate Governance.
SCOPE AND APPROACH OF THE REVIEWWe conducted our review in accordance with FAR’s recommendation RevR 16 Review of the Corporate Govern-ance Statement Performed by the Auditor. This means that our review of the Corporate Governance Statement has a different approach and is substantially less in scope than an audit conducted in accordance with Interna-tional Standards on Auditing and Generally Accepted Auditing Practices in Sweden. We believe that this review provides sufficient appropriate evidence on which to base our opinion.
OPINIONA Corporate Governance Statement has been prepared. Disclosures in accordance with Chapter 6, section 6, paragraph 2, items 2–6 of the Swedish Annual Accounts Act and Chapter 7, section 31, paragraph 2 of the same Act are consistent with the Annual Report and the consolidated financial statements, and are in compliance with the Swedish Annual Accounts Act and the Swedish Code of Corporate Governance.
Gothenburg, 18 March 2022Ernst & Young AB
Staffan LandénAuthorised Public Accountant
Principal Auditor
Auditor’s opinion on the Corporate Governance StatementTo the Annual General Meeting of shareholders of Investment AB Latour (publ), Corporate identity number 556026-3237
L A T O U R A N N U A L R E P O R T 2 0 2 1 1 3 5
A U D I T O R ’ S O P I N I O N O N T H E C O R P O R A T E G O V E R N A N C E S T A T E M E N T

Standing from the left: Johan Hjertonsson, Mariana Burenstam Linder, Eric Douglas, Joakim Rosengren, Lena Olving, Carl Douglas and Anders Böös. Sitting from the left: Ulrika Kolsrud and Olle Nordström.
Board of Directors
Olle Nordström born 1958. Chairman of the Board since 2016. Bachelor of Science (Econ.). Chairman of the boards of Besqab AB, Skirner AB and Skirner Förvaltning AB. Board member of Tilia Fastigheter AB and Teletec Connect Aktiebolag. Shares in Latour *: 800,000 class A and 1,719,720 class B (with family and companies)
Mariana Burenstam Linder born 1957. Board member since 2011. Bachelor of Science (Econ.). Board member of BTS AB. Member of the Investment Committee of the Royal Swedish Academy of Sciences as well as Natur & Kultur. Shares in Latour *: 89,193 class B
Anders Böös born 1964. Board member since 2005. Economic college graduate. Chairman of the Board of Einride AB, Hantverksdata AB and Valamis OY. Board member of Newsec AB, Stronghold Invest AB and tbd30 AB.Shares in Latour *: 120,000 class B (through companies)
Carl Douglas born 1965. Board member since 2008. BA (Bachelor of Arts), D. Litt (h.c.) (Doctor of Letters). Entrepreneur. Vice Chairman of ASSA ABLOY AB. Shares in Latour through related companies*: 39,740,000 class A and 433,538,000 class B
Eric Douglas born 1968. Board member since 2002. Economic college graduate and three years of studies at the University of Lund in “Economy for Entrepreneurs”. Entrepreneur since 1992. Chairman of the Boards of Pod Investment AB and Sparbössan Fastigheter AB. Vice chairman of AB Fagerhult.Shares in Latour *: 1,650,000 class B and through related companies: 39,740,000 class A and 433,538,000 class B
Johan Hjertonsson born 1968. Board member since 2019. Bachelor of Science (Econ.). President and CEO of Investment AB Latour. Chairman of the Boards of Nederman Holding AB and Alimak Group. Board member of Sweco AB and ASSA ABLOY AB.Shares in Latour *: 50,000 class B and 480,000 call options that give the right to buy 480,000 class B shares.
Lena Olving born 1956. Board member since 2016. M.Sc. in Mechanical Engineering. Chairman of the board of ScandiNova Systems AB, The Royal Swedish Opera and Academic Work Holding AB. Board member of ASSA ABLOY AB, Munters AB, NXP Semiconductors N.V. and Stena Metall AB. Member of the Royal Swedish Academy of Engineering Sciences. Shares in Latour *: 4,230 class B
Joakim Rosengren born 1960. Board member since 2019. Bachelor of Science (Econ.). Board member of Stena Metall AB and Stena Recycling AB. Shares in Latour *: 4,950 class B
Ulrika Kolsrud born 1970. Board member since 2021. M.Sc. Engineering. Business Area Manager Health and Medical Solutions, Essity. Board member of Essity Hygiene and Health AB. Member of the Royal Swedish Academy of Engineering Sciences. Shares in Latour *: 1,900 class B
Except for Johan Hjertonsson, everyone is independent from the company and the company management.Except for Carl Douglas and Eric Douglas, everyone is independent from the company’s major shareholders.* Ownership at the end of 2021.
B O A R D O F D I R E C T O R S
1 3 6 L A T O U R A N N U A L R E P O R T 2 0 2 1

Standing from the left: Johan Menckel, Ida Saalman, Fredrika Ekman, Johan Hjertonsson, Gustav Samuelsson, Niclas Nylund, Torbjörn Carlén, Jonas Davidsson, Hedvig Wennerholm and Angelica Pavlic. Sitting from the left: Anders Mörck, Maria Asterholm, Fredrik Lycke and Katarina Rautenberg.
Latour
JUST AS LATOUR’S principal owners are represented in Latour’s Board, Latour is likewise an engaged principal owner in all of its investments. Corporate governance of the listed holdings is per-formed efficiently by its own representatives and a network of experienced representatives from boards.
CLEAR AND DELEGATED RESPONSIBILITIESThe wholly-owned companies are managed with clear and dele-gated responsibilities. Leadership plays a central role in Latour’s corporate governance and close collaboration with the management teams in the wholly-owned companies is of great importance. Latour’s corporate culture is characterised by the fact that it is a small, flexible organisation with short deci-sion-making channels. The parent company consists of four-teen employees and the aim is to provide an attractive work-
place environment that offers stimulating and rewarding job roles. The main functions in the parent company are executive management, administration, treasury and finance and busi-ness development. The Group management has the overriding responsibility for management, business development, finan-cial governance, follow-up of results and communication.
GOOD RELATIONSHIPS WITH STAKEHOLDERSLatour is committed to maintaining good relationships with representatives in the company’s network and other stakehold-ers with long-term, substantial influence on the company. External stakeholders should feel that the company’s communi-cation with the wider community is open and maintains a high standard of quality, and that contact with Latour is easy and straight-forward.
Group managementJohan Hjertonsson born 1968 President and CEO since 2019.Bachelor of Science (Econ.).Shares in Latour: 50,000 class B and 480,000 call options class B that give the right to buy 480,000 class B shares.
Anders Mörck born 1963CFO since 2008.Bachelor of Science (Econ.).Shares in Latour: 235,000 class B and 109,000 call options class B that give the right to buy 109,000 class B shares.
Johan Menckel born 1971Chief Investment Officer since 2021.M.Sc. Engineering.Shares in Latour: 90,000 call options class B that give the right to buy 90,000 class B shares.
Auditors Ernst & Young AB Staffan Landén born 1963. Authorised public accountant, Principal auditor.
L A T O U R A N N U A L R E P O R T 2 0 2 1 1 3 7
L A T O U R , G R O U P M A N A G E M E N T , A U D I T O R S

(SEK m) Full year Q42021
Q3 Q2 Q1 Full year Q42020
Q3 Q2 Q1
INCOME STATEMENTNet sales 18,567 5,324 4,433 4,823 3,987 15,028 4,053 3,692 3,605 3,678 Cost of goods sold 11,479 –3,344 –2,788 –2,924 –2,423 –9,151 –2,472 –2,236 –2,209 –2,234 Gross profit 7,088 1,980 1,645 1,899 1,564 5,877 1,581 1,456 1,396 1,444
Operating costs etc. –4,532 –1,297 –1,060 –1,158 –1,017 –3,820 –1,006 –860 –935 –1,019 Operating profit 2,556 683 585 741 547 2,057 575 596 461 425
Total equity investment 2,363 412 620 616 715 3,941 991 836 2,469 –355
Profit before financial items 4,919 1,095 1,205 1,357 1,262 5,998 1,566 1,432 2,930 70
Net financial items 66 9 17 –42 82 –245 –120 –40 –121 46 Profit after financial items 4,985 1,104 1,222 1,315 1,344 5,753 1,446 1,382 2,809 116
Taxes –604 –171 –164 –136 –133 –429 –157 93 –67 –112 Profit for the period 4,381 933 1,058 1,179 1,211 5,324 1,289 1,289 2,742 4
KEY RATIOSEarnings per share, SEK 6.85 1.46 1.65 1.84 1.89 8.32 2.01 2.02 4.29 0.01 Cash flow for the period –2,586 566 –851 125 –2,426 3,102 537 483 2,053 1,606 Adjusted equity ratio % 88 88 86 87 88 86 86 85 82 80 Adjusted equity 108,004 108,004 91,673 91,363 83,820 77,245 77,245 77,112 67,933 59,626 Net asset value 137,845 137,845 120,046 120,505 106,003 98,024 98,024 94,584 81,418 72,863 Net asset value per share 216 216 188 188 166 153 153 148 127 114 Listed price 369 369 272 281 226 200 200 211 169 142
NET SALESBemsiq 927 291 220 210 206 725 188 166 173 197 Caljan 1,527 554 403 859 209 1,176 424 311 219 222 Hultafors Group 5,546 1,648 1,310 1,353 1,113 3,641 1,041 915 839 846 Latour Industries 3,022 884 693 873 681 2,356 667 559 516 615 Nord-Lock Group 1,439 353 357 402 354 1,274 294 300 324 357 Swegon 5,824 1,523 1,374 1,796 1,361 5,614 1,376 1,372 1,472 1,394
18,280 5,252 4,356 5,675 3,924 14,783 3,990 3,622 3,542 3,631 Other companies and items 287 71 77 87 63 245 64 70 63 47
18,567 5,323 4,433 5,762 3,987 15,028 4,054 3,692 3,605 3,678
OPERATING PROFIT
Bemsiq 198 45 58 45 50 165 47 41 35 42 Caljan 276 118 77 61 19 207 93 58 27 30 Hultafors Group 860 241 170 266 183 561 182 157 114 108 Latour Industries 244 68 57 57 62 147 58 46 13 29 Nord-Lock Group 367 74 98 97 99 316 52 83 84 97 Swegon 718 177 158 227 156 721 160 217 201 143
2,663 723 618 753 569 2,117 593 602 474 449 Gain/loss from sale/purchase of businesses –51 –8 –25 –4 –14 –38 –12 1 –10 –17 Other companies and items –56 –32 –9 –8 –9 –22 –6 –4 –7 –8
2,556 683 584 741 546 2,057 575 599 457 424
OPERATING MARGIN (%)Bemsiq 21.4 15.5 26.2 21.4 24.4 22.7 24.9 25.0 20.0 21.1 Caljan 18.1 21.4 19.2 17.0 9.1 17.6 17.6 18.7 12.2 13.3 Hultafors Group 15.5 14.6 13.0 18.0 16.5 15.4 17.5 17.1 13.6 12.8 Latour Industries 8.1 7.7 8.3 7.4 9.1 6.3 8.8 8.2 2.6 4.8 Nord-Lock Group 25.5 20.8 27.3 26.0 27.8 24.8 17.7 27.6 25.8 27.3 Swegon 12.3 11.6 11.5 14.5 11.5 12.8 11.6 15.8 13.7 10.2
14.6 13.8 14.2 15.9 14.5 14.3 14.8 16.6 13.4 12.4
Information by quarter
I N F O R M A T I O N B Y Q U A R T E R
1 3 8 L A T O U R A N N U A L R E P O R T 2 0 2 1

SEK m 2021 2020 2019 2018 2017 2016 2015 2014 2013 2012
PARENT COMPANYDividends paid 2,110 1) 1,918 799 1,598 1,437 1,277 1,077 957 877 796 Adjusted equity ratio 2) (%) 57 66 57 76 100 100 99 95 95 96
THE GROUP 8)
Dividends received 1,042 927 1,148 1,037 862 737 671 606 560 499Return on equity (%) 14 19 22 11 14 21 28 15 13 13Return on total capital (%) 11 15 17 9 13 17 22 13 12 12Adjusted equity ratio 2) (%) 88 86 85 86 88 91 89 85 88 86Adjusted equity 2) 108,004 77,245 71,398 52,395 51,758 47,208 43,161 33,015 26,830 20,223Net debt/equity ratio 2) (%) 9 7 11 9 8 3 5 11 7 8Net asset value 2) 137,845 98,024 86,974 63,980 60,521 55,500 50,572 39,859 33,799 25,726
DATA PER SHARE 8)
Profit after tax 3) 6.85 8.32 8.33 3.66 4.37 5.75 6.45 2.94 2.33 2.12Listed price 31 December 369 200 153 112 101 86 78 51 43 31Net asset value per share 4) 216 153 136 100 95 87 79 63 53 41Listed price as a percentage of net asset value 4) (%) 171 131 113 112 106 98 98 81 81 77Basic earnings per share 6.85 8.32 8.33 3.66 4.37 5.75 6.45 2.94 2.33 2.12Diluted earnings per share 6.82 8.29 8.31 3.64 4.36 5.73 6.43 2.93 2.32 2.11Management cost as a percentage of the market value of total assets (%) 0.06 0.06 0.06 0.07 0.09 0.06 0.07 0.08 0.09 0.11Operating cash flow per average number of shares 2.8 3.6 2.8 1.7 1.5 1.3 1.2 0.8 1 1.4Equity 5) 50 46 41 34 32 30 25 21 18 17Dividends paid 3.30 6) 3.00 1.25 2.5 2.25 2 1.69 1.5 1.38 5.00 Direct return (%) 0.9 7) 1.5 0.8 2.2 2.2 2.3 2.2 2.9 3.2 4P/E ratio 54 24 18 31 23 15 12 17 18 15
Total outstanding shares (000) 639,323 639,380 639,283 639,117 638,848 638,544 638,232 637,972 637,512 637,052Average number of shares outstanding 639,409 639,339 639,214 638,005 638,720 638,416 638,124 637,780 637,428 637,684Average number of fully diluted shares outstanding 641,454 641,434 641,358 641,230 640,983 640,792 640,716 640,484 639,948 639,692Repurchase of own shares (000) 517 461 558 723 992 1,292 1,612 1,868 2,328 2,788Average number of repurchased shares 431 501 626 835 1,142 1,452 1,716 2,060 2,520 2,156
1) Proposed dividend calculated on the number of shares outstanding at 11 February 2022.2) Including fair value gain in associates.3) Calculated on the average number of shares outstanding.4) Calculated on the average of the multiple span applied since 2006.
5) Calculated on the number of shares outstanding at the balance sheet date.6) Proposed dividend.7) Calculated on the proposed dividend.8) Comparative prior-year figures restated to take account of the 4:1 share split in June 2017.
Ten-year overview
L A T O U R A N N U A L R E P O R T 2 0 2 1 1 3 9
T E N - Y E A R O V E R V I E W
ANNUAL GENERAL MEETINGThe Annual General Meeting will be held on Tuesday, 10 May 2022.
DIVIDENDSThe Board of Directors recommends that the Annual General Meeting of shareholders approves a dividend payment of SEK 3.30 per share, and that Thursday 12 May 2022 be set as the record date. Subject to shareholders approving this recom-mendation at the Annual General Meeting, the dividend is expected to be issued on Tuesday 17 May 2022 by Euroclear Sweden AB to shareholders on the share register on the record date.
INFORMATION DATES29 April 2022 Interim report as at
31 March 202210 May 2022 Annual General Meeting23 August 2022 Interim report as at
30 June 2022 8 November 2022 Interim report as at
30 September 2022February 2023 Year-end report for 2022March 2023 Annual Report 2022
Please register for an electronic subscription to interim reports, year-end reports and press releases at latour.se. A hard copy of the Annual Report can be ordered or subscribed to via latour.se, by telephone +46 31 89 17 90, by email to [email protected], or upon request to Investment AB Latour (publ), Box 336, SE-401 25 Gothenburg, Sweden.
Shareholder information
S H A R E H O L D E R I N F O R M A T I O N
1 4 0 L A T O U R A N N U A L R E P O R T 2 0 2 1

LATOUR ANNUAL REPORT 2021
Production Rubrik
rubrik.se
Art Direction: Fredrik Sandberg
Photos Patrik Olsson
olssonpatrik.com
Text Author: Per Åkerberg
Proofreading: Pernilla Lindquist, Rubrik
English translation: Semantix, semantix.se
Printers Taberg Media Group, Taberg, 2022
tabergmediagroup.se
Paper Cover: GMund Colors Felt 93 Dark Grey 320 g
Inside pages: Arctic Paper - Munken Kristall 150 g
FSC® C074394Printed matter
3041 0271
L A T O U R A N N U A L R E P O R T 2 0 2 1 1 4 1

Investment AB Latour (publ)Corporate ID no. 556026–3237
J A Wettergrens gata 7, Box 336, SE-401 25 Gothenburg, Sweden Tel +46 31 89 17 90
[email protected], www.latour.se