BEHAVIOUR OF U-SHAPED WALLS SUBJECTED TO UNIAXIAL AND BIAXIAL CYCLIC LATERAL LOADING
29
This article was downloaded by: [CEA Saclay] On: 28 January 2015, At: 03:07 Publisher: Taylor & Francis Informa Ltd Registered in England and Wales Registered Number: 1072954 Registered office: Mortimer House, 37-41 Mortimer Street, London W1T 3JH, UK Journal of Earthquake Engineering Publication details, including instructions for authors and subscription information: http://www.tandfonline.com/loi/ueqe20 BEHAVIOUR OF U-SHAPED WALLS SUBJECTED TO UNIAXIAL AND BIAXIAL CYCLIC LATERAL LOADING N. ILE a & J. M. REYNOUARD a a Unité de Recherche de Génie Civil , National Institute of Applied Mechanics of Lyon , 20, Av. Albert Einstein, 69621, Villeurbanne, France Published online: 04 Sep 2008. To cite this article: N. ILE & J. M. REYNOUARD (2005) BEHAVIOUR OF U-SHAPED WALLS SUBJECTED TO UNIAXIAL AND BIAXIAL CYCLIC LATERAL LOADING, Journal of Earthquake Engineering, 9:1, 67-94, DOI: 10.1080/13632460509350534 To link to this article: http://dx.doi.org/10.1080/13632460509350534 PLEASE SCROLL DOWN FOR ARTICLE Taylor & Francis makes every effort to ensure the accuracy of all the information (the “Content”) contained in the publications on our platform. However, Taylor & Francis, our agents, and our licensors make no representations or warranties whatsoever as to the accuracy, completeness, or suitability for any purpose of the Content. Any opinions and views expressed in this publication are the opinions and views of the authors, and are not the views of or endorsed by Taylor & Francis. The accuracy of the Content should not be relied upon and should be independently verified with primary sources of information. Taylor and Francis shall not be liable for any losses, actions, claims, proceedings, demands, costs, expenses, damages, and other liabilities whatsoever or howsoever caused arising directly or indirectly in connection with, in relation to or arising out of the use of the Content. This article may be used for research, teaching, and private study purposes. Any substantial or systematic reproduction, redistribution, reselling, loan, sub-licensing, systematic supply, or distribution in any form to anyone is expressly forbidden. Terms & Conditions of access and use can be found at http:// www.tandfonline.com/page/terms-and-conditions
Transcript of BEHAVIOUR OF U-SHAPED WALLS SUBJECTED TO UNIAXIAL AND BIAXIAL CYCLIC LATERAL LOADING

This article was downloaded by: [CEA Saclay]On: 28 January 2015, At: 03:07Publisher: Taylor & FrancisInforma Ltd Registered in England and Wales Registered Number: 1072954 Registered office: Mortimer House,37-41 Mortimer Street, London W1T 3JH, UK
Journal of Earthquake EngineeringPublication details, including instructions for authors and subscription information:http://www.tandfonline.com/loi/ueqe20
BEHAVIOUR OF U-SHAPED WALLS SUBJECTED TOUNIAXIAL AND BIAXIAL CYCLIC LATERAL LOADINGN. ILE a & J. M. REYNOUARD aa Unité de Recherche de Génie Civil , National Institute of Applied Mechanics of Lyon , 20,Av. Albert Einstein, 69621, Villeurbanne, FrancePublished online: 04 Sep 2008.
To cite this article: N. ILE & J. M. REYNOUARD (2005) BEHAVIOUR OF U-SHAPED WALLS SUBJECTED TO UNIAXIAL AND BIAXIALCYCLIC LATERAL LOADING, Journal of Earthquake Engineering, 9:1, 67-94, DOI: 10.1080/13632460509350534
To link to this article: http://dx.doi.org/10.1080/13632460509350534
PLEASE SCROLL DOWN FOR ARTICLE
Taylor & Francis makes every effort to ensure the accuracy of all the information (the “Content”) containedin the publications on our platform. However, Taylor & Francis, our agents, and our licensors make norepresentations or warranties whatsoever as to the accuracy, completeness, or suitability for any purpose of theContent. Any opinions and views expressed in this publication are the opinions and views of the authors, andare not the views of or endorsed by Taylor & Francis. The accuracy of the Content should not be relied upon andshould be independently verified with primary sources of information. Taylor and Francis shall not be liable forany losses, actions, claims, proceedings, demands, costs, expenses, damages, and other liabilities whatsoeveror howsoever caused arising directly or indirectly in connection with, in relation to or arising out of the use ofthe Content.
This article may be used for research, teaching, and private study purposes. Any substantial or systematicreproduction, redistribution, reselling, loan, sub-licensing, systematic supply, or distribution in anyform to anyone is expressly forbidden. Terms & Conditions of access and use can be found at http://www.tandfonline.com/page/terms-and-conditions

Journal of Earthquake Engineering! Vol. 9, No. 1 (2005) 67-94 @ Imperial College Press @ Imperial College Press
www.icpr8ss.co.vk
-BEHAVIOUR OF U-SHAPED WALLS SUBJECTED TO UNIAXIAL AND BIAXIAL CYCLIC LATERAL LOADING
N. ILE and J. bI. REYNOUARD Unite'.de Rechemhe de G h i e Civil,
Nutimaul Institute of Applied Mechanics of Lyon, 20, Av. Albert Einstein, 69621, Villeurbanne, Fmnce
Received 3 December 2003 Revised 11 June 2004
Accepted 30 June 2004
This paper presents the results of an experimental and numerical i~lvestigation on the behaviour of U-shaped walls subjected to lateral uniaxial and biaxial cyclic loading. The test speci~nens have been sized and detailed according to EC8 code. The tests ai~rled at stii~lyirig the bcl~aviour of a full scale U-shaped wall in uniaxial and biaxial bendirlg a d sfwar, and cornparccl the alternative design requirements of two versions of EC8. A 3D mult itayer t h i l l shell finite element formulation, incorporating a concrete model with a smeared cracking capability, was used to simulate the experimental behaviour of this specimcn. Comparison between numerical and experimental results shows that the model is capable of predicting with acceptable accuracy the most important characteristics of the measured globat and local response. Based on the findings of both experimental and numerical results, some additional recommendations for design and analysis have rcsul ted.
Keywords: U-shaped wall; cyclic loading; non-linear model; EC8.
1. Introduction
Walls consisting of two or more rectangular parts (i.e. a T-, L-, or U-shaped section) are quite common in earthquake-resistant concrete buildings. Generally they pro- vide stiffness and resistance in both directions, and their behaviour under seismic actions is more complex than tllat of rectangular walls. Presently the behaviour of noh-rectangular walls under combined biaxial bending and shear with axial force is not sufficiently known, as the number of experimental and numerical studies is very limited. Moreover, extension of design concepts and detailing rules to non- rectangular walls is not immediate and more investigations are effectively needed in this sense. .
Various analytical models based on different approaches have been proposed to predict the response of shearlcore walls. Very often, the core wall is modelled by an assemblage of linear elements with appropriate cross-sectional properties, known as the hame analogy method or the wide-column analogy [MacLeod and Hosny, 1977; Kwan, 19951. The advantages of this model lie in the uncomplicated
Dow
nloa
ded
by [
CE
A S
acla
y] a
t 03:
07 2
8 Ja
nuar
y 20
15

68 N. Ile E9 J . M. Reynowrrd
modelling and the reduced number of degees of freedom. Several investigations on the elastic behaviour of non-rectangular walls under static and dynamic loading conditions have indicated, in some cases, that this method may lead to unsatisfac- tory results [Stafford-Smith and Girgis, 1986; Xenidis et aL, 19931. As an example, in the particular case of cores under predominantly torsional loading, large devia- tion of the elastic response as compared to the solution obtained by finite element analysis using shell elements is reported by Xenidis et al., (19931.
When non-linear response is 6f interest, the behiviour of this type of wall is strongly influenced by the interaction between axial force, flexure and shear, and the macro type of modelling will have some inherent difficulties in accurately repro- ducing all these phenomena. Clearly, the adoption of a local approach, based upon cyclic behaviour laws of the constitutive materials, seems more appropriate in this case. In this way, not only irregular walls can be easily modelled, but also the inter- action between axial force, flexure and shear is directly taken into account. The major drawback of the local approach lies in the fact that these kinds of models need more effort to generate the element mesh and after that more numerical effort is needed during the solution. However, since nowadays computer power is contin- uously increasing, the drawback of the exte~lsive coniputational effort will become less important in the near future.
In recognition of the problematic belmviour of this type of walls, an irlterlsivc
research program was devoted to the design and arialysis of earthquake resistant U-shaped walls [Reynouard and Fardis eds., 20011. In thc framework of this pro- gram, experimestal and numerical investigations were carried out with the partic- ular concern that modelling activities and design concepts complement each o t lw and have some implications for the relevant provisions of Eurocode 8. Shaking table and cyclic tests onEC8 designed U-shaped walls were conducted a t CEA- SACLAY (Commissariat de I'Energie Atomique) and ELSA laboratory (European Laboratory for Structural Assessment) as a part of the TMR (Training and blobil- ity of Researchers) of the 5th Topic "Shear Wall Structures" of the European Research Programs ICONS (Innovative Concepts for New and Existing Structures) and ECOEST I1 (European Consortium of Shaking Tables). This paper presents the principal experimental results of the cyclic tests conducted a t the ELSA lab- oratory and compares test results with numerical predictions based on a refined and detailed 3D thin shell representation of the geometry of the walls. Comparing numerical and experimental results gives a great help in verifying the numerical model and understanding the behaviour of the test specimens more clearly. Based on the findings of both experimental and analytical results, some additional recom- mendations for design and analysis of U-shaped walls have resulted.
2. Test Specimens and Experimental Program
A total of three U-shaped wall specimens were fabricated and tested by PBgon et al. (2000a; 2000b; 2000c; 2000dj under lateral cyclic loading at the ELSA laboratory.
Dow
nloa
ded
by [
CE
A S
acla
y] a
t 03:
07 2
8 Ja
nuar
y 20
15
Behaviour of U-Shaped WalLs 69
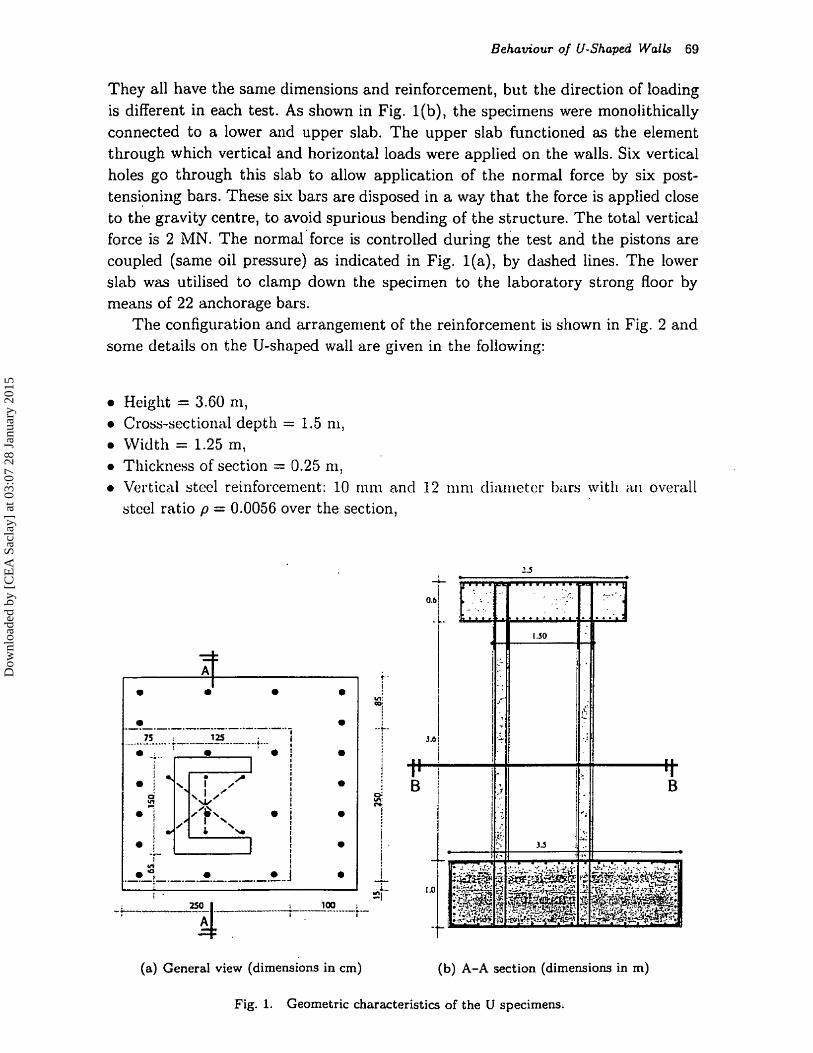
They all have the same dimensions and reinforcement, but the direction of loading is different in each test. As shown in Fig. l(b), the specimens were monolithically connected to a lower and upper slab. The upper slab functioned as the element through which vertical and horizontal loads were applied on the walls. Six vertical holes go through this slab to allow application of the normal force by six post- tensioning ban . These siu bars are disposed in a way that the force is applied close to the gravity centre, to avoid spurious bending of the structure. The total vertical force is 2 MN. The normalforce is controlled during the test and the pistons are coupled (same oil pressure) as indicated in Fig. l(a), by dashed lines. The lower slab was utilised to clamp down the specimen to the laboratory strong floor by means of 22 anchorage bars.
The configuration and arrangement of the reinforcement is shown in Fig. 2 and some details on the U-shaped wall are given in the following:
Height = 3.60 ni, Cross-sectional depth = 1.5 m, Width = 1.25 m, Thickness of section = 0.25 m, Vertical steel reinforcement: 10 rnnl and 12 mni diiwletor txm wit11 it11 overall stcel ratio p = 0.0056 over the section,
(a) General view (dimensions in cm) (b) A-A section (dimensions in m)
Fig. 1. Geometric characteristics of the U specimens;
Dow
nloa
ded
by [
CE
A S
acla
y] a
t 03:
07 2
8 Ja
nuar
y 20
15

70 iV. Iie @ J . M. Reyrrouad
Fig. 2. B-B section of the test specimen (dimensions in mm).
a Horizontal reinforcement: two curtains of 8 mm diameter bars at 125 mm centres in the flanges and at 75 rnm centres in the web, Confining reinforcement: horizontal stirrups of 8 mrn diameter bars at 90 mrn centres.
The U-shaped wall specimen has been designed and detailed by Fardis [Rey- nouard and Fardis eds., 20011 according to both ENV1998-1-3:1994 rules [CEN, 19941 (which are not directly applicable to'walls with a non-rectangular section, since they were developed primarily for walls with rectangular section) and its proposed revision in prEN199&1:2001 [CEN, 20011.
The section of the specimen is meant to represent a full scale wall, for a small elevator shaft. The part of the cross-section parallel to the shear force and normal to the bending moment vector is generally considered as the web, while the part orthogonal to it is termed the flange. However, for simplicity, in this study the sides
Dow
nloa
ded
by [
CE
A S
acla
y] a
t 03:
07 2
8 Ja
nuar
y 20
15

Behaviovr of U-Shaped Walls 71
of the section parallel to the Y direction will be denoted a s flanges, while the side parallel with the X direction will be denoted as web.
According to EC8 (EC8, 19941, confined boundary elements should be provided at the free end of each flange. As the wall was designed to resist the earthquake action in both horizontal directions, confined boundary elements were provided at the ends of all rectangular parts of the section. At the corners, the boundary elements were provided in both directions, to improve confinement and also to provide shear strength to the interface between the two parts of the section (with one part acting as web and the other as the Range).
Given that the vertical reinforcement proportioned to provide the flexural capac- ity was concentrated in the boundary elements and that the part of the section between them is relatively small, the vertical web and flange burs were neglected in the dimensioning of the vertical reinforcement. Therefore, the dimensioning of the vertical rei~iforcement for the ULS in bending with avid force was done as in a T-section with reinforcement only at the top arid bottom of the section [Reynouarcl and Fardis eds., 2001]. The ratio of the vertical reinforcenlent in the boundary ele- lncrlts of the two corners is equal to 0.81% and is below the rlii~ii~num steel ratio of 1% allowed by ENV1998-1-3: 1994. However, the reduced stecl ratio (0.81%) is still above the 0.5% limit adopted by prEN1998-1:2001. The design valucs of the Hesurd capacity in the two directions corresponding tto tha csilct location of all bars imd n concrete of C20/25 are:
- for hcndilig in the Y+ direction (web in compression): . lliLdg = 1945 KNui - for. bending in the Y- direction (web in tension): A&, = 2100 KNm - for bending almg the X axis (about the axis of symmetry): bfRdz = 2650 KNm
The confinement reinforcement is the same for all three specimens and consists of hoops and cross ties with a diameter of 8 mm at 90 mrn centres. With this confinement reinforcement, the estimated values of the available curvature ductility factor p4 were translated into values of the available displacement ductility factor c(& According to ENV1998-1-3: WI4, the wall has in the Y+, Y - and X direction of bending an available displacement ductility factor paY+ = 3.0, psY- = 1.875, and pa" = 2.075, respectively. According to the proposed revision of ENV1998- 1-3: l3W in prEN199&1:2001, the wall has in the Y+, Y- and X direction of bending an available displacement ductility factor = 4.5, psY- = 3.55, a d ps" = 3.9, respectively [Reynouard and Fardis eds., 20011.
Since the shear span ratio of the specimen is rather low (3.12 in direction Y and 2.6 in direction X), shear phenomena are important and have to be carefully considered. While the vertical reinforcement was designed in compliance with the recommendations of the EC8 code for given ultimate bending moments with respect to the two axes, along with an axial compression, considerable overstrength was pro- vided in shear, in the Y direction especially. The horizontal reinforcement consists of two curtains of 8 rnm bars, a t 125 mm centres in the two flanges or a t 75 mrn centres in the web. It meets the relevant minimum requirements of ENV1998-1-
Dow
nloa
ded
by [
CE
A S
acla
y] a
t 03:
07 2
8 Ja
nuar
y 20
15
31994 and prEN1998-1:2001 for DCH with large margins: the steel ratio is equal to 0.54% in the web and 0.32% in the two flanges, versus a minimuni value of 2%. The adopted design values of shear resistance, according to prEN1998-1:2001, provided a margin of 13% in direction X and of 105% in direction Y, for DCH (ductility class "H"). The preceding design solution was based on the fact that in
- the case of biaxial bending and shear, the flange of the U-shaped wall that is under tension due to bending about the Y axis does not contribute much to the shear resistance in thk Y-direction, and the full shear iesistince may hive to be provided by the other flange, which is in compression. So each flange of the U-shaped wall has considerable overstrengt h in shear.
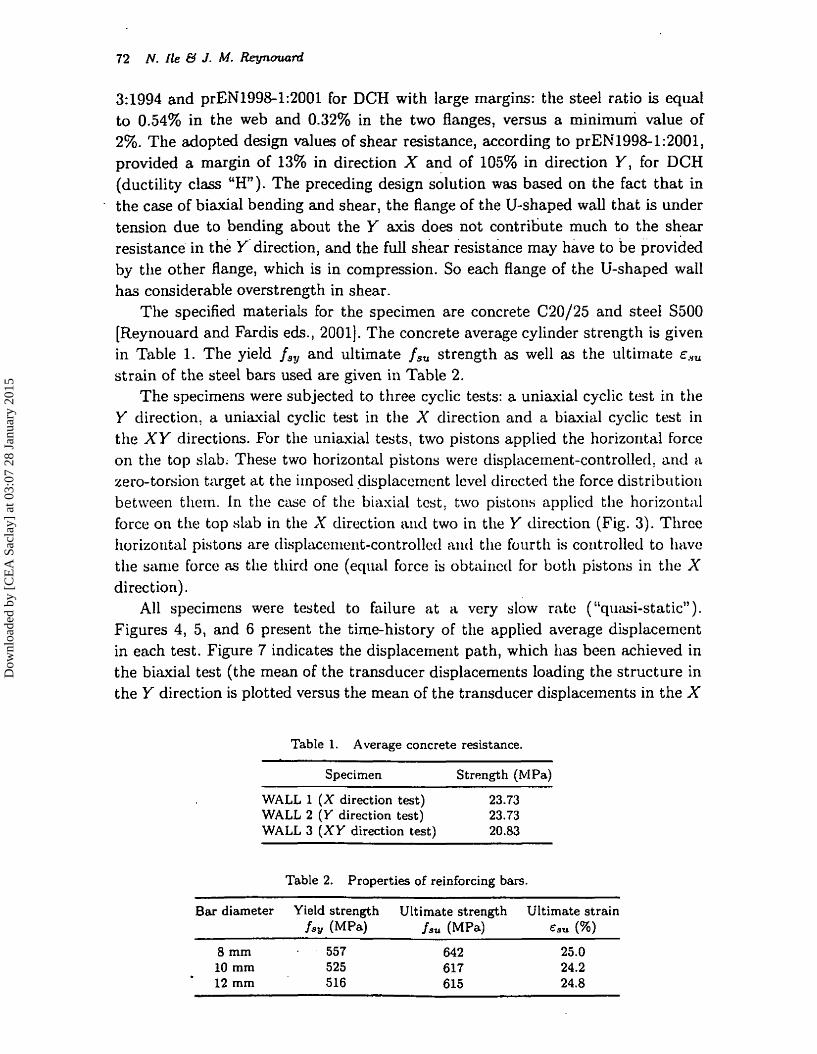
The specified materials for the specimen are concrete C20/25 and steel S500 [Reynouard and Fardis eds., 2001). The concrete average cylinder strength is given in Table 1. The yield f,, and ultimate f,, strength as well as the ultimate E,,
strain of the steel bars used are given in Table 2. The specimens were subjected to three cyclic tests: a uniaxial cyclic test in the
Y direction, a uniaxial cyclic test in the X direction and a biaxial cyclic test in the XY directions. For the uniaxial tests, two pistons applied the horizorital force on the top slab; These two horizontal pistons were displacement-controlled: and a zero-torsion target at the imposed displaccrncnt level dirccted the force distribut iorl between them. In the case of the biaxial tcst, two pistons applied the horizotlt;rl force on the top slab in the X direction a t d two in the Y direction (Fig. 3). Three horizontal pistons are tlisplacenlent-controlletl and the fourth is controlled to hvvc the same force as the third one (equal force is obtainctl for both pistons in the X direction).
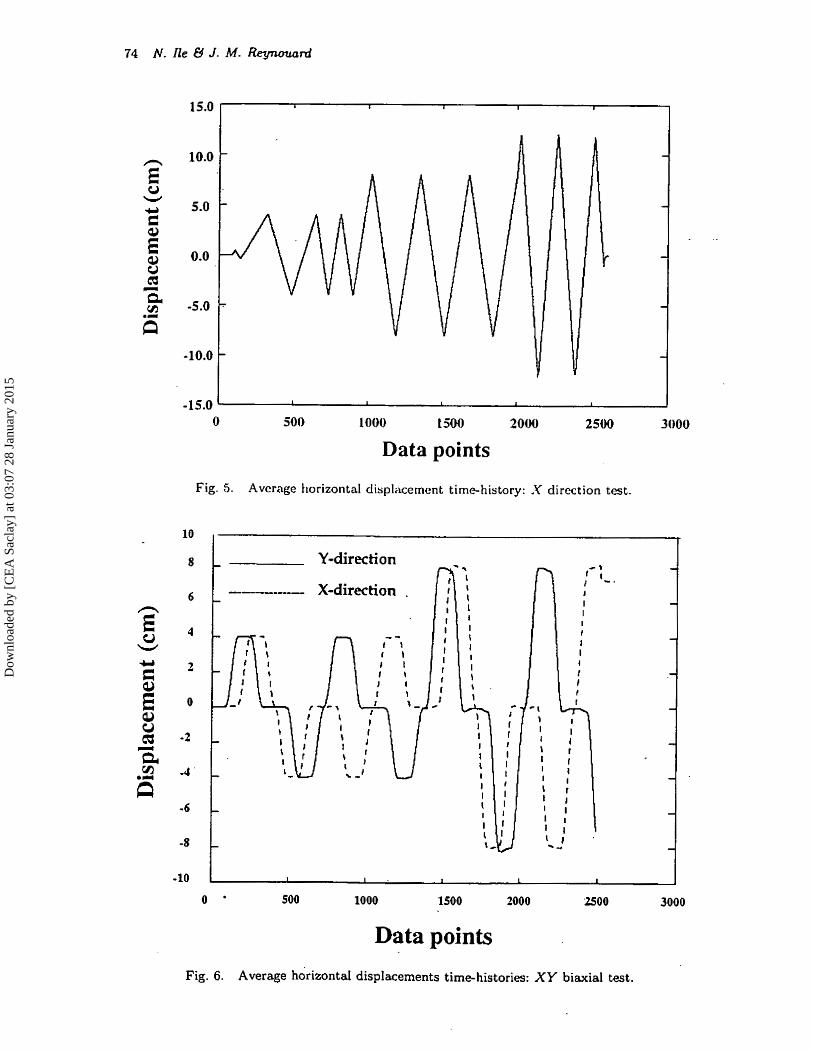
All specimens were tested to failure at a very slow rntc ( "quasi-static" ). Figures 4, 5, and 6 present the time-history of the applied average displacement in each test. Figure 7 indicates the displacement path, which has been achieved in the biaxial test (the mean of the transducer displacements loading the structure in the Y direction is plotted versus the mean of the transducer displacements in the X
Table 1. Average concrete resistance.
Specimen Strength (M Pa)
WALL 1 (X direction test) 23.73 WALL 2 (Y direction test) 23.73 WALL 3 (XY direction test) 20.83
Table 2. Properties of reinforcing bars.
Bar diameter Yield strength Ultimate strength Ultimate strain fa, WPa) fsu (MPa) €su (%)
Dow
nloa
ded
by [
CE
A S
acla
y] a
t 03:
07 2
8 Ja
nuar
y 20
15

Behaviour of U-Shaped Walls 73
Fig. 3. U specimen: wall axes and pistons position ( X I - biaxial test).
500 1000 1500 2000 2500 3000
Data points
Fig. 4. Average horizontal displacement time-history: Y direction test.
Dow
nloa
ded
by [
CE
A S
acla
y] a
t 03:
07 2
8 Ja
nuar
y 20
15
0 500 1000 1500 2000 2500 3000
Data points
Fig. 5. Avcrage horizontal displacement time-history: .Y direction test.
1000 1500 too0
Data points
Fig. 6. Average horizontal displacements time-histories: XY biaxial test.
Dow
nloa
ded
by [
CE
A S
acla
y] a
t 03:
07 2
8 Ja
nuar
y 20
15

-10 -8 -6 -4 -2 0 2 4 6 8 10
Average displacement X-direction (cm)
Fig. 7. Y top dispIacenient versus X top displacement: Xk' bix~ial test.
direction). The specimens' instrumentation allowed rneasuremcnts associated wit 11 thc global and local behaviour of the U-shaped wall. A detailed description of all experimental measurements and of the globd and local results are given in PBgm et al. (2000a; 2000b; 2000c; 2000d], and Reynouard and Fardis [2001].
3. Experimental Results
3.1. Y direction test - geneml observations
The load versus the average drift for the Y direction test is shown in Fig. 8 (for 2.5 cm of displacement drift is equal to 0.64%). First inclined cracking at the base of the flanges was observed at about 2 cm displacement (0.5% drift) during the first loading cycle..The main horizontal web cracks started during the first loading cycle at about -2 cm displacement. With increasing displacement, flange cracks occurred also in the other direction and propagated from the bottom upward, reaching up to almost three-quarters of the height of the wall (Fig. 9). During the 3 cycles with amplitude of 4 cm (1% drift), the wall web heavily cracked and the steel bars at the edges of the flanges tended to buckle. During the 3 cycles with amplitude of 8 cm (2% drift), strong damage was observed at the base of the Range edges, but the wall still performed very well. After one complete cycle was performed for amplitude of 12 cm (3% drift), strength degradation of about 80% was observed for the second half cycle to 12 cm. The U-shaped wall failure, in the Y negative direction of loading, was dictated by the bars buckling at the base of one flange extremity, where one stirrup was missing (it was not assembled in the construction phase) and
Dow
nloa
ded
by [
CE
A S
acla
y] a
t 03:
07 2
8 Ja
nuar
y 20
15

Reynouard
-3.85 -2.56 -1.28 0.0 1.28 2.56 3.85 Drift (%)
Fig. 8. Total force versus average drift (Y direction test).
Web cracks (D, = -3.5 cm) Flange cracks (D, = 2 cm)
Fig. 9. Crack pattern of U-wall specimen (Y direction test).
the concrete crushed in that region. Then one stirrup broke on the other flange and some longitudinal bars broke, in tension, after buckling in compression. Following
Dow
nloa
ded
by [
CE
A S
acla
y] a
t 03:
07 2
8 Ja
nuar
y 20
15

Behcrviour of U-Shaped Walls 77
failure in the negative direction of loading, the specimen failed, in the Y positive direction of loading, by the bars buckling on the corner of the U-shaped wall web. The resulting displacement ductility factor that was attained in a stable manner, based on a maximum top displacement of 8 cm and a measured top displacement of about 1.3 cm at the onset of yielding at the wall base Pdgon et al. [ZOOOb], was found to be of approximately 6.
3.2. X direction test - general observations
The load versus top displacement for the X direction test is shown in Fig. 10. The behaviour of the wall was dominated by shear in the web and in the two flanges. This is the result of the large warping occurring in the U-wall specimen when loading is applied in the X direction. First cracking was observed at about 1 cm displacement during the first loading cycle. Due to shear, flange cracks were very inclined, as
can be seen in the left side of Fig. 11. After load reversal, web and flange cracks propagate in the other direction as well and a crack pattern, as shown ill the right side of Fig. 11, develops. During the 3 cycles to 4 cm, cracks propagated up to the whole wall height. At 8 cm displacement some buckling occurred, hut it was limited to the end of the flanges. After 2 complete cycles to 12 cm, severe buckling, rnpture of some stirrups and longitudinal steel bars at the base of the flmgcs or at the web ends were observed. The U-shaped wall failure, in both directions, occrlrred when three vertical bars on the flange side broke while straightelling back up after buckling ill compression. As in the case of the Y direction test, the rcsultirlg
-3.85 -2.56 -1.28 0.0 1.28 2.56 3.85
Drift (%)
Fig. 10. Total force versus average drift (X direction test).
Dow
nloa
ded
by [
CE
A S
acla
y] a
t 03:
07 2
8 Ja
nuar
y 20
15

78 N. Ile & J . M. Reynouard
Flange cracks (Dx = 2.0 cm) Web cracks (D, = -t 4 crn)
Fig. 11. Crack pattern of U-wall speci~ricri (S clircotion test).
clisplace~rlerit ductility factor was fourid to be of approsj.~rmtely 6.
3.3. X Y direction test - general observa-tions
In contrast with the previous two specimens, which were tested in only one dircc- tion. in this test the U-shaped wall was loaded in both directions (X and Y), according to the butterfly path already presented in Fig. 7. The behaviour of the wall was dominated by shear and inclined web and flange cracks that propagated through to the entire height of the specimen. The force vs. displacement diagram shown in Fig. 1 2 illustrates the global U-shaped wall behaviour. Figure 13 dis- plays the force path, that was obtained in this test. Alt.hough the structure mainly
-Z-% 1105 -150 -1.00 -050 0.00 0.50 1.00 150 205 256 -256 -2.05 - 1 3 -1.00 -0.50 0.00 0 3 1.00 150 LO5 LS6
Drift in X direction (%) Drift. in Y direction (7%)
Fig. 12. Total horizontal force versus drift - left: Y direction and right: X direction (XY direction test).
Dow
nloa
ded
by [
CE
A S
acla
y] a
t 03:
07 2
8 Ja
nuar
y 20
15

Behaviour of U-Shaped Walls 79
1000 800 600 400 200 0 200 400 600 800 I000
Total force in X direction (KN)
Fig. 13. X and Y loads (XY direction test).
Fig. 14. Shear failure of one .flange a t the end of the XY direction test.
Dow
nloa
ded
by [
CE
A S
acla
y] a
t 03:
07 2
8 Ja
nuar
y 20
15

cracked during the first butterfly cycle to 4 cm, an important cyclic degradation can be observed. During the cycle to 8 cm, large buckling and rupture of the steel bars, as well as spalling and severe degradation of concrete, have been observed. Figure 12 also shows that, when the displacement loading branches are orthogonal to the previous ones, they always introduce important strength degradation in the orthogonal direction. As a consequence, apart at the end of the first (monotonic) branch, the force. level reached is always lower than for the monotonic tests in the Y and X direction. The U-shaped wall failure, in both directions occurred i t the apex of the larger magnitude of the last fly (for a displacement value of 8 cm in the X direction and -8 cm in the Y direction), when three vertical bars broke straightening back up after buckling in compression. Then, one flange failed in shear (Fig. 14) and a relative displacement of the top of the flange with respect to the bottom (of about 2 cm) was observed. Based on a maximum top displacenie~it of 8 cm, and a yield displacement of about 1.3 cm the available displacement ductility factor is approximately 6 in both directions.
4. Modelling of the Test Specimens
The nurrlericnl analyses have been performed using the gerlcral-purpose filiite elc- ment program CASTEM 2000 developed at CEA-Suclay [I~Iillartl, 10931. To prctlict the inelastic response with sufficient accnracy, due care has becn given to create a detailed model of the specimen, taking into account the necessary gcornetric charac- teristics, construction details and boundary conditions. Due to the U-shaped cross section and to the direction of the applied loading, in plane as well as out of plane behaviour of the different wall portions needed to be analysed. Therefore, a 3D
Fig. 15. FEM mesh adopted for the U-shaped wall specimens.
Dow
nloa
ded
by [
CE
A S
acla
y] a
t 03:
07 2
8 Ja
nuar
y 20
15

Behaviour of U-Shaped Walls 81
thin shell representation was considered as sufficient to include the behaviour of interest. The finite element modelling of the structure resulted in the mesh shown in Fig. 15. For the shear wall, layered thin shell discrete Kirchoff triangles (DKT) were used to model the wall response.-Nine concrete layers of equal thickness were used in the web and flanges to account for the flexural action. Rectangular shell elements were used to model the top slab, but due to its large relative stiffness, the base slab was not considered in the analysis and the structure was assumed fully restrained a t all nodes along the base of the shear wall. Discrete modelling was adopted to represent the horizontal and vertical reinforcement, through the use of truss-bar elements. Perfect bond was assumed to exist between concrete and reinforcement. The possibility of non-linear material behaviour was specified for all the wall elements, while the behaviour of the top slab was considered as elastic.
Before applying the lateral load, vertical loads, including the slab weight and axial load on the wall, were imposed to the model. The time history of the exper- imentally applied horizontal displacement was then considered, while rrlnintaining the initial vertical load as constant. To solve the non-linear equilibritun equations, a modified Newton-Raphson iteration solution scllerne was used.
In order to achieve a good compromise between sir~qdicity i111d accuracy, a hiax- ial concrete model that provides acceptable representation of tllc cyclic irlclastic bcliaviour of reinforced concrete under cyclic loadi~ig was uscd. This modcl [Alcr- abet and Reynouard, 1900], adopts the concept of a srncarccl crack rrppro;~cli with a possible double cracking only at 00'. It is based upon the plasticity theory for uncracked concrete with isotropic hardening and associated flow rule. Two dis- tinct criteria describe the failure surface: Nndai in corr~pression and bi-compression and Rankine in tension. Hardening is isotropic and an associated How rule is uscd. When the ultimate surface is reached in tension, a crack is created perpendicular to the principal direction of. maximum tensile stress, and its orientation is considered subsequently as fixed. Each direction is then processed independently by a cyclic uniaxial law, and the stress tensor in the local co-ordinate system defined by the direction of the cracks is completed by the shear stress, elast i d l y calculated with a reduced shear modulus pG, (with 0 < p < 1, and p being a function of the crack opening strain) to account for the effect of interface shear transfer:
p = 0.4 ............ if E~~ - €re , - E l m -< 2 ~ t m
/ 4 = O . . . . . . . . . . . if Ecr - Eres - Elm 2 2€tm
p = O and 012 = 0 ............ if e, - E,,, - ~ t , 2 4 ~ t m
where:
E, - total strain E,., - residual strain after unloading in compression E t m - crack opening strain 0 1 2 - shear stress
The behaviour of a point initially under tension, which completely cracks prior to undergoing reverse loading in compression, is illustrated in Fig. 16. Similar laws
Dow
nloa
ded
by [
CE
A S
acla
y] a
t 03:
07 2
8 Ja
nuar
y 20
15

1 - Elastic tension 2 - Crack opening 3 - 8 Crack closing 4 - Nonlinear compression 5 - 1 I-Damaged unloading, E, t E, 6 - Darnaged unloading. Moddus = E, 7 - Reopening of m k 9 - ReIdading: Linear com~ression I0 - Softening behaviour in compression 12 - Elastic tension with resistance f; < I ,
STRESS
Fig. 16. U n i a ~ i a l model: point initially in tension.
tlescril~e tllc case,ol a n irlitial cotnpressed point or that of a poirlt, which has rwt totally cracked u d c r rcversc lotding. The model iiiw becrl dcscribcd in detail ant1 verified elsewlicre [Ile mid Reynouartl 2000; Ile et al., 20021. Its virlitlity h;u becti dcrmnstratcd hy usirlg it to predict the behaviour of slicar walls with diffcrcnt span-to-height ratio under monotonic, cyclic and dynamic 1o;diug conditions for which experimental observation was available.
For steel, R cyclic ~uodel tllitt can take into account thc Bilwchingcr effect and buckling of reinforcing bars has been adopted. The monotonic branch is
(a) cyclic behaviour without buckling. (b) cyclic behaviour with buckling.
Fig. 17. Numerical model for steel under cyclic loading.
Dow
nloa
ded
by [
CE
A S
acla
y] a
t 03:
07 2
8 Ja
nuar
y 20
15

Behaviour of U-Shaped Walk 83
characterised by an initial linear branch followed by a plateau and hardening up to failure. The cyclic behaviour is described by the formulation proposed by GiuffrC and Pinto and impleniented by Menegoto and Pinto [1073]. The steel model is presented in Fig. 17.
The concrete was modelled as having an initial modulus of elasticity of 28000 MPa and a Poisson ratio of 0.2. The concrete compressive strength was 24 MPa in the unconfined regions. In the confined regions, following the recornmew dativns of EC8, the concrete coinpressive strength was increased to about 30 MPa. The desce~lding part of the compressive stress-strain behaviour was approxir~iatetl by a straight-line function, the corresponding ultimate compressive strairi E,, , being equal to 0.006 in the unconfined regions and to 0.020 in the confined regions. An initial shear retention factor of 0.4 was adopted in modelling the shear stifhcss of the cracked concrete. The tensile strength was set equal to 2.0 MPa and thc crack opening strain Q,, was set equal to 0.5 x
The evaluation of steel parameters was quite simple: the measwed elastic 111otl- uhs , yield and failure stress of the steel bars being directly used.
5. Test Resul ts and Model Comparison
Tlw force-displacc~ile~it curves for the cxpcriniental and 11111iieri~id rcs~ilts ilrc S ~ ~ O W H
in Figs. 118 to 20. With the esccption of the pinching of the loops ill the Y direction test and the significant strength degradation in the last two cycles of the X direc- t ion test, t he ~l~inm-ical arldysis provides a realistic represent at ion of the s trengt 11
-150 -100 -50 0 50 100 150 Top displacement (mm)
Fig. 18. Force-displacement relationship - Y direction test.
Dow
nloa
ded
by [
CE
A S
acla
y] a
t 03:
07 2
8 Ja
nuar
y 20
15

-1000 L I I 1 L J
-150 -100 -50 0 50 100 I 5 0
Top displacement (mm)
Fig. 19. Forcodisplacement relationship - X direction test.
-100-80 do 4 -20 0 20 40 60 80 100 -100 -80 40 -40 -20 0 20 40 60 80 100
Top displacement: X direction (rnm) Top displacement: Y dirtxtion (mm)
Fig. 20. Force-top displacement relationship - XY direction test.
and stiffness of the U-wall specimen. On the one hand, the observed differences may be due to the fact that the 3D thin shell representation (via the plane-stress assumption) cannot take adequately into account the significant damage consisting of concrkte crushing and bar buckling, as was indeed observed during the last cycles of each test. On the other hand, the discrepancies may also be due to the fixed end deformation component, as was indeed observed during the Y direction test. This deformation mechanism (bond slippage of the reinforcement at the fixed end) was not included in the model, because the wall model was attached to a rigid fixed end.
Figure 21 shows thebteraction relationship (envelope curve) for the U-shaped wall section, with the axial load applied in the quasi-static tests, as predicted by the
Dow
nloa
ded
by [
CE
A S
acla
y] a
t 03:
07 2
8 Ja
nuar
y 20
15

TEST C- I o o o ' a
MODEL
Fig. 21. Interaction diagram and load path (XY direction test).
3D model. On the same figure the load path corresponding to both experiment and calculation are presented for the X Y direction test. It can be seen that during the biaxial test the cyclic strength degradation is severe, and a s expected, X Y curves are inside the envelope curve.
Figures 22 and 23 show the crack pattern for the uniaxial tests as predicted by the numerical analysis. Compared with the actual crack pattern presented earlier, it can be seen that the crack distribution and direction is consistent with what was experimentally observed. These figures also indicate that different types of behaviour are expected depending the direction of loading. For the Y direction test, horizontal cracks are predicted in the web, while due to shear effects, two sets of inclined cracks appear in the flanges, depending of the sign of the loading (+Y or -Y). For the X direction test, very inclined cracks occur in the web and the two flanges, shear being important in all the wall portions - to the state of bending was superimposed a state of shear related to the important cross sectional warping associated with the U-shape of the section.
During the X direction test, diagonal transducers mounted on the lateral faces of the wall measured shear deformations on each face. Figure 24 shows three diagonal transducers placed at the base, on each face of the wall, transducer C40 on the X+ flange, transducer C48 on the web and transducer C57 on the X- flange. The .
Dow
nloa
ded
by [
CE
A S
acla
y] a
t 03:
07 2
8 Ja
nuar
y 20
15

Fig. 22. Numerically prcclictcd crack pclttcrtl (Y rlircction tcst).
Fig. 23. Numerically predicted crack pattern (X direction test).
Dow
nloa
ded
by [
CE
A S
acla
y] a
t 03:
07 2
8 Ja
nuar
y 20
15

Behuuiour of U-Shaped Wal Ls 87
Fig. 24. Position of the C40, C48 a ~ i d C57 diagonal transducers (X dircctioii tcst).
experimental relationship between the applied force and the tliitgonal tlispli\c~~i~clit of these trn~isdilcers is presented in Figs. 25 and 26. It can be sccri that both C40 and C48 transducers are giving the same kind of results, while C57 trmstluccr is of opposite sign. That means that both the X+ flange and the web are cracked,
-1000 -800- -600 -400 -200 0 200 400 600 800 1000
Force (KN)
Fig. 25. Experimental forcediagonal displacement curves (X direction test).
Dow
nloa
ded
by [
CE
A S
acla
y] a
t 03:
07 2
8 Ja
nuar
y 20
15

-1000 -800 -600 -400 -200 0 200 400 6UO 800 1000
Force (KN)
Fig. 26. Experimental force-diagonal displacement curves (X direction test).
Force (KN)
Fig. 27. Calculated force-diagonal displacement curves (X direction test).
when the X loading is applied in the negative direction. They behave together in the same'way, whereas the X- flange remains uncracked. Conversely, when the X loading is applied in the positive direction, both the X- flange and the web are now cracked, whereas the X+ flange is in compression. As shown in Fig. 27, where the predicted force and diagonal displacement of transducers C40 and C48 are presented, the type of behaviour previously described is well reproduced by the numerical model.
For the X direction test, displacements at the top of the wall in the Y direction were also registered, in spite of the fact that the specimen was not loaded in the Y direction. It is to be noted that measured Y displacements were generally positive and the two measurements (for the X+ and X- flange) were almost the same. Figure 28 shows the evolution of the average Y top displacement as obtained by
Dow
nloa
ded
by [
CE
A S
acla
y] a
t 03:
07 2
8 Ja
nuar
y 20
15

0 500 1000 1500 2000 2500 3000 Data points
Fig. 28. Evolution of the average Y top displacemerit (X direction tcst).
test and calculation. Despite the fact that measured and numerical valucs do not match exactly, both of them indicate a global increase of the Y displaceknt duriug the test. The positive sign and the global increase of the Y average tlisplaccr~le~it are due to higher plastic deformations on the flange extremities tharl on the web, which tend to bend the structure in the Y positive direction.
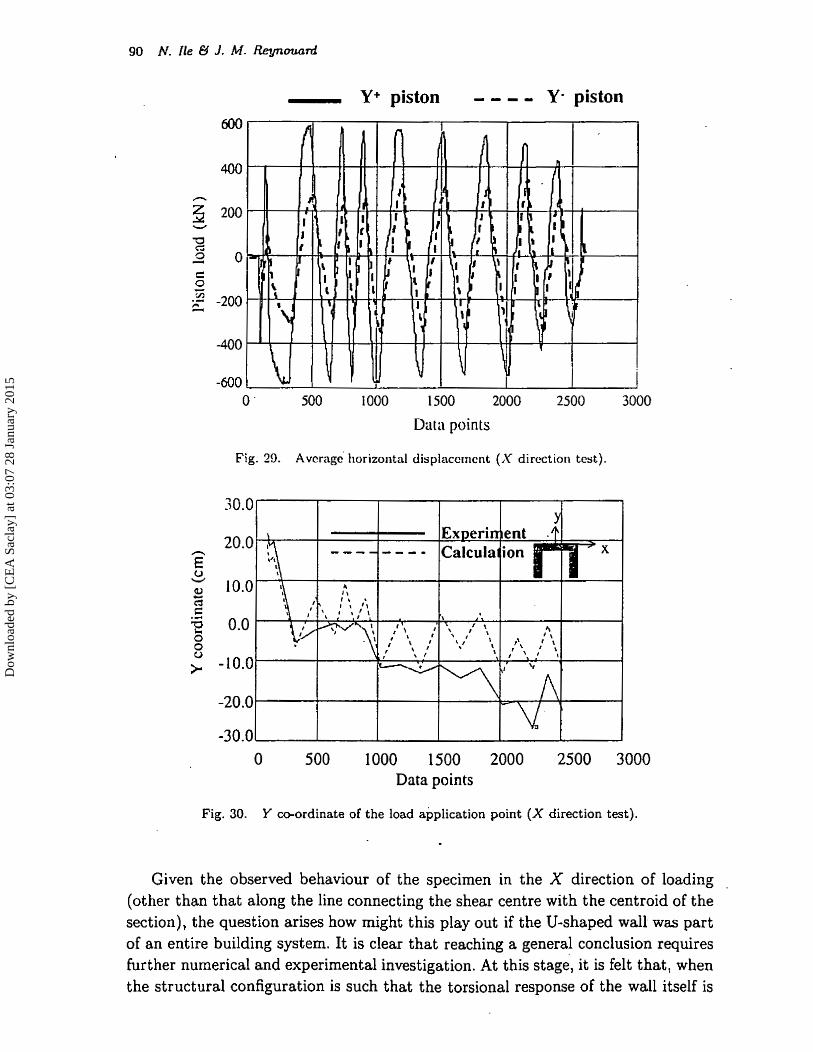
Another interesting aspect, which was observed during the X direction tcst, is the evolution of the shear centre with inelastic cyclic deformatiow. As can be observed in Fig. 29, the applied experimental forces in the two pistons were far from being identical. The piston outside the web near the shear centre (the Yf piston) delivered the main effort during the test. The relative contribution of the other piston, located outside the flange (the Y - piston) tended to increase, showing that the shear centre modified its position during the test. Therefore a torsional moment was applied at the top of the wall to equilibrate the torsion induced by the rotation of the damaged sections situated between the base and the top slab. The application point of the resultant of the two corresponding top horizontal forces represents the position of the shear centre of the wall. This point moved during the test from its initial position, which was very close to the theoretical position for an elastic homogeneous wall (Y = 0.20 cm), to the midline of the web of the wall and then to the centroid of the wall section, when failure was approaching. Figure 30 represents the variation of the Y co-ordinate of this point during the X direction test, for every maximum. and minimum. X top displacement of each cycle. In the same figure the position of this point as obtained from the finite element analyses is presented for comparative purposes. From this figure it can be seen that calculation gives generally consistent results almost up to the first 12 crn cycle.
Dow
nloa
ded
by [
CE
A S
acla
y] a
t 03:
07 2
8 Ja
nuar
y 20
15
- Y+ piston - - - - Y- piston
0 ' 500 1000 1500 2000 2500 3000
Data points
Fig. 20. ~ v c r a & horizontal displacct~~cnt (X direction test).
Fig. 30. Y co-ordinate of the load application point (X direction test).
Given the observed behaviour of the specimen in the X direction of loading (other than that along the line connecting the shear centre with the centroid of the section), the question arises how might this play out if the U-shaped wall was part of an entire building system. It is clear that reaching a general conclusion requires Further numerical and experimental investigation. At this stage, it is felt that, when the structural configuration is such that the torsional response of the wall itself is
Dow
nloa
ded
by [
CE
A S
acla
y] a
t 03:
07 2
8 Ja
nuar
y 20
15

of minor importance in comparison to the flexural one, the observed phenomena would be less pronounced. However, this is not true if the torsional stiffness of the core itself is an important component of the total torsional rigidity of the structure, and, in addition, the overall structural configuration in plan is such that torsion is expected to be an important component of the response to the horizontal seismic action components. In this case, the observed phenomena (bending of the wall in the perpendicular direction of loading and migration of the shear centre to the- centroid of the wall in the post-elastic range could) could affect significantly the behaviour of other structural members.
The X direction test has also shown that during a large part of the cyclic response, due to bending in the direction riornlal to the axis of syhmetry, one of the flanges is in compression and the other is in tension. Hence their shear resis- tance is different and more shear concentrates in the conipressed flange. 111 the case
of biaxial loading, secondary shear forces due to bending in the orthogonal direc- tion superimpose to this primary shear. These secordary forces have the same or opposite direction relative to the primary shear due the loading in the X direction. As a result, when during cyclic response high lateral forces are applied in both directions, dmost the entire shear resistance in the direction parallel to the flangcs is provided by the flange that is under compression. This effect is clearly shown by the numerical results in Fig. 31, which compares the applied forces with the shear force shared in the Y direction, only by the right flange. It can be seen that, at certain time.steps, the shear force in the right flange in the Y direction is almost equal with the applied load in the same direction. When the entire shear resistance
Data points
Fig. 31. Total applied forces and Y shear force in the right flange during X Y test.
Dow
nloa
ded
by [
CE
A S
acla
y] a
t 03:
07 2
8 Ja
nuar
y 20
15
is provided by just one flange, the compression zone is limited to the region of the bee end of this side and it is there that failure of the wall may start, as was indeed observed in the biaxial test. As indicated by Fardis [Reynouard and Fardis eds., 20011, the implication for design is in the direction of providing the full-required shear capacity of the wall parallel to the axis of symmetry, by just one "side" or flange of the wall- As a minimum, this may be reaiised by considering that one of the flanges will have to resist shear while under net tension. However, a safer alter- native would be to proportion each of the two flanges to resist the full design shear force, assuming that the flange under consideration carries simultaneously the full axial load of the wall.
6. Conclusions
The numerical results obtained for the case of the U-sliaped walls can be cow sitleretl very satisfactory, siicc they reproduce the experimental beliaviour with slificic~lt accuracy, even under extrenie bixuial loading conditions. Tllc nurncricirl nloclel liowever requires n refi~wtl a d realistic tlescription of thc gcorrlctry of the wall i l r d of its rci~hrcenleiit m d tletailetl cyclic co~istit~itive x~iotlels of thc material belmviour. Its principirl ntlvmltilgo rel;rtivc to the macro ~uotlcls lies in thc fact that the nlcclmiic;rl propert ics of each cons titnent elenlent of t hc will1 are based 011 the actrtal local bchwiol~r of nl,ztcri;tls, and due to this the interaction betwcun axial force, flexure u r d shear is directly ti~kekcrl into n c c o ~ ~ r l t . B i w d on tlic rcsults obtainctl in this rltunerical study, and noting thc rapidly growing cornpi~tcr powcr, it appcirrs nowadays to bc possible to apply a shell rcfinetl model to invcstigatc the non-lincar behaviour of muticrate-rise mixed s tructurcs, that is structures consisting of frtmm, plane share walls a11d wall cores. In this type of modelli~lg, the walls arid slabs are simulated using finite elements having both flexural and membrane capabilities, while fibre beam elements may be used to describe the behaviour of frames.
Overall, the three cyclic tests confirmed the new design approach according to prENl998- 1 :ZOO1 for proportioning the confining reinforcement in critical regions -of ductile walls as compared to the rules of ENV1998-1-3:1994. A displacement ductility of about 6 has been attained in a very stable manner in the uniaxial tests. The specimen tested under bi-directional loading, has also attained a displace ment ductility factor of about 6, confirming the adequacy of the prEN199&1:2001 confinement provisions even under extreme biaxial loading and demonstrated the conservatism of the relevant provisions of ENV1998-1-3: 1994.
As indicated by tests and numerical simulations, this type of wall may be sub- jected to large bending and shear forces in both directions, and shear demands in the two sides parallel to the axis of symmetry may be critical. The implication for design is. in the direction of providing the full-required shear capacity of the wall parallel to the axis of symmetry, by just one "side" or flange of the wall.
Dow
nloa
ded
by [
CE
A S
acla
y] a
t 03:
07 2
8 Ja
nuar
y 20
15

Behoviour of U-Shaped Walls 93
Acknowledgment
The research reported in this paper has been financially supported by the Train- ing and Mobility of Researchers Program of the European Conitllission under the ICONS and ECOEST II projects. The authors gratefully acknowledge the valuable research work of Prof. M. Fardis and Dr. P. PBgon that provided the design and experimental data for this paper. We are also indebted to Mis. C. Plumier who provided . . . data processing during execution of the cyclic tests.
References
CEN (19941 "Design provisions for earthquake resistance of structures. Part 1: General rules. Part 1-1: Seismic actio~is and ,general requiretmnts for structures; Part 1-2: General rules for buildings; Part 1-3: Specific rules for various materials ancl elements," ENV 1998-1-1, 1-2 and 1-3, Cornite' Europe'en de Normalzsation, Brussels.
CEN [2001] "Eorocode 8: Design of structures for earthquake resistance. Part 1: General rules, seismic actions and rules for buildings. F ind Project Tear11 Draft (stage 34)," P ~ E N ' 1998- 1, Cornit6 Europhen de Norntolisation, Brussels.
ECS [1994] .'Eurocode 8: Design provisiorls lor earthquake resistance of structures:" Euru- pearl Coninlittee for Standardization, Brussels.
Ile! N . and R.ey noliard, .J. i\I. [20001 "Nonli~iear analysis of reinforced coricrete sllear wid1
undcr enrt hquake loading," Journal of Earthquake Engineering 4(2), 183-2 13. Ile, N., Reynounrd J. M. and Georgin J . F. [2002], "Non-linear response and modelling
of RC walls subjected to seismic loading,'' ISET Journal of Earthquuke Technology 39(1-2), 1-21.
Kwan, A. K. H. [l9!35] "Eqilivalence of finite elements and analogous frame nodules for shear/core walI analysis," Computers @ Structures 57(2 ) , 193-203.
MacLeod, I. A. and Hosny, H. M. (19771 "Frame analysis of shear wall cores," ASCE J. Struct. Dzu. 103(ST10), 2037-2047.
Menegoto, M. and Pinto, P. 119731 "Method of analysis of cyclically loaded reinforced concrete plane frames including changes in geometry and nonelastic behaviour of ele- ments under combined normal force and bending," IABSE St~mposium o n Resistance and Uitimate Dejonnability of Structures Acted on by Well-Defined Repealed Loads, Final report, Lisbon, 328p.
Merabet, 0. and Reynouard, J. R.I. [I9991 "Formulation d'un rnocll?le elasto-plastique fis- surable pour le beton sous chargement cyclique," Contract Study EDF/DER, Final Report, No. 1/943/002, URGC-Structures, National Institute for Applied Sciences, Lyon, 84p.
Millard, A. [I9931 "CASTEM 2000, Manuel d'utilisation," CEA-LA MBS Report No. 93/007, Saclay, France, 186p.
Pkgon, P., Plumier, C., Pinto A., Molina J., Gonzalez P., Tognoli, P. C. and Hubert, 0. [2000a] "U-shaped walls: Description of the experimental set-up," TIIfR-ICONS- TOPICS, JRC Ispm, April, 23p.
Pggon, P., Plumier C., Pinto, A*, Molina J., Gonzalez P., Tognoli, P. C. and Hubert, 0. [2000b] "U-shaped walls: quasi-static test in the Y direction - test report," TMR- ICONS- TOPICS, JRC Ispm, May, 19p.
Pkgon, P., Plumier, C., Pinto, A*, Molina, J., Gonzalez, P., Tognoli, P. C. and Hubert, 0. [2000c] "U-shaped-walls: quasi-static test in the X direction - test report,'' TMR- ICONS-TOPICS, 3RC Ispm, June, 23p.
Dow
nloa
ded
by [
CE
A S
acla
y] a
t 03:
07 2
8 Ja
nuar
y 20
15
Pegon, P., Plumier, C., Pinto, A., Molina, J., Gonzalez, P., Tognoli, P. C. and Hubert, 0. [2000d] "U-shaped-walls: ~uasi-static biaxial test in the X and Y directions - test report," TMR-ICONS-TOPIC5, JRC Ispm, June, 23p.
Reynouard, J. M. and Fardis, M. N. eds. (20011 "Shear wall structures," Ca/eei-Ernest Thematic Report No. 5, gen. eds. R. T. Severn and R. Bairrao (LNEC, ISBN 972-49- 1891-2) September, 240p.
Stafford-Smith, B. and Girgis, A. M. 11986) "Deficiencies in the wide column analogy for shear wall core analysis," Concrete International, April, pp. 58-61.
Xenidis, H., Athanatopoulou, A. and Avramidis, 1. E. [I9931 "Modelling of shear wall cores under earthquake loading using equivalant Erarnes," Structural Dynamics - EUROD YN '93, eds. T. Moan et al. (Balkema/Rot terdam/Brookfield) , pp. 901-910.
Dow
nloa
ded
by [
CE
A S
acla
y] a
t 03:
07 2
8 Ja
nuar
y 20
15