Behaviour of geogrid reinforced abutments on soft soils in BR 101 Highway, Brazil
14
Behaviour of Geogrid Reinforced Abutments on Soft Soil in the BR 101-SC Highway, Brazil 1 André R. S. Fahel 1 , Ennio M. Palmeira 1 and J. A. R. Ortigão 2 Abstract This work presents the behaviour of geogrid reinforced bridge abutments in the BR-101 highway, in the state of Santa Catarina, Brazil. Unidirectional geogrid layers were used as reinforcement for the embankments. A coarse sand was employed as fill material and the foundation layer consisted of an organic soft clay. Because of the nature of the foundation soil and the proximity of existing structures, geotechnical instrumentation was installed to assess the reinforced structure displacements. The results showed that the presence of the reinforcement layers reduced the soft soil lateral displacements and the damages to the existing structures. A preliminary stability analysis of one of the abutments is also presented and discussed. Introduction Soil reinforcement of earth works by inclusions is a very old technique, dating back thousands of years. However, only during the last few decades have engineers scientifically studied the technique and developed rational design methods for several applications of soil reinforcement. In the past, roots and plant mattresses were used as reinforcements and, in some cases, are still used today. However, a wide variety of geosynthetic materials is now available such as geotextiles, geogrids, strips, geocells and geocomposites. The use of these materials, on a rational basis, allows better designs with the required performance assurance that biodegradable reinforcing materials may not provide for ------------------ 1 Proc ASCE SPG Special Geotechnical Publication, GeoDenver 2000 Conference, August, Denver, CO 1 University of Brasilia, Department of Civil and Environmental Engineering, FT, 70910-900 Brasilia, DF, Brazil. 2 Federal University of Rio de Janeiro, RJ, Brazil.
-
Upload
independent -
Category
Documents
-
view
3 -
download
0
Transcript of Behaviour of geogrid reinforced abutments on soft soils in BR 101 Highway, Brazil

Behaviour of Geogrid Reinforced Abutments on Soft Soil in the BR 101-SC Highway, Brazil1
André R. S. Fahel1, Ennio M. Palmeira1 and J. A. R. Ortigão2
Abstract
This work presents the behaviour of geogrid reinforced bridge abutments in the BR-101 highway, in the state of Santa Catarina, Brazil. Unidirectional geogrid layers were used as reinforcement for the embankments. A coarse sand was employed as fill material and the foundation layer consisted of an organic soft clay. Because of the nature of the foundation soil and the proximity of existing structures, geotechnical instrumentation was installed to assess the reinforced structure displacements. The results showed that the presence of the reinforcement layers reduced the soft soil lateral displacements and the damages to the existing structures. A preliminary stability analysis of one of the abutments is also presented and discussed. Introduction Soil reinforcement of earth works by inclusions is a very old technique, dating back thousands of years. However, only during the last few decades have engineers scientifically studied the technique and developed rational design methods for several applications of soil reinforcement. In the past, roots and plant mattresses were used as reinforcements and, in some cases, are still used today. However, a wide variety of geosynthetic materials is now available such as geotextiles, geogrids, strips, geocells and geocomposites. The use of these materials, on a rational basis, allows better designs with the required performance assurance that biodegradable reinforcing materials may not provide for ------------------
1 Proc ASCE SPG Special Geotechnical Publication, GeoDenver 2000 Conference, August, Denver, CO
1University of Brasilia, Department of Civil and Environmental Engineering, FT, 70910-900 Brasilia, DF, Brazil. 2Federal University of Rio de Janeiro, RJ, Brazil.

structures requiring large life times. The use of geosynthetic as reinforcing materials has shown a marked increase in the last two decades mainly because of their cost-effectiveness solutions (compared to the traditional solutions), research and developments on polymer reinforcing material behaviour, research results on soil reinforcement and the observation of the performance of real geosynthetic reinforced structures. Among the different types of reinforcements now available, geogrids are still the least used as reinforcement elements in reinforced structures in Brazil. However, this situation is changing and those materials are becoming more competitive and more commonly available. This work describes the use of geogrids to reinforce bridge abutments on an important highway in the southern part of Brazil. Despite all of the research that has been carried out to date on reinforced embankments on soft soils, very little can be found on the influence of basal reinforcement in reducing the lateral movement of soft foundation soils and stresses transferred to adjacent existing structures such as highway embankments or bridges. Fahel (1998) and Palmeira and Fahel (1999) have shown that geosynthetic reinforced retaining structures on soft soils present the advantage of flexibility, compared to other traditional stiffer retaining solutions. The former type of structure can accept larger levels of differential settlements with smaller damages than the latter. The present work deals with the use of geosynthetic reinforced bridge abutments by means of observations of instrumented works. The case history presented in this work is part of a research programme involving the study of several geosynthetic reinforced abutments on soft soils on the BR-101 highway. Characteristics of the Site Large, and sometimes rather deep, soft soil deposits are very frequently found in Brazil, particularly along the coastline. In the state of Santa Catarina, in southern Brazil, tropical organic soft soil deposits are commonly found along the coast line of the state. For the widening of the BR-101 highway in that region, several bridge abutments have to be built to crossing rivers and channels. For several of these abutments the use of geogrid reinforcement was adopted and some of these were instrumented. The reinforced abutments on soft soil considered in the present work were built as approaches to a concrete bridge over a channel known as the DNOS channel, with DNOS standing for National Department of Sanitary Works. The BR-101 highway is very important for the economy of the states in southern Brazil, particularly for the import and export of goods to or from neighbouring countries. The reinforced abutments of the DNOS channel are located near the city of Tijucas,

48 km from Florianopolis, the capital of the state of Santa Catarina. Figure 1 shows the location of the site investigated. The foundation soil in the region consists of a soft organic soil layer with the presence of sand intrusions with thicknesses varying from a few centimetres to a couple of meters. Below the DNOS abutments a weaker clay layer, 5.5m thick, can be found separated from another slightly stronger clay layer by 2m of clayey sand, as shown in the schematic subsoil profile presented in Figure 2. This figure also shows the results of vane and piezocone (CPTU) tests performed at the site. The undrained strength varied between 4 to 15 kPa in a rather non-uniform mode. Piezocone dissipation tests performed at the site yielded values of horizontal consolidation coefficient between 10 and 28 m2/year.
TijucasBlumenau
Florianópolis
LagunaTubarão
Santa Catarina
Atlanti
c Ocea
n
Brazil
Figure 1. Location of the Reinforced Abutments Characteristics of the Reinforced Abutments Adjacent to the newly constructed abutments are old abutments that were built about thirty years ago and reinforced, at that time, with the use of wood branches and trees mattresses at their bases. It was expected that duplication of the highway and the construction of additional adjacent traffic lanes would cause damage to the existing embankments and structure. To minimise possible damages to those structures geogrid layers were used to reinforce the abutments in conjunction with vertical band shaped drains to accelerate the consolidation of the soft soil deposit. The two abutments described in this paper will be referred to hereafter as North and South abutments. Figure 3 shows a typical cross-section along the highway axis of the reinforced abutment (South abutment), showing the reinforcement layout. Five layers of geogrid reinforcement were employed and the inclination of the embankment slopes were 1:1.5 (vertical:horizontal) or 1.5:1,
depending on the slope considered. Figure 4 presents a cross-section normal to the highway axis showing the new and the old embankments. Figure 5 shows a plan view of the embankments and instrumentation locations. Both will be described later in this work.
0
4
8
12
16
0 5 10 0 4 8 12 16 ������������������������������������
������
������������������������������������
����
������������������������������������������������
Fill
Soft clay
Clayey sand
Clay
Compactsand
disturbed
qc (MPa) Su (kPa)z
(m)
(a) North Abutment
0
4
8
12
16
0 105 0 4 8 12
disturbed
qc (MPa) Su (kPa)
z (m
)
���������������������������������
������
���������������������������������
�����������������������������������������������������������
Fill
Soft clay
Clayey sand
Clay
Compactsand
(b) South Abutment
Figure 2. In-Situ Tests Results A 1.1m high surcharge fill was planned for placement on top of the embankments of the new abutments to act in conjunction with the vertical drains to minimise consolidation settlements and surface repairs after the construction of the pavement. In fact the surcharge was only applied to the South abutment, as will be discussed later in this work. The height of the surcharge was established by the

designers as a function of the expected maximum consolidation settlement. The vertical drains used were synthetic band-shaped drains, 100mm wide by 5mm thick, comprising a plastic core with a nonwoven geotextile cover. The drains were installed in a square pattern with a spacing of 1.35m. A 0.4m thick sand blanket was placed on top of the foundation soil surface and the embankments were raised at an average speed of 1.5 m per week.
���
geogrids, 0.4m spacing,30 m long�����������������������������������������������������������������������������������
�����������������������������������������������������������������������������������������������������������������������������������������������������������������������������������������������������������������������������������������������������������������������������������������������������������������������������������������������������������������������������������������������������������������������������������������������������������������������������������������������������������������������������������������������������������������������������������������������
��������������������������������������������������������������������������������������������������������������������������������������������������������������������������������������������������������������
3.8
0.45.5
1.51
soft clay
fill
bridge
CL
vertical drains
���������������������������������
�������������������
Figure 3. Typical Cross-Section of the Abutments
����������������������������������������������������������������������������
������������������������������������������������������������������������������������������������������������������������������������������������������������������������������������������������������������������������������������������������������������������
� �������������������������������������������������������������������������������������������������������������������������������������������������������������������������������������������������������������������������������������������������������������������������������������������������������������������������������������������������������������������������������������������������������������������
����������������������������������������������������������������������������������
������������������������������������������������������������������������������������������������������������������������������������������������������������������������������������������������������������������������������������������������
30
1.5
berm1.1
surcharge (South abutment)
18 18
3.8
old embankment
new embankment
Dimensions in meters vertical band shaped drains,1.35 m spacing in square pattern
soft soil
1.51
1.51
��������������������������������������������������������������������������������������������������������������������������������������������������������������? ? ? ? ?
geogrid layers
�������������������������������������������������������������
Figure 4. Old and New Embankments
The soil used as fill material for the embankments was a coarse sand with a unit weight of 15.5 kN/m3 and a friction angle of 33o, determined by direct shear test.

To reinforce the embankment the designers chose 5 layers of unidirectional geogrid, made of polyester. Figures 6 (a) and (b) show details of the geogrid and installation in the field respectively. The reinforcement layers were 30m long, with a spacing of 0.4m vertically, and covered the entire width of each abutment base. The first geogrid layer was installed on the sand blanket. The geogrid has a thin pvc cover for protection against environmental effects and site damages. The longitudinal tensile strength of the geogrid is equal to 200 kN/m and the transverse tensile strength is 15 kN/m. Geogrid layers were laid with the stronger direction coinciding with the highway axis. Therefore, less reinforcement strength was available along the transverse direction. At the end of construction of the North abutment significant lateral movement along the direction normal to the highway axis (abutment side slopes) were observed. Although the use of bi-directional grids, or the installation of some layers of reinforcement orientated along the embankment transverse direction, could have been employed to stabilise the abutment side slopes, the designers preferred the use of a berm 1.5 m high and 30 m long adjacent to the new embankment, as shown in Figures 4 and 5.
berm berm
existing lanes
DN
OS
chan
nel
Southabutment
Northabutment
I2
I1
I3
I4
SP1 SP4SP5SP6SP2
SP3
P2, P3, P4P1
Florianópolis
Tijucas
MPSG
I2 - inclinometerSP3 - settlement plateP4 - Piezometer
MPSG - multi-point settlement gauge
Figure 5. Plan View of the Old and New Embankments
The location of the instruments used to monitor the behaviour of the embankments is shown in Figure 5. The instrumentation consisted of 4 inclinometers, 4 vibrating wire piezometers, 6 settlement plates and a multi-point settlement gauge to assess the vertical settlement profile of the embankment along its axis (only for the South Abutment).

(a) Geogrid Detail
(b) Geogrid Installation
Figure 6. Geogrid Type and Installation The sequence and construction procedure utilized played an important role on the general behaviour of the abutments. The work was started with the construction of the North Abutment. Probably due to time constraints the embankment was raised to its final height (plus the surcharge height) very quickly. As a result, large lateral movements, cracks and signs of general instability of the abutment side slope were noticed at the end of construction. Immediate corrective action included removal of the surcharge layer and the construction of a berm along the side slope (Figure 4). The lateral movements observed were certainly related to the smaller strength/stiffness available in the reinforcement layers along the direction normal to the embankment axis. The decisions mentioned above are likely to have been made within a limited amount of time by the designers and contractors, as far as the
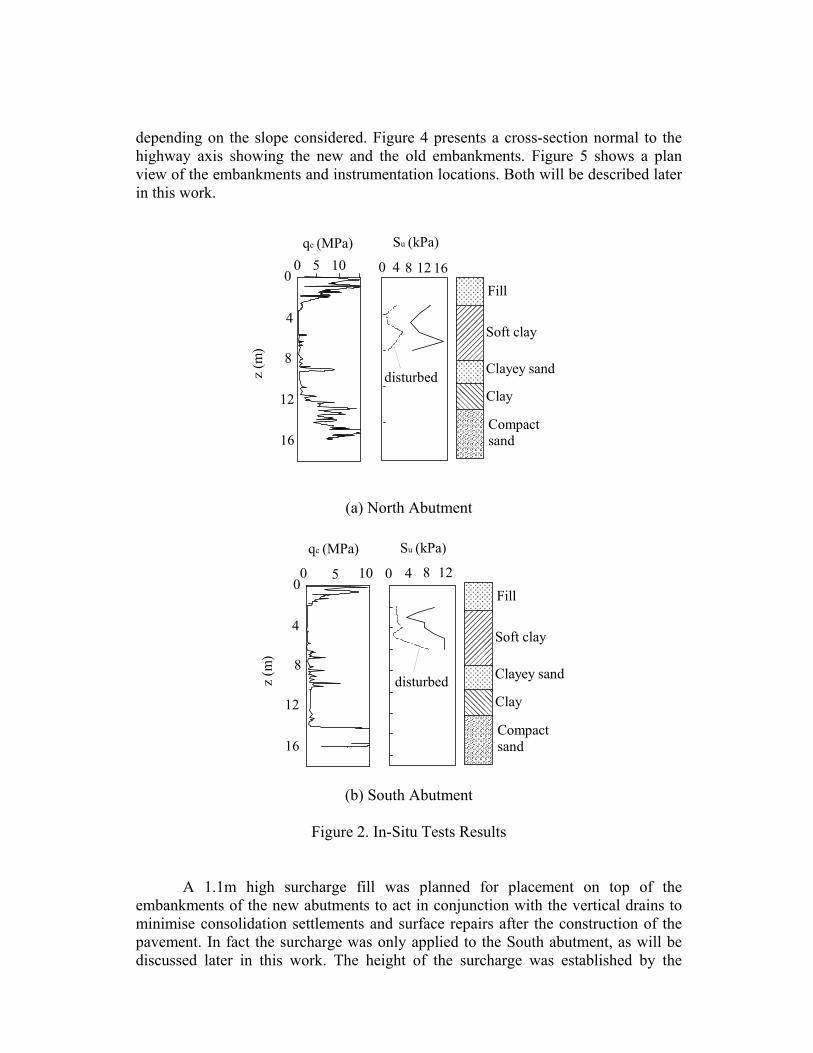
authors of the present paper can infer. Because of this experience, the South Abutment was built with plans to include the lateral berm from the beginning of construction and with a more controlled construction procedure. Behaviour of the reinforced Abutments Figures 7(a) and (b) show the variation of settlements with time for the abutments. Figure 7(a) shows the settlements measured by the settlement plate SP2 (Fig. 5) and Figure 7(b) shows the settlement profile along the embankment axis for the South abutment, as measured at different times by the multi-point settlement gauge. Settlement values as high as 0.5m can be observed in both cases.
Time (days)0 50 100 150 200 250
-500-400-300-200-100
0
Settl
emen
t (m
m)
������������������
��������
north abutment
(a) Settlements of SP5
Distance (m)0 5 10 15 20 25 30 35
-200-100
0100200300400500
14
75138Se
ttlem
ent (
mm
)
�����������������
��������x
(time, days)
(b) Settlement Profile of the South Abutment
Figure 7. Settlement Data of the Abutments
Porepressure generation with time is presented in Figure 8. A steep increase of porepressure with time for piezometer PE-1 can be noticed within the first 30 days

of construction, in contrast to the behaviour of the other piezometers. This is explained by the fact that the piezometer PE-1 is located in the North abutment which was raised very quickly, and suffering stability problems as mentioned previously. When signs of instability appeared the surcharge was removed and a berm was constructed, reducing load on the soft soil and allowing the dissipation of the porepressure in piezometer PE-1. Porepressure values up to 41 kPa were observed in piezometer PE-1. Piezometers PE-2 to PE-4, below the South abutment, presented a different pattern of pore pressure generation because of the construction procedure employed in this case. In these piezometers the porepressure values reached up to 18 kPa.
Time (days)0 50 100 150 200 250 300 350 400
-505
1015202530354045
PE-1
PE-2PE-3
PE-4
Pore
pres
sure
(kPa
) ����������������������������������
��������PE-2
PE-3PE-4
����������������������������������
��������
PE-1
Figure 8. Porepressure Generation Versus Time
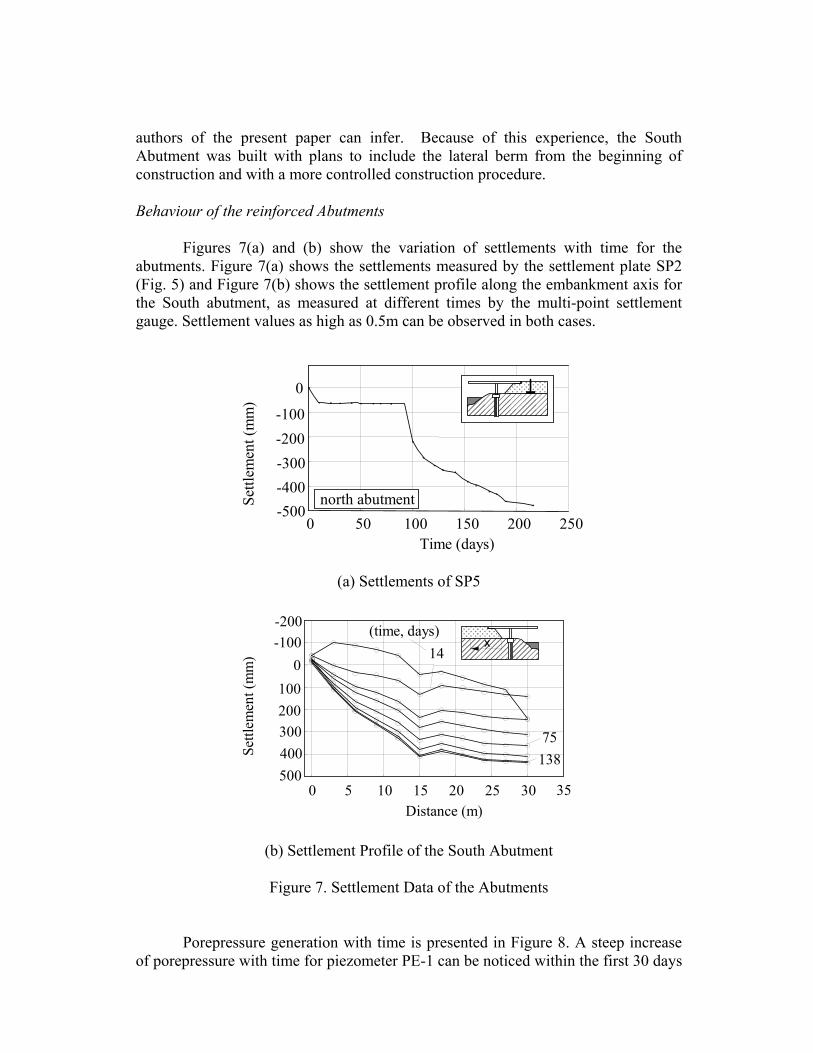
Figures 9(a) and (b) show the horizontal displacements measured by inclinometers I3 and I4, in the North abutment (Fig. 5), respectively. Inclinometer I3 was installed at mid length of the embankment slope of the North abutment, facing the channel, and inclinometer I4 was installed at the crest of the side slope (Fig. 5). The pattern of horizontal displacement was similar in both cases, with the largest displacements occurring at the surface of the soft soil. The results also show that the fast construction of the embankment caused much larger horizontal displacements (of the order of 20 cm) along the direction normal to the embankment axis (I4) than along the direction of the embankment axis (I3). This can be explained by the fact that the embankment axis direction coincided with the stiffest direction of the reinforcement, as commented before. Therefore, the reinforcement was capable of reducing the horizontal displacement along that direction, in contrast to what was observed in the transverse direction. The horizontal displacements measured by inclinometers I1 and I2 in the South abutment are presented in Figures 10(a) and (b), respectively. It should again

be pointed out that because the side slope of the North abutment almost failed, the South abutment was built with the side berm from the beginning of construction. For this reason the horizontal displacements in I2 are significantly smaller than in I1. ��������������������
0 1 2
1.82.38
-2
02
4
68
1012
z (m
)
Horizontal displacement (cm)
������������������������������������������������������������
���������������
��������������������������������������������������������������������������������
fill
soft clay
sand
1.5
������������������������������
������
I3
3
(a) Inclinometer I3
��������
softclay
2.20
Horizontal displacement (cm)0 5 10 15 20 25
����������������������������������������������������������������������������
������������������������������������������������������������
fill
sand
2.80
3.26
embankment height (m)
��������
��������������������������������������������������
���������������������������
I4
z (m
)
0
5
10
2.20 3.26
(b) Inclinometer I4
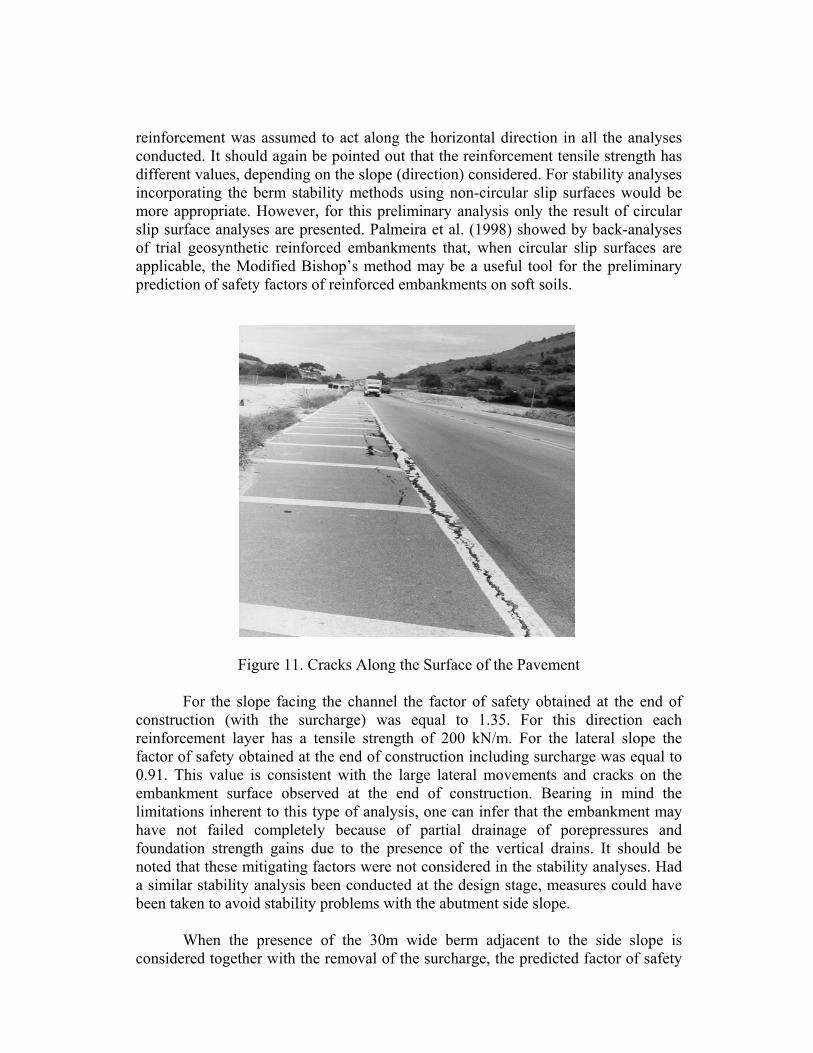
Figure 9. Horizontal Displacements in the North Abutment Figure 11 shows cracks observed along the border of the old embankment that were caused by the settlement of the new embankment. Cracks with openings up to 6 cm wide were observed. As it could be seen in Figure 4, one of the new embankments extremities rested on the old embankment side slope. The consolidation settlements of the new embankment dragged the border of the old embankment down, causing tensile cracks along its surface.
����������������������������������������
0
3
6
9
12
15
18
�������������������������������������������
3.26
1.5
0 2 4 6 8
z (m
)
Horizontal displacements (cm)
(a) Inclinometer I1
0
2
4
6
8
10
2 1 0 -1
1.52.38
2.38
z (m
)
Horizontal displacement (cm)������
����������������������������������������������
����������������������������������������������������
I2
embankment height(m)
������������������������������������������������������������������
����������������
����������������������������������������������������������������������������������������
fill
soft clay
sand
(b) Inclinometer I(2)
Figure 10. Horizontal Displacements in the South Abutment
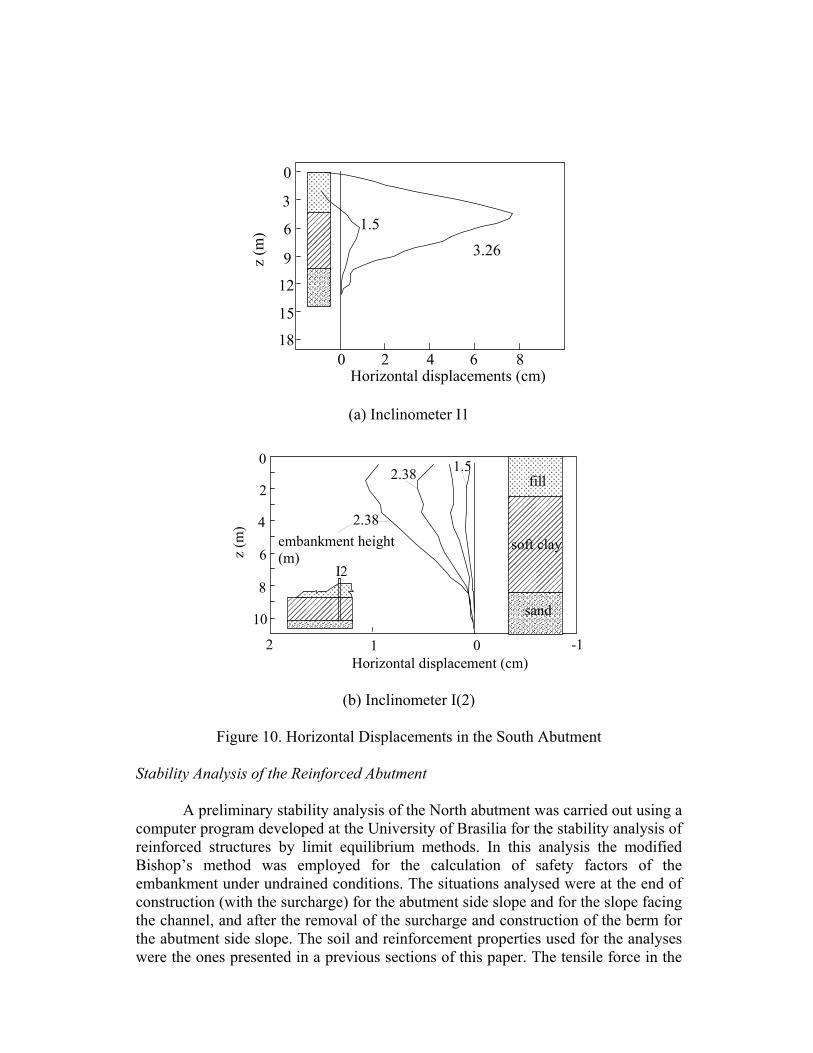
Stability Analysis of the Reinforced Abutment A preliminary stability analysis of the North abutment was carried out using a computer program developed at the University of Brasilia for the stability analysis of reinforced structures by limit equilibrium methods. In this analysis the modified Bishop’s method was employed for the calculation of safety factors of the embankment under undrained conditions. The situations analysed were at the end of construction (with the surcharge) for the abutment side slope and for the slope facing the channel, and after the removal of the surcharge and construction of the berm for the abutment side slope. The soil and reinforcement properties used for the analyses were the ones presented in a previous sections of this paper. The tensile force in the
reinforcement was assumed to act along the horizontal direction in all the analyses conducted. It should again be pointed out that the reinforcement tensile strength has different values, depending on the slope (direction) considered. For stability analyses incorporating the berm stability methods using non-circular slip surfaces would be more appropriate. However, for this preliminary analysis only the result of circular slip surface analyses are presented. Palmeira et al. (1998) showed by back-analyses of trial geosynthetic reinforced embankments that, when circular slip surfaces are applicable, the Modified Bishop’s method may be a useful tool for the preliminary prediction of safety factors of reinforced embankments on soft soils.
Figure 11. Cracks Along the Surface of the Pavement
For the slope facing the channel the factor of safety obtained at the end of construction (with the surcharge) was equal to 1.35. For this direction each reinforcement layer has a tensile strength of 200 kN/m. For the lateral slope the factor of safety obtained at the end of construction including surcharge was equal to 0.91. This value is consistent with the large lateral movements and cracks on the embankment surface observed at the end of construction. Bearing in mind the limitations inherent to this type of analysis, one can infer that the embankment may have not failed completely because of partial drainage of porepressures and foundation strength gains due to the presence of the vertical drains. It should be noted that these mitigating factors were not considered in the stability analyses. Had a similar stability analysis been conducted at the design stage, measures could have been taken to avoid stability problems with the abutment side slope. When the presence of the 30m wide berm adjacent to the side slope is considered together with the removal of the surcharge, the predicted factor of safety

of the side slope increases to 1.98. This is a significant increase in the safety factor and suggests that the berm width may be quite conservative. Figure 12 shows the variation of safety factor, of the lateral slope of the North abutment, with the berm width as a function of the presence of the surcharge. Assuming no significant reduction of soil strength caused by the embankment lateral movements, the results suggest that, in the case of surcharge removal, a 5m wide berm might have been enough to ensure the embankment stability with a safety factor of the order of 1.4. If the surcharge layer had been maintained, a berm 15m wide would have raised the safety factor to 1.3.
0 5 10 15 20 25 30 35Berm width, w (m)
0.8
1.0
1.2
1.4
1.6
1.8
2.0
2.2
Safe
ty F
acto
r
With Surcharge
Without Surcharge
��������
������������������������������������������������������w
Figure 12. Effect of Berm Width on the North Abutment Lateral Slope Safety Factor. Conclusions This paper described the behaviour of reinforced abutments on soft soils built close to an existing highway embankment and bridge. The results obtained from the instrumentation installed showed that the orientation of the stiffer and stronger reinforcement layer direction preferentially along the embankment axis in combination with a high rate of embankment lifting almost caused collapse of the side slope of one of the North abutment. The designers had to avoid failure by building a berm along the side slope. However, this occurrence made it possible to observe that the presence of the reinforcement layers significantly reduced the lateral displacements of the foundation soil. The behaviour of the abutments also emphasises the need for correct specification of reinforcement type and orientation and due care regarding anisotropy of reinforcement strength and stiffness as well as the need for controlled construction. The presence of the reinforcement layers effectively minimised the damages caused to the existing structures because of the reduction of horizontal displacements.
A preliminary stability analysis was also conducted and suggests that the instability of the abutment North side slope could have been anticipated and that the berm width adopted for its stabilization was conservative. References Fahel, A.R.S. (1998). “Instabilities and construction problems in geosynthetic
reinforced structures on soft soils.” MSc Thesis, University of Brasilia, Brasilia, Brazil (in Portuguese).
Palmeira, E.M., Pereira, J.H.F. and Silva, A.R.L. (1998). “Back-analyses of geosynthetic reinforced embankments on soft soils.” Geotextiles and Geomembranes, 16(5), 273-292.
Palmeira, E.M. and Fahel, A.R.S. (1999). “Lessons learned from failures of wall facings in two geotextile reinforced bridge abutments.” Book on Lessons Learned from Failures, Editor: J.P. Giroud (in press).