Geochemical signature of historical mining: Fowey Estuary, Cornwall, UK

EnvironmentalScienceProcesses & Impacts
PAPER
Behaviour and m
aCentre for Radiochemistry Research, Sc
Manchester, Manchester, M13 9PL, UK. E-mbCollege of Science, Department of Chemistr
Abha, Saudi ArabiacChemistry and Nuclear Physics Institute, At
Khartoum, SudandNational Nuclear Laboratory, 5th Floor
Birchwood Park, Warrington, WA3 6AE, UK
† Electronic supplementary informa10.1039/c4em00230j
Cite this: Environ. Sci.: ProcessesImpacts, 2015, 17, 235
Received 20th April 2014Accepted 2nd December 2014
DOI: 10.1039/c4em00230j
rsc.li/process-impacts
This journal is © The Royal Society of C
obility of U and Ra in sedimentsnear an abandoned uranium mine, Cornwall, UK†
Saifeldin M. Siddeeg,*abc Nicholas D. Bryand and Francis R. Livensa
Sediment samples were collected from the vicinity of the abandoned South Terras uranium mine in south-
west UK and analysed for uranium and 226Ra to explore their geochemical dispersion. The radioactivity
concentrations in the sediment samples were measured using alpha spectrometry for uranium, and
gamma spectrometry for radium. Sequential chemical extraction was applied to selected sediments in
order to investigate the speciation of the radionuclides and their association with stable elements. The
activity ratio of the uranium isotopes was used to explore the mobility of uranium, and scanning electron
microscopy (SEM) and electron microprobe analysis (EMPA) were used to characterise the sediments.
The radiochemical results identified two locations with enhanced radioactivity, so two samples from
these locations were further investigated. The geochemical distribution of the radionuclides in these two
samples varies within the five operationally-defined fractions. In one sample, the majority of the uranium
was released from the ‘carbonate’ fraction, followed by the organic fractions. Similarly, in the second
sample, the uranium was mainly resealed from the carbonate fraction, although a considerable
percentage associated with the resistant fraction. The fractionation trend of radium noticed to show
some similarities to that of barium, as expected from the similarity in their chemistries. Geochemical
distributions of the stable elements, such as Mn, Ti and As, were different in the enhanced radioactivity
samples. The activity ratio of 234U/238U shows different trends in the two sediments, signifying the
impact of organic matter and/or the exchange between water and sediment. SEM and EMPA analysis
identified uranium-bearing phases in association with potassium, calcium, iron, manganese and arsenic.
Environmental impact
Different compartments, such as water, food and air, if contaminated can affect human health. Following the industrial revolution, the relationship betweenlocal geochemistry and actual intake of chemicals play a vital role in mobility of contaminants in the environment. As uranium present a chemical andradiological hazard, it is important to investigate its distribution in specic locations such as former uranium mining areas. The study targets South Terrasabandoned uranium mine, Cornwall, UK as a natural analogue to explore the fate of natural radionuclides. Uranium and radium have been geochemicallycharacterised in sediments collected from the vicinity by different techniques. The work will be of interest to a wide range of the scientic community, includingenvironmental chemists, radiochemists and geochemists.
1. Introduction
Natural decay series radionuclides show elevated concentra-tions in all igneous rocks.1 Therefore, regions with acid igneousrocks, such as granite, are oen of interest as potential uraniummining areas. Following mining and milling, large amounts of
hool of Chemistry, The University of
ail: [email protected]
y, King Khalid University, P.O. Box 9004,
omic Energy Commission, P.O. Box 3001,
, Chadwick House, Warrington Road,
tion (ESI) available. See DOI:
hemistry 2015
waste containing isotopes from the uranium decay chain areproduced and dumped in spoil heaps and mill tailings.2 Thetailings le behind hold most of the radium from the ore, as aco-precipitate with barium or lead, usually associated with negrained material in the waste. Alpha emitters, such as 238U,234U, 230Th and 226Ra, are the most important isotopes in theradiological assessment of many former uranium mininglocations worldwide.3–6 Accordingly, continuous radiologicalsurveillance of these sites is required, even aer cessation, tomonitor radioactivity in waste piles and spoil heaps.
The south-west of the UK, with its scattered granitic intru-sions, has a rich history of mining activities.7 In the context ofradioactive deposits, the most signicant mine in Cornwall isthat at South Terras (50� 20.0480 N 4� 54.3110 W), which was theonly UK mine worked primarily for uranium and, subsequently,radium. The potential for uranium contamination of water and
Environ. Sci.: Processes Impacts, 2015, 17, 235–245 | 235

Environmental Science: Processes & Impacts Paper
sediment collected from the River Fal, which ows close to thevicinity of the mine, has been studied,8 and the results sug-gested that the uranium mine and spoil heaps at the mine werenot signicant sources of uranium in the river water. This wassupported by a correlation found between the total cationconcentrations and uranium in the surface water, thereby sug-gesting that uranium in the river water originated from rockweathering. Nevertheless, the concentration of uranium locallyin sediment beneath the outow pipe was relatively high, andreaching up to 1000 ppm.
Nearly a century aer the cessation of mining activities inSouth Terras, the spoil heaps can be used as a natural laboratoryin which to study the environmental geochemistry of thenatural radionuclides. The area is of particular interest due tothe retention of the long-lived radionuclides and the presenceof a variety of minerals and the associated stable metals.7
Therefore, surface sediments in the River Fal are of interestfrom a radiological and toxicological perspective.
The aim of this study is to use the disused uranium mine atSouth Terras to explore the behaviour of the natural radionu-clides associated with the uranium mining activities, mainly238U, 234U and 226Ra, in particular by means of:
� Quantifying the distribution of natural radionuclidesassociated with uranium mining, namely 238U, 234U and 226Ra.
� Characterising sediments with elevated radionuclidecontents to investigate the geochemical associations andmobility of the radionuclides.
� Identifying factors affecting this transport, such asadsorption to organic matter, association with differentgeochemical phases within the sediments, relationship withtrace elements.
2. Materials and methods2.1 The study area and sampling
In the south-west region of the UK, Cornwall's high-temperature(300–500 �C) veins, oriented NE-SW and associated with diverseand complex mineralisation, have been exploited for differentelements, including copper, tin, iron and lead. Other low-temperature veins (100–300 �C) cross the high-temperatureveins. These contain a small amount of pitchblende, and havebeen explored for cobalt, nickel, iron, lead, uranium and then forradium.9 At South Terras, uranium was excavated mainly frompitchblende (U3O8) and uraninite (UO2) as primary ores, butsecondary minerals, such as autunite [Ca(UO2)2(PO4)2$10H2O],zippeite [(UO2)3(SO4)2(OH)2$8H2O] and metatorbernite[Cu(UO2)2(PO4)2$8H2O], were reported to be common in thearea.9
The area around the abandoned mine is now covered byvegetation. It can be noticed that plants had grown in the minedebris and heaps of waste materials have been reshaped byerosion. Twenty surface sediments were collected by hands at adepth approximately at 5–10 cm beneath the surface wateralong an approximately 2 km stretch of the valley of the RiverFal, running south from the South Terras mine site (Fig. 1).They were saved in Kra envelopes for further analysis in thelaboratory, where they were wet sieved through a 2 mm sieve
236 | Environ. Sci.: Processes Impacts, 2015, 17, 235–245
and then air dried. Once dry, they were disaggregated using amortar and pestle and homogenised to be suitable for chemicaltreatment.
2.2 Physicochemical properties of the sediments
Organic matter (OM) content was estimated from loss on igni-tion.10 A porcelain crucible was ignited at 550 �C for 30 minutesin a muffle furnace, then allowed to cool in a desiccator andaccurately weighed. From the bulk dry sediments, 1.0–2.0 g wasplaced in the crucible and weighed accurately, then transferredto a muffle furnace and heated to 550 �C for 5 hours. The hotcrucible, containing the residue, was placed in the desiccatorand cooled to ambient temperature. The crucible containingthe ashed sediment was weighed accurately and the loss onignition as a percentage was calculated.
2.3 Mineral identication using X-ray diffraction
The dry sediments were sieved through 80 mesh to obtain thesediment fraction with 0.177 mm11 and a suitable amount (�0.5g) of each sample was placed on the sample holder. A smooth,at surface was obtained using a glass slide, before placing thesample in the specimen position of the XRD. Mineral identi-cations were made using a Bruker D8 Advance diffractometer.The X-rays were generated from a Cu X-ray tube (Ka with awavelength of 0.152 nm, current 30 mA at 40 kV) and theinstrument is equipped with a standard scintillation detector.The scanning angle for the specimen was set from 5� to 75� witha step size of 0.02� s�1 and an exposure time of 30 minutes.Phase identication was performed using the Bruker Eva 14,version 2008 pattern analysis tool.
2.4 Radioactivity content in sediments
2.4.1 Sediment dissolution. For total dissolution of thesediments, another part of the sediment was ashed at 550 �Cand a fraction of 0.2 g of the ashed sediment was placed in aclosed vessel and wetted overnight with a mixture of 1.0 mldeionised water, 3.0 ml conc. HNO3 and 6.0 ml conc. HF. Thesample was then digested in a microwave oven with rampingtime 10 minutes to 140 �C (�150 psi) and 50 minutes holdingtime, and this was repeated three times before evaporation.Finally, 2.0 ml of 3.2 M HNO3 was added to the residue and thevolume was made up to 20 ml with deionised water.
2.4.2 Uranium separation. The uranium separation wasbased on extraction chromatography methods.12,13 For totaldissolution, approximately 40 mBq of 232U tracer solution wasadded to a suitable aliquot (�20.0 ml) of solution and thesolution brought to near dryness under a heat lamp. Then, 5.0ml conc. HNO3 was added to the residue and the solutionbrought to near dryness under a heat lamp. The residue wasdissolved with 10.0 ml of 3.0 M HNO3/1 M Al(NO3)3 and theresultant solution was centrifuged at 3000 rpm (about 6500 g)for 10 minutes.
An extraction chromatography column (UTEVA, 2.0 ml pre-packed column; Eichrom resin, Triskem, France) was pre-conditioned with 5 ml 3.0 M HNO3 before loading the solution.The beaker was washed with 5.0 ml 3.0 M HNO3 and the wash
This journal is © The Royal Society of Chemistry 2015

Fig. 1 Cornwall map showing the sampling points along the river Fal.
Paper Environmental Science: Processes & Impacts
was passed through the column. Then the column was rinsedwith consecutive additions of 5.0 ml of 3.0 M HNO3, 5.0 ml of9.0 M HCl and 20.0 ml of 5.0 M HCl in 0.05 M H2C2O4. All theseeluates were discarded and, nally, uranium was stripped with
This journal is © The Royal Society of Chemistry 2015
15.0 ml of 1.0 M HCl. The eluent was evaporated to near drynessfor electrodeposition in the presence of 1.0 ml 10% (w/v) KHSO4
using a heat lamp.
Environ. Sci.: Processes Impacts, 2015, 17, 235–245 | 237

Table 1 The measured and the recommended values of 226Ra and238U in IAEA-314 stream sediment reference material (�1s countingstatistics uncertainties)
226Ra Bq kg�1 238U mg kg�1
Measured 774 � 24 57.8 � 0.9Recommended 732 56.895% condence interval 678–787 52.9–60.7
Environmental Science: Processes & Impacts Paper
For uranium electroplating, 2.5 ml of 5 wt% NaHSO4, 2.0 mlof deionised water and 5.0 ml of 15.0 wt%Na2SO4 were added tothe residue of the puried uranium fractions and heated gentlyuntil the residue dissolved. The solution was transferred to anelectrodeposition cell and rinsed in with 3.0 ml deionised water,then 1.0 ml of 20.0 g L�1 (NH4)2C2O4 plating solution wasadded. The current was adjusted to 0.5 A for 5 minutes and thento 0.75 A for 90 minutes. One minute before the end, 2.0 ml of25.0 wt% KOH was added and the power was turned off. Thesolution was discarded and the cell was washed with 2.0 ml 5.0wt% NH4OH.
Finally, the stainless-steel disc was rinsed consecutively witha small volume of 5.0 wt% NH4OH, ethanol and acetone beforebeing dried on a hotplate at 200 �C for 5 minutes.
The whole radiochemical separation method was validatedusing blank samples (deionised water spiked with the tracer)and the IAEA RM-314 reference material. The method was alsotested using standard additions, in which a known amount of238U was added to three duplicate samples and then the sepa-ration was performed.
2.4.3 Total radium in sediments. Total radium in thesediments was measured using gamma spectrometry with ahigh purity germanium (HPGe) detector. Sample preparation isrelatively straightforward. To avoid the escape of 222Rn gas, thesamples were sealed in a double polypropylene container andput aside for four weeks to reach secular equilibrium (with acondence of 1%) between 226Ra, 222Rn, 214Bi and 214Pb. Thesamples were then counted for 12 hours, and the specicactivity of 226Ra was estimated from measurements of the 214Bigamma line at 609 keV and the 214Pb gamma line at 352 keV.
2.5 Quality control
The analysis conducted, either for the total or the leachedfraction (aqua regia), of the radionuclides was tested by regularquality control methods. The radiochemical separation wasvalidated using blank solutions spiked with the tracer, standardadditions and a standard reference material (IAEA-314). Theblank analyses always gave less than 5 counts in each uraniumregion of interest, whereas all the sample analyses are based onsignals of at least several hundred counts. In the standardadditions, where a known amount of 238U was added to threeduplicate samples and then the separation was performed onthe two samples, the measured uranium recoveries were 92 �12%, 116 � 17% and 87 � 11% of the added uranium. Thehigher recovery with its counting error may indicate contami-nation and/or instrumentation error for this sample. Referencematerials are used to verify the accuracy and overall perfor-mance of the analysis. They are chosen to closely match thematrix and analyte concentration of interest, so IAEA-314 sedi-ment reference material was analysed for this purposes. Theobtained results for the IAEA-314 were close to the recom-mended values, as can be seen in Table 1.
2.6 Sequential chemical extraction
The method used in this study to determine the speciation ofradionuclides in the sediments with the highest uranium
238 | Environ. Sci.: Processes Impacts, 2015, 17, 235–245
content, S3 and S7, was the one that had been optimized forquantication of actinides in an organic-rich soil (approxi-mately > 10%). The only modication was using aqua regiainstead of the strong acids (HClO4/HF) to avoid completeoxidation of organic matter and dissolution of silica, becausethe interest is to examine radionuclide and heavy metalmobility rather than obtaining the total concentrations in theresidual fraction.
All reaction steps were performed in duplicate in 50.0 mlpolyethylene centrifuge tubes with a solid/reagent ratio of1.0 g/15.0 ml.14 The reagents and conditions for each step aregiven in ESI (Table S1†). At the beginning of the method, 1.0 gsample was wetted overnight with water before conducting theextraction steps. To separate the extract solution following eachextraction step, the samples were ltered through 0.22 mm lterand centrifuged at 4500 rpm/20 minutes. The solid residue wassaved for later steps and uranium and radium were determinedin the solutions. To the solutions, tracers 232U (�70 y) foruranium and 225Ra (�15 d), in equilibrium with the parent229Th (�7340 y), for radium, were added before evaporation todryness using a heating lamp, and uranium and radium sepa-ration was performed.
Uranium was separated using extraction chromatography ona UTEVA column similar to the total dissolution, while the nextsection describes the method of radium separation.
Radiochemical separation of radium was modied from thedescribed method15 using 150 mBq 225Ra, in equilibrium withthe parent 229Th, as a radiotracer. Care was taken to ensurequantitative transfers until the point of Ra separation, whichwas achieved by adding 50.0 ml 0.1 M HNO3 to the treatedfraction from the sequential extraction, then coprecipitating Rawith PbSO4 by adding consecutively 1.0 ml of concentratedH2SO4, 2.0 g K2SO4 and 1.0 ml of 0.24 M of Pb(NO3)2. The solidwas centrifuged in a 50.0 ml tube at 3000 rpm (�6200 g) for 10.0minutes, and then washed with 20.0 ml of a mixture of 0.2 MH2SO4/0.1 M K2SO4.
The precipitate was dissolved in 5.0 ml of 0.1 M ethyl-enediaminetetraacetic acid (EDTA)/NH4OH (pH 10), passedthrough an anion exchange column (Bio-Rad AG1-X8, 100–200mesh, chloride form, 5 � 0.5 cm) to remove sulphate andwashed with 13.0 ml 0.01 M EDTA/NH4OH. To the eluate Th, 1.0ml 5.0 M CH3COONH4 was added (pH 4.5) and the solution waspassed through a cation exchange column (Bio-Rad AG50W-X12, 200–400 mesh, 8.0 � 0.7 cm) at a ow rate of 1.0 mlminute�1. The column was previously conditioned with 15.0 ml1.5 M CH3COONH4 followed by 15.0 ml 0.25 M CH3COONH4.Another 50.0 ml 1.5 M CH3COONH4/0.1 M HNO3 was passed
This journal is © The Royal Society of Chemistry 2015

Table 2 Samples locations, U-isotopes and Ra specific activities (Bq kg�1 dry weight) and isotopic ratios in 20 sediment samples collected fromlocations around the River Fal and side streams in Cornwall (�1s counting statistics uncertainties)
ID 238U 234U 226Ra 234U/238U 226Ra/238U Latitude (N) Longitude (W)
S1 230 � 12 181 � 10 293 � 15 0.79 � 0.06 1.27 � 0.09 50� 19.8610 4� 54.2480
S2 290 � 14 260 � 13 424 � 23 0.90 � 0.06 1.46 � 0.10 50� 19.8630 4� 54.2570
S3 1820 � 36 1388 � 32 940 � 53 0.76 � 0.02 0.52 � 0.03 50� 19.8560 4� 54.2480
S4 43 � 5 44 � 5 55 � 6 1.02 � 0.18 1.28 � 0.20 50� 19.8090 4� 54.2740
S5 49 � 6 55 � 6 68 � 8 1.12 � 0.19 1.39 � 0.23 50� 19.8100 4� 54.2720
S6 160 � 10 127 � 9 220 � 12 0.79 � 0.08 1.38 � 0.12 50� 19.8090 4� 54.2750
S7 4350 � 53 4265 � 52 1765 � 48 0.98 � 0.02 0.41 � 0.01 50� 20.0140 4� 54.3300
S8 95 � 8 104 � 8 116 � 11 1.09 � 0.13 1.22 � 0.15 50� 20.0590 4� 54.3440
S9 43 � 5 39 � 5 75 � 7 0.91 � 0.16 1.74 � 0.26 50� 20.1030 4� 54.3210
S10 51 � 5 57 � 5 61 � 5 1.12 � 0.14 1.20 � 0.15 50� 19.5590 4� 54.2590
S11 40 � 6 40 � 6 61 � 5 1.00 � 0.19 1.53 � 0.24 50� 19.5590 4� 54.2600
S12 39 � 5 35 � 5 194 � 16 0.90 � 0.17 4.97 � 0.75 50� 19.5580 4� 54.2600
S13 44 � 5 54 � 6 72 � 7 1.23 � 0.20 1.64 � 0.26 50� 19.5470 4� 54.2330
S14 50 � 6 49 � 6 67 � 6 0.98 � 0.16 1.34 � 0.19 50� 19.5500 4� 54.2330
S15 49 � 6 52 � 6 60 � 5 1.06 � 0.18 1.22 � 0.18 50� 19.0140 4� 54.3300
S16 44 � 6 42 � 6 53 � 4 0.95 � 0.18 1.20 � 0.19 50� 19.3590 4� 54.0190
S17 13 � 3 16 � 4 42 � 4 1.23 � 0.39 3.23 � 0.80 50� 19.3710 4� 54.0100
S18 43 � 6 42 � 6 62 � 5 0.98 � 0.18 1.44 � 0.21 50� 19.4220 4� 54.0970
S19 41 � 5 40 � 5 53 � 4 0.98 � 0.19 1.29 � 0.22 50� 19.7010 4� 54.2860
S20 73 � 7 66 � 6 51 � 4 0.90 � 0.12 0.70 � 0.09 50� 20.1380 4� 54.3520
Paper Environmental Science: Processes & Impacts
through this column to remove Pb and Ac, while Ba was elutedby washing the column with 40.0 ml 2.5 M HCl. Finally, Ra waseluted with 25.0 ml 6.0 M HNO3, and this solution was evapo-rated to dryness using a heating lamp.
The electrolysis cell consists of two glass tubes (Sovril SV 30)joined with a SV 30 plastic joint. A polished stainless steelplanchette (cathode) was held between the two glass tubes by arecessed brass planchette mount supported by the lower elec-trode. The cell was sealed with a Teon ring and checked forleaking. A platinum wire anode, inserted in a narrow glass tube,was passed through a rubber bung into the electrolyte solutionto complete the electric circuit.
For radium electroplating, the Ra fraction was re-dissolvedin organic electrolyte solution (1.0 ml 0.1 M HNO3 in 9.0 mlethanol) and electroplated on to a stainless steel planchette at120 mA for 30 minutes. One minute before the end, 1.0 ml ofammonia (s.g. 0.88) was added and the power was turned off.The solution was discarded and the planchette was dried on ahotplate at 200 �C for 5 minutes.
2.7 Stable element analysis
The leachates from sequential extraction of the sedimentswith the highest uranium content, S3 and S7, were analysedusing inductively coupled plasma optical emission spectros-copy (ICP-OES) and inductively coupled plasma mass spec-trometry (ICP-MS), the latter applied where the concentrationswere low enough. For analysis of the sediment samples, 1.0 mlof each fraction obtained from the sequential extractionwas made up to 10.0 ml with 2% HNO3. The sampleswere run using a series of solutions prepared from certiedstandard solutions (1000 ppm, Sigma Aldrich, UK) for eachanalyte.
This journal is © The Royal Society of Chemistry 2015
2.8 Sediment characterisation
2.8.1 Heavy liquid separation. The heavy liquid separationtechnique was used to separate minerals in the sediments withthe highest uranium content, S3 and S7, based on density. Thesample was placed into a 50.0 ml centrifuge tube and a heavyliquid for density separation, LST Fastoat, which consists ofsodium heteropolytungstates dissolved in water to give adensity 2.80 � 0.02 g ml�1, was poured to half-ll the tube. Thetube was hand-shaken to mix the grains with the heavy liquid,thenmore LST was added until the tube was almost full, and leovernight to allow the minerals to separate. Once the mineralshad separated, the lower end of the centrifuge tube wasimmersed into a small container of liquid nitrogen until thebottom 1 cm of liquid was frozen. The unfrozen solution wasdecanted and ltered under gravity. Deionised water was usedcarefully to rinse out any minerals remaining in the tube, whileavoiding melting the frozen layer. The bottom layer was thenallowed to melt, and ltered under gravity, rinsing with deion-ised water. The ltered samples were rinsed 4–5 times withdeionised water to ensure removal of LST, and the lter paperswere placed inside an oven to dry at 100 �C.
2.8.2 Scanning electron microscopy. Two sedimentsamples with the highest radioactivity, S3 and S7, were selectedfor characterisation by the JEOL JSM-6400 scanning electronmicroscopy (SEM). Three subsamples (total sample, lightminerals and heavy minerals) were prepared. Each dry samplewas embedded on a glass slide using epoxy resin, and polishedto provide a homogeneous surface for analysis. The sampleswere carbon-coated so the samples were conductive, to preventcharging of the surface and to promote emission of secondaryelectrons. At the beginning of the analysis, backscatteredimages were obtained to localise heavy elements. This was
Environ. Sci.: Processes Impacts, 2015, 17, 235–245 | 239

Environmental Science: Processes & Impacts Paper
followed by obtaining secondary electron images from the nearsurface of the most interesting spots using a voltage of 15–20kV. In addition, the EDX Princeton Gamma Tech EDS systemwas used to perform semi-quantitative elemental analysis.
2.8.3 Electron microprobe analysis. The same two sedi-ment samples (S3 and S7) that were characterised by SEM werefurther analysed using a CAMECA SX100 electron microprobeanalyser (EMPA). Firstly, a backscattered image of a 100 � 100mm area of the sample was obtained, to locate higher atomicnumber elements. This was followed by selecting a single grain(typically 50 � 50 mm) for elemental mapping. In addition, theelemental composition (expressed as the oxides) of 21 majorand trace elements was determined by energy-dispersive spec-troscopy at selected spots. During analysis, the accelerationvoltage was 15 kV, the beam current of the probe was 20 nA, andseveral appropriate standards were used for calibration.
The instrument is equipped with ve wavelength detectorsand it was also possible to use these to obtain elemental mapsusing wavelength-dispersive spectroscopy aer using suitablestandard materials. The 10 elements selected were divided intotwo groups. The rst group included U, Ca, Mg, Mn and Fe,while K, Cu, As, Sn and Pb were in the second group.
3. Results and discussion3.1 Physico-chemical properties of sediments
The bulk minerals identied by X-ray diffraction (XRD) and theorganic matter (OM) content calculated from the loss of ignitionare outlined in ESI (Table S2†). The OM content of the River Falsediment is much lower (1.0%) than that of the sedimentscollected from streams running towards the river. In somestreams, the OM content of the sediments is as high as 37%(S3), 25% (S2) and 21% (S7). Organic-rich sediments are alsoobserved in some streams emerging from adits (e.g. 29% in S12and 20% in S13) along the river course.
XRD is only useful in characterising crystalline minerals, sominerals with disordered structures will not give well denedpatterns. The mineralogical composition of the bulk samplesreveals that quartz is the main component of all sediments, asexpected in stream sediments. In addition muscovite, kaolinite,
Fig. 2 Extraction profile of uranium as a percentage of the sum of fivefractions in S3 and S7.
240 | Environ. Sci.: Processes Impacts, 2015, 17, 235–245
rutile and schorl are identied in all samples. It is important tonote that the lowest percentage of quartz was found in thesample with the highest uranium content (S7), and the highestproportion of phyllosilicate minerals (muscovite and kaolinite).Minor dolomite and chlorite were also identied, addition tojarosite (found in one sample coming from an adit). Overallthough, the results from XRD suggest no substantive differencein bulk sediment composition, whether for those collected fromthe main river or from the side streams.
3.2 Radiochemical characterisation of sediments
The specic activities and activity ratios of the natural radio-nuclides 238U, 234U and 226Ra in the sediment from the River Faland streams around South Terrasmine are presented in Table 2.
The sample located about 100m upstream (S20) was selectedto provide a background level for the sediments in the River Fal.This point shows negligible inuence from the mine on theuranium activity (73 Bq kg�1), while the concentration ofradium is 51 Bq kg�1. Moreover, the ratios of 234U/238U and226Ra/238U in S20 are close to those observed far from uraniummines.16 The highest concentrations of the radionuclides arefound in the sediments collected downstream, about 135 msouth of the mine building (S7). The values are up to 4350, 4265and 1765 Bq kg�1 for 238U, 234U and 226Ra, respectively. Theratio between the two uranium isotopes, within 1s, is aroundone, indicating equilibrium. This is probably because theparent materials of these sediments released from the old mineheaps and are relatively new, which initially had 234U/238Uactivity ratio near 1.0 and has not been subjected to muchleaching of 234U since its deposition.
At a distance of about 425 m downstream, the concentra-tions of the radionuclides vary in the small streams drainingtowards the River Fal. For samples S1 and S2, the specicactivities of 238U are 230 and 290 Bq kg�1. These samples weredepleted slightly in the daughter, 234U, compared with theparent, 238U. However, within the same area, sample S3 dis-played 238U content of 1820 Bq kg�1, with a similar depletion in234U as S1 and S2. In addition, the 226Ra shows a specic activity
Fig. 3 Extraction profile of radium as a percentage of the sum of fivefractions in S3 and S7.
This journal is © The Royal Society of Chemistry 2015

Fig. 4 234U/238U activity ratios in the sequential extraction fractions of S3.
Paper Environmental Science: Processes & Impacts
higher than the background in the sediments from thesestreams, with a value of 940 Bq kg�1 at S3.
For the remainder of the samples, with the exception of the226Ra level in S6 and S12, the sediments in the River Fal seem todisplay local background levels (range 42 to 115 Bq kg�1 withmean value 64 Bq kg�1). Since sediments can indicate thesource of contamination in an area, the results from the RiverFal suggest that the South Terras mine has no signicantradiological impact on the nearby water courses beyond adistance greater than 0.5 km from the mine buildings.
Fig. 5 234U/238U activity ratios in the sequential extraction fractionsof S7.
3.3 Sequential chemical extraction results
Elevated specic activities of 238U, 234U and 226Ra were observedin the two samples (S3 and S7) collected close to the mine site.In order to identify the association of the radionuclides with thedifferent geochemical fractions, sequential chemical extraction(SCE) was performed.
3.3.1 Fractionation in S3. The sequential extraction resultsof uranium (Fig. 2) showed that about 43% of the total uraniumwas associated with fraction 2, interpreted as the organic frac-tion, and around 55% of the uranium was extracted in fraction3, interpreted as the carbonate phase. Humic substancesstrongly bind high charged radionuclides, so complexation isexpected. However, in natural water this seems mostly withtrivalent actinides since carbonate complexes are more domi-nant with hexavalent actinides such as uranyl. Therefore,carbonate species, most commonly CaCO3, represent an effec-tive uranium control agent since uranyl ion forming a solublecomplexes ion with carbonate ions.17,18 These two fractionsrepresent about 95% of the uranium released in all fractions,except resistant, suggesting strong retention of uranium byadsorption to organic species and/or incorporation intocarbonates.
This journal is © The Royal Society of Chemistry 2015
For radium, as can be seen in Fig. 3, about 70% was found tobe associated with fraction 2, the organic fraction, while about15% was released in fraction 3, the carbonate fraction, and only10% was released in fraction 1, the exchangeable fraction. Thismay be linked to the higher organic matter (37%) in thissediment.19
3.3.2 Fractionation in S7. Around 60% of the total uraniumwas extracted in fraction 3, the carbonate fraction (Fig. 2), thesame as S3, while 25% of the uranium was extracted fromfraction 5, the resistant fraction and only about 15% fromfraction 2, the organic fraction.
This is again consistent with the proposed associationbetween uranium and carbonate phases. However, compared tosample S3, a higher percentage of uranium was present in theresidual fraction, fraction 5, suggesting the presence of primaryU-minerals in S7.
Environ. Sci.: Processes Impacts, 2015, 17, 235–245 | 241

Environmental Science: Processes & Impacts Paper
For radium, 60% was found to be associated with fraction 2,the organic fraction, and 20% was released in fraction 5, theresidual fraction (Fig. 3). In contrast to S3, part of the radiumappears to be associated with a resistant phase, rather thanprimarily controlled by adsorption. This would be reasonable,given the presence of uranium in the residual fraction andtherefore the potential for in situ generation of radium.
3.4 Radionuclide and stable element fractionation
Comparing the geochemical distribution of the stable elementswith the radionuclides in S3 and S7 could help understandingof distribution between the operationally-dened phases.Accordingly, geochemical fractionation of selected stableelements was undertaken in order to explore the most likelygeochemical host phases for uranium and radium in Cornwallsediments.
Calcium was associated mainly with the fractions 1 and 2(exchangeable and organic) fractions in both samples (ESIFig. S1†), with the majority of the calcium (�80%) in S7 boundto fraction 2 compared with only 60% in S3.
Manganese was also associated primarily with fractions 1and 2, the exchangeable and organic matter fractions, in S3,with nearly the same percentage in each fraction (ESI Fig. S2†).However, in S7 it was found in all fractions, with a relativelyhigher percentage (�40%) in fraction 2 (organic).
Fig. 6 Scanning electron microscope (SEM) results showing back-scattered electron (BSE) images (A) and electron-dispersive spec-troscopy (EXD) spectrum (B) of the bulk minerals of S3. The bright areais an indication of a presence of high atomic number elements.
242 | Environ. Sci.: Processes Impacts, 2015, 17, 235–245
Fractionation of titanium and iron are illustrated in ESI(Fig. S3 and S4†). In both samples, the majority of titanium(�90%) was released from fraction 5, the fraction leached bystrong acids. This is consistent with the classication of Ti as arefractory element,20 which, therefore, is expected to be boundto the resistant fraction. In both sediments, iron, same as tita-nium, was also found mainly in this fraction, with about 75%.
Arsenic was found to associate with fractions 2 and 3 of S7,with �60% in carbonate and �37% in organic (ESI Fig. S5†). InS3, it was more distributed towards the acid-resistant fractions,with about 30% in fraction 5, the resistant component.
Barium fractionation is very similar to that of Ra (ESIFig. S6†). In S3, it was attached predominantly to fraction 2;however, for S7 it was distributed in all fractions, with theexception of fraction 4 (Fe/Mn oxides), with a relatively higheramount (�40%) in fraction 5, the resistant fraction.
Comparing the geochemical fractionation of stable elementswith that of uranium and radium showed that, in both S3 andS7, the uranium distribution was quite different from that ofany stable elements. In both sediments, the fractionationprole of barium showed some similarities to that of radium, asexpected from the similarity in their chemistries.
3.5 Uranium isotopic ratios in sequential extractionfractions
The activity ratio between 238U and 234U isotopes was used toobtain information about the mobility of uranium between
Fig. 7 Scanning electron microscope (SEM) results showingsecondary electron (SE) images (A) and electron-dispersive spectros-copy (EXD) spectrum (B) of the bulk minerals of S3.
This journal is © The Royal Society of Chemistry 2015
Paper Environmental Science: Processes & Impacts
water-solid phases. This is because 234U is expected to be moreabundant in water relative to 238U, and the vice versa is expectedin sediment. The uranium isotopic activity ratio (234U/238U) inthe sequential extraction fractions of samples S3 and S7,excluding the exchangeable fraction, is shown in Fig. 4 and 5.
For S3, the results indicated that, within 1s, the 234U/238Uactivity ratios in fractions 2 (the organic fraction), 4 (Fe/Mnoxides) and 5 (the resistant) were within equilibrium, with theorganic the closest to unity; however, for the carbonate fraction,uranium isotopic ratios was clearly lower than unity. Asmentioned above, S3 has the highest OM content of all thesesediments (�40%) and OM plays an important role in retainingradionuclides. A possible reason for this higher 234U/238U in theorganic fraction compared with the other fractions is that theorganic fraction, which will include organic coatings on otherparticles, is more likely to be in contact with water, and there-fore has a great opportunity to adsorb uranium from water, withan activity ratio greater than unity.21
For S7, fractions 3, 4 and 5, the carbonates, Fe/Mn oxides andthe resistant, within 1s, revealed 234U/238U activity ratios withinequilibrium. However, the 234U/238U activity ratio in fraction 2,the organic, was ca. 0.8, indicating substantial disequilibrium.As discussed earlier, disequilibrium in sediments is interpretedas relating to the preferential leaching of 234U from the mineralgrain, compared with the parent 238U. Consequently, water isexpected to exhibit 234U/238U > 1, while sediment is expected to
Fig. 8 Scanning electron microscope (SEM) results showingsecondary electron (SE) images (A) and electron-dispersive spectros-copy (EXD) spectrum (B) of a single grain isolated from the heavyminerals separated by heavy liquid from the richest U-sample (S7). A Uassociation with P, Th and Ca (from the EDX analysis) has beenidentified.
This journal is © The Royal Society of Chemistry 2015
show 234U/238U < 1.22–24 In S7, which has the highest uraniumcontent of these sediments, the equilibrium 234U/238U ratio mayreect the presence of signicant primary Uminerals (hence therelatively high proportion of uranium in fraction 5, the resistantcomponent), and this material could contribute uranium tofractions 3 and 4, giving the same ratio. By contrast, the muchlower ratio in fraction 2 suggests a more complex process, forexample, may be, derivation of the uranium in this fractionfrom another source.25
3.6 Characterisation of sediments using spectroscopicmethods
3.6.1 Scanning electron microscopy. In the scanning elec-tron microscopy (SEM) analysis, the bright areas in a back-scattered electron image (BSE) indicate the presence of highatomic number elements, which could be uranium or otherheavy elements, such as Ti. However, the energy-dispersivespectroscopy (EDS) spectrum provides a semi-quantitativeanalysis of the area of interest which allows identication of theelement in the area. The identication of U-bearing particles inS3, without heavy liquid separation, is illustrated in Fig. 6 and 7.The BSE image identies a bright spot, as demonstrated inFig. 6, indicating the presence of heavy element-bearing parti-cles. The chemical composition of this bright area from EDSanalysis suggests the existence of trace amounts of uranium and
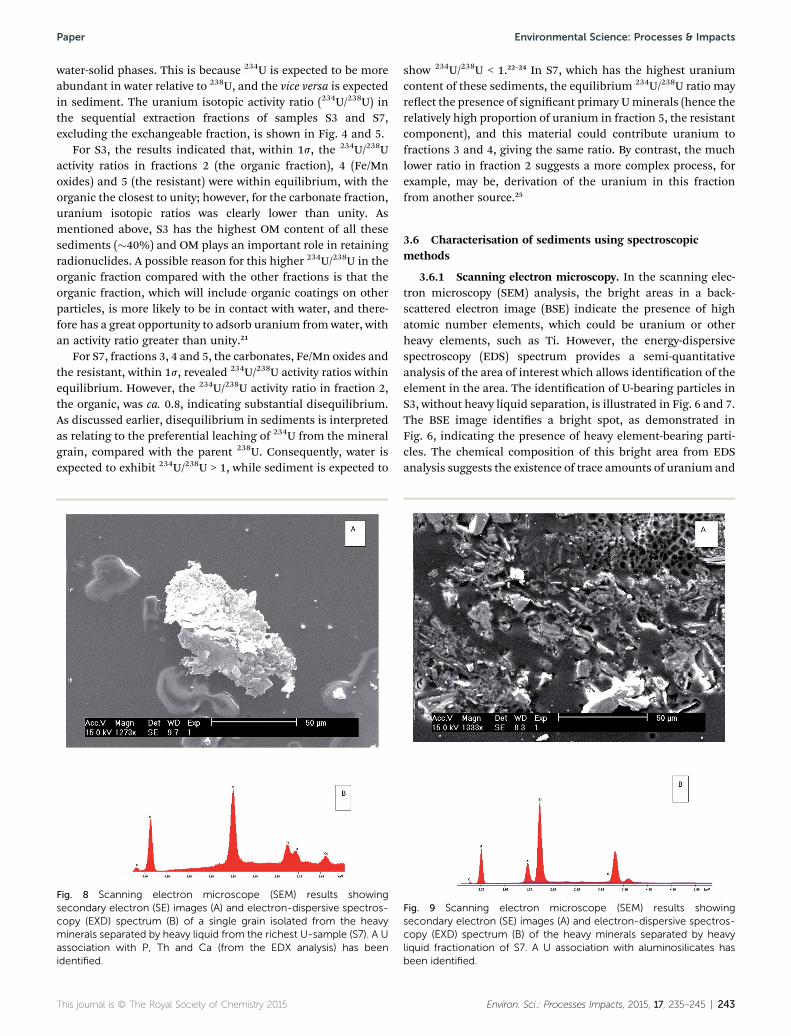
Fig. 9 Scanning electron microscope (SEM) results showingsecondary electron (SE) images (A) and electron-dispersive spectros-copy (EXD) spectrum (B) of the heavy minerals separated by heavyliquid fractionation of S7. A U association with aluminosilicates hasbeen identified.
Environ. Sci.: Processes Impacts, 2015, 17, 235–245 | 243

Fig. 10 Backscattered electron (BSE) image (top) and X-raymaps of elements (Mn, K, Fe, As, Ca and U) from electronmicroprobe analysis (EMPA)of the heavy mineral fraction from S7.
Environmental Science: Processes & Impacts Paper
other metals (Al, Si, P, K and Ca). As the scale of the area beingimaged becomes smaller (�20 mm), focusingmore on the brightarea (Fig. 7), the intensity of the uranium signal increases andthose of the associated elements decrease. By applyingsecondary electron (SE) analysis in combination with EDS onthis small scale, it is possible to localise an individual U-bearingparticle. Since the SE image is derived from low energy (<50 keV)electrons with limited penetrating ability, the uranium isexpected to be very close to the surface of the particle, possiblyin a coating layer.
The SEM/EDS results of the heavy minerals of S7, isolatedusing heavy liquid separation, revealed the presence of U-bearing particles, as presented in Fig. 8 and 9. The EDS spec-trum (Fig. 8) identied an association of uranium with P, Caand Th in one particle. The percentage of the oxides forms were(9.83%, 0.21%, 0.22%) respectively, compared with 0.18% ofuranium. In another particle (Fig. 9), the uranium was found to
244 | Environ. Sci.: Processes Impacts, 2015, 17, 235–245
associate with clay minerals (Al and Si). This may support thesequential extraction results, where a considerable amount(25%) of uranium in S7 was released from the residual fraction,while, for S3, only 1% of the uranium was released from samefractions.
3.6.2 Electron microprobe analysis. In an attempt to locateuranium hot spots in the minerals separated by heavy liquidfrom S3 and S7, EMPA was used for further characterisation. Asin SEM analysis, BSE imaging was used to identify areas withhigher atomic number elements relative to the adjacent areas.Wavelength-dispersive spectrometry (WDS) was used to createX-ray maps of 10 elements (K, Mg, Ca, Mn, Fe, Cu, As, Sn, Pb andU) in order to obtain the chemical distribution within the grainof interest. The result is presented in Fig. 10.
For S3, EMPA characterisation of the bulk minerals could notidentify uranium-rich grains. However, for S7, a grain from theheavy minerals separated by the heavy liquid was identied as
This journal is © The Royal Society of Chemistry 2015

Paper Environmental Science: Processes & Impacts
containing trace amounts of uranium-bearing minerals(Fig. 10). The WDS images suggested that the grain includes ahigher amount of K, Ca and Fe relative to U, As and Mn. Thepercentage of uranium oxide (wt% UO2) in this grain wasabout 1%.
4. Conclusions
Radioactivity around the former uranium mining site at SouthTerras is generally close to local background levels, with nosubstantial effect of the radionuclides on the River Fal, andenhanced concentrations of radionuclides only found in theimmediate area of the mine. The elevated activity at distancesless than 0.5 km could be related to the migration of particlesenriched in uranium from the mine location due to weathering.
Sequential chemical extraction, applied to the sedimentswith the highest radionuclide concentrations, revealed differentgeochemical fractionation of uranium and radium. Theuranium in the sediment with the highest organic matter wasmore closely associated with relatively labile fractions, particu-larly the organic and the carbonate fractions. Furthermore, thesample with the highest uranium revealed that although thecarbonate bound more of the uranium, a signicant portionwas held in the resistant fraction. Radium in both sedimentswas held primarily in the organic fraction but, in S7, the samplewith the highest radioactivity, signicant radium was also heldin the resistant fraction.
There was no clear association of the radionuclides and thestable elements in individual fractions, although there wereindications of an association with calcium, manganese andarsenic in the organic and the carbonate fractions.
The activity ratios of the uranium isotopes may suggest thatexchange between sediment/water could explain the ndings sofurther study, including measurements of the uranium isotopicratios in water samples, is recommended.
Using SEM, uranium-bearing particles have been localised inthe bulk minerals and the heavy minerals from the sedimentsenriched in uranium. EMPA results produced an X-ray map ofthe uranium, with associated stable elements, in a single grainobtained from the sample with the highest uranium content.
Acknowledgements
The authors greatly appreciate nancial support from theIslamic Development Bank (IDB), Jeddah, Saudi Arabia. Theauthors thank Mr Paul Lythgoe for ICP-OES/ICP-MS measure-ments, Mr Alastair Bewsher for IC analysis, Mrs Cath Davies fortotal dissolution of samples, Dr John Waters for SEM and DrJohn Charnock for EMPA analysis, all from School of Earth,Atmospheric and Environmental Sciences, University of Man-chester. The authors are grateful to the Boconnoc Estate forpermission to access the South Terras mine site, and to locallandowners for permission to access other locations.
This journal is © The Royal Society of Chemistry 2015
References
1 A. J. Plater, M. Ivanovich and R. E. Dugdale, Appl. Geochem.,1992, 7, 101–110.
2 F. P. Carvalho, J. M. Oliveira, I. Lopes and A. Batista, J.Environ. Radioact., 2007, 98, 298–314.
3 B. S. Marko Strok, J. Environ. Radioact., 2010, 101, 22–28.4 F. P. Carvalho and J. M. Oliveira, J. Radioanal. Nucl. Chem.,2007, 274, 167–174.
5 G. R. Hancock, M. K. Grabham, P. Martin, K. G. Evans andA. Bollhofer, Sci. Total Environ., 2006, 354, 103–119.
6 P. Blanco, F. V. Tome and J. C. Lozano, J. Environ. Radioact.,2005, 79, 315–330.
7 G. K. Gillmore, P. S. Phillips, G. Pearce and A. Denman,International radon symposium, 2001, pp. 94–105.
8 Y. Moliner-Martinez, P. Campins-Falco, P. J. Worsfold andM. J. Keith-Roach, J. Environ. Monit., 2004, 6, 907–913.
9 O. W. Purvis, E. H. Bailey, J. McLean, T. Kasama andB. J. Williamson, Geomicrobiol. J., 2004, 21, 159–167.
10 R. A. Sutherland, Hydrobiologia, 1998, 389, 153–167.11 G. G. Kipp, J. J. Stone and L. D. Stetler, Appl. Geochem., 2009,
24, 2246–2255.12 H. E. Carter, P. Warwick, J. Cobb and G. Longworth, Analyst,
1999, 124, 271–274.13 I. Eichrom Technologies 2001.14 M. K. Schultz, K. G. W. Inn, Z. C. Lin, W. C. Burnett,
G. Smith, S. R. Biegalski and J. Filliben, Appl. Radiat. Isot.,1998, 49, 1289–1293.
15 K. A. Smith and E. R. Mercer, J. Radioanal. Chem., 1970, 5,303–312.
16 J. C. Lozano, P. Blanco Rodrıguez and F. Vera Tome, J.Environ. Radioact., 2002, 63, 153–171.
17 N. G. Rachkova, I. I. Shuktomova and A. I. Taskaev, EurasianSoil Sci., 2010, 43, 651–658.
18 G. G. Kipp, J. J. Stone and L. D. Stetler, Appl. Geochem., 2009,24, 2246–2255.
19 D. J. Greeman, A. W. Rose, J. W. Washington, R. R. Dobosand E. J. Ciolkosz, Appl. Geochem., 1999, 14, 365–385.
20 M. K. Schultz, W. Burnett, K. G. W. Inn and G. Smith, J.Radioanal. Nucl. Chem., 1998, 234, 251–256.
21 M. J. Vargas, F. V. Tome, A. M. Sanchez, M. T. C. Vazquez andJ. L. G. Murillo, Appl. Radiat. Isot., 1997, 48, 1137–1143.
22 N. Vigier, B. Bourdon, E. Lewin, B. Dupre, S. Turner,G. J. Chakrapani, P. van Calsteren and C. J. Allegre, Chem.Geol., 2005, 219, 69–91.
23 N. Vigier, K. W. Burton, S. R. Gislason, N. W. Rogers,S. Duchene, L. Thomas, E. Hodge and B. Schaefer, EarthPlanet. Sci. Lett., 2006, 249, 258–273.
24 J. Riotte and F. Chabaux, Geochim. Cosmochim. Acta, 1999,63, 1263–1275.
25 S. M. Siddeeg, N. D. Bryan and F. R. Livens, Environ. Sci.:Processes Impacts, 2014, 16, 991–1000.
Environ. Sci.: Processes Impacts, 2015, 17, 235–245 | 245
Copyright © 2022 FDOKUMEN