Magnetic helicity fluxes in interface and flux transport dynamos
Upload
independentCategory
view
3download
0
ARTICLE IN PRESS
Applied Radiation and Isotopes 67 (2009) 345–356
Contents lists available at ScienceDirect
Applied Radiation and Isotopes
0969-80
doi:10.1
� Corr
E-m
journal homepage: www.elsevier.com/locate/apradiso
Behaviour and fluxes of natural radionuclides in the production processof a phosphoric acid plant
J.P. Bolıvar a, J.E. Martın a, R. Garcıa-Tenorio b, J.P. Perez-Moreno a, J.L. Mas c,�
a Department of Applied Physics, University of Huelva, 21071 Huelva, Spainb Department of Applied Physics II, University of Seville, 41013 Seville, Spainc Department of Applied Physics I, University of Seville, 41012 Seville, Spain
a r t i c l e i n f o
Article history:
Received 4 March 2008
Received in revised form
25 September 2008
Accepted 17 October 2008
Keywords:
Phosphoric acid
Activity balance
NORM
Radioactivity flow
43/$ - see front matter & 2008 Elsevier Ltd. A
016/j.apradiso.2008.10.012
esponding author.
ail address: [email protected] (J.L. Mas).
a b s t r a c t
In recent years there has been an increasing awareness of the occupational and public hazards of the
radiological impact of non-nuclear industries which process materials containing naturally occurring
radionuclides. These include the industries devoted to the production of phosphoric acid by treating
sedimentary phosphate rocks enriched in radionuclides from the uranium series.
With the aim of evaluating the radiological impact of a phosphoric acid factory located in the south-
western Spain, the distribution and levels of radionuclides in the materials involved in its production
process have been analysed. In this way, it is possible to asses the flows of radionuclides at each step and
to locate those points where a possible radionuclide accumulation could be produced. A set of samples
collected along the whole production process were analysed to determine their radionuclide content by
both alpha-particle and gamma spectrometry techniques. The radionuclide fractionation steps and
enrichment sources have been located, allowing the establishment of their mass (activity) balances
per year.
& 2008 Elsevier Ltd. All rights reserved.
1. Introduction
1.1. Background
Several phosphate processing plants are located on the south-western coast of Spain (on the outskirts of the town of Huelva),close to the estuary of the Odiel and Tinto rivers, wherephosphoric acid has been produced since 1968. The companyimports sedimentary phosphate ore (phosphate rock) containingaround 100–150 ppm of uranium, which mainly comes fromMorocco (Bolivar et al., 1996a). The phosphate is treated(dissolved) at these plants by mixing it with sulphuric acid toproduce phosphoric acid by the di-hydrate process. A by-productcalled phosphogypsum (mainly calcium sulphate), is also pro-duced during this process.
Until 1998, about 20% of phosphogypsum produced annuallywas discharged into the sea. The remaining 80% was pumped insuspension with sea water (20% phosphogypsum+80% seawater)and subsequently transported about 2 km away the factories, to bedisposed in large piles located in a salt-marsh area along the Tintoriver estuary. Until 1997, the sea water used for this transportationwas discharged into the estuary where the phosphogypsum piles
ll rights reserved.
were formed. At the start of 1998, direct discharges into the seawere banned following the OSPAR (1996) convention, with all thephosphogypsum stored in a pile in the town’s surroundings. Thefresh water used for its transportation had to follow a closedcircuit in order to avoid any impact on the estuarine ecosystem(Absi et al., 2005; Mas et al., 2006). Nowadays, a small fraction ofthe phosphogypsum produced (less than 10%) is used inagriculture as soil amendment for sodic soils (El-Mrabet et al.,2003).
The process for obtaining the phosphoric acid from thephosphate rock can be described schematically by the followingchemical reaction (Fertiberia, 2002):
Ca3ðPO4Þ2 þ 3H2SO4 ! 2H3PO4 þ 3CaSO4 þ 48:9 kcal
This reaction is exothermic and its magnitude is self-limited dueto the formation of an insoluble layer of calcium sulphate over thephosphate particles. To avoid this self-limitation, a high recircula-tion of the produced phosphoric acid is imposed to favour theconversion of phosphate rock in mono-calcium phosphate. Then,it reacts with the sulphuric acid to produce the phosphoric acidrequired:
Ca3ðPO4Þ2 þ 4H3PO4 ! 3CaðH2PO4Þ2
3CaðH2PO4Þ2 þ 3H2SO4 ! 6H3PO4 þ 3CaSO4

ARTICLE IN PRESS
J.P. Bolıvar et al. / Applied Radiation and Isotopes 67 (2009) 345–356346
The phosphogypsum (insoluble calcium sulphate) is separatedfrom the phosphoric acid by filtration. Phosphogypsum can beobtained in different crystalline forms depending on the tem-perature, concentration of the phosphoric acid and the amount offree sulphuric acid in the digesters (Rutherford et al., 1994). In theHuelva phosphoric acid plants, the process conditions induce theproduction of the phosphogypsum in the di-hydrate form,according to the following general reaction (Fertiberia, 2002):
Ca10ðPO4Þ6F2CO3Caþ 11H2SO4 þ 21H2O
! 6H3PO4 þ 11CaSO4 � 2H2Oþ 2FHþ CO2
In the Huelva phosphoric acid plants, around 1.5 million tonnes ofphosphate rock are treated annually, and some 500,000 ton ofphosphoric acid and 2.5 million tonnes of phosphogypsum areproduced. Phosphogypsum is an unavoidable by-product in theproduction of phosphoric acid by the sulphuric ‘‘wet-acid’’method, formed in the proportion 5–6 ton of phosphogypsumper ton of P2O5 produced.
1.2. Detailed description of the process
The process for the phosphoric acid production from Moroccanphosphate rock is identical in all the plants in Huelva. For thatreason, all the studies in this paper will concentrate on just one of
SILOS
HOPPERS BALL MILL
M1 M2
Fig. 1. Schematic diagram of the
22% P2O5 coming fromFiltration (Step 3)
Water to filtration(Step 3)
DILUTER DEPOSITA
DEPOSITB
1 2 3
REACT
Dilutingwater
Fresh water fromoutside the proces
H2SO498%
H2SO460%
MILLEDPR
A-9
A-1
A-2
A-6
A-8
Fig. 2. Schematic diagram of the pho
the plants. The industrial process can be divided in four differentsteps: (1) grinding and conditioning of the phosphate rock, (2)attack, or digestion, of the phosphate rock with sulphuric acid, (3)filtration, or phosphogypsum separation from the liquid fractionof phosphoric acid, and (4) washing of phosphogypsum by water.The phosphoric acid produced has a P2O5 concentration of 27%,which later rises to 54% through a concentration step byevaporation of a fraction of its water content.
Fig. 1 shows schematically the process used in the step ofconditioning and grinding of the phosphate rock (step 1). Thecommercial phosphate rock (transported to the factory by shipswith a granulometry in the range of 0–2 mm) is stored initially inbig silos. Then it is taken and transported by hoppers, which feeda ball mill where the grain size of phosphate rock is reduced until90% of the grinded material has a size less than 147mm and 60%less than 74mm. Finally, the grinded material is transported by anascendant air current of several cyclones, which discharge it inanother hopper that feeds the digesters where the phosphate rockis attacked.
Fig. 2 shows schematically the process used in the acid attackon the phosphate rock (step 2). In this phase of the process, thegrinded phosphate rock is dissolved with sulphuric acid diluted toa concentration of 60% with water. This water is mostly freshwater coming from outside the factory, although a small fractionoriginates in the process (Deposit A, see Fig. 2).
CYCLONS
FILTERSHOPPER
WEIGHINGMACHINE
M3
To Digester (Step2)
phosphate rock milling step.
Pulp to Filtration(Step 3)
CONDENSATOR/ WASHER
FLASH COOLER
4 5 6 7
ORS
Pulp
Vapours
Waters fromPG piles
Uncondensatedmaterial released to
atmosphere
s
Pulp
A-3 A-4A-5
A-7
sphate rock acid attack (step 2).

ARTICLE IN PRESS
Fig. 3. Schematic diagram of the phosphogypsum filtration and washing steps (steps 3 and 4, respectively).
J.P. Bolıvar et al. / Applied Radiation and Isotopes 67 (2009) 345–356 347
The reaction of the phosphate rock with the sulphuric acidtakes place in a reactor of seven compartments where thetemperature is maintained at 70–75 1C. To improve the chemicalreaction, some phosphoric acid, 22% obtained in the filtration step(step 3), is added, coming back through the process. The pulpproduced in the reaction is continuously mixed and circulatesfrom compartments 1 to 5. Then it passes to a flash cooler whereits temperature decreases and the dissolved gases are removed(the flash cooler works in vacuum conditions and the gases arecondensed in a condenser with the help of water previously usedin the management-disposal of the phosphogypsum). Once thepulp is cooled, it is transported to compartment 7 of the reactor(see Fig. 2), from where it is transported to the filtration processthrough the reactor 6 (step 3). The water used in the condensationof the gases produced in the reaction is stored in Deposits A and B(see Fig. 2) to be later reused during the process. In Deposit B,water which has previously been used in the management-disposal of phosphogypsum is also stored.
In Fig. 3, the process used for the filtration of the pulpproduced in the digestion step (step 3) and phosphogypsumwashing (step 4) is shown schematically. In this filtration process,the phosphoric acid is separated from the phosphogypsum using arotating filter system formed of 24 independent filtering trayswhich can tilt to discharge the phosphogypsum after its filtrationand washing. The rotating system (rotation along a vertical axiswhich is perpendicular to the trays) has a total filtration area of69 m2, and takes around 3 min to rotate 3601. The separation andwashing step is performed through filtering clothes, covering thesurface of the trays, by the vacuum generated by two largevacuum pumps.
The pulp coming from the reactor is placed on the trays, and ina first small suction (called ‘‘pre-suction’’) 27% P2O5 is extractedand stored in Deposit W (see Fig. 3). A second suction separatesthe production acid (27% P2O5) which is sent to Deposit X (seeFig. 3). Afterwards, the washing step of the pulp remaining on thefilter starts (formed mostly by phosphogypsum). Three successive
washings are used in order to extract the remaining phosphoricacid still in the phosphogypsum.
The first washing is carried out with PA at 12% P2O5 wherephosphoric acid with 22% P2O5 is obtained and stored in DepositW. The second washing is done with 5% P2O5 to produce 12% P2O5
which, after storage in Deposit Y (see Fig. 3), is used in the firstwashing. Thirdly, a final washing is performed with hot waterfrom Deposit C (see Fig. 3) to produce 5% P2O5, which is used inthe second washing following storage in Deposit Z (see Fig. 3).
Once the washings have finished, each tray rotates 1801 anddischarges the phosphogypsum over a ramp to be mixed withwater coming from the phosphogypsum piles (Deposit B, seeFig. 2) in Tank D. From this tank, the phosphogypsum–watermixture is sent to the phosphogypsum piles for the storage of thisby-product. The filtration process finishes with the washing of thefilter clothes using hot water (which is collected as waste wateralong the plant) from Deposit B. Such water is later stored inDeposit C to be used in the third washing step, and by rotating thetray back to its original position to start a new filtration cycle.
These suctions and washings are essential to obtain a highefficiency phosphoric acid in the filtration process. The objective isto obtain a phosphogypsum with a P2O5 content less than 0.5%,before it is sent to the storage stacks (Becker, 1989). In summary,phosphoric acid extracted in this filtration process is stored in fourdeposits. The Deposits Y and Z contain 12% and 5% P2O5,respectively, which is used in the same filtration process forwashing the pulp. Deposit W contains 22% P2O5 to be used in thereactors to improve the reaction of the phosphate rock with thesulphuric acid (see Fig. 2). Finally, Deposit X contains 27% P2O5
(production acid) which is sent to a final step of concentration forobtaining commercial acid (54% P2O5).
Indeed, the 27% P2O5 produced in the filtration step should beconcentrated up to 54% (step 5), since it is the normalconcentration needed for the fabrication of the most demandedphosphate fertilisers: monoamonium phosphate (MAP), diamo-nium phosphate (DAP), and complex fertilisers (NPK). This
ARTICLE IN PRESS
Tinto river
North PondSouthPond
Perimetral channel
Regulatory reservoirPipes from factory to the storage area
Huelva town
PumpingStation Perimetral wall
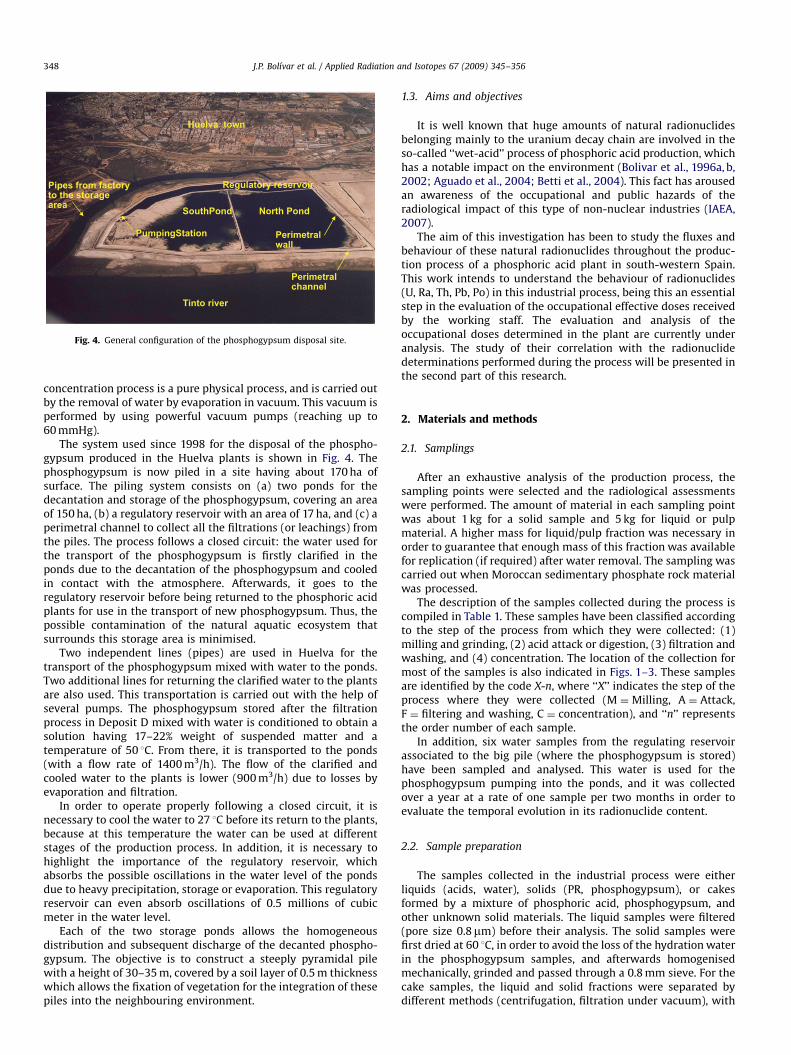
Fig. 4. General configuration of the phosphogypsum disposal site.
J.P. Bolıvar et al. / Applied Radiation and Isotopes 67 (2009) 345–356348
concentration process is a pure physical process, and is carried outby the removal of water by evaporation in vacuum. This vacuum isperformed by using powerful vacuum pumps (reaching up to60 mmHg).
The system used since 1998 for the disposal of the phospho-gypsum produced in the Huelva plants is shown in Fig. 4. Thephosphogypsum is now piled in a site having about 170 ha ofsurface. The piling system consists on (a) two ponds for thedecantation and storage of the phosphogypsum, covering an areaof 150 ha, (b) a regulatory reservoir with an area of 17 ha, and (c) aperimetral channel to collect all the filtrations (or leachings) fromthe piles. The process follows a closed circuit: the water used forthe transport of the phosphogypsum is firstly clarified in theponds due to the decantation of the phosphogypsum and cooledin contact with the atmosphere. Afterwards, it goes to theregulatory reservoir before being returned to the phosphoric acidplants for use in the transport of new phosphogypsum. Thus, thepossible contamination of the natural aquatic ecosystem thatsurrounds this storage area is minimised.
Two independent lines (pipes) are used in Huelva for thetransport of the phosphogypsum mixed with water to the ponds.Two additional lines for returning the clarified water to the plantsare also used. This transportation is carried out with the help ofseveral pumps. The phosphogypsum stored after the filtrationprocess in Deposit D mixed with water is conditioned to obtain asolution having 17–22% weight of suspended matter and atemperature of 50 1C. From there, it is transported to the ponds(with a flow rate of 1400 m3/h). The flow of the clarified andcooled water to the plants is lower (900 m3/h) due to losses byevaporation and filtration.
In order to operate properly following a closed circuit, it isnecessary to cool the water to 27 1C before its return to the plants,because at this temperature the water can be used at differentstages of the production process. In addition, it is necessary tohighlight the importance of the regulatory reservoir, whichabsorbs the possible oscillations in the water level of the pondsdue to heavy precipitation, storage or evaporation. This regulatoryreservoir can even absorb oscillations of 0.5 millions of cubicmeter in the water level.
Each of the two storage ponds allows the homogeneousdistribution and subsequent discharge of the decanted phospho-gypsum. The objective is to construct a steeply pyramidal pilewith a height of 30–35 m, covered by a soil layer of 0.5 m thicknesswhich allows the fixation of vegetation for the integration of thesepiles into the neighbouring environment.
1.3. Aims and objectives
It is well known that huge amounts of natural radionuclidesbelonging mainly to the uranium decay chain are involved in theso-called ‘‘wet-acid’’ process of phosphoric acid production, whichhas a notable impact on the environment (Bolivar et al., 1996a, b,2002; Aguado et al., 2004; Betti et al., 2004). This fact has arousedan awareness of the occupational and public hazards of theradiological impact of this type of non-nuclear industries (IAEA,2007).
The aim of this investigation has been to study the fluxes andbehaviour of these natural radionuclides throughout the produc-tion process of a phosphoric acid plant in south-western Spain.This work intends to understand the behaviour of radionuclides(U, Ra, Th, Pb, Po) in this industrial process, being this an essentialstep in the evaluation of the occupational effective doses receivedby the working staff. The evaluation and analysis of theoccupational doses determined in the plant are currently underanalysis. The study of their correlation with the radionuclidedeterminations performed during the process will be presented inthe second part of this research.
2. Materials and methods
2.1. Samplings
After an exhaustive analysis of the production process, thesampling points were selected and the radiological assessmentswere performed. The amount of material in each sampling pointwas about 1 kg for a solid sample and 5 kg for liquid or pulpmaterial. A higher mass for liquid/pulp fraction was necessary inorder to guarantee that enough mass of this fraction was availablefor replication (if required) after water removal. The sampling wascarried out when Moroccan sedimentary phosphate rock materialwas processed.
The description of the samples collected during the process iscompiled in Table 1. These samples have been classified accordingto the step of the process from which they were collected: (1)milling and grinding, (2) acid attack or digestion, (3) filtration andwashing, and (4) concentration. The location of the collection formost of the samples is also indicated in Figs. 1–3. These samplesare identified by the code X-n, where ‘‘X’’ indicates the step of theprocess where they were collected (M ¼Milling, A ¼ Attack,F ¼ filtering and washing, C ¼ concentration), and ‘‘n’’ representsthe order number of each sample.
In addition, six water samples from the regulating reservoirassociated to the big pile (where the phosphogypsum is stored)have been sampled and analysed. This water is used for thephosphogypsum pumping into the ponds, and it was collectedover a year at a rate of one sample per two months in order toevaluate the temporal evolution in its radionuclide content.
2.2. Sample preparation
The samples collected in the industrial process were eitherliquids (acids, water), solids (PR, phosphogypsum), or cakesformed by a mixture of phosphoric acid, phosphogypsum, andother unknown solid materials. The liquid samples were filtered(pore size 0.8mm) before their analysis. The solid samples werefirst dried at 60 1C, in order to avoid the loss of the hydration waterin the phosphogypsum samples, and afterwards homogenisedmechanically, grinded and passed through a 0.8 mm sieve. For thecake samples, the liquid and solid fractions were separated bydifferent methods (centrifugation, filtration under vacuum), with

ARTICLE IN PRESS
Table 1Codes and description of samples taken along the whole industrial process.
Code Description
Step 1: Milling and grinding
M1 Phosphate rock before milling and grinding. It was taken from the silos
where it is stored after its reception in the factory
M2 Phosphate rock collected just after its grinding in the ball mill and before
its transportation by an ascendant current air to several cyclones
M3 Grinded phosphate rock collected just before its entrance in the digester
Step 2: Acid attack
A1 22% P2O5 coming from the filtration step and used to favour the digestion
A2 Grinded phosphate rock feeding the digester
A3 Pulp formed in the digester, and collected from compartment 5
A4 Pulp collected from compartment 7 of the digester, just after passing from
the flash-cooler
A5 Pulp collected in the compartment 6 of the digester, just before to be
transported to the filtration step
A6 Water from Deposit B collected before its transportation to the filtration
step
A7 Water returning to the factory from the ponds used for the storage of PG
A8 Fresh waters supplied from outside the process
A9 Water collected in Deposit A, used to dilute the 98% sulphuric acid
Step 3: Filtering and washing
F1 ¼ A5 Pulp collected just after leaving compartment 6 of the digester and before
to be suctioned and washed
F2 27% P2O5 extracted from the pulp coming from the digesters by suction
F3 PG collected before to be washed, and after the extraction of the 27% P2O5
F4 ¼ A1 22% P2O5 extracted from the PG in the first washing and used to favour
the reaction in the digesters
F5 12% P2O5 extracted from the PG in the second washing and used for the
performance of the first washing
F6 PG collected after the first washing with 12% P2O5
F7 5% phosphoric acid extracted from the PG in the third washing and used
for the performance of the second washing
F8 PG collected after the second washing with 5% P2O5
F9 Water from Deposit C, used for the third washing of the PG
F10 Waste water collected from different parts of the plan to Deposit B and
used for the washing of the filter clothes
F11 ‘‘Fresh PG’’ collected after third washing just before to be transported to
Deposit D
F12 Residual waters coming from a plant of the factory devoted to the
production of SA from pyrites and used to form the solution with the PG
in suspension to be transported into the PG stacks
F13 Suspension of PG plus water which is pumped into the storage area
F14 Mud formed at the bottom of the tank where the 27% P2O5 is stored
F15 Floating material at the upper of the tank where the 27% P2O5 is stored
Step 4: Concentration
C1 Phosphoric acid at 54% P2O5 obtained after the concentration process
C2 Phosphoric acid (32% P2O5) which is feeding to the condenser after
flocculation
J.P. Bolıvar et al. / Applied Radiation and Isotopes 67 (2009) 345–356 349
the liquid fractions finally passing through a filter with a 0.8mmpore size. After separation, the solid fractions were conditionedfollowing the same protocol used for the solid samples.
2.3. Radionuclide determinations
2.3.1. Gamma-ray spectrometry
Aliquots of the pre-treated and conditioned samples wereintroduced into polypropylene cylindrical containers with adiameter of 6.6 cm, up to a height of 5 cm for analysis bygamma-ray spectrometry.
The gamma-ray determinations were performed with a coaxialhyper-pure Ge detector (extended range (XtRa) type, modelGX3519 from Canberra industries), mounted with a carbonwindow of 0.5 mm thickness, relative efficiency of 38.4%, andFWHM of 0.95 keV at the 122 keV line of 57Co and 1.9 keV at the1333 keV line of 60Co. The detector is connected to a conventional
electronic chain, including a multichannel analyser, and isshielded by Fe 15 mm of thickness. The detector with its shieldingis located in a room with walls and ceilings made of 75 cm-thickconcrete on the ground floor of a four-storey building in order tominimise the natural background of the measuring system.
For gamma-ray quantitative determinations, we have devel-oped an original efficiency calibration procedure in the energyrange of 150–1800 keV (Perez-Moreno et al., 2002). It takes intoaccount the self-absorption differences between the problemsample and the calibration sample. 226Ra activities were deter-mined by the 352 keV emission of 214Pb. Both nuclides were insecular equilibrium since counting was done at least one monthafter filling and sealing the cylindrical container. 228Ra determina-tion was carried out by the emission of 911 keV of 228Ac, while228Th was determined by the 583 keV photon of 208Tl taking intoaccount the branching ratio in the decay scheme of these nuclides.On the other hand, 210Pb activities were also determined from thesame measurement by using an independent efficiency calibra-tion which was performed specifically by 46.5 keV photon emittedby this radionuclide (Bolivar et al., 1994; San Miguel et al., 2002).
2.3.2. Alpha-particle spectrometry
Aliquots of around 5 g in the case of acids and solids, and about1 L in the case of waters were taken for the determination ofseveral alpha-emitters by alpha-particle spectrometry. U-isotope(238U, 235U, 234U) and Th-isotope (232Th, 230Th) mass activitieswere determined by alpha-particle spectrometry. To this end, asequential well-established radiochemical method was applied torepresentative aliquots of the samples (Holm and Fukai, 1977). Inthis method, the U-isotopes and the Th-isotopes once isolated areelectrodeposited onto stainless steel planchets (Hallstadius, 1984).Typical recoveries of 60–80% for uranium and 50–70% for thoriumwere obtained.
3. Results and discussion
3.1. Natural radioactivity concentrations throughout the process
Radionuclide concentrations of the samples collected through-out the P2O5 production process are shown in Tables 2 (millingand digestion steps), and in 3 (filtration, washing, and concentra-tion steps). Additionally, in Table 4 the most interesting activityratios for the most representative samples analysed are compiled.
As can be seen from Table 2, the phosphate rock treated for theproduction of phosphoric acid is clearly enriched in radionuclidesfrom the uranium series. Their concentrations are in line with datafrom the Moroccan sedimentary phosphate rocks found inliterature (Azouazi et al., 2001). They are also at least 50 timeshigher than in representative unperturbed soils worldwide(UNSCEAR, 2000). In addition, it is possible to observe that allmembers of the uranium series are in secular equilibrium (seeTable 4, sample M-3), as expected due to the fact that the materialdoes not experiments any radionuclide enrichment during thephysical processes applied before digestion. On the other hand,the activity concentrations of the radionuclides belonging to the232Th chain in the treated phosphate rock are quite reduced (see,for example, 232Th/238U activity ratio of sample M-3, Table 4). Forthis reason the discussion of these nuclides will be fairly limited inthis paper.
During the digestion step, we observe the first clear evidenceof different behaviour that the analysed radionuclides from the U-series show in the process. It is possible to observe a non-homogenous, varied distribution of the analysed radionuclidesbetween the liquid and solid fractions in the pulp samplescollected from the digesters. The liquid fractions, corresponding

ARTICLE IN PRESS
Table 2Activity concentrations (Bq/kg) obtained for the samples collected along the milling and digestion steps.
Sample code Sample type 238U 234U 230Th 226Ra 210Pb 232Th 228Th 228Ra
M1 Phosphate rock 1650790 1650790 1670770 1610780 1660790 2572 2172 2272
M2 1650790 1650790 1490760 1630780 1600790 2472 2072 1972
M3 1630790 1640790 1570770 1640780 16107100 2271 2372 2172
A2 16807100 1680710 1670780 1380770 14407100 3374 1771 2071
A1 22% P2O5 870750 870 750 9574 3.070.4 74714 53711 1.770.4 o1.8
A3L Cake dig. liquid fraction 1000770 980770 245722 5.570.5 76712 3.070.6 3.870.5 o1.9
A4L 1300790 1280790 246719 6.770.5 82713 3.270.6 8.070.7 6.770.5
A5L 1340790 1330790 425778 4.070.4 60712 6.571.4 4.070.5 o1.0
A3S Cake dig. solid fraction 460730 460730 510750 470720 5207100 1472 9.470.8 1471
A4S 560740 560740 690730 760740 8707160 1472 1471 1472
A5S 450730 450730 750730 590725 590 7120 1672 1171 9.471.1
A6 Waters 202714 202713 o0.1 4.07 0.4 89717 0.5570.14 1.570.4 o1.6
A7 182717 183717 N.M. o0.6 875 N.M. o1.6 o1.2
A8 0.05470.004 0.05170.004 N.M. o0.9 o11 N.M. o1.5 o0.9
A9 0.4470.02 0.4570.02 0.02770.011 o0.4 N.M. 0.007 70.001 o0.8 o0.4
‘‘L’’: liquid fraction; ‘‘S’’: solid fraction; ‘‘N.M.’’: not measured.
Table 3Activity concentrations (Bq/kg) obtained for the samples collected along the filtration, washing, and acid concentration steps.
Sample code Sample type 238U 234U 230Th 226Ra 210Pb 232Th 228Th 228Ra
F1L ¼ A5L Pulp cake 1340790 1330790 425778 4.070.4 60712 6.571.4 4.070.5 o1.0
F1S ¼ A5S 450730 450730 750730 590725 5907120 1672 1172 9.471.1
F2 27% P2O5 10707110 10907110 230730 5.670.5 78715 9.871.8 3.970.5 o1.8
F4 ¼ A1 22% P2O5 870750 870750 9574 3.070.4 74714 53711 1.770.4 o1.8
F5 12% P2O5 470740 470740 80710 6.170.5 o225 6.071.5 o1.7 o1.9
F7 5% P2O5 290720 290720 4.270.3 1.870.3 o135 0.1770.06 o1.0 o1.5
F3 Gypsum 1 650740 650740 760740 580730 6007120 3473 9.070.9 9.571.6
F6 Gypsum 2 370725 380725 790750 640730 6407120 1973 14.371.1 9.771.3
F8 Gypsum 3 360725 390725 720740 650735 620760 3174 7.870.6 11.871.0
F11 Gypsum 4 318726 334727 830752 670735 620760 1873 o2.2 10.671.2
F13L Gypsum + water 280720 280720 1.170.10 9.170.3 675 0.0570.02 o1.5 o1.8
F13S 250720 260720 700730 525730 610780 21.672.4 o3 8.971.3
F9 Waters 230720 230720 N.M. 0.3370.30 o16 12.371.0 o1.6 o1.2
F10 5675 5675 0.3170.03 2.670.4 o15 0.1170.02 o1.5 o1.9
F12 0.2670.02 0.2870.02 0.7470.02 o0.8 o9 0.02970.003 o1.0 o1.2
F14L Sludges 20907170 21007170 12507150 7.470.5 46710 2273 16.371.2 1.770.5
F15L 1260780 1240780 250730 4.570.4 84715 5.271.1 6.070.6 o1.7
F14S 1230770 1230770 20007150 43007220 1900790 2876 3273 6576
F15S 910760 900755 910725 1310770 14207160 12.971.0 10.471.2 17.871.9
C1 32% P2O5 1300770 1320770 N.M. 3.670.3 o135 N.M. 6.570.4 o0.9
C2 54% P2O5 18307180 18107180 N.M. 7.970.5 109714 N.M. 13.271.4 o1.0
‘‘L’’: liquid fraction; ‘‘S’’: solid fraction; ‘‘N.M.’’: not measured.
J.P. Bolıvar et al. / Applied Radiation and Isotopes 67 (2009) 345–356350
mainly to the phosphoric acid formed at this step, are clearlyenriched in uranium, whilst the concentrations of 230Th, 226Ra,and 210Pb are evidently lower or even negligible (this is the case of226Ra). On the contrary, solid samples contain the major propor-tion of the 230Th, 226Ra, and 210Pb originally present in thephosphate rock, while the uranium isotopes concentrations areslightly lower (but far from negligible, see activity ratios of sampleA-4S, Table 4). This solid fraction is mostly composed of the
phosphogypsum formed in reaction to the phosphate rock withsulphuric acid. However, it may also contain a proportion of non-attacked phosphate rock and some phosphoric acid occludedbetween the phosphogypsum grains and not separated from theliquid samples.
For a better understanding of the previously mentioned results,it is necessary to take into consideration the main three inputs ofradionuclides from the uranium series to the digestion step. In

ARTICLE IN PRESS
Table 4Activity ratios obtained for the most representative samples collected along the whole industrial process.
Sample code Sample type 234U/238U 230Th/238U 226Ra/238U 210Pb/238U 226Ra/230Th 210Pb/226Ra 232Th/238U (�102)
M3 Phosphate rock 1.0170.08 0.9670.07 1.0170.07 0.9970.08 1.0470.07 0.9870.08 1.470.1
A4L Cake digester 0.9870.10 0.1970.02 0.00570.001 0.0670.01 0.02770.003 1272 0.2570.05
A4S 1.0070.10 1.2370.11 1.3670.12 1.6170.32 1.1070.08 1.1470.22 2.570.4
A6 Water ponds 1.0070.09 o0.0005 0.02070.002 0.4470.09 440 2275 0.2770.02
A7 1.0170.13 N.M. 0.00770.016 0.0470.03 N.M. 677172 –
F2 27% P2O5 1.0270.15 0.2170.03 0.005270.0007 0.07370.016 0.02470.004 1473 0.970.2
F5 12% P2O5 1.0070.11 0.1770.03 0.01370.002 o0.48 0.07670.012 o75 1.370.3
F8 Gypsum 1.0870.10 1.9870.18 1.8070.15 1.7270.21 0.9170.07 0.9670.11 971
F13S 1.0470.10 2.8470.23 2.1170.17 2.4670.34 0.7470.05 1.1770.16 971
F14L Sludges 1.0070.11 0.5970.09 0.003570.0004 0.02270.005 0.006070.0008 6.271.4 1.170.2
F14S 1.0070.08 1.6270.15 3.570.3 1.5470.11 2.1670.20 0.4470.03 2.370.5
C2 54% P2O5 0.9970.14 N.M. 0.004370.0005 0.05970.010 N.M. 13.872.0 –
‘‘L’’: liquid fraction; ‘‘S’’: solid fraction; ‘‘N.M.’’: not measured.
0
0
200
400
600
800
1000
1200
1400
1600
1800
2000
2200
F7F5
F4
F2
C1
C2
a(238U) = (108+25) + (35+2) [P2O5]
R2 = 0.9860
238 U
act
ivity
con
cent
ratio
n (B
q/kg
)
P2O5 contents (%)10 20 30 40 50 60
Fig. 5. Dependence of the 238U activity concentration on the P2O5 concentration of
the samples collected in this work.
J.P. Bolıvar et al. / Applied Radiation and Isotopes 67 (2009) 345–356 351
addition to the main input associated to the treated phosphaterock, significant amounts of 22% P2O5 are used in order to favourdigestion, and furthermore some amounts of water for dilution ofthe sulphuric acid are used for attacking the rock. The last twosources contain enhanced amounts of radioactivity (see Table 2).Indeed, the 22% P2O5 is clearly enriched in Uranium isotopes, withclearly lower concentrations of the other radionuclides deter-mined from the uranium series. This finding is in good agreementwith the results obtained in the liquid phases of the pulp, asexpected, while the water fed into the digester (sample A9) is alsoparticularly enriched in uranium. This water is formed by amixture of freshwater and recycled water. The freshwater (sampleA8) comes from a reservoir near the factories and containsnegligible amounts of radioactivity. The recycled water (samplesA6 and A7), which is used previously for the transport ofphosphogypsum to storage, contains particularly elevatedamounts of uranium. Consequently, the input of the uraniumisotopes in the digestion step is clearly higher than that associatedto the mineral feeding the process. On the contrary, the additionalinputs in the case of analysed uranium daughters (230Th, 226Ra,and 210Pb) are negligible.
The results obtained in the analysis of the samples collected inthe filtration step allowed the confirmation of the differentbehaviour of the Uranium isotopes and their daughters previouslydrawn. By observing the data shown in Tables 2 and 3, we canaffirm that most of the uranium tends to be associated to thephosphoric acid fraction, while the majority of 230Th, 226Ra, and210Pb tends to be associated to phosphogypsum. These conclu-sions are evident by observing the obtained activities in thephosphoric acid samples. They present high values of U-isotopesand clearly lower, or negligible, concentrations of their daughters.The concentration of U decreases in the phosphogypsum samplesaccording to their successive washings, a fact indicating that theamounts of P2O5 that remain associated to the gypsum areremoved sequentially in the different washings. Consequently, theuranium associated to this acid is removed. On the contrary, theconcentrations of 230Th, 226Ra, and 210Pb remain inalterable in thesuccessive washings because these radionuclides cannot be foundassociated to the acid fraction.
Due to the extremely close association of the uranium with theliquid fractions containing P2O5, it is even possible to observe aclear correlation between the concentrations of this element andthe strength of the phosphoric acid samples analysed from thefiltration area (Fig. 5). This correlation is even closer if we alsoinclude the phosphoric acid samples collected in the finalconcentration step. This is due to the fact that these last samplesonly suffer the loss of a fraction of their water content byevaporation. As a consequence, they experience an increase intheir uranium levels by concentration following strictly theincrease in their P2O5 percentage.
Both good correlation coefficient and acceptable uncertaintiesfor fit parameters were obtained. These facts are thus supportingthe affinity of uranium fraction for the phosphoric acid fraction.Bearing in mind that this acid is used for phosphate fertiliserproduction, such an accumulation is in agreement with the wellreported accumulation of uranium in fertilisers (Yamazaki and

ARTICLE IN PRESS
J.P. Bolıvar et al. / Applied Radiation and Isotopes 67 (2009) 345–356352
Geraldo, 2003; Saueia and Mazzilli, 2006). On its turn, the use offertilisers with high P2O5 contents could be the origin of a certainaccumulation of this element on tilled soils (Rothbaum et al.,1979).
On the contrary, observing this correlation is however moredifficult for the uranium daughters due to their low affinity withthe P2O5. However, it is necessary to indicate that the behaviour isnot exactly the same for all the uranium daughters analysed.While the concentrations of 226Ra are negligible in the P2O5
fractions, the levels of 230Th and 210Pb in these samples are clearlyhigher. In fact, by ordering all the analysed elements according totheir affinity to the phosphoric acid, we can indicate that
U-isotopes44230Th4210Pb4226Ra
The uniformity in the 226Ra, 230Th, and 210Pb concentrations in thegypsum samples collected in the process (regardless of thenumber of washings applied) is in opposition to the behaviourof the uranium isotopes. This finding indicates that the uraniumdaughters are strongly bound to the gypsum matrix, and theirconcentrations in liquid fractions will be driven by dilution factorsin relation to the mass percentage P2O5. These facts can explainthe results obtained in the water used, first for the transport ofthis by-product to the disposal site, and afterwards in the processafter its recirculation (samples A6, A7, and F9). As previouslymentioned, this water is especially enriched in the uraniumisotopes while it presents clearly lower concentrations of theuranium daughters, which tend to remain bound to the solidgypsum material (see activity ratios, Table 4). Laboratory leachingexperiments were performed by our group using phosphogypsumcollected at the Huelva factory just before mixing with water andtransportation to the phosphogypsum ponds. The results confirmthe previous comments (Aguado et al., 2005).
The high radioactive content (specially in uranium) of thewater used for the transport of the phosphogypsum to thedisposal area needs to be considered in a construction of theradionuclide balances in the processes due to their recirculationand active use in the process. The radioactive content of this wateris fairly uniform over time. This fact can be deduced from theanalysis performed on six aliquots from different locations in thereservoir associated to the piles where the phosphogypsum isstored (see Table 5). As previously explained, these samples werecollected over one year and at a rate of one sample per twomonths. The data shown in this table should be compared withthe results obtained in the samples A6, A7, and F9 (Tables 2 and 3)which also correspond to waters used for the transport of thephosphogypsum but collected after returning to the plant.
3.2. Mass and radionuclide balances in the process
In Fig. 6, the scheme of the global production process appliedin obtaining phosphoric acid by the wet acid method in theHuelva production plant analysed in this work is shown. The mostrepresentative sampling points for the mass-balance and radio-nuclide fluxes are marked by solid frames. The frames with
Table 5Obtained activity concentrations (Bq/kg) for the PG transportation water samples
collected in this work measured by gamma spectrometry.
Sample code 238U, 234U 226Ra 228Th 228Ra
AG1 223718 o0.69 1.670.3 o1.4
AG2 219722 o0.86 5.370.6 o1.0
AG3 204722 o0.87 o1.6 o1.6
AG4 215721 o0.83 1.770.4 o1.6
AG5 214721 o0.90 8.270.7 o1.6
AG6 217721 o0.89 6.570.6 o1.6
dashed lines correspond to samples with marginal entity insidethe process. These mass and radionuclide activity balances havebeen performed with the objective of confirming clearly the mainroutes followed by the different radionuclides of the uraniumseries involved in the process. They also help to the evaluation ofthe magnitude of the possible emissions of natural radioactivityinto the environment.
In Fig. 7, the mass balance in the P2O5 production processcorresponding to the analysed plant is shown in graph form. Thedata have been normalised to the amount of Moroccan phosphaterock introduced into the process, which is 44 ton per hour. In theelaboration of this mass balance, the following losses throughoutthe process have been considered: (a) 1 ton per hour inphosphogypsum and 3 ton per hour in acids in the filtration step,which represents 1% of the phosphogypsum produced and 8% ofthe liquids used in the washings, (b) 2 ton per hour of pulp in thereaction step, and (c) 2.8 ton per hour of CO2 by evaporation and6.9 ton per hour of F in the form of H2SiF6 also in the reaction step.
All the data shown in Fig. 7 correspond to the average valuesdetermined in a typical month of production at the plant. It can bededuced that for every tonne per hour of phosphate rock attacked(sample M3), 1.11 ton per hour of production phosphoric acid (27%P2O5, sample F2) and 1.97 ton per hour of phosphogypsumcontaining approximately 20% in weight of water (sample F11)are produced. In addition, the consumption of water in the plantincludes 0.60 ton per hour used in the dilution of the sulphuricacid prior to its reaction with the phosphate rock in the digesters,1.06 ton per hour used in the washing of the filters, and 0.03 tonper hour associated to the humidity of the phosphate rock and tothe water content of the concentrated sulphuric acid.
The mass-balance study showed and discussed previously hasbeen the basis (together with the data compiled in Tables 2 and 3)for the quantitative elaboration of the fluxes of the radionuclidesfrom the uranium series involved in the process.
In Fig. 8, the normalised flux of radioactivity associated to 238Uis presented. The normalisation was performed on the uraniumcontent introduced in the process associated to the phosphaterock. As previously explained, the 238U is introduced with thephosphate rock (sample M) and the water used in the washing ofthe phosphogypsum (sample F9). Its activity is distributedbetween the production phosphoric acid (sample F2) in aproportion of 51% and the phosphogypsum (41%). So it can beconcluded that the uranium has the tendency to stay indissolution in an acidic medium. This conclusion is also reinforcedif we consider that a fraction of the uranium detected in thephosphogypsum is associated to the acid liquid where it remains.This finding can be deduced in two ways. First, observing theuranium enrichment in the water of the process (F10) after thewashing of the filters used for separation of the phosphogypsum,to give the water F9. Second, observing the uranium content in thewaters used for the transport of the phosphogypsum to thestorage area. In fact, the acid water returning to the plant afterthe transport of the phosphogypsum to the disposal area containsaround 65% 238U in the amount bound to the phosphate rock.
Quantitatively, we can indicate the 238U activity input rates:76 MBq/h associated to the phosphate rock, 14.1 MBq/h associatedto the water used for the washings in the filtration area, and48.4 MBq/h associated to the water returning from the disposalarea. Furthermore, the amount of this nuclide leaving the processin the filtration step associated to the production phosphoric acid(27% P2O5), is 54.9 MBq/h. Finally, 99.9 MBq/h of 238U leaves theprocess with the mixture of water and gypsum transported to thepiles. Consequently, it is possible to affirm the existence ofagreement between the inputs and outputs of Uranium in theprocess (with a lower deviation of 10%). The net annual flux of 238Usent to the piles for its disposal from the plant is 0.42 TBq per year.

ARTICLE IN PRESS
Fig. 6. General scheme of the steps considered for establishing the mass/activity balances in this industrial process.
Fig. 7. Scheme of the P2O5 mass balance throughout the whole industrial process.
J.P. Bolıvar et al. / Applied Radiation and Isotopes 67 (2009) 345–356 353
In Fig. 9, the normalised flux of radioactivity associated to230Th is shown. In this case, the phosphate rock is the onlysignificant source of this nuclide in the production processbecause the 230Th content of the water involved in the processis very low according to the mass-balance obtained. This result iscompatible with the very low solubility of this element in waterregardless of its acidity (Hyde, 1960).
From Fig. 9, it can also be seen that the 230Th tends to beassociated to the phosphogypsum fraction during the process.
Around 87% of its input is deposited in the disposal area. Theremaining 13% is associated to the production of phosphoric acid,27% P2O5, and will probably reach the environment via the use ofphosphate fertilisers.
Quantitatively, 72.3 MBq/h of 230Th are sent to the phospho-gypsum piles for disposal. Almost the same amount, 76 MBq/h, isassociated to the phosphate rock and enters the productionprocess. Associated to the production of phosphoric acid, the 230Thflux is 11.7 MBq/h, which indicates the good balance established

ARTICLE IN PRESS
Fig. 8. Scheme of the 238U activity balance throughout the whole industrial process.
Fig. 9. Scheme of the 230Th activity balance throughout the whole industrial process.
J.P. Bolıvar et al. / Applied Radiation and Isotopes 67 (2009) 345–356354
for this radionuclide during the process. The deviation is only of10%. The annual flux of 230Th stored in the phosphogypsum pilesdue to the plant can be estimated at 0.85 TBq, slightly higher thanthe estimate for 238U, due to the higher tendency of the thorium tobe associated to the phosphogypsum.
Finally, in Figs. 10 and 11 the normalised balances for 226Ra and210Pb, respectively, are shown. From these figures, it can first bedrawn that in the case of 226Ra the input and output fluxes are in
agreement within a deviation of 10%, while in the case of 210Pbthis agreement is even better (deviation between input andoutput fluxes of 1–2%).
From these last two figures it is also possible to deduce thatboth Ra and Pb elements have a very high affinity with the Pphosphogypsum, which is even higher than that observedpreviously for thorium. This conclusion can be ratified by theminor presence of both radionuclides in the production

ARTICLE IN PRESS
Fig. 10. Scheme of the 226Ra activity balance throughout the whole industrial process.
Fig. 11. Scheme of the 210Pb activity balance throughout the whole industrial process.
J.P. Bolıvar et al. / Applied Radiation and Isotopes 67 (2009) 345–356 355
phosphoric acid (27% P2O5) and in the recycled phosphoric acid(22% P2O5). Only 4.0 MBq/h in the case of 210Pb and 0.30 MBq/h inthe case of 226Ra are associated to the production phosphoric acid.
In the case of 226Ra, the proportion of the input associated tothe phosphogypsum is 99.5%, with only 0.5% associated to theproduction of phosphoric acid. The behaviour of 210Pb is similar tothat of radium. The proportion associated to the phosphogypsum
being slightly lower, 93%, with only 7% associated to the acid. Thenet fluxes stored in the disposal area can be evaluated in around70 MBq/h of 226Ra and 210Pb.
The normalised fluxes of 232Th, 228Th, and 228Ra are not shownand discussed because these radionuclides have similar behaviourto that observed for 230Th and 226Ra, respectively. This similarbehaviour can be explained, and is even expected, attending to the

ARTICLE IN PRESS
J.P. Bolıvar et al. / Applied Radiation and Isotopes 67 (2009) 345–356356
fact that the fractionation of the different radionuclides in the wetacid production process are mostly due to chemical processesinvolved being elemental and non-isotope dependent. The factthat the compared isotopes of thorium and radium belong todifferent natural series is not relevant for their distribution andfluxes during the process, mostly due to the strong acid attack ofthe phosphate rock in the initial reaction step.
4. Conclusions
The flow and fractionation of natural radionuclides belongingto the 238U-series have been studied in detail along the wetprocess of a phosphoric acid production plant. Around 380 MBq/hof 238U is the intake for the five existing plants at Huelva (Spain),in secular equilibrium with their daughters, associated to the rawmaterial (sedimentary phosphate rock), being the secular equili-brium broken at the initial acid digestion step.
The well known uranium enrichment in the liquid fraction (theacid) seems to be a consequence of two facts: firstly, the highchemical affinity of this element for the recently producedphosphoric acid and secondly, the use of additional P2O5
(previously enriched in uranium) in order to accelerate the rockdigestion. As a consequence, a fair correlation between acid P2O5
contents and uranium concentration has been achieved.The phosphogypsum produced during the acid attack is
consequently submitted to progressive washings, and the resultsshow how the uranium concentration clearly decreases as thewashing is becoming more intense. This fact is probably due to theassociation of uranium to traces of phosphoric acid remaining inthe recently generated phosphogypsum. Washing and filteringprocesses remove such traces, and for that fact uraniumconcentration decreases according to the number of washings.On the other hand, Pb, Ra, and, in some extent, Th isotopes areexclusively supplied by the phosphate rock, and they remainassociated to the phosphogypsum particles, being subsequentlystored in a disposal site located in the vicinity of the factories at arate of around 350 MBq/h.
Acknowledgements
This work has been partially supported by project ‘‘Estudio yevaluacion del impacto radiologico producido por las actividadesde diversas industrias no nucleares del Sur de Espana’’ (SpanishNuclear Security Council) and by projects CTM2006-08148/MARfrom Ministry of Education and Science, and P06-FQM-02065from the Regional Government of Andalusia (Junta de Andalucıa).Authors wish to thank to Fertiberia enterprise and specially to Mr.J. Garralda for their kind help and support in performing thiswork.
References
Absi, A., Villa, M., Moreno, H.P., Manjon, G., 2005. Self-cleaning in an estuarine areaformerly affected by Ra-226 anthropogenic enhancements. Sci. Total Environ.339, 207–218.
Aguado, J.L., Bolivar, J.P., Garcia-Tenorio, R., 2004. Sequential extraction of Ra-226in sediments from an estuary affected historically by anthropogenic inputs ofnatural radionuclides. J. Environ. Radioact. 74, 117–126.
Aguado, J.L., Bolıvar, J.P., San Miguel, E.G., Garcıa-Tenorio, R., 2005. Ra and Uisotopes determination in phosphogypsum leachates by alpha-particlespectrometry. Radioact. Environ. 7, 160–165.
Azouazi, M., Ouahidi, Y., Fakhi, S., Abbe, J.C., Benmansour, M., 2001. Naturalradioactivity in phosphates, phosphogypsum and natural waters in Morocco.J. Environ. Radioact. 54, 231–242.
Becker, P., 1989. Phosphates and Phosphoric Acid: Raw Materials, Technology,and Economics of the Wet Process, second ed. Marcel Dekker Inc.,New York.
Betti, M., de las Heras, L.A., Janssens, A., Henrich, E., Hunter, G., Gerchikov, M.,Dutton, M., van Weers, A.W., Nielsen, S., Simmonds, J., Bexon, A., Sazykina, T.,2004. Results of the European Commission Marina II Study Part II—effects ofdischarges of naturally occurring radioactive material. J. Environ. Radioact. 74,255–277.
Bolivar, J.P., Garcia-Tenorio, R., Garcia-Leon, M., 1994. A generalized transmissionmethod for gamma-efficiency determination in soil samples. Nucl. Geophys. 8,485–492.
Bolivar, J.P., Garcia-Tenorio, R., Garcia-Leon, M., 1996a. On the fractionation ofnatural radioactivity in the production of phosphoric acid by the wet acidmethod. J. Radioanal. Nucl. Chem. 214, 77–88.
Bolivar, J.P., Garcia-Tenorio, R., Garcia-Leon, M., 1996b. Radioactive impact of somephosphogypsum piles in soils and salt marshes evaluated by gamma-rayspectrometry. Appl. Radiat. Isot. 47, 1069–1075.
Bolivar, J.P., Garcia-Tenorio, R., Mas, J.L., Vaca, F., 2002. Radioactive impact insediments from an estuarine system affected by industrial wastes releases.Environ. Int. 27, 639–645.
El-Mrabet, R., Abril, J.M., Perianez, R., Manjon, G., Garcıa-Tenorio, R., Delgado, A.,Andreu, L., 2003. Phosphogypsum amendment effect on radionuclide contentin drainage water and marsh soils from southwestern Spain. J. Environ. Qual.32, 1262–1268.
Fertiberia, 2002. Documentation on the Industrial Process at the HuelvaPhosphoric Acid Production Plant. Fertiberia, SA (in Spanish).
Hallstadius, L., 1984. A method for the electrodeposition of actinides. Nucl.Instrum. Methods Phys. Res. A 223, 266–267.
Holm, E., Fukai, R., 1977. Method for multi-element alpha-spectrometry ofactinides and its application to environmental radioactivity studies. Talanta24, 659–664.
Hyde, E.K., 1960. The Radiochemistry of Thorium. Nuclear Science Series. USAtomic Energy Commission, Oak Ridge, TN, USA.
International Atomic Energy Agency, 2007. Assessing the Need for RadiationProtection Measures in Work Involving Minerals and Raw Materials. IAEASafety Reports Series No. 49. IAEA, Vienna.
Mas, J.L., San Miguel, E.G., Bolıvar, J.P., Vaca, F., Perez-Moreno, J.P., 2006.An assay on the effect of preliminary restoration tasks applied to a largeTENORM wastes disposal in the south-west of Spain. Sci. Total Environ. 364,55–66.
Oslo-Paris Convention for the Protection of the Marine Environment of the North-East Atlantic, 1996. PARCOM Decision 96/3 on a Harmonized MandatoryControl System for the Use and Reduction of the Discharge of OffshoreChemicals. Oslo.
Perez-Moreno, J.P., San Miguel, E.G., Bolivar, J.P., Aguado, J.L., 2002. A comprehen-sive calibration method of Ge detectors for low-level gamma-spectrometrymeasurements. Nucl. Instrum. Methods Phys. Res. A 491, 152–162.
Rothbaum, H.P., McGaveston, D.A., Wall, T., Johnston, A.E., Mattingly, G.E.G., 1979.Uranium accumulation in soils from long-continued applications of super-phosphate. J. Soil Sci. 30, 147–153.
Rutherford, P.M., Dudas, M.J., Samek, R., 1994. Environmental impacts ofphosphogypsum. Sci. Total Environ. 149, 1–38.
San Miguel, E.G., Perez-Moreno, J.P., Bolivar, J.P., Garcıa-Tenorio, R., Martın, J.E.,2002. Pb-210 determination by gamma spectrometry in voluminalsamples (cylindrical geometry). Nucl. Instrum. Methods Phys. Res. A 493,111–120.
Saueia, C.H.R., Mazzilli, B.P., 2006. Distribution of natural radionuclides in theproduction and use of phosphate fertilizers in Brazil. J. Environ. Radioact. 89,229–239.
UNSCEAR, 2000. Report of the United Nations Scientific Committee on the Effectsof Atomic Radiation. United Nations, New York.
Yamazaki, M.I., Geraldo, L.P., 2003. Uranium content in phosphate fertilizerscommercially produced in Brazil. Appl. Radiat. Isot. 59, 133–136.
Copyright © 2022 FDOKUMEN