Analysis of Transcription Factor-Mediated Remodeling of Nucleosomal Arrays in a Purified System

Ž .Hydrometallurgy 56 2000 309–322www.elsevier.nlrlocaterhydromet
Uranium extraction from purified wet processJordanian phosphoric acid: a development study
Khaled M. Rawajfeh a,1, Ali Kh. Al-Matar b,)
a Chemical Engineering Department, Faculty of Engineering and Technology, UniÕersity of Jordan,Amman, Jordan
b Department of Chemical Engineering, New Mexico State UniÕersity Box 30001, Dept. 3805 Las Cruces,NM 88003, USA
Received 3 March 1999; received in revised form 10 January 2000; accepted 21 February 2000
Abstract
A study on the physical properties, liquid–liquid equilibrium and the performance of a pulsedsieve plate column was conducted using the system: Jordanian purified filter phosphoric acidŽ .28% P O –uranium–0.5 M DEPA–0.125 M TOPO diluted in kerosene. Density and surface2 5
tension were found to follow simple negative linear relationship with temperature while anArrhenius type model was adequate to fit the viscosity dependence on temperature.
Ž .The effect of electromotive force EMF on the uranium distribution coefficient was studiedand a practical limit of oxidation of the uranium was found to be in the range 400–410 mV. VantHoff equation was found to adequately describe the dependence of uranium distribution coeffi-cient on temperature. Uranium distribution coefficients obtained for the Jordanian acid werehigher than reported data for other acids, with distribution coefficients as high as 6.0 obtained atabout 458C.
A preliminary evaluation of the performance of a pulsed sieve plate column was conducted andyielded promising results for the application of such contactors in this field. Recoveries of 90%were obtained at moderate pulsation intensities. Solvent entrainment results indicate that about1900 ppm of the solvent is lost to the acid, which is higher than that for mixer settlers. q 2000Elsevier Science B.V. All rights reserved.
Keywords: Uranium; Purified wet process; Jordanian phosphoric acid
) Corresponding author. Tel.: q1-505-646-1214; fax: q1-505-646-7706.Ž .E-mail address: [email protected] A.Kh. Al-Matar .
1 Tel.: q962-6-5355000 ext. 2883; fax: q962-6-848558.
0304-386Xr00r$ - see front matter q2000 Elsevier Science B.V. All rights reserved.Ž .PII: S0304-386X 00 00080-3

( )K.M. Rawajfeh, A.Kh. Al-MatarrHydrometallurgy 56 2000 309–322310
1. Introduction
Phosphoric acid is produced by contacting phosphate ores with sulfuric acid. Duringthis process, the uranium content of the phosphate ores is preferentially transferred to thephosphoric acid. Phosphate ores and phosphatic fertilizers manufactured using phospho-ric acid exports contributes significantly to the economy of Jordan. Growing concernsand stringent regulations imposed on the content of heavy metals of fertilizers, pose apotential loss of important markets such as the European Union states. This led todevising ways to upgrade the quality of phosphoric acid by reducing the concentrationof uranium and cadmium.
Although a considerable amount of research and development work has been carriedw xout on the extraction of uranium from phosphoric acid 1–13 , none of these studies
employed Jordanian phosphoric acid. It has been found that the synergistic mixture of0.5 M DEPA–0.125 M TOPO diluted by a long-chain aliphatic hydrocarbon such asn-dodecane or kerosene is a satisfactory solvent for uranium in the hexavalent state. Fora detailed literature survey regarding the extraction of uranium from phosphoric acid,
w x w xrefer to the work of Al-Matar 14 and Al-Matar and Rawajfeh 15 .Ž .In this study, the phosphoric acid is the aqueous phase A , 0.5 M DEPA–0.125 M
Ž . Ž .TOPO diluted in kerosene is the organic phase O , while uranium VI is the solutedistributed between the two phases. We report the effect of temperature on the physical
Ž .properties density, viscosity and surface tension of the phosphoric acid and the solvent.Ž .We also report the effect of temperature and electromotive force EMF on the
extraction equilibrium isotherm and the results of a preliminary investigation of uraniumextraction from phosphoric acid in a pulsed sieve plate extraction column.
2. Materials and experimental procedures
2.1. Materials
Ž .Phosphoric acid used in the study is produced by Jordan Phosphate Mines JPMCfertilizer complex located in Aqaba, south of Jordan. This acid is a dilute filter acidŽ .28% P O , which has been subjected to thickening, flocculation and activated carbon2 5
treatment in order to remove suspended solids and organic matter. Average uraniumcontent in the phosphoric acid used is about 71 grm3.
DEPA supplied by Fluka and TOPO from Hoechst having purities of 98.6% and97.8%, respectively, were used without further purification. The diluent used is commer-cial kerosene having an API gravity of 45 and produced by Jordan Petroleum RefineryŽ .JPRC .
2.2. Experimental procedures
Density is determined for the two liquids using a 50-ml pycnometer, a water bathwith a precision of "0.28C and an analytical balance with a precision of "0.0001 g.

( )K.M. Rawajfeh, A.Kh. Al-MatarrHydrometallurgy 56 2000 309–322 311
The temperatures range for which the density of the acid was determined is 8–878C;while for the solvent, it is 21–608C. Viscosity for both the acid and the solvent wasdetermined using a HAAKE falling ball viscometer. The viscosity of phosphoric acidwas determined in the temperature range 16–508C; while the viscosity of the solventwas determined in the range 15–558C. Surface tension was determined using thecapillary rise method for mutually saturated phosphoric acid and solvent at a phase ratioof 2.0. Surface tension for phosphoric acid and solvent was determined in the tempera-tures range 25–608C.
Ž .Liquid–liquid equilibrium LLE data were obtained as a function of variablesrelevant to this study; i.e., temperature and EMF, since all other parameters are keptconstant; e.g., acid concentration is about 28% and the solvent composition is kept at 0.5M DEPA–0.125 M TOPO diluted in kerosene. The range of temperature used in thisstudy is from about 15–458C, while the EMF varied from 350 to 410 mV.
The phase ratio variation method was used to determine the uranium distributioncoefficient using 100 ml liquid–liquid equilibrium cells equipped with agitators andtemperature control. The two phases were mixed for 15 min to ensure that they havereached equilibrium, and then they were left to stand for a period of about 30 min to
w xallow for phase separation. Preliminary experiments by Basheer 16 showed that about3 min were sufficient to reach equilibrium. After phase separation, samples werewithdrawn and analyzed for uranium using a Pye unicam spectrophotometer followingthe BromoPADAP procedure at 578 nm.
3. Results and discussion
3.1. Physical properties
The variation of the density of phosphoric acid and the solvent as a function oftemperature in the relevant temperature range are shown in Figs. 1 and 2, respectively.From these figures, it is seen that the density as a function of temperature can bereasonably correlated by a simple straight-line equation. The parameters of this equationfor the two liquids are given in Table 1.
Ž .The change in density of the phosphoric acid expressed in terms of % P O as a2 5w xfunction of temperature is given in Becker 17 by:
w xDr8Csy0.1 3.8q0.08=% P O 1Ž .2 5
Based on this equation, the change in density per degree centigrade for a 28% acid iscalculated to be 0.604, which compares reasonably well with the slope of the straightline equation for the acid in this work. The density of the solvent is more sensitive tovariations in temperature than that of the acid, which leads to an increase in densitydifference, which in turn enhances phase separation.
The viscosities of the phosphoric acid and the solvent are plotted as a function oftemperature in Figs. 3 and 4, respectively. As expected, the decrease in viscosity withtemperature is not linear. The viscosity of a liquid in a temperature range from the

( )K.M. Rawajfeh, A.Kh. Al-MatarrHydrometallurgy 56 2000 309–322312
Fig. 1. Effect of temperature on the density of 28% P O phosphoric acid.2 5
Fig. 2. Effect of temperature on the density of 0.5 M DEPA–0.125 M TOPO diluted in kerosene.

( )K.M. Rawajfeh, A.Kh. Al-MatarrHydrometallurgy 56 2000 309–322 313
Table 1Regression results for the physical properties of phosphoric acid and solvent
Density Viscosity Surface tension
Acid Solvent Acid Solvent Acid Solvent
Ž .Range 8C 8.0–87.0 21.0–60.0 16.0–50.0 15.0–55.0 25.0–60.0 25.0–60.0Intercept 1299 837.7 y2.87 y1.60 55.3 26.7Slope y0.6043 y0.7396 1280 843.0 y0.507 y0.127Correlation coefficient 0.996 0.999 0.987 0.975 0.955 0.903
Ž .Error % 0.2 0.1 4.9 3.6 8.0 2.4
freezing point to somewhere near its normal boiling temperature is often approximatedw xby an Arrhenius type model 18,19 , i.e.,
blnmsaq 2Ž .
T
where T is the absolute temperature and a and b are constants characteristic of liquid.For a pure component, these constants can be related to the Gibbs free energy ofactivation of viscosity based on the molecular theory of liquids. Other correlating
Fig. 3. Effect of temperature on the viscosity of 28% P O phosphoric acid.2 5

( )K.M. Rawajfeh, A.Kh. Al-MatarrHydrometallurgy 56 2000 309–322314
equations are available in the literature describing dependency of viscosity on tempera-w xture 19 . The results of this work are adequately and simply described by the Arrhenius
Ž .type model. The values of the parameters of Eq. 2 are given in Table 1.Fig. 4 also compares the viscosity of Jordanian phosphoric acid to an equivalent
w xFlorida rock acid 17 . The difference between the two acids may be attributed to thefact that no unique wet process phosphoric acid can be produced from different ores,which contain many different impurities; e.g., a small fractional percent of MgO maycause a wide variation in phosphoric acid viscosity. The difference shown in the figureis typical of any phosphoric acid.
The variation of surface tension for phosphoric acid and the solvent is shown in Fig.5. The surface tension of both liquids decreases with increasing temperature. The surfacetension of the acid is more sensitive to changes in temperature than that of the solvent.The results obtained were in the range of similar materials; e.g., for mineral acids therange is typically 40–50 mNrm, while for TBP solutions in kerosene, it is about 25mNrm.
To quantify the effect of temperature on the surface tension, the normal practice inw xthe literature is to assume a linear equation of the following form 19 :
ssaybT
The above equation was used to correlate the changes in surface tension data as afunction of temperature for both liquids. The regression parameters for the acid andsolvent are shown in Table 1.
Fig. 4. Effect of temperature on the viscosity of 0.5 M DEPA–0.125 M TOPO diluted in kerosene.

( )K.M. Rawajfeh, A.Kh. Al-MatarrHydrometallurgy 56 2000 309–322 315
Fig. 5. Effect of temperature on the surface tension of 28% P O phosphoric acid and 0.5 M DEPA–0.125 M2 5
TOPO diluted in kerosene.
3.2. System equilibrium
The extraction of uranium from phosphoric acid by DEPA–TOPO mixture may beŽrepresented by the simplified reaction based on DEPA since TOPO reaction occurs
.within the organic phase :
UOq2 qm HA ~UO A H q2Hq1Ž . 22 2 2 m 2 my2
The distribution coefficient of uranium between the two phases is given by:
Uranium Concentration in Organic PhaseoD sa Uranium Concentration in Aqueous Phase
w xUO A H2 2 m 2 my2oD s 3Ž .a q2UO2
The equilibrium constant for the chemical reaction is given by:
2qw x w xH UO A H2 2 m 2 my2K s 4Ž .mT q2UO HAŽ . 22
This constant can be assumed as a function of temperature only, therefore, it is fixedat a given temperature. Details of the dependence of equilibrium constant are to be

( )K.M. Rawajfeh, A.Kh. Al-MatarrHydrometallurgy 56 2000 309–322316
discussed later. The distribution coefficient can be related to the equilibrium constant byŽ . Ž .substituting Eq. 3 into Eq. 4 , which yields:
mHAŽ . 2oD sK 5Ž .a T 2qw xH
The DEPA in the system is present in excess, therefore, it is reasonable to assumethat its concentration remains constant. Also, it is reasonable to assume that thehydrogen evolved from the reaction does not alter the pH of the system appreciably.
Ž . oTherefore, it can be seen from Eq. 5 that D is constant at a fixed temperature. Ina
other words, it is independent of phase ratio. Consequently, a plot of the U o vs. Ua
should yield a straight line passing through the origin and having a slope equal to thedistribution coefficient. This is exactly what was obtained experimentally. Within theestimated experimental errors, all distribution isotherms followed the above-mentionedbehavior as can be seen in Figs. 6 and 7, respectively.
3.2.1. Effect of EMF on distribution coefficientThe effect of EMF on distribution coefficient at a constant temperature is presented in
Fig. 6. It is seen that the distribution coefficient increases as a result of an increase inEMF of the acid. An increase of about 33% in the distribution coefficient is observed foran EMF change from 350 to 410 mV. This increase is due to the increase in theconcentration of hexavalent form of uranium favoring its extraction by the solvent,which is selective to this state.
Fig. 6. Effect of EMF on the uranium distribution between 28% P O phosphoric acid and 0.5 M2 5
DEPA–0.125 M TOPO diluted in kerosene at 258C.
( )K.M. Rawajfeh, A.Kh. Al-MatarrHydrometallurgy 56 2000 309–322 317
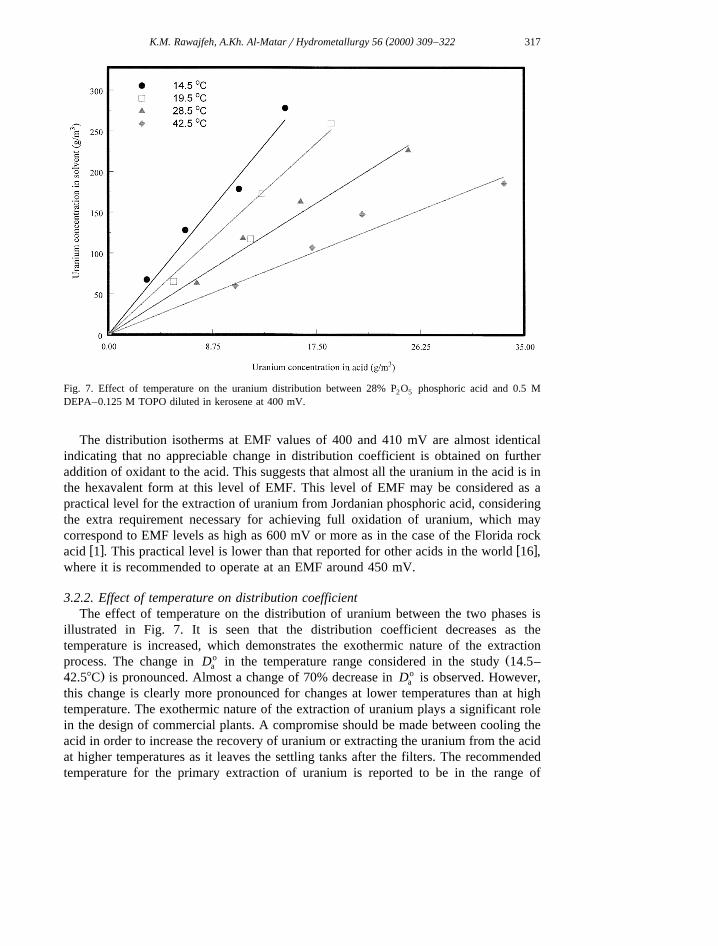
Fig. 7. Effect of temperature on the uranium distribution between 28% P O phosphoric acid and 0.5 M2 5
DEPA–0.125 M TOPO diluted in kerosene at 400 mV.
The distribution isotherms at EMF values of 400 and 410 mV are almost identicalindicating that no appreciable change in distribution coefficient is obtained on furtheraddition of oxidant to the acid. This suggests that almost all the uranium in the acid is inthe hexavalent form at this level of EMF. This level of EMF may be considered as apractical level for the extraction of uranium from Jordanian phosphoric acid, consideringthe extra requirement necessary for achieving full oxidation of uranium, which maycorrespond to EMF levels as high as 600 mV or more as in the case of the Florida rock
w x w xacid 1 . This practical level is lower than that reported for other acids in the world 16 ,where it is recommended to operate at an EMF around 450 mV.
3.2.2. Effect of temperature on distribution coefficientThe effect of temperature on the distribution of uranium between the two phases is
illustrated in Fig. 7. It is seen that the distribution coefficient decreases as thetemperature is increased, which demonstrates the exothermic nature of the extraction
o Žprocess. The change in D in the temperature range considered in the study 14.5–a. o42.58C is pronounced. Almost a change of 70% decrease in D is observed. However,a
this change is clearly more pronounced for changes at lower temperatures than at hightemperature. The exothermic nature of the extraction of uranium plays a significant rolein the design of commercial plants. A compromise should be made between cooling theacid in order to increase the recovery of uranium or extracting the uranium from the acidat higher temperatures as it leaves the settling tanks after the filters. The recommendedtemperature for the primary extraction of uranium is reported to be in the range of

( )K.M. Rawajfeh, A.Kh. Al-MatarrHydrometallurgy 56 2000 309–322318
w x40–458C 1–4,16 . In this range, the distribution coefficient obtained in this study isaround 6. This value is higher than that obtained for similar acids such as Florida rockacid for which the distribution coefficient at this temperature range is reported to bearound 4.5. This higher value suggests that fewer extraction stages may be required forthe extraction of uranium from phosphoric acid produced in Aqaba. An additionaladvantage of a higher distribution coefficient is the higher phase ratio that one can
Ž .operate at, i.e., phase ratios of 2.5 ArO can be used as compared to reportedŽ .international practice where the phase ratio is set at 2.0 ArO , which will reduce the
operating and capital costs of the plant.The effect of temperature on the distribution coefficient can be quantified by making
use of the Vant Hoff equation, which relates the chemical equilibrium constant withtemperature:
Eln K D HTs 6Ž .2ET RT
Ž .With the assumption of constant D H in a narrow temperature range, Eq. 6 can beintegrated to yield:
D Hln K say 7Ž .T RT
Ž .If Eq. 7 is to be valid in its present form, a plot of ln K vs. 1rT should yield astraight line, otherwise, the assumption of constant D H is no longer valid and one has tofind another relation to quantify the effect of temperature on either D H or theequilibrium constant. Previous development led to direct proportionality between Do
aŽ Ž .. oand K Eq. 5 , therefore, a plot of ln D vs. 1rT should also lead to a straight line,T a
which has the following form:
bXoln D sa y 8Ž .a T
in which
2qw xHXa say ln m
HAŽ . 2
bsD HrR
Fig. 8 shows clearly that the behavior of Do as a function of temperature follows theaŽ .pattern predicted by Eq. 8 . From the predicted value of the slope of the line, it is found
that the heat of reaction D H for this system is about 7000 calrg mol. This value isw xwithin the same order of magnitude of the system used by Hurst et al. 1,2 in which the
heat of reaction can be calculated to be around 4750 calrg mol for the reaction ofuranium extraction by 0.2 M DEPA–0.05 M TOPO diluted in NDD. The discrepancy inthe two values may be attributed to the effect of type of diluent and the effect of activitycoefficients, which accumulate in this term.
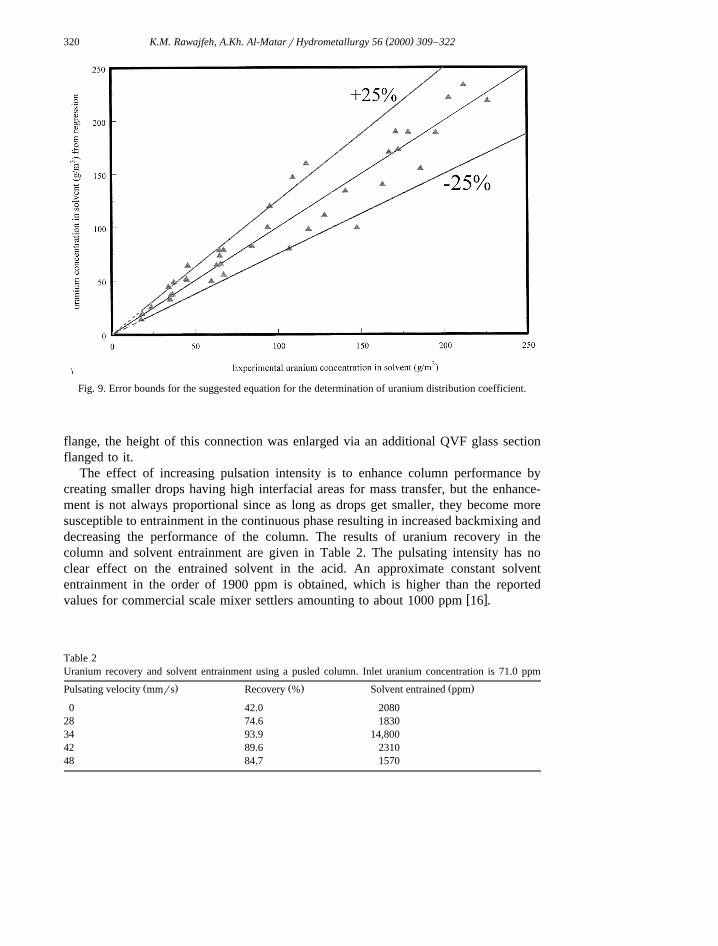
A more convenient method to determine the concentration of uranium in the solventŽ .or distribution coefficient knowing that the concentration in the acid, EMF and

( )K.M. Rawajfeh, A.Kh. Al-MatarrHydrometallurgy 56 2000 309–322 319
Fig. 8. Effect of temperature on the uranium distribution coefficient.
temperature is given by the following equation, which can reproduce the experimentalŽ . Ž .data to within 25% accuracy it is more accurate for the distribution coefficient Fig. 9 .
4237o y7D s4.9647=10 exp 0.00657EMFq 9Ž .a ž /T
This equation is valid for an EMF range from 350 to 410 mV, a temperature range from14.58C to 42.58C, and an aqueous to organic ratio in the range 0.2–5.0.
3.3. Pulsed column study
The quantity of solvent available for the study was limited, therefore, only thepulsation intensity of the column was investigated using the phosphoric acid as thecontinuous phase to minimize solvent use, which result in a c™d direction of masstransfer, and to avoid interfacial turbulence. The phase ratio was kept constant at 2Ž . 3 2ArO with a total throughput of 9.17 m rm Ph. The experiments were carried out atan ambient temperature of 25"18C with an acid EMF of 410 mV. The values of thepulsation intensities investigated were 0, 28, 34, 42, and 48 mmrs at a fixed motorspeed of 60 Hz.
The pulsed column consists of a 50-mm i.d. Corning QVF glass section with a totallength of about 100 cm containing 19 sieve plates with their holes arranged in atriangular pitch. The column is fitted to the upper and lower disengaging section byflanges. A Corning QVF glass tee connection was fitted to the heavy phase settler with a
( )K.M. Rawajfeh, A.Kh. Al-MatarrHydrometallurgy 56 2000 309–322320
Fig. 9. Error bounds for the suggested equation for the determination of uranium distribution coefficient.
flange, the height of this connection was enlarged via an additional QVF glass sectionflanged to it.
The effect of increasing pulsation intensity is to enhance column performance bycreating smaller drops having high interfacial areas for mass transfer, but the enhance-ment is not always proportional since as long as drops get smaller, they become moresusceptible to entrainment in the continuous phase resulting in increased backmixing anddecreasing the performance of the column. The results of uranium recovery in thecolumn and solvent entrainment are given in Table 2. The pulsating intensity has noclear effect on the entrained solvent in the acid. An approximate constant solvententrainment in the order of 1900 ppm is obtained, which is higher than the reported
w xvalues for commercial scale mixer settlers amounting to about 1000 ppm 16 .
Table 2Uranium recovery and solvent entrainment using a pusled column. Inlet uranium concentration is 71.0 ppm
Ž . Ž . Ž .Pulsating velocity mmrs Recovery % Solvent entrained ppm
0 42.0 208028 74.6 183034 93.9 14,80042 89.6 231048 84.7 1570

( )K.M. Rawajfeh, A.Kh. Al-MatarrHydrometallurgy 56 2000 309–322 321
4. Conclusions
In this article, we presented the results of a preliminary investigation of uraniumextraction from Jordanian phosphoric acid using the synergistic solvent: 0.5 M DEPA–0.125 M TOPO diluted in kerosene. Physical properties of both the acid and the solventwere determined as a function of temperature and appropriate equations were deter-mined. The results indicate that the distribution coefficient of uranium is proportional tothe EMF and is inversely proportional to temperature. The results from the pulsedcolumn study show that such systems may provide a promising alternative to theconventional mixer-settler batteries in the removal of uranium from phosphoric acid.
Acknowledgements
The authors wish to thank Engineer Arafat Ghousheh and Dr. Saleh Al-Basheer fromthe JPMC R&D labs for providing the materials and facilities to carry out this project.Also, we would like to thank Mr. Nabih Iriksousi from the instrumental analysis lab atthe chemical engineering department of the University of Jordan for the help in
Ž .analytical procedures and analysis. One of the authors AA wishes to thank hiscolleague Mark Nelson for helpful comments and discussions.
References
w x1 F.J. Hurst, D.J. Crouse, K.B. Brown, Recovery of uranium from wet process phosphoric acid, ORNL-TMŽ .2522 1969 .
w x2 F.J. Hurst, D.J. Crouse, K.B. Brown, Recovery of uranium from wet process phosphoric acid, I&ECŽ . Ž .Process Des. Dev. 11 1 1972 122.
w x3 F.J. Hurst, D.J. Crouse, Recovery of uranium from wet process phosphoric acid by extraction with octylŽ . Ž .phenyl phosphoric acid, I&EC Process Des. Dev. 13 3 1974 286.
w x4 F.J Hurst, D.J. Crouse, Equilibrium and kinetic studies of the reductive stripping of uranium fromŽ .DEPA–TOPO reagent into aqueous phosphoric acid, Hydrometallurgy 13 1984 15.
w x5 F. Habashi, The recovery of uranium from phosphate rock: progress and problems, in: Proceedings of anIMPHOS Conference, Boston, 1980, p. 629.
w x6 Z. Ketzinel et al., A process for the recovery of uranium as a by-product of phosphoric acid via HCLacidulation from undissolved residue, in: Proceedings of Sao Paulo Symposium on the Recovery ofUranium, 17–21 August, 1970, p. 363.
w x7 T.K.S. Murthy, V.N. Pai, R.A. Nagle, Study of some phenyl phosphoric acids for extraction of uraniumfrom phosphoric acid, in: Proceedings of Sao Paulo Symposium on the Recovery of Uranium, 17–21August, 1970, p. 341.
w x8 A. Deleon, M. Lazarevic, Possibilities for recovery of uranium as a by-product in the production ofphosphate fertilizers and tripolyphosphate, in: Proceedings of Sao Paulo Symposium on the Recovery ofUranium, 17–21 August, 1970, p. 351.
w x9 CEP Editors, Sulphuricrphosphoric acid plant operations, in: CEP Technical Manual,1982, pp. 171–206.w x10 P. Noirot, M. Wozniak, Computing of liquid–liquid equilibria: I. Application of a general chemical
model to the extraction of uranium from phosphoric acid by a hydroxyalkyldiphosphonic acid, Hydromet-Ž .allurgy 13 1985 229.

( )K.M. Rawajfeh, A.Kh. Al-MatarrHydrometallurgy 56 2000 309–322322
w x11 P.T. Chiang, The effect of solvent uranium loading on the extraction of iron in the DEPA–TOPOŽ .extraction process for recovering uranium from wet process phosphoric acid, Hydrometallurgy 17 1986
85.w x Ž .12 F. Bunus, P. Dumitrescu, Uranium VI extraction from acid mixtures with organophosphorous esters,
Ž .Hydrometallurgy 16 1986 167.w x13 Vidali, P., Golob, J., Grilc, V., Uranium Extraction in Pilot Plant Differential Extractors, Summer School
on Extraction, Toulouse, 7–11 Sep 1987, p. A-III-1.w x Ž .14 Al-Matar, A. K., Extraction of Uranium from Purified Wet Process Jordanian Phosphoric Acid 28% : A
Study of System Properties and Performance of a Pulsed Sieve Plate Column, MSc thesis in ChemicalEngineering, Faculty of Graduate Studies, University of Jordan, Amman, October, 1993.
w x15 A.K. Al-Matar, K.M. Rawajfeh, A study of extraction equilibrium in the system: phosphoric acidŽ .produced in aqaba–uranium–0.5 M DEPA–0.125 M TOPO diluted in kerosene, Dirasat Pure Apll. Sci.
Ž . Ž .22B 6 1995 1459–1474.w x16 Basheer, S., Uranium extraction from wet process phosphoric acid on a micro pilot plant, Unpublished
Ž .report submitted to JPMC’s administration, 1991 in Arabic .w x17 P. Becker, Phosphates and Phosphoric Acid, Marcel Dekker, 1983.w x18 R. Bird, W. Stewart, E. Lightfoot, Transport Phenomena, Wiley, New York, 1960.w x19 R. Reid, J. Prausnitz, T. Sherwood, in: The Properties of Gases and Liquids, 4th edn., McGraw-Hill, New
York, 1987.
Copyright © 2022 FDOKUMEN