Chemistry and microbiology of the Critical Zone along a steep ...

This article was downloaded by:[Universitetbiblioteket I Trondheim]On: 2 June 2008Access Details: [subscription number 788832638]Publisher: RoutledgeInforma Ltd Registered in England and Wales Registered Number: 1072954Registered office: Mortimer House, 37-41 Mortimer Street, London W1T 3JH, UK
Norsk Geografisk Tidsskrift -Norwegian Journal of GeographyPublication details, including instructions for authors and subscription information:http://www.informaworld.com/smpp/title~content=t713735796
Bed load transport in a steep snowmelt-dominatedmountain stream as inferred from impact sensorsGeir Vatne; Øyvind Takøy Naas; Tommy Skårholen; Achim A. Beylich; IvarBerthling
Online Publication Date: 01 June 2008
To cite this Article: Vatne, Geir, Takøy Naas, Øyvind, Skårholen, Tommy,Beylich, Achim A. and Berthling, Ivar (2008) 'Bed load transport in a steepsnowmelt-dominated mountain stream as inferred from impact sensors', NorskGeografisk Tidsskrift - Norwegian Journal of Geography, 62:2, 66 — 74
To link to this article: DOI: 10.1080/00291950802094817URL: http://dx.doi.org/10.1080/00291950802094817
PLEASE SCROLL DOWN FOR ARTICLE
Full terms and conditions of use: http://www.informaworld.com/terms-and-conditions-of-access.pdf
This article maybe used for research, teaching and private study purposes. Any substantial or systematic reproduction,re-distribution, re-selling, loan or sub-licensing, systematic supply or distribution in any form to anyone is expresslyforbidden.
The publisher does not give any warranty express or implied or make any representation that the contents will becomplete or accurate or up to date. The accuracy of any instructions, formulae and drug doses should beindependently verified with primary sources. The publisher shall not be liable for any loss, actions, claims, proceedings,demand or costs or damages whatsoever or howsoever caused arising directly or indirectly in connection with orarising out of the use of this material.
Dow
nloa
ded
By:
[Uni
vers
itetb
iblio
teke
t I T
rond
heim
] At:
08:0
9 2
June
200
8
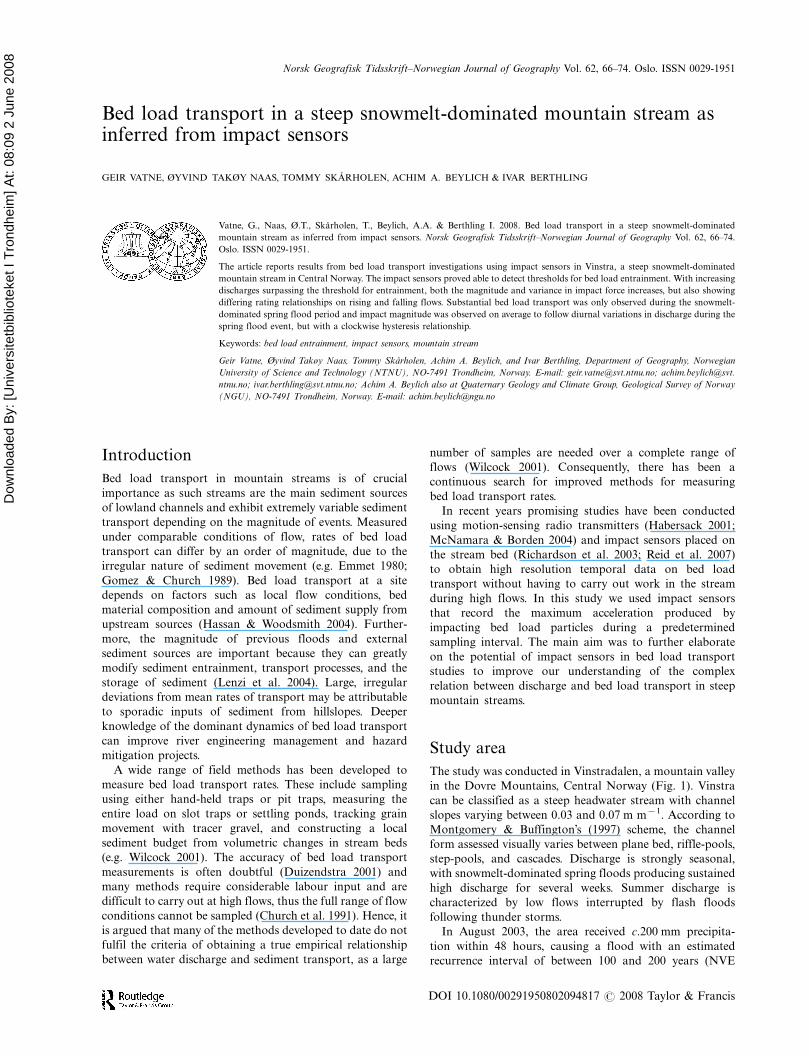
Bed load transport in a steep snowmelt-dominated mountain stream asinferred from impact sensors
GEIR VATNE, ØYVIND TAKØY NAAS, TOMMY SKARHOLEN, ACHIM A. BEYLICH & IVAR BERTHLING
Vatne, G., Naas, Ø.T., Skarholen, T., Beylich, A.A. & Berthling I. 2008. Bed load transport in a steep snowmelt-dominated
mountain stream as inferred from impact sensors. Norsk Geografisk Tidsskrift�Norwegian Journal of Geography Vol. 62, 66�74.
Oslo. ISSN 0029-1951.
The article reports results from bed load transport investigations using impact sensors in Vinstra, a steep snowmelt-dominated
mountain stream in Central Norway. The impact sensors proved able to detect thresholds for bed load entrainment. With increasing
discharges surpassing the threshold for entrainment, both the magnitude and variance in impact force increases, but also showing
differing rating relationships on rising and falling flows. Substantial bed load transport was only observed during the snowmelt-
dominated spring flood period and impact magnitude was observed on average to follow diurnal variations in discharge during the
spring flood event, but with a clockwise hysteresis relationship.
Keywords: bed load entrainment, impact sensors, mountain stream
Geir Vatne, Øyvind Takøy Naas, Tommy Skarholen, Achim A. Beylich, and Ivar Berthling, Department of Geography, Norwegian
University of Science and Technology (NTNU), NO-7491 Trondheim, Norway. E-mail: [email protected]; achim.beylich@svt.
ntnu.no; [email protected]; Achim A. Beylich also at Quaternary Geology and Climate Group, Geological Survey of Norway
(NGU), NO-7491 Trondheim, Norway. E-mail: [email protected]
Introduction
Bed load transport in mountain streams is of crucial
importance as such streams are the main sediment sources
of lowland channels and exhibit extremely variable sediment
transport depending on the magnitude of events. Measured
under comparable conditions of flow, rates of bed load
transport can differ by an order of magnitude, due to the
irregular nature of sediment movement (e.g. Emmet 1980;
Gomez & Church 1989). Bed load transport at a site
depends on factors such as local flow conditions, bed
material composition and amount of sediment supply from
upstream sources (Hassan & Woodsmith 2004). Further-
more, the magnitude of previous floods and external
sediment sources are important because they can greatly
modify sediment entrainment, transport processes, and the
storage of sediment (Lenzi et al. 2004). Large, irregular
deviations from mean rates of transport may be attributable
to sporadic inputs of sediment from hillslopes. Deeper
knowledge of the dominant dynamics of bed load transport
can improve river engineering management and hazard
mitigation projects.
A wide range of field methods has been developed to
measure bed load transport rates. These include sampling
using either hand-held traps or pit traps, measuring the
entire load on slot traps or settling ponds, tracking grain
movement with tracer gravel, and constructing a local
sediment budget from volumetric changes in stream beds
(e.g. Wilcock 2001). The accuracy of bed load transport
measurements is often doubtful (Duizendstra 2001) and
many methods require considerable labour input and are
difficult to carry out at high flows, thus the full range of flow
conditions cannot be sampled (Church et al. 1991). Hence, it
is argued that many of the methods developed to date do not
fulfil the criteria of obtaining a true empirical relationship
between water discharge and sediment transport, as a large
number of samples are needed over a complete range of
flows (Wilcock 2001). Consequently, there has been a
continuous search for improved methods for measuring
bed load transport rates.
In recent years promising studies have been conducted
using motion-sensing radio transmitters (Habersack 2001;
McNamara & Borden 2004) and impact sensors placed on
the stream bed (Richardson et al. 2003; Reid et al. 2007)
to obtain high resolution temporal data on bed load
transport without having to carry out work in the stream
during high flows. In this study we used impact sensors
that record the maximum acceleration produced by
impacting bed load particles during a predetermined
sampling interval. The main aim was to further elaborate
on the potential of impact sensors in bed load transport
studies to improve our understanding of the complex
relation between discharge and bed load transport in steep
mountain streams.
Study area
The study was conducted in Vinstradalen, a mountain valley
in the Dovre Mountains, Central Norway (Fig. 1). Vinstra
can be classified as a steep headwater stream with channel
slopes varying between 0.03 and 0.07 m m�1. According to
Montgomery & Buffington’s (1997) scheme, the channel
form assessed visually varies between plane bed, riffle-pools,
step-pools, and cascades. Discharge is strongly seasonal,
with snowmelt-dominated spring floods producing sustained
high discharge for several weeks. Summer discharge is
characterized by low flows interrupted by flash floods
following thunder storms.
In August 2003, the area received c.200 mm precipita-
tion within 48 hours, causing a flood with an estimated
recurrence interval of between 100 and 200 years (NVE
Norsk Geografisk Tidsskrift�Norwegian Journal of Geography Vol. 62, 66�74. Oslo. ISSN 0029-1951
DOI 10.1080/00291950802094817 # 2008 Taylor & Francis

Dow
nloa
ded
By:
[Uni
vers
itetb
iblio
teke
t I T
rond
heim
] At:
08:0
9 2
June
200
8
2003). The flood damaged the railway and the main road
connecting Central and Southern Norway. Massive slope
destabilization followed the precipitation event, and more
than 50 debris flows were triggered, delivering in the order
of 8900 m3 of sediment to the stream channel (Onsøyen
2005). The present study is part of a series of investiga-
tions to study the effect and consequences of this extreme
event on hillslope-channel coupling and fluvial sediment
transport.
The Vinstra valley follows a fault zone which divides the
valley into two geologically distinct zones. Ordovician-
Silurian greywacke, siltstone and clay schist’s dominate
the eastern side of the stream, whereas less resistant
phyllites, mica-schists, and some garbenschists and gneisses
dominate the western side (NGU1). The schists produce a
high proportion of disc-shaped pebbles and cobbles which
are found in both the colluviums and the stream channel.
Steep valley slopes (in many places exceeding 358) with a
thick cover of till and colluviums cause extensive mass
wasting, with debris flows being a dominant process
causing extensive hillslope-channel coupling (Fig. 1). The
dominant control of river behaviour is thus the down-
stream variation in slope, bedrock and sediment supply
from mass wasting, which causes variations in bed load
transport, temporal sediment storage and channel mor-
phology.
The 75 m reach studied is located at 900 m a.s.l. and has
a drainage area of 25 km2. The channel is steep (: 0.06)
and consists of 11 steps and pool segments (Fig. 2) with
channel width varying from 7 m to 11 m. The stream
running between the steps contains pebbles and cobbles
with occasional boulders (D16 26 mm, D50 55 mm and
D85 mm, n�550). The bed has a high proportion of disc-
shaped particles (60%, n�118) with a densely packed
imbricated armouring layer. Steps are formed around key
stones with b axis ranging from 300 mm to 1300 mm,
which have not been observed to be mobilized since spring
2004. A few key stones seem to be large immobile colluvial
blocks.
Methods
A few previous studies have reported on the use of
continuous logging impact sensors that detect the number
of impacts on a steel plate fixed flush with the channel bed
after the plate is struck by a particle in motion (Richardson
et al. 2003; Reid et al. 2007). Impact sensors have previously
been found to be useful for studying the timing of sediment
entrainment and transfer cessation, and the relative inten-
sities of transport over time (Reid et al. 2007).
We used Gemini Tinytag Plus data loggers2 (TGP-0610) of
cubic dimensions 34�68�73 mm and weighing 140 g, to
measure the maximum acceleration caused by impacting
particles in a given sampling interval. The instrument
measures impacts along one axis from the lid to its base
using a piezoelectric sensor, and has a reading range of
0�100 g (980 ms�2) and a sensitivity and accuracy of 0.4 g
(3.5 ms�2), thus it is capable of measuring impacts of gravel
down to 10 mm (intermediate axis). The sensors were
mounted on aluminium plates of dimensions 150�150�2
mm that were perforated by 3�6 holes of 15 mm diameter.
The aluminium plates were then mounted on the upstream
side of boulders in the range 32�55 kg which were deployed
on the stream bed (Fig. 3). As bed load is commonly routed
along well-defined and narrow pathways within upland
rivers (Richardson et al. 2003), five sensors were deployed
along what was observed to be the thalweg over the reach at
flows less than 1 m3s�1. During the spring melt it was
observed that what was the thalweg during low flows was
not necessary the main sediment transport route during high
flows. The impact sensors were installed on 9 May 2007 and
were programmed to store the maximum acceleration at
one-minute intervals. The loggers were downloaded at least
every 11 days until 24 June, when the sensors were
reprogrammed to five-minute sample intervals which re-
quired downloading only every 50 days. No attempt has
been made to calibrate the impact sensors thoroughly as
only brief testing of their sensitivity has been carried out. In
the following discussion we are aware that any impact of a
given magnitude can be generated by a range of flows,
Fig. 1. An example of the high degree of coupling of the hillslope system with
the fluvial system in Vinstradalen following the 2003 extreme rainfall event.
Insert shows the location of Vinstradalen in the central mountains of Norway.
Fig. 2. Step-pool sequences in the upper part of the studied reach in Vinstra,
in the Dovre Mountains, Central Norway.
NORSK GEOGRAFISK TIDSSKRIFT 62 (2008) Bed load transport inferred from impact sensors 67

Dow
nloa
ded
By:
[Uni
vers
itetb
iblio
teke
t I T
rond
heim
] At:
08:0
9 2
June
200
8
particle shapes and particle sizes, and that there is probably
no straightforward relationship between impact magnitude
and particle size. Nevertheless, we argue that an overall
increase in mean impact magnitude reflects an increase in
average particle sizes impacting on the sensor. Moreover, as
the sensor is limited to recording impacts up to 1000 ms�2,
impacts at the upper end of the scale will be truncated, hence
influencing average values calculated from samples contain-
ing maximum values. It should also be emphasized that the
results from the impact sensors do not contain information
on the number of particles in transport, as only maximum
acceleration is measured. Thus, any large impact probably
masks a number of smaller impacts.
Stream stage was measured using a Global Water WL400
pressure transducer vented to the atmosphere to correct for
atmospheric pressure variations, and logged at 10-minute
intervals using a Campbell CR200 data logger. Stage was
converted to discharge using rating curves based upon the
salt dilution method due to the turbulent nature of the
channel.
Results
Figure 4 shows the seasonal hydrograph for 2007. Peak
discharge of 12.3 m3s�1 was recorded on the evening of 31
May after a steep rise in flow followed by several days of
sustained high flows showing pronounced diurnal cycles.
The summer was dry and discharge was characterized by
general flow recession from spring snowmelt and low flows
interrupted by a few substantial flash floods. Good quality
data from the impact sensors were obtained from 9 May
until 21 May, 6 June until 24 June, and from 31 July until 25
September, as at least one impact logger was working
properly and had not been moved by the flow. The impact
sensors only recorded sporadic and small impacts
(B30 ms�2) from when they were installed 9 May until 21
May. During peak spring flooding on 31 May all ‘impact
boulders’ were entrained and moved out of position, hence
reliable data do not exist for this event. The site was revisited
on 2 June and the impact boulders were relocated. During
the periods 9 May until 24 June and 31 July until 25
September, bed load transport was observed to take place
approximately 15% of the time, being concentrated in the
main snowmelt period, during which flows were substan-
tially higher than in any other period. Impact data are
lacking for the two substantial flash floods that occurred in
July, but some data exist from the recession following the
flood on 31 July exist from one of the sensors, showing
sediment transport as discharge at c.2 m3s�1. In the
following, the focus will be on the period 2�13 June, when
flow was high and good quality data for two impact sensors.
Figure 5 shows the flow hydrograph and impact magnitudes
for the two sensors that were stable during this period, with
parallel scatter plots for discharge�impact magnitude
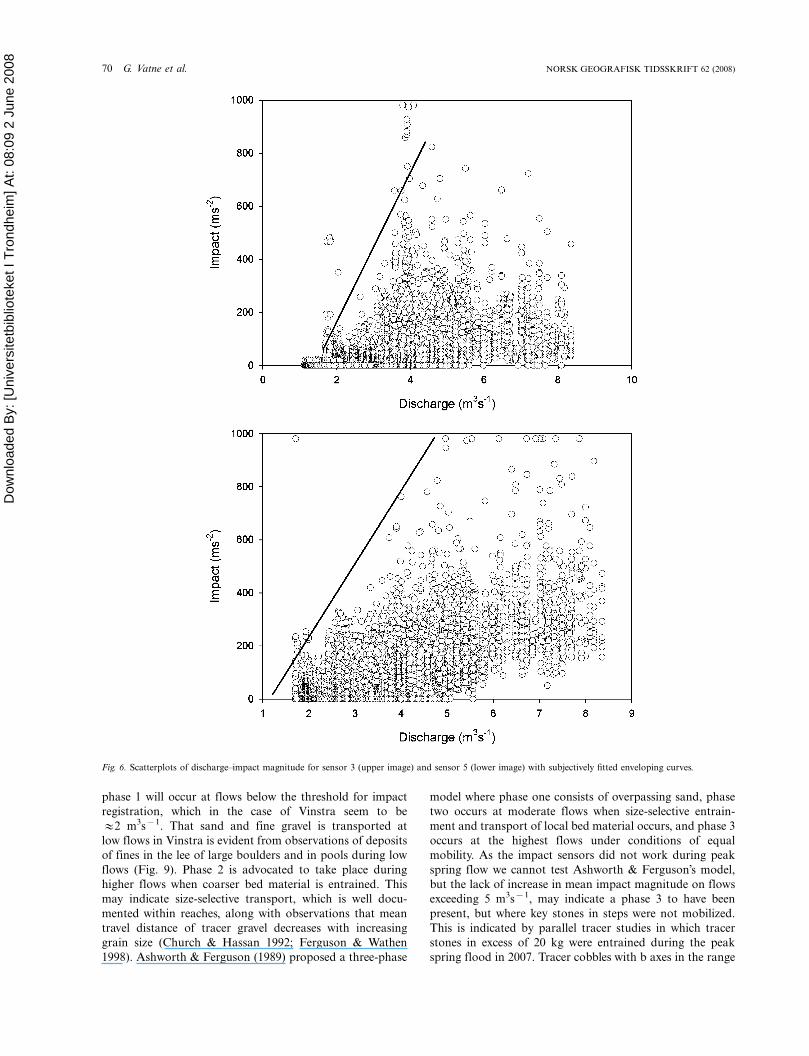
(Fig. 6). The data strongly indicate limited bed load
transport for flows less than 1�2 m3s�1, in accordance
with the data from 1 August until 25 September which
hardly contained registered impacts for any sensor. The
number and magnitude of impacts recorded when flows
surpassed this threshold show a rapid increase in both
average impact magnitude for defined flow intervals and
impact standard deviation (Table 1). At flows exceeding
5 m3s�1, the number of sampling intervals without regis-
tered impacts is very low, suggesting continuous bed load
transport. An enveloping curve can be drawn for maximum
impacts recorded at any given discharge (Fig. 6). The
number of impacts near the enveloping curve is low, with
mean impact magnitude being less than one-third of the
maximum impact recorded at a given flow. Exemplified by
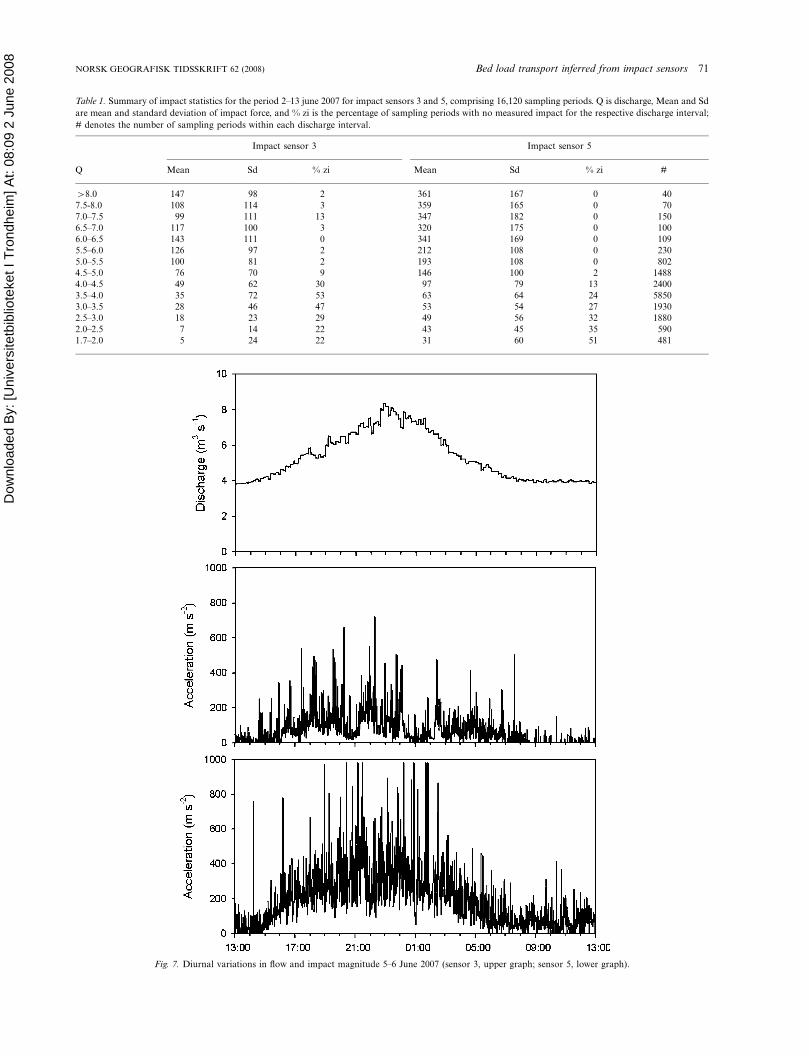
the diurnal flow cycle with highest relative discharge
variations, starting on 5 June (Fig. 7) an overall good
correlation between discharge and average impact magni-
tude is revealed, although the average impact magnitude is
generally higher on the rising stage (280 ms�2 sensor 5, 123
ms�2 sensor 3) than during the falling stage (147 ms�2
sensor 3, 48 ms�2 sensor 5). The data do, however,
demonstrate bed load transport to have a large stochastic
element, as impact magnitude varies by two magnitudes
when flow exceeds 4 m3s�1. Flow plotted against smoothed
impact force using a 60 minutes moving average (Fig. 8)
Fig. 4. Seasonal flow hydrograph at the study site in Vinstra 2007.
Fig. 3. The impact sensors mounted on boulders deployed on the stream bed.
The impact sensors were mounted on the downstream side of aluminium
plates :150 *150 mm perforated with 3�5 holes of 15 mm diameter. The
aluminium plate protruded 50 mm from the boulder. The boulders were
deployed with the aluminium plates installed flush with the stream bed.
68 G. Vatne et al. NORSK GEOGRAFISK TIDSSKRIFT 62 (2008)

Dow
nloa
ded
By:
[Uni
vers
itetb
iblio
teke
t I T
rond
heim
] At:
08:0
9 2
June
200
8
show a clockwise hysteresis for both sensors. The hysteresis
is less pronounced for discharges exceeding 7 ms�1.
Relation between discharge and bed loadtransport
We have examined the discharge�bed load transport
relationship in a gravel bed stream using impact magnitude
sensors mounted on large boulders deployed on the stream
bed’s upstream steps in a step-pool reach in a Norwegian
mountain stream. In an attempt to obtain high resolution
temporal variation in bed load transport, maximum impact
was logged every minute during the spring melt period when
discharge was observed to be highest.
The scatter plots of discharge�impact magnitude and the
calculated mean impact values for steps of 0.5 m3s�1
increase in discharge indicate a clear phase change for bed
load transport occurring at flows of :2 m3s�1 at these
specific reaches. As the sensitivity of the impact sensor is
sufficient to detect particles in the order of 10 mm
(intermediate axis) this phase change can be interpreted as
the threshold for incipient motion of bed load transport
having been surpassed. The significant increase in impact
magnitude with increasing flows and the parallel reduction
in number of sampling periods with no impacts recorded
clearly indicate increased bed load transport rates with
increasing flows. It also follows that if one accepts that
average impact magnitude is correlated with average particle
size, the data indicate size-selective transport over the range
of discharges observed.
These observations are in accordance with previous field
measurements that have identified bed load to take place in
two or three phases (Jackson & Beschta 1982; Andrews
1983; Ashworth & Ferguson 1989; Warburton 1992; Wil-
cock 1997). Phase 1 is found at low flows and is proposed to
consist of overpassing sand. Moving sand cannot be
registered by the impact sensors used in this study, hence
Fig. 5. Flow hydrograph and impact magnitude for two impact sensors (sensor 3, middle graph; sensor 5, lower graph) from 2�13 June, when diurnal flow cycles
were particularly well developed.
NORSK GEOGRAFISK TIDSSKRIFT 62 (2008) Bed load transport inferred from impact sensors 69
Dow
nloa
ded
By:
[Uni
vers
itetb
iblio
teke
t I T
rond
heim
] At:
08:0
9 2
June
200
8
phase 1 will occur at flows below the threshold for impact
registration, which in the case of Vinstra seem to be
:2 m3s�1. That sand and fine gravel is transported at
low flows in Vinstra is evident from observations of deposits
of fines in the lee of large boulders and in pools during low
flows (Fig. 9). Phase 2 is advocated to take place during
higher flows when coarser bed material is entrained. This
may indicate size-selective transport, which is well docu-
mented within reaches, along with observations that mean
travel distance of tracer gravel decreases with increasing
grain size (Church & Hassan 1992; Ferguson & Wathen
1998). Ashworth & Ferguson (1989) proposed a three-phase
model where phase one consists of overpassing sand, phase
two occurs at moderate flows when size-selective entrain-
ment and transport of local bed material occurs, and phase 3
occurs at the highest flows under conditions of equal
mobility. As the impact sensors did not work during peak
spring flow we cannot test Ashworth & Ferguson’s model,
but the lack of increase in mean impact magnitude on flows
exceeding 5 m3s�1, may indicate a phase 3 to have been
present, but where key stones in steps were not mobilized.
This is indicated by parallel tracer studies in which tracer
stones in excess of 20 kg were entrained during the peak
spring flood in 2007. Tracer cobbles with b axes in the range
Fig. 6. Scatterplots of discharge�impact magnitude for sensor 3 (upper image) and sensor 5 (lower image) with subjectively fitted enveloping curves.
70 G. Vatne et al. NORSK GEOGRAFISK TIDSSKRIFT 62 (2008)
Dow
nloa
ded
By:
[Uni
vers
itetb
iblio
teke
t I T
rond
heim
] At:
08:0
9 2
June
200
8
Table 1. Summary of impact statistics for the period 2�13 june 2007 for impact sensors 3 and 5, comprising 16,120 sampling periods. Q is discharge, Mean and Sd
are mean and standard deviation of impact force, and % zi is the percentage of sampling periods with no measured impact for the respective discharge interval;
# denotes the number of sampling periods within each discharge interval.
Impact sensor 3 Impact sensor 5
Q Mean Sd % zi Mean Sd % zi #
�8.0 147 98 2 361 167 0 40
7.5-8.0 108 114 3 359 165 0 70
7.0�7.5 99 111 13 347 182 0 150
6.5�7.0 117 100 3 320 175 0 100
6.0�6.5 143 111 0 341 169 0 109
5.5�6.0 126 97 2 212 108 0 230
5.0�5.5 100 81 2 193 108 0 802
4.5�5.0 76 70 9 146 100 2 1488
4.0�4.5 49 62 30 97 79 13 2400
3.5�4.0 35 72 53 63 64 24 5850
3.0�3.5 28 46 47 53 54 27 1930
2.5�3.0 18 23 29 49 56 32 1880
2.0�2.5 7 14 22 43 45 35 590
1.7�2.0 5 24 22 31 60 51 481
Fig. 7. Diurnal variations in flow and impact magnitude 5�6 June 2007 (sensor 3, upper graph; sensor 5, lower graph).
NORSK GEOGRAFISK TIDSSKRIFT 62 (2008) Bed load transport inferred from impact sensors 71

Dow
nloa
ded
By:
[Uni
vers
itetb
iblio
teke
t I T
rond
heim
] At:
08:0
9 2
June
200
8
329�441 mm had a recovery rate of 60% with a mean travel
length of 10.5 m (T. Skarholen, unpublished data).
Hysteresis effects is clearly present in the relation between
flow and impact magnitude during pronounced diurnal flow
cycles, as they show pronounced clockwise hysteresis loops
(Fig. 8). This result is similar to observations made using pit-
type sediment traps (Hassan & Church 2001) and motion-
sensing radio transmitters (McNamara & Borden 2004).
Hassan & Church (2001) showed that for certain discharges
sediment transport rates during rising stage were generally
higher than during falling stage, and that coarse material
mobilized and ceased motion much more abruptly than fine
material. However, they did not find the same pattern for
high flows. McNamara & Borden (2004), on the other hand,
showed that rocks were two to seven times more likely to
move on rising hydrograph limbs than on falling hydrograph
limbs. In Vinstra it is also evident that the largest difference
in impact magnitude for rising and falling flows occurs on
Fig. 8. Clockwise hysteresis loops in discharge�impact magnitude relationship of two independent impact sensors (filled circles � sensor 3, open circles � sensor 5),
during the diurnal flow cycle on 5 and 6 June.
Fig. 9. Temporal storage of sand and fine gravel within the stream channel.
72 G. Vatne et al. NORSK GEOGRAFISK TIDSSKRIFT 62 (2008)

Dow
nloa
ded
By:
[Uni
vers
itetb
iblio
teke
t I T
rond
heim
] At:
08:0
9 2
June
200
8
the lower part of the diurnal flow peaks, which is in line with
observations made by Hassan & Church (2001).
Stochastic nature of bed load transport
The temporal variations in impact magnitude show a very
high variation within single flow cycles, and even on
individual rising and falling limbs of daily flow cycles,
generally producing poor rating relationships between flow
and impact magnitude. This can be attributed to several
factors. Firstly, the individual impact sensors monitor only
1�2% of the stream’s cross-sectional width. The large
temporal variation thus probably relates to the small
sampling area which is not representative of the entire
cross-section, a problem similar to that observed for bed
load samplers (Church et al. 1987). The poor covariance and
relatively large difference in average impact magnitude
between the two sensors over the period 2�13 June further
demonstrate the sensitivity of such devices to their location
on the stream bed. This clearly shows that a number of
sensors are needed over a cross-section in order to obtain
reliable estimates of bed load transport.
The highly variable impact magnitude recorded over short
time spans during flow cycles is explained by the laboratory
observations made by Einstein (1937), who proposed that
once entrained, the transport of bed load is a stochastic
process in which particles move along the bed in discrete
steps, separated by rest periods, until final deposition. The
stochastic nature of intervening rest and transport periods
stems from a number of factors, including particle shape,
embedding, relative size, boundary roughness, and the many
ways in which turbulent flow imparts lift and drag forces on
a particle. This behaviour has been confirmed in natural
streams by McNamara & Borden (2004) where motion
groups were identified. The relatively wide range of particles
sizes that characterize step-pool sections further complicates
the sediment transport process as the mobility difference
between large and small particles in the bed is reduced
(Gintz et al. 1996). In any given sample period when critical
boundary shear stress is exceeded for a given particle size
(Shields 1936), Einstein’s (1937) observations suggest that
parts of the population will be in motion and parts will be at
rest.
Conclusions
The use of impact magnitude sensors in studying bed load
transport is promising as they provide high temporal
resolution data without the necessity for wading in the
stream. The impact sensor clearly shows potential for
identifying flow thresholds for sediment entrainment and
for studying the presence of hysteresis effects in discharge�bed load relationships.
In future studies emphasis should be on research design,
calibration and testing different types of impact sensors so
that grain-size rating curves can be constructed. One
problem with the impact sensor used in this study is that
only the maximum acceleration during a sampling period
was recorded. During high intensity transport events with
many high energy impacts, many small impacts are masked
by the higher impacts during the same period, hence
transport rates cannot be estimated. The sensors therefore
have the greatest potential when used in combination with
other methods, such as impact counting sensors, pit and
hand-held samplers, tracer studies, etc. Although the intense
temporal sampling that is possible with the impact sensors
may reduce the number of sensors required in such studies, a
number of impact sensors should be used to obtain spatial
resolution of bed load transport.
Notes1 Geological Survey of Norway, Trondheim (www.ngu.no accessed 30 March
2007)2 Tinytag Plus Shock (0�100 g) (www.geminidataloggers.com accessed
October 2007)
Acknowledgements. � D. Gintz and M. Hassan are thanked for their reviews of
this paper which resulted in considerable improvement to it.
Manuscript submitted 23 April 2007; accepted 5 December 2007
References
Andrews, E.D. 1983. Entrainment of gravel from naturally sorted river bed
material. Geological Society of America Bulletin 94, 1225�1231.
Ashworth, P.J. & Ferguson, R.I. 1989. Size-selective entrainment of bed-load
in gravel bed streams. Water Resources Research 25:4, 627�634.
Church, M. & Hassan, M.A. 1992. Size and distance of travel of
unconstrained clasts on a streambed. Water Resources Research 28:1,
299�303.
Church, M., McLean, D.G. & Wolcott, J.F. 1987. River bed gravels: Sampling
and analysis. Thorne, C.R., Bathurst, J.C. & Hey, R.D. (eds.) Sediment
Transport in Gravel-bed Rivers, 43�48. John Wiley, New York.
Church, M., Wolcott, J.F. & Fletcher, W.K. 1991. A test of equal mobility in
fluvial sediment transport: Behaviour of the sand fraction. Water Resources
Research 27:11, 2941�2951.
Duizendstra, H.D. 2001. Determination of the sediment transport in an
armoured gravel-bed river. Earth Surface Processes and Landforms 26:13,
1381�1393.
Einstein, H.A. 1937. Der Geschiebetrieb als Wahrscheinlichkeitsproblem.
Mitteilungen der Versuchsanstalt fur Wasserbau an der ETH, 3�112. Verlag
Rascher, Zurich.
Emmet, W.W. 1980. A field calibration of the sediment trapping character-
istics of the Helley-Smith bedload sampler. U.S. Geological Survey
Professional Paper 1139.
Ferguson, R.I. & Wathen, S.J. 1998. Tracer-pebble movement along a concave
river profile: Virtual velocity in relation to grain size and shear stress. Water
Resources Research 34:8, 2031�2038.
Gintz, D., Hassan, M.A. & Schmidt, K.H. 1996. Frequency and magnitude of
bed load transport in a mountain river. Earth Surface Processes and
Landforms 21:5, 433�445.
Gomez, B. & Church, M. 1989. An assessment of bed-load sediment
transport formulas for gravel bed rivers. Water Resources Research 25:6,
1161�1186.
Habersack, H.M. 2001. Radio-tracking gravel particles in a large braided
river in New Zealand: A field test of the stochastic theory of bed load
transport proposed by Einstein. Hydrological Processes 15:3, 377�391.
Hassan, M.A. & Church, M. 2001. Sensitivity of bed load transport in Harris
Creek: Seasonal and spatial variation over a cobble-gravel bar. Water
Resources Research 37:3, 813�825.
NORSK GEOGRAFISK TIDSSKRIFT 62 (2008) Bed load transport inferred from impact sensors 73

Dow
nloa
ded
By:
[Uni
vers
itetb
iblio
teke
t I T
rond
heim
] At:
08:0
9 2
June
200
8
Hassan, M.A. & Woodsmith, R.D. 2004. Bed load transport in an
obstruction-formed pool in a forest, gravelbed stream. Geomorphology
58:1-4, 203�221.
Jackson, W.L. & Beschta, R.L. 1982. A model of two-phase bed load
transport in an Oregon Coast Range stream. Earth Surface Processes and
Landforms 7: 517�527.
Lenzi, M.A., Mao, L. & Comiti, F. 2004. Magnitude-frequency analysis of
bed load data in an Alpine boulder bed stream. Water Resources Research
40:7, 257�276.
McNamara, J.P. & Borden, C. 2004. Observations on the movement of coarse
gravel using implanted motion-sensing radio transmitters. Hydrological
Processes 18:10, 1871�1884.
Montgomery, D.R. & Buffington, J.M. 1997. Channel-reach morphology in
mountain drainage basins. Geological Society of America Bulletin 109:5,
596�611.
NVE [Norges vassdrags- og energidirektorat]. 2003. Hydrologisk maned-
soversikt, August 2003. Norwegian Water Resources and Energy Directo-
rate, Oslo.
Onsøyen, R. 2005. Flomskred i Vinstradalen. Master avhandling (Master’s
thesis), Norwegian University of Science and Technology, Trondheim.
Reid, S.C., Lane, S.N., Berney, J.M. & Holden, J., 2007. The timing and
magnitude of coarse sediment transport events within an upland, temperate
gravel-bed river. Geomorphology 83:1-2, 152�182.
Richardson, K., Benson, I. & Carling, P.A. 2003. An instrument to record
sediment movement in bedrock channels. Bogen, J., Fergus, T. & Walling,
D.E. (eds.) Erosion and Sediment Transport Measurement in Rivers:
Technological and Methodological Advances, 164�171. IAHS/AISH, Oslo.
Shields, A. 1936. Anwendung der aenlichkeitsmechanik und der turbulenz-
forschung auf die geschiebebewegung. Mitteilungen der PreussischenVer-
suchsanstalt fur Wasserbau und Schiffbau, Heft 26. Preussischen
Versuchsanstalt fur Wasserbau und Schiffbau, Berlin.
Warburton, J. 1992. Observation of bed load transport and channel bed
changes in a proglacial mountain stream. Arctic and Alpine Research 24,
195�203.
Wilcock, P.R. 1997. The components of fractional transport rate. Water
Resources Research 33:1, 247�258.
Wilcock, P.R. 2001. Toward a practical method for estimating sediment-
transport rates in gravel-bed rivers. Earth Surface Processes and Landforms
26:13, 1395�1408.
74 G. Vatne et al. NORSK GEOGRAFISK TIDSSKRIFT 62 (2008)
Copyright © 2022 FDOKUMEN