
BDDDE.pdf - Oracle Help Center
438
Oracle ® Big Data Discovery Cloud Service Studio User's Guide E65365-05 November 2016
-
Upload
khangminh22 -
Category
Documents
-
view
3 -
download
0
Transcript of BDDDE.pdf - Oracle Help Center

Oracle® Big Data Discovery Cloud ServiceStudio User's Guide
E65365-05
November 2016

Oracle Big Data Discovery Cloud Service Studio User's Guide,
E65365-05
Copyright © 2016, 2016, Oracle and/or its affiliates. All rights reserved.
This software or hardware is developed for general use in a variety of information management applications.It is not developed or intended for use in any inherently dangerous applications, including applications thatmay create a risk of personal injury. If you use this software or hardware in dangerous applications, then youshall be responsible to take all appropriate fail-safe, backup, redundancy, and other measures to ensure itssafe use. Oracle Corporation and its affiliates disclaim any liability for any damages caused by use of thissoftware or hardware in dangerous applications.
If this is software or related documentation that is delivered to the U.S. Government or anyone licensing it onbehalf of the U.S. Government, then the following notice is applicable:
U.S. GOVERNMENT END USERS: Oracle programs, including any operating system, integrated software,any programs installed on the hardware, and/or documentation, delivered to U.S. Government end users are"commercial computer software" pursuant to the applicable Federal Acquisition Regulation and agency-specific supplemental regulations. As such, use, duplication, disclosure, modification, and adaptation of theprograms, including any operating system, integrated software, any programs installed on the hardware,and/or documentation, shall be subject to license terms and license restrictions applicable to the programs.No other rights are granted to the U.S. Government.
This software or hardware is developed for general use in a variety of information management applications.It is not developed or intended for use in any inherently dangerous applications, including applications thatmay create a risk of personal injury. If you use this software or hardware in dangerous applications, then youshall be responsible to take all appropriate fail-safe, backup, redundancy, and other measures to ensure itssafe use. Oracle Corporation and its affiliates disclaim any liability for any damages caused by use of thissoftware or hardware in dangerous applications.
Oracle and Java are registered trademarks of Oracle and/or its affiliates. Other names may be trademarks oftheir respective owners.
Intel and Intel Xeon are trademarks or registered trademarks of Intel Corporation. All SPARC trademarks areused under license and are trademarks or registered trademarks of SPARC International, Inc. AMD, Opteron,the AMD logo, and the AMD Opteron logo are trademarks or registered trademarks of Advanced MicroDevices. UNIX is a registered trademark of The Open Group.
This software or hardware and documentation may provide access to or information about content, products,and services from third parties. Oracle Corporation and its affiliates are not responsible for and expresslydisclaim all warranties of any kind with respect to third-party content, products, and services unlessotherwise set forth in an applicable agreement between you and Oracle. Oracle Corporation and its affiliateswill not be responsible for any loss, costs, or damages incurred due to your access to or use of third-partycontent, products, or services, except as set forth in an applicable agreement between you and Oracle.

Contents
Preface .............................................................................................................................................................. xiii
About this guide ........................................................................................................................................ xiii
Audience ..................................................................................................................................................... xiii
Conventions................................................................................................................................................ xiii
Contacting Oracle Customer Support .................................................................................................... xiv
Part I Overview of Studio
1 Signing In and Managing Your Account
Signing in to Studio .................................................................................................................................. 1-1
Resetting your password ......................................................................................................................... 1-2
Changing your password ........................................................................................................................ 1-2
About locales ............................................................................................................................................. 1-3
Configuring the locale for your account ....................................................................................... 1-4
Selecting a locale from the user menu........................................................................................... 1-5
2 Using the Studio Catalog
About the Catalog..................................................................................................................................... 2-1
Browsing data sets and projects ............................................................................................................. 2-2
Filtering and searching data sets and projects...................................................................................... 2-3
Editing data set or project names, descriptions, and tags................................................................... 2-4
Part II Searching and Filtering in Studio
3 Searching in Studio
About Studio search ................................................................................................................................. 3-1
Displaying and using the results of a search ........................................................................................ 3-2
About keyword searches ......................................................................................................................... 3-4
About Boolean searches ........................................................................................................................... 3-6
Enabling or disabling full text search and typeahead search on an attribute.................................. 3-8
iii

4 Filtering Based on Refinements
About using refinements for filtering .................................................................................................... 4-1
Selecting refinement values for filtering ............................................................................................... 4-2
Selecting a range of refinement values .................................................................................................. 4-4
Selecting a recurring date/time.............................................................................................................. 4-5
About implicit refinements ..................................................................................................................... 4-7
Managing Selected Refinements............................................................................................................. 4-7
About the Selected Refinements panel .................................................................................................. 4-7
Removing refinements from the Selected Refinements panel ........................................................... 4-9
Part III Managing Data Sets
5 Managing a Data Set
Options for loading data into Studio ..................................................................................................... 5-1
About creating a data set in the Catalog ............................................................................................... 5-2
Creating a data set from a file......................................................................................................... 5-3
Creating a data set from a JDBC data source ............................................................................... 5-5
About updating a data set in the Catalog ............................................................................................. 5-6
Updating a data set from a file ....................................................................................................... 5-7
Updating a data set from a JDBC data source.............................................................................. 5-8
Setting attribute metadata in data sets .................................................................................................. 5-9
About notifications for data set changes ............................................................................................. 5-11
Managing access to a data set ............................................................................................................... 5-13
Deleting a data set................................................................................................................................... 5-15
6 Exploring a Data Set
About exploring a data set ..................................................................................................................... 6-1
Selecting the data to explore ................................................................................................................... 6-2
Switching Explore between tile view and table view.......................................................................... 6-2
Filtering and sorting displayed attributes in Explore or Transform................................................. 6-3
Working with an individual attribute in Explore ................................................................................ 6-4
Using the scratchpad................................................................................................................................ 6-5
Keyboard shortcuts for Scratchpad ....................................................................................................... 6-9
Part IV Creating and Configuring Projects
7 Creating, Localizing, and Deleting Projects
About projects ........................................................................................................................................... 7-1
Creating a project...................................................................................................................................... 7-2
Localizing the project name, description, page names, and component titles ................................ 7-2
Deleting a project using the Catalog ...................................................................................................... 7-3
iv

8 Managing Access to Projects
Project and User Roles ............................................................................................................................. 8-1
Project Types ............................................................................................................................................. 8-2
Assigning project roles............................................................................................................................. 8-3
9 Managing Project Pages
Adding a page to a project ...................................................................................................................... 9-1
Renaming a page....................................................................................................................................... 9-2
Changing the page layout ....................................................................................................................... 9-2
Changing the data set binding for a page ............................................................................................. 9-3
Deleting a page.......................................................................................................................................... 9-3
Adding and deleting components on a page........................................................................................ 9-3
Part V Viewing and Using Projects
10 Navigating Within a Project
Navigating to a project........................................................................................................................... 10-1
Navigating within a project................................................................................................................... 10-1
Displaying information about the project data .................................................................................. 10-2
11 Creating and Using Bookmarks
About bookmarks ................................................................................................................................... 11-1
Displaying and navigating to bookmarks........................................................................................... 11-2
Creating, editing, and deleting bookmarks ........................................................................................ 11-2
Generating bookmark links................................................................................................................... 11-4
Emailing bookmark links....................................................................................................................... 11-4
Bookmark data saved for each component and panel ...................................................................... 11-5
12 Creating and Managing Snapshots
About snapshots and snapshot galleries ............................................................................................. 12-1
Displaying the list of snapshots and snapshot galleries ................................................................... 12-1
Creating and managing individual snapshots ................................................................................... 12-2
Creating a snapshot........................................................................................................................ 12-2
Managing saved snapshots........................................................................................................... 12-3
Exporting the entire snapshot list......................................................................................................... 12-5
Emailing the entire snapshot list ......................................................................................................... 12-6
Creating and managing snapshot galleries......................................................................................... 12-6
Creating a snapshot gallery .......................................................................................................... 12-6
Editing and deleting snapshot galleries...................................................................................... 12-8
Emailing a snapshot gallery.......................................................................................................... 12-9
Exporting a snapshot gallery to a PDF file ................................................................................ 12-9
v

Part VI Managing Project Data
13 Managing Project Data Sets
Adding a data set to an existing project .............................................................................................. 13-1
Loading the full data set in a project.................................................................................................... 13-2
Configuring a project data set for incremental updates .................................................................. 13-3
Converting a project to a BDD Application ....................................................................................... 13-5
Removing a data set from a project...................................................................................................... 13-6
14 Linking Project Data Sets
About data set links................................................................................................................................ 14-1
Creating a data set link .......................................................................................................................... 14-2
Editing a link key .................................................................................................................................... 14-5
Managing aggregation methods for a linked view............................................................................ 14-6
Controlling automatic filtering between linked data sets .............................................................. 14-10
15 Defining Project Data Set Views
About views............................................................................................................................................. 15-2
About base views.................................................................................................................................... 15-2
About linked views ................................................................................................................................ 15-2
Displaying the list of views for a project............................................................................................. 15-4
Displaying details for a view ................................................................................................................ 15-5
Creating views......................................................................................................................................... 15-6
Creating a new view ...................................................................................................................... 15-6
Copying an existing data view..................................................................................................... 15-7
Configuring a view............................................................................................................................... 15-10
Editing and localizing the view display name and description ............................................ 15-10
Editing the view definition ......................................................................................................... 15-12
Guidelines for using EQL to define a view .............................................................................. 15-12
Configuring the view attributes ................................................................................................. 15-16
Defining predefined metrics for a view .................................................................................... 15-29
Previewing the content of a view ....................................................................................................... 15-32
Deciding whether to publish a custom view .................................................................................... 15-33
Deleting a view...................................................................................................................................... 15-33
16 Managing Attribute Groups for a Project
About attribute groups and the Attribute Groups page................................................................... 16-1
About groups for linked views............................................................................................................. 16-2
Displaying the groups for a selected view.......................................................................................... 16-4
Displaying attribute information for a group..................................................................................... 16-5
Displaying the list of attributes for a group ............................................................................... 16-5
Displaying the full list of metadata values for an attribute ..................................................... 16-6
vi

Selecting the metadata columns to display for each attribute ................................................. 16-6
Creating an attribute group................................................................................................................... 16-7
Deleting an attribute group................................................................................................................... 16-7
Configuring an attribute group ............................................................................................................ 16-8
Changing the group name and use.............................................................................................. 16-8
Configuring the group membership ........................................................................................... 16-9
Configuring the sort order for a group ..................................................................................... 16-10
Saving the attribute group configuration and reloading the attribute group cache................... 16-11
17 Exporting Project Data Sets
About exporting project data ................................................................................................................ 17-1
Exporting project data............................................................................................................................ 17-2
Part VII Transforming Project Data
18 Overview of Transforming Project Data
About transformations and transformation scripts ........................................................................... 18-2
About the Transform page user interface ........................................................................................... 18-3
Transformation script workflow .......................................................................................................... 18-4
Transformations workflow diagram.................................................................................................... 18-4
About Groovy.......................................................................................................................................... 18-5
About transform functions .................................................................................................................... 18-6
Transform locking................................................................................................................................... 18-6
Preview mode.......................................................................................................................................... 18-7
19 Transforming Project Data Sets
Overview of transforming an attribute ............................................................................................... 19-2
Transform page controls........................................................................................................................ 19-2
Toggling the Transform data grid view...................................................................................... 19-2
Filtering and sorting the displayed attributes and values ....................................................... 19-3
Displaying whitespace characters in attribute values............................................................... 19-4
Basic transform operations.................................................................................................................... 19-5
Splitting String attribute values ................................................................................................... 19-6
Trimming spaces from String values........................................................................................... 19-6
Selecting subsets of date/time values ......................................................................................... 19-7
Changing the capitalization of String values ............................................................................. 19-7
Performing mathematical operations on numeric values ........................................................ 19-8
Conversion transform operations......................................................................................................... 19-8
Changing the data type of an attribute ....................................................................................... 19-8
Advanced transform operations........................................................................................................... 19-9
Obtaining geocode information from attribute values ........................................................... 19-10
Extracting parts of a date from attribute values ...................................................................... 19-13
Extracting names of people, places, or organizations from attribute values....................... 19-15
vii

Extracting key phrases from attribute values .......................................................................... 19-15
Providing a whitelist to extract terms from attribute values ................................................. 19-16
Binning numeric attribute values............................................................................................... 19-17
Grouping attribute values........................................................................................................... 19-18
Managing null values .................................................................................................................. 19-19
Shaping transform operations ............................................................................................................ 19-20
Filtering records from the project data set................................................................................ 19-21
Deleting an attribute .................................................................................................................... 19-22
About aggregating attribute values........................................................................................... 19-23
Aggregating attribute values ...................................................................................................... 19-24
About joining data sets ................................................................................................................ 19-26
Joining data sets............................................................................................................................ 19-27
Creating custom transformations....................................................................................................... 19-30
Creating a custom transformation ............................................................................................. 19-30
Writing custom transform code ................................................................................................ 19-31
Exception handling and debugging .......................................................................................... 19-37
Managing and executing the transformation script ........................................................................ 19-41
Reordering, editing, and deleting transformations................................................................. 19-41
Running the transformation script against a project data set ................................................ 19-42
Creating a new data set from the transformed data........................................................................ 19-43
Sharing a transform script ................................................................................................................... 19-44
Publishing a transformation script ............................................................................................ 19-44
Loading a transformation script................................................................................................. 19-45
Un-publishing a transformation script...................................................................................... 19-46
Tips for better performance................................................................................................................. 19-46
20 Transform Function Reference
Data types ................................................................................................................................................ 20-1
Data type conversions ............................................................................................................................ 20-2
Groovy reserved keywords and unsupported functions.................................................................. 20-3
Conditional statements and multi-assign values ............................................................................... 20-5
List of transform functions .................................................................................................................... 20-8
Conversion functions..................................................................................................................... 20-8
Date functions ................................................................................................................................. 20-9
Enrichment functions................................................................................................................... 20-13
Geocode functions........................................................................................................................ 20-25
Math functions .............................................................................................................................. 20-26
Set functions .................................................................................................................................. 20-28
String functions............................................................................................................................. 20-29
URL functions ............................................................................................................................... 20-33
viii

Part VIII Working with Components
21 Component Overview
Component list ........................................................................................................................................ 21-1
Common component controls............................................................................................................... 21-7
Paging through data ...................................................................................................................... 21-7
Using a component to refine data ................................................................................................ 21-8
Displaying details for a component item.................................................................................. 21-10
Comparing items within a component ..................................................................................... 21-10
Printing component data............................................................................................................. 21-12
Exporting data from a component............................................................................................. 21-13
Common component configuration workflows............................................................................... 21-14
About configuring components ................................................................................................. 21-15
Renaming a component............................................................................................................... 21-15
Configuring attribute value formats.......................................................................................... 21-16
Selecting the aggregation method to use for a metric............................................................. 21-20
Configuring cascading for dimension refinement................................................................... 21-21
About the component Actions menu................................................................................................. 21-22
Selecting the actions to include in the Actions menu.............................................................. 21-23
Configuring actions for attribute values ................................................................................... 21-24
About component hyperlinks..................................................................................................... 21-27
About using non-HTTP protocol links...................................................................................... 21-27
Selecting the target page for a refinement or hyperlink ......................................................... 21-27
Recommendations for attribute values that are complete URLs........................................... 21-29
Indicating whether to encode inserted attribute values ......................................................... 21-30
Configuring hyperlinks to external URLs ................................................................................ 21-31
Configuring a Pass Parameters Actions menu action............................................................. 21-31
22 Containers
Adding a Column Container ................................................................................................................ 22-1
Adding a Tabbed Container.................................................................................................................. 22-2
23 Data Record Displays
Results List............................................................................................................................................... 23-1
Sorting records in a Results List ................................................................................................... 23-2
Configuring a Results List............................................................................................................. 23-3
Results Table............................................................................................................................................ 23-7
About the Results Table layout .................................................................................................... 23-8
Configuring a Results Table........................................................................................................ 23-12
Using Results Table values to refine the data .......................................................................... 23-30
Navigating to other URLs from a Results Table ...................................................................... 23-30
Exporting data from a Results Table ......................................................................................... 23-30
ix

24 Charts
Chart ......................................................................................................................................................... 24-1
Bar chart ........................................................................................................................................... 24-4
Line / Area chart ............................................................................................................................ 24-6
Pie / Sunburst chart ....................................................................................................................... 24-7
Scatter chart ..................................................................................................................................... 24-8
Bar-Line chart................................................................................................................................ 24-13
Thematic Map ............................................................................................................................... 24-14
Configuring a Chart ..................................................................................................................... 24-18
Saving a snapshot of a chart ....................................................................................................... 24-23
Histogram Plot ...................................................................................................................................... 24-24
Selecting Histogram Plot data and display options ................................................................ 24-25
Box Plot................................................................................................................................................... 24-25
Selecting Box Plot data................................................................................................................. 24-27
Parallel Coordinates Plot ..................................................................................................................... 24-27
Refining Parallel Coordinates Plot data.................................................................................... 24-29
Selecting Parallel Coordinates Plot data ................................................................................... 24-30
25 Other Data Visualizations
Map ........................................................................................................................................................... 25-1
Configuring the Map connection to Oracle MapViewer .......................................................... 25-2
Using the Map................................................................................................................................. 25-3
Configuring the Map ..................................................................................................................... 25-9
Pivot Table ............................................................................................................................................. 25-18
Using the Pivot Table................................................................................................................... 25-18
Configuring the Pivot Table........................................................................................................ 25-21
Summarization Bar ............................................................................................................................... 25-27
Configuring Summarization Bar display options ................................................................... 25-29
Adding, renaming, and deleting summary items ................................................................... 25-29
Configuring a metric value summary item .............................................................................. 25-31
Configuring a dimension value spotlight................................................................................. 25-32
Configuring metric and dimension value display and actions ............................................. 25-34
Configuring conditional formatting .......................................................................................... 25-35
Configuring flag summary items............................................................................................... 25-36
Tag Cloud............................................................................................................................................... 25-39
Configuring Tag Cloud display options ................................................................................... 25-40
Selecting and configuring dimensions ...................................................................................... 25-41
Configuring term size and order................................................................................................ 25-42
Configuring available metrics .................................................................................................... 25-43
Timeline.................................................................................................................................................. 25-44
Adding and editing metric timelines ........................................................................................ 25-45
Setting the displayed date unit and date range for the metric timelines ............................. 25-47
x

Saving the current timeline configuration as the default ....................................................... 25-48
26 Web-Based Content
IFrame....................................................................................................................................................... 26-1
Configuring an IFrame .................................................................................................................. 26-2
Web Content Display ............................................................................................................................. 26-3
Configuring a Web Content Display ........................................................................................... 26-3
Index
xi

xii

Preface
Oracle Big Data Discovery is a set of end-to-end visual analytic capabilities thatleverage the power of Apache Spark to turn raw data into business insight in minutes,without the need to learn specialist big data tools or rely only on highly skilledresources. The visual user interface empowers business analysts to find, explore,transform, blend and analyze big data, and then easily share results.
About this guideThis guide contains information about using Oracle Big Data Discovery to explore,analyze, and transform data.
AudienceThis guide is written for business analysts and data scientists who want to explore,analyze, and transform data within the Hadoop ecosystem.
Oracle Big Data Discovery is designed for those who look for insights in data:
• Data Analyst
• Data Scientist
• Analytics Manager
• Problem Solver
• Casual Analyst
ConventionsThe following conventions are used in this document.
Typographic conventions
The following table describes the typographic conventions used in this document.
Typeface Meaning
User Interface Elements This formatting is used for graphical user interface elementssuch as pages, dialog boxes, buttons, and fields.
Code Sample This formatting is used for sample code segments within aparagraph.
xiii

Typeface Meaning
Variable This formatting is used for variable values.For variables within a code sample, the formatting isVariable.
File Path This formatting is used for file names and paths.
Symbol conventions
The following table describes symbol conventions used in this document.
Symbol Description Example Meaning
> The right anglebracket, or greater-than sign, indicatesmenu item selectionsin a graphic userinterface.
File > New > Project From the File menu,choose New, thenfrom the Newsubmenu, chooseProject.
Path variable conventions
This table describes the path variable conventions used in this document.
Path variable Meaning
$ORACLE_HOME Indicates the absolute path to your Oracle Middleware homedirectory, where BDD and WebLogic Server are installed.
$BDD_HOME Indicates the absolute path to your Oracle Big Data Discoveryhome directory, $ORACLE_HOME/BDD-<version>.
$DOMAIN_HOME Indicates the absolute path to your WebLogic domain homedirectory. For example, if your domain is named bdd-<version>_domain, then $DOMAIN_HOME is$ORACLE_HOME/user_projects/domains/bdd-<version>_domain.
$DGRAPH_HOME Indicates the absolute path to your Dgraph home directory,$BDD_HOME/dgraph.
Contacting Oracle Customer SupportOracle customers that have purchased support have access to electronic supportthrough My Oracle Support. This includes important information regarding Oraclesoftware, implementation questions, product and solution help, as well as overallnews and updates from Oracle.
You can contact Oracle Customer Support through Oracle's Support portal, My OracleSupport at https://support.oracle.com.
xiv

Part IOverview of Studio


1Signing In and Managing Your Account
Studio users may have access through Single Sign-On integration, or they may haveaccounts specific to Studio.
Signing in to StudioNavigating to Studio results in automatic login when using Single Sign-On. If your Studio deployment does not use SSO authentication, youmust sign in with either your Studio or LDAP credentials.
Resetting your passwordIf you forget your Studio password, then you can have Studio reset itand email it to you. Studio cannot reset LDAP passwords.
Changing your passwordIf you log in using a Studio account, you can use the My Account pageto change your password.
About localesStudio is available in multiple locales. The locale determines thelanguage that you see on the screen, as well as the default formatting fordata values such as numbers and dates.
Signing in to StudioNavigating to Studio results in automatic login when using Single Sign-On. If yourStudio deployment does not use SSO authentication, you must sign in with either yourStudio or LDAP credentials.
Note: A Studio Administrator can create and manage users and groupsdirectly, or they can configure access through an external user managementsystem. For details about the two approaches to user accounts, including howto integrate with LDAP and single sign-on (SSO), see the Administrator's Guide.
To sign in to Studio:
1. Navigate to Studio.
If Single Sign-On authentication is enabled, you are automatically logged in to theapplication. Otherwise, the Welcome page appears.
2. Type your email address or username in the top field, as prompted.
A BDD deployment is configured to take one value or the other. Check the fieldlabel to verify that you have entered the required information.
Signing In and Managing Your Account 1-1

3. In the Password field, type your Studio password.
4. Click Sign In.
Resetting your passwordIf you forget your Studio password, then you can have Studio reset it and email it toyou. Studio cannot reset LDAP passwords.
To reset your password:
1. Click the Forgot your password? link.
The Forgot Your Password? dialog displays.
2. In the Email Address field, type your email address.
This must be the address associated with your Studio account.
3. In the Text Verification field, type the Captcha displayed above the field.
4. Click Send New Password.
Studio resets your password and sends it to the provided email address.
Changing your passwordIf you log in using a Studio account, you can use the My Account page to change yourpassword.
Note: If you use Single Sign-On or LDAP authentication, you must reset yourpassword within the respective system. You cannot reset an SSO or LDAPpassword from within Studio.
To change your Studio password:
Resetting your password
1-2 Studio User's Guide

1. In the right corner of Studio, click User Options > My Account.
The My Account page displays.
2. In the Password field, type the new password.
3. In the Retype Password field, type the new password again.
4. To save the new password, click Save.
Studio verifies that the values you typed matched and that the new password isvalid.
About localesStudio is available in multiple locales. The locale determines the language that you seeon the screen, as well as the default formatting for data values such as numbers anddates.
Studio is configured with a default locale, but you may choose to override it for youraccount.
Big Data Discovery supports the following locales:
• Chinese - Simplified
About locales
Signing In and Managing Your Account 1-3
• English - UK
• English - US
• Japanese
• Korean
• Portuguese - Brazilian
• Spanish
Note that this is a subset of the languages supported by the Dgraph.
For more details on how Studio determines the locale and how to configure theavailable and default locales, see the Administrator's Guide.
Configuring the locale for your accountWhen an administrator first creates an account, the preferred locale is setto Use Browser Locale, which indicates to use the browser locale forStudio. If Studio doesn't support the browser locale, then Studio uses itsdefault locale.
Selecting a locale from the user menuThe user menu includes an option to select a locale.
Configuring the locale for your accountWhen an administrator first creates an account, the preferred locale is set to UseBrowser Locale, which indicates to use the browser locale for Studio. If Studio doesn'tsupport the browser locale, then Studio uses its default locale.
Restricted Users cannot access the My Account menu. If you are a Restricted User, see Selecting a locale from the user menu.
To select a different preferred locale for your account:
1. From the user menu, select My Account.
The My Account page displays.
About locales
1-4 Studio User's Guide
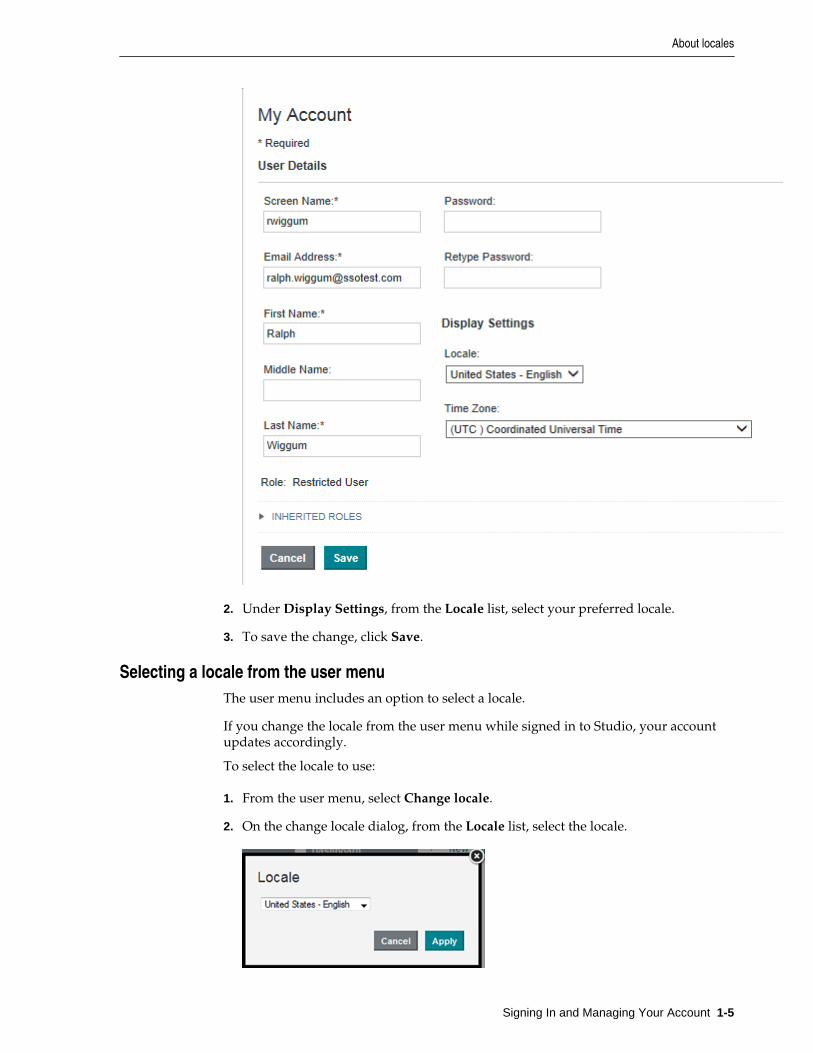
2. Under Display Settings, from the Locale list, select your preferred locale.
3. To save the change, click Save.
Selecting a locale from the user menuThe user menu includes an option to select a locale.
If you change the locale from the user menu while signed in to Studio, your accountupdates accordingly.
To select the locale to use:
1. From the user menu, select Change locale.
2. On the change locale dialog, from the Locale list, select the locale.
About locales
Signing In and Managing Your Account 1-5

3. Click Apply.
Studio displays in the selected locale. This includes:
• User interface labels
• Names of attributes displayed on components
• Values of attributes
• Formatting of data values
Values listed on the Selected Refinements panel are not affected.
If you are signed in, then your account also updates to use the locale as yourpreferred locale.
About locales
1-6 Studio User's Guide

2Using the Studio Catalog
The Catalog is the main entry point for Studio. It provides access to all projects anddata sets that you have permission to access. Clicking the logo in the header bringsyou back to the Catalog from any location in Studio.
About the CatalogThe Catalog lets you browse, search, and filter across data sets andprojects in Studio.
Browsing data sets and projectsFrom the Catalog, you can sort displayed items and get additionalinformation about each project and data set.
Filtering and searching data sets and projectsYou can view the full lists of data sets and projects on the Catalog. Youcan also use the Refine By panel to filter the lists, or use the search fieldto search for a project or data set.
Editing data set or project names, descriptions, and tagsFrom the Catalog, you can rename a data set or project, add or edit thedescription, and add or remove searchable tags.
About the CatalogThe Catalog lets you browse, search, and filter across data sets and projects in Studio.
Each project and data set is represented by a tile. Clicking directly on a project or dataset name takes you to that project or data set, while clicking elsewhere on the tileopens a collapsible detail pane.
From the Catalog, you can:
• Search and filter data sets and projects. Once you locate a data set or project thatyou are interested in, you can browse its metadata before exploring the data set orproject itself.
• Edit data set and project names, descriptions, and searchable tags.
• Create or delete data sets and projects for which you have administrator privileges.
The Projects tab
Projects are sets of pages containing visualizations such as charts and tables. They areused to visualize data from one or more data sets.
The Catalog opens to the Projects tab by default. If you haven't searched or filtered thelist, the Projects tab displays groups of:
• Recently Viewed Projects - Projects you have viewed recently
Using the Studio Catalog 2-1
• Most Popular Projects - Projects that are viewed the most by all users
To display a list of projects you have access to, click Projects.
The Data Sets tab
Data sets are collections of data that you can explore and add to projects.
If you haven't searched or filtered the list, the Data Sets tab displays groups of:
• Recently Viewed Data Sets - Data sets you've used recently
• Most Popular Data Sets - Data sets that are used the most by all users
• Newly Added Data Sets - Data sets that were added most recently
To display the list of data sets you have access to, click Data Sets. Restricted users donot have permission to view Data Sets.
Browsing data sets and projectsFrom the Catalog, you can sort displayed items and get additional information abouteach project and data set.
Icons used on the Catalog tiles
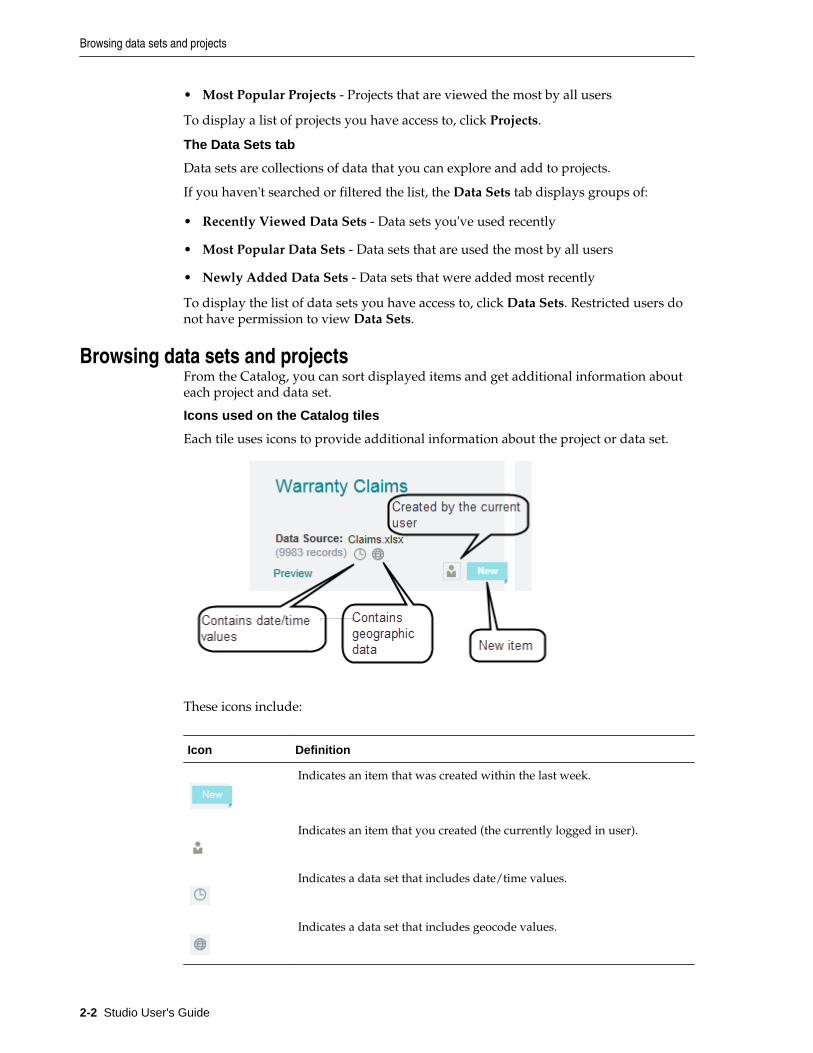
Each tile uses icons to provide additional information about the project or data set.
These icons include:
Icon Definition
Indicates an item that was created within the last week.
Indicates an item that you created (the currently logged in user).
Indicates a data set that includes date/time values.
Indicates a data set that includes geocode values.
Browsing data sets and projects
2-2 Studio User's Guide

Displaying a preview of a data set
The Preview link for each data set displays a small sample (the first 15 records and 50attributes) of the data set.
Displaying details for a data set or project
Clicking the tile displays a panel with additional details about an item, including:
• Description, if available
• Tags
• Types of attributes in a data set, or in data sets used in the selected project
• Who created it and when
• Available actions
• Number of views
• When it was last updated
• For projects:
– Data sets used in the project
– Pages in the project
– Number of snapshots and bookmarks
• For data sets:
– Data source
– Origin system name and type
– Data set permissions
– Projects where the data set is used
– Other data sets used in the same projects as this data set
You can use the paging icons at the left and right to page through the details panelsfor the previous or next data set or project.
In addition to accessing the details from the tile, you can also display a subset of thedetails by clicking the Show Data Set Properties icon in the Explore or Transformscreens.
Filtering and searching data sets and projectsYou can view the full lists of data sets and projects on the Catalog. You can also usethe Refine By panel to filter the lists, or use the search field to search for a project ordata set.
Displaying the full list of projects or data sets
From the Catalog, to display the full list of projects or data sets, click the View all linkon the Projects or Data Sets tab, or the View more link for the project or data setgroups.
Filtering and searching data sets and projects
Using the Studio Catalog 2-3

Filtering the Catalog lists
The Refine By panel provides options for filtering the Catalog lists.
For projects, many of the refinement options apply to included data sets. For example,when you refine the Catalog to only show items with geocode attributes, projects areincluded in the results if a project data set includes a geocode attribute.
The available refinements for the Catalog are grouped into the following categories:
Refine By Category Description
Projects Filter based on project details including the name, searchabletags, the creator, and the creation or modification dates.
Data Sets Filter based on data set details or contents. In addition to thename, tags, creator, and creation/modification dates you canalso filter by the number of records or attributes or by specificdatetime or geocode information.
Attributes Filter based on attributes within a data set. These include rawattribute names, standardized names, attribute tags, andsemantic types.
Data Sources Filter based on the types of source systems used to providedata. For example, you can limit results to data from Hadoop,or data uploaded from delimited files.
For details on using refinements for filtering, see Filtering Based on Refinements.
Searching the Catalog
You can use the search field to search for Catalog items. See Searching in Studio.
Sorting data sets or projects
If you have searched or filtered on the Catalog or clicked the View All / View Morelinks, a SORT dropdown is present to the far right of the Projects and Data Sets tabs.
To sort the results, select the value to use for the sort:
• Name - The project or data set name
• Created Date/ Recently Added - The project or data set creation date
• Most Popular - The number of unique visitors to a project or data set
To switch between ascending and descending order, click the sort order icon.
Editing data set or project names, descriptions, and tagsFrom the Catalog, you can rename a data set or project, add or edit the description,and add or remove searchable tags.
Tags are words or phrases that provide meaningful information about a data set orproject. You can add one or more tags to a data set or a project. Once you add a tag,you can then find data sets and projects that contain those tags using the Catalogsearch feature or by using the Refine By feature against either Project Tag or Data SetTag.
To edit data set or project names, descriptions, and tags:
Editing data set or project names, descriptions, and tags
2-4 Studio User's Guide

1. In the Catalog, locate the data set or project you want to modify.
2. Click the tile to open the details panel.
3. To rename a data set or project:
a. Click the title.
b. Modify the title text.
c. Press Enter.
The name updates to the new value.
4. To add a description:
a. Click the description field below the title.
The title opens to an editable text field.
b. Enter or modify the description.
c. Press Enter.
The description updates to the new value.
5. To add a tag:
a. Click the text field below the Tags heading.
b. Type the tag text.
Autocomplete may display suggested results in the tag field.
c. Press Enter to add the tag.
The tag is added to the tag list.
d. Optionally, continue to add tags.
6. To remove a tag, click its delete icon.
Editing data set or project names, descriptions, and tags
Using the Studio Catalog 2-5

Editing data set or project names, descriptions, and tags
2-6 Studio User's Guide

Part IISearching and Filtering in Studio


3Searching in Studio
The Studio search feature provides quick access to data sets, projects, pages, and datafrom throughout Studio.
About Studio searchYou can access the search box from anywhere in Studio.
Displaying and using the results of a searchTo start a search, begin typing your search text into the search box. Asyou type, Studio displays matching search results.
About keyword searchesWhen you complete a keyword search in a project, the data is refined toonly include records with the matching search terms. In the Catalog, thelist of projects and data sets are filtered to only include items with thematching search terms.
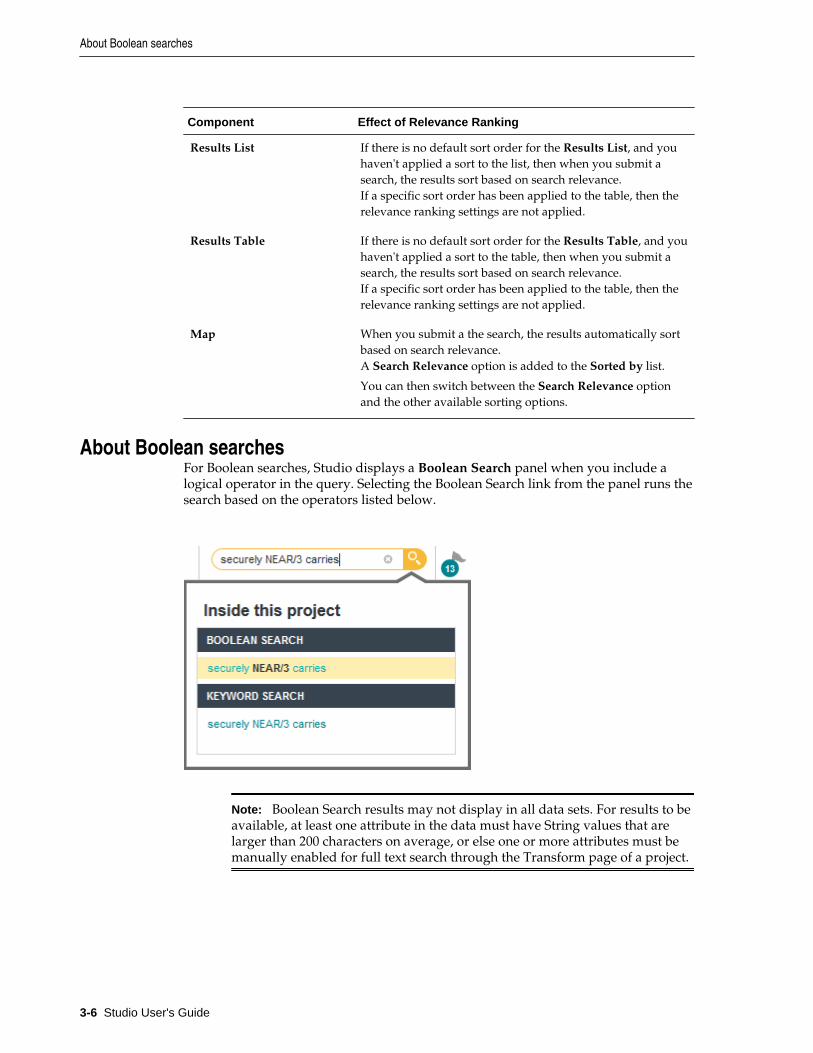
About Boolean searchesFor Boolean searches, Studio displays a Boolean Search panel when youinclude a logical operator in the query. Selecting the Boolean Search linkfrom the panel runs the search based on the operators listed below.
Enabling or disabling full text search and typeahead search on an attributeEach String attribute can be individually enabled or disabled for full textand typeahead search. By default, String attributes that are longer thanapproximately 200 characters are enabled for full text search anddisabled for typeahead search, while attributes shorter than 200characters are enabled for typeahead search and disabled for full textsearch.
About Studio searchYou can access the search box from anywhere in Studio.
You can run a keyword search from:
• The Catalog - Search against project or data set details such as name, description,or searchable tags. Search matches that correspond to an attribute filtering valueare highlighted in the Refine By sidebar.
• Data Sets and Project Data Sets - Search against String attribute values.
Note: The String attribute must be enabled for either full text search ortypeahead search. If an attribute is not searchable in a data set, you must addthe data set to a project in order to modify attribute metadata and enablesearch and/or typeahead on the attribute. For more information, see Enablingor disabling full text search and typeahead search on an attribute.
Searching in Studio 3-1

• Discover pages within a project - Filter visualizations by searching againstattribute names and values. The results panel also displays suggested filterrefinements that match the keyword search.
• Control Panel pages - Search against pages in the Control Panel. For example,searching for "user" shows results for the Users and User Groups pages.
Results may also include "Did You Mean" suggestions, automatic spelling correction,and typeahead suggestions.
Displaying and using the results of a searchTo start a search, begin typing your search text into the search box. As you type,Studio displays matching search results.
The search results are divided into panels to reflect the different types of results.
For searches from the Catalog, the results are also divided into results from data sets,projects, project refinements (tags), and keyword search.
Each section contains a different type of search result. Each type of result has anassociated action you can perform from that result. The possible search results include:
Displaying and using the results of a search
3-2 Studio User's Guide
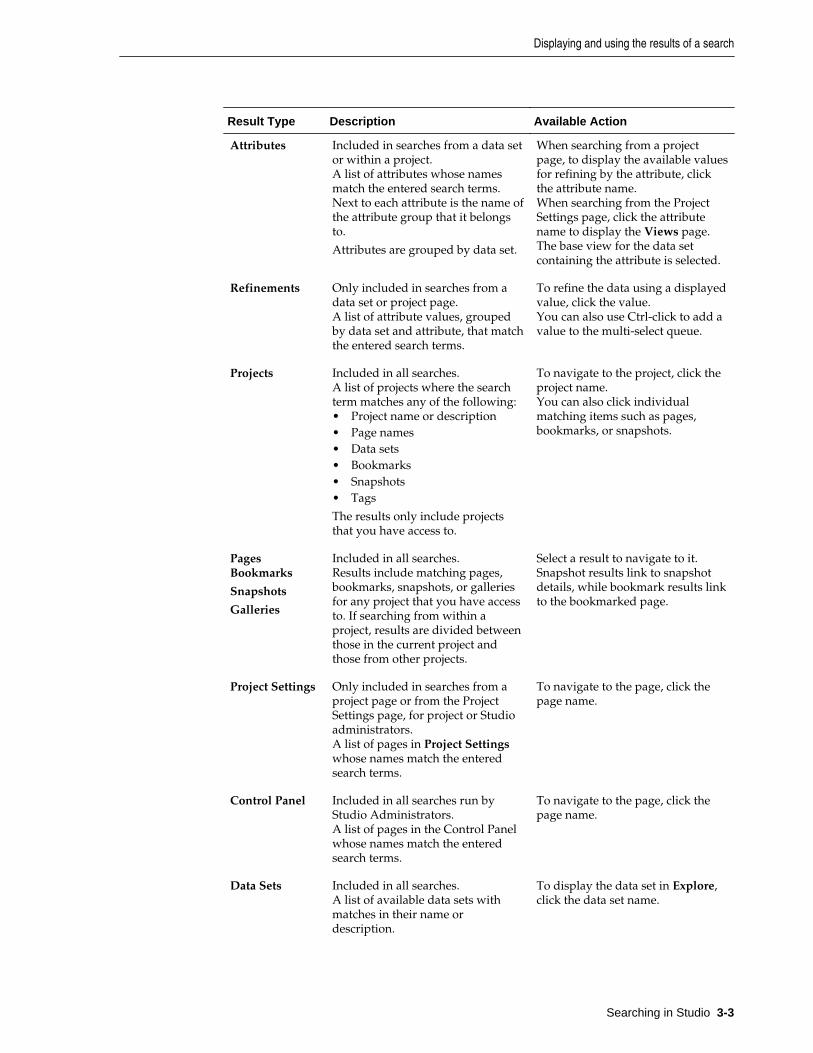
Result Type Description Available Action
Attributes Included in searches from a data setor within a project.A list of attributes whose namesmatch the entered search terms.Next to each attribute is the name ofthe attribute group that it belongsto.
Attributes are grouped by data set.
When searching from a projectpage, to display the available valuesfor refining by the attribute, clickthe attribute name.When searching from the ProjectSettings page, click the attributename to display the Views page.The base view for the data setcontaining the attribute is selected.
Refinements Only included in searches from adata set or project page.A list of attribute values, groupedby data set and attribute, that matchthe entered search terms.
To refine the data using a displayedvalue, click the value.You can also use Ctrl-click to add avalue to the multi-select queue.
Projects Included in all searches.A list of projects where the searchterm matches any of the following:• Project name or description• Page names• Data sets• Bookmarks• Snapshots• Tags
The results only include projectsthat you have access to.
To navigate to the project, click theproject name.You can also click individualmatching items such as pages,bookmarks, or snapshots.
PagesBookmarks
Snapshots
Galleries
Included in all searches.Results include matching pages,bookmarks, snapshots, or galleriesfor any project that you have accessto. If searching from within aproject, results are divided betweenthose in the current project andthose from other projects.
Select a result to navigate to it.Snapshot results link to snapshotdetails, while bookmark results linkto the bookmarked page.
Project Settings Only included in searches from aproject page or from the ProjectSettings page, for project or Studioadministrators.A list of pages in Project Settingswhose names match the enteredsearch terms.
To navigate to the page, click thepage name.
Control Panel Included in all searches run byStudio Administrators.A list of pages in the Control Panelwhose names match the enteredsearch terms.
To navigate to the page, click thepage name.
Data Sets Included in all searches.A list of available data sets withmatches in their name ordescription.
To display the data set in Explore,click the data set name.
Displaying and using the results of a search
Searching in Studio 3-3

Result Type Description Available Action
Keyword Search Included for searches from theCatalog, a data set, or a projectpage.Contains a link with the search text.
For data sets and projects, thesearch is within the attribute valuesfrom the project data.
On the Catalog, the search is withinthe information about the availabledata sets and projects.
If you include Boolean syntax in thesearch text, then Studio alsodisplays a Boolean Search section.Clicking the suggested search queryenters it as a Boolean search.
To complete the text search, clickthe search term or press Enter. Youcan also click the search icon next tothe search field.For project data, if the data isavailable in more than one locale,hovering the mouse over thekeyword in the results displays adrop-down:
To select a locale for the search,click the drop-down icon and selectthe locale.
Once you select a locale, Studiouses it until you change it. If thecurrent search locale is differentfrom your locale, then Studiodisplays the current search localenext to the keyword.
About keyword searchesWhen you complete a keyword search in a project, the data is refined to only includerecords with the matching search terms. In the Catalog, the list of projects and datasets are filtered to only include items with the matching search terms.
About keyword searches
3-4 Studio User's Guide

Note: Keyword Search results may not display in all data sets. For results tobe available, at least one attribute in the data must have String values that arelarger than 200 characters on average, or else one or more attributes must bemanually enabled for full text search through the Transform page of a project.
Keyword searches
For non-Boolean searches, Studio looks for items that have all of the terms. If it findsany, it stops looking and returns those records.
If none of the items have all of the search terms, then records are returned based onthe partial search rules:
• The item must contain at least one of the search terms.
• The item cannot be missing more than two of the search terms.
For example, if you type California red berry sweet, then:
• An item containing only one term would not be a match.
• An item containing two or more terms would be a match.
To use other logical operators such as AND and OR, see About Boolean searches.
Wildcard searches
As you type a keyword in the search box, Studio implicitly adds a trailing wildcard (*)after each character and performs character-by-character matching as you type.Adding a wildcard character to the search syntax has no additional effect.
Search refinements
When you complete a text search, the refinement appears in the Selected Refinementspanel. "Did You Mean" and spelling-corrected results also appear in the SelectedRefinements panel:
For more information on how refinements display, see About the SelectedRefinements panel.
Displaying snippets for search terms
On the Results List and Results Table components, the search terms may behighlighted. For attributes that support snippeting, the search snippet displays. Thesnippet displays the portion of the attribute value that contains the search terms.
Effect of relevance ranking
For non-Boolean searches, relevance ranking can affect the display order of results onthe following components:
About keyword searches
Searching in Studio 3-5
Component Effect of Relevance Ranking
Results List If there is no default sort order for the Results List, and youhaven't applied a sort to the list, then when you submit asearch, the results sort based on search relevance.If a specific sort order has been applied to the table, then therelevance ranking settings are not applied.
Results Table If there is no default sort order for the Results Table, and youhaven't applied a sort to the table, then when you submit asearch, the results sort based on search relevance.If a specific sort order has been applied to the table, then therelevance ranking settings are not applied.
Map When you submit a the search, the results automatically sortbased on search relevance.A Search Relevance option is added to the Sorted by list.
You can then switch between the Search Relevance optionand the other available sorting options.
About Boolean searchesFor Boolean searches, Studio displays a Boolean Search panel when you include alogical operator in the query. Selecting the Boolean Search link from the panel runs thesearch based on the operators listed below.
Note: Boolean Search results may not display in all data sets. For results to beavailable, at least one attribute in the data must have String values that arelarger than 200 characters on average, or else one or more attributes must bemanually enabled for full text search through the Transform page of a project.
About Boolean searches
3-6 Studio User's Guide

BooleanSearchOperator
Purpose Example Usage and Results
AND Returns results with allspecified terms. fruit AND berry
Returns results with both "fruit" and "berry"such as:
This wine has notes of fruit, cinnamon,berry, and oak.
OR Returns results with anyspecified terms. "best buy" OR cheap
Returns results with either "best buy" or"cheap" such as:
The product quality is cheap.
NOT Negates the followingterm. Carries an implicit"AND" when paired withother terms, which isoverridden if you specify"OR NOT"
"best buy" NOT cheap
Returns results with "best buy" but not "cheap"such as:
At this price, this is a best buy.
But not:
The price is cheap for what you get, a definite best buy.
NEAR/<NUM>
Returns results where theright side term is within<NUM> words of the leftside term. Terms can be asingle word or multi-wordphrases, but cannotinclude wildcards orBoolean operators.
blue NEAR/4 red
Returns results where "blue" is within 4 words(inclusive) of "red", such as:
red orange yellow green blue indigo violet
ONEAR/<NUM>
Functions identically toNEAR/<NUM> , except thatterms must be in thespecified order.
red ONEAR/2 blue
Returns results where "blue" occurs within 2words AFTER "red", such as:
red white blue
Operator interaction and precedence
By default, a keyword search runs as an AND search that uses all entered terms. Youcan use Boolean operators to set more precise search logic. For example, the querycamcorder AND NOT digital searches for records with the word "camcorder" andthen removes any results with the word "digital" before returning the set of matches.
Operator precedence is determined in the following order:
About Boolean searches
Searching in Studio 3-7

1. Any sub-expressions in parentheses are evaluated first
2. NOT is evaluated before other operators
3. AND is evaluated after NOT
4. OR is evaluated after AND
For example, the expression "A OR B AND C NOT D" is interpreted as "A OR (BAND C AND (NOT D))".
Enabling or disabling full text search and typeahead search on anattribute
Each String attribute can be individually enabled or disabled for full text andtypeahead search. By default, String attributes that are longer than approximately 200characters are enabled for full text search and disabled for typeahead search, whileattributes shorter than 200 characters are enabled for typeahead search and disabledfor full text search.
Note: You can also use the "--disableSearch" command of the DataProcessing CLI to globally disable search for all string attributes. Thiscommand disables both full text search and value search. This globalcommand can be useful in cases where you have a large number of attributesin a project data set, and it is easier to disable all of them using the DataProcessing CLI and then enable just a couple of them using Studio. Foradditional information, see "Record and value search settings for stringattributes" in the Data Processing Guide.
To enable or disable full text search and typeahead search for an attribute:
1. In your project, select Transform.
2. Locate the String attribute that has text you want to be available for full text search.
3. Mouse over the attribute column header.
A menu button appears.
4. Click the menu and select Edit Details.
The Quick Look dialog opens.
5. To enable or disable typeahead search, select the corresponding Typeahead searchoption.
This adds a transformation step to the transform script. If you wish to undo yourselection before committing, remove the step from the script.
6. To enable or disable full text search, select the corresponding Full text searchoption.
This adds a transformation step to the transform script. If you wish to undo yourselection before committing, remove the step from the script.
Enabling or disabling full text search and typeahead search on an attribute
3-8 Studio User's Guide

7. Click Done.
8. To apply changes immediately, expand the Transform Script pane and clickCommit to Project.
After the script completes, the attribute is enabled or disabled for full text search andtypeahead search.
Enabling or disabling full text search and typeahead search on an attribute
Searching in Studio 3-9

Enabling or disabling full text search and typeahead search on an attribute
3-10 Studio User's Guide

4Filtering Based on Refinements
Throughout Studio, you can use the refinements panel to refine projects, data sets, ordata.
About using refinements for filteringThe Refine By panel lets you filter the currently displayed items anddata.
Selecting refinement values for filteringYou can select one or more values on the Refine By for filtering. Selectedrefinements appear in the Selected Refinements panel.
Selecting a range of refinement valuesFor some attributes, you can refine by a range of values instead ofchoosing specific values.
Selecting a recurring date/timeDate/time attributes allow you to refine based on a recurring value. Youcan filter results to show only records that recur at a certain time.
About implicit refinementsA refinement to one attribute can affect the available refinements forother attributes. This is referred to as an implicit refinement.
Managing Selected RefinementsThe Selected Refinements panel displays all refinements currentlyapplied to the Catalog or to data sets within a project.
About the Selected Refinements panelThe Selected Refinements panel displays all of your currently selectedrefinements and enables you to modify and remove them. It appears atthe top of the page whenever you apply a refinement to the Catalog or toa data set within a project.
Removing refinements from the Selected Refinements panelYou can use the Selected Refinements panel to remove refinements andindividual refinement values. You can also use it to remove all selectedrefinements at once.
About using refinements for filteringThe Refine By panel lets you filter the currently displayed items and data.
The Refine By panel is collapsed by default.
On the Catalog, the Refine By panel allows you to filter the lists of available data setsand projects based on characteristics such as data types, creator, and searchable tags.
Filtering Based on Refinements 4-1

On the Explore and Transform pages, the Refine By panel allows you to filter databased on attribute values. You display the panel by clicking the Filter icon on the leftside of the screen.
Refinements display in collapsible groups. For each refinement, you can also showand hide all available values.
Depending on the refinement, you can either select a specific value or values, orspecify a range of values.
Selecting refinement values for filteringYou can select one or more values on the Refine By for filtering. Selected refinementsappear in the Selected Refinements panel.
To select refinement values for filtering:
1. In the Refine By panel, expand the attribute you want to use for filtering.
2. To display additional attribute values, click More
Studio initially shows the first 20 values. Clicking More displays the first 100values, and each additional click displays another 100 values up to a maximum of2000. To display only the first 20 values again, click Fewer.
Selecting refinement values for filtering
4-2 Studio User's Guide

By default, values display in descending order based on the number of matches foreach value. The shaded bar indicates the relative number of matches.
To search across attribute values, use the Search field. To change the sort order,click the drop-down arrow next to the Search field.
3. When filtering from the Explore or Transform pages, you can optionally changethe metric used to sort attribute values:
a. Mouse over the Refine By header and click the Configuration icon:
The Metric used for value count dialog appears.
b. Click the attribute you want to modify and select the aggregation menu fromthe drop-down next to the attribute:
c. Click Apply.
The sort list updates to reflect the currently selected metric value.
4. If you are selecting a value for a date/time attribute, use the drop-down to selectthe desired Year, Year-Month, or Year-Month-Day combination.
5. To select a single refinement value, click the value in the list.
Selecting refinement values for filtering
Filtering Based on Refinements 4-3

The data is filtered to only display records with that value. If the attribute does notallow you to select multiple values or if there are no matching records for any othervalues, the attribute is disabled on the Refine By panel.
6. To select multiple refinement values, Ctrl-click each value and click Applyrefinements in the multi-select panel.
Optionally, click the Select All button to select all values.
Depending on the refinement, the data is filtered to include records that either:
• Have any one or more of the selected values
• Have all of the selected values
7. To exclude a single refinement value, mouse over the value and click the Excludeicon:
The data is filtered to only display records without that value.
8. To exclude multiple refinement values, Ctrl-click the exclude icon for each valueand click Apply refinements in the multi-select panel.
The data is filtered to include records that have none of the selected values.
Selecting a range of refinement valuesFor some attributes, you can refine by a range of values instead of choosing specificvalues.
By default, range selections are enabled for numeric, date, and time values and displaythe current minimum and maximum values for the selected attribute. Range filtersdisplay a histogram which shows how the values are distributed within the range.Hover over a histogram bar to see the range of values for that bar and the number ofmatching records in that range.
If you want to choose a specific value instead of a range, use the value list toggle icon:
For information on selecting refinement values from a list, see Selecting refinementvalues for filtering.
Selecting a range of refinement values
4-4 Studio User's Guide

Date/time values also offer a recurring range selection option. See Selecting arecurring date/time.
To select a range of refinement values:
1. In the Refine By panel, expand the attribute you want to use for filtering.
2. In the range drop-down, select the range type:
• Between two values or dates/times (the default)
• Less than a value or Before a date/time
• Greater than a value or After a date/time
3. Specify the necessary values by entering them in the fields (or by using the datepicker for dates).
Alternately, drag the black range selection arrows to select value ranges from thehistogram.
4. Click Submit.
The selected range is added to the Selected Refinements panel.
If you submit a different range value for the same attribute, the existing refinementis replaced by the new refinement.
5. After you submit a range filter refinement, you can use the range type toggle tochange the displayed range on the histogram. This does not affect the selectedrefinement.
You can either display:
• The full range of available values (limited by any other selected refinements).
• The current range of available values based on refinements to the attribute.
Selecting a recurring date/timeDate/time attributes allow you to refine based on a recurring value. You can filterresults to show only records that recur at a certain time.
You can select a value for:
• Month
• Day of the month
Selecting a recurring date/time
Filtering Based on Refinements 4-5

• Hour of the day
• Minute of the hour
• Second of the minute
Note: Available date/time attribute values are determined by attributeconfiguration in the data set.
For example, you could include:
• Dates in May of any year
• Dates on the third of any month
• Date values with time values during the noon hour
You can also select values from different units. For example, you could refine the datato only include dates on May 6 of any year.
To select a recurring date/time:
1. In the Refine By panel, expand the attribute you want to use for filtering.
2. Click the recurring date button:
If no date/time values recur for the selected attribute, a "No recurring date/timerefinements available" message displays.
3. If recurring values are available, click the drop-down for the unit you wish to use:
Selecting a recurring date/time
4-6 Studio User's Guide

4. Select a value.
5. Click Submit.
The selected recurring dates/times are added to the Selected Refinements panel.
If you submit a new set of recurring dates/times for the same attribute, the existingrefinement is replaced by the new refinement.
About implicit refinementsA refinement to one attribute can affect the available refinements for other attributes.This is referred to as an implicit refinement.
For example, if vehicle sales data includes both the make and the model, then whenusers refine by the vehicle model Mustang, which is produced by Ford, then the makeattribute is implicitly refined by Ford.
If the data also includes the sales month, but no Mustangs were sold in January, thenJanuary is removed as an available value for the sales month.
Enabling filtering between linked data sets also leads to implicit refinements.
Implicit refinements are not displayed on the Selected Refinements panel. However,if there are no available refinements for an attribute because of implicit refinements,the attribute is disabled, and Studio displays a message explaining that the attribute isnot available because of implicit refinements.
Managing Selected RefinementsThe Selected Refinements panel displays all refinements currently applied to theCatalog or to data sets within a project.
About the Selected Refinements panelThe Selected Refinements panel displays all of your currently selected refinementsand enables you to modify and remove them. It appears at the top of the pagewhenever you apply a refinement to the Catalog or to a data set within a project.
The data set list
Within a project, the left side of the Selected Refinements panel lists the data sets thatare currently being filtered.
Next to the name of each data set is a bar that indicates the percentage of its recordsthat match the refinements. You can hover your mouse over this bar to view the dataset's details, which include the exact percentage and number records that match.
About implicit refinements
Filtering Based on Refinements 4-7
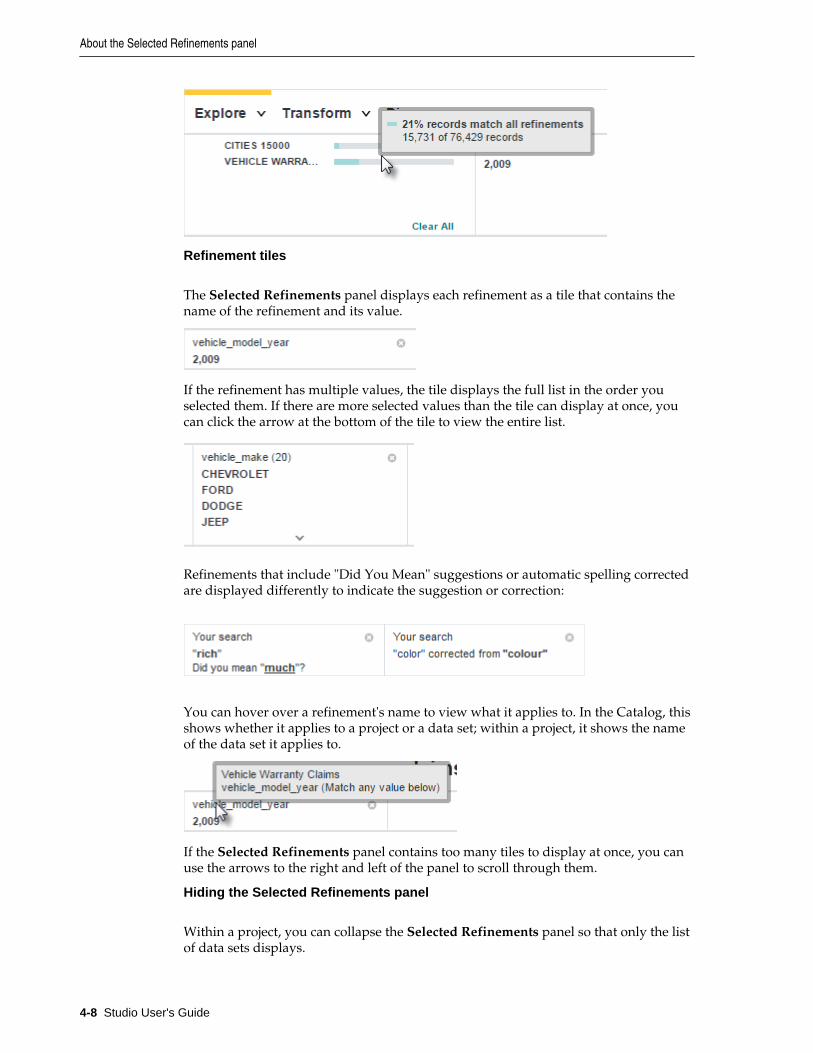
Refinement tiles
The Selected Refinements panel displays each refinement as a tile that contains thename of the refinement and its value.
If the refinement has multiple values, the tile displays the full list in the order youselected them. If there are more selected values than the tile can display at once, youcan click the arrow at the bottom of the tile to view the entire list.
Refinements that include "Did You Mean" suggestions or automatic spelling correctedare displayed differently to indicate the suggestion or correction:
You can hover over a refinement's name to view what it applies to. In the Catalog, thisshows whether it applies to a project or a data set; within a project, it shows the nameof the data set it applies to.
If the Selected Refinements panel contains too many tiles to display at once, you canuse the arrows to the right and left of the panel to scroll through them.
Hiding the Selected Refinements panel
Within a project, you can collapse the Selected Refinements panel so that only the listof data sets displays.
About the Selected Refinements panel
4-8 Studio User's Guide

Negative refinements
By default, all refinement values are positive, meaning the data is filtered to includerecords that match them. You can reverse this and filter for records that don't match arefinement by making it negative.
To make a positive refinement value negative, hover your mouse over its name andselect the check mark.
The checkmark turns into a slashed circle and the value is crossed out. If there aremultiple values selected, the negative value will be moved to the bottom of the list.
Refinements in linked data sets
When data sets in a project are linked, the data set list on the Discover page displays aline connecting them and each data set's details specify the number of its records thatare unavailable because of the linking.
Refinements applied to one of the data sets are automatically applied to the other.
Removing refinements from the Selected Refinements panelYou can use the Selected Refinements panel to remove refinements and individualrefinement values. You can also use it to remove all selected refinements at once.
To remove a single refinement, click the delete icon in its tile.
To remove a single refinement value, hover your mouse over the value's name andclick the delete icon. To remove all values, click the delete icon for the refinement.
Removing refinements from the Selected Refinements panel
Filtering Based on Refinements 4-9

To remove all currently selected refinements, click Clear All in the leftmost tile of theRefinements Panel.
Removing refinements from the Selected Refinements panel
4-10 Studio User's Guide

Part IIIManaging Data Sets


5Managing a Data Set
You can create new data sets, update them, and remove them from the Catalog.Depending on how a data set is created, you can then assign access to it in order toexpose it to Studio users.
Options for loading data into StudioYou can load data into Studio by either creating a new data set orupdating a data set.
About creating a data set in the CatalogYou can create a new data set in the Catalog by uploading personal datafiles into Studio and also by importing and filtering a JDBC data sourceinto Studio.
About updating a data set in the CatalogIn Studio, you can a update a data set that has a source type of Excel,delimited file, or JDBC by using Reload Data set. A reload operationupdates a data set to include all records and attributes that have beenadded, modified, or deleted since the last reload or since the time thedata set was created.
Setting attribute metadata in data setsYou can set metadata properties on attributes to make a data set easier tosearch and navigate. Metadata properties include display names,attribute types, semantic types, tags, and notes. On added to a data set,these metadata values become searchable in the search box of Studio,and the metadata values display as new navigation options in theCatalog's Refine By menu.
About notifications for data set changesStudio provides a Notifications panel for you to view notifications aboutthe progress of any data set changes you initiated. Notifications caninclude information about creating new data sets, updates to data setsincluding refreshes and full data loads, transformations, exports,deletions, and so on.
Managing access to a data setUsers must have access to a data set in order to see it in the Catalog orsearch results, explore the data, or add the data set to a project.
Deleting a data setIf you have the role of User, Power User, or Administrator, you candelete any data set from the Catalog. If you have the role of Viewer, youcannot delete a data set.
Options for loading data into StudioYou can load data into Studio by either creating a new data set or updating a data set.
Managing a Data Set 5-1

There are four data loading operations:
• Loading a file to create a new data set.
• Loading a JDBC data source to create a new data set.
• Reloading a file to update the data set.
• Reloading a JDBC data source to update the data set.
Here is the typical workflow of loading a data set and reloading it in the Catalogbefore you add it to a project:
In this workflow, the following actions take place:
1. You load a data set from a file or JDBC data source. This is the initial load of thedata set into the Catalog.
2. Reload the data set as necessary.
3. Explore the data and add it to a project if you want to use Transform andDiscover. If you transform or fully load a data set in a project, the data set is nowprivate to the project.
About creating a data set in the CatalogYou can create a new data set in the Catalog by uploading personal data files intoStudio and also by importing and filtering a JDBC data source into Studio.
Permissions
A Studio user must have the role of User, Power User, or Administrator to load datafrom a file. Creating a data set from a JDBC data source additionally requires you toprovide the user name and password of the person who has database credentials.
Maximum sample size for file upload
By default, any file you upload is processed to result in a maximum sample size of upto 1,000,000 records. Files that contain more than 1,000,000 records are down sampledto approximately 1,000,000 records. Files with less than 1,000,000 records contain thefull record set in the resulting data set.
About creating a data set in the Catalog
5-2 Studio User's Guide

If necessary, you can increase the default setting from 1,000,000 records to anothervalue. For details, see the bdd.sampleSize documentation in the Administrator'sGuide.
Potential upload timeouts
If a file upload fails due to a connection timeout, the file may be too large to uploadfrom Studio. You can work around this issue by asking your Hive databaseadministrator to import the source file into a Hive table, and then you run the DataProcessing CLI utility to process the table. After data processing, a new data set, basedon the file, is available in the Catalog.
Duplicate columns and multi-value attributes
Note that if your personal data file has columns with identical headings, then in thenew data set, the columns are converted into a single multi-value attribute. Forexample, if your data includes:
Item Color Color Color
T-Shirt Red Blue Green
Sweatshirt Red White
Then in the final data set, the result is:
Item Color
T-Shirt Red, Blue, Green
Sweatshirt Red, White
Anti-Virus and Malware
Studio can load Excel spreadsheets and delimited files. Oracle strongly encouragesyou to use anti-virus products prior to uploading files into Studio. Studio convertsthese files into the Hadoop Avro format, uploads the data to HDFS, and then registersa Hive table for the data. The original file is then discarded.
Creating a data set from a fileYou can create a new data set in Studio by uploading personal data fromfiles. After upload, the data is available as a data set in the Catalog.
Creating a data set from a JDBC data sourceIf a Studio administrator has already created a data connection andadded a JDBC data source, then you can import and filter a JDBC datasource into Studio. After import, the data source is available as a data setin the Catalog. For information about creating data sources, see theAdministrator's Guide.
Creating a data set from a fileYou can create a new data set in Studio by uploading personal data from files. Afterupload, the data is available as a data set in the Catalog.
Studio supports Microsoft Excel files, delimited files such as CSV, TSV, and TXT, andalso compressed file such as ZIP, GZ and GZIP. A compressed file may include onlyone delimited file.
About creating a data set in the Catalog
Managing a Data Set 5-3

Microsoft Excel files must have a suffix of XLS or XLSX and may have been createdusing any of the following versions:
• Excel 2016
• Excel 2013
• Excel 2010
• Excel 2007
• Excel 97 - 2003
To create a data set from a file:
1. Click the Add Data Set option on the Catalog.
This option adds the new data set to the Catalog. You can also add a new data setfrom within a project.
2. Click Create a data set from a file.
3. Click Browse, locate the file, and click Open.
4. Click Next.
5. In the Preview page, you can both edit attributes and limit the data before youupload it.
a. To exclude an attribute from the data set, deselect its check box.
b. To modify the name of an attribute as it appears in the data set, select thecolumn header and edit the name of the attribute.
6. Expand Basic Settings and set the following options:
Setting Description
My data includes header row Specify if the file includes a header row. Ifyou deselect this option, Studio creates analphabetized list in place of attribute names.
Skip the first 0 rows If necessary, you can indicate how manyrows to skip from the top of the file.
Sheet Microsoft Excel files only. Select which sheetto load from the list. A data set correspondsto one sheet. Run the wizard again if youneed to process multiple sheets.
Fields are delimited by Delimited file formats only. Select a fielddelimiter from the list. This selection oftencorresponds to the file format, commaseparated (CSV), tab separated (TSV/TAB),etc.
Fields are quoted Delimited file formats only. Specify whetherthe fields contain quoted values.
Quote Character Delimited file formats only. If you enabledFields are quoted, select the quotecharacter.
About creating a data set in the Catalog
5-4 Studio User's Guide
Setting Description
Quote escape character Delimited file formats only. If you enabledFields are quoted, select the quote escapecharacter.
7. Expand Advanced Settings and set the following options:
Setting Description
Character Encoding Delimited file formats only. Select the fileencoding. If you are unsure, you may haveto open the file in a full featured text editorand use the editor to detect the encoding.
Language Specify the language of text data in yourfile. This setting is used during dataprocessing and then used for value andkeyword searches.
8. Click Next.
9. On the Create your data set page:
a. Specify a name for the data set as it appears in the Catalog.
b. Optionally, specify a description for the data set.
c. Optionally, specify a Hive table name. By default, the Hive table name is thesame as the data set name. If you create a data set by the same name as anexisting data set, you must specify a different Hive table name. Studio maps thedata set name to a unique table name.
10. Click Create and then click Add Another Data Set if you have more files to uploador click Return to Catalog while the file is being processed.
A new data set based on the file is available in the Catalog.
If the file upload fails due to a connection timeout, the file may be too large to uploadfrom Studio. You can work around this issue by asking your Hive databaseadministrator to import the source file into a Hive table, and then you run the DataProcessing CLI utility to process the table. After data processing, a new data set, basedon the file, is available in the Catalog .
Creating a data set from a JDBC data sourceIf a Studio administrator has already created a data connection and added a JDBC datasource, then you can import and filter a JDBC data source into Studio. After import,the data source is available as a data set in the Catalog. For information about creatingdata sources, see the Administrator's Guide.
The Studio user must have the role of User, Power User, or Administrator to importJDBC data.
To load data from a JDBC data source:
1. Click the Add Data Set option on the Catalog.
This option adds the new data set to the Catalog. You can also add a new data setfrom within a project.
About creating a data set in the Catalog
Managing a Data Set 5-5

2. Click Create a data set from a database.
3. On the Select data source page, select a row corresponding to the data source youwant to import and click Next.
4. Provide the user name and password of the person who has database credentials toaccess the data and click Continue.
5. In the Preview & filter data page, you can both edit attributes and limit the databefore you upload it:
a. To exclude an attribute from the data set, deselect its check box.
b. To modify the name of an attribute as it appears in the data set, select thecolumn header and edit the name of the attribute.
c. To filter an attribute by an attribute value, select the funnel icon in an attributeheader. (This adds a filter to the Filter By pane.) And then select a sample valuethat you want to filter by. For example, if you have an attribute namedCountry_Name, you can select the filter icon and then select United States.That filters the records down to the set of records where Country_Namematches United States.
d. If you know the language of text data in your attributes, select the sourcelanguage from Default search language. (This setting is used during dataprocess and then used for value and keyword searches.)
6. Click Next.
7. On the Select data source page:
a. Specify a name for the data set as it appears in the Catalog.
b. Optionally, specify a description for the data set.
c. Optionally, specify a Hive table name. By default, the Hive table name is thesame as the data set name. If you create a data set by the same name as anexisting data set, you must specify a different Hive table name. Studio maps thedata set name to a unique table name.
8. Click Create.
A new data set, based on the data source, is available in the Catalog.
About updating a data set in the CatalogIn Studio, you can a update a data set that has a source type of Excel, delimited file, orJDBC by using Reload Data set. A reload operation updates a data set to include allrecords and attributes that have been added, modified, or deleted since the last reloador since the time the data set was created.
Studio does not automatically reload a data set after you add it to a project. Once adata set has been transformed or loaded within a project it becomes a private copy.
After you reload a data set in the Catalog, Studio automatically reloads the data setinto a project if the project is using the public copy.
However, once a data set has been transformed in a project it becomes a copy that isspecific to that project.
About updating a data set in the Catalog
5-6 Studio User's Guide

If the public version of this data set in Catalog is reloaded (that is, a newer version ofthis public data set appears in Catalog), then the next time you enter the project,Studio notices that you are using a private copy of a recently updated public versionof this data set, and prompts you to "Accept data updates" by re-committing thetransform script to the new version of the data set. This commit creates a new privatecopy of the reloaded public data set. The transform script is applied to that privatecopy.
Note: To update data sets that were created directly in Hive, use the DataProcessing CLI. For details, see the Data Processing Guide.
Updating a data set from a fileThe Reload Data set operation updates a data set from a file and makesthe updated data set available in the Catalog.
Updating a data set from a JDBC data sourceThe Reload Data set operation reloads a data set from a JDBC datasource and makes the updated data set available in the Catalog.
Updating a data set from a fileThe Reload Data set operation updates a data set from a file and makes the updateddata set available in the Catalog.
To update a data set from a file:
1. In the Catalog, locate the data set you want to update.
2. Open the quick look for the data set, and from the Actions menu, select ReloadData set.
This starts the personal data upload wizard.
3. Click Browse, locate the file, and click Open.
4. Click Next.
5. In the Preview page, you can both edit attributes and limit the data before youupload it:
a. To exclude an attribute from the data set, deselect its check box.
b. To modify the name of an attribute as it appears in the data set, select thecolumn header and edit the name of the attribute.
c. To specify that the file includes a header row, select My data includes headerrow. If you deselect this option, Studio creates an alphabetized list in place ofattribute names.
d. If necessary, you can indicate how many rows to skip from the top of the file.
e. If the file is an MS Excel file, you can select which sheet to load.
f. If you know the language of text data in your attributes, expand AdvancedSettings and select the source language from Language. (This setting is usedduring data processing and then used for value and keyword searches.)
About updating a data set in the Catalog
Managing a Data Set 5-7

6. Click Next.
7. Click Reload.
After processing, an updated data set is available in the Catalog.
Updating a data set from a JDBC data sourceThe Reload Data set operation reloads a data set from a JDBC data source and makesthe updated data set available in the Catalog.
To update a data set from a JDBC data source:
1. In the Catalog, locate the data set you want to update.
2. Open the quick look for the data set, and from the Actions menu, select ReloadData set.
This starts the personal data upload wizard.
3. Provide the user name and password of the person who has database credentials toaccess the data and click Continue.
4. In the Preview & filter data page, you can both edit attributes and limit the databefore you upload it:
a. To exclude an attribute from the data set, deselect its check box.
b. To modify the name of an attribute as it appears in the data set, select thecolumn header and edit the name of the attribute.
c. To filter an attribute by an attribute value, select the funnel icon in an attributeheader. (This adds a filter to the Filter By pane.) And then select a sample valuethat you want to filter by. For example, if you have an attribute namedCountry_Name, you can select the filter icon and then select United States.That filters the records down to the set of records where Country_Namematches United States.
d. If you know the language of text data in your attributes, select the sourcelanguage from Default search language. (This setting is used during dataprocessing and then used for value and keyword searches.)
5. Click Next.
6. On the Select data source page:
a. Specify a name for the data set as it appears in the Catalog.
b. Optionally, specify a description for the data set.
c. Optionally, specify a Hive table name. By default, the Hive table name is thesame as the data set name. If you create a data set by the same name as anexisting data set, you must specify a different Hive table name. Studio maps thedata set name to a unique table name.
7. Click Create.
8. Click Reload.
About updating a data set in the Catalog
5-8 Studio User's Guide

Setting attribute metadata in data setsYou can set metadata properties on attributes to make a data set easier to search andnavigate. Metadata properties include display names, attribute types, semantic types,tags, and notes. On added to a data set, these metadata values become searchable inthe search box of Studio, and the metadata values display as new navigation optionsin the Catalog's Refine By menu.
For example, if you add a semantic type named Person to an attribute, you see a newnavigation option in Catalog > Refine by > Attributes > Semantic type for Person.
You can set the metadata properties on a public data set in the Catalog and on aproject data set. Metadata changes to public data sets display to all Studio users.Changes to projects with restricted access display only to users with project access.
Changes to attribute metadata that you make in one project do not affect other projectsusing the same data set. However, changes to attribute metadata that you make in apublic data set is inherited by projects using that data set until you run a transform tomodify the data set.
To set attribute metadata:
1. From the Explore page:
a. Select the Data Set from the bottom tabs.
b. Locate the attribute you wish to modify.
c. Click the arrow at the bottom of the frame to open the Attribute Details.
d. Select the Details tab.
2. From the Transform page:
a. Select the Data Set from the bottom tabs.
b. Locate the column for attribute you wish to modify and select the column.
c. In the attribute menu, click Edit Details.
For example:
3. To change the display name:
a. Click the attribute name to enable the edit frame.
b. Click to edit.
Setting attribute metadata in data sets
Managing a Data Set 5-9

c. Enter a new display name.
To change a long name, press CTRL+A to select the entire text field.
d. Click on another area of the Details panel to save the name.
The new display name is used in place of the original attribute name.
4. To add or change the semantic type:
a. From the Semantic type list, choose an option that more finely describes theattribute.
For example, this dealerprice attribute has a data type of number and also hasa semantic type of currency:
b. Click on another area of the Details panel to save the semantic type.
5. To add or remove tags:
a. Mouse over the Tags area until the edit frame appears.
b. Click to edit.
c. To add a tag, type a tag name.
For example, this dealerprice attribute has a tag of oem:
Setting attribute metadata in data sets
5-10 Studio User's Guide

d. Click on another area of the Details panel to save the new tag.
e. Repeat Steps a-d to add additional tags.
f. To remove a tag, click the corresponding x icon.
6. To add or remove a note:
a. Mouseover the Notes area until the edit frame appears.
b. Click to edit.
c. Specify note text to describe the attribute.
d. Click on another area of the Details panel to save the note.
Notes include a "Last Modified" entry above the text field that indicates theusername and time associated with the last edit.
e. To remove a note, edit the field and remove any content.
Press CTRL+A to select all text in a large note for deletion.
7. Click x in the top of the Details pane to return to the Explore or Transform page.
About notifications for data set changesStudio provides a Notifications panel for you to view notifications about the progressof any data set changes you initiated. Notifications can include information aboutcreating new data sets, updates to data sets including refreshes and full data loads,transformations, exports, deletions, and so on.
To display the Notifications panel, click the Notifications icon (a flag) in the header ofStudio:
About notifications for data set changes
Managing a Data Set 5-11

The icon also might have a number indicating the amount of unread notificationmessages since the last time you read the notifications or clicked Mark all as read.
After you open the panel, you see all notifications for data sets you have access to. Forexample, here is a snapshot of a Notifications panel:
Changes that are in progress display with a corresponding progress bar inside theNotifications panel, and at the moment the change completes, there is a brief bannernotification across the Studio header to alert you that the change is complete.
Once you receive a notification that changes are complete, you can explore thechanges by clicking Explore the data set.
Default permissions for notifications
When you open the Notifications panel, Studio displays only notifications for projectsthat you have privileges to view. So for example, if a project restricted user is amember of only Project A, then the user gets notifications for only Project A. On theother hand, an administrator gets all notifications for all data sets and project changes.In short, if you can see a data set or project in the Catalog, then you receivenotifications for changes to that data set or project.
About notifications for data set changes
5-12 Studio User's Guide

Configuring prune settings for notifications
An administrator can configure how long to store notifications based on a specifiednumber of days or based on a specified number of notifications. For details, see the"Studio settings list" topic in the Administrator's Guide.
Managing access to a data setUsers must have access to a data set in order to see it in the Catalog or search results,explore the data, or add the data set to a project.
Any user with access to a data set can manage access rights to the data.
Default data set permissions are configured by Studio Administrators in the ControlPanel. By default, Studio uses the following settings:
• Data sets created by personally uploading files are private. Aside fromAdministrators, only the file uploader has access.
• Data sets created by ingesting data from Hive are public.
• Data sets created from duplicating or exporting data are public.
To modify this behavior, see the "Studio settings list" topic in the Administrator's Guide.
Users with Read access to a data set can
• See the data set in search results or by browsing the Catalog
• Explore the data set
• Add the data set to a project
Users with Write access to a data set can
• Modify data set metadata
• Manage access to the data set
Note: A user without any access to a data set can still explore the data theyare a Project Restricted User or Project Author on a project that uses the dataset. Project Authors can use the Transform operations to create a duplicatedata set and gain access to the new data set. Similarly, a user with Read-onlyaccess to a data set can create a project using that data set and then executetransformations against the data if the default data set permissions includeWrite access. If you are working with sensitive information, consider thiswhen assigning project roles and data set permissions. See Project and UserRoles for more information.
To manage access to a data set:
1. From the Data Sets tab in the Catalog, select the data set to modify and click theedit link beside the data set Access level:
Managing access to a data set
Managing a Data Set 5-13

The Data Set Security Setup pane displays.
2. To add or remove individual users:
a. Click +User.
The Add Users dialog appears.
b. To add users, drag user names from the Available Users list to the SelectedUsers list.
Optionally, use the Search field to filter the Available Users list.
c. To remove users, click the x next to a user name in the Selected Users list orclick Clear All to remove all selected users.
d. Click Save.
3. To add or remove groups:
a. Click +Group.
The Add Groups dialog appears.
b. To add groups, drag group names from the Available User Groups list to theSelected User Groups list.
Optionally, use the Search field to filter the Available User Groups list.
c. To remove groups, click the x next to a group name in the Selected UserGroups list or click Clear All to remove all selected groups.
You can also remove groups from the Group access table on the Sharing pageby clicking the x in the right side column.
Note: You cannot remove or modify permissions for the All Big DataDiscovery admins group.
d. Click Save.
4. To set access for users or groups:
a. Select an access level in the Access column:
• No Access — The user group cannot access the data set. The data set doesnot show up for this user or group in the Catalog.
• Default Access — The user group has default access to the data set. The"default" access level is set on the Studio Settings page in the Control Panel.See the Administrator's Guide for more information.
• Read-only — The user or user group can access the data set and modify thedata set as a part of a project, but they cannot modify the data set metadataor set permissions.
• Read/Write — The user or user group has full access to the data set,including setting permissions.
Managing access to a data set
5-14 Studio User's Guide

Note: For individual users you cannot set permissions to "Default Access" or"No Access." Assigning individual permissions is outside of the scope of adefault permissions model, and restrictive access to data should be based on awhitelist, where a user has minimal permissions and is given access to specificdata sets, rather than a blacklist where a user has global access and onlycertain data sets are restricted.
b. Click Save.
5. Click Save.
Deleting a data setIf you have the role of User, Power User, or Administrator, you can delete any data setfrom the Catalog. If you have the role of Viewer, you cannot delete a data set.
You cannot delete a data set that is currently being used in a project.
To delete a data set, click Delete on the data set details panel.
Note: Deleting a data set from the Catalog does not delete its correspondingHive table in the Hive database. For details about the relationship between adata set and its Hive table, see the Data Processing Guide.
Deleting a data set
Managing a Data Set 5-15

Deleting a data set
5-16 Studio User's Guide

6Exploring a Data Set
Explore allows you to explore a data set, either from the Catalog or from within aproject.
About exploring a data setExplore allows you to explore the structure and data values in a data set.
Selecting the data to exploreYou can explore a data set from the Catalog or from within a project.
Switching Explore between tile view and table viewBy default, Explore displays each attribute as a tile containing avisualization showing the distribution of values for that attribute.
Filtering and sorting displayed attributes in Explore or TransformYou can filter and sort displayed attributes in the Explore andTransform views to more easily navigate a data set. If you are within aproject data set, these preferences apply for all project users.
Working with an individual attribute in ExploreFrom Explore, you can filter the values, select a different visualization,and display a details panel with additional options.
Using the scratchpadYou can use the scratchpad component on the Explore page to try outdifferent visualizations with one or more attributes before adding themto a Discover page.
Keyboard shortcuts for ScratchpadStudio provides a number of keyboard shortcuts to simplify interactingwith Scratchpad. See the following table.
About exploring a data setExplore allows you to explore the structure and data values in a data set.
Using Explore, you can find out:
• What attributes are available
• The types of values for those attributes
• The distribution of those values across the data set
Exploring a Data Set 6-1

• The quality of the values – in particular, whether values are missing
• How attributes correlate to each other
After exploring a data set, you should have a better idea of the visualizations you maywant to use to show the data values and relationships, and the transformations thatyou may want to apply.
Selecting the data to exploreYou can explore a data set from the Catalog or from within a project.
Selecting a data set to explore
To explore a data set, click a data set name in the Data Sets tab of the Catalog.
To explore a project data set, click the data set tab from the data sets view of a project.
Explore header information and links
At the top of Explore is a summary of the data. For example:
This summary includes:
• The number of records in the data set sample. Or if this number is less than1,000,000 this is the number of records in the full data set.
• An option to switch between Precise mode and Approximate mode. This optiondisplays only in data sets that are larger than the sample size. By default, this is1,000,000 records. Precise mode provides a precise calculation for sum operationsperformed against the data sample. Approximate mode provides an approximationfor sum operations across the full data set.
• The number of records in the entire data set
• The number of records in the sample that match the current filters (the FilteredRecords value).
• The number of attributes in the data set
• A Filter Attributes drop down to locate attributes by name, data type, and bywhether they are marked as hidden or favorite.
• A Sort control to sort attributes.
The page header can also contains links to:
• Show/Hide the Scratchpad
• Show/Hide data set properties
Switching Explore between tile view and table viewBy default, Explore displays each attribute as a tile containing a visualization showingthe distribution of values for that attribute.
Selecting the data to explore
6-2 Studio User's Guide

The default visualization is based on an attribute's data type.
A data quality bar shows the percentage of valid values (blue) and null values (black).You can click a section of the data quality bar to refine the data to only include recordswith valid, invalid, or null values.
You use the toggle switch at the top right of the list to switch between the tile viewand a table view. The table view contains the data set records.
Filtering and sorting displayed attributes in Explore or TransformYou can filter and sort displayed attributes in the Explore and Transform views tomore easily navigate a data set. If you are within a project data set, these preferencesapply for all project users.
Note: Filtering attributes is a navigation convenience and does not affect thecurrent search or refinement state for attribute values.
To filter and sort displayed attributes in Explore or Transform:
1. To mark an attribute as a favorite, click the star icon on the attribute tile in Exploreor select Add to favorites from the attribute details in Transform.
2. To mark an attribute as hidden, click the eye icon on the attribute tile in Explore orselect Hide from the attribute details in Transform.
3. To filter, click the Filter Attributes drop-down on the left side above the displayedattribute tiles (Explore) or table (Transform).
The filtering submenu appears.
4. Apply filters by selecting the corresponding checkbox(es) from each submenu.
You can also click the Search icon next to the drop-down to see matching availablefilters sorted by type. For example, entering "st" as a query may suggest DataType > string and Notes > this is a test.
• For Attribute name, Tags, and Notes filters, you can enter a search query tofilter the list of options to a manageable size.
• Selecting the Hidden filter temporarily disables all other filters. Removing it re-enables the other selections.
• Selecting the Favorites filter removes the Hidden filter.
Applied filters display alongside the drop-down, and the attribute tiles or table arereduced to the subset of attributes that match all filters.
5. To remove filters, either click the X icon next to a filter or click Clear all to removeall filters.
6. To sort attributes, click the Sort drop-down and select a sort type:
• Name - sort by name
• Null percentage - sort by the percentage of null values for each attribute
Filtering and sorting displayed attributes in Explore or Transform
Exploring a Data Set 6-3

• Information potential - sort by an information potential algorithm thatconsiders factors such as distribution of attribute values across records. This isthe default.
• Relationship to an attribute - sort by correlation with another attribute.
For example, a list of wine attributes sorted by relation to "body" may show that"region" is strongly related.
In Explore, you can also sort by relationship to an attribute by clicking the arrowicon for that attribute tile.
Working with an individual attribute in ExploreFrom Explore, you can filter the values, select a different visualization, and display adetails panel with additional options.
Filtering the attribute values
The Available Refinements panel allows you to filter attribute values by selectingspecific values or ranges of values. The refinements are added to the SelectedRefinements panel at the top of the page.
You can also use the individual visualizations to refine the data based on the attributevalues.
Hiding attributes or marking attributes as favorite
You can flag attributes that you are particularly interested in, or hide those that havelittle value to you. If you hide an attribute or mark it as a favorite, then whenexploring a data set from the Catalog, that attribute shows as favorite or hidden for allusers who explore the data set outside of a project.
Displaying a different visualization for an attribute
In tile view, each attribute may have multiple visualization options. For example, for anumeric attribute, you might be able to switch between a histogram or a box plot.
If there are multiple visualization options, then to switch to a different visualization,use the paging arrows to the left and right of the attribute visualization.
Displaying the details panel for an attribute
When you click the attribute name on the attribute tile, the details panel for theattribute displays.
You can use the paging icons to the left and right of the details panel to page throughthe details panels for each attribute.
The panel includes options to:
• Indicate the attribute is a favorite or hidden
• Sort the attribute values
• Add the attribute to the scratchpad
The details panel also contains the following tabs:
Working with an individual attribute in Explore
6-4 Studio User's Guide

Tab Description
Overview tab Displays the attribute visualization, with a SummaryStatistics section listing information about the attribute andits values.Also displays thumbnails representing the availablevisualizations for the attribute.
To change to a different visualization, either use the pagingicons to the left and right of the visualization, or click thevisualization thumbnail.
Details tab Displays some details about the attribute, including:• Display name• Enrichments that were applied to the original values• Data typeIt also displays the list of values for the attribute, sorted byrelative frequency within the data sample.
Using the scratchpadYou can use the scratchpad component on the Explore page to try out differentvisualizations with one or more attributes before adding them to a Discover page.
About the scratchpad
The scratchpad consists of:
• The scratchpad drop zone, which lists the attributes currently displayed on thescratchpad
• The scratchpad visualizations
Using the scratchpad
Exploring a Data Set 6-5

The visualizations available in the scratchpad can include charts, box plots,histograms, and maps. These function similarly to the chart components; forinformation, see Charts.
The type and number of visualizations available for an attribute or combination ofattributes varies. If the scratchpad contains only one attribute, it displays the samevisualization as the attribute's tile and allows you to switch to the other visualizationsavailable in the attribute's details panel. If the scratchpad contains multiple attributes,it displays the most appropriate visualization for the current set.
Note: The scratchpad cannot display more than 1000 marks in avisualization. Refine your filtering criteria if you exceed this limit. Somecombinations of attributes are incompatible and cannot be displayed by thescratchpad at all.
You can page through the available visualizations by clicking the arrows on either sideof the scratchpad. You can also display a specific visualization by clicking itsthumbnail next to the scratchpad.
Displaying and hiding the scratchpad
The scratchpad displays when you add an attribute to it, or when you click the ShowScratchpad icon at the top right of the Explore page.
To hide the scratchpad, click either the Hide Scratchpad icon or the white arrow at thebottom of the scratchpad.
Adding attributes
You can add attributes to the scratchpad in multiple ways:
• Hover your mouse over an attribute tile and click Add to scratchpad.
• Click the down arrow on an attribute tile to open its details panel and click Add toscratchpad.
• Click anywhere within the scratchpad drop zone and either enter the name of theattribute you want to add or select it from the list of available attributes.
Using the scratchpad
6-6 Studio User's Guide

As you add attributes to the scratchpad, the other attributes may be sorted to put themost relevant first.
Configuring visualizations
Each type of visualization is configurable; for example, you can change the chartplacement and sort order of a histogram plot. To view options for configuring thevisualization, click the down arrow next to the attribute's name in the scratchpad dropzone.
You can swap attributes between zones in a visualization by dragging and droppingthem on top of each other in the drop zone. Attempting to drag and drop attributesshows a preview icon that indicates whether values are swapped or dropped uponcompletion. For example, you can re-order inner and outer rings in a Sunburst chart.Dragging and dropping attributes preserves any configured sort or aggregationbehavior unless swapping a dimension (non-countable values, such as Strings) with ametric.
You can also modify the sort order using the Sort arrow, when available.
Using the scratchpad
Exploring a Data Set 6-7

Refining visualizations
Any refinements applied to your project are automatically applied to visualizationswithin the scratchpad. You can also click on specific values within the visualization toset them as refinements.
You can modify and remove your selected refinements using the SelectedRefinements panel. For more information, see Managing Selected Refinements.
Removing attributes
To remove an individual attribute from the scratchpad, hover your mouse over itsname in the drop zone and click the delete icon.
To remove all currently selected attributes, click Clear all in the top right of thescratchpad.
Saving a visualization to a Discover page
If you are working within a project, you can save your visualization to a Discoverpage when you are satisfied with it.
Note: Saving a visualization to a project page causes the project to open to theDiscover page instead of the Explore page. If you are not working within aproject, you must create one before saving your visualization.
To save a visualization to a Discover page, click Save to Discover page, then eitherselect an existing page to save it to, or provide a name for a new page.
Using the scratchpad
6-8 Studio User's Guide

Keyboard shortcuts for ScratchpadStudio provides a number of keyboard shortcuts to simplify interacting withScratchpad. See the following table.
Table 6-1 Keyboard shortcuts for Scratchpad
Shortcut Description
s Moves the cursor focus to Scratchpad and displays theattribute list.
spacebar Displays the attribute list.
Up/Down arrow Moves up or down the attribute list.
Enter If an attribute is highlighted in the list, Enter adds theattribute to the Scratchpad.
Left/Right arrow If you have multiple attributes in the drop zone, arrowsmove the focus forwards or backwards betweenattributes.
Tab/Shift + Tab Moves the focus to the next / previous object in the userinterface.
Backspace If the cursor is at the end of an attribute, this removesthe attribute.
Esc Cancels an action.
Keyboard shortcuts for Scratchpad
Exploring a Data Set 6-9

Keyboard shortcuts for Scratchpad
6-10 Studio User's Guide

Part IVCreating and Configuring Projects


7Creating, Localizing, and Deleting Projects
Studio users can create projects to transform data and explore data sets in greaterdetail. Project Authors and Administrators can localize or delete existing projects.
About projectsAny edit operation, such as transforming data, must take place within aproject rather than in a data set. Creating a new project also providesseveral other features that are not available when exploring a data set. Ina project you can:
Creating a projectYou can create a project from the Catalog, or while exploring a data setthat you wish to include.
Localizing the project name, description, page names, and component titlesYou can use the Project Settings > Localization page to localize aproject's name, description, page names, and component titles.
Deleting a project using the CatalogBoth Project Authors and Studio Administrators can delete individualprojects from the Catalog or they can use the Projects page on theControl Panel to delete multiple projects at a time.
About projectsAny edit operation, such as transforming data, must take place within a project ratherthan in a data set. Creating a new project also provides several other features that arenot available when exploring a data set. In a project you can:
• Create and save project pages in Discover.
• Add multiple data sets, and link them in the Data Set Manager editor. In otherwords, a project provides the structure to join, aggregate, and transform multipledata sets. Note however, that a project does not make a copy of a data set.
• Modify attribute metadata in the Attribute Groups editor. For example, you canpreserve changes for display name settings or dimension settings as part of project.
• Create and modify data views in the Project Settings > Data Views.
There are several ways to create a project:
• From the Catalog, you can immediately create a new project before you explore ortransform the data. This is a good option if you know you are going to makechanges to the data and prefer to create a new project right away. In other words,you typically do this early in the discovery process.
Creating, Localizing, and Deleting Projects 7-1

• From Explore, you can create a new project after examining the source data. Youtypically do this later in the discovery process.
• Or, you can create a new project only after being prompted by Studio during anedit operation that you want to perform. You typically do this only if required.
If you have a role of Administrator, Power User, or User, you can create new projects.If you only have the Restricted User role, you cannot create projects.
Creating a projectYou can create a project from the Catalog, or while exploring a data set that you wishto include.
Note: Studio does not require unique project names. Try to think of a namethat is unlikely to cause confusion with existing projects, and avoid namingyour project after the data set(s) it uses.
To create a new project:
1. From the Catalog:
a. Select a data set to include.
b. Expand the data set preview menu and click Add to Project.
c. Enter a name and description for the new project.
d. Click Add.
2. From the Explore page:
a. Click Add to Project.
b. Enter a name and description for the new project.
c. Click Add.
The new project opens to the Explore page.
Localizing the project name, description, page names, and componenttitles
You can use the Project Settings > Localization page to localize a project's name,description, page names, and component titles.
If you localize these items, then when end users select a different locale, these itemscan be displayed in the correct languages.
To localize the project name, description, page names, and component titles:
1. On the project menu bar, click the settings icon.
2. In the project settings menu, click Localization.
The Localization page contains a table listing:
Creating a project
7-2 Studio User's Guide

• Project name
• Project description
• Pages
• Under each page, the list of components
For the project name and description, you can only localize these values in otherlanguages. You use the Project Configuration page to change the default values.For page names and component titles, you can change the value for both thedefault language and for other languages.
3. To provide localized values for a specific locale:
a. From the locale list, select the locale.
By default, each item in the list has Use Current Default selected, indicating touse the value for the default locale.
b. For each item you want to localize, click Replace Default.
c. In the field, type the localized value, then press Enter.
4. To save the changes to the localization, click Save.
Deleting a project using the CatalogBoth Project Authors and Studio Administrators can delete individual projects fromthe Catalog or they can use the Projects page on the Control Panel to delete multipleprojects at a time.
For details about using the Control Panel to delete projects, see the Administrator'sGuide.
To delete a project using the Catalog:
1. On the Catalog page, click the project tile.
Deleting a project using the Catalog
Creating, Localizing, and Deleting Projects 7-3

2. On the project details panel, click the delete link.
For example:
When you delete a project, Studio automatically deletes any bookmarks and snapshotsfor that project.
Deleting a project using the Catalog
7-4 Studio User's Guide

8Managing Access to Projects
Projects are listed as either Private (the default), Public, or Shared (any project withmanually configured permissions for users or user groups). You can configure accessto projects by granting project roles to individual users or to user groups.
Project and User RolesA user who creates a project is assigned the Project Author role. Otherusers or groups may be either Project Authors or Restricted ProjectUsers. Project Authors can add, remove, or set permissions for users anduser groups.
Project TypesThe project type listed in the Catalog project detail panel reflects theassigned roles.
Assigning project rolesYou can grant access to a project by assigning project roles to users anduser groups. Sharing settings are accessible from the Project Settingspage or from the project details panel in the Catalog.
Project and User RolesA user who creates a project is assigned the Project Author role. Other users or groupsmay be either Project Authors or Restricted Project Users. Project Authors can add,remove, or set permissions for users and user groups.
• Project and User Roles
• Project and User Roles
Project Roles
Project roles grant access privileges to project content and configuration. The roles are:
Managing Access to Projects 8-1

Role Description
Project Author Project authors can:• Configure and manage a project• Add or remove users and user groups• Assign user and user group roles• Transform project data• Export project data
Project authors cannot:• Create new data sets• Access the Studio Control Panel
Project Restricted User Project Restricted Users can:• View a project and navigate through the configured pages• Add and configure project pages and components
Project restricted users cannot:• Access Project Settings
• Create new data sets• Transform data• Export project data
User Roles
The table below summarizes the overlap between project roles and Studio user roles.
Role Description
Administrator Administrators always have the Project Author role for allprojects.
Power User Power users do not gain any access to a project beyond what isconfigured for the All Big Data Discovery users group.
User Users do not gain any access to a project beyond what isconfigured for the All Big Data Discovery users group.
Restricted User Restricted users do not gain any access to a project beyond what isconfigured for the All Big Data Discovery users group.
If you wish to assign project permissions by Studio roles, you can use the ControlPanel User Settings > User Groups page to create a User Group that maps to a role,and then use the Project Settings > Sharing page within a project to assignpermissions for that User Group.
For additional details about user roles in Studio, see "About Role Privileges" in theAdministrator's Guide.
Project TypesThe project type listed in the Catalog project detail panel reflects the assigned roles.
Project types reflect user access settings. The project types are as follows:
Project Types
8-2 Studio User's Guide

Project Type Description
Private • The project creator and Studio Administrators are theonly users with access
• The All Big Data Discovery users group is set to NoAccess
Projects are Private by default. Access must be granted by thecreator or by a Studio Administrator.
Public • The All Big Data Discovery users group is set to ProjectAuthors
Public projects grant view access to Studio users.
Shared The project has been modified in any of the following ways:• Users other than the creator are added to the project• User Groups other than All Big Data Discovery admins
and All Big Data Discovery users are added to the project• The All Big Data Discovery users group is set to Project
Restricted Users
Projects are set to Shared to indicate changes from the defaultPublic or Private permissions.
Assigning project rolesYou can grant access to a project by assigning project roles to users and user groups.Sharing settings are accessible from the Project Settings page or from the projectdetails panel in the Catalog.
You must have Project Author permissions for a project in order to assign roles.
You can assign Project Restricted User or Project Author access to individual users orto user groups. Users gain the greater permissions of either their group permissions ortheir individually assigned permissions. For details on permission levels, see Projectand User Roles.
To share a project:
1. Navigate to the sharing settings:
a. From the Catalog, select the project to modify and click the edit link beside theproject Access level:
The Sharing Setup pane displays.
b. From within a project, click Configuration Options in the top right corner of thepage and select Share:
Assigning project roles
Managing Access to Projects 8-3

The Project Settings screen opens to the Sharing page.
2. To add or remove individual users:
a. Click +User.
The Add Users dialog appears.
b. To add users, drag user names from the Available Users list to the SelectedUsers list.
Optionally, use the Search field to filter the Available Users list.
c. To remove users, click the x next to a user name in the Selected Users list orclick Clear All to remove all selected users.
You can also remove users from the User access table on the Sharing page byclicking the x in the right side column.
d. Click Save.
3. Click the drop down in the Access column to set a user's permissions for theproject.
4. To add or remove groups:
a. Click +Group.
The Add Groups dialog appears.
b. To add groups, drag group names from the Available User Groups list to theSelected User Groups list.
Optionally, use the Search field to filter the Available User Groups list.
c. To remove groups, click the x next to a group name in the Selected UserGroups list or click Clear All to remove all selected groups.
You can also remove groups from the Group access table on the Sharing pageby clicking the x in the right side column.
Note: You cannot remove or modify permissions for the All Big DataDiscovery admins group, and you cannot remove the All Big Data Discoveryusers group.
d. Click Save.
Assigning project roles
8-4 Studio User's Guide

5. Click the drop down in the Access column to set a group's permissions for theproject.
6. Click Save.
Assigning project roles
Managing Access to Projects 8-5

Assigning project roles
8-6 Studio User's Guide

9Managing Project Pages
A project can contain any number of pages where you create components to visualizedata.
Adding a page to a projectWhen you first create a project, it contains a single empty page. From theproject pages view, you can then add additional pages.
Renaming a pageAfter you create a page, you can change the display name that appearson its tab.
Changing the page layoutYou can select the layout to use for each page in your project.
Changing the data set binding for a pageEach page within a project is data bound to a specific data set. Thisapproach provides a more granular page-level data binding rather thanproject-level data binding. If necessary, you can change the data setassociated with a particular page.
Deleting a pageYou can delete pages from a project. When you a delete a page, you alsodelete any components on the page and bookmarks and snapshotscreated for that page.
Adding and deleting components on a pageIf you have Project Author or Project Restricted User permissions for aproject, you can add and delete components. The components providefunctions to display and create different visualizations of the projectdata.
Adding a page to a projectWhen you first create a project, it contains a single empty page. From the project pagesview, you can then add additional pages.
Creating a project page causes your project to open to the first Discover page insteadof the Explore page. Projects open to the Explore page if they include only an emptyPage 1 (created by default for new projects), or if all pages have been removed.
To add a page to a project:
1. Select Discover.
2. In the page footer, click the add page icon next to the page tabs.
Managing Project Pages 9-1
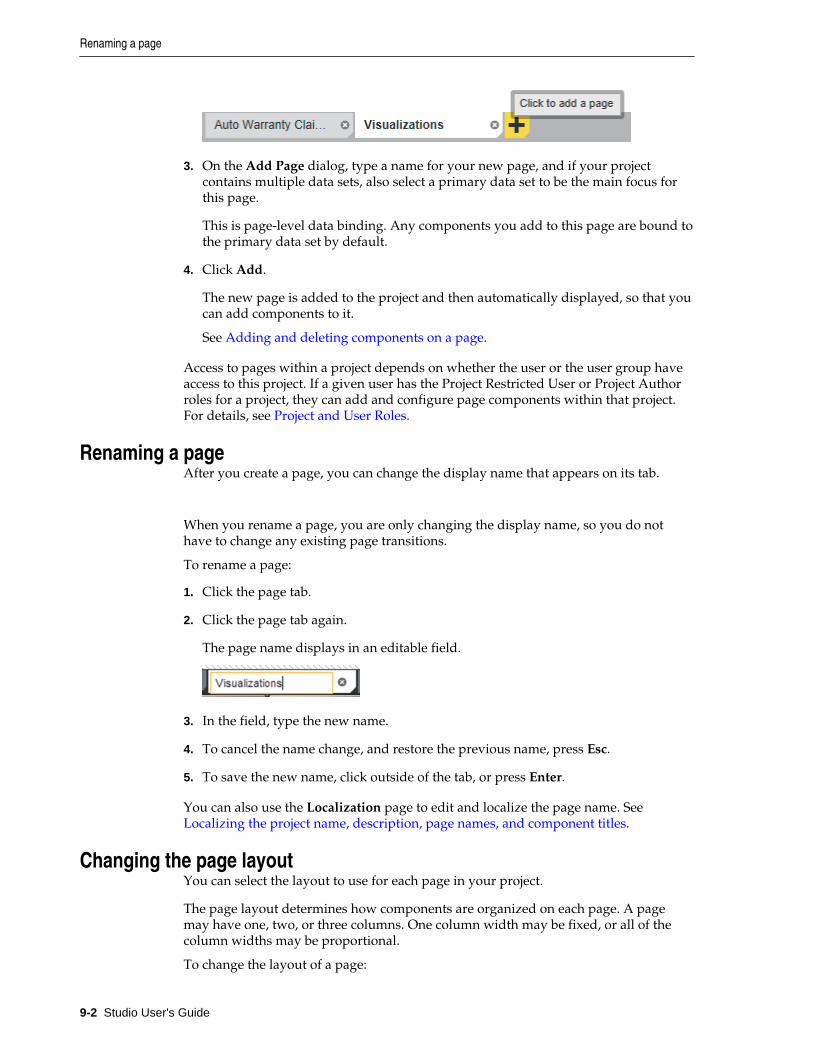
3. On the Add Page dialog, type a name for your new page, and if your projectcontains multiple data sets, also select a primary data set to be the main focus forthis page.
This is page-level data binding. Any components you add to this page are bound tothe primary data set by default.
4. Click Add.
The new page is added to the project and then automatically displayed, so that youcan add components to it.
See Adding and deleting components on a page.
Access to pages within a project depends on whether the user or the user group haveaccess to this project. If a given user has the Project Restricted User or Project Authorroles for a project, they can add and configure page components within that project.For details, see Project and User Roles.
Renaming a pageAfter you create a page, you can change the display name that appears on its tab.
When you rename a page, you are only changing the display name, so you do nothave to change any existing page transitions.
To rename a page:
1. Click the page tab.
2. Click the page tab again.
The page name displays in an editable field.
3. In the field, type the new name.
4. To cancel the name change, and restore the previous name, press Esc.
5. To save the new name, click outside of the tab, or press Enter.
You can also use the Localization page to edit and localize the page name. See Localizing the project name, description, page names, and component titles.
Changing the page layoutYou can select the layout to use for each page in your project.
The page layout determines how components are organized on each page. A pagemay have one, two, or three columns. One column width may be fixed, or all of thecolumn widths may be proportional.
To change the layout of a page:
Renaming a page
9-2 Studio User's Guide

1. In a project, select Discover.
2. In the right bar, click the pencil icon to edit page settings.
3. Expand Page Templates and select the layout you want to apply to the page.
The new layout is applied to the page, with any existing components organizedaccordingly.
Changing the data set binding for a pageEach page within a project is data bound to a specific data set. This approach providesa more granular page-level data binding rather than project-level data binding. Ifnecessary, you can change the data set associated with a particular page.
To change the data set binding for a page:
1. Select Discover.
2. In the footer, select the page you want to modify.
3. In the right bar, click the pencil icon to edit page settings.
4. Expand Page Data Settings and select a different primary data set from the list.
Deleting a pageYou can delete pages from a project. When you a delete a page, you also delete anycomponents on the page and bookmarks and snapshots created for that page.
To delete a page:
1. Click the delete icon in the top corner of the page that you want to delete.
2. To delete the page, click OK.
Adding and deleting components on a pageIf you have Project Author or Project Restricted User permissions for a project, you canadd and delete components. The components provide functions to display and createdifferent visualizations of the project data.
To add and delete components on a page:
1. To add a component:
a. Click the add component icon in the upper right of the panel.
For example:
Changing the data set binding for a page
Managing Project Pages 9-3

b. To display a description of a component, hover the mouse over the componenticon.
c. To find a specific component, use the search field.
d. To add a component to the page, either:
• Click the add icon for the component. If the page contains more than onecolumn, then the component is added to the leftmost column.
• Drag the component from the add page/component panel to the appropriatelocation on the page.
2. To delete a component from a page, click its delete icon.
For details regarding each component's function and configuration workflow, see Working with Components.
Adding and deleting components on a page
9-4 Studio User's Guide

Part VViewing and Using Projects


10Navigating Within a Project
From the Catalog, you can select a project to view. You can also display informationabout the project and its associated data sets.
Navigating to a projectTo navigate to a project, click the project name in the Catalog. Theproject details panel also contains a link to display the project.
Navigating within a projectNew projects initially open on the Explore page to allow you to exploreone or more data sets in a project. Projects that already have one or moreDiscover pages configured instead open to the first Discover page.
Displaying information about the project dataIn the header of both the Explore and Transform pages, there is aninformation icon that provides information about the data sets used inthe project:
Navigating to a projectTo navigate to a project, click the project name in the Catalog. The project details panelalso contains a link to display the project.
Navigating within a projectNew projects initially open on the Explore page to allow you to explore one or moredata sets in a project. Projects that already have one or more Discover pagesconfigured instead open to the first Discover page.
In Explore, each data set is represented on a tabbed page. For details on exploring adata set, see Exploring a Data Set.
You can also switch to the Transform or Discover pages, and, if you have roleprivileges, you can also display project settings. In Discover, each tabbed pageprovides an area to add components to analyze the data and discover insights hiddenin data. For details about using specific components, see Working with Components.
Navigating Within a Project 10-1

Displaying information about the project dataIn the header of both the Explore and Transform pages, there is an information iconthat provides information about the data sets used in the project:
To display information about the project, click the Show Data Set Properties icon.
For each data set, the information includes:
• The data source name
• When the data was last updated
• Information about the status of the data set, to indicate when a data set is loadingor has a problem
• Information about other related data sets in the project
The Data Set Relationships tab shows how the data sets are linked.
Displaying information about the project data
10-2 Studio User's Guide

11Creating and Using Bookmarks
You can create bookmarks for your own use or to share with other users.
About bookmarksBookmarks allow you to save a given navigation and component state soyou can return to it at a later time or email it to other users.
Displaying and navigating to bookmarksThe bookmarks panel displays bookmarks created by the current userfor the current project. It also includes any shared bookmarks created byother users.
Creating, editing, and deleting bookmarksYou can create new bookmarks. You can also edit or delete bookmarksthat you have created.
Generating bookmark linksUsers can get access to bookmarks using a hyperlink. From the Actionsmenu on the bookmark details panel, you can generate the link to thebookmark.
Emailing bookmark linksUsers can get access to bookmarks using a hyperlink. From the Actionsmenu on the bookmark details panel, you can email the link.
Bookmark data saved for each component and panelBookmarks include different levels of detail for the types of componentsand panels on a page.
About bookmarksBookmarks allow you to save a given navigation and component state so you canreturn to it at a later time or email it to other users.
Note: A bookmark is only guaranteed to work if the page that it points to hasnot been changed. If components have been added, removed, or modified,then the bookmark may no longer be valid.
You delete bookmarks manually, or in the following situations:
• When a page or project is removed, any bookmarks for that page or project are alsoremoved.
• When a user is removed, any bookmarks created by that user are also removed.
Creating and Using Bookmarks 11-1

Displaying and navigating to bookmarksThe bookmarks panel displays bookmarks created by the current user for the currentproject. It also includes any shared bookmarks created by other users.
To display and navigate to bookmarks:
1. Within a project, click Discover.
2. Click the bookmarks icon in the left panel:
The Bookmarks pane displays.
Bookmarks you create are listed under My Bookmarks. If you configure abookmark to be available to other users, it is marked with a shared icon. TheShared Bookmarks list contains shared bookmarks created by other users.
3. To search for a bookmark, use the Filter field.
Studio filters the list to display bookmarks where entered text is included in thebookmark name, bookmark description, or the refinements associated with thebookmark. Search results include both your bookmarks and shared bookmarks.
4. To sort bookmarks, click Sort at the top of the Bookmarks pane and select a sorttype.
You can sort the list alphabetically by bookmark name, or based on the order thatbookmarks were created.
5. To navigate to a specific bookmark, click the bookmark name.
Creating, editing, and deleting bookmarksYou can create new bookmarks. You can also edit or delete bookmarks that you havecreated.
Displaying and navigating to bookmarks
11-2 Studio User's Guide
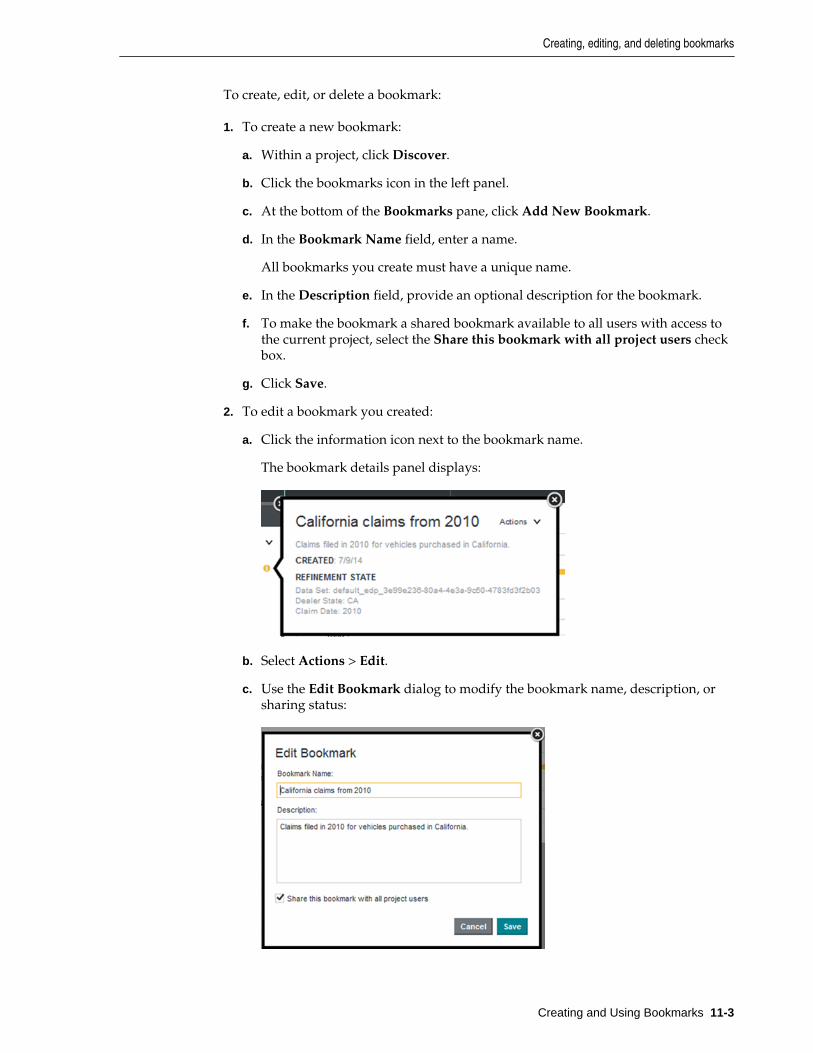
To create, edit, or delete a bookmark:
1. To create a new bookmark:
a. Within a project, click Discover.
b. Click the bookmarks icon in the left panel.
c. At the bottom of the Bookmarks pane, click Add New Bookmark.
d. In the Bookmark Name field, enter a name.
All bookmarks you create must have a unique name.
e. In the Description field, provide an optional description for the bookmark.
f. To make the bookmark a shared bookmark available to all users with access tothe current project, select the Share this bookmark with all project users checkbox.
g. Click Save.
2. To edit a bookmark you created:
a. Click the information icon next to the bookmark name.
The bookmark details panel displays:
b. Select Actions > Edit.
c. Use the Edit Bookmark dialog to modify the bookmark name, description, orsharing status:
Creating, editing, and deleting bookmarks
Creating and Using Bookmarks 11-3

d. Click Save.
3. To delete a bookmark you created:
a. Click the information icon next to the bookmark name.
b. Select Actions > Delete.
A confirmation dialog displays.
c. Click Click to delete.
Generating bookmark linksUsers can get access to bookmarks using a hyperlink. From the Actions menu on thebookmark details panel, you can generate the link to the bookmark.
Bookmarks that are shared via links have the following properties:
• Anyone using a bookmark link must log in to Studio. Users cannot navigate to abookmark for a project or page if they do not have permission to access it.
• Personal bookmarks (bookmarks that do not have the Share this bookmark withall project users check box selected) can be shared by providing a link. Usersaccessing a linked bookmark can create their own copy by using the Add NewBookmark button from the linked page or project.
To generate a link to a bookmark:
1. Click the information icon next to the bookmark name.
2. Select Actions > Create Link.
The Bookmark Link dialog displays. The link is selected automatically so that youcan immediately copy it to the clipboard.
Emailing bookmark linksUsers can get access to bookmarks using a hyperlink. From the Actions menu on thebookmark details panel, you can email the link.
To send snapshots by email, the outbound email server for Big Data Discovery mustbe configured. For information on how to configure the outbound email server, see theAdministrator's Guide.
Note: Emailing bookmark links is not supported by Big Data DiscoveryCloud Service. The feature is supported by Big Data Discovery.
Generating bookmark links
11-4 Studio User's Guide
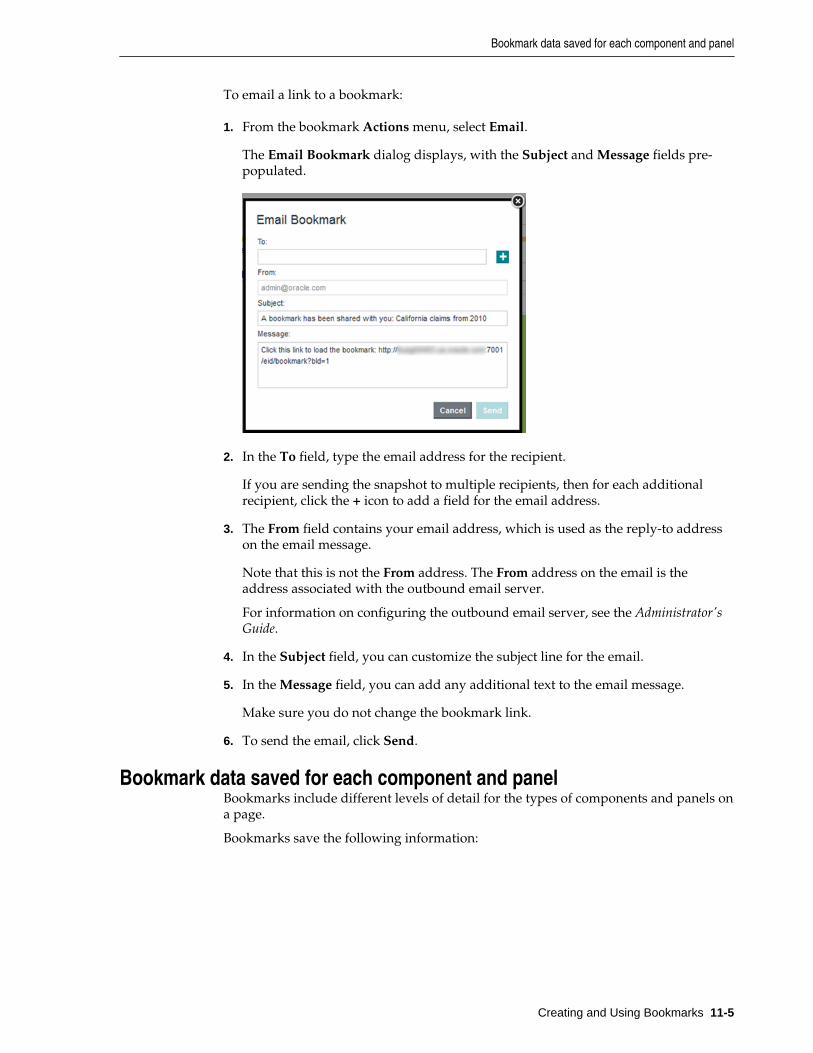
To email a link to a bookmark:
1. From the bookmark Actions menu, select Email.
The Email Bookmark dialog displays, with the Subject and Message fields pre-populated.
2. In the To field, type the email address for the recipient.
If you are sending the snapshot to multiple recipients, then for each additionalrecipient, click the + icon to add a field for the email address.
3. The From field contains your email address, which is used as the reply-to addresson the email message.
Note that this is not the From address. The From address on the email is theaddress associated with the outbound email server.
For information on configuring the outbound email server, see the Administrator'sGuide.
4. In the Subject field, you can customize the subject line for the email.
5. In the Message field, you can add any additional text to the email message.
Make sure you do not change the bookmark link.
6. To send the email, click Send.
Bookmark data saved for each component and panelBookmarks include different levels of detail for the types of components and panels ona page.
Bookmarks save the following information:
Bookmark data saved for each component and panel
Creating and Using Bookmarks 11-5

Component or Panel Persisted States
Available Refinements • Whether the panel is expanded or collapsed• Which data set is expanded• Expanded and collapsed groups and attributes• Toggle selection for the refinement type (value list vs.
range filter vs. recurring date)
Box Plot • Selected Y-axis metric• Selected X-axis attribute• Boxes per page
Chart • All chart information. This includes the selected metric,selected dimensions, sort order and sort options,alternative chart suggestions, and all state information inthe Chart Settings panel.
Histogram Plot • Selected metric• Number of bins
Map • Records per page• Sort order• Map searches
Parallel Coordinates Plot • Selected view• Displayed metrics• Aggregation method• Selected dimension
Pivot Table None
Results List • Sort order• Records per page
Results Table • Sort order• Number of records per page
Selected Refinements • Whether the panel is expanded or collapsed• Whether refinements for each data set are hidden• Display order of the refinement tiles• Whether each refinement tile is expanded• Scroll position for navigating through the refinement tiles
Summarization Bar None
Tabbed ComponentContainer
Selected tab
Tag Cloud • Display format (cloud or list)• Selected dimension• Selected metric
Timeline • Selected time frame• Selected date/time attributes• Selected metrics
Bookmark data saved for each component and panel
11-6 Studio User's Guide

12Creating and Managing Snapshots
Studio allows you to create and manage snapshots of project pages.
About snapshots and snapshot galleriesA snapshot captures an image of a component or page at a specificmoment in time. You can save these snapshots in Studio.
Displaying the list of snapshots and snapshot galleriesIf you click the snapshot (camera) icon, available on the Discover page,Studio displays the snapshots panel.
Creating and managing individual snapshotsYou can create, view details, and perform actions on individualsnapshots.
Exporting the entire snapshot listThe Actions menu on the snapshots panel includes an option to exportthe entire list of snapshots. This feature saves the images to a single PDFfile.
Emailing the entire snapshot listThe Actions menu on the snapshots panel includes an option to emailthe entire list of snapshots. This feature saves the images to a single PDFfile and emails the file.
Creating and managing snapshot galleriesYou can group snapshots into snapshot galleries, which you can thenemail to other users.
About snapshots and snapshot galleriesA snapshot captures an image of a component or page at a specific moment in time.You can save these snapshots in Studio.
You can email individual snapshots, save them as image files, and return to the projectstate reflected by the snapshot.
You can also create galleries of related snapshots. For example, a snapshot gallerycould show the progression of chart data as different refinements are applied.
You can email a snapshot gallery and save a gallery to a PDF file.
Displaying the list of snapshots and snapshot galleriesIf you click the snapshot (camera) icon, available on the Discover page, Studiodisplays the snapshots panel.
For example:
Creating and Managing Snapshots 12-1

The snapshots panel includes:
• The Snapshots list, showing the snapshots you have created for this project.
• The Galleries list, showing the snapshot galleries you have created for this project.
To find a specific snapshot, use the search field at the top of the Snapshots list. As youtype, Studio filters the list to display snapshots with the entered text in the snapshotname, snapshot description, or the refinements associated with the snapshot.
To find a specific gallery, use the search field at the top of the Galleries list. As youtype, Studio filters the list to display galleries with the entered text in the gallery nameor gallery description.
Creating and managing individual snapshotsYou can create, view details, and perform actions on individual snapshots.
Creating a snapshotFrom either the project footer or the snapshots panel, you can createsnapshots of a project page. The snapshots are added to the Snapshotslist.
Managing saved snapshotsFrom the Snapshots list for a project, you can edit, email, save, anddelete snapshots. You can also use the snapshot as a bookmark todisplay the project page in the state reflected by the snapshot.
Creating a snapshotFrom either the project footer or the snapshots panel, you can create snapshots of aproject page. The snapshots are added to the Snapshots list.
To create a new snapshot:
1. Select Discover if you haven't already.
2. Click the snapshot (camera) icon to display the Snapshots panel
For example:
Creating and managing individual snapshots
12-2 Studio User's Guide

3. In the project footer click New snapshot or on the snapshots panel, click Newsnapshot.
Both bring up the same dialog. The Add Snapshot dialog displays. The dialogincludes a generated default name for the snapshot.
4. In the Snapshot Name field, update the name for the snapshot.
5. In the Description field, type a description of the snapshot.
6. Click Save.
Managing saved snapshotsFrom the Snapshots list for a project, you can edit, email, save, and delete snapshots.You can also use the snapshot as a bookmark to display the project page in the statereflected by the snapshot.
Note that in order to be able to send snapshots by email, the outbound email server forStudio must be configured. For information about how to configure the outboundemail server, see the Administrator's Guide.
To manage the snapshots in the Snapshots list:
1. To display details for a snapshot, click the snapshot.
The snapshot details include the name, description, creation date, source of thedata, and the refinements that were in place when you created the snapshot.
Creating and managing individual snapshots
Creating and Managing Snapshots 12-3

The Actions menu contains options to edit, email, save, and delete the snapshot.You can also navigate to the refinement state represented by the snapshot.
2. To edit a snapshot:
a. From the snapshot Actions menu, select Edit.
b. On the edit dialog, you can edit the name and description of the snapshot.
c. To save the changes, click Save.
3. To email a snapshot:
a. From the snapshot Actions menu, select Email.
The Email Snapshot dialog displays.
Creating and managing individual snapshots
12-4 Studio User's Guide

b. In the To field, type the email address of the recipient.
If you are sending the snapshot to multiple recipients, then for each additionalrecipient, click the + icon to add a field for the email address.
c. The From field shows your email address as the "Reply to:" address on the emailmessage.
Note that this is not the From address. The From address on the email is theaddress associated with the outbound email server.
For information on configuring the outbound email server, see theAdministrator's Guide.
d. In the Subject field, edit the subject line of the email.
e. In the Message field, edit the text for the email message.
f. To send the snapshot, click Send.
4. To save a snapshot to a file, from the Actions menu, click Save to Disk.
Depending on your browser, you are prompted to open or save the image.
5. To display the project page using the refinement state associated with the snapshot,on the snapshot details, click Apply this refinement state.
6. To delete a snapshot, from the snapshot Actions menu, select Delete.
You are prompted to confirm that you want to delete the snapshot from the list. Ifthey snapshot is part of a gallery, it is still stored there.
Exporting the entire snapshot listThe Actions menu on the snapshots panel includes an option to export the entire listof snapshots. This feature saves the images to a single PDF file.
To export the entire set of snapshots:
1. In the Actions menu, click Save All to Disk.
2. Use the file save dialog to name and save the file.
Exporting the entire snapshot list
Creating and Managing Snapshots 12-5

Emailing the entire snapshot listThe Actions menu on the snapshots panel includes an option to email the entire list ofsnapshots. This feature saves the images to a single PDF file and emails the file.
Note that in order to be able to send snapshots by email, you must configure theoutbound email server for Studio. For information on how to configure the outboundemail server, see the Administrator's Guide.
Note: Emailing snapshots is not supported by Big Data Discovery CloudService. The feature is supported by Big Data Discovery.
To email entire set of snapshots:
1. In the Actions menu, click Email All.
2. On the email dialog, in the To field, type the email address of the recipient.
To add a field for an additional recipient, click +.
3. In the Subject field, type the subject line for the email.
4. In the Message field, type the text of the email.
5. Click Send.
The snapshots are sent in a PDF file attached to the email.
Creating and managing snapshot galleriesYou can group snapshots into snapshot galleries, which you can then email to otherusers.
Creating a snapshot galleryYou can create snapshot galleries to group a related set of snapshots. Forexample, you can put together a "slide show" of screen shots showing aseries of refinement states.
Editing and deleting snapshot galleriesWithin a snapshot gallery, you can add snapshots to the gallery, deletesnapshots from the gallery, and change the order of the snapshots in thegallery. For each snapshot, you can provide a name and description thatis specific to the gallery.
Emailing a snapshot galleryYou can email an entire snapshot gallery to one or more email addresses.The gallery is attached to the message as a PDF file.
Exporting a snapshot gallery to a PDF fileYou can export an entire snapshot gallery to a PDF file.
Creating a snapshot galleryYou can create snapshot galleries to group a related set of snapshots. For example, youcan put together a "slide show" of screen shots showing a series of refinement states.
From the snapshots panel, to create a new snapshot gallery:
Emailing the entire snapshot list
12-6 Studio User's Guide

1. On the snapshots panel, click New Gallery.
The new gallery dialog displays.
2. In the name field, type the name of the new gallery.
3. In the list of snapshots, click each snapshot you want to add to the new gallery.
To deselect a snapshot, click it again.
4. To save the new gallery, click Save.
The gallery panel for the new gallery displays.
The first snapshot is selected and displays at the top of the panel.
At the bottom of the panel is the full list of snapshots in the gallery.
Creating and managing snapshot galleries
Creating and Managing Snapshots 12-7

Editing and deleting snapshot galleriesWithin a snapshot gallery, you can add snapshots to the gallery, delete snapshots fromthe gallery, and change the order of the snapshots in the gallery. For each snapshot,you can provide a name and description that is specific to the gallery.
To edit and delete a snapshot gallery:
1. To display the details for a gallery, in the Galleries list, click the information iconfor the gallery.
The gallery panel for the selected gallery displays.
The first snapshot is selected by default, with the full list of snapshots in the gallerydisplayed at the bottom of the panel.
You can use the next and previous icons to page through the snapshot list.
2. To determine the order of the snapshots in the gallery, drag and drop the snapshotsin the gallery snapshots list.
3. To display and edit the details for a snapshot in the gallery, in the snapshots list,click the snapshot.
You can use the name and description fields at the top of the panel to customize thename and description of the snapshot in the context of the gallery.
This name and description is specific to this instance of the snapshot within thegallery.
4. To page through the snapshots in full screen mode:
a. Click the full screen icon at the top right.
Creating and managing snapshot galleries
12-8 Studio User's Guide

b. Use the next and previous icons to page through the snapshots.
c. To exit the full screen mode, either click the return icon, or press the Esc key.
5. To add snapshots to the gallery:
a. Click Add more snapshots.
b. On the add snapshots dialog, click each snapshot that you want to add.
To deselect the snapshot, click it again.
c. When you have selected and deselected the snapshots as needed, click Save.
6. To delete a snapshot from the gallery:
a. Hover the mouse over the snapshot.
b. Click the delete icon.
7. To save the changes to the snapshot gallery, click Save.
8. To delete a snapshot gallery, in the Galleries list, click the delete icon for thesnapshot gallery.
Emailing a snapshot galleryYou can email an entire snapshot gallery to one or more email addresses. The galleryis attached to the message as a PDF file.
Note that in order to be able to send a snapshot gallery by email, you must configurethe outbound email server for Big Data Discovery. For information on how toconfigure the outbound email server, see the Administrator's Guide.
Note: Emailing a snapshot gallery is not supported by Big Data DiscoveryCloud Service. The feature is supported by Big Data Discovery.
To email a snapshot gallery:
1. In the Galleries list, click the information icon for the snapshot gallery.
2. In the gallery Actions menu, click Email.
3. On the Email Gallery dialog, in the To field, type the email address of therecipient.
To add another recipient, click +.
4. In the Subject field, edit the subject line of the email.
5. In the Message field, edit the text for the email message.
6. Click Send.
Exporting a snapshot gallery to a PDF fileYou can export an entire snapshot gallery to a PDF file.
To export a snapshot gallery:
Creating and managing snapshot galleries
Creating and Managing Snapshots 12-9

1. In the Galleries list, click the information icon for the snapshot gallery.
2. In the gallery Actions menu, click Save to Disk.
3. Use the file save dialog to name and save the PDF file.
Creating and managing snapshot galleries
12-10 Studio User's Guide

Part VIManaging Project Data


13Managing Project Data Sets
The Data Set Manager provides options add, remove, or load a full data set within aproject and also to enable or disable links among multiple data sets in a project.
Adding a data set to an existing projectStudio provides several options for adding a data set to a project.
Loading the full data set in a projectAfter you add a data set to a project, you can choose to load the full dataset into the project. This is useful for comprehensive data analysis andbuilding a BDD application. Remember that without this full data load,Studio displays a sampled data set of approximately 1 million records ifthe full data set is larger than 1 million records.
Configuring a project data set for incremental updatesTo prepare your data set for an incremental update, you must first load afull data set and provide a record identifier so that Studio can determinethe incremental changes to apply during the update.
Converting a project to a BDD ApplicationA BDD Application is a logical designation of a project that contains oneor more data sets that you transform, update, and maintain for long-lasting data analysis, reporting, and sharing. In this release, you canthink of an application as a production-quality project. This topicdescribes the high-level workflow of converting a project into a BDDapplication and provides pointers to more detailed instructions asnecessary.
Removing a data set from a projectYou can have any number of data sets associated with a project. If a dataset is no longer useful in a particular project, you can remove the data setfrom that project. This removal affects only the active project. It does notaffect any other projects that a data set may be added to.
Adding a data set to an existing projectStudio provides several options for adding a data set to a project.
From the Catalog
On the Catalog, the data set details panel includes an option to add the data set to aproject.
Click Add to Project, then select the project.
Managing Project Data Sets 13-1

From Explore
When exploring a data set from the Catalog, the page header includes an option to addthe data set to a project.
Click Add to Project, then select the project.
From within a project
From the Explore or Transform pages of a project, to add a data set to the project, clickthe + icon to the right of the data set tabs.
You can select an existing data set, or create a new data set.
Loading the full data set in a projectAfter you add a data set to a project, you can choose to load the full data set into theproject. This is useful for comprehensive data analysis and building a BDDapplication. Remember that without this full data load, Studio displays a sampled dataset of approximately 1 million records if the full data set is larger than 1 millionrecords.
The Load Full Data Set option behaves as follows:
• It loads all records stored in the Hive table for a data set. This includes any tableupdates performed by a system administrator. The full data load happens duringthe initial full data load only. After the first full data load, the action changes toReload Data Set and you can reload the data set any number of times.
• It increases a sampled data set up to the full size of the data set.
• If the project contains a transformation script that you have committed, then Studioruns that script against the full data set. This way, all transformations apply to thefull data set in the project.
The following diagram shows the workflow of loading a full data set into a project:
In this workflow, the following actions take place:
1. You load a data set from a file or JDBC data source. This is the initial load of thedata set into the Catalog.
Loading the full data set in a project
13-2 Studio User's Guide

2. You can then explore the data and add it to a project to use Transform andDiscover.
3. You load the full data set and reload the data set as necessary.
Notice that loading the full data set affects only the data set in a specific project: it doesnot affect the data set as it displays in the Catalog.
To check if a data set has already been fully loaded into a project, go to the Data SetManager page and see if the Record Data Volume property indicates Full dataset is loaded.
To load the full data set in a project:
1. From the Configuration Options menu, select Project Settings.
2. Select Data Set Manager and expand the options next to the data set name.
3. Select Load Full Data Set.
4. In the confirmation dialog, select Load Full Data Set again.
5. Return to Explore or Transform to monitor the progress of the load operation.
Depending on the size of the data set, the load may take some time to complete. Afterthe operation finishes, you can check the Data Volume information to see that theFull data set is loaded and the Explore header indicates the full record count.
Configuring a project data set for incremental updatesTo prepare your data set for an incremental update, you must first load a full data setand provide a record identifier so that Studio can determine the incremental changesto apply during the update.
An incremental update is performed with DP CLI. However, in Studio, you prepareyour data set for this type of update so that you can then run an incremental updateagainst a project data set with DP CLI.
An incremental update lets you add newer data to an existing data set in project,without removing already loaded data. It is most useful when you keep alreadyloaded data, but would like to continue adding new data.
Note: You cannot run an incremental update from Studio. For details and adiagram of the incremental update workflow, see the Getting Started Guide. Forfull information on how to run an incremental update with DP CLI, see theData Processing Guide.
The following diagram shows the Configure for Updates action. This action preparesyour data set for running incremental updates with DP CLI:
Configuring a project data set for incremental updates
Managing Project Data Sets 13-3

In this diagram, from left to right, the following actions take place: you load a data setinto Studio from a file or a JDBC source. Next, you add a data set to a project and loada data set in full. Now you can run Configure for Updates. Notice that you can onlyrun Configure for Updates for a data set that is already in project and has alreadybeen loaded in full.
The action Configure for Updates performs two tasks: it loads a full data set (by re-running the operation for loading a full data set), and lets you configure a recordidentifier. The record identifier is then used by Data Processing CLI when it runs anincremental update for the data set.
The record identifier must be unique enough to determine the delta between recordsin the Hive table and records in the project data set. Practically speaking, this meansthat in some project data sets you might have to provide a record identifier that is thecombination of several attributes. In other projects, you might have a single attributethat works as a unique record identifier without any additional combination.
Studio helps you identify which attribute in your data set is a good candidate for arecord identifier. When you select an attribute from the list as a record identifier,Studio calculates the percentage of records in your data set that have unique values forthe combination of attributes. The uniqueness score must be 100% or the DataProcessing workflow will fail and return an exception to Studio.
To check if a data set already has a record identifier defined in Studio, go to the DataSet Manager page and see if there is a Record Identifiers property specified.
To configure a project data set for incremental updates:
1. From the Configuration Options menu, select Project Settings.
2. Select Data Set Manager and expand options next to the data set name.
3. Select Configure for Updates.
4. From the list, select an attribute for the data set. If the Key Uniqueness is not 100%for the attribute, click + Attribute to add another attribute and repeat to improveuniqueness.
Studio combines these attributes into a new unique record identifier for the dataset.
Configuring a project data set for incremental updates
13-4 Studio User's Guide

5. Click Configure for Updates.
After you click this option, a Load Full Data Set operation starts automatically as abackground process.
At this point you can schedule and run incremental updates using theIncrementalUpdate command of the Data Processing CLI. For details, see the DataProcessing Guide.
Converting a project to a BDD ApplicationA BDD Application is a logical designation of a project that contains one or more datasets that you transform, update, and maintain for long-lasting data analysis, reporting,and sharing. In this release, you can think of an application as a production-qualityproject. This topic describes the high-level workflow of converting a project into aBDD application and provides pointers to more detailed instructions as necessary.
Before you convert a project to an application there are a number of tasks that youmust have already performed. These tasks are common to any project and are notspecific to building a BDD Application:
1. Create a data set. You can do this by uploading your source data in Studio or bycreating a Hive table and running a data processing workflow.
2. Add one or more data sets to a project. For details, see Adding a data set to anexisting project.
3. Set access permissions on data sets and projects. For details, see Managing Accessto Projects.
4. If necessary, transform the project data set to clean up the attributes and attributevalues. This might include reformatting attributes, changing data types, splittingattributes into more specific attributes, creating new attributes, and so on. Fordetails, see About the Transform page user interface.
5. Build components to visualize the data in Discover that you want to preserve in amore productized way.
To convert a project to a BDD Application:
1. Optionally, if you created one or more data sets by uploading source data intoStudio, you should change the source of each data set to point to a new Hive table.This step is not required if data set is based on a table created directly in Hive. (Thisstep is necessary for data encoding reasons.)
a. In Studio, find the data set's current Hive table name by clicking Show Data SetProperties. The name is of the form default.my_uploaded_data.
b. Browse to the Hive query editor for your Hadoop distribution. For example, ina Cloudera environment, this is the Hive Query Editor in Hue.
c. Run the following Hive command and specify the data set's Hive table name:
SHOW CREATE TABLE `default.my_uploaded_data`
d. Copy the resulting create table command and modify it in a text editor. Modifythe table definition to point to the new location in HDFS of the data set's sourcefiles. Specify the column data types using Hive types; by default, the tabledescription shows all attributes as strings. Also, change the table encoding
Converting a project to a BDD Application
Managing Project Data Sets 13-5

properties like Row Format, Storage Format, and SerDe as necessary to matchthe source file encoding. Optionally change other table properties as necessarylike dataSetDisplayName or comment.
e. Run drop table to remove the existing Hive table.
DROP TABLE `default.my_uploaded_data`
f. Run the new create table command to re-create the table with the same nameand columns but new source file location and encoding.
g. Test that the new table definition is correct by browsing in Hue to MetastoreTables. Find the re-created Hive table and click on Sample. Optionally run aHive query to count the number of rows in the table to confirm the expecteddata set size.
h. Repeat these steps for each data set in the project that has a Data source typevalue of Excel, Delimited, or JDBC.
Important: Now that you have a new Hive table that has the same name as the oldHive table, do not use the Actions > Reload Data set feature on the quick look forthis specific data set in the Catalog. The Reload Data set feature invokes the fileupload wizard and allows you to overwrite the production Hive table that you justcreated.
2. Optionally, specify a record identifier for the project if you plan to run incrementalupdates to the data.
For details, see Configuring a project data set for incremental updates .
3. Load the full data set into the project.
This step provides all the source data so that visualization and analysis includesthe full record set. For details, see Loading the full data set in a project.
4. Schedule updates to data sets using the Data Processing CLI and cron jobs.
For details, see "DP CLI configuration" and "DP CLI cron job" in the Data ProcessingGuide.
Removing a data set from a projectYou can have any number of data sets associated with a project. If a data set is nolonger useful in a particular project, you can remove the data set from that project.This removal affects only the active project. It does not affect any other projects that adata set may be added to.
To remove a data set from a project:
1. Select either Explore or Transform.
2. In the footer, locate the data set you want to remove from the project
3. Click the remove icon for the data set.
For example:
Removing a data set from a project
13-6 Studio User's Guide

4. Alternatively, you can also remove a data set from a project on the Data SetManager page:
a. Select the Project Settings > Data Set Managerpage.
b. Expand the data set to display its information and select Remove from Project.
Removing a data set from a project
Managing Project Data Sets 13-7

Removing a data set from a project
13-8 Studio User's Guide

14Linking Project Data Sets
You can link together project data sets that have corresponding attributes.
About data set linksYou create a link between two data sets by selecting one or moreattributes from one data set and associating them with correspondingattributes from another data set. These corresponding pairs of attributesare called a link key.
Creating a data set linkYou create a link between two data sets by setting one or morecorresponding attributes from each as the link key. You can do this fromeither the Data Set Manager or the Data Set Relationships tab of thedata set details footer panel.
Editing a link keyYou can edit a link key by adding or removing attribute pairs.
Managing aggregation methods for a linked viewWhen you first create a data set link, the attributes in the linked view areaggregated by the default aggregation methods set for their data types.However, you can change the aggregation methods used for individualattributes from either the Data Set Manager or the Data SetRelationships tab of the data set details footer panel.
Controlling automatic filtering between linked data setsAutomatic filtering of linked data sets is enabled by default, but you candisable it for individual project pages from the Page Data Settingspanel.
About data set linksYou create a link between two data sets by selecting one or more attributes from onedata set and associating them with corresponding attributes from another data set.These corresponding pairs of attributes are called a link key.
For each data set that is linked to others, Studio creates a linked view, which containsattributes from that data set, as well as those it is linked to. For more information, see About linked views.
While you cannot edit the linked views themselves, you can modify the data thatappears in them by adding or removing link key attributes, changing the methodsused to aggregate attributes within the view, and enabling or disabling automaticfiltering.
If you run updates for each of the linked data sets, such as a full data set load or anincremental update, then data set links are preserved and continue to work.
Linking Project Data Sets 14-1
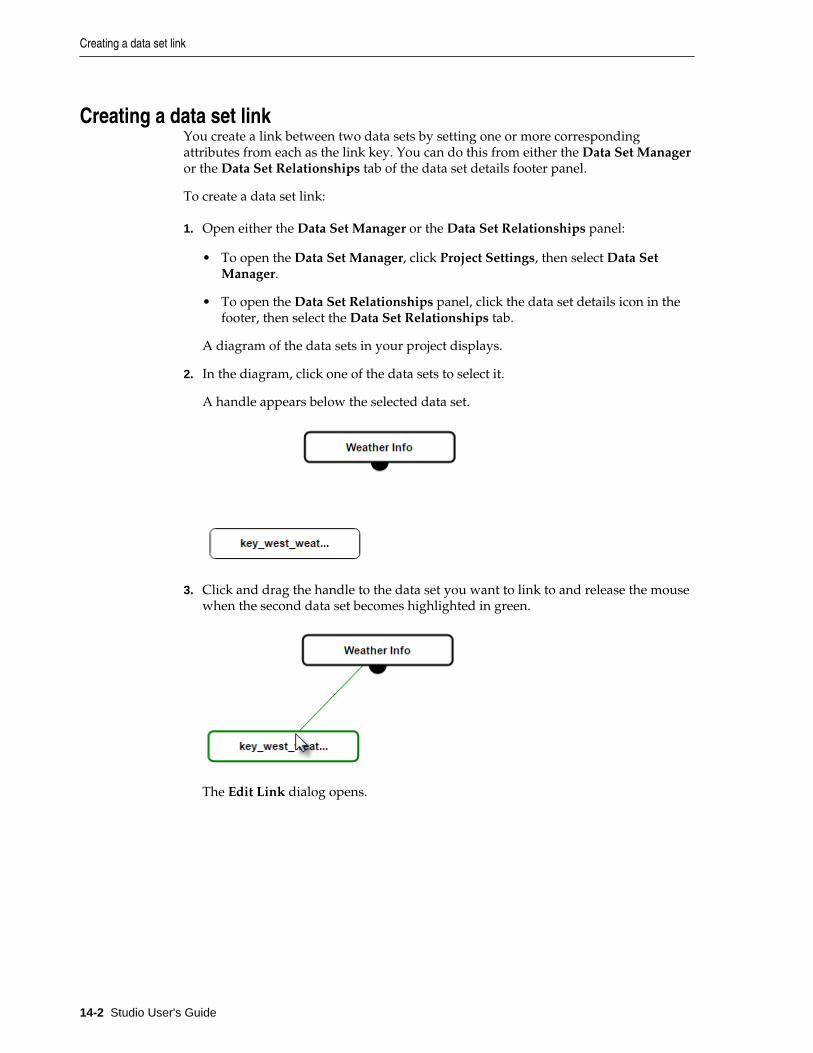
Creating a data set linkYou create a link between two data sets by setting one or more correspondingattributes from each as the link key. You can do this from either the Data Set Manageror the Data Set Relationships tab of the data set details footer panel.
To create a data set link:
1. Open either the Data Set Manager or the Data Set Relationships panel:
• To open the Data Set Manager, click Project Settings, then select Data SetManager.
• To open the Data Set Relationships panel, click the data set details icon in thefooter, then select the Data Set Relationships tab.
A diagram of the data sets in your project displays.
2. In the diagram, click one of the data sets to select it.
A handle appears below the selected data set.
3. Click and drag the handle to the data set you want to link to and release the mousewhen the second data set becomes highlighted in green.
The Edit Link dialog opens.
Creating a data set link
14-2 Studio User's Guide

4. Verify that the Enable link check box is selected.
Deselecting this disables the link.
5. Add at least one attribute pair:
a. Click Select attribute pair.
b. In the attribute pair selection dialog, select an attribute from each data set.
When you select an attribute from one list, the other is automatically filtered forattributes of the same data type.
Creating a data set link
Linking Project Data Sets 14-3

c. Click Apply.
The Edit link dialog is updated with the selected attribute pair.
Creating a data set link
14-4 Studio User's Guide

6. Click Save.
The diagram displays the two linked data sets with the link key between them.
Editing a link keyYou can edit a link key by adding or removing attribute pairs.
To edit the link key for a data set link:
1. Open either the Data Set Manager or the Data Set Relationships panel:
• To open the Data Set Manager, click Configuration Options > Project Settings,then select Data Set Manager.
• To open the Data Set Relationships panel, click the data set details icon in thefooter, then select the Data Set Relationships tab.
A diagram of the data sets and linked views in your project displays.
2. Click the link you want to edit.
The Edit link dialog displays.
Editing a link key
Linking Project Data Sets 14-5

3. Make the desired changes:
• Click Add attribute pair to add a new attribute pair.
• Click the delete icon next to an attribute pair to remove it.
4. When you are satisfied with your changes, click Save.
The combined views in your project are updated to reflect your changes.
Managing aggregation methods for a linked viewWhen you first create a data set link, the attributes in the linked view are aggregatedby the default aggregation methods set for their data types. However, you can changethe aggregation methods used for individual attributes from either the Data SetManager or the Data Set Relationships tab of the data set details footer panel.
For more information on aggregation methods, see Selecting the available and defaultaggregation methods for an attribute.
To manage the aggregation methods for a linked view:
1. Open either the Data Set Manager or the Data Set Relationships panel:
• To open the Data Set Manager, click Configuration Options > Project Settings,then select Data Set Manager.
• To open the Data Set Relationships panel, click the data set details icon in thefooter, then select the Data Set Relationships tab.
A diagram of the data sets and linked views in your project displays.
Managing aggregation methods for a linked view
14-6 Studio User's Guide

2. Click the pencil icon for the view you want to modify.
The manage aggregation dialog displays.
If the selected view is contains more than one data set, the dialog contains a dropdown menu for selecting the data set whose aggregation methods you want tomodify.
The dialog also contains a table that displays sample values from the selected dataset. The two leftmost columns contain values from the Record ID and Link Keyattributes of the selected view.
The remaining columns contain attributes and values from the selected data set.The aggregation method used for each attribute is listed below the attribute's name.
Managing aggregation methods for a linked view
Linking Project Data Sets 14-7

3. If the selected view is linked to multiple data sets, select the name of the data setyou want to modify from the drop down menu.
4. Click the down arrow next to the aggregation method you want to modify.
Note that this will not be available for String attributes.
A drop down menu displays, listing the available aggregation methods for thatattribute.
Managing aggregation methods for a linked view
14-8 Studio User's Guide

5. Select one of the available aggregation methods, then click Save.
The dialog is updated to display the new values for the modified attribute.
Managing aggregation methods for a linked view
Linking Project Data Sets 14-9

6. When you are finished, click Close.
Controlling automatic filtering between linked data setsAutomatic filtering of linked data sets is enabled by default, but you can disable it forindividual project pages from the Page Data Settings panel.
When automatic filtering is enabled for a pair of linked data sets, you can filter bothdata sets simultaneously using attributes from their link key.
For example, two data sets called Sales and Products are linked based on product SKUand have automatic filtering enabled. If you filter Sales for a specific range of SKUvalues, Products is also filtered for the same range of values automatically, and viceversa.
To control automatic filtering for a pair of linked data sets:
1. On the project page for the linked view, click the pencil icon in the right bar.
The Page Settings panel opens.
2. Click Page Data Settings.
Controlling automatic filtering between linked data sets
14-10 Studio User's Guide

The panel displays the data settings for the current page. By default, the All <dataset> records option is selected
3. Select the Disable data set filtering on this page.
The page is updated to reflect the change. Refinements applied to both data sets arenow only applied to their original data sets.
Controlling automatic filtering between linked data sets
Linking Project Data Sets 14-11

Controlling automatic filtering between linked data sets
14-12 Studio User's Guide

15Defining Project Data Set Views
You can use the Views page to configure a set of views for project data. Views areused by components to determine the data to display.
About viewsA view is a logical collection of information that is derived from therecords in project data sets.
About base viewsEach data set is automatically configured with a base view, whichcontains all of the physical attributes from the data set. The base viewuses the name and description from the data set.
About linked viewsLinked views are created automatically when you link two data sets.
Displaying the list of views for a projectOn the project settings page, the Data Views page allows you to viewand edit the views for the project data.
Displaying details for a viewTo display the details for a view, in the views list, click the view name.
Creating viewsFrom the Views page, you can either create a new empty view, or makea copy of an existing view.
Configuring a viewFrom the Views page, you can edit each view's display name,description, definition, attributes, and predefined metrics.
Previewing the content of a viewFrom the Views page, you can display a preview list of the records in aview.
Deciding whether to publish a custom viewFor custom views, the Publish check box controls whether the view ispublished. Only published views are available to use in a project.
Deleting a viewFrom the Views page, you can delete custom views. You cannot deletebase views or linked views. If you delete a view, any component thatuses that view can no longer display correctly. Also, any other viewwhose definition includes references to this view becomes invalid.
Defining Project Data Set Views 15-1

About viewsA view is a logical collection of information that is derived from the records in projectdata sets.
For example, the original records in a data set may represent individual salestransactions. However, from those transaction records, you could derive:
• A list of products
• A list of customers
• A summary of sales data grouped by year
Each of those could be a view.
All views are made up of attributes. Some attributes may be the physical attributesfrom a data set, while others may be calculated from the original data.
For example, for a list of products derived from a list of sales transactions, the productname comes directly from the data, while the total sales for that product is calculatedfrom the individual sales records.
Views can optionally have predefined metrics, which are values calculated from viewattributes using EQL expressions.
For example, for sales transaction data, a predefined metric might be the profitmargin.
About base viewsEach data set is automatically configured with a base view, which contains all of thephysical attributes from the data set. The base view uses the name and descriptionfrom the data set.
While you cannot change the definition of a base view, or add predefined metrics to abase view, you can configure base view attributes.
About linked viewsLinked views are created automatically when you link two data sets.
For each data set that has links to other data sets, Studio creates a combined linkedview that contains:
• All of the attribute for that data set
• The attributes from the other data sets, aggregated based on the link key
Linked views are read-only, and do not allow for any configuration or customization.You also cannot copy a linked view.
So for the following links among the Products, Customers, and Sales data sets:
About views
15-2 Studio User's Guide

Studio creates the following linked views:
Linked View Description
Products - linked Contains the Products records with Sales attributes added in.The Sales attributes are aggregated by product SKU.
For example:• The sales amount (from Sales) for each product is the total
for all of the sales for the product.• The customer name (also from Sales) for each product is a
list of customers that purchased the product.
About linked views
Defining Project Data Set Views 15-3

Linked View Description
Customers - linked Contains the Customers records with Sales attributes addedin.The Sales attributes are aggregated by the Customer FirstName and Last Name.
For example:• The sales amount (from Sales) for each customer is total
for all sales to that customer.• The product SKU (from Sales) for each customer is a list of
SKUs for products purchased by that customer.
Sales - linked Contains the Sales records with the Products and Customersattributes added in.The Products information is aggregated by product SKU, andthe Customers information is aggregated by the CustomerFirst Name and Customer Last Name.
In this case, because each sales record has a single productand customer, there is still only a single value for eachproduct and customer field.
Displaying the list of views for a projectOn the project settings page, the Data Views page allows you to view and edit theviews for the project data.
To display the list of views for a project:
1. On the project menu bar, click the settings icon.
2. In the project settings menu, click Data Views.
On the Data Views page, the Data Views list is populated with the views for theproject. For each view, the list shows the display name, key, type, source data sets,and identifying attributes for the view records. The first base view is selected bydefault.
Displaying the list of views for a project
15-4 Studio User's Guide

Displaying details for a viewTo display the details for a view, in the views list, click the view name.
The view details section is populated with
• Whether the view is published.
If the view is not published, then it is not available to use for components. Youcannot publish views that do not have a valid view definition.
• View name
• View description
• Identifying attributes for the view
• Attributes list.
The attributes list does not display for views that do not have a valid viewdefinition.
Displaying details for a view
Defining Project Data Set Views 15-5

• Predefined metrics list.
The predefined metrics list does not display for views that do not have a valid viewdefinition.
Creating viewsFrom the Views page, you can either create a new empty view, or make a copy of anexisting view.
Creating a new viewOne option for creating a new view is to create a completely new view.
Copying an existing data viewYou can create a data view by copying another data view. You cannotcopy a linked data view. The new view initially has the same definition,attributes, and metrics as the original view. Studio also copies theattribute groups.
Creating a new viewOne option for creating a new view is to create a completely new view.
To create a new view:
Creating views
15-6 Studio User's Guide

1. Click Configuration Options > Project Settings, then navigate to the Data Viewspage.
2. On the views list, click + View.
The Create View Definition dialog displays.
3. In the Display Name field, type a name for the view.
4. In the Description field, type a description of the view.
5. In the EQL text area, enter the view definition.
For details on defining a view definition, see Guidelines for using EQL to define aview.
To the right of the text area is the Available Attributes list, which contains the listof base attributes. You can show or hide this list.
You can use the attributes list as a reference as you compose the view definition. Toadd an attribute to the definition, you can also double-click or drag and drop theattribute from the list. Studio automatically adds quotes around the insertedattribute, in case the attribute name contains reserved characters in EQL.
Note that if you include a base attribute that has locale-specific versions, then forthose locale-specific versions to be available in the new view, you must manuallyinclude them in the view definition.
6. By default, when you save a new view, it is automatically published. To notpublish the new view automatically, deselect the Publish when saving check box.
7. To validate the definition, click Validate.
If the definition is not valid, then Studio displays error messages to help youtroubleshoot the definition.
8. To save the new view, click Save.
If the view definition is valid, then the view is saved and can be published.
If the view definition is not valid, then you are prompted to confirm that you wantto save an invalid view. If you save the view, it is flagged as invalid and cannot bepublished.
Copying an existing data viewYou can create a data view by copying another data view. You cannot copy a linkeddata view. The new view initially has the same definition, attributes, and metrics asthe original view. Studio also copies the attribute groups.
To copy an existing:
1. Select Project Settings.
2. Select Data Views.
3. Identify the view you want to copy.
4. In the Actions column, click the copy icon for the data view you want to copy.
The Create View Definition dialog displays. By default:
Creating views
Defining Project Data Set Views 15-7

• The view display name is "Copy of <copiedViewName>".
• The view key in the view definition is set to "<copiedViewKeyName>Copy".
• The view description and the rest of the view definition are identical to thecopied view.
Creating views
15-8 Studio User's Guide

Creating views
Defining Project Data Set Views 15-9

5. Update the view name, description, view key, and definition as needed.
Note that you cannot change the view key after you save the new view, so makesure you update the value before saving.
Remember also that the view key must be NC-Name compliant.
6. By default, when you save a new view, it is automatically published. To notpublish the new view automatically, deselect the Publish when saving check box.
7. To validate the new view, click Validate.
8. To save the new view, click Save.
Configuring a viewFrom the Views page, you can edit each view's display name, description, definition,attributes, and predefined metrics.
Editing and localizing the view display name and descriptionOn the Data Views page, when you select a view from the view list, theview details include the Display name and Default view descriptionfields.
Editing the view definitionFrom the Views page, after you create a custom view, you can updatethe view EQL definition. Note that if you change the definition, youcould affect components that are using the view, as well as other viewsthat may use attributes from this view.
Guidelines for using EQL to define a viewThe view definition EQL defines the content of the view. When defininga view, you need to keep the following guidelines in mind. For completedetails on EQL syntax, see the EQL Reference.
Configuring the view attributesFor each attribute in the view, you can configure the display name andaggregation methods.
Defining predefined metrics for a viewCustom views can also have predefined metrics, which are valuescalculated from the view attributes.
Editing and localizing the view display name and descriptionOn the Data Views page, when you select a view from the view list, the view detailsinclude the Display name and Default view description fields.
Configuring a view
15-10 Studio User's Guide

The display name and description are used when showing the list of available views toassign to a component.
For custom views, you can create localized versions of the name and description.
Base views use the name and description of the data set. To edit or localize the nameand description of a base view, you edit the data set.
Linked views use automatically generated names and descriptions.
To edit and localize the view display name and description for a custom data view:
1. Copy a base view if you haven't already. This is your custom data view.
2. To edit the default display name and description:
a. In the Display name field, type the display name for the view.
b. In the Default view description field, type a description of the view.
3. To localize the view display name and description, click the localize icon next toeither field.
4. To localize the view display name:
a. On the Configure Locale Options dialog, click the Display Name tab.
The Default display name field contains the default name. If you edit the namehere, it will be reflected on the main Views page.
b. From the locale list, select a locale that you want to provide a version of thedisplay name for.
c. To use the default display name for the selected locale, leave the Use defaultvalue check box selected.
d. To provide a localized display name, deselect the check box. In the field, typethe localized name.
5. To localize the view description:
a. On the Configure Locale Options dialog, click the Description tab.
The Default description text area contains the default description. If you editthe description here, it is reflected on the main Views page.
b. From the locale list, select a locale that you want to provide a version of thedescription for.
c. To use the default description for the selected locale, leave the Use defaultvalue check box selected.
d. To provide a localized description, deselect the check box. In the text area, typethe localized description.
6. After providing all of the localized versions of the name and description, clickApply.
7. To save the changes to the view, click Save View.
Configuring a view
Defining Project Data Set Views 15-11

Editing the view definitionFrom the Views page, after you create a custom view, you can update the view EQLdefinition. Note that if you change the definition, you could affect components that areusing the view, as well as other views that may use attributes from this view.
To edit a view definition:
1. Click Configuration Options > Project Settings, then navigate to the Data Viewspage.
2. In the view list, click the view.
3. Click Edit Definition.
4. On the Edit View Definition dialog, update the view definition.
For details on the rules for setting a view definition, see Guidelines for using EQLto define a view.
5. To validate the new definition, click Validate.
If the definition is invalid, then Studio displays error messages to help youtroubleshoot the definition.
6. To save the new definition, click Save.
If the view definition is valid, then the attribute and metrics lists are updated toreflect the new definition.
If the view definition is not valid, then you are prompted to confirm that you wantto save an invalid view. If you save the view, it is flagged as invalid and cannot bepublished.
Guidelines for using EQL to define a viewThe view definition EQL defines the content of the view. When defining a view, youneed to keep the following guidelines in mind. For complete details on EQL syntax,see the EQL Reference.
Configuring a view
15-12 Studio User's Guide

View DEFINE and SELECT statements
A view definition may contain multiple DEFINE and SELECT statements.
The last statement must be a DEFINE statement that contains all of the view attributes.The name of that DEFINE statement is used as the view key, and cannot be changed. Ifyou try to change the view key for an existing view, the corresponding componentswill no longer work.
View RETURN statements
Although the EQL Reference uses RETURN statements in its code examples, youshould not add RETURN statements to any views you create in Studio. Studioautomatically wraps your EQL with a RETURN statement.
You can copy EQL examples from the EQL Reference into a view and then delete theRETURN statement. This way, Studio wraps the EQL with an implicit RETURN andthe example works correctly. If you explicitly add the RETURN the view fails.
Providing the source view for the view attributes
For all custom view definitions, you must use the FROM parameter to provide theoriginal source of the view attributes.
For example, if you create a copy of a base view, you will see that the view definitionincludes the view key for that base view.
DEFINE Customers as SELECT ARB(Customer_Name) as Customer_Name,ARB (Customer_Address) as Customer_Address,ARB(Cities) as Cities,ARB(States) as States,ARB(CustomerZip) as CustomerZip,ARB(LatLong) as LatLong,ARB(Business_Types) as Business_Types,ARB(CustomerAgreedDaysCredit) as CustomerAgreedDaysCredit,ARB(Credit_Rating) as Credit_Rating,ARB(CustomerDiscount) as CustomerDiscount,SUM(Number_of_Cases_Sold) as TotalCustomerCases,CountDistinct(Transaction_Id) as TotalCustomerTransactions,SUM(GrossDollars) as TotalCustomerGross,SUM(MarginDollars) as TotalCustomerMargin,SET(Shipping_Companies) as ShippingCompaniesUsedFROM "wine-sales"GROUP BY Customer_Id
When identifying the source view, make sure to use the view key, and not the viewdisplay name.
Also, when referring to another view, you can only refer to the final DEFINE statementthat identifies the attributes for other view. You cannot refer to any intermediateDEFINE or SELECT statements in that view definition.
Grouping a view
All custom views should have at least one grouping (GROUP BY) attribute.
Studio uses the GROUP BY attributes as the identifying attributes for the view records.
If there are no GROUP BY attributes, then there are no identifying attributes, and theview cannot be used for Record Details or Compare. On component edit views, theRecord Details and Compare options are then automatically disabled.
Configuring a view
Defining Project Data Set Views 15-13

Using multi-value attributes for grouping
When using a multi-value attribute for grouping, you must indicate whether to groupby the individual values, or by the sets of values assigned to the records.
• To group by the sets of values, use GROUP BY.
• To group by the individual values, use GROUP BY MEMBERS. The syntax forGROUP BY MEMBERS is slightly different from GROUP BY:
GROUP BY MEMBERS(attributeName) as attributeName
For example, the following data shows available product colors, and the number ofoutlets that carry each product:
ItemColors AvailableOutlets
Red, Blue 3
Red 5
Red, Blue, White 6
Red, Blue, White 4
Red, Blue 1
If you are calculating the total number of available outlets grouped by the item color,then:
• If you use DEFINE NewView as SELECT TotalOutlets assum(AvailableOutlets) FROM Sales GROUP BY ItemColors, then theresult is:
ItemColors TotalOutlets
Red, Blue 4
Red 5
Red, Blue, White 10
• If you use DEFINE NewView as SELECT TotalOutlets asSUM(AvailableOutlets) FROM Sales GROUP BY MEMBERS(ItemColors)as ItemColors, then the result is:
ItemColors TotalOutlets
Red 19
Blue 14
White 10
Providing aggregation methods when grouping view attributes
When defining a view, if you are using grouping, then you must provide anaggregation method for all of the attributes in the view, except for the groupingattributes.
Configuring a view
15-14 Studio User's Guide

If you using aggregation to derive attributes from the physical attributes, then you canuse the applicable aggregation methods for the attribute data type. See Aggregationmethods and the data types that can use them.
In some cases, you may want to display the actual values of physical attributes in agrouped view. For example, when you are grouping by product identifier, then youmay want to include the product name, product description, and available sizes.When using grouping for a view, to include the actual values of physical attributes:
• For a single-value attribute, use the ARB aggregation method. For example:
SELECT ARB(Region) as Region
Note that if there are different values for an attribute within the grouping, Studiochooses a single, arbitrary value.
• For a multi-value attribute:
– To get a single, arbitrary value for the attribute from each record, use the ARBaggregation method. For example:
SELECT ARB(ItemColors) as ItemColors
– To get the complete set of values for the records, use the SET_UNIONSaggregation method. For example:
SELECT SET_UNIONS(ItemColors) as ItemColors
If you are not using grouping, then you do not need an aggregation method. Forexample:
SELECT ProductName as ProductName
In this case, you do not need to specify the name, so you could also use:
SELECT ProductName
Naming view attributes
When naming attributes in a view:
• Do not change the name of (also referred to as aliasing) attributes from the physicaldata.
For example, for a "Region" attribute, when you add the attribute to a view, defineit as "Region".
SELECT ARB(Region) AS Region
Do not define the attribute under a different name, such as:
SELECT ARB(Region) AS RegionList
End users can only refine by attributes that are present in the physical data. If youalias an attribute, then end users cannot use it for refinement.
• Do not give a derived attribute the same name as an attribute from the physicaldata.
For example, for an attribute that averages the values of the "Sales" attribute, do notdefine the new attribute as:
SELECT AVG(Sales) as Sales
Configuring a view
Defining Project Data Set Views 15-15

Instead, use something like:
SELECT AVG(Sales) as AvgSales
This is also to prevent end users from trying to refine by an attribute that is not inthe physical data.
Sample view definition
Here is an example of an EQL query for generating a list of products, including price,available colors, and sales numbers, from a single data set consisting of individualtransactions.
DEFINE Products AS SELECTARB(ProductSubcategoryName) AS ProductSubcategoryName,ARB(ProductCategoryName) AS ProductCategoryName,ARB(Description) AS Description,SET_UNIONS(AvailableColors) AS AvailableColors,AVG("FactSales_SalesAmount") AS AvgSales,SUM("FactSales_SalesAmount") AS SalesSum,AVG(StandardCost) AS AvgStandardCost,AVG(ListPrice) AS AvgListPrice,(AvgListPrice - AvgStandardCost) AS ProfitFROM SalesGROUP BY ProductName
Configuring the view attributesFor each attribute in the view, you can configure the display name and aggregationmethods.
About the view attributes listOn the Views page, the attributes list for a view consists of the attributesfrom the view definition. This includes both the defined attributes andthe grouping attributes.
Editing and localizing an attribute display name and descriptionThe attribute display name is used in Studio as the default label for theattribute. By default, the attribute display name is the same as theattribute key. The description provides additional information. You canedit both values, and also create localized versions for each of thesupported locales.
Determining the available subsets of date/time attributesFor a date/time attribute, you can select the available combinations ofdate "parts" that can be used to display and filter by the attribute.
Configuring the default display format for an attributeBy default, the display format for attribute values is based on theattribute's data type plus the user's current locale. You can change thedefault display format used for each attribute. Within specificcomponents, you can then make some updates to the display format.
Selecting the available and default aggregation methods for an attributeAggregation methods are used to aggregate attribute values into metricsdisplayed on components such as Chart, Pivot Table, and ResultsTable.
Configuring a view
15-16 Studio User's Guide

Aggregation methods and the data types that can use themAggregation methods are types of calculations used to group attributevalues into a metric for each dimension value. For example, for eachcountry (each value of the Country dimension), you might want toretrieve the total value of transactions (the sum of the Sales Amountattribute).
Configuring the Available Refinements behavior for base view attributesFor each attribute in a base view, the Views page attributes list allowsyou to configure settings for how to handle selection and sorting ofattribute values on the Available Refinements panel.
About the view attributes listOn the Views page, the attributes list for a view consists of the attributes from theview definition. This includes both the defined attributes and the grouping attributes.
The list includes the following information about each attribute:
Attribute List Column Description
Display Name The display name for the attribute.You can edit and localize the display name at any time.See Editing and localizing an attribute display nameand description.
Attribute Key The attribute identifier.Read-only. You cannot change the attribute key unlessyou update the view definition.
Refinable Whether the attribute can be used for refinement.Only attributes from the physical data can be used forrefinement.
Read-only.
Searchable Whether the attribute is enabled for either full text ortypeahead search.Read-only. To enable or disable an attribute for search,see Enabling or disabling full text search andtypeahead search on an attribute.
Multi-Value Whether the attribute can be assigned multiple values.For a base view, this indicates whether the physicalattributes are configured to be multi-value. For viewsyou create, an attribute can be multi-value if you usedthe set aggregation for that attribute in the viewdefinition.
Read-only.
Data Type The data type for the attribute. You cannot change thedata type.For base views, for date/time attributes, you canconfigure the available subsets of date/time units thatcan be used for filtering and display. See Determiningthe available subsets of date/time attributes.
Configuring a view
Defining Project Data Set Views 15-17
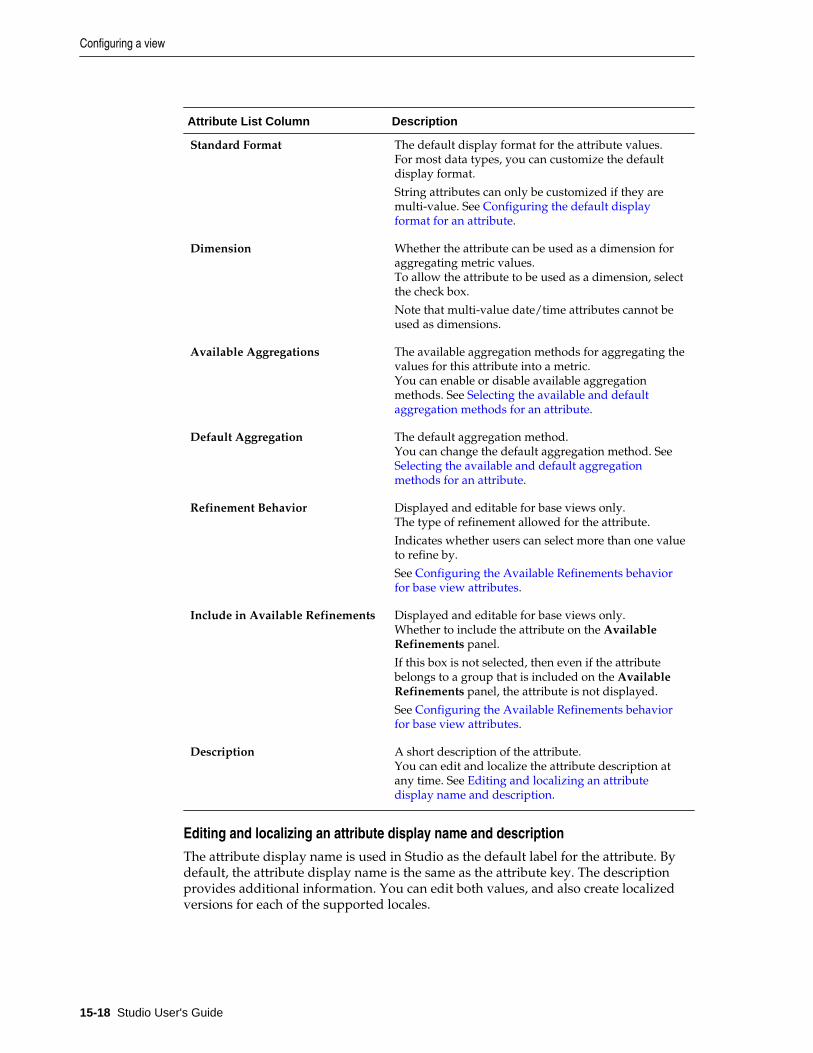
Attribute List Column Description
Standard Format The default display format for the attribute values.For most data types, you can customize the defaultdisplay format.
String attributes can only be customized if they aremulti-value. See Configuring the default displayformat for an attribute.
Dimension Whether the attribute can be used as a dimension foraggregating metric values.To allow the attribute to be used as a dimension, selectthe check box.
Note that multi-value date/time attributes cannot beused as dimensions.
Available Aggregations The available aggregation methods for aggregating thevalues for this attribute into a metric.You can enable or disable available aggregationmethods. See Selecting the available and defaultaggregation methods for an attribute.
Default Aggregation The default aggregation method.You can change the default aggregation method. See Selecting the available and default aggregationmethods for an attribute.
Refinement Behavior Displayed and editable for base views only.The type of refinement allowed for the attribute.
Indicates whether users can select more than one valueto refine by.
See Configuring the Available Refinements behaviorfor base view attributes.
Include in Available Refinements Displayed and editable for base views only.Whether to include the attribute on the AvailableRefinements panel.
If this box is not selected, then even if the attributebelongs to a group that is included on the AvailableRefinements panel, the attribute is not displayed.
See Configuring the Available Refinements behaviorfor base view attributes.
Description A short description of the attribute.You can edit and localize the attribute description atany time. See Editing and localizing an attributedisplay name and description.
Editing and localizing an attribute display name and descriptionThe attribute display name is used in Studio as the default label for the attribute. Bydefault, the attribute display name is the same as the attribute key. The descriptionprovides additional information. You can edit both values, and also create localizedversions for each of the supported locales.
Configuring a view
15-18 Studio User's Guide

In the attributes list on the Views page, to edit and localize an attribute's display nameand description:
1. To edit the display name:
a. Click the display name.
The name displays in an editable field.
b. In the field, type the new name.
2. To localize the display name, in the Display Name column, click the localize icon.
On the Display Name tab of the Configure Locale Options dialog, the Defaultdisplay name field contains the value you entered in the Display Name column. Ifyou edit the value here, it also is updated in the attributes list.
For each locale:
a. From the locale list, select the locale for which to configure the display namevalue.
b. To use the default value, leave the Use default value check box selected.
c. To provide a localized value for the selected locale, deselect the check box. Inthe Display name field, enter the localized value.
d. After entering the localized values, click Apply.
3. From the Description column, to edit the description:
a. Click the description.
The description displays in an editable field.
b. In the field, type the new description.
4. To localize the description, in the Description column, click the localize icon.
Configuring a view
Defining Project Data Set Views 15-19

On the Description tab of the Configure Locale Options dialog, the Defaultdescription field contains the value you entered in the column. If you edit thevalue here, it also is updated in the attributes list.
For each locale:
a. From the locale list, select the locale that you want to configure the descriptionof.
b. To use the default description, leave the Use default value check box selected.
c. To provide a localized value for the selected locale, deselect the check box. Inthe Description text area, enter the localized value.
d. After entering the localized values, click Apply.
5. To save the changes to the attribute display name and description, click Save View.
Determining the available subsets of date/time attributesFor a date/time attribute, you can select the available combinations of date "parts" thatcan be used to display and filter by the attribute.
For example, you may want to allow users to filter by the specific month orcombination of month and year.
On a component, users may choose to display an individual date/time element (Year,Month, Day, Hour, Minute, Second), or may be able to select one of the followingdate/time combinations:
Date/Time Display Option Sample Value
Year-Month January 2012
Year-Month-Day January 1, 2012
Year-Month-Day-Hour-Minute-Second January 1, 2012 3:15:05 am
To configure the available subsets of date/time units:
1. In the Data Type column for a date/time attribute, click the edit icon.
2. On the Date-Time Options dialog, select the check box next to each option toenable.
Configuring a view
15-20 Studio User's Guide

3. Click Apply.
Configuring the default display format for an attributeBy default, the display format for attribute values is based on the attribute's data typeplus the user's current locale. You can change the default display format used for eachattribute. Within specific components, you can then make some updates to the displayformat.
Note that you only configure the display format for the default locale version of theattribute. You do not configure formatting for the locale-specific attributes. Becausethe formatting configuration already takes the current locale into account, you do notneed to configure the formatting for the locale-specific attributes separately.
From the attributes list on the Views page, to change the default display format for anattribute:
1. Click the edit icon in the Standard Format column.
The Format Option dialog displays.
At the top of the dialog is a sample value that displays the current formattingselection based on your current locale.
2. For numeric attributes:
a. Under Metric Type, click the radio button to indicate the type of number.
A numeric attribute may be displayed as a regular number, a currency value, ora percentage.
Note that if you set a numeric attribute to be a currency or percentage, thatselection cannot be overridden at the component level.
b. If the number is a currency value, then from the Currency list, select the type ofcurrency. This selection determines the symbol to display next to each value.
Configuring a view
Defining Project Data Set Views 15-21

c. If the number is a percentage, then from the Percentage list, select whether todisplay the percentage (%) sign with the value.
Note that if you use percentage as the format, Studio automatically multipliesthe value by 100. So if the actual value is 0.05, Studio displays the value as 5%.
d. Under Decimal Places, to display all numbers using the same default number ofdecimal places, leave Default selected.
To display all of the decimal places from the original value, up to 6 places, clickUp to 6 digits. Studio truncates any decimal places after 6, and removes anytrailing zeroes.
To specify the number of decimal places to use for all numbers, click Fixedlength, then in the field, type the number of decimal places to display.
e. From the Grouping Separator list, select whether to display the groupingseparator (used to separate thousands).
f. The Advanced Formatting section provides additional format options.
For each of the advanced items, you can choose to have the display determinedautomatically based on the user's locale, or select a specific option.
g. From the Number Format list, select how to display positive and negativenumbers.
h. From the Decimal Separator list, select the character to use for the decimalpoint.
i. From the Grouping Separator list, select the character to use for the grouping(thousands) separator.
3. For a Boolean attribute, you can determine the values to display for each Booleanvalue.
By default, 1 displays as the localized version of "True", and 0 displays as thelocalized version of "False". To set specific (but non-localized) values to display:
a. Click Custom Values.
b. In the True field, type the value to display if the attribute value is 1 (True).
c. In the False field, type the value to display if the attribute value is 0 (False).
Configuring a view
15-22 Studio User's Guide

4. For a geocode, to set a specific number of decimal places to display for the latitudeand longitude values:
a. Click Fixed length.
b. In the field, type the number of decimal places.
5. For a date/time attribute:
a. From the Date Display list, select the format to use for the date.
The selected format is adjusted for locale. For example, for some locales themonth displays first, and for others the day displays first.
b. From the Time Display list, select the format to use for the time.
6. For a time attribute, from the Time Display list, select the format to use for thetime.
7. For all value types, the Multi-Value Formatting section indicates how to displaymultiple values.
The setting is applied whenever multiple values are displayed for an attribute,including when an attribute is by definition multi-value, and when the setaggregation is applied to an attribute.
From the Multi-value Separator list, select the character to use to separate thevalues.
8. To confirm the format configuration, click Apply.
9. To save the changes to the view settings, click Save View.
Configuring a view
Defining Project Data Set Views 15-23

Selecting the available and default aggregation methods for an attributeAggregation methods are used to aggregate attribute values into metrics displayed oncomponents such as Chart, Pivot Table, and Results Table.
Based on its data type, each attribute can support specific aggregation methods. Youcan then configure attributes to only support a subset of the applicable aggregationmethods. For details on the available aggregation methods, see Aggregation methodsand the data types that can use them.
Each attribute also is assigned a default aggregation method. You can change thedefault used for each attribute.
From the attributes list on the Views page, to configure the available and defaultaggregation methods for an attribute:
1. To configure the available aggregation methods for an attribute:
a. In the Available Aggregations column, click the edit icon.
b. On the aggregation methods dialog, to enable an available aggregation method,select the check box.
c. To disable an aggregation method, deselect the check box.
d. To confirm the settings, click Apply.
2. From the Default Aggregation list, select the default aggregation to use.
Configuring a view
15-24 Studio User's Guide

3. To save the changes to the view configuration, click Save View.
Aggregation methods and the data types that can use themAggregation methods are types of calculations used to group attribute values into ametric for each dimension value. For example, for each country (each value of theCountry dimension), you might want to retrieve the total value of transactions (thesum of the Sales Amount attribute).
On the component edit view, you select the aggregation method from a list. Whenusing these aggregation methods in definitions of views and predefined metrics, youuse the EQL syntax.
The available aggregation methods are:
Aggregation Method Description EQL Syntax
sum Calculates the total value for themetric.You can use this aggregationmethod for numbers.
You cannot use this aggregationmethod for multi-valueattributes.
sum(attributeName)
average Calculates the average value forthe metric.You can use this aggregationmethod for numbers, dates, andtimes.
You cannot use this aggregationmethod for multi-valueattributes.
avg(attributeName)
Configuring a view
Defining Project Data Set Views 15-25

Aggregation Method Description EQL Syntax
median Calculates the median value forthe metric.You can use this aggregationmethod for numbers, dates, andtimes.
You cannot use this aggregationmethod for multi-valueattributes.
median(attributeName)
minimum Selects the minimum value forthe metric.You can use this aggregationmethod for numbers, dates, andtimes.
You cannot use this aggregationmethod for multi-valueattributes.
min(attributeName)
maximum Selects the maximum value forthe metric.You can use this aggregationmethod for numbers, dates, andtimes.
You cannot use this aggregationmethod for multi-valueattributes.
max(attributeName)
variance Calculates the variance (square ofthe standard deviation) for themetric values.You can use this aggregationmethod for numbers, dates andtimes.
You cannot use this aggregationmethod for multi-valueattributes.
variance(attributeName)
standard deviation Calculates the standard deviationfor the metric values.You can use this aggregationmethod for numbers, dates andtimes.
You cannot use this aggregationmethod for multi-valueattributes.
stddev(attributeName)
set Instead of performing acalculation, creates a list of all ofthe unique values.You can use this aggregationmethod for any attribute.
set(attributeName)For multi-value attributes, useset_unions(attributeName).
Configuring a view
15-26 Studio User's Guide

Aggregation Method Description EQL Syntax
arb Instead of performing acalculation, arbitrarily selects oneof the values.You can use this aggregationmethod for any attribute.
The arb aggregation method istypically not provided as anoption for aggregating metricvalues on components.
arb(attributeName)
When configuring components, the following count aggregation options are appliedusing separate system metrics.
For the other aggregation methods, such as sum and average, you select an attribute,and then apply the aggregation method. For the count aggregation methods, you firstselect the system metric, then select the attribute to use.
When using these aggregation methods in definitions of views and predefinedmetrics, you use the EQL syntax.
Aggregation Method Description EQL Syntax
Number of recordswith values
Calculates the number of recordswith a value for the selectedattribute.You can use this aggregationmethod for all data types.
You cannot use this aggregationmethod for multi-valueattributes.
You apply this aggregation byadding the Number of recordswith values system metric to thecomponent.
count(attributeName)
Number of uniquevalues
Calculates the number of uniquevalues for the metric.You can use this aggregationmethod for all data types.
You cannot use this aggregationmethod for multi-valueattributes.
You apply this aggregation byadding the Number of uniquevalues system metric to thecomponent.
countdistinct(attributeName)
To show how each of the aggregation methods work, we'll use the following data:
Country Amount of Sale Shipping Company
US 125.00 UPS
US 50.00 UPS
Configuring a view
Defining Project Data Set Views 15-27

Country Amount of Sale Shipping Company
US 150.00 FedEx
Based on these values, the aggregation for Amount of Sale and Shipping Company forthe US would be:
Aggregation Method Amount of Sale (US) Shipping Company (US)
sum 325.00 Cannot be aggregated
avg 108.33 Cannot be aggregated
median 125.00 Cannot be aggregated
min 50.00 Cannot be aggregated
max 150.00 Cannot be aggregated
variance 2708.33 Cannot be aggregated
standard deviation 52.04 Cannot be aggregated
set 125.00, 50.00, 150.00 UPS, FedEx
arb Could be either 125.00, 50.00,or 150.00
Could be either UPS or FedEx
Number of records withvalues
3 3
Number of unique values 3 2
Configuring the Available Refinements behavior for base view attributesFor each attribute in a base view, the Views page attributes list allows you toconfigure settings for how to handle selection and sorting of attribute values on theAvailable Refinements panel.
In the attributes list for a base view, to configure the value selection and sorting foreach attribute:
1. From the Refinement Behavior list, select whether users can select multiple values,and if so, whether the records must contain all of the selected values.
The available options are:
Configuring a view
15-28 Studio User's Guide

Option Description
Single Indicates that end users can only refine by one value at atime.
Multi-OR Indicates that end users can refine by more than one valueat a time.For multi-or, a record matches if it has at least one of theselected values.
So if an end user selects the values Red, Green, and Blue,then matching records only need to have one of thosevalues (Red or Green or Blue).
Note that date/time attributes are always multi-or. Youcannot change the refinement behavior for a date/timeattribute.
Multi-AND Indicates that end users can refine by more than one valueat a time.For multi-and, a record matches only if it has all of theselected attribute values. Multi-and should only be usedwith multi-value attributes.
So if an end user selects the values Red, Green, and Blue,then matching records must have all of those values (Redand Green and Blue).
2. In the Include in Available Refinements column, to include the attribute on theAvailable Refinements panel if it belongs to a group that displays, select the checkbox.
Defining predefined metrics for a viewCustom views can also have predefined metrics, which are values calculated from theview attributes.
About predefined metricsPredefined metrics are values calculated from view attributes. Forexample, if the attributes for a view include product price and costinformation, you could calculate predefined metrics such as the ratio ofretail price to cost.
Adding a predefined metric to a viewAdding a predefined metric to a view consists of specifying the metrickey and EQL definition.
Configuring a predefined metric for a viewFrom the predefined metrics list on the Views page, you can configurethe metric name, description, definition, and display. The display nameand definition can be localized for each of the available locales.
Deleting a predefined metricYou can delete predefined metrics from a view. Before deleting apredefined metric, try to make sure that it is not being used by acomponent.
Configuring a view
Defining Project Data Set Views 15-29

About predefined metricsPredefined metrics are values calculated from view attributes. For example, if theattributes for a view include product price and cost information, you could calculatepredefined metrics such as the ratio of retail price to cost.
Predefined metrics are optional. By default, views do not have predefined metrics.They are always added manually.
Predefined metrics should only be used for calculated values that are only meaningfulwithin the context of the view, and that stand on their own as values. Whenconfiguring a component, you can assign simple aggregations such as sum or averageto any attribute, so you don't need to create those as predefined metrics. Predefinedmetrics are more appropriate for more complex values such as ratios.
On the Views page, the Metrics section, which lists the predefined metrics, displaysbelow the view attribute list. By default, the section is collapsed. To expand thesection, click the section heading.
Adding a predefined metric to a viewAdding a predefined metric to a view consists of specifying the metric key and EQLdefinition.
On the Views page, to add a predefined metric to a view:
1. From the Metrics list, click + Metric.
The Create Metric Definition dialog displays.
2. On the Create Metric Definition dialog, in the Metric Key Name field, type thekey name for the metric.
The key name must be NCName-compliant.
Configuring a view
15-30 Studio User's Guide

Once you save the new metric, you cannot change the key name.
3. In the Display name field, type the display name for the metric.
This is the name used to select the metric to add to a component. You can edit andlocalize the display name at any time.
4. In the text area, type the EQL expression for calculating the predefined metricvalue.
The expression is an EQL snippet that is inserted into a SELECT statement when aquery using the predefined metric is issued. The snippet can only refer to attributesfrom the current view. For example:
count(1) WHERE (SalesAmountSum > 3000000)
To the right of the EQL text area is the list of attributes in the current view for youto use as a reference. You can show or hide the attribute list.
For information on aggregation methods, including the EQL syntax for includingthem in predefined metrics, see Aggregation methods and the data types that canuse them. For detailed information on EQL syntax, see the EQL Reference.
5. To validate the expression, click Validate.
If the expression is invalid, Studio displays error messages to help youtroubleshoot.
6. To confirm adding the metric, click Save.
Configuring a predefined metric for a viewFrom the predefined metrics list on the Views page, you can configure the metricname, description, definition, and display. The display name and definition can belocalized for each of the available locales.
To configure a predefined metric:
1. In the Display name field, type a display name for the predefined metric.
Display names do not need to be NCName-compliant.
2. To localize the display name, in the Display name column, click the localize icon.
On the Configure Locale Options dialog, the Default display name field containsthe value you entered in the column. If you edit the value here, it also is updated inthe metrics list. For each locale:
a. From the locale list, select the locale that you want to configure the displayname value of.
Configuring a view
Defining Project Data Set Views 15-31

b. To use the default value, select the Use default value check box.
c. To provide a localized value for the selected locale, deselect the check box. Inthe Display name field, enter the localized value.
d. After entering the localized values, click Apply.
3. To configure the display format for a predefined metric, click the edit icon in theStandard Format column.
The display format configuration is the same as that for attributes. See Configuringthe default display format for an attribute.
4. To change the definition of a predefined metric, click the edit icon in the Definitioncolumn.
5. In the Description field, type a brief description of the predefined metric.
6. To localize the description, in the Description column, click the localize icon.
On the Configure Locale Options dialog, the Default description field containsthe value you entered in the column. If you edit the value here, it also is updated inthe metrics list. For each locale:
a. From the locale list, select the locale that you want to configure the descriptionof.
b. To use the default description, select the Use default value check box.
c. To provide a localized value for the selected locale, deselect the check box. Inthe Description field, enter the localized value.
d. After entering the localized values, click Apply.
7. To save any changes to the predefined metrics, click Save View.
Deleting a predefined metricYou can delete predefined metrics from a view. Before deleting a predefined metric,try to make sure that it is not being used by a component.
From the Views page, to delete a predefined metric from the current view, click thedelete icon for that metric.
To save the change to the view configuration, click Save View.
Previewing the content of a viewFrom the Views page, you can display a preview list of the records in a view.
To preview the contents of a view:
1. Click Configuration Options > Project Settings, then navigate to the Data Viewspage.
2. In the views list, click the view.
3. Click Preview.
The Preview dialog displays, containing a list of records for the view.
Previewing the content of a view
15-32 Studio User's Guide

The list only displays the view attributes. Because the preview list is not groupedby a specific dimension, it cannot display the predefined metrics.
4. To close the Preview dialog, click Close.
Deciding whether to publish a custom viewFor custom views, the Publish check box controls whether the view is published. Onlypublished views are available to use in a project.
Base views are always published.
Custom views can only be published if the view definition is valid.
Deleting a viewFrom the Views page, you can delete custom views. You cannot delete base views orlinked views. If you delete a view, any component that uses that view can no longerdisplay correctly. Also, any other view whose definition includes references to thisview becomes invalid.
Note that Big Data Discovery cannot automatically check whether a view is being usedin the definition of another view.
To delete a view, in the Actions column of the view list, click the delete icon for thatview.
Deciding whether to publish a custom view
Defining Project Data Set Views 15-33

Deleting a view
15-34 Studio User's Guide

16Managing Attribute Groups for a Project
You can group attributes within each project data view in order to organize theinformation.
About attribute groups and the Attribute Groups pageAttribute groups are used to group attributes within a view. Forexample, for a view containing sales information, one group mightcontain attribute related to the payment (credit card type, cost, billingaddress) and another group might contain attributes related to theshipping (shipping address, shipping company, shipping cost).
About groups for linked viewsStudio automatically creates a linked view for each linked data set. Foreach linked view, Studio also creates a default set of attribute groups.
Displaying the groups for a selected viewWhen the Attribute Groups page is first displayed, the groups for thefirst base view are displayed by default. You can then change theselected view.
Displaying attribute information for a groupFor each group on the Attribute Groups page, you can display a list ofattributes and attribute metadata.
Creating an attribute groupWhen you create a group, you give the group a name, select defaultoptions for how the group is used, and then select the attributes thatbelong to the group.
Deleting an attribute groupFrom the Attribute Groups page, you can delete attribute groups.
Configuring an attribute groupFrom the Attribute Groups page, for each group, you can configure thedisplay name, the group membership, and the attribute display order.
Saving the attribute group configuration and reloading the attribute group cacheChanges to the group configuration do not become permanent until yousave them. To immediately reflect the saved group configurationchanges on the project components, reload the attribute group cache.
About attribute groups and the Attribute Groups pageAttribute groups are used to group attributes within a view. For example, for a viewcontaining sales information, one group might contain attribute related to the payment(credit card type, cost, billing address) and another group might contain attributesrelated to the shipping (shipping address, shipping company, shipping cost).
Managing Attribute Groups for a Project 16-1

For each group, you select the specific attributes in the group.
From the Attribute Groups page, you can create and edit the attribute groups for thecurrent project data. To display the Attribute Groups page:
1. Click Configuration Options > Project Settings.
2. Click Attribute Groups.
About groups for linked viewsStudio automatically creates a linked view for each linked data set. For each linkedview, Studio also creates a default set of attribute groups.
The default attribute groups for a linked view consist of:
• The attribute groups from the source data set
• For each data set that the source data set is linked to, an attribute group containingall of the attributes in that data set, except for the link key attributes. The group isnamed for the data set.
For example, as shown in the following diagram:
• The Sales and Products data sets are linked by the SKU attribute
• The Sales and Customers data sets are linked using the Customer First Name andCustomer Last Name attributes.
About groups for linked views
16-2 Studio User's Guide

For these links, Studio creates the following views:
• Sales - linked
• Products - linked
• Customers - linked
If the base views for the data sets contain the following groups:
Data Set Base View Groups
Sales Order CreationCustomer Information
Shipping Details
Products Product SummaryProduct Pricing
Customers Customer NameCustomer Contact Information
Then for the linked views, Studio creates the following default attribute groups:
Linked View Default Attribute Groups
Sales - linked Order CreationCustomer Information
Shipping Details
Products (all Product attributes, except for SKU)
Customers (all Customer attributes, except for Customer FirstName and Customer Last Name)
Products - linked Product SummaryProduct Pricing
Sales (all Sales attributes, except for SKU)
About groups for linked views
Managing Attribute Groups for a Project 16-3

Linked View Default Attribute Groups
Customers - linked Customer NameCustomer Contact Information
Sales (all Sales attributes, except for Customer First Name andCustomer Last Name)
These are default groups only. You can create, edit, and remove groups for linkedviews the same way you would for base or custom views.
Displaying the groups for a selected viewWhen the Attribute Groups page is first displayed, the groups for the first base vieware displayed by default. You can then change the selected view.
To display the groups for a selected view:
to select the view for which to display the attribute groups:
1. Click Configuration Options > Project Settings:
2. Select the Attribute Groups page.
3. From the View list, select the view.
4. If there are unsaved changes in the current view, you are prompted to either savethe changes, discard the changes, or cancel and return to the current view.
When you select a view, the Attribute Groups section is updated to display thegroups for the current view.
Displaying the groups for a selected view
16-4 Studio User's Guide
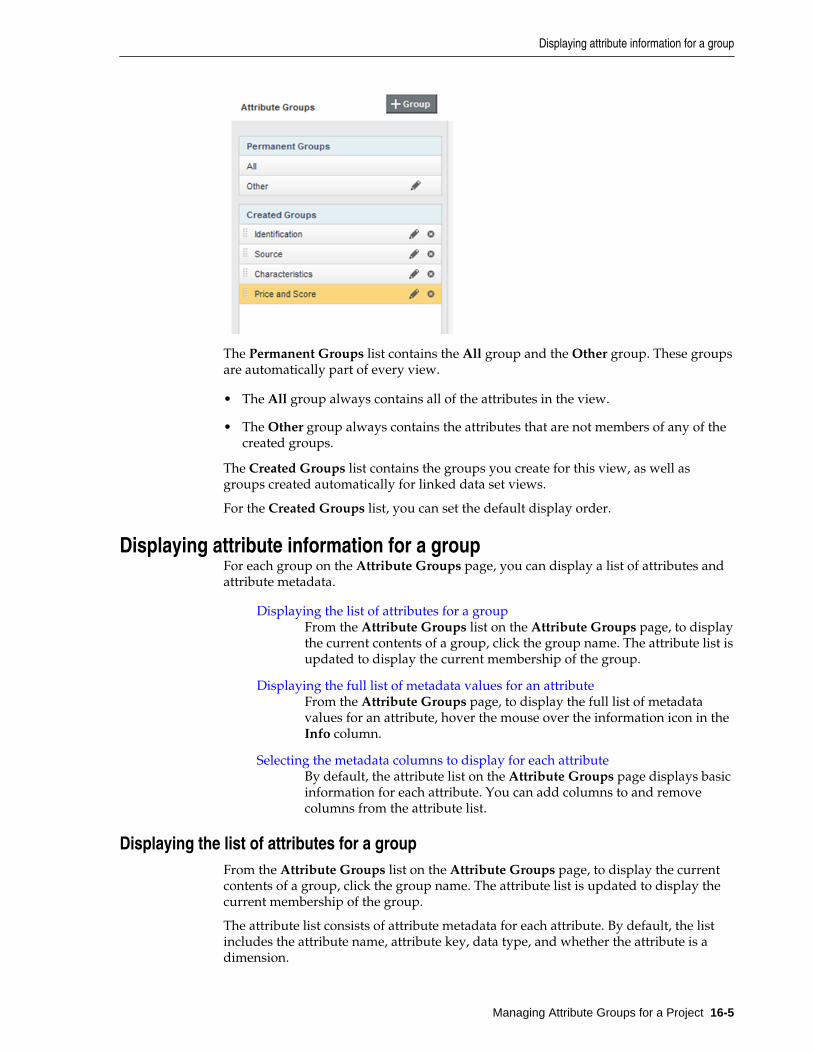
The Permanent Groups list contains the All group and the Other group. These groupsare automatically part of every view.
• The All group always contains all of the attributes in the view.
• The Other group always contains the attributes that are not members of any of thecreated groups.
The Created Groups list contains the groups you create for this view, as well asgroups created automatically for linked data set views.
For the Created Groups list, you can set the default display order.
Displaying attribute information for a groupFor each group on the Attribute Groups page, you can display a list of attributes andattribute metadata.
Displaying the list of attributes for a groupFrom the Attribute Groups list on the Attribute Groups page, to displaythe current contents of a group, click the group name. The attribute list isupdated to display the current membership of the group.
Displaying the full list of metadata values for an attributeFrom the Attribute Groups page, to display the full list of metadatavalues for an attribute, hover the mouse over the information icon in theInfo column.
Selecting the metadata columns to display for each attributeBy default, the attribute list on the Attribute Groups page displays basicinformation for each attribute. You can add columns to and removecolumns from the attribute list.
Displaying the list of attributes for a groupFrom the Attribute Groups list on the Attribute Groups page, to display the currentcontents of a group, click the group name. The attribute list is updated to display thecurrent membership of the group.
The attribute list consists of attribute metadata for each attribute. By default, the listincludes the attribute name, attribute key, data type, and whether the attribute is adimension.
Displaying attribute information for a group
Managing Attribute Groups for a Project 16-5

Displaying the full list of metadata values for an attributeFrom the Attribute Groups page, to display the full list of metadata values for anattribute, hover the mouse over the information icon in the Info column.
The metadata includes the list of groups that the attribute belongs to.
Selecting the metadata columns to display for each attributeBy default, the attribute list on the Attribute Groups page displays basic informationfor each attribute. You can add columns to and remove columns from the attribute list.
To change the displayed columns:
1. Hover the mouse over the right edge of any column.
An arrow displays.
2. Click the arrow.
3. In the menu, click Columns.
The full list of available columns displays.
Columns currently in the list are selected.
4. To add a column, select the check box.
To remove a displayed column, deselect the check box.
Displaying attribute information for a group
16-6 Studio User's Guide

Creating an attribute groupWhen you create a group, you give the group a name, select default options for howthe group is used, and then select the attributes that belong to the group.
From the Attribute Groups page, to create a new attribute group:
1. Click +Group.
2. On the New Group dialog, in the Group name field, enter the name of the newgroup.
3. For a group in a base view, to have this group enabled on the AvailableRefinements panel, select the Include this group in Available Refinements checkbox.
Note that because the Available Refinements panel only uses base views, thischeck box is not displayed for groups created in other views.
Also, even if you enable the group, the attributes in the group are only displayed ifthey are configured on the Views page to display on the Available Refinementspanel. See Configuring the Available Refinements behavior for base viewattributes.
4. To have this group enabled when displaying record details information for thisview, including on the Record Details and Compare dialogs, and in the defaultconfiguration for a Results Table component, select the Include this group inrecord details check box.
5. Configure the group membership.
See Configuring the group membership.
6. After completing the configuration, click Apply.
The new group is added to the group list. You can then drag the group to set itsdefault display order.
Deleting an attribute groupFrom the Attribute Groups page, you can delete attribute groups.
You cannot delete the default Other or All attribute groups.
Deleting an attribute group does not delete its attributes from the view or from otherattribute groups.
Creating an attribute group
Managing Attribute Groups for a Project 16-7

To delete an attribute group, in the Created Groups list, click the delete icon for theattribute group. The attribute group is removed from the Created Groups list.
When you save the attribute group changes for the current view, then the attributegroup is no longer displayed on components.
If an attribute does not belong to any of your other groups, it is restored to the defaultOther group.
Configuring an attribute groupFrom the Attribute Groups page, for each group, you can configure the display name,the group membership, and the attribute display order.
Changing the group name and useThe group name is used as the display name for the group in Studio.You can edit and localize the name. You can also change whether agroup is used in Available Refinements and for record detail display.
Configuring the group membershipFor each group, you select the specific attributes that belong to thegroup.
Configuring the sort order for a groupFor each group, you can either sort the list using a metadata value, or setthe sort order manually. The sort order on the Attribute Groups pagedetermines the display order of attributes on components.
Changing the group name and useThe group name is used as the display name for the group in Studio. You can edit andlocalize the name. You can also change whether a group is used in AvailableRefinements and for record detail display.
To change the name and default use of an existing group:
1. In the groups list, click the edit icon for the group.
2. On the Edit Group dialog, in the Group Name field, type the new display name forthe group.
3. To localize the display name, click the localize icon next to the Group Name field.
On the localization dialog, the Default display name field contains the value youentered in the Group Name field. If you edit the value here, it also is updated onthe Edit Group dialog and in the group list.
For each locale:
Configuring an attribute group
16-8 Studio User's Guide

a. From the locale list, select the locale that you want to configure the displayname value of.
b. To use the default value, leave the Use default value check box selected.
c. To provide a localized value for the selected locale, deselect the check box. Inthe Display name field, enter the localized value.
d. After entering the localized values, click Apply.
4. For a group in a base view, to have this group enabled on the AvailableRefinements panel, select the Include this group in Available Refinements checkbox.
Note that because the Available Refinements component only uses base views,this check box is not displayed for groups in other views.
Also, even if you enable the group, the attributes in the group are only displayed ifthey are configured on the Views page to display on the Available Refinementspanel. See Configuring the Available Refinements behavior for base viewattributes.
5. To have this group enabled when displaying record details information for thisview, including on the Record Details and Compare dialogs, and in the defaultconfiguration for a Results Table component, check the Include this group inrecord details check box.
6. To save the changes, click Apply.
Configuring the group membershipFor each group, you select the specific attributes that belong to the group.
If an attribute has locale-specific versions, you must add them manually to the groupmembership.
From the Attribute Groups page, to add and remove attributes for a group:
1. To add attributes:
Configuring an attribute group
Managing Attribute Groups for a Project 16-9

a. Display the New Group or Edit Group dialog.
The New Group dialog displays when you create a new group.
To display the Edit Group dialog for an existing group, either:
• From the groups list, click the edit icon.
• From the attributes list for the group, click +Attributes.
The Add attributes section contains the list of attributes in the view that do notbelong to the group.
b. To filter the list, either:
• Use the search field above the attribute list to search based on the attributedisplay name.
• Use the data type list to only display attributes for a specific data type.
c. In the attribute list, click +Add next to each attribute you want to add to thegroup.
The attributes are added to the Selected Attributes list. +Add for the selectedattributes is disabled.
To remove a selected attribute from the list of attributes to add, click the deleteicon for that attribute. +Add for that attribute is then re-enabled.
d. To add the selected attributes, click Apply.
2. To remove an attribute from a group, in the attribute list, click the delete icon forthat attribute.
Configuring the sort order for a groupFor each group, you can either sort the list using a metadata value, or set the sort ordermanually. The sort order on the Attribute Groups page determines the display orderof attributes on components.
By default, the group is sorted by attribute display name in alphabetical order. Forattributes that do not have a display name, the attribute key is used.
Configuring an attribute group
16-10 Studio User's Guide

The Attributes ordered by field at the top of the attribute list shows the current sortorder, including the metadata used and whether the sort is in ascending or descendingorder.
When you click a column heading, the sort order is updated to use that value for thesort. Clicking the same column heading twice switches the sort between ascendingand descending order.
You also can move an attribute to a specific location in the list. When you do that, thesort order is updated to be Custom order.
If you then click a column heading, the sort order changes to use that metadata value.
Saving the attribute group configuration and reloading the attribute groupcache
Changes to the group configuration do not become permanent until you save them. Toimmediately reflect the saved group configuration changes on the project components,reload the attribute group cache.
When you have unsaved changes, you can use Revert to Last Save to undo thosechanges.
To save the current group configuration, click Save.
When Studio first loads the project data, it stores the attributes and groups in thecache. To reload the cache, so that the project components immediately reflect anyupdates to the group configuration, click Reload Attribute Cache.
Saving the attribute group configuration and reloading the attribute group cache
Managing Attribute Groups for a Project 16-11

Saving the attribute group configuration and reloading the attribute group cache
16-12 Studio User's Guide

17Exporting Project Data Sets
You can export data from project views and Results Tables to either HDFS or yourcomputer.
About exporting project dataYou can export data from a project view and from a Results Tablecomponent. An export creates a file based on your data that you caneither store in HDFS or download to your computer.
Exporting project dataYou can export data from a project view or a Results Table to eitherHDFS or your computer.
About exporting project dataYou can export data from a project view and from a Results Table component. Anexport creates a file based on your data that you can either store in HDFS or downloadto your computer.
The exported data is based on the current refinement state of your project, so it willnot include attributes that have been filtered out or hidden. You will be able topreview a small sample of the exported data, as well as a list of attributes that will notbe included, before you export.
When you export project data, you must specify whether you want the file exported toHDFS or your computer. If you export to HDFS, you must specify a directory to savethe file to. If you export to your computer, the file is automatically downloaded once ithas been generated.
You must also select the type of file your data is exported to. This can be one of thefollowing:
• Delimited
• Avro
• A Hive table. This option is only available when you export to HDFS.
Note: The exported data uses attribute display names by default. However, ifyou are exporting to an Avro file, any attribute display names that containinvalid Avro characters will be replaced with their attribute keys.
Exporting Project Data Sets 17-1

Transposing attributes
If the data set you're exporting contains multi-value attributes, you can have some orall of them transposed. Transposed attributes are replaced with sets of Booleanattributes representing their possible values.
Note: You cannot transpose attributes when exporting to an Avro file.
For example, consider a multi-value attribute named Color that has the unique values"Red", "Blue", and "Green". If the Color attribute were transposed, it would be replacedin the exported data by the Boolean attributes Red, Blue, and Green. A record thatoriginally had its Color attribute set to "Red, Blue" would now contain the following:
• A Red attribute set to "True"
• A Green attribute set to "False"
• A Blue attribute set to "True"
Because multi-value attributes can have numerous possible values, you can specify alimit for the number of new columns added for each transposed attribute. Columnswill only be added for the top values until the limit is reached.
Problems viewing non-ASCII attribute values
If the data set you export contains non-ASCII attributes, the non-ASCII attributevalues may be corrupt when you open the CSV file. For example, this data corruptionproblem occurs with Chinese, Japanese, and Korean attribute values and other non-ASCII language encodings.
To work around this issue:
1. Export the data set from Studio.
2. Instead of opening the CSV file, save the file locally.
3. Start Microsoft Excel and import the CSV file with UTF-8 encoding. You find thisoption in Excel under Data > Get External Data From Text > Import and thenselect UTF-8 in the import wizard.
After import, the attribute values render correctly.
Exporting project dataYou can export data from a project view or a Results Table to either HDFS or yourcomputer.
To export project data:
1. If you are exporting from a project view, click the Control Panel icon and selectExport Data Set:
Exporting project data
17-2 Studio User's Guide

If you are exporting from a Results Table, select Actions > Export.
The Export Data dialog opens.
2. If you are exporting from a project view, select the data set to export from the DataSelection drop down list.
The Preview displays the first three records of the selected data set.
3. In the Filename field, enter a name for the file the data will be exported to.
By default, this is the name of the selected data set followed by the current date; forexample, Vehicle_Warranty_Claims_03022015.
4. From the Export to list, select the location you want to export the file to:
• HDFS
• My Computer
5. If you are exporting to HDFS, do the following:
a. In the File Path field, enter the path to the HDFS directory you want to exportto.
By default, this path begins with /user/bdd/exports.
b. If you want to create a new Hive table based on the exported data, select theCreate Hive table check box and enter a name for the table in the Table namefield.
By default, this is the name of the data set followed by the current date; forexample, Vehicle_Wattanty_Claims_030215.
Optionally, enter a description for the table in the Add description field.
6. From the Type list, select the type of file to export to:
• Delimited
• Avro
Note that if you select Avro, you will not be able to transpose any of your data'smulti-value attributes.
7. If you are exporting to a delimited file, select delimiters for fields and multi-valueattributes.
Exporting project data
Exporting Project Data Sets 17-3

If you select Other..., you must also provide a new delimiter. This must be a singleunicode character with a value of 127 or less.
8. If you want to transpose your data's multi-value attributes:
Note: This option is not available for Avro files.
a. Click Multi-value attribute handling and select Transpose unique values.
b. Select the attribute(s) you want to transpose.
You can select all attributes by selecting the Apply to all multi-value attributescheck box. However, if you want to limit the number of new columns createdfor each transposed attribute, you must select them one at a time.
c. In each selected attribute's pop up, optionally check the Limit columns createdto the top values only check box and enter a column limit.
This prevents your data from becoming cluttered with columns from attributesthat have large numbers of possible values.
9. Click Export.
Exporting project data
17-4 Studio User's Guide

Part VIITransforming Project Data


18Overview of Transforming Project Data
This section provides conceptual information about transforming project data setsusing both default Studio transformations and the custom transform functions(Groovy code).
Use this section together with the Transform API Reference (generated Groovydoc) thatis packaged with Big Data Discovery and also available on the Oracle TechnologyNetwork.
About transformations and transformation scriptsTransformations are changes you can make to your project data set,after the source data has been processed and loaded into Studio.Transformations are effectively an ETL process to clean your data.Transformations can overwrite an existing attribute, modify attributes,or create new attributes. Any number of transformations can becombined into a transformation script. You run the script against theproject data set. And if desired, you can create a new data set in theCatalog based on the transformed version.
About the Transform page user interfaceProvides basic information about the header and menu features.
Transformation script workflowAt a high level, creating a transformation script and running it againstyour project data set involves the following steps:
Transformations workflow diagramWhen you run a transformation script against a project data set andcommit it, Studio modifies the project data set (this is the private copy ofthe data set), but does not modify the underlying data set as it appears inthe Catalog to other Studio users (the public copy of the data set).
About GroovyGroovy is a dynamically-typed scripting language. Code written in theJava language is valid in Groovy, so users not familiar with Groovy mayresort to the Java syntax. All transform functions available for you inStudio are written in Groovy.
About transform functionsTransform functions are customized Groovy functions available inStudio that you can include in your transformation scripts. Eachtransform function performs a specific operation on your data, fromsimple ones, such as converting an attribute to a different data type, tomore complex ones, such as determining the overall sentiment of adocument or a String of text.
Overview of Transforming Project Data 18-1

Transform lockingThe Transform page in Studio has a locking mechanism to ensure thatmultiple users can't transform the same project data set at the same time.
Preview modeYou can preview a transformation at any time by clicking Preview, tosee the effect it will have on your project data set. Preview mode is also auseful debugging tool, as it detects any runtime errors or corner caseexceptions your transformation contains.
About transformations and transformation scriptsTransformations are changes you can make to your project data set, after the sourcedata has been processed and loaded into Studio. Transformations are effectively anETL process to clean your data. Transformations can overwrite an existing attribute,modify attributes, or create new attributes. Any number of transformations can becombined into a transformation script. You run the script against the project data set.And if desired, you can create a new data set in the Catalog based on the transformedversion.
The Transform page allows you to make corrections and enhancements to a projectdata set. The transformations are within the scope of the project and do not affect thedata set in the Catalog for other Studio users.
For example, you can use Transform page to modify:
• Change an attribute's data type
• Change capitalization of values
• Remove attributes or records
• Populate missing values
• Split columns into new ones (by creating new attributes)
• Add or remove attributes, or overwrite existing attributes
• Correct invalid or inconsistent values. For example, an attribute may have multipleversions of the same value (Wal-Mart, Walmart, Wal*Mart).
• Group or bin values
• Extract information from values
You can also provide additional information about the data or provide new ways touse the values. For example, you can:
• Identify commonly used terms
• Analyze sentiment
Custom transforms in a transformation script
You can also use the Groovy scripting language and a list of predefined Groovy-basedtransform functions available in Studio, to create a transformation script.Transformation scripts are collections of various transformations; they can contain anyof the transform functions.
You can also write your own transformations from scratch using Groovy, within thesame Transform page of Studio, using the Transformation Editor.
About transformations and transformation scripts
18-2 Studio User's Guide

Running a transformation script
You run a transformation script by clicking Commit to project in the Transformeditor. When you commit a transformation script to a project, the script runs againstthe project data set and modifies the project data set with each transform step in thescript. However, the operations do not affect the public data set in the Catalog onwhich that project is based.
You can preview the result of changes before you commit the script. While the script isrunning, you can check its progress in the Notifications panel.
After you transform a project data set, you can optionally create a new data set basedon your modifications. This allows other Studio users to access the new data set inCatalog.
Size of the data set to transform
If the source data is larger than one million records, the source data is automaticallysampled during the ingest process to give you a data set limited to a maximum of onemillion records.
If the source data is smaller than one million records, the project contains the full dataset rather than a sampled data set.
About the Transform page user interfaceProvides basic information about the header and menu features.
Transform page header information
At the top of Transform is a summary of the project data set. For example:
This summary includes:
• The number of records in the sample being used
• The number of records in the entire data set
• The number of records in the sample that match the current refinements
• The number of attributes in the data set
• A link to show/hide data set properties
Transform menu
Underneath the header is the attribute menu. It contains all the transformations thatyou can apply to an attribute. For example:
This menu includes transforms grouped into the following categories:
About the Transform page user interface
Overview of Transforming Project Data 18-3
• Shaping - transforms to filter attributes, delete attributes, aggregate attributes, andjoin data sets.
• Basic - transforms to perform basic text manipulation (split, trim, and so on).
• Convert - transforms to convert an attribute data type to another data type.
• Advanced - transforms for more sophisticated operations such as extractinginformation from attributes and creating new attributes based on geography,entities, key phrases, and so on.
• Editor - displays the Transformation Editor where you can write customtransformation steps and add them to a transformation script.
The page header can also contain:
• A value indicating the total number of transforms in the transformation script.
• A value indicating the number of uncommited transforms in the transformationscript.
Transformation script workflowAt a high level, creating a transformation script and running it against your projectdata set involves the following steps:
1. Create a transformation script using transforms and optionally custom transformfunctions.
2. Use preview to debug your transformation and view its effects on your data.
3. Save the transformation to your transformation script.
4. Edit your transformation script by rearranging, modifying, and deletingindividual transformations.
5. Run your script against the project data set. This updates your copy of the projectdata set (it is a sample of the source Hive table), and makes it available inDiscover area of Studio.
Transformations workflow diagramWhen you run a transformation script against a project data set and commit it, Studiomodifies the project data set (this is the private copy of the data set), but does notmodify the underlying data set as it appears in the Catalog to other Studio users (thepublic copy of the data set).
As shown in this workflow diagram, you create a project based on a data set andtransform the private copy of the data set in your project by committing thetransformation script.
As you change the transformation script, you can commit it again as necessary tocontinue modifying the project data set. The transformations apply to your version ofthe data set in project (this is the private copy of the data set); they do not affect thepublic version of this data set in Catalog.
Transformation script workflow
18-4 Studio User's Guide

Interaction of transformations with updatesHere is a summary of how changes you make in Transform interact with updates:
• Data sets loaded in Studio and from the JDBC source. If you have a newerversion of the Studio-uploaded file, you can reload it in Studio. The reloadedpublic version of the data set appears in the Catalog. See About updating a data setin the Catalog.
You can apply a transformation to the private copy of this data set in your project.
When a reloaded version of this data set appears in the Catalog, the private copy inyour project is not automatically updated. Studio prompts you to Accept dataupdates". If you do, Studio creates a new private copy of the reloaded public dataset and your transformations are applied to that private copy.
• Data sets backed by Hive and loaded with DP CLI.
If you have not transformed this data set in your project, you can update it with DPCLI.
Once you transform the DP CLI-loaded data set in your project, you can update itwith newer or additional data using DP CLI if the data set has been already loadedin full or is configured for updates using Configure for Updates.
If the data set has not been loaded in full or configured for updates, and you applytransformations, they are applied to the private version of this data set in yourproject. This means that to run transformations on data sets which you want tocontinuously update with DP CLI, the data sets must be loaded in full orconfigured for updates.
About GroovyGroovy is a dynamically-typed scripting language. Code written in the Java languageis valid in Groovy, so users not familiar with Groovy may resort to the Java syntax. Alltransform functions available for you in Studio are written in Groovy.
Groovy was chosen as the basis for the Transform API because it is flexible and easy touse. Additionally, although it is a dynamic language, it can use static compilation andstatic type checking to make it less error-prone at runtime.
About Groovy
Overview of Transforming Project Data 18-5

Studio lets you use many features of the Groovy language when writing your owncustom transformations; it does, however, impose a few restrictions for securityreasons. For more information, see Unsupported Groovy language features.
You can find more information on Groovy, including tutorials, in the Groovydocumentation.
About transform functionsTransform functions are customized Groovy functions available in Studio that youcan include in your transformation scripts. Each transform function performs aspecific operation on your data, from simple ones, such as converting an attribute to adifferent data type, to more complex ones, such as determining the overall sentimentof a document or a String of text.
Studio provides these types of custom transform functions:
• Conversion functions convert values to different data types.
• Date functions perform actions on Date objects, such as adding a specific amountof time to a Date.
• Enrichment functions are based on Data Enrichment modules in Studio. You canuse them to extract complex information from your data.
• Geocode functions perform actions on Geocode objects, such as calculating thedistance between two Geocode objects.
• Math functions perform mathematical operations on numerical values.
• Set functions perform different actions on sets of values on multi-value attributesin Studio, such as obtaining the size of the value set, checking whether a set isempty, or converting a multi-value attribute to a single-value attribute. Setfunctions only work on multi-value (also known as multi-assign) attributes.
• String functions perform different actions on String values, such as concatenatingtwo String values, or splitting a single String into multiple values.
Transform lockingThe Transform page in Studio has a locking mechanism to ensure that multiple userscan't transform the same project data set at the same time.
Transform locks a data set when a user previews or saves a transformation (that is,when the user clicks Preview or Apply to Script from the Transformation Editor).The lock remains set for 30 minutes, which is extended each time the user previews orsaves a transformation, or while they are actively working in the TransformationEditor.
Transform locks the data set when a user clicks Commit to Project, which runs thetransformation script against the project's data set. This lock applies to all users,including the one who ran the script.
A lock on a data set remains set until any of these conditions are met:
• You close the browser window that is running Studio.
• You navigate to a different URL in the browser window that is running Studio.
About transform functions
18-6 Studio User's Guide

• The script finishes running.
• Studio times out from inactivity after a period of 30 minutes.
• The session is ended by the user signing out of Studio.
When a data set is locked, users can only perform the following actions:
• View the data set
• Copy transformation scripts
• Toggle rows and values
• Sort columns
Preview modeYou can preview a transformation at any time by clicking Preview, to see the effect itwill have on your project data set. Preview mode is also a useful debugging tool, as itdetects any runtime errors or corner case exceptions your transformation contains.
When you click Preview, the Transformation Editor updates the transformationscript.
When you preview a transformation, Transform finds and displays runtime errorsthat weren't detected by the static parser. It is therefore recommended that youpreview your transformations and fix any errors they contain before saving them toyour transformation script. You can revert the changes made in the preview byclicking Cancel.
Preview only updates your project data set in Studio's internal files backing theTransform; it does not affect any data sets in a Dgraph database, and the results arenot visible to other users of your project in Studio. Additionally, your project data setis still associated with its source Hive data, so any changes made to the source are stillreflected within your project.
Preview mode
Overview of Transforming Project Data 18-7

Preview mode
18-8 Studio User's Guide

19Transforming Project Data Sets
This section describes how to correct and enrich data sets within a project.
Overview of transforming an attributeAll transforms follow the same basic work flow.
Transform page controlsThere are a number of general controls on the Transform page to togglethe data grid, filter and sort, and display whitespace in attribute values.
Basic transform operationsSimple transforms such as splitting attributes, trimming attributes, orchanging the case of attributes are listed on the Basic tab of theTransform page.
Conversion transform operationsConversion transforms convert the data type of an attribute that youselect to another data type. They are listed on the Convert tab of theTransform page.
Advanced transform operationsMore advanced transforms such as creating geo heirarchy attributes,extracting entities or phrases, managing null values and so on are listedon the Advanced tab of the Transform page.
Shaping transform operationsShaping transforms are listed on the Shaping tab of the Transform page.
Creating custom transformationsIf the default transforms do not meet your needs, you can also create andadd custom transformations to a transformation script on the Editor tabof the Transform page.
Managing and executing the transformation scriptThe transformation script tracks and executes the transformations.
Creating a new data set from the transformed dataAfter running a transformation script, you can create a new data set inthe Catalog based on the transformed project data.
Sharing a transform scriptThe ability to publish and share scripts provides a useful starting pointfor other projects to build a transform script.
Tips for better performanceThere are some simple things you can do while designing a transformscript to improve its overall performance.
Transforming Project Data Sets 19-1

Overview of transforming an attributeAll transforms follow the same basic work flow.
The high-level process:
1. You select the transformation that you want to apply to an attribute. If thetransformation does not require any configuration, then it is added immediatelyto the transformation script. If the transformation does require configuration, thena Transform Editor displays so you can provide the transformation-specificconfiguration.
2. Determine the target attribute for the transformed values. Some transformationsrequire that you use the transformation to create a new attribute. In this case, inthe New Attribute Name field, type the name for the new attribute.
Other transformations allow you to choose whether to create a new attribute oruse the transformed values to overwrite the current attribute.
• The default option is to create a new attribute.
• To overwrite the current attribute, click Apply to existing attribute.
3. To display the effect of the transformation on the Transform data grid, clickPreview.
4. To add the transformation to the transformation script, click Add to Script.
Transform page controlsThere are a number of general controls on the Transform page to toggle the data grid,filter and sort, and display whitespace in attribute values.
Toggling the Transform data grid viewMost of the Transform page consists of the data grid. In the grid, eachcolumn represents an attribute from the project data set.
Filtering and sorting the displayed attributes and valuesTransform provides sorting and filtering options to help you focus onthe attributes you want to work with.
Displaying whitespace characters in attribute valuesTo help gauge the amount of cleanup that might be needed in anattribute value, you can display spaces, tabs, and paragraph breaks aswhitespace characters.
Toggling the Transform data grid viewMost of the Transform page consists of the data grid. In the grid, each columnrepresents an attribute from the project data set.
The data grid can display either:
• An short list of records from the project data sample. This is a row view. In thisview, each row represents a record.
• Lists of attribute values. For each attribute, this view lists the unique values foundin the data sample, listed in descending order by frequency.
To switch to the record list, click the row view icon.
Overview of transforming an attribute
19-2 Studio User's Guide

To switch to the value list view, click the value list icon. This view shows attributevalue distribution in a column display. (On the Transform page, this a column displayof the same information you see in an attribute tile on the Explore page.)
The header for each attribute column contains:
• An icon to indicate the data type for the attribute.
• The attribute menu, used to access transformation options for that attribute.
• A data quality bar to indicate the number of records with valid or missing valuesfor the attribute. You can click either group of values in the quality bar to refine thedata.
Filtering and sorting the displayed attributes and valuesTransform provides sorting and filtering options to help you focus on the attributesyou want to work with.
Setting attributes as hidden or favorite
The Favorite and Hide options allow you to mark attributes that you are moreinterested in or that you do not want to see. These options only apply within a project.
To set an attribute as a favorite:
1. Select a column to highlight it.
2. From the attribute menu, select Add to Favorites. For example:
This move the column to the left most position of the data grid.
And you can then use the Filter Attributes > Favorites option to only display theattributes you mark as a favorite.
To hide an attribute:
1. Select a column to highlight it.
2. From the attribute menu, select Hide.
This removes the attribute from the grid.
And you can then use the Filter Attributes > Hidden filter option to only display thehidden attributes.
To remove the favorite or hidden flag for the attribute, click the Star or Hide optionagain.
When you set an attribute as hidden or favorite in the Transform page, the attribute isalso treated the same way in Explore and for all users of the project.
Transform page controls
Transforming Project Data Sets 19-3

Filtering the displayed attributes
In the Transform header are options for filtering the displayed attributes based on:
• The attribute name
• Any tags the attribute may have
• The attribute data type
• Any notes the attribute may have
• Any semantic types assigned to the attribute
• Whether an attribute is marked as favorite or hidden
Filtering the attribute values
You can use the Available Refinements panel to filter the displayed data based onattribute values. See Filtering Based on Refinements.
You can also use the data quality bar to refine the data to only include records withvalid, invalid, or missing values.
The refinement state can be included in custom transformations, and also used toselect records to delete from the project data set.
Sorting the displayed attributes
In Transform, you can sort the attributes:
• Alphabetically by name
• By the percentage of null values for the attribute
• Based on an algorithm that places attributes with more information potential at thetop of the list. This is the default.
• Based on the relationship to a selected attribute.
This sort suggests how closely related the attribute is to others in the data set andsorts the attributes accordingly. This sort suggests what one attribute can tell youabout the distribution of other attributes. For example, you might sort acomplaint attribute in a manufacturing data set and find that a supplier nameattribute is closely related.
This sort does not work with attributes that have hundreds of distinct values, sothose attributes are marked as ineligible for sort by relationship. Also, this sort doesnot evaluate null values; attributes that have a large number of null values aremoved toward the end of the sorted list.
When you sort based on an attribute, the selected attribute is moved to the front of thelist, and the other attributes are displayed in order based on that attribute.
To sort alphabetically by name, select By name from the Sort list.
To sort based on the relationship to a selected attribute, select Relationship to anattribute from the Sort list and choose an attribute to sort by.
Displaying whitespace characters in attribute valuesTo help gauge the amount of cleanup that might be needed in an attribute value, youcan display spaces, tabs, and paragraph breaks as whitespace characters.
Transform page controls
19-4 Studio User's Guide

When the whitespace characters are shown, tooltip displays the full value with thewhitespace characters when you hover the mouse over the value.
To display whitespace characters in attribute values:
1. In the Catalog, select a project.
2. Select Transform.
3. Locate an attribute and select the column.
4. Click Show whitespace.
Basic transform operationsSimple transforms such as splitting attributes, trimming attributes, or changing thecase of attributes are listed on the Basic tab of the Transform page.
Splitting String attribute valuesThe Split transformation creates one or more new attributes from theoriginal value. You can only split String attributes.
Trimming spaces from String valuesThe Trim transformation removes white spaces from the beginning orend of String attribute values.
Selecting subsets of date/time valuesFor date/time attributes, you can truncate the date/time values to onlyinclude a specific subset of the date/time units.
Changing the capitalization of String valuesWhen you change the capitalization, the transformation is immediatelyadded to the transformation script. There is no configuration, and thechange always overwrites the selected attribute.
Basic transform operations
Transforming Project Data Sets 19-5

Performing mathematical operations on numeric valuesFor numeric attributes, you can perform mathematical operations. Theavailable operations change based on whether the attribute you select isan integer, long, or double value.
Splitting String attribute valuesThe Split transformation creates one or more new attributes from the original value.You can only split String attributes.
For example, the values of a Vehicle Type attribute for vehicles consists of the vehiclemake and model separated by a colon (Honda:Civic, Toyota:Camry). You could thenuse the split transformation to create a Make attribute and a Model attribute.
You can split a value:
• Based on a delimiter.
For example, you might split the attribute after a comma or colon. If the delimiteroccurs multiple times, the value is split after the first occurrence.
• At a specific position in the text.
For example, you might split the attribute after the fourth character.
So if a Vehicle Type included the year (1995 Civic, 2003 Camry), then by splittingthe value after the fourth character, you could create a Year attribute and a Modelattribute.
• After specific text.
For example, split the attribute after the word "type".
To split String attribute values:
1. In the Catalog, select a project.
2. Select Transform.
3. Locate an attribute that contains values you want to split into multiple values andselect the column.
4. From the transform menu, select Basic > Split.
5. Choose a split method from the list and its corresponding delimited or position (asdescribed above).
6. In New Attribute Name, specify the name of the attribute you want to create basedon the split.
7. Either click Preview to see the previewed results of running the transformation, orclick Add to Script to save the transformation step to the script.
If you are done making changes to the project data set, you can commit the changes.See Running the transformation script against a project data set.
Trimming spaces from String valuesThe Trim transformation removes white spaces from the beginning or end of Stringattribute values.
To trim spaces from String values:
Basic transform operations
19-6 Studio User's Guide

From the attribute menu, under Quick Transformation, select Basic > Trim.
When you trim white spaces, the transformation is immediately added to thetransformation script. There is no configuration, and the change always overwrites theselected attribute.
1. In the Catalog, select a project.
2. Select Transform.
3. Select the column of the attribute you want to change.
4. From the transform menu, selectBasic > Trim.
When you select a Trim transformation, it is immediately added to thetransformation script. There is no configuration, and the change always overwritesthe selected attribute.
If you are done making changes to the project data set, you can commit the changes.See Running the transformation script against a project data set.
Selecting subsets of date/time valuesFor date/time attributes, you can truncate the date/time values to only include aspecific subset of the date/time units.
For example, if the attribute values include both the date and a time, you can truncatethe values to only include the date.
To select subsets of date/time values:
1. In the Catalog, select a project.
2. Select Transform.
3. Select the column of the attribute you want to truncate.
4. From the transform menu, select Basic > Truncate date.
When you select a Truncate date transformation, it is immediately added to thetransformation script. There is no configuration, and the change always overwritesthe selected attribute.
If you are done making changes to the project data set, you can commit the changes.See Running the transformation script against a project data set.
Changing the capitalization of String valuesWhen you change the capitalization, the transformation is immediately added to thetransformation script. There is no configuration, and the change always overwrites theselected attribute.
To change the capitalization of String values:
1. In the Catalog, select a project.
2. Select Transform.
3. Locate an attribute that contains values you want to modify and select the column.
Basic transform operations
Transforming Project Data Sets 19-7

4. Choose any of the following:
• To change the value to be all uppercase, select Basic > Uppercase .
• To change the value to be all lowercase, select Basic > Lowercase.
• To change the value to use title case, select Basic > Titlecase.
Performing mathematical operations on numeric valuesFor numeric attributes, you can perform mathematical operations. The availableoperations change based on whether the attribute you select is an integer, long, ordouble value.
The options can include:
• Getting the absolute value
• Rounding decimal values
• Change a real number to the largest previous integer (floor) or the smallestfollowing integer (ceiling).
To perform mathematical operations on numeric values:
1. In the Catalog, select a project.
2. Select Transform.
3. Select the column of the attribute you want to change.
4. From the transform menu, select Basic and the mathematical operation you want toperform on the attribute.
When you select a numeric transformation, it is immediately added to thetransformation script. There is no configuration, and the change always overwritesthe selected attribute.
If you are done making changes to the project data set, you can commit the changes.See Running the transformation script against a project data set.
Conversion transform operationsConversion transforms convert the data type of an attribute that you select to anotherdata type. They are listed on the Convert tab of the Transform page.
Changing the data type of an attributeYou can change the data type assigned to an attribute.
Changing the data type of an attributeYou can change the data type assigned to an attribute.
For example, an attribute might contain mostly date values, but be classified as aString because of missing values or an unrecognized format. To take advantage of thefeatures associated with date/time attributes, you can change the data type to date/time, then use other transformations to clean up the values.
Any data type can be transformed to a String. For other data types:
Conversion transform operations
19-8 Studio User's Guide

• Strings can be converted to date/time, numeric, or geocode data types
• Date/time values can be converted to numbers, or to times
• Long numbers can be converted to dates or geocodes
When converting values to or from date/time or time values, you must specify thedate/time format to use. The acceptable formats use the Java SimpleDateFormatsyntax (http://docs.oracle.com/javase/7/docs/api/java/text/SimpleDateFormat.html).
When converting to geocode values, you must specify the latitude and longitude.
To change the data type of an attribute:
1. In the Catalog, select a project.
2. Select Transform.
3. Select the column of the attribute you want to change.
4. From the transform menu, select Convert to <type> and the data type transformyou want.
When you select a Convert to <type> transformation, it is immediately added tothe transformation script. There is no configuration, and the change alwaysoverwrites the selected attribute.
If you are done making changes to the project data set, you can commit the changes.See Running the transformation script against a project data set.
Advanced transform operationsMore advanced transforms such as creating geo heirarchy attributes, extractingentities or phrases, managing null values and so on are listed on the Advanced tab ofthe Transform page.
Obtaining geocode information from attribute valuesYou can create a full set of geocode attributes (country, region,subregion, etc.) based on any String attribute that has partial addressinformation. The full set of geocode attributes allows you to display thegeographic information in a Thematic Map.
Extracting parts of a date from attribute valuesYou can extract date patterns from a Date Time attribute and use thatinformation to create a new attribute or overwrite an existing attribute.
Extracting names of people, places, or organizations from attribute valuesThe Entity Extraction transformation searches attributes for names ofpeople, places, or organizations. The resulting attribute contains adelimited list of the found entities. If the transformation does not findany entities, the resulting attribute is empty.
Extracting key phrases from attribute valuesThe Extract key phrases transform extracts key phrases from a Stringattribute and creates a list of phrases in a new multi-assign attribute. Thetransform calculates key phrases using the TF/IDF algorithm, whichtakes the total number of times each term appears within the String and
Advanced transform operations
Transforming Project Data Sets 19-9

offsets that value by the number of times it appears within a larger bodyof work.
Providing a whitelist to extract terms from attribute valuesIf you know the exact words you want to extract from an attribute, thenyou can use the Tag from Whitelist transformation to extract them andcreate a new attribute. You can also extract them, replace them withanother term, and create a new attribute.
Binning numeric attribute valuesThe binning transformation takes values for a numeric attribute andgroups them into bins. The bins are then used as the values of a newattribute.
Grouping attribute valuesGrouping attribute values takes the attribute values and puts them intogroups, with each group given a unique name.
Managing null valuesThe Manage null values transformation replaces null values for anattribute.
Obtaining geocode information from attribute valuesYou can create a full set of geocode attributes (country, region, subregion, etc.)based on any String attribute that has partial address information. The full set ofgeocode attributes allows you to display the geographic information in a ThematicMap.
For details about using the geocode attributes in a chart, see Thematic Map. For detailsabout using geocode (geotag) functions and their data type requirements, see Enrichment functions.
To obtain geocode information from attribute values:
1. In the Catalog, select a project.
2. Select Transform.
3. Locate an attribute, of type String, that has geographic information.
For example, this might be a city, state, or postal code attribute.
4. From the transform menu, select Advanced > Create geo heirarchy.
5. In Select a <location> attribute..., do one of the following depending on your dataset:
(where <location> represents each control such as country, region, subregion,city and postcode)
• If your data set already has a <location> attribute, select Attribute from thelist and specify the attribute name.
• If your data set does not have a <location> attribute, create a countryattribute manually by selecting Static Value from the first list and selecting acountry name from the second list.
Advanced transform operations
19-10 Studio User's Guide

• If the attribute is not applicable, select N/A. In other words, this attribute maybe unknown; it may not exist, or may not apply. For example, some countriesdo not have providences, states, or counties.
• Repeat this step to specify the values of Select a country attribute..., Select aregion attribute..., Select a subregion attribute..., Select a city attribute... andSelect a postcode attribute....
6. In New Attribute Name (prefix), specify just the prefix value for the new geocodeattributes.
7. Decide how to handle ambiguous location matches in the new geocode attributevalues by selecting one of the following:
• Return the most populated relevant location - sets the ambiguous value to themost populated location match. For example, an ambiguous match to Boston isset to Boston Massachusetts rather than Boston, Georgia.
• Return a null value - sets the ambiguous value to null.
8. Either click Preview to see the previewed results of running the transformation, orclick Add to Script to save the transformation step to the script.
Example 19-1 Example
Suppose your source data has attributes named city, county, and zip_code withvalues that represent city names, county names, and postal codes in the state ofCalifornia:
However, the source data does not have country or state information. You can createthe geocode attributes by setting the Create Geographic Heirarchy as follows:
Advanced transform operations
Transforming Project Data Sets 19-11

After you click Preview, you see that Studio created the following new geocodeattributes highlighted in yellow:
If you are done making changes to the project data set, you can commit the changes.See Running the transformation script against a project data set.
Advanced transform operations
19-12 Studio User's Guide
Extracting parts of a date from attribute valuesYou can extract date patterns from a Date Time attribute and use that information tocreate a new attribute or overwrite an existing attribute.
For example, this may be useful if an attribute has a timestamp and you want toextract the day of the week value and create a new attribute called Day.
To extract parts of a date from attribute values:
1. In the Catalog, select a project.
2. Select Transform.
3. Locate an attribute of type Date Time that has date information that you want toextract.
4. From the transform menu, select Basic > Extract date part.
5. Specify a date pattern for the attribute values in one of the following ways:
• In Select a data part..., select a date format from the list of pre-defined formatpatterns.
• Alternatively, you can enable Create a custom data part and specify a customdate pattern. Specify only the date pattern not a label for the pattern. Forexample, if you want to create a custom pattern for Year-Month-Day, youspecify only yyyy-MM-dd.
6. Select an output time zone for the date pattern. This setting normalizes the attributevalues to the time zone you specify.
7. Select an output locale from the available list. This setting converts character (non-numeric) date information to the locale you specify.
For example, if you extract a day pattern, such as dd, and set the output locale toJapanese, the new attribute values contain the day names in Japanese.
8. Indicate whether you want the Extract Date Part transformation to apply to theattribute you selected previously, or indicate whether you want to create a newattribute using the extracted date information.
9. If you selected Create New Attribute, then specify an attribute name.
10. Either click Preview to see the previewed results of running the transformation, orclick Add to Script to save the transformation step to the script.
Example 19-2 Example
Suppose your source data has attributes named dropoff_datetime and you want toextract the day value and use it to create dropoff_day. You can create the attributesby setting the Extract Date Part as follows:
Advanced transform operations
Transforming Project Data Sets 19-13

After you click Preview, you see that Studio creates the following new dropoff_dayattribute highlighted in yellow:
If you are done making changes to the project data set, you can commit the changes.See Running the transformation script against a project data set.
Advanced transform operations
19-14 Studio User's Guide

Extracting names of people, places, or organizations from attribute valuesThe Entity Extraction transformation searches attributes for names of people, places,or organizations. The resulting attribute contains a delimited list of the found entities.If the transformation does not find any entities, the resulting attribute is empty.
For example, for the text: "In New York, the Metropolitan Museum of Art is the largestmuseum. Other popular museums include the Guggenheim (designed by Frank LloydWright) and the Museum of Modern Art."
• If you run Entity Extraction to extract places, the resulting value would besomething like "New York, Metropolitan Museum of Art, Guggenheim, Museum ofModern Art".
• If you run Entity Extraction to extract people, the resulting value would be "FrankLloyd Wright".
To extract entity names from an attribute's values:
1. In the Catalog, select a project.
2. Select Transform.
3. Locate an attribute of type String that contains entity information that you want toextract and select the column.
4. From the transform menu, select Advanced > Extract entities.
5. Select the type of entities you want to extract (people, places, or organizations). Youselect one or all of the available entities.
6. Specify a prefix for the new attribute.
Studio creates a new attribute with the prefix value combined with a suffix of<prefix>_person (for People), <prefix>_location (for Places), and<prefix>_organization (for Organizations).
7. Either click Preview to see the previewed results of running the transformation, orclick Add to Script to save the transformation step to the script.
If you are done making changes to the project data set, you can commit the changes.See Running the transformation script against a project data set.
Extracting key phrases from attribute valuesThe Extract key phrases transform extracts key phrases from a String attribute andcreates a list of phrases in a new multi-assign attribute. The transform calculates keyphrases using the TF/IDF algorithm, which takes the total number of times each termappears within the String and offsets that value by the number of times it appearswithin a larger body of work.
To extract key phrases from an attribute's value:
1. In the Catalog, select a project.
2. Select Transform.
3. Locate an attribute that you want to extract phrases from and select the column.
Advanced transform operations
Transforming Project Data Sets 19-15

4. From the transform menu, select Advanced > Extract key phrases.
5. In Input language, specify the language of the attribute value.
This improves the accuracy of key phrase identification by applying a languagespecific identification model.
6. Select Use smart casing for input text to better handle documents that arepredominantly in either title case or upper case.
Smart casing helps the transform better identify key phrases by first convertingupper case text to lower case and then running the phrase extraction on the lower-case text.
7. In New Attribute Name, specify the name of the attribute you want to create. Bydefault, Studio creates a multi-assign attribute to store key phrases.
8. Either click Preview to see the previewed results of running the transformation, orclick Add to Script to save the transformation step to the script.
If you are done making changes to the project data set, you can commit the changes.See Running the transformation script against a project data set.
Providing a whitelist to extract terms from attribute valuesIf you know the exact words you want to extract from an attribute, then you can usethe Tag from Whitelist transformation to extract them and create a new attribute. Youcan also extract them, replace them with another term, and create a new attribute.
Each line in the editor represents a single tagging action. Types of available taggingactions include:
Tagging Action Syntax Examples
Extract a single term. Specify the term on its ownline.
red
If the term red is found, addit to the output attribute.
Extract a single term andreplace it with another term.
Specify the term on its ownline, add a tab, and specifythe replacement term.
red<tab>color
If red is found it is replacedby color in the outputattribute.
Extract several terms andreplace it with one term.
Replace a selected term orterms with another term.
This is the same as singleterm replacement but youuse a new line for each termand its replacement.
red<tab>coloryellow<tab>colorblue<tab>color
If red, yellow, or blue arefound, the term is extractedand replaced by color in theoutput attribute.
To provide a whitelist to extract terms from attribute values:
Advanced transform operations
19-16 Studio User's Guide

1. In the Catalog, select a project.
2. Select Transform.
3. Locate an attribute, of type String, that has text you want to extract.
4. From the transform menu, select Advanced > Tag from whitelist.
5. Click Enter Terms.
6. Specify the terms you want to extract according to the syntax in the table above.
For example:
7. If desired, specify whether you want a case-sensitive match or a whole word match(no sub-String matches) for the terms.
8. Click Done.
9. In New Attribute Name, specify the name of the attribute you want to create.
10. Either click Preview to see the previewed results of running the transformation, orclick Add to Script to save the transformation step to the script.
If you are done making changes to the project data set, you can commit the changes.See Running the transformation script against a project data set.
Binning numeric attribute valuesThe binning transformation takes values for a numeric attribute and groups them intobins. The bins are then used as the values of a new attribute.
For example, from a Price attribute, you might create a new Price Range attribute suchthat:
• If Price is less than 20 dollars, then Price Range is "Inexpensive".
• If Price is greater than 20 dollars but less than 40 dollars, then Price Range is"Moderately Priced".
• If Price is greater than 40 dollars but less than 60 dollars, then Price Range is"Expensive".
• If Price is greater than 60 dollars, then Price Range is "Very Expensive".
Advanced transform operations
Transforming Project Data Sets 19-17

To bin the values of a numeric attribute:
1. In the Catalog, select a project.
2. Select Transform.
3. Locate one of the attributes that you want to bin and select the column.
4. From the transform menu, select Advanced > Bin numeric values.
5. For each bin that you add, specify the following:
a. A bin name. The bin names are used as the display name for the new attributevalue.
b. A low value for the bin range. For the low value, you indicate whether values inthe bin must be greater than or greater than or equal to the specified value.
c. A high value for the bin range. For the high value, you indicate whether valuesin the bin must be less than or less than or equal to the specified value.
6. For values that don't fit in any of the bins, select whether to:
• Leave them as is without any binning.
• Place them in another bin named Other.
7. Provide the name of the new attribute to contain the bins. When you bin values,you must always create a new attribute.
8. Either click Preview to see the previewed results of running the transformation, orclick Add to Script to save the transformation step to the script.
If you are done making changes to the project data set, you can commit the changes.See Running the transformation script against a project data set.
Grouping attribute valuesGrouping attribute values takes the attribute values and puts them into groups, witheach group given a unique name.
You can use the groups to replace the current attribute values, or create a newattribute.
You might replace the current attribute values if you want to standardize values thatare actually the same value, but with slightly different formatting or spelling acrossthe data set.
For example, Walmart might show up as Wal-Mart, walmart, and Wal*Mart. To fixthese inconsistencies, you could create a Walmart group that includes all of thesevariants.
You might create a new attribute if you want to provide an attribute with a higherlevel of abstraction.
For example, you might want to group the values of a State attribute into a newRegion attribute. You could then create visualizations based on either State or Region.
To group the values for an attribute:
1. In the Catalog, select a project.
Advanced transform operations
19-18 Studio User's Guide

2. Select Transform.
3. Locate one of the attributes that you want to group and select the column.
4. From the transform menu, select Advanced > Group values.
5. Click + Value Group.
A new empty group is added to the list, with a default name of "New Value Group1". Each group name becomes an attribute value.
6. To rename the group, double-click the group name. Type the new name, then pressEnter.
7. To populate a group, drag values from the value list and drop them on the groupname.
8. Either specify a new attribute name for the group, or apply the new attribute groupto the attribute you selected in Step 3.
9. Either click Preview to see the previewed results of running the transformation, orclick Add to Script to save the transformation step to the script.
If you are done making changes to the project data set, you can commit the changes.See Running the transformation script against a project data set.
Managing null valuesThe Manage null values transformation replaces null values for an attribute.
You can fill in the null values using either:
• The mostly commonly used value
• For numeric values, the mean of the attribute values
• A specific value that you specify.
For example, you could fill in all of the null values with "Not Provided" or "NotApplicable".
To fill in null values:
1. In the Catalog, select a project.
2. Select Transform.
3. Locate an attribute that contains null values you want to modify and select thecolumn.
Remember the data quality bar shows the percentage of null values in black. Forexample:
Advanced transform operations
Transforming Project Data Sets 19-19

4. From the transform menu, select Advanced > Manage null values.
5. Specify a replacement for the null values in one of the following ways:
• Choose Replace with Static Value > Most Frequent Value. This optionprovides a pre-calculated value in grey.
• Choose Replace with Static Value > Attribute Mean. This option provides apre-calculated mean value in grey.
• Choose Replace with Static Value > Null filling value and specify a value ofyour choice.
• Choose Delete Records to delete all records that have a null value for theselected attribute.
6. Optionally, select Create null indicator attribute to create a new attribute, based onthe column name you selected, that gets populated with either 1 or 0 for the value.
A value of 1 means a null value was replaced. A value of 0 means the original valuewas not modified because it was not null.
7. If you selected Replace with Static Value, then indicate whether to apply thechange to the current attribute or specify a new attribute name.
8. Either click Preview to see the previewed results of running the transformation, orclick Add to Script to save the transformation step to the script.
If you are done making changes to the project data set, you can commit the changes.See Running the transformation script against a project data set.
Shaping transform operationsShaping transforms are listed on the Shaping tab of the Transform page.
Shaping includes all of the following data set modifications:
• Filtering rows out of a data set
• Deleting attributes from a data set
• Aggregating the values of one or more attributes into one or more new derivedattribute
• Joining one or more data sets together
Filtering records from the project data setYou can use the refinement state as a basis for removing records fromthe project data set. You can either remove records that match therefinement state, or remove records that do NOT match the refinementstate.
Deleting an attributeYou can delete an attribute from a project data set by using the quicktransform menu option Delete Attribute.
About aggregating attribute valuesYou aggregate attribute values by applying an operation (sum, average,min/max, etc.) to one or more attributes and then grouping the derivedresult by an attribute.
Shaping transform operations
19-20 Studio User's Guide

Aggregating attribute valuesThe Aggregate transformation aggregates attributes values to derive oneor more new attributes and group the result by an attribute.
About joining data setsStudio can perform a left outer join, inner join, or full outer join againstone or more data sets based on a key, or compound key, that you create.
Joining data setsYou can join one or more data sets by specifying primary and secondarysources, a join key, a join type, and then running the transform script.
Filtering records from the project data setYou can use the refinement state as a basis for removing records from the project dataset. You can either remove records that match the refinement state, or remove recordsthat do NOT match the refinement state.
For example, you might want to filter out all records with null values for certainattributes. Or you may want to filter out all records except those with Canada as thecountry value.
If you filter the records, then they are permanently removed from the project data set.However, they are still in the original data set.
To delete records from the project data set:
1. In the Catalog, select a project.
2. Select Explore and refine the data set to either represent the records you want tokeep or exclude.
3. Select Transform.
4. From the transform menu, select Shaping > Filter rows.
5. In the Transformation Editor, verify that the transform reflects the refinement stateyou selected.
For example, this transform filters out records that have a color value of Silver:
Shaping transform operations
Transforming Project Data Sets 19-21

6. Choose a radio button to indicate whether to delete records that do NOT match therefine by selection or delete records that match the refine by selection.
7. Either click Preview to see the previewed results of running the transformation, orclick Add to Script to save the transformation step to the script.
8. Click the numbered bubble to expand the Transform Script window.
9. Click Commit to Project to run the script. If necessary, click the pencil icon to editthe transform before committing it.
For example:
Deleting an attributeYou can delete an attribute from a project data set by using the quick transform menuoption Delete Attribute.
To delete an attribute:
1. In the Catalog, select a project.
Shaping transform operations
19-22 Studio User's Guide

2. Select Transform.
3. Locate an attribute that you want to remove from the project data set.
4. From the transform menu, select Shaping > Delete attribute.
There is no editor that displays. The delete operation removes the attribute columnfrom the table and also adds a Delete transformation step to the Transform Script.
If you are done making changes to the project data set, you can commit the changes.See Running the transformation script against a project data set.
About aggregating attribute valuesYou aggregate attribute values by applying an operation (sum, average, min/max,etc.) to one or more attributes and then grouping the derived result by an attribute.
For example, you could aggregate the average of a Standard Cost attribute andgroup the result by a Product Category. In that case, you get the average cost ofeach item in a particular product category.
Or, you could aggregate the minimum and maximum values of a Standard Costattribute and group the results by a Product Category. In that case, you get thelowest cost of each item in a category and the highest cost of each item in a category.
Aggregating attribute values provides a way to consolidate data into a new derivedattribute for further examination. And in some cases, the new derived attribute valuesare often used before you perform additional operations such joining one data set withanother data set.
Some attributes have a data type that make them unavailable for aggregation.Specifically, multi-assign and geocode attributes display in the Aggregate editor asunavailable.
Some operators can only transform attributes of a particular data type. The average,sum, standard dev and variance operators can only used with numeric attributes.The min and max operators can be used with numeric attributes and date timeattributes.
Aggregation operators
The supported aggregation operators are sum, average, min, max, , records withvalues, and unique values. In addition to these operators, you might also haveset, variance, and standard dev if thedf.advancedSparkAggregationsEnabled property is set to true on the ControlPanel > Studio Settings page.
Table 19-1 Aggregation operators
Operator Description
sum Finds the sum of all values in the attribute.
average Finds the average of all values in the attribute.
min Finds the minimum value of all values in the attribute.
max Finds the maximum value of all values in the attribute.
records with values Finds the number of records with values in theattribute.
Shaping transform operations
Transforming Project Data Sets 19-23

Table 19-1 (Cont.) Aggregation operators
Operator Description
unique values Finds the number of unique values in the attribute.
set Optionally enabled. Finds the set of matching valuesin the attribute.
variance Optionally enabled. Finds the variance between a setof values.
standard dev Optionally enabled. Finds the standard deviation forthe attribute values.
Interaction with data set updates
Aggregated attributes are calculated based on values from one point in time. If yourun a transformation script with an aggregation and then reload or update a data set,you have to re-run the transform script with the aggregation using the updated data.In other words, the values in an aggregated attribute have been collapsed during theaggregation, and you need the un-aggregated values to run subsequent updates.
Aggregating attribute valuesThe Aggregate transformation aggregates attributes values to derive one or more newattributes and group the result by an attribute.
To aggregate attribute values:
1. In the Catalog, select a project.
2. Select Transform.
3. From the transform menu, select Shaping > Aggregate.
4. Specify the attribute to group by, as follows:
a. From the Available attributes list, locate and select an attribute that you wantto group by.
You can filter attributes by name or by data type to locate them.
This example shows a selected the sales_productcategoryname attribute:
Shaping transform operations
19-24 Studio User's Guide

b. Optionally, examine the Available attributes preview pane to check whetherthe attribute you selected to group by has the attribute value distribution thatyou expect. (This pane shows the value list view. )
This example shows the attribute value distribution of thesales_productcategoryname attribute:
c. If the attribute you examined is what you want to group by, drag and drop theattribute onto the Grouping attributes pane.
5. Specify the new aggregated attributes, as follows:
a. From the Available attributes list, locate and select an attribute that you wantto aggregate.
You can filter attributes by name or by data type to locate them.
b. Drag and drop the attribute onto the Aggregated attributes pane and select anoperator for the aggregation. (The default operator is average, but you can selectany operator from the drop-down list.)
Studio creates a new attribute name with a new suffix of the form_operatorName.
c. Optionally, click the name to make it editable and edit the new attribute name.
This example shows two new aggregated attributes. One creates a minimum valuefor a product's standard cost and the second creates a maximum value for aproduct's standard cost.
6. Click Preview and examine the Aggregated preview pane to see the result ofaggregating the values and grouping by the attribute you chose previously.
To continue the above example, Studio creates the new aggregated attributessales_productstandardcost_min and
Shaping transform operations
Transforming Project Data Sets 19-25

sales_productstandardcost_max and then grouped them bysales_productcategoryname. As a result of the aggregation, you can see thehigh and low cost grouped by the category:
7. Click Add to Script to save the transformation step to the script.
If you are done making changes to the project data set, you can commit the changes.See Running the transformation script against a project data set.
About joining data setsStudio can perform a left outer join, inner join, or full outer join against one or moredata sets based on a key, or compound key, that you create.
The primary data set displays the join changes and the secondary data set is notmodified.
The updated records have an additional attribute, named Data Source Name thatspecifies which data sources, by name, contributed to the new records. For example, ina left join, every record is tagged with dataset1, but there might be some records thathave no matching data from dataset2. Those records would only contain the valuedataset1. All other records would contain both dataset1 and dataset2 as attribute values.
Differences between joining and linking data sets
Joining data sets performs a full SQL join combining records from the primary andsecondary sides of the join. Joining materializes new records that replace the data inthe primary data set of your project.
Linking data sets links the data at query time for temporary use in Discovercomponents. Both data sets continue to be stored as separate data sets with only a key(link) that connects them during queries. Linked data sets are not permanently joinedin any way.
A link is logically similar to a database view. Links provide a way to temporarily lookat relationships in multiple data sets without the level of persistence and dataprocessing required by a join. For more information about linking, see Linking ProjectData Sets.
Updates to joined data
Joins have the same update model as all other transforms. If you load a full data set orrun an incremental update, Studio notifies you that the data set has changed and youcan accept or reject the update in your project. If you accept an update, Studio readsthe changes from the Hive table and re-runs the join operation.
Shaping transform operations
19-26 Studio User's Guide

Limits to the sample size after joins
A join operation could result in a larger data set size. However, the bdd.sampleSizesetting, on the Data Processing Settings page, limits the sample size that results fromtransforms such as Join, Aggregate, and FilterRows. In other words, a join operationnever results in a sample size that exceeds the value of bdd.sampleSize.
Joining data setsYou can join one or more data sets by specifying primary and secondary sources, ajoin key, a join type, and then running the transform script.
Before performing a join, both data sets must be added to the project. If you areperforming a self join, only one data set is required.
To join data sets:
1. In the Catalog, select a project.
2. Select Transform.
3. Select a data set tab that you want to be the primary data set.
For example, this project has an employee data set and a sales data set. SelectingEmployee makes it the primary data set:
4. From the transform menu, select Shaping > Join.
5. Confirm that the secondary data set that you want to join is selected.
For example, this project joins an employee data set to a sales data set:
Shaping transform operations
Transforming Project Data Sets 19-27

6. Create a unique join key from attributes that are the same data type.
a. Click an attribute name from the primary side of the join to highlight it.
The attribute is added to the left side of the Select Keys list. Also note thatStudio restricts available attributes on the right side to those of the same datatype.
b. Select a key operator (equals, less than, greater than, etc) to determine how thekey is built.
For example, employee_fullname on the primary side might equalsales_employeefullname on the secondary side.
c. Click an attribute name from the secondary side of the join to highlight it
The attribute is added to the right side of the Select Keys list. For example, thiskey is employee_fullname equals sales_employeefullname:
Shaping transform operations
19-28 Studio User's Guide

d. If a single attribute is not sufficient to guarantee uniqueness across the joinedrecord set, click the + icon and repeat the above steps a - c to build a compoundkey using a second set of attributes.
7. Select the join type of Left Outer, Inner, or Full Outer.
8. Optionally, click Preview to see the results of the join.
9. Click Next.
10. Specify which attributes you want in the joined data set by checking thecorresponding attribute names. You can filter attributes, sort by data type, andselect or deselect all.
The available attribute list contains all attributes from both the primary andsecondary data sets. At the top of the list, there is also a Source data set attribute. Ifthis attribute is enabled, Studio creates a new multi-assign attribute with valuesthat specify which data sources, by name, contributed to the new records.
11. Optionally, click an attribute name to edit the name if necessary.
12. Click Add to Script to save the join to the script.
If you are done making changes to the project data set, you can commit the changes.See Running the transformation script against a project data set.
You can monitor the progress of the join from the Notifications panel.
Shaping transform operations
Transforming Project Data Sets 19-29

Creating custom transformationsIf the default transforms do not meet your needs, you can also create and add customtransformations to a transformation script on the Editor tab of the Transform page.
Creating a custom transformationYou can create a custom transformation by writing custom Groovy codein the Transformation Editor. After you save the custom transformation,it is added as one individual execution step to the transformation script.
Writing custom transform codeTransformations can contain attributes and records from your projectdata set as variables, and can create new attributes to hold thetransformed values.
Exception handling and debuggingThese topics describe exception handling in Transform and show how todebug individual transformations.
Creating a custom transformationYou can create a custom transformation by writing custom Groovy code in theTransformation Editor. After you save the custom transformation, it is added as oneindividual execution step to the transformation script.
The Transformation Editor provides access to lists of functions and attributes to insertinto a transformation script. The individual Groovy functions are documented in Transform Function Reference.
Also note that like other scripting languages, Groovy has a set of reserved keywordsthat have special meanings and therefore can't be used as variable or function namesin transformation scripts. For details, see Unsupported Groovy language features.
To create a custom transformation:
1. In the Catalog, select a project.
2. Select Transform.
3. From the transform menu, select Editor.
4. To insert the current refinement state into the script, click the Use refinement stateas a conditional statement link.
5. To insert a function into the custom transform code:
a. Click Functions.
b. To find a specific function, use the filter field to filter by function name, orchoose a category of functions from the drop down to filter by grouping such asdata type.
c. To add a function, either double-click it, or drag and drop it into the script.
6. To insert an attribute name into the custom transform code:
a. Click Attributes.
Creating custom transformations
19-30 Studio User's Guide

b. To find a specific attribute, use the filter field. You can filter the list by name ordata type.
c. To add an attribute, either double-click it, or drag and drop it into the script.
7. Add any additional Groovy code as necessary for your data cleaning.
8. If you are applying the transform to an existing attribute, select Applytransformation to [attribute name]
Applying a transformation to the selected attribute overwrites the attribute withthe transformed data.
9. If you are creating a new attribute, provide the attribute name in Create NewAttribute.
Setting the transformation to output to a new column adds a new attribute to yourproject data set. The new name can only contain alphanumeric characters andunderscores (_). If the name you enter contains unsupported characters, the outlineof the text box turns red and you receive an error message if you try to preview orsave the transformation.
10. From the Data Type list, select the data type to assign to the resulting attribute.
Studio automatically selects an appropriate data type, but you can override this.
11. If the new attribute should be multi-assign, deselect the Single Assign check box.
12. Either click Preview to see the previewed results of running the transformation, orclick Add to Script to save the transformation step to the script.
If you are done making changes to the project data set, you can commit the changes.See Running the transformation script against a project data set.
Writing custom transform codeTransformations can contain attributes and records from your project data set asvariables, and can create new attributes to hold the transformed values.
The Transformation EditorThe Transformation Editor becomes available when you select the Editor tab of theTransform page.
Creating custom transformations
Transforming Project Data Sets 19-31

In the editor:
• Syntax highlighting enables color-coding of different elements in yourtransformation to indicate their type.
• Auto complete lets you view a list of autocomplete suggestions for the word you'retyping, by pressing Ctrl+space. Use the arrow keys to navigate this list and pressEnter to select the highlighted item.
• Error checking includes a built-in static parser that performs error checking whenyou preview or save your transformation. For more information, see Exceptionhandling.
You can write code in the editor in two different ways, depending on yourprogramming experience level:
• If you are comfortable with Groovy, you can type directly into the TransformationEditor. Your code can contain any of the supported Groovy language features, andcustom transform functions available in Studio.
• If you have limited experience with Groovy, you can create transformations usingpredefined lists of custom transform functions and available attributes:
– To view the list of transform functions, click Functions above theTransformation Editor. In the Functions list, you can search, filter, and learnabout each function by hovering the mouse over its name.
For example:
Creating custom transformations
19-32 Studio User's Guide

– To view the list of your data set's attributes, click Attributes. The Attributes listdisplays an icon next to each attribute's name indicating its data type. Forexample:
To add items from either list to your transformation, click and drag its name intothe Transformation Editor.
To add an item from the Attributes list as a parameter to a function, drag theattribute's name directly on top of the function's placeholder text.
Formats for variablesYou can use attributes from your project data set as variables in your transformationscripts. This allows you to pass attributes to transform functions as parameters andperform other operations on them.
To include an attribute in a transformation, you can reference it using the formatsdescribed below. The specific formats you can use for a given attribute depend onwhether its name meets the following requirements:
Creating custom transformations
Transforming Project Data Sets 19-33

• Names should consist of a letter or underscore (_) followed by zero or morealphanumeric characters (a-zA-Z, 0-9) and underscores.
• Names can't contain any of the reserved keywords from either the Transform areain Studio, or from Groovy. For more information, see Groovy reserved keywordsand unsupported functions.
Note: Unlike other variables, attributes don't need to be declared.
This table describes the formats you can use to include attributes as variables intransformations.
Format syntax Description
<attribute> Attribute names that consist of a letter or underscore (_)followed by zero or more alphanumeric characters (a-zA-Z, 0-9) and underscores. Names can't contain any ofthe reserved keywords from either the Transform areain Studio, or from Groovy.
row["_<attribute>"] The map format. This can be used for all attributes,including those whose names don't meet the namingrequirements described above. You can use single ordouble quotes.
row."_<attribute>" The long dot format. This can be used for all attributes,including those whose names don't meet the namingrequirements described above. You can use single ordouble quotes.
row._<attribute> The short dot format. This can only be used forattributes whose names consist of alphanumericcharacters, dollar signs ($), and underscores.
Note: The format you use for an attribute affects how it is handled by thestatic parser. For more information, see Exception handling andtroubleshooting your scripts.
Functional and dot notation and function chainingYou must use proper syntax when adding transform functions to your script, or yourscript won't run properly. You can reference all transform functions using functionalnotation, as described in this topic.
<function>(<argument1>[,<argumentN>])
For example, the following code applies the geotagAddress function to an attributecalled address:
geotagAddress(address)
You can use dot notation to include original Groovy functions that aren't specific toStudio:
<attribute>.<function>()
Creating custom transformations
19-34 Studio User's Guide

For example, the following code uses the toString function to convert an attributecalled quantity to a String:
quantity.toString()
Note: You can only use dot notation for original Groovy functions. For theBDD-specific transform functions, you must use functional notation.
Function chaining
Function chaining allows you to apply multiple functions to an attribute in a singlestatement. You chain functions by passing an attribute to one function, then passingthat function to another function. The innermost function (the one receiving theattribute as a parameter) is evaluated first, and the outermost function is evaluatedlast.
For example, the following code takes an IP address, determines the city it originatedfrom, then converts the name of the city to uppercase:
// Performs two transformations on a single attribute using one line of code:
toUpperCase(geotagIPAddressGetCity(IP_address))
The following code produces the same result as the code above, but is more verbose:
// The same two transformations as above, without chaining.// 'city_name' is a temporary variable that stores the output of geotagIPAddressGetCity()
def city_name = geotagIPAddressGetCity(IP_address)toUpperCase(city_name)
As you can see in the examples, function chaining makes your code cleaner and easierto read. Additionally, not having to include placeholder variables, such as city_namein the second example, helps make your code less error prone.
Extending the transform function libraryYou can create an external Groovy script that extends the transform function library,and then call the function in a custom transformation. This provides an extensionpoint to the set of default Groovy-based transformation functions provided with BDD.
The custom Groovy script you create must be packaged in a JAR that you makeavailable as a plug-in to both Studio and the Data Processing component. Next, youcan run your custom transformation script in Studio with the runExternalPluginfunction.
Note: Extending the transform function library is not supported by Big DataDiscovery Cloud Service. The feature is supported by Big Data Discovery.
This sample Groovy script (named MyPlugin.groovy) is used as an example:
def pluginExec(Object[] args) { String input = args[0] //args[0] is the input field from the BDD Transformation Editor
//Return a lowercase version of the input.
Creating custom transformations
Transforming Project Data Sets 19-35

input.toLowerCase()}
The script defines the pluginExec() method, which takes an Object array (namedargs) as an argument. args[0] corresponds to the string attribute to be transformedand is assigned to the input variable. Next, the Transform function toLowerCase()is called to change the input data to lower case and return it to be stored in a single-assign string attribute.
You can create a more complex transformation script in Groovy, for example, one thatimports external Java libraries and uses them in the script. Documentation for theGroovy language is available at: http://www.groovy-lang.org/documentation.html
Note: For security reasons, you should not use Groovy System.xxxmethods, such as the System.getProperty() method.
To extend the transform function library and run the custom transformation script:
1. Create a directory for your custom transformation plug-ins:
mkdir /opt/custom_lib
This directory will also store any Java libraries that are imported by the Groovyscript.
2. In the custom plug-ins directory, create a Groovy script, such as theMyPlugin.groovy example shown above.
3. Package the Groovy script into a JAR with the jar cf command:
jar cf MyPlugin.jar MyPlugin.groovy
The Groovy script must be located at the root of the JAR. Any additional files usedby the script can also be included in the JAR.
4. Go to the $BDD_HOME/dataprocessing/edp_cli/config directory, and editthe sparkContext.properties file, to add thespark.executor.extraClassPath property pointing to the directory youcreated in Step 1.
Make sure you add an asterisk character at the end of the path to indicate that allJARs in the directory should be included.
The edited file should look like this example:
########################################################## Spark additional runtime properties, see# https://spark.apache.org/docs/1.0.0/configuration.html# for examples#########################################################spark.executor.extraClassPath=/opt/custom_lib/*
Note that if there already exists a spark.executor.extraClassPath propertyin the file, any libraries referenced by the property should be moved to thecustom_lib directory so they are still included in the Spark class path.
5. If you have a clustered (multi-node) Hadoop environment, repeat Steps 1-4 on eachnode that runs YARN. This ensures that your custom transformation script can beused regardless of which YARN node runs the transformation workflow.
Creating custom transformations
19-36 Studio User's Guide

6. Run the new plug-in in the Studio's Transform page:
a. Make sure the data set is present in the Transform page.
b. Open the Transformation Editor.
c. From the Functions menu, select the runExternalPlugin function.
d. In the function's signature, specify the name of the Groovy script (in quotes) andthe attribute to be processed. For example:
runExternalPlugin("MyPlugin.groovy", surveys)
e. In Configure Output Settings, configure either Apply to existing attribute orCreate New Attribute.
f. Click Add to Script. (Do not select Preview as previews do not work withcustom transformation scripts.)
g. Click Commit to Project.
After the transformation script is applied to the data set, the new or existingattribute should show in the new data set.
Exception handling and debuggingThese topics describe exception handling in Transform and show how to debugindividual transformations.
Script evaluationTransformation scripts are evaluated top-down on each input row. This means thateach transformation in the script is applied in order to the first input row, then againto the second row, and so on. This is illustrated by the following pseudo code:
for each input row R for each transform T R <- apply T to R
Additionally, each transformation can see the results of the transformations that ranbefore it. This is important to understand, as transformations within a script can bedependent on others. You should be aware of these dependencies when editingtransformations or rearranging their order within your script.
Dynamic typing vs. static typingThis topic is provided for reverence only as it explains the differences betweendynamic and static typing. Understanding the differences between dynamic and statictyping is key to understanding the way in which transformation script errors arehandled, and how it is different from the way Groovy handles errors. This will alsohelp you interpret errors created by your transformation script.
Note: It is important to know that the Groovy implementation within BigData Discovery enforces static typing. For information on exception handlingin Transform, which uses a static parser overriding Groovy's dynamic typingbehavior, see Exception handling and troubleshooting your scripts.
Creating custom transformations
Transforming Project Data Sets 19-37

There are two main differences between dynamic typing and static typing that youshould be aware of when writing transformation scripts.
First, dynamically-typed languages perform type checking at runtime, while staticallytyped languages perform type checking at compile time. This means that scriptswritten in dynamically-typed languages (like Groovy) can compile even if theycontain errors that will prevent the script from running properly (if at all). If a scriptwritten in a statically-typed language (such as Java) contains errors, it will fail tocompile until the errors have been fixed.
Second, statically-typed languages require you to declare the data types of yourvariables before you use them, while dynamically-typed languages do not. Considerthe two following code examples:
// Java exampleint num;num = 5;
// Groovy examplenum = 5
Both examples do the same thing: create a variable called num and assign it the value5. The difference lies in the first line of the Java example, int num;, which definesnum's data type as int. Java is statically-typed, so it expects its variables to be declaredbefore they can be assigned values. Groovy is dynamically-typed and determines itsvariables' data types based on their values, so this line is not required.
Dynamically-typed languages are more flexible and can save you time and spacewhen writing scripts. However, this can lead to issues at runtime. For example:
// Groovy examplenumber = 5numbr = (number + 15) / 2 // note the typo
The code above should create the variable number with a value of 5, then change itsvalue to 10 by adding 15 to it and dividing it by 2. However, number is misspelled atthe beginning of the second line. Because Groovy does not require you to declare yourvariables, it creates a new variable called numbr and assigns it the value numbershould have. This code will compile just fine, but may produce an error later on whenthe script tries to do something with number assuming its value is 10.
Exception handling and troubleshooting your scriptsTransform uses a static parser to override some of Groovy's dynamic typing behaviorand detect parsing errors, such as undefined variables, when you preview or saveyour transformations.
Important: Because the static parser forces Groovy to behave like a statically-typed language, you cannot use Groovy's dynamic typing features in yourtransformations. For example, while undeclared variables are normallyallowed in Groovy, they produce parsing errors in Transform.
The static parser also verifies that the attributes referenced directly in your scriptmatch those defined in your data set's schema. Any attributes that don't match (forexample, ones that are misspelled) produce an error.
Creating custom transformations
19-38 Studio User's Guide

Important: The static parser does not verify that parameters included in yourtransformation match their syntax as referenced in the row map of somecustom functions, such as enrichment functions. If you incorrectly reference aparameter from a function, your transformation script will not validate, butthe parser will not specify an error. Therefore, check the Transform APIReference (either in this document or in the Groovydoc), to verify that youcorrectly reference function parameters in the row map.
If you include attributes as variables in your transformation scripts, the format youuse for an attribute affects how it is handled by the static parser. For information aboutattribute formats, see Formats for variables.
If your transformation contains any parsing errors, Transform displays the resultingmessages in the Transformation Error dialog box when you preview or save thetransformation. Additionally, the Transformation Editor displays a red X icon next toeach line that contains an error. You can hover over these icons to view moreinformation about the error.
You should close the dialog box, fix the errors, then preview your transformationagain to verify that all errors have been fixed. You cannot save your transformation toyour script until it is free of errors.
Troubleshooting exceptions for set functions
You can run the following set functions from the Transform API only on multi-assignattributes (these attributes are known as multi-value attributes in Studio):
• cardinality()
• isSet()
• isEmpty()
• isMemberOf()
• toSet()
• toSingle()
These functions belong to the in-line transformations you can do in Transform. Theseset functions are applicable to sets of values on attributes that are multi-assign.
If you run any of these functions from Transform in Studio, and the attribute on whichyou attempt to run them is a single-assign (single-value) attribute, the Transform APImay throw NULL or an exception, depending on the Dgraph type of the attribute.
Note: You can check if an attribute is multi-value by looking at a data set inExplore, and selecting a table view. A column that will have more than asingle value in a cell indicates that this column represents a multi-valueattribute. You can also check the value of the Multi-Value column for yourdata set in Project Settings > Data Views.
To summarize, if you receive an exception when attempting to run a transformation,check if the attribute you run the transformation on is a single-value. In this case, settransformation functions do not apply.
Security exceptions
Creating custom transformations
Transforming Project Data Sets 19-39

If your transformation script contains any of the Groovy language features that are notsupported, the parser throws a security exception, which displays in theTransformation Error dialog box. Remove the code that caused the error.
For more information on the Groovy language features that can cause securityexceptions, see Groovy reserved keywords and unsupported functions.
Troubleshooting runtime exceptions
The static parser can't detect all errors, particularly runtime exceptions caused byanomalies in your data. Transform typically handles these errors by returning nullvalues for data it can't process.
If you want to know more about why your transformation script is producing nullvalues, you can wrap your code in a try block and set its output to a new temporaryattribute of type String (it will show up in your project's data set table as a newcolumn for an attribute of type String):
try { <transformation script> // replace this with your transformation script code 'OK' } catch (Exception ex) { ex.getMessage() }
When you preview the transformation script, any error messages it produces will beoutput to the temporary column of type String. Once you have debugged it, you candelete the try block and remove the temporary attribute.
Troubleshooting dateTime conversions
If you implicitly convert a dateTime object (that is, an mdex:dateTime attribute) to aString object, you might get a different result depending on where the cluster Sparkjob ran. In particular, the resulting time zone may not be what you expected.
For example, assume the following statements:
// mydatetime is an mdex:dateTime objectmydatetime = 1/1/1970 03:00:00 PM UTC// convert to mdex:string-set objectnew_set= toSet(mydatetime)
If you have a wide-spread cluster, you may not know where the job will be run. If thejob is run on a machine configured for the New York, NY time zone, the result will be"Jan 1, 1970 10:00:00 AM" because EST is 5 hours ahead of UTC. However, if the job isrun on a machine configured for the San Jose, CA time zone, the result will be "Jan 1,1970 07:00:00 AM".
If your intention is to use mydatetime as a string, it is best to explicitly convert it. Forexample:
new_set = toSet(toString(mydatetime,"MMM d, yyyy HH:mm:ss a","UTC"))
In this case, the time zone is specified by the user, instead of by the Spark node.
Transform loggingIf your transformation script fails to commit, you can learn more about the cause of thefailure by looking through the Data Processing logs.
Data Processing writes its logs to a user-specified directory on each Data Processingnode in the cluster. The default location is the $BDD_HOME/logs/edp directory.
Creating custom transformations
19-40 Studio User's Guide
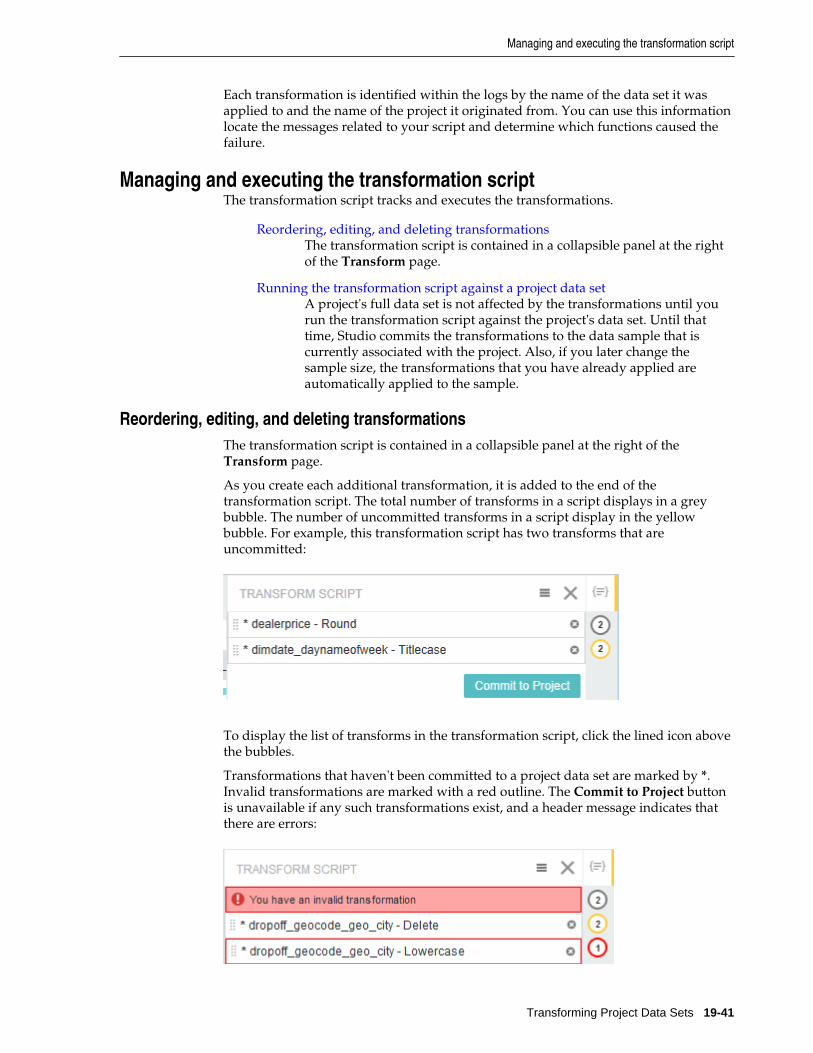
Each transformation is identified within the logs by the name of the data set it wasapplied to and the name of the project it originated from. You can use this informationlocate the messages related to your script and determine which functions caused thefailure.
Managing and executing the transformation scriptThe transformation script tracks and executes the transformations.
Reordering, editing, and deleting transformationsThe transformation script is contained in a collapsible panel at the rightof the Transform page.
Running the transformation script against a project data setA project's full data set is not affected by the transformations until yourun the transformation script against the project's data set. Until thattime, Studio commits the transformations to the data sample that iscurrently associated with the project. Also, if you later change thesample size, the transformations that you have already applied areautomatically applied to the sample.
Reordering, editing, and deleting transformationsThe transformation script is contained in a collapsible panel at the right of theTransform page.
As you create each additional transformation, it is added to the end of thetransformation script. The total number of transforms in a script displays in a greybubble. The number of uncommitted transforms in a script display in the yellowbubble. For example, this transformation script has two transforms that areuncommitted:
To display the list of transforms in the transformation script, click the lined icon abovethe bubbles.
Transformations that haven't been committed to a project data set are marked by *.Invalid transformations are marked with a red outline. The Commit to Project buttonis unavailable if any such transformations exist, and a header message indicates thatthere are errors:
Managing and executing the transformation script
Transforming Project Data Sets 19-41

From the Transform Script editor, you can:
• Change the order for committing transformations to the project.
The transformations are committed in the order they appear. To change the order,drag and drop individual transformations to a new location in the list.
• Edit individual transformations.
To edit a transformation, click its pencil icon, make the required changes to theGroovy code, and then click Save. Note that some Transforms do not have an editoption, as with the first two examples in the screenshot above.
• Delete individual transformations.
To delete a transformation, click its delete icon. Transform alerts you if you deletea transformation that other transformations are dependent on.
Running the transformation script against a project data setA project's full data set is not affected by the transformations until you run thetransformation script against the project's data set. Until that time, Studio commits thetransformations to the data sample that is currently associated with the project. Also, ifyou later change the sample size, the transformations that you have already appliedare automatically applied to the sample.
The transformed data set is only available within your project. The Commit operationdoes not add a new data set to the Catalog, nor does it modify the source data in Hive.
Note: Due to the way BDD converts Hive source table data types to its owndata types, applying your script to the project's data set may result in someomitted data types. For example, some complex Hive data types that do notmatch the Dgraph data types are omitted. For more information, see Data typeconversion.
To run the transformation script against the project data set:
1. In the Catalog, select a project.
2. Select Transform.
3. Expand the Transformation Script panel by clicking the grey bubble that indicatesthe project contains transforms that have not yet been committed.
4. Click Commit to Project.
Commit to Project runs the transformations against the project data set but does notmodify the underlying data set as it appears in the Catalog to other Studio users. Thismeans that other Studio users can explore the untransformed data set in the Catalog,and project users can explore the transformed data set.
If you want to run transformations and make them available to other Studio users,commit the transformations to the project, and then create a new data set. Theresulting new data set contains the transform changes and is available in the Catalog.See Creating a new data set from the transformed data.
Managing and executing the transformation script
19-42 Studio User's Guide

Creating a new data set from the transformed dataAfter running a transformation script, you can create a new data set in the Catalogbased on the transformed project data.
If you create a new data set, Studio runs the transformation script against the entiredata set, not just the data sample in the project, and Studio applies thetransformations, and enrichments to the new data set. A new sample is generated andthe data set is available in the Catalog.
Note: Due to the way BDD converts Hive source table data types to its owndata types, applying your script to the source data set may result in someomitted or modified data types. For example, some complex Hive data typesthat do not match the Dgraph data types are omitted. For more information,see Data type conversion.
To create a new data set from the transformed data:
1. Select Transform.
2. From the transformation script menu, select Create a Data Set.
For example:
3. In the Data Set Name field, type the name of the new data set.
4. If desired, provide any notes about the new data set in the Description field.
5. Optionally, expand Advanced Hadoop Options and specify a Hive table name. Bydefault, the Hive table name is the same as the data set name. If you create a dataset by the same name as an existing data set, you must specify a different Hivetable name. Studio maps the data set name to a unique table name.
6. Click Create Data Set.
(You can check the progress of this process by looking at the Oozie Web UI tool.)
After BDD finishes creating a new table in the Hive database and performing dataprocessing, the data set becomes available in the Catalog. If you do not see the newdata set in Catalog, then the script failed. You can learn more about why it failed bychecking the Data Processing logs. For more information, see Transform logging.
Creating a new data set from the transformed data
Transforming Project Data Sets 19-43

Sharing a transform scriptThe ability to publish and share scripts provides a useful starting point for otherprojects to build a transform script.
Publishing a transformation scriptYou can publish a transformation script to make it available for otherStudio users to load into projects and run against a project data set.
Loading a transformation scriptIf there are published transformation scripts available, you can loadthem into a project and run them against a similar project data set, or ifthe data sets are different, you can modify the script as necessary.
Un-publishing a transformation scriptIf you no longer want a published transformation script to be availablefor use in other project data sets, you can un-publish the script. Un-publishing does not remove the script from projects in which it waspreviously loaded.
Publishing a transformation scriptYou can publish a transformation script to make it available for other Studio users toload into projects and run against a project data set.
You do not have to apply a transformation script to a project data set beforepublishing it. You can create a transformation script and publish it at any time.
To publish a transformation script:
1. In the Catalog, select a project.
2. Select Transform.
3. Click the icon to view the transformation script.
For example:
4. From the transformation script menu, select Publish Script.
For example:
Sharing a transform script
19-44 Studio User's Guide

5. On the Publish Script dialog, provide a unique name for the script and an optionaldescription.
6. Click Publish Script.
Loading a transformation scriptIf there are published transformation scripts available, you can load them into aproject and run them against a similar project data set, or if the data sets are different,you can modify the script as necessary.
To load a transformation script:
1. In the Catalog, select a project.
2. Select Transform.
3. Click the icon to view the transformation script.
For example:
4. From the transformation script menu, select Load Script.
For example:
5. On the Load Script dialog, select the name of the script you want to load. Bydefault, you see all scripts that were created for the current data set.
You may need to deselect Filter to current data set in order to show all scripts thatare available to Studio.
Sharing a transform script
Transforming Project Data Sets 19-45

6. Click Append to append the script to the end of the existing transformation steps,or click Replace to overwrite the existing script.
The Replace option replaces the old script with a new script and also reverts anychanges that were committed using the old script. The revert operation effectivelyresets the data set to a point before any transforms were committed. You thencommit the new (replaced) script against the project data set.
Un-publishing a transformation scriptIf you no longer want a published transformation script to be available for use in otherproject data sets, you can un-publish the script. Un-publishing does not remove thescript from projects in which it was previously loaded.
To un-publish a transformation script:
1. Go to the Catalog and locate the data set associated with the published script.
2. Open the details pane for the data set.
3. Select the Script tab.
4. Click the x icon to remove the script from the data set.
Tips for better performanceThere are some simple things you can do while designing a transform script toimprove its overall performance.
• The Filter rows transform should be placed as early in the transform script aspossible.
• In a Join transform, the primary data set should be the largest data set.
Tips for better performance
19-46 Studio User's Guide
20Transform Function Reference
This section lists data types, discusses data type conversions that take place whentransformation scripts are applied, provides a list of reserved words and unsupportedfeatures of Groovy, and contains examples of custom transform function usage. It alsoincludes the reference documentation for the custom transform functions in Studio.
Use this section together with the Transform API Reference (generated Groovydocdocumentation for the custom functions).
Data typesIn transformation scripts, the attribute's data type is represented as aGroovy data type. This topic discusses how the Dgraph data typesmatch the Groovy data types.
Data type conversionsWhen you apply your transformation script to the project data set orclick Create a new data set from within Transform), the Data Processingcomponent converts most of the Hive data types to its correspondingDgraph data types. However, this can result in some of the original datatypes being changed or omitted. This topic discusses these data typeconversions in detail.
Groovy reserved keywords and unsupported functionsThis topic lists reserved keywords and those Groovy language featuresthat are not supported in Studio.
Conditional statements and multi-assign valuesThis section contains examples of transformations using conditionalstatements and multi-assign values.
List of transform functionsThis section lists and describes custom transform functions in Big DataDiscovery.
Data typesIn transformation scripts, the attribute's data type is represented as a Groovy datatype. This topic discusses how the Dgraph data types match the Groovy data types.
When you create a project based on a data set found in Catalog, this data set isindexed by Data Processing, and each attribute in the project's data set is assigned aDgraph data type (also known as the mdex:<type>). All Dgraph data types beginwith mdex:, and those used for multi-assign attributes end with -set. For moreinformation on Dgraph data types, see the Data Processing Guide.
In transformation scripts, Groovy data types are used, as described in the followingtable.
Transform Function Reference 20-1

When you commit your script, it outputs data with Groovy data types. These datatypes are then converted to the appropriate Dgraph data types when the data iswritten to a data set.
In addition to the settings shown in this table, the following two considerations apply:
• Multi-assign Dgraph attributes correspond to Set Groovy types. For example, aDgraph type mdex:int-set (which is a type used in the Dgraph for multi-assignattributes of type Integer), corresponds to a Java type set <integer>.
• Long data types are converted to Integer data types if they are small enough.
Groovy data type Corresponding mdex data types
Boolean mdex:boolean, mdex:boolean-set
Integer mdex:int, mdex:int-set
Long mdex:long, mdex:long-set
Double mdex:double, mdex:double-set
Date mdex:dateTime, mdex:dateTime-set, mdex:time, mdex:time-set
Geocode mdex:geocode, mdex:geocode-set
String mdex:String, mdex:String-set
Data type conversionsWhen you apply your transformation script to the project data set or click Create anew data set from within Transform), the Data Processing component converts mostof the Hive data types to its corresponding Dgraph data types. However, this canresult in some of the original data types being changed or omitted. This topic discussesthese data type conversions in detail.
For information on complex types in Hive tables, see https://cwiki.apache.org/confluence/display/Hive/LanguageManual+Types. The types that are present inyour source Hive tables depend on the Hadoop environment you use.
For information on which data types are supported by Big Data Discovery, see theData Processing Guide.
The following table describes how different Hive data types are affected bytransformation scripts. The table lists the data types the source Hive table can containand shows the data types in the Dgraph (mdex:<type>) to which they are converted.
Source Hive tabledata type (before thetransformation scriptis applied)
Dgraph data type Target Hive table data type (after thetransformation script is applied)
BOOLEAN mdex:boolean BOOLEAN
TINYINT mdex:long BIGINT; this type is converted to Longduring ingest.
SMALLINT mdex:long BIGINT ; this type is converted to Longduring ingest.
Data type conversions
20-2 Studio User's Guide

Source Hive tabledata type (before thetransformation scriptis applied)
Dgraph data type Target Hive table data type (after thetransformation script is applied)
INT mdex:long BIGINT; this type is converted to Longduring ingest.
BIGINT mdex:long BIGINT
FLOAT mdex:double DOUBLE
DOUBLE mdex:double DOUBLE
DECIMAL mdex:double DOUBLE ; this may result in loss ofprecision.
DATE mdex:dateTime TIMESTAMP
TIMESTAMP mdex:dateTime TIMESTAMP
STRING Discoveredmdex:<type>
STRING (or other primitive types)
CHAR Discoveredmdex:<type>
STRING (or other primitive types)
VARCHAR Discoveredmdex:<type>
STRING (or other primitive types)
ARRAY (complex) Multi-assign of theARRAY type. Forexample, for an ARRAYof decimals, it becomesa multi-assign attributeof mdex:double.
ARRAY (complex) of the types obtainedfrom the Dgraph type.
STRUCT (complex) None Multiple fields of this format:struct_(structName)_(fieldName)
BINARY None Unsupported; the entire field or column isomitted.
MAP (complex) None Unsupported; the entire field or column isomitted.
UNION (complex) None Unsupported; the entire field or column isomitted.
Groovy reserved keywords and unsupported functionsThis topic lists reserved keywords and those Groovy language features that are notsupported in Studio.
Reserved Keywords
Reserved keywords are words that have special meanings in Groovy language andtherefore cannot be used as variable or function names in Groovy scripts. Thefollowing table lists Groovy's reserved keywords:
abstract as assert
Groovy reserved keywords and unsupported functions
Transform Function Reference 20-3

boolean break byte
case catch char
class const continue
def default do
double else enum
extends false final
finally float for
goto if implements
import in instanceof
int interface long
native new null
package private protected
public return short
static strictfp super
switch synchronized this
threadsafe throw throws
transient true try
void volatile while
Additionally, the following keywords are reserved by the transform functions used inStudio:
DEFAULTLANG MILLISECONDS SECONDS
MINUTES HOURS DAYS
WEEKS MONTHS YEARS
DATEFORMAT_DEFAULT
Attributes with reserved keywords for names can only be referenced through the rowmap format; referencing them directly will produce an error. For more information onthe row map format, see Formats for variables.
Unsupported functions
For security reasons, Transform does not support all of Groovy's original classes. Forexample, System.xxx methods are not supported. Transformation scripts thatcontain methods of unsupported classes produce errors (such as Security Exceptionerror messages) and cannot be saved to the script in Studio.
You can use any of the functions listed in the Transformation Editor's Functions list,as well as functions from the following classes (other original Groovy functions are notsupported).
Groovy reserved keywords and unsupported functions
20-4 Studio User's Guide
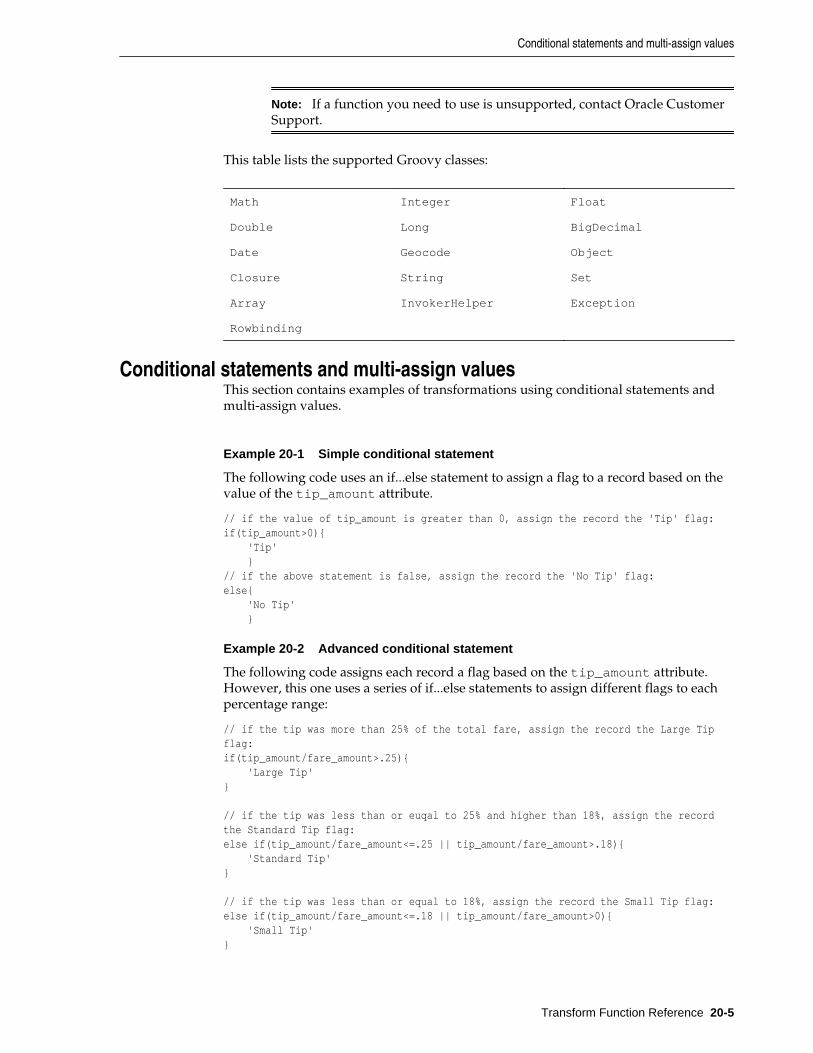
Note: If a function you need to use is unsupported, contact Oracle CustomerSupport.
This table lists the supported Groovy classes:
Math Integer Float
Double Long BigDecimal
Date Geocode Object
Closure String Set
Array InvokerHelper Exception
Rowbinding
Conditional statements and multi-assign valuesThis section contains examples of transformations using conditional statements andmulti-assign values.
Example 20-1 Simple conditional statement
The following code uses an if...else statement to assign a flag to a record based on thevalue of the tip_amount attribute.
// if the value of tip_amount is greater than 0, assign the record the 'Tip' flag:if(tip_amount>0){ 'Tip' }// if the above statement is false, assign the record the 'No Tip' flag: else{ 'No Tip' }
Example 20-2 Advanced conditional statement
The following code assigns each record a flag based on the tip_amount attribute.However, this one uses a series of if...else statements to assign different flags to eachpercentage range:
// if the tip was more than 25% of the total fare, assign the record the Large Tip flag:if(tip_amount/fare_amount>.25){ 'Large Tip'}
// if the tip was less than or euqal to 25% and higher than 18%, assign the record the Standard Tip flag:else if(tip_amount/fare_amount<=.25 || tip_amount/fare_amount>.18){ 'Standard Tip'}
// if the tip was less than or equal to 18%, assign the record the Small Tip flag: else if(tip_amount/fare_amount<=.18 || tip_amount/fare_amount>0){ 'Small Tip'}
Conditional statements and multi-assign values
Transform Function Reference 20-5

// if all of the above statements failed assign the record the No Tip flag:else{ 'No Tip'}
Example 20-3 Advanced conditional statement using a variable
This example performs the same operation as the previous example, but uses avariable to store the tip percentage rather than calculating it in each statement.
// calculate the tip percentage and assign it to PercentageTipdef PercentageTip = tip_amount/fare_amount
// if the value of PercentTip is greater than .25 (25%),// assign the record the Large Tip flagif(PercentTip>.25){ 'Large Tip'}
// if the value of PercentTip is less than or equal to .25 and higher than .18// assign the record the Standard Tip flagelse if(PercentTip<=.25 && PercentTip>.18){ 'Standard Tip'}
// if the value of PercentTip is less than or equal to .18 and higher than 0// assign the record the Small Tip flagelse if(PercentTip<=.18 && PercentTip>0){ 'Small Tip'}
// if all of the above statements failed assign the record the No Tip flagelse{ 'No Tip'}
Example 20-4 Advanced conditional statement using date logic
The following code uses a series of else...if statements to create a multi-assign value. Ituses the diffDatesWithPrecision function to calculate the amount of timebetween the current date and the attribute dropoff_datetime in days. It thenassigns the record a list of String values that specify the different ranges of time it fallsinto.
if(diffDates(dropoff_datetime,today(),'days',true)<=30){ toSet('Last 30 Days','Last 90 Days','Last 180 Days')}else if(diffDates(dropoff_datetime,today(),'days',true)<=90){ toSet('Last 90 Days','Last 180 Days')}else if(diffDates(dropoff_datetime,today(),'days',true)<=180){ toSet('Last 180 Days')}else{ toSet('Greater than 180 Days')}
Example 20-5 Examples with multi-assign values
The following examples demonstrate how to work with multi-assign values.
Conditional statements and multi-assign values
20-6 Studio User's Guide

This example takes a multi-assign attribute named ItemColor and usestoUpperCase function to convert its values to upper case:
ItemColor.collect{toUpperCase(it)}
The following code iterates through the values in a multi-assign attribute calledMedalsAwarded and adds a specific number of points for each type of medal it findsto the variable MedalValue. It then returns MedalValue, which contains the totalnumber of points awarded for each medal in the attribute.
def MedalValue=0
for (int i in 0..cardinality(MedalsAwarded)-1) { if(indexOf(MedalsAwarded[i],'Gold')>=0){ MedalValue=MedalValue+3; } else if(indexOf(MedalsAwarded[i],'Silver')>=0){ MedalValue=MedalValue+2; } else if(indexOf(MedalsAwarded[i],'Bronze')>=0){ MedalValue=MedalValue+1; }}MedalValue
For example, if MedalsAwarded['Gold','Silver','Gold'], the final value ofMedalValue would be 8.
Here is another option for iterating through the values in a multi-assign attribute:
def MedalValue=0
for (x in MedalsAwarded) { if(indexOf(x,'Gold')>=0){ MedalValue=MedalValue+3; } else if(indexOf(x,'Silver')>=0){ MedalValue=MedalValue+2; } else if(indexOf(x,'Bronze')>=0){ MedalValue=MedalValue+1; }}MedalValue
Example 20-6 Multi-assign value operations using method chaining
The following code iterates through a multi-assign attribute called PartIdentifierand replaces its identification numbers with X to mask them.
PartIdentifier.{collect(trim(replace(substring(it,1,10),'[0-9]','X')))}
The above example uses method chaining to perform a number of operations on thevalues of PartIdentifier in a single statement. The first part of the statement,PartIdentifier.collect calls the collect method on the PartIdentifierattribute. collect runs the code in the outermost set of parentheses on each of thevalues in the PartIdentifier multi-assign attribute.
collect first calls the substring method, which returns the substring of the Stringit, defined by the character in position 1 through position 10, where it is the implicitGroovy variable ranging over the numbers of PartIdentifier.
Conditional statements and multi-assign values
Transform Function Reference 20-7

This substring is passed to the replace method, which replaces all numericcharacters ('[0-9]') with X. The trim method then takes the masked String andremoves all leading and trailing whitespace from it.
List of transform functionsThis section lists and describes custom transform functions in Big Data Discovery.
Conversion functionsConversion functions change a value from one data type to another.
Date functionsDate functions perform actions on Date objects, such as obtaining themonth information from a specific date or adding time to a date.
Enrichment functionsEnrichment functions are based on Data Enrichment modules used aspart of data processing in Big Data Discovery. You can use thesefunctions to extract meaningful information from your data and modifyattributes to make them more useful for analysis.
Geocode functionsGeocode functions perform different actions on Geocode objects, such ascalculating the distance between two Geocode values or obtaining aGeocode's latitude coordinate.
Math functionsMath functions perform mathematical operations on your data.
Set functionsSet functions perform various functions on values for multi-assignattributes, such as obtaining the size of the set, checking whether a set isempty, or converting an attribute from a multi-value to a single-valueattribute.
String functionsString functions perform different actions on Strings, such asconverting an entire String to uppercase or removing whitespace from aString.
URL functionsThe URL functions return parts of a specific URL, such as the host nameused in the URL.
Conversion functionsConversion functions change a value from one data type to another.
This table describes the conversion functions that Transform supports. The samefunctions are described in the Transform API Reference (Groovydoc).
These functions rely on the Java dateFormat: http://docs.oracle.com/javase/7/docs/api/java/text/SimpleDateFormat.html.
List of transform functions
20-8 Studio User's Guide

User Function Return DataType
Description
toBoolean(Number n) Boolean Converts a number to a Boolean value. Forexample, toBoolean(1) evaluates totrue. Note that only 0 evaluates tofalse. Any number other than 0(including negative numbers) evaluates totrue.
toBoolean(String s) Boolean Converts a String to a Boolean value. Forexample, toBoolean("yes") returnsfalse. Note that this method onlyevaluates to true if the String is "true".Capitalization is ignored, so "true","TRUE", and "tRuE" are all true.
toBoolean(Boolean b) Boolean Converts a Boolean to a Boolean value. Forexample, toBoolean("FALSE") returnsfalse.
toDouble(Boolean b)
toDouble(Number n)
toDouble(String s)
Double Converts a Boolean, Number, or String toa Double.
toLong(Boolean b)
toLong(Date d)
toLong(Double d)
Long Converts a Boolean, Date, or Double to aLong.
toLong(String s) Long Converts a String representation of a longto a Long. For example,toBoolean("123") returns 123. InvalidStrings (for example, one that containsletters) return null.
toString(Object arg) String Converts an Object of any data type to aString.
Date functionsDate functions perform actions on Date objects, such as obtaining the monthinformation from a specific date or adding time to a date.
This table describes the Date functions that Transform supports. The same functionsare described in the Transform API Reference (Groovydoc).
Date formats adhere to the SimpleDateFormat class in Java. For information onSimpleDateFormat class, see: http://docs.oracle.com/javase/7/docs/api/java/text/SimpleDateFormat.html.
List of transform functions
Transform Function Reference 20-9

User Function ReturnDataType
Description
addTime(Dateattribute,IntegertimeToAdd,String timeUnit)
Date Adds time to a Date object. The time unit used must beone of the following constants:• MILLISECONDS
• SECONDS
• MINUTES
• HOURS
• DAYS
• WEEKS
• MONTHS
• YEARS
diffDates(DatefirstDate, DatesecondDate,String timeUnit,BooleanprecisionFlag)
Double Calculates the difference between two dates as a long ina specific time unit. The time unit must be one of thefollowing constants:• MILLISECONDS
• SECONDS
• MINUTES
• HOURS
• DAYS
• WEEKS
• MONTHS
• YEARS
The precisionFlag optional parameter specifieswhether to get the difference with a millisecondprecision. If not used, it defaults to false.
getDayOfMonth(Date attribute,String timeZone,String locale)
Integer Returns a day-of-month value for the Date. You canspecify a time zone and locale as optional parameters;the defaults are null and "en", respectively.
getDayOfWeek(Date attribute,String timeZone,String locale)
Integer Returns a day-of-week value for the Date. You canspecify a time zone and locale as optional parameters;the defaults are null and "en", respectively.
getDayOfYear(Date attribute,String timeZone,String locale)
Integer Returns a day-of-year value for the Date. You canspecify a time zone and locale as optional parameters;the defaults are null and "en", respectively.
getHour(Dateattribute,String timeZone,String locale)
Integer Returns an hour value for the Date. You can specify atime zone and locale as optional parameters; thedefaults are null and "en", respectively.
getMilliSecond(Date attribute,String timeZone,String locale)
Long Returns a millisecond value for the Date, based on atime zone and locale parameters that you specify. Thedefaults are null and "en", respectively.
getMinute(Dateattribute,String timeZone,String lcoale)
Integer Returns a minute value for the Date. You can specify atime zone and locale as optional parameters; thedefaults are null and "en", respectively.
List of transform functions
20-10 Studio User's Guide

User Function ReturnDataType
Description
getMonth(Dateattribute,String timeZone,String locale)
Integer Returns a month value for the Date. You can specify atime zone and locale as optional parameters; thedefaults are null and "en", respectively.
getSeconds(Dateattribute,String timeZone,String locale)
Long Returns a seconds value for the Date. You can specify atime zone and locale as optional parameters; thedefaults are null and "en", respectively.
getYear(Dateattribute,String timeZone,String locale)
Integer Returns a year value for the Date. You can specify a timezone and locale as optional parameters; the defaults arenull and "en", respectively.
isDate(Stringattribute,StringdateFormat)
Boolean Determines whether a String is a valid Date value with aspecific format.
toDate(LongepochDate)
Date Converts a Long to a Date object.
toDate(Stringattribute,StringdateFormat),String timeZone,String locale
Date Converts a String to a Date object using a specific dateformat. You can specify a time zone and locale asoptional parameters; the defaults are null and "en",respectively. Invalid date Strings return null.
today(StringtimeZone, Stringlocale)
Date Returns the current date. You can specify a time zoneand locale as optional parameters; the defaults are nulland "en", respectively.
toString(Datedate, StringdateFormat,String locale)
String Converts a Date to a String. You must specify the Date'sformat and a locale, which default toDATEFORMAT_DEFAULT and "en", respectively.
truncateDate(Date date, StringtimeUnit)
Date Truncates a Date based on a given time unit. The timeunit used must be one of the following constants:• MILLISECONDS
• SECONDS
• MINUTES
• HOURS
• DAYS
• WEEKS
• MONTHS
• YEARS
For example,truncateDate((toDate("2015/03/3121:34:56")),MONTHS) returns 2015-03-0100:00:00 UTC.
Date constants
List of transform functions
Transform Function Reference 20-11

Date constants define the default Date format and the time units that can be passed toDate functions.
This table describes the Date constants that Transform supports.
Constant Name Data Type Description
DATEFORMAT_DEFAUL
T
Object Defines the default Date format: "yyyy/MM/ddHH:mm:ss"
DAYS Object Defines the constant for days: "days"
HOURS Object Defines the constant for hours: "hours"
MILLISECONDS Object Defines the constant for milliseconds:"milliseconds"
MINUTES Object Defines the constant for minutes: "minutes"
MONTHS Object Defines the constant for months: "months"
SECONDS Object Defines the constant for seconds: "seconds"
WEEKS Object Defines the constant for weeks: "weeks"
YEARS Object Defines the constant for years: "years"
Example 20-7 Date extracting example
This example pulls out the year-month.
toString(pickup_datetime, 'yyyy-MM')
Example 20-8 Date calculation example
The following code uses the diffDates function to calculate the number of days topickup_datetime:
diffDates(today(),pickup_datetime,DAYS,true)
today() obtains the current date, pickup_datetime is the pickup date, DAYSspecifies the time unit in which to return the result, and true specifies that thedifference be calculated with precision.
Example 20-9 toDate examples
This example first uses the toLong function to convert a String to a Long and thenuses the result as the input to the toDate function:
toDate(toLong("1240596879"))
The following are some sample date formats for the toDate function:
toDate(date_String,'EEE MM/DD/YYYY hh:mm:ss a')toDate(date_String,'EEE MM/DD/YYYY hh:mm:ss a','EST')toDate(date_String,'EEE MM/DD/YYYY hh:mm:ss a','Etc/GMT-10')toDate(date_String,'EEE MM/DD/YYYY hh:mm:ss a','Etc/Universal','en'))toDate(date_String,'EEE MM/DD/YYYY hh:mm:ss a','GMT0','de'))toDate(date_String,DATEFORMAT_DEFAULT)toDate(date_String,DATEFORMAT_DEFAULT,'EST')toDate(date_String,DATEFORMAT_DEFAULT,'Etc/GMT-10')
List of transform functions
20-12 Studio User's Guide

Enrichment functionsEnrichment functions are based on Data Enrichment modules used as part of dataprocessing in Big Data Discovery. You can use these functions to extract meaningfulinformation from your data and modify attributes to make them more useful foranalysis.
The same functions are described in the Transform API Reference (Groovydoc).
More information on the Data Enrichment modules is available in the Data ProcessingGuide.
Transform supports the following enrichment functions:
• detectLanguage
• extractKeyPhrases
• extractNounGroups
• extractWhiteListTags
• geotagIPAddress
• geotagIPAddressGetGeocode
• geotagStructuredAddress
• geotagUnstructuredAddress
• geotagUnstructuredAddressGetGeocode
• getEntities
• getSentiment
• getTermSentiment
• reverseGeotag
• runExternalPlugin
• stripTagsFromHTML
• toPhoneticHash
detectLanguage
Finds the language of a given String attribute and returns an Oracle language code (forexample, es for Spanish). For accurate results, the text should contain at least tenwords.
The syntax is:
detectLanguage(String attribute)
where:
• attribute is the String attribute on which to perform language detection.
The results are returned in a single-assign attribute.
List of transform functions
Transform Function Reference 20-13
Example:
detectLanguage(labor_description)
might return "en" for the labor_description String attribute.
extractKeyPhrases
Extracts key phrases from a String attribute and returns a list of phrases in a multi-assign attribute. The function calculates key phrases using the TF/IDF algorithm,which takes the total number of times each term appears within the String and offsetsthat value by the number of times it appears within a larger body of work. Offsettingthe value helps filter out frequently-used terms like "the" and "it". The body of workused as the control is selected internally based on the String's language; for example,the model used for English is based on a New York Times corpus. TheextractKeyPhrases function is a wrapper function for the TF/IDF Term extractorenrichment module.
The number of key phrases returned by extractKeyPhrases is a function of theTF/IDF curve. By default, it stops returning terms when the score of a given term fallsbelow ~68%.
The syntax is:
extractKeyPhrases(String attribute, String languageCode, Boolean smartCasing)
where:
• attribute is a String attribute that is to be processed. It is recommended that youconvert the text to lowercase first, especially if it is in all caps.
• languageCode is an optional String parameter that specifies the language nameor code (for example "en", "English", "German") to improve accuracy. Supportedlanguages are English (UK/US), Portuguese (Brazilian), Spanish, French, German,and Italian. When specified, it forces the function to use a model specific to thatlanguage. When not specified, or when passed as null (this is the default), thefunction will automatically detect the language model. Throws an error if a non-supported language is specified.
• smartCasing is an optional parameter that, when set to true, specifies that thefunction automatically handle documents that are predominantly in either title caseor upper case. If this parameter is not used, it defaults to true.
Examples:
extractKeyPhrases(toLowerCase(comments))
extractKeyPhrases(surveys, 'en', true)
When you create a new attribute as a result of using this function, make sure theattribute is of type multi-assign.
extractNounGroups
Returns a String containing noun groups. A noun group is any noun, such as "movie"or "building". This is a wrapper function for the Noun Group Extractor enrichmentmodule. This module finds and returns noun groups from a String attribute in each ofthe supported languages. It is used in tag cloud visualization, for finding commonlyoccurring themes in the data.
List of transform functions
20-14 Studio User's Guide

The syntax is:
extractNounGroups(String attribute, String languageCode)
where:
• attribute is the String attribute to be processed.
• languageCode is an optional parameter that specifies the language name or code(for example "en", "English", "German") to improve accuracy. Supported languagesare English (UK/US), Spanish, French, German, and Italian. When specified, itforces the function to use a model specific to that language. When not specified, orwhen passed as null (this is the default), the function will automatically detect thelanguage model. Throws an error if a non-supported language is specified.
Example:
extractNounGroups(labor_description, 'en')
would return nouns (such as "Battery" or "Mass Air Flow Sensor") for thelabor_description String attribute.
When you create a new attribute as a result of using this function, make sure theattribute is of type multi-assign.
extractWhiteListTags
Uses a dictionary-matching algorithm that locates elements of a finite set of Strings(the whitelist) within input text. The function finds all occurrences of any whitelistterms and returns a list of matching expansions. The input text is matched against awhitelist. A whitelist is newline-delimited. This is a wrapper function for the WhitelistTagger enrichment module.
Each line may be either a comment (indicated with a # as the first character), or amatching directive comprised of either one or two values (separated by thedelimiter character). The second value is used to rewrite the match output.
Here is a simple example whitelist:
• helium
• neon
• argon
• krypton
• xenon
• radon
It could be rewritten as follows, with a forward slash (/) as the delimiter:
• helium/He
• neon/Ne
• argon/Ar
• krypton/Kr
• xenon/Xe
List of transform functions
Transform Function Reference 20-15

• radon/Rn
When this whitelist is run on the text "The only noble gas is radon", it would producean output list of ['Rn']
The syntax is:
extractWhiteListTags(String attribute, String whitelist, String languageCode, boolean caseSensitive, boolean matchWholeWords, String delimiter)
where:
• attribute is the String attribute to process.
• whitelist is a document containing whitelisted entries. This should be a plaintext file containing a newline-delimited list of literals and configuration terms.
• languageCode is an optional String parameter that specifies the String's languageto improve accuracy. Set to English by default. Supported languages arewhitespace-delimited languages only.
• caseSensitive is an optional Boolean parameter that indicates whether input iscase-sensitive (the default is false).
• matchWholeWords is an optional Boolean parameter that indicates whether tomatch whole words only (when set to false, which is the default), or parts ofwords (when set to true). Ensures that "red" does not match "reduce".
• delimiter is an optional String parameter that specifies the delimiter characterused to parse a whitelist entry into the "match" and "output" values. The TABcharacter (\t) is the default. Note that each whitelist entry can use only onedelimiter (all delimiters after the first one are ignored).
Note that what the delimiter character does is to separate a whitelist entry into itsmatch and output values, as in these examples:
delimiter=','Rn,86Ne,10He,2
delimiter='/'Rn/86Ne/10He/2
no delimiter specified (uses the default <tab> character)Rn<tab>86Ne<tab>10He<tab>2
In this extractWhiteListTags example, the first line defines a whitelist namedtagList, the second line defines a document, and the thire line uses theextractWhiteListTags Transform enrichment function, which first matches theinput text against the specified whitelist. Next, finds and extracts all occurrences ofany terms listed in the whitelist (in English), as WhitelistTags, and then returns alist of matching expansions:
def whitelist = '''helium/Heneon/Ne
List of transform functions
20-16 Studio User's Guide

argon/Arkrypton/Krxenon/Xeradon/Rn'''def document = 'The noble gases make a group of chemical elements with similar properties: under standard conditions, they are all odorless, colorless, monatomic gases with very low chemical reactivity. The six noble gases that occur naturally are helium (He), neon (Ne), argon (Ar), krypton (Kr), xenon (Xe), and the radioactive RADON (Rn).'
extractWhitelistTags(document, whitelist, 'en', false, true, '/')
Note that the language specified is English (en), the matches are not case-sensitive(false), and unbounded, thus match the whole words only (false). The '/' delimiteris used for parsing the whitelist.
geotagIPAddress
Converts an IP address to a Geocode String address according to the admin level.Administrative divisions vary depending on the country, so the returned values maybe different than expected. This is a wrapper function for the IP Address GeoTaggerdata enrichment module.
The syntax is:
geotagIPAddress(String IPAddress, String adminLevel)
where:
• IPAddress is a valid IP address to process, in type String.
• adminLevel is an optional String parameter that specifies an administrativedivision to return. This can be set to only one of the following constant or literalvalues (case-sensitive):
– ADMIN_LEVEL_CITY or 'City' for a city match.
– ADMIN_LEVEL_COUNTRY or 'Country' for a country match.
– ADMIN_LEVEL_REGION or 'Region' for a region match, such as a state in theUnited States.
– ADMIN_LEVEL_REGIONID or 'RegionID' for the ID of the region in theGeoNames database, such as "6254926" for Massachusetts.
– ADMIN_LEVEL_SUBREGION or 'SubRegion' for a sub-region match, such as acounty in the United States.
– ADMIN_LEVEL_SUBREGIONID or 'SubRegionID' for the ID of the sub-regionin the GeoNames database, such as "4943909" for Middlesex County inMassachusetts.
– ADMIN_LEVEL_POSTCODE or 'Postcode' for a postal code, such as a zip codein the US.
The returned data types for the adminLevel are:
List of transform functions
Transform Function Reference 20-17

• String for adminLevel = City, Country, Postcode, Region, SubRegion, RegionID,SubRegionID
• Geocode for adminLevel = Geocode
Examples:
geotagIPAddress('148.86.25.54', 'City')
geotagIPAddress('148.86.25.54', ADMIN_LEVEL_CITY)
Both examples return "New York City" as a single-assign string attribute.
geotagIPAddressGetGeocode
Converts an IP address to a Geocode and returns its geocode field as an Object. Thisis a wrapper function for the IP Address GeoTagger data enrichment module thatreturns a single attribute as a Geocode type.
The syntax is:
geotagIPAddressGetGeocode(String IPAddress)
where:
• IPAddress is a valid IP address to process, in type String.
Example:
geotagIPAddressGetGeocode('148.86.25.54')
Returns a geocode of "40.714270 -74.005970" as a single-assign Geocode attribute.
geotagStructuredAddress
Geotags an address, based on structured fields.
The syntax is:
geotagStructuredAddress(String country, String region, String subregion, String city, String postcode, Boolean returnByPopulation, String adminLevel)
where:
• country is the field for the country of the address (use null when unknown).
• region is the field for the region of the address (use null when unknown). Aregion would be a state in the US.
• subregion is the field for the sub-region of the address (use null when unknown).A sub-region would be a country in the US.
• city is the field for the city of the address (use null when unknown).
• postcode is the field for the postal code of the address (use null when unknown).A postal code would be a zip code in the US.
• returnByPopulation is an optional Boolean parameter that, if set to true,returns the location with largest population. The default is false.
List of transform functions
20-18 Studio User's Guide

• adminLevel is an optional String parameter that specifies a specific field to return.This can be set to only one of the following constant or literal values (case-sensitive):
– ADMIN_LEVEL_CITY or 'City' returns the city of the address.
– ADMIN_LEVEL_COUNTRY or 'Country' returns the country of the address.
– ADMIN_LEVEL_REGION or 'Region' returns the region of the address, such asa state in the United States.
– ADMIN_LEVEL_REGIONID or 'RegionID' returns the ID of the region in theGeoNames database, such as "6254926" for Massachusetts.
– ADMIN_LEVEL_SUBREGION or 'SubRegion' returns the sub-region of theaddress, such as a county in the United States.
– ADMIN_LEVEL_SUBREGIONID or 'SubRegionID' returns the ID of the sub-region in the GeoNames database, such as "4952349" for Suffolk Country inMassachusetts.
– ADMIN_LEVEL_POSTCODE or 'Postcode' returns the postal code of theaddress.
– ADMIN_LEVEL_GEOCODE or 'Geocode' returns the geocode of the leasthierarchical administrative level. This is the default.
Note that the adminLevel parameter is the only optional parameter and therefore isthe only parameter that can be omitted. All other parameters must be specified, eitherwith a value or as null.
The function returns the value requested by the adminLevel parameter. The returneddata types for the adminLevel are:
• String for adminLevel = City, Country, Postcode, Region, SubRegion, RegionID,SubRegionID
• Geocode for adminLevel = Geocode
If the address resolves to a number of locations and returnByPopulation is true,the function will pick the location with the largest population and then return itsgeocode.
Example 1:
// Get the geocode for San Francisco in the US and return the location with the largest population.geotagStructuredAddress( 'us', null, null, 'san francisco', null, true, 'Geocode')
Returns "39.76 -98.5" (the geocode of San Francisco, California).
Example 2:
// Get the region (state in the US) in which the Boston with the highest population is located.geotagStructuredAddress('us', '', '', 'boston', '', true, 'Region')
Returns "Massachusetts" (because Boston, Massachusetts has the largest population ofall the Boston locations in the US).
List of transform functions
Transform Function Reference 20-19
geotagUnstructuredAddress
Converts a valid address in a String attribute to a Geocode String address according tothe admin level. Administrative divisions vary depending on the country, so thereturned values may be different than expected.
This is a wrapper function for the Address GeoTagger data enrichment module. Itadds a multi-assign attribute (column) to your data set that contains the Geocodeaddress.
The syntax is:
geotagUnstructuredAddress(String addressText, String adminLevel, String addressGrain, Boolean validateAddress)
where:
• addressText is the address String to process. This must be less than or equal to350 characters.
• adminLevel is an optional String parameter that specifies an administrativedivision to return. This can be set to only one of the following constant or literalvalues (case-sensitive):
– ADMIN_LEVEL_CITY or 'City' for a city match.
– ADMIN_LEVEL_COUNTRY or 'Country' for a country match.
– ADMIN_LEVEL_REGION or 'Region' for a region match, such as a state in theUnited States.
– ADMIN_LEVEL_REGIONID or 'RegionID' for the ID of the region in theGeoNames database, such as "6254926" for Massachusetts.
– ADMIN_LEVEL_SUBREGION or 'SubRegion' for a sub-region match, such as acounty in the United States.
– ADMIN_LEVEL_SUBREGIONID or 'SubRegionID' for the ID of the sub-regionin the GeoNames database, such as "4943909" for Middlesex County inMassachusetts.
– ADMIN_LEVEL_POSTCODE or 'Postcode' for a postal code, such as a zip codein the US.
• addressGrain is an optional String parameter that specifies an administrativedivision to help the GeoTagger find the most likely match for a given level. Thiscan be set to only one of the following constant or literal values (case-sensitive):
– ADMIN_LEVEL_CITY or 'City' for a city match.
– ADMIN_LEVEL_COUNTRY or 'Country' for a country match.
– ADMIN_LEVEL_REGION or 'Region' for a region match.
– ADMIN_LEVEL_SUBREGION or 'SubRegion' for a sub-region match.
– ADMIN_LEVEL_NONE or 'None' returns the most populous location that mostclosely matches the address String. This is the default value.
• validateAddress is an optional Boolean parameter that specifies whether theGeoTagger should validate the address.
List of transform functions
20-20 Studio User's Guide

The returned data types for the adminLevel are:
• String for adminLevel = City, Country, Postcode, Region, SubRegion, RegionID,SubRegionID
• Geocode for adminLevel = Geocode
The following example shows how to retrieve Geocode addresses for country namesin the "countries" String attribute:
geotagUnstructuredAddress(countries, 'Country', , true, 'en')geotagUnstructuredAddress('New York, NY 10029', 'Region', 'SubRegion', false)
geotagUnstructuredAddressGetGeocode
Converts an IP address to a Geocode and returns its geocode field as an Object. Thisis a wrapper function for the Address GeoTagger module.
The syntax is:
geotagUnstructuredAddressGetGeocode(String addressText, String addressGrain, Boolean validateAddress)
where:
• addressText is the address String to process. This must be less than or equal to350 characters.
• addressGrain is an optional String parameter that helps the GeoTagger to findthe most likely match for a given level. This can be set to only one of the followingvalues (case-insensitive):
– ADMIN_LEVEL_CITY or 'City' for a city match.
– ADMIN_LEVEL_COUNTRY or 'Country' for a country match.
– ADMIN_LEVEL_REGION or 'Region' for a region match, such as a state in theUnited States.
– ADMIN_LEVEL_SUBREGION or 'SubRegion' for a sub-region match, such as acounty in the United States.
– ADMIN_LEVEL_NONE or 'None' returns the most populous location that mostclosely matches the address String. This is the default value.
• validateAddress is an optional Boolean parameter that specifies whether theGeoTagger should validate the address.
Examples:
geotagUnstructuredAddressGetGeocode(cities, ADMIN_LEVEL_CITY, false)
geotagUnstructuredAddressGetGeocode(cities, 'City', false)
getEntities
Returns all entities, of a specified type, from an input String attribute. The entities arereturned as a list of Strings. This function creates a new multi-assign column in yourdata set for the entity results. This is a wrapper function for the Named EntityRecognition extractor module. Supports only English input text.
The syntax is:
List of transform functions
Transform Function Reference 20-21

getEntities(String attribute, String entityType)
where:
• attribute specifies the String attribute that is to be processed.
• entityType is a String parameter that specifies the type of entity to extract. Youcan specify only one of the following constant or literal values (case-sensitive):
– ENTITY_TYPE_PERSON or 'Person' returns all the person entities found inthe attribute.
– ENTITY_TYPE_ORGANIZATION or 'Organization' returns all theorganization entities found in the attribute.
– ENTITY_TYPE_LOCATION or 'Location' returns all the location entitiesfound in the attribute. Location entities are names of places, such as "Boston" or"Canada".
Examples:
getEntities(claims, ENTITY_TYPE_LOCATION)
getEntities(reviews, 'Person')
getSentiment
Returns a String containing the overall sentiment of a String attribute. The attribute'ssentiment can be one of the following:
• POSITIVE
• NEGATIVE
This is a wrapper function for the Sentiment Analysis (document level) dataenrichment module.
The syntax is:
getSentiment(String textAttribute, String languageCode)
where:
• attribute specifies the String attribute that is to be processed.
• languageCode is an optional parameter that specifies the language name or code(for example "en", "English", "German") to improve accuracy. Supported languagesare English (UK/US), Spanish, French, German, and Italian. When specified, itforces the function to use a model specific to that language. When not specified, orwhen passed as null (this is the default), the function will automatically detect thelanguage model. Throws an error if a non-supported language is specified.
Example:
getSentiment(comments, 'English')
In the example, "comments" is a String attribute.
List of transform functions
20-22 Studio User's Guide

getTermSentiment
Extracts phrases in sentences that have a positive or negative sentiment. The functioncall will specify the type of phrases to be extracted and which type of sentiment. A listof the desired terms (as Strings) is returned.
The syntax is:
getTermSentiment(String textAttribute, String termAttribute, String sentimentCategory, String languageCode)
where:
• textAttribute is the String attribute to process.
• termAttribute is a String parameter that specifies the type of terms to extract,based on their sentiment (as set by the sentimentCategory argument). You canspecify only one of the following values (case-sensitive) for the term type:
– ENTITY_TYPE_PERSON or 'Person' locates passages that contain personentities and returns the sentiment of those passages.
– ENTITY_TYPE_ORGANIZATION or 'Organization' locates passages thatcontain organization entities and returns the sentiment of those passages.
– ENTITY_TYPE_LOCATION or 'Location' locates passages that containlocation entities and returns the sentiment of those passages.
– NOUN_GROUPS or 'NounGroups' extracts noun groups in sentences, based ontheir specified sentiment.
– KEY_PHRASES or 'KeyPhrases' extracts key phrases in sentences, based ontheir specified sentiment.
• sentimentCategory is specifies the type of sentiment to be considered for theterms. You can specify SENTIMENT_POSITIVE (or 'Positive') for negative forpositive sentiment or SENTIMENT_NEGATIVE (or 'Negative') for negativesentiment. All values are case-sensitive.
• languageCode. An optional parameter that specifies the language name or code(for example "en", "English", "German") to improve accuracy. Supported languagesare English (UK/US), Spanish, French, German, and Italian. When specified itforces the function to use a model specific to that language. When not specified, orwhen passed as null (this is the default), the function will automatically detect thelanguage model. Throws an error if a non-supported language is specified.
Examples:
getTermSentiment(comments, 'KeyPhrases', 'Positive')getTermSentiment(comments, KEY_PHRASES, SENTIMENT_POSITIVE)
getTermSentiment(companies, 'Organization', 'Negative')getTermSentiment(companies, ENTITY_TYPE_ORGANIZATION, SENTIMENT_NEGATIVE)
getTermSentiment(reviews, 'NounGroups', 'Positive')getTermSentiment(reviews, NOUN_GROUPS, SENTIMENT_POSITIVE)
reverseGeotag
Returns the geocode address for a specified administrative division. Searches for theadministrative division within the specified radius from the entered Geocode. This is a
List of transform functions
Transform Function Reference 20-23

wrapper function for the Reverse GeoTagger data enrichment module that returns asingle value.
The syntax is:
reverseGeotag(Geocode geoAttribute, String adminLevel, Double proximityThreshold)
where:
• geoAttribute is the Geocode to process.
• adminLevel is String parameter that specifies an administrative division toreturn. This can be set to only one of these constant or literal values (case-sensitive):
– ADMIN_LEVEL_CITY or 'City' for a city match.
– ADMIN_LEVEL_COUNTRY or 'Country' for a country match.
– ADMIN_LEVEL_REGION or 'Region' for a region match, such as a state in theUnited States.
– ADMIN_LEVEL_REGIONID or 'RegionID' for the ID of the region in theGeoNames database, such as "6254926" for Massachusetts.
– ADMIN_LEVEL_SUBREGION or 'SubRegion' for a sub-region match, such as acounty in the United States.
– ADMIN_LEVEL_SUBREGIONID or 'SubRegionID' for the ID of the sub-regionin the GeoNames database, such as "4943909" for Middlesex County inMassachusetts.
– ADMIN_LEVEL_POSTCODE or 'Postcode' for a postal code, such as a zip codein the US.
• proximityThreshold is an optional Double parameter that specifies themaximum distance in miles allowed for input geocode and output geographiclocation. If this parameter is not specified, the default of 100 miles is used. If thedistance exceeds the threshold, null is returned.
The function returns the geotagged address as requested by the adminLevelparameter. The returned data types for the adminLevel are:
• String for adminLevel = City, Country, Postcode, Region, SubRegion, RegionID,SubRegionID
• Geocode for adminLevel = Geocode
The following example uses two values to create a Geocode object, then returns theGeocode's city field:
reverseGeotag(toGeocode(42.35843, -71.05977), 'CITY', 'en', 50)
runExternalPlugin
Runs a custom, external Groovy script as defined in an external file of pluginNameand returns the result of the script.
The syntax is:
runExternalPlugin(String pluginName, String attribute, Map options)
where:
List of transform functions
20-24 Studio User's Guide

• pluginName is the name (base name and extension) of the Groovy script file (forexample, MyPlugin.groovy).
• attribute is the input String passed to the script.
• options is an options Map, which contains any options to be used by the Groovyscript. The default is to be empty.
For information on creating the external plug-in, see Extending the transform functionlibrary.
stripTagsFromHTML
Removes any HTML, XML and XHTML markup tags from the input String andreturns the result as a String. This is a wrapper function for the Tag Stripper dataenrichment module.
The syntax is:
stripTagsFromHTML(String attribute)
where:
• attribute is the HTML String to process.
The function returns plain text.
toPhoneticHash
Produces a String hash of the input text (English only) that represents the phonetics ofthe text.
A word's phonetic hash is based on its pronunciation, rather than its spelling. Oneapplication for phonetic hashes is search engines. If a search term does not return anyresults, the search engine can compare the term's phonetic hash to the hashes of otherterms and return results for the term that is the best fit. For example, "purple" and"pruple" have the same phonetic hash (PRPL), so a search for the misspelled term"pruple" would still yield results for "purple".
The syntax is:
toPhoneticHash(String attribute)
where:
• attribute is the String attribute to process.
Example:
toPhoneticHash(terms)
In the example, "terms" is a String attribute.
Geocode functionsGeocode functions perform different actions on Geocode objects, such as calculatingthe distance between two Geocode values or obtaining a Geocode's latitudecoordinate.
This table describes the Geocode functions that Transform supports. The samefunctions are described in the Transform API Reference (Groovydoc).
List of transform functions
Transform Function Reference 20-25

Important: For those geocode functions where type Double is required forinputs, make sure you enter values that are within valid ranges. The range forvalid latitude values is from -90.0 to 90.0; the range for valid longitude valuesis from -180.0 to 180.0. Also, note that geocode functions do not accept typeLong.
User Function ReturnData Type
Description
distance(Geocodegeo1, Geocodegeo2)
Double Calculates the distance between two Geocode values,in kilometers. Note that geocode functions do notaccept type Long.
getLatitude(Geocode geo)
Double Returns the latitude coordinate of a Geocode value.Note that geocode functions do not accept type Long.
getLongitude(Geocode geo)
Double Returns the longitude coordinate of a Geocode value.Note that geocode functions do not accept type Long.
isGeocode(Strings)
Boolean Determines whether a String is a valid Geocodevalue.
toGeocode(Strings)
Geocode Converts a String to a Geocode value.
toGeocode(Doublelat, Double lon)
Geocode Converts a pair of latitude and longitude coordinatesto a Geocode value. For the inputs to this function,ensure that you enter valid latitude and longitudevalues. The range for valid latitude values is from-90.0 to 90.0. The range for valid longitude values isfrom -180.0 to 180.0.
Math functionsMath functions perform mathematical operations on your data.
This table describes the math functions that Transform supports.
User Function ReturnData Type
Description
abs(Double d)
abs(Integer i)
abs(Long l)
Double
Integer
Long
Calculates the argument's absolute value.
acos(Double d) Double Calculates the arccosine of a double. The returnedangle is between 0.0 and pi.
asin(Double d) Double Calculates the arcsine of a double. The returned angleis between -pi/2 and pi/2.
asin(Doubled)atan(Double d)
Double Calculates the arctangent of a double. The returnedangle between -pi/2 and pi/2.
atan2(Double y,Double x)
Double Calculates the angle theta from the conversion ofrectangular coordinates (x,y) to polar coordinates(r,theta).
cbrt(Double d) Double Calculates the cube root of a double.
List of transform functions
20-26 Studio User's Guide

User Function ReturnData Type
Description
ceil(Double d) Double Returns the smallest (i.e., closest to negative infinity)double value that is greater than or equal to theargument, and is equal to a mathematical integer.
copySign(Double a,Double b)
Double Returns the first floating-point argument with thesign of the second floating-point argument.
cos(Double a) Double Calculates the trigonometric cosine of an angle.
cosh(Double d) Double Calculates the hyperbolic cosine of a double.
exp(Double d) Double Returns Euler's number e raised to the power of adouble value.
expm1(double x) Double Returns ex-1.
floor(Double d) Double Returns the largest (i.e., closest to positive infinity)double value that is less than or equal to theargument and is equal to a mathematical integer.
getExponent(Doubled)
Integer Returns the unbiased exponent used in therepresentation of a double.
hypot(Double x,Double y)
Double Returns sqrt(x2 + y2) without intermediateoverflow or underflow.
log(Double d) Double Returns the natural logarithm (base e) of a double.
log10(Double d) Double Returns the base 10 logarithm of a double.
log1p(Double d) Double Returns the natural logarithm of the sum of a doubleand 1.
max(Double a,Double b)
max(Integer a,Integer b)
max(Long a, Longb)
Double
Integer
Long
Returns the greater of the two arguments.
min(Double a,Double b)
min(Integer a,Integer b)
min(Long a, Longb)
Double
Integer
Long
Returns the lesser of the two arguments.
nextAfter(Doublea, Double b)
Double Returns the floating-point number adjacent to thefirst argument in the direction of the second.
nextUp(Double a) Double Returns the floating-point value adjacent to theargument in the direction of positive infinity.
pow(Double a,Double b)
Double Returns the value of the first argument raised to thepower of the second.
rint(Double a) Double Returns the double value that is closest in value tothe argument and is equal to a mathematical integer.
random() Double Returns a positive double value that is greater than orequal to 0.0 and is less than 1.0.
List of transform functions
Transform Function Reference 20-27

User Function ReturnData Type
Description
round(Double a,Integer precision)
Double Returns the closest value to the argument, with tiesrounding up.The precision optional parameter specifieswhether to round the value with the specifiedprecision. If not used, it defaults to null.
scalb(Double a,Integer b)
Double Returns a × 2b rounded as if performed by a single,correctly-rounded floating-point multiply to amember of the float value set.
signum(Double a) Double Returns the signum of the argument: 0 if theargument is 0, 1.0 if the argument is greater than 0,-1.0 if the argument is less than 0.
sin(Double a) Double Calculates the trigonometric sine of an angle.
sinh(Double a) Double Calculates the hyperbolic sine of the argument.
sqrt(Double a) Double Calculates the correctly-rounded positive square rootof the argument.
tan(Double a) Double Calculates the trigonometric tangent of an angle.
tanh(Double a) Double Calculates the hyperbolic tangent of a.
toDegrees(Doubleangle)
Double Converts an angle measured in radians to anapproximately equivalent angle measured in degrees.
toRadians(Doubleangle)
Double Converts an angle measured in degrees to anapproximately equivalent angle measured in radians.
truncateNumber(Double number,Integer precision)
Double Truncates a number using the specified precision.
ulp(Double a) Double Returns the size of a ULP of the argument.
Example 20-10 Time conversion example with floor
This example uses the floor function to convert trip_time_in_secs to minutes:
floor(trip_time_in_secs/60)
trip_time_in_seconds is first divided by 60 to determine the number of minutesin the trip. The floor function then rounds this number down and returns it as adouble.
Set functionsSet functions perform various functions on values for multi-assign attributes, such asobtaining the size of the set, checking whether a set is empty, or converting anattribute from a multi-value to a single-value attribute.
This table describes the Set functions that Transform supports. The same functions aredescribed in the Transform API Reference (Groovydoc).
List of transform functions
20-28 Studio User's Guide

User Function Return DataType
Description
cardinality(Objectattribute)
Long Inputs the set of values in a multi-assignattribute and obtains the size of that set.Works only on multi-value (multi-assign)attributes. Throws an exception if run on asingle-assign attribute.
isEmpty(Objectattribute)
Boolean Inputs the set of values in a multi-assignattribute and checks whether this set is empty(has no assignments). Returns true if the setis empty.Works only on multi-value (multi-assign)attributes. Throws an exception if run on asingle-assign attribute.
isMemberOf(Objectattribute, Objectvalue)
Boolean Checks whether the value belongs to the setof values in a multi-assign attribute. Returnstrue if the value belongs to the set.Works only on multi-value (multi-assign)attributes. Throws an exception if run on asingle-assign attribute.
isNull(Objectattribute)
Boolean Determines whether an attribute has anyassigned values. Returns true if the attributeis null (has no assigned values). Works onboth multi-assign and single-assign attributes.
isSet(Objectattribute)
Boolean Checks if an attribute is a multi-assignattribute. Returns true if yes.Works only on multi-value (multi-assign)attributes. Throws an exception if run on asingle-assign attribute.
toSet(Object...attributes)
Object[] Converts an Object argument list to an Objectarray.Works only on multi-value (multi-assign)attributes. Throws an exception if run on asingle-assign attribute.
toSingle(Objectattribute)
Object Converts a multi-value attribute into a single-value attribute. Returns a single value chosenrandomly from a set of values for theattribute.Works only on multi-value (multi-assign)attributes. Throws an exception if run on asingle-assign attribute.
String functionsString functions perform different actions on Strings, such as converting an entireString to uppercase or removing whitespace from a String.
This table describes the String functions that Transform supports. The same functionsare described in the Transform API Reference (Groovydoc).
List of transform functions
Transform Function Reference 20-29

User Function Return DataType
Description
concat(String...arguments)
String Combines a list of String arguments into asingle String.
concatWithToken(String joinToken,String...arguments)
String Combines a list of String arguments into asingle String using a join token. For example:
concatWithToken("|", "merlot", "cabernet", "malbec")
would return:
"merlot|cabernet|malbec"
contains(StringoriginalString,String substring)
Boolean Determines whether a String contains asubstring. For example,contains("Boston", "Bos") wouldreturn true.
find(StringoriginalString,String pattern)
String, null Returns the first instance of a substring orregular expression within a String. Returnsnull if no match is found.
findAll(StringoriginalString,String pattern)
String, null Returns a (possibly empty) list of alloccurrences of a regular expression (in Stringformat) found within a String.
indexOf(StringoriginalString,String substring)
Integer Returns the index of a substring within aString.
isDouble(String s) Boolean Determines whether a String is a Double.
isLong(String s) Boolean Determines whether a String is a Long.
length(String s) Integer Returns the length of a String.
replace(Stringattribute, StringsearchString,StringreplaceString,Boolean useRegex)
String Replaces every instance of a substring orregular expression within a String with a newtext String. The useRegex argument specifieswhether searchString is a literal (false,the default) or a regular expression (true).
splitToSet(StringoriginalString,String delimiter)
String Splits an original String based on a specifiedregular expression delimiter character.
stripIndent(Strings)
String Removes leading spaces from a String.
substring(String s,Integer start,Integer end)
String Returns a substring from the original String,based on its start point and end point. Forexample, substring("cabernet", 0, 3)returns cab.
substring(String s,Integer start)
String Returns a substring from the original String,based on its start point. The returned substringwill be from the start point to the end of theoriginal String. For example,substring("cabernet", 5) returns net.
List of transform functions
20-30 Studio User's Guide

User Function Return DataType
Description
toLowerCase(Strings, String locale)
String Converts a String to lowercase. You canoptionally specify the String's locale; thisdefaults to "en".
toTitleCase(Strings, String locale)
String Converts a String to title case. For example,toTitleCase("sOMe STrING") wouldreturn "Some String". You can optionallyspecify the String's locale; this defaults to "en".
Note: For lists ofcomma-separatedvalues that do notinclude spaces, onlythe first item in thelist will beconverted to titlecase. For example,toTitleCase("apple,cherry,plum") returns"Apple,cherry,plum".
toUpperCase(Strings, String locale)
String Converts a String to uppercase. You canoptionally specify the String's locale; thisdefaults to "en".
trim(String s) String Removes leading and trailing whitespace froma String.
urlDecode(String s,StringcharacterEncoding)
String Decodes a String into application/x-www-form-urlencoded format using a specificencoding scheme. You can optionally specifythe encoding scheme; this defaults to "UTF-8".
urlEncode(String s,StringcharacterEncoding)
String Translates a String into application/x-www-form-urlencoded format using a specificencoding scheme. You can optionally specifythe encoding scheme; this defaults to "UTF-8".
Example 20-11 Escaping special characters in regular expressions
Some String functions (such as find, findAll, replace, and splitToSet) use aregular expression (regex) as a String argument. Some characters have specialmeaning in the regular expression. For example, the dot (.) matches any characterexcept the new line, the dollar sign ($) is an end-of-line anchor, and the vertical pipe(|) separates a series of alternatives.
If you use a special character in a regular expression in a Groovy function, you willhave to double-escape it in the argument. For example, if you do not escape the pipecharacter:
def attrs='aa|bb|cc|dd'splitToSet(attrs, "|")
returns:
List of transform functions
Transform Function Reference 20-31

d,b,c,a|
If you double-escape the pipe character:
def attrs='aa|bb|cc|dd'splitToSet(attrs, "\\|")
returns:
dd,aa,bb,cc
Alternatively, you can use the open and close square brackets to match a single specialcharacter, which gives you the same effect as double-escaping the character. Therefore,the last example can be written as::
def attrs='aa|bb|cc|dd'splitToSet(attrs, "[|]")
returns:
dd,aa,bb,cc
Example 20-12 Locating String patterns using find and regular expressions
This example shows how to use the find function. Assume you have an attributeamz_desc, and it has the following value:
The future is here people and it has arrived in the form of an LED digital bracelet watch. That's right. You'll never have to live the disappointing life of not owning a digital bracelet watch. This revolutionary piece of technology is not only stylish but it will completely change the way you read time.
You can use the following transformation code with find function and regularexpressions in it. This script locates a String pattern that begins with "LED" and endswith "h.", where in between, there can be zero or more of any characters (excluding anew line):
find(amz_desc,'LED.*h\\.')
This script produces the following result:
LED digital bracelet watch. That's right. You'll never have to live the disappointing life of not owning a digital bracelet watch.
In the output, you can see that the script a part of the first sentence, and includes itbecause it starts with "LED". Next, the script looks for the last occurrence of "h.", whichis a letter "h" followed by a period at the end of the sentence.
Note also that the script must escape the second "." , because the script wants thesecond "." to be treated as a regular period in the end of the sentence, and not as aregular expression for any character excluding a new line. Typically, to escape acharacter, "\" is used, however, in this case, "\" must be used twice "\\". This isbecause the transformation script must pass the "\" literally ( as text) to the Groovylanguage, which then treats it as an escape character for the "." period.
Example 20-13 String replacement using replace
This example replaces Strings:
replace(cost,'\\$','',false)
List of transform functions
20-32 Studio User's Guide

Example 20-14 SubString replacement using trim and replace
This example removes County suffix from pickup_county attribute:
trim(replace(pickup_county,'County',''))
The above code uses method chaining to perform multiple actions with a singlestatement. replace first locates the substring County in the attributepickup_county and replaces it with a blank String (''), which essentially removesit. trim then removes all leading and trailing whitespace from the result.
Example 20-15 SubString replacement using regular expressions
The following code masks the number in the medallion attribute by replacing it with'X':
replace(medallion,'[0-9]','X',true)
The replace function locates all numeric characters in the medallion attributeusing the regular expression [0-9], which defines a range of characters. It thenreplaces any characters that match this pattern with the String X. The true argumentspecifies that a regular expression will be used instead of a literal String.
URL functionsThe URL functions return parts of a specific URL, such as the host name used in theURL.
This table describes the URL (Uniform Resource Locator) functions that Transformsupports.
User Function Return DataType
Description
getURLAuthority(String url)
String Returns the authority part of the URL as asingle-assign string attribute. The authority partcomprises an optional user-information part, ahost name (e.g., domain name or IP address),and an optional port number.
getURLHost(Stringurl)
String Returns the host name in the URL as a single-assign string attribute.
getURLPath(Stringurl)
String Returns the path in the URL as a single-assignstring attribute. The path begins with a singleforward slash, not a double forward slash.Returns null if the URL does not contain asingle forward slash.
getURLPort(Stringurl)
Long Returns the port number of the URL as a single-assign Long attribute. Returns -1 if the URLdoes not contain a port number.
getURLProtocol(String url)
String Returns the protocol name of the URL as asingle-assign string attribute. Protocol examplesare http, https, and ftp. Returns null if theURL does not contain a valid protocol.
List of transform functions
Transform Function Reference 20-33

User Function Return DataType
Description
getURLQuery(Stringurl)
String Returns the query part of the URL as a single-assign string attribute. The query part is anoptional part, separated by a question mark("?"), that contains additional identificationinformation that is not hierarchical in nature.Returns null if the URL does not contain aquery part.
getURLRef(Stringurl)
String Returns the reference (ref) part of the URL as asingle-assign string attribute. The reference part(also called a fragment) is indicated by a sharp-sign (#) followed by more characters. Returnsnull if the URL does not contain a referencepart.
getURLUserInfo(String url)
String Returns the user-information part of the URL asa single-assign string attribute. The user-information part is terminated with an at-sign(@). Returns null if the URL does not contain auser-information part.
Example 20-16 URL function examples
getURLAuthority example:
getURLAuthority('http://jjones:[email protected]:1080/docs/resource1.html')
returns jjones:[email protected]:1080 as a single-assign string attribute.
getURLHost example:
getURLHost('http://www.example.com:1080/docs/resource1.html')
returns www.example.com as a single-assign string attribute.
getURLPath example:
getURLPath('http://www.example.com:1080/docs/resource1.html')
returns /docs/resource1.html as a single-assign string attribute.
getURLPort example:
getURLPort('http://www.example.com:1080/docs/resource1.html')
returns 1080 as a single-assign long attribute.
getURLProtocol example:
getURLProtocol('http://www.example.com:1080/docs/resource1.html')
returns http as a single-assign string attribute.
getURLQuery example:
getURLQuery('http://www.example.com:1080/ShowOrder.aspx?ID=10248')
returns ID=10248 as a single-assign string attribute.
getURLRef example:
List of transform functions
20-34 Studio User's Guide

getURLRef('http://www.example.com:1080/docs/chapter1.html#introduction')
returns introduction as a single-assign string attribute.
getURLUserInfo example:
getURLUserInfo('http://jjones:[email protected]:1080/docs/resource1.html')
returns jjones:hello as a single-assign string attribute.
List of transform functions
Transform Function Reference 20-35

List of transform functions
20-36 Studio User's Guide

Part VIIIWorking with Components


21Component Overview
This section includes an overview of the components in Big Data Discovery, as well asthe interface elements that are common across components.
Component listThe tables below provide an overview of available components, sortedby component type.
Common component controlsMany components share a subset of user-facing options. These aresummarized here.
Common component configuration workflowsMany components share a subset of configuration workflows. These aresummarized here.
About the component Actions menuA component can include an Actions menu to allow end users toperform component-level actions such as printing the component andexporting data.
Component listThe tables below provide an overview of available components, sorted by componenttype.
Note: The Summary column lists the full functionality for a component.Many components can be configured to expose only a subset of functionalityto users.
Containers
Containers allow users to group components on the page.
ComponentName
Summary Screenshot
ColumnContainer
Used to group components on the page. Userscan configure the number of columns andoverall layout.
Component Overview 21-1

ComponentName
Summary Screenshot
TabbedContainer
Used to create a tabbed interface, with each tabcontaining a different set of components.
Data Record Displays
Data record displays allow users to view lists of records.
ComponentName
Summary Screenshot
Results List Displays the list of records for the currentrefinement. Each record displays a subset ofattributes as configured for the component.
Users can export and print the list. They canalso compare records, display details for arecord, and refine the data.
ResultsTable
Displays a table containing either a list ofrecords for the current refinement, or a set ofmetrics aggregated by one or more dimensions.
The table can include links to display theRecord Details dialog, refine the data set, ordisplay related content. Selected values canalso be highlighted.
Users can export and print the list. They canalso use the Compare dialog to compareselected rows.
Charts
Studio provides several types of charts to use to visualize data and the distribution ofdata values.
Component list
21-2 Studio User's Guide

ComponentName
Summary Screenshot
Chart A Chart displays data using various chartformats, including:• Bar charts• Line / Area charts• Pie / Sunburst charts• Scatter / Bubble charts (including binned
scatter charts)• Bar-Line charts• Thematic maps
Depending on the configured chart type, usersmay be able to select the data view and metricsto plot. They can also save the currentlydisplayed chart as an image.
Chart > ThematicMap
Plots regions on a map and distinguishes theregions by color and record count per metric.
For a Thematic Map, you can select:• The data view to use for the chart data• The geocode attribute to display on the
map.• The geographic grain used to display the
map. For example, you can display the mapby country, region, county, and so on.
HistogramPlot
A Histogram Plot is a basic visualization forshowing the distribution of values for a singlemetric. The values are grouped into bins, eachrepresenting a range of values and displayingthe number of values in that range.
Users can select the data view, the X-axismetric, the number of X-axis bins, and the typeof histogram to display
Box Plot A Box Plot provides a capsule summary ofvalues for a metric for each value of a Stringattribute. For example, you can show asummary of the values for Number Orderedagainst each value of Product Category.
Users can select the data view, as well as thevalues to plot on each axis.
Component list
Component Overview 21-3

ComponentName
Summary Screenshot
ParallelCoordinatesPlot
A Parallel Coordinates Plot plots the values ofmultiple metrics for each value of a singledimension.
Users can select the data view, the dimension,and the metrics and aggregation methods touse.
Other Data Visualizations
Other visualizations allow users to explore and visualize data on the page.
ComponentName
Summary Screenshot
CustomVisualizationComponent
A Custom Visualization Component is anextension to Studio that lets you createcustomized visualizations in cases where thedefault components in Studio do not meetyour specific data visualization needs.
You implement a uniquerendering for a CustomVisualization Component tomeet your data visualizationneeds. For details aboutcreating a CustomVisualization Component,see the Extensions Guide.
Map Displays one or more map layers. Each layerrepresents a set of geographic locations.
Users can search for locations and displaydetails for a specific location.
Component list
21-4 Studio User's Guide

ComponentName
Summary Screenshot
Pivot Table Generates a table that allows users to performcomparisons and identify trends across severalcross sections of data.
Users can change the table layout and exportthe data to a spreadsheet.
Summarization Bar
Displays a set of summary items that containsummary values from the data. A summaryvalue can be a metric (such as average sales), adimension value associated with the lowest orhighest value of a metric (such as the regionwith the highest sales), or a number of flags.Flags indicate the dimension values that haveassociated metric values which have passed aspecified threshold.
Tag Cloud Displays a distribution of terms based on thevalue of an associated metric. Larger fontsindicate a higher metric value.
The component can display in cloud view,with the terms in alphabetical order, or in listview, with the terms ordered by the metricvalue.
Users can refine by the displayed terms.
Component list
Component Overview 21-5

ComponentName
Summary Screenshot
Timeline Displays one or more metric values over theperiod of time. It consists of a Master Timelineto set the date/time range, and individualmetric timelines showing the value of a metricfor a selected date/time attribute.
Users can:• Add and remove metric timelines• Select the metric and date/time attribute to
use for each timeline• Select a specific subset of the available
date/time range to display on the metrictimelines
There is no edit view for the component, butadministrators can save a configuration to bethe default displayed when users first displaythe page.
Web-based Content
Data record displays allow users to view lists of records.
ComponentName
Summary Screenshot
IFrame Displays the content of an external URL on thepage.
WebContentDisplay
Displays HTML content. Users can create andedit the content within the component.
Component list
21-6 Studio User's Guide

Common component controlsMany components share a subset of user-facing options. These are summarized here.
Paging through dataComponents that display data may include a pagination toolbar. Fromthe pagination toolbar, you can navigate through the data and alsodetermine the amount of data to display per page.
Using a component to refine dataThe Available Refinements panel and Search Box functions arespecifically designed for refinement, but other components can allowyou to click attribute values in order to refine the data.
Displaying details for a component itemSome component hyperlinks display the Record Details dialog, whichdisplays information from the current component item. For example,you could display details for a row in a Results Table, a record in aResults List, or a location on a Map component.
Comparing items within a componentSome components include an Actions > Compare option to compareselected items.
Printing component dataSome components include an Actions > Print option to print data.
Exporting data from a componentSome components include an Actions > Export option to export data to aCSV file with UTF-16LE encoding.
Paging through dataComponents that display data may include a pagination toolbar. From the paginationtoolbar, you can navigate through the data and also determine the amount of data todisplay per page.
The following components include a pagination toolbar:
• Data Record Displays
– Results List
– Results Table
To page through component data:
1. At the left of the pagination toolbar are the navigation controls. To navigate usingthe paging toolbar:
• To navigate to the next or previous page, click the next or previous page button.
• To navigate to the first or last page, click the first or last page icon.
Common component controls
Component Overview 21-7

• To jump to a specific page, type the page number in the field, then press Enter.
2. The right of the toolbar shows the current subset of records being displayed (forexample, "1-50 of 500"). To change the amount of data displayed on each page:
a. Click the drop-down icon next to the record subset information.
b. From the pop-up list, select the number of items to display per page.
Using a component to refine dataThe Available Refinements panel and Search Box functions are specifically designedfor refinement, but other components can allow you to click attribute values in orderto refine the data.
When you click a value that is enabled for refinement, other components that are tiedto data from the same data set are updated to reflect the change.
Refinements are always added to the Selected Refinements panel, to allow you to:
• See what you have refined by
• Remove refinements
See About the Selected Refinements panel.
Refining from a list of values
For a list of values:
• To refine by an individual value, click that value
• To refine by all of the values, click the icon that displays after the list, then clickRefine by all values.
If you can only refine by one value at a time, then the Refine by all values option isnot displayed.
Selecting multiple values to refine by
You can also create a list of values to refine by. You can select the values from differentattributes and components, including components on different pages. For example,you could refine by a Region value displayed on a Results Table, and a Wine Typevalue displayed on a Summarization Bar.
To do this, Ctrl-click each value. The values must all be enabled for refinement. Whenyou Ctrl-click a value, it is added to the list of values to refine by. You can also Ctrl-
Common component controls
21-8 Studio User's Guide

click a Refine by all values link to add all of the values to the list. As you navigatebetween pages, the list remains displayed until you either confirm or cancel therefinement.
To toggle a selection between positive and negative refinement, click the icon in frontof the value.
If the list of refinements does not match any records, Studio displays a warningmessage.
To remove a value from the list, click its delete icon. If you remove all of the values,then the list is closed.
By default, the list is either at the right of the page, if you selected the first value froma component, or immediately to the right of the Available Refinements panel, if youselected the first value from there. You can, however, use the top bar to drag the list toanother location on the page.
The list only applies to the current page. If you navigate to a different page, the listcloses automatically.
To refine the data using the selected values, click Apply refinements.
To close the list and cancel the refinement, click the close icon.
Date hierarchies and dimension cascading
Date/time values have an implicit hierarchy that uses the available subsets of date/time units. For example, if a component is currently displaying the year for a datevalue, then when you refine by a specific year, Studio could display data for themonths of that year. If you then refine by a specific month, Studio could display datafor the days of that month.
Components may also be configured to allow cascading of values. Cascading meansthat when you refine by a specific attribute value, the component is updated to displayvalues from a different attribute. For example:
1. When you refine by the country United States, the component displays data for allof the states in the United States.
2. When you refine by California, the component displays data for cities inCalifornia.
Common component controls
Component Overview 21-9
Displaying details for a component itemSome component hyperlinks display the Record Details dialog, which displaysinformation from the current component item. For example, you could display detailsfor a row in a Results Table, a record in a Results List, or a location on a Mapcomponent.
The Record Details dialog displays attributes within the context of their attributegroups.
If the original item reflects a record from a data set, the Record Details dialog displaysall of the attribute groups that an administrator configured to include in record details.For example, a Results List item may only display a few attributes, but the RecordDetails dialog contains all of the applicable attribute groups for the associated record.
For aggregated data, the Record Details dialog only includes the displayed data:
• The dimensions are displayed in their attribute groups
• The metrics are displayed in the Other group
From the Record Details dialog, you can print the displayed data, or export the datato a spreadsheet. See Printing component data and Exporting data from a component.
Comparing items within a componentSome components include an Actions > Compare option to compare selected items.
The following components include a Compare option:
• Data Record Displays
– Results List
– Results Table
To compare items:
1. Select the records to compare:
a. Select the check box for each item you want to compare.
b. Select Actions > Compare.
The Compare dialog displays with the selected items:
Common component controls
21-10 Studio User's Guide

When comparing records, the Compare dialog displays all attributes thatdisplay in the Record Details view. For example, a Results Table row may onlydisplay a subset of attributes in the component itself, but the Compare dialogshows the full set of attributes for the selected records.
If the original items have been aggregated, the Compare dialog only includesthe displayed data. The dimensions used for aggregation display in theirattribute groups, and the metrics display in the Other group.
2. Optionally, select a baseline item:
a. To select an item as the baseline, click the lock icon in the header row.
The selected item becomes the first column in the list and cannot be moved. Thelock icon is changed to indicate that the item is the baseline. If another item waspreviously selected as the baseline, it becomes a non-baseline item:
You can drag any non-baseline records left or right in the display, to allow youto do a side-by-side comparison of selected records.
b. To remove the designation as a baseline record, click the lock icon again.
The record column remains at the left of the table, but can now be moved.
3. Reorder or search for relevant attributes to compare:
a. Drag and drop attribute groups to move them up or down in the display.
You can reorder attributes within a group, but cannot drag attributes to othergroups.
Common component controls
Component Overview 21-11

b. To expand or collapse an attribute group, click the group name.
c. To expand all attribute groups, select Actions > Expand all groups.
d. To collapse all attribute groups, select Actions > Collapse all groups.
e. To search for a specific attribute, enter text in the Filter field.
4. Highlight the differences between selected items:
a. select Actions > Highlight Differences.
If you haven't selected a baseline, then the Compare dialog highlights attributevalues that are different across any of the selected items.
If there is a baseline, the Compare dialog highlights attribute values in non-baseline items that differ from the baseline values:
b. To remove the highlighting, select Actions > Hide Highlights.
5. To remove records:
a. Select the check box for each record to remove.
b. Select Actions > Remove Selected.
6. To reset the Compare dialog to its initial display, select Actions > Reset view.
Printing component dataSome components include an Actions > Print option to print data.
The following components include a Print option:
• Data Record Displays
– Results List - only prints the current page
– Results Table
– Record Details - While not a component, the Record Details screen is accessiblefrom the Results List, Results Table, and Map.
• Other Data Visualizations
Common component controls
21-12 Studio User's Guide

– Pivot Table - only prints the currently displayed data
To print component data:
1. In the component Actions menu, select Print.
A print preview displays. Any refinements that have been applied to the data areincluded at the top of the printout.
2. Configure any printer settings as desired and click Print.
Exporting data from a componentSome components include an Actions > Export option to export data to a CSV filewith UTF-16LE encoding.
The export option is not available if you are viewing the project on an iPad.
The following components include an Export option:
• Data Record Displays
– Results List - Exported data includes the displayed attributes for all exportedrecords. You can select specific records to export.
– Results Table - Exported data includes all columns from the available columnsets. You can select specific rows to export.
For aggregated tables, only the displayed dimensions are included in the export.
– Record Details - While not a component, the Record Details screen is accessiblefrom the Results List, Results Table, and Map. Exported data from this screenincludes a single row for the displayed data.
• Other Data Visualizations
– Pivot Table- Exported data includes the data used to create the Pivot Tabledisplay.
To export data from a component:
1. In the component Actions menu, select Export.
The Export Data dialog displays.
2. In the File name: field, set output file format:
By default, the output file name is the data view name, with spaces replaced byunderscores.
3. In the File type: field, set the output type:
• Avro saves the file as an Avro file in HDFS.
• Delimited saves the file as a CSV.
a. For Delimited files, set the following using drop-downs:
• Field Delimiter - The character used to separate fields in a record. You canselect Other to enter a custom character.
Common component controls
Component Overview 21-13

• Quote Character - The character used for quotation marks, either double orsingle quote.
• Multi-Value Delimiter - The character used to separate multiple values inthe same multi-assign field. You can select Other to enter a custom character.
For example, if you choose Pipe (|) , Single quote ('), and Semicolon (;), a rowfrom the exported file might look something like:
|'10234'|'Bourdeaux'|'Valmaison'|'Best buy';'Recommended'|'$10'|
4. In the Export to: drop-down, select an export destination:
• My Computer is the default option, and prompts to open or download the file,based on your browser.
• HDFS exports the file to HDFS so that it is available to other Studio users. Thisoption is available to Administrators and Power Users.
a. For HDFS exports, set the following:
• HDFS File Path - The file path on the configured HDFS export directory.Ensure that any changes return a checkmark when validating pathuniqueness.
• Create Hive table - For Avro files, select this checkbox to create a new Hivetable for exported data.
b. If you are creating a Hive table, set the name and description:
• Hive table name: - The name of the Hive table.
By default, this is the data view name with spaces replaced by underscoresand an incremented number appended for uniqueness. Ensure that anychanges return a checkmark when validating that the new path is unique.
• Description: - A description of the table.
5. If the component has multi-value attributes selected, then under Multi-ValueAttribute Handling, click a radio button to indicate whether to leave multi-valueattributes without any transformations, or to transpose columns for multi-valueattributes.
Transposing multi-value attributes adds a column for each unique value of theattribute. For each record, each column includes a Boolean value that indicateswhether the attribute value is present for that record.
6. Click Export.
An Export Data screen displays while data is formatted and prepared for export.
7. Save or open the exported file.
The exact prompt varies based on your browser.
Common component configuration workflowsMany components share a subset of configuration workflows. These are summarizedhere.
Common component configuration workflows
21-14 Studio User's Guide

About configuring componentsYou can customize components to determine details for the displayeddata and formatting. Many components include a default configuration,while others (such as charts) require configuration before they displayany data.
Renaming a componentAfter you add a component to your project, you can rename it to reflectyour own terminology or the content being displayed.
Configuring attribute value formatsFor values displayed on a component, you can configure the displayformat.
Selecting the aggregation method to use for a metricFor metrics other than system metrics or predefined metrics, when youfirst select a metric to add to a component, Studio uses the defaultaggregation method for that attribute. You can then select a differentaggregation method.
Configuring cascading for dimension refinementWhen users refine by dimension values on a component, you canconfigure the dimension to use cascading.
About configuring componentsYou can customize components to determine details for the displayed data andformatting. Many components include a default configuration, while others (such ascharts) require configuration before they display any data.
The steps below summarize the workflow for configuring data display in acomponent.
Configuring data display in a component consists of the following high-level steps:
1. Select the data view from the available data set views for the project.
Some components use multiple data views. The Summarization Bar, for example,can use a separate data view for each summary item.
2. Select the attribute(s) or aggregated value(s) to display.
3. For attributes that are not System Metrics or Predefined Metrics, select theaggregation methods to use.
4. Configure the display format for each value displayed in the component.
5. Configure any attribute actions for displayed values.
6. Configure the component Action menu.
For detailed instructions for specific components, see the corresponding componentdocumentation.
Renaming a componentAfter you add a component to your project, you can rename it to reflect your ownterminology or the content being displayed.
Common component configuration workflows
Component Overview 21-15

To rename a component:
1. Click the title of the component.
The title field becomes editable.
2. In the field, type the new title for the component.
3. Press Enter.
The new title replaces the previous title.
You can also use the Localization page to edit and localize the component title. See Localizing the project name, description, page names, and component titles.
Configuring attribute value formatsFor values displayed on a component, you can configure the display format.
Components can display:
• Attribute values from a data view
• Predefined metrics from a data view
• Component-specific metrics that are derived from the attribute values in a dataview
For attribute values and predefined metrics, the default display format is configuredin the Data Views page. See Configuring the default display format for an attribute.You can override these defaults on a per-component basis.
For component-specific metrics, the default display depends on the type ofaggregation:
Aggregation Method Default Display Format
SumAverage
Median
Min
Max
Set
Arb
Uses the default display format for the originalattribute.
Common component configuration workflows
21-16 Studio User's Guide

Aggregation Method Default Display Format
VarianceStandard Deviation
Uses the default format (adjusted for locale) for adecimal number.
Count (Number of records withvalues)Count Distinct (Number of uniquevalues)
Uses the default format (adjusted for locale) for aninteger number.
To configure the attribute value format for an attribute in a component:
1. Open the Edit Attribute dialog for the attribute you wish to configure:
2. To hide the attribute name in the Results List, deselect the Display attribute namecheck box.
3. To configure String values:
a. To ignore line breaks and white space in the attribute value, deselect thePreserve spaces and line breaks check box.
b. Configure the display limit for the attribute:
• To limit attribute value display to a specific number of lines of text, selectTruncation > Display up to and enter the number of lines to display.
• To display the full text of the attribute value up to the maximum allowablelength, select Truncation > Show full record text.
c. Expand the Display Options section and configure the Text Format settings.
These include:
• Text size
• Text weight (Bold or Normal)
• Text alignment within the template block
At the top of the display settings is a sample value showing the currentconfiguration adjusted for your locale.
Common component configuration workflows
Component Overview 21-17

4. To configure numeric values:
a. Expand the Value Formatting section and configure the Basic Formattingsettings.
These include:
• Metric Type - Used to display numeric values as currency or percentagevalues. When selecting Percentage, the value is multiplied by 100. Note thatany attribute that is already formatted as a currency or percentage by defaultcannot be reconfigured.
• Decimal Places - Used to limit the number of decimal places that display forthe value.
• Grouping Separator - Used to display or hide the grouping separator forthousands values.
b. Configure Advanced Formatting settings.
These include:
• Number Format - Use a negative sign or parentheses to indicate negativevalues.
• Decimal Separator - Use a period or comma as a decimal point character.
• Grouping Separator - Use a period or comma as a grouping separatorcharacter.
5. To configure Boolean values:
a. Expand the Value Formatting section and configure the Basic Formattingsettings.
These include:
Common component configuration workflows
21-18 Studio User's Guide

• Default - Display the default configuration
• Custom Values - Specify values to display in place of default "true" (1) or"false" (0) values.
6. To configure geocode values:
a. Expand the Value Formatting section and configure the Basic Formattingsettings.
These include:
• Default - Display the default configuration.
• Fixed length - Specify the number of decimal places to display for thelatitude and longitude values.
7. To configure date/time values:
a. Expand the Value Formatting section and configure the Basic Formattingsettings.
These include:
• Date Display - Select the format to use for the date. Available formats aredetermined by the locale. For some locales, the month displays first, and forothers the day displays first.
• Time Display - Select the format to use for the time.
8. To configure time values:
a. Expand the Value Formatting section and configure the Basic Formattingsettings.
These include:
Common component configuration workflows
Component Overview 21-19

• Time Display - Select the format to use for the time.
9. To configure attributes that are multi-value or use the Set aggregation:
a. Expand the Multi-Value Formatting section and configure the Multi-ValueFormatting settings.
These include:
• Number of values to display - Set the number of values to display.
• Multi-value Separator - Select the character to use to separate the values.
10. Click Apply.
Selecting the aggregation method to use for a metricFor metrics other than system metrics or predefined metrics, when you first select ametric to add to a component, Studio uses the default aggregation method for thatattribute. You can then select a different aggregation method.
For information on aggregation methods and how they work, see Aggregationmethods and the data types that can use them.
You configure the default and available aggregation methods for each attribute on theData Views page. For information on configuring the available and defaultaggregation methods, see Selecting the available and default aggregation methods foran attribute.
To change the aggregation method used for a metric value:
1. On the edit view of the component, the selected metric includes a drop-down iconto allow you to select a different aggregation method.
2. The configuration dialog for the metric also contains an aggregation method listyou can use to change the aggregation method.
Common component configuration workflows
21-20 Studio User's Guide

Configuring cascading for dimension refinementWhen users refine by dimension values on a component, you can configure thedimension to use cascading.
Cascading means that when the data is refined to a single value for the dimensionvalue, the component is updated to use a different dimension.
When there are no more dimensions to cascade to, the component remains on the lastdimension in the cascade.
For example, a component includes a Country dimension. The Country dimension isconfigured to cascade to State and then to Supplier. With this configuration:
1. When users refine the data to only show records for the United States, thecomponent uses the State dimension (for states within the United States).
2. If users then refine the data to only show records for California, the componentuses the Supplier dimension (for suppliers within California).
3. If users then refine the data by a specific supplier, the component displays thedata for the selected supplier, and the cascade stops.
Note that for multi-or or multi-and dimensions, where users can refine by more thanone value, then if the data is refined by any one of the dimension values, the cascadecontinues to the next dimension, even if there are still available values to refine by.
When configuring a dimension, to configure cascading for refinement:
1. In the Dimension Cascade section, select the Enable dimension cascade check box.
The cascade configuration displays. The current dimension is automatically at thetop of the cascade.
You can select the next dimension in the cascade from the list.
2. To add a new layer to the cascade, select the dimension for that layer from the list,then click Add Layer.
The new layer is added to the end of the cascade.
Common component configuration workflows
Component Overview 21-21

3. To remove a layer from the cascade, click the delete icon next to that layer.
4. To clear the entire cascade, click Clear Cascade.
About the component Actions menuA component can include an Actions menu to allow end users to perform component-level actions such as printing the component and exporting data.
Some components also support options that require users to first select one or moreitems, such as comparing records, refining by attribute values in selected records, orusing POST to pass parameters to a URL.
The available actions for a component Actions menu are:
Action Description
Print Allows users to print the component.
Export Allows users to export data from a component.
Compare Displays the Compare dialog to allow users to do a moredetailed comparison of selected items.The Actions menu can only contain one Compare option,which is enabled by default.
If the view used for the component does not have anyidentifying attributes, then the Compare check box isdisabled and locked.
Pass Parameters Allows users to create a hyperlink that generates an HTTPPOST request containing attribute values from the selectedrecords as POST parameters.The Pass Parameters option is only available for the ResultsList and Results Table components.
The Actions menu can contain multiple Pass Parametersoptions, each with a different label, URL, and parameters.
By default, there are no Pass Parameters options in the menu.
Refinement Allows users to refine the data using selected attribute valuesfrom the selected records. The attributes must allow users torefine using multiple values (have multi-or or multi-andrefinement behavior).For example, users could select three records and then refinethe data to only include records that have values for availablecolors and available sizes that are used in those selectedrecords.
The Refinement option is only available for the Results Listand Results Table components.
The actions menu can contain multiple Refinement options,each with a different label and attributes.
By default, there are no Refinement options in the menu.
About the component Actions menu
21-22 Studio User's Guide

Selecting the actions to include in the Actions menuOn the Actions tab of the component edit view, you use the Actionsmenu list to select the available options in the Actions menu. For someactions, you can only enable or disable them. For other actions, you canadd one or more instances to the menu.
Configuring actions for attribute valuesFor many components, you can allow users to click displayed values inorder to refine data, display record details, or navigate to a specifiedpage or external URL.
About component hyperlinksSome components can include hyperlinks from the displayed records toexternal URLs.
About using non-HTTP protocol linksWhile Studio does not prevent you from inserting links that use a non-HTTP protocol, such as file:// or ftp://, using these types of links is notrecommended.
Selecting the target page for a refinement or hyperlinkYou can configure refinement actions to display a different page. Youcan also create hyperlink actions that navigate to a different page.
Recommendations for attribute values that are complete URLsIt is possible that your source data contains complete URLs (includingthe protocol, host, port, and path) that are ingested when the data isloaded. For example, company data could include links to pages on thecompany web site.
Indicating whether to encode inserted attribute valuesWhen you insert an attribute value as a URL parameter, you can specifywhether Studio encodes the value before inserting it into the URL.
Configuring hyperlinks to external URLsComponents can include hyperlinks to external URLs, which can presentsecurity risks.
Configuring a Pass Parameters Actions menu actionFor a Pass Parameters option in a component Actions menu, you canconfigure the URL and whether to display it in a new browser window.You can also include attribute values as POST parameters.
Selecting the actions to include in the Actions menuOn the Actions tab of the component edit view, you use the Actions menu list to selectthe available options in the Actions menu. For some actions, you can only enable ordisable them. For other actions, you can add one or more instances to the menu.
To select the options to include in the Actions menu:
1. To exclude the Print option, deselect the Print check box. To restore the Printoption in the Actions menu, select the check box.
There are no configuration options for the Print option.
2. To exclude the Export option, deselect the Export check box. To restore the Exportoption in the Actions menu, select the check box.
About the component Actions menu
Component Overview 21-23

There are no configuration options for the Export option.
3. To exclude the Compare option, deselect the check box. To restore the Compareoption in the Actions menu, select the Compare check box.
For the Compare option, you can configure the label to display in the columnheading for each record. To configure the column heading:
a. Click the edit icon for the Compare option.
b. On the Compare Configuration dialog, in the Header field, type the header todisplay.
The default is Record {counter}, which displays the word "Record" plus acolumn number based on the order in which you selected the records. Forexample, Record 1, Record 2, etc.
In addition to the {counter} token, you can also use the {attributeKey}token, where attributeKey is the key name (not the display name) of an attributefor whdisplay the associated value. For example, entering {Name} wouldindicate to use the value of the Name attribute for the record as the columnheading.
The attribute must be in a group that is configured to display for record details.If the attribute is not included in the attributes on the Compare dialog, then thevalue is not displayed in the column heading.
4. The Actions menu list initially does not contain any Pass Parameters options. Youcan add one or more of these options, each with unique settings:
a. To add a Pass Parameters option, click +Action. From the menu, select Passparameters.
b. By default, the option is enabled when you add it. To exclude the option,deselect its check box. To reenable the option, select the check box.
c. To remove a Pass Parameters option, click its delete icon.
5. The Actions menu list initially does not contain any Refinement options. You canadd one or more of these options, each with unique settings:
a. To add a Refinement option, click +Action. From the list, select Refinement.
b. By default, the option is enabled when you add it. To exclude the option,deselect its check box. To reenable the option, select the check box.
c. To remove a Refinement option, click its delete icon.
6. To change the display order of the Actions menu options, drag each option to theappropriate location in the list.
Configuring actions for attribute valuesFor many components, you can allow users to click displayed values in order to refinedata, display record details, or navigate to a specified page or external URL.
When configuring a displayed value, there is an Actions section to configure theaction.
To configure actions for an attribute in a component:
About the component Actions menu
21-24 Studio User's Guide

1. Open the Edit Attribute dialog for the attribute you wish to configure:
2. Expand the Actions section.
3. If more than one action is available, select the action from the list.
The available actions are:
Action Name Description
No Action Indicates that the value is not hyperlinked.For attributes that do not support refinement, this is thedefault option.
Show Details When users click the value, the Record Details dialogdisplays already populated with the details for that recordor row.
Refinement When users click the value, the data is refined to onlyinclude records with that value.If the displayed attribute supports refinement, then thisaction is selected by default.
Hyperlink When users click the value, they navigate to the specifiedURL.A hyperlink can be to another page in the same project, orto an external URL.
Hyperlinks to external URLs can include attribute values asparameters.
4. To configure a Show Details action:
a. Set title of the Record Details dialog in the Window Name field.
5. To configure a Refinement action:
a. Set the Target Page to the desired destination page for the attribute value link.
Values include:
• Current page - Stays on the current page.
• Other page - Navigates to the specified page.
About the component Actions menu
Component Overview 21-25

For details on providing a target page for refinement, see Selecting the targetpage for a refinement or hyperlink.
6. To configure a Hyperlink action:
a. Optionally, display a description tooltip for the action by selecting the Displayaction description in tooltip check box.
b. If you have enabled an action tooltip, enter text in the Action Description field.
c. To create a new browser window for the destination page, select the Open linkin a new window check box.
d. Enter the hyperlink destination in the URL field.
You can link to:
• A different page in the same project. For details on providing a target pagefor a hyperlink, see Selecting the target page for a refinement or hyperlink.
• An external URL. Ensure the URL is correctly formed and that you haveproperly encoded any special characters.
You must provide the full URL, starting with the protocol (HTTP, HTTPS,FTP, etc.)
A hyperlink to an external URL can include attribute values.
The values may be query parameters:
http://www.acme.com/index.htm?p1="Red"&p2="1995"
Values may also be part of the URL path:
http://www.acme.com/wines/1995/
To add attribute values to an external URL:
a. Click + Add URL Parameters.
b. On the add parameters dialog, in the attribute list, select the check box next toeach attribute to add.
c. When you are finished selecting attributes, click Apply.
The selected attributes are displayed in a table, with each attribute assigned anID to use when inserting the attribute into the URL.
The attributes are also inserted as query parameters, where the parameter nameis the attribute key, and the parameter value is {IDNumber}, where IDNumberis the ID for that attribute. For example: http://www.acme.com/index.htm?Region={0}&WineType={1}
By default, the value is encoded. To not encode the value, change the format to{{IDNumber}}. For example: {{0}}
You can also use the ID numbers to insert the attribute values manually.
For details on component hyperlinks and encoding inserted attribute values, see Configuring hyperlinks to external URLs.
d. To remove a URL parameter from the table, click its delete icon.
About the component Actions menu
21-26 Studio User's Guide

If you did not edit the inserted query parameter, then Big Data Discovery alsoremoves it from the URL.
If you did edit the inserted query parameter, then you must remove theparameter from the URL manually.
If you inserted the attribute value manually, then you also must remove itmanually.
7. Click Apply.
About component hyperlinksSome components can include hyperlinks from the displayed records to externalURLs.
In some cases, the URLs are static, with the exact same target displayed for everyrecord.
More commonly, a URL contains one or more variable placeholders, each representingan attribute from the underlying data. At runtime, Big Data Discovery replaces theplaceholders with the actual attribute values for the current record.
For example, for a list of products, a Results List component might include ahyperlink to the product web page. To find the correct page, the hyperlink includesthe product identifier as a dynamic URL parameter.
When configuring these hyperlinks and inserting dynamic URL parameters, youshould be aware of the security risks and recommendations associated with them,including:
• Encoding versus not encoding the inserted values
• Using non-HTTP (file or FTP) links
• Storing full URLs as attribute values
About using non-HTTP protocol linksWhile Studio does not prevent you from inserting links that use a non-HTTP protocol,such as file:// or ftp://, using these types of links is not recommended.
Most modern browsers are configured by default to disallow file URLs on web pagesretrieved over HTTP. This is a security precaution to ensure web pages cannot executefiles on a user’s system.
When users click these types of links, the browser ignores them and does not displaythe link target.
Similarly, not all browsers are guaranteed to support FTP links, and users may nothave FTP clients available to get access to content hosted over this protocol.
If users need to reach content on a file system or FTP server, it is recommended thatyou set up a configuration such as a web servlet to stream files through an HTTPinterface. This allows all of your links to be secure HTTP links, and ensures consistentaccess for users with all browser configurations.
Selecting the target page for a refinement or hyperlinkYou can configure refinement actions to display a different page. You can also createhyperlink actions that navigate to a different page.
About the component Actions menu
Component Overview 21-27

For example, when users refine by a value on a Results Table component on one page,users could be redirected to a different page. Note, however, that the refinementaffects all of the components where it applies, no matter what page the componentsare displayed on.
On the component edit view, the target page setting for a refinement action uses radiobuttons to indicate whether to stay on the current page or navigate to a different page.
Using the internal page name
When specifying the target page for a refinement or hyperlink, you must use theinternal page name used in the URL, not the display name used on the page tab.
Studio creates the internal name automatically when you create the page. The internalname removes spaces and special characters.
For example, if the page name displayed on the page tab might be Data Results, thenthe page name in the URL might be data-results.
While you can change the display name for a page, the internal page name does notchange.
Selecting a tab on a Tabbed Component Container
If the target page includes a Tabbed Component Container component, then tospecify the tab that is selected, you append to the page name:
#tabComponentName[tabNumber]
Where:
• tabComponentName is the name of the Tabbed Component Container.
• tabNumber is the number (1, 2, 3, etc.) of the tab to select.
So for example, for the following target value:
analyze#Sales Numbers[1]
• The end user is redirected to the analyze page.
• On the page, the first tab of the Sales Numbers tabbed component is selected.
To select the tab to display for multiple tabbed components, use a double colon (::) todelimit the components.
For example, for the following target value:
analyze#Sales Numbers[1]::Quarterly Forecast[2]
• The user is redirected to the analyze page.
• On the Sales Numbers tabbed component, tab 1 is selected.
• On the Quarterly Forecast tabbed component, tab 2 is selected.
About the component Actions menu
21-28 Studio User's Guide

Using component IDs to specify a Tabbed Component Container
Because the double colon (::) is part of the target page syntax, you should avoid usingit in your tab titles. You also should avoid multiple tabbed component containers withduplicate titles.
If you cannot avoid these naming features, then when defining a target page, youmust use a component's ID rather than its name.
To find a component's ID:
1. Hover your mouse over the tab until the URL appears in the browser status bar.
2. Extract the p_p_id parameter from the URL.
For example, for the following target value:
analyze#nested_tabs_INSTANCE_0CbE[2]::nested_tabs_INSTANCE_Ja6E[1]
• The end user is redirected to the analyze page.
• On the tabbed component with ID nested_tabs_INSTANCE_0CbE, tab 2 isselected.
• On the tabbed component with ID nested_tabs_INSTANCE_Ja6E, tab 1 isselected.
Recommendations for attribute values that are complete URLsIt is possible that your source data contains complete URLs (including the protocol,host, port, and path) that are ingested when the data is loaded. For example, companydata could include links to pages on the company web site.
If you store the full value, and then insert the value as the hyperlink URL, you wouldnot be able to encode it. Because Big Data Discovery does not parse the attribute valueas part of an absolute URL, encoding it would corrupt the URL, and the link wouldnot work.
For example, http://www.mycompany.com/page1 would become http%3A%2F%2Fwww.mycompany.com%2Fpage1.
Because of this, storing the full URL in your data is not recommended.
For these types of attributes, during the data ingest process, it is recommended thatyou use one of the following approaches:
1. Use one or more attributes to store only the parameter values for each record’sURL.
When you configure the URL in a component, you would then manually type thestandard part of the URL into the component configuration, and use encodedattributes for the query String parameters. For example:
http://server.mycompany.com/path/to?file={0}
0 is a number from the list of selected parameters.
You can only use this approach if all of the URLs have the same structure. If this isnot the case, then you may need to use one of the other approaches.
About the component Actions menu
Component Overview 21-29

2. Store the structural portions of the URL in a separate attribute from theparameter values.
In this approach, the structural portions of the URL such as the protocol,hostname, port, and context path/delimiters are stored in one or more attributes.The parameter portions of the URL that represent identifiers are stored in separateattributes as in approach 1 above.
When you enter the URL in the component, you would not encode the structuralattributes, but would encode the parameters. For example:
{{0}}/path/to/{1}?file={2}
0, 1, and 2 are numbers from the list of selected parameters.
3. Use a single attribute for the full URL, but have the data ingest process encodeany non-structural portions of the URL, such as query String parameters.
This prevents script injection and addresses any disallowed characters. When youenter the URL, you can then use the attribute value without further encoding. Forexample:
{{0}}
0 is a number from the list of selected parameters.
Indicating whether to encode inserted attribute valuesWhen you insert an attribute value as a URL parameter, you can specify whetherStudio encodes the value before inserting it into the URL.
URLs must use ASCII characters, and must avoid using certain reserved charactersused as part of the URL syntax. URL encoding replaces any non-conformingcharacters with a percent sign followed by a hexadecimal numeric representation ofthe character.
For example, the forward slash (/) is a reserved character. If a URL includes thephrase "CD/DVD", then URL encoding would change that to "CD%2FDVD".
To insert parameters into a URL, you first select a list of attributes, each of which isassigned a number. You then use the number to insert the parameter.
The format uses the single and double braces to indicate encoding versus notencoding. By default, the values are encoded, and the parameters are enclosed by asingle set of braces:
{parameterNumber}
For example:
http://www.acme.com/index.htm?p1={0}&p2={1}
To have Studio not encode a hyperlink parameter, use a double set of braces:
About the component Actions menu
21-30 Studio User's Guide

{{parameterNumber}}
For example:
http://www.acme.com/index.htm?p1={{0}}&p2={{1}}
It is important to understand that avoiding encoding can pose a security risk, becausedata is rendered in the user’s browser without intervention, potentially allowingscripts or HTML to be injected directly into a user’s browser.
Similarly, if the attribute contains reserved characters that are disallowed in a URL, theresulting hyperlink may be invalid or incorrect and therefore not work for the enduser.
As a result, using the non-encoding syntax is not recommended. Unless you know thatthe underlying data is already encoded, you should always use the encoding syntax.
Configuring hyperlinks to external URLsComponents can include hyperlinks to external URLs, which can present securityrisks.
Configuring a Pass Parameters Actions menu actionFor a Pass Parameters option in a component Actions menu, you can configure theURL and whether to display it in a new browser window. You can also includeattribute values as POST parameters.
To configure a Pass Parameters option:
1. Click its edit icon.
2. On the configuration dialog, in the Action name field, type the label to use for thisoption.
3. To display the URL in a new browser window, select the Open link in a newwindow check box.
4. In the URL field, type the URL to post to.
Make sure that the URL is correctly formed, and that special characters areproperly encoded. You must provide the full URL, starting with the protocol(HTTP, HTTPS, and so on).
5. To add attribute values as POST parameters:
a. Click + Add POST parameters.
The list of available attributes displays.
b. For each attribute you want to add, select its check box.
c. When you are finished selecting the attributes to add, click Apply.
The selected attributes display in a list.
About the component Actions menu
Component Overview 21-31

d. To remove a parameter, click its delete icon.
6. To save the action configuration, click Apply.
About the component Actions menu
21-32 Studio User's Guide

22Containers
Containers allow you to group components on a page. Containers can also be nestedwithin each other for further organization. You can move a container along with anycomponents inside it as a single unit.
Adding a Column ContainerThe Column Container groups components into one or more columns inorder to organize and position them on a page.
Adding a Tabbed ContainerThe Tabbed Container groups components into multiple tabs. Each tabmay contain one or more components.
Adding a Column ContainerThe Column Container groups components into one or more columns in order toorganize and position them on a page.
By default, a new Column Container is configured as two equal-width columns, as inthe example below:
To add a Column Container:
1. In the Discover View of your project, click the Add Component icon in the rightsidebar:
Containers 22-1

The Add Component panel appears.
2. Select the Column Container and click the + icon or drag it to the desired locationon the page.
3. To configure the column layout:
a. Click the Options gear on the right side of the Column Container menu bar toaccess the Component Edit View.
b. From the Layout Template menu, select the layout to use.
Any components already inside the container remain in their specified columns,or are repositioned to the first column if the column they are in is not present inthe new layout.
c. Click Save.
d. Click Exit in the upper right corner.
After configuring the container, you can drag other components into it and configurethem as normal.
Adding a Tabbed ContainerThe Tabbed Container groups components into multiple tabs. Each tab may containone or more components.
By default, the container includes two tabs. The example below shows a Line Chartand a Results List included as separate tabs:
Adding a Tabbed Container
22-2 Studio User's Guide

To add a Tabbed Container:
1. In the Discover View of your project, click the Add Component icon in the rightsidebar:
The Add Component panel appears.
2. Select the Tabbed Component Container and click the + icon or drag it to thedesired location on the page.
3. Click the Options gear on the right side of the Tabbed Container menu bar toaccess the Component Edit View:
4. To add a new tab:
a. In the New tab name field, enter the name of the new tab.
b. Click Create new tab.
5. To change the layout of a tab:
a. Click the layout in the Tab Layout column.
The Choose a Layout dialog appears.
b. Select the layout to use.
c. Click OK.
6. To change the tab order, click and drag the handle on the left side to move each tabto the desired location.
7. To delete a tab, click Delete tab for the tab.
8. To rename a tab:
a. Click the tab name.
The tab name becomes an editable field.
b. In the field, enter the new label for the tab.
c. Click OK.
Adding a Tabbed Container
Containers 22-3

9. To localize a tab name:
a. Click the localization icon next to the tab name.
The Localize Tab dialog displays:
b. From the locale list, select the locale for which to provide a value.
c. Deselect the Use default value check box.
By default, each locale uses the display name configured in the Component EditView.
d. In the Display name field, enter the localized tab name.
e. Click Apply.
10. Click Save.
11. Click Exit in the upper right corner.
After configuring the container, you can drag other components into it and configurethem as normal.
Adding a Tabbed Container
22-4 Studio User's Guide

23Data Record Displays
These components provide a detailed view of record results for a set of refinements.
Results ListThe Results List component displays a list of records in a list formatsimilar to regular web search results. It is designed to provide ameaningful summary of results, and is especially useful for records thatinclude unstructured data such as long text fields.
Results TableThe Results Table component displays a set of data in a table format.
Results ListThe Results List component displays a list of records in a list format similar to regularweb search results. It is designed to provide a meaningful summary of results, and isespecially useful for records that include unstructured data such as long text fields.
In the list, each record displays a configurable set of attributes:
Displayed attributes can include links that refine the data, display record details, ornavigate to a URL. Each record may also include a link that displays the RecordDetails dialog for the record.
The Results List includes the following common functions, summarized in Commoncomponent controls:
• Paging
Data Record Displays 23-1

• Actions > Compare
• Actions > Print
• Actions > Export
Sorting records in a Results ListThe Results List View Options menu includes a Sort option to sort therecords based on the displayed attributes.
Configuring a Results ListA newly-added Results List component displays five attributes for eachrecord. You determine how the component displays and how end userscan interact with each displayed attribute.
Sorting records in a Results ListThe Results List View Options menu includes a Sort option to sort the records basedon the displayed attributes.
To sort records:
1. Select View Options > Sort.
The Edit Sort dialog displays:
If there is currently a search refinement in place, the Sort by keyword search termrelevance check box is enabled. Deselect the check box if you want to sort by one ofthe displayed attributes.
2. To add a sort rule:
a. Click +Sort rule.
b. In the Attribute column, click Select a column and browse to or search for anattribute to sort by.
c. Click Apply.
d. Click the triangle icon in the Order column to switch between Sort Ascending orSort Descending.
The mouseover tooltip displays the current sort order.
Results List
23-2 Studio User's Guide

e. Click Apply.
3. To remove a sort rule:
a. Click the X icon in the rightmost column.
b. Click Apply.
4. To reset the sort order, select View Options > Reset to default.
Configuring a Results ListA newly-added Results List component displays five attributes for each record. Youdetermine how the component displays and how end users can interact with eachdisplayed attribute.
To configure a Results List:
1. Choose a data set view:
a. In the component menu bar, click the Options icon to navigate to the Edit view:
The Edit view opens to the Data Selection tab.
The tab contains the list of views for the project. Views that are not valid for theselected component or sub-component are disabled in the UI.
The View list includes the view name, description, whether the view is a base orcustom view, the data sets the view is created from, and the identifyingattributes for the view.
b. (Optional) To display the list of attributes in a view, click its information icon.
c. Select a view by enabling the radio button.
d. Click Save.
A message bar displays the result of the save operation.
2. Select the attributes to display for each record in the list:
a. In the Edit view, navigate to the List Template tab.
The Results List record display includes multiple rows, each of which cancontain up to 3 attributes. You can add or remove rows and attributes from theRecord Template pane in this tab:
Results List
Data Record Displays 23-3

b. To add an attribute to the template, drag the attribute from the attributes list tothe desired location in the Record Template.
You can create a new row for the attribute or add it to an existing row.
c. To change the location of a selected attribute, drag it to another location in thetemplate.
d. To remove an attribute from the template, click its delete icon.
3. Configure the format of each displayed attribute:
a. In Record Template pane, click the edit icon for an attribute you wish toconfigure.
b. Configure the attribute as described in Configuring attribute value formats.
4. Configure available actions for each displayed attribute:
a. In Record Template pane, click the edit icon for an attribute you wish toconfigure.
b. Configure the actions as described in Configuring actions for attribute values.
5. Click Save.
Configuring images to display next to each recordYou can configure the images that display next to each record in a Results Listcomponent.
Studio supports the following image sources:
Image Type Description
Icons selected fromthe image gallery
This option is typically used when the icons represent a category orother high-level classification of the records.Studio provides a basic set of icon images. You can also upload yourown using .gif, .jpeg/.jpg, .bmp, and .png file types. When you uploadimages, they become available to use for any Results List componentin the same project.
Results List
23-4 Studio User's Guide

Image Type Description
Images from a URLthat you provide
This is typically used when most of the records in the system haveassociated images published to a Web or application server (forexample, a unique preview image for products represented by eachrecord). The URL can include tokens substitute in attribute values asparameters.
To configure images to display next to each record:
1. In the component menu bar, click the Options icon to navigate to the Edit view:
2. In the Edit view, navigate to the Images tab.
3. To disable image display, select Type of image > None.
This is the default configuration.
4. To display an icon from the image gallery:
a. Select Type of image > Icon from gallery.
b. Click Select Attribute.
The attribute selection dialog displays the attributes that can be used for theimage selection. The attribute must have fewer than 15 values, and must bedisplayed on the component.
c. Click the attribute to use and click Apply.
d. To select an image for an attribute value, click Select.
The Select Image dialog opens.
e. Click the image you want to use or click No Image to disable images for a value.
To upload your own image, click Browse, locate the image, and clickUpload.The uploaded image is added to a new My Images category on the SelectImage dialog. If the image is too large, Studio crops it.
f. Click OK.
The list updates with the selected image.
g. To select a different image for an attribute value, click the edit icon.
h. To clear a selected image and display the default image, click the delete icon.
i. Hide or change the default icon by clicking the None radio button below theattribute value list, or by clicking Change Icon.
5. To display images from a URL:
a. Under Type of image, select Thumbnail from URL.
Results List
Data Record Displays 23-5

b. In the field, type the URL for the image file.
c. To add attribute values as parameters in the URL, click Add URL Parameters.
d. On the add parameters dialog, in the attribute list, check the check box next toeach attribute to add.
e. When you are finished selecting attributes, click Apply.
The selected attributes are displayed in a table, with each attribute assigned anID to use when inserting the attribute into the URL.
The attributes are also inserted as query parameters, where the parameter nameis the attribute key, and the parameter value is {IDNumber}, where IDNumberis the ID for that attribute. For example: http://www.mywines.com/images?Designation={0}
By default, the value is encoded. To not encode the value, change the format to{{IDNumber}}. For example: {{0}}
You can also use the ID numbers to insert the attribute values manually.
For details on component hyperlinks and encoding inserted attribute values, see Configuring hyperlinks to external URLs.
f. To remove a URL parameter from the table, click its delete icon.
If the parameter is unedited, Studio also removes it from the URL. If you haveedited the inserted query parameter or inserted the attribute value manually,you must manually remove it from the URL.
6. Hide or change the default icon by clicking the None radio button or by clickingChange Icon.
The default image setting determines the image to display if Studio can't find aconfigured image, or if the No Image option is selected for a value. You can alsouse this setting to display the same image for all records.
Configuring display and pagination options for a Results ListFor a Results List component, you can configure the component height, whether toenable pagination, and, if pagination is enabled, whether to allow end users to selectthe number of results per page.
To configure pagination and navigation options for a Results List:
1. In the component menu bar, click the Options icon to navigate to the Edit view:
2. In the Edit view, click the Display Options tab.
3. In the Component height field, type the height in pixels for the component.
4. To allow end users to select the number of results to display on each page, selectthe Enable end user results per page controls check box.
Results List
23-6 Studio User's Guide

a. In the Available results per page options field, type a comma-separated list ofselectable records per page values.
b. In the Default results per page drop-down, select the default number of resultsto display per page.
5. If you do not allow end users to select the number of results per page, enter thenumber of results to display in the Default results per page field.
Results TableThe Results Table component displays a set of data in a table format.
The data displayed in the Results Table component is either:
• A flat list of records from a selected view. Each row represents a single record. Thecolumns contain attribute values for that record:
• An aggregated list of metric values calculated from attribute values. The metricvalues are aggregated using dimension values displayed at the left of the table.Each row contains the values for a unique combination of dimension values:
The Results Table includes the following common functions, summarized in Commoncomponent controls:
• Paging
Results Table
Data Record Displays 23-7

• Actions > Compare
• Actions > Print
• Actions > Export
About the Results Table layoutA Results Table always contains a set of persistent columns, and canalso contain one or more column sets.
Configuring a Results TableA newly-added Results Table component uses default configuration.You can configure the table type, layout, and available end user options.
Using Results Table values to refine the dataYou can use the values in a Results Table to refine the data.
Navigating to other URLs from a Results TableA Results Table can include hyperlinks to other URLs. The hyperlinkcan pass parameters in the form of attribute values from a row or rows.
Exporting data from a Results TableResults Table supports exporting data to HDFS or the desktop.
About the Results Table layoutA Results Table always contains a set of persistent columns, and can also contain oneor more column sets.
Persistent columns are always displayed to the left of the table.
• For a record list, any column can be a persistent column. One use of persistentcolumns in a record list might be to display identifying information for eachrecord, such as an ID or name.
• For aggregated tables, the persistent columns always contain the dimension valuesused to aggregate the metric values.
For example, the table could have persistent columns for the Country and ProductLine dimensions. The values in the other columns are then aggregated by thecountry and product line values.
To define persistent columns, see Creating persistent columns.
For an aggregated table, the persistent columns are by default locked to the left of thetable, and do not scroll horizontally with the other columns. For a record list, thepersistent columns are unlocked by default.
The columns for the currently selected column set display after the persistent columns.For aggregated tables, the columns contain the aggregated metric values. To definecolumn sets, see Creating column sets .
Aggregated tables can also contain summary rows. There can be summary rows toaggregate values across a dimension value, as well as a summary row that aggregatesthe values across the entire table. The same aggregation method is used for a metricthroughout the table.
Results Table
23-8 Studio User's Guide

You can page through and sort results. You may be able to select the columns todisplay, and use displayed values to refine the data or display related content.
Selecting the column set to display on a Results TableIf a Results Table has multiple available column sets, then a list of the column setsdisplays above the table.
From the column set list, select the column set you want to display.
The column set columns are displayed to the right of the persistent columns.
Changing the layout of a Results TableYou may be able to change the Results Table layout, including the columns that aredisplayed, the display order, and whether to display summary rows for an aggregatedtable.
Showing, hiding, and moving columns
You may be able to show and hide columns in the Results Table. For aggregatedtables, when you show a hidden dimension, it is always added to the dimensioncolumns area.
To show, hide, or move columns:
1. To hide or show columns:
a. From the View Options menu, select Hide / Show Columns.
The complete list of available columns displays. For aggregated tables, thedimension and metric columns are grouped as separate lists:
Results Table
Data Record Displays 23-9

b. To show or hide a column, select or deselect its check box.
c. Click Apply to save changes.
2. To move a column, click the column heading and drag it to a new location.
You can only move persistent columns or dimensions within the persistentcolumns area of the table. You cannot move columns from a column set into thepersistent columns.
You can restore default column configuration by selecting View Options > Resettable to default.
Changing the aggregation method used for a metric
In an aggregated Results Table, each metric has an associated aggregation method(for example, sum or average). If the aggregation is not built into the metric, then youcan assign a different aggregation method.
For example, you could change a column to display the average of the values acrossthe selected dimension values instead of the sum.
To change the aggregation method for a metric:
1. Click the arrow immediately to the right of the column heading.
2. From the list, select the aggregation method.
Showing and hiding summary rows on an aggregated table
If an aggregated Results Table is configured to allow summary rows, then you canshow or hide those rows.
To show or hide the dimension summary rows:
1. Click View Options.
2. In the View Options menu, to show or hide the summary rows for each dimension,select or deselect the Summary rows check box.
3. To show or hide the summary row for the entire table, select or deselect the Grandsummary row check box.
Results Table
23-10 Studio User's Guide

Showing and hiding conditional formatting
A Results Table can include conditional formatting, where individual cells thatcontain numbers are highlighted based on the value in the cell. For example, the tablemay be configured to highlight in red all Sales values that are lower than 1000.
To show or hide available formatting, select or deselect the View Options >Conditional formatting check box.
Sorting a Results TableFor a non aggregated Results Table or an aggregated table without summary rows,you can sort the table using any of the displayed columns. You can also create acompound sort, where the table is sorted by multiple columns in order.
For example, you can configure a compound sort that sorts by Country, then by Year.In this case, all records for "United States" are grouped together, then sorted by Yearwithin the group.
To set the sorting for a table:
1. To sort by a single column, click the column heading.
The rows are sorted by the column values in ascending (A-Z or low-high) order.
To reverse the sort order, click the column heading again.
2. To set up a compound sort:
a. Select View Options > Sort.
The Edit Sort dialog displays. It shows the current sort order for the table. Therule at the top of the list is used first.
Note: If there is currently a search refinement in place, then the Sort bykeyword search term relevance check box is selected.
You can deselect the check box in order to sort based on the table columns.
b. To add a sort rule to the list, click +Sort Rule.
An empty sort rule is added to the bottom of the list.
Results Table
Data Record Displays 23-11

c. To select a column to use for a sort rule, click the arrow for the column name,then from the list, select the column.
You cannot select a column that is already being used in a sort rule.
d. To switch the sort direction for a sort rule, click the sort direction arrow in theOrder column.
e. To change the order for applying sort rules, drag and drop each rule to theappropriate location in the list.
f. To remove a sort rule, click its delete icon.
g. To save and implement the compound sort, click Apply.
Sorting an aggregated table with summary rows
For an aggregated Results Table that includes summary rows, when you sort by aspecific column other than the first dimension, the sort is applied within the parentdimension.
For example, an aggregated table is grouped by Country, then by Year, then byProduct Line. The table includes Total Sales and Average Sales for each combinationof Country and Year, with summary rows to show the total and average across theentire year and the entire country.
So if you sort by Year, the year values are only sorted in the context of each Country. Ifyou sort by Total Sales, the sales values are sorted within each year.
Configuring a Results TableA newly-added Results Table component uses default configuration. You canconfigure the table type, layout, and available end user options.
To configure a Results Table:
1. Choose a data set view:
a. In the component menu bar, click the Options icon to navigate to the Edit view:
The Edit view opens to the Data Selection tab.
The tab contains the list of views for the project. Views that are not valid for theselected component or sub-component are disabled in the UI.
The View list includes the view name, description, whether the view is a base orcustom view, the data sets the view is created from, and the identifyingattributes for the view.
Results Table
23-12 Studio User's Guide

b. (Optional) To display the list of attributes in a view, click its information icon.
c. Select a view by enabling the radio button.
d. Click Save.
A message bar displays the result of the save operation.
2. Select the type of Results Table to display:
a. In the Edit view, navigate to the Table Type tab.
b. Select a table type:
• To create a flat list of records, select Details table.
• To create an aggregated list of metric values, select Analytics table.
Important: If you change the table type after configuring the table layout, youlose the entire table configuration.
3. If you are displaying a flat list of records, configure the columns:
For a record list Results Table, the default column configuration contains theidentifying attributes (for a base view) and the view group-by attributes (for otherviews), and the default record detail groups. The identifying or group-by attributesare used for the persistent columns, and the record detail groups are used for thecolumn sets.
Each view is defined using group-by attributes. For example, from a set of salesdata, you could create a view listing the available products. The view might begrouped by product ID, and so the grouping attribute would be the product ID.
Base views do not have group-by attributes, but have attributes that are flagged asidentifying attributes for the record. For a data set created by loading personaldata, the display name of the identifying attribute is PRIMARY_KEY.
Each view can be configured with a set of attribute groups. Each group isconfigured to indicate whether to use it by default when viewing record details.
a. In the Edit view, navigate to the Column Selection tab.
b. To use the default configuration, leave the Automatic configuration: use recorddetails groups to define the table columns check box selected:
c. To use custom configuration, deselect the Automatic configuration: use recorddetails groups to define the table columns check box.
The default configuration remains, but the lists are enabled to allow you tochange the configuration.
Results Table
Data Record Displays 23-13

If you check the check box again, the default configuration is restored, and anycustomization is lost.
d. Add or remove persistent columns as described in Creating persistent columns.
e. Optionally, add or remove column sets as described in Creating column sets .
4. If you are displaying an aggregated list of metric values, select the dimensions touse for the aggregation and the metrics to display:
a. Add or remove dimension columns as described in Adding dimension columnsto an aggregated table.
b. Optionally, add or remove column sets as described in Adding column sets toan aggregated table.
5. Configure selected columns as described in Configuring column formatting.
6. Add action columns:
a. Add action columns as described in Adding action columns for row-levelResults Table actions.
b. Configure conditions for actions as described in Configuring conditions forenabling Results Table actions.
7. Configure sorting and a summary row as described in Configuring the defaultResults Table sort order and summary row display.
8. Configure the table display as described in Configuring the Results Table displayand navigation.
9. Click Save.
Configuring the Results Table display and navigationThe Display Options tab of the Results Table edit view contains options fordisplaying and navigating through the table.
To configure these settings:
1. Under Table height, in the text field, type the number of rows to display at onetime.
2. Use the pagination fields to configure whether users can select the number ofresults per page, and the available options.
3. In the Default column width field, type the default width in pixels of a tablecolumn.
4. To allow end users to show and hide columns, check the Allow end user to showand hide columns check box.
If the check box is selected, then the View Options menu includes the Hide / ShowColumns option.
Results Table
23-14 Studio User's Guide

Configuring the default Results Table sort order and summary row displayThe Sorting & Summaries tab on the Results Table edit view allows you to configurethe default sort order to use for the table. For aggregated tables, the tab alsodetermines whether to enable the dimension and table summary rows.
For record list tables and aggregated tables without dimension summary rows, youcreate a list of sort rules, which are applied in order. For each sort rule, you can select adifferent column and determine whether to sort in ascending or descending order.
For aggregated tables with dimension summary rows, the sort rules use the dimensioncolumns from left to right, with each dimension sorted in ascending order. You cannotchange the order of the sort rules, and you cannot add or remove sort rules. You canonly:
• Change the sort direction of each dimension (ascending or descending)
• Change the attribute used in the last sort rule. By default, it is the last dimension inthe dimension list, but you can instead select a metric column. The values in themetric column then determine the order of the values for the last dimensioncolumn.
Note that on the end user view, only the currently visible columns can affect the sortorder. Dimensions that are hidden by default are not available to include in the defaultsort order.
On the Summaries & Sorting tab, to configure the sorting:
1. In the Maximum number of sort rules field, type the maximum number of rulesthat can be used in a compound sort.
2. For record list tables, or aggregated tables that do not display dimension summaryrows, to configure the list of sort rules:
a. To add a new sort rule, click +Sort Rule.
If the maximum number of sort rules already has been added, then the button isdisabled.
b. To change the column assigned to a sort rule, click the arrow next to the columnname, then select the new column.
c. To switch the sort direction for a sort rule, click sort arrow in the Order column.
d. To change the order for applying sort rules, drag each sort rule to theappropriate location in the list.
e. To remove a sort rule, click its delete icon.
Results Table
Data Record Displays 23-15

3. For an aggregated table that does display dimension summary rows, to configurethe sort rules:
a. To switch the sort direction for a sort rule, click the sort direction icon in theOrder column.
b. To change the column used in the last sort rule, click the arrow next to thecolumn name, then select the new column.
4. For an aggregated table, the Summaries section of the Sorting & Summaries tabalso allows you to configure whether to display summary rows by default:
a. By default, the dimension summary rows are not displayed. To display bydefault the dimension summary rows, check the Show summary rows bydefault check box.
b. By default, the grand summary row displays. To not show the grand summaryrow, deselect the Show a grand summary row by default check box.
Configuring column formattingFrom the Column Selection tab of the Results Table edit view, you can configure thewidth, formatting, and other options for all of the table columns.
Note that for a record list table, if you are using the default column configuration, thenyou cannot configure the columns. Only default settings are used.
To configure the display of a column:
1. From the Column Selection tab, to display the Edit column dialog, click the editicon for the column.
2. For aggregated tables, select the aggregation method for each metric.
See Selecting the aggregation method to use for a metric.
3. For a date/time attribute, from the Date/time Subset list, select the date/timesubset to display.
The selected date/time subset is included in the column heading on the end userview.
4. For persistent columns and dimensions, you can lock the column, so that it isalways visible at the left of the table.
To lock the column, check the Lock column check box.
Results Table
23-16 Studio User's Guide

To unlock the column, deselect the check box. If the column is not locked, it is stillat the left of the table, but can scroll horizontally.
5. By default, all of the columns are visible. However, you can configure a column tobe hidden when the table is first displayed.
To hide the column by default, check the Hide column check box.
On the Column Selection tab, hidden columns are flagged with an icon.
6. For record list tables, you can indicate whether to highlight search terms thatappear in the attribute value. To highlight search terms, check the Highlight searchterm in context check box.
7. Optionally, configure the Attribute Cascade section to configure a dimensioncascade when users refine by the dimension value as described in Configuringcascading for dimension refinement.
8. In the Display Options section:
a. Under Alignment, to select the horizontal alignment to use for the columnvalue, click its radio button.
b. Under Width, to override the default width, click Custom, then in the field,type the width in pixels of the column.
9. The Value Formatting section is used to set the format for displaying the columnvalues.
For details on formatting displayed values, see Configuring attribute value formats.
10. The Actions section allows you to configure the action that occurs when users clickthe value.
When the dialog is first displayed, the section is collapsed. To expand or collapsethe section, click the section heading.
For general information on configuring column actions, see Configuring actions forattribute values.
In addition to the basic action configuration, for Results Table columns, you canuse the Action Condition setting to also set a condition to determine whether toenable the action based on the value of an attribute in the table. For example, youcan configure the action to only be enabled if the Date Reviewed column has anon-null value.
Results Table
Data Record Displays 23-17
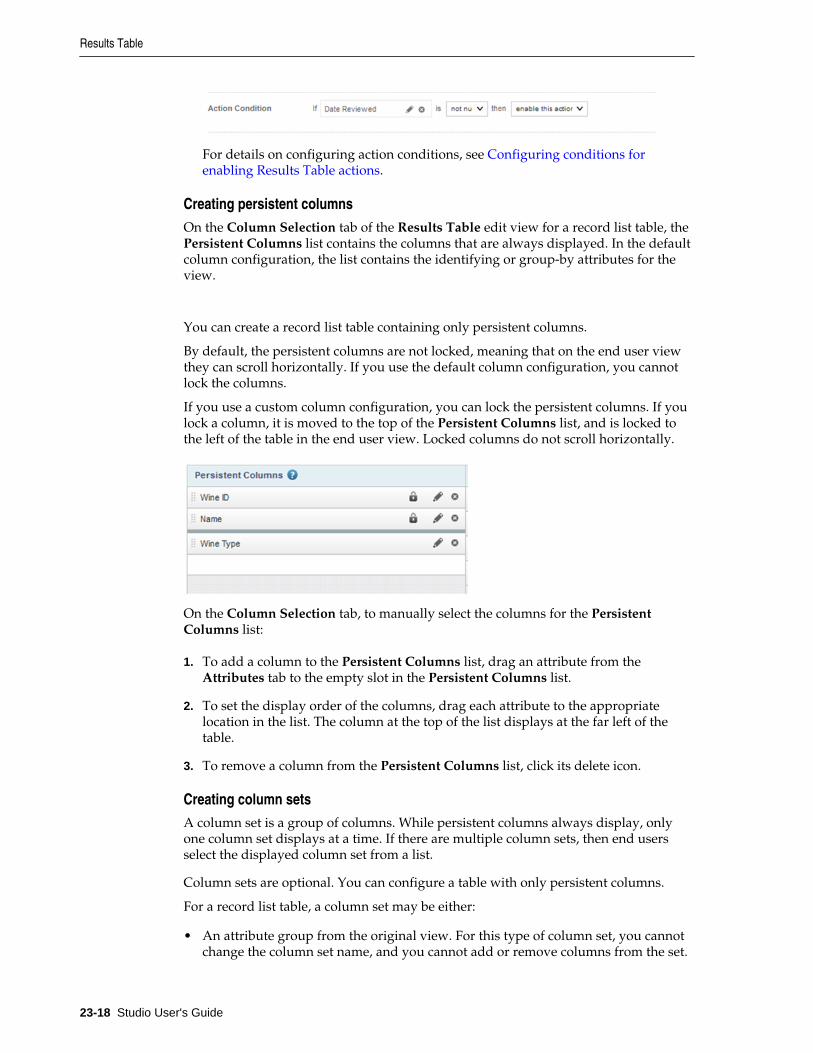
For details on configuring action conditions, see Configuring conditions forenabling Results Table actions.
Creating persistent columnsOn the Column Selection tab of the Results Table edit view for a record list table, thePersistent Columns list contains the columns that are always displayed. In the defaultcolumn configuration, the list contains the identifying or group-by attributes for theview.
You can create a record list table containing only persistent columns.
By default, the persistent columns are not locked, meaning that on the end user viewthey can scroll horizontally. If you use the default column configuration, you cannotlock the columns.
If you use a custom column configuration, you can lock the persistent columns. If youlock a column, it is moved to the top of the Persistent Columns list, and is locked tothe left of the table in the end user view. Locked columns do not scroll horizontally.
On the Column Selection tab, to manually select the columns for the PersistentColumns list:
1. To add a column to the Persistent Columns list, drag an attribute from theAttributes tab to the empty slot in the Persistent Columns list.
2. To set the display order of the columns, drag each attribute to the appropriatelocation in the list. The column at the top of the list displays at the far left of thetable.
3. To remove a column from the Persistent Columns list, click its delete icon.
Creating column setsA column set is a group of columns. While persistent columns always display, onlyone column set displays at a time. If there are multiple column sets, then end usersselect the displayed column set from a list.
Column sets are optional. You can configure a table with only persistent columns.
For a record list table, a column set may be either:
• An attribute group from the original view. For this type of column set, you cannotchange the column set name, and you cannot add or remove columns from the set.
Results Table
23-18 Studio User's Guide

• A manually created column set. For this type of column set, you name the set andselect the attributes that are in the set.
For the default column configuration, the columns sets consist of the attribute groupsconfigured to be used by default for record details.
On the Column Selection tab of the edit view, the column sets are displayed in theInterchangeable Column Sets list. If you are not using the default columnconfiguration, then the list always contains an empty set, used to add a new set to thelist.
You can expand and collapse each column set to show or hide the list of columns.
The order of the column sets in the list determines the display order in the end userlist. The column set at the top of the list is selected by default on the end user view.
To create and configure column sets:
1. To create a new column set from an attribute group, drag the group from theAttribute Groups tab to the Interchangeable Column Sets list.
The column set uses the attribute group name. You cannot change the name of acolumn set created from an attribute group.
The column set uses the attributes and attribute display order configured for theattribute group. For column sets created from an attribute group, you cannot addor remove columns, and you cannot change the display order of the columns.
2. To create and configure manual column sets:
a. To create a new manual column set, drag an attribute from the Attributes tabinto the empty column set slot.
A new empty set slot is added to the bottom of the list. The default name for anew manual column set is "New set" plus a number if needed to differentiatethe name from other column sets.
b. To edit the name of a manual column set, click its edit icon.
c. To add an attribute to a manual column set, drag the attribute from theAttributes tab to the empty slot in the column set.
When you add an attribute to a set, a new empty attribute slot is added.
Results Table
Data Record Displays 23-19

d. To control the display order of the columns in a manual column set, drag theattribute to the appropriate location in the list. You can also drag attributes toother manually created sets.
e. To remove a column from a manual column set, click its delete icon.
3. To determine the display order of the sets in the end user list, drag each set to theappropriate location in the list.
4. To remove a column set, click its delete icon.
Adding column sets to an aggregated table
For an aggregated Results Table, a column set is a group of metric values. All metricvalues display in column sets. While the dimension columns are always displayed,only one column set displays at a time. If there are multiple column sets, then endusers use a list to select the column set to display.
On the Column Selection tab of the edit view, the Metric Column Sets list containsthe column sets. Each column set can be collapsed to allow you to see more of the list.
The list always contains an empty column set slot, to allow you to add new sets.
The display order of the Metric Column Sets list determines the order they display inwithin the end user list. The column set at the top of the list is selected by defaultwhen the component is first displayed.
To manage the column sets:
1. To add a new column set, drag a metric from the attributes list into the emptycolumn set slot.
A new column set is created containing the selected metric, and a new emptycolumn set slot is added.
The default name for a new column set is "New set", plus a number if needed todifferentiate the name from other column sets.
2. To add a column to an existing column set, drag a metric into the empty metriccolumn slot for the column set.
3. To determine the order of the column sets in the end user list, drag each set to theappropriate location in the list.
Results Table
23-20 Studio User's Guide

4. Within each column set, to determine the display order of the columns, drag eachcolumn to the appropriate location in the column set.
5. To configure the column set, click its edit icon.
From the Edit column set dialog, you can configure the column set name.
6. To remove a column set, click its delete icon.
Adding dimension columns to an aggregated tableOn the Column Selection tab of an aggregated Results Table edit view, theDimension Columns list contains the dimensions used to aggregate the metrics in thecolumn sets. Dimension columns are always displayed to the left of the table.
By default, the dimension columns are locked, meaning that they do not scrollhorizontally in the end user view.
If you do not select any dimension columns, then the table consists of a single row,with the metric values aggregated across the entire data set.
To manage the Dimension Columns list:
1. To add a dimension to the list, drag the dimension from the attributes list to theDimension Columns list.
2. To determine the display order of the dimension columns, drag each dimension tothe appropriate location in the list.
3. To remove a dimension column, click its delete icon.
Highlighting Results Table values that fall within a specified rangeThe Conditional Formatting tab of the Results Table edit view allows you tohighlight specific numeric values in a Results Table.
To configure whether to use conditional formatting, and to set the values to highlight:
Results Table
Data Record Displays 23-21
1. To allow conditional formatting, make sure that the Enable conditional formattingcheck box is selected.
If the check box is not selected, then there is no conditional formatting.
2. In the list, click the attribute or metric for which to configure conditionalformatting.
Only numeric attributes and metrics are included in the list.
Each item in the list includes the number of conditional formatting rules configuredfor it.
3. To add a new range of values to highlight for that attribute, click Add condition.
4. To configure a condition:
a. From the Condition Rule list, select the type of comparison.
b. In the field (or fields, for the between or a range from options), enter thevalue(s) against which to do the comparison.
Note that for the between option, the values are inclusive. So if you specify arange between 20 and 30, values of 20 and 30 also are highlighted.
c. From the Color list, select the color to use for the highlighting.
d. In the Tooltip Description field, type a brief description of the highlighting. Thedescription is included in the tooltip for each highlighted cell.
5. The conditions are applied based in the order they are listed. So a condition at thetop of the list has a higher priority than a condition lower in the list.
To change the priority of the conditions, drag and drop them to the appropriatelocation in the list.
6. To remove a condition, click its delete icon.
Adding action columns for row-level Results Table actionsYou can add actions columns to the Results Table to allow end users to perform anaction on the specific row.
Available row-level actions
For row-level action columns in a Results Table, the link to the action can be either atext String or an icon.
The available row-level actions are:
Results Table
23-22 Studio User's Guide

Action Description
Detail Displays the Record Details dialog, which contains dataassociated with the selected row.For record list tables, the component displays the attributegroups configured on the Views page to be used to displayrecord details.
For aggregated tables, the component displays the columnsfrom the current row.
There can be only one Detail action column, which isdisabled by default.
If the view used for the table does not have any identifyingattributes, then the Detail check box is disabled and locked.
For a Detail action column, you can configure the title of theRecord Details dialog.
Hyperlink Allows users to navigate to a specified URL. The link caninclude attribute values from the current row.Users can create multiple Hyperlink action columns, eachwith unique settings.
By default, there are no Hyperlink action columns.
Refinement Refines the data based on one or more attribute values fromthe current row.Users can create multiple Refinement action columns, eachwith unique settings.
By default, there are no Refinement action columns.
Selecting the action columns to include
On the Actions tab of the Results Table edit view, you use the Record actions list tomanage the action columns. For the Detail action, you can only enable or disable theaction. For other actions, you can add one or more instances to the table.
To select the row-level action columns:
1. To include the Detail action, check its check box. To exclude the Detail action,deselect the check box.
2. The table initially does not contain any Hyperlink options. You can add one ormore of these columns, each with unique settings:
a. To add a Hyperlink action column, click + Action. From the menu, selectHyperlink.
b. By default, the column is enabled when you add it. To exclude the actioncolumn, but not remove it, deselect its check box.
c. To remove a Hyperlink action column from the list, click its delete icon.
3. The table initially does not contain any Refinement action columns. You can addone or more of these columns, each with unique settings:
a. To add a Refinement action column, click Action. From the menu, selectRefinement.
Results Table
Data Record Displays 23-23
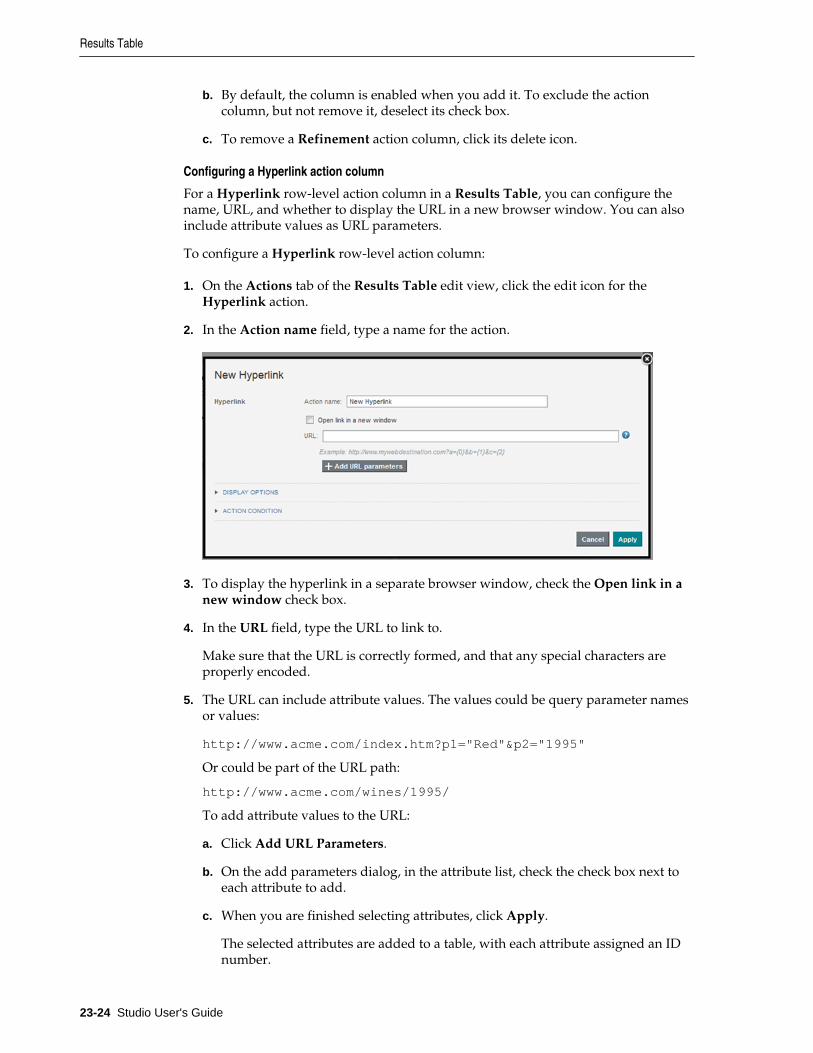
b. By default, the column is enabled when you add it. To exclude the actioncolumn, but not remove it, deselect its check box.
c. To remove a Refinement action column, click its delete icon.
Configuring a Hyperlink action column
For a Hyperlink row-level action column in a Results Table, you can configure thename, URL, and whether to display the URL in a new browser window. You can alsoinclude attribute values as URL parameters.
To configure a Hyperlink row-level action column:
1. On the Actions tab of the Results Table edit view, click the edit icon for theHyperlink action.
2. In the Action name field, type a name for the action.
3. To display the hyperlink in a separate browser window, check the Open link in anew window check box.
4. In the URL field, type the URL to link to.
Make sure that the URL is correctly formed, and that any special characters areproperly encoded.
5. The URL can include attribute values. The values could be query parameter namesor values:
http://www.acme.com/index.htm?p1="Red"&p2="1995"
Or could be part of the URL path:
http://www.acme.com/wines/1995/
To add attribute values to the URL:
a. Click Add URL Parameters.
b. On the add parameters dialog, in the attribute list, check the check box next toeach attribute to add.
c. When you are finished selecting attributes, click Apply.
The selected attributes are added to a table, with each attribute assigned an IDnumber.
Results Table
23-24 Studio User's Guide

The attributes are also inserted as query parameter values, where the parametername is the attribute key, and the parameter value is {IDNumber}, whereIDNumber is the ID for that attribute.
For example: http://www.acme.com/index.htm?Region={0}&WineType={1}
By default, the value is encoded. To not encode the value, change the format to{{IDNumber}}.
For example: {{0}}
You can also use the ID numbers to insert the attribute values manually.
For details on component hyperlinks and encoding inserted values, see Configuring hyperlinks to external URLs.
d. To remove a URL parameter from the table, click its delete icon.
If you did not edit the inserted query parameter, then Big Data Discovery alsoremoves it from the URL.
If you did edit the inserted query parameter, then you must remove theparameter from the URL manually.
You must also remove manually any attribute values that you added manually.
6. To save the configuration, click Apply.
Configuring a Refinement action column
For a Refinement action column on a Results Table, you can select the attributes touse for the refinement, and the page on which to apply the refinement.
To configure a Refinement action column:
1. On the Actions tab of the Results Table edit view, click the edit icon for the action.
2. On the configuration dialog, in the attributes list, check the check box next to eachattribute to use for the refinement.
Results Table
Data Record Displays 23-25

Note that for aggregated tables, you can only use the dimension columns forrefinement.
3. Use the Target Page setting to specify the page to display when users do therefinement.
For information on specifying a different page in the project, see Selecting thetarget page for a refinement or hyperlink.
Configuring how each Hyperlink or Refinement action column displays
The configuration dialog for each Hyperlink or Refinement action column in aResults Table contains a Display Options section. This section is collapsed by default,and is the same for each action. It determines how the column displays in the table.
In the Display Options section, to configure the display for an action column:
1. To expand or collapse the section, click the section heading.
Results Table
23-26 Studio User's Guide

2. Under Alignment, click a radio button to indicate how to align the action icon orhyperlink within the column.
3. By default, action columns display at the far left of the table, in front of thepersistent columns. Under Position, to change the column location:
a. Click the radio button for the custom location.
b. From the location list, select whether to display the column before or after theselected column set.
c. From the column sets list, select the column set to display the action column in.
The list includes all of the column sets in the table, plus an entry to display thecolumn in the persistent columns.
4. Under Width, to have the width set automatically, click Default.
To set a specific width, click Custom. In the field, type the default width in pixels.
5. Under Behavior, configure how to display the action column to end users.
To display the action name as a hyperlink:
a. Click Hyperlinks.
b. To also display the action name in the column heading, check the Displayaction name in column header check box.
To display a clickable icon:
a. Click Icons. This is the default.
When you display an icon in the action column, the column heading is empty.
b. To display an icon other than the default, click Custom icon.
c. To select the custom icon, click Select Icon.
The image selection dialog displays. The dialog lists any images that have beenuploaded for any Results Table component in the current project.
Results Table
Data Record Displays 23-27

The list does not include images from other component types or projects.
d. To search for and select a new image file to upload, click Browse.
Studio supports the .gif, .jpeg/.jpg, .bmp, and .png file types.
e. After you select the file, to clear the current selection, click Cancel.
f. To add the image to the list, click Upload.
g. To select an image to use for the action, click the image in the list, then click OK.
If the image is too large, Studio crops it.
h. To change to a different image, click the edit icon next to the selected image.
i. To remove the selected image, click the delete icon.
Configuring conditions for enabling Results Table actions
For most Results Table actions, including column actions, action columns, and theActions menu, you can set up a condition to determine whether the action is enabled.
Note that for the Actions menu, you can only configure conditions for the Refinementand Pass Parameters actions. For action columns, you can only configure conditionsfor the Refinement and Hyperlink actions. Print, Export, Compare, and Detailsactions never have conditions.
Results Table
23-28 Studio User's Guide

For column values, the Action Condition fields display in the Column Actions sectionof the column configuration dialog.
For Actions menu and action column actions, the configuration dialog contains aseparate Action Condition section.
To configure the condition to control whether the action is available:
1. To select the attribute for the condition, click Select Attribute. On the attributeselection dialog, click the attribute to use, then click Apply.
You can select any of the columns in the table.
2. From the is list, select the comparison operator to use for the condition.
The options are:
Option Description
equal to Indicates that the condition applies if the column value isequal to the comparison value.
not equal to Indicates that the condition applies if the column value isnot equal to the comparison value.
null Indicates that the condition applies if the column value isnull.
not null Indicates that the condition applies if the column value is avalue other than null.
3. For the equal to and not equal to comparisons, in the value field, type the value touse for the comparison.
4. From the then list, select whether to enable or disable the action if the condition ismet.
When an action has an associated condition, then on the end user view:
Action Type Effect of Action Condition
Column values For rows that should not have the action, the column value isnot hyperlinked.
Action columns For rows that should not have the action, the action column isempty. It does not display the icon or hyperlink.
Results Table
Data Record Displays 23-29

Action Type Effect of Action Condition
Actions menu For Actions menu options, users must first select at least onerow to perform the action on.• If all of the selected rows should not have the action, the
action is disabled (grayed out) in the Actions menu.• If at least one of the selected rows can have the action, the
action is enabled.
Using Results Table values to refine the dataYou can use the values in a Results Table to refine the data.
The table can include options to:
Option Description
Refine by a specific attributevalue
For a record list table, the displayed values may behyperlinked to allow you to refine by that value. When youclick the hyperlink, the data is refined to only include recordswith that attribute value.
Refine by multiple attributesin the same row
A record list table can also include a column with a link torefine by selected attribute values in the row.
Refine by attribute valuesfrom multiple rows
The Actions menu can also include options to refine byselected attribute values from the selected rows.To use this option, you must first check at least one row. Youcan select multiple rows across different pages.
To deselect all of the selected rows, click delete icon next tothe number of selections.
Navigating to other URLs from a Results TableA Results Table can include hyperlinks to other URLs. The hyperlink can passparameters in the form of attribute values from a row or rows.
For individual rows, a column can contain a hyperlink to another URL. The URL caninclude attribute values for that record as part of the URL or as query parameters forthe URL.
The Actions menu can also contain options to send attribute values from selected rowsas POST parameters.
Exporting data from a Results TableResults Table supports exporting data to HDFS or the desktop.
The Actions > Export option allows you to export all of the table columns as an Avroor CSV file to either HDFS or the desktop. See Exporting data from a component and Exporting project data for details.
Results Table
23-30 Studio User's Guide

24Charts
Studio provides chart components that you can use to visualize data and thedistribution of data values. The chart components include the Chart, Box Plot,Histogram Plot, and the Parallel Coordinates Plot.
ChartThe Chart component displays a graphical chart based on the projectdata. It supports several sub-types and includes options for selecting thespecific data to display.
Histogram PlotA Histogram Plot is a basic visualization for showing the distribution ofvalues for a single metric.
Box PlotA Box Plot provides a capsule summary of metric values for each valueof a selected String attribute.
Parallel Coordinates PlotA Parallel Coordinates Plot displays the values of several metrics foreach value of a single grouping dimension.
ChartThe Chart component displays a graphical chart based on the project data. It supportsseveral sub-types and includes options for selecting the specific data to display.
The chart sub-types are:
Charts 24-1

Chart Type Description
Bar chart Bar charts show one or more metric values aggregated across a groupdimension. They are useful for precise comparisons of one or more values.
Line / Areachart
Line charts show one or more metric values aggregated across a groupdimension. They are useful for showing changes or trends.
Pie / Sunburstchart
Pie charts show a single metric aggregated across a group dimension.They are useful for showing how each value contributes towards a total.Sunburst charts show concentric rings of metric values, in order to displaycontribution towards a total while also showing relationships betweenhierarchical data.
Chart
24-2 Studio User's Guide

Chart Type Description
Scatter chart Scatter charts display data points, with each point representing adimension value. Points can also be aggregated into bins in a binnedscatterplot, or measured against a third metric and displayed as scaledbubbles in a bubble chart. These charts are useful for showing correlationsbetween metrics.
Bar-Line chart Bar-Line charts show two or more metric values aggregated across agroup dimension. They are useful for showing quantity alongside changesin trends over time.
Thematic Map The Thematic Map shows geographic data.
Bar chartBar charts show one or more metric values aggregated across a groupdimension. They are useful for precise comparisons of one or morevalues.
Line / Area chartLine charts show one or more metric values aggregated across a groupdimension. They are useful for showing changes or trends.
Chart
Charts 24-3

Pie / Sunburst chartPie charts show a single metric aggregated across a group dimension.They are useful for showing how each value contributes towards a total.Sunburst charts show concentric rings of metric values, in order todisplay contribution towards a total while also showing relationshipsbetween increasingly finer-grained metrics.
Scatter chartScatter charts display data points, with each point representing adimension value. Points can also be aggregated into bins in a binnedscatterplot, or measured against a third metric and displayed as scaledbubbles in a bubble chart. These charts are useful for showingcorrelations between metrics.
Bar-Line chartBar-Line charts show two metric values aggregated across a groupdimension. They are useful for showing quantity alongside changes intrends over time.
Thematic MapThe Thematic Map component shows the data graphically and allowsyou to refine the data by regions including country, region, county, etc.You can refine data by drilling down into more granular regions in athematic map and see the results associated with a sub-region.
Configuring a ChartStudio creates a new Chart component based on a set of default values.You can re-configure the defaults with different chart data and chartdisplay options. This is often necessary to change the X and Y-axissettings.
Saving a snapshot of a chartYou can create a snapshot of a displayed Chart component. Thesnapshot includes any current refinements to the chart data.
Bar chartBar charts show one or more metric values aggregated across a group dimension.They are useful for precise comparisons of one or more values.
Bar charts can display multiple metrics at the same time. Bar charts support bothgroup dimensions (category axis) and series (color) dimensions. They can displayeither vertically (the default) or horizontally.
Chart
24-4 Studio User's Guide

Bar charts feature the following variants:
• Bar — A basic bar chart.
• Clustered bars — A bar chart that displays different metrics alongside each otherfor comparison. For example, you might want to plot review scores and productioncost across different car models.
• Stacked bars — A bar chart that displays multiple values atop each other to showhow they contribute towards a varying total. For example, you might want to plottotal sales for three different regions across each fiscal quarter.
• Percentage stacked bars — A bar chart that displays multiple values atop eachother to show percentages of a total by metric. All bars are scaled to the sameheight (100%) to emphasize the difference in percentages.
About using a Bar chart
Mousing over a bar displays the X and Y axis values for that data point. Highlighting acolor in the legend highlights the corresponding bar.
You can refine displayed data by clicking a single bar, or by clicking and dragging toselect a set of bars, then clicking a second time to apply the selection as a refinement.Alternately, hold the CTRL key and select multiple bars, then click Apply refinementsin the selection box when finished. You can also select or multi-select values directlyfrom the X-axis.
Chart
Charts 24-5

Selected refinements display in the Selected Refinements Panel and can be toggled toset them as negative refinements. See About the Selected Refinements panel fordetails.
About configuring a Bar chart
For variants that show multiple bars, you can either plot multiple Y-axis attributes(such as total sales and sales by region A, B, and C) or you can plot a single Colorattribute that is automatically rendered as a separate bar for each attribute value. Youcannot do both.
For detailed configuration steps, see Configuring a Chart.
Line / Area chartLine charts show one or more metric values aggregated across a group dimension.They are useful for showing changes or trends.
Line charts can display multiple metrics as separate lines. They feature the followingvariants:
• Line — A basic line chart.
• Area — A line chart that fills in the area under the line, making it suitable forvisually representing volume.
• Colored lines — A line chart that displays multiple metrics as different coloredlines. This type of chart is generally preferable to an area chart if comparing metricsthat do not contribute towards some total, or when showing a large number ofmetrics.
• Stacked area — An area chart that displays multiple metrics as filled areas. Thistype of chart makes it easier to see how multiple values contribute towards acumulative total.
• Percentage stacked area — An area chart that displays multiple values atop eachother to show percentages of a total by metric. The top of the chart represents 100%,so the visualization includes no whitespace unless a given X-axis value has nocorresponding data.
Chart
24-6 Studio User's Guide
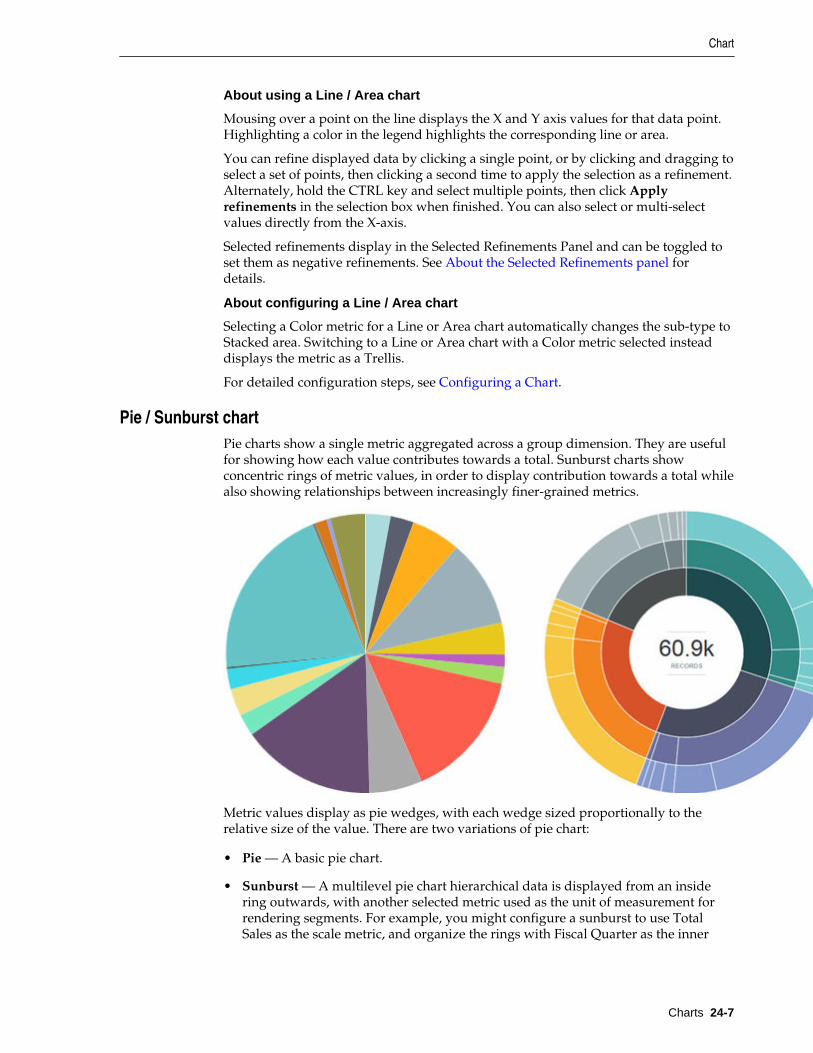
About using a Line / Area chart
Mousing over a point on the line displays the X and Y axis values for that data point.Highlighting a color in the legend highlights the corresponding line or area.
You can refine displayed data by clicking a single point, or by clicking and dragging toselect a set of points, then clicking a second time to apply the selection as a refinement.Alternately, hold the CTRL key and select multiple points, then click Applyrefinements in the selection box when finished. You can also select or multi-selectvalues directly from the X-axis.
Selected refinements display in the Selected Refinements Panel and can be toggled toset them as negative refinements. See About the Selected Refinements panel fordetails.
About configuring a Line / Area chart
Selecting a Color metric for a Line or Area chart automatically changes the sub-type toStacked area. Switching to a Line or Area chart with a Color metric selected insteaddisplays the metric as a Trellis.
For detailed configuration steps, see Configuring a Chart.
Pie / Sunburst chartPie charts show a single metric aggregated across a group dimension. They are usefulfor showing how each value contributes towards a total. Sunburst charts showconcentric rings of metric values, in order to display contribution towards a total whilealso showing relationships between increasingly finer-grained metrics.
Metric values display as pie wedges, with each wedge sized proportionally to therelative size of the value. There are two variations of pie chart:
• Pie — A basic pie chart.
• Sunburst — A multilevel pie chart hierarchical data is displayed from an insidering outwards, with another selected metric used as the unit of measurement forrendering segments. For example, you might configure a sunburst to use TotalSales as the scale metric, and organize the rings with Fiscal Quarter as the inner
Chart
Charts 24-7

ring, territories as the next ring, and companies as the third ring. A sunburst cancontain up to five rings.
About using a Pie / Sunburst chart
Mousing over a wedge or ring segment displays the corresponding metric value aswell as its percent of the total. Mousing over any outer Ring values in a Sunburst chartalso highlights the selected value in other segments of the chart for easier visibility.Highlighting a color in the legend highlights the corresponding wedge or segment.
You can also search for values in a Sunburst chart by using the search box above thecolor legend. This allows you to refine the visualization by a metric value that mightotherwise be displayed only as part of the "Others" group.
You can refine displayed data by clicking a segment. To select multiple segments, holdthe CTRL key and click each one, then click Apply refinements in the selection boxwhen finished. You can also select refinements in the same manner from the colorlegend.
Selected refinements display in the Selected Refinements Panel and can be toggled toset them as negative refinements. See About the Selected Refinements panel fordetails.
About configuring a Pie / Sunburst chart
A Sunburst chart can be configured to show colors one of two ways:
• One hue per ring — Each ring uses a different base color, making it easier todistinguish which level a data point belongs to (inner ring, second ring, third ring,etc).
• Hierarchical (fan gradient) — Each inner ring value uses a different base color,making it easier to distinguish which data is associated with a given root value inthe hierarchy. This may also display data multiple times in the legend if an outerring value is present for multiple inner ring values. For this reason, whendisplaying hierarchical data try to choose an inner data metric where the valueseach have non-overlapping data for outer ring values.
Converting a Sunburst chart back to a pie chart renders the chart based on theinnermost ring. If a second Rings metric is present, it is used to display a Trellised setof charts. Any additional metrics are removed from the configuration.
Note: You cannot specify multi-assign attributes for a Sunburst chart.
When configuring the chart, note that Pie charts use an independent metric (Slice size)and render dependent values from one configured Color metric. Sunburst charts useone dependent metric (Segment size) and render one or more independent metrics(the Rings). The Segment size metric must be both numeric and countable — scalingby total sales works, but attempting to scale by median sale value does not create anaccurate visualization. Keep this in mind if you create your own metrics and want touse them in a Sunburst chart.
For detailed configuration steps, see Configuring a Chart.
Scatter chartScatter charts display data points, with each point representing a dimension value.Points can also be aggregated into bins in a binned scatterplot, or measured against a
Chart
24-8 Studio User's Guide

third metric and displayed as scaled bubbles in a bubble chart. These charts are usefulfor showing correlations between metrics.
A Scatter chart can show a line of best fit if there is any clear trend in the distributionof data points.
As an example of binning, one bin may contain all points where both the X and Yvalues are between 0 and 50. The bin to the right contains all points where X isbetween 50 and 100, and Y is still between 0 and 50. By default, scatter chartsautomatically switch from individual points to bins when there are more than 1000data points in the chart.
Bins are shaded to indicate the relative number of points in that bin: more points in abin means darker shading. For example:
Chart
Charts 24-9

Scatter charts feature the following variants:
• Scatter — A basic Scatter chart displays points in either binned or unbinned form.
• Grouped Scatter — Specifying a Color metric renders a Scatter chart as a GroupedScatter chart. Records are grouped based on their values in the Color metric, with asingle point shown per Color metric value.
Chart
24-10 Studio User's Guide

• Bubble — Specifying both Color and Size metrics renders a Scatter chart as aBubble chart. Like a Grouped Scatter plot, each Color metric value displays a singlepoint on the chart. The size of the point is determined by the Size metric value:
• Scatterplot Matrix — A collection of binned scatterplots and correlation valuesdisplaying the relationships between three or more metrics.
About using a Scatter chart
Mousing over a bin or bubble displays all of the corresponding metric values.Highlighting a color in the legend highlights the corresponding point.
You can refine displayed data by clicking a single point or bubble, or by clicking anddragging to select a set of points, then clicking a second time to apply the selection as arefinement. Alternately, hold the CTRL key and select multiple points, then clickApply refinements in the selection box when finished. You can also select refinementsin the same manner from the color legend or from an axis.
Selected refinements display in the Selected Refinements Panel and can be toggled toset them as negative refinements. See About the Selected Refinements panel fordetails.
About configuring a Scatter chart
The Scatter chart automatically sets a subtype based on the configured metrics.Converting a Bubble chart to a Grouped Scatter chart clears the Size metric selection.Similarly, converting a Grouped Scatter chart to a Scatter chart clears the Color metric.
You can set whether binning behavior is automatic or manual in the Display Options.You can also set whether the chart renders a line of best fit.
For detailed configuration steps, see Configuring a Chart.
Scatterplot MatrixThe Scatterplot Matrix is a Scatter chart sub-type that plots multiple matrices forcomparing attributes against each other. You can also add an optional Color attributefor grouping.
Chart
Charts 24-11

About using a Scatterplot Matrix
To find the plot or correlation for any two attributes, look at where their rows andcolumns intersect. For example, for three attributes the matrix is organized as follows:
Mousing over a chart or a correlation value highlights the attributes being compared.For example, in the diagram above, mousing over the lower-left corner highlights the
Chart
24-12 Studio User's Guide

"Attribute 1" and "Attribute 3" squares to make it clear what is being compared andrendered in the chart, and it also highlights the "Correlation of Attribute 1 to Attribute3" value in the upper-right corner so you can see if the two attributes have closelycorrelated values, or are independent.
Mousing over a bin within one of the charts also shows the value ranges for the bin ina tooltip, while mousing over a correlation value displays the exact correlation.Clicking and dragging a range of values in any of the scatter plot visualizations addstwo range filter refinements, one for each of the plotted attributes, to the SelectedRefinements panel.
The Number of Records legend indicates the number of records in each bin based onthe bin shade, so that you can interpret each of the individual scatterplots.
About configuring a Scatterplot Matrix
A Scatterplot Matrix requires at least three metric attributes to render, though you canadd more. Each additional attribute adds a row and a column to the layout.
Selecting a Color attribute color codes bins based on the most common value of thatattribute.
Bar-Line chartBar-Line charts show two metric values aggregated across a group dimension. Theyare useful for showing quantity alongside changes in trends over time.
The first Y-axis metric displays as a bar, and the second displays as a line. The chartuses a dual-axis plot, where bars are plotted against the left vertical axis and the line isplotted against the right vertical axis.
About using a Bar-Line chart
Mousing over a bar or a point on the line displays the X and Y axis values for that datapoint.
You can refine displayed data by clicking a single bar, or by clicking and dragging toselect a section of the chart, then clicking a second time to apply the selection as arefinement. Alternately, hold the CTRL key and select multiple bars, then click Apply
Chart
Charts 24-13

refinements in the selection box when finished. You can also select or multi-selectvalues directly from the X-axis.
Selected refinements display in the Selected Refinements Panel and can be toggled toset them as negative refinements. See About the Selected Refinements panel fordetails.
About configuring a Bar-Line chart
You cannot render only a line or only bars; the chart requires a metric for each axisand for the line in order to render. For detailed configuration steps, see Configuring aChart.
Thematic MapThe Thematic Map component shows the data graphically and allows you to refinethe data by regions including country, region, county, etc. You can refine data bydrilling down into more granular regions in a thematic map and see the resultsassociated with a sub-region.
The component can only be used if the data set contains at least one geocode attributealong with five related attributes that qualify the geocode attribute with additionalregion information.
The naming syntax for the geocode attribute varies slightly depending on whether it isa latitude/longitude geocode or an IP address/address geocode. This namingdifference only affects the main geocode attribute but not the five related attributes.
Here is the minimum set of attributes required to render a Thematic Map component:
• <attributeName> for geocode attributes or <attributeName>_geo_geocodefor IP address or address attributes
• <attributeName>_geo_country
• <attributeName>_geo_region
• <attributeName>_geo_subregion
• <attributeName>_geo_regionid — This attribute must be present in the dataset but it is not exposed in the tabular view of Explore.
• <attributeName>_geo_subregionid — This attribute must be present in thedata set but it is not exposed in the tabular view of Explore.
The five related attributes are produced in any of the following ways:
• The data enrichment process creates the geocode attributes automatically duringdata processing. See the Administrator's Guide for information about enabling auto-enrichment using the bdd.enableEnrichments setting.
• You can create the geocode attributes manually by writing a custom transformationscript on the Transform page of Studio.
• You can create the geocode attributes using the Geohierarchy Tagger transform.
For example, if you create the region attributes manually and they are based on an IPattribute, you call the geotagIPAddressGetGeocode transform function to create ageocode attribute based on an IP attribute. (See the Extensions Guide for details aboutfunctions.)
Chart
24-14 Studio User's Guide

Using the Thematic MapYou can create a new Thematic Map component in either the scratchpad or theDiscover page.
Choosing the geocode attribute for the thematic map
From the Geo Attribute list, you can select an attribute name on which to aggregaterecords in the thematic map.
Choosing a geographic grain region for the thematic map
From the Geographic Grain list, you can select a region name on which to aggregaterecords in the thematic map. For example, this thematic map aggregates records basedon State rather than Country:
Chart
Charts 24-15

Choosing a metric and metric aggregation
From the Metric list, you can select a metric name on which to aggregate records inthe thematic map. Optionally, from the Metric Aggregation list, you can select amethod to aggregate the value of the metric you selected in the Metric option. Forexample, this thematic map first aggregates records based on State and then sums therecords for the state based on population:
Chart
24-16 Studio User's Guide

Spotlighting values on the map
The Spotlight Top Value list colors regions according to the largest value of the metricselected in the Metric option.
For example, this map shows the city in each country that has the maximumpopulation. The grain is set to country, and the metric and metric aggregation instructthe component to calculate records based on maximum population, and lastly, theSpotlight Top Value groups the records by city. So you can see that in China, the cityof Shanghai has the largest population:
Zooming in/out and redrawing the map
You can use Zoom In and Zoom Out features on the left edge of the component tomanipulate the map.
You can multi-select regions using the Marque drawing tool or by using ctrl+click toselect regions one at a time. You can also drag the thematic map to different locationson the page and then use the tools to zoom to finer views of the data.
Using custom views with a Thematic Map
The Thematic Map chart does not render correctly if it is based on a custom view. Thisis because two region attributes that are required to render the Thematic Map are not
Chart
Charts 24-17

exposed in the base view and therefore the attributes are not copied into the customview. To work around this issue, manually copy the following two attributes into thecustom view EQL:
ARB("dimgeography_latlong_geo_regionid") AS "dimgeography_latlong_geo_regionid",ARB("dimgeography_latlong_geo_subregionid") AS "dimgeography_latlong_geo_subregionid",
Configuring the Thematic Map connection to Oracle MapViewerThe Thematic Map component uses Oracle's MapViewer (11.1.1.7.2 or greater) todisplay the map. Studio includes framework settings to configure the connection toMapViewer.
By default, Studio is configured to use the public instance of MapViewer. If you areusing that instance, and your browser has access to the Internet, then you should notneed to make any configuration changes.
Studio includes the following framework settings related to the MapViewerconnection. If you are using your own instance of MapViewer, or if your Web browserdoes not have Internet access, then you will need to change these settings. For detailson configuring framework settings in Studio, see the Administrator's Guide.
Framework Setting Description
df.mapViewer The URL of the MapViewer instance.By default, this is the URL of the public instance ofMapViewer.
If you are using your own internal instance of MapViewer,then you must update this setting to connect to yourMapViewer instance.
Configuring a ChartStudio creates a new Chart component based on a set of default values. You can re-configure the defaults with different chart data and chart display options. This is oftennecessary to change the X and Y-axis settings.
The default Chart component configuration starts with:
• A vertical Bar chart
• The base view of the default project data set
• For the chart metrics, the first 20 available metrics in the view.
Each metric uses its default aggregation method. The available metrics also includethe Record Count system metric, which is selected by default.
• For the chart group (category axis) and series (color) dimensions, allows end usersto select from the first 20 available dimensions in the view.
By default, the category axis displays the first dimension. The chart is initiallydisplayed with no color dimension selected or trellis dimension selected. You canthen select a color dimension and trellis dimension if desired.
To configure a Chart component:
1. In the Discover page of your project, locate the chart you want to configure, andclick the pencil icon to display the Chart Settings panel.
Chart
24-18 Studio User's Guide

2. From the Data View list, select a data set view to associate with the chart.
3. From the Chart Type list, select a chart type.
• Bar - Bar charts can display multiple metrics at the same time. Bar chartssupport both group dimensions (category axis) and series (color) dimensions.
• Line - Line charts can display multiple metrics at the same time. Line chartssupport both group dimensions (category axis) and series (color) dimensions.
• Pie - Pie charts display one metric at a time and only support group dimensions(wedge colors). Sunburst charts display multiple metrics and only supportgroup dimensions (ring segments).
• Scatter - Scatter charts both support X-axis and Y-axis metrics. Only one X-axisand Y-axis metric can be used at a time. Scatter charts support color and detaildimensions.
• Bar-Line - Bar-Line charts can display multiple bar and line metrics at the sametime. Bar-Line charts only support group dimensions (category axis). They donot support series dimensions.
a. If applicable, select a chart sub-type.
Charts have the following sub-types:
• Bar - Bars, Clustered Bars, Stacked Bars, Percentage Stacked Bars.
• Line - Line, Area, Colored Lines, Stacked Area, Percentage Stacked Area.
• Pie - Pie, Sunburst.
• Scatter - Scatter, Grouped Scatter, Bubble.
• Bar-Line - No subtypes.
Many sub-types require a Color attribute for rendering, and Bubble chartsrequire a Size attribute.
The chart type you select determines the subsequent configuration options.Required zones display in the attribute list with a solid outline if they are notconfigured.
You can drag configured attributes between zones as long as they are valid for thenew location, and any aggregation, sorting, or formatting is preserved as part ofthe transition. Dragging an attribute over another attribute in a zone will swapthem.
4. Configure and format the X-axis or Slice / Segment size value:
Pie / Sunburst charts scale all wedges or ring segments based on the configuredvalue.
a. Type an attribute name or select one from the dropdown to set the attribute toplot on the horizontal axis.
To remove an attribute, mouseover it and click the X in the corner of the zone.You can change attributes by removing the current selection and adding thenew attribute.
Chart
Charts 24-19

b. For attributes with multiple grouping options, select an option from thedropdown:
• by members - Default. Each individual value displays as a mark on the X-axis. Any records that include a value count towards the Y-axis value.
• by set - Each individual value and each unique combination of valuesdisplays as a mark on the X-axis. Any records with the value or with thespecified combination of values count towards the Y-axis value.
For example, a wine with the flavors "Berry" and "Cherry" is included in boththe "Berry" and "Cherry" Y-axis totals when displaying flavor by members. Ifthe chart displays flavor by set, then the wine is included in the "Berry","Cherry", and "Berry, Cherry" Y-axis totals.
c. Mouseover the X-axis value and select Options > Format in the upper rightcorner:
d. Specify X-axis Title text, font size, and Labels font size.
5. If available, configure X-axis sorting:
a. Mouseover the X-axis zone and select Options > Sort in the upper right corner.
Some attribute types do not support sorting configuration.
b. Configure Ascending or Descending sorting either by Alphabetic/Sequentialvalues for the X-axis attribute, or you can sort based on a selected attribute.
c. Configure the number of marks to display from the Show up to: ... marksdropdown.
This value is approximate. Studio adjusts the setting internally to ensure evenbreakpoints and a reasonable visualization.
d. Optionally, display any results that don't fit on the first page of the visualizationas a consolidated Others mark on the X-axis.
You can use the pagination controls to see additional pages if you do notdisplay an Others value. This can help you decide whether consolidating thevalues is worthwhile, or if doing so hides too much useful information.
Chart
24-20 Studio User's Guide

6. Configure and format the Y-axis or Rings value(s):
Pie charts instead use the Color metric for displaying dependent values. See Step 7.
For Bar-Line charts, repeat these steps for both the Left Y-Axis (Bar) and Right Y-Axis (Line).
a. Type an attribute name or select one from the dropdown to set the attribute toplot on the vertical axis.
To remove an attribute, mouseover it and click the X in the corner of the zone.You can change attributes by removing the current selection and adding a newattribute. Some chart types, such as Stacked Bar charts, support multiple Y-axisvalues.
b. If required, select an aggregation method from the dropdown:
By default, aggregation is set to sum.
c. Mouseover the Y-axis zone and click Format in the upper right corner.
d. Specify Y-axis Title text, font size, and Labels tick mark number and size:
e. Specify additional Y-axis Scale, Range, Symbol, and Decimal configuration.
By default, the Y-axis scales linearly. Log (logarithmic) scaling is useful forvalues with an extreme range of values, where relatively small values may behard to differentiate from each other when compared to a few much largervalues.
7. Configure and format the Color value.
a. Select an attribute to plot as colors.
If you are plotting multiple Y-axis values (for example, plotting manufacturingprice and shipping price as a single bar in a stacked Bar chart), the Y-axis valuesare automatically mapped to the color of the visualization. You cannot assign aseparate Color attribute.
b. Mouseover the Color zone and select Options > Format in the upper rightcorner.
c. Select the color scheme from the Scheme dropdown.
d. Enable or disable the Legend display using the Show legends check box.
Chart
Charts 24-21

e. Specify Legend Title text, font size, and Labels font size.
8. If available, configure Color sorting:
a. Mouseover the Color zone and select Options > Sort in the upper right corner.
b. Configure Ascending or Descending sorting either by Alphabetic/Sequentialvalues for the Color attribute, or you can sort based on a selected attribute.
c. Optionally, display the final color in the palette as a consolidated Others color.
Pie charts always include an Others color.
9. For a Bubble chart, configure and format the Size value.
This value determines which attribute scales Bubble size. Specifying a Size valuefor any other type of Scatter chart converts it to a Bubble chart.
10. For Bar, Line, and Pie charts, optionally specify a Trellis attribute.
Specifying a trellis attribute splits the visualization into a set of smaller charts. Forexample, a Bar chart that plots product cost based on category can be displayed asa Trellis based on region, so that it shows separate charts for data from the UnitedStates, Canada, France, etc:
a. Mouseover the Trellis zone and select Sort in the upper right corner.
b. Configure Ascending or Descending sorting for the charts either byAlphabetic/Sequential values for the Trellis attribute, or sort based on anotherattribute.
Chart
24-22 Studio User's Guide

11. Expand and configure the Display Settings:
a. Set the Chart width, in pixels.
b. Set the Chart height, in pixels.
c. Enable or disable Show chart title to show or hide title text. If enabled, selectAutomatic or Custom text to display.
d. For Bar charts, select between Vertical Bars and Horizontal Bars.
e. For Sunburst charts, select a Color pattern.
Note that depending on configured data, the Hierarchical (fan gradient) optionmay display metric values multiple times in outer rings. For example, usingMonth as an inner ring and Day of the Week as an outer ring results in all 7days of the week rendering 12 times (once per month).
f. For Scatter charts, configure binning behavior:
With the Automatic option, the chart displays points if there are fewer than1000 data points, and bins if there are more. You can adjust this threshold in theMaximum number of points to show field.
You can also configure the number of bins per axis to control how granular thedisplay is.
g. For Scatter charts, set the Point opacity.
h. For Scatter charts, enable or disable Show line of best fit and Show coefficient.
Show line of best fit displays a line that approximates the linear relationship ofthe plotted points. Show coefficient displays the correlation of data with theapproximated line when a user mouses over the line in the chart.
12. When you are finished, click Save as default state.
Saving a snapshot of a chartYou can create a snapshot of a displayed Chart component. The snapshot includes anycurrent refinements to the chart data.
To save a snapshot of a chart:
1. Click the camera icon in the left bar to expose the Snapshots pane.
2. Select New Snapshot.
3. On the Add Snapshot dialog:
a. Provide the name of the snapshot.
b. Provide an optional description of the chart snapshot.
c. Click Save.
Chart
Charts 24-23

The snapshot displays in the Snapshots pane. You can click to view the snapshotand also perform a number of addition actions from the Actions menu (edit, email,save to disk, or delete).
Histogram PlotA Histogram Plot is a basic visualization for showing the distribution of values for asingle metric.
On the Histogram Plot, the X-axis contains bars with binned data reflecting ranges ofattribute values. Values are left inclusive and right exclusive. For example, the first binmight reflect values between 0 and 29, the second bin values between 30 and 59, andso on. The Y-axis shows the number of records with values that fall within each rangeof values.
About using a Histogram Plot
Mousing over the bar for a bin displays the range of values for the bin, as well as therecord count for the bin.
You can refine displayed data by clicking a the bar for a single bin, or by clicking anddragging to select a set of bins, then clicking a second time to apply the selection as arefinement. Alternately, hold the CTRL key and select multiple bins, then click Applyrefinements in the selection box when finished. You can also select or multi-selectvalues directly from the X-axis.
Selected refinements display in the Selected Refinements Panel and can be toggled toset them as negative refinements. See About the Selected Refinements panel fordetails.
Selecting Histogram Plot data and display optionsYou can select the data view, metric, histogram type, and number of binswhen viewing a Histogram Plot.
Histogram Plot
24-24 Studio User's Guide

Selecting Histogram Plot data and display optionsYou can select the data view, metric, histogram type, and number of bins whenviewing a Histogram Plot.
To select the Histogram Plot data and display options:
1. Select the view to use for the chart data from the View list at the bottom of thechart.
2. Select the metric for which to plot the value ranges on the X-axis from the Attributelist.
3. Select the type of histogram to display from the Histogram Type list:
Histogram Type Description
Cumulative The cumulative histogram adds up the number of recordsthrough each range of values.So each point in the histogram represents the total numberof records with values up to, but not including, that range.
For example:• The bar for range 1-10 shows the number of records
with a value between 1 and 9.• The bar for range 10-20 shows the number of records
with a value between 1 and 19.• The bar for range 20-30 shows the number of records
with a value between 1 and 29.
Relative The relative histogram shows the relative frequency foreach range of attribute values.Relative histograms also include a kernel density line.
Standard The standard histogram shows the actual number ofrecords for each range of attribute values.Standard histograms also include a kernel density line.
4. By default, the Auto Binning check box is selected, indicating that Studioautomatically determines the number of bins to display. To set the numbermanually:
a. Deselect the Auto Binning check box.
b. In the Number of Bins field, type the number of bins to display on the X-axis.Click outside the field to update the visualization.
The larger the number of bins, the smaller the range of values in each bin.
For example, if you have 50 bins for 1000 data points, each bin represents arange of 20 (0-19, 20-39, etc.). If you have 100 bins, each bin represents a range of10 (0-9, 10-19, etc.).
Box PlotA Box Plot provides a capsule summary of metric values for each value of a selectedString attribute.
Box Plot
Charts 24-25

For example, you can show a summary of the values for sales cycle duration plottedby region, as above.
About using a Box Plot
For each dimension value, the Box Plot displays a box showing:
• First and third quartile metric values for that dimension value
• Median metric value for that dimension value
• Upper and lower whisker lines.
To calculate the end points of the whisker lines, Big Data Discovery first gets thedifference of the third and first quartile values, then multiplies it by 1.5.
For the lower whisker line, it then subtracts the resulting value from the firstquartile value. The lower whisker line also cannot extend past the absoluteminimum value.
For the upper whisker line, it adds the value to the third quartile value. The upperwhisker line also cannot extend past the absolute maximum value.
• Any outlier values that fall above or below the whisker line end points. The chartalways includes the single lowest outlier and single highest outlier in order to showthe full range of values.
Mousing over a quartile displays the X-axis value and the quartile value range.
Box Plot
24-26 Studio User's Guide
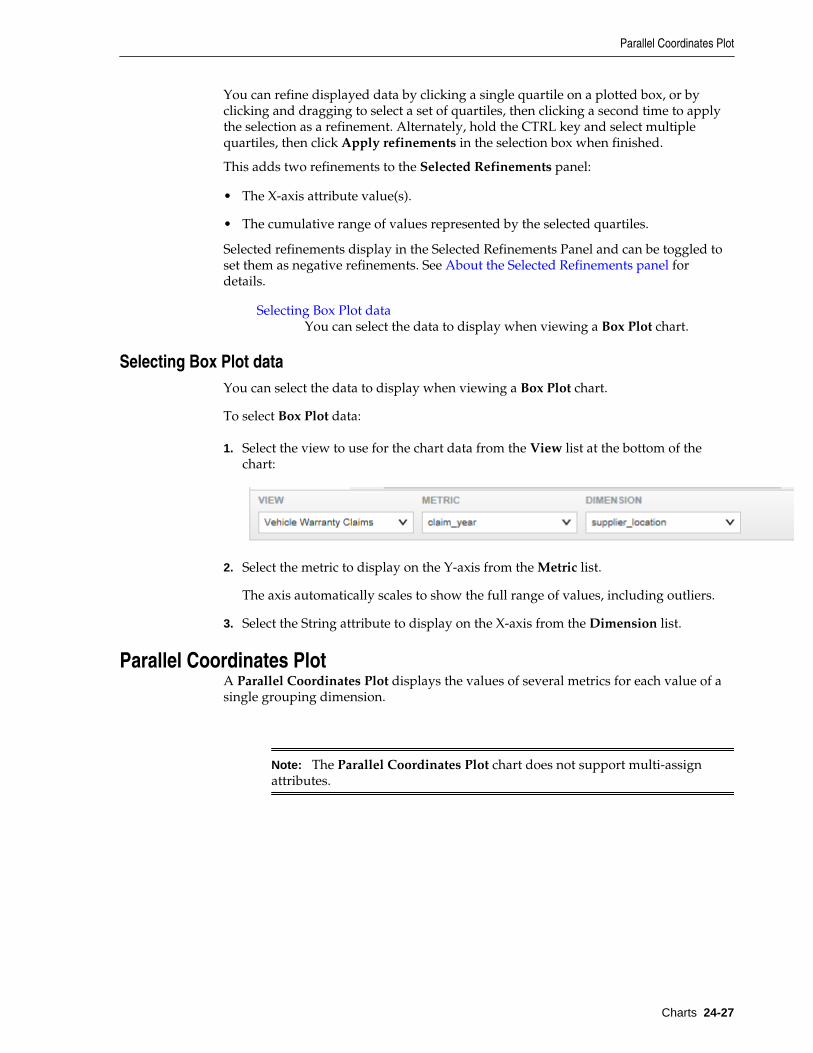
You can refine displayed data by clicking a single quartile on a plotted box, or byclicking and dragging to select a set of quartiles, then clicking a second time to applythe selection as a refinement. Alternately, hold the CTRL key and select multiplequartiles, then click Apply refinements in the selection box when finished.
This adds two refinements to the Selected Refinements panel:
• The X-axis attribute value(s).
• The cumulative range of values represented by the selected quartiles.
Selected refinements display in the Selected Refinements Panel and can be toggled toset them as negative refinements. See About the Selected Refinements panel fordetails.
Selecting Box Plot dataYou can select the data to display when viewing a Box Plot chart.
Selecting Box Plot dataYou can select the data to display when viewing a Box Plot chart.
To select Box Plot data:
1. Select the view to use for the chart data from the View list at the bottom of thechart:
2. Select the metric to display on the Y-axis from the Metric list.
The axis automatically scales to show the full range of values, including outliers.
3. Select the String attribute to display on the X-axis from the Dimension list.
Parallel Coordinates PlotA Parallel Coordinates Plot displays the values of several metrics for each value of asingle grouping dimension.
Note: The Parallel Coordinates Plot chart does not support multi-assignattributes.
Parallel Coordinates Plot
Charts 24-27

On the chart:
• Each metric is represented by a vertical axis.
• Each dimension value is represented by a colored line, which crosses each metricaxis based on the metric value for the dimension value.
To focus on the metric values for a specific dimension value, hover the mouse overeither a specific line or a specific entry in the chart legend.
The line for that dimension value is highlighted, and the rest of the lines grayedout. A tooltip displays listing the metric values.
For example, a Parallel Coordinates Plot can display the average price, average rating,number of cylinders, and average mileage for types of car models.
Refining Parallel Coordinates Plot dataYou can select metric values in a Parallel Coordinates Plot to refine thedisplayed data.
Parallel Coordinates Plot
24-28 Studio User's Guide
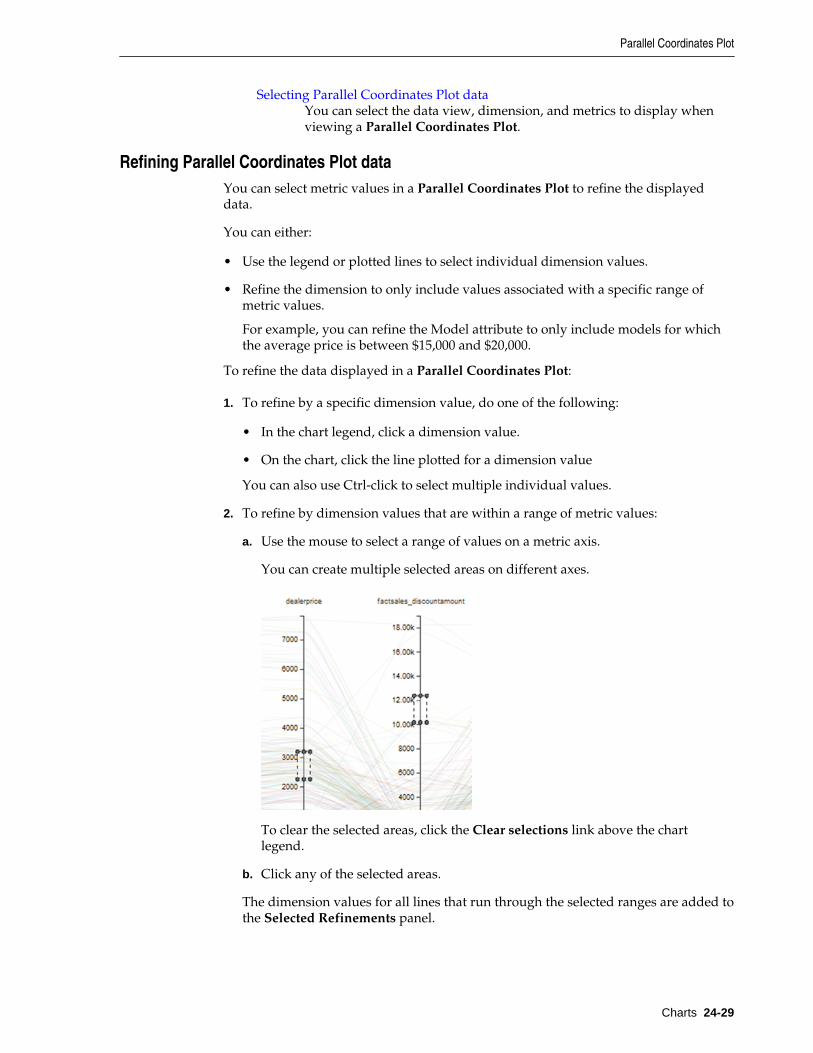
Selecting Parallel Coordinates Plot dataYou can select the data view, dimension, and metrics to display whenviewing a Parallel Coordinates Plot.
Refining Parallel Coordinates Plot dataYou can select metric values in a Parallel Coordinates Plot to refine the displayeddata.
You can either:
• Use the legend or plotted lines to select individual dimension values.
• Refine the dimension to only include values associated with a specific range ofmetric values.
For example, you can refine the Model attribute to only include models for whichthe average price is between $15,000 and $20,000.
To refine the data displayed in a Parallel Coordinates Plot:
1. To refine by a specific dimension value, do one of the following:
• In the chart legend, click a dimension value.
• On the chart, click the line plotted for a dimension value
You can also use Ctrl-click to select multiple individual values.
2. To refine by dimension values that are within a range of metric values:
a. Use the mouse to select a range of values on a metric axis.
You can create multiple selected areas on different axes.
To clear the selected areas, click the Clear selections link above the chartlegend.
b. Click any of the selected areas.
The dimension values for all lines that run through the selected ranges are added tothe Selected Refinements panel.
Parallel Coordinates Plot
Charts 24-29

Selecting Parallel Coordinates Plot dataYou can select the data view, dimension, and metrics to display when viewing aParallel Coordinates Plot.
To select Parallel Coordinates Plot data:
1. From the View list, select the view to use as the source of the plot data.
2. From the Dimension list, select the grouping dimension to display on the chart.
3. To add a new metric to the chart, select the metric to add from the Add Metric...list.
You can select any numeric attribute.
4. To select the aggregation method for a metric, click its drop-down icon and selectthe operation.
Note that when the data is refined to a single record, then on the ParallelCoordinates Plot, the aggregation is removed, and the chart shows the actualmetric values for the record.
5. To remove a metric from the chart, click its delete icon.
6. To change the order of the metric axes:
a. Hover the mouse over the axis label at the top of the axis you want to move.
b. Click and drag the axis to the new location.
Parallel Coordinates Plot
24-30 Studio User's Guide

25Other Data Visualizations
These components provide you with other options for visualizing values in your data.
MapThe Map component allows you to analyze data based on geographiclocation. It can only be used if the data contains at least one geocodeattribute.
Pivot TableThe Pivot Table component allows users to perform comparisons andidentify trends across several cross sections of data.
Summarization BarThe Summarization Bar allows users to quickly view metric ordimension values that summarize aspects of the underlying data.
Tag CloudThe Tag Cloud component allows users to quickly compare a set ofdisplayed terms based on the value of an associated metric, such as thenumber of times the term occurs.
TimelineThe Timeline component allows you to see changes in the value of oneor more metrics over the same time period. For example, one timelinecould track total sales against the sale date, and another could track totalclaims against the claim date.
MapThe Map component allows you to analyze data based on geographic location. It canonly be used if the data contains at least one geocode attribute.
Other Data Visualizations 25-1

Configuring the Map connection to Oracle MapViewerThe Map component uses Oracle MapViewer (11.1.1.7.2 or greater) todisplay the map. Studio includes framework settings to configure theconnection to MapViewer.
Using the MapYou use the Map component to view geographic locations.
Configuring the MapThe Map component configuration allows you to configure the maplayers.
Configuring the Map connection to Oracle MapViewerThe Map component uses Oracle MapViewer (11.1.1.7.2 or greater) to display the map.Studio includes framework settings to configure the connection to MapViewer.
By default, Studio is configured to use the public instance of MapViewer. If you areusing that instance, and your browser has access to the Internet, then you should notneed to make any configuration changes.
Studio includes the following framework settings related to the MapViewerconnection. If you are using your own instance of MapViewer, or if your browser doesnot have Internet access, then you must change these settings. For details onconfiguring framework settings in Studio, see the Administrator's Guide.
Map
25-2 Studio User's Guide

Framework Setting Description
df.mapLocation The URL for the MapViewer eLocation service.The eLocation service is used for the text location search, toconvert the location name entered by the user to latitude andlongitude.
By default, this is the URL of the global eLocation service.
If you are using your own internal instance, and do not haveInternet access, then set this setting to "None", to indicate thatthe eLocation service is not available. If the setting is "None",Studio disables the text location search.
If this setting is not "None", and Studio is unable to connect tothe specified URL, then Studio disables the text locationsearch.
Studio then continues to check the connection each time thepage is refreshed. When the service becomes available, Studioenables the text location search.
df.mapViewer The URL of the MapViewer instance.By default, this is the URL of the public instance ofMapViewer.
If you are using your own internal instance of MapViewer,then you must update this setting to connect to yourMapViewer instance.
df.mapTileLayer The name of the MapViewer Tile Layer.By default, this is the name of the public instance.
If you are using your own internal instance, then you mustupdate this setting to use the name you assigned to the TileLayer.
Using the MapYou use the Map component to view geographic locations.
Showing and hiding map layers
At the bottom left of the Map component is the layer list, which shows the availablelayers configured for the component. You can use the icon in the top-right corner ofthe layer list to expand or collapse the list.
The layer list contains a check box for each numbered point and point layer. To hide anumbered point or point layer, deselect its check box.
If any heat layers are available for the Map component, then there is a single heat layercheck box, with a list containing all of the available heat layers. From the heat layerlist, select the heat map to display. To hide the heat layer entirely, deselect the heatlayer check box.
Map
Other Data Visualizations 25-3

Types of map layersEach Map component is configured with one or more map layers. Each map layer usesa specific layer type.
The available map layer types are:
Layer Type Description
Numbered pointlayer
A numbered point layer displays a numbered point for each location onthe map.
The layer includes a separate list containing the details for each point.
The Map component can display multiple numbered point layers at thesame time, with color used to differentiate the layers.
Point layer A point layer displays a point for each location on the map.
The Map component can display multiple point layers at the same time,with color used to differentiate the layers.
Map
25-4 Studio User's Guide

Layer Type Description
Heat map layer A heat map layer can display:• A point for each location on the map.• A shaded cloud with color gradients to show either the relative
density of the points on the map, or the change in an associatedmetric value between locations. The cloud colors are also reflected onthe map points.
You can choose whether to display just the points, just the cloud, orboth.
The Map component can only display one heat layer at a time.
Using the numbered points listWhen a numbered point layer displays on the Map component, the component bydefault displays the numbered point list to the right of the map.
You can use the expand/collapse icon to the left of the list to show or hide the list.
The list also uses the standard pagination to allow you to page through the list andcontrol the number of points to display per page. See Paging through data.
From the numbered point list:
1. If there is more than one numbered point layer, then from the Map Layer list, selectthe layer for which to display the numbered point list.
2. To change the sort order for the numbered point list:
a. From the Sort list, select the attribute to use for the sort.
Note that if the data is currently refined using a keyword search, then the listalso includes a Search Relevance option.
b. To switch the sort direction, click the sort direction toggle. When you change thesort for a numbered point layer, it affects the points displayed on the map.
Changing the display of points and heat map layersFrom the layer list, for point and heat map layers, you can change the amount ofinformation displayed.
To adjust the display of point and heat map layers:
1. In the layer list, the point layer name is followed by the number of pointsdisplayed. To change the point layer display:
Map
Other Data Visualizations 25-5

a. Click the edit icon for the point layer.
b. On the layer dialog, from the Display list, select whether to display the top orbottom set of points.
c. From the number list, select the number of points to display.
d. From the Based on list, select the value to use to determine the top or bottompoints.
2. In the layer list, the heat layer information includes the number of points. Tochange the heat layer display:
a. Click the edit icon for the heat map.
b. On the layer dialog, from the Display list, select whether to display the top orbottom set of points.
c. From the number list, select the number of points to display.
d. Under Display heat as, click the radio button to indicate whether to displayonly the points, only the cloud, or both the points and the cloud.
e. Use the Range slider to determine the range for calculating the cloud.
The range determines how much a point affects the cloud calculation. The largerthe range, the more impact each point has on the cloud calculation.
Searching the mapThe Map component can include both text and range filter search tools to allow you tofind specific locations.
The text search allows you to display locations based on their proximity to a specifiedplace name. For example, you can display locations within 10 miles of Boston,Massachusetts.
Map
25-6 Studio User's Guide

Note: The version of MapViewer used by the component may be limited toselected geographic areas. If you try to do a text search based on a locationoutside those geographic areas, an error displays.
The range search allows you to only display locations in a selected area of the map.
To do text and range searches on the Map component:
1. To do a text search:
a. Click the Geospatial Text Search icon above the zoom bar.
The Location Search pop-up displays.
b. In the field, type the search text.
c. In the Show locations within field, specify the number of miles or kilometers,then select the unit of measurement.
d. Click the search icon.
The map is updated to only show pins for locations within the specified area.
If the Auto Pan check box is selected, the map shifts automatically to display allof the pins for the first page of results. This also adds a Range Filter entry to theSelected Refinements panel.
2. To do a range search:
a. Click the range search icon.
b. On the map, click and drag the mouse from the middle to the edge of the area toselect.
As you drag the mouse, the distance from the point you started at displays.
c. When you have selected the area you want, release the mouse.
The map is updated to only display pins for locations within that selected area.
A Range Filter entry also is added to the Selected Refinements panel.
Map
Other Data Visualizations 25-7

If the Auto Pan check box is selected, the map shifts automatically to display allof the pins for the first page of results.
Displaying details for a map pointWhen you click a map point, Studio displays additional information about thatlocation.
If several numbered points are clustered together, then the Map component displaysthe number of points in the cluster.
For point layers, when there is a cluster of points, Studio displays a circle around thecluster.
When you click a cluster of points, the Map component displays the details for all ofthe points in the cluster.
Map
25-8 Studio User's Guide

The values in the point details may be configured to allow you to refine the data. See Using a component to refine data.
The point details may also include a link to display record details. See Displayingdetails for a component item.
Configuring the MapThe Map component configuration allows you to configure the map layers.
About the default Map configurationWhen the Map component is first added, it uses the default configuration. For eachbase view that has a geocode attribute, the component includes a numbered pointlayer. The layer name is set to the view name.
The details for the default layers contain the identifying attributes for the view.
The automatically created layers are visible by default.
Adding, editing, and deleting map layersFrom the Map Layers tab of the Map component edit view, you manage the list oflayers.
To add, edit, and delete map layers:
1. To add a new layer to the map, either:
• Hover the mouse over +Layer, then in the list, click the type of layer to add.
Map
Other Data Visualizations 25-9

For details on the map layer types, see Selecting the map layer type.
• In the edit view menu, click + next to the Map Layers entry in the edit viewmenu.
A new layer is added to the list.
If you selected the layer type when you added the layer, then the Data Selectiontab displays. See Selecting the view to use for the map layer.
If you did not select a layer type, then by default the layer is a numbered pointlayer, and the Layer Type tab displays. See Selecting the map layer type.
2. To edit a layer, click the layer name.
3. To change the name of a layer:
a. Double-click the layer name.
The name displays in an editable field.
b. Type the new name.
c. Press Enter.
4. To delete a layer, click its delete icon.
Configuring a map layerFor each map layer, you select the data to use and configure the display.
Selecting the view to use for the map layer
The Data Selection tab for the map layer contains the list of views from the projectdata. Map layers can only use views that contain a geocode attribute. The geocodeattribute cannot be multi-value.
Views that do not contain a geocode attribute are disabled.
Selecting the map layer type
By default, a new map layer is a numbered point layer. After you create the layer, youcan select the type of layer.
The available layer types are:
Map
25-10 Studio User's Guide

Layer Type Description
Numbered Points Displays each location on the map as a numbered point.The numbered points are also displayed in a correspondinglist.
End users can page through the list of numbered points.
This is the default layer type for a new map layer.
Points Displays each location on the map as a point.
Heat Layer Can display:• A point for each location on the map. The points are color
coded based on the value of a selected metric.• Shaded clouds to show the change in metric values across
a geographic area.End users can display one or the other or both.
On the Layer Type tab for a layer, to select the layer type, click the icon for the type.
Defining the map points for the map layer
On the Points Definition tab for the map layer, you select the geocode attribute to usefor the map points, and whether the map layer uses aggregated points.
For an aggregated layer, you also select the group dimensions to use for theaggregation.
For a heat map layer, you select the metric to use to determine the point colors.
To define the map points:
1. From the Geospatial attribute list, select the geocode attribute to use for the maplocations.
Map
Other Data Visualizations 25-11

2. You also select whether the map locations need to be aggregated.
• To not aggregate the map locations, click Detail points.
• To aggregate the map locations, click Aggregated points.
For example, if the view contains a simple list of stores, with the geocode being thestore location, you would not need to aggregate the locations, and could use thedetail points option.
But if the view contains a list of sales transactions, with the geocode being the storelocation for the sale, then to generate a single list of store locations, you mightaggregate by a dimension such as the store name.
3. If you are creating an aggregated map layer, then you configure the list of groupingdimensions to use for the aggregation.
a. To add a dimension to the list, drag a dimension from the Available attributeslist to the Grouping dimensions list.
b. To determine the order for applying aggregation, drag each dimension to theappropriate location in the list. The dimension at the top of the list is appliedfirst.
c. To remove a dimension from the list, click its delete icon.
4. For a heat map layer, you can select a metric to use for setting the layer point andheat cloud colors.
Map
25-12 Studio User's Guide

For example, if the locations are stores, then the heat map layer colors could reflectthe total sales at each store.
If you do not select a metric, then the heat map colors are based on the relativedensity of the points on the map. So if the locations are stores, then the heat mapcolors would change based on the number of stores in a given area.
To select the metric, click Select Metric. On the metric dialog, click the metric, thenclick Apply.
For predefined metrics or system metrics, the aggregation method is built in.
For other attributes, the default aggregation method is assigned. You can then usethe list to select a different aggregation method.
To select a different metric, click the delete icon, then click Select Metric.
Configuring the layer name and display options
On the Layer Properties tab for the map layer, you configure the layer name andoptions for displaying the map locations, and, for heat map layers, the cloud overlay.
On the Layer Properties tab:
1. In the Layer name field, type the name of the layer.
The layer name is used to identify the layer on the map legend.
For numbered point layers, the name is also used in the layer list on the numberedpoint list.
2. If the view contains multiple geocode attributes, then from the Geo filteringattribute list, select the attribute to use when searching or filtering the locations.
By default, the map layer uses the same geocode attribute for both the map pointsand the filtering.
3. For point layers and heat map layers, from the Size of points list, select the size ofthe map location points.
4. For numbered point and point map layers, from the Layer color list, select the colorto use to display the points.
5. For a heat map layer, to configure the color and metric value range:
Map
Other Data Visualizations 25-13

a. From the Layer color list, select the color range to use for the map points andcloud.
b. To automatically calculate the minimum and maximum metric values for thecolor range, click Dynamically determine min/max values on color ramp.
c. To specify the minimum and maximum values, click Fixed values on colorramp, then in the Minimum and Maximum fields, type the minimum andmaximum values.
6. For a heat map layer, under Heat Options:
a. Click the radio button to indicate whether to display by default the locationpoints, heat cloud, or both.
b. To allow end users to adjust the heat range, check the Enable end user to adjustheat range check box.
Selecting and configuring the details to display for each map point
On the Details Template tab for the map layer, you configure the information todisplay when users click a point on the map. For detail points, you can also determinewhether to include a separate link to display record details.
To configure the map location details:
1. For a numbered point layer, you can configure a different set of details to displayin the numbered points list and when users click the point on the map. To enable
Map
25-14 Studio User's Guide

the different sets of details, deselect the Use same configuration for pin and listdetail templates check box.
2. To add an item to a details template, drag it from the Available attributes list tothe template.
3. To determine the display order of the template items, drag each item to theappropriate location in the list.
4. To remove an item from a template, click its delete icon.
5. To configure the item display, click its edit icon. On the configuration dialog:
a. For a metric other than a system or predefined metric, from the AggregationFunction list, select the aggregation method to use.
b. For a date/time attribute, from the Date/time Subset list, select the subset ofdate/time units to display (for example, Year, Year-Month, Year-Month-Day).
c. To include the attribute display name as well as the value, check the Showattribute name in the template check box.
d. To allow users to sort by the attribute, check the Allow sorting by this attributecheck box.
e. Under Value Formatting, configure the display format for the value. See Configuring attribute value formats.
f. Under Actions, configure the action for when the user clicks the value.
Map
Other Data Visualizations 25-15

For information on configuring actions for displayed values, see Configuringactions for attribute values.
g. To save the configuration, click Apply.
6. If the points are not aggregated, then to display a link to record details, check theShow link to record details check box.
No check box displays for aggregated points and you cannot show a record detailslink.
Configuring pagination and sorting for the map layer
On the Sorting and Pagination tab for the map layer, you configure the available sortoptions and pagination for the layer.
To configure the sorting and pagination:
1. To allow end users to change the sort order, check the Enable end user sortingcontrols check box.
Selecting this check box lets end users sort the map using any of the values in thedetails template.
2. To configure the default sort order:
a. To select the attributes to include in the default sort, drag the attributes from theAvailable attributes list to the Default Sort drop zone.
b. To determine the order for applying the sort, drag each attribute to theappropriate location in the list.
c. For each sorting attribute, use the sort order icon to indicate whether to sort inascending or descending order.
d. To remove an item from the default sort, click its delete icon.
3. To always display the same fixed number of locations on the map:
a. Click Fixed number of points.
b. In the field, enter the number. For a numbered points layer, this is the numberof points to display per page. Users can then page through the list.
Map
25-16 Studio User's Guide

4. To allow end users to change the number of locations to display:
a. Click Enable end user to change number of points.
b. In the Number of pin options field, type a comma-separated list of options forthe number of locations to display.
c. From the Default number of points list, select the default number of locationsto display.
Determining which map layers are visibleIf you are using the default map layer configuration, then all of the automaticallygenerated map layers are visible on the end user view of the Map component. If youare not using the default configuration, then you can control whether the layer isvisible.
On the Map Layers tab, to not display the map layer on the end user view of the Mapcomponent, deselect the layer's check box.
Configuring general display settings for the MapOn the General Settings tab of the Map component edit view, you configure generalsettings for the component as a whole. These settings are not specific to a map layer.
On the General Settings tab:
1. Under Filtering:
a. To allow users to search the map using the range search, check the Enablegeospatial range filtering via marquee check box.
b. To allow users to search the map using the location text search, check theEnable geospatial filtering via text search check box.
2. Under Display Settings:
a. If the map includes a numbered pin layer, then to display the numbered pin listby default when the component is first displayed, check the Show numberedlist overlay panel by default check box.
b. In the Map height field, type the height in pixels for the Map component.
Map
Other Data Visualizations 25-17

c. From the Units of measure list, select the unit of measurement to use for themap.
To use the preferred unit of measurement based on the current locale, select uselocale default.
Otherwise, you can have the map always use either miles or kilometers.
Pivot TableThe Pivot Table component allows users to perform comparisons and identify trendsacross several cross sections of data.
The values in the header rows and columns represent every possible grouping of theselected data fields.
Each body cell contains a metric value that corresponds to the intersection of thevalues in the heading rows and columns. In the following example, each cell containseither the average price or average score for a specific combination of region,designation, and vintage.
Cells may also be highlighted based on the displayed value. In the example, values arehighlighted in red if they are below a certain number, and in green if they are above acertain number.
Using the Pivot TableIn addition to viewing the Pivot Table data, you may be able to changethe table layout.
Configuring the Pivot TableFor a Pivot Table component, you select the view to use and configurehow the table displays.
Using the Pivot TableIn addition to viewing the Pivot Table data, you may be able to change the tablelayout.
The Pivot Table includes the following common functions, summarized in Commoncomponent controls:
Pivot Table
25-18 Studio User's Guide

• Actions > Print
• Actions > Export
Navigating through Pivot Table dataYou use the scroll bars to scroll through the Pivot Table rows and columns. You canalso use the scroll bars to jump to a location.
When you hover the mouse over a location on a scroll bar, Studio calculates anddisplays the dimension values for that relative location in the Pivot Table.
For the vertical scroll bar, the row dimension values are shown. For the horizontalscroll bar, the column dimension values are shown.
If you then click the scroll bar, the Pivot Table jumps to that location.
Displaying summaries and highlighting in the Pivot TableThe Pivot Table component can include summaries of individual row or columndimensions as well as summary rows and columns for the entire table. Individualvalues may also be highlighted. The Pivot Table may be configured to allow you toshow or hide the summaries, and to show or hide the highlighting
If you can control these features, then a View Options button displays at the top of thetable.
To enable and disable these options:
1. Click View Options.
A list of check boxes displays. There are options for enabling and disabling thehighlighting, the dimension summaries, and the table summaries.
2. To show or hide the value highlighting, select or deselect the ConditionalFormatting check box.
3. To show or hide the summaries for each dimension, select or deselect theSummaries check box.
4. To show or hide the table summaries, which aggregate all of the values in a row orcolumn, select or deselect the Grand Summary check box.
Sorting the Pivot Table dimension valuesFor each Pivot Table row and column dimension, you can determine the order fordisplaying dimension values.
At the top left of the Pivot Table are the headings with the dimension names.
Pivot Table
Other Data Visualizations 25-19

To switch the display order of the values for a dimension, click the dimensionheading.
Changing the layout of the Pivot TableYou may be able to change the layout of the Pivot Table, including the dimensionsand metrics that are displayed and the row and column display order.
If the Pivot Table is configured to allow you to change the table layout, then aConfigure button displays at the top of the component.
To change the layout of the Pivot Table table:
1. Click Configure.
On the configuration view, the list at the left shows the available metrics anddimensions that are not currently displayed on the table.
The rest of the configuration view shows a mockup of the displayed dimensioncolumns and rows, with the list of displayed metrics in the middle. A metricsplaceholder indicates whether the metrics are displayed as rows or columns.
2. To change the order of the displayed dimension rows or columns, drag thedimension to the new location.
3. To remove a dimension or metric, click its delete icon.
The dimension or metric is removed from the table and added to the available list.
4. To add a new dimension, drag the dimension from the available list to theappropriate location in the row or column groups.
Pivot Table
25-20 Studio User's Guide

5. To add a new metric, drag the metric from the available list to the appropriatelocation in the metrics list.
If the metrics are displayed as columns, then the metric at the top of the listdisplays in the leftmost column.
If the metrics are displayed as rows, then the metric at the top of the list displays inthe top row.
6. To swap all of the rows and columns, including the metrics, click the swap icon inthe top left corner of the layout.
7. To only switch whether the metrics are displayed as rows or columns, click theswap icon in the metrics placeholder.
8. To change the display order of the metric rows or columns, drag each metric to theappropriate location in the list.
9. As you make changes, a preview of the resulting table displays below theconfiguration. It is updated automatically as you make changes.
a. To hide the preview, click Hide Preview.
b. To show the preview again, click Show Preview.
10. To revert the layout back to the original default, click Reset to Default.
11. To exit the configuration view, click Exit Configuration.
The currently displayed layout is used.
Using the Pivot Table to refine the project dataYou can use the Pivot Table dimension values to refine the project data.
If a dimension allows refinement, then when you click the dimension values in therow and column headings, the data is refined by that value.
When you click a metric value, then the data is refined by all of the dimension valuesthat apply to that cell and that allow refinement.
So for example, if a cell displays an average price of $25.55 for Red wines in theBordeaux region for the year 1992, then when you click the value $25.55, the data isrefined by the values:
• Red for the Wine Type attribute
• Bordeaux for the Region attribute
• 1992 for the Vintage attribute
For more details on refining by data on a component, see Using a component to refinedata.
Configuring the Pivot TableFor a Pivot Table component, you select the view to use and configure how the tabledisplays.
Pivot Table
Other Data Visualizations 25-21

Configuring the layout of the Pivot TableOnce you select the view to use, you can configure the layout of the dimensions andmetrics on the Pivot Table table.
About configuring the Pivot Table layout
You use the Table layout tab of the Pivot Table edit view to configure the layout ofthe Pivot Table.
The layout includes:
• The dimensions to use to aggregate the Pivot Table
• How to group the dimension values into nested rows and columns. The table musthave at least one row-based dimension.
• The metrics to display on the Pivot Table
• Whether to display those metrics as rows or columns. By default, the metricsdisplay as columns, with the headings in the last row of column headings.
Adding dimensions and metrics to the Pivot Table
Each Pivot Table consists of dimension rows and columns to determine theaggregation, and metrics to determine the displayed values.
At the right of the Table Layout tab is a mockup of the Pivot Table format, with dropzones to add dimensions to the row and column groups, and to add metrics. Aplaceholder block indicates whether the metrics are displayed as columns or rows.
Pivot Table
25-22 Studio User's Guide

To populate the default view of the Pivot Table:
1. To add a dimension to a row or column group, drag the dimension from the list toeither the row or column group drop zone.
You must add at least one dimension to the row group zone.
If there are existing row or column dimensions, you can drop the new dimensionbefore or after those dimensions.
You can also drag and drop the dimensions within the mockup to change the orderof the row and column groups.
2. To add a metric to the Pivot Table, drag the metric from the list to the metric dropzone.
The order of the metrics in the list determines the order (from left to right forcolumns or top to bottom for rows) of the metrics in the Pivot Table. Theplaceholder also lists the selected metrics.
Changing the orientation of the Pivot Table
The Table Layout tab on the Pivot Table edit view includes options to switch whetherdimensions and metrics are displayed as rows or columns.
Pivot Table
Other Data Visualizations 25-23

To switch the Pivot Table row and column groups, click the swap icon at the top leftof the mockup. The swap includes the metrics, so for example if your metrics weredisplayed as columns, when you click Swap, they are changed to display as rows.
To only change the location of the metrics, click the swap icon on the metricsplaceholder.
Adding dimensions and metrics
If you are allowing end users to change the configuration of the Pivot Table, you canprovide additional available dimensions and metrics that are not displayed on thedefault view of the table.
On the Table Layout tab of the Pivot Table edit view, the Available attributes for enduser configuration section below the Pivot Table mockup contains the lists of theseavailable dimensions and metrics.
To add the additional dimensions and metrics:
1. To expand or collapse the section, click the section heading.
2. To add additional available dimensions, drag the dimensions from the attributeslist to the Dimensions list.
3. To add additional available metrics, drag the metrics from the attributes list to theMetrics list.
Configuring a dimension
For each Pivot Table dimension, you can configure the label for the dimension,whether to display a summary row or column for the dimension, and rules for refiningby the dimension value.
From the Table Layout tab of the Pivot Table edit view, to configure a dimension:
1. Click the edit icon for the dimension you want to configure.
The Edit Dimension dialog displays.
Pivot Table
25-24 Studio User's Guide

2. If the dimension is a date/time attribute, then from the Date/time subset list, selectthe default date/time subset to display.
By default, Studio selects the largest date/time unit that is available for thatattribute.
3. On the edit dimension dialog, to display a summary row or column for thedimension, check the Enable dimension summaries check box.
4. Under Label, by default, the summary label is "Summary", and Default is selected.
To provide a custom label, click Custom, then type the new label into the field.
5. Use the Attribute Cascade section to configure cascading for the dimension.
For details on dimension cascading and how to configure it, see Configuringcascading for dimension refinement.
6. To save the dimension configuration, click Apply.
Configuring a metric
For a Pivot Table metric, you can configure the aggregation method for the metric, thetooltip for summary values, and the format of the metric value.
For information on selecting the aggregation method for a metric, see Selecting theaggregation method to use for a metric.
To configure all of the options for a metric:
1. On the Table Layout tab, click the edit icon for the metric you want to edit.
The Edit Count Metric dialog displays.
Pivot Table
Other Data Visualizations 25-25

2. The Summary Calculation section contains the Summary Tooltip field, used toadd a description to the tooltip displayed when users hover the mouse over ametric value in a summary row or column.
3. The Display Options section contains a setting to determine the horizontalalignment of the value in the metric column. When the dialog is first displayed, thesection is collapsed.
To expand or collapse the section, click the section heading.
To select the alignment, click the radio button.
4. The Value Formatting section contains settings to customize the format of themetric values.
For details on formatting displayed values, see Configuring attribute value formats.
5. To save the metric configuration, click Apply.
Allowing end users to configure the table layout
You can configure the Pivot Table to allow end users to change the layout.
On the Table Layout tab of the Pivot Table edit view, to allow end users to change thelayout, check the Enable Pivot Table configuration by end users check box.
Highlighting Pivot Table metric values that fall within a specified rangeThe Conditional Formatting tab of the Pivot Table edit view allows you to highlightspecific metric values.
To configure whether to use conditional formatting, and select the values to highlight:
Pivot Table
25-26 Studio User's Guide

1. To allow conditional formatting, make sure that the Enable conditional formattingcheck box is selected. It is selected by default.
If the check box is not selected, then there is no conditional formatting.
2. In the Metrics list, click the metric for which to configure conditional formatting.
For each metric, the list displays the number of conditional formatting rules createdfor it.
3. To add a new range of values to highlight for that metric, click +Add Condition.
4. To configure a condition:
a. From the Condition Rule type list, select the type of comparison.
b. In the field (or fields, for the between and a range from options), enter thevalue(s) against which to do the comparison.
Note that for the between option, the values are inclusive. So if you specify arange between 20 and 30, values of 20 and 30 also are highlighted.
c. From the Color list, select the color to use for the highlighting.
d. In the Tooltip Description field, type the text to display in the tooltip for ahighlighted cell.
5. The conditions are applied based in the order they are listed. So a condition at thetop of the list has a higher priority than a condition lower in the list.
To change the priority of the conditions, drag and drop them to the appropriatelocation in the list.
6. To remove a condition, click its delete icon.
Configuring display options for the Pivot TableThe Display Options tab of the Pivot Table edit view contains options for setting sizeand other display options for the Pivot Table table.
To configure the Pivot Table display options:
1. Under Table height, in the field, type the number of rows that are visible at a time.
2. In the Column width field, type the width in pixels to use for each column.
3. Under Grid display, to hide any empty rows or columns, check the Hide emptyrows/columns check box.
4. Under Summaries, use the check boxes to indicate whether to display thesummary and grand summary rows by default.
Summarization BarThe Summarization Bar allows users to quickly view metric or dimension values thatsummarize aspects of the underlying data.
Each summary item contains one of the following types of values:
Summarization Bar
Other Data Visualizations 25-27

SummaryItem
Value Description
Metricvalue
The actual value of a specific metric, such as total sales or average profit.
Dimensionvalue
The dimension value associated with either the top or bottom value of anassociated metric value, such as the product category with the highest totalsales.
Number offlags
The number of flags. Flags are based on the value of a metric for a selecteddimension or dimensions.For example, a flag summary item can reflect the number of product categorieswith more than 500 total sales.
Values can use icons and color highlighting to provide additional context for thatvalue. You can also display a tooltip containing a description and value details:
For flags, you can click the number to display the list of values.
Some summary values can redirect to a configured URL. Dimension values may berefinable -- see Using a component to refine data for details.
Configuring Summarization Bar display optionsThe Display Options tab of the Summarization Bar edit view containssettings to control the label position and text size for all of the summaryitems.
Adding, renaming, and deleting summary itemsWhen you first add a Summarization Bar component to a project page,it automatically displays a single metric value summary item that showsthe number of records in the base view of the first data set. You can add,rename, reorder, or remove displayed items.
Configuring a metric value summary itemFor a metric summary value, on the Define Item tab of theSummarization Bar edit view, you select the metric value to display.
Summarization Bar
25-28 Studio User's Guide
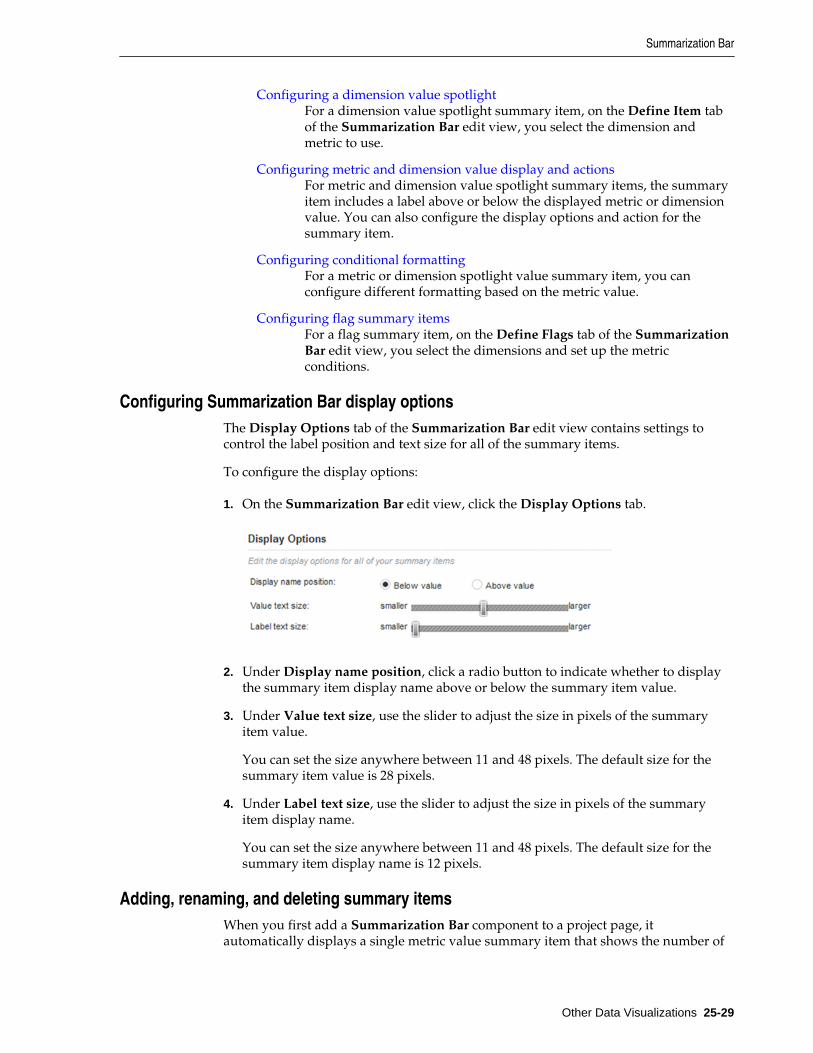
Configuring a dimension value spotlightFor a dimension value spotlight summary item, on the Define Item tabof the Summarization Bar edit view, you select the dimension andmetric to use.
Configuring metric and dimension value display and actionsFor metric and dimension value spotlight summary items, the summaryitem includes a label above or below the displayed metric or dimensionvalue. You can also configure the display options and action for thesummary item.
Configuring conditional formattingFor a metric or dimension spotlight value summary item, you canconfigure different formatting based on the metric value.
Configuring flag summary itemsFor a flag summary item, on the Define Flags tab of the SummarizationBar edit view, you select the dimensions and set up the metricconditions.
Configuring Summarization Bar display optionsThe Display Options tab of the Summarization Bar edit view contains settings tocontrol the label position and text size for all of the summary items.
To configure the display options:
1. On the Summarization Bar edit view, click the Display Options tab.
2. Under Display name position, click a radio button to indicate whether to displaythe summary item display name above or below the summary item value.
3. Under Value text size, use the slider to adjust the size in pixels of the summaryitem value.
You can set the size anywhere between 11 and 48 pixels. The default size for thesummary item value is 28 pixels.
4. Under Label text size, use the slider to adjust the size in pixels of the summaryitem display name.
You can set the size anywhere between 11 and 48 pixels. The default size for thesummary item display name is 12 pixels.
Adding, renaming, and deleting summary itemsWhen you first add a Summarization Bar component to a project page, itautomatically displays a single metric value summary item that shows the number of
Summarization Bar
Other Data Visualizations 25-29

records in the base view of the first data set. You can add, rename, reorder, or removedisplayed items.
Summary items can be one of three types:
Summary Item Type Description
Metric Value Displays a single aggregated metric value, such as total salesor average score.
Dimension Value Spotlight Displays a single dimension value. The displayed dimensionvalue is associated with the top or bottom value for a singlemetric.For example, you could display the name of the productcategory that has the highest or lowest total sales.
Flag Displays the number of values for a selected dimension orcombination of dimensions that meet a set of metricconditions.For example, you could display the number of combinationsof product category and sales region that had more than 500sales and for which the percentage of total sales was at least90% of expected sales.
To add, rename, or delete summary items:
1. In the component menu bar, click the Options icon:
2. To add a new summary item to the Summarization Bar, either:
• Click the drop-down arrow beside+ Itemand select the type of summary item toadd from the list:
The Select Data tab displays.
• In the Edit View menu, click + next to the Summary Items heading.
This adds a metric item. Click the Select Item Type tab to select a different type.
3. To configure a summary item, click the item name.
Summarization Bar
25-30 Studio User's Guide

a. To rename a summary item, select the Summary Items tab and double-click theitem name.
The name displays as an editable field.
b. Type the new name, then press Enter.
c. To return to the Summary Items list after editing a summary item, click theSummary Items option in the left menu.
4. To determine the order for displaying summary items, drag each item in the list tothe desired location.
5. To delete a summary item, click its x icon.
Configuring a metric value summary itemFor a metric summary value, on the Define Item tab of the Summarization Bar editview, you select the metric value to display.
To select and configure the summary item value for a metric summary item:
1. To select the metric:
a. Click Select Metric.
b. On the Select a Metric dialog, click the metric you want to use. You can use thefilter field to search for a specific metric.
c. Click Apply.
2. To select a different aggregation method for a metric, you can use the list next tothe metric name.
Summarization Bar
Other Data Visualizations 25-31

You cannot select a different aggregation method for a predefined metric.
3. To select a different metric:
a. Click the delete icon for the current metric.
b. Click Select Metric.
c. On the Select a Metric dialog, click the metric you want to use.
d. Click Apply.
4. To configure the metric:
a. Click its edit icon.
b. For metrics that are not predefined, the configuration dialog includes a list toselect the aggregation method.
c. The Value Formatting section allows you to customize the format of thedisplayed value.
For details on customizing a displayed value on a component, see Configuringattribute value formats.
Configuring a dimension value spotlightFor a dimension value spotlight summary item, on the Define Item tab of theSummarization Bar edit view, you select the dimension and metric to use.
To select the summary item values:
1. To select the dimension for which to display a value:
a. Click Select Dimension.
Summarization Bar
25-32 Studio User's Guide

b. On the Select a Dimension dialog, click the dimension you want to use.
c. Click Apply.
2. To display the dimension value with the highest metric value, click Top Value.
To display the dimension value with the lowest metric value, click Bottom Value.
3. To select a different dimension:
a. Click the delete icon for the current dimension.
b. Click Select Dimension.
c. On the Select a Dimension dialog, click the dimension you want to use.
d. Click Apply.
4. To select the metric value:
a. Click Select Metric.
b. On the Select a Metric dialog, click the metric you want to use. You can use thefilter field to find a specific metric.
c. Click Apply.
5. To select a different aggregation method for the metric, you can use the list next tothe metric name.
You cannot select a different aggregation method for a predefined metric.
6. To select a different metric:
a. Click the delete icon for the current metric.
b. Click Select Metric.
c. On the Select a Metric dialog, click the metric you want to use.
d. Click Apply.
7. To configure the metric or dimension:
a. Click its edit icon.
b. For date/time dimensions, from the Date/time Subset list, select the date/timesubset to display on the component.
By default, the largest available subset is used.
Summarization Bar
Other Data Visualizations 25-33

c. For metrics that are not predefined, the configuration dialog includes a list toselect the aggregation method.
d. For both the dimension and the metrics, the Value Formatting section allowsyou to customize the format of the displayed value.
For details on customizing a displayed value on a component, see Configuringattribute value formats.
Configuring metric and dimension value display and actionsFor metric and dimension value spotlight summary items, the summary item includesa label above or below the displayed metric or dimension value. You can alsoconfigure the display options and action for the summary item.
On the Summarization Bar edit view, on the Define Item tab for the summary item:
1. The Display Name setting determines the label displayed below the metric ordimension value.
You can either display the dimension and metric names, or use a custom name. Thecustom name is also used as the name of the summary item.
2. Under Display Options, use the Tooltip setting to provide a description of thesummary item.
In the tooltip text, use the {MetricValue} token to represent the metric value.
3. The Width setting determines the maximum width of the summary item block.
You can use the default maximum width, or set a custom maximum width.
If the value doesn't fit within the maximum width of the summary item, thenStudio truncates it.
4. For a metric summary item, you can allow users to click the metric value in orderto navigate to a different page in the project or to an external URL.
To enable the hyperlink, you must at least provide the page name or URL. See Configuring actions for attribute values.
5. For a dimension value spotlight item, you can allow users to click the dimensionvalue in order to either refine by the value, or to navigate to a different page in theproject or to an external URL.
Summarization Bar
25-34 Studio User's Guide

Under Actions, from the Type list, select the action. For details on configuring anaction from a component value, see Configuring actions for attribute values.
Configuring conditional formattingFor a metric or dimension spotlight value summary item, you can configure differentformatting based on the metric value.
On the Conditional Formatting tab for a summary item, to configure the conditionalformatting:
1. Select the type of value to use to determine whether the condition is met:
a. Click the radio button to indicate the value to use.
The options are:
Comparison Type Description
Metric value Indicates to apply the conditional formatting based onthe actual summary item value.
Percentage of anothermetric
Indicates to apply the conditional formatting based onthe ratio of the summary item metric value to anothermetric.For example, if a summary item displays total sales, thenyou could configure formatting based on the ratio oftotal sales to expected sales.
So you might configure the total sales to display in greenif they are greater than or equal to 100% of the expectedsales.
b. For a ratio to another metric, to select the other metric, click Select Metric.
c. On the Select a Metric dialog, click the metric you want to use, then clickApply.
2. From the Style list, select the style to use for the conditional formatting.
The style determines the available set of icons to display on the summary item.
3. To add a condition to the list, click +Condition.
Summarization Bar
Other Data Visualizations 25-35

4. To configure a condition:
a. From the Display list, select the icon to display when the condition is met.
Note that you can have multiple rows that use the same display. For example,you may want to use the same formatting to highlight both very low and veryhigh outlying values.
b. Under When value is, select the comparison to use, then enter the appropriatevalues.
c. In the Description column, type a description to display in the summary itemtooltip when the condition is met.
5. To remove a condition, click its delete icon.
6. In the Display Options section:
a. By default, the text color on the summary item matches the icon color, if color isused. To always display the summary item value in black, check the Setsummary item text to black for all conditions check box.
b. To only display the summary item if the value meets one of the conditions,check the Only display this summary item if it meets a condition check box.
For example, if you create a condition for total sales for when the value is lessthan 1,000,000, then if this check box is selected, the summary item does notdisplay at all when total sales are greater than or equal to 1,000,000.
Configuring flag summary itemsFor a flag summary item, on the Define Flags tab of the Summarization Bar edit view,you select the dimensions and set up the metric conditions.
If you select multiple dimensions, then the conditions are applied to combinations ofthose dimension values.
For example, if you select the product category and region dimensions, and set the flagcondition to total sales greater than 500, then the flag summary item displays if anycombination of product category and region has total sales greater than 500.
To configure a flag summary item:
1. In the Display Name field, type the text to display on the summary item.
The display name is also used as the name of the summary item.
2. From the Flag Color list, select the background color to use for the number ofvalues that match the flag criteria.
Summarization Bar
25-36 Studio User's Guide

3. To add a dimension to the flag summary item:
a. Click + Dimension.
b. On the Select a Dimension dialog, click the dimension you want to use.
c. Click Apply.
If you select a date/time attribute as a flag dimension, then by default, Studio usesthe largest available date/time subset. For example, if the attribute has Year, Year-Month, and Year-Month-Day enabled, then the Year subset is used.
4. The dimension values are applied in the order they are listed. To change the order,drag each dimension to the appropriate location in the list.
5. To remove a dimension from the list, click its delete icon.
6. Use the Define Conditions list to select the list of conditions that must be met inorder for the flag summary item to display.
A flag summary item is only displayed on the end user view if at least one valuematches all of the conditions in the list.
a. To add a condition to the list, click +Condition.
b. To remove a condition from the list, click its delete icon.
c. To change the order for applying conditions, drag and drop the conditions tothe appropriate location in the list.
7. For each condition in the Define Conditions list:
a. From the Condition Based On list, select whether the condition is based on:
• A single metric value. For example, display the flag summary item if any ofthe dimension values have more than 500 sales.
• A ratio of two metrics. For example, display the flag summary item if thetotal sales for any of the dimension values is greater than 90% of theprojected sales.
b. To select a metric, click Select Metric.
c. To select a different aggregation method for a metric, you can use the list next tothe metric name. You cannot select a different aggregation method for apredefined metric.
d. In the Threshold column, configure the condition comparison. From the list,select the comparison operator, then in the field or fields, type the comparisonvalue or values.
8. To configure a dimension or metric:
Summarization Bar
Other Data Visualizations 25-37

a. Click its edit icon.
b. For date/time dimensions, from the Date/time Subset list, select the date/timesubset to display on the component.
By default, the largest available subset is used.
c. For metrics that are not predefined, the configuration dialog includes a list toselect the aggregation method.
d. For both metrics and dimensions, the Value Formatting section allows you tocustomize the format of the displayed value.
For details on customizing a displayed value on a component, see Configuringattribute value formats.
9. Under List of flags:
a. In the Max number of flags to display field, type the maximum number of flagsto display when users click the flag summary item.
For example, even if 20 dimension values match the flag conditions, you canrestrict the list of flags to only show 10.
b. In the Overview content field, type a brief description to display above the list.
10. Under Display Options:
a. Under Width, to customize the maximum width of the item, click Custom maxwidth, then in the field, type the width in pixels.
b. Under Display name for column of dimensions, specify the column headingfor the dimension column on the list of flags.
By default, the dimension names are used. To specify a custom name, clickCustom name, then in the field, type the custom heading.
c. Under Select metrics to display as columns, to include the metric values in thelist of flags, check the check box.
Summarization Bar
25-38 Studio User's Guide

d. If you are displaying the metrics, then to customize the column heading for themetric values, click Custom name, then in the field, type the custom heading.
11. In the Actions section, configure the page to display when end users refine by adimension value in the list of flags.
For information on configuring a target page for refinement, see Selecting the targetpage for a refinement or hyperlink.
Tag CloudThe Tag Cloud component allows users to quickly compare a set of displayed termsbased on the value of an associated metric, such as the number of times the termoccurs.
For example, a Tag Cloud component might display a list of wine flavors, organizedbased on the number of wines that include each flavor. The component can alsodisplay the metric value associated with each term. Alternately, Tag Cloud terms candisplay in a simple list.
The Tag Cloud includes the following common functions, summarized in Commoncomponent controls:
• Refining Data
Toggling cloud and list view
Use the toggle icon to switch between the two layout types.
In cloud layout, the terms display in alphabetical order, and are not separated by a linebreak:
In list layout, each term displays on a separate line. The terms are displayed indescending order based on the value of the associated metric:
Tag Cloud
Other Data Visualizations 25-39
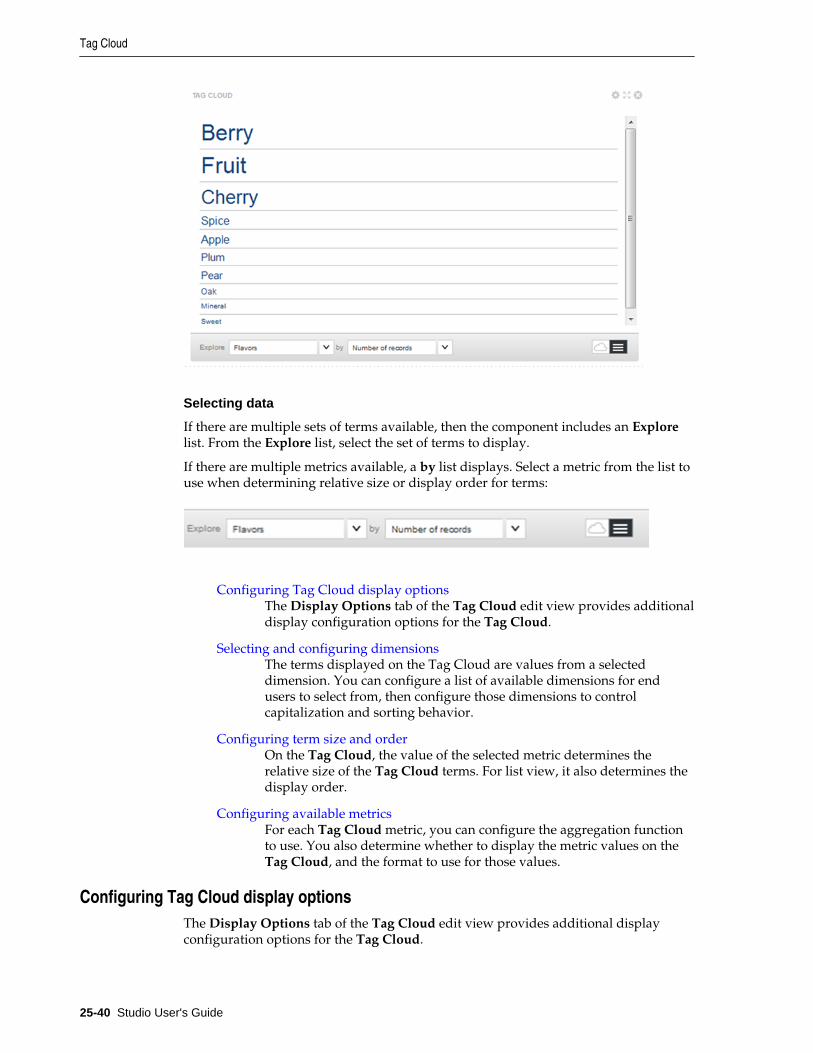
Selecting data
If there are multiple sets of terms available, then the component includes an Explorelist. From the Explore list, select the set of terms to display.
If there are multiple metrics available, a by list displays. Select a metric from the list touse when determining relative size or display order for terms:
Configuring Tag Cloud display optionsThe Display Options tab of the Tag Cloud edit view provides additionaldisplay configuration options for the Tag Cloud.
Selecting and configuring dimensionsThe terms displayed on the Tag Cloud are values from a selecteddimension. You can configure a list of available dimensions for endusers to select from, then configure those dimensions to controlcapitalization and sorting behavior.
Configuring term size and orderOn the Tag Cloud, the value of the selected metric determines therelative size of the Tag Cloud terms. For list view, it also determines thedisplay order.
Configuring available metricsFor each Tag Cloud metric, you can configure the aggregation functionto use. You also determine whether to display the metric values on theTag Cloud, and the format to use for those values.
Configuring Tag Cloud display optionsThe Display Options tab of the Tag Cloud edit view provides additional displayconfiguration options for the Tag Cloud.
Tag Cloud
25-40 Studio User's Guide

The configuration includes the number of terms to display, the default format, and thetext size for the terms.
To configure the display:
1. In the Maximum number of keywords field, type the maximum number of termsto display on the Tag Cloud.
2. In the Maximum component height for list view field, type the maximum heightin pixels of the Tag Cloud component when displayed in list view.
If the list does not fit within the specified height, then end users can scroll throughthe list.
3. Under Tag Cloud format:
a. Click a radio button to select the default display format (Cloud or List) for thetag cloud.
b. By default, end users can toggle between cloud and list view. To prevent themfrom changing the format, deselect the Allow end user to toggle format checkbox.
4. Under Text size, use the sliders to set the minimum and maximum size in pixels ofthe Tag Cloud terms.
By default, the text size ranges from 10 pixels to 32 pixels.
You can set the text size down to a minimum of 8 pixels, and up to a maximum of48 pixels.
You can also put the sliders on top of each other to set a single text size for all of theterms. For example, for a list view that includes the number of values next to eachterm, you may just want to display all of the terms at a size of 11 pixels.
Selecting and configuring dimensionsThe terms displayed on the Tag Cloud are values from a selected dimension. You canconfigure a list of available dimensions for end users to select from, then configurethose dimensions to control capitalization and sorting behavior.
To select and configure Tag Cloud dimensions:
1. In the component menu bar, click the Options icon:
Tag Cloud
Other Data Visualizations 25-41

2. Navigate to the Configuration tab.
The Dimensions list displays with any selected dimensions:
By default, the Tag Cloud component contains the first available multi-valuedimension that allows refinement.
3. To add a dimension to the Dimensions list, drag it from the attributes list.
Note that you cannot use date/time attributes in a Tag Cloud.
4. To rearrange the order of dimensions in the Explore list, click and drag dimensions.
5. To remove a dimension from the Dimensions list, click its delete icon.
6. To configure a dimension:
a. Click the edit icon for the dimension you want to configure
The Edit Dimension dialog displays.
b. Expand Attribute Cascade to enable dimension cascading when users refine bya Tag Cloud term.
See Configuring cascading for dimension refinement.
c. Expand Value Formatting to control capitalization.
• To display terms exactly as they are stored in the data, select Default (nochange).
• To display all terms in lowercase, select Lower case.
d. Click Apply.
Configuring term size and orderOn the Tag Cloud, the value of the selected metric determines the relative size of theTag Cloud terms. For list view, it also determines the display order.
On the Configuration tab of the Tag Cloud edit view, the Metrics list contains theavailable metrics for end users to select from.
Tag Cloud
25-42 Studio User's Guide

In addition to regular attributes and system metrics, the Tag Cloud also provides aRelevancy metric. The Relevancy metric applies when the data has been refined, anddetermines how relevant each term is to the current refinement. To determine therelevancy of each term, Studio compares the frequency of the term in the currentrefinement to the frequency in the data as a whole.
• If a term occurs more frequently in the current refinement than in the data as awhole, then that term is more relevant, and is larger.
• If a term does not occur any more frequently in the current refinement, then theterm is less relevant, and is smaller.
For example, a Tag Cloud contains wine types. The Sparkling wine type occurs in 30%of the records. When users refine by a specific region, if the Sparkling wine type nowoccurs in more than 30% of the records, then the Sparkling wine type is more relevant.If the Sparkling wine type only occurs in 30% or fewer of the records, then it is lessrelevant.
To select the available Tag Cloud metrics:
1. To add a metric to the Metrics list, drag the metric from the attributes list to theMetrics list.
Note that you cannot use date/time attributes in a Tag Cloud.
2. To determine the order for displaying metrics in the by list, drag each metric to theappropriate location in the list.
The metric at the top of the list is selected by default when the Tag Cloudcomponent is first displayed.
3. To remove a metric from the list, click its delete icon.
Configuring available metricsFor each Tag Cloud metric, you can configure the aggregation function to use. Youalso determine whether to display the metric values on the Tag Cloud, and the formatto use for those values.
On the Configuration tab of the Tag Cloud edit view, to configure a metric:
1. In the Metrics list, click the edit icon for the metric.
2. On the Edit Metric dialog, from the Aggregation Function method list, select theaggregation method to use to calculate the metric value.
For information on selecting a metric aggregation method, see Selecting theaggregation method to use for a metric.
Tag Cloud
Other Data Visualizations 25-43

3. To display the calculated metric value for each Tag Cloud term, check the Displaycalculated metric value next to each tag cloud term check box.
4. If you are displaying the metric values, then use the Value Formatting section tocustomize the display format.
For details on customizing the format of values displayed on a component, see Configuring the format of values displayed on a component.
5. To save the configuration, click Apply.
TimelineThe Timeline component allows you to see changes in the value of one or moremetrics over the same time period. For example, one timeline could track total salesagainst the sale date, and another could track total claims against the claim date.
The component consists of:
Timeline
25-44 Studio User's Guide

TimelineType
Description
Mastertimeline
Used to set the range of dates to use on all of the metric timelines.The full range of available dates is based on the earliest and latest dates that areavailable for the date attributes displayed on the metric timelines.
From the Master Timeline, you can also select a date subset to use on the charts.You can only select date spans that are available for all of the selected dateattributes.
Note also that on the Master Timeline, the metric values are plotted based on therelative minimum and maximum values for each metric. The metrics do not use asingle scale.
Metrictimelines
Each metric timeline is a bar or line chart that is associated with a specific dataset. To plot the chart, the metric timeline uses:• A date/time attribute, for the horizontal axis of the chart. If a data set does
not include at least one date/time attribute, then you cannot use it on theTimeline component.
• A metric value to plot against the date/time valuesEach metric timeline includes the number of matching records for the currentrefinement.
You can add and remove metric timelines, and use a date range to refine the data.
Administrators can also save a configuration as the default to display for all users.
Adding and editing metric timelinesOn the Timeline component, you can add multiple metric timelines. Foreach metric timeline, you select the view, date/time attribute, and metricto use for the display. You can also change the display order of themetric timelines.
Setting the displayed date unit and date range for the metric timelinesOn the Timeline component, you can use the Master Timeline to refinethe project data based on a specific date/time range, or refine by a datevalue on a metric timeline. You can also change the date unit to use onthe horizontal axis for the charts.
Saving the current timeline configuration as the defaultIf you are able to edit the project, then you can also save the currentconfiguration of the Timeline component as the default for all users.
Adding and editing metric timelinesOn the Timeline component, you can add multiple metric timelines. For each metrictimeline, you select the view, date/time attribute, and metric to use for the display.You can also change the display order of the metric timelines.
To add and edit metric timelines:
1. To add a new metric timeline, click Add Metric.
2. Click the View name of the new timeline to select a data view:
Timeline
Other Data Visualizations 25-45

If a view does not include at least one date/time attribute that can be used as adimension, it cannot be used for a timeline.
3. To select the metric to display on the metric timeline:
a. Click the metric name.
Studio displays a list of available attributes to use for the metric.
You can also use the search field to find a specific attribute.
b. Click the attribute you want to use for the metric.
c. If the metric is not a predefined metric, then use the aggregation method list toselect the aggregation method to use to calculate the metric value.
4. To select the date/time attribute to use on the metric timeline:
a. Click the attribute name.
Studio displays the list of available date/time attributes.
Timeline
25-46 Studio User's Guide

You can also use the search field to find a specific attribute.
b. Click the date/time attribute you want to use.
5. To change the display order of the metric timelines, drag the timeline to the newlocation.
6. To delete a metric timeline, click its delete icon.
If there is only one metric timeline, then you cannot delete it. You can only changeits configuration.
Setting the displayed date unit and date range for the metric timelinesOn the Timeline component, you can use the Master Timeline to refine the projectdata based on a specific date/time range, or refine by a date value on a metrictimeline. You can also change the date unit to use on the horizontal axis for the charts.
Note that if date/time refinements have already been applied, then those values aredisplayed above the Master Timeline.
To change the displayed date subset and date unit for the metric timelines:
1. Available date units (Year, Month, Day, etc) are listed above the Master Timeline.To display a different date unit, click it.
You can only use date units that are available for all of the selected date/timeattributes. If one date/time attribute supports Year, Month, and Day, but anotheronly supports Year and Day, you can only select from Year and Day.
2. To use the Master Timeline to refine the data:
a. Select the date/time range.
To do this, use the sliders or the date picker widget.
For each metric timeline, the Timeline component displays the preview of thenumber of records that match the new unit selection.
Timeline
Other Data Visualizations 25-47

b. Click Apply Refinement.
The date range refinements are added to the Selected Refinements panel.
The metric timelines are updated to show the selected date range, and the numberof records for each metric timeline is also updated.
3. To refine by a date value on a metric timeline, double-click the point on the metrictimeline.
The value for that point is added as a refinement for the date attribute displayed onthat timeline.
Saving the current timeline configuration as the defaultIf you are able to edit the project, then you can also save the current configuration ofthe Timeline component as the default for all users.
When users first display the page, the Timeline component initially displays using thelast saved default.
To save the current timeline configuration as the default:
1. In the component menu bar, click the Options icon:
The Timeline Preferences dialog opens.
2. Click Save as Default.
Timeline
25-48 Studio User's Guide

26Web-Based Content
You can use components to display Web-based content on a page. Content can comefrom external URLs, or it can be created and stored in Big Data Discovery.
IFrameThe IFrame component can display the content of an external URL.
Web Content DisplayThe Web Content Display component allows you to create and displayHTML content in your project.
IFrameThe IFrame component can display the content of an external URL.
Link targets from the URL also display within the IFrame component, unless they arespecifically configured to display in another browser window.
For example, you might want to display your company's home page, or provide accessto tools to allow users to share their findings.
Note: Some sites include JavaScript that prevents those sites from loading inan iFrame. The common behavior of such sites is that they briefly appear toload before redirecting to the top-level location for the browser. You cannotdisplay these sites in an IFrame component unless you have access to the pagesource and can remove the JavaScript in question.
Web-Based Content 26-1

Configuring an IFrameFor an IFrame component, you configure the URL to display, anddetermine whether to require additional authentication in order to viewthe content.
Configuring an IFrameFor an IFrame component, you configure the URL to display, and determine whetherto require additional authentication in order to view the content.
To configure an IFrame component:
1. In the component menu bar, click the Options icon to navigate to the Edit view:
2. In the Source URL field, type the target URL.
3. If the URL is relative to the context path for Studio, check the Relative to ContextPath check box.
4. If the page you are embedding requires authentication, configure theauthentication information:
a. Check the Authenticate check box.
The authentication fields display.
b. From the Authentication Type list, select the type of authentication.
Basic authentication simply provides the user name and password required bythe embedded page.
Form authentication uses POST or GET to validate the user.
c. For Basic authentication, to specify the user name and password, enter thevalues in the fields.
d. For Form authentication, from the Form Method list, indicate whether to useGET or POST to validate the user.
For the user name and password, provide the field names and values to send.
In the Hidden Variables field, provide any hidden variables to include in theauthentication request.
5. Use the HTML Attributes field to provide any additional display parameters forthe content.
IFrame
26-2 Studio User's Guide

6. To save the configuration, click Save.
7. To return to the end user view, click Exit.
Web Content DisplayThe Web Content Display component allows you to create and display HTML contentin your project.
Configuring a Web Content DisplayFor the Web Content Display component, you provide the content todisplay. You can also customize the component height.
Configuring a Web Content DisplayFor the Web Content Display component, you provide the content to display. You canalso customize the component height.
To configure the Web Content Display component:
1. In the component menu bar, click the Options icon to navigate to the Edit view:
2. In the Web content display height field, enter the desired height.
By default, the component is 200 pixels high.
3. Use the text editor to create or edit the component content.
The text editor provides options to:
• Select a font
• Highlight text
• Change text alignment
• Create numbered and bulleted lists
Web Content Display
Web-Based Content 26-3

Note that you cannot include script tags or a separate style tag. If you include theseitems, they are removed when you save the component.
4. To add a hyperlink:
a. Select the link text.
b. In the text editor toolbar, click the hyperlink icon.
The hyperlink dialog opens.
c. In the URL: field, type the URL.
d. In the Text to display: field, enter the display text.
e. Click OK.
When end users click links in a Web Content Display component, the target URLautomatically displays in a new browser window.
To edit an existing link, click anywhere in the link text, then click the hyperlinkicon.
5. To insert an image:
a. In the text editor toolbar, click the image upload icon.
The image upload dialog displays. The dialog displays any images that havebeen uploaded for this or any other Web Content Display component in thecurrent project.
The list does not include images uploaded in other components or otherprojects.
The images are stored in the database.
b. To use an existing image in the list, click the image, then click OK.
c. If you need to upload a new image, click Browse to search for and select theimage.
Big Data Discovery supports the .gif, .jpeg/.jpg, .bmp, and .png file types.
To clear the image file selection, click Cancel.
d. To upload the selected file, click Upload.
Web Content Display
26-4 Studio User's Guide

The image is added to the list, and the dialog is updated to display the imagewidth and height.
You can use the Width and Height fields to customize the displayed size of theimage. The image always maintains its original aspect ratio, so editing one fieldautomatically adjusts the other.
e. To insert the currently selected image, click OK.
6. To display the source HTML, click the source view icon.
Web Content Display
Web-Based Content 26-5

Web Content Display
26-6 Studio User's Guide

Index
Aactions
configuring for displayed values, 21-24Results Table, 23-22Results Table, conditions for actions, 23-28target page, specifying, 21-28
Advanced transforms, 19-9aggregating, attribute values, 19-23aggregation methods
EQL syntax, 15-25list of, 15-25selecting for a metric, 21-20
anti-virus warning, 5-3attribute groups
attribute metadata, displaying full, 16-6attribute metadata, selecting columns to display,
16-6attributes, displaying the list of, 16-5creating, 16-7deleting, 16-7displaying on the Attribute Groups page, 16-4linked views, 16-2renaming, 16-8selecting attributes, 16-9sort order, configuring, 16-10
Attribute Groups pageattribute group cache, reloading, 16-11attribute groups, creating, 16-7attribute groups, deleting, 16-7attribute groups, renaming, 16-8attribute groups, saving, 16-11attribute groups, selecting attributes, 16-9attribute metadata, displaying full, 16-6attribute metadata, selecting columns to display,
16-6attributes, displaying for a group, 16-5displaying groups for a view, 16-4sort order, configuring for an attribute group,
16-10attribute values, aggregating, 19-24attributes
aggregation methods, 15-25
attributes (continued)available aggregation methods, selecting, 15-24Available Refinements behavior, configuring,
15-28default aggregation method, selecting, 15-24descriptions, editing and localizing, 15-18display names, editing and localizing, 15-18storing URLs as values, 21-29
Available Refinementsabout, 4-1bookmarks, saved data for, 11-6dates, refining by, 4-5implicit refinements, about, 4-7linked data sets, controlling automatic filtering,
14-10range filters, 4-4value list, using for refinement, 4-2
B
Basic transforms, 19-5BDD application, 13-5Bin Values transformation, 19-17Binned Scatter Plot chart, 24-9bookmarks
about, 11-1bookmarks list, displaying, 11-2creating, 11-2deleting, 11-4editing, 11-3emailing, 11-4links, generating, 11-4navigating to, 11-2saved data for components and panels, 11-5
Box Plotabout, 24-25bookmarks, saved data for, 11-6data, 24-27display options, 24-27
CCatalog
Index-1

Catalog (continued)about, 2-1data sets, displaying details, 2-3data sets, previewing, 2-3data sets, sorting, 2-4filtering, 2-4icons on the tiles, 2-2projects, displaying details, 2-3projects, navigating to, 10-1projects, searching, 2-4projects, sorting, 2-4
Chartabout, 24-1bookmarks, saved data for, 11-6default configuration, 24-18selecting chart type, 24-18snapshot, creating, 24-23trellis, 24-18
Column Containerabout, 22-1adding, 22-1configuring, 22-1
componentsActions menu, about, 21-22Actions menu, selecting actions, 21-23actions, configuring for component values, 21-24adding, 9-3Chart, 24-1Column Container, 22-1comparing items, 21-10deleting, 9-3dimension cascades, configuring, 21-21displaying Record Details, 21-10exporting data, 21-13formatting displayed values, 21-16hyperlinks, configuring external, 21-31localizing titles, 7-2paging, 21-7Pass Parameters action, configuring, 21-31Pivot Table, 25-18printing, 21-12renaming, 21-15Results List, 23-1Results Table, 23-7Tabbed Container, 22-2using for refinement, 21-8
Convert transforms, 19-8
D
data connection, creating data sets from, 5-5data loading options, 5-2data sets
about reloading, 5-7adding tags, 2-4creating from file, 5-4
data sets (continued)data connection, creating from, 5-5data set access, 5-13deleting, 5-15deleting from projects, 13-6groups, adding, 5-13joining, about, 19-26joins, creating, 19-27linking, about, 14-1links, aggregation methods for linked view, 14-6links, creating, 14-2links, editing the link key, 14-5loading full, 13-2managing access, 5-13notifications, 5-11projects, adding to, 13-1reloading from file, 5-7reloading from JDBC, 5-8removing tags, 2-4renaming, 2-4supported file types, 5-3tags, 2-4updating, 13-4upload permissions, 5-2upload timeouts, 5-3users, adding, 5-13
Data Sets tab, 2-2data sources, creating data sets from, 5-5data, exporting from projects, 17-1
E
Entity Extraction Transformation, 19-15EQL
aggregation method syntax, 15-25predefined metric definitions, 15-31view definition guidelines, 15-12
exception handling, 19-38Explore
attribute values, filtering, 6-4attribute values, hiding, 6-4attribute visualization, changing, 6-4data set, selecting, 6-2details panel, displaying, 6-4display type, toggling, 6-3scratchpad, saving, 6-8scratchpad, shortcuts, 6-9scratchpad, using, 6-5
GGroovy
about, 18-5data types, 20-1reserved keywords, 20-3unsupported functions, 20-4
Index-2

Group Values transformation, 19-18
HHistogram Plot
about, 24-24bookmarks, saved data for, 11-6data, 24-25display options, 24-25
hyperlinks from componentsencoding, 21-30non-HTTP protocol links, 21-27URLs as attribute values, 21-29
IIFrame
about, 26-1configuring, 26-2
incremental updates with DP CLI, 13-4
J
joining data sets, 19-27
L
layout, changing for a page, 9-2loading a full data set, 13-2locales
configuring user preferred, 1-4selecting from the user menu, 1-5supported, 1-3
logging in, 1-1
MMap
about, 25-1bookmarks, saved data for, 11-6default configuration, 25-9details template, configuring for a layer, 25-14display settings, configuring, 25-17filtering, configuring, 25-17heat map layer, changing the display, 25-5map layer data view, 25-10map layer display options, configuring, 25-13map layer name, configuring, 25-13map layer points, defining, 25-11map layer type, selecting, 25-10map layers, 25-3, 25-4map layers, adding, 25-9map layers, configuring visibility, 25-17map layers, deleting, 25-9map layers, editing, 25-9map layers, renaming, 25-9
Map (continued)map layers, selecting the view, 25-10map points, displaying details for, 25-8numbered points list, using, 25-5Oracle MapViewer, 25-2pagination, configuring, 25-16point layer, changing the display, 25-5range search, 25-6sorting, configuring, 25-16text search, 25-6
N
notifications, 5-11
Ppages
adding, 9-1deleting, 9-3layout, changing, 9-2localizing names, 7-2renaming, 9-2target page, specifying for actions, 21-28
Parallel Coordinates Plotabout, 24-27bookmarks, saved data for, 11-6data, selecting, 24-30refining data, 24-29
Pass Parameters action, configuring, 21-31password
changing, 1-2resetting forgotten, 1-2
Pivot Tableabout, 25-18bookmarks, saved data for, 11-6column width, configuring, 25-27conditional formatting, configuring, 25-26dimensions, adding, 25-22dimensions, adding additional available, 25-24dimensions, configuring, 25-24end user configuration, enabling, 25-26end user layout configuration, 25-20hiding empty rows and columns, 25-27highlighting, showing and hiding, 25-19metrics, adding, 25-22metrics, adding additional available, 25-24navigating in, 25-19sorting dimension values, 25-19summaries, default display, 25-27summaries, showing and hiding, 25-19swapping rows and columns, 25-23table height, configuring, 25-27using for refinement, 25-21
predefined metricsadding to a view, 15-30
Index-3

predefined metrics (continued)configuring, 15-31deleting from a view, 15-32
project rolesabout, 8-1adding, 8-3assigning, 8-3removing, 8-3Studio roles, 8-2types of, 8-1
Project Settings pageAttribute Groups page, 16-2Localization page, 7-2Views page, 15-4
project types, 8-2projects
about, 7-1adding tags, 2-4attribute groups, configuring, 16-1creating, 7-2creating from Catalog, 7-2creating from data set, 7-2data sets, adding, 13-1data sets, deleting, 13-6data sets, displaying information about, 10-2deleting, 7-3exporting data, 17-2exporting data, about, 17-1groups, adding, 8-3groups, removing, 8-3localizing the name and description, 7-2navigating within, 10-1pages, adding, 9-1pages, changing the layout, 9-2pages, data binding, 9-3pages, deleting, 9-3pages, renaming, 9-2project roles, assigning, 8-3project types, 8-2removing tags, 2-4renaming, 2-4roles, 8-1tags, 2-4users, adding, 8-3users, removing, 8-3views, configuring for project data, 15-1
Projects tab, 2-1
Rrange filters
switching to values, 4-4using, 4-4
record identifier, 13-4refinements
about, 4-1
refinements (continued)dates, refining by, 4-5implicit refinements, about, 4-7range filters, 4-4value list, using for refinement, 4-2
reloading data in the Catalog, 5-7Results List
about, 23-1attributes, selecting, 23-3bookmarks, saved data for, 11-6configuring, 23-3data view, 23-3default configuration, 23-3images, 23-4images, configuring, 23-4pagination, 23-6sorting, 23-2
Results Tableabout, 23-7action columns, available, 23-22action columns, configuring the display, 23-26action columns, selecting, 23-23actions, configuring conditions for, 23-28aggregated table, adding dimension columns,
23-21attributes, selecting, 23-12bookmarks, saved data for, 11-6changing aggregation, 23-10column sets, adding to an aggregated table, 23-20column sets, configuring, 23-18column sets, selecting on the end user view, 23-9columns, formatting, 23-16conditional formatting, configuring, 23-21conditional formatting, showing and hiding,
23-11configuring, 23-12data view, 23-12data, exporting, 23-30default configuration, 23-12display options, configuring, 23-14hide columns, 23-9Hyperlink action column, configuring, 23-24move columns, 23-9navigating to other URLs, 23-30persistent columns, selecting, 23-18Refinement action column, configuring, 23-25show columns, 23-9sorting, 23-11sorting with summary rows, 23-12sorting, configuring, 23-15summary rows, configuring, 23-15summary rows, showing and hiding, 23-10table type, selecting, 23-12types of rows and columns, 23-8using to refine data, 23-30
roles
Index-4

roles (continued)project roles, 8-1user roles, 8-2
runtime exceptions, troubleshooting, 19-40
S
Scatter Plot Matrix chart, 24-11search
about, 3-1Boolean, 3-6keyword search, match mode, 3-5relevance ranking, effect of, 3-5results, displaying, 3-2results, using, 3-2snippets, displaying, 3-5wildcards, 3-5
security exceptions, troubleshooting, 19-39Selected Refinements
bookmarks, saved data for, 11-6data set list, 4-7linked data sets, 4-9negative refinements, 4-9refinement tiles, 4-8refinements, removing, 4-9Selected Refinements panel, hiding, 4-8
Shaping transforms, 19-20snapshots
creating, 12-2deleting, 12-5details, displaying, 12-3editing, 12-4emailing all, 12-6emailing individual, 12-4galleries, creating, 12-6galleries, deleting, 12-8galleries, editing, 12-8galleries, emailing, 12-9galleries, exporting to PDF, 12-9galleries, full screen mode, 12-8refinement state, navigating to, 12-5saving all to a PDF, 12-5saving to a file, 12-5snapshots panel, displaying, 12-1
Split transformation, 19-6static and dynamic typing, about, 19-38Summarization Bar
about, 25-27action, configuring for summary items, 25-34adding items, 25-30bookmarks, saved data for, 11-6conditional formatting, configuring, 25-35deleting items, 25-30dimension value, selecting for a dimension
spotlight item, 25-32display name location, configuring, 25-29
Summarization Bar (continued)display name, configuring for summary items,
25-34flag items, configuring, 25-36item types, 25-30metric value, selecting for a dimension spotlight
item, 25-32metric value, selecting for a metric summary item,
25-31renaming items, 25-30text size, configuring, 25-29tooltip, configuring for summary items, 25-34using, 25-27width, configuring for summary items, 25-34
TTabbed Component Container
bookmarks, saved data for, 11-6Tabbed Container
about, 22-2adding, 22-2configuring, 22-2
Tag Cloudabout, 25-39bookmarks, saved data for, 11-6cloud, 25-39, 25-40configuring, 25-41display type, 25-39, 25-40display, configuring, 25-41list, 25-39, 25-40metrics, configuring, 25-43metrics, selecting available, 25-42selecting dimensions, 25-41values, 25-39, 25-40
text searchdisabling, 3-8enabling, 3-8
Thematic Mapabout, 24-14attribute, selecting, 24-15Oracle MapViewer, 24-18
Timelineabout, 25-44bookmarks, saved data for, 11-6date range, setting, 25-47date unit, setting, 25-47default configuration, saving, 25-48metric timelines, adding, 25-45metric timelines, deleting, 25-45metric timelines, editing, 25-45metric timelines, reordering, 25-45refinement, using for, 25-47
Transformabout, 18-2attributes, adding custom, 19-30
Index-5

Transform (continued)attributes, favorite, 19-3attributes, filtering, 19-4attributes, hiding, 19-3binning values, 19-17capitalization, changing for Strings, 19-7custom transformation, creating, 19-30data grid, toggling the display, 19-2data set size determining, 18-3data set, creating new, 19-43data type, changing for an attribute, 19-8date/time values, truncating, 19-7deleting records, 19-21Entity Extraction, 19-15Extract Date Part, 19-13Extracting key phrases, 19-15Geographic Hierarchy, 19-10grouping values, 19-18locking, 18-6logging, 19-40menu, about, 18-3null values, filling in, 19-19numeric transformations, performing, 19-8page header, about, 18-3preview mode, 18-7splitting values, 19-6static parser, 19-38Tag from Whitelist, 19-16transform script, reordering, 19-41Transformation Editor, 19-31Transformation Editor, using, 19-30transformation script, loading, 19-45transformation script, publishing, 19-44transformation script, un-publishing, 19-46transformation, configuring, 19-2transformation, deleting attribute, 19-22transformation, selecting, 19-2transformations, deleting, 19-41trimming spaces, 19-6whitespace characters, displaying, 19-5workflow, 18-4workflow diagram, 18-4
transform functionsabout, 18-6conversion functions, 20-8date functions, 20-9dynamic and static typing, 19-38enrichment functions, 20-13geocode functions, 20-25math functions, 20-26set functions, 20-28String functions, 20-29URL functions, 20-33
Transform functionsdate constants, 20-11
Transform, performance, 19-46
Transformation Editor, 19-31transformation scripts
about, 18-2committing, 19-42conditional statements, 20-5creating custom transformation plug-ins with
Groovy, 19-35data type conversion, 20-2data types, 20-1evaluation, 19-37exception handling, 19-38function chaining, 19-35function syntax, 19-34multi-assign values, 20-5variable formats, 19-33workflow, 18-4
transformationsabout, 18-2extending, 19-35
Trim transformation, 19-6typeahead search
disabling, 3-8enabling, 3-8
U
upload timeouts, 5-3user roles, 8-2
V
variable formats, 19-33views
attribute aggregation methods, selecting available,15-24
attribute aggregation methods, selecting default,15-24
attribute descriptions, editing and localizing,15-18
attribute display names, editing and localizing,15-18
attributes, default display format, 15-21Available Refinements behavior for attributes,
configuring, 15-28base views, about, 15-2copying, 15-7creating a new view, 15-6date/time subsets, configuring available, 15-20deleting, 15-33description, editing and localizing, 15-10display name, editing and localizing, 15-10displaying for a project, 15-4editing the definition, 15-12EQL guidelines, 15-12linked views, about, 15-2predefined metrics, adding, 15-30
Index-6

views (continued)predefined metrics, configuring, 15-31predefined metrics, deleting, 15-32previewing, 15-32publishing custom, 15-33
Views pageattribute aggregation methods, selecting available,
15-24attribute aggregation methods, selecting default,
15-24attribute descriptions, editing and localizing,
15-18attribute display names, editing and localizing,
15-18attributes list columns, 15-17attributes, default display format, 15-21Available Refinements behavior, configuring,
15-28date/time subsets, configuring available, 15-20displaying, 15-4
Views page (continued)predefined metrics, adding to a view, 15-30predefined metrics, configuring, 15-31predefined metrics, deleting, 15-32view definition, editing, 15-12view description, editing and localizing, 15-10view display name, editing and localizing, 15-10views, copying, 15-7views, creating new, 15-6views, deleting, 15-33views, displaying details, 15-5views, previewing, 15-32views, publishing custom, 15-33
WWeb Content Display
about, 26-3configuring, 26-3
Index-7

Index-8