bC85__E-ICD-10-C85-Non-Hodgkin-lymphoma-NOS-incidence ...
36
Munich Cancer Registry Survival Selection Matrix Homepage Deutsch ICD-10 C85: Non-Hodgkin lymphoma NOS Incidence and Mortality Year of diagnosis 1998-2020 Patients 2,748 Diseases 2,749 Creation date 12/21/2021 Database export 12/20/2021 Population 4.95 m Munich Cancer Registry Cancer Registry Bavaria - Upper Bavaria Regional Center at Klinikum Grosshadern/IBE Marchioninistr. 15 Munich, 81377 Germany https://www.tumorregister-muenchen.de/en https://www.tumorregister-muenchen.de/en/facts/base/bC85__E-ICD-10-C85-Non-Hodgkin- lymphoma-NOS-incidence-and-mortality.pdf BERLIN GERMANY MUNICH BAVARIA
-
Upload
khangminh22 -
Category
Documents
-
view
1 -
download
0
Transcript of bC85__E-ICD-10-C85-Non-Hodgkin-lymphoma-NOS-incidence ...
Munich Cancer Registry
Survival Selection Matrix Homepage Deutsch
ICD-10 C85: Non-Hodgkin lymphoma NOS
Incidence and Mortality
Year of diagnosis 1998-2020
Patients 2,748
Diseases 2,749
Creation date 12/21/2021
Database export 12/20/2021
Population 4.95 m
Munich Cancer Registry Cancer Registry Bavaria - Upper Bavaria Regional Center at Klinikum Grosshadern/IBE Marchioninistr. 15 Munich, 81377 Germany https://www.tumorregister-muenchen.de/en
https://www.tumorregister-muenchen.de/en/facts/base/bC85__E-ICD-10-C85-Non-Hodgkin-lymphoma-NOS-incidence-and-mortality.pdf
BERLIN
GERMANY
MUNICH
BAVARIA

INDEX ICD-10 C85: Non-Hodgkin lymphoma NOS Page 2 of 36
MCR bC85__E-ICD-10-C85-Non-Hodgkin-lymphoma-NOS-incidence-and-mortality.pdf 12/21/2021
Index of figures and tables
Fig./Tbl. Page
1 Annual cases, DCO, mult. malignancies, follow-up / yr 4
2 Incidence by year of diagnosis 7
3 Age distribution parameters by year of diagnosis 8
4 Age distribution by 5-year age group and sex 11
5 Age-specific incidence, DCO rate, proportion malignancies 12
6 Age distribution and age-specific incidence (chart) 13
6a Age-specific incidence internationally (chart) 14
7 Standardized incidence ratio of further malignancies 15
8a Map of cancer incidence (BRD-S) by county (chart) 17
8b Standardized incidence ratio (SIR) by county (chart) 18
9a Pts incident cohorts and mortality / yr 19
9b Incidence and mortality by year of diagnosis 20
9c Cancer-related deaths, death certification available / yr 21
10 Medians of age at death / yr 22
11 Mortality by year of death 24
12 Distribution of age at death 26
13 Age-specific mortality 27
14 Further malignancies in deaths 28
15 Age-specific mortality (first primaries) 30
16 Age-specific mortality (single primaries) 31
17 Age distribution and age-specific mortality (chart) 32
18a Map of cancer mortality (BRD-S) by county (chart) 33
18b Standardized mortality ratio (SMR) by county (chart) 34
METHODS ICD-10 C85: Non-Hodgkin lymphoma NOS Page 3 of 36
MCR bC85__E-ICD-10-C85-Non-Hodgkin-lymphoma-NOS-incidence-and-mortality.pdf 12/21/2021
Global Statements about the statistics on the Internet − Baseline Statistics (grey button ), Survival (red button )
In these analyses, the clinics and physicians of Upper Bavaria and the city and county of Landshut#, with a total of 4.69 million inhabitants, account for the frequency of cancer diseases## and the achieved long term results. Additionally, the long term survival evaluated by the Munich Cancer Registry (MCR) is compared with the results of the population-based registry in the USA (SEER), which is useful for checking the consistency of the data on an international level.
In comparing several tables, inconsistent figures may be detected. This is based on the fact that different patient cohorts are included in the base calculation, for example when proportions of multiple tumors or DCO-cases### are concerned. In other cases the individual tumor diagnosis is the basis for calculation, for example with incidence.
The foot notes describe the currentness of the data. The baseline statistics and survival data are updated annually. This yearly analysis comprises the Annual Report of the MCR.
Clinics and physicians have access to essentially more detailed data, with which they can check, compare and in the best case optimize their own data and results.
We would be pleased to receive corrections, critique and useful suggestions. Just send an e-mail to [email protected].
Munich Cancer Registry, December 2021
# Base data has been collected since 1998. An increase in new diseases is apparent, which is an effect of
two extensions in the MCR catchment area (from a base population of 2.65 million to 4.10 in 2002, and to 4.69 million in 2007).
## Due to the high frequency and good prognosis of non-malignant skin cancer (C44), no systematic
ascertainment is performed for this diagnosis. C44 is not designated as a primary, but rather as a secondary tumor.
### DCO (death certificate only) identifies a cancer case that first becomes available to the MCR through the
death certificate.
ICD-10 codes (ICD-10 2016) used for specifying cancer site
Code Description
C85.- Other and unspecified types of non-Hodgkin lymphoma C85.1 B-cell lymphoma, unspecified C85.2 Mediastinal (thymic) large B-cell lymphoma C85.7 Other specified types of non-Hodgkin lymphoma C85.9 Non-Hodgkin lymphoma, unspecified
INCIDENCE ICD-10 C85: Non-Hodgkin lymphoma NOS Page 4 of 36
MCR bC85__E-ICD-10-C85-Non-Hodgkin-lymphoma-NOS-incidence-and-mortality.pdf 12/21/2021
IINNCCIIDDEENNCCEE
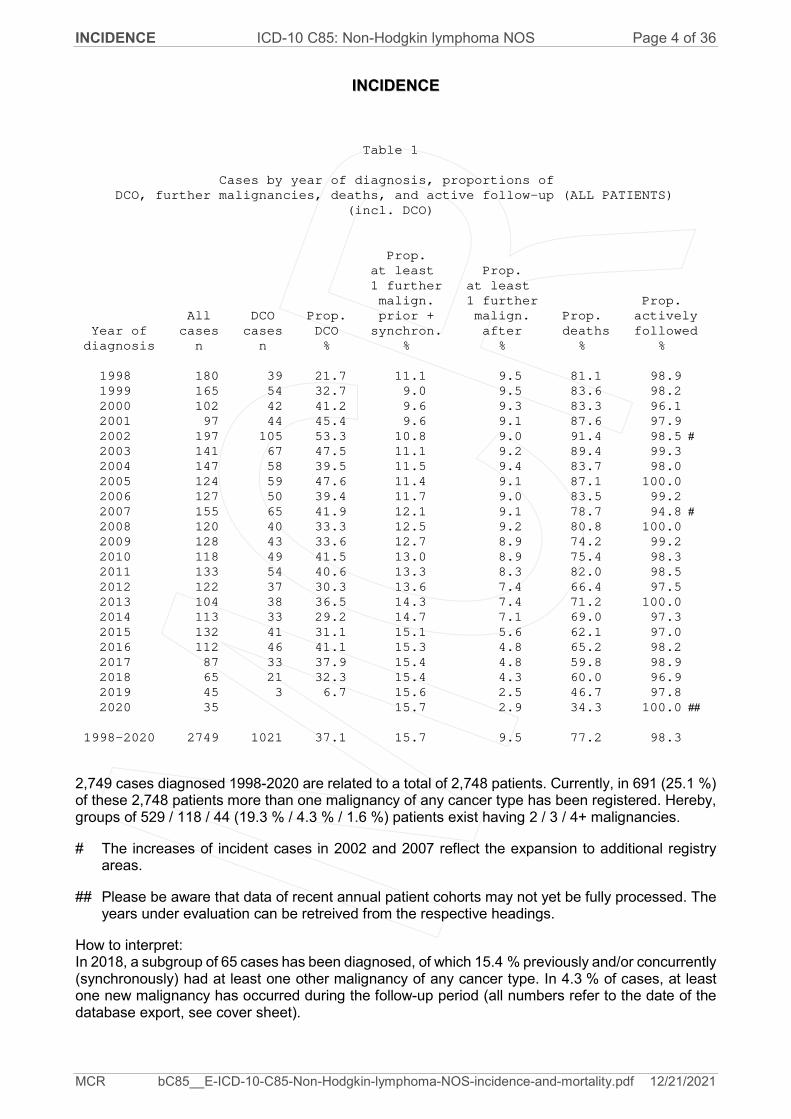
Table 1
Cases by year of diagnosis, proportions of
DCO, further malignancies, deaths, and active follow-up (ALL PATIENTS)
(incl. DCO)
Prop.
at least Prop.
1 further at least
malign. 1 further Prop.
All DCO Prop. prior + malign. Prop. actively
Year of cases cases DCO synchron. after deaths followed
diagnosis n n % % % % %
1998 180 39 21.7 11.1 9.5 81.1 98.9
1999 165 54 32.7 9.0 9.5 83.6 98.2
2000 102 42 41.2 9.6 9.3 83.3 96.1
2001 97 44 45.4 9.6 9.1 87.6 97.9
2002 197 105 53.3 10.8 9.0 91.4 98.5 #
2003 141 67 47.5 11.1 9.2 89.4 99.3
2004 147 58 39.5 11.5 9.4 83.7 98.0
2005 124 59 47.6 11.4 9.1 87.1 100.0
2006 127 50 39.4 11.7 9.0 83.5 99.2
2007 155 65 41.9 12.1 9.1 78.7 94.8 #
2008 120 40 33.3 12.5 9.2 80.8 100.0
2009 128 43 33.6 12.7 8.9 74.2 99.2
2010 118 49 41.5 13.0 8.9 75.4 98.3
2011 133 54 40.6 13.3 8.3 82.0 98.5
2012 122 37 30.3 13.6 7.4 66.4 97.5
2013 104 38 36.5 14.3 7.4 71.2 100.0
2014 113 33 29.2 14.7 7.1 69.0 97.3
2015 132 41 31.1 15.1 5.6 62.1 97.0
2016 112 46 41.1 15.3 4.8 65.2 98.2
2017 87 33 37.9 15.4 4.8 59.8 98.9
2018 65 21 32.3 15.4 4.3 60.0 96.9
2019 45 3 6.7 15.6 2.5 46.7 97.8
2020 35 15.7 2.9 34.3 100.0 ##
1998-2020 2749 1021 37.1 15.7 9.5 77.2 98.3
2,749 cases diagnosed 1998-2020 are related to a total of 2,748 patients. Currently, in 691 (25.1 %) of these 2,748 patients more than one malignancy of any cancer type has been registered. Hereby, groups of 529 / 118 / 44 (19.3 % / 4.3 % / 1.6 %) patients exist having 2 / 3 / 4+ malignancies.
# The increases of incident cases in 2002 and 2007 reflect the expansion to additional registry areas.
## Please be aware that data of recent annual patient cohorts may not yet be fully processed. The years under evaluation can be retreived from the respective headings.
How to interpret: In 2018, a subgroup of 65 cases has been diagnosed, of which 15.4 % previously and/or concurrently (synchronously) had at least one other malignancy of any cancer type. In 4.3 % of cases, at least one new malignancy has occurred during the follow-up period (all numbers refer to the date of the database export, see cover sheet). .
INCIDENCE ICD-10 C85: Non-Hodgkin lymphoma NOS Page 5 of 36
MCR bC85__E-ICD-10-C85-Non-Hodgkin-lymphoma-NOS-incidence-and-mortality.pdf 12/21/2021
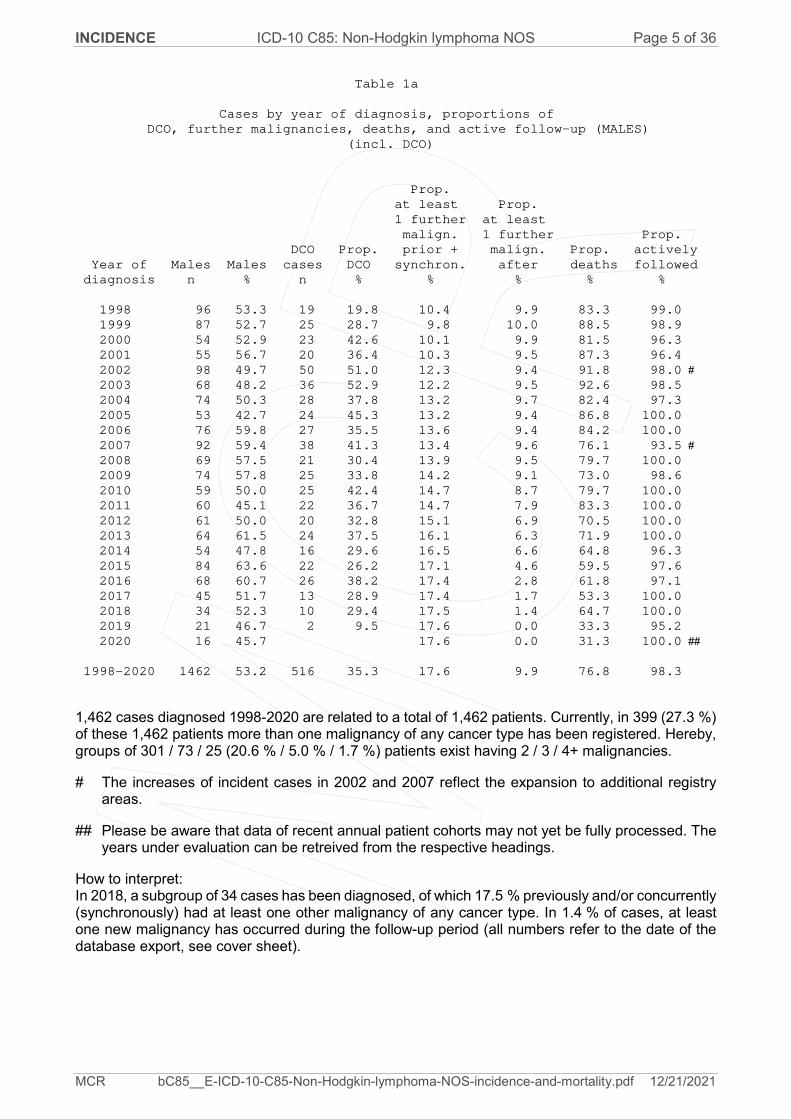
Table 1a
Cases by year of diagnosis, proportions of
DCO, further malignancies, deaths, and active follow-up (MALES)
(incl. DCO)
Prop.
at least Prop.
1 further at least
malign. 1 further Prop.
DCO Prop. prior + malign. Prop. actively
Year of Males Males cases DCO synchron. after deaths followed
diagnosis n % n % % % % %
1998 96 53.3 19 19.8 10.4 9.9 83.3 99.0
1999 87 52.7 25 28.7 9.8 10.0 88.5 98.9
2000 54 52.9 23 42.6 10.1 9.9 81.5 96.3
2001 55 56.7 20 36.4 10.3 9.5 87.3 96.4
2002 98 49.7 50 51.0 12.3 9.4 91.8 98.0 #
2003 68 48.2 36 52.9 12.2 9.5 92.6 98.5
2004 74 50.3 28 37.8 13.2 9.7 82.4 97.3
2005 53 42.7 24 45.3 13.2 9.4 86.8 100.0
2006 76 59.8 27 35.5 13.6 9.4 84.2 100.0
2007 92 59.4 38 41.3 13.4 9.6 76.1 93.5 #
2008 69 57.5 21 30.4 13.9 9.5 79.7 100.0
2009 74 57.8 25 33.8 14.2 9.1 73.0 98.6
2010 59 50.0 25 42.4 14.7 8.7 79.7 100.0
2011 60 45.1 22 36.7 14.7 7.9 83.3 100.0
2012 61 50.0 20 32.8 15.1 6.9 70.5 100.0
2013 64 61.5 24 37.5 16.1 6.3 71.9 100.0
2014 54 47.8 16 29.6 16.5 6.6 64.8 96.3
2015 84 63.6 22 26.2 17.1 4.6 59.5 97.6
2016 68 60.7 26 38.2 17.4 2.8 61.8 97.1
2017 45 51.7 13 28.9 17.4 1.7 53.3 100.0
2018 34 52.3 10 29.4 17.5 1.4 64.7 100.0
2019 21 46.7 2 9.5 17.6 0.0 33.3 95.2
2020 16 45.7 17.6 0.0 31.3 100.0 ##
1998-2020 1462 53.2 516 35.3 17.6 9.9 76.8 98.3
1,462 cases diagnosed 1998-2020 are related to a total of 1,462 patients. Currently, in 399 (27.3 %) of these 1,462 patients more than one malignancy of any cancer type has been registered. Hereby, groups of 301 / 73 / 25 (20.6 % / 5.0 % / 1.7 %) patients exist having 2 / 3 / 4+ malignancies.
# The increases of incident cases in 2002 and 2007 reflect the expansion to additional registry areas.
## Please be aware that data of recent annual patient cohorts may not yet be fully processed. The years under evaluation can be retreived from the respective headings.
How to interpret: In 2018, a subgroup of 34 cases has been diagnosed, of which 17.5 % previously and/or concurrently (synchronously) had at least one other malignancy of any cancer type. In 1.4 % of cases, at least one new malignancy has occurred during the follow-up period (all numbers refer to the date of the database export, see cover sheet). .
INCIDENCE ICD-10 C85: Non-Hodgkin lymphoma NOS Page 6 of 36
MCR bC85__E-ICD-10-C85-Non-Hodgkin-lymphoma-NOS-incidence-and-mortality.pdf 12/21/2021
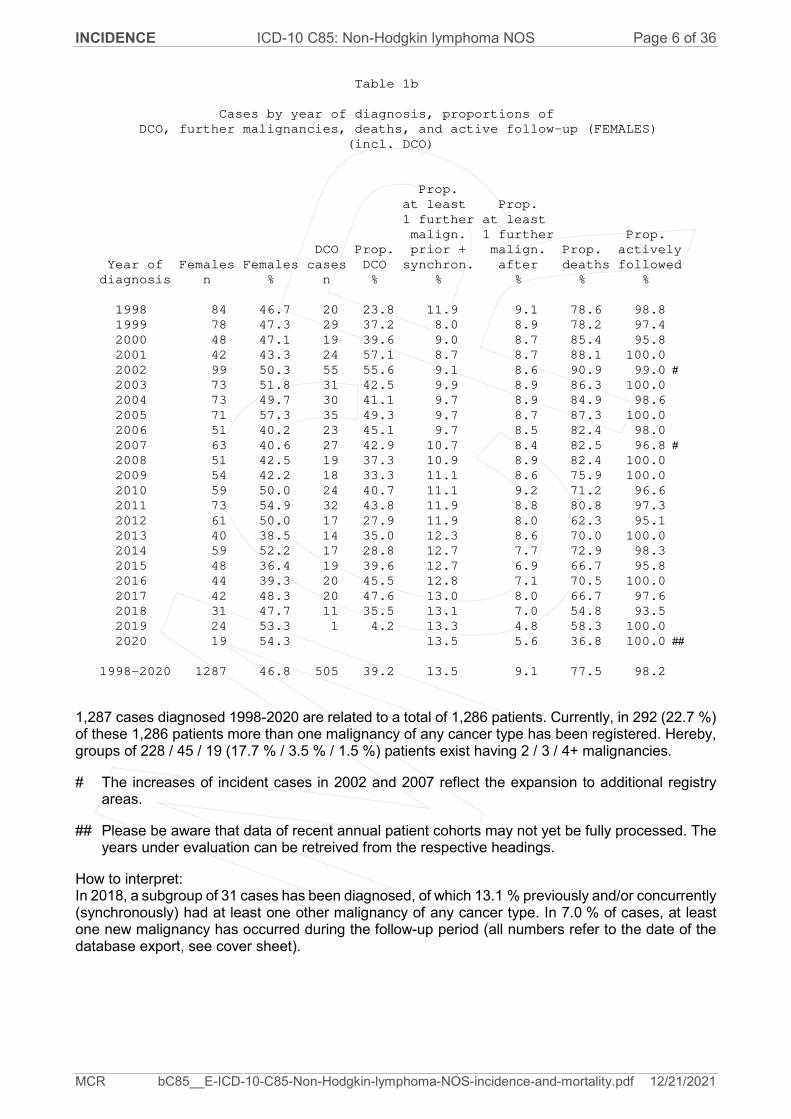
Table 1b
Cases by year of diagnosis, proportions of
DCO, further malignancies, deaths, and active follow-up (FEMALES)
(incl. DCO)
Prop.
at least Prop.
1 further at least
malign. 1 further Prop.
DCO Prop. prior + malign. Prop. actively
Year of Females Females cases DCO synchron. after deaths followed
diagnosis n % n % % % % %
1998 84 46.7 20 23.8 11.9 9.1 78.6 98.8
1999 78 47.3 29 37.2 8.0 8.9 78.2 97.4
2000 48 47.1 19 39.6 9.0 8.7 85.4 95.8
2001 42 43.3 24 57.1 8.7 8.7 88.1 100.0
2002 99 50.3 55 55.6 9.1 8.6 90.9 99.0 #
2003 73 51.8 31 42.5 9.9 8.9 86.3 100.0
2004 73 49.7 30 41.1 9.7 8.9 84.9 98.6
2005 71 57.3 35 49.3 9.7 8.7 87.3 100.0
2006 51 40.2 23 45.1 9.7 8.5 82.4 98.0
2007 63 40.6 27 42.9 10.7 8.4 82.5 96.8 #
2008 51 42.5 19 37.3 10.9 8.9 82.4 100.0
2009 54 42.2 18 33.3 11.1 8.6 75.9 100.0
2010 59 50.0 24 40.7 11.1 9.2 71.2 96.6
2011 73 54.9 32 43.8 11.9 8.8 80.8 97.3
2012 61 50.0 17 27.9 11.9 8.0 62.3 95.1
2013 40 38.5 14 35.0 12.3 8.6 70.0 100.0
2014 59 52.2 17 28.8 12.7 7.7 72.9 98.3
2015 48 36.4 19 39.6 12.7 6.9 66.7 95.8
2016 44 39.3 20 45.5 12.8 7.1 70.5 100.0
2017 42 48.3 20 47.6 13.0 8.0 66.7 97.6
2018 31 47.7 11 35.5 13.1 7.0 54.8 93.5
2019 24 53.3 1 4.2 13.3 4.8 58.3 100.0
2020 19 54.3 13.5 5.6 36.8 100.0 ##
1998-2020 1287 46.8 505 39.2 13.5 9.1 77.5 98.2
1,287 cases diagnosed 1998-2020 are related to a total of 1,286 patients. Currently, in 292 (22.7 %) of these 1,286 patients more than one malignancy of any cancer type has been registered. Hereby, groups of 228 / 45 / 19 (17.7 % / 3.5 % / 1.5 %) patients exist having 2 / 3 / 4+ malignancies.
# The increases of incident cases in 2002 and 2007 reflect the expansion to additional registry areas.
## Please be aware that data of recent annual patient cohorts may not yet be fully processed. The years under evaluation can be retreived from the respective headings.
How to interpret: In 2018, a subgroup of 31 cases has been diagnosed, of which 13.1 % previously and/or concurrently (synchronously) had at least one other malignancy of any cancer type. In 7.0 % of cases, at least one new malignancy has occurred during the follow-up period (all numbers refer to the date of the database export, see cover sheet). .
INCIDENCE ICD-10 C85: Non-Hodgkin lymphoma NOS Page 7 of 36
MCR bC85__E-ICD-10-C85-Non-Hodgkin-lymphoma-NOS-incidence-and-mortality.pdf 12/21/2021
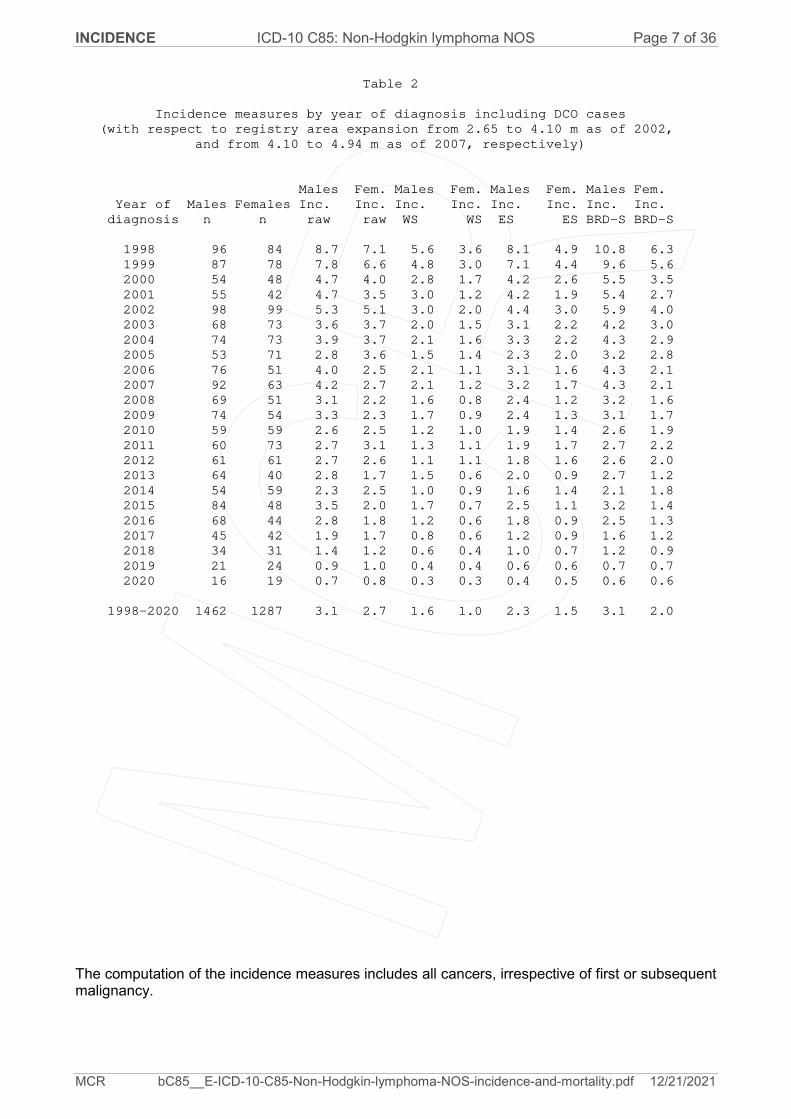
Table 2
Incidence measures by year of diagnosis including DCO cases
(with respect to registry area expansion from 2.65 to 4.10 m as of 2002,
and from 4.10 to 4.94 m as of 2007, respectively)
Males Fem. Males Fem. Males Fem. Males Fem.
Year of Males Females Inc. Inc. Inc. Inc. Inc. Inc. Inc. Inc.
diagnosis n n raw raw WS WS ES ES BRD-S BRD-S
1998 96 84 8.7 7.1 5.6 3.6 8.1 4.9 10.8 6.3
1999 87 78 7.8 6.6 4.8 3.0 7.1 4.4 9.6 5.6
2000 54 48 4.7 4.0 2.8 1.7 4.2 2.6 5.5 3.5
2001 55 42 4.7 3.5 3.0 1.2 4.2 1.9 5.4 2.7
2002 98 99 5.3 5.1 3.0 2.0 4.4 3.0 5.9 4.0
2003 68 73 3.6 3.7 2.0 1.5 3.1 2.2 4.2 3.0
2004 74 73 3.9 3.7 2.1 1.6 3.3 2.2 4.3 2.9
2005 53 71 2.8 3.6 1.5 1.4 2.3 2.0 3.2 2.8
2006 76 51 4.0 2.5 2.1 1.1 3.1 1.6 4.3 2.1
2007 92 63 4.2 2.7 2.1 1.2 3.2 1.7 4.3 2.1
2008 69 51 3.1 2.2 1.6 0.8 2.4 1.2 3.2 1.6
2009 74 54 3.3 2.3 1.7 0.9 2.4 1.3 3.1 1.7
2010 59 59 2.6 2.5 1.2 1.0 1.9 1.4 2.6 1.9
2011 60 73 2.7 3.1 1.3 1.1 1.9 1.7 2.7 2.2
2012 61 61 2.7 2.6 1.1 1.1 1.8 1.6 2.6 2.0
2013 64 40 2.8 1.7 1.5 0.6 2.0 0.9 2.7 1.2
2014 54 59 2.3 2.5 1.0 0.9 1.6 1.4 2.1 1.8
2015 84 48 3.5 2.0 1.7 0.7 2.5 1.1 3.2 1.4
2016 68 44 2.8 1.8 1.2 0.6 1.8 0.9 2.5 1.3
2017 45 42 1.9 1.7 0.8 0.6 1.2 0.9 1.6 1.2
2018 34 31 1.4 1.2 0.6 0.4 1.0 0.7 1.2 0.9
2019 21 24 0.9 1.0 0.4 0.4 0.6 0.6 0.7 0.7
2020 16 19 0.7 0.8 0.3 0.3 0.4 0.5 0.6 0.6
1998-2020 1462 1287 3.1 2.7 1.6 1.0 2.3 1.5 3.1 2.0
The computation of the incidence measures includes all cancers, irrespective of first or subsequent malignancy. .

INCIDENCE ICD-10 C85: Non-Hodgkin lymphoma NOS Page 8 of 36
MCR bC85__E-ICD-10-C85-Non-Hodgkin-lymphoma-NOS-incidence-and-mortality.pdf 12/21/2021
Table 3
Age distribution parameters by year of diagnosis (ALL PATIENTS)
(incl. DCO)
Year of Cases Std. Median
diagnosis n Mean dev. Min. Max. 10% 25% 50% 75% 90%
1998 180 67.1 18.0 5.9 100 43.6 55.9 71.0 80.6 86.6
1999 165 67.9 16.3 2.8 93.9 46.3 57.5 71.8 80.7 87.3
2000 102 68.5 14.9 15.7 91.6 48.6 58.0 71.9 80.4 85.2
2001 97 68.6 16.7 24.8 98.7 41.2 61.6 71.6 79.9 87.2
2002 197 71.4 15.8 1.2 95.5 51.5 64.3 74.3 81.1 89.3
2003 141 72.5 14.1 16.7 96.3 58.0 65.1 74.9 82.2 87.4
2004 147 70.8 16.0 8.4 97.8 49.1 63.4 73.1 82.9 87.0
2005 124 71.7 15.2 12.9 92.9 49.5 64.6 75.6 82.5 86.8
2006 127 70.5 15.5 1.9 98.5 55.8 65.2 72.5 79.3 86.1
2007 155 69.5 17.0 19.4 98.2 43.3 63.2 73.1 81.3 87.6
2008 120 72.0 13.7 25.2 95.6 55.5 63.8 73.9 82.3 87.8
2009 128 69.9 15.2 11.7 92.9 43.8 65.4 72.9 81.0 85.6
2010 118 73.1 15.5 14.3 94.9 52.8 67.7 76.9 84.4 88.9
2011 133 73.0 17.1 11.4 97.7 50.9 67.6 77.3 85.1 90.0
2012 122 72.7 14.8 11.5 96.0 55.5 65.5 76.3 81.8 87.4
2013 104 70.9 18.5 7.0 96.3 47.0 67.7 75.7 83.4 87.7
2014 113 73.5 15.1 15.7 94.7 53.1 67.8 75.6 83.5 89.8
2015 132 71.2 15.8 17.7 97.8 47.3 65.1 75.7 81.8 87.3
2016 112 72.8 16.2 24.3 96.4 45.9 67.0 77.2 83.7 87.7
2017 87 74.3 16.4 24.5 104 50.2 68.1 77.9 84.7 91.4
2018 65 73.4 13.4 36.6 93.7 57.8 66.8 76.2 83.6 87.9
2019 45 69.6 17.3 30.1 98.0 40.8 63.4 74.7 82.5 85.2
2020 35 69.7 17.3 23.8 90.1 48.9 52.3 77.8 81.3 87.2
1998-2020 2749 71.0 16.0 1.2 104 48.4 63.5 74.5 82.3 87.6

INCIDENCE ICD-10 C85: Non-Hodgkin lymphoma NOS Page 9 of 36
MCR bC85__E-ICD-10-C85-Non-Hodgkin-lymphoma-NOS-incidence-and-mortality.pdf 12/21/2021
Table 3a
Age distribution parameters by year of diagnosis (MALES)
(incl. DCO)
Year of Cases Std. Median
diagnosis n Mean dev. Min. Max. 10% 25% 50% 75% 90%
1998 96 65.3 17.6 8.3 91.4 40.4 54.9 68.8 78.7 85.8
1999 87 65.8 17.1 2.8 93.8 44.9 57.1 67.1 78.8 84.4
2000 54 66.7 13.4 31.9 90.0 49.8 58.0 67.4 77.9 82.1
2001 55 63.1 16.3 24.8 88.2 38.0 51.9 66.9 75.9 78.4
2002 98 68.3 15.9 1.2 95.5 46.8 61.4 71.1 80.1 82.9
2003 68 71.3 13.4 19.8 94.3 58.5 63.0 73.1 81.8 87.7
2004 74 69.1 15.3 31.8 97.8 48.6 58.9 71.6 80.3 85.5
2005 53 70.0 17.5 12.9 90.9 44.9 61.1 76.1 82.9 85.6
2006 76 70.7 16.1 1.9 98.5 54.1 65.1 75.3 79.4 86.0
2007 92 69.2 15.5 19.4 92.7 48.1 64.0 71.8 79.4 85.2
2008 69 69.6 13.7 25.2 93.1 50.6 62.7 72.2 78.8 84.6
2009 74 67.9 15.8 11.7 92.9 43.6 62.5 71.2 77.7 84.4
2010 59 73.1 15.1 28.2 92.2 52.0 62.8 76.7 85.2 89.1
2011 60 71.7 16.5 11.4 94.6 52.0 66.5 76.7 83.3 85.9
2012 61 73.6 13.7 11.5 96.0 55.7 68.6 77.2 81.9 85.9
2013 64 68.5 21.2 7.0 96.3 23.6 61.7 74.8 82.0 87.4
2014 54 73.3 14.9 22.3 93.4 53.1 65.0 76.9 83.2 90.4
2015 84 69.6 16.8 17.7 91.6 44.2 61.4 74.8 81.8 87.3
2016 68 71.5 15.8 29.1 93.5 40.9 65.9 75.9 82.8 87.0
2017 45 73.4 16.4 24.5 97.4 50.2 65.6 77.1 83.6 93.3
2018 34 71.8 15.1 36.6 90.3 40.8 66.0 76.2 83.4 87.4
2019 21 70.8 15.8 34.0 98.0 53.3 64.0 71.2 82.3 83.7
2020 16 69.0 14.8 48.9 90.1 50.4 52.0 73.8 81.0 85.0
1998-2020 1462 69.4 16.1 1.2 98.5 47.0 61.6 73.0 80.6 86.4

INCIDENCE ICD-10 C85: Non-Hodgkin lymphoma NOS Page 10 of 36
MCR bC85__E-ICD-10-C85-Non-Hodgkin-lymphoma-NOS-incidence-and-mortality.pdf 12/21/2021
Table 3b
Age distribution parameters by year of diagnosis (FEMALES)
(incl. DCO)
Year of Cases Std. Median
diagnosis n Mean dev. Min. Max. 10% 25% 50% 75% 90%
1998 84 69.2 18.4 5.9 100 45.9 60.5 74.4 82.7 88.3
1999 78 70.2 15.3 25.0 93.9 46.4 57.5 72.9 82.8 87.9
2000 48 70.6 16.3 15.7 91.6 48.1 58.3 75.4 82.9 85.7
2001 42 75.9 14.6 39.6 98.7 49.6 71.3 79.5 86.6 88.5
2002 99 74.5 15.0 6.6 94.6 55.0 67.7 77.4 85.8 90.4
2003 73 73.6 14.8 16.7 96.3 51.4 66.9 78.1 83.4 87.4
2004 73 72.6 16.7 8.4 94.1 53.7 67.7 77.2 83.1 87.0
2005 71 73.0 13.3 26.4 92.9 56.1 66.2 74.9 82.5 86.8
2006 51 70.3 14.6 21.8 95.8 61.1 65.9 70.9 79.3 86.1
2007 63 69.9 19.0 22.6 98.2 39.9 59.5 73.7 83.1 89.5
2008 51 75.1 13.2 38.6 95.6 57.5 67.2 78.8 85.4 88.4
2009 54 72.6 14.0 37.1 91.6 49.3 67.3 74.9 83.1 85.9
2010 59 73.2 16.1 14.3 94.9 54.8 69.4 77.1 83.7 88.6
2011 73 74.1 17.6 25.2 97.7 47.8 69.7 77.6 86.5 91.0
2012 61 71.9 15.8 19.9 95.5 55.5 63.4 74.5 81.7 88.6
2013 40 74.7 12.6 41.3 91.8 52.2 70.0 75.9 84.9 87.9
2014 59 73.7 15.5 15.7 94.7 51.4 68.4 75.5 85.0 89.6
2015 48 74.0 13.6 26.1 97.8 53.6 68.5 77.0 81.7 88.4
2016 44 74.8 16.7 24.3 96.4 45.9 69.8 79.9 85.1 90.4
2017 42 75.2 16.6 25.0 104 52.9 70.3 80.1 85.8 88.7
2018 31 75.3 11.3 54.0 93.7 58.7 67.5 75.8 85.3 88.1
2019 24 68.5 18.8 30.1 91.9 36.8 55.6 75.7 82.7 85.2
2020 19 70.3 19.5 23.8 89.9 32.0 61.9 78.4 85.4 88.0
1998-2020 1287 72.7 15.7 5.9 104 50.2 66.8 76.2 84.0 88.5

INCIDENCE ICD-10 C85: Non-Hodgkin lymphoma NOS Page 11 of 36
MCR bC85__E-ICD-10-C85-Non-Hodgkin-lymphoma-NOS-incidence-and-mortality.pdf 12/21/2021
Table 4
Age distribution by 5-year age group and sex for period 2007-2020
(incl. DCO)
Age at
diagnosis Cases Males Females
Years n % Cum.% n % Cum.% n % Cum.%
0-4
5-9 1 0.1 0.1 1 0.1 0.1 0.0
10-14 5 0.3 0.4 4 0.5 0.6 1 0.1 0.1
15-19 6 0.4 0.8 4 0.5 1.1 2 0.3 0.4
20-24 13 0.9 1.7 7 0.9 2.0 6 0.9 1.3
25-29 14 1.0 2.7 7 0.9 2.9 7 1.0 2.4
30-34 18 1.2 3.9 10 1.2 4.1 8 1.2 3.6
35-39 35 2.4 6.3 18 2.2 6.4 17 2.5 6.1
40-44 27 1.8 8.1 16 2.0 8.4 11 1.6 7.8
45-49 31 2.1 10.2 17 2.1 10.5 14 2.1 9.9
50-54 53 3.6 13.8 37 4.6 15.1 16 2.4 12.3
55-59 68 4.6 18.4 39 4.9 20.0 29 4.3 16.6
60-64 77 5.2 23.7 47 5.9 25.8 30 4.5 21.1
65-69 160 10.9 34.6 90 11.2 37.1 70 10.5 31.6
70-74 202 13.8 48.3 111 13.9 50.9 91 13.6 45.2
75-79 236 16.1 64.4 146 18.2 69.2 90 13.5 58.7
80-84 243 16.5 80.9 126 15.7 84.9 117 17.5 76.2
85+ 280 19.1 100.0 121 15.1 100.0 159 23.8 100.0
All ages 1469 100.0 801 100.0 668 100.0
INCIDENCE ICD-10 C85: Non-Hodgkin lymphoma NOS Page 12 of 36
MCR bC85__E-ICD-10-C85-Non-Hodgkin-lymphoma-NOS-incidence-and-mortality.pdf 12/21/2021
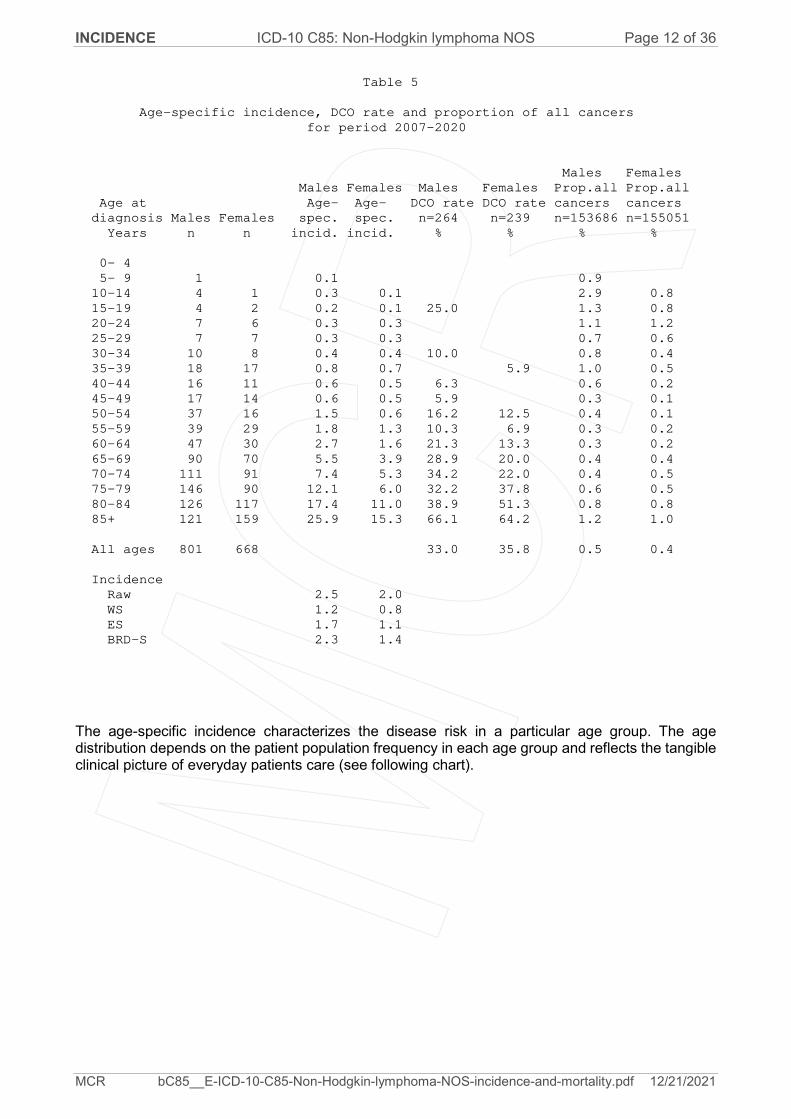
Table 5
Age-specific incidence, DCO rate and proportion of all cancers
for period 2007-2020
Males Females
Males Females Males Females Prop.all Prop.all
Age at Age- Age- DCO rate DCO rate cancers cancers
diagnosis Males Females spec. spec. n=264 n=239 n=153686 n=155051
Years n n incid. incid. % % % %
0- 4
5- 9 1 0.1 0.9
10-14 4 1 0.3 0.1 2.9 0.8
15-19 4 2 0.2 0.1 25.0 1.3 0.8
20-24 7 6 0.3 0.3 1.1 1.2
25-29 7 7 0.3 0.3 0.7 0.6
30-34 10 8 0.4 0.4 10.0 0.8 0.4
35-39 18 17 0.8 0.7 5.9 1.0 0.5
40-44 16 11 0.6 0.5 6.3 0.6 0.2
45-49 17 14 0.6 0.5 5.9 0.3 0.1
50-54 37 16 1.5 0.6 16.2 12.5 0.4 0.1
55-59 39 29 1.8 1.3 10.3 6.9 0.3 0.2
60-64 47 30 2.7 1.6 21.3 13.3 0.3 0.2
65-69 90 70 5.5 3.9 28.9 20.0 0.4 0.4
70-74 111 91 7.4 5.3 34.2 22.0 0.4 0.5
75-79 146 90 12.1 6.0 32.2 37.8 0.6 0.5
80-84 126 117 17.4 11.0 38.9 51.3 0.8 0.8
85+ 121 159 25.9 15.3 66.1 64.2 1.2 1.0
All ages 801 668 33.0 35.8 0.5 0.4
Incidence
Raw 2.5 2.0
WS 1.2 0.8
ES 1.7 1.1
BRD-S 2.3 1.4
The age-specific incidence characterizes the disease risk in a particular age group. The age distribution depends on the patient population frequency in each age group and reflects the tangible clinical picture of everyday patients care (see following chart). .

INCIDENCE ICD-10 C85: Non-Hodgkin lymphoma NOS Page 13 of 36
MCR bC85__E-ICD-10-C85-Non-Hodgkin-lymphoma-NOS-incidence-and-mortality.pdf 12/21/2021
Figure 6. Age distribution (males: mean=70.8 yrs, median=74.7 yrs; females: mean=73.2 yrs, median=76.5 yrs) and age-specific incidence.
Age distribution (%)
Age-spec. incidence (per 100,000)
MALES FEMALES
Avera
ged a
nnual
age-s
pecific
incid
ence (
per
100,0
00)
0
5
10
15
20
25
30
Age at diagnosis (years)
0-4
5-9
10-1
4
15-1
9
20-2
4
25-2
9
30-3
4
35-3
9
40-4
4
45-4
9
50-5
4
55-5
9
60-6
4
65-6
9
70-7
4
75-7
9
80-8
4
85+
Age d
istrib
utio
n (%
)
0
5
10
15
20
25
ICD-10 C85: Other and unspecified types of non-Hodgkin lymphomaAge distribution and age-specific incidence 2007 - 2020 (Males: 801, Females: 668)

INCIDENCE ICD-10 C85: Non-Hodgkin lymphoma NOS Page 14 of 36
MCR bC85__E-ICD-10-C85-Non-Hodgkin-lymphoma-NOS-incidence-and-mortality.pdf 12/21/2021
Figure 6a. Age-specific incidence in MCR registry areas compared to Germany (FRG, RKI estimates) and SEER (Surveillance, Epidemiology, and End Results, USA).
Reference:
Estimated age-specific patient population of Germany, latest update: 16 March 2021. German Centre for Cancer Registry Data, Robert Koch Institute (RKI), based on data of the population based cancer registries. http://www.krebsdaten.de. Last access: 08/17/2021 Surveillance, Epidemiology, and End Results (SEER) Program SEER*Stat Database: Incidence - SEER 21 Regs Research Data, released April 2021, based on the November 2020 submission. http://www.seer.cancer.gov.
1-y
ear
avera
ged incid
ence (
per
100,0
00)
0
5
10
15
20
25
30
35
Age at diagnosis (years)
0-4
5-9
10-1
4
15-1
9
20-2
4
25-2
9
30-3
4
35-3
9
40-4
4
45-4
9
50-5
4
55-5
9
60-6
4
65-6
9
70-7
4
75-7
9
80-8
4
85+
ICD-10 C85: Other and unspecified types of non-Hodgkin lymphomaAge-specific incidence rates: international comparison
Region Period Population
MALES FEMALES
MCR 2007-2020 4.9 m
SEER 2007-2018 86.7 m
FRG (RKI estimates) 2007-2017 82.8 m

INCIDENCE ICD-10 C85: Non-Hodgkin lymphoma NOS Page 15 of 36
MCR bC85__E-ICD-10-C85-Non-Hodgkin-lymphoma-NOS-incidence-and-mortality.pdf 12/21/2021
Table 7a
Standardized incidence ratio (SIR, with 95% confidence limits),
excess absolute risk (EAR) and DCO rate of further malignancies
for period 1998-2020
MALES
Observed Expected CI CI DCO
Diagnosis n n SIR 95% 95% EAR %
C03-C06 Oral cavity 1 0.4 2.4 0.1 13.6 1.8
C07-C08 Salivary gland 1 0.1 8.0 0.2 44.6 2.6
C09-C10 Oropharynx 2 0.5 4.1 0.5 15.0 4.5
C15 Oesophagus 1 1.0 1.0 0.0 5.8 0.1
C16 Stomach 5 2.2 2.3 0.8 5.4 8.5 20.0
C17 Small intestine 1 0.3 3.4 0.1 18.9 2.1
C18 Colon 8 5.2 1.5 0.7 3.0 8.3 12.5
C19-C20 Rectum 6 2.7 2.2 0.8 4.8 9.9
C21 Anus/canal 1 0.1 8.5 0.2 47.5 2.6
C22 Liver 3 1.5 2.1 0.4 6.0 4.6
C23-C24 Bile 1 0.5 1.8 0.0 10.1 1.3
C25 Pancreas 6 2.0 3.0 1.1 6.5 # 11.9
C32 Larynx 1 0.5 2.0 0.1 11.2 1.5
C33-C34 Lung 23 6.0 3.8 2.4 5.7 # 50.7 13.0
C38,C45 Mesothelioma 2 0.3 5.7 0.7 20.7 4.9
C43 Malign. melanoma 10 2.3 4.4 2.1 8.2 # 23.1
C46,C49 Soft tissue 2 0.3 6.5 0.8 23.6 5.1
C50 Breast 1 0.1 7.3 0.2 40.5 2.6
C60 Penis 1 0.1 7.7 0.2 42.7 2.6
C61 Prostate 35 14.7 2.4 1.7 3.3 # 60.6 2.9
C64 Kidney 10 1.7 5.7 2.7 10.5 # 24.6
C66 Ureter 2 0.1 14.6 1.8 52.9 # 5.6
C67 Bladder 9 2.5 3.6 1.6 6.8 # 19.3
C68 Urethra 2 0.0 43.7 5.3 158.0 # 5.8
C69 Eye lymphoma 1 0.0 86.2 2.2 480.1 # 3.0
C70-C72 CNS cancer 4 0.7 6.1 1.7 15.6 # 10.0 25.0
C76-C79 CUP 2 0.9 2.2 0.3 8.0 3.3
C81 Hodgkin lymphoma 4 0.1 32.9 9.0 84.2 # 11.6 25.0
C82-C85 NHL 6 2.2 2.7 1.0 5.9 11.3 16.7
C90 Mult. myeloma 1 0.7 1.5 0.0 8.1 0.9
C91-C96 Leukaemia 9 0.8 11.1 5.1 21.0 # 24.4 22.2
Not observed 0 1.7 0.0 0.0 2.2 -5.0
All further malignancies 161 52.4 3.1 2.6 3.6 # 324.2 6.8
Patients 1019
Median age at next malignancy (years) 72.6
Person-years 3349
Mean observation time (years) 3.3
Median observation time (years) 1.3
# The occurrence of further specified malignancy is statistically significant. .

INCIDENCE ICD-10 C85: Non-Hodgkin lymphoma NOS Page 16 of 36
MCR bC85__E-ICD-10-C85-Non-Hodgkin-lymphoma-NOS-incidence-and-mortality.pdf 12/21/2021
Table 7b
Standardized incidence ratio (SIR, with 95% confidence limits),
excess absolute risk (EAR) and DCO rate of further malignancies
for period 1998-2020
FEMALES
Observed Expected CI CI DCO
Diagnosis n n SIR 95% 95% EAR %
C03-C06 Oral cavity 1 0.2 4.8 0.1 26.6 2.4
C09-C10 Oropharynx 1 0.1 7.0 0.2 39.0 2.6
C15 Oesophagus 1 0.2 4.3 0.1 24.1 2.3
C16 Stomach 2 1.3 1.5 0.2 5.4 2.0 50.0
C18 Colon 8 3.7 2.1 0.9 4.2 13.0
C19-C20 Rectum 3 1.5 2.0 0.4 5.8 4.5
C21 Anus/canal 1 0.2 5.1 0.1 28.4 2.5
C22 Liver 1 0.5 2.2 0.1 12.2 1.7
C23-C24 Bile 5 0.5 9.1 3.0 21.3 # 13.6
C25 Pancreas 4 1.7 2.3 0.6 6.0 7.0
C33-C34 Lung 7 2.7 2.6 1.1 5.4 # 13.2
C43 Malign. melanoma 5 1.3 3.7 1.2 8.7 # 11.2
C46,C49 Soft tissue 2 0.2 9.5 1.2 34.3 # 5.5
C50 Breast 31 10.8 2.9 2.0 4.1 # 61.7 6.5
C53 Cervix uteri 2 0.5 4.3 0.5 15.6 4.7 50.0
C54 Corpus uteri 8 2.0 4.0 1.7 7.9 # 18.3
C56 Ovary 2 1.5 1.4 0.2 4.9 1.6
C69 Eye lymphoma 1 0.0 86.3 2.2 481.0 # 3.0
C69 Eye melanoma 1 0.0 20.8 0.5 116.0 2.9
C70-C72 CNS cancer 1 0.5 2.1 0.1 11.5 1.6 100.0
C73 Thyroid 6 0.6 10.7 3.9 23.4 # 16.6 16.7
C76-C79 CUP 1 0.7 1.5 0.0 8.1 1.0
C82-C85 NHL 5 1.5 3.4 1.1 8.0 # 10.8
C90 Mult. myeloma 2 0.5 4.4 0.5 15.8 4.7
C91-C96 Leukaemia 6 0.5 11.1 4.1 24.2 # 16.7 33.3
Not observed 0 3.4 0.0 0.0 1.1 -10.4
All further malignancies 107 36.7 2.9 2.4 3.5 # 214.7 7.5
Patients 852
Median age at next malignancy (years) 73.7
Person-years 3273
Mean observation time (years) 3.8
Median observation time (years) 1.7
# The occurrence of further specified malignancy is statistically significant. .
INCIDENCE ICD-10 C85: Non-Hodgkin lymphoma NOS Page 17 of 36
MCR bC85__E-ICD-10-C85-Non-Hodgkin-lymphoma-NOS-incidence-and-mortality.pdf 12/21/2021
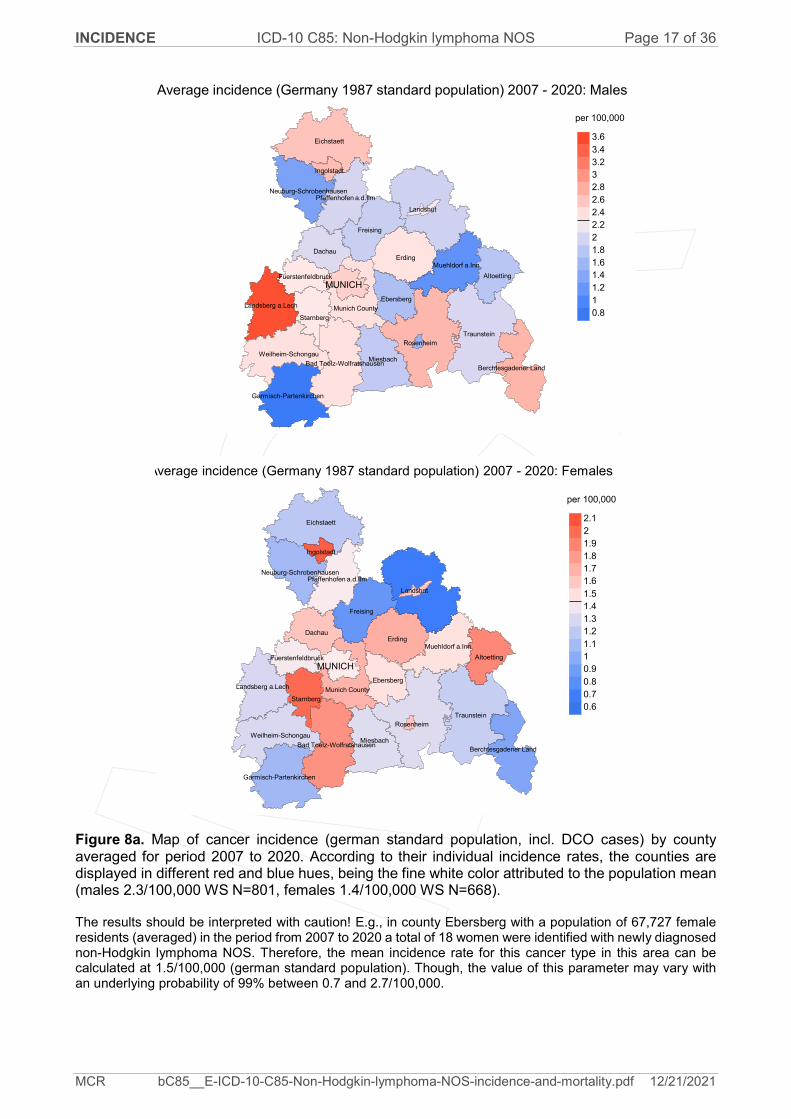
Figure 8a. Map of cancer incidence (german standard population, incl. DCO cases) by county averaged for period 2007 to 2020. According to their individual incidence rates, the counties are displayed in different red and blue hues, being the fine white color attributed to the population mean (males 2.3/100,000 WS N=801, females 1.4/100,000 WS N=668).
The results should be interpreted with caution! E.g., in county Ebersberg with a population of 67,727 female residents (averaged) in the period from 2007 to 2020 a total of 18 women were identified with newly diagnosed non-Hodgkin lymphoma NOS. Therefore, the mean incidence rate for this cancer type in this area can be calculated at 1.5/100,000 (german standard population). Though, the value of this parameter may vary with an underlying probability of 99% between 0.7 and 2.7/100,000.
Average incidence (Germany 1987 standard population) 2007 - 2020: Males
per 100,000
3.6
3.4
3.2
3
2.8
2.6
2.4
2.2
2
1.8
1.6
1.4
1.2
1
0.8Starnberg
Fuerstenfeldbruck
Weilheim-Schongau
Garmisch-Partenkirchen
Muehldorf a.InnErding
Altoetting
Eichstaett
Neuburg-SchrobenhausenPfaffenhofen a.d.Ilm
Landsberg a.Lech
Dachau
Traunstein
Berchtesgadener Land
MiesbachBad Toelz-Wolfratshausen
Ebersberg
Munich County
Freising
Landshut
Ingolstadt
MUNICH
Rosenheim
Average incidence (Germany 1987 standard population) 2007 - 2020: Females
per 100,000
2.1
2
1.9
1.8
1.7
1.6
1.5
1.4
1.3
1.2
1.1
1
0.9
0.8
0.7
0.6Starnberg
Fuerstenfeldbruck
Weilheim-Schongau
Garmisch-Partenkirchen
Muehldorf a.InnErding
Altoetting
Eichstaett
Neuburg-SchrobenhausenPfaffenhofen a.d.Ilm
Landsberg a.Lech
Dachau
Traunstein
Berchtesgadener Land
MiesbachBad Toelz-Wolfratshausen
Ebersberg
Munich County
Freising
Landshut
Ingolstadt
MUNICH
Rosenheim
INCIDENCE ICD-10 C85: Non-Hodgkin lymphoma NOS Page 18 of 36
MCR bC85__E-ICD-10-C85-Non-Hodgkin-lymphoma-NOS-incidence-and-mortality.pdf 12/21/2021
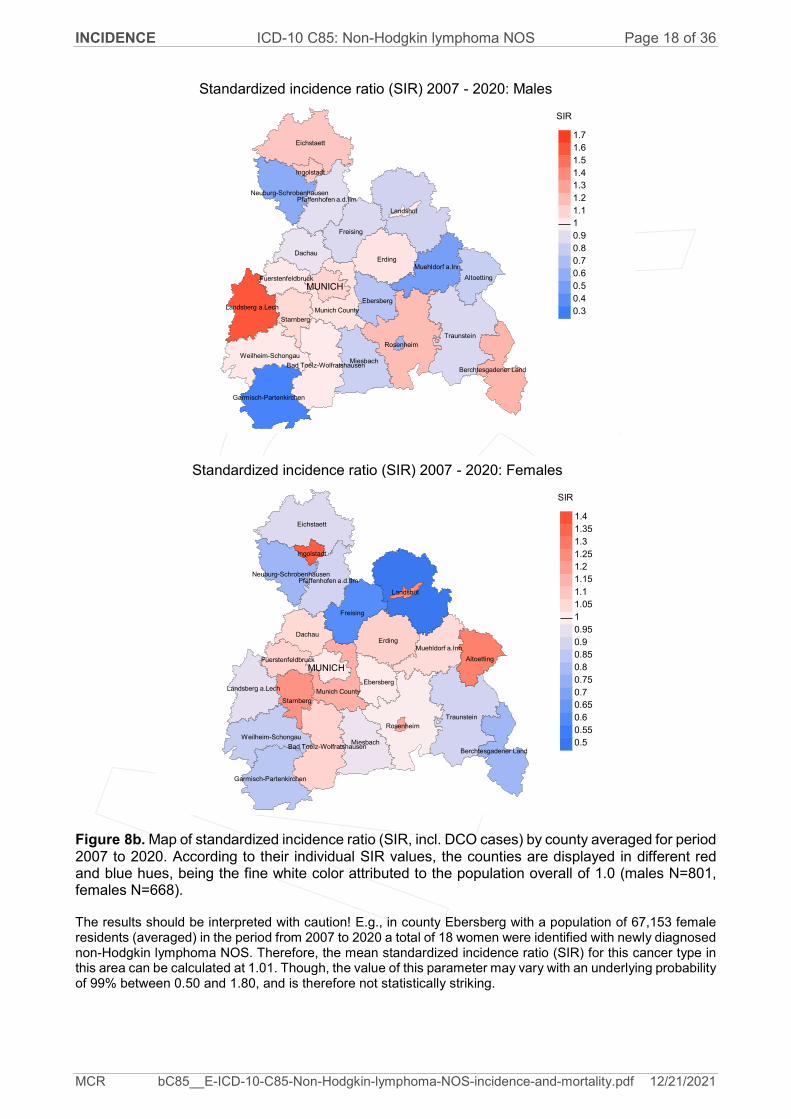
Figure 8b. Map of standardized incidence ratio (SIR, incl. DCO cases) by county averaged for period 2007 to 2020. According to their individual SIR values, the counties are displayed in different red and blue hues, being the fine white color attributed to the population overall of 1.0 (males N=801, females N=668).
The results should be interpreted with caution! E.g., in county Ebersberg with a population of 67,153 female residents (averaged) in the period from 2007 to 2020 a total of 18 women were identified with newly diagnosed non-Hodgkin lymphoma NOS. Therefore, the mean standardized incidence ratio (SIR) for this cancer type in this area can be calculated at 1.01. Though, the value of this parameter may vary with an underlying probability of 99% between 0.50 and 1.80, and is therefore not statistically striking.
Standardized incidence ratio (SIR) 2007 - 2020: Males
SIR
1.7
1.6
1.5
1.4
1.3
1.2
1.1
1
0.9
0.8
0.7
0.6
0.5
0.4
0.3Starnberg
Fuerstenfeldbruck
Weilheim-Schongau
Garmisch-Partenkirchen
Muehldorf a.InnErding
Altoetting
Eichstaett
Neuburg-SchrobenhausenPfaffenhofen a.d.Ilm
Landsberg a.Lech
Dachau
Traunstein
Berchtesgadener Land
MiesbachBad Toelz-Wolfratshausen
Ebersberg
Munich County
Freising
Landshut
Ingolstadt
MUNICH
Rosenheim
Standardized incidence ratio (SIR) 2007 - 2020: Females
SIR
1.4
1.35
1.3
1.25
1.2
1.15
1.1
1.05
1
0.95
0.9
0.85
0.8
0.75
0.7
0.65
0.6
0.55
0.5
Starnberg
Fuerstenfeldbruck
Weilheim-Schongau
Garmisch-Partenkirchen
Muehldorf a.InnErding
Altoetting
Eichstaett
Neuburg-SchrobenhausenPfaffenhofen a.d.Ilm
Landsberg a.Lech
Dachau
Traunstein
Berchtesgadener Land
MiesbachBad Toelz-Wolfratshausen
Ebersberg
Munich County
Freising
Landshut
Ingolstadt
MUNICH
Rosenheim

MORTALITY ICD-10 C85: Non-Hodgkin lymphoma NOS Page 19 of 36
MCR bC85__E-ICD-10-C85-Non-Hodgkin-lymphoma-NOS-incidence-and-mortality.pdf 12/21/2021
MMOORRTTAALLIITTYY
Table 9a
Annual cohorts: Incident cancers, follow-up status,
proportion of DCO, deaths among the annual cohorts
and proportion of available death certificates
(with respect to registry area expansion from 2.65 to 4.10 m as of 2002,
and from 4.10 to 4.94 m as of 2007, respectively)
Prop.
Prop. deaths
Incident actively Prop. Prop. with death
Year of cases followed DCO Deaths deaths certific.
diagnosis n % % n % %
1998 180 98.9 21.7 146 81.1 94.5
1999 165 98.2 32.7 138 83.6 97.1
2000 102 96.1 41.2 85 83.3 98.8
2001 97 97.9 45.4 85 87.6 96.5
2002 197 98.5 53.3 180 91.4 96.1
2003 141 99.3 47.5 126 89.4 98.4
2004 147 98.0 39.5 123 83.7 99.2
2005 124 100.0 47.6 108 87.1 99.1
2006 127 99.2 39.4 106 83.5 98.1
2007 155 94.8 41.9 122 78.7 98.4
2008 120 100.0 33.3 97 80.8 96.9
2009 128 99.2 33.6 95 74.2 95.8
2010 118 98.3 41.5 89 75.4 96.6
2011 133 98.5 40.6 109 82.0 97.2
2012 122 97.5 30.3 81 66.4 96.3
2013 104 100.0 36.5 74 71.2 97.3
2014 113 97.3 29.2 78 69.0 92.3
2015 132 97.0 31.1 82 62.1 95.1
2016 112 98.2 41.1 73 65.2 95.9
2017 87 98.9 37.9 52 59.8 100.0
2018 65 96.9 32.3 39 60.0 89.7
2019 45 97.8 6.7 21 46.7 66.7
2020 35 100.0 12 34.3 91.7
1998-2020 2749 98.3 37.1 2121 77.2 96.5

MORTALITY ICD-10 C85: Non-Hodgkin lymphoma NOS Page 20 of 36
MCR bC85__E-ICD-10-C85-Non-Hodgkin-lymphoma-NOS-incidence-and-mortality.pdf 12/21/2021
Table 9b
Annual cohorts of incident cancers and deaths, proportion of death certificates
and cases deceased within the same year of being diagnosed with cancer
(incl. DCO)
(with respect to registry area expansion from 2.65 to 4.10 m as of 2002,
and from 4.10 to 4.94 m as of 2007, respectively)
Prop.
deaths Prop.
Year of Incident with death Deaths in deaths in
diagnosis/ cases Deaths certific. same year same year
death n n % n %
1998 180 123 97.6 59 32.8
1999 165 159 94.3 71 43.0
2000 102 104 97.1 47 46.1
2001 97 109 97.2 44 45.4
2002 197 174 96.6 110 55.8
2003 141 154 97.4 79 56.0
2004 147 131 98.5 69 46.9
2005 124 135 97.0 67 54.0
2006 127 133 100.0 58 45.7
2007 155 122 95.1 78 50.3
2008 120 102 100.0 60 50.0
2009 128 112 98.2 60 46.9
2010 118 98 99.0 58 49.2
2011 133 102 98.0 67 50.4
2012 122 121 97.5 51 41.8
2013 104 88 97.7 43 41.3
2014 113 100 97.0 45 39.8
2015 132 93 97.8 53 40.2
2016 112 83 98.8 55 49.1
2017 87 92 100.0 43 49.4
2018 65 74 81.1 28 43.1
2019 45 47 53.2 16 35.6
2020 35 57 82.5 6 17.1
1998-2020 2749 2513 95.9 1267 46.1

MORTALITY ICD-10 C85: Non-Hodgkin lymphoma NOS Page 21 of 36
MCR bC85__E-ICD-10-C85-Non-Hodgkin-lymphoma-NOS-incidence-and-mortality.pdf 12/21/2021
Table 9c
Annual cohorts of deaths, proportion of cancer-related and non-cancer-
related deaths, and cancer recorded on death certificates
(incl. DCO)
(with respect to registry area expansion from 2.65 to 4.10 m as of 2002,
and from 4.10 to 4.94 m as of 2007, respectively)
Prop.
cancer
Prop. Prop. recorded
cancer- non-cancer- on death
Year of Deaths related related certificate
death n % % %
1998 123 61.8 38.2 90.8
1999 159 69.8 30.2 93.3
2000 104 81.7 18.3 95.0
2001 109 78.0 22.0 91.5
2002 174 77.0 23.0 90.5
2003 154 76.6 23.4 92.7
2004 131 86.3 13.7 92.2
2005 135 72.6 27.4 91.6
2006 133 75.9 24.1 88.0
2007 122 75.4 24.6 88.8
2008 102 79.4 20.6 87.3
2009 112 72.3 27.7 76.4
2010 98 76.5 23.5 81.4
2011 102 70.6 29.4 87.0
2012 121 73.6 26.4 82.2
2013 88 70.5 29.5 82.6
2014 100 66.0 34.0 85.6
2015 93 67.7 32.3 82.4
2016 83 69.9 30.1 81.7
2017 92 64.1 35.9 85.9
2018 74 55.4 44.6 70.0
2019 47 34.0 66.0 72.0
2020 57 50.9 49.1 78.7
1998-2020 2513 71.8 28.2 87.1

MORTALITY ICD-10 C85: Non-Hodgkin lymphoma NOS Page 22 of 36
MCR bC85__E-ICD-10-C85-Non-Hodgkin-lymphoma-NOS-incidence-and-mortality.pdf 12/21/2021
Table 10a
Medians of age at death according to the grouping in Table 9
MALES
Age at
Age at Age at Age at death
death death death (according
(all (cancer- (non-cancer- to death
Year of Deaths causes) related) related) certificate)
death n Years Years Years Years
1998 62 74.6 72.7 80.2 74.0
1999 96 73.4 67.4 77.9 72.8
2000 56 71.1 66.7 76.6 69.9
2001 49 70.4 69.5 81.2 69.9
2002 85 72.2 69.2 77.8 70.0
2003 75 72.2 68.0 73.6 71.4
2004 68 75.2 74.8 75.5 75.2
2005 66 77.8 78.2 76.7 78.2
2006 71 75.5 75.0 79.2 75.0
2007 58 73.1 72.3 77.6 72.3
2008 56 75.1 73.9 82.8 73.8
2009 60 76.0 75.4 79.8 75.4
2010 58 77.8 77.2 80.7 75.6
2011 49 77.6 77.2 79.5 76.6
2012 63 77.9 78.1 77.7 78.0
2013 42 79.1 78.3 79.3 78.9
2014 54 78.0 75.1 82.5 78.0
2015 43 82.1 81.3 85.7 81.8
2016 46 80.1 78.4 84.4 79.3
2017 50 83.2 81.7 87.6 81.6
2018 43 80.6 81.7 77.8 81.5
2019 22 84.1 77.8 85.9 75.8
2020 26 79.8 80.7 78.4 79.8
1998-2020 1298 76.5 75.2 79.7 75.7
Deaths of patients are considered to be cancer-related, in case that fact was recorded on the death certificate, or patients had suffered from metastasis or recurrence. .

MORTALITY ICD-10 C85: Non-Hodgkin lymphoma NOS Page 23 of 36
MCR bC85__E-ICD-10-C85-Non-Hodgkin-lymphoma-NOS-incidence-and-mortality.pdf 12/21/2021
Table 10b
Medians of age at death according to the grouping in Table 9
FEMALES
Age at
Age at Age at Age at death
death death death (according
(all (cancer- (non-cancer- to death
Year of Deaths causes) related) related) certificate)
death n Years Years Years Years
1998 61 82.5 81.2 84.6 82.6
1999 63 79.1 76.3 83.7 79.2
2000 48 76.6 75.9 83.9 75.9
2001 60 80.0 79.2 84.1 79.7
2002 89 78.9 77.7 82.8 78.9
2003 79 77.7 73.8 85.2 75.8
2004 63 80.3 79.9 83.2 80.3
2005 69 80.4 75.3 84.5 80.0
2006 62 79.3 78.6 83.3 78.1
2007 64 80.8 79.7 83.7 80.2
2008 46 81.5 81.2 84.8 81.3
2009 52 84.4 83.0 86.8 83.1
2010 40 81.2 80.7 83.7 81.2
2011 53 80.4 79.4 84.4 79.9
2012 58 79.1 77.3 85.2 77.7
2013 46 80.6 79.5 81.4 79.0
2014 46 77.7 75.7 83.2 76.7
2015 50 81.7 81.4 81.9 81.2
2016 37 81.3 83.2 80.7 81.3
2017 42 81.0 81.0 81.0 81.0
2018 31 83.4 83.6 81.1 83.4
2019 25 82.2 81.4 82.7 75.8
2020 31 81.1 78.4 86.6 80.7
1998-2020 1215 80.4 79.1 84.0 80.0
By 2018, Bavarians' life expectancy at birth is estimated at 79.3 years for boys and 83.8 years for girls.
Deaths of patients are considered to be cancer-related, in case that fact was recorded on the death certificate, or patients had suffered from metastasis or recurrence. .

MORTALITY ICD-10 C85: Non-Hodgkin lymphoma NOS Page 24 of 36
MCR bC85__E-ICD-10-C85-Non-Hodgkin-lymphoma-NOS-incidence-and-mortality.pdf 12/21/2021
Table 11a
Mortality measures (cancer-related death) and mortality-incidence-index
by year of death
MALES
Year of Deaths Mort. MI-Index Mort. MI-Index Mort. MI-Index Mort. MI-Index
death n raw raw WS WS ES ES BRD-S BRD-S
1998 37 3.3 0.39 2.0 0.36 3.1 0.38 4.5 0.41
1999 70 6.3 0.80 3.8 0.79 5.6 0.80 7.2 0.75
2000 44 3.9 0.81 2.1 0.78 3.3 0.80 4.5 0.82
2001 38 3.3 0.69 2.0 0.66 2.9 0.69 3.7 0.69
2002 69 3.7 0.70 2.1 0.69 3.2 0.72 4.2 0.71
2003 62 3.3 0.91 1.9 0.95 2.7 0.89 3.6 0.88
2004 57 3.0 0.77 1.6 0.74 2.5 0.77 3.5 0.81
2005 53 2.8 1.00 1.3 0.86 2.2 0.96 3.3 1.03
2006 55 2.9 0.72 1.4 0.68 2.3 0.73 3.1 0.72
2007 43 1.9 0.47 1.0 0.47 1.5 0.48 2.0 0.47
2008 45 2.0 0.65 0.9 0.60 1.5 0.63 2.1 0.65
2009 39 1.7 0.53 0.8 0.46 1.2 0.50 1.8 0.57
2010 47 2.1 0.80 0.9 0.73 1.4 0.74 2.0 0.78
2011 36 1.6 0.60 0.7 0.58 1.1 0.59 1.6 0.60
2012 42 1.9 0.69 0.8 0.69 1.3 0.70 1.8 0.70
2013 28 1.2 0.44 0.5 0.33 0.8 0.40 1.1 0.42
2014 39 1.7 0.72 0.7 0.73 1.1 0.72 1.5 0.71
2015 27 1.1 0.32 0.4 0.21 0.7 0.26 1.0 0.31
2016 31 1.3 0.46 0.5 0.40 0.8 0.44 1.1 0.45
2017 32 1.3 0.71 0.4 0.50 0.7 0.60 1.1 0.68
2018 23 0.9 0.68 0.3 0.41 0.5 0.50 0.8 0.64
2019 8 0.3 0.38 0.1 0.36 0.2 0.38 0.3 0.38
2020 13 0.5 0.81 0.2 0.64 0.3 0.70 0.5 0.81
1998-2020 938 2.0 0.64 0.9 0.59 1.5 0.63 2.0 0.64

MORTALITY ICD-10 C85: Non-Hodgkin lymphoma NOS Page 25 of 36
MCR bC85__E-ICD-10-C85-Non-Hodgkin-lymphoma-NOS-incidence-and-mortality.pdf 12/21/2021
Table 11b
Mortality measures (cancer-related death) and mortality-incidence-index
by year of death
FEMALES
Year of Deaths Mort. MI-Index Mort. MI-Index Mort. MI-Index Mort. MI-Index
death n raw raw WS WS ES ES BRD-S BRD-S
1998 39 3.3 0.46 1.3 0.36 2.0 0.40 2.7 0.44
1999 41 3.5 0.53 1.4 0.45 2.1 0.49 3.0 0.54
2000 41 3.4 0.85 1.4 0.78 2.1 0.83 2.7 0.78
2001 47 3.9 1.12 1.4 1.15 2.2 1.16 3.1 1.16
2002 65 3.3 0.66 1.2 0.63 1.9 0.64 2.6 0.67
2003 56 2.8 0.77 1.3 0.88 1.9 0.85 2.4 0.81
2004 56 2.8 0.77 0.9 0.60 1.5 0.68 2.2 0.75
2005 45 2.3 0.63 0.8 0.60 1.3 0.63 1.7 0.62
2006 46 2.3 0.90 0.8 0.70 1.2 0.78 1.7 0.85
2007 49 2.1 0.78 0.8 0.62 1.2 0.69 1.6 0.73
2008 36 1.6 0.71 0.4 0.57 0.7 0.60 1.1 0.70
2009 42 1.8 0.78 0.5 0.56 0.8 0.63 1.2 0.68
2010 28 1.2 0.47 0.3 0.32 0.5 0.38 0.8 0.43
2011 36 1.5 0.49 0.5 0.44 0.8 0.47 1.0 0.48
2012 47 2.0 0.77 0.6 0.58 1.0 0.63 1.4 0.69
2013 34 1.4 0.85 0.5 0.80 0.7 0.83 1.0 0.88
2014 27 1.1 0.46 0.3 0.36 0.6 0.41 0.7 0.42
2015 36 1.5 0.75 0.4 0.51 0.6 0.58 1.0 0.67
2016 27 1.1 0.61 0.3 0.52 0.5 0.57 0.7 0.55
2017 27 1.1 0.64 0.3 0.50 0.5 0.56 0.7 0.59
2018 18 0.7 0.58 0.1 0.30 0.3 0.37 0.4 0.47
2019 8 0.3 0.33 0.1 0.19 0.1 0.23 0.2 0.29
2020 16 0.6 0.84 0.2 0.59 0.3 0.67 0.5 0.77
1998-2020 867 1.8 0.67 0.6 0.56 0.9 0.61 1.3 0.64

MORTALITY ICD-10 C85: Non-Hodgkin lymphoma NOS Page 26 of 36
MCR bC85__E-ICD-10-C85-Non-Hodgkin-lymphoma-NOS-incidence-and-mortality.pdf 12/21/2021
Table 12
Age distribution of age at death (cancer-related) for period 2007-2020
(incl. multiple malignancies)
Age at
death Cases Males Females
Years n % Cum.% n % Cum.% n % Cum.%
0-4
5-9
10-14 1 0.1 0.1 1 0.2 0.2 0.0
15-19 2 0.2 0.3 2 0.4 0.7 0.0
20-24 1 0.1 0.5 1 0.2 0.9 0.0
25-29 3 0.3 0.8 1 0.2 1.1 2 0.5 0.5
30-34 3 0.3 1.1 1 0.2 1.3 2 0.5 0.9
35-39 4 0.5 1.6 3 0.7 2.0 1 0.2 1.2
40-44 5 0.6 2.1 3 0.7 2.6 2 0.5 1.6
45-49 11 1.2 3.4 7 1.5 4.2 4 0.9 2.6
50-54 19 2.1 5.5 13 2.9 7.1 6 1.4 3.9
55-59 23 2.6 8.1 13 2.9 9.9 10 2.3 6.3
60-64 40 4.5 12.7 22 4.9 14.8 18 4.2 10.4
65-69 82 9.3 21.9 47 10.4 25.2 35 8.1 18.6
70-74 122 13.8 35.7 64 14.1 39.3 58 13.5 32.0
75-79 168 19.0 54.8 100 22.1 61.4 68 15.8 47.8
80-84 174 19.7 74.4 80 17.7 79.0 94 21.8 69.6
85+ 226 25.6 100.0 95 21.0 100.0 131 30.4 100.0
All ages 884 100.0 453 100.0 431 100.0

MORTALITY ICD-10 C85: Non-Hodgkin lymphoma NOS Page 27 of 36
MCR bC85__E-ICD-10-C85-Non-Hodgkin-lymphoma-NOS-incidence-and-mortality.pdf 12/21/2021
Table 13
Age-specific mortality (cancer-related) and proportion of all cancers
for period 2007-2020
(incl. multiple malignancies)
Males Females Males Females
Age at Age- Age- Prop.all Prop.all
death Males Females spec. spec. cancers cancers
Years n n mortal. MI-index mortal. MI-index % %
0- 4
5- 9
10-14 1 0.1 0.25 3.6
15-19 2 0.1 0.50 4.2
20-24 1 0.0 0.14 1.4
25-29 1 2 0.0 0.14 0.1 0.29 1.1 2.0
30-34 1 2 0.0 0.10 0.1 0.25 0.7 1.1
35-39 3 1 0.1 0.17 0.0 0.06 1.1 0.2
40-44 3 2 0.1 0.19 0.1 0.18 0.5 0.2
45-49 7 4 0.3 0.41 0.2 0.29 0.5 0.2
50-54 13 6 0.5 0.35 0.2 0.38 0.5 0.2
55-59 13 10 0.6 0.33 0.5 0.34 0.3 0.3
60-64 22 18 1.2 0.47 0.9 0.60 0.3 0.4
65-69 47 35 2.9 0.52 1.9 0.50 0.5 0.5
70-74 64 58 4.3 0.58 3.4 0.64 0.5 0.7
75-79 100 68 8.3 0.68 4.5 0.76 0.8 0.7
80-84 80 94 11.0 0.63 8.8 0.80 0.8 1.0
85+ 95 131 20.3 0.79 12.6 0.82 1.0 1.1
All ages 453 431 0.7 0.7
Mortality
Raw 1.4 0.57 1.3 0.65
WS 0.6 0.49 0.4 0.50
ES 0.9 0.53 0.6 0.55
BRD-S 1.3 0.56 0.9 0.60
PYLL-70
per 100,000 4.5 2.8
ES 4.2 2.3
AYLL-70 11.4 9.9
.
MORTALITY ICD-10 C85: Non-Hodgkin lymphoma NOS Page 28 of 36
MCR bC85__E-ICD-10-C85-Non-Hodgkin-lymphoma-NOS-incidence-and-mortality.pdf 12/21/2021
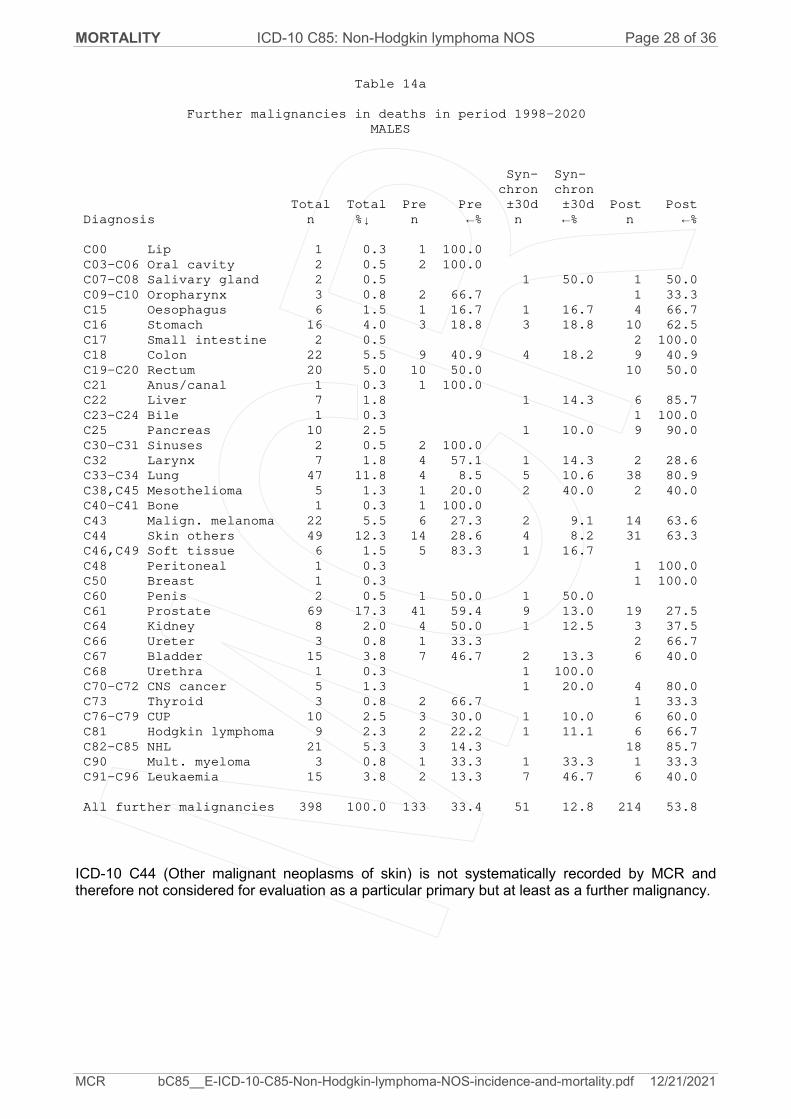
Table 14a
Further malignancies in deaths in period 1998-2020
MALES
Syn- Syn-
chron chron
Total Total Pre Pre ±30d ±30d Post Post
Diagnosis n %↓ n ←% n ←% n ←%
C00 Lip 1 0.3 1 100.0
C03-C06 Oral cavity 2 0.5 2 100.0
C07-C08 Salivary gland 2 0.5 1 50.0 1 50.0
C09-C10 Oropharynx 3 0.8 2 66.7 1 33.3
C15 Oesophagus 6 1.5 1 16.7 1 16.7 4 66.7
C16 Stomach 16 4.0 3 18.8 3 18.8 10 62.5
C17 Small intestine 2 0.5 2 100.0
C18 Colon 22 5.5 9 40.9 4 18.2 9 40.9
C19-C20 Rectum 20 5.0 10 50.0 10 50.0
C21 Anus/canal 1 0.3 1 100.0
C22 Liver 7 1.8 1 14.3 6 85.7
C23-C24 Bile 1 0.3 1 100.0
C25 Pancreas 10 2.5 1 10.0 9 90.0
C30-C31 Sinuses 2 0.5 2 100.0
C32 Larynx 7 1.8 4 57.1 1 14.3 2 28.6
C33-C34 Lung 47 11.8 4 8.5 5 10.6 38 80.9
C38,C45 Mesothelioma 5 1.3 1 20.0 2 40.0 2 40.0
C40-C41 Bone 1 0.3 1 100.0
C43 Malign. melanoma 22 5.5 6 27.3 2 9.1 14 63.6
C44 Skin others 49 12.3 14 28.6 4 8.2 31 63.3
C46,C49 Soft tissue 6 1.5 5 83.3 1 16.7
C48 Peritoneal 1 0.3 1 100.0
C50 Breast 1 0.3 1 100.0
C60 Penis 2 0.5 1 50.0 1 50.0
C61 Prostate 69 17.3 41 59.4 9 13.0 19 27.5
C64 Kidney 8 2.0 4 50.0 1 12.5 3 37.5
C66 Ureter 3 0.8 1 33.3 2 66.7
C67 Bladder 15 3.8 7 46.7 2 13.3 6 40.0
C68 Urethra 1 0.3 1 100.0
C70-C72 CNS cancer 5 1.3 1 20.0 4 80.0
C73 Thyroid 3 0.8 2 66.7 1 33.3
C76-C79 CUP 10 2.5 3 30.0 1 10.0 6 60.0
C81 Hodgkin lymphoma 9 2.3 2 22.2 1 11.1 6 66.7
C82-C85 NHL 21 5.3 3 14.3 18 85.7
C90 Mult. myeloma 3 0.8 1 33.3 1 33.3 1 33.3
C91-C96 Leukaemia 15 3.8 2 13.3 7 46.7 6 40.0
All further malignancies 398 100.0 133 33.4 51 12.8 214 53.8
ICD-10 C44 (Other malignant neoplasms of skin) is not systematically recorded by MCR and therefore not considered for evaluation as a particular primary but at least as a further malignancy. .

MORTALITY ICD-10 C85: Non-Hodgkin lymphoma NOS Page 29 of 36
MCR bC85__E-ICD-10-C85-Non-Hodgkin-lymphoma-NOS-incidence-and-mortality.pdf 12/21/2021
Table 14b
Further malignancies in deaths in period 1998-2020
FEMALES
Syn- Syn-
chron chron
Total Total Pre Pre ±30d ±30d Post Post
Diagnosis n %↓ n ←% n ←% n ←%
C00 Lip 1 0.3 1 100.0
C03-C06 Oral cavity 3 1.0 1 33.3 1 33.3 1 33.3
C07-C08 Salivary gland 1 0.3 1 100.0
C15 Oesophagus 2 0.7 2 100.0
C16 Stomach 14 4.7 3 21.4 2 14.3 9 64.3
C18 Colon 27 9.2 9 33.3 4 14.8 14 51.9
C19-C20 Rectum 5 1.7 2 40.0 1 20.0 2 40.0
C21 Anus/canal 4 1.4 1 25.0 3 75.0
C22 Liver 3 1.0 2 66.7 1 33.3
C23-C24 Bile 6 2.0 1 16.7 5 83.3
C25 Pancreas 5 1.7 5 100.0
C26 GI cancer 1 0.3 1 100.0
C30-C31 Sinuses 2 0.7 1 50.0 1 50.0
C32 Larynx 1 0.3 1 100.0
C33-C34 Lung 18 6.1 2 11.1 2 11.1 14 77.8
C43 Malign. melanoma 8 2.7 1 12.5 1 12.5 6 75.0
C44 Skin others 18 6.1 8 44.4 10 55.6
C46,C49 Soft tissue 4 1.4 2 50.0 2 50.0
C48 Peritoneal 1 0.3 1 100.0
C50 Breast 77 26.1 38 49.4 6 7.8 33 42.9
C51 Vulva 2 0.7 1 50.0 1 50.0
C53 Cervix uteri 6 2.0 3 50.0 3 50.0
C54 Corpus uteri 8 2.7 4 50.0 4 50.0
C55,C57 Fem. genitals un 1 0.3 1 100.0
C56 Ovary 8 2.7 1 12.5 7 87.5
C64 Kidney 4 1.4 4 100.0
C65 Renal pelvis 1 0.3 1 100.0
C66 Ureter 1 0.3 1 100.0
C67 Bladder 5 1.7 3 60.0 2 40.0
C70-C72 CNS cancer 8 2.7 3 37.5 1 12.5 4 50.0
C73 Thyroid 2 0.7 1 50.0 1 50.0
C76-C79 CUP 6 2.0 6 100.0
C81 Hodgkin lymphoma 6 2.0 4 66.7 1 16.7 1 16.7
C82-C85 NHL 17 5.8 17 100.0
C90 Mult. myeloma 7 2.4 3 42.9 1 14.3 3 42.9
C91-C96 Leukaemia 12 4.1 2 16.7 10 83.3
All further malignancies 295 100.0 91 30.8 29 9.8 175 59.3
ICD-10 C44 (Other malignant neoplasms of skin) is not systematically recorded by MCR and therefore not considered for evaluation as a particular primary but at least as a further malignancy. .

MORTALITY ICD-10 C85: Non-Hodgkin lymphoma NOS Page 30 of 36
MCR bC85__E-ICD-10-C85-Non-Hodgkin-lymphoma-NOS-incidence-and-mortality.pdf 12/21/2021
Table 15
Age-specific mortality (cancer-related) and proportion of all cancers
for period 2007-2020
(First primaries only *)
Males Females Males Females
Age at Age- Age- Prop.all Prop.all
death Males Females spec. spec. cancers cancers
Years n n mortal. MI-index mortal. MI-index % %
0- 4
5- 9
10-14 1 0.1 0.25 3.6
15-19 2 0.1 0.50 4.3
20-24
25-29 1 1 0.0 0.14 0.0 0.20 1.2 1.1
30-34 1 1 0.0 0.10 0.0 0.13 0.7 0.6
35-39 3 1 0.1 0.18 0.0 0.06 1.2 0.3
40-44 2 2 0.1 0.13 0.1 0.22 0.4 0.3
45-49 7 3 0.3 0.44 0.1 0.27 0.5 0.2
50-54 11 4 0.4 0.34 0.2 0.29 0.5 0.2
55-59 11 9 0.5 0.31 0.4 0.33 0.3 0.3
60-64 20 16 1.1 0.53 0.8 0.70 0.4 0.4
65-69 37 26 2.3 0.49 1.4 0.43 0.5 0.5
70-74 50 48 3.3 0.63 2.8 0.73 0.6 0.7
75-79 86 57 7.1 0.82 3.8 0.83 0.9 0.8
80-84 57 77 7.9 0.62 7.2 0.81 0.8 1.1
85+ 68 110 14.6 0.79 10.6 0.86 1.0 1.2
All ages 357 355 0.7 0.7
Mortality
Raw 1.1 0.57 1.1 0.65
WS 0.5 0.48 0.3 0.48
ES 0.7 0.53 0.5 0.54
BRD-S 1.0 0.57 0.7 0.60
PYLL-70
per 100,000 3.9 2.1
ES 3.6 1.8
AYLL-70 11.7 9.6
* See corresponding tables with multiple malignancies. .

MORTALITY ICD-10 C85: Non-Hodgkin lymphoma NOS Page 31 of 36
MCR bC85__E-ICD-10-C85-Non-Hodgkin-lymphoma-NOS-incidence-and-mortality.pdf 12/21/2021
Table 16
Age-specific mortality (cancer-related) and proportion of all cancers
for period 2007-2020
(Single primaries only *)
Males Females Males Females
Age at Age- Age- Prop.all Prop.all
death Males Females spec. spec. cancers cancers
Years n n mortal. MI-index mortal. MI-index % %
0- 4
5- 9
10-14 1 0.1 0.25 3.6
15-19 2 0.1 0.50 4.3
20-24
25-29 1 1 0.0 0.14 0.0 0.20 1.2 1.1
30-34 1 1 0.0 0.11 0.0 0.13 0.7 0.6
35-39 3 1 0.1 0.18 0.0 0.06 1.2 0.3
40-44 2 2 0.1 0.13 0.1 0.22 0.4 0.3
45-49 5 3 0.2 0.33 0.1 0.27 0.4 0.2
50-54 10 2 0.4 0.32 0.1 0.14 0.4 0.1
55-59 8 6 0.4 0.26 0.3 0.29 0.2 0.2
60-64 16 7 0.9 0.48 0.4 0.35 0.3 0.2
65-69 27 18 1.7 0.46 1.0 0.37 0.4 0.3
70-74 30 34 2.0 0.42 2.0 0.57 0.3 0.5
75-79 62 41 5.1 0.64 2.7 0.65 0.7 0.6
80-84 46 63 6.4 0.55 5.9 0.68 0.7 0.9
85+ 54 92 11.6 0.66 8.8 0.74 0.9 1.0
All ages 268 271 0.5 0.6
Mortality
Raw 0.8 0.47 0.8 0.54
WS 0.3 0.40 0.2 0.38
ES 0.5 0.44 0.4 0.44
BRD-S 0.8 0.47 0.5 0.49
PYLL-70
per 100,000 3.4 1.6
ES 3.2 1.3
AYLL-70 12.8 10.8
* See corresponding tables with multiple malignancies. .

MORTALITY ICD-10 C85: Non-Hodgkin lymphoma NOS Page 32 of 36
MCR bC85__E-ICD-10-C85-Non-Hodgkin-lymphoma-NOS-incidence-and-mortality.pdf 12/21/2021
Figure 17. Distribution of age at death (bars; males: mean=69.3 yrs, median=72.8 yrs; females: mean=71.5 yrs, median=74.1 yrs) and age-specific mortality (all patients: solid line, patients with single primaries: dotted line). The age-specific incidence is additionally plotted for comparison (dashed line).
The difference between age at diagnosis (Table 3) and age at non-Hodgkin lymphoma NOS-related death (see Table 10) should be considered.
Age distribution (%)
Age-spec. mortality (per 100,000) Age-spec. mortality, single primaries only Age-spec. incidence (per 100,000)
MALES FEMALES
Avera
ged a
nnual
age-s
pecific
mort
ality
(per
100,0
00)
0
5
10
15
20
25
30
Age at death (years)
0-4
5-9
10-1
4
15-1
9
20-2
4
25-2
9
30-3
4
35-3
9
40-4
4
45-4
9
50-5
4
55-5
9
60-6
4
65-6
9
70-7
4
75-7
9
80-8
4
85+
Age d
istrib
utio
n (%
)
0
5
10
15
20
25
30
35
ICD-10 C85: Other and unspecified types of non-Hodgkin lymphomaAge distribution and age-specific mortality 2007 - 2020 (Males: 453, Females: 431)

MORTALITY ICD-10 C85: Non-Hodgkin lymphoma NOS Page 33 of 36
MCR bC85__E-ICD-10-C85-Non-Hodgkin-lymphoma-NOS-incidence-and-mortality.pdf 12/21/2021
Figure 18a. Map of cancer mortality (german standard population) by county averaged for period 2007 to 2020. According to their individual mortality rates, the counties are displayed in different red and blue hues, being the fine white color attributed to the population mean (males 1.3/100,000 WS N=453, females 0.9/100,000 WS N=431).
The results should be interpreted with caution! E.g., in county Ebersberg with a population of 67,727 female residents (averaged) in the period from 2007 to 2020 a total of 19 women died from non-Hodgkin lymphoma NOS. Therefore, the mean mortality rate for this cancer type in this area can be calculated at 1.4/100,000 (german standard population). Though, the value of this parameter may vary with an underlying probability of 99% between 0.7 and 2.6/100,000.
Average mortality (Germany 1987 standard population) 2007 - 2020: Males
per 100,000
2.4
2.2
2
1.8
1.6
1.4
1.2
1
0.8
0.6
0.4
0.2
Starnberg
Fuerstenfeldbruck
Weilheim-Schongau
Garmisch-Partenkirchen
Muehldorf a.InnErding
Altoetting
Eichstaett
Neuburg-SchrobenhausenPfaffenhofen a.d.Ilm
Landsberg a.Lech
Dachau
Traunstein
Berchtesgadener Land
MiesbachBad Toelz-Wolfratshausen
Ebersberg
Munich County
Freising
Landshut
Ingolstadt
MUNICH
Rosenheim
Average mortality (Germany 1987 standard population) 2007 - 2020: Females
per 100,000
1.6
1.5
1.4
1.3
1.2
1.1
1
0.9
0.8
0.7
0.6
0.5
0.4
0.3
Starnberg
Fuerstenfeldbruck
Weilheim-Schongau
Garmisch-Partenkirchen
Muehldorf a.InnErding
Altoetting
Eichstaett
Neuburg-SchrobenhausenPfaffenhofen a.d.Ilm
Landsberg a.Lech
Dachau
Traunstein
Berchtesgadener Land
MiesbachBad Toelz-Wolfratshausen
Ebersberg
Munich County
Freising
Landshut
Ingolstadt
MUNICH
Rosenheim
MORTALITY ICD-10 C85: Non-Hodgkin lymphoma NOS Page 34 of 36
MCR bC85__E-ICD-10-C85-Non-Hodgkin-lymphoma-NOS-incidence-and-mortality.pdf 12/21/2021
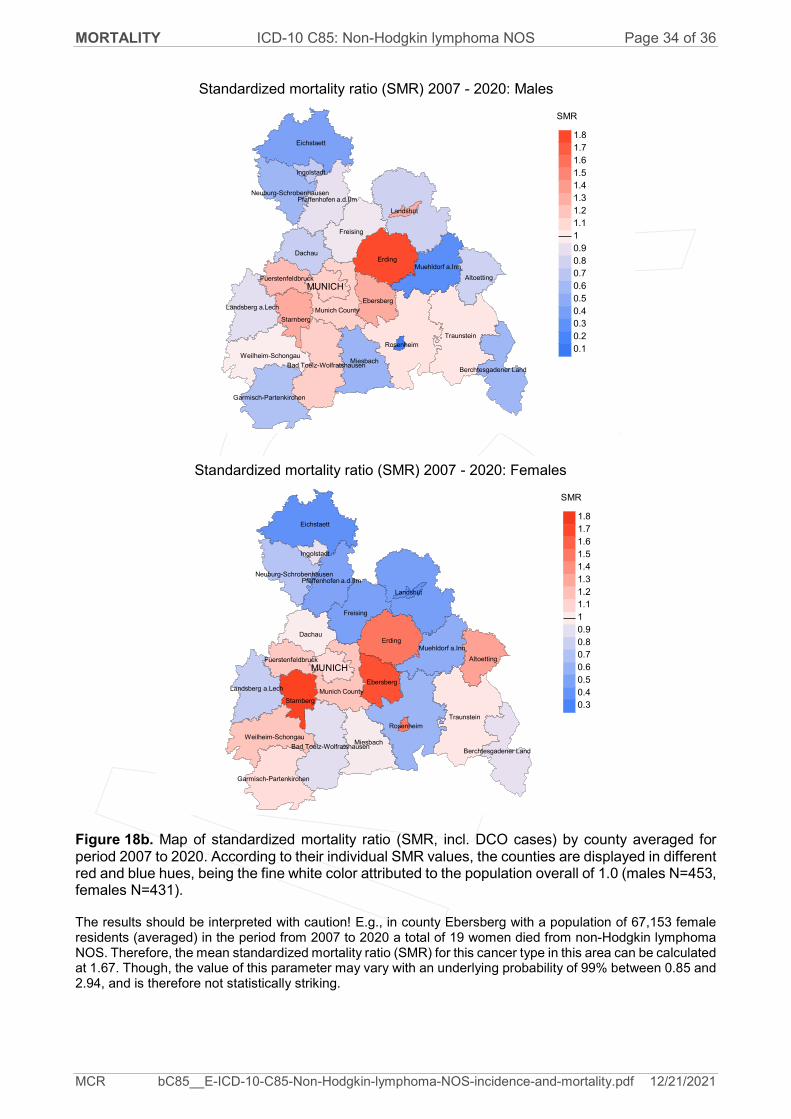
Figure 18b. Map of standardized mortality ratio (SMR, incl. DCO cases) by county averaged for period 2007 to 2020. According to their individual SMR values, the counties are displayed in different red and blue hues, being the fine white color attributed to the population overall of 1.0 (males N=453, females N=431).
The results should be interpreted with caution! E.g., in county Ebersberg with a population of 67,153 female residents (averaged) in the period from 2007 to 2020 a total of 19 women died from non-Hodgkin lymphoma NOS. Therefore, the mean standardized mortality ratio (SMR) for this cancer type in this area can be calculated at 1.67. Though, the value of this parameter may vary with an underlying probability of 99% between 0.85 and 2.94, and is therefore not statistically striking.
Standardized mortality ratio (SMR) 2007 - 2020: Males
SMR
1.8
1.7
1.6
1.5
1.4
1.3
1.2
1.1
1
0.9
0.8
0.7
0.6
0.5
0.4
0.3
0.2
0.1
Starnberg
Fuerstenfeldbruck
Weilheim-Schongau
Garmisch-Partenkirchen
Muehldorf a.InnErding
Altoetting
Eichstaett
Neuburg-SchrobenhausenPfaffenhofen a.d.Ilm
Landsberg a.Lech
Dachau
Traunstein
Berchtesgadener Land
MiesbachBad Toelz-Wolfratshausen
Ebersberg
Munich County
Freising
Landshut
Ingolstadt
MUNICH
Rosenheim
Standardized mortality ratio (SMR) 2007 - 2020: Females
SMR
1.8
1.7
1.6
1.5
1.4
1.3
1.2
1.1
1
0.9
0.8
0.7
0.6
0.5
0.4
0.3Starnberg
Fuerstenfeldbruck
Weilheim-Schongau
Garmisch-Partenkirchen
Muehldorf a.InnErding
Altoetting
Eichstaett
Neuburg-SchrobenhausenPfaffenhofen a.d.Ilm
Landsberg a.Lech
Dachau
Traunstein
Berchtesgadener Land
MiesbachBad Toelz-Wolfratshausen
Ebersberg
Munich County
Freising
Landshut
Ingolstadt
MUNICH
Rosenheim

USAGE ICD-10 C85: Non-Hodgkin lymphoma NOS Page 35 of 36
MCR bC85__E-ICD-10-C85-Non-Hodgkin-lymphoma-NOS-incidence-and-mortality.pdf 12/21/2021
Statistical Notes
In all tables and figures the respective reference values should be carefully considered. The incidence rates include diagnoses (with multiple primary), and death certificate only (DCO) cases, where applicable. For mortality statistics patients, diagnoses and progressive course of disease are presented. In the calculations, all courses of disease are considered whereby progressions occurred and/or death certificate identified progressive cancers were ascertained. Additionally there are three groups of disease course to consider:
1. All multiple primaries included
The mortality statistic describes the tumor-specific death, independent of any malignancy. The patient perspective, induced secondary malignancies, and the problem of multiple malignancies from the same primary tumor all have reasons for their inclusion.
2. First singular primary (no information about other prior or synchronous malignancy)
The mortality statistic describes the cancer-related death for patients who have no therapeutic restrictions due to a previous or synchronous cancer. These statistics are comparable to studies that have exclusion criteria based on a second malignancy.
3. Single primary (no information about other prior, syn- or metachronous malignancy)
The mortality statistic describes the tumor-specific death that occurs without any impact through secondary primaries, earlier, synchronous, later or induced. Precisely the difference between disease group 1 and 2 highlight the magnitude of the problem of secondary malignancies.
For this reason differences appear concerning official mono-causal mortality statistics. To judge the maximum deviation, 2 further tables are presented. In the first table the distribution of secondary malignancies before, at or after the described cancer are shown, that could be an alternative cause of death. In the second table, the age-specific mortality rates for all courses of disease, without designation of secondary malignancies are shown.
A previously minimally acknowledged statistic is the age at death, which allows for a good assessment of the quality of classification of the apparent tumor-specific death. For assumed tumor-independent deaths, the age of death should be estimated from the age of diagnosis and the normal life expectancy, whereas tumor-dependent deaths can be estimated from the age of diagnosis plus the average tumor-specific life expectancy. The comparison of different tumors demonstrates this association, if the causes of cancer and the competing cause of death are independent of each other (e.g. breast and colon versus head&neck and lung).
The ratio of mortality and incidence (mortality-to-incidence ratio, MIR, MI-Index) is a statistical index that allows for the evaluation of the quality of data. For diseases with poor prognoses, comparable values are obtained from all age groups, because to a large extent, the numerator and denominator contain the same cases. For tumors with a good prognosis, increasing and decreasing incidence and age-specific differences in prognosis can more strongly alter the MIR. Additionally, attention should be paid to the confidence intervals where fewer cases are reported.
The complexity of problems identified here emphasizes the importance of relative survival data for the appropriate analysis of long term results.
As a measurement of the burden of disease, the number of potential life years loss due to premature deaths in a cohort can be calculated (PYLL, potential years of life lost, standardized per 100,000 persons or per European standard) as well as the average loss of life years per individual (AYLL, average years of life lost). Depending upon the analytic aim (health economy, prevention, health care research) different methods exist for the generation of these measurements. In the results presented here, the age for a premature death is considered to be before 70 years, according to the guidelines of the OECD and the WHO (as seen in the abbreviation PYLL-70 or AYLL-70).
.

USAGE ICD-10 C85: Non-Hodgkin lymphoma NOS Page 36 of 36
MCR bC85__E-ICD-10-C85-Non-Hodgkin-lymphoma-NOS-incidence-and-mortality.pdf 12/21/2021
Shortcuts
MCR Munich Cancer Registry (Tumorregister München) GEKID Association of Population-based Cancer Registries in Germany (Gesellschaft der epidemiologischen Krebsregister in Deutschland e.V.) SEER Surveillance, Epidemiology, and End Results (USA) DCO Death certificate only BRD-S German (FRG) standard population ES European standard population (old) WS World standard population SIR Standardized incidence ratio CI Confidence interval EAR Excess absolute risk = excess cancer cases (O - E) per 10,000 person-years PYLL-70 Potential years of life lost prior to age 70 given a person dies before that age AYLL-70 Average years of life lost prior to age 70 given a person dies before that age SMR Standardized mortality ratio MI-index Ratio of mortality to incidence, MIR FRG Federal Republic of Germany
Recommended Citation
Munich Cancer Registry. ICD-10 C85: Non-Hodgkin lymphoma NOS - Incidence and Mortality [Internet]. 2021 [updated 2021 Dec 21; cited 2022 Feb 1]. Available from: https://www.tumorregister-muenchen.de/en/facts/base/bC85__E-ICD-10-C85-Non-Hodgkin-lymphoma-NOS-incidence-and-mortality.pdf
Copyright
The content of the public web site provided by the Munich Cancer Registry is available worldwide and free of charge. All documents are free to download, utilize, copy, print-out and distribute, providing that the MCR is referenced.
Disclaimer
The Munich Cancer Registry reserves the right to not be responsible for the topicality, correctness, completeness or quality of the information provided. Liability claims regarding damage caused by the use of any information provided, including any kind of information which is incomplete or incorrect, will therefore be rejected.