LOFAR Time-series data format ICD
11
LOFAR Time-series data format ICD Lars B¨ahren, Andreas Horneffer, Joseph Masters March 22, 2007 Contents 1 Introduction 1 1.1 Purpose and scope .......................................... 1 1.2 Context and motivation ....................................... 1 1.3 Relationship with other interfaces .................................. 2 2 Organization of the data 2 2.1 Requirements ............................................. 2 2.2 Metadata ............................................... 3 2.3 Structure and contents of the data ................................. 3 2.3.1 Station group ......................................... 3 2.3.2 Antenna table ........................................ 4 2.3.3 Calibration table ....................................... 6 2.4 Open questions ............................................ 8 3 Interfaces 9 3.1 Interface requirements ........................................ 9 3.2 Relation to existing workpackages .................................. 9 3.2.1 Data Access Library (DAL) ................................. 9 3.2.2 Data Visualization Library (DVL) ............................. 9 3.3 Open Questions ............................................ 10 Glossary of terms 11 References 11 1 Introduction 1.1 Purpose and scope This document describes the internal structure of and the interface to the LOFAR time series data. Time series data – i.e. the digitized electric field strength, as received by the individual LOFAR dipoles – represent the primary input data to the UHECR (Ultra-High-Energy Cosmic Rays) analysis pipeline(s) and have to be considered as the most basic for in which the received radio signals are present within the LOFAR system. 1.2 Context and motivation The fundamental difference between data analysis for LOFAR/CR w.r.t. the other KSPs is the fact, that processing starts from the raw digitized time-series data delivered by the individual dipoles of the LOFAR telescope. This approach is required to provide the necessary time-resolution – essentially down to the 1
-
Upload
independent -
Category
Documents
-
view
0 -
download
0
Transcript of LOFAR Time-series data format ICD

LOFAR Time-series data format ICD
Lars Bahren, Andreas Horneffer, Joseph Masters
March 22, 2007
Contents
1 Introduction 11.1 Purpose and scope . . . . . . . . . . . . . . . . . . . . . . . . . . . . . . . . . . . . . . . . . . 11.2 Context and motivation . . . . . . . . . . . . . . . . . . . . . . . . . . . . . . . . . . . . . . . 11.3 Relationship with other interfaces . . . . . . . . . . . . . . . . . . . . . . . . . . . . . . . . . . 2
2 Organization of the data 22.1 Requirements . . . . . . . . . . . . . . . . . . . . . . . . . . . . . . . . . . . . . . . . . . . . . 22.2 Metadata . . . . . . . . . . . . . . . . . . . . . . . . . . . . . . . . . . . . . . . . . . . . . . . 32.3 Structure and contents of the data . . . . . . . . . . . . . . . . . . . . . . . . . . . . . . . . . 3
2.3.1 Station group . . . . . . . . . . . . . . . . . . . . . . . . . . . . . . . . . . . . . . . . . 32.3.2 Antenna table . . . . . . . . . . . . . . . . . . . . . . . . . . . . . . . . . . . . . . . . 42.3.3 Calibration table . . . . . . . . . . . . . . . . . . . . . . . . . . . . . . . . . . . . . . . 6
2.4 Open questions . . . . . . . . . . . . . . . . . . . . . . . . . . . . . . . . . . . . . . . . . . . . 8
3 Interfaces 93.1 Interface requirements . . . . . . . . . . . . . . . . . . . . . . . . . . . . . . . . . . . . . . . . 93.2 Relation to existing workpackages . . . . . . . . . . . . . . . . . . . . . . . . . . . . . . . . . . 9
3.2.1 Data Access Library (DAL) . . . . . . . . . . . . . . . . . . . . . . . . . . . . . . . . . 93.2.2 Data Visualization Library (DVL) . . . . . . . . . . . . . . . . . . . . . . . . . . . . . 9
3.3 Open Questions . . . . . . . . . . . . . . . . . . . . . . . . . . . . . . . . . . . . . . . . . . . . 10
Glossary of terms 11
References 11
1 Introduction
1.1 Purpose and scope
This document describes the internal structure of and the interface to the LOFAR time series data. Timeseries data – i.e. the digitized electric field strength, as received by the individual LOFAR dipoles – representthe primary input data to the UHECR (Ultra-High-Energy Cosmic Rays) analysis pipeline(s) and have to beconsidered as the most basic for in which the received radio signals are present within the LOFAR system.
1.2 Context and motivation
The fundamental difference between data analysis for LOFAR/CR w.r.t. the other KSPs is the fact, thatprocessing starts from the raw digitized time-series data delivered by the individual dipoles of the LOFARtelescope. This approach is required to provide the necessary time-resolution – essentially down to the
1
1.3 Relationship with other interfaces Page 2
time-interval at which the analog signal is sampled – to detect, identify and investigate the radio pulsesfrom Extensive Air-Showers (EAS) originating form high-enery cosmic rays.
Based on a number of considerations1 we have chosen the HDF5 data format as common wrapper for thestandard LOFAR data products (or at least a considerable fraction thereof). The goal is to create alongwith the definitions of the standard data product also an infrastructur which will enable LOFAR users toaccess and manipulate such data – this document therefore also serves as reference for the implementationwith the Data Access Library (DAL).
1.3 Relationship with other interfaces
The functionality to write, access and inspect time-series data will not come from a single software compo-nents (as delivered by the USG), but requires coverage by the following modules:
• Data Acces Library (DAL) – to provide read/write access to the data, as physically located on storagemedia (single hard-drive, RAID array, GRID, etc.)
• Data Visualization Library (DVL) – display the structure of the data set or parts of its contents; thisranges from the graphical representation of the internal hierarchical structure of the data set to thedisplay of e.g. the stored time-series or the antenna beamshape.
• Meta-Database Interface (MDI) – to provide read/write access to data associated with the time-seriesdata, required for inspection, processing, etc.
A detailed description of the expected interaction of above mentioned modules is given in section 3 (Inter-faces).
2 Organization of the data
2.1 Requirements
The data format needs to be able to handle data volumes as different as a CR event with 1ms worth of datafrom a few antennas only to a full dump of 1 second worth of data from all LOFAR antennas in a consistentand efficient way.
UHEP:Time series data from the formed beam2 pol × 227 samples × 8 Bytes/sample: 2.0 GB/eventRaw time series data from individual dipoles77 stations × 96 antennae × 2 pol × 217 samples × 2 Bytes/sample: 3.6 GB/eventTotal: 5.6 GB/event
VHECR:Raw time series data from individual dipoles32 core stations × 96 antennae × 2 pol × 217 samples × 2 Bytes/sample: 1.6 GB/event
HECR:Similar, but now only one station is involved96 antennae × 2 pol × 217 samples × 2 Bytes/sample: 48MB/event
TS-modeSimilar to VHECR but full raw data from TBB77 stations × 96 antennae × 2 pol × 2 · 108 samples × 2 Bytes/sample: 5.9TB/event
The event rate is uncertain and estimated at one triggered event per station per 10 minutes.
1Wouldn’t it be better to have a reference here?
lofar Project Page 2

2.2 Metadata Page 3
2.2 Metadata
Metadata is the auxiliary data stored along with the time series data need to provide all the necessaryinformation for automated processing of the data. This data can either be stored directly in the data setor it can be stored in an external database. In the latter case the data set must contain a pointer to thecorrect entry in that database (e.g. the antenna-id is needed to get the antenna position).
• DAQ mode, including Samplerate, Filters, etc.
• Timing information:
– Trigger time relative to recorded data segement
– Timing of the data streams relative to the trigger
– Timing of the data streams relative to each other with sub-sample accuracy; This can be implicit,e.g. all data streams of a station start at the same time. Fields that can be in stored in an externaldatabase.
• List of RFI sources identified by the station calibration, including direction, center frequency andpeak strength.
→ What does this actually mean: the properties of the single channel containing the highest signallevel or the parameters obtained from fitting e.g. a Gaussian to a segment of the spectrum?
• dispersion measure of the ionosphere (at this point in time and space)
• health information about the antennas
System monitoring and system health. Information on the status of the various (hardware) componentsat a LOFAR station will be stored inside the PVSS database; a description of the datapoint-types anddatapoints can be found in the MAC/Deployment/data/PVSS branch of the LOFAR code repository (seeTab. 1 for an excerpt).
In order to later store certain system health information along with the other data, parameters need tobe subscribed to at the definition of the observation.
2.3 Structure and contents of the data
2.3.1 Station group
Given the different modes planed for cosmic ray observation, a single LOFAR station appears to be thenatural choice for a first grouping of time-series data from the individual dipoles; for that matter we considerthe station group (Tab. 2) as a basic module within the data structure.2 Creating a snapshot of multiplestations, or even the full LOFAR array, thus will result in a set of station groups – which in turn might becollected into another superstructure.
The main purpose of this group is to serve as a common container for the separate sub-tables, which takeup data from the station calibration and the trigger algorithm; the main motivation for this design is to beable to more efficiently distribute the contents of the data set. Especially the calibration information mightnot physically reside in the same location as the rest of data – calibration information might be interactivelyextracted from a calibration data-base, whether being a central one or a local snapshot.
The following entries will be found in the station group (Tab. 2, p. 6):
– One of the most obvious informations to store is the name of the telecope (TELESCOPE) with whichthe observation was carried out – i.e. LOFAR.
– OBSERVER holds the name(s) of the observer(s).
– If the observation is carried out within the context of a specific project, then its name will be storedin PROJECT. If no specific project is defined, the variable simply should be set to LOFAR/CR.
2Though from initial perception the described structure well can be perceived as a table, the HDF5 internal data model isthat of a group; in order to stick as closely as possible to the libraries naming conventions, we therefore use the name groupinstead of table.
lofar Project Page 3
2.3 Structure and contents of the data Page 4
Database entry Field Format
CalCtlr connected boolobsname stringantennaArray stringfilter stringnyquistzone intrcus string
ObservationControl claimPeriod intpreparePeriod intstartTime stringstopTime stringsubbandList stringbeamletList stringbandFilter stringnyquistzone intantenneArray stringreceiverList stringsampleClock intmeasurementSet stringstationList stringinputNodeList stringBGLNodeList stringstorageNodeList string
Table 1: Excerpt from the list of entries into the PVSS database. The definitions of the datapointtypesand datapoints can be found in the MAC/Development/data/PVSS branch of the LOFAR coderepository.
– OBSERVATION_ID is the unique identifier for the LOFAR observation.
– The observation mode (OBSERVATION_MODE) at which the data where recorded.
Even though there exist multiple LOFAR observation modes for cosmic rays, all have in common a (multi-level) pulse-detection and trigger-generation algorithm; the control parameters of the trigger algorithms aswell as its output (in case a trigger condition was derived) needs to be stored.
– The type of the CR trigger (TRIGGER_TYPE) will depend on the observation mode, i.e. VHECR,HECR, UHEP; either the original trigger was generated at antenna, station or array level (for moredetails see the description of the CR processing pipelines).
– TRIGGER_OFFSET
– In the VHECR mode the first-level trigger is generated at dipole level; thereby we need to store theinformation for which set of antennas (TRIGGERED_ANTENNAS) the trigger condition was fullfilled.The shape of the vector will depend on the number of antennas for which the triggger condition wasfullfilled – the maximum length is the number of antennas within a station (96).
– BEAM_DIRECTION
2.3.2 Antenna table
The antenna table (Tabb. 3) collects data on a per-dipole basis3 – starting from the identifiers requiredfor the unambiguous identification of an individual dipole within the full LOFAR network to the actualsampled wave-form of the EM-field at the position of each antenna feed.3Please keep in mind here, that we clearly distinguish between antenna and dipole/feed: using the feed-based approach as
underlying the Measurement-Equation, an antenna can consist of multiple feeds (or dipoles).
lofar Project Page 4

2.3 Structure and contents of the data Page 5
� � � � � � � � � � � � � �� � � � � � � � � � � � �� � � � � � � � � � � �� � � � � � � � � � � � � � � � � � �� � � � � � � � � � � � � � � � � � � � �� � � � � � � � � � � � � � � � �� � � � � � � � � � � � � � � � � � � � !� � � � � � � � � � � � � � � � � � � � " � � " # $ � � % & '� � � � � � � � � � � � � � � � " � � " # $ � � � � ! % & '
( ) * + , - . * / 0 1 2 , 3 / 4 * ( 1 2 5 6 7
� � � � � � � � � � � � � " � !� � � � � � � � � � � � � � � � � " � !
( ) * + , - . * / 0 1 2 , 3 / 4 * ( 1 2 5 6 7� � � � � � � � � � � � � � � � � � � � � � 8 � � � � � � � � � � � � � � � 9 � � � � � � !� � � � � � � � � � � � � � � � � � � � � � � � � � � � � � � � � � � � � � � � � � � � � � : � � � � � � � � " � � " # $ ; � � % & '� � 9 8 � � � � < � � � � � � � � � � � � � �� � � � � � � � � � � � " � � " # $ � � � � ! % & '
( ) * + , - . * / 0 1 2 , 3 / 4 * ( 1 2 5 6 7� � � = � � � � � � � � � � � !� � � � � � 8 � � � " � � " # $ > � ? @ ! A % & '� � � � � � � � 9 8 � � � � � � " � � " # $ � � � � ! % & '� � � � � � : � � � " � � " # $ > � ? @ ! A % = '� � � � � � � � � � � � � � � " � � " # $ � � � � ! % = '� � � � � � � � 9 8 � � � � � � " � � " # $ � � � � ! % & '� � � � � � � 8 � � � " � � " # $ > � ? @ ! A % & '� � � � � � � � � 9 8 � � � � � � " � � " # $ � � � � ! % & '
� � � � � � � � � � � � � � � " � � " # $ � � � � ! % & '
� � � � � � � � � � � � �
� � � � � � � � � � � 8 �
� � � � � � � � � � � � � � � � �
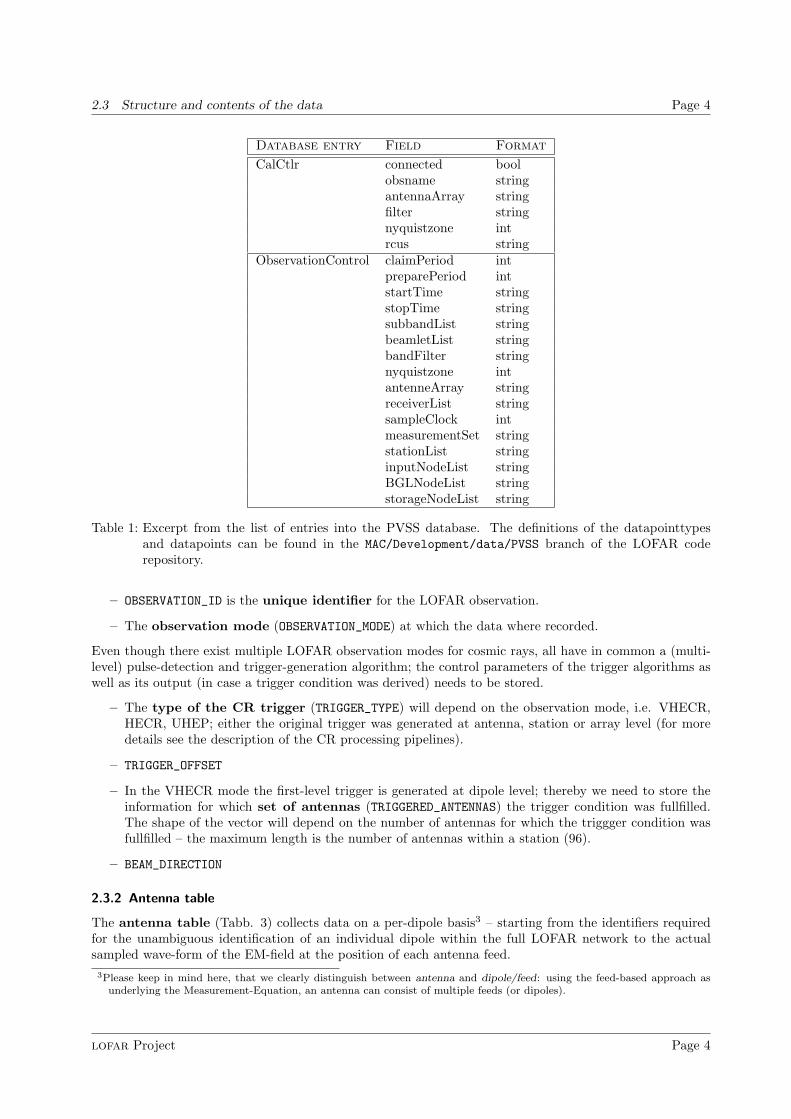
Figure 1: Organization of the group holding the data per LOFAR station (Tab. 2); besides holding a fewparameters common to all antenna elements within the station, this table serves as a containerfor three sub-tables, containing the raw antenna data (Tab. 3), calibration information (Tab. 4)and the output of the trigger algorithm which has initiated the data dump.
– STATION_ID, RSP_ID and RCU_ID are directly taken from the frame structure used in the communi-cation between RSP and TBB [4]. The three identifiers in combination allow for an unambiguousidentification of an individual dipole within the LOFAR network; depending on the range of value ofthe individual numbers the unique ID may be constructed via e.g.
NID = 104 · NStation + 102 · NRSP + NRCU (1)
– The combination of the two fields TIME and SAMPLE_NR gives an absolute time reference for the firstsample in the DATA field. The TIME field gives a time offset in seconds from a certain start moment,where the LCU is completely free at chossing a time system, such as UNIX time4. For a constantsampling frequency (SAMPLE_FREQ) the timing for the remaining set of samples can derived via [4]
t[n] = tTIME +(tSAMPLE−NR + n
)· 1/νSAMPLE−FREQ (2)
where n is the index for a sample in the DATA vector.
– Each frame of data transferred between RSP and TBB has the same fixed length (SAMPLES_PER_FRAME),but a frame may hold any number of samples that will fit in the payload area of the frame.
– DATA stores the raw ADC output for an individual signal path/dipole, consisting of DATA_LENGTHsamples for a single dump of TBB data; the length of this data vector will vary depending on theobservation mode (see list in Sec. 2.1).It should be kept in mind how the data of a pair of dipoles is organized in the data frame structure
4Referring to the UINX time, this field would hold the number of seconds since 1970
lofar Project Page 5

2.3 Structure and contents of the data Page 6
Field/Keyword Format Unit DescriptionTELESCOPE KW/string — Name of the telescopeOBSERVER KW/string — Name(s) of the observer(s)PROJECT KW/string — Project code/nameOBSERVATION_ID KW/string — Unique identifier for the observationOBSERVATION_MODE KW/string — Observation mode (i.e. Mode 1: 30–90MHz,
Mode 2: 120–190MHz etc.)TRIGGER_TYPE KW/string — The kind of trigger that triggered this obser-
vation (UHEP/VHECR/HECR?)TRIGGER_OFFSET KW/double sec Trigger time relative to the reference timeTRIGGERED_ANTENNAS KW/array<uint,1> — [Ntrig.Ant] List of the triggered antenna
(VHECR mode); vector of variable length.BEAM_DIRECTION KW/array<double,1> deg [2] Direction of the station beam, on which the
CR observation was piggy-backing.ANTENNA_TABLE table — Table: entries extracted from the frame struc-
ture used in the transfer between RSP andTBB
CALIBRATION_TABLE table — Table: calibration information as deliveredthrough the online (station) calibration
Table 2: Fields in the station data group (STATION−GROUP). The main purpose of this group of to serve asa common container for the separate sub-tables, which take up data from the TBB, the stationcalibration and the trigger algorithm. Shapes of vector and matrices are given in [ ]-brackets inthe description. See text for detailed explanation on the individual fields in the table.
used in the transfer between TBB and RSP (see Fig. below). In order to achieve maximum datapacking density, the 12-bit encoded signals from the RCU-channels are placed front-to-back within thepayload segment of the data frame. This arrangement should be reorganized before storage into thetime-series data set!
� � � � � � � �� � � �
� � � � � � � �� � � �
� � � � � � � �� � � �
� � � � � � � �� � � �
� � � � � � � �� � � �
� � � � � � � �� � � �
� � � � � � � �� � � �
� � � � � � � �� � � �
� � � � � � � �� � � �
� � � � � � � �� � � �
� � � � � � � �� � � �
� � � � � � � �� � � �
� �
� �
– the position (ANT_POSITION) of each receiving element, ~x = (x1, x2, x3)
– the orientation (ANT_ORIENTATION) of each receiving element, ~α = (α1, α2, α3). Of course we shouldtry to minimize the number of parameters used for reference frame transformations; if we – and thisseems reasonable – can assume the ground of a single LOFAR station as flat, we can reduce therotation parameters to a single angle decribing a possible rotation of the antenna w.r.t. the (x, y) axesof the station coordinate reference frame.
2.3.3 Calibration table
The calibration table collects all the information required for the proper calibration of the recordeddata. Since all cosmic ray observation modes make use of the data as they are available directly after the
lofar Project Page 6

2.3 Structure and contents of the data Page 7
Field/Keyword Format Unit DescriptionSTATION_ID uint — Data source station identifierRSP_ID uint — Data source RSP board identifierRCU_ID uint — Data source RCU board identifierSAMPLE_FREQ double/KW Hz Sample frequency in MHz of the RCU boardsTIME uint sec Time instance in seconds of the first sample in
the payloadSAMPLE_NR uint — Sample number of the first payload sample in
current seconds interval in transient mode [4]SAMPLES_PER_FRAME uint — Total number of samples in the payload of the
original TBB–RSP frame structureDATA_LENGTH uint/KW — The number of samples per dipole which ac-
tually stored into the data set; this might aswell be different from the number of samplesin a data frame
DATA array<short,1> counts [DATA_LENGTH] Raw ADC output (the time-series)
NYQUIST_ZONE uint/KW — Nyquist zone in which the data are sampledFEED string — Type of feed for this dipoleANT_POSITION array<double,1> m [3] Antenna position w.r.t. the station center,
~x = (x1, x2, x3)ANT_ORIENTATION array<double,1> deg [3] Orientation of the antenna w.r.t. the sta-
tion reference frame, ~α = (α1, α2, α3)
Table 3: Fields in the ANTENNA−TABLE subtable; each listed field corresponds to a column in the table, wherethe number of rows corresponds to the number of dipoles. The first set of values is adopted directlyfrom the frame structure used for data transfer between TBB and RSP [4].
digitization step, the further processing incorporated into the data products delivered for other observationmodes will need to be applied as part of the offline-analysis.
– The first conversion step in the processing will be to turn the recorded ADC counts into voltages; forthis matter we need the scale (ADC2VOLTAGE) relating both quantities. These values are expected to berather stable as function of time, though dependency external or system factors cannot be excluded.
– The complex electronic gain (GAIN_CURVE) of each receiving element as function of frequency(bandpass), Ggain = G(ν); this array<complex,1> will be multiplied (after interpolation, if required)to the output of the Fourier transform of the dipole voltage time-series. Keep in mind, that thefrequency range might be covered by non-equidistantly separated points, such that a array<double,1>per antenna will be required for the GAIN_FREQUENCIES.
– BEAM_SHAPE holds the complex element beam pattern as function of direction and frequencyGbeam = G(~ρ, ν). In order to correctly interpret the data – and, if necessary, interpolate – thecorresponding beam directions (BEAM_DIRECTIONS) and frequency values (BEAM_FREQUENCIES)are required.
– NOISE_CURVE holds the system noise as function of frequency, Nsystem = N(ν), where the frequenciesare stored in NOISE_FREQUENCIES
Since CR data processing will require to perform all the calibration steps normally applied after passing thedata through the transient buffer board (TBB) within the LOFAR system, availability of station calibrationis vital; most aforementioned information are listed as central products/parameters to the LOFAR stationcalibration [5].
lofar Project Page 7

2.4 Open questions Page 8
Field name Format Units DescriptionADC2VOLTAGE double Voltage Factors for conversion from raw ADC counts
to voltagesGAIN_CURVE array<complex,1> — [NChannels] Complex electronic gain as func-
tion of frequencyGAIN_FREQUENCIES array<double,1> Hz [NChannels] Frequency values for which the
gain electronic gains are providedBEAM_SHAPE array<complex,2> [NDirections, NChannels]BEAM_DIRECTIONS array<double,2> deg [NDirections, 2] Directions, for which the beam-
shape is providedBEAM_FREQUENCIES array<double,1> Hz [NChannels] Frequencies for which the beam-
shape is providedNOISE_CURVE array<complex,1> — [NChannels] system noise as function of fre-
quencyNOISE_FREQUENCIES array<double,1> Hz [NChannels] Frequencies for which the system
noise is sampled
Table 4: Columns in the CALIBRATION−TABLE subtable; ; each listed field corresponds to a column in thetable, where the number of rows corresponds to the number of dipoles.
2.4 Open questions
1. Are there modes forseens, in which the total LOFAR array is being split up into sub-arrays, whichoperate in different modes, e.g. the Compact Core using the high-band antennas, while the remotestations are observing with the LBAs? In such a case the range of application of some of the metadatakeywords would change; in order not to shift keywords within the data structure we therefore will endup with redundant information, depending of the specific observation mode. The latter though willnot pose a major problem, since this redundance will show up in non-datasize critical keywords, suche.g. OBSERVTAION_MODE or NYQUIST_ZONE.
2. How do the various components running at station level react to holes or bit errors in the datastreams coming from the RCUs? Data frames should not be dropped in any case, but flagged ifan error is detected; the peak detection running on the TBB should not come to halt but continueanalysing the incoming buffer frames. A possible false alarm triggered by a single channel most likelywill be cancelled out in the subsequent coincidence stage.
→ Check with station engineering group how RSP and TBB would behave in the case describedabove. If necessary ask for adjustment!
3. Which parameters will be there to describe the trigger condition?
4. What about distance dependency of the element beam pattern? Calibration on astronomicalsources naturally will provide the far-field beam pattern, but be also might be interested in thetransition from near-field to far-field – is this accessable via the EM simulations?Will the beam pattern be provided as mean element beam pattern or in fact as beam pattern for eachindividual dipole? If deviations from the mean pattern are larger than 1%, the latter is required.
5. Which data points will be generated for and distributed by the system health monitoring? While indeedthere is a list of parameters available from the database description files (e.g. RSPBoard.dpdef), aremore detailed explanation of the stored contents is required in order to make a proper selection ofvalues which are about to be stored long with a CR time-series dataset.
6. In which form/format will the information on the dispersion measure be provided?
lofar Project Page 8

Page 9
3 Interfaces
3.1 Interface requirements
t.b.d.
3.2 Relation to existing workpackages
3.2.1 Data Access Library (DAL)
The DAL must be able to handle retrieval of the data representations as used throughout the data analysispipeline:
– ADC values as function of time
– Voltage as function of time
– Raw FFT of the voltage time-series
– Calibrated FFT
– RFI-filtered FFT
– Cross-Correlation Spectra (either from raw or calibrated FFT)
– Visibilities
From its design it becomes clear, that most likely the functionality of the DAL will be limited to the basichandling of the data I/O, whereas generation of the derived data products most likely is to become theresponsibility of another processing layer.
While in most usage scenarios all the valid data from a LOFAR station will be read in to be processedtogether, their might be the need to select data from antenna across the borders of a LOFAR station: thiswill require the ability to access data based on the geographical locations, such as e.g.
– all antennas within a N Kilometer radius of the shower core
– all antennas within a sector of M degrees opening angle towards a given direction w.r.t. the showercore
– all antennas located in a ring of N1 < R < N2 around the position of the shower core
3.2.2 Data Visualization Library (DVL)
Past experience with the software for the LOPES experiment has shown, that is is crucial to provide theuser with a variety of way to graphically inspect the data. This not only includes visualization of thetime-series/FFT/etc. data themselves, but also displaying the various data with the wider context of theexperimental setup (e.g. geographical distribution of the antennas w.r.t. to the particle detector setup)
• Display of the standard data products (also see documentation of the lopes–Tools DataReader):ADC, Voltage, FFT, Calibrated FFT, RFI-filtered FFT, Cross-Corr. Spectra, Visibilities
• Display of the (intermediate) data products generated from the input data, e.g. dynamic spectra,multi-dimensional skymaps
• Flags and weights associated with the data, e.g. filter curves, antenna gain curves, etc.
• Station layout, i.e. positions of the (selected/excluded) antennas
• antenna power level distribution over the area of the station/array (this is very similar to the type ofevent display as known from particle physics experiments)
• mapping of the (local) RFI via an (Azimuth,Frequency) plot centered on the position of a certainstation
lofar Project Page 9
3.3 Open Questions Page 10
• geographical locations of identified RFI sources; such a plot should also indicate the frequency bandof the RFI (via label or bar etc.)
• geographical distribution/location of antennas which generated a trigger signal, failed, etc.
→ VR setting, combining geographical information (e.g. map of the Netherlands) with the locationof localized CR-/TS-events
⇒ in a cave-like setup we actually can perform a fly-through, which would be ideal for outreachpurposes!
• cummulative geographical distribution of detected CR events
• total power per LOFAR station (geographically distributed)
• overlay of CR data with information from other sensors (e.g. weather radar images, temperatures,etc.)
A number of the before-mentioned displayes should be interactive, in the sense that the user should be ableto perform data selection from the graphical display (e.g. by drawing a circle around the core of the CR airshower, thereby selecting the antennas included in the data analysis step).
3.3 Open Questions
lofar Project Page 10

References Page 11
Glossary of terms
ADC Analog to Digital ConversionDAL Data Access LibraryDVL Data Visualization LibraryEAS Extensive Air-ShowerHECR High-Energy Cosmic RaysLOPES LOFAR Prototype StationRCU Receiver UnitRSP Remote Station Processing BoardTBB Transient Buffer BoardTS ThunderstormUHECR Ultra-High-Energy Cosmic RaysUHEP Ultra-High-Energy ParticleUSG User Software Group
References
[1] A. J. Boonstra & M. Tanigawa (2006) LOFAR Interference Mitigation Approach and MeasurementResults, LOFAR-ASTRON-RPT-104
[2] HDF5 home page, http://hdf.ncsa.uiuc.edu/HDF5
[3] A. Horneffer (2006) PhD Thesis, Uni. Bonn
[4] W. Poiesz (2006) TBB Design Document, LOFAR-ASTRON-SDD-047
[5] S. J. Wijnholds (2006) Station calibration, Pitfalls and possibilities 2006, LOFAR-ASTRON-MEM-217
[6] M. Wise et al (2006) LOFAR User Software Plan, ASTRON, Dwingeloo
lofar Project Page 11