Transplanting Neural Progenitor Cells into a Chronic Dorsal ...

708 VOLUME 16 NUMBER 7 JULY 2015 nature immunology
A rt i c l e s
Individual dendritic cell (DC) lineages have non-redundant roles in defense against pathogens1. Plasmacytoid DCs (pDCs) produce type I interferons to limit viral infection2 but are limited in presenting antigen to T cells3. The two conventional DC (cDC) lineages, repre-sented by splenic CD8α+ DCs and CD4+ DCs4, selectively express the transcription factors IRF8 or IRF4, respectively5,6. IRF8+ cDCs func-tion in vivo in cross-presentation to CD8+ T cells and in the induction of interleukin 12–dependent responses of the TH1 subset of helper T cells7,8, while IRF4+ cDCs function in promoting immune responses by TH17 and TH2 cells9–11. Both in vivo and in bone marrow (BM) cul-tures treated with the cytokine Flt3L, IRF8+ cDCs can be identified as CD24+CD172a− cells (called ‘CD24+ DCs’ here) and IRF4+ cDCs can be identified as CD24−CD172a+ cells (called ‘CD172a+ cDCs’ here).
Several transcription factors control the development of DCs from the BM-resident common DC progenitor (CDP)12–14. IRF8 is expressed by and required for the development of both pDCs and CD24+ DCs6,15–17. IRF8 reportedly binds to the promoter of its own gene Irf8 in a macrophage cell line18 and may be regulated by a positive autoregulatory loop in pDCs19. In contrast, IRF4 is required in the CD172a+ DC lineage20. The basic helix-loop-helix transcrip-tion factor E2-2 is expressed by pDCs and is required for their development3,21, while Id2, an inhibitor of basic helix-loop-helix tran-scription factors, is expressed by both cDC subsets but is required only for the development of CD24+ cDCs22–24.
Heterodimers of the transcription factors Batf3 and Jun interact with IRFs to stabilize binding of a heterocomplex to transcription
factor AP1-IRF composite elements (AICEs)25,26. Both Batf and Batf3 can interact with both IRF4 and IRF8, but Batf is expressed neither in mature DCs nor in progenitors of DCs during development at home-ostasis25. Like Id2, Batf3 is expressed in both CD24+ DCs and CD172a+ DCs, but Batf3 is required only for the development of CD24+ cDCs, both for splenic CD24+ cDCs and for peripheral tissue–resident and migratory CD103+ cDCs of the CD24+ DC lineage7,27.
Batf3−/− mice exhibit severe functional immunological impair-ment7,8,28. However, there is an unexplained residual population of CD24+ cDCs in Batf3−/− mice25. Therefore, it is possible that Batf3 may control gene expression only in mature CD24+ cDCs instead of controlling the development of this lineage, similar to the respective actions of the transcription factors EBF and Pax5 in B cell develop-ment29. If so, residual CD24+ cDCs in Batf3−/− mice might represent cells undergoing abnormal development.
Here we present a model to explain the role of Batf3 in CD24+ cDC development. First, we identified clonogenic progenitors that arose directly from the CDP that were committed to becoming either CD24+ cDCs or CD172a+ cDCs. We found that the clonogenic progenitor of CD24+ cDCs, the pre-CD8 DC, could be specified without Batf3 but that Batf3 was necessary at this stage to sustain autoactivation of Irf8 through an enhancer element that was active exclusively in CD24+ cDCs. In Batf3−/− mice, this progenitor failed to commit to the CD24+ cDC lineage because of the decay of Irf8 autoactivation and diverted into the IRF4+ CD172a+ lineage.
1Department of Pathology and Immunology, Washington University School of Medicine, St. Louis, Missouri, USA. 2Department of Medicine A, Hematology and Oncology, University of Muenster, Muenster, Germany. 3Department of Biomedicine, University of Basel, Basel, Switzerland. 4Max Delbrück Center for Molecular Medicine in the Helmholtz Association, Berlin, Germany. 5Institute of Molecular Tumor Biology, University of Münster, Münster, Germany. 6Howard Hughes Medical Institute, Washington University School of Medicine, St. Louis, Missouri, USA. Correspondence should be addressed to K.M.M. ([email protected]).
Received 14 December 2014; accepted 5 May 2015; published online 8 June 2015; doi:10.1038/ni.3197
Batf3 maintains autoactivation of Irf8 for commitment of a CD8a+ conventional DC clonogenic progenitorGary E Grajales-Reyes1, Arifumi Iwata1, Jörn Albring2, Xiaodi Wu1, Roxane Tussiwand1,3, Wumesh KC1, Nicole M Kretzer1, Carlos G Briseño1, Vivek Durai1, Prachi Bagadia1, Malay Haldar1, Jörg Schönheit4, Frank Rosenbauer5, Theresa L Murphy1 & Kenneth M Murphy1,6
The transcription factors Batf3 and IRF8 are required for the development of CD8α+ conventional dendritic cells (cDCs), but the basis for their actions has remained unclear. Here we identified two progenitor cells positive for the transcription factor Zbtb46 that separately generated CD8a+ cDCs and CD4+ cDCs and arose directly from the common DC progenitor (CDP). Irf8 expression in CDPs required prior autoactivation of Irf8 that was dependent on the transcription factor PU.1. Specification of the clonogenic progenitor of CD8a+ cDCs (the pre-CD8 DC) required IRF8 but not Batf3. However, after specification of pre-CD8 DCs, autoactivation of Irf8 became Batf3 dependent at a CD8a+ cDC–specific enhancer with multiple transcription factor AP1-IRF composite elements (AICEs) within the Irf8 superenhancer. CDPs from Batf3−/− mice that were specified toward development into pre-CD8 DCs failed to complete their development into CD8a+ cDCs due to decay of Irf8 autoactivation and diverted to the CD4+ cDC lineage.
npg
© 2
015
Nat
ure
Am
eric
a, In
c. A
ll rig
hts
rese
rved
.

nature immunology VOLUME 16 NUMBER 7 JULY 2015 709
A rt i c l e s
RESULTSAutoactivation of Irf8 in early progenitor cellsWe first confirmed the lack of CD24+ cDCs in Irf8−/− mice6 and BXH2 mice17, which are homozygous for a mutation in Irf8 that results in a substitution (R294C) that prevents the interaction of IRF8 with partner transcription factors PU.1, IRF2 and SpiB17 (Fig. 1a). Unexpectedly, heterozygous Irf8+/− mice had a fivefold lower frequency of CD24+ cDCs than that of wild-type mice, with a lower mean fluorescence intensity (MFI) of CD24 (Fig. 1a), and a similarly lower abundance CD8α+CD205+ cells (Supplementary Fig. 1a). These decreases were greater than would be predicted from half the amount of IRF8 pro-tein in heterozygous mice. Similarly, there was 77% lower frequency of CD24+ cDCs in Irf8+/− BM than in wild-type BM and 95% fewer CD103+ cells derived from culture of BM with Flt3L (Fig. 1b). The phenotype of Irf8+/− mice for the development of CD24+ cDC was consistent with transcriptional Irf8 autoactivation30–32, in which IRF8 regulates its own transcription19.
To find the developmental stage at which autoactivation of Irf8 occurs, we examined the expression of IRF8 protein in macrophage and DC progenitors (MDPs)33 and CDPs13,14. IRF8 expression was lower in wild-type MDPs than in wild-type CDPs (Fig. 1c,d), similar
to results obtained for a published IRF8-EGFP reporter mouse34, and was only slightly lower in Irf8+/− MDPs than in wild-type MDPs (Fig. 1c,d). IRF8 levels increased in wild-type cells during the transi-tion from MDP to CDP, but a smaller increase occurred for Irf8+/− CDPs (Fig. 1d). CDPs from BXH2 mice also had lower expression of IRF8 than that of wild-type CDPs (Fig. 1d). These results suggested that the autoactivation of Irf8 occurred as early as the CDP stage and required the interaction of IRF8 with a partner such as PU.1.
We expressed IRF8 via retrovirus in the progenitors of DCs to test that hypothesis. Retrovirally expressed IRF8 increased the development of CD24+ cDCs to 51% of total cDCs from Irf8+/− BM, compared with about 8% for Irf8+/− samples transduced with control (empty) retrovi-rus, whereas in Irf8−/− BM, CD24+ cDCs increased to only 14% of total cDCs (Fig. 1e). This suggested that efficient reconstitution by retrovi-rally expressed IRF8 required an intact endogenous Irf8 locus. Moreover, retroviral expression of the mutant IRF8(R294C) increased CD24+ cDC development only twofold in Irf8+/− BM, relative to the development in cells transduced with control (empty) retrovirus , but not at all in Irf8−/− BM (Fig. 1e), which suggested that the inability of IRF8(R294C) to activate its own expression might have caused, in part, the observed defect in CD24+ cDCs in BXH2 mice, similar to that of Irf8−/− mice5,6.
0.0
98
0.4
97
CD
24
9.6
88
1.2
97
WTa b c dIrf8+/–
Irf8–/– BXH2
CD172a
105
104
103
0
105
104
103
0
105
104
103
0
105
104
103
0
1051041030 1051041030
1051041030
1051041030 1051041030
WT Irf8+/– Irf8–/–
39
55
8.9
86
1.9
86
CD
24
CD172a
15 0.8 0.7
CD
103
4.2
15
4.1
9.6
11
4.2
3.5
3.0
WT Irf8+/–
Irf8–/– BXH2
CD135
CD
117
MDP CDP
IRF8
WT
Irf8–/–BXH2
Irf8+/–WT
Irf8–/–
2,6982,631
6,0693,638
2,6983,439
6,0693,827
Eve
nts
(% o
f max
)
100
80
60
40
20
0
7.8
35
0.0
67
51
14
36
16
0.09
CD172a
CD
24
EVe IRF8 IRF8 (R294C)
105
104
103
0
1051041030
WT
Irf8+/–
Irf8–/–
IRF8
EV Flag-IRF8
49 35 22 73
64 4.8 39 51
16 0.8 73 11100
f
80
60
40
20
0Eve
nts
(% o
f max
)
1041030 102
gWT
Irf8–/–60
0
20 kb
60
0
Irf8
Figure 1 IRF8 is regulated by PU.1-dependent autoactivation of Irf8 in CDPs. (a) Flow cytometry analyzing the frequency of CD24+ cDCs among live splenocytes from wild-type, Irf8+/−, Irf8−/− or BXH2 mice (n = 4–6 mice per genotype), with cDCs gated as B220−Siglec-H−CD11c+MHCII+. Numbers adjacent to outlined areas indicate percent CD24+CD172a− cells (top left) or CD24−CD172a+ cells (bottom right). (b) Flow cytometry analyzing the expression of CD24, CD172a and CD103 in wild-type, Irf8+/− and Irf8−/− cDCs after 10 d of culture of BM with Flt3L. Numbers adjacent to outlined areas as in a (top row) or indicate percent CD103+CD172a− cells (bottom row). (c) Flow cytometry of wild-type, Irf8+/−, Irf8−/− or BXH2 BM, gated as Lin−CD127−CD115+CD11c− (lineage (Lin) markers included CD11b, CD5, Gr-1, B220 and TER-119). Numbers adjacent to outlined areas indicate percent Lin− CD117hiCD135+ MDPs (top) or Lin− CD117int–loCD135+ CDPs (bottom). (d) Flow cytometry analyzing the expression of IRF8 in wild-type, Irf8+/− and Irf8−/− MDPs and CDPs (top) or wild-type, BXH2 and Irf8−/− MDPs and CDPs (bottom) (cells gated as in c) (n = 2 mice per genotype). Numbers in plots (top right corner) indicate the MFI of IRF8. (e) Flow cytometry analyzing the development of CD24+CD172a− cDCs from wild-type, Irf8+/− and Irf8−/− BM cells infected (GFP+) with empty retrovirus (EV) or retrovirus expressing IRF8 or IRF8(R294C) (above plots), followed by 8 d of culture with Flt3L (n = 5 mice per genotype). Numbers adjacent to outlined areas indicate percent CD24+CD172a− cells. (f) Flow cytometry analyzing the expression of IRF8 by cDCs (CD11c+MHCII+) derived from CD117hiCD11b− wild-type, Irf8+/− and Irf8−/− BM cells (n = 5 mice per genotype) infected (GFP+) with empty retrovirus or retrovirus expressing Flag-tagged IRF8 (Flag-IRF8) (above plots), followed by 8 d of culture with Flt3L; gray shaded curves, background staining in Irf8−/− cDCs. Numbers above bracketed lines indicate percent IRF8lo cells (left) or IRF8hi cells (right). (g) ChIP-seq analysis of IRF8 in DCs derived from wild-type or Irf8−/− BM cultured for 10 d with Flt3L. Data are representative of four to six experiments (a), three experiments (b), two experiments (c,d), five experiments (e,f) or one experiment (g).
npg
© 2
015
Nat
ure
Am
eric
a, In
c. A
ll rig
hts
rese
rved
.

710 VOLUME 16 NUMBER 7 JULY 2015 nature immunology
A rt i c l e s
We next investigated whether retrovirally expressed IRF8 would be able to induce the expression of endogenous IRF8 protein. Flt3L-treated wild-type BM cells infected with empty retrovirus included two distinct cDC populations with endogenous IRF8 expression that was either low (49%) or high (35%), while heterozygous Irf8+/− BM included predominantly cDCs with low endogenous IRF8 expres-sion (64%) (Fig. 1f). Retroviral expression of IRF8 resulted in low IRF8 expression in 73% of infected Irf8−/− cDCs, but it substantially increased the percentage of cells with high total expression of IRF8 (retroviral and endogenous) relative to that of cells infected with control (empty) retrovirus, for Irf8+/− cDCs (from 4.8% to 51%) and wild-type cDCs (from 35% to 73%) (Fig. 1f). Thus, the increase in total IRF8 protein induced by retrovirally expressed IRF8 in Irf8+/− cDCs relative to that in Irf8−/− cDCs occurred because of autoactiva-tion at the endogenous Irf8 locus.
Analysis of the binding of IRF8 to the Irf8 locus by chromatin immunoprecipitation followed by sequencing (ChIP-seq) showed several peaks for the binding of IRF8, located upstream and downstream of the Irf8 coding region but not at the Irf8 promoter (Fig. 1g). As a negative control, we observed no peaks for the bind-ing of IRF8 in DCs derived from Irf8−/− BM. The binding of IRF8 to regulatory elements within the Irf8 locus was consistent with autoactivation of Irf8.
Batf3 maintains IRF8 in CD24+ cDCsDirect interaction between the Batf3 leucine zipper and IRF8 is required for the development of CD24+ cDCs25. Since IRF8 expression in CDPs involved an interaction between IRF8 and PU.1, we sought to determine if IRF8 expression in mature CD24+ cDCs might also involve Batf3. Irf8−/− mice showed a complete lack of CD24+ cDCs, but Batf3−/− mice had a CD24+ cDC population that was approximately 82% smaller than that of wild-type mice (Fig. 2a). Although certain infections can increase the frequency of CD24+ cDCs in Batf3−/− mice due to compensation by Batf2 or Batf25, the persistence of these cells in uninfected Batf3−/− mice has never been explained.
Wild-type CD24+ cDCs had high expression of IRF8; however, the residual Batf3−/− CD24+ cDCs had heterogeneous and lower IRF8 expression relative to that of wild-type CD24+ cDCs (Fig. 2b). In contrast, pDCs had abundant expression of IRF8, and CD172a+ cDCs had much lower expression of IRF8 in wild-type and Batf3−/− mice than did their CD24+ counterparts (Fig. 2b). Thus, residual CD24+ cDCs in Batf3−/− mice were abnormal, with heterogeneous expression of IRF8; this suggested a possible role for Batf3 in directly regulating IRF8 expression in this lineage.
cDC divergence occurs in the BMCD24+ cDCs and CD172a+ cDCs share a common progenitor called the ‘pre-cDC’, originally defined as lineage marker–negative (Lin−) CD135+MHCII−CD11c+ cells that develop from CDPs35. Since pre-cDCs
had heterogeneous expression of the cytokine receptor CD115 (MCSF-R) (Supplementary Fig. 1b), we sought to determine if CD115 expression could be used to distinguish pre-cDCs that were committed to the CD24+ cDC lineage or the CD172a+ cDC lineage. As a control, we found that CDPs generated CD24+ and CD172a+ cDCs and pDCs, but the CD115+ fraction of pre-cDCs developed exclusively into CD172a+ cDCs (Supplementary Fig. 1c,d). In con-trast, the CD115− fraction of pre-cDCs developed into both pDCs and CD172a+ cDCs (Supplementary Fig. 1c,d), consistent with a pub-lished report showing that Lin−CD11c−CD135+CD115−CD117int–lo BM is enriched for progenitors of pDCs36. However, CD115− pre-cDCs did not develop into CD24+ cDCs (Supplementary Fig. 1c,d). Thus, unexpectedly, neither fraction of the originally defined pre-cDCs generated CD24+ cDCs.
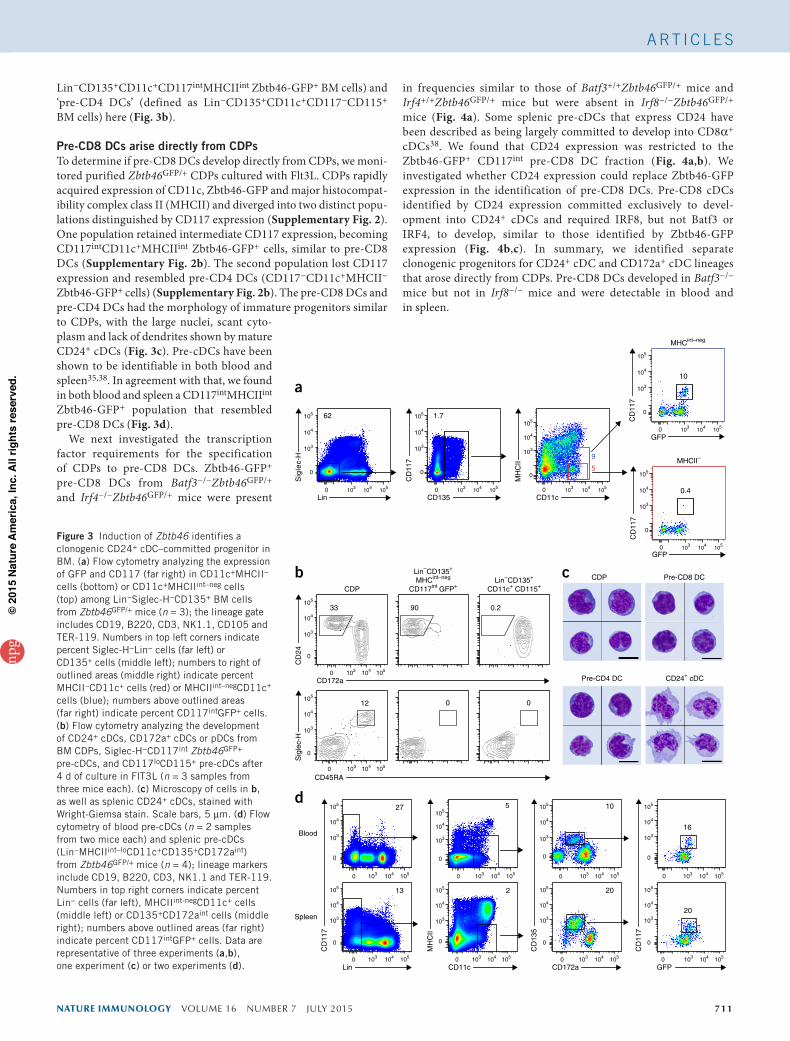
To identify the source of CD24+ cDCs, we used Zbtb46GFP/+ mice, in which expression of green fluorescent protein (GFP) from the locus encoding the transcription factor Zbtb46 identifies BM pro-genitors exclusively committed to cDC lineages and not pDCs or their progenitors37. Although pre-cDCs were originally defined as MHCII− cells35, we noticed that strict exclusion of MHCIIint cells from the CD11c+ pre-cDC gate identified cells that were CD117− and had heterogeneous Zbtb46-GFP expression (Fig. 3a). By including MHCIIint cells in the CD11c+ pre-cDC gate, we identified an addi-tional population of CD117int Zbtb46-GFP+ cells (Fig. 3a) that were largely negative for CD115 expression (data not shown) and would have been excluded by the strict lineage gate used (Supplementary Fig. 1b). Therefore, we sought to determine if these MHCIIint pre-cDCs might generate CD24+ cDCs. Indeed, these CD117intMHCIIint Zbtb46-GFP+ pre-cDCs developed exclusively into CD24+ cDCs but did not develop into CD172a+ cDCs or pDCs (Fig. 3b). In contrast, the CD115+CD117−MHCII− fraction of pre-cDCs developed exclu-sively into CD172a+ cDCs (Fig. 3b and Supplementary Fig. 1c,d). Thus, commitment to distinct branches of cDCs occurred in the BM and yielded progenitors that we call ‘pre-CD8 DCs’ (defined as
a
CD
24
CD172a
WT Batf3–/– Irf8–/–
CD
317
MHCII
25
68
4.4
88
0.0
94
0.2 0.2 0.0
105
104
103
0
105
104
103
0
1051041030
1051041030
b CD24+ CD172a+ CD317+
WT
Batf3–/–
IRF8
12 85 100 0.3
93
59 34 99 0.186
100
80
60
20
40
0Eve
nts
(% o
f max
)
Figure 2 Batf3 is required for IRF8 expression in CD8α+ cDCs. (a) Flow cytometry of fixed splenocytes from wild-type, Batf3−/− or Irf8−/− mice, with cDCs gated as B220−CD317−CD11c+MHCII+. Numbers adjacent to outlined areas indicate percent CD24+CD172a− cDCs (top left) or CD24−CD172a+ cDCs (bottom right) (top row), or CD317+MHCII− pDCs (bottom row). (b) Flow cytometry analyzing the expression of IRF8 in the DC subsets in a, measured by intracellular staining of cells from wild-type and Batf3−/− mice (black lines); shaded curves, background staining in Irf8−/− cells. Numbers below bracketed lines indicate percent IRF8lo cells (left) or IRF8hi cells (right). Data are representative of three experiments.
npg
© 2
015
Nat
ure
Am
eric
a, In
c. A
ll rig
hts
rese
rved
.
nature immunology VOLUME 16 NUMBER 7 JULY 2015 711
A rt i c l e s
Lin−CD135+CD11c+CD117intMHCIIint Zbtb46-GFP+ BM cells) and ‘pre-CD4 DCs’ (defined as Lin−CD135+CD11c+CD117−CD115+ BM cells) here (Fig. 3b).
Pre-CD8 DCs arise directly from CDPsTo determine if pre-CD8 DCs develop directly from CDPs, we moni-tored purified Zbtb46GFP/+ CDPs cultured with Flt3L. CDPs rapidly acquired expression of CD11c, Zbtb46-GFP and major histocompat-ibility complex class II (MHCII) and diverged into two distinct popu-lations distinguished by CD117 expression (Supplementary Fig. 2). One population retained intermediate CD117 expression, becoming CD117intCD11c+MHCIIint Zbtb46-GFP+ cells, similar to pre-CD8 DCs (Supplementary Fig. 2b). The second population lost CD117 expression and resembled pre-CD4 DCs (CD117−CD11c+MHCII− Zbtb46-GFP+ cells) (Supplementary Fig. 2b). The pre-CD8 DCs and pre-CD4 DCs had the morphology of immature progenitors similar to CDPs, with the large nuclei, scant cyto-plasm and lack of dendrites shown by mature CD24+ cDCs (Fig. 3c). Pre-cDCs have been shown to be identifiable in both blood and spleen35,38. In agreement with that, we found in both blood and spleen a CD117intMHCIIint Zbtb46-GFP+ population that resembled pre-CD8 DCs (Fig. 3d).
We next investigated the transcription factor requirements for the specification of CDPs to pre-CD8 DCs. Zbtb46-GFP+ pre-CD8 DCs from Batf3−/−Zbtb46GFP/+ and Irf4−/−Zbtb46GFP/+ mice were present
in frequencies similar to those of Batf3+/+Zbtb46GFP/+ mice and Irf4+/+Zbtb46GFP/+ mice but were absent in Irf8−/−Zbtb46GFP/+ mice (Fig. 4a). Some splenic pre-cDCs that express CD24 have been described as being largely committed to develop into CD8α+ cDCs38. We found that CD24 expression was restricted to the Zbtb46-GFP+ CD117int pre-CD8 DC fraction (Fig. 4a,b). We investigated whether CD24 expression could replace Zbtb46-GFP expression in the identification of pre-CD8 DCs. Pre-CD8 cDCs identified by CD24 expression committed exclusively to devel-opment into CD24+ cDCs and required IRF8, but not Batf3 or IRF4, to develop, similar to those identified by Zbtb46-GFP expression (Fig. 4b,c). In summary, we identified separate clonogenic progenitors for CD24+ cDC and CD172a+ cDC lineages that arose directly from CDPs. Pre-CD8 DCs developed in Batf3−/− mice but not in Irf8−/− mice and were detectable in blood and in spleen.
Pre-CD4 DC CD24+ cDC
CDP Pre-CD8 DC
CD
24
CD172a
Lin–CD135+
MHCint–neg
CD117int GFP+CDP
b c
Sig
lec-
H
CD45RA
12 0 0
33 90
Lin–CD135+
CD11c+ CD115+
0.2105
104
103
0
105
104
103
0
1051041030
1051041030
CD
117
10
0.4
CD
117
GFP
GFP
Sig
lec-
H
Lin CD135
CD
117
MH
CII
CD11c
1.762
a
MHCint–neg
MHCII–
105
104
103
0
105
104
103
0
105
104
103
0
105
104
103
0
105
104
103
0
1051041030 1051041030 1051041030
1051041030
1051041030
105
104
103
0
105
104
103
0
105
104
103
0
105
104
103
0
105
104
103
0
105
104
103
0
105
104
103
0
105
104
103
0
1051041030 1051041030
1051041030 1051041030
1051041030 1051041030
10510410301051041030Lin
CD
117
MH
CII
CD11c CD172a
CD
135
CD
117
GFP
Blood
d
Spleen20
13 2 20
10
16
527
9
5
Figure 3 Induction of Zbtb46 identifies a clonogenic CD24+ cDC–committed progenitor in BM. (a) Flow cytometry analyzing the expression of GFP and CD117 (far right) in CD11c+MHCII− cells (bottom) or CD11c+MHCIIint–neg cells (top) among Lin−Siglec-H−CD135+ BM cells from Zbtb46GFP/+ mice (n = 3); the lineage gate includes CD19, B220, CD3, NK1.1, CD105 and TER-119. Numbers in top left corners indicate percent Siglec-H−Lin− cells (far left) or CD135+ cells (middle left); numbers to right of outlined areas (middle right) indicate percent MHCII−CD11c+ cells (red) or MHCIIint–negCD11c+ cells (blue); numbers above outlined areas (far right) indicate percent CD117intGFP+ cells. (b) Flow cytometry analyzing the development of CD24+ cDCs, CD172a+ cDCs or pDCs from BM CDPs, Siglec-H−CD117int Zbtb46GFP+ pre-cDCs, and CD117loCD115+ pre-cDCs after 4 d of culture in FlT3L (n = 3 samples from three mice each). (c) Microscopy of cells in b, as well as splenic CD24+ cDCs, stained with Wright-Giemsa stain. Scale bars, 5 µm. (d) Flow cytometry of blood pre-cDCs (n = 2 samples from two mice each) and splenic pre-cDCs (Lin−MHCIIint–loCD11c+CD135+CD172aint) from Zbtb46GFP/+ mice (n = 4); lineage markers include CD19, B220, CD3, NK1.1 and TER-119. Numbers in top right corners indicate percent Lin− cells (far left), MHCIIint-negCD11c+ cells (middle left) or CD135+CD172aint cells (middle right); numbers above outlined areas (far right) indicate percent CD117intGFP+ cells. Data are representative of three experiments (a,b), one experiment (c) or two experiments (d).
npg
© 2
015
Nat
ure
Am
eric
a, In
c. A
ll rig
hts
rese
rved
.

712 VOLUME 16 NUMBER 7 JULY 2015 nature immunology
A rt i c l e s
Newly identified cDC progenitors are developmentally discreteWe analyzed gene expression in BM CDPs, pre-CD8 DCs and pre-CD4 DCs and splenic CD24+ and CD172a+ cDCs by microarray. By principal-component analysis, all progenitors segregated from mature cDC subsets along principal component 1 (PC 1), which accounted for approximately half of all variation in gene expression (Fig. 5a). Pre-CD8 DCs and CD24+ cDCs clustered together and segregated from pre-CD4 DCs and CD172a+ cDCs along PC2 and PC3, which accounted for nearly all of the remaining variation (Fig. 5a,b). In pairwise comparisons, the expression of some genes changed at different stages during the development of CD24+ cDCs and that of CD172a+ cDCs, including some genes with equal expression in both mature cDC subsets (Fig. 5c,d). For example, H2-Aa (which encodes an isotype of MHC class II) was fully induced during the transition from CDP to pre-CD8 DC but was induced only to an inter-mediate amount in pre-CD4 DCs (Fig. 5c,d). In contrast, the genes encoding myeloperoxidase (Mpo) and cathepsin G (Ctsg) were fully downregulated during the CDP–to–pre-CD4 DC transition but decreased to an intermediate extent in pre-CD8 DCs (Fig. 5c,d). Hierarchical clustering further showed that pre-CD8 DCs and pre-CD4 DCs were distinct from CDPs and each other (Fig. 5e) as well as from mature cDC subsets (Fig. 5f).
Many transcription factor–encoding genes (Fig. 5g,h) and cell surface marker–encoding genes (Fig. 5i) showed stage-specific regulation. For example, Batf3 and Id2 were upregulated during the CDP–to–pre-CD8 DC transition to the expression found in mature CD24+ cDCs, but their upregulation was delayed during the develop-ment of CD172a+ cDCs (Fig. 5g,h). In contrast, Nr4a1 (which encodes Nur77), Nr4a2 and Nr4a3 were upregulated during the transition from pre-CD8 DC to mature CD24+ cDC (Fig. 5g). Notably, Irf8 was still expressed in pre-CD4 DCs and was not downregulated until the mature CD172a+ cDC stage (Fig. 5h). In contrast, Irf4 did not have high expression in pre-CD4 DCs but instead had high expression only in mature CD172a+ cDCs (Fig. 5h). Because we used Zbtb46GFP/+ cells to identify pre-CD8 DCs and pre-CD4 DCs, Zbtb46 transcripts increased in abundance modestly during the CDP–to–pre-CD8 DC transition and CDP–to–pre-CD4 DC transition (Fig. 5h). Together these data suggested that pre-CD4 DCs and pre-CD8 DCs represent discrete stages of development.
Control of Irf8 expression by a Batf3-dependent enhancerWe sought evidence of a direct role for Batf3 in regulating Irf8 expres-sion. For this, we performed ChIP-seq analysis of IRF8 in CD24+ cDCs and pDCs, which had high expression of IRF8, and of Batf3 in CD24+
cDCs and CD172a+ cDCs, which expressed Batf3 (Supplementary Fig. 3a,b). In CD24+ cDCs, the binding of Batf3 and that of IRF8 were localized together at sites −26 kilobases (kb) and +32 kb from the Irf8 transcriptional start site (TSS) (Fig. 6a). IRF8 also bound at sites −16 kb and +41 kb from the Irf8 TSS in both CD24+ cDCs and pDCs, but Batf3 did not (Fig. 6a). In CD24+ cDCs and pDCs, we observed binding of the histone acetyltransferase p300, indicative of enhancer activity, at both the element +32 kb from the Irf8 TSS and the element +41 kb from the Irf8 TSS (Fig. 6a). In CD172a+ cDCs, which expressed IRF4, the Irf8 locus lacked binding of p300 and Batf3 (Fig. 6a), which suggested that the Batf3-IRF8 heterodimers, rather than Batf3-IRF4 heterodimers, might bind ‘preferentially’ to this locus.
Large, high-density clusters that bind master transcription factors, have unusually high levels of mediator binding, or have active histone marks, called ‘superenhancers’, have been recognized as being critical in controlling cell identity39,40. The Irf8 locus showed acetylation of histone H3 at Lys27 (H3K27ac) and monomethylation of histone H3 at Lys4 (H3K4me1) throughout a 60-kb region in CD24+ cDCs and pDCs and showed binding of H3K4me1 but no binding of H3K27ac in CD172a+ cDCs (Fig. 6a). Thus, the Irf8 locus was poised but not active in CD172a+ cDCs. The Irf8 peaks at +32 kb and +41 kb from the Irf8 TSS showed depletion for the binding of H3K4me1 and H2K27ac in CD24+ cDCs (Supplementary Fig. 3c). The Irf8 locus was the top-ranked superenhancer region in CD24+ cDC and pDCs, as assessed through use of the normalized H3K27ac ChIP-seq signal, but did not rank as a superenhancer in CD172a+ cDCs (Supplementary Fig. 4a–c). We were able to identify superenhancers with distinct DC specificity. For example, a superenhancer at the Itgae locus (which encodes the integrin αE) was specific for CD24+ cDCs, and a super-enhancer for the Bcl11a locus (which encodes the transcriptional
CD
117
GFP CD24
12
8
11
0.2 0.6
12
8
11
CD
117
CD135
WT
Batf3–/–
Irf4–/–
Irf8–/–
CD
117
Lin–CD11c+
MHCIIint–nega
11
13
11
5
b CD11c+
MHCIIint–neg
100
75
50
25
CD
24+ c
ells
(%
)
0
CDP
Pre-C
D8 DC
Pre-C
D4 DC
*
WT
Batf3–/–
Irf4–/–
Irf8–/–
105
104
103
0
105
104
103
0
1051041030
CD172a
CD
24CDP Pre-CD8 DC Pre-CD4 DC
c31 98 0.8105
104
103
105104103
0
0
1051041030
105
104
103
0
1051041030
Figure 4 Specification of pre-CD8 DCs requires IRF8 but not Batf3. (a) Flow cytometry analyzing the development of CD117int Zbtb46-GFP+ BM pre-CD8 DCs from Zbtb46GFP/+ (WT), Batf3−/−Zbtb46GFP/+, Irf4−/−Zbtb46GFP/+ and Irf8−/−Zbtb46GFP/+mice (n = 3 per genotype); lineage markers include CD19, B220, CD3, NK1.1, CD105 and TER-119. Numbers above outlined areas indicate percent CD135+ cells (left) or CD117intGFP+ cells (right); above plots, pre-gating. (b) Flow cytometry analyzing the expression of CD24 in cells from a (n = 3 mice per genotype). Numbers above outlined areas indicate percent CD117+CD24+ cells. (c) Flow cytometry analyzing the development of CD24+ cDCs (gated cells) and CD172a+ cDCs (ungated cells) (left half) from cells purified by sorting of wild-type cells in b (middle), as well as CDPs (left) and pre-CD4 DCs (right), assessed after 5 d of culture with Flt3L. Numbers above outlined areas (left) indicate percent CD24+CD172a− cells. Right, frequency of CD24+ cells that developed from the progenitors at left (n = 7 mice). *P < 0.001 (one-way analysis of variance (ANOVA) with Tukey’s post-hoc test). Data are representative of two experiments (a,b) or three experiments (c; average and s.e.m.).
npg
© 2
015
Nat
ure
Am
eric
a, In
c. A
ll rig
hts
rese
rved
.

nature immunology VOLUME 16 NUMBER 7 JULY 2015 713
A rt i c l e s
regulator Bcl-11A) was specific for pDCs (Supplementary Fig. 4d). The Id2 locus had superenhancer activity in both CD24+ cDCs and CD172a+ cDCs (Supplementary Fig. 4d). In summary, the region +32 kb from the Irf8 TSS bound Batf3, IRF8 and p300 and was within an Irf8 superenhancer.
We assessed the activity of several of the genomic regions described above, through the use of retroviral reporters in DCs derived from culture with Flt3L41–43. The Irf8 minimal promoter, either alone or in cis with the region −26 kb from the Irf8 TSS, was inactive in all DC subsets (Fig. 6b and Supplementary Fig. 5a–d). The element −16 kb from the Irf8 TSS and a previously identified PU.1-binding element at −50 kb from the Irf8 TSS44 were generally active in all DC subsets, remained active in Batf3−/− pDCs and had slightly more activity in Batf3−/− CD172a+ cDCs than in wild-type CD172a+ cDCs (Supplementary Fig. 5b,c), perhaps reflective of an original com-mitment of some of these cells to the CD24+ lineage. In contrast, the element +32 kb from the Irf8 TSS was active specifically in CD24+ cDCs but not in CD172a+ cDCs or pDCs and was less active in the few remaining Batf3−/− CD24+ cDCs than in wild-type CD24+ cDCs (Fig. 6b and Supplementary Fig. 5a–c). Conversely, the element +41 kb from the Irf8 TSS was active specifically in pDCs,
not in CD24+ DCs, and remained active in Batf3−/− pDCs (Fig. 6b and Supplementary Fig. 5a–c). Through the use of de novo motif discovery, we identified AICE motifs in Batf3-binding peaks (Supplementary Fig. 6a) that were present four times within the element +32 kb from the Irf8 TSS25,26 (Supplementary Fig. 6b–e). Of the four AICE motifs in the element +32 kb from the Irf8 TSS, AICE sites 1 and 2 were the most highly conserved between mouse and human (Supplementary Fig. 6d,e). Thus, Batf3-dependent auto-activation of Irf8 in CD24+ cDCs may operate at an element +32 kb from the Irf8 TSS, within an Irf8 superenhancer.
IRF8 expression becomes dependent on Batf3Next we sought to determine which stage of CD24+ cDC development required Batf3. Pre-CD8 DCs appeared at a similar frequency in the BM of Batf3−/− mice and wild-type mice (Fig. 7a) but were about 40% lower in frequency in the blood and spleen of Batf3−/− mice than in that of wild-type mice (Fig. 7a,b). The amount of IRF8 protein was similar in Batf3−/− BM pre-CD8 DCs and wild-type BM pre-CD8 DCs (Fig. 7c,d). However, Batf3−/− pre-CD8 DCs in blood and spleen had lower levels of IRF8 than that of their wild-type counterparts (Fig. 7c,d).
Exp
ress
ion
(log 2
)
4
12
4
12
4
12
Ifi205Id2Bcl6
CiitaBatf3
MybTfecErg
Nr4a1 (Nur77)
Nr4a2Egr2, Egr3
Nr4a3
Sox4Zeb2
Atf3, AhrZfp366, Zfp36l1Bhlhe40Skil
g
Irf8 Irf4
Cbfb Spib
Cbl Spic
Runx1 Batf3
Tcf4 Zbtb46
Sfpi1 Id2
Tcf3 Ciita
Irf2 Klf2
Runx2 Klf3
Tcf12 Atf3
Klf4 Batf
Runx3 Nfil3
Ly6c2 Xcr1
Sell Cd8a
Ccr2 Ly6d
Flt3 Il7r
Csf1r Itgax
Bst2 Siglech
Kit Itgam
Sirpa
Csf3r
Csf2ra
Csf2rb2
Csf2rb
CDPPre
-CD8
DC
CD24+ cD
C
Pre-C
D4 DC
CD172a
+ cDC
CDPPre
-CD8
DC
CD24+ cD
C
Pre-C
D4 DC
CD172a
+ cDC
CDPPre
-CD8
DC
CD24+ cD
C
Pre-C
D4 DC
CD172a
+ cDC
CDPPre
-CD8
DC
CD24+ cD
C
Pre-C
D4 DC
CD172a
+ cDC
h i
0.4 13.8
Expression (log2)
a
b
−150 0 150
PC1 (54%)
−150
0
150
PC
2 (2
0%)
CD24+
cDC
CD172a+
cDC
Pre-CD8DC
CDP
Pre-CD4DC
−150 0 150
PC2 (20%)
−150
0
150
PC
3 (1
5%)
Pre-CD8 DC
CD24+ cDC
Pre-CD4 DCCD172a+
cDC
CDP
0.4 13.8
Expression (log2)
Pre-C
D8 DC
CD24+ cD
C
Pre-C
D4 DC
CD172a
+ cDC
CDPPre
-CD8
DC
Pre-C
D4 DC
e f
(IV) Mpo
(III)Cd34Sox4Ctsg
(II)ItgaxSlamf7H2-Aa
(Ia)Batf3Id2Tlr3
(Ib)Irf4
(VII) H2-Eb1
(III)Ly6c2Ccr2
(II)Nr4a3Ccr7Cd80
(Ia)Il1r2Ptgs2Clec4a1
(Ib)Xcr1
(IV)MybMpoCtsg
(V) Clec4b1(VI) Clec4a4−8 −4 0 4 8
Expression ratio (log2)pre-CD8 DC/CDP
Nr4a3Cd81
Dntt
H2-Aa
MpoCtsg
Ly6c2
−8
0
8
−4
4
Exp
ress
ion
ratio
(lo
g 2)
CD
24+ c
DC
/pre
-CD
8 D
C
−8 −4 0 4 8Expression ratio (log2)
pre-CD4 DC/CDP
Ly6c2
Nr4a3
Cd81
Ctsg,Mpo
DnttCd7
H2-Aa
−8
0
8
−4
4
Exp
ress
ion
ratio
(lo
g 2)
CD
172a
+ c
DC
/pre
-CD
4 D
C
c
d
CDP CD24+cDC
Pre-CD8 DC
Figure 5 Pre-CD8 DCs represent a development stage distinct from that of CDPs and mature CD24+ cDCs. (a,b) Principal-component analysis of various populations (labels adjacent to symbols) showing segregation by developmental stage (PC1) and by lineage (PC2 and PC3). Numbers in parentheses (along axes) indicate proportion of variance explained by that component. (c,d) Pairwise comparisons of gene expression in committed progenitors versus CDPs (horizontal axes) and in mature cDCs versus their committed progenitors (vertical axes); each symbol indicates an individual probe set. (e,f) Hierarchical clustering of genes with a difference in expression of at least eightfold in the committed progenitors relative to their expression in CDPs (e) or the corresponding mature cDC subsets (f); roman numerals (right margin) identify major clusters. (g) Expression of all transcription factor–encoding genes with a difference in expression of at least eightfold in CDPs relative to that in CD24+ cDCs. (h,i) Expression of transcription factor–encoding genes (h) or cell surface marker–encoding genes (i) in various populations (above heat maps). Data are representative of two experiments (results averaged from biological triplicates (CDPs and CD24+ cDCs) or biological duplicates (all other samples)).
npg
© 2
015
Nat
ure
Am
eric
a, In
c. A
ll rig
hts
rese
rved
.

714 VOLUME 16 NUMBER 7 JULY 2015 nature immunology
A rt i c l e s
To determine the eventual fate of pre-CD8 DCs in Batf3−/− mice, we monitored the differentiation of wild-type and Batf3−/− CDPs, pre-CD8 DCs and pre-CD4 DCs over 5 d of culture with Flt3L. As expected, wild-type CDPs produced both CD24+ and CD172a+ cDCs, and wild-type and Batf3−/− pre-CD4 DCs produced exclusively CD172a+ DCs (Fig. 7e,f). Wild-type and Batf3−/− pre-CD8 DCs initially expressed CD24 in the BM (Fig. 4b), but Batf3−/− pre-CD8 DCs pro-gressively downregulated CD24 expression and gained CD172a expression (Fig. 7e,f). Batf3−/− pre-CD8 DCs initially had abundant IRF8 expression, but this rapidly decreased to the amount expressed by wild-type CD172a+ DCs (Fig. 7g,h).
Similarly, wild-type BM pre-CD4 DCs had heterogeneous IRF8 expression, with 38% exhibiting high IRF8 expression (Supplementary Fig. 7a), in agreement with the abundant transcription of Irf8 in pre-CD4 DCs (Fig. 5h). However, IRF8 expression was lost by day 1 during culture of pre-CD4 DCs with Flt3L (Supplementary Fig. 7b). The low Batf3 expression by pre-CD4 DCs (Fig. 5h) and the instability of IRF8 expression in pre-CD4 DCs were consistent with a requirement for Batf3 in maintaining IRF8 expression in cDCs. In summary, these results suggested that pre-CD8 DCs were specified normally in Batf3−/− mice but converted to the CD172a+ cDC lineage because they failed to maintain IRF8 expression.
Transgenic IRF8 overexpression bypasses Batf3 dependenceThe transgenic Irf8VENUS reporter carries three copies of a phage artificial chromosome containing a 130-kb Irf8 genomic region harboring a cas-sette containing an internal ribosome entry site and sequence encoding the yellow fluorescent protein VENUS within the Irf8 3′ untranslated region44; this results in five Irf8 loci that each contain all of the recognized regulatory elements. VENUS expression reproduces the expected IRF8
expression in mature wild-type DC subsets44 but has not been exam-ined in Batf3−/− mice. Batf3+/+Irf8VENUS+ mice developed splenic DC subsets normally, although CD24+ cDCs in those mice showed slightly higher expression of CD24 than that of CD24+ cDCs in wild-type (Batf3+/
+Irf8VENUS−) mice (Fig. 8a), and Batf3+/+Irf8VENUS+ mice showed high VENUS expression in CD24+ cDCs and pDCs and low VENUS expres-sion in CD172a+ cDCs (Supplementary Fig. 8). Thus, the development of wild-type CD24+ cDCs was not affected by increased IRF8. Unexpectedly, Batf3−/−Irf8VENUS+ mice showed normal splenic CD24+ cDC develop-ment, whereas Batf3−/−Irf8VENUS− mice had diminished splenic CD24+ cDC development, as expected (Fig. 8a). The residual CD24+ cDCs in Batf3−/− mice had lower IRF8 expression than did those from wild-type mice, as before (Fig. 2b); however, CD24+ cDCs in Batf3−/−Irf8VENUS+ mice maintained their IRF8 expression (Fig. 8b,c). These results showed that higher expression of IRF8 protein in Batf3−/−Irf8VENUS+ mice bypassed the requirement for Batf3 in the autoactivation of Irf8.
a160
40
20
70
35
160
70
35
40
20
70
35
Batf3
IRF8
p300
H3K27ac
H3K4me1
Batf3
p300
H3K27ac
H3K4me1
IRF8
p300
H3K27ac
H3K4me1
CD
24+
cD
Cs
CD
172a
+ c
DC
spD
Cs
Irf8
CD24+ cDC super enhancer
pDC super enhancer
–26 kb –16 kb +32 kb +41 kb
50 kbmm9
0
0
0
0
0
0
0
20
0
0
0
0
0
0
Reporter (iMFI)CD24+ cDC
Rep
orte
r (iM
FI ×
102 )
pDC
0 200 400 600 0 200 400 600 0 200 400 6000
5
10
15
0
5
10
15
0
5
10
15
No enh–26 kb
b–50 kb–16 kb
Reporter (iMFI)CD24+ cDC
Reporter (iMFI)CD24+ cDC
Rep
orte
r (iM
FI ×
102 )
pDC
s
WT Batf3–/–WT Batf3–/–WT Batf3–/–
+32 kb+41 kb
Rep
orte
r (iM
FI ×
102 )
pDC
s
Figure 6 A Batf3-dependent Irf8 enhancer functions selectively in CD24+ cDCs. (a) ChIP-Seq analysis of Batf3, IRF8, p300, H3K27ac and H3K4me1 (left margin) in CD24+ cDCs, CD172a+ cDCs and pDCs purified by sorting; outlined areas at −26 kb, −16 kb, +32 kb and +41 kb (relative to the Irf8 TSS) indicate regions assessed for enhancer activity; gray shading below indicates superenhancers (the PU.1-binding element at −50 kb relative to the Irf8 TSS44 is not presented here). mm9, NCBI37/mm9 assembly of the mouse genome. (b) Reporter activity in BM that underwent enrichment for cells expressing CD117, which were then transduced with retroviral reporter constructs containing no enhancer (No enh) or various enhancer elements (key) identified in a and cultured for 7 d with Flt3L; results are presented as integrated MFI (iMFI). Each symbol represents an individual replicate (duplicates for pDCs and CD24+ cDCs; as gated in Supplementary Fig. 5c,d). Data are representative of one experiment per binding or occupying factor (a) or two experiments with two biological replicates per reporter (b).
npg
© 2
015
Nat
ure
Am
eric
a, In
c. A
ll rig
hts
rese
rved
.

nature immunology VOLUME 16 NUMBER 7 JULY 2015 715
A rt i c l e s
These actions of Irf8VENUS on pre-CD8 DCs were apparent in BM as well. MHCIIint BM pre-CD8 DCs matured normally into MHCIIhiIRF8+ cDCs (Fig. 8d). In contrast, Batf3−/− pre-CD8
DCs lost IRF8 as they matured and acquired expression of MHC class II (Fig. 8d). However, this loss of IRF8 was reversed in Batf3−/−Irf8VENUS+ mice (Fig. 8e,f). In summary, the usual
Pre
-CD
8 D
Cs
(%)
Batf3–/–WT
WT
Batf3–/–
WT
Batf3–/–
CD172a
CD
24
1.2
7.2 1.3
0.5
1 91
89
9718
47
7.9
13
2.5
0.5
1.9
1.5
0.1
0.4
WT Batf3–/– WT Batf3–/– WT Batf3–/–
CDP Pre-CD8 Pre-CD4
IRF
8 (g
MF
I × 1
02 ) 30
20
10
Batf3–/–WT
BM Blood Spleen
Day 1
Day 3
Day 5
BM Blood Spleen
CD
117
a b
c d
e
0
CD24
BM Blood Spleen
*NS
* **NS
20
15
10
5
0
Time (d)
CD
24+ c
ells
(%
)
f
1 3 5
25
50
75
100
0
* * *
Batf3–/–WT
IRF8
BM Blood Spleen
969
1,506
1,038
2,780 2,264
833
15
13
16
10
1051041030
105
104
103
0
1008060
2040
0% o
f max
105
104
103
0
1051041030
Batf3–/–WT
h 10
4
2
6
8
0IRF
8 ex
pres
sion
(AU
)
*
*
IRF8
g1008060
2040
0
Eve
nts
(% o
f max
)
10510410301051041030
9.5
11
WT Batf3–/–
3,703 921
Figure 7 Specified pre-CD8 DCs are diverted to the CD172a+ lineage in the absence of Batf3. (a) Flow cytometry of pre-cDCs in the BM (n = 7 mice per genotype), blood (n = 5 mice per genotype) and spleen (n = 6 mice per genotype) of wild-type and Batf3−/− mice. Numbers adjacent to outlined areas indicate percent CD117int–loCD24+ pre-CD8 DCs. (b) Frequency of pre-CD8 DCs in a. (c) Flow cytometry analyzing IRF8 expression in pre-CD8 DCs from BM (n = 7 mice per genotype), blood (n = 5 mice per genotype) and spleen (n = 6 mice per genotype) of wild-type and Batf3−/− mice (solid lines); shaded curves, background IRF8 in CD24− cDCs of each tissue. Numbers in top right corners indicate geometric MFI of IRF8 expression. (d) Geometric MFI (gMFI) of IRF8 in pre-CD8 DCs from c. (e) Flow cytometry analyzing the development of CD24+ cDCs (gated cells) and CD172a+ cDCs (ungated cells) from CDPs, pre-CD8 DCs and pre-CD4 DCs obtained from wild-type or Batf3−/− mice (n = 4 samples from four mice per genotype) and cultured for 1, 3 and 5 d with Flt3L and CD45.1+ BM cells. Numbers above outlined areas indicate percent CD24+CD172a− cells. (f) Frequency of CD24+ cDCs among the cells in e (n = 4 samples from four mice per genotype). (g) Flow cytometry analyzing the expression of IRF8 in pre-CD8 DCs (solid lines) obtained from wild-type and Batf3−/− mice (n = 4 samples from four mice per genotype) and cultured for 5 d with Flt3L; shaded curves CD172a+ cDCs developed from wild-type CDPs after 5 d. (h) IRF8 expression in the cells in g, in arbitrary units (AU). NS, not significant (P > 0.05); *P < 0.05 and **P < 0.01 (unpaired t-test (b, and BM and spleen in c), unpaired t-test with Welch’s correction (blood in c) or Mann-Whitney test (f,h)). Data are representative of three experiments (a–d; average and s.e.m. in b,d) or four experiments (e), four experiments (f–h; average and s.e.m. in f,h).
Batf3+/+
Batf3–/–
b26
61
6.2
Irf8VENUS–
18
70
19
68
Irf8VENUS+
CD172a
80
CD11c
Lin– Flt3+
Irf8VENUS–
4
17
MH
CII
IRF8
Batf3+/+
Batf3–/–
20
15
10
5
0IRF
8lo c
ells
(%
)
c
d e f
3.6
3.6
****
a
Batf3–/–
Batf3+/+
CD
24
105
104
103
0
105
104
103
0
105
104
103
0
105
104
103
0
105
104
103
0
1051041030
1051041030 1051041030 10510410301051041030
1051041030
CD24+ CD172a+
Irf8–/–Irf8VENUS–Irf8VENUS+
IRF8
Eve
nts
(% o
f max
)
100
8060
2040
0
CD
117
Batf3+/+
Batf3–/–
CD11c
CD
117
Lin– Flt3+
1.4
4.1
MH
CII
IRF8
3.5
2.9
Irf8VENUS+
25
201510
0CD
24+ c
ells
(%
)
5
*
Batf3+/+ Irf8VENUS–
Batf3+/+ Irf8VENUS+
Batf3–/– Irf8VENUS–
Batf3–/– Irf8VENUS+
Batf3+/+ Irf8VENUS–
Batf3+/+ Irf8VENUS+
Batf3–/– Irf8VENUS–
Batf3–/– Irf8VENUS+
Figure 8 Transgenic overexpression of IRF8 bypasses the Batf3 requirement in CD8α+ cDC development. (a) Flow cytometry analyzing the frequency of CD24+ cDCs and CD172a+ cDCs among splenocytes from wild-type (Batf3+/+Irf8VENUS−), Batf3+/+Irf8VENUS+, Batf3−/−Irf8VENUS− and Batf3−/−Irf8VENUS+ mice. Numbers adjacent to outlined areas indicate percent CD24+CD172a− cells (top left) or CD24int–negCD172a+ cells (bottom right). (b) Flow cytometry analyzing the expression of IRF8 in CD24+ and CD172a+ cDCs in a; shaded curves, background IRF8 staining in Irf8−/− splenocytes. (c) Frequency of CD24+ cDCs among all cDCs (genotypes (key) as in a; n = 7–8 mice per genotype). (d,e) Flow cytometry analyzing the expression of IRF8 and MHC class II in Lin−Flt3+CD117int BM cells from the mice in a (n = 6 mice per genotype); lineage markers include CD19, B220, CD3, NK1.1, CD105 and TER-119. (f) Frequency of MHCIIhiIRF8lo cells among Lin−Flt3+CD117int BM cells from the mice in a. *P < 0.05 and **P < 0.001 (one-way ANOVA with Tukey’s post-hoc test). Data are representative of five experiments with six to eight mice per genotype (a), three experiments (b,d–f; average and s.e.m. of n = 6 mice per genotype in f) or five experiments (c; average and s.e.m. of n = 7–8 mice per genotype).
npg
© 2
015
Nat
ure
Am
eric
a, In
c. A
ll rig
hts
rese
rved
.

716 VOLUME 16 NUMBER 7 JULY 2015 nature immunology
A rt i c l e s
requirement for Batf3 in the autoactivation of Irf8 could be bypassed by increasing the number of copies of endogenous Irf8 loci.
DISCUSSIONOur study has extended the understanding of DC development by identifying committed clonogenic precursors of CD24+ cDCs and CD172a+ cDCs, which represent the CD8α+ cDC lineage and CD4+ cDC lineage, respectively. These findings were made possible by the use of Zbtb46GFP reporter mice, in which Zbtb46-GFP+ BM progenitors are committed to cDC fates and exclude pDC potential37. In pub-lished articles, pre-cDC populations were not defined on the basis of CD117 expression35 but contained both CD117int cells and CD117neg cells. We showed that CD117 expression among Zbtb46-GFP+ pre-cDCs could be used to distinguish clonogenic progenitors of CD8α+ cDCs and CD4+ cDCs that were CD117int and CD117−, respectively. The CD117− fraction of pre-cDCs lacked the potential to develop into CD24+ DCs; however, it had heterogeneous expression of CD115. While CD117−CD115+ pre-cDCs were mostly Zbtb46-GFP+ and developed exclusively into CD172a+ cDCs, CD117−CD115− pre-cDCs were mostly Zbtb46-GFP− and retained potential to develop into either pDCs or CD172a+ cDCs, consistent with a report indicating a bias of CD115− progenitors toward the pDC fate36. An exclusive progenitor of pDCs has not been defined45.
Transcriptional autoactivation circuits can stabilize lineage-fate ‘decisions’30. As an example, autoactivation of the gene encoding the transcription factor GATA-3 stabilizes the development of TH2 cells31. Autoactivation of Irf8 has been suggested before19,34 but has not been examined during DC development, to our knowledge. A published study has shown that a PU.1-dependent enhancer at −50 kb from the Irf8 TSS initially drives Irf8 expression in MDPs44. We found that the increase in IRF8 expression in CDPs was sensitive to the R294C substitution of IRF8 that influences the interaction of IRF8 with PU.1 as well as with IRF2 and SpiB17,46,47. This extends the role of PU.1 to also include the autoactivation of Irf8 in early BM progenitors.
We found that commitment, but not specification, to the CD24+ cDC lineage was Batf3 dependent. Batf3 expression was induced during specification in wild-type pre-CD8 DCs, along with Id2 expres-sion, and Batf3 was needed to sustain autoactivation of Irf8. Without Batf3, IRF8 expression decayed in the progeny of pre-CD8 DCs, which then did not commit to the CD24+ cDC lineage but diverted toward the CD172a+ cDC lineage. Further studies are needed to determine the transcription factors involved in the specification of pre-CD8 and pre-CD4 DCs.
The normal loss of IRF8 in the CD172a+ DC lineage could also be explained as a lack of Batf3-dependent autoactivation of Irf8. The pre-CD4 DCs had heterogeneous expression of IRF8 but did not yet express Batf3. This indicated that commitment to CD172a+ cDCs occurred before complete loss of IRF8 and suggested that Irf8 tran-scription decayed at this stage, as in Batf3−/− pre-CD8 DCs, because of the lack of Batf3. Thus, the delay in Batf3 expression, and possibly in Id2 expression, in pre-CD4 DCs relative to that in pre-CD8 DCs might explain the differential IRF8 expression in the lineages. Conceivably, the E3 ligase Cbl, which can promote degradation of IRF8 protein48, might regulate differential IRF8 expression; however, since Cbl is uni-formly expressed across all stages, this seems unlikely. Competition with IRF4 is also a possible mechanism. However, IRF4 did not have abundant expression in pre-CD4 cDCs.
Notably, while CD24+ cDCs required Batf3 for sustained Irf8 expression, pDCs did not. The Irf8 locus has the characteristics of a superenhancer in both CD24+ cDCs and pDCs39,40 but uses different enhancer elements in those two lineages. An element +32 kb from
the Irf8 TSS bound IRF8, Batf3 and p300 and had enhancer activity exclusively in CD24+ cDCs, while an element +41 kb from the Irf8 TSS bound IRF8 and p300, but not Batf3, and functioned in pDCs.
Batf and Batf2 can compensate for Batf3 in CD24+ cDC devel-opment during infection25. However, this does not explain residual CD8α+CD103+ cDCs observed in uninfected Batf3−/− mice7, which nonetheless are impaired in several pathogen models in vivo7,8,28,49. Here we found that the residual CD24+ cDCs in Batf3−/− mice had heterogeneous IRF8 expression as it underwent transcriptional decay and were probably non-functional. The maintenance of IRF8 expres-sion in Batf3−/− mice restored splenic CD24+ cDC development, but whether all the functions of cells are restored, as well as whether they depend on Batf3, will require further study.
METHODSMethods and any associated references are available in the online version of the paper.
Accession codes. GEO: microarray data, GSE66565; ChIP-Seq data, GSE53311 (Fig. 1) and GSE66899 (Fig. 6).
Note: Any Supplementary Information and Source Data files are available in the online version of the paper.
ACKNoWLEDGMENTSWe thank the Alvin J. Siteman Cancer Center at Washington University School of Medicine for use of the Center for Biomedical Informatics and Multiplex Gene Analysis Genechip Core Facility. Supported by the Howard Hughes Medical Institute, the US National Institutes of Health (1F31CA189491-01 to G.E.G.-R. and K08AI106953 to M.H.), the American Heart Association (12PRE12050419 to W.K.), and the National Cancer Institute (P30 CA91842; for support of the Alvin J. Siteman Cancer Center).
AUTHoR CoNTRIBUTIoNSG.E.G.-R., T.L.M. and K.M.M. designed the study; G.E.G.-R., A.I., J.A., R.T. and T.L.M. performed experiments related to cell sorting, retroviral infection, culture and flow cytometry, with advice from N.M.K., C.G.B., V.D., P.B. and M.H.; W.K. performed experiments related to antibody generation and Irf8 ChIP-Seq; A.I. performed and analyzed ChIP-Seq experiments; G.E.G.-R. performed microarray experiments with advice from and analysis by X.W. and C.G.B.; J.S. and F.R. provided Irf8VENUS mice and advice; and G.E.G.-R., X.W., T.L.M. and K.M.M. wrote the manuscript with contributions from all authors.
CoMPETING FINANCIAL INTERESTSThe authors declare no competing financial interests.
reprints and permissions information is available online at http://www.nature.com/reprints/index.html.
1. Satpathy, A.T. et al. Re(de)fining the dendritic cell lineage. Nat. Immunol. 13, 1145–1154 (2012).
2. Cervantes-Barragan, L. et al. Plasmacytoid dendritic cells control T-cell response to chronic viral infection. Proc. Natl. Acad. Sci. USA 109, 3012–3017 (2012).
3. Reizis, B. et al. Plasmacytoid dendritic cells: recent progress and open questions. Annu. Rev. Immunol. 29, 163–183 (2011).
4. Vremec, D. et al. CD4 and CD8 expression by dendritic cell subtypes in mouse thymus and spleen. J. Immunol. 164, 2978–2986 (2000).
5. Aliberti, J. et al. Essential role for ICSBP in the in vivo development of murine CD8α+ dendritic cells. Blood 101, 305–310 (2003).
6. Tamura, T. et al. IFN regulatory factor-4 and -8 govern dendritic cell subset development and their functional diversity. J. Immunol. 174, 2573–2581 (2005).
7. Hildner, K. et al. Batf3 deficiency reveals a critical role for CD8α+ dendritic cells in cytotoxic T cell immunity. Science 322, 1097–1100 (2008).
8. Torti, N. et al. Batf3 transcription factor-dependent DC subsets in murine CMV infection: differential impact on T-cell priming and memory inflation. Eur. J. Immunol. 41, 2612–2618 (2011).
9. Persson, E.K. et al. IRF4 Transcription-factor-dependent CD103+CD11b+ dendritic cells drive hucosal T helper 17 cell differentiation. Immunity 38, 958–969 (2013).
10. Gao, Y. et al. Control of T helper 2 responses by transcription factor IRF4-dependent dendritic cells. Immunity 39, 722–732 (2013).
npg
© 2
015
Nat
ure
Am
eric
a, In
c. A
ll rig
hts
rese
rved
.

nature immunology VOLUME 16 NUMBER 7 JULY 2015 717
A rt i c l e s
11. Schlitzer, A. et al. IRF4 Transcription factor-dependent CD11b+ dendritic cells in human and mouse control mucosal IL-17 cytokine responses. Immunity 38, 970–983 (2013).
12. Merad, M. & Ginhoux, F. Dendritic cell genealogy: a new stem or just another branch? Nat. Immunol. 8, 1199–1201 (2007).
13. Onai, N. et al. Identification of clonogenic common Flt3+ M-CSFR+ plasmacytoid and conventional dendritic cell progenitors in mouse bone marrow. Nat. Immunol. 8, 1207–1216 (2007).
14. Naik, S.H. et al. Development of plasmacytoid and conventional dendritic cell subtypes from single precursor cells derived in vitro and in vivo. Nat. Immunol. 8, 1217–1226 (2007).
15. Schiavoni, G. et al. ICSBP is essential for the development of mouse type I interferon-producing cells and for the generation and activation of CD8α+ dendritic cells. J. Exp. Med. 196, 1415–1425 (2002).
16. Suzuki, S. et al. Critical roles of interferon regulatory factor 4 in CD11bhighCD8α– dendritic cell development. Proc. Natl. Acad. Sci. USA 101, 8981–8986 (2004).
17. Tailor, P. et al. The BXH2 mutation in IRF8 differentially impairs dendritic cell subset development in the mouse. Blood 111, 1942–1945 (2008).
18. Kantakamalakul, W. et al. Regulation of IFN consensus sequence binding protein expression in murine macrophages. J. Immunol. 162, 7417–7425 (1999).
19. Bornstein, C. et al. A negative feedback loop of transcription factors specifies alternative dendritic cell chromatin States. Mol. Cell 56, 749–762 (2014).
20. Vander, L.B. et al. Transcriptional programming of dendritic cells for enhanced MHC class II antigen presentation. Nat. Immunol. 15, 161–167 (2014).
21. Hacker, C. et al. Transcriptional profiling identifies Id2 function in dendritic cell development. Nat. Immunol. 4, 380–386 (2003).
22. Spits, H. et al. Id2 and Id3 inhibit development of CD34+ stem cells into predendritic cell (pre-DC)2 but not into pre-DC1. Evidence for a lymphoid origin of pre-DC2. J. Exp. Med. 192, 1775–1784 (2000).
23. Li, H.S. et al. The signal transducers STAT5 and STAT3 control expression of Id2 and E2–2 during dendritic cell development. Blood 120, 4363–4373 (2012).
24. Ghosh, H.S. et al. ETO family protein Mtg16 regulates the balance of dendritic cell subsets by repressing Id2. J. Exp. Med. 211, 1623–1635 (2014).
25. Tussiwand, R. et al. Compensatory dendritic cell development mediated by BATF-IRF interactions. Nature 490, 502–507 (2012).
26. Glasmacher, E. et al. A genomic regulatory element that directs assembly and function of immune-specific AP-1-IRF complexes. Science 338, 975–980 (2012).
27. Edelson, B.T. et al. Peripheral CD103+ dendritic cells form a unified subset developmentally related to CD8α+ conventional dendritic cells. J. Exp. Med. 207, 823–836 (2010).
28. Mashayekhi, M. et al. CD8α+ dendritic cells are the critical source of interleukin-12 that controls acute infection by Toxoplasma gondii tachyzoites. Immunity 35, 249–259 (2011).
29. Medvedovic, J. et al. Pax5: a master regulator of B cell development and leukemogenesis. Adv. Immunol. 111, 179–206 (2011).
30. Veraksa, A., Del Campo, M. & McGinnis, W. Developmental patterning genes and their conserved functions: from model organisms to humans. Mol. Genet. Metab. 69, 85–100 (2000).
31. Ouyang, W. et al. Stat6-independent GATA-3 autoactivation directs IL-4-independent Th2 development and commitment. Immunity 12, 27–37 (2000).
32. Boyer, L.A. et al. Core transcriptional regulatory circuitry in human embryonic stem cells. Cell 122, 947–956 (2005).
33. Fogg, D.K. et al. A clonogenic bone marrow progenitor specific for macrophages and dendritic cells. Science 311, 83–87 (2006).
34. Wang, H. et al. A reporter mouse reveals lineage-specific and heterogeneous expression of IRF8 during lymphoid and myeloid cell differentiation. J. Immunol. 193, 1766–1777 (2014).
35. Liu, K. et al. In vivo analysis of dendritic cell development and homeostasis. Science 324, 392–397 (2009).
36. Onai, N. et al. A clonogenic progenitor with prominent plasmacytoid dendritic cell developmental potential. Immunity 38, 943–957 (2013).
37. Satpathy, A.T. et al. Zbtb46 expression distinguishes classical dendritic cells and their committed progenitors from other immune lineages. J. Exp. Med. 209, 1135–1152 (2012).
38. Naik, S.H. et al. Intrasplenic steady-state dendritic cell precursors that are distinct from monocytes. Nat. Immunol. 7, 663–671 (2006).
39. Whyte, W.A. et al. Master transcription factors and mediator establish super-enhancers at key cell identity genes. Cell 153, 307–319 (2013).
40. Hnisz, D. et al. Super-enhancers in the control of cell identity and disease. Cell 155, 934–947 (2013).
41. Zhu, H. et al. Unexpected characteristics of the IFN-γ reporters in nontransformed T cells. J. Immunol. 167, 855–865 (2001).
42. Schraml, B.U. et al. The AP-1 transcription factor Batf controls TH17 differentiation. Nature 460, 405–409 (2009).
43. Ise, W. et al. The transcription factor BATF controls the global regulators of class-switch recombination in both B cells and T cells. Nat. Immunol. 12, 536–543 (2011).
44. Schönheit, J. et al. PU.1 level-directed chromatin structure remodeling at the Irf8 gene drives dendritic cell commitment. Cell Rep. 3, 1617–1628 (2013).
45. Reizis, B. et al. Plasmacytoid dendritic cells: one-trick ponies or workhorses of the immune system? Nat. Rev. Immunol. 11, 558–565 (2011).
46. Ichikawa, E. et al. Defective development of splenic and epidermal CD4+ dendritic cells in mice deficient for IFN regulatory factor-2. Proc. Natl. Acad. Sci. USA 101, 3909–3914 (2004).
47. Nagasawa, M. et al. Development of human plasmacytoid dendritic cells depends on the combined action of the basic helix-loop-helix factor E2–2 and the Ets factor Spi-B. Eur. J. Immunol. 38, 2389–2400 (2008).
48. Xiong, H. et al. Ubiquitin-dependent degradation of interferon regulatory factor-8 mediated by Cbl down-regulates interleukin-12 expression. J. Biol. Chem. 280, 23531–23539 (2005).
49. Edelson, B.T. et al. CD8α+ dendritic cells are an obligate cellular entry point for productive infection by Listeria monocytogenes. Immunity 35, 236–248 (2011).
npg
© 2
015
Nat
ure
Am
eric
a, In
c. A
ll rig
hts
rese
rved
.

nature immunology doi:10.1038/ni.3197
ONLINE METHODSMice. Zbtb46GFP/+ mice had deletion of the neomycin-resistance cassette and were N8 and N9 backcrosses from 129S6/SvEvTac to C57BL/6J. Fully back-crossed C57BL/6J Zbtb46GFP mice were deposited at The Jackson Laboratory (stock number JR27618). Batf3−/− and Irf8VENUS mice have been described7,44. Irf8−/− mice were generated by crossing of Irf8f/f mice (B6(Cg)-Irf8tm1.1Hm/J; The Jackson Laboratory) with CMV-Cre mice (B6.C-Tg(CMV-cre)1Cgn/J). Irf8+/− mice were obtained by crossing of Irf8−/− mice to wild-type C57BL/6J mice.
Irf4−/− mice were generated by crossing of Irf4f/f mice (B6.129S1-Irf4tm1Rdf/J; The Jackson Laboratory) first to CMV-Cre mice (B6.C-Tg(CMV-cre)1Cgn/J) and then to CMV-Flp1 mice (B6.129S4-Gt(ROSA)26Sortm1(FLP1)Dym/JRainJ). BXH2/TyJ mice were from The Jackson Laboratory. All mice were maintained on the C57BL/6J background and were maintained in a specific pathogen–free animal facility following institutional guidelines and with protocols approved by the Animal Studies Committee at Washington University in St. Louis. Experiments were performed with mice 8–12 weeks of age, with sex-matched littermates.
Antibodies and flow cytometry. Cells were kept at 4 °C while being staining in a solution of 0.5% BSA and 2 mM EDTA in PBS in the presence of antibody for the blockade of CD16/32 (2.4G2; BD).
The following antibodies were from BD: Brilliant Violet 711–anti-CD45.1 (A20), Brilliant Ultraviolet 395–anti-CD117 (2B8), allophycocyanin–PE-CF594–anti-CD135 (A2F10.1), V500–Brilliant Violet 421–Brilliant Violet 510–anti-MHCII (M5/114.15.2), Brilliant Ultraviolet 496–anti-CD24 (M1/69), Brilliant Violet 421–anti-CD127 (SB/199), phycoerythrin (PE)–anti-CD45RA (14.8), and Brilliant Violet 42–anti-CD19 1(1D3). The following antibodies were from eBioscience: PE–indotricarbocyanine (Cy7)–anti-CD117 (2B8), eFluor 450–allophycocyanin–anti-CD317 (eBio927), PE–anti-CD115 (AFS98), allophycocyanin–eFluor 780–anti-CD11c (N418), eFluor 450–anti-MHCII (M5/114/15/2), PE-Cy7–anti-CD24 (M1/69), allophycocyanin–peridinin chlorophyll protein (PerCP)–eFluor 710–anti-CD172a (P84), PerCP–eFluor 710–anti-Siglec-H (eBio440C), eFluor 450–anti-Ter119 (Ter119), eFluor 450–anti-CD105 (MJ7/18), PerCP–eFluor 710–anti-IRF8 (V3GYWCH), eFluor 450–anti-CD45R (RA3-6B2), eFluor 450–anti-NK1.1 (PK136), eFluor 450–anti-CD3 (17A2), and PE–anti-IRF4 (3E4). The following antibodies were from Tonbo Biosciences: PE-Cy7–anti-CD45.1 (A20), PE–anti-CD115 (AFS98), and allophycocyanin-Cy7–anti-CD11c (N418). The following antibodies were from BioLegend: Brilliant Violet 71 –anti-CD115 (ASF98), Alexa Fluor 488–anti-CD45.1 (A20) and allophycocyanin–anti-Flag (DYKDDDDK) (L5).
The lineage cell–depletion kit was from Miltenyi. Cells were analyzed on a FACSCanto II or FACSAria Fusion flow cytometer (BD), and data were analyzed with FlowJo software (TreeStar).
Isolation and culture of BM progenitor cells and splenic DCs. BM was har-vested from the pelvis, tibia and femurs, which were ground with a mortar and pestle, in PBS supplemented with 0.5% BSA and 2 mM EDTA, then was passed through a 70-µm strainer, and red blood cells were lysed with ammo-nium chloride–potassium bicarbonate lysis buffer. For some experiments, BM was purified on a Histopaque-119 gradient (Sigma-Aldrich) before culture or sorting. Gates used to define the MDPs, CDPs and pre-cDCs were based on published studies13,35. BM was treated with lineage-depletion beads (Miltenyi) before being sorted. MDPs were identified as Lin−CD117hiCD135+CD115+ BM cells; CDPs, as Lin−CD117intCD135+CD115+CD11c−MHCII− BM cells; pre-CD8 DCs, as Lin−CD135+CD117intSiglec-H−CD11c+MHCIIint BM cells; and pre-CD4 DCs, as Lin−CD135+CD117loCD115+CD11c+MHCII− BM cells. The lineage markers (‘Lin’) included CD19, B220, CD3, NK1.1, CD105 and TER-119 or other markers as stated in figure legends. Blood and spleen pre-cDCs were sorted as Lin−MHCIIint–negCD172int–negCD11c+CD135+ cells. The lineage markers for blood and spleen included CD19, B220, CD3, NK1.1 and TER-119. A FACSAria Fusion was used for sorting of cells in into IMDM plus 10% FCS (complete IMDM) with 100 ng/ml Flt3L. For the preparation of DCs, spleens were minced and then were stirred for 30 min at 37 °C in 5 ml of complete IMDM with 30 U/ml DNase I (Sigma-Aldrich) and 250 µg/ml col-lagenase B (Roche). For removal of debris, cells were passed through a 70-µm strainer before red blood cells were lysed with ammonium chloride–potassium
bicarbonate lysis buffer. For experiments that included culture with Flt3L50, sorted cells (3 × 10³ to 6 × 10³ cells per 200 µl complete IMDM) were cultured for 1–5 d at 37 °C in 100 ng/ml Flt3L (PeproTech).
Expression microarray analysis. RNA was extracted with an RNAqueous-Micro Kit (Ambion), then was amplified with the Ovation Pico WTA Sytem (NuGEN) and hybridized to GeneChip Mouse Gene 2.0 ST microarrays (Affymetrix). Fragmentation was performed with the NuGen Encore biotin module, and samples were hybridized for 18 h at 45 °C in a GeneChip Hybridization Oven 640. Data were normalized by robust multiarray average summarization and under-went quartile normalization with ArrayStar software (DNASTAR). Principal-component analysis (Supplementary Table 2) was computed by singular value decomposition without additional centering or scaling after samples were grouped by replicate and the mean log-transformed expression values from each group was imported into R, mean-centered by gene, root-mean-square–scaled by sample and transposed. Unsupervised hierarchical clustering of differentially expressed genes was computed with ArrayStar (DNASTAR) with the Euclidean distance metric and centroid linkage method.
Retroviral analysis. Retroviral vectors were transfected into Phoenix-E cells as described25 and viral supernatants were collected 2 d later. BM cells were infected with supernatants of transfected packaging cells, concentrated by centrifugation51 with 2 µg/ml polybrene by ‘spin infection’ at 1,800 r.p.m. for 45 min. Infected cells were cultured in Flt3L as described25.
Genomic enhancer elements were cloned into a retroviral reporter (hCD4 pA GFP RV)41–43 (primers, Supplementary Table 1). For analysis, we used integrated MFI, which combines the metrics of frequency and MFI as a measure of total functional response52,53.
Generation of Batf3-specific rabbit polyclonal antibody. Mouse Batf3 cDNA generated by RT-PCR from CD8α+ cDCs was cloned into plasmid pET-28a(+) (Novagen) downstream of sequence encoding the histidine tag, and protein was generated in Escherichia coli BL21-CodonPlus(DE3)-RIL cells (Stratagene). Recombinant Batf3 was expressed for 12 h at 22 °C and purified on Ni-NTA His·Bind Resin (Novagen), and was used to immunize New Zealand White Rabbits (Harlan Laboratories). Anti-Batf3 was affinity purified54.
ChIP. ChIP was performed as described54 with minor modifications. CD24+ and CD172a+ cDCs and pDCs from Flt3L-treated BM cultures of wild-type mice were purified by being sorted on day 9. For ChIP analysis of p300, sorted cells were incubated for 2 h in fresh medium with Flt3L before crosslinking. For ChIP analysis of IRF8, Batf3, H3K27ac and H3K4me1, cells underwent crosslinking before being sorted. For crosslinking, cells were incubated for 10 min at 37 °C with 1% formaldehyde (for ChIP analysis of p300) or for 8 min at room temperature with 1% formaldehyde (for ChIP analysis of IRF8, Batf3, H3K27ac and H3K4me1), then reactions were quenched with 1.25 M glycine and cells were washed twice with PBS, then pellets were ‘flash frozen’ for storage at −80 °C. Chromatin was sonicated at 4 °C in sonication buffer (10 mM Tris-HCl, pH 8, 100 mM NaCl, 1 mM EDTA, 0.5 mM EGTA, 0.1% sodium deoxycholate and 0.5% N-lauroylsarcosine) for 36 cycles (p300) or 22 cycles (IRF8, Batf3, H3K27ac, and H3K4me1) of 20 s on and 50 s off per cycle with a Vivra-Cell VCX130PB and CV188 (Sonics & Material) to obtain DNA fragments from 140 bp to 500 bp. Chromatin was immunoprecipitated overnight at 4 °C with Dynabeads Protein A or G (Invitrogen) that had been pre-incubated with 1–6 µg of the appropriate antibody: anti-p300 (sc-585X; Santa Cruz Biotechnology), anti-IRF8 (sc-6058x; Santa Cruz Biotechnology), anti-Batf3 (described above), anti-H3K27ac (Ab 4729; Abcam) or H3K4me1 (Ab 8895; Abcam). Beads containing protein-DNA complexes were washed seven times with RIPA buffer (50 mM HEPES, pH 7.5, 500 mM LiCl, 1 mM EDTA, 1% NP-40 and 0.7% sodium deoxycholate) and Tris-EDTA plus 50 mM NaCl. DNA fragments were eluted, and crosslinking was reversed by incubation for 6 h at 65 °C in 50 mM Tris-HCl, pH 8.0, 10 mM EDTA and 1% SDS with 1 mg/ml proteinase K (New England BioLabs). DNA was purified by phenol-chloroform extraction followed by ethanol precipitation. Libraries for ChIP-seq were prepared with a ThruPLEX-FD kit (Rubicon Genomics) and were sequenced with an Illumina HiSeq 2500 as single ‘reads’ extending 50 bases.
npg
© 2
015
Nat
ure
Am
eric
a, In
c. A
ll rig
hts
rese
rved
.

nature immunologydoi:10.1038/ni.3197
Computational analysis. ChIP-Seq data sets were aligned to the mouse genome (NCBI37/mm9 assembly) by Bowtie software (version 1.0.1)55 with the follow-ing parameters: --sam --best -p 4 -m 1 --chunkmbs 4000. Uniquely mapped reads were masked with the Samtools storage format56 with blacklist of the ENCODE Project57 and the RepeatMasker program (which screens for inter-spersed repeats and low complexity) in the UCSC Genome Browser. ‘Reads’ for Batf3 and IRF8 ranged from 6274983 to 9234602; for p300, from 9745561 to 11293164; for H3K4me1, from 6599991 to 8402016; and for H3K27ac, from 8065509 to 11950695. Data were visualized with the ‘makeUCSCfile’ program of the Homer software package with default parameters58.
Peaks were identified with MACS software, version 1.4.2 (‘model-based analysis for ChIP-Seq’)59 with a P value of 1 × 10⁻⁹. For motif analysis, we selected the 1,000 peaks with the lowest P values, extracted 150 bp centered on the summit for each peak, and performed motif analysis with MEME software60. The occurrence of AICE motifs in the element +32 kb relative to the TSS was found with FIMO motif-identification program60 at a P-value threshold of 1 × 10⁻³ with the AICE position weight matrix obtained for the Batf3 peaks of CD24+ DCs.
Superenhancer analysis. Superenhancers were identified as described39,61 by the ROSE algorithm (‘rank ordering of super enhancers’) with a ‘stitching’ distance of 12,500 bp and a promoter-exclusion zone of ± 2,500 bp around the TSS. ROSE ranked all enhancers by increasing ChIP-seq occupancy of H3K27ac by subtraction of total background and plotted the ChIP-seq occu-pancy of H3K27ac with subtraction of total background. Superenhancers were identified by an inflection point of H3K27ac signal versus enhancer rank61. Superenhancers were assigned to the genes whose TSS was the nearest from the center of the superenhancer and that had an H3K27ac peak within ± 1 kb of the TSS.
Statistical analysis. Statistical analyses were performed with Prism (GraphPad Software). All t-tests were performed on samples that passed a normality test
and showed no statistical difference in their variance. Unpaired t-tests on sam-ples that had unequal variances, as shown by an F-test, were performed with Welch’s correction. All one-way ANOVA tests were performed on samples that passed a normality test and showed no statistical difference in their standard deviation as shown by a Brown-Forsythe test. Samples that could not be tested for normality were analyzed with a Mann-Whitney U-test.
50. Naik, S.H. et al. Cutting edge: generation of splenic CD8+ and CD8– dendritic cell equivalents in Fms-like tyrosine kinase 3 ligand bone marrow cultures. J. Immunol. 174, 6592–6597 (2005).
51. Kanbe, E. & Zhang, D.E. A simple and quick method to concentrate MSCV retrovirus. Blood Cells Mol. Dis. 33, 64–67 (2004).
52. Shooshtari, P. et al. Correlation analysis of intracellular and secreted cytokines via the generalized integrated mean fluorescence intensity. Cytometry A 77, 873–880 (2010).
53. Darrah, P.A. et al. Multifunctional TH1 cells define a correlate of vaccine-mediated protection against Leishmania major. Nat. Med. 13, 843–850 (2007).
54. KC, W, et al. L-Myc expression by dendritic cells is required for optimal T-cell priming. Nature 507, 243–247 (2014).
55. Langmead, B. et al. Ultrafast and memory-efficient alignment of short DNA sequences to the human genome. Genome Biol. 10, R25 (2009).
56. Li, H. et al. The Sequence Alignment/Map format and SAMtools. Bioinformatics 25, 2078–2079 (2009).
57. ENCODE Project Consortium. An integrated encyclopedia of DNA elements in the human genome. Nature 489, 57–74 (2012).
58. Heinz, S. et al. Simple combinations of lineage-determining transcription factors prime cis-regulatory elements required for macrophage and B cell identities. Mol. Cell 38, 576–589 (2010).
59. Zhang, Y. et al. Model-based analysis of ChIP-Seq (MACS). Genome Biol. 9, R137 (2008).
60. Bailey, T.L. et al. MEME SUITE: tools for motif discovery and searching. Nucleic Acids Res. 37, W202–W208 (2009).
61. Lovén, J. et al. Selective inhibition of tumor oncogenes by disruption of super-enhancers. Cell 153, 320–334 (2013).
npg
© 2
015
Nat
ure
Am
eric
a, In
c. A
ll rig
hts
rese
rved
.
Copyright © 2022 FDOKUMEN