Basic Needs Analysis - The CALP Network
65
Guidance and Toolbox for the Basic Needs Analysis Version 2 (unedited) October 2017 Funded by European Union Humanitarian Aid
-
Upload
khangminh22 -
Category
Documents
-
view
1 -
download
0
Transcript of Basic Needs Analysis - The CALP Network

Guidance and Toolbox for the Basic Needs Analysis
Version 2 (unedited) October 2017
Funded by European Union Humanitarian Aid
Acknowledgments The Guidance has been developed with the precious advice from a multi-agency Peer Review Group, which has been involved since the drafting of the product specifications, throughout the revision of the version preceding this document. The Peer Review Group, to which the authors and Save the Children are extremely thankful, is composed of: Leonie Tax (ACAPS); Cecile Barriere (ACF-US); Fay Mahdi (British Red Cross); Nick Nichol (British Red Cross); Azim Noorani (British Red Cross); Ruth McCormack (CaLP); Louisa Seferis (DRC); Marianne Tinlot (ECHO); Daniele Barelli (FAO); Maria Oca Rojo (FAO); Neil Marsland (FAO); Ruco van der Merwe (Food For Peace); John Lamm from (Food For Peace); Marina Angeloni (gFSC); Jake Zarins (Habitat for Humanity); Margarita Ledo (IFRC); Rosie Jackson (Independent Consultant); Emmanuel Ufot (IRC Nigeria); Lama Chamaa (Lebanese Red Cross); Rebecca Vo (Mercy Corps); Herbert Tatham (CASS at OCHA); Laura Meissner (OFDA); Jessica Saulle (SCUK); Michaelle Tauson (SCUK); Silvia Paruzzolo (SCUS); Hanna Mattinen (UNHCR); Kaleem ur Rehman (UNHCR); Shelley Gornall (UNHCR) Malick Ndiaye (WFP Nigeria); Bile Khalif (WFP Nigeria); Susanna Sandstrom (WFP). The field test in Borno State (Nigeria) has been conducted in collaboration with WFP and Plan International. Data has been collected by enumerators from WFP, Plan International, and a local survey firm, ICAS. The project has been managed by Francesca Battistin, ERC-MPG Consortium lead, with the support of Hannah Hames, ERC-MPG Consortium Coordinator, and has been made possible thanks to funding from the ECHO ERC budget and Save the Children UK.
Preface This document is the final draft of the Basic Needs Analysis (BNA) Guidance, commissioned by Save the Children within the broader framework of the Consortium for the uptake of quality, collaborative multipurpose grants (MPGs). The MPG Consortium if funded by European Commission Humanitarian Aid (ECHO) - through its Enhanced Response Capacity (ERC) budget line (hereinafter, it will be referred to as the ERC-MPG Consortium). It is led by Save the Children and formed of the Cash Learning Partnership (CaLP), the Danish Refugee Council (DRC), Mercy Corps, and the United Nations Office for the Coordination of Humanitarian Affairs (OCHA). The Consortium’s work builds on the MPG Operational Guidance & Toolkit produced in 2015 by a UNHCR-led and ERC-funded project. This version of the BNA Guidance is the result of a multi-staged development process involving: two previous unpublished drafts, which were revised by an inter-agency Peer Review Group; one field test in Borno State (Nigeria), carried out in May-June 2017; and a subsequent, final review of the pilot version based on Peer Review Group’s comments. This version will be tested in one region of Ethiopia between November 2017 and January 2018. The BNA Guidance has been developed by Okular-Analytics, with the technical support and supervision from Save the Children UK, through a highly consultative process involving many experts from a wide range of agencies and groups, at the global and the country level. The variety of actors that were brought into the process was intended to ensure that the Guidance would be cross-sectoral, that it would not duplicate previous efforts, and that it would draw from the wealth of experience and knowledge of experts from different disciplines, including cash transfer programming.
3
Save the Children UK will own the Guidance until the release of its first edition, by the end of the ERC-MPG Consortium. Afterwards, the Guidance will be handed over to ECHO and/or other entity/platform, as appropriate, based on forthcoming global-level discussions around its uptake. Organisations interested in using this first edition of the Guidance are encouraged to contact the project manager, Francesca Battistin at Save the Children UK ([email protected]). Disclaimer: This Guidance has not been professionally edited. An edited version of the document will be released in May 2018, following a final revision based on the second and last pilot of the ERC-MPG Consortium, in Ethiopia.
Acronyms Acronym Description BNA Basic Needs Assessment or Analysis CaLP Cash Learning Partnership CBI Cash Based Interventions CTP Cash Transfer Programming DRC Danish Refugee Council ECHO European Commission Humanitarian Aid ERC Enhanced Response Capacity FAO Food and Agriculture Organisation FSP Financial Service Provider GCCG Global Cluster Coordination Group HCT Humanitarian Country Team HPC Humanitarian Programme Cycle ICWG Inter-cluster Working Group ISWG Inter-sector Working Group MPG Multipurpose Grant MSMA Multi-sector Market Assessment ROAP Response Options Analysis and Planning UNHCR United Nations High Commissioner for Refugees SDA Secondary Data Analysis

4
UN OCHA United Nations Office for the Coordination of Humanitarian Affairs WFP World Food Programme

5
Table of Contents Acknowledgments ................................................................................................................................... 2 Preface .................................................................................................................................................... 2 Acronyms ................................................................................................................................................ 3 Table of Contents .................................................................................................................................... 5 CHAPTER 1: INTRODUCTION TO THE GUIDANCE .................................................................................... 6
I. What it is ..................................................................................................................................... 6 II. Why the BNA guidance ............................................................................................................... 6 III. Who should use it ................................................................................................................... 7 IV. For what it is to be used .......................................................................................................... 7 V. When and where it is appropriate to use ................................................................................... 8 VI. What is the structure of this guidance .................................................................................... 9
CHAPTER 2: OVERVIEW OF THE BNA APPROACH ................................................................................. 10 I. The BNA within the Humanitarian Programme Cycle ............................................................... 10 II. How the BNA links with other assessments ............................................................................. 13 III. Key concepts and definitions ................................................................................................ 14 IV. The BNA and ROAP Analysis Framework .............................................................................. 20 V. Roles and Responsibilities ......................................................................................................... 25 VI. Overview of BNA activities .................................................................................................... 26
CHAPTER 3: IMPLEMENTING THE BNA ................................................................................................. 28 I. Design and planning of the BNA ............................................................................................... 28 II. Primary data collection ............................................................................................................. 32 III. BNA Analysis ......................................................................................................................... 37
Data preparation – Engage and discover ...................................................................................... 40 Descriptive analysis – Summarize and compare ........................................................................... 49 Explanatory analysis – Connect and relate ................................................................................... 50 Interpretive analysis – Imply and conclude .................................................................................. 52
IV. Communication and dissemination ...................................................................................... 55 Annexes ................................................................................................................................................. 58
Annex 1 – Questionnaires ................................................................................................................. 58

6
CHAPTER 1: INTRODUCTION TO THE GUIDANCE I. What it is The Basic Needs Analysis (BNA) is a multi-sector needs analysis approach that can be applied in both sudden onset and protracted emergencies. The methodology comprises the Guidance (this document) presenting the conceptual BNA framework and related processes, and a Toolbox, which includes tools, templates, training materials, and examples drawn from its first pilot, in Borno State(Nigeria). The BNA is conceived to go hand in hand with the Facilitator’s Guide for the Response Options Analysis and Planning (a separate document), as it is part of a broader response planning process (see The BNA within the ). It shall be carried out with other assessments on the operational environment and would not add any value if undertaken in isolation. The BNA was inspired by and is complementary to the Operational Guidance and Toolkit for Multipurpose Cash Grants released in 2015. However, since the BNA gives way to the selection of a broader range of response modalities than only the cash-based ones, its application is wider than MPG programmes. Supposedly, the selection of MPG as a response modality would be the result of an evidence-based response planning process, that has been informed by needs and operational environment assessments. The approach took inspiration from ECHO’s Basic Needs Framework for Integrated Response.
II. Why the BNA guidance At the heart of this approach there are three of the Grand Bargain goals1 that have been agreed by the sector’s biggest donors and providers. These key goals are to:
increase the use and collaboration of cash-based programming (goal 3) improve joint and impartial needs assessments (goal 5) create a participation revolution that includes people receiving aid in making the decisions that affect their lives (goal 6).
There is currently no agreed-upon methodology that allows humanitarian actors from different sectors to jointly assess humanitarian needs, in a way to understand their underlying causes and allow affected populations to express their perspective around priorities and assistance modalities. The MIRA is a multi-sectoral needs assessment tool but it does not collect the necessary information to establish if cash based interventions are a suitable response option, alone or in combination with other modalities. This is a major impediment to designing CTP that are integrated into broader responses. A basic needs approach that focuses on beneficiaries’ perspectives is necessary because affected people are not passive recipients of aid: they are actors that make decisions, prioritise their needs, and routinely interact with markets or (public/semi-public) service providers to satisfy them. While the market (available goods and services including financial service providers) plays a key function in people’s ability to meet their basic needs an overreliance on sector specific market data when 1 The Grand Bargain. Available at: http://www.agendaforhumanity.org/initiatives/3861

7
designing response programmes can lead to responses that do not optimally meet the needs of beneficiaries across the full spectrum of needs. A basic understanding of affected households’ perspectives on these matters allows for triangulation and validation of information, resulting in selection of assistance modalities that genuinely “put people in the centre”.
III. Who should use it The intended users of the Guidance and the associated Toolbox are groups of humanitarian organisations within affected countries who engage into multi-sectoral coordinated assessments (joint or harmonized) and intend to make their basic needs and response analysis more transparent, people-centred, and inclusive of multiple modalities and/or mixes of them. More specifically, there would be two categories of users: The Humanitarian Country Team (HCT), at the inter-agency level, or the decision makers within a
humanitarian organisation, in charge of triggering a multi-sector needs assessment. This would be carried out in-house, in collaboration with other organisations, or commissioned to a third party (e.g. a specialised assessment organisation). These users would be mostly interested in the second chapter of the Guidance, which describes the approach, the process, the roles and responsibilities, and the analytical framework.
Needs assessment specialists within humanitarian organisations and specialised assessment agencies. They will have to be familiar with the entire document and able to use the associated Toolbox. They will most likely take the role of assessment coordinator, and be in charge of designing and leading the assessment, and training others on how to effectively participate in it.
IV. For what it is to be used The BNA Guide and Toolbox provide inter-sector processes, tools and templates to design and lead secondary and primary data analysis of affected groups’ needs in the aftermath of a sudden shock or . The BNA is designed to inform – in conjunction with other assessments - both strategic and programmatic decision making and planning, including policies and goal settings, programme selection, delivery methods, targeting and conditionality, etc. within a specific geographical area where distinct population groups (affected groups, livelihood groups, urban or rural population, etc.) are affected in different ways by a given hazard. More specifically, the BNA is expected to inform the following key decisions:
8
Figure 1: Types of decisions to be informed by the BNA, in conjunction with complementary assessments The BNA builds on an analytical framework that guides the systematic collection, organization and analysis of secondary and primary data; allows the identification of unmet basic needs, key priorities and consequently the selection of the most appropriate and proportionate response options. What the BNA can deliver: Identification of the most severe and pressing unmet basic needs, affected areas, and groups, based on
current and forecasted humanitarian outcomes and the needs as perceived by the affected population Understanding of main drivers and underlying factors of humanitarian outcomes Information to inform and support the design and planning of subsequent more in-depth assessments and
analysis which are often more detailed, operational and sector specific What the BNA is not covering: A selection of most appropriate and proportionate response options and delivery mechanisms Information to directly inform the design of specific and localized humanitarian interventions A substitute for detailed or in-depth sectoral assessment.
V. When and where it is appropriate to use The BNA can be adapted for use in both sudden onset and protracted crises. In sudden onset disasters, the approach and tools can be adapted to reflect the situation prior to
the shock and after, provide insight on the impact and outcomes of the disaster and inform subsequent sector/cluster assessments. With adequate preparedness and facilitation, the process can be implemented in the first weeks of the crisis and provide with results for the second phase of the emergency (one month onward) in order to inform emergency programs or feed into a revised Flash Appeal.
• Geographical areas the most severely hit by the emergency• Population groups that are the most deprived of basic goods and services as a result of the shock
Which geographic areas and population groups are the most in need of assistance?
• by household composition • by type of impact suffered• by the household’s situation in the emergency
The composition of the minimum basket of assistance which needs to be addressed• Main commodity markets• Service systems (public and private)• Labour markets• House stocks
What are the crititcal markets and systems of service provision?• Cash transfers • In-kind • Service provision• A mix of the above
Which of the needs can be best addressed through which (mix of) assistance modality?• Unconditional & unrestricted Cash (MPG)• Conditional & unrestricted Cash• Unconditional & restricted Cash (vouchers)• Conditional & restricted Cash
If Cash transfers, what Cash modality?
• By household size• By cost of basket If Cash transfers, what amount?
9
In protracted crises, the approach can be used to inform key documents, e.g. annual plan, Humanitarian Needs Overview, etc. or at regular intervals to monitor any changes in the situation, identify trends over time and trigger in-depth and/or sector specific assessments, e.g. services assessments, market analysis, cash feasibility assessments, etc. For example, the BNA could be carried out during a prolonged ceasefire or in preparation for a change in conditions (such as dry season) when an opportunity for a sustained response will be available.
Similarly to other needs assessment approaches, the BNA is best applied when a few key conditions are in place and verified. The BNA is most appropriate when a specific event triggers an emergency that is new or sudden and significant in nature and generates a confirmed or potential humanitarian impact, followed by a period of relative stability and allowing humanitarian actors to carry out response activities and more detailed assessments. Box 1 details the criteria organisations or other relevant stakeholders should consider in determining whether a BNA is the appropriate tool for a context. Box 1 criteria for successful BNA Stability: No significant and sudden deterioration of conditions is expected in the program implementation
period (3-6 month at least) No significant additional population movements anticipated Safe and sustainable access to the majority of the affected population Gaps in information: Need for new information to support strategic joint planning, e.g. NGO consortiums, HCT, etc. No or limited detailed cluster/sector or agency assessments available No cross-sector analysis available Joint or harmonized: Humanitarian organisations willing to engage in joint analysis and planning process Humanitarian organisations willing to share information for joint secondary data analysis Humanitarian organisations willing to contribute resources for joint primary data collection
VI. What is the structure of this guidance This Guidance is structured in three chapters: the Introduction to the Guidance; the Overview of the BNA Approach; and the Implementation of the BNA. Chapter 1, the “Introduction to the Guidance”, introduces the user to the document, in general terms. It provides an overview of the rationale that led to its development. It defines its purpose and scope; it indicates where, when and by whom it should be used; and in conjunction with what other methodologies Chapter 2, the “Overview of the BNA Approach”, allows the readers to situate the BNA in the broader Humanitarian Programme Cycle and, more specifically, within the Response Analysis and Planning Process. It clarifies that the BNA would not add much value if conducted in isolation, and points out at what other assessments should be undertaken to feed into the response analysis process. This chapter introduces the key concepts and terminology that will be used across the

10
document. It explains how the process unfolds, describing the roles and responsibilities along its steps, as well as the types of competencies that need to be mobilised for a successful assessment. Chapter 3, the “Implementation of the BNA”, is the “how to” section of this document. It provides step-by-step guidance on how to: design and plan the BNA, and analyse secondary data ahead of primary data collection; collect primary BNA data; analyse the findings; and communicate and disseminate them for their successful uptake. The Toolbox, instead, contains data collection tools, templates, training materials, and examples drawn from its first pilot, in Borno State (Nigeria). The Toolbox is available at [link to be provided].
CHAPTER 2: OVERVIEW OF THE BNA APPROACH I. The BNA within the Humanitarian Programme Cycle
The BNA is intended to be part of the Humanitarian Programme Cycle. Ultimately, the BNA is meant to inform the response analysis process, but it is not in itself sufficient to do so. It must be conducted together with other, complementary assessments focusing on the operational environment where the response is being planned. While those assessments provide information that is used to establish the operational feasibility of different response options, the BNA generates information around the priority groups and needs that the response should address, as well as around the most suitable types of interventions considering the objectives to be attained. Suitability to the objectives and operational feasibility are two complementary dimensions against which response options will be compared. The BNA is the first building block of a three-phased process that includes the situation analysis (needs and operational environment), response analysis and response planning (see Error! Reference source not found.). The success of the exercise will depend on having appropriately contextualized and adapted the BNA, possibly ahead of the crisis, when this is predictable. The steps are designed to precede the implementation of the response and subsequent monitoring and evaluation (which are not covered in this guidance).
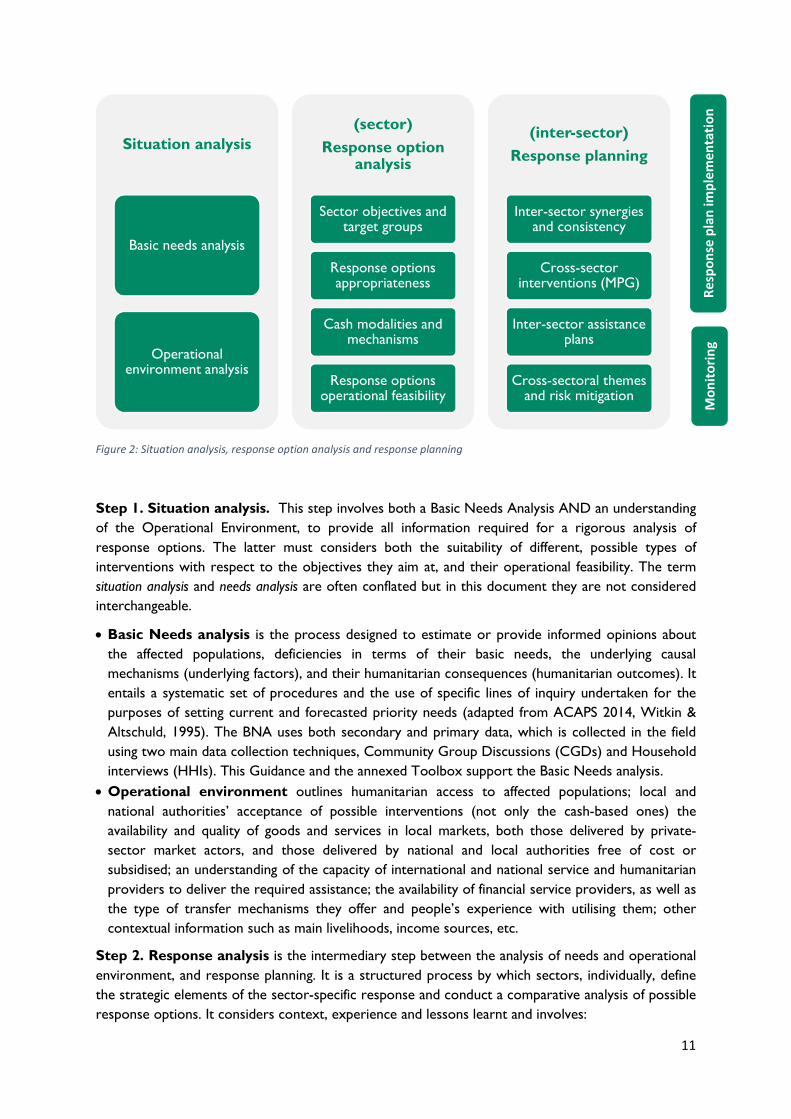
11
Figure 2: Situation analysis, response option analysis and response planning Step 1. Situation analysis. This step involves both a Basic Needs Analysis AND an understanding of the Operational Environment, to provide all information required for a rigorous analysis of response options. The latter must considers both the suitability of different, possible types of interventions with respect to the objectives they aim at, and their operational feasibility. The term situation analysis and needs analysis are often conflated but in this document they are not considered interchangeable. Basic Needs analysis is the process designed to estimate or provide informed opinions about
the affected populations, deficiencies in terms of their basic needs, the underlying causal mechanisms (underlying factors), and their humanitarian consequences (humanitarian outcomes). It entails a systematic set of procedures and the use of specific lines of inquiry undertaken for the purposes of setting current and forecasted priority needs (adapted from ACAPS 2014, Witkin & Altschuld, 1995). The BNA uses both secondary and primary data, which is collected in the field using two main data collection techniques, Community Group Discussions (CGDs) and Household interviews (HHIs). This Guidance and the annexed Toolbox support the Basic Needs analysis.
Operational environment outlines humanitarian access to affected populations; local and national authorities’ acceptance of possible interventions (not only the cash-based ones) the availability and quality of goods and services in local markets, both those delivered by private-sector market actors, and those delivered by national and local authorities free of cost or subsidised; an understanding of the capacity of international and national service and humanitarian providers to deliver the required assistance; the availability of financial service providers, as well as the type of transfer mechanisms they offer and people’s experience with utilising them; other contextual information such as main livelihoods, income sources, etc.
Step 2. Response analysis is the intermediary step between the analysis of needs and operational environment, and response planning. It is a structured process by which sectors, individually, define the strategic elements of the sector-specific response and conduct a comparative analysis of possible response options. It considers context, experience and lessons learnt and involves:
Situation analysis
Basic needs analysis
Operational environment analysis
(sector)Response option analysisSector objectives and target groups
Response options appropriatenessCash modalities and mechanismsResponse options operational feasibility
(inter-sector)Response planning
Inter-sector synergies and consistencyCross-sector interventions (MPG)
Inter-sector assistance plansCross-sectoral themes and risk mitigation
Respon
se plan
imple
menta
tion
Monito
ring

12
The identification of objectives and targets groups. Targeting is the process by which areas and populations are selected to receive assistance. It includes mechanisms and criteria to define target groups, to identify members of the target populations, to ensure that assistance reaches the intended beneficiaries and meets their needs (Adapted from WFP 2006, Targeting in Emergencies).
The identification and comparison of response options based on the primary and secondary information collected during situation analysis, context, experience and lessons learnt (step 1). The selection of sector-specific response options is informed by considerations of: (1) appropriateness (or suitability to the objective); and (2) acceptance, cost efficiency, technical, contextual feasibility, and risks for the targeted populations, the implementing agency and the context. Therefore, the preferred intervention(s) will simultaneously address the needs prioritised by the affected groups, whilst proving to be operationally feasible and able to minimise potential harmful side-effects (adapted FAO 2011, Maxwell et al 2013). Response analysis is generally conducted in a workshop setting or – ideally - through a series of subsequent workshops, involving a range of key-informants and decision makers. Response options refer to the set of interventions considered to solve a particular problem. For the purpose of this document, response options are categorized as in-kind aid, direct service provision or Cash Based Interventions (CBI), or a combination of these based on the objectives of the response (what the intervention aims to achieve and how it is designed, developed and implemented). a. In kind aid refers to the provision of tangible objects, goods, commodities, products or
materials for immediate use or consumption such as food rations, shelter materials, seeds, tools, kits of household items, etc.
b. Direct service provision refers to intangible processes, activities, outputs or performance provided by individuals or organisations to other people, e.g. medical consultation, price monitoring, water treatment, corpse removal, etc. ILO distinguishes between essential services whose interruption would endanger the life, personal safety or health of the whole or part of the population and fundamental services, forming the necessary base for the functioning of other services and non-vital services whose interruption would result in an acute national crisis endangering the normal living conditions of the population.
c. Cash Based Intervention (CBI) refers to all programs where cash (or vouchers for goods or services) is directly provided to beneficiaries. In the context of humanitarian assistance, the term is used to refer to the provision of cash or vouchers given to individuals, household or community recipients; not to governments or other state actors. This excludes remittances and microfinance in humanitarian interventions (although microfinance and money transfer institutions may be used for the actual delivery of cash). The term can be used interchangeably with Cash Based Transfers and Cash Transfer Programming (CaLP Glossary).
CBIs are defined by the modality, the delivery mechanism, the type of cash transfer, and the transfer value (CaLP 2015): o Modalities (the form of transfer) which can be restricted/unrestricted on the utilization,
and conditional/unconditional. The former are the requirements on use of assistance received: what a transfer can be spent on, or what it is intended the transfer should be spent on, after the beneficiary receives it. The latter are about the pre-requisite/qualifying requirements to receive assistance (activities or obligations that must be fulfilled before receiving assistance)

13
o Delivery mechanisms, which are the means of delivering a cash or voucher transfer: e.g. Direct Cash, E cash, Paper voucher, E- voucher
o Type of cash transfer (what the interventions aim to achieve and how they are designed, developed and implemented): multipurpose, multi-sector or sector specific.
o Transfer value: The amount of cash to transfer. At the response analysis stage, it will already be necessary to define and compare different CBI modalities and transfer mechanisms, as these two dimensions are associated to different programmatic, protection and operational risks, as well as costs for the implementing agency and the recipients of aid. Acceptance by the local and national authorities may also vary across modalities and transfer mechanisms, due to political or security reasons. At this stage, the transfer value will be discussed at the sectoral level, but will be revised in the inter-sector consultations, to consider the cumulative effect of multiple cash transfers and their sequencing.
Step 3. Response Planning is the final step of the process and involves sectors getting together and planning their respective responses in light of other sectors’ plans. This is an inter-sector planning process, whereby sector-specific response options are reviewed to ensure inter-sector synergies, consistency and integration, and that multi-sector interventions - such as MPG programmes – are identified and jointly designed and sequenced. The outcome is an integrated inter-sector response plan, as opposed to a collation of sector plans. This step will provide recommendations to plan programme, activities and practical arrangements for the response, including the sequencing and frequency of transfers (regardless of their nature), the type and amount of sector assistance to be provided, in light of other sectors’ assistance and the cumulative effect that this may have on recipients. If in-kind assistance, the sector will typically confirm the contents of the kit/package to be distributed, the frequency of the transfer, and the duration. If cash based interventions are selected during the response analysis as an appropriate response, stakeholders will have to discuss and decide on the most suitable type of cash transfer (if sector specific or multipurpose, and how to combine different CBI), the transfer value, and the most appropriate timing to deliver it. Finally, cross-sectoral themes such as protection and environmental issues will be analysed and mitigation measures will be proposed, including by adjusting the response plan.
II. How the BNA links with other assessments The BNA builds on and complements other assessment methodologies, such as the Multi Cluster Initial and Rapid Assessment (MIRA) or the Household Economy Approach (HEA). The BNA’s outputs will support the roll-out of a MIRA in sudden-onset emergencies or the Humanitarian Needs Overview in the context of protracted emergencies. In fact, both of them require the identification of immediate humanitarian needs and key humanitarian issues along with a systematic process for determining the severity and ranking of these needs/issues. In addition, the BNA can complement and support the development of a comprehensive Refugee Response Framework through integration with existing refugee assessments and analysis tools. With regard to the HEA, when a baseline is available, the geographic scope and the groups for the BNA sampling can be decided based on the HEA livelihoods zoning findings and the wealth groups. The BNA questionnaire can also be adapted based on the HEA findings, especially when it comes to

14
income sources. Last but not least, the BNA findings can also be triangulated with those of the HEA, in particular with regard to households’ expenditures, sources of income and seasonality of expenditures. It is hoped that the second pilot of the ERC-MPG consortium, which will take place in Ethiopia, will shed more light on the conceptual and practical linkages between BNA and HEA. As explained in the previous section, the BNA is designed to align with, complement and link with other assessments, all of which are brought together to inform the broader response analysis. The BNA should be followed by: An assessment of the markets of goods and services providers offered by private-sector actors.
The selection of the markets will be informed by the findings of the BNA around the critical needs that the affected group(s) generally satisfies by purchasing goods and services, when the lack of purchasing power is one of the primary underlying factors. There are many methodologies supporting market assessments. One of them, that is relatively quick to roll-out while producing good-enough information around the feasibility of CBI at scale, is the UNHCR’s Multi-sector Market Assessment methodology; it can be used to assess both goods and service markets.
The assessment of pharmaceutical markets is particularly complex and challenging to assess, because of the fundamental importance of ensuring affected group(s) get access to safe, quality pharmaceuticals, which is very difficult to assess and control unless a very thorough mapping is conducted. The Health cluster/sector should take all decisions related to these markets.
Health and education systems assessments will provide information on the accessibility (proximity, physical access, entitlement to receive services), availability, and quality of essential services provided by the public sector, for free or at subsidised price. They will also inform whether these systems can sustain an increase in demand, or what would be required to make them able to support increased demand.
Cultural and social factors, as well as the education level of a household, will affect their utilisation of services and goods, their spending behaviour, and – more generally – the importance that they give to different needs and the consequent coping strategies they use to meet some at needs at the expensive of others. The BNA looks at the spending behaviour and coping strategies, which, taken jointly, are fairly good proxies of utilisation of services and goods, especially when these are typically offered by the private sector. However, the BNA does not investigate in-depth the important underlying factors such as health-seeking behaviour, and dedicated assessments should be carried out to provide additional information for specific sectors, such as health.
Operational feasibility assessments which will provide information on acceptance, safety, partners’ capacities, as well as financial service providers and cash transfer mechanisms that are available locally. For CBIs, UNOCHA, WFP, UNICEF, and UNHCR developed specific tools.
III. Key concepts and definitions The concept of basic needs refers to the essential goods, utilities, services or resources required on a regular or seasonal basis by households for ensuring long term survival AND minimum living standards, without resorting to negative coping mechanisms or compromising their health, dignity and essential livelihood assets. This definition is adapted from the Basic Needs Approach (ILO, 1976), one of the most significant approaches to the measurement of absolute poverty, which attempts to define the absolute minimum resources necessary for long-term physical well-being, usually in terms of consumption goods. In this approach, the poverty line is defined as the amount of income required to satisfy those needs. The Basic Needs Approach views poverty as “deprivation of consumption” (inadequate food,

15
nutrition, clean water, education, health, etc.) and was often opposed to the capability approach (CA) in which poverty is seen as “deprivation of opportunities” related to lifestyles and people values: When it is used as an input (consumption) based approach, the Basic Needs Approach fails to connect deprivation with people’s values, aspirations and the result (well-being). The Capability Approach, on the other hand, focuses on capacity development of people rather than how much they consume. The BNA and the accompanying tools consider all aspects of wellbeing: health/survival, dignity and development capacities. Since there is no universal agreement around minimum standards, the list of basic needs will vary from one context to the other and should be adapted to each crisis, through community/focus group discussions or workshops with key stakeholders. An initial list of ten essential items was selected based on a meta-review of existing Minimum Expenditure Baskets and Living Standards. The category “other” allows to include other important items to the list, e.g. protection, agricultural inputs, etc. that respondents consider important for their survival and minimum living standards. Initial list of basic needs Category Items commonly included Food Staple, vegetable, meat, milk, condiments, oil, sugar, salt, etc. Potable water Water, containers, treatment, etc. Shelter Rent, furniture’s, material, repair, etc. Household items Utensils, pots, mats, blanket, mosquito net, cooking set, etc. Sanitation and hygiene Clothing, washing, basic items (soap, toothbrush, pads, diapers, etc.) Education School fee, uniforms, shoes, stationery, books, transport, etc. Healthcare Medicine, healthcare, delivery, baby kit, critical event, etc. Energy Cooking, lighting, charging, heating (kerosene, electricity, firewood,
charcoal, etc.) Transport All except education (transport to work, health centre, markets, etc.) Communication Phone, credit, internet, etc. Others Protection, agricultural inputs, etc. The list can be further broken down between commodities and services for each category, when and if relevant. Sample list of basic needs broken down by services and commodities, Nigeria Pilot, June 2017 Category Commodities and services included Food Food commodities (Staple, vegetable, meat, milk, condiments, oil, sugar, salt,
etc.) Health Health commodities (medicine, drug, baby kit, etc.)

16
Health care services (Health staff and centre, Primary/secondary health care, etc)
Water Potable water (Water, containers, home treatment) Shelter Shelter commodities (furniture’s, material, repair, etc.) Shelter services (rent, purchase) HH items Households commodities (Utensils, pots, mats, blanket, mosquito net,
cooking set, etc.) Hygiene and sanitation Hygiene/sanitation commodities (Clothing, washing, basic items (soap,
toothbrush, pads, diapers, etc.) Hygiene/sanitation facilities/services (toilets, shower, bath, etc.) Energy Energy commodities for heating, cooking, lightning and charging (kerosene,
electricity, firewood, charcoal, etc.) Transport Transport services (All except education (transport to work, health centre,
markets, etc.) Education Education commodities (uniforms, shoes, stationery, books, etc.) Education services (transport, school fees, teachers, school building,
canteen, etc.) Communication Communication commodities (Phone, credits, internet, etc.) Communication services (phone providers, phone towers, internet
network, etc.) Sector Category Frequency Type of expenditure faced by a
household CCCM / shelter / NFI Communication One off Phone, etc.
Recurrent Phone credit, internet bill Energy One off Stove, heater
Recurrent Cooking, lighting, charging, heating. Includes kerosene, electricity, firewood, charcoal, etc. Household items One off The improved NFI kit for north-east Nigeria: Synthetic Mat Blanket Mosquito net Foldable mattress stainless plates stainless cups table spoons kitchen knife serving spoon Solar lamp cooking pots (7”5” litres)
Recurrent Housing and shelter commodities
One off Rent (quarterly or every six months, or every year), furniture, construction materials, permissions, repair, etc.
Recurrent
17
Transport One off Vehicle purchase Recurrent Any other not related directly to other basic needs (fuel and fees)
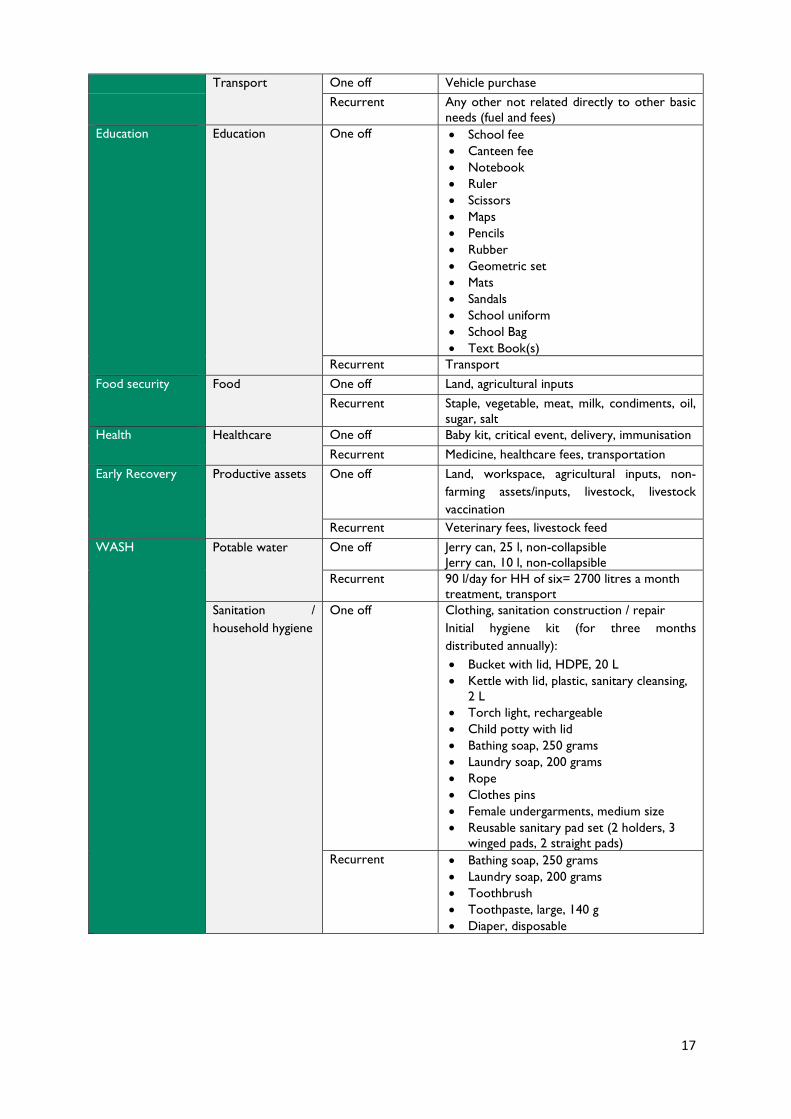
Education Education One off School fee Canteen fee Notebook Ruler Scissors Maps Pencils Rubber Geometric set Mats Sandals School uniform School Bag Text Book(s) Recurrent Transport
Food security Food One off Land, agricultural inputs Recurrent Staple, vegetable, meat, milk, condiments, oil, sugar, salt
Health Healthcare One off Baby kit, critical event, delivery, immunisation Recurrent Medicine, healthcare fees, transportation
Early Recovery Productive assets One off Land, workspace, agricultural inputs, non-farming assets/inputs, livestock, livestock vaccination
Recurrent Veterinary fees, livestock feed WASH Potable water One off Jerry can, 25 l, non-collapsible Jerry can, 10 l, non-collapsible
Recurrent 90 l/day for HH of six= 2700 litres a month treatment, transport Sanitation / household hygiene
One off Clothing, sanitation construction / repair Initial hygiene kit (for three months distributed annually): Bucket with lid, HDPE, 20 L Kettle with lid, plastic, sanitary cleansing, 2 L Torch light, rechargeable Child potty with lid Bathing soap, 250 grams Laundry soap, 200 grams Rope Clothes pins Female undergarments, medium size Reusable sanitary pad set (2 holders, 3 winged pads, 2 straight pads)
Recurrent Bathing soap, 250 grams Laundry soap, 200 grams Toothbrush Toothpaste, large, 140 g Diaper, disposable

18
Minimum Expenditure Basket (MEB) and Survival Minimum Expenditure Basket (SMEB). The Minimum Expenditure Basket entails the identification of basic needs items and the minimum amount of money required for a household to be able to meet them, on a regular or seasonal basis. It is based on the average cost of the items composing the basket, in normal times. MEBs, which can be calculated for various sizes of households, allow users to estimate the expenditures gap as well as the impact suffered by various household groups. The Survival Minimum Expenditure Basket is more restrictive and refers to the minimum amount of money required to meet the basic needs essential to ensure health and survival of the household members. Expenditure and seasonality of goods consumption and service utilization: Consumption and utilization of basic goods and services can vary from one month to the other and may be more or less frequent. Some goods or services, once they have been utilised, have to be repurchased; some others can be reutilised multiple times or have a specific use window. The reference period for expenditures refers to the frequency of expenditures, which reflects the interval at which the commodity or service has to be repurchased. The BNA captured three types of variation from normal monthly expenses: Recurrent expenditures, that repeat over time, as the commodity or service is consumed and
must be repurchased on a regular basis. The most common recurrent expenditures within a household are those for food, water, and hygiene items.
One-off expenditures are non-frequent expenditures, and include seasonal or exceptional costs. o Seasonal costs occur on a regular but non-frequent basis, at specific times of the year.
Examples of seasonal expenditures are education-related expenditures, e.g. school fees, or the purchase of agricultural inputs ahead of the sowing/planting season.
o Exceptional or extraordinary costs are of a varied nature and may also arise from the emergency itself. Examples include the costs related to the repair of a house or purchase of furniture; the medical costs to treat an injury.
Underlying factors and humanitarian outcomes. When a shock/hazard occurs, we generally observe disruption in or of access, quality, availability, awareness or use of goods and services. As a result, the satisfaction or degree of fulfilment of basic needs decreases and the affected population experiences deprivation. This leads to unmet basic needs, the actual difference between a preferred state or condition, and the actual one. This discrepancy might in turn create negative, harmful of undesirable outcomes, e.g. fear, physical or mental conditions, etc. Humanitarian outcomes refer to effects or consequences that
challenge long term survival or minimum living standards of the affected population of forces them to Figure 3: Underlying factors and humanitarian outcomes
19
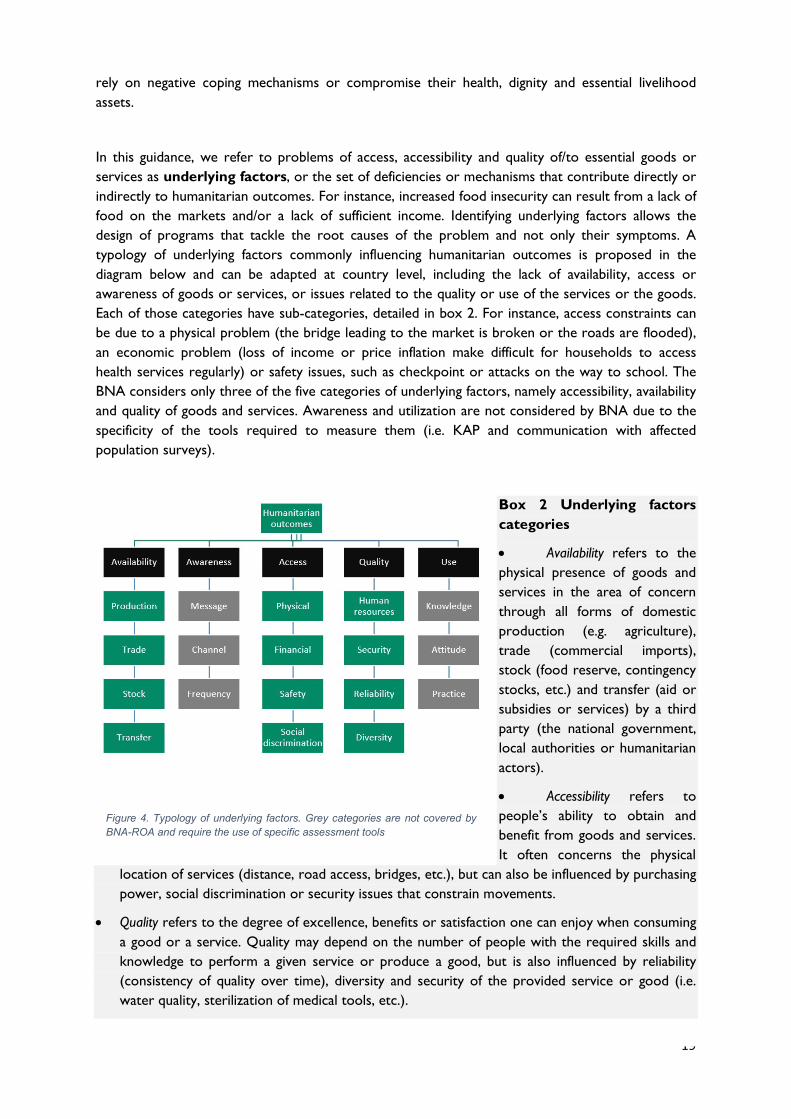
rely on negative coping mechanisms or compromise their health, dignity and essential livelihood assets. In this guidance, we refer to problems of access, accessibility and quality of/to essential goods or services as underlying factors, or the set of deficiencies or mechanisms that contribute directly or indirectly to humanitarian outcomes. For instance, increased food insecurity can result from a lack of food on the markets and/or a lack of sufficient income. Identifying underlying factors allows the design of programs that tackle the root causes of the problem and not only their symptoms. A typology of underlying factors commonly influencing humanitarian outcomes is proposed in the diagram below and can be adapted at country level, including the lack of availability, access or awareness of goods or services, or issues related to the quality or use of the services or the goods. Each of those categories have sub-categories, detailed in box 2. For instance, access constraints can be due to a physical problem (the bridge leading to the market is broken or the roads are flooded), an economic problem (loss of income or price inflation make difficult for households to access health services regularly) or safety issues, such as checkpoint or attacks on the way to school. The BNA considers only three of the five categories of underlying factors, namely accessibility, availability and quality of goods and services. Awareness and utilization are not considered by BNA due to the specificity of the tools required to measure them (i.e. KAP and communication with affected population surveys).
Box 2 Underlying factors categories Availability refers to the physical presence of goods and services in the area of concern through all forms of domestic production (e.g. agriculture), trade (commercial imports), stock (food reserve, contingency stocks, etc.) and transfer (aid or subsidies or services) by a third party (the national government, local authorities or humanitarian actors). Accessibility refers to people’s ability to obtain and benefit from goods and services. It often concerns the physical
location of services (distance, road access, bridges, etc.), but can also be influenced by purchasing power, social discrimination or security issues that constrain movements.
Quality refers to the degree of excellence, benefits or satisfaction one can enjoy when consuming a good or a service. Quality may depend on the number of people with the required skills and knowledge to perform a given service or produce a good, but is also influenced by reliability (consistency of quality over time), diversity and security of the provided service or good (i.e. water quality, sterilization of medical tools, etc.).
Figure 4. Typology of underlying factors. Grey categories are not covered by BNA-ROA and require the use of specific assessment tools
20
Humanitarian outcomes refer to negative consequences, as a result of problem of access, availability or quality of goods or services. Two levels of outcomes can be distinguished, the first focusing on changes in key aspects of life, such as consumption, livelihoods, income, health seeking behaviour, learning, etc. The second and ultimate level of humanitarian outcome refers to physical and mental consequences, such as excess morbidity or mortality, mental health, nutritional status, etc. Not all problems of access, availability or quality of goods and services lead to humanitarian outcomes. Therefore, it is insufficient (and sometimes misleading) to measure issues only at this level, and important to associate or correlate existing deficiencies to confirmed or potential humanitarian outcomes. Understanding cause-effect relationships is central to the BNA and has several advantages: Identify the set of deficiencies or mechanisms that contribute directly or indirectly to
humanitarian outcomes. Understand the causal mechanisms that contribute the most to unmet needs. For instance,
increased food insecurity can be the result of lack of food on the markets and/or lack or insufficient income to purchase it.
Separate causes and effects to allow the design of programs that are relevant and address the root cause(s) of the issue.
When information is not available for one level, then inferences based on information available at a lower level can be used to draw assumptions or hypotheses.
IV. The BNA and ROAP Analysis Framework The BNA and ROAP analysis framework approaches situational and response analysis logically, systematically and provides a clear driving force behind lines of inquiries. Using the framework ensures that situational and response analysis are conducted comprehensively and focus on key information needs, and that key concerns are not overlooked. In addition, the framework: Underpins, support and guides the collection, collation, and analysis of secondary and primary
data by providing with key analytical outputs and how they intersect analytically Provides a way to organize what data to collect and how to analyse it, including how information
intersect analytically Supports a common analysis of where unmet needs have the most severe humanitarian
outcomes, which geographical areas and population groups are a priority for intervention Serves as a communication tool between stakeholders and should be considered as a reference
throughout the needs assessment process. The framework (figure 5 below) groups analytical outputs under two pivotal areas, situation and response analysis. The diagram below describes the themes and analytical outputs. The situation analysis is concerned with the identification of unmet basic needs, humanitarian
outcomes, underlying factors as well as coping mechanisms. The main analytical output of the situation analysis is the identification of the severity of unmet needs, based on degree of deprivation and humanitarian outcomes and finally establish key priorities (basic unmet needs, affected groups, geographical areas).

21
The Response analysis is concerned with the identification of appropriate and relevant response options to the problems identified and allow to strategically plan and design the humanitarian response.
Box 3. Characteristics of the BNA analysis framework The BNA is forward looking and requires understanding current AND forecasted humanitarian
outcomes, to ensure analysis covers the period during which programmes will take place. There is no universal list of basic needs and they will often vary based on context. Similarly, not
all basic needs have the same importance and contribute the same way to living standards. In each context, it will be important to adapt the list of basic needs and define their criticality regarding health/survival, dignity and personal development, using participatory approaches.
The framework helps to identify unmet basic needs with the most significant humanitarian outcomes. Understanding the severity of humanitarian outcomes (degree of harm or undesirable effect) allows the determination of priorities. Priorities are established across basic needs, geographical areas and population groups.
The framework requires an understanding of the monthly household expenditures related to each basic service and good, and the evolution of consumption over time (seasonal, one off or exceptional costs) in the specific context in order to allow for the design of cash based interventions in cases where they are relevant and feasible.

Objectives and
Targets
Situation analysis Response analysis

23
Figure 5. BNA analysis framework
24
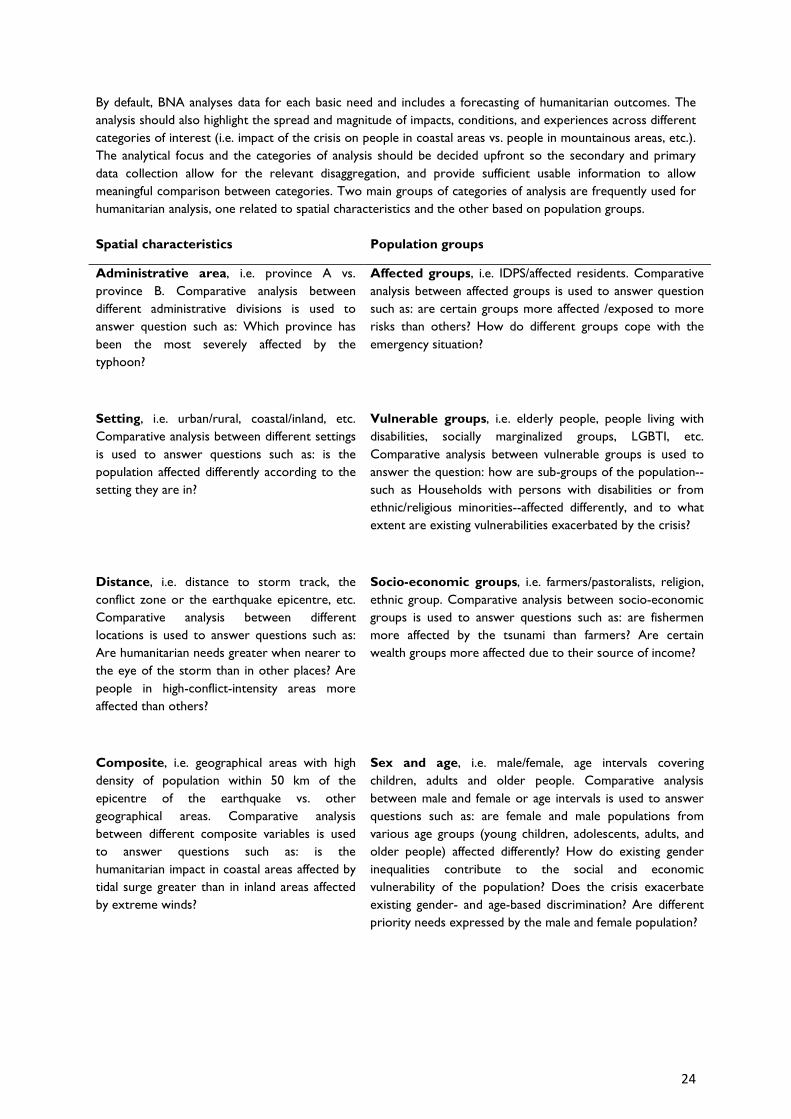
By default, BNA analyses data for each basic need and includes a forecasting of humanitarian outcomes. The analysis should also highlight the spread and magnitude of impacts, conditions, and experiences across different categories of interest (i.e. impact of the crisis on people in coastal areas vs. people in mountainous areas, etc.). The analytical focus and the categories of analysis should be decided upfront so the secondary and primary data collection allow for the relevant disaggregation, and provide sufficient usable information to allow meaningful comparison between categories. Two main groups of categories of analysis are frequently used for humanitarian analysis, one related to spatial characteristics and the other based on population groups. Spatial characteristics Population groups Administrative area, i.e. province A vs. province B. Comparative analysis between different administrative divisions is used to answer question such as: Which province has been the most severely affected by the typhoon?
Affected groups, i.e. IDPS/affected residents. Comparative analysis between affected groups is used to answer question such as: are certain groups more affected /exposed to more risks than others? How do different groups cope with the emergency situation?
Setting, i.e. urban/rural, coastal/inland, etc. Comparative analysis between different settings is used to answer questions such as: is the population affected differently according to the setting they are in?
Vulnerable groups, i.e. elderly people, people living with disabilities, socially marginalized groups, LGBTI, etc. Comparative analysis between vulnerable groups is used to answer the question: how are sub-groups of the population--such as Households with persons with disabilities or from ethnic/religious minorities--affected differently, and to what extent are existing vulnerabilities exacerbated by the crisis?
Distance, i.e. distance to storm track, the conflict zone or the earthquake epicentre, etc. Comparative analysis between different locations is used to answer questions such as: Are humanitarian needs greater when nearer to the eye of the storm than in other places? Are people in high-conflict-intensity areas more affected than others?
Socio-economic groups, i.e. farmers/pastoralists, religion, ethnic group. Comparative analysis between socio-economic groups is used to answer questions such as: are fishermen more affected by the tsunami than farmers? Are certain wealth groups more affected due to their source of income?
Composite, i.e. geographical areas with high density of population within 50 km of the epicentre of the earthquake vs. other geographical areas. Comparative analysis between different composite variables is used to answer questions such as: is the humanitarian impact in coastal areas affected by tidal surge greater than in inland areas affected by extreme winds?
Sex and age, i.e. male/female, age intervals covering children, adults and older people. Comparative analysis between male and female or age intervals is used to answer questions such as: are female and male populations from various age groups (young children, adolescents, adults, and older people) affected differently? How do existing gender inequalities contribute to the social and economic vulnerability of the population? Does the crisis exacerbate existing gender- and age-based discrimination? Are different priority needs expressed by the male and female population?

Basic needs & Preliminary Response Options Analysis Tool
25
Due to time limits and logistical constraints, the number of categories of analysis that will apply must fit with existing resources, data collection and analytical capacities. In most situations, it is recommended to limit the number of categories of analysis and comparisons to two or three as a maximum, in order not to delay the final conclusions and results. Subsequent assessments will allow to answer more specific questions or go deeper into certain categories, if necessary.
V. Roles and Responsibilities The BNA can be implemented by a single organisation but is better achieved through mobilisation of several humanitarian organisations, as situation and response analysis is more coordinated and successful through involvement of different partners and stakeholders. BNA should be planned and carried out through partnerships with government (where feasible), humanitarian actors, national civil society, and with the participation of the affected population. In addition to saving time and resources, a coordinated approach will ensure complementarity in data coverage and avoids duplication of efforts. Leading BNA includes a spectrum of responsibilities: setting objectives, identifying necessary technical expertise, coordinating data collection and analysis activities, sharing findings to inform response planning and programming, and reporting back to the affected population. A core team will lead and coordinate the process, supported by sector experts and other relevant technical specialists with a good understanding of the local context. The size of the team required will vary depending on the resources available and the speed and quality of results expected: The core team should include at a minimum one coordinator and one technical function to lead
secondary data and primary data collection, analysis and reporting. Technical roles can be split between different people if resources are available.
The core team should be supported in the implementation of specific functions at key moments of the process. Sector experts or focal points, identified by partners of key stakeholders, will provide inputs and feedback to the tool design, secondary data review and analysis of the results. They will also participate to workshops to review the results and work on the response analysis. Field teams, supported by team leaders, will also be drawn from partners or key stakeholders and support field data collection. Field team leaders will provide useful inputs to the analysis and interpretation of the results and response analysis.
For small, sub-national level crisis contexts with good assessment preparedness, existing capacity and resources should be sufficient. In the case of a large-scale or national level crisis, additional human resources will likely be required, depending on the workload and volume of data available. The following table details the functions and roles required to implement successfully a BNA for a medium scale emergency. Bigger emergencies will require additional resource or to split some of the core function described below. Stakeholder Main activities Assessment coordinator
Oversees coordination of the process, lead core team, facilitate situation and response analysis workshops, encourages participation by key humanitarian actors and ensures production and dissemination of key BNA outputs.

Basic needs & Preliminary Response Options Analysis Tool
26
Assessment expert
Conduct secondary data review, analysis and adapt field data collection tools and form, select areas or population groups to visit, supervise field teams, validate primary data collection. Analyse results and prepare template for response analysis.
IM/GIS In case of large scale emergency, consider support from an IM/GIS specialist, involved in the design of the assessment tool, mobile data collection (if any), database, mapping, cleaning and charting of results.
Field teams Representation of a cross section of BNA stakeholders should be considered: government, UN, NGOs, affected population and private sector. Gender balanced composition if and when possible. Include emergency programming and field data collection knowledge or experience. Local knowledge and expertise in participatory approaches, gender, do not harm approach is required.
Field team leaders
Appointed by the assessment coordinator, the field team leaders are trained and lead the field assessment teams, ensure that agreed procedures and standards are used to select sites, conduct data collection, and lead daily debriefing with their teams. They also ensure findings and raw data are produced and sent to the assessment coordinator on a timely basis.
Enumerators Collect primary data, under the supervision of the field team leaders Sector experts
Participate as necessary to the planning, design, implementation, secondary data review and situation and response analysis. Beyond sector specialists, involve cash expert.
Government Include government representatives if and when possible.
VI. Overview of BNA activities A quality and credible BNA is not created in a vacuum but requires careful planning and attention to context and capacities. The Gantt chart below provides with an overview of key activities required to complete a BNA during a protracted crisis, from initiation up to reporting and dissemination of the final findings. All steps are detailed in section II Implementing BNA. The analysis section, particularly, summarizes the steps and activities required to approach, process and evaluate information in a structured and controlled way. It can be used as a guide by humanitarian staff to ensure their efforts in data collection and analysis will lead to quality outputs and help them in planning or anticipate issues.
Activities W1 W2 W3 W4 W5 W6 W7 Design and planning
Plan/revise coordination arrangements, identify core team Define objectives and scope of the assessment

Basic needs & Preliminary Response Options Analysis Tool
27
Adapt analysis framework/ plan Conduct secondary data review
Plan field assessment Draft assessment plan
Primary Data collection Adapt and pilot data collection tools
Select and train field assessment teams Organize field visits Conduct interviews
Store, document and manage data properly Situation Analysis
Preparatory analysis Descriptive analysis Explanatory analysis Interpretive analysis
Response analysis Define objectives & target groups
Identify response options Assess operational feasibility
Select appropriate response option(s) Response planning
Goods and services Cash based interventions
Reporting and communication The BNA assessment report
Documenting data and methods Sharing findings and data

Basic needs & Preliminary Response Options Analysis Tool
28
CHAPTER 3: IMPLEMENTING THE BNA This section describes the sequence of practical steps necessary to ensure a successful BNA during emergencies, from initiation of the BNA up to reporting and dissemination of the final findings. The chapter details the main activities and refers to other manuals and guidance when appropriate. The section on analysis is more detailed and specific guidance, tools and templates can be found in the BNA toolbox available here.
I. Design and planning of the BNA The design phase precedes any data collection or analytical processes and is about selecting the best strategies for ensuring the basic needs and response analysis delivers quality outputs. It elaborates and refines the focus, approach, method, tools and activities necessary to provide relevant and credible conclusions. Careful attention to the design phase will help save time later. When properly executed, it ensures the broader context and considerations such as speed, cost, quality, ethics, analytical standards, consensus, participation, etc., are considered. In addition, good design breaks down a complex issue into something that can be managed in a limited time and with limited resources, and still produce useful and quality results. Careful planning and engagement with key stakeholders helps to ensure that all critical issues have been taken into consideration and all required resources are anticipated and provided. Box 4. Expected outputs of the design stage Terms of Reference: Overall aim of the BNA, specific objectives, focus (e.g., affected groups,
geographical areas and basic needs) and timeframe. Coordination modalities and arrangements: If multiple actors are involved, a detail of roles and
responsibilities, commitments of material, human and financial resources, etc. Terms of reference of the BNA core team.
Analysis framework and analysis plan: This is the methodology that the assessment and analysis will be built on; giving an overall framework and detailing information needs, indicators, data collection techniques, sources, sampling approach, thresholds, and other indicators to compare against, etc.
A secondary Data Review (SDR): including an assessment registry, an organized repository of available reports and datasets stored in a shared and protected workspace and an SDR report with main findings, information gaps and recommendations.
Work plan: Activities, resources required, key milestones and budget. Supporting documents: style guide, visual identity, security or data protection guidelines, cleaning
and data processing procedures, job description, branding, etc. A draft outline of the final product(s): report-template with headlines, description of visuals,
requested maps, etc. as well as a strategy for dissemination, including release date, channels, recipients, groups, media, etc.
Plan/revise coordination arrangements and identify core team. Following the decision and launch of the BNA process, a meeting should immediately take place between decision makers (NGOs, CCs, Government, HCT, etc.) to establish the coordination structure of the assessment (the core team or the BNA) and identify technical resources and capacities available among

Basic needs & Preliminary Response Options Analysis Tool
29
stakeholders to support the process. Existing plans, tools or assessment-preparedness mechanisms in-country should be reviewed and activated if relevant. The BNA core team should be appointed and their roles and responsibilities defined with terms of reference. The structure and size of the core team will vary with the scope of the assessment undertaken, the volume of information to collect, the type of crisis and where the assessment takes place. Large, joint assessments will require a bigger core team with different skillsets including assessment coordination and planning, supported by more technical capacity (e.g. a geographic information system (GIS) officer, analyst, logistician, data entry clerk, etc.). In some situations, several hubs will need to be planned for and resourced. The BNA coordinator will need to plan and anticipate expertise for both secondary and primary data collection, drawing from partners’ staff and in-kind participation. Define the objectives of the assessment and its scope. Once the coordination structure and arrangements are in place, the thematic focus of the exercise2 should be agreed upon. Objectives and scope should be validated among stakeholders and should, as a minimum, refer to:
The basic needs to be assessed Geographical areas of interest Affected groups of interest Decisions to be informed Timeframe for delivering the outputs Type of outputs and dissemination channels
Adapt the BNA framework/plan. The core team should always review and adapt the BNA framework (Figure 5) to the local context, the type of crisis, and add additional modules if other information needs are necessary, e.g. a greater focus on displacement, humanitarian access, livelihoods, etc. Context-relevant categories of analysis should also be defined at this stage to help focus the secondary and primary data collation and the analysis strategy (i.e. decision to compare humanitarian outcome on urban vs. rural areas, or male vs. female, etc.). For the entire set of information needs agreed by partners, the team should develop an analysis plan, detailing: What data to collect (following the adapted Framework); Where to access the information (secondary data review or primary data collection, sources, data
collection technique); What types of analyses will be required to interpret it; Where this information will be reflected in the final report. The standard analysis plan should be revised accordingly to accommodate additional information needs. Conduct secondary data review. Secondary data plays a crucial role in BNA. It is reviewed and analysed to decide if further research is required and if a field assessment is necessary to fill critical information gaps. The core team is in charge of collating the secondary information. Experienced 2 For sudden onset, since the crisis impact is often uncertain during the first days, objectives need to be broad to allow for screening of a large range of issues or impact. Generic objectives for BN-ROA can be determined by basic facts and assumptions derived from the location, type of hazard, sectors affected and lessons learned.
Basic needs & Preliminary Response Options Analysis Tool
30
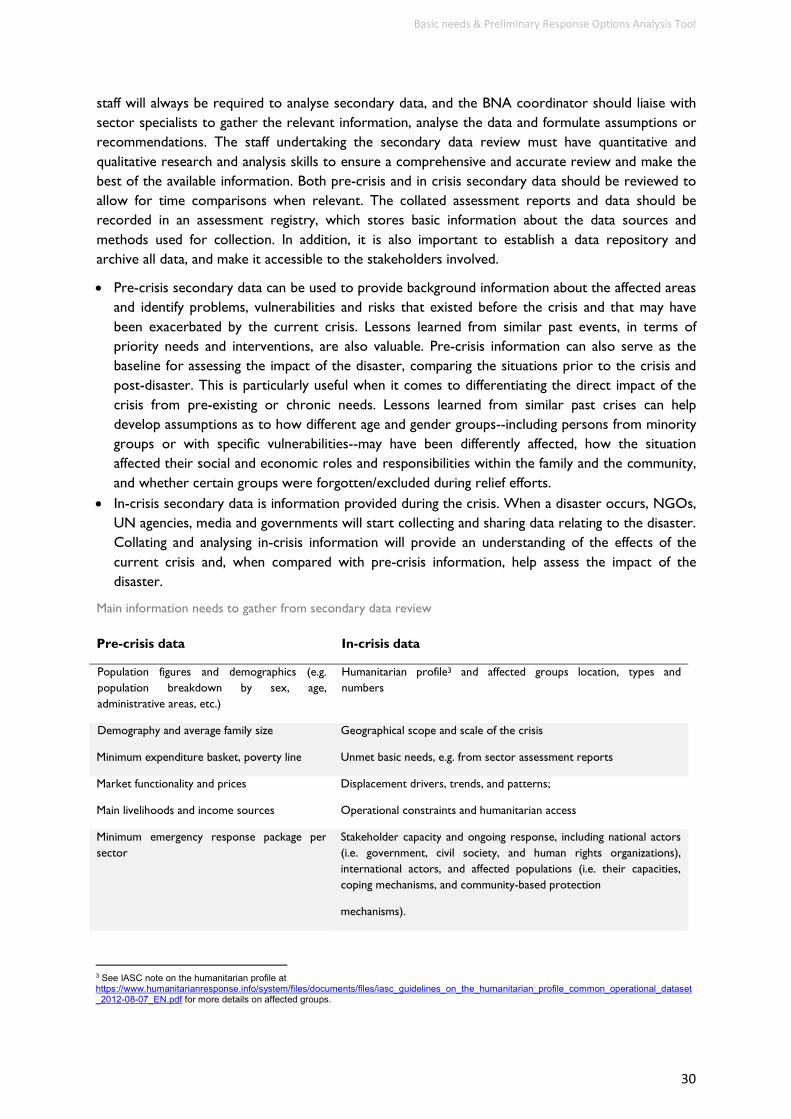
staff will always be required to analyse secondary data, and the BNA coordinator should liaise with sector specialists to gather the relevant information, analyse the data and formulate assumptions or recommendations. The staff undertaking the secondary data review must have quantitative and qualitative research and analysis skills to ensure a comprehensive and accurate review and make the best of the available information. Both pre-crisis and in crisis secondary data should be reviewed to allow for time comparisons when relevant. The collated assessment reports and data should be recorded in an assessment registry, which stores basic information about the data sources and methods used for collection. In addition, it is also important to establish a data repository and archive all data, and make it accessible to the stakeholders involved. Pre-crisis secondary data can be used to provide background information about the affected areas
and identify problems, vulnerabilities and risks that existed before the crisis and that may have been exacerbated by the current crisis. Lessons learned from similar past events, in terms of priority needs and interventions, are also valuable. Pre-crisis information can also serve as the baseline for assessing the impact of the disaster, comparing the situations prior to the crisis and post-disaster. This is particularly useful when it comes to differentiating the direct impact of the crisis from pre-existing or chronic needs. Lessons learned from similar past crises can help develop assumptions as to how different age and gender groups--including persons from minority groups or with specific vulnerabilities--may have been differently affected, how the situation affected their social and economic roles and responsibilities within the family and the community, and whether certain groups were forgotten/excluded during relief efforts.
In-crisis secondary data is information provided during the crisis. When a disaster occurs, NGOs, UN agencies, media and governments will start collecting and sharing data relating to the disaster. Collating and analysing in-crisis information will provide an understanding of the effects of the current crisis and, when compared with pre-crisis information, help assess the impact of the disaster.
Main information needs to gather from secondary data review Pre-crisis data In-crisis data Population figures and demographics (e.g. population breakdown by sex, age, administrative areas, etc.)
Humanitarian profile3 and affected groups location, types and numbers
Demography and average family size Geographical scope and scale of the crisis Minimum expenditure basket, poverty line Unmet basic needs, e.g. from sector assessment reports Market functionality and prices Displacement drivers, trends, and patterns; Main livelihoods and income sources Operational constraints and humanitarian access Minimum emergency response package per sector
Stakeholder capacity and ongoing response, including national actors (i.e. government, civil society, and human rights organizations), international actors, and affected populations (i.e. their capacities, coping mechanisms, and community-based protection mechanisms).
3 See IASC note on the humanitarian profile at https://www.humanitarianresponse.info/system/files/documents/files/iasc_guidelines_on_the_humanitarian_profile_common_operational_dataset_2012-08-07_EN.pdf for more details on affected groups.
Basic needs & Preliminary Response Options Analysis Tool
31
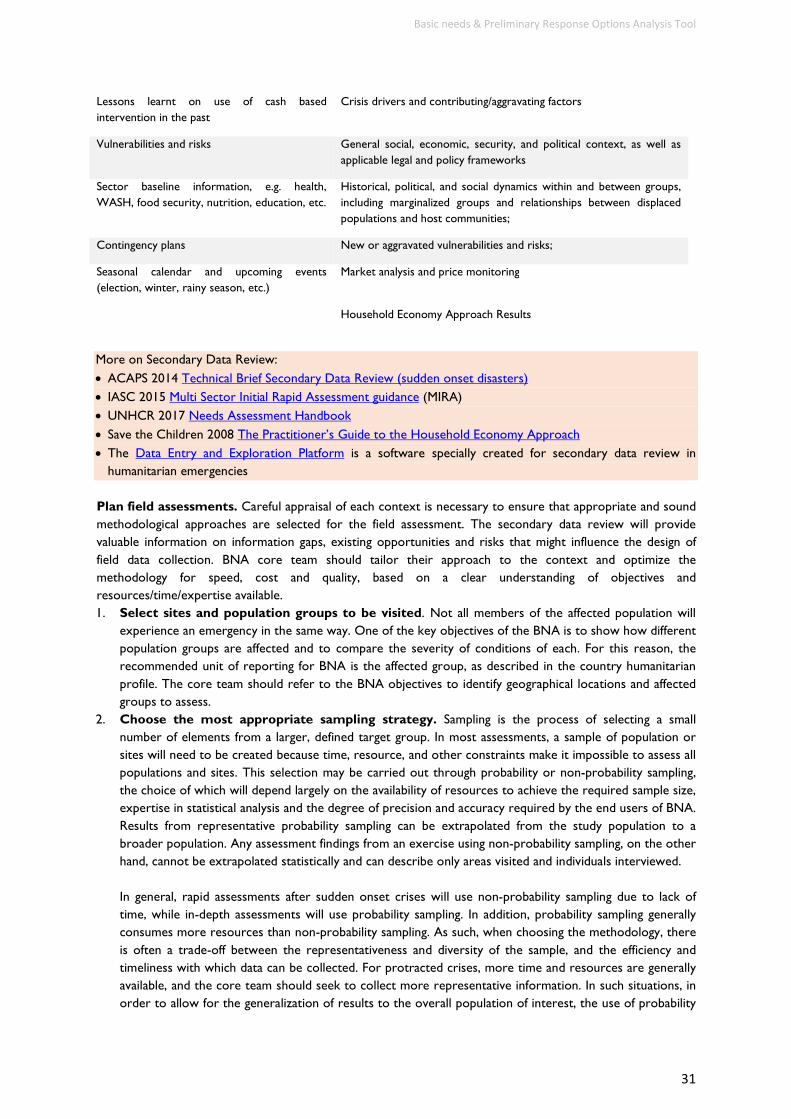
Lessons learnt on use of cash based intervention in the past
Crisis drivers and contributing/aggravating factors
Vulnerabilities and risks General social, economic, security, and political context, as well as applicable legal and policy frameworks
Sector baseline information, e.g. health, WASH, food security, nutrition, education, etc.
Historical, political, and social dynamics within and between groups, including marginalized groups and relationships between displaced populations and host communities;
Contingency plans New or aggravated vulnerabilities and risks; Seasonal calendar and upcoming events (election, winter, rainy season, etc.)
Market analysis and price monitoring
Household Economy Approach Results More on Secondary Data Review: ACAPS 2014 Technical Brief Secondary Data Review (sudden onset disasters) IASC 2015 Multi Sector Initial Rapid Assessment guidance (MIRA) UNHCR 2017 Needs Assessment Handbook Save the Children 2008 The Practitioner’s Guide to the Household Economy Approach The Data Entry and Exploration Platform is a software specially created for secondary data review in
humanitarian emergencies Plan field assessments. Careful appraisal of each context is necessary to ensure that appropriate and sound methodological approaches are selected for the field assessment. The secondary data review will provide valuable information on information gaps, existing opportunities and risks that might influence the design of field data collection. BNA core team should tailor their approach to the context and optimize the methodology for speed, cost and quality, based on a clear understanding of objectives and resources/time/expertise available. 1. Select sites and population groups to be visited. Not all members of the affected population will
experience an emergency in the same way. One of the key objectives of the BNA is to show how different population groups are affected and to compare the severity of conditions of each. For this reason, the recommended unit of reporting for BNA is the affected group, as described in the country humanitarian profile. The core team should refer to the BNA objectives to identify geographical locations and affected groups to assess.
2. Choose the most appropriate sampling strategy. Sampling is the process of selecting a small number of elements from a larger, defined target group. In most assessments, a sample of population or sites will need to be created because time, resource, and other constraints make it impossible to assess all populations and sites. This selection may be carried out through probability or non-probability sampling, the choice of which will depend largely on the availability of resources to achieve the required sample size, expertise in statistical analysis and the degree of precision and accuracy required by the end users of BNA. Results from representative probability sampling can be extrapolated from the study population to a broader population. Any assessment findings from an exercise using non-probability sampling, on the other hand, cannot be extrapolated statistically and can describe only areas visited and individuals interviewed.
In general, rapid assessments after sudden onset crises will use non-probability sampling due to lack of time, while in-depth assessments will use probability sampling. In addition, probability sampling generally consumes more resources than non-probability sampling. As such, when choosing the methodology, there is often a trade-off between the representativeness and diversity of the sample, and the efficiency and timeliness with which data can be collected. For protracted crises, more time and resources are generally available, and the core team should seek to collect more representative information. In such situations, in order to allow for the generalization of results to the overall population of interest, the use of probability

Basic needs & Preliminary Response Options Analysis Tool
32
sampling is recommended. Determining and designing the most appropriate sampling strategy can be difficult and it is recommended to seek support from an assessment expert to choose the best sampling strategy. Factors commonly influencing the choice of sampling method include the following: Nature and quality of the sampling frame; Accuracy and precision requirements; Type and level of detail of analysis expected; Available resources (time, human, material, financial, technological); and Context and operational concerns (e.g. humanitarian access).
More on site selection and sampling methods: ICRC 2017 Acquiring and analysing data in support of evidence based decisions UNHCR 2017 Needs Assessment Handbook ACAPS 2012 Technical Brief Purposive sampling and site selection Consolidate the BNA plan. Before starting the field data collection, consolidate the outputs of all previous steps into an assessment plan or an updated ToR and share with partners. The following outlines may be used to summarize the plan: Box 5. BNA plan outline 1. Objectives
Specific objectives Geographical areas, groups, basic needs to
be assessed Decisions to be informed and timeframe Frequency of reporting
2. Secondary data review Summary of findings Information gaps
3. Analysis framework and plan
Information needs (adapted BNA Framework)
Analysis plan, including sources and data collection techniques
4. Coordination arrangements Coordinating agencies and partners list Coordination structure and ToR Data ownership and information sharing
protocols Resources required (human, financial,
material) at different steps of the assessment
5. Dissemination plan Type of end products Final report templates Target audience Dissemination timeline Data sharing protocols
II. Primary data collection After designing and preparing the assessment and response analysis, relevant and credible data needs to be collected to populate your analysis framework and plan. BNA uses two common data collection techniques to collect data from the affected population, Community Groups Discussions (CGDs) and Household Interviews (HHIs). Primary data should not be collected until an SDR is first conducted. The information needed is sometimes available through secondary data and valuable time and resources do not need to be spent collecting this information. Furthermore, SDR analysis will highlight geographic and thematic information gaps and provide a better understanding of what information still needs to be collected (and from where), leading to better designed and more targeted primary data collection. Secondary Data Review should also continue during
Basic needs & Preliminary Response Options Analysis Tool
33
primary data collection as to ensure in-crisis information is properly stored and available for comparison with the results of the primary data collection. Since data comes in multiple formats, it must be organized, managed, documented and safely stored before it can become useful as a source and used as evidence for analysis. Data management precedes analysis and no proper analysis of the field data will be possible until measures for data organisation, categorisation, and storing are in place. Box 6. Expected outputs of the primary data collection stage Database for primary data: Excel-sheet or similar containing clean data from CGDs and HHIs, including
common identifiers for comparisons across databases and a data dictionary providing with a description of each field.
Adapt and pilot data collection tools. The core team ensures that key information needs are reflected in the field data collection tools as per the objectives and focus of the assessment. The data collection tools should be closely aligned with the analysis framework and the analysis plan. Standards forms are proposed in annex 1 for the Community Group Discussions and the Household Interviews. Additional modules can be added to the standards forms to reflect new information needs, e.g. displacement, humanitarian access, etc. and comply with the information requirements outlined in the analysis plan. Information modules included in the standard BNA data collection tools Data collection technique Topics covered in standard forms Household Interviews (HHI)
Demographics Livelihood, source of cash and income Coping mechanisms Humanitarian outcomes Distance and main sources/providers of essential goods and services Past, current and minimum expenditure Priority needs Underlying factors Preferred assistance options
Community Group Discussions (CGDs)
Basic needs list and criticality Minimum expenditure basket for average family size Priority needs Underlying factors Seasonality of expenditure and consumption
Some variables of the BNA and the data collection tools need to be precisely defined and adapted in each situation: The definition of a household. The definition proposed is from the Household Economy Approach, where a
household refers to a group of people, each with different abilities and needs, who live together most of the

Basic needs & Preliminary Response Options Analysis Tool
34
time and contribute to a common economy, and share the food and other income from this. However, definitions of households might vary across contexts and if necessary will need to be adapted.
Definitions of affected groups. Refer to the humanitarian profile in country or existing definitions for affected groups (e.g. IDPs in public building, tents, etc.) and settings (e.g. rural, urban, peri urban, area of high conflict intensity, livelihood zone, etc.)
The average number of members in one household. This number might vary per affected groups and location. Refer to baseline information, past surveys or registration lists, etc. to establish the average size of households.
The time frame for the forecast of humanitarian outcomes. The time for which forecast is requested need to be established in advance. It is recommended a period of 3 to 6 months, depending on how volatile and dynamic is the context. Alternatively, key events could also be used, such as the future lean or rainy season, the winter, etc.
Before and after: Some questions in the data collection tools require to establish a before and an after. The approximate date of the “before” need to be fixed so as to refer to a common baseline. It can be: Since the crisis started in March 2015, since the earthquake hit in November last month, etc. Be as specific as possible to avoid confusion and misunderstanding.
Depending on the context, a translation might be required for the questionnaires to adapt to local language. Finally, the data collection tools should always be piloted and refined as necessary before training and field data collection start. More on questionnaire design: ICRC 2017 Acquiring and analysing data in support of evidence based decisions UNHCR 2017 Needs Assessment Handbook ACAPS 2016 Technical Brief Questionnaire design Select and train field assessment teams. The field assessment team is the most important field assessment asset, and the quality of the data is directly related to the quality of the team collecting it. Staff involved in field data collection should be experienced in emergency programming and assessments, and have country knowledge. When possible, field assessment teams should include staff from different agencies and NGOs. The involvement of local actors or authorities (if appropriate given the context) and representatives from the affected population in the assessment teams will strengthen the accuracy of the findings and interpretation of the situation. Provide all assessment team members (including drivers and translators) with adequate and timely instructions, briefings, clear reporting lines and up-to-date job descriptions to enable them to understand their responsibilities and work objectives, and what management support they may receive during the field data collection. Field assessment teams will require appropriate training on objectives, sampling strategy, code of conduct, data collection forms, standard operating procedures, logistics, administrative planning and be given support to complete the field work properly and safely. An assessment package containing the essential information and documents should be distributed to all team members at the end of the training and may include: Box 7. Assessment field team package A short overview of the emergency and the location of the assessment and maps of the areas to be
assessed Data Collection Plans: Instructions for site, group and head of household selection, protocols for site
substitution if required Copies of data collection tools, guidelines on the data collection techniques that will be used and list of key
terms used in the data collection tools and definitions Communication procedures and contact list (with emergency contacts and security procedures). Instructions on the use of any electronic devices being used in the assessment (tablets, GPS, smart phones)

Basic needs & Preliminary Response Options Analysis Tool
35
Letters of introduction for notice of arrival on site (e.g. from relevant ministries) Code of conduct Informed consent forms with instructions in case of photography More on assessment team composition and training: ACAPS 2012 Building an effective assessment team Organize field visits. The site selection plan designed in the planning step needs to be communicated to the field teams. Every day in the field is different and must be planned accordingly. Teams should prepare each day carefully, deciding/confirming which locations will be visited, agreeing on how the information will be collected, deciding how to include local authorities, planning for team meetings during and after the visit and revising responsibilities within the teams. Team leaders should know the procedure to follow when one targeted site or group is not accessible. Ensure teams have the necessary logistical means and administrative framework to conduct field assessments, including standard operating procedures and safety checks/recommendations. Conduct interviews. Data collection should be undertaken using Community Group Discussions (CGD) and household interviews (HHI). These methods require adapted observation, facilitation and interviewing skills. They are best conducted by multi-disciplinary, gender-balanced teams where multiple opinions about what has been observed or heard can be shared and contrasted within the team during the field visit and afterwards, during debriefings. Community Group Discussions bring together small, manageable groups of individuals (typically 7-10) with
some common characteristics (age, gender, socially distinguished group, etc.) to gain information about a specific or focused event. They are important to deepen the insight into a specific segment of the population. Reaching consensus is important in a CGD. Questions may allow one single response, multiple responses, or require a prioritization of responses. If there are vastly varied responses at first, achieving consensus will require skilled management of the discussion. There may be times when noting ‘no clear consensus’ is the only option to capture the response and recording the range of opinions will be required. Clarify in your assessment plan where and for whom the CGDs will be conducted, and maintain this approach for all sites to allow appropriate comparison. CGDs should be conducted in each visited site and composed of male and female from each targeted affected group (i.e. IDPs in public buildings, affected residents, etc.) to better understand and compare priority needs and the impact and challenges related to the disruption of access to essential services and goods. In case a disaggregation male/female is desired, CGDs can be targeted specifically to each of those genders in each site. CGDs should be conducted first in order to identify key priorities, and followed by household interviews. Core team should ensure that the adapted form does not require more than one hour and a half of discussion.
Household interviews provide more granular information at the household level and to explore results based on other characteristics, such as the number of people in the family, the source of income, the date of arrival, etc. The Household interview for BNA should be conducted with head of households and all enumerators should be trained in their selection. The interview shouldn’t last more than 50min, including introduction and explanation about the objectives of the assessment.
In each site and for each targeted affected group, a community group discussion should be conducted as well as household interviews. It is of crucial importance that community group discussions and Household refer to the same site or population. Store, document and manage data properly. Traditionally, data is collected with paper and pen and then entered into a database such as Excel for processing, storing, and analysis. Increasingly, primary data collection is conducted using mobile data-collection systems, e.g. using mobile phones, tablets, or Personal Digital Assistants (PDAs) that allow for real-time data collection, uploading, analysis, and sharing. These are considered more effective than paper-based forms, which take longer to process. Primary data collection using mobile technology: If mobile technology is used, data is most likely being
directly uploaded to an online database, thus speeding up the data entry process. Numerous tools for

Basic needs & Preliminary Response Options Analysis Tool
36
mobile data collection exist. Most commonly used in humanitarian settings are the Open Data Kit (ODK) or customized versions such as KoBoToolbox. An ODK version of the CGD and HHI forms is available for adaptation in the toolbox. Data collected through mobile phones or tablets is no “more accurate” than data collected via paper forms. It will require the same amount of cleaning and validation than data collected through traditional ways, although some traditional data entry mistakes can be reduced by inserting conditionalities and rules in the electronic form.
Paper-based data collection will require an electronic data entry tool. The assessment expert should develop the tool based on the data collection tools and may use Microsoft Excel or Access for offline data entry functionality or an online software4. Based on your selected method(s), a data entry team may have to be recruited to ensure data is managed and stored appropriately. If using the field teams, ensure at least one person in the team is proficient in data entry and the software chosen for the data entry. Otherwise, establish a data entry centre with an adequate number of data entry clerks and computers with required software. Select only people who have strong computer skills and preferably who already have data entry experience.
The core team should set procedures for collation, quality control, and management of the data. It should also ensure the protection and safeguarding of personal or confidential information, if any. This includes establishing protocols among partners for the storing of different types of information (e.g. raw vs. aggregated data vs. findings) and agreeing on how to share data or findings. Related protocols must define the following: Type of metadata to describe the dataset (date of collection, geographic coverage, methodology); Geographical units (use of country P-codes and/or agreed administrative place names, disaggregation levels,
and other technical standards); Who owns the data and who has what rights to change or modify the data; Determination of whether datasets should be cleared or sanitized prior to sharing, and by whom; Who has what rights to access the data at each level of aggregation and sensitivity; and Details on data confidentiality and safeguarding of information. During primary data collection, the assessment teams will need to ensure that collected data is stored and referenced properly, ready to be used for later analyses. Irrespective of the method used for collection and storage, all data should indicate: Location or geographical area to which the data is applicable, using agreed standards (i.e. CODs); Population segment or affected groups from which the observation is derived; Sector(s) or sub-sector(s) the observation represents or belongs to, or other themes of interest (e.g.
humanitarian access, response capacity, etc.); Date on which the data was collected or the information to which it refers; Basic information about the enumerator, such as sex, phone number, etc.; Basic information about the respondent, such as age, sex, and other aspects of diversity; and A unique identifier for each questionnaire. In addition, data storage, back up or archiving protocols need to be identified for safeguarding data. More on storage and protection of data: UNHCR 2015 Policy on the protection of personal data of persons of concerns to UNHCR ACAPS 2013 How to approach a dataset part 1:Database design ACAPS 2013 How to approach a dataset part 2: Data preparation ACAPS 2016 Data cleaning
4 Any software with a form functionality, such as Google Forms or SurveyMonkey, should work.
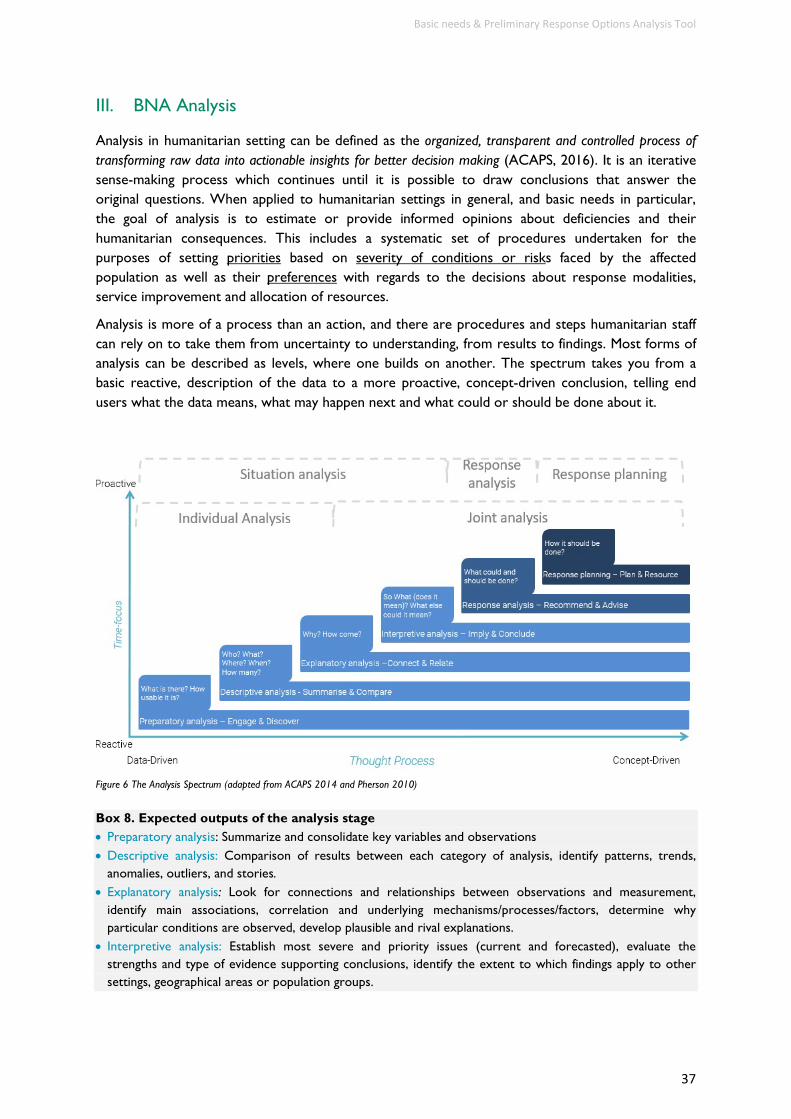
Basic needs & Preliminary Response Options Analysis Tool
37
III. BNA Analysis Analysis in humanitarian setting can be defined as the organized, transparent and controlled process of transforming raw data into actionable insights for better decision making (ACAPS, 2016). It is an iterative sense-making process which continues until it is possible to draw conclusions that answer the original questions. When applied to humanitarian settings in general, and basic needs in particular, the goal of analysis is to estimate or provide informed opinions about deficiencies and their humanitarian consequences. This includes a systematic set of procedures undertaken for the purposes of setting priorities based on severity of conditions or risks faced by the affected population as well as their preferences with regards to the decisions about response modalities, service improvement and allocation of resources. Analysis is more of a process than an action, and there are procedures and steps humanitarian staff can rely on to take them from uncertainty to understanding, from results to findings. Most forms of analysis can be described as levels, where one builds on another. The spectrum takes you from a basic reactive, description of the data to a more proactive, concept-driven conclusion, telling end users what the data means, what may happen next and what could or should be done about it.
Figure 6 The Analysis Spectrum (adapted from ACAPS 2014 and Pherson 2010) Box 8. Expected outputs of the analysis stage Preparatory analysis: Summarize and consolidate key variables and observations Descriptive analysis: Comparison of results between each category of analysis, identify patterns, trends,
anomalies, outliers, and stories. Explanatory analysis: Look for connections and relationships between observations and measurement,
identify main associations, correlation and underlying mechanisms/processes/factors, determine why particular conditions are observed, develop plausible and rival explanations.
Interpretive analysis: Establish most severe and priority issues (current and forecasted), evaluate the strengths and type of evidence supporting conclusions, identify the extent to which findings apply to other settings, geographical areas or population groups.

Basic needs & Preliminary Response Options Analysis Tool
38
Response analysis: Decide on a strategy and objectives to change the outcomes, a comparative analysis of different response options and their feasibility, likely outcome, opportunities and risks, a set of recommended response options.
Response planning: Details on the activities and resources required to achieve the objectives, using the response options selected in the previous step.
Box 9. Key principles for BNA analysis Analysis is a systematic and iterative sense-making process guided by the analytical framework and analysis plan defined during the design stage of the BNA. The more detailed the analysis plan, the more automatic and straightforward the analysis will be. Analysis is an ongoing activity throughout the needs assessment. It should start with secondary data and continue as soon as primary data becomes available, rather than waiting until after all the data has been collected. When analysing primary data, be sure to integrate secondary data analysis as much as possible, as an essential complement to primary data. Secondary data is used not only to triangulate and validate primary data findings, but also to help comparing, explaining, interpreting, forecasting and recommending. When findings are presented in the assessment report, this should include both primary and secondary findings or highlight differences where relevant. Data cleaning will happen both during field team debriefing and when reading and analysing the data in the database. Initial cleaning should focus on simple mistakes such as typographical errors (misspellings, extra zeros, etc.) and blank entries. As analysis progresses, you may begin to see anomalies and outliers in the data which will need to be verified or cleaned. Outliers demand further investigation, and most of the time there will be an explanation to such anomalies; they can occur because of misunderstandings between respondents and data collectors or simply because the data was entered inaccurately. Often, these issues can be resolved through discussion with field assessments team leaders and checking entries. In some cases, the anomaly may be an indicator of problems being more severe in one area than others and in some cases, it can point to poor quality information which will need to be removed from the overall analysis. The analysts should document when the latter is the case. Some levels of analysis, especially interpretive, anticipatory and response levels, require the involvement of sector experts who have a sound knowledge about the context and programme design in the country. The core team should plan for joint analysis (i.e. workshop) in which the core team, the field team leaders, relevant ministries and sector representative, wider Cluster members and relevant stakeholders come together to discuss and analyze the findings. Objectives may include: Establish a common understanding of the situation by agreeing on the findings Compensate lack of evidence with expert judgement Resolve inconsistencies in the data through discussion and information sharing Validate key findings (severity, priorities, underlying factors, etc.) and results Develop likely scenarios for how the situation may evolve Identify most appropriate assistance modalities (response analysis) Summarizing data into tables may be enough for analysts and decision makers to draw important meaning from the data. However, at times it may be difficult to make sense of the information if it is only presented as numbers in a table. Being able to clearly see the data in an organized way is key for meaningful analysis, and will require the visualization of the data in effective ways. This entails using specialized tools, e.g. excel, Tableau, etc.). This is important for the information analyst(s) themselves and especially for the wider community who

Basic needs & Preliminary Response Options Analysis Tool
39
will help with the analysis. In most cases, seven basic graphs are enough to show specific stories and relationships, detailed hereafter.
When you want to compare one value to another as well as its quantitative order relationship. Use bars (vertical or horizontal), sorted in descending order to emphasize high values or sorted in ascending order to emphasize low values.
When you want to compare values in no specific order. Use bars (vertical or horizontal).
Also known as pie-charts, a part-to-whole graph shows how the values relate to the whole and to one another. A specific characteristic of a pie chart is the fact that everyone immediately knows that the individual slices combine to make up a whole pie. Very useful when presenting just a few values.
When you want to compare measurements taken over a period of time. Lines show the flow of values across time, for example consecutive months of a year. The movement from one value to the next represents change, giving meaning to the slope of the line: the steeper the slope, the more dramatic the change.
Shows how one or more sets of values differ from a reference set of values. Use a reference line to show how one or more values deviate from a point of reference. For example, to show the degree to which an indicator does not meet a standard.

Basic needs & Preliminary Response Options Analysis Tool
40
When you want to compare two set of measures to determine if as one set goes up, the other set correspondingly goes up or down and how strongly. The line shows the trend and whether it goes up (positive), or down (negative), and the more tightly the values are grouped around the trend line, the stronger the correlation.
Spatial visualization shows how a situation may differ from one area to another using mapping. Very effective for showing geographical distribution of an issue.
Data preparation – Engage and discover After cleaning the dataset, BNA analysts will prepare a set of key variables necessary to conduct the analysis. A few key variables are required to perform a basic analysis for BNA. The section details each and provide with the reference questions in the questionnaire, analytical outputs as well as visualization types when relevant. List of basic needs. The first task is to contextualize and validate the list of basic needs. An initial list of basic needs is proposed in the standard questionnaire and should be adapted based on secondary data review and consultation with key BNA stakeholders, before being discussed and validated during the Community Group Discussions. The category “others” allows the population to mention a basic need they consider essential and was not included in the initial list. It is likely that the category “others” will require recoding during the data preparation stage. Only validate a new category if at least one percent of the sample mentioned the new item. Reference question in the questionnaires Community group discussion Household interview
Basic need list and “others” category Question B1-B8 Question D1-D9 Analytical output Final list of basic needs to use in the final report Triangulate: Refer to existing HEA data, poverty or living standards survey in the country available and compare the list. Criticality of basic needs. As discussed previously, not all basic needs hold the same importance or contribute in the same way to humanitarian outcomes, depending on locations and affected groups. For instance, access to energy for heating in high altitude might be of importance to ensure survival at night during the winter, while of much less importance in plains or coastal areas. For this reason, community groups are requested to provide with a grading of the criticality of a basic item, based on how important access to the good/service is to ensure health/survival, dignity and/or personal development.

Basic needs & Preliminary Response Options Analysis Tool
41
Reference question in the questionnaires Community group discussion Household interview
Criticality score Question B1 Analytical output List of essential goods or services required for health/survival, dignity and personal development Triangulate: None of the items that were mentioned as non-essential for health/survival should be associated to life threatening humanitarian outcomes. Minimum expenditure basket. Each basic need item is broken down per commodity and service, e.g. water as a commodity and maintenance and purification of public water as a service. Community groups and heads of households are requested for each basic item to provide with an average monthly expenditure. This estimation should be available for both normal times (before the crisis) and current times, so as to estimate the impact of the crisis on the family basket. In addition, head of households are requested to provide with an estimate of the current gap in expenditure, i.e. the difference between their current monthly expenditure for one item and the one that they estimate would suffice to fulfil their basic need. The difference can be positive (they can cover their basic need with the current expenditure) or negative (there is a negative difference between the amount requested and their current level of expenses). The minimum expenditure basket is estimated based on the average cost of one item for an average month, for an average family number. In some cases, it might be relevant to provide a minimum expenditure basket for different family sizes. An analysis of the distribution of the number of family members will provide insight as to the most appropriate and operational way of providing the information. In case of bimodal distribution, provide a minimum expenditure basket for each category In case of normal distribution, chose the most appropriate family number interval (3-5, 7-9, etc.) and
estimate average cost of the baskets accordingly. The BNA allows the calculation of a survival minimum expenditure basket, using the criticality metric and filtering the minimum expenditure basket only for the items that have been graded essential for health/survival. Reference question in the questionnaires Community group discussion Household interview Monthly expenditure for each essential
goods and services (past, current and minimum required)
Question B6 Question D4
Average # of family members Question B5 Criticality score Question B1
Analytical output Minimum expenditure basket for (different) average family size Survival minimum expenditure basket (optional)

Basic needs & Preliminary Response Options Analysis Tool
42
Average Expenditure gap for each basic need Triangulate: Check consistency between the expenditures provided during CGDs and HHI for a same site, family size and affected group. They should match within a 20% range. In case of discrepancies, use existing market price monitoring system to randomly check the price of some of the items enunciated during CGD or Household interviews. Check the plausibility of the prices with market specialists, field assessment teams and field humanitarian staff. Seasonality of expenditures and consumption. The community groups are requested to provide for each good or service some information about the evolution of expenditures over time, as a proxy for consumption and variation of prices across a year. The results are represented using a calendar view of the year, and showing percent difference from one month to another. This provides with an understanding of both recurrent and seasonal expenditures over a year and allow to plan potential cash based interventions by accounting for future variation. Exceptional or extraordinary expenditures, e.g. emergency medical intervention, tent purchase, etc. should be processed separately as they cannot always be linked to a specific time period. Seasonal expenditure calendar, Nigeria pilot, June 2017
Reference question in the questionnaires Community group discussion Household interview
Seasonal evolution of expenditure Question B7

Basic needs & Preliminary Response Options Analysis Tool
43
Annual events Question B7-8 Analytical output Seasonal calendar and key events (temperature, precipitation, rainy season, harvest, school period, etc.) Expenditure evolution for each month of the year (average percentage change compared to previous or
normal month) List of recurrent, one off and extraordinary expenditures, e.g. emergency medical intervention, etc. Triangulate: Revise the seasonal calendar obtained from secondary sources and compare with the list of key events and expenditure variation reported during CGDs. In case market price monitoring is available, compare also percentage changes over time. The severity of harmful consequence is calculated in BNA using two scores, sufficiency and humanitarian outcome. Sufficiency refers to the degree to which current access to services or goods is enough to meet/satisfy the basic needs of family members. Humanitarian outcome refers to the degree of concern regarding the consequences of shortages or disruptions in the next X months5, if no additional assistance is provided to the family. The degree of concern integrates the capacity to cope as well as possible effects on health or life of family members. The combination of both metrics provides with an understanding of current shortages as well as potential harmful consequences. The severity classification is calculated by multiplication of the sufficiency and the humanitarian outcome score. This provide with a severity score for each basic need and household, on a scale from 1 to 256. To determine a severity score for affected groups and geographical areas, the median score is recommended as an aggregation method. The median indicates the severity score for 50% of the population interviewed in a given group or geographical area. The 50% cut off can be adapted to a lower or higher point, depending on the context. Results can be displayed in a heatmap as in the example below. Sample humanitarian outcome score, Nigeria, June 2017
5 The time frame for the forecast period should be decided upon during the adaptation of the questionnaire. It is recommended to use a period of 3-6 month, depending on the dynamics of the crises. 6 It is recommended to run and compare the severity score separately for each class of basic needs, i.e. for the set of basic needs considered as critical for health/survival, and for those critical to dignity and personal development. This will avoid favouring only the lifesaving sectors.
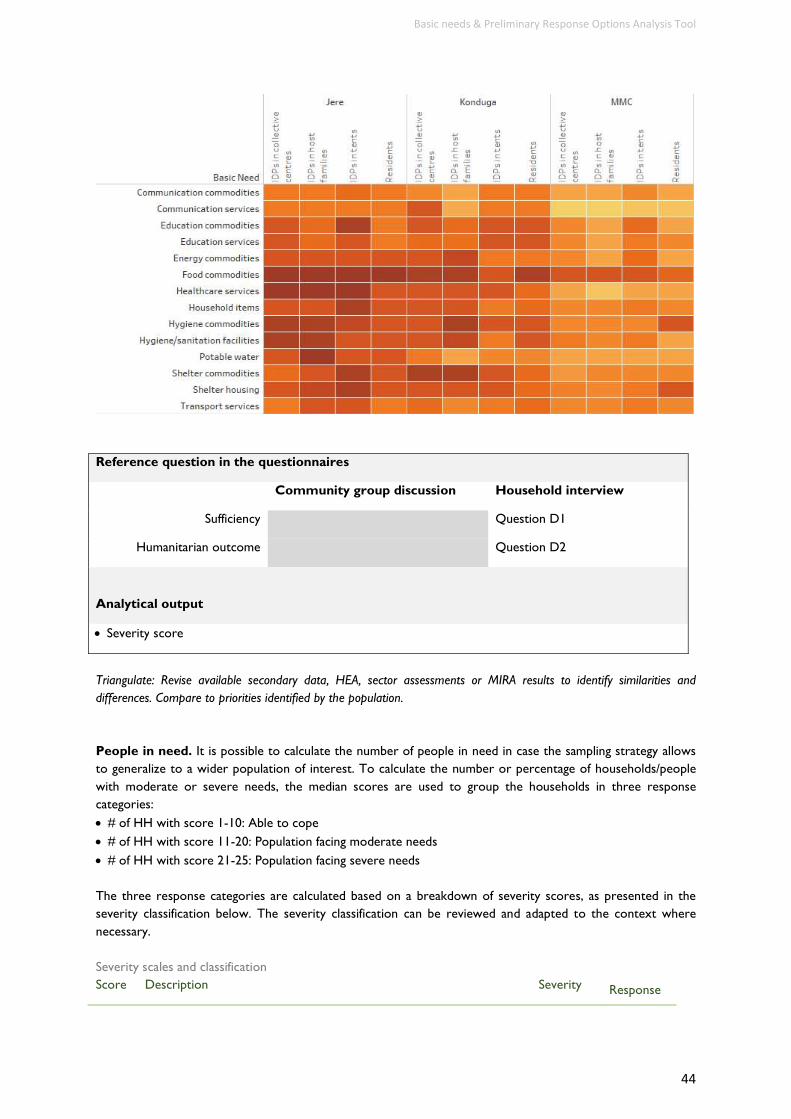
Basic needs & Preliminary Response Options Analysis Tool
44
Reference question in the questionnaires Community group discussion Household interview
Sufficiency Question D1 Humanitarian outcome Question D2
Analytical output Severity score Triangulate: Revise available secondary data, HEA, sector assessments or MIRA results to identify similarities and differences. Compare to priorities identified by the population. People in need. It is possible to calculate the number of people in need in case the sampling strategy allows to generalize to a wider population of interest. To calculate the number or percentage of households/people with moderate or severe needs, the median scores are used to group the households in three response categories: # of HH with score 1-10: Able to cope # of HH with score 11-20: Population facing moderate needs # of HH with score 21-25: Population facing severe needs The three response categories are calculated based on a breakdown of severity scores, as presented in the severity classification below. The severity classification can be reviewed and adapted to the context where necessary. Severity scales and classification Score Description Severity Response

Basic needs & Preliminary Response Options Analysis Tool
45
category category 1-5 Half the population can meet and sustain their basic needs in the next XX
months Minor Able to cope 6-10
Half the population faces shortages and unmet basic needs but consider they should be able to cope in the next XX months, even if no additional assistance is provided
Moderate
11-15 Half the population faces shortages and unmet basic needs and fear not being able to cope in the next XX months, if no additional assistance is provided
Serious Moderate
needs 16-20
Half the population faces shortages and unmet basic needs with consequences on the health of the family members in the next XX months if no additional assistance is provided
Severe
21-25 Half the population faces shortages and unmet basic needs with life threatening consequences in the next XX months if no additional assistance is provided
Critical Severe needs
Percentage of people in need in visited sites, Nigeria pilot, June 2017
Reference question in the questionnaires Community group discussion Household interview
Sufficiency Question D1 Humanitarian outcomes Question D2
Number of people in HH Question B5 Analytical output # and % of people able to cope, in moderate and severe needs Triangulate: Compare the number of people in need and the severity per group and geographical areas with the results of the livelihood coping strategy index. Services/goods/facility, sources and provider. BNA requires an understanding of the main sources for or providers of goods or services, as households use different strategies to meet their basic needs, from own production to the purchase of goods or hiring of services. Two metrics are used to better understand
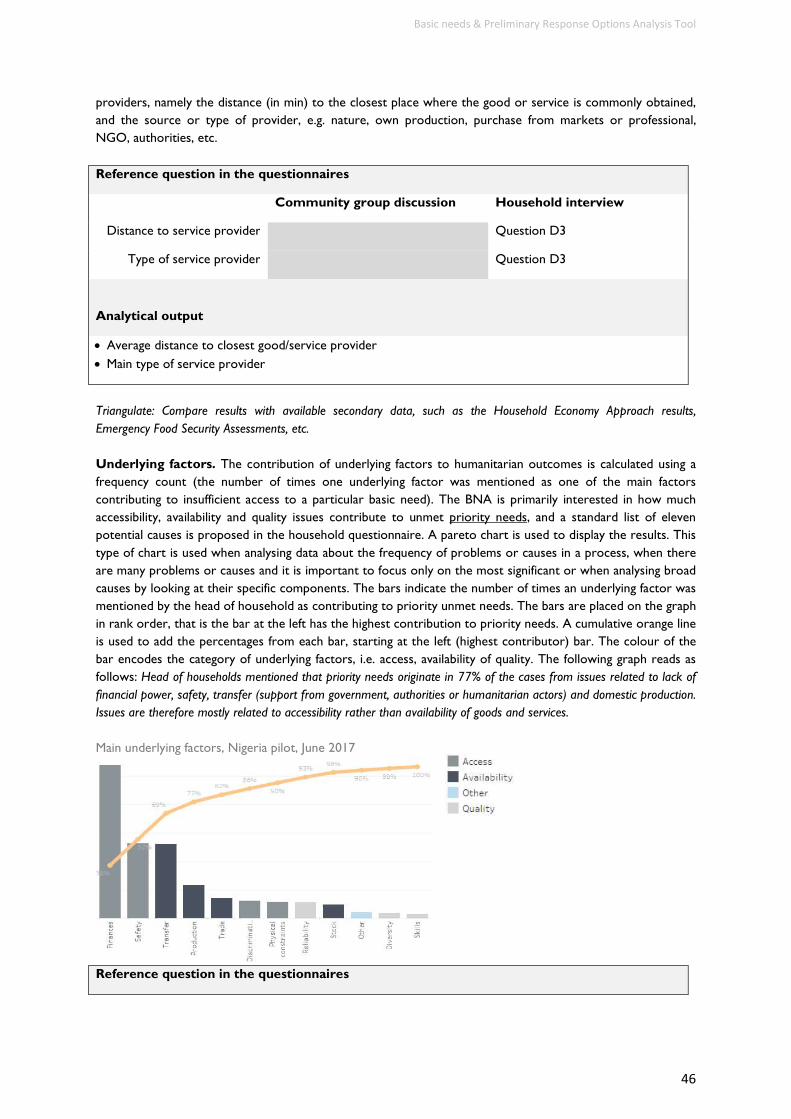
Basic needs & Preliminary Response Options Analysis Tool
46
providers, namely the distance (in min) to the closest place where the good or service is commonly obtained, and the source or type of provider, e.g. nature, own production, purchase from markets or professional, NGO, authorities, etc. Reference question in the questionnaires Community group discussion Household interview
Distance to service provider Question D3 Type of service provider Question D3
Analytical output Average distance to closest good/service provider Main type of service provider Triangulate: Compare results with available secondary data, such as the Household Economy Approach results, Emergency Food Security Assessments, etc. Underlying factors. The contribution of underlying factors to humanitarian outcomes is calculated using a frequency count (the number of times one underlying factor was mentioned as one of the main factors contributing to insufficient access to a particular basic need). The BNA is primarily interested in how much accessibility, availability and quality issues contribute to unmet priority needs, and a standard list of eleven potential causes is proposed in the household questionnaire. A pareto chart is used to display the results. This type of chart is used when analysing data about the frequency of problems or causes in a process, when there are many problems or causes and it is important to focus only on the most significant or when analysing broad causes by looking at their specific components. The bars indicate the number of times an underlying factor was mentioned by the head of household as contributing to priority unmet needs. The bars are placed on the graph in rank order, that is the bar at the left has the highest contribution to priority needs. A cumulative orange line is used to add the percentages from each bar, starting at the left (highest contributor) bar. The colour of the bar encodes the category of underlying factors, i.e. access, availability of quality. The following graph reads as follows: Head of households mentioned that priority needs originate in 77% of the cases from issues related to lack of financial power, safety, transfer (support from government, authorities or humanitarian actors) and domestic production. Issues are therefore mostly related to accessibility rather than availability of goods and services. Main underlying factors, Nigeria pilot, June 2017
Reference question in the questionnaires

Basic needs & Preliminary Response Options Analysis Tool
47
Community group discussion Household interview Underlying factors Question B2-B4 Question D8
Analytical output Pareto analysis on main underlying and contributing factors. Priority needs and preferred type of assistance. BNA seeks an understanding of the key priorities as expressed by the population interviewed, and their preferred type of assistance. Community groups and heads of households are requested to provide their preferences, using an ordinal scale (top 1, top 2, top 3 priority need or preferred assistance). The results are calculated using Borda count7 and displayed using heatmaps. While there is a rank order in the numbers assigned to the categories of the variable, the “distance” between the preference levels is not equal or known. Note also that a “lower” ranking, demand, priority or preference does not imply an “absence of preference”. It only means that other items or interventions are requested, preferred and given more importance and that the item does not qualify regularly in the top three preferences as expressed by the population. Therefore, the heat maps display only the most frequently mentioned “top three” items. To understand better priority needs, head of households are also requested to indicate how they would allocate a fixed amount of cash to cover their current basic needs. This provide with an indication of which of the mentioned issues is solvable using cash, but also of the importance of the need based on the allocation amount. Reference question in the questionnaires Community group discussion Household interview Priority needs Question D7 Preferred assistance Question XX Question D9 Money allocation Question D6-D7 Analytical output Priority needs (Borda count) Preferred assistance (Borda count) Money allocation (Average amount allocation)
7 The Borda count determines the most preferred items of an election by giving each response a certain number of points corresponding to the position in which it is ranked by each respondent. Once all preferences have been counted, the item with the most points is determined as the most preferred. See ACAPS Resources: http://www.acaps.org/resourcescats/downloader/heat_maps_as_tools_to_summarise_priorities/69

Basic needs & Preliminary Response Options Analysis Tool
48
Livelihood coping strategy index. The Livelihood Coping Strategies indicator8 is derived from a series of questions regarding the household’s experience with livelihood stress and asset depletion during the 30 days prior to survey. Responses are used to understand the stress and insecurity faced by households and describes their capacity to regarding future productivity. A master list of livelihoods coping strategies presents all potential questionnaire items for this indicator. All strategies are classified into three broad groups, namely stress, crisis and emergency strategies. Stress strategies, such as borrowing money or spending savings, are those which indicate a reduced ability to deal with future shocks due to a current reduction in resources or increase in debts. Crisis strategies, such as selling productive assets, directly reduce future productivity, including human capital formation. Emergency strategies, such as selling one's land, affect future productivity, but are more difficult to reverse or more dramatic in nature. Reference question in the questionnaires Community group discussion Household interview Livelihood coping strategies Question C9 Analytical output Livelihood coping strategies index Demographic and socio-economic profile. Some basic demographic and socio-economic information is required for each interviewed household, to better understand the composition and specific needs in each family, as well as their livelihood, sources of income and ways of accessing cash. Reference question in the questionnaires Community group discussion Household interview
Age/sex head of household Question B1-B2 Displacement Question B4
# family members by age and sex Question B5
# of family members with specific needs Question B8
Education level Question B9 # of school-aged children
attending school Question B10-B11 # of family members
contributing HH income Question C1 Main sources of income Question C2
Main ways of accessing cash Question C3 Total family income Question C4
8 For more information and guidance on the Livelihood coping strategy index and how to adapt it to each context, please refer to the consolidated approach for reporting indicators of food security (CARI) from WFP

Basic needs & Preliminary Response Options Analysis Tool
49
Alternative source of cash Question C5 Debt level Question C6
Savings Question C7 Analytical output Average # people per household #/% of people with specific needs Highest education level per household School drop out #/% of active family members Main income generating activities Main ways of accessing cash Average income family level Alternative source of cash, apart from income generating revenues Level of debt (ratio debt vs income) # of days saving can sustain expenditure Once all key BNA variables have been prepared, visualized and validated, analysts can move to the next level, descriptive analysis. Generally, BNA analysts will have already noticed some interesting patterns, messages or stories during the preparatory stage. It is important during this phase of data manipulation and transformation to suspend judgment and stand back from the results, so as to not influence future judgments and suffer later from selection and confirmation bias. More on data preparation: WFP 2013 Consolidated approach for reporting indicators of food security (CARI) Save the Children 2008 The Practitioner’s Guide to the Household Economy Approach ACAPS 2013 How to approach a dataset part 2: Data preparation ICRC 2017 Acquiring and analysing data in support of evidence-based decisions Descriptive analysis – Summarize and compare Each of the variables presented in the previous section should be summarized using relevant descriptive statistics (mode, median, mean, %, frequency count, etc.) and disaggregated according to the pre-identified categories of analysis, e.g. by geographical area, affected group, etc. when and if the sample allows. Results within and between categories of analysis should be systematically screened and contrasted to identify similarities and differences, anomalies, patterns or trends. The core team perception of patterns in qualitative or quantitative data is fundamental to the sense-making process. For example, certain severity conditions may cluster in particular geographical areas or people from a particular group may apply similar coping mechanisms. These patterns may not be specifically what was looked for or anticipated, but they may be important in themselves and deserve increased attention and further investigation, or they may shed light on new areas of interest or specific elements of the data. As results are compared, BNA analysts develop an understanding of what is known about assessed situations, people, places, or objects, and what is valid or worth noting about who, what, when, where, and how. Key dimensions to systematically compare for BNA are:

Basic needs & Preliminary Response Options Analysis Tool
50
Time comparisons: Before, current and future conditions Main categories of interest: Compare humanitarian outcomes, sufficiency, main underlying factors, expenditures, priorities, etc. across affected groups, basic needs and geographical areas Sample graph comparing the distribution of expenditures per month across basic needs, before the crisis, currently and ideally (currency is NGN).
Box 10. What is worth of interest? What repeats? What goes with what? Look for patterns of repetition or resemblance. In virtually all subjects, repetition is a sign of emphasis. Once apparent similarities have been located, analysts can refine their thinking by pursuing significant distinctions among the similar things (looking at differences within the similarity or similarities despite the difference). What is opposed to what? Look for binary oppositions. Sometimes patterns of repetition are significant because they are part of a contrast around which the subject matter is structured. One advantage of detecting repetition is that it will lead
analysts to discover opposites which are central to locating issues and concerns. What doesn’t fit? Look for anomalies, outliers, and things that don’t fit. An anomaly is literally something
that cannot be named, a deviation from the normal order. Anomalies help us revise stereotypical assumptions, and noticing them often leads to new and better ideas. Observations can fall outside the norms for three reasons: errors, extraordinary events or extraordinary people / institutions / organizations.
More on descriptive analysis: ICRC 2017 Acquiring and analysing data in support of evidence-based decisions ACAPS 2013 How to approach a dataset part 2: Data preparation ACAPS 2013 How to approach a dataset part 3: Analysis Explanatory analysis – Connect and relate Explanatory analysis looks for associations and correlations between observations and measurements. Identifying relationships is an important part of the analysis process, because it prepares for moving from a simple description of the population conditions and settings to explanations of why and how things happened as they did, and which underlying factors, processes and causal mechanisms are at play. This level of analysis implies carefully assessing whether two or more variables, conditions, or
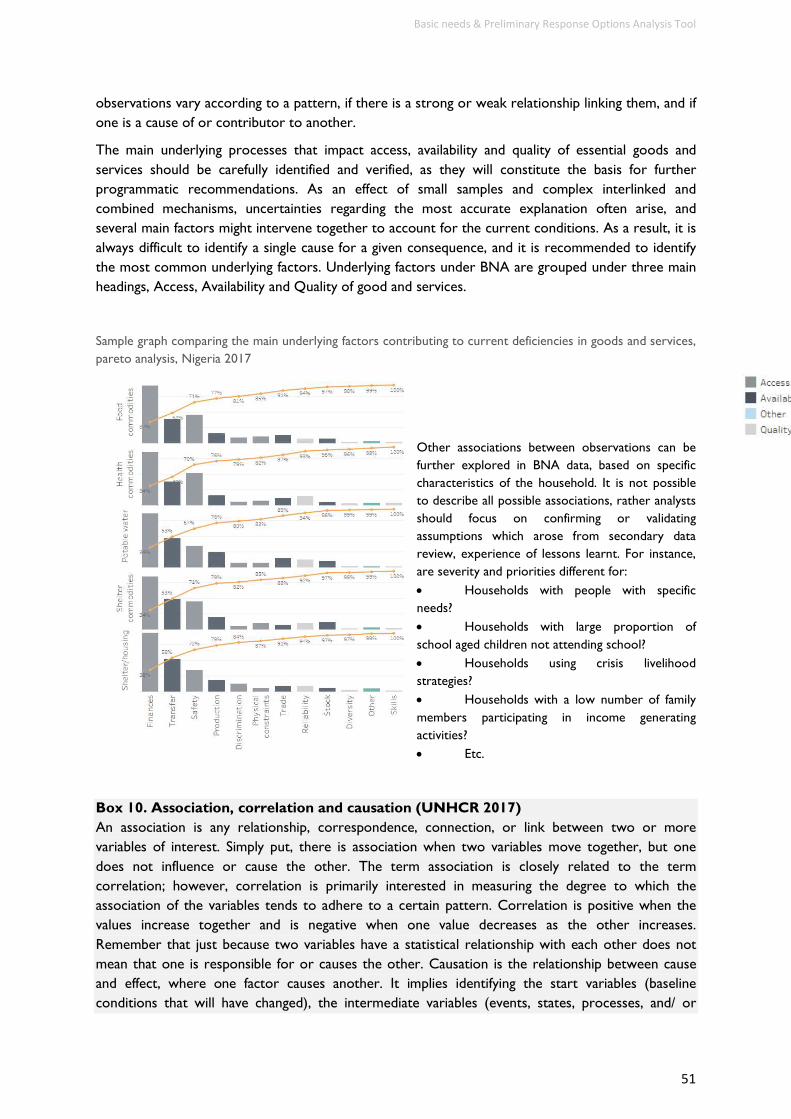
Basic needs & Preliminary Response Options Analysis Tool
51
observations vary according to a pattern, if there is a strong or weak relationship linking them, and if one is a cause of or contributor to another. The main underlying processes that impact access, availability and quality of essential goods and services should be carefully identified and verified, as they will constitute the basis for further programmatic recommendations. As an effect of small samples and complex interlinked and combined mechanisms, uncertainties regarding the most accurate explanation often arise, and several main factors might intervene together to account for the current conditions. As a result, it is always difficult to identify a single cause for a given consequence, and it is recommended to identify the most common underlying factors. Underlying factors under BNA are grouped under three main headings, Access, Availability and Quality of good and services. Sample graph comparing the main underlying factors contributing to current deficiencies in goods and services, pareto analysis, Nigeria 2017
Other associations between observations can be further explored in BNA data, based on specific characteristics of the household. It is not possible to describe all possible associations, rather analysts should focus on confirming or validating assumptions which arose from secondary data review, experience of lessons learnt. For instance, are severity and priorities different for: Households with people with specific needs? Households with large proportion of school aged children not attending school? Households using crisis livelihood strategies? Households with a low number of family members participating in income generating activities? Etc.
Box 10. Association, correlation and causation (UNHCR 2017) An association is any relationship, correspondence, connection, or link between two or more variables of interest. Simply put, there is association when two variables move together, but one does not influence or cause the other. The term association is closely related to the term correlation; however, correlation is primarily interested in measuring the degree to which the association of the variables tends to adhere to a certain pattern. Correlation is positive when the values increase together and is negative when one value decreases as the other increases. Remember that just because two variables have a statistical relationship with each other does not mean that one is responsible for or causes the other. Causation is the relationship between cause and effect, where one factor causes another. It implies identifying the start variables (baseline conditions that will have changed), the intermediate variables (events, states, processes, and/ or

Basic needs & Preliminary Response Options Analysis Tool
52
factors that initiate changes or action of some kind), and the outcomes (the consequent and final results, positive or negative, of start and mediating variables). Analysts should be cautious and should not treat simultaneity (or co-occurrence) as causation Interpretive analysis – Imply and conclude Interpretation is the process of attaching meaning to data, from observations to implications, and ultimately to conclusions. The interpretation process involves careful arguments, evaluation of the strength of evidence, attention to plausibility in context and anticipation of future events or possible scenarios. Not all observed insufficiencies, gaps or discrepancies have the same importance. Some contribute more than others to the deterioration of the physical, mental, or social well-being of an affected population, and thus need immediate attention. Establishing the degree of harmful consequences for each unmet basic need, as well as the number of people facing those conditions allows for issues to be prioritized based on their actual or expected negative outcomes and their prevalence among a given population. Establishing severity allows to identify unmet basic needs that are a priority for intervention, and to compare also with the preferences expressed by the population themselves, and also the feedback received from BNA field assessments teams. Beyond most severe and priority unmet basic needs, priority geographical areas or population groups that have been the most severely impacted should also be identified. Sample graph comparing % of population by severity class, severity of conditions by affected group and priority basic needs, Nigeria 2017.
Interpreting current conditions, severity and priorities is not enough. Future developments should be considered to anticipate how these might impact current conditions and the nature and severity of needs for different groups in different areas. For each basic need, BNA requires head of households to indicate their degree of concern for the future as to provide indications on the evolution of humanitarian outcomes. If time is available, risk analysis and scenarios should be used to identify the likelihood of future events and trends in a specifically identified time frame (e.g. three to six months), based on current and historical data. Strengths and limitations of the evidence that supports final conclusions and the reasoning behind analytical judgments must be assessed in order to detect possible flaws in arguments and establish

Basic needs & Preliminary Response Options Analysis Tool
53
the trustworthiness and credibility of conclusions. Conclusions derived from assumptions rather than the available data should be clearly flagged and communicated to avoid risk of misinterpretation. The number of observations supporting conclusions should be clearly displayed to avoid misinterpretation based on small samples. In cases where a random sample has been used, interpretation also implies determining the conditions and extent to which findings can apply to other places or population groups through careful generalization and inferences. More on interpretive analysis: ACAPS 2016 How to build scenario in preparation for or during humanitarian crises ACAPS 2013 How sure are you?

54
To facilitate the interpretation of findings and access to details, all results can be summarized in a dashboard, using excel power BI or Tableau software. Sample summary dashboard, Nigeria 2017

55
IV. Communication and dissemination The impact of BNA analysis is largely determined by the organization, clarity and credibility of arguments and the reasoning behind it. However, this is not enough. Findings are only useful if the core team succeed in communicating and conveying clearly and effectively the key message(s). This requires understanding how messages are being retained by an audience, balancing respect for the data, honesty about the limitations and uncertainties of the analysis and an understanding of the end users, their expertise, data literacy and their main concerns, as well as the decisions they might have to take based on the analysis. The more tailored the final product is to the end users, the more impact it will have. In order for BNA to serve its purpose and have operational impact for the benefit of affected populations, analysis results must be communicated in a timely and effective manner, and disseminated to appropriate audiences. A dissemination plan should be established at the planning phase of the exercise, since each end user of the findings may require them to be presented via different products and platforms. Box 11. Expected outputs of the communication and dissemination stage Report: Word or power point presentation, containing a methodology section, an executive
summary Data and documentation: Primary data in an excel format, anonymized and protected, graphs and
maps. Folder for secondary data documents: Shared workspace with an agreed folder structure and
naming convention for storage of key documents from primary and secondary data review The BNA report. A report produced at the end of the assessment process can be adjusted to suit a number of audiences, but it must at all times be structured to assist with the defined purpose and objective(s). The report should be as short as possible, and the outline should be developed at the outset of the needs assessment initiative in order for stakeholders to agree on expectations and anticipated results. For long reports, an executive summary of the assessment findings should appear at the beginning. Needs assessment reports should include the following: Box 12. BNA Report outline (see also template in word in the toolbox) 1. Executive summary
Priority geographic areas, groups and needs
Assistance required Critical markets and systems of service
provision Preferred assistance modalities Minimum expenditure basket Information gaps and needs
2. Background and methodology
Underlying factors Market and systems of service provision Preferred assistance options Minimum Expenditure basket Seasonality of expenditures Demographic data Household economy and livelihoods Summary dashboard
4. Sector specific findings (optional) Severity of unmet needs
Basic needs & Preliminary Response Options Analysis Tool
56
Objective and scope Key definitions and concepts Data collection techniques and sampling Activities and timeframe Limitations of the methodology How to read charts
3. Key findings
Priority geographical areas Priority Affected groups Priority basic needs
Priority geographical areas and affected groups
Underlying factors Markets and systems of service provision Preferred assistance options Seasonality of expenditures
5. Annexes
Detailed sampling plan Questionnaires Secondary Data Review
BNA report should be released as soon as possible, i.e. as soon as validated and approved by the core team and the relevant stakeholders. Data on needs becomes stale very quickly, particularly as more assessments are conducted and the situation on the ground changes. Consider sharing preliminary findings with relevant stakeholders prior to the final report, especially if approval is required before publication. Keep the validation and consultation process as short as possible without compromising quality, consensus, and buy-in. Documenting data and methods. Limitations in analysis will emerge from the interpretation phase and should be reported honestly and explicitly in written form in the final report. All aspects of the assessment methodology need to be clearly articulated and openly shared. This includes the way the assessment was carried out, the information sources used, sites selected, timeframe, personnel involved, and decisions made about the processing of the collected information, e.g. thresholds, missing data, etc. It also includes the assumptions made in developing scenarios and how conclusions were reached. Information is required both on the data and on the methods by which they were collected and analysed. Required documentation on data and methods for BNA Data documentation Method documentation Cases: number and location of samples,
maps of covered sites or location. Content: details about type and sources
of data used, calculations, transformation, etc.
Values: details or remarks on missing values or outliers and processing decisions.
Design: description of the assessment design, number and training of enumerators, team composition, data collection methods, instrument pre-testing. Attach the questionnaire.
Sample: describe the sampling process and list the sites visited, include P-Codes if and when available.
Data processing: coding, data entry, error checking, cleaning procedures.
Joint analysis: description, participants, documents, decisions and disagreements.
Credits: credits to participants and logos of contributing agencies, donors, etc.

Basic needs & Preliminary Response Options Analysis Tool
57
Sharing findings and data. Once data has been collected and analysed, findings and data should be shared and made easily accessible to support decision making. Protocols for data sharing should be negotiated among partners to regulate the sharing of aggregated findings and/ or raw data. It is important to share this information both internally and externally as appropriate, based on agreed dissemination plans and data-sharing protocols, and after having identified and mitigated any potential protection concerns. For instance, in insecure environments, BNA might contain sensitive information potentially endangering the affected population or respondents and the data cannot always be shared publicly, calling for specific measures to be adopted for protecting and sharing data. Aside from traditional hard-copy dissemination, there are many ways to distribute assessment findings electronically, including the following: UNHCR operational web portals, Refworld; HumanitarianResponse.info and ReliefWeb; Shared data repository such as HDX, Cluster-specific websites (i.e. sheltercluster.org, globalprotectioncluster.org,
globalcccmcluster.org, etc.); Social media such as Facebook, Twitter, Google Plus, Yammer; and File synchronization services such as Sharepoint, Dropbox, and the Humanitarian Kiosk. Box 13. Recommendations for reporting and dissemination Be clear and transparent on the limitations of your analysis, the methods used to reach
conclusions, and your degree of uncertainty or confidence on the findings. Present results accordingly.
Make the assessment questionnaires, tools, checklists, and other documentation publicly available, explaining how they were used during the assessment.
Key terms should be clearly defined to avoid misunderstanding and different interpretations. For example, what does ‘affected’ mean? What does ‘damage’ mean? What is meant by ‘site’? Use accepted terms and standards, e.g. SPHERE, etc. Avoid jargon and technical language.
In case the information is available, ensure that the report captures how the female and male population from different diversity and age groups has been affected. Clearly spell out throughout the report how the situation distinctly affects different groups.
When using affected population figures estimates, explain the methodology used to reach the final number or range. Be explicit, precise and double-check figures. Record source and other metadata.
Include maps and use data visualization to ease the understanding process. Articulate results. Translate conclusions into easily understandable results and focus on value
added. Summarize the main findings briefly and clearly in an executive summary. This section should draw together the various findings from the needs assessment into a few coherent messages. Also include a ‘key messages’ section in the report.
Share findings with affected communities and national authorities to ensure accountability. Clearly identify information gaps, or the known unknowns, and needs for further assessment
phases. Give credit to participating stakeholders. More on communication and dissemination: ICRC 2017 Acquiring and analysing data in support of evidence-based decisions ACAPS 2012 Documenting data and method in rapid assessments

Basic needs & Preliminary Response Options Analysis Tool
58
Annexes Annex 1 – Questionnaires
Two standard questionnaires are proposed below to implement BNA: 1 household level questionnaire, 2 pages, to be addressed to the Head of Household (mother, father or any
person responsible to provide for their dependents). Average implementation time is 50min. 1 Community Group Discussion questionnaire, 2 pages, to be addressed to a selection (Maximum 10) of
males or females belonging to a same affected group (IDPs, non IDPS, etc., depending on the targeting and the sampling strategy). Average implementation time is 1 hour.
If resources and time are sufficient, conduct and analyse first the community group discussions, then adapt the household questionnaire based on the result of the Community Group Discussion, and conduct the interviews in the same locations. In all situations, the two questionnaires will need to be adapted, piloted and in some instance, translated. The standard questionnaires proposed in this annex only contain the core variables required to conduct BNA. Organisations or agencies using BNA are free to add more questions depending on their information needs. For instance, question B10, B11 and C8 (grey colour background) are not necessary to conduct the core analysis, but are example of questions that can be added to obtain more specific or contextual information. On average, the proposed questionnaire for the Community Group Discussion can be implemented in one hour, and the Household questionnaire in 50 min. BNA can be applied either in sudden onset or protracted crisis. Depending on the context, the questionnaires need to be adapted to fit the purpose. The table below summarize the main adaptations required. Sudden onset Protracted Insert “before” and “now” questions to measure change and impact. Define clearly date or event for the “Before”
Do not use “before” and “now” questions for time periods greater than one year, unless you have a specific event to mention, e.g. since the presidential election in May 2015, etc.
Set the forecast timeframe to 3-6 months Set the forecast timeframe to 3-9 month depending on the level of volatility and expected changes in context
Adapt displacement timeframes for displaced groups, e.g. less than 3 months, between 3 and 6 months, 6 and 12 months, over a year, etc.

Basic needs & Preliminary Response Options Analysis Tool
59
Some variables of the BNA and the data collection tools need to be precisely defined and adapted in each situation:
The final list of goods and services that will be used in both the CGDs and the HHIs needs to be validated. It can be done through secondary data review, using existing Minimum Expenditures Baskets, expert opinions or after the Community Groups Discussion if they are implemented first.
The definition of a household. The definition proposed is from the Household Economy Approach, where a household refers to a group of people, each with different abilities and needs, who live together most of the time and contribute to a common economy, and share the food and other income from this. However, definitions of households might vary across contexts and if necessary will need to be adapted.
Definitions of affected groups. Refer to the humanitarian profile in country or existing definitions for affected groups (e.g. IDPs in public building, tents, etc.) and settings (e.g. rural, urban, peri urban, area of high conflict intensity, livelihood zone, etc.)
The average number of members in one household. This number might vary per affected groups and location. Refer to baseline information, past surveys or registration lists, etc. to establish the average size of households. Check also with enumerators during the training.
Recall time frame: Some questions require to adapt the recall period, such as “since the beginning of this crisis, since the last harvest, in the last seven days, in the last 30 days, etc. Be as specific as possible to avoid confusion and different interpretation from respondents.
School age for primary, secondary, university. Provide enumerators with the normal age intervals for children going to primary or secondary school as well as university, so they can provide respondents with a reference value.
Main income generating activities. Each country has different types of activities. Refer to existing surveys, e.g. Household economy approach, livelihood survey, etc. and liaise with specialists if necessary to identify the right response options. Validate during the training with the enumerators
Currency. Specify in the questionnaire in which currency expenditures and income levels should be recorded.
Minor age limit: Internationally, any person below 18 years old is considered a minor. However, this age limit differs in some countries. Always use the in country legal age limit, if available.
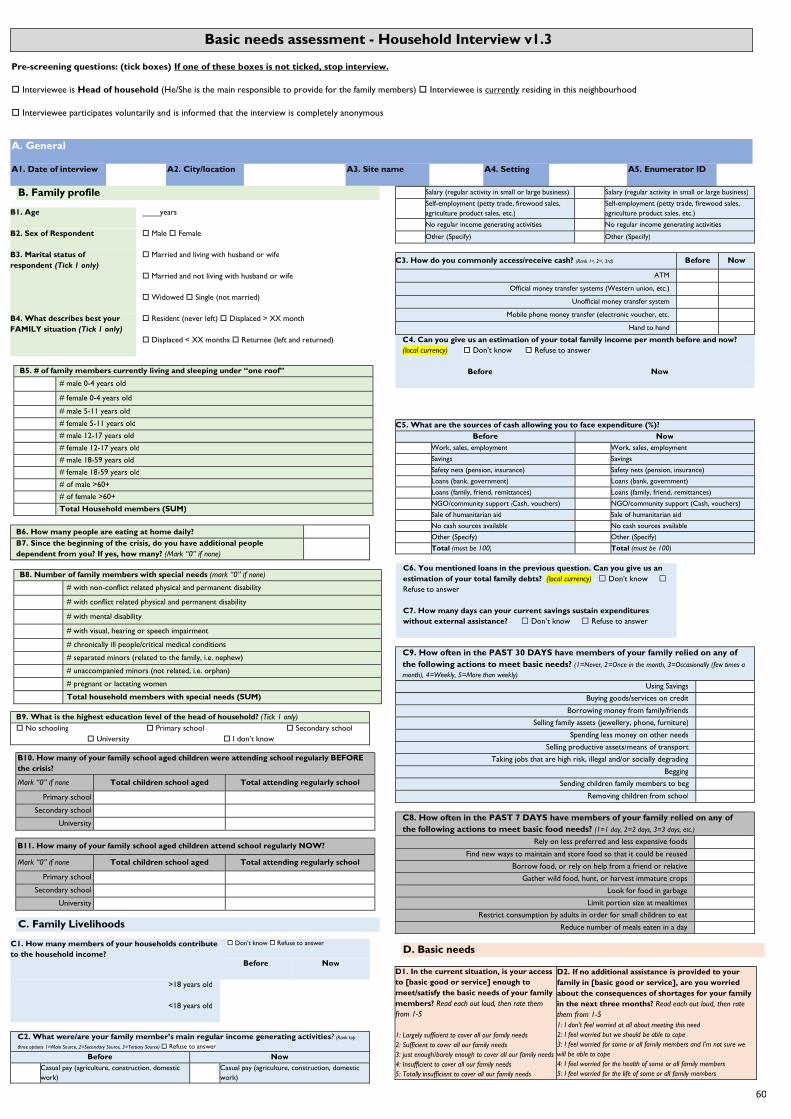
60
Basic needs assessment - Household Interview v1.3
Pre-screening questions: (tick boxes) If one of these boxes is not ticked, stop interview. Interviewee is Head of household (He/She is the main responsible to provide for the family members) Interviewee is currently residing in this neighbourhood Interviewee participates voluntarily and is informed that the interview is completely anonymous
A. General A1. Date of interview A2. City/location A3. Site name A4. Setting A5. Enumerator ID
B. Family profile
B1. Age ____years B2. Sex of Respondent Male Female B3. Marital status of respondent (Tick 1 only)
Married and living with husband or wife Married and not living with husband or wife Widowed Single (not married)
B4. What describes best your FAMILY situation (Tick 1 only)
Resident (never left) Displaced > XX month Displaced < XX months Returnee (left and returned)
B5. # of family members currently living and sleeping under “one roof” # male 0-4 years old # female 0-4 years old # male 5-11 years old # female 5-11 years old # male 12-17 years old # female 12-17 years old # male 18-59 years old # female 18-59 years old # of male >60+ # of female >60+ Total Household members (SUM) B6. How many people are eating at home daily? B7. Since the beginning of the crisis, do you have additional people dependent from you? If yes, how many? (Mark “0” if none) B8. Number of family members with special needs (mark “0” if none) # with non-conflict related physical and permanent disability # with conflict related physical and permanent disability # with mental disability # with visual, hearing or speech impairment # chronically ill people/critical medical conditions # separated minors (related to the family, i.e. nephew) # unaccompanied minors (not related, i.e. orphan) # pregnant or lactating women Total household members with special needs (SUM)
B9. What is the highest education level of the head of household? (Tick 1 only) No schooling Primary school Secondary school University I don’t know
B10. How many of your family school aged children were attending school regularly BEFORE the crisis? Mark “0” if none Total children school aged Total attending regularly school
Primary school Secondary school
University
B11. How many of your family school aged children attend school regularly NOW? Mark “0” if none Total children school aged Total attending regularly school
Primary school Secondary school
University C. Family Livelihoods
C1. How many members of your households contribute to the household income?
Don’t know Refuse to answer
Before Now
>18 years old
<18 years old
C2. What were/are your family member’s main regular income generating activities? (Rank top three options 1=Main Source, 2=Secondary Source, 3=Tertiary Source) Refuse to answer
Before Now Casual pay (agriculture, construction, domestic
work) Casual pay (agriculture, construction, domestic work)
Salary (regular activity in small or large business) Salary (regular activity in small or large business) Self-employment (petty trade, firewood sales,
agriculture product sales, etc.) Self-employment (petty trade, firewood sales, agriculture product sales, etc.)
No regular income generating activities No regular income generating activities Other (Specify) Other (Specify)
C3. How do you commonly access/receive cash? (Rank 1st, 2nd, 3rd) Before Now ATM
Official money transfer systems (Western union, etc.) Unofficial money transfer system
Mobile phone money transfer (electronic voucher, etc. Hand to hand
C4. Can you give us an estimation of your total family income per month before and now? (local currency) Don’t know Refuse to answer
Before Now
C5. What are the sources of cash allowing you to face expenditure (%)? Before Now
Work, sales, employment Work, sales, employment Savings Savings Safety nets (pension, insurance) Safety nets (pension, insurance) Loans (bank, government) Loans (bank, government) Loans (family, friend, remittances) Loans (family, friend, remittances) NGO/community support (Cash, vouchers) NGO/community support (Cash, vouchers) Sale of humanitarian aid Sale of humanitarian aid No cash sources available No cash sources available Other (Specify) Other (Specify) Total (must be 100) Total (must be 100)
C6. You mentioned loans in the previous question. Can you give us an estimation of your total family debts? (local currency) Don’t know Refuse to answer
C7. How many days can your current savings sustain expenditures without external assistance? Don’t know Refuse to answer
C9. How often in the PAST 30 DAYS have members of your family relied on any of the following actions to meet basic needs? (1=Never, 2=Once in the month, 3=Occasionally (few times a month), 4=Weekly, 5=More than weekly)
Using Savings Buying goods/services on credit
Borrowing money from family/friends Selling family assets (jewellery, phone, furniture)
Spending less money on other needs Selling productive assets/means of transport
Taking jobs that are high risk, illegal and/or socially degrading Begging
Sending children family members to beg Removing children from school
C8. How often in the PAST 7 DAYS have members of your family relied on any of the following actions to meet basic food needs? (1=1 day, 2=2 days, 3=3 days, etc.)
Rely on less preferred and less expensive foods Find new ways to maintain and store food so that it could be reused
Borrow food, or rely on help from a friend or relative Gather wild food, hunt, or harvest immature crops
Look for food in garbage Limit portion size at mealtimes
Restrict consumption by adults in order for small children to eat Reduce number of meals eaten in a day
D. Basic needs
D1. In the current situation, is your access to [basic good or service] enough to meet/satisfy the basic needs of your family members? Read each out loud, then rate them from 1-5 1: Largely sufficient to cover all our family needs 2: Sufficient to cover all our family needs 3: just enough/barely enough to cover all our family needs 4: Insufficient to cover all our family needs 5: Totally insufficient to cover all our family needs
D2. If no additional assistance is provided to your family in [basic good or service], are you worried about the consequences of shortages for your family in the next three months? Read each out loud, then rate them from 1-5 1: I don’t feel worried at all about meeting this need 2: I feel worried but we should be able to cope 3: I feel worried for some or all family members and I’m not sure we will be able to cope 4: I feel worried for the health of some or all family members 5: I feel worried for the life of some or all family members

61
List of basic needs D1 D2 Communication commodities (Phone, credit, etc.)
Communication services (providers, towers, network, etc.) Education commodities (uniforms, shoes, stationaries, books, etc.)
Education services (transport, fees, teachers, etc.) Energy commodities for heating, cooking, lightning and charging
Food commodities (Staple and non-staple, etc.) Health care services (Health staff, centre, etc.)
Health commodities (drugs, etc.) Household commodities (Utensils, pots, mats, blanket, mosquito net, cooking set, etc.)
Hygiene commodities (Clothing, washing, soap, toothbrush, pads, diapers, etc.) Hygiene/sanitation facilities (toilets, shower, bath, etc.)
Potable water (incl. containers, treatment, etc.) Shelter commodities (furniture’s, material, etc.)
Shelter/housing (rent, purchase, construction services, etc.) Transport services (All except education, to work, health centre, markets, etc.)
Other (Legal support, special needs, etc.)

62
D3. How far is the nearest place where you commonly access [basic goods or services]. Also, could you tell us who provide you with [good or service] at this place? Combine answers about distance and type of provider, i.e. A5 is Local distance (5-15mn) and provided by local/national authorities Distance (time) Service/good/facility provider:
D.4. Let’s discuss about your family expenditures. How much (local currency) does your family dedicate each month to cover the following basic goods and services? D5. What would be
the minimum local currency required per month to cover the basic needs of all your family members without compromising your health, assets and dignity?
D6. If you received XXXX this month, how would you spend it across the following. Split the XXXX across the categories. Total must be XXXX
Cover basic needs Repay debts Savings
A: In house (0-5min) B: Local (5-1H) C: Remote (>1H) D: Remote (>2H) E: Remote (>5H)
1: From nature/natural resource 2: Own production/good 3: Purchase from private/professional/market 4: NGO/community support 5: Local/national authorities Before (Local
currency) Now (Local currency)
D7. If you received XXXX this month only to cover your basic needs, how would you spend it across the following goods and services? Split the XXXX across. Total must be XXXX
Communication commodities (Phone, credit, etc.) Communication services (providers, towers,
network, etc.) Education commodities (uniforms, shoes,
stationaries, books, etc.) Education services (transport, fees, teachers, etc.) Energy commodities for heating, cooking, lightning
and charging Food commodities (Staple and non-staple, etc.) Health care services (Health staff, centre, etc.)
Health commodities (drugs, etc.) Household commodities (Utensils, pots, mats,
blanket, mosquito net, cooking set etc.) Hygiene commodities (Clothing, washing, soap,
toothbrush, pads, diapers, etc.) Hygiene/sanitation facilities (toilets, shower, bath,
etc.) Potable water (incl. containers, treatment, etc.) Shelter commodities (furniture’s, material, etc.)
Shelter/housing (rent, purchase, construction services, etc.)
Transport services to work, health centre, markets, etc.)
Other (Legal support, special needs, etc.) Total (local currency)
D7. From the following list, what are the basic needs you will have the most difficulties meeting in the next three months and that you consider a priority for assistance? Rank 1st, 2nd, 3rd?
D8. For the three goods or services identified as a priority for assistance, what are the main reasons why you can’t cover/meet this basic need? Select from the following list: A. Physical and logistical constraints to access markets/service providers, e.g. distance, roads blockades, etc. B. Insecurity hindering access to markets/service providers C. Social discrimination hindering access to markets/service providers D. Insufficient money/income/resources to purchase/access goods or services E. Insufficient goods/services/infrastructures produced/available locally F. Insufficient traders supplying the area G. Insufficient local reserve/resource/stock/facilities H. Insufficient assistance or support provided by government/community I. insufficient diversity of good and services J. Insufficient skills and competencies of service providers K. Insufficient safety or reliability of provided goods or services
D9. For each good or service you mentioned as a priority, which type of assistance would you favour to help you meeting this basic need? You can choose between cash, in-kind aid or service provision. Rank 1st, 2nd, 3rd preferred option
Basic needs Rank order 1st reason 2nd reason 3rd reason In kind Service
provision Cash Food commodities (Staple and non-staple,
etc.)
Health commodities (drugs, etc.)
Health care services (Health staff, centre, etc.) Potable water (incl. containers, treatment,
etc.)
Shelter commodities (furniture’s, material, etc.)
Shelter/housing (rent, purchase, construction,
etc.)
Households commodities (Utensils, pots, mats, blanket, mosquito net, cooking set, etc.)
Hygiene commodities (Clothing, washing,
soap, toothbrush, pads, diapers, etc.)
Hygiene/sanitation facilities (toilets, shower, bath, etc.)
Energy commodities for heating, cooking,
lightning and charging
Transport services (All except education, to work, health centre, markets, etc.)
Education commodities (uniforms, shoes,
stationaries, books, etc.)
Education services (transport, fees, teachers, etc.)
Communication commodities (Phone, credit,
etc.)
Communication services (providers, towers, network, etc.)
Other (Legal support, special needs, etc.)

63 Funded by European Union Humanitarian Aid
Basic needs assessment – Community Group Discussion v1.3 Hi, how are you? Let me introduce myself: I am ______ from (enter your agency) and I am responsible for collecting information that will help us better understand your basic needs, on behalf of the humanitarian community. It is anonymous and confidential and will take roughly 1 hour. We will be talking first about what you consider to be basic needs and how you are meeting them, before the current crisis and now. We will then try to understand how much does it cost for one family to meet those basic needs. But first let me make sure of the following: Pre-screening questions: (tick boxes) If one of these boxes is not ticked, stop interview. Participants all belong to a same affected group (e.g. IDPs, returnees, Non IDPs, etc.) Group participants are all head of households Group participants all have the same sex (e.g. Male or Female) Participants participate voluntarily and are informed that the interview is completely anonymous A. General A1. Date of interview A2. Site name A3. Setting A4. # of participants A5. Sex of participants A6. Affected group category (IDPs, non IDPS, etc.)
B1.Let’s discuss how essential certain basic services or goods are to you. Under the current conditions, would you say accessing [good or service] is: Read each out loud, then write the highest score 1. Essential to guarantee personal development of family members 2. Essential to maintain the dignity of family members 3.Essential to guarantee health/survival of family members
B2.We would like to know if your community experience shortages of essential goods or services. In the last 30 days, were [goods or services] always available locally to satisfy your basic needs, for instance from nature, local providers, markets or professionals? Read each out loud, then rate from 1-5 1: Always available 2: Most of the time available 3: Sometimes available 4: Rarely available 5: Never available
B3.Sometimes goods or services are available locally, but we can’t access them, because they are too expensive, it’s too dangerous or they are too far. We would like to know if your community faced difficulties in the last 30 days in obtaining or purchasing [goods or services] from nature, local providers, markets or professionals. Are [goods or services]: Read each out loud, then rate from 1-5 1: Very easy to purchase/obtain/access 2: Easy to purchase/obtain/access 3: Sometimes difficult to purchase/obtain/access 4: Very difficult to purchase/obtain/access 5: Impossible to purchase/obtain/access
B4.Sometimes goods or services are available and accessible, but their quality is not good. We would like to know if you are satisfied with the quality of goods and services you have been having access to in the last 30 days. Are you: Read each out loud, then rate 1-5 1: Always satisfied with quality of [good or service] 2: Most of the time satisfied with quality of [good or service] 3: Sometimes unsatisfied with quality of [good or service] 4: Rarely satisfied with quality of [good or service] 5: Never satisfied with quality of [good or service]
B5.For each good or service that scored 3, 4 or 5 in at least one among availability, access of quality, please indicate which type of community assistance could be provided to help solve the issue. You can choose between cash assistance to households, in-kind aid (e.g. distribution of goods, etc.) or service provision (e.g. medical consultation, etc.). Rank 1st, 2nd, 3rd preferred option
Cash In kind Service Food commodities (Staple and non-staple, etc.)
Health commodities (drugs, etc.)
Health care services (Health staff, centre, etc.)
Potable water (incl. containers, treatment, etc.)
Shelter commodities (furniture’s, material, etc.)
Shelter/housing (rent, purchase, construction, etc.)
Households commodities (Utensils, pots, mats, blanket, mosquito net, cooking set, etc.)
Hygiene commodities (Clothing, washing, soap, toothbrush, pads, diapers, etc.)
Hygiene/sanitation facilities (toilets, shower, bath, etc.)
Energy commodities for heating, cooking, lightning and charging
Transport services (All except education, to work, health centre, markets, etc.)

64 Funded by European Union Humanitarian Aid
Education commodities (uniforms, shoes, stationaries, books, etc.)
Education services (transport, fees, teachers, etc.)
Communication commodities (Phone, credit, etc.)
Communication services (providers, towers, network, etc.)
Other (Legal support, special needs, etc.)
B6.What is the minimum amount of cash required to meet the basic needs of one average family (XX parents and XX children) for one month in (local currency)? Indicate amount before the crisis started and now.
B7.Please provide total expenditure for each month of the year for this family. Start with the amount required this month, then proceed to the next month. The monthly expenditure should account for seasonal variation of prices and change in consumption. Write “zero” if there are no expenditures
B8.In this column, provide details and explanations for regular (food, water, electricity), seasonal (Lean season) or one-off expenditures (e.g. Annual school fee). In case extraordinary expenditures are required (e.g. new shelter construction), indicate also in this column the required expenditure. Before the crisis Now Jan Feb Mar Apr May Jun Jul Aug Sep Oct Nov Dec
Food commodities (Staple and non-staple, etc.)
Health commodities (drugs, etc.)
Health care services (Health staff, centre, etc.)
Potable water (incl. containers, treatment, etc.)
Shelter commodities (furniture’s, material, etc.)
Shelter/housing (rent, purchase, construction, etc.)
Households commodities (Utensils, pots, mats, blanket, mosquito net, cooking set,
etc.)
Hygiene commodities (Clothing, washing, soap, toothbrush, pads, diapers, etc.)
Hygiene/sanitation facilities (toilets, shower, bath, etc.)
Energy commodities for heating, cooking, lightning and charging
Transport services (All except education, to work, health centre, markets, etc.)

65 Funded by European Union Humanitarian Aid
Education commodities (uniforms, shoes, stationaries, books, etc.)
Education services (transport, fees, teachers, etc.)
Communication commodities (Phone, credit, etc.)
Communication services (providers, towers, network, etc.)
Other (Legal support, special needs, etc.)