Baseline Wildlife Monitoring at I-90 Snoqualmie Pass East ...
283
B B a a s s e e l l i i n n e e W W i i l l d d l l i i f f e e M M o o n n i i t t o o r r i i n n g g a a t t I I - - 9 9 0 0 S S n n o o q q u u a a l l m m i i e e P P a a s s s s E E a a s s t t , , P P r r i i o o r r t t o o t t h h e e I I n n s s t t a a l l l l a a t t i i o o n n o o f f W W i i l l d d l l i i f f e e C C r r o o s s s s i i n n g g S S t t r r u u c c t t u u r r e e s s Robert A. Long James S. Begley Paula MacKay Western Transportation Institute College of Engineering Montana State University A Report Prepared for the Washington State Department of Transportation December, 2012 GCA-5400
-
Upload
khangminh22 -
Category
Documents
-
view
2 -
download
0
Transcript of Baseline Wildlife Monitoring at I-90 Snoqualmie Pass East ...

BBBaaassseeellliiinnneee WWWiiillldddllliiifffeee MMMooonnniiitttooorrriiinnnggg aaattt
III---999000 SSSnnnoooqqquuuaaalllmmmiiieee PPPaaassssss EEEaaasssttt,,, PPPrrriiiooorrr tttooo ttthhheee IIInnnssstttaaallllllaaatttiiiooonnn ooofff
WWWiiillldddllliiifffeee CCCrrrooossssssiiinnnggg SSStttrrruuuccctttuuurrreeesss
Robert A. Long James S. Begley Paula MacKay
Western Transportation Institute
College of Engineering Montana State University
A Report Prepared for the Washington State Department of Transportation
December, 2012 GCA-5400


This document should be cited as: Long, R.A., J.S. Begley, and P. MacKay. 2012. Baseline wildlife monitoring at I-90 Snoqualmie Pass East, prior to the installation of wildlife crossing structures. Final report to the Washington State Department of Transportation, Yakima, Washington. Western Transportation Institute, Montana State University, Bozeman, Montana. 270pp.

Baseline wildlife monitoring at I-90 Snoqualmie Pass East Disclaimer
Western Transportation Institute
Disclaimer The opinions, findings, and conclusions expressed in this publication are those of the authors and do not necessarily reflect those of the Washington Department of Transportation or Montana State University.

Baseline wildlife monitoring at I-90 Snoqualmie Pass East Acknowledgements
Western Transportation Institute
Acknowledgments The authors would like to thank the following individuals for their contributions: WTI: Steve Albert, Rob Ament, Kelvin Bateman, Matt Blank, Jeralyn Brodowy, Tony Clevenger, Robbi Colvin, Jamie DuHoux, Doug Galarus, Susan Gallagher, Marcel Huijser, Nick Johnson, Angela Kociolek, Suzanne Lassacher, Carolyn Marx, Daniell Richter, Jerry Stephens WSDOT: Scott Anfinson, Victoria Book, Craig Broadhead, Lynne Cooke, Amy Danberg, Summer Derrey, Doug Eitemiller, Randy Giles, Hyak Maintenance Crew, Terry Kukes, Larry Mattson, Kelly McAllister, Meagan McFadden, Mark Norman, Mark Reynolds, Damon Roberts, Amanda Sullivan, Eric Snider, Paul Wagner, Brian White, Josh Zylstra Central Washington University: Jonathan Betz, Mary Botcher, Tom Cottrell, Dave Darda, Kristina Ernest, Jason Irwin, Paul James, Kariann Linnell, Craig Scrivner, Steve Wagner Conservation Northwest/I-90 Wildlife Bridges Coalition: Becky Beard, Jodi Broughton, Kit McGurn, Charlie Raines, Volunteers, Jen Watkins Miscellaneous: Jeff Buzas (University of Vermont), Karl Halupka (US Fish and Wildlife Service), Rayo McCollough (McCollough Consults), Dave Moskowitz (Wilderness Awareness School), Kylie Paul (Defenders of Wildlife), Ron Rundus (jackfig design), Mike Sawaya (Sinopah Wildlife Research Associates), Andrew Shirk (University of Washington), Paige Singer (Rocky Mountain Wild), Ann Winters (Washington Department of Fish and Wildlife) Montana State University Department of Ecology: Steven Kalinowski, Seth Shy, Joe Smith, Wilson Wright USDA Forest Service: Tim Foss, Bill Gaines (Conservation Science Institute), Patty-Garvey Darda, John Lehmkuhl, Kristen Richardson, Peter Singleton, Aja Woodrow, John Wagenknecht Washington Department of Fish and Wildlife: William Meyer, Josh Nichols, Anthony Novack Wildlife Genetics International: Candace Harris, David Paetkau, Staff We also appreciate the support of the following entities, which provided funding and/or equipment for wildlife monitoring and research in the I-90 region: Aquatic Lands Enhancement Account Conservation Northwest Elinor Patterson Baker Trust Gear for Good Great Northern LCC HSUS Wildlife Land Trust Klorfine Foundation Okanogan-Wenatchee National Forest
Oregon Zoo Future for Wildlife Program Patagonia Seattle City Light Wildlife Research Program The Mountaineers Foundation TransWild Alliance University Transportation Center Program Wilburforce Foundation

Baseline wildlife monitoring at I-90 Snoqualmie Pass East Table of Contents
Western Transportation Institute Page i
Table of Contents Chapter 1 – Introduction ............................................................................................................................... 1
Chapter 2 – Monitoring Wildlife Vehicle Collisions and Live Animal Observations ...................................... 7
Chapter 3 – Monitoring the Pre-Construction Crossing Activity of High-Mobility Species ........................ 45
Chapter 4 – Species Occurrence and Genetic Sampling ............................................................................. 83
Chapter 5 – Evaluating the Effects of I-90 on Northern Flying Squirrel Movement and Gene Flow ........ 105
Literature Cited ......................................................................................................................................... 128
Appendices ................................................................................................................................................ 136

Baseline wildlife monitoring at I-90 Snoqualmie Pass East Table of Contents
Western Transportation Institute Page ii
List of Tables Table 2.1. Variables used in the MaxEnt analysis of landscape features associated with locations of wildlife-vehicle collisions. ........................................................................................................................... 18
Table 2.2. Total number of carcasses reported by WSDOT maintenance crews by species and area, July 2008–June 2012. ......................................................................................................................................... 19
Table 2.3. Total number of WVCs reported on the I-90 Wildlife Watch website, by species and area, November 2010–October 2011. ................................................................................................................. 21
Table 2.4. Live animals reported on the I-90 Wildlife Watch website, by species and area, November 2010–June 2012. ......................................................................................................................................... 24
Table 3.1. Highway encounter categories for tracks found along snow tracking transects. ...................... 56
Table 3.2 High-priority structures for wildlife monitoring. Monitoring end date for all structures was June 2012. ........................................................................................................................................................... 58
Table 3.3. Species (or species groups) detected by remote cameras at long-term monitoring sites. ....... 60
Table 3.4. Crossings data for all “species-of-interest” (as defined in this report), including crossing frequency and (below frequency in parentheses) crossing rate, expressed as crossings/100 camera nights. .......................................................................................................................................................... 61
Table 3.5. Crossings by humans and domestic animals, including crossing frequency and crossing rate (below frequency in parentheses) expressed as crossings/100 camera nights. ........................................ 68
Table 3.6. Species-specific detections at all monitored culverts and bridges. “X” indicates that the species or group was detecte either outside of the structure or crossing through the structure. Species/group names are alphabetical. ...................................................................................................... 70
Table 3.7. Omissions and omission rate by primary camera at the Swamp Creek E Culvert, from May–November, 2010 and 2011. ........................................................................................................................ 71
Table 3.8. Number of detections and rate of detections (number/survey/mile) within various encounter classifications along four snow track survey transects conducted during winter 2008–2009. .................. 73
Table 4.1. Species (or species groups) detected by remote cameras, DNA extracted from hair or scat, and tracks within the greater I-90 SPE Project Area. ......................................................................................... 92
Table 4.2. Summary of small mammal captures, recaptures, and mortalities by species. ...................... 101
Table 4.3. Summary of small mammal detections by species. ................................................................. 101
Table 5.1. Summary of radio-telemetry results and movement vector analysis, including squirrel identification number, sex, year monitored, and numbers of: (a) vectors; (b) tracking nights; (c) detected crossings; and (d) expected crossings (i.e., the mean of the randomization distribution). Also shown are the detected crossing rate and the p-value of the movement randomization test for each squirrel. ..... 111
Table 5.2. Pairwise relatedness, geographic distances, and FST between sites. NS = not significant, * = p < 0.05, ** = p < 0.005, *** = p < 0.0001 (after sequential Bonferroni correction). Average relatedness is reported within each site (r1 and r2) and between sites (rbetween). Bold values indicate average coefficients of relatedness consistent with first cousin or closer relationships. ......................................................... 120

Baseline wildlife monitoring at I-90 Snoqualmie Pass East Table of Contents
Western Transportation Institute Page iii
List of Figures Figure 2.1. Map of Study Area highlighting the Project Area and adjacent Control Area, as well as Connectivity Emphasis Areas (CEAs) and select mileposts. ........................................................................ 10
Figure 2.2. Trimble GPS unit (A) and ROCS software (B) used by WDOT maintenance personnel to collect WVC data. (Photos: WTI) ............................................................................................................................ 11
Figure 2.3. Observation form (A) and locator map (B) from the I-90 Wildlife Watch website showing 1/10 mile markers for locations of WVCs and live animal sightings. .................................................................. 13
Figure 2.4. A billboard erected on the shoulder of I-90 near Cle Elum. (Photo: P. MacKay/WTI) .............. 15
Figure 2.5. Frequency of WVCs reported by WSDOT maintenance personnel, by species group and month, July 2008–June 2011. ..................................................................................................................... 19
Figure. 2.6. Rates of wildlife-vehicle collisions (number/mile/year, with 95% confidence intervals) reported by WSDOT maintenance personnel, by species group and area, July 2008–June 2011. Sample sizes were 54, 12, and 2 WVCs for ungulates, carnivores, and other species, respectively in the Control Area, and 34, 5, and 4 WVCs respectively in the Project Area ................................................................... 20
Figure 2.7. Rates of WVCs (number/mile, with 95% confidence intervals) reported by WSDOT maintenance personnel, by year and area, July 2008–June 2011. Sample sizes are shown next to the year and 95% confidence intervals. Sample sizes for years 1–4 were 18, 16, 18, and 2 WVCs respectively for the Control Area, and 14, 6, 4, and 10 WVCs respectively for the Project Area. ....................................... 20
Figure 2.8. Frequency of WVCs reported on the I-90 Wildlife Watch website, by species group and month, November 2010–October 2011. .................................................................................................... 22
Figure 2.9. Rates of WVCs (number/mile; with 95% confidence intervals) reported on the I-90 Wildlife Watch website, by species group and area, November 2010–June 2012. Sample sizes were 14, 11, and 17 WVCs for ungulates, carnivores, and other species, respectively in the Control Area, and 5, 6, and 7 WVCs respectively in the Project Area. ...................................................................................................... 22
Figure 2.10. ROCS and I-90 WW WVC rates during November 2010–June 2012, with 95% confidence intervals. Sample sizes are reported in Figures 2.6 and 2.9 (above). ......................................................... 23
Figure 2.11. Rates of live animals (number/mile; with 95% confidence intervals) reported on the I-90 Wildlife Watch website, by species group and area, November 2010–June 2012. Sample sizes were 228, 19, and 23 WVCs for ungulates, carnivores, and other species, respectively in the Control Area, and 170, 11, and 31 WVCs respectively in the Project Area. ..................................................................................... 25
Figure 2.12. Power curves indicating the estimated number of years of monitoring that must be conducted before and after mitigation in the Project Area to detect 50%, 70%, and 90% reductions in WVCs with a power of 0.8. .......................................................................................................................... 26
Figure 2.13. Power curves indicating the estimated number of years of monitoring that must be conducted to detect 50% and 70% reductions in WVCs with a power of 0.8 between the period before and after mitigation efforts in the Project Area. ........................................................................................ 26
Figure 2.14. Curves indicating the power achieved and the associated number of years after mitigation required to detect 30%, 50%, and 70% reductions in WVCs within the Project Area, assuming four years of pre-mitigation monitoring. ..................................................................................................................... 27

Baseline wildlife monitoring at I-90 Snoqualmie Pass East Table of Contents
Western Transportation Institute Page iv
Figure 2.15. Curves indicating the power achieved and the associated number of years required to detect 30%, 50%, and 70% reductions in WVCs within the Control Area, assuming four years of pre-mitigation monitoring. ................................................................................................................................ 28
Figure 2.16. Ungulate WVC hotspots in the Project Area, identified via data collected by WSDOT maintenance crews. Hotspots were derived from n=34 WVCs with hotspots defined as the 46% kernel isopleths (see Methods for details). ........................................................................................................... 29
Figure 2.17. Non-ungulate WVC hotspots in the Project Area, identified via data collected by WSDOT maintenance crews and I-90 Wildlife Watch participants. Hotspots were derived from n=6 WVCs with hotspots defined as the 72% kernel isopleths (see Methods for details). ................................................. 30
Figure 2.18. Ungulate wildlife-vehicle collision hotspots in the Control Area identified via analysis of data collected by WSDOT maintenance crews and I-90 Wildlife Watch participants. Hotspots were derived from n=54 WVCs with hotspots defined as the 49% kernel isopleth (see Methods for details). ............... 31
Figure 2.19. Non-ungulate WVC hotspots in the Control Area, identified via data collected by WSDOT maintenance crews and I-90 Wildlife Watch participants. Hotspots were derived from n=13 WVCs with hotspots defined as the 57% kernel isopleth (see Methods for details). ................................................... 32
Figure 2.20. Ungulate WVC hotspots and live ungulate hotspots in the Project Area, identified via data collected by WSDOT maintenance crews and I-90 Wildlife Watch participants. WVC hotspots were derived from n=39 WVCs with hotspots defined as the 46% kernel isopleth, and live hotspots were derived from n=74 observations with hotspots defined as the 58% kernel isopleth (see Methods for details)......................................................................................................................................................... 33
Figure 2.21. Non-ungulate WVC hotspots and live non-unglulate hotspots in the Project Area, identified via data collected by WSDOT maintenance crews and I-90 Wildlife Watch participants. WVC hotspots were derived from n=16 WVCs with hotspots defined as the 72% kernel isopleth, and live hotspots were derived from n=11 observations with hotspots defined as the 63% kernel isopleth (see Methods for details)......................................................................................................................................................... 34
Figure 2.22. Ungulate WVC hotspots and live animal locations in the Control Area, identified via data collected by WSDOT maintenance crews and I-90 Wildlife Watch participants. WVC hotspots were derived from n=107 WVCs with hotspots defined as the 44% kernel isopleth, and live hotspots were derived from n=95 observations with hotspots defined as the 48% kernel isopleth (see Methods for details)......................................................................................................................................................... 35
Figure 2.23. Non-ungulate WVC hotspots and live animal locations in the Control Area, identified via data collected by WSDOT maintenance crews and I-90 Wildlife Watch participants. WVC hotspots were derived from n=30 WVCs with hotspots defined as the 73% kernel isopleth, and live hotspots were derived from n=20 observations with hotspots defined as the 52% kernel isopleth (see Methods for details)......................................................................................................................................................... 36
Figure 2.24. Response curve output from MaxEnt analysis showing positive association between deer WVC locations and stream density in the Project Area. The Y-axis represents increasing likelihood of a WVC, and the X-axis is stream density. ....................................................................................................... 37
Figure 2.25. Response curve output from MaxEnt analysis showing positive association between deer WVC locations and distance-to-nearest-ridge in the Control Area. The Y-axis represents increasing likelihood of a WVC, and the X-axis is distance-to-ridge. ........................................................................... 37

Baseline wildlife monitoring at I-90 Snoqualmie Pass East Table of Contents
Western Transportation Institute Page v
Figure 2.26. Response chart output from MaxEnt analysis showing positive association between elk WVC locations and areas further from the nearest forested patch in the Project Area. The Y-axis represents increasing likelihood of a WVC, and the X-axis is distance-to-forested patch. .......................................... 38
Figure 2.27. Response chart output from MaxEnt analysis showing the negative association between elk WVC locations and the presence of Jersey barriers in the Control Area. The Y-axis represents increasing likelihood of a WVC, and the X-axis is whether a Jersey barrier is absent (0) or present (1). .................... 38
Figure 2.28. Average number of vehicles traveling on I-90 by hour, recorded in 2011 (excluding June–July) at milepost 52.2 near Snoqualmie Pass. Data extracted from the WSDOT Data Warehouse. .......... 40
Figure 3.1. Map of our Study Area, highlighting Connectivity Emphasis Areas (CEAs), select mileposts, and locations of monitored structures. ...................................................................................................... 47
Figure 3.2. Three Reconyx-brand digital remote cameras used to monitor culverts, underpasses, and bridges. Silent Image, Rapid Fire, and Hyperfire models are shown from left to right. (Photo: R. Long/WTI) ................................................................................................................................................... 49
Figure 3.3. Remote camera deployed on culvert wall in a locked, metal security box. (Photo: R. Long/WTI) ................................................................................................................................................... 50
Figure 3.4. “Faux” electrical housing containing remote camera deployed at the Sparks Road Bridge South. Various images show housing (A), aim of camera (B), view from under the bridge with arrow pointing to camera box (C), and sample photo of WTI field vehicle (D). (Photos: R. Long /WTI) .............. 51
Figure 3.5. Transects used for snow tracking along I-90 including (a) Swamp-Bonnie-Price Creek and Toll-Swamp Creek Transects, and (b) Easton Hill WB and EB Transects. ........................................................... 54
Figure 3.6. Researcher snow-tracking along I-90. (Photo: P. MacKay/WTI) ............................................... 56
Figure 3.7. Paved bridges that were monitored by remote cameras at Exit 62 and Exit 63. (Photo: J. Begley/WTI) ................................................................................................................................................ 57
Figure. 3.8. Camera performance metrics, including the total number of nights that cameras were deployed, nights they were operational (Camera Nights), and percentage of total nights they were operational. ................................................................................................................................................. 59
Figure 3.9. Species-specific crossing rates (crossings/100 camera nights) for (A) terrestrial and (B) aquatic (or semi-aquatic, in the case of raccoons) species. .................................................................................... 62
Figure 3.10. Index of the timing of crossings by species-of-interest using the 12 crossing structures monitored with remote cameras. Index of timing values greater than or less than 1.0 reflect the detection of more or fewer crossings, respectively, than would have been expected due to chance during a given time period. ......................................................................................................................... 63
Figure 3.11. Detection frequencies by month and relative water levels for Gold Creek NE, Gold Creek NW, Price Creek, and Bonnie Creek structures. ......................................................................................... 64
Figure 3.12. Detection frequencies by month and relative water levels for Gold Creek NE, Gold Creek NW, Price Creek, and Bonnie Creek structures. ......................................................................................... 65
Figure 3.13. Detection frequencies by month and relative water levels for Hudson Creek, Sparks Road N, and Sparks Road S structures. No water levels are reported for Sparks Road structures because they span roads not creeks. ................................................................................................................................ 66

Baseline wildlife monitoring at I-90 Snoqualmie Pass East Table of Contents
Western Transportation Institute Page vi
Figure 3.14. Frequency of aborted crossings by species-of-interest and structure. Aborted crossings were defined as an individual being detected by remote camera, but turning around before a crossing was completed and exiting the same way it entered. ....................................................................................... 69
Figure 3.15. Coyote tracks leading up to the shoulder of I-90, with a semi-trailer truck in the background. (Photo: R. Long/WTI)................................................................................................................................... 72
Figure 3.16. Winter 2008–2009 snow track detections, including encounter type, along the Swamp-Bonnie-Price Creek Transect for (A) coyotes and (B) bobcats. ................................................................... 74
Figure 3.17. Winter 2008–2009 snow track detections, including encounter type, along the Toll-Swamp Creek Transect for (A) coyotes and (B) bobcats. ........................................................................................ 75
Figure 3.18. Winter 2008–2009 snow track detections, including encounter type, along the Easton Hill WB and EB Transects for (A) coyotes and (B) bobcats. .............................................................................. 76
Figure 3.19. One frame of a multi-frame time-lapse sequence taken by a camera deployed in the highway median. (Photo: WTI) ................................................................................................................... 77
Figure 4.1. Corral-type hair snagging station for bears showing barbed wire and debris pile, with black bear sliding under the wire. (Photo: WTI) .................................................................................................. 85
Figure 4.2. Cubby-type hair snagging station for martens showing scent lure and chicken bait locations and gun brushes, with marten at base of tree. (Photo: WTI) ..................................................................... 86
Figure. 4.3. A scat detection dog alerts her handler to a marten scat (foreground). (Photo:
P. MacKay/WTI) .......................................................................................................................................... 87
Figure 4.4. Locations of small mammal trapping grids. .............................................................................. 90
Figure 4.5. Photos of (A) marten, (B) bobcat, (C) coyote, and (D) elk captured at remote camera/hair-snagging stations. (Photos: WTI) ................................................................................................................ 93
Figure 4.6. Marten tracks photographed just south of I-90 near Snoqualmie Pass. (Photo: R. Long/WTI) 94
Figure 4.7. Locations where black bears were detected via the genetic analysis of hair or scat samples, or remote camera photographs. Hair-snagging survey locations yielding nondetections are also shown. ... 96
Figure 4.8. Locations where martens were detected via the genetic analysis of hair samples, remote camera photographs, or snow tracks at hair-snagging stations. Hair-snagging survey locations yielding nondetections are also shown. ................................................................................................................... 97
Figure 4.9. Locations where coyotes were detected via the genetic analysis of hair or scat samples, remote camera photographs, snow tracks encountered during highway snow tracking, or mud tracks encountered during track surveys of Lake Keechelus. ............................................................................... 98
Figure 4.10. Locations where bobcats were detected via the genetic analysis of hair or scat samples, remote camera photographs, snow tracks encountered during highway snow tracking, or mud tracks encountered during track surveys of Lake Keechelus. ............................................................................... 98
Figure 4.11. Locations where cougars were detected via the genetic analysis of hair or scat samples, or remote camera photographs. ..................................................................................................................... 99
Figure 4.12. Locations where mule deer were detected via the genetic analysis of hair samples, remote camera photographs, or mud tracks encountered during track surveys of Lake Keechelus. ..................... 99
Figure 4.13. Locations where elk were detected by remote camera photographs. ................................. 100

Baseline wildlife monitoring at I-90 Snoqualmie Pass East Table of Contents
Western Transportation Institute Page vii
Figure 4.14. Survey routes and tracks detected during Lake Keechelus track surveys conducted on 10/5/09, 10/15/09, and 10/28/09. ........................................................................................................... 104
Figure 5.1. Map of study area showing live-trap locations at four trapping sites. For analyses, each site was divided into a “north” and “south” component relative to I-90 ....................................................... 107
Figure 5.2. Radio-tracking locations and minimum convex polygon home ranges for four northern flying squirrels tracked at the Bonnie Creek site. The background orthophoto shows I-90, smaller paved and unpaved roads, and other landscape features. ........................................................................................ 112
Figure 5.3. Radio-tracking locations and minimum convex polygon home ranges for five northern flying squirrels monitored at the Toll Creek site. The background orthophoto shows I-90, smaller paved and unpaved roads, and other landscape features. ........................................................................................ 113
Figure 5.4. Radio-tracking locations and minimum convex polygon home ranges for five northern flying squirrels monitored at the Easton Hill site. The background orthophoto shows I-90, smaller paved and unpaved roads, and other landscape features. ........................................................................................ 114
Figure 5.5. Radio-tracking locations and minimum convex polygon home ranges for five northern flying squirrels monitored at the Easton Island site. The background orthophoto shows I-90, smaller paved and unpaved roads, and other landscape features. ........................................................................................ 115
Figure 5.6. Diagram representing radio-tracked movements of collared squirrels relative to the highway. Within sites, individual squirrels are represented by different-colored lines. Site diagrams are arranged from northwest (top) to southeast. .......................................................................................................... 117
Figure 5.7. Crossing rates of all radio-tracked squirrels by site. Sites are ordered from narrowest (left) to widest average canopy gap width. Approximate average and minimum gap widths (meters): Easton Island (57, 42); Toll Creek (72, 51); Bonnie Creek (76, 64); Easton Hill (83, 65). Gaps were measured using digital orthophotos in ArcGIS 10 (Esri, Redlands, CA, USA). ..................................................................... 118
Figure 5.8. Mean within-site relatedness and pairwise FST for all pairs of sites. Higher within-site relatedness is positively associated with estimated genetic distance between sites (t = 4.14 on 13 degrees of freedom, p = 0.001). Within-site relatedness of pairs of sites explained approximately 57% of the variation in pairwise FST. Within-site relatedness at each site is reported in Table 5.2. .................... 123
Figure 5.9. (A) Glider poles deployed alongside the highway and in the median to facilitate crossing by gliding mammals in New South Wales, Australia. (B) Close-up of pole top and remote camera. (Photos: Kylie Soanes, Rodney van der Ree) ........................................................................................................... 125
Figure. 5.10. Glider pole deployed in the median of a split highway in New South Wales, Australia (Photo: Rodney van der Ree) .................................................................................................................... 126
Figure. 5.11. (A) Rope bridge installed across multiple lanes of highway and median in New South Wales, Australia. (B) Squirrel glider (Petaurus norfolcensis) at terminus of rope bridge (Photos: Rodney van der Ree) ........................................................................................................................................................... 127

Baseline wildlife monitoring at I-90 Snoqualmie Pass East Chapter 2
Western Transportation Institute Page 1
Chapter 1 – Introduction
Preface This chapter summarizes the I-90 Snoqualmie Pass East Project, its setting, and our objectives for pre-construction wildlife monitoring. The chapter draws heavily from material previously prepared by Western Transportation Institute and presented in the I-90 Snoqualmie Pass East Wildlife Monitoring Plan (Clevenger et al. 2008; also available from the Washington State Department of Transportation [WSDOT]). Please see this plan for further background.
The I-90 Snoqualmie Pass East Project The I-90 Snoqualmie Pass East (SPE) Project was initiated to fulfill multiple objectives, including reducing avalanche and rock fall impacts on human safety and highway operation, replacing failing concrete pavement, adding lanes to reduce congestion, and improving ecological connectivity across I-90 (WSDOT 2006). To address planning for the ecological connectivity components of the project, WSDOT organized a Multi-Disciplinary Team (MDT) composed of the stakeholder agencies in the Project Area (WSDOT 2006). Recommendations from the MDT were used to inform the ecological connectivity measures that were eventually adopted for the project. Wildlife crossing structures and associated wildlife exclusion fencing are increasingly being installed along roads and highways in North America and other locations around the world (Clevenger et al. 2009, Gagnon et al. 2011). Such measures are designed to mitigate the effects of highways on wildlife individuals and populations, and have been shown to be effective for a wide variety of species. In 12 years of monitoring 23 wildlife crossing structures at Banff National Park, Alberta, for example, researchers documented large mammals using these structures more than 185,000 times (Clevenger et al. 2009). The I-90 SPE Project proposes to construct more than 20 large (i.e., >120 ft span) wildlife crossing structures—including three major overpasses—along the 15-mile stretch of I-90 between Hyak (west) to Easton (east). In addition, continuous wildlife fencing will be installed throughout most of the Project Area. More details about the I-90 SPE Project are available through WSDOT (WSDOT 2006, 2008).
Project Setting The I-90 SPE Project is located in the Cascade Mountain Range (Cascades) of Washington. The project comprises a 15-mile segment of I-90 beginning just east of Snoqualmie Pass. The project corridor, which passes through the Okanogan-Wenatchee National Forest, is part of a 100-mile scenic byway known as the Mountains to Sound Greenway—the first stretch of interstate highway in the country to be designated a National Scenic Byway. The corridor also occupies the Upper Yakima River sub-basin east of the Cascade crest. Its topography is mountainous, and it is situated in a rain-shadow that causes highly variable patterns of precipitation ranging from 140 in/year at Snoqualmie Pass to 50 in/year at Easton. The area thus represents an important ecotone

Baseline wildlife monitoring at I-90 Snoqualmie Pass East Chapter 2
Western Transportation Institute Page 2
between the dry interior and wet coastal zones, and a center of high biodiversity (Hansen et al. 1991).
Landscape Conservation and Biodiversity Values The I-90 SPE Project Area lies within the boundaries of the Snoqualmie Pass Adaptive Management Area, which was created by the Northwest Forest Plan to address concerns regarding the northern spotted owl. The Plan highlights the importance of the Snoqualmie Pass area for maintaining ecological connectivity in the Cascades. Numerous public and private entities have made extensive efforts to improve the ecological conditions in the upper Yakima River watershed, including the development of land management plans that emphasize ecological connectivity, land exchanges, and purchases of private lands for transfer to public ownership. Value and Threats to Biodiversity At the landscape scale, the Project Area traverses an extensive network of public lands that provide refuge for wildlife, including the Okanogan-Wenatchee and Mt. Baker-Snoqualmie National Forests, multiple National Forest wilderness areas, and two national parks. The public lands directly abutting the project corridor represent the narrowest band of such lands running north-south in the Washington Cascades. The I-90 SPE corridor has therefore been identified as a critical connectivity zone for Pacific Northwest wildlife populations (e.g., Thomas et al. 1990), potentially providing ecological connectivity between the North and South Cascades (Singleton and Lehmkuhl, 2000). Research by Singleton and Lehmkuhl (2000) further suggested that the Project Area facilitates the local movement of wildlife, and identified three significant north-south linkage zones within the Project Area itself, each with its own distinct species assemblages (WSDOT 2006). Indeed, the USDA Forest Service has identified more than 49 species of amphibians, mammals, and birds that are closely associated with late-successional habitat or old-growth forest in the Project Area.
An estimated 28,000 vehicles pass through the Project Area on the average weekday,
with traffic volumes swelling to as many as 58,000 per day on busy weekends and holidays (WSDOT, personal communication, December 2012). Over the course of a day, these volumes average to one vehicle every 3.1 and 1.5 seconds, respectively. Notably, traffic volumes on this section of I-90 are expected to increase at an average of 2 to 3 percent per year—a trend that WSDOT plans to accommodate by widening the highway from four to six lanes.
Roads and highways have been shown to have many negative effects on wildlife and natural communities. The most recent comprehensive review of wildlife-vehicle collision (WVC) databases across the United States estimated that 300,000 WVCs were reported each year, and that the total number of animal-vehicle collisions (AVCs, which include domestic animals and wildlife) was 1–2 million per year (Huijser et al. 2008).
In addition to its direct mortality effects, traffic on roads and highways can also reduce
habitat quality in adjacent areas (Reijnen and Foppen 1994, Forman and Deblinger 2000), or

Baseline wildlife monitoring at I-90 Snoqualmie Pass East Chapter 2
Western Transportation Institute Page 3
result in avoidance by wildlife and therefore affect habitat use and movements (Rowland et al. 2000, Trombulak and Frissell 2000, Sweanor et al. 2000, Chruszcz et al. 2003, Gagnon et al. 2007, Keller and Bender 2007). Forman and Alexander (1998) suggest that avoidance may have the most pervasive effects on wildlife populations. Restriction of movements, especially when they affect dispersal, mating, and migration, can lead to population subdivision and genetic differentiation (e.g., Epps et al. 2005). Increasing traffic volumes along roadways can increase the rates of ungulate-vehicle collisions (e.g., Groot Bruinderink and Hazebroek 1996, Romin and Bissonette 1996).
Ecological Connectivity Objectives Definitions of Ecological Connectivity Without mitigation, the combined effects of increased traffic volumes, widening the highway, and a possible resulting increase in traffic speed in the Project Area would undoubtedly serve to further fragment wildlife habitat and populations. Thus, WSDOT determined it necessary to take measures designed to enhance ecological connectivity for multiple species and ecological processes over time (WSDOT 2006, WSDOT 2008). The MDT was charged with developing preferred options for the design and sighting of connectivity measures throughout the Project Area (WSDOT 2006). As part of its recommendation package, the MDT defined ecological connectivity as:
The movement of organisms and the occurrence of ecological processes across an ecosystem over time. Intact ecosystems are structured by dynamic processes that create a shifting mosaic of various habitat patches. The ability of organisms to disperse freely through this mosaic is important to allow genetic exchange, re-colonization of habitats, and maintenance of functioning food webs. Genetic variability is a species’ insurance against localized or population level disturbances and ultimately improves an organism’s evolutionary potential. The ultimate outcome is natural sustaining populations across an ecosystem over time (WSDOT 2006).
This definition provided the basis for monitoring and research designed to evaluate
whether the project-wide objectives of increasing ecological connectivity in the Project Area were met during the phased reconstruction of the highway. Project-Wide Objectives
The MDT report identified broad objectives to determine whether project designs would meet the goal of increased ecological connectivity. These objectives can be refined into three major questions:

Baseline wildlife monitoring at I-90 Snoqualmie Pass East Chapter 2
Western Transportation Institute Page 4
Are aquatic and terrestrial habitats sufficiently linked to function properly for the species they support? Habitats of particular importance include old-growth forests, upland forests, wetlands, riparian habitats, streams and unique habitats such as talus.
Are hydrological processes sufficiently connected to permit the proper function of stream channels, riparian areas, floodplains, channel capacity and movement, wetland flow paths and hydroperiods, and groundwater-surface water interactions?
Will highway-related wildlife mortality and impediments to movement be reduced
sufficiently to provide a moderate to high probability of sustaining local and regional populations of all species, and to reduce risks associated with demographic isolation and limited genetic variability?
Connectivity Emphasis Areas The MDT also identified “Connectivity Emphasis Areas” (CEAs), defined as areas within the Project Area where there is opportunity to improve connectivity for a unique assemblage of species and/or habitat types. CEA-specific connectivity objectives consist of increasing movement by wildlife and reconnecting plant and animal populations separated by I-90. Wildlife-Specific Connectivity Objectives The MDT report identified two broad objectives specific to improving terrestrial species linkages designed to meet ecological connectivity goals (WSDOT 2006). The first objective was to evaluate whether terrestrial habitats are adequately linked to allow for the movement of wildlife between core habitats, to meet the biological needs of wildlife, and to adapt to changing landscape conditions. Of particular importance were unique habitats in the Project Area, such as talus and old-growth forests, in addition to upland forests, wetlands, and riparian habitats. The second objective was to reduce highway-related mortality of wildlife and impediments to their movements, thereby helping to ensure local and regional populations of all native species and reducing risks associated with demographic isolation and limited genetic variability.
Wildlife Monitoring Wildlife crossing structures and wildlife fencing are costly, and take many years to fund, design, and construct. Wildlife monitoring is required both prior to and following the installation of mitigation measures to ensure that efforts to enhance ecological connectivity are achieving their intended goals. We developed a pre-construction monitoring program—largely for high-mobility mammals—based on WSDOT’s I-90 Snoqualmie Pass East Wildlife Monitoring Plan (Clevenger et al. 2008). This program was designed to address the need for monitoring a variety of species at multiple scales, and the data generated were intended to compare with post-construction data in an effort to evaluate long-term structure performance.

Baseline wildlife monitoring at I-90 Snoqualmie Pass East Chapter 2
Western Transportation Institute Page 5
Tiered Approach to Pre-Construction Wildlife Monitoring Due to the landscape context of road systems, and the broad ecological connectivity objectives associated with the I-90 SPE Project in particular, we developed a two-tiered approach to gathering pre-construction, baseline monitoring data for the Project Area.
Tier 1 pre-construction monitoring was designed to help WSDOT answer the most fundamental transportation management questions regarding the ecological connectivity goals of the project (i.e., to address management concerns with regard to the performance of the project’s connectivity design measures). Tier 2 pre-construction monitoring efforts are intended to build upon Tier 1 to help WSDOT and other agencies and organizations further assess whether ecological connectivity goals are achieved by having the highway design measures in place.
Pre-construction wildlife monitoring was conducted at multiple spatial scales, including
within CEAs, across the Project Area, and throughout the region. Tier 1 monitoring was conducted primarily at the scale of CEAs and the Project Area. Tier 2 monitoring and research encompassed work at specific CEAs, as well as landscape-level and regional studies of wide-ranging mammals. WSDOT was the primary agency responsible for ensuring that Tier 1 monitoring was conducted, while additional public and private partners helped fund and address Tier 2 monitoring efforts. Pre-Construction Monitoring Objectives Our Tier 1 pre-construction monitoring objectives included the following:
1. Characterize the locations and rate of wildlife-vehicle collisions. Monitoring metric: Incidence of road-killed wildlife in the Project Area. What species are affected by collisions, where are collisions occurring and how frequently?
2. Assess the use of existing sub-grade structures (e.g., culverts, underpasses).
Monitoring metric: Use of structures. Do animals use the existing sub-grade structures prior to construction? If so, which species and how frequently?
3. Characterize the rate of at-grade highway crossings by wildlife.
Monitoring metric: Crossing rates, locations and activity of wildlife in the Project Area. Do animals cross I-90? Which species, where, and with what frequency prior to construction?
4. Assess species occurrence and distribution in the Project Area.
Monitoring metric: What species are present in the Project Area that might eventually use crossing structures? Assessing occurrence in areas adjacent to crossing structures is important for evaluating the effectiveness of the crossing structures, as expected use of a given structure by a species is contingent on the species occurring there.
Our monitoring methods and protocols were designed primarily for mammals, and generally mid- to large-bodied, high-mobility species. Although we occasionally report results pertaining

Baseline wildlife monitoring at I-90 Snoqualmie Pass East Chapter 2
Western Transportation Institute Page 6
to birds, our methods were not tailored for this taxonomic group and our results should thus be interpreted accordingly. Other monitoring efforts conducted by faculty and students from Central Washington University were focused on pikas, amphibians, reptiles, and fish. Our Tier 2 efforts were less constrained. One of these efforts, spearheaded by a Master’s student at Montana State University, focused on the presence, movement, and genetic connectivity of flying squirrels within the Project Area. A second Tier 2 project comprised an extensive, multi-partner landscape genetic study of American black bears and American martens.
Organization of this Report This report is organized into four core chapters (Chapters 2–5). Chapters 2 and 3 primarily address the collection of baseline data relating to the first three Tier 1 monitoring objectives described above: characterizing the rate and location of wildlife-vehicle collisions, and assessing the extent of sub-grade and at-grade crossings by wildlife. Chapters 4 and 5 are focused on the third Tier 1 monitoring objective—assessing species occurrence within the Project Area—but also summarize Tier 2 evaluations of genetic connectivity for flying squirrels and carnivores. The latter two projects were collaborative in nature and funded by multiple partners. Scientific names for all species mentioned in this report are contained in Appendix 1.1, and therefore not included in the report body.

Baseline wildlife monitoring at I-90 Snoqualmie Pass East Chapter 2
Western Transportation Institute Page 7
Chapter 2 – Monitoring Wildlife Vehicle Collisions and Live Animal Observations
Introduction Collisions between vehicles and wildlife can have direct mortality effects on wildlife populations. The most recent comprehensive review of wildlife-vehicle collision (WVC) databases across the United States estimated that 300,000 WVCs were reported each year, and that the total number of animal-vehicle collisions (AVCs, which include domestic animals and wildlife) was 1–2 million per year (Huijser et al. 2008). From 1990–2004, the annual number of WVCs reported increased from 200,000 to 300,000, a change apparently associated with an increase in both vehicle miles driven, and deer population sizes in many regions of the U.S. By 2004 WVCs represented approximately 5% of all reported motor vehicle collisions (Huijser et al. 2008). Further, approximately 89% of all WVCs that occurred from 2001–2005 took place on two-lane roads and highways. Property damage costs associated with WVCs were estimated to be over $8 billion annually (Huijser et al. 2008).
Studies designed specifically to assess species composition of road-killed wildlife suggest that medium-sized mammals (e.g., porcupines, raccoons, skunks, and rabbits and hares) are the most often killed (Barthelmess and Brooks 2010). Most WVCs documented in standard surveys, however, are typically of ungulates (e.g., deer, elk, moose), both because they are large and tend to cause substantial property damage and human injuries (e.g., Nielson et al. 2003, Sullivan and Messmer 2003, Huijser et al. 2008)—and therefore are most likely to be reported—and because they are often migratory (Fryxell et al. 1999), and intersect roads during seasonal shifts between habitats. Further, smaller mammals are more difficult to see, and persist as carcasses for shorter periods than do larger species (Slater 2002, Barthelmess and Brooks 2010).
In addition to its direct mortality effects, traffic on roads and highways can also result in avoidance by wildlife and therefore affect habitat use and movements (Rowland et al. 2000, Trombulak and Frissell 2000, Gagnon et al. 2007, Keller and Bender 2007). Forman and Alexander (1998) suggest that avoidance may have the most pervasive effects on wildlife populations. Restriction of movements, especially when they affect dispersal, mating, and migration, can lead to population subdivision and genetic differentiation (e.g., Epps et al. 2005). Increasing traffic volumes along roadways can increase the rates of ungulate-vehicle collisions (e.g., Groot Bruinderink and Hazebroek 1996, Romin and Bissonette 1996). Alternately, however, some species such as elk may avoid areas near high-traffic roads (e.g., Rowland et al. 2000, Wisdom et al. 2005), leading to reduced road-related mortality when traffic volumes are higher (Gagnon et al. 2007). It is most likely, however, that the relationship between WVCs and highway traffic volumes is quite complex, and related to many variables including animal abundance, mitigation measures, landscape features, traffic volumes, and animal behavior (Seiler 2004, Gagnon et al. 2007). If avoidance effects for many species are positively correlated with traffic volumes, however, such effects could be substantial for wildlife adjacent to I-90 at Snoqualmie Pass East (SPE)—where daily traffic volumes average 28,000 vehicles on the average day, and can increase to as many as 58,000 per day on busy weekends (WSDOT,

Baseline wildlife monitoring at I-90 Snoqualmie Pass East Chapter 2
Western Transportation Institute Page 8
personal communication, December 2012).
Studies of wildlife mortality along roads and highways typically utilize two sources of data: AVC or WVC reports filed by law enforcement agencies, and Animal Carcass (AC) data collected by state departments of wildlife, natural resources, or transportation (Huijser et al. 2007). In Washington, AVC reports are compiled by the Washington State Patrol, but usually only for collisions involving substantial property damage or loss of human life. Further, while these reports distinguish between domestic animals and non-domestic animals, they generally do not provide species-level information for wildlife. Such limitations severely limit the value of AVC data for the analyses of wildlife mortality on roads.
For approximately 36 years, the Washington Department of Transportation (WSDOT)
has collected AC data pertaining to highway and roadway segments in Washington (C. Broadhead, WSDOT, personal communication), including I-90 SPE. Historically, such data were collected on paper forms, focused primarily on ungulates and large carnivores (e.g., bears), and were not accompanied by routine trainings to ensure consistent effort and data accuracy. In 2005, the Western Transportation Institute (WTI) and WSDOT initiated a collaborative pilot program to standardize AC data collection by WSDOT maintenance crews working along I-90 SPE (Ament et al. 2011). This program included the use of computerized, handheld GPS/data entry units (Roadkill Observation Collection System [ROCS]) developed by WTI. In follow-up to this pilot program, WTI launched a full-scale monitoring effort in July 2008 to collect wildlife mortality data (hereafter WVC data, which technically combine WVC and AC data) via the efforts of WSDOT maintenance crew.
It is well-recognized that any given method for collecting WVC data has its limitations.
In addition, locations where WVCs occur can differ considerably from locations where live animals congregate and/or cross highways successfully (Alexander et al. 2005, McCoy 2005, Lee 2007, Paul 2007). Thus, in November 2010, WTI and the I-90 Wildlife Bridges Coalition launched I-90 Wildlife Watch to engage motorists to report both live and dead animals sighted along I-90 between North Bend and Easton. This program was developed as a complement to other monitoring efforts in the I-90 SPE Project Area.
Here we address the following objectives related to WVCs and live wildlife in the I-90
SPE region:
1. estimate WVC rates, species composition, and hotspots via two methods—carcass reporting by WSDOT maintenance staff, and citizen reporting via a public website—for the I-90 Snoqualmie Pass East Project Area and an adjacent Control area, to serve as baseline data prior to the installation of crossing structures and wildlife fencing;
2. assess the power of monitoring under different scenarios to detect differences between pre- and post-construction WVC rates (i.e., determine the probability of detecting a given change in WVC rates after the installation of crossing structures and fencing given rates observed before installation);
3. identify live animal hotspots via a citizen reporting method for the I-90 Snoqualmie Pass

Baseline wildlife monitoring at I-90 Snoqualmie Pass East Chapter 2
Western Transportation Institute Page 9
East Project Area and an adjacent Control area. Locations where live animals tend to occur may differ from WVC locations, and in such cases may represent places where successful crossings are more likely; and
4. identify landscape features associated with WVCs.
Study Area
The Study Area is described previously in detail (Chapter 1). WVCs and live animal observations were monitored along a 39.3-mile stretch of highway between mile post (MP) 31 (North Bend) on the west side of the Cascade Crest and MP 70.3 (Easton) on the east side of the Crest (Fig. 2.1). Given that one of our main objectives was to provide baseline data for comparison with post-construction WVC rates, we implemented a “before-after-control-impact” (BACI) design (Roedenbeck et al. 2007). Information described in this document constitutes pre-construction baseline data (i.e., the “before” component), with post-construction monitoring to eventually serve as the “after” component.
The 15.3-mile, I-90 SPE Project Area segment between MP 55 (Hyak) and MP 70.3 (Easton)—where planned mitigation activities include the installation of wildlife crossing structures and wildlife fencing—served as the impact component of our study. Our control area was the 24-mile stretch of I-90 between MP 31 (North Bend) and MP 54 (Hyak). Throughout the remainder of this document, we refer to results in terms of the Study Area (i.e., the full 39.3 mile segment), the Project Area (Hyak to Easton), and the Control Area (North Bend to Hyak). Within the Project Area, WSDOT had previously highlighted specific highway segments that were considered to be especially important for connectivity mitigation efforts (WSDOT 2006). Fourteen of these Connectivity Emphasis Areas (CEAs) are used as reference points in our report (Fig. 2.1).

Baseline wildlife monitoring at I-90 Snoqualmie Pass East Chapter 2
Western Transportation Institute Page 10
Figure 2.1. Map of Study Area highlighting the Project Area and adjacent Control Area, as well as Connectivity Emphasis Areas (CEAs) and select mileposts.

Baseline wildlife monitoring at I-90 Snoqualmie Pass East Chapter 2
Western Transportation Institute Page 11
Methods Data Collection We used two sources of WVC data in our analyses: (1) carcass data collected during routine work activities by WSDOT maintenance personnel operating from WSDOT’s Hyak facility; and (2) I-90 Wildlife Watch reports from citizens who observed dead animals while traveling through the Study Area.
WSDOT Maintenance Crew Data Collection In July 2008, WSDOT maintenance personnel were supplied with Trimble Recon GPS XC PDA/GPS units (Trimble Navigation Limited, Corvallis, Oregon) loaded with ROCS software (Ament et al. 2011) (Figs. 2.2). The ROCS system facilitates the entry of geo-referenced locations containing the following information about a given carcass observation:
• date and time of the report; • species (via a dropdown list); • number of individuals; • sex of individual(s); • whether there was a resulting human injury or death; • whether there was property damage to a vehicle; • whether the carcass was removed; • any additional notes of interest.
After information was entered, the carcass record—accompanied by its spatial coordinates—was uploaded to a database managed by WTI.
A. B. Figure 2.2. Trimble GPS unit (A) and ROCS software (B) used by WDOT maintenance personnel to collect WVC data. (Photos: WTI)

Baseline wildlife monitoring at I-90 Snoqualmie Pass East Chapter 2
Western Transportation Institute Page 12
During July 2008, WTI personnel performed a comprehensive training for all WSDOT maintenance personnel who would be using ROCS units. The training included information about the I-90 SPE project, a description of why pre-construction wildlife monitoring was important, and detailed instructions for using the ROCS units, with particular protocols for data collection. Maintenance crews were instructed to record WVC data for all carnivores, as well as for other species larger than a snowshoe hare, as hares, squirrels, and other smaller species were likely to be either difficult to identify or potentially numerous, resulting in inordinate amounts of time and effort to record. Training refreshers have been provided once or twice each year since July 2008.
I-90 Wildlife Watch Data Collection From its inception, I-90 Wildlife Watch represented an innovative partnership between WTI, the I-90 Wildlife Bridges Coalition, WSDOT, and other agency partners. I-90 Wildlife Watch encouraged motorists to report both dead and live animals along the I-90 corridor via a user-friendly website (www.i90wildlifewatch.org), which included a brief observation form and a locator map to capture sighting information (Fig. 2.3). Website visitors were also able to map sightings reported by other observers. Observers had the option to remain anonymous. GPS coordinates were not collected, as we felt that this information would not be feasible for most motorists to acquire while traveling. Rather, the locator map allowed observers to pinpoint sightings at the resolution of 1/10 mile. As with the WSDOT maintenance crew data collection, only species larger than a snowshoe hare—with the exception of the American mink—were listed on the reporting page. More details about I-90 Wildlife Watch can be found in the first year report (Appendix 2.1).
In an attempt to quantify the amount of survey effort expended, we explored a data collection approach using recruited volunteers that would permit standardized statistical comparisons of WVC and live animal reporting rates between time periods. More specifically, we recruited several volunteers who drove I-90 on a consistent basis (i.e., 1–2 times per week) to report their wildlife observations. In addition to reporting live and dead wildlife, these volunteers also recorded trips during which they saw no wildlife. Volunteer observations of alive and dead individuals were modeled with a Poisson distribution and used to calculate Bayesian estimates of individual observation rates and associated confidence intervals for volunteers driving the survey route. Estimated rates can potentially be compared with similarly collected, post-construction rates.

Baseline wildlife monitoring at I-90 Snoqualmie Pass East Chapter 2
Western Transportation Institute Page 13
A.
B. Figure 2.3. Observation form (A) and locator map (B) from the I-90 Wildlife Watch website showing 1/10 mile markers for locations of WVCs and live animal sightings.

Baseline wildlife monitoring at I-90 Snoqualmie Pass East Chapter 2
Western Transportation Institute Page 14
Because the success of I-90 Wildlife Watch was dependent on citizen participation, numerous strategies were employed to inform motorists about the launch of the project, and to increase public awareness about the program. We selected a launch date of November 4, 2010, to coincide with “Give Wildlife A Brake” week—a national campaign coordinated by the Humane Society of the United States—and distributed a press release to regional media outlets. The story was picked-up by numerous media outlets, including the Seattle Times. Announcements were also posted on partner websites and blogs, and the program was profiled on various other electronic venues as well (Box 2.1).
Box 2.1. Examples of media promoting I-90 Wildlife Watch
Press release: New project is launched to document wildlife sightings along I-90 November 4, 2010 Drivers encouraged to report wildlife on I-90 over Snoqualmie Pass Seattle Times, November 4, 2010 New website lets drivers track wildlife along stretch of I-90 Seattle Times, November 6, 2010 I-90 Wildlife Watch KOMOnews.com (radio), November 6, 2010 New web site tracks I-90 roadkill TechFlash, November 8, 2010 Heading over I-90 Snoqualmie Pass? Keep your eyes peeled for critters big or small WSDOT Blog, November 10, 2010 Wildlife sightings wanted from drivers on I-90 Northwest Public Radio, November 22, 2010 Help map wildlife crossings as you drive I-90 east of Snoqualmie in WA National Geographic Global Action Atlas, March 2011 Watching for wildlife on I-90 Fall City Newsletter, April 2011 (page 4) I-90 project to ease flow of traffic, wildlife east of Snoqualmie Pass Seattle Times, July 7, 2011 Volunteers keep eye on wildlife along Interstate 90 Ellensburg Daily Record, July 26, 2011
In early March 2010, we leased a billboard (Fig. 2.4) on the westbound side of I-90 in Cle
Elum, approximately 12 miles east of the project area. This high-profile billboard was within

Baseline wildlife monitoring at I-90 Snoqualmie Pass East Chapter 2
Western Transportation Institute Page 15
easy view of all motorists traveling toward Snoqualmie Pass from eastern Washington, and was displayed for the remainder of the data collection period.
Figure 2.4. A billboard erected on the shoulder of I-90 near Cle Elum. (Photo: P. MacKay/WTI) Temporal Differences Between Data Collection Approaches The start dates and duration of data collection differed between our two approaches. Thus, we employed various time periods to describe and compare results from each dataset in the sections below. We encourage readers to pay close attention to figure and table captions to ensure the accurate interpretation of results. Dealing with Duplicate Reports We attempted to remove duplicate reports (i.e., two or more reports of the same live or dead individual) from both datasets. We assumed that any two or more (I-90 Wildlife Watch) reports of live individuals were duplicates if their locations were 0.2 mile apart and they occurred within two hours of each other. Similarly, we assumed reports of dead animals were duplicates if the locations were 0.2 mile apart and they occurred within 48 hours of each other. Data from WSDOT maintenance personnel were less likely to contain duplicates than I-90 Wildlife Watch data, as WSDOT typically removed carcasses from the roadway. WVC Rates In addition to reporting raw WVC and live animal frequencies, we calculated Poisson WVC rates

Baseline wildlife monitoring at I-90 Snoqualmie Pass East Chapter 2
Western Transportation Institute Page 16
representing WVCs or live animal reports per mile, and exact Poisson confidence intervals following Ulm (1990). Such rates permit comparisons between the Project and Control Areas, as well as with results from studies conducted elsewhere.
Power Analysis We conducted power analyses to evaluate the capacity of our four-year MC WVC dataset to serve as effective pre-construction baseline data. More specifically, power analyses permitted a priori estimates of the probability of detecting a post-construction reduction in WVCs after a specified number of survey years based on the WVC rates observed during our four years of pre-construction monitoring. Further, such analyses allowed us to estimate the number of years of post-construction monitoring that would be required to achieve a specified power.
To conduct power analyses, we contracted J. Buzas (University of Vermont) to develop software programs that compute power and sample sizes for a one-sided hypothesis test comparing the rates of two Poisson distributions (Shiue and Bain 1982, Thode 1997). For all analyses, we used 0.80 as a target power, and set the Type I error rate ( ; the risk of detecting a reduction in WVC rates if none actually exists) to 0.05. We excluded I-90 WW data from the power analysis because it is unclear whether I-90 Wildlife Watch will continue into the future or be reinitiated once mitigation efforts are complete.
Hotspot Analysis We identified relative hotspots for WVCs and live animal locations using kernel estimation. This method evaluates point data and identifies clustering, or dense patterns of spatial locations. Kernel estimation has been used extensively to estimate distributions of animal locations from radio-telemetry data (Worton 1989), and has more recently been employed to characterize clustering of WVCs (Gomes et al. 2009). In our case, such clustering comprised locations of dead animals from data collected by WSDOT maintenance personnel (hereafter “Maintenance Crew” or “MC” data), and both live and dead animals from I-90 Wildlife Watch data (hereafter “I-90 WW” data). Analysis was performed with the spatial analyst toolbox for ArcGIS using the “kernel density” function. Point locations of dead and live animals were represented as point layers in ArcGIS, and the kernel function was performed using an underlying 30-m raster (i.e., grid) layer. Results are, therefore, represented as a density value (i.e., points/mi2) for each 30-m grid cell.
WVC hotspots are typically defined as locations with the “highest” density of WVCs, and
as such identifying what qualifies as “highest” is important. Some studies have used the top 5 percent (i.e., 95th percentile) of density values (Gomes et al. 2009), but such approaches are highly subjective and render comparisons between regions and datasets difficult. Instead, we employed a bandwidth of 500 m to estimate kernels and defined hotspots with a novel method that identified “core areas” from kernel output data (Bingham and Noon 1998). More specifically, this method identifies areas that are disproportionately within an animal’s home range relative to a uniform distribution, and expresses this area as an isopleth (i.e., contour line within which the high-use area or “core” occurs). For our purposes, we considered the area of the core to be analogous to a WVC or live animal hotspot, with the resulting output delineating areas
Baseline wildlife monitoring at I-90 Snoqualmie Pass East Chapter 2
Western Transportation Institute Page 17
of disproportionate clustering of WVC or live animal observations within the segment of highway being analyzed. Thus, percentiles used to define a hotspot varied among the different subsets of analysis and are identified in figure captions. This method is defensible, repeatable, empirical, and improves on ad hoc methods to identify WVC hotspots.
We conducted hotspot analyses separately for the Project and Control Areas. In addition
to analyzing hotspots for all WVCs and live animal locations, we also conducted separate analyses for ungulates because deer and elk are often of special concern for transportation planning. To compare hotspots identified from MC data with those identified from I-90 WW results, and for comparisons of WVC and live animal hotspots, we mapped the relevant hotspots and looked for areas of overlap or discordance.
Identifying Landscape Features Associated with WVCs and Live Animal Locations We identified landscape features associated with the locations of WVCs and live animal reports for deer and elk using maximum entropy habitat modeling with the software package MaxEnt (Phillips et al. 2006). MaxEnt is a method developed for modeling the distribution of species, and uses presence-only data consisting of information related only to sites where animals were reported (i.e., “absences” and “no detections” are not required for the analysis). Presence-only data contrast with presence/absence or presence/no-detection data, which include sites where surveys were conducted but animals were not detected. In species distribution modeling, MaxEnt can be used for prediction (e.g., to estimate where on the landscape a given species would be predicted to occur) and to identify which factors are associated with species occurrence. In our case, we employed MaxEnt to identify landscape features associated with where WVCs and live animal reports occurred along I-90. Although similar modeling methods (e.g., environmental niche factor analysis) have been used for roadkill hotspot analysis (e.g., Gomes et al. 2009), to our knowledge, this is the first time MaxEnt has been used for this purpose.
Inputs required by MaxEnt included a GIS point layer—in our case, representing
locations of WVCs or live animal reports—and several underlying GIS raster (i.e., grid) layers representing landscape features suspected of being correlated with WVCs or live animal locations. MaxEnt permits the use of both continuous and categorical landscape layers, making it possible to include variables such as “distance to forest cover” (continuous) and “presence of a median” (categorical) in the same model. We included 3 continuous and 7 categorical landscape features in our analyses (Table 2.1) based on a review of the WVC literature and our own observations within the Project Area. The variable representing the presence of Lake Keechelus was included only in the Project Area analysis. Landscape grids were clipped to a 3-cell- wide path, with the center cell located along the highway midline. We conducted analyses for the Project and Control Areas separately, and for both WVCs and live animal reports. Given sample size constraints, we conducted analyses for only deer and elk. \
We used model selection methods (Burnham and Anderson 2002) and the software
ENMTools (Warren et al. 2010) to compare various MaxEnt models containing different combinations of the 10 landscape features, and chose the best model for each species-area combination based on AIC values and Akaike weights (Burnham and Anderson 2002). This method estimates the weight of evidence in favor of a given model being the best model in the candidate set.

Baseline wildlife monitoring at I-90 Snoqualmie Pass East Chapter 2
Western Transportation Institute Page 18
Table 2.1. Variables used in the MaxEnt analysis of landscape features associated with locations of wildlife-vehicle collisions. Variable Name Description Type BRDG Locations where rivers or roads crossed under highway Categorical FORM Presence of forested medians Categorical DTOF Distance to nearest forest Continuous GRAM Presence of grass medians Categorical LAKE Presence of Lake Keechelus Categorical DTOR Distance to nearest ridge Continuous LIGT Presence of significant highway lighting Categorical MMDB Presence of Jersey barrier Categorical SDEN Stream density (mi/mi2; calculated from a 900 m radius Continuous neighborhood analysis) TOPB Presence of topographic barrier (e.g., cliff, roadcut) Categorical
Once a model was selected, we evaluated the performance of the best model using the area under the receiver operating characteristic curve. The area under this curve (AUC) is a threshold-free index of model classi cation performance and indicates overall ability of the model to accurately predict the data used to create it (Fielding and Bell 1997; Pearce and Ferrier 2000). We also used output from MaxEnt to evaluate how much information each landscape feature contributed to the model, and to explore the response curves associated with each feature.
Results WVC data were collected by WSDOT maintenance crews from July 2008–June 2012, and by motorists reporting to I-90 Wildlife Watch from November 2010–June 2012. We included the full four years of data for analyses specific to the MC data, but direct WVC rate comparisons between MC and I-90 WW data were limited to data collected during the same time period (i.e., November 2010–June 2012). A report summarizing year 1 results for I-90 Wildlife Watch can be found in Appendix 2.1.
WVC Reports: WSDOT Maintenance Crew Results During the four year period from July 2008–June 2012, WSDOT maintenance personnel reported 111 WVCs (43 Project Area, 68 Control Area; Table 2.2, Appendix 2.2) representing 10 species. We assigned all deer reports (e.g., deer, mule deer, black-tailed deer) to a single “deer” species category. Most WVCs (79%) reported by maintenance crews were ungulates (i.e., deer, elk), with coyotes, bobcats, and black bears representing the only other species with more than one individual reported (Table 2.2).
Baseline wildlife monitoring at I-90 Snoqualmie Pass East Chapter 2
Western Transportation Institute Page 19
Table 2.2. Total number of carcasses reported by WSDOT maintenance crews by species and area, July 2008–June 2012.
Species Control Area Project Area Total Black Bear 3 1 4 Bobcat 3 3 Coyote 6 3 9 Otter 1 1 Deer 29 26 55 Elk 25 8 33 Beaver 1 1 Canada Goose 1 1 Mallard Duck 1 1 Wild Turkey 1 1 Total 68 43 111
The seasonal distribution of WVCs involving ungulates was irregular. Most WVCs occurred during spring and early summer (April–July), although two additional peaks were also seen in October and December (Fig. 2.5). WVCs of other species appeared to be more evenly distributed throughout the year, but had sufficiently low frequencies to preclude meaningful temporal comparisons (Fig. 2.5).
Figure 2.5. Frequency of WVCs reported by WSDOT maintenance personnel, by species group and month, July 2008–June 2011.
02468
101214161820
Ungulate
Carnivore
Other
Baseline wildlife monitoring at I-90 Snoqualmie Pass East Chapter 2
Western Transportation Institute Page 20
Rates of WVCs (i.e., number/length of road) did not differ (based on overlapping 95% confidence intervals) between Project and Control Areas (Fig. 2.6). No difference in WVC rates was detected among years 1–3, but the number of individuals reported per mile in the Control Area was lower in year 4 than in other years, and also lower than in the Project Area during that same year (Fig. 2.7). More ungulates than carnivores were reported based on minimal or no overlap in 95% confidence intervals (Fig. 2.6).
Figure. 2.6. Rates of wildlife-vehicle collisions (number/mile/year, with 95% confidence intervals) reported by WSDOT maintenance personnel, by species group and area, July 2008–June 2011. Sample sizes were 54, 12, and 2 WVCs for ungulates, carnivores, and other species, respectively in the Control Area, and 34, 5, and 4 WVCs respectively in the Project Area
Figure 2.7. Rates of WVCs (number/mile, with 95% confidence intervals) reported by WSDOT maintenance personnel, by year and area, July 2008–June 2011. Sample sizes are shown next to the year and 95% confidence intervals. Sample sizes for years 1–4 were 18, 16, 18, and 2 WVCs respectively for the Control Area, and 14, 6, 4, and 10 WVCs respectively for the Project Area.
0
0.1
0.2
0.3
0.4
0.5
0.6
0.7
0.8
0.9
Control Project
Ungulates
Carnivores
Other
0
0.05
0.1
0.15
0.2
0.25
0.3
0.35
0.4
Yr1 Yr2 Yr3 Yr4
Control
Project

Baseline wildlife monitoring at I-90 Snoqualmie Pass East Chapter 2
Western Transportation Institute Page 21
WVC Reports: I-90 Wildlife Watch Results A total of 60 WVCs (18 Project Area, 42 Control Area), representing 14 species or species groups (e.g., raptors) and a number of “unknown” species, were reported on the I-90 Wildlife Watch website from November 2010–October 2011 (Table 2.3, Appendices 2.3, 2.4). Ungulates (n=19) and carnivores (n=17) were reported with similar frequency (Table 2.3). Raptors (n=7) were also frequently reported compared with other mammals and birds. Table 2.3. Total number of WVCs reported on the I-90 Wildlife Watch website, by species and area, November 2010–October 2011. Species or Species Group Control Area Project Area Total Black bear 1 1 Coyote 1 1 2 Fox 1 1 Striped skunk 1 1 Raccoon 9 3 12 Deer 8 4 12 Elk 6 1 7 Virginia opossum 1 1 Porcupine 1 1 2 Raptor 2 2 Hawk 2 1 3 Owl 2 2 Turkey 1 1 Hummingbird 1 1 Unknown 10 2 12 Total 42 18 60
The relatively low frequency of I-90 Wildlife Watch-reported WVCs made it difficult to discern any obvious seasonal patterns to the reports (Fig. 2.8). Fewer WVCs were reported in November–April than in most other months, but small overall sample sizes made valid comparisons impossible.

Baseline wildlife monitoring at I-90 Snoqualmie Pass East Chapter 2
Western Transportation Institute Page 22
Figure 2.8. Frequency of WVCs reported on the I-90 Wildlife Watch website, by species group and month, November 2010–October 2011.
Rates of WVCs (number/length of road) reported on the I-90 Wildlife Watch website did not differ (based on overlapping 95% confidence intervals) between Project and Control Areas, nor between species groups (Fig. 2.9).
Figure 2.9. Rates of WVCs (number/mile; with 95% confidence intervals) reported on the I-90 Wildlife Watch website, by species group and area, November 2010–June 2012. Sample sizes were 14, 11, and 17 WVCs for ungulates, carnivores, and other species, respectively in the Control Area, and 5, 6, and 7 WVCs respectively in the Project Area.
0
0.5
1
1.5
2
2.5
3
3.5
4
4.5
Ungulate
Carnivore
Other
Unknown
(blank)
0.00
0.20
0.40
0.60
0.80
1.00
1.20
Control Project
Ungulates
Carnivores
Other

Baseline wildlife monitoring at I-90 Snoqualmie Pass East Chapter 2
Western Transportation Institute Page 23
Direct Comparisons of MC versus Wildlife Watch Methods We were unable to detect differences (based on overlapping 95% confidence intervals) between rates of WVCs reported by WSDOT maintenance crews and I-90 Wildlife Watch participants during November 2010–June 2012 (Fig. 2.10). Further, we detected no differences in WVC rates between Control and Project Areas for these species groups. In the Control Area, however, I-90 Wildlife Watch participants reported a greater number of “other” species than did WSDOT maintenance crews.
Figure 2.10. ROCS and I-90 WW WVC rates during November 2010–June 2012, with 95% confidence intervals. Sample sizes are reported in Figures 2.6 and 2.9 (above). Reports of Live Animals I-90 Wildlife Watch also facilitated reports of live animals observed within the Study Area, with participants having reported 482 live animals during November 2010–June 2012 (Table 2.4). Most reports (82%) pertained to ungulates, especially elk, which were often reported in herds. The average number of individual elk observed per elk report was 3.2, whereas the average number of deer observed per deer report was 1.4. Carnivores were reported infrequently, with black bears and coyotes reported most often. Rates of live animal reports were similar between the Control and Project Areas (Fig. 2.11).
0.00
0.10
0.20
0.30
0.40
0.50
0.60
0.70
0.80
0.90
ROCS WW ROCS WW
Control Project
Ungulates
Carnivores
Other

Baseline wildlife monitoring at I-90 Snoqualmie Pass East Chapter 2
Western Transportation Institute Page 24
Table 2.4. Live animals reported on the I-90 Wildlife Watch website, by species and area, November 2010–June 2012. Species or Species Group Control Project Total Black bear 7 3 10 Bobcat 1 1 Cougar/Mountain lion 3 3 Coyote 5 1 6 Fox 1 3 4 Otter 4 4 Raccoon 2 2 Deer 51 59 110 Elk 176 111 287 Moose 1 1 Hare 1 1 Mouse 1 1 Woodrat 1 1 Raptor (general) 2 2 Eagle 4 4 Hawk 9 9 Osprey 1 1 Vulture 5 5 Owl 1 1 Goose 14 14 Raven 2 2 Crow 3 3 Turkey 4 5 9 Bluebird 1 1 Grand Total 270 212 482

Baseline wildlife monitoring at I-90 Snoqualmie Pass East Chapter 2
Western Transportation Institute Page 25
Figure 2.11. Rates of live animals (number/mile; with 95% confidence intervals) reported on the I-90 Wildlife Watch website, by species group and area, November 2010–June 2012. Sample sizes were 228, 19, and 23 WVCs for ungulates, carnivores, and other species, respectively in the Control Area, and 170, 11, and 31 WVCs respectively in the Project Area.
I-90 Wildlife Watch Volunteer Reporting Rates Seven volunteers drove a combined total of 22,859 miles within the survey area, contributing 73 reports totaling 100 individual animals (live=65, dead=35). After removing miles driven in poor visibility (n=5,402) and live bird sightings (n=19), Bayesian estimates of reporting rates over the entire Study Area for live and dead individuals were 0.003 individuals/mile driven (95% credible interval = 0.002–0.003) and 0.002 individuals/mile driven (95% credible interval = 0.001–0.003), respectively. Such relatively small numbers of individuals observed per mile driven preclude further meaningful analysis between Project and Control Areas, however, it is likely that this approach could be effective in other regions where WVC rates are higher. Power Analysis Based on the observed, four-year total of 34 ungulate WVCs detected in the Project Area with MC data, we estimated an occurrence rate of 8.5 WVCs/year. Using this value as the annual pre-construction rate for ungulate WVCs, we further estimated that 3.5 years of post-construction monitoring by WSDOT maintenance crews would be required to detect a 50% reduction in ungulate WVCs. Larger reductions would be detectable with fewer years of post-construction monitoring data, and more years would be required to detect smaller reductions (Fig. 2.12). Given the higher annual rate of ungulate WVCs in the Control Area versus the Project Area (i.e., 13.5 WVCs/year versus 8.5 WVCs/year), fewer years of post-construction monitoring would be required to detect a statistical reduction in WVCs in this area (Fig. 2.13).
0
2
4
6
8
10
12
14
Control Project
Ungulates
Carnivores
Other

Baseline wildlife monitoring at I-90 Snoqualmie Pass East Chapter 2
Western Transportation Institute Page 26
Figure 2.12. Power curves indicating the estimated number of years of monitoring that must be conducted before and after mitigation in the Project Area to detect 50%, 70%, and 90% reductions in WVCs with a power of 0.8.
Figure 2.13. Power curves indicating the estimated number of years of monitoring that must be conducted to detect 50% and 70% reductions in WVCs with a power of 0.8 between the period before and after mitigation efforts in the Control Area.
0
1
2
3
4
5
6
1 2 3 4 5 6 7 8 9
Num
ber o
f Sur
vey Y
ears
Aft
er M
itiga
tion
Number of Survey Years Before Mitigation
50% reduction 70% reduction 90% reduction
0
0.5
1
1.5
2
2.5
3
3.5
4
4.5
1 2 3 4 5 6 7 8 9
Num
ber o
f Sur
vey Y
ears
Aft
er M
itiga
tion
Number of Survey Years Before Mitigation
50% reduction 70% reduction

Baseline wildlife monitoring at I-90 Snoqualmie Pass East Chapter 2
Western Transportation Institute Page 27
We also estimated year-specific power curves for detecting 30%, 50%, and 70% reductions in ungulate WVCs based on 1, 2, 3, 4, and 5 years of post-construction monitoring, assuming 4 years of pre-construction monitoring with annual rates of 8.5 and 13.5 ungulate WVCs/year in the Project and Control Areas, respectively (Fig. 2.14, 2.15). Almost no amount of post-construction monitoring will permit the detection of a relatively small (i.e., 30%) reduction in WVCs. However, 3–4 years would likely provide sufficient power to detect >50% reductions in WVCs.
Figure 2.14. Curves indicating the power achieved and the associated number of years after mitigation required to detect 30%, 50%, and 70% reductions in WVCs within the Project Area, assuming four years of pre-mitigation monitoring.
0.3
0.4
0.5
0.6
0.7
0.8
0.9
1
1.1
0 1 2 3 4 5 6 7 8 9
Estim
ated
Pow
er
Number of Survey Years After Mitigation
30% reduction 50% reduction 70% reduction

Baseline wildlife monitoring at I-90 Snoqualmie Pass East Chapter 2
Western Transportation Institute Page 28
Figure 2.15. Curves indicating the power achieved and the associated number of years required to detect 30%, 50%, and 70% reductions in WVCs within the Control Area, assuming four years of pre-mitigation monitoring. Hotspot Analyses
We identified WVC hotspots for ungulates from MC data collected during July 2008–June 2012 within the following CEAs in the Project Area: Gold Creek (MP 55.2), Price/Noble Creek (MP 61.6), and at the border of Swamp Creek and Toll Creek (MP 63.3)(Fig. 2.16). There were no ungulate-specific WVC hotspots identified using I-90 WW data in the Project Area. One non-ungulate WVC hotspot (composed of one coyote and one bobcat) was identified from MC data, at the Townsend Creek CEA (MP 70) (Fig. 2.17). In addition, a major, non-ungulate hotspot was identified with I-90 WW data, adjacent to Easton Lake in the Kachess River CEA (MP 70). This latter hotspot comprised one report each of a coyote, a skunk, and a Virginia opossum.1
1 This location is further east than would be expected to encounter a Virginia opossum. This is an instance where it was necessary to simply report what was entered into the I-90 Wildlife Watch website, as accuracy-checking of citizen reports was not possible. This also highlights why caution must be practiced when interpreting these data.
0.3
0.4
0.5
0.6
0.7
0.8
0.9
1
1.1
0 1 2 3 4 5 6 7 8 9
Estim
ated
Pow
er
Number of Survey Years After Mitigation
30% reduction 50% reduction 70% reduction

Baseline wildlife monitoring at I-90 Snoqualmie Pass East Chapter 2
Western Transportation Institute Page 29
Figure 2.16. Ungulate WVC hotspots in the Project Area, identified via data collected by WSDOT maintenance crews. Hotspots were derived from n=34 WVCs with hotspots defined as the 46% kernel isopleth (see Methods for details).

Baseline wildlife monitoring at I-90 Snoqualmie Pass East Chapter 2
Western Transportation Institute Page 30
Figure 2.17. Non-ungulate WVC hotspots in the Project Area, identified via data collected by WSDOT maintenance crews and I-90 Wildlife Watch participants. Hotspots were derived from n=6 WVCs with hotspots defined as the 72% kernel isopleth (see Methods for details).

Baseline wildlife monitoring at I-90 Snoqualmie Pass East Chapter 2
Western Transportation Institute Page 31
MC data were used to identify a single ungulate WVC hotspot in the Control Area at MP 34.9, east of North Bend (Fig. 2.18). Three minor ungulate WVC hotspots were identified from I-90 WW data, at MPs 31, 32.1, and 39.7 (Fig. 2.18).
Figure 2.18. Ungulate wildlife-vehicle collision hotspots in the Control Area identified via analysis of data collected by WSDOT maintenance crews and I-90 Wildlife Watch participants. Hotspots were derived from n=54 WVCs with hotspots defined as the 49% kernel isopleth (see Methods for details).
Also in the Control Area, non-ungulate WVC hotspots were detected with MC data at
MPs 36 (2 coyotes, 1 bobcat) and 48.3 (2 black bears), and with I-90 WW data at MPs 31 and 31.3 (4 raccoons, 1 coyote)(Fig. 2.19).

Baseline wildlife monitoring at I-90 Snoqualmie Pass East Chapter 2
Western Transportation Institute Page 32
Figure 2.19. Non-ungulate WVC hotspots in the Control Area, identified via data collected by WSDOT maintenance crews and I-90 Wildlife Watch participants. Hotspots were derived from n=13 WVCs with hotspots defined as the 57% kernel isopleth (see Methods for details). Comparisons of Live and Dead Animal Hotspot Locations When ungulate WVC hotspots from both MC and I-90 WW data from within the Project Area were combined and compared with live ungulate hotspots derived from I-90 WW data, only two locations showed hotspot overlap—Noble Creek (MP 61.6) within the Price/Noble Creek CEA, and a location just west of the Hudson Creek CEA (MP 66.4)(Fig. 2.20).

Baseline wildlife monitoring at I-90 Snoqualmie Pass East Chapter 2
Western Transportation Institute Page 33
Figure 2.20. Ungulate WVC hotspots and live ungulate hotspots in the Project Area, identified via data collected by WSDOT maintenance crews and I-90 Wildlife Watch participants. WVC hotspots were derived from n=39 WVCs with hotspots defined as the 46% kernel isopleth, and live hotspots were derived from n=74 observations with hotspots defined as the 58% kernel isopleth (see Methods for details).
Locations for other live ungulate hotspots differed from those of WVC hotspots (Fig. 2.20), and non-ungulate WVC hotspots differed in location from live non-ungulate hotspots within the Project Area (Fig. 2.21).

Baseline wildlife monitoring at I-90 Snoqualmie Pass East Chapter 2
Western Transportation Institute Page 34
Figure 2.21. Non-ungulate WVC hotspots and live non-unglulate hotspots in the Project Area, identified via data collected by WSDOT maintenance crews and I-90 Wildlife Watch participants. WVC hotspots were derived from n=16 WVCs with hotspots defined as the 72% kernel isopleth, and live hotspots were derived from n=11 observations with hotspots defined as the 63% kernel isopleth (see Methods for details).

Baseline wildlife monitoring at I-90 Snoqualmie Pass East Chapter 2
Western Transportation Institute Page 35
In the Control Area, there was no overlap in live and dead hotspot locations for ungulates nor non-ungulates (Figs. 2.22, 2.23).
Figure 2.22. Ungulate WVC hotspots and live animal locations in the Control Area, identified via data collected by WSDOT maintenance crews and I-90 Wildlife Watch participants. WVC hotspots were derived from n=107 WVCs with hotspots defined as the 44% kernel isopleth, and live hotspots were derived from n=95 observations with hotspots defined as the 48% kernel isopleth (see Methods for details).

Baseline wildlife monitoring at I-90 Snoqualmie Pass East Chapter 2
Western Transportation Institute Page 36
Figure 2.23. Non-ungulate WVC hotspots and live animal locations in the Control Area, identified via data collected by WSDOT maintenance crews and I-90 Wildlife Watch participants. WVC hotspots were derived from n=30 WVCs with hotspots defined as the 73% kernel isopleth, and live hotspots were derived from n=20 observations with hotspots defined as the 52% kernel isopleth (see Methods for details). Landscape Features Associated with WVCs and Live Animal Locations The best models for predicting deer or elk WVCs from landscape characteristics that we developed using the MaxEnt modeling approach performed relatively poorly for predicting the actual location of WVCs based on AUC values. This outcome may have resulted from actual weak relationships between the landscape features we measured and the location of deer or elk WVCs, or could have been a result of relatively small sample sizes leading to low model power. Despite the overall weak predictive power of the models, MaxEnt was able to identify some features that were most related to WVC presence. Deer WVCs Our MaxEnt analysis suggested that, of the landscape features evaluated (Table 2.1), stream density had the strongest relationship with deer WVC locations in the Project Area. In the Control Area, distance-to-nearest ridge was identified as having the most relationship with deer WVC locations. In both cases the relationship was positive, meaning that in the Project Area

Baseline wildlife monitoring at I-
Western Transportation Institute
higher stream densities were associated with locations of WVCs Area WVCs tended to be located further from ridgesmodels had AUC values of 0.65 and 0.61 respectively (where 0.5 is prediction no better than chance, and 1.0 indicates perfect predictive performance)
Figure 2.24. Response curve output from MaxEnt analysis showing positive association between deer WVC locations and stream density in the Project Area. The Ylikelihood of a WVC, and the X-axis is stream density.
Figure 2.25. Response curve output from MaxEnt analysis showing positive association between deer WVC locations and distanceincreasing likelihood of a WVC, and the X
Elk WVCs Landscape features relating to the location of elk to be different than those identified for deer. In the Project Area,associated with areas farther from forest patches were most associated with areas lacking Jersey barriers along the highway or in the median 2.27). Again, the model was only moderately
Baseline wildlife monitoring at I-90 Snoqualmie Pass East
ociated with locations of WVCs (Fig. 2.24), and in the Control Area WVCs tended to be located further from ridges (Fig. 2.25). The Project and Control Area
values of 0.65 and 0.61 respectively (where 0.5 is prediction no better than and 1.0 indicates perfect predictive performance).
. Response curve output from MaxEnt analysis showing positive association between
deer WVC locations and stream density in the Project Area. The Y-axis represents increasing axis is stream density.
. Response curve output from MaxEnt analysis showing positive association between
deer WVC locations and distance-to-nearest-ridge in the Control Area. The Y-axis represents , and the X-axis is distance-to-ridge.
Landscape features relating to the location of elk WVCs in the Project and Control Areathan those identified for deer. In the Project Area, elk WVCs were positively areas farther from forest patches (Fig. 2.26), but in the Control Area, WVCs
were most associated with areas lacking Jersey barriers along the highway or in the median only moderately predictive (AUC = 0.66).
Chapter 2
Page 37
, and in the Control e Project and Control Area
values of 0.65 and 0.61 respectively (where 0.5 is prediction no better than
. Response curve output from MaxEnt analysis showing positive association between axis represents increasing
. Response curve output from MaxEnt analysis showing positive association between axis represents
Control Areas tended were positively
, but in the Control Area, WVCs were most associated with areas lacking Jersey barriers along the highway or in the median (Fig.

Baseline wildlife monitoring at I-
Western Transportation Institute
Figure 2.26. Response chart output from MaxEnt analysis showing positive association between elk WVC locations and areas further from the nearest forested patch in the Project Area. The Yaxis represents increasing likelihood of a WVC, and the X
Figure 2.27. Response chart output from MaxEnt analysis showing the negative association between elk WVC locations and the presence of Jersey barriers in the Control Area. The Yrepresents increasing likelihood of a WVC, and the Xor present (1).
Species Diversity, Seasonal Trends, and Rates The types and number of species involved in WVCs reported WW) were similar. Both datasets contained elk, deer, black bears, and coyotes. Only MC data included bobcats, and single reports of a beaver, a Canada goose and a mallard were also unique. In contrast, I-90 WW data contained a large number of of raccoons and raptors (hawks, owls, and generic reports of “raptor”), two reports of porcupines,
Baseline wildlife monitoring at I-90 Snoqualmie Pass East
. Response chart output from MaxEnt analysis showing positive association between
elk WVC locations and areas further from the nearest forested patch in the Project Area. The Yaxis represents increasing likelihood of a WVC, and the X-axis is distance-to-forested patch.
. Response chart output from MaxEnt analysis showing the negative association
between elk WVC locations and the presence of Jersey barriers in the Control Area. The Yrepresents increasing likelihood of a WVC, and the X-axis is whether a Jersey barrier is absent (0)
Discussion
Species Diversity, Seasonal Trends, and Rates for WVCs and Live Animal Observations
The types and number of species involved in WVCs reported in the two datasetswere similar. Both datasets contained elk, deer, black bears, and coyotes. Only MC data
included bobcats, and single reports of a beaver, a Canada goose and a mallard were also unique. 90 WW data contained a large number of unique species, including multiple reports
raptors (hawks, owls, and generic reports of “raptor”), two reports of porcupines,
Chapter 2
Page 38
. Response chart output from MaxEnt analysis showing positive association between elk WVC locations and areas further from the nearest forested patch in the Project Area. The Y-
forested patch.
. Response chart output from MaxEnt analysis showing the negative association between elk WVC locations and the presence of Jersey barriers in the Control Area. The Y-axis
axis is whether a Jersey barrier is absent (0)
for WVCs and Live Animal Observations
in the two datasets (MC and I-90 were similar. Both datasets contained elk, deer, black bears, and coyotes. Only MC data
included bobcats, and single reports of a beaver, a Canada goose and a mallard were also unique. including multiple reports
raptors (hawks, owls, and generic reports of “raptor”), two reports of porcupines,
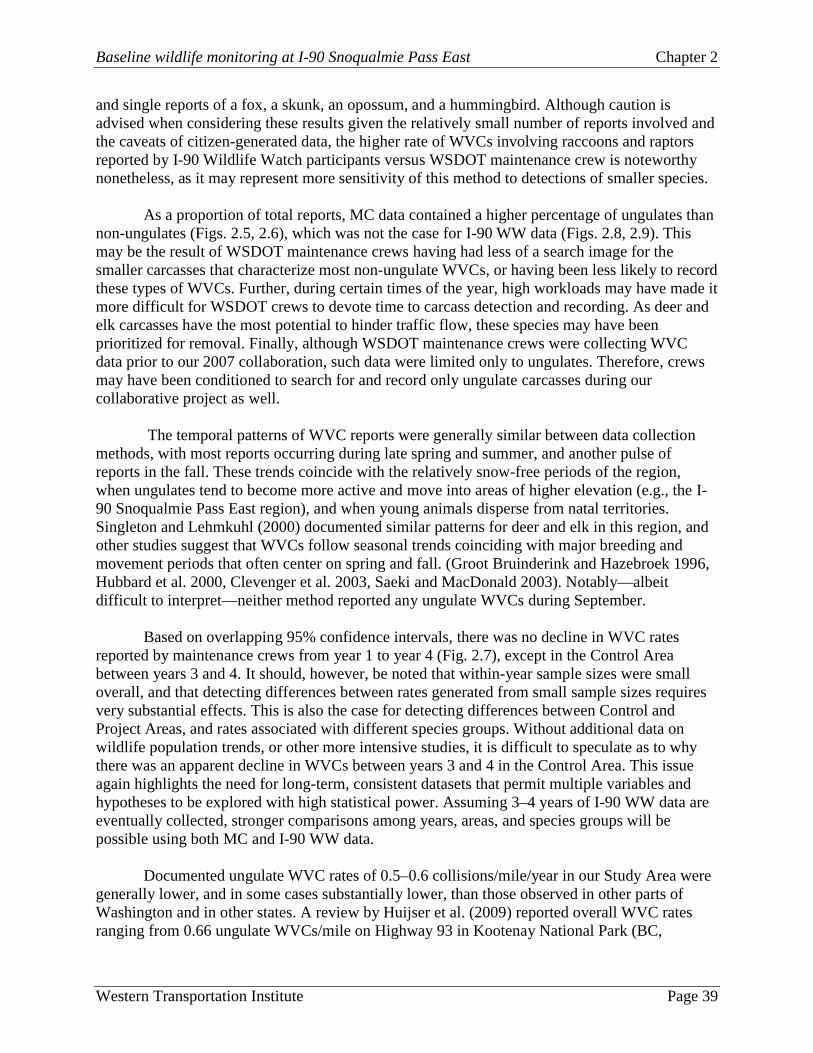
Baseline wildlife monitoring at I-90 Snoqualmie Pass East Chapter 2
Western Transportation Institute Page 39
and single reports of a fox, a skunk, an opossum, and a hummingbird. Although caution is advised when considering these results given the relatively small number of reports involved and the caveats of citizen-generated data, the higher rate of WVCs involving raccoons and raptors reported by I-90 Wildlife Watch participants versus WSDOT maintenance crew is noteworthy nonetheless, as it may represent more sensitivity of this method to detections of smaller species.
As a proportion of total reports, MC data contained a higher percentage of ungulates than non-ungulates (Figs. 2.5, 2.6), which was not the case for I-90 WW data (Figs. 2.8, 2.9). This may be the result of WSDOT maintenance crews having had less of a search image for the smaller carcasses that characterize most non-ungulate WVCs, or having been less likely to record these types of WVCs. Further, during certain times of the year, high workloads may have made it more difficult for WSDOT crews to devote time to carcass detection and recording. As deer and elk carcasses have the most potential to hinder traffic flow, these species may have been prioritized for removal. Finally, although WSDOT maintenance crews were collecting WVC data prior to our 2007 collaboration, such data were limited only to ungulates. Therefore, crews may have been conditioned to search for and record only ungulate carcasses during our collaborative project as well.
The temporal patterns of WVC reports were generally similar between data collection
methods, with most reports occurring during late spring and summer, and another pulse of reports in the fall. These trends coincide with the relatively snow-free periods of the region, when ungulates tend to become more active and move into areas of higher elevation (e.g., the I-90 Snoqualmie Pass East region), and when young animals disperse from natal territories. Singleton and Lehmkuhl (2000) documented similar patterns for deer and elk in this region, and other studies suggest that WVCs follow seasonal trends coinciding with major breeding and movement periods that often center on spring and fall. (Groot Bruinderink and Hazebroek 1996, Hubbard et al. 2000, Clevenger et al. 2003, Saeki and MacDonald 2003). Notably—albeit difficult to interpret—neither method reported any ungulate WVCs during September.
Based on overlapping 95% confidence intervals, there was no decline in WVC rates
reported by maintenance crews from year 1 to year 4 (Fig. 2.7), except in the Control Area between years 3 and 4. It should, however, be noted that within-year sample sizes were small overall, and that detecting differences between rates generated from small sample sizes requires very substantial effects. This is also the case for detecting differences between Control and Project Areas, and rates associated with different species groups. Without additional data on wildlife population trends, or other more intensive studies, it is difficult to speculate as to why there was an apparent decline in WVCs between years 3 and 4 in the Control Area. This issue again highlights the need for long-term, consistent datasets that permit multiple variables and hypotheses to be explored with high statistical power. Assuming 3–4 years of I-90 WW data are eventually collected, stronger comparisons among years, areas, and species groups will be possible using both MC and I-90 WW data.
Documented ungulate WVC rates of 0.5–0.6 collisions/mile/year in our Study Area were generally lower, and in some cases substantially lower, than those observed in other parts of Washington and in other states. A review by Huijser et al. (2009) reported overall WVC rates ranging from 0.66 ungulate WVCs/mile on Highway 93 in Kootenay National Park (BC,
Baseline wildlife monitoring at I-90 Snoqualmie Pass East Chapter 2
Western Transportation Institute Page 40
Canada) to 5.79 ungulate WVCs/mile on I-90 near Bozeman Pass (MT, USA). A study of WVCs along the TransCanada Highway throughout the Bow Valley (Alberta, Canada) reported rates of 0.5–6.8 ungulate WVCs/mile, with rates across all highway subsections averaging about 2–3 ungulate WVCs/mile (Lee et al. 2012). In Washington, an analysis by Wang et al. (2010) estimated WVC rates for white-tailed and mule deer to range from about 1 WVC/mile on US-101 to >25 WVC/mile on State Route 970, with rates on most routes ranging from ~5–10 WVCs/mile. This latter study, however, included locations throughout Washington, many of which contained much higher quality ungulate habitat and therefore higher ungulate densities. In contrast, data collected in the I-90 SPE region from 1990–1998 (Singleton and Lehmkuhl 2000) yielded WVC rates of 1 deer/mile/year and 0.5 elk/mile/year, which were similar to the 0.5–0.6 ungulate collisions/mile/year that we observed.
Relatively low WVC rates in our Study Area may have been a function of low overall
habitat quality for ungulates, and the fact that ungulates in this mountainous area migrate to lower elevation habitats during winter. In addition, our relatively low WVC rates could indicate high levels of highway avoidance by wildlife. Other studies suggest that WVC rates are generally higher on lower volume roads (Huijser et al. 2008), and Gagnon et al. (2007) documented wildlife avoidance of a highway in Arizona when traffic volumes were highest (e.g., an increase in traffic volume from 0–1,500 vehicles/hour correlated with a 20% decrease in highway crossings by elk). Effects in the latter study, however, did not appear to be permanent, with elk returning to areas near the highway during periods with lower traffic volumes. Gagnon et al. (2007) speculated that the higher elk WVC rates observed during weekdays, which typically exhibited lower traffic volumes than weekends, resulted from greater elk activity along the highway during these periods. In the case of I-90 SPE, traffic volumes were routinely 2,000–2,500 vehicles/hour, with average volumes of >500 vehicles/hour during all but 6 hours of the day (Fig. 2.28). Resulting avoidance effects may translate to fewer WVCs.
Figure 2.28. Average number of vehicles traveling on I-90 by hour, recorded in 2011 (excluding June–July) at milepost 52.2 near Snoqualmie Pass. Data extracted from the WSDOT Data Warehouse.
0
500
1,000
1,500
2,000
2,500
3,000
12 a.
m.
1 a.
m.
2 a.
m.
3 a.
m.
4 a.
m.
5 a.
m.
6 a.
m.
7 a.
m.
8 a.
m.
9 a.
m.
10 a.
m.
11 a.
m.
12 p
.m.
1 p.
m.
2 p.
m.
3 p.
m.
4 p.
m.
5 p.
m.
6 p.
m.
7 p.
m.
8 p.
m.
9 p.
m.
10 p
.m.
11 p
.m.
Vehi
cles
/Hou
r
Time of Day
Weekday Weekend
Baseline wildlife monitoring at I-90 Snoqualmie Pass East Chapter 2
Western Transportation Institute Page 41
Hotspots Hotspot analyses are intended to highlight locations where a disproportionate number of WVCs or live animal reports occur. Where data are sparse, few hotspots can be identified unless reports are highly clustered, and identified hotspots can comprise relatively few reports, despite being defined as hotspots. More hotspots were identified with MC data than I-90 WW data, which is to be expected given the longer duration of MC data collection and thus the greater number of reports used to generate hotspots (i.e., 111 reports for MC-generated hotspots versus 60 reports for I-90 WW-generated hotspots ). Longer-term datasets (or higher intensity surveys) for both data collection methods would provide more accurate hotspot estimates and yield better options for comparing these methods.
WVC hotspot locations differed according to which method was used to gather the data.
It is difficult to say why this may have been the case. Perhaps WSDOT maintenance crews, who were able to travel along the shoulder and stop to investigate carcasses along the roadway, were more effective at detecting carcasses in certain locations than were citizens traveling at high speeds and unable to stop. Another hypothesis is that maintenance crews, whose responsibilities included locating and removing debris (e.g., tire remnants) from travel lanes, had less of a search image for small and midsized carcasses located off of the main roadway. Reciprocally, it should be noted that motorists, given the speed at which they were traveling and their inability to stop, may have been prone to error in pinpointing exact carcass locations, or may have been less able to focus on detecting carcasses at certain locations along the highway (e.g. curves).
Interestingly, when MC and I-90 WW ungulate WVC data were combined, major WVC
hotspots generally corresponded with locations highlighted as high-density roadkill sites by Singleton and Lehmkuhl (2000)—specifically at MP 55–55.3 near the northern tip of Keechelus Lake, and at MP 60.5–62 from the Keechelus Lake dam to Price/Noble Creeks.
Locations of live animal hotspots and WVC hotspots tended to differ. This result was not
surprising, and has been documented and discussed elsewhere (Clevenger et al. 2002). Live animal hotspots without corresponding WVC hotspots may represent places where wildlife (e.g., elk) congregated but were discouraged from crossing because of landscape or highway features (e.g., Jersey barriers), or where crossing efforts were relatively successful. Indeed, modeling of landscape features related to WVC hotspots (see below) suggest that for elk, the presence of Jersey barriers was associated with fewer WVCs. Further research, however, would be required to effectively evaluate these hypotheses.
Most WVC and live animal hotspots in the Project Area occurred within CEAs that will
be mitigated with crossing structures as part of the I-90 SPE project. One live animal/WVC hotspot overlap area near MP 66.5, however, is largely outside of planned CEAs. Treating this location with effective wildlife fencing (Clevenger et al. 2001) may be important for reducing or eliminating WVCs there in the future. Landscape Features Associated with WVCs and Live Animal Locations Relatively poor predictive performance for both the deer and elk models across the Study Area

Baseline wildlife monitoring at I-90 Snoqualmie Pass East Chapter 2
Western Transportation Institute Page 42
(i.e., AUC values of only 0.60–0.75) makes the interpretation of relationships between WVCs and landscape features tenuous, and although relationships between WVCs and landscape features were identified by MaxEnt, such relationships were likely weak. Higher densities of streams and areas located away from ridges (e.g., valley bottoms) were associated with deer WVCs in the Project and Control Areas, respectively. Others studies have identified similar relationships between deer WVCs and riparian areas and gullies (Finder et al. 1999, Crooks et al. 2008). In Colorado, Crooks et al. (2008) identified “midslope drainages” and areas closer to streams as having higher counts of animal-vehicle collisions. They speculate that such areas are conducive to animal movements and may, therefore, be predisposed to higher WVC activity.
In contrast to the results of the analysis for deer, elk WVCs appeared to be more related
to open areas (i.e., locations farther from forest cover) in the Project Area, or areas with fewer Jersey barriers in the Control Area. The relationship with open areas is somewhat counter to results from other studies (e.g., Crooks et al. 2008) that have identified areas with higher percent forest cover or shorter distances to forest patches as being more associated with ungulate WVC locations. Such contrasts may, however, be the result of differences in regional land-use trends and study scale, or could represent complex interactions of multiple variables such as forest cover and vehicle sight distances. Jersey barriers (and especially those with vertical reflectors on top) may present enough of an additional disincentive—beyond the high-traffic volume roadway itself—to crossing by elk that they choose to attempt crossing elsewhere.
While local landscape features themselves have been shown to affect the location of
WVCs, it may often be that factors related to the road segment (e.g., speed limit; Seiler 2004, Ng et al. 2008), the larger region (e.g., road density; Wang et al. 2010), or other specific habitat-driven choices (Roger and Ramp 2009) have the most effect on the location of WVCs). Biases in Reporting
Both methods we employed for collecting WVC and live animal occurrence data were inevitably subject to biases. Indeed, efforts to collect WVC data and estimate accurate WVC rates are known to be fraught with bias issues, such as spatial inaccuracy of report locations (Gunson et al. 2009), incorrect species identification, and duplicate reporting, or from underreporting of WVCs related to carcasses being removed from the highway (Slater 2002) or injured animals dying elsewhere (Hesse 2006).
We attempted to include various protocols and standards in an effort to address, or at
least minimize, some of these issues. For example, maintenance crews were equipped with ROCS GPS devices to ensure spatial accuracy of reports. We also conducted regular ROCS trainings for maintenance crews, during which we described species that might be encountered in the Study Area. The I-90 Wildlife Watch website included a detailed locator map to help address spatial accuracy issues, and provided species photos and links to natural history information to help maximize the accuracy of species identification. Despite these efforts, the website did not require that users include contact information, and it was therefore typically impossible to verify reports of sightings. On the roadway, 1/10 mile marker posts were present throughout most of our Study Area, and ostensibly made it easier for motorists to note their sighting locations and plot them with accuracy later. We screened I-90 WW data to identify and remove duplicate

Baseline wildlife monitoring at I-90 Snoqualmie Pass East Chapter 2
Western Transportation Institute Page 43
reports. Concerns about underreporting of WVCs as a result of degraded /removed carcasses or
injured animals leaving the roadway are more difficult to address. One study in Wales estimated that only 6–8% of all actual WVCs might typically be recorded in WVC studies (Slater 2002), and Hesse (2006) concluded that for every reported WVC, three went unreported. Our two data collection methods—i.e., WSDOT maintenance crews and I-90 Wildlife Watch—were intended to complement one another and reduce the chances that a given carcass would be missed. For I-90 Wildlife Watch, we conducted extensive outreach (e.g., billboards, radio advertisements, posters) in an attempt to increase citizen participation, and therefore maximize the probability of capturing WVC data. Similarly, our regular ROCS trainings for maintenance crews encouraged them to routinely look for and report WVCs. While such measures could not ensure that every WVC was recorded, they at least provided some consistency in survey effort. It will be important to parallel this consistency when collecting post-construction WVC data for comparison with pre-construction data.
Recommendations for Future Monitoring This chapter documents the results of four years of WVC and live animal monitoring conducted via two methods along 39 miles of I-90 near Snoqualmie Pass. Our primary objective was to collect baseline data prior to the installation of wildlife crossing structures and wildlife fencing such that the performance of these mitigation measures can ultimately be evaluated. Our data and results will be suitable for comparison with post-mitigation data and rates, assuming methods and efforts to collect post-mitigation data are similar to those described herein. The following recommendations should help to guide future monitoring efforts such that the performance of mitigation efforts can be most effectively evaluated:
Identifying the effects of mitigation efforts in the face of other potential concurrent changes in wildlife populations requires that a BACI design be implemented. Maintaining monitoring efforts in both the Project and Control Areas is, therefore, essential.
For accurate pre-post comparisons, pre-construction monitoring should be conducted
immediately prior to the installation of crossing structures and wildlife fencing, and post-construction monitoring should begin immediately following the installation of the structures and fencing. Large temporal gaps in monitoring between pre- and post-construction monitoring efforts make comparisons less reliable, as it becomes more likely that other factors beyond mitigation efforts (e.g., changes in wildlife densities) influence WVC rates as well. Observed WVC rates to-date in both the Project and Control Areas suggest that at least 6–8 years of a combination of pre- and post-construction monitoring should be conducted. Ideally, the number of monitoring years pre- and post-construction should be close to equal. Fewer years of monitoring during the pre-construction window will require an increased number of years of monitoring post-construction to detect a given reduction in WVCs, with a given power. Thus, continuation of WVC monitoring—or at the very least initiating WVC monitoring again 3–4 years prior to final construction and the installation of wildlife fencing—will make the detection of actual reductions in

Baseline wildlife monitoring at I-90 Snoqualmie Pass East Chapter 2
Western Transportation Institute Page 44
WVCs after construction much more probable.
Despite multiple years of data collection, the relatively small sample sizes observed for WVCs during our monitoring efforts resulted in relatively low power to detect differences (1) between Maintenance Crew and I-90 Wildlife Watch results; (2) between Control and Project Areas, and; (3) among survey years. In the case of WVC studies, sample size is the result of both sufficient survey effort and total actual numbers of WVCs. We made substantial efforts to encourage consistent participation in WVC reporting by both the WSDOT maintenance crews and members of the public. Future monitoring efforts should include regular refreshers and reminders for WSDOT crews, as well as increased outreach and publicizing of the I-90 Wildlife Watch program. Such efforts will help to ensure that sample sizes are as large as possible, and will maximize consistency between pre- and post-construction monitoring, thus making results from pre- and post-construction monitoring efforts more comparable.

Baseline wildlife monitoring at I-90 Snoqualmie Pass East Chapter 3
Western Transportation Institute Page 45
Chapter 3 – Monitoring the Pre-Construction Crossing Activity of High-Mobility Species
Introduction Evaluating the performance of mitigation efforts aimed at reducing wildlife-vehicle collisions (WVCs) on highways and increasing cross-highway connectivity for wildlife and natural communities requires first assessing pre-mitigation frequencies of WVCs and existing levels of connectivity across the highway of interest. Such baseline data can then be compared with post-mitigation data. Chapter 2 described pre-mitigation frequencies and patterns of WVCs and live animal distributions in the I-90 Snoqualmie Pass East (SPE) Project Area. Here, we summarize our efforts to document at-grade and sub-grade highway crossing frequencies for high-mobility mammals in the Project Area, and the results of these monitoring efforts.
We quantified sub-grade crossing activity using remote cameras deployed in many of the
I-90 SPE Project Area’s larger culverts, and in underpasses formed by highway bridges. These structures were designed and installed decades ago, with the specific purpose of facilitating the movement of water beneath the highway. Although they were not originally installed with the intention of providing crossing opportunities for wildlife, few long-term and intensive studies have been conducted to assess whether and to what extent such structures are indeed used by wildlife.
At-grade crossing activity is difficult to quantify, especially across very large stretches of
highway. Radio- or GPS-collar technology has proven useful for such applications (e.g., Dodd et al. 2007, Gagnon et al. 2007), but collaring projects are expensive, can have negative consequences for study animals (Cattet et al. 2008), and typically permit data to be collected on relatively few individuals. Track beds installed parallel and adjacent to the highway (Hardy et al. 2007, Hardy and Huijser 2007) can be effective for evaluating relatively short stretches of highway, but they are labor intensive to install and maintain—especially when right-of-way access is limited, topography is a constraint (e.g., when the highway runs along cliffs and steep slopes), and climate is particularly challenging (e.g., in areas characterized by high precipitation, cold weather, snow, and ice). Such conditions were all present within the I-90 SPE Project Area.
Snow tracking can yield reliable crossing and occurrence data, even under difficult
topographical scenarios, and has been applied previously within the Project Area (Singleton and Lehmkuhl 2000). This method also has substantial limitations in the I-90 SPE corridor, however. First, snow tracking allows for the detection only of species that are present and active when snow cover is consistent, and thus largely precludes monitoring ungulates at higher elevations and bears during hibernation periods. Further, the window of opportunity for tracking is small; conducting surveys too soon after a snowfall provides insufficient time for animals to become active and deposit tracks, but waiting too long can result in poor snow conditions as temperatures warm or cool. Also, rapid warming or rain following a snow event can quickly render the snow surface unsuitable for tracking. Finally, snow tracking is ineffective for monitoring wildlife during periods lacking snowfall. Despite these limitations, we chose snow tracking as the best available method for collecting at-grade crossing data in the Project Area. We nonetheless

Baseline wildlife monitoring at I-90 Snoqualmie Pass East Chapter 3
Western Transportation Institute Page 46
suggest that snow tracking results be interpreted carefully, and that they be considered indices to crossing rates and behaviors for those few species detected as opposed to actual estimates of crossing rates for all species that might be present.
We specifically focused our monitoring efforts on medium- to large-bodied, high-
mobility mammals (e.g., animals larger than a snowshoe hare). This was primarily due to the fact that remote cameras and camera deployment configurations for larger bodied mammals differ from those that are most effective for surveying small mammals, birds, or aquatic species (e.g., fish, amphibians). Further, snow tracking protocols for small mammals differ markedly from those optimized for larger mammals. Finally, other research projects being carried out by biologists at Central Washington University were already addressing one small mammal of conservation concern (i.e., pikas), as well as amphibians, reptiles, and fish.
We address the following objectives related to sub-grade and at-grade crossing activity
by high-mobility mammals in the I-90 SPE Project Area:
1. estimate rates, species composition, and timing of sub-grade crossings through existing large culverts and underpasses, and over existing bridges using remote camera methods;
2. estimate rates and species composition of at-grade crossings during winter within select
stretches of I-90 using snow tracking methods.

Baseline wildlife monitoring at I-90 Snoqualmie Pass East Chapter 3
Western Transportation Institute Page 47
Study Area The Study Area is described in detail in Chapter 1. We monitored large culverts and underpasses along the entire 15-mile extent of the I-90 SPE Project Area, from MP 55.1 (Hyak) to MP 70.3 (Easton)(Fig. 3.1). Within the Project Area, WSDOT had previously highlighted specific highway segments that were considered to be especially important for connectivity mitigation efforts (WSDOT 2006). Fourteen of these Connectivity Emphasis Areas (CEAs) are used as reference points in our report (Fig. 3.1). We use “Project Area” when referring to the I-90 SPE project extent, and “Study Area” to more generally describe the region where our monitoring efforts took place. For the purposes of our structure monitoring efforts, these areas are identical.
Figure 3.1. Map of our Study Area, highlighting Connectivity Emphasis Areas (CEAs), select mileposts, and locations of monitored structures.

Baseline wildlife monitoring at I-90 Snoqualmie Pass East Chapter 3
Western Transportation Institute Page 48
Methods Identification of Structures for Monitoring In late 2007, we obtained multiple, georeferenced databases of known storm water culverts from WSDOT, which were combined into a master database of 349 culverts. In addition to locations, this database contained attributes including culvert type (e.g., corrugated metal pipe, concrete box) and size. Preliminary field visits to select culverts suggested that this database was both incomplete and, in some cases, inaccurate, with regards to both culvert type and size. We acquired a second database from the USDA Forest Service (P. Singleton, USDA Forest Service, unpublished data) that included sites monitored as part of a study conducted from 1998–2000 (Singleton and Lehmkuhl 2000). From both databases, we selected a subset of culverts to evaluate in terms of the likelihood of their being used by medium- to large-bodied mammals to cross under I-90. We based our assessment primarily on whether the structures: (1) were large relative to all available culverts (i.e., 4 ft x 4ft for rectangular structures or 4 ft in diameter for cylindrical structures); (2) were likely to be water-free during some periods of the year based on the size of the creek they drained and whether they emptied into a lake; (3) had flat bases; and (4) were located in areas deemed to have high potential for wildlife access and movement based on previous assessments (Singleton and Lehmkuhl 2000, WSDOT 2006).
In addition to culverts, we evaluated all underpasses that could potentially provide crossing opportunities for medium-to-large mammals, as well as bridges crossing over the highway that could potentially be used by wildlife.
Remote Camera Deployment and Maintenance We used remote digital cameras to monitor wildlife crossings through culverts and bridges. Over five-plus years, we employed all models of Reconyx remote cameras (Holmen, Wisconsin), including Silent Image, Rapidfire, and Hyperfire models from both the “professional” and “outdoor” series (Fig. 3.2). These cameras were triggered to take photographs when they detected the movement of objects (i.e., animals) whose temperature differs from the ambient air temperature. While most photos are instigated by warm-blooded mammals or birds, other objects, such as snow, ice chunks, or blowing vegetation, occasionally caused “false” triggers. With sufficient light (e.g., daytime in open habitats), most camera models recorded color photos without infrared illumination. When light was limited, however, (e.g., inside culverts, nighttime, under heavy tree canopy), infrared emitters were used to illuminate subjects and a black and white image was recorded. We used standard camera models that featured high-output infrared emitters that glowed red to the human eye, as well as “stealth” or “covert” models whose infrared emitters were undetectable to humans and some wildlife. We opted for deploying covert models in locations where passersby might be more likely to occur to minimize the risk of theft and vandalism.

Baseline wildlife monitoring at I-90 Snoqualmie Pass East Chapter 3
Western Transportation Institute Page 49
Figure 3.2. Three Reconyx-brand digital remote cameras used to monitor culverts, underpasses, and bridges. Silent Image, Rapid Fire, and Hyperfire models are shown from left to right. (Photo: R. Long/WTI)
We programmed cameras with the highest sensor-sensitivity setting, and to take 10 successive photos during each trigger event, with no pause between events. This combination of settings maximized our chances of detecting individuals of all sizes, and also ensured that we would record as many images as possible from each trigger event. Cameras were powered with rechargeable NiMH C-cell batteries, and equipped with 1–2 GB compact flash or SD media cards.
We deployed a single camera at each culvert. At larger underpasses, we deployed a
camera at each potential crossing location (e.g., under bridges spanning creeks, where either bank of the creek could be accessed by wildlife, we deployed a camera on each bank). We initially deployed cameras on trees outside of culverts, with the camera and sensor aimed at the culvert entrance. After experiencing high numbers of false detections triggered by vegetation, however, as well as detections of birds and rodents using culvert entrances as perching locations or habitat, we moved cameras to the inside the culverts and faced them towards the center. Locating cameras inside of culverts also eliminated the need to continually adjust the height of camera units to adjust for changing snow levels, and eliminated exposure to rain, sleet, snow, and sun. We removed cameras from culverts and directed them at culvert entrances during some spring thaw periods, when high water levels inside the culverts threatened to submerge the cameras.

Baseline wildlife monitoring at I-90 Snoqualmie Pass East Chapter 3
Western Transportation Institute Page 50
We attached cameras to cement culverts by affixing a custom-made bracket to the wall with expansion bolts, and attaching a Reconyx security box to the bracket (Fig. 3.3). We then inserted the camera into the bracket, and locked the security box to avert camera theft.
Figure 3.3. Remote camera deployed on culvert wall in a locked, metal security box. (Photo: R. Long/WTI)
For monitoring larger underpasses, we enclosed cameras in faux utility boxes that were
locked to the ground (Figs. 3.4).

Baseline wildlife monitoring at I-90 Snoqualmie Pass East Chapter 3
Western Transportation Institute Page 51
A. B.
C.
D. Figure 3.4. “Faux” electrical housing containing remote camera deployed at the Sparks Road Bridge South. Various images show housing (A), aim of camera (B), view from under the bridge with arrow pointing to camera box (C), and sample photo of WTI field vehicle (D). (Photos: R. Long /WTI)

Baseline wildlife monitoring at I-90 Snoqualmie Pass East Chapter 3
Western Transportation Institute Page 52
We generally checked cameras at 2–3 week intervals. During checks, we inserted fully charged batteries if necessary and replaced the memory card. We also recorded the battery level, the amount of memory remaining on the card, and whether the camera was intact and appeared to be operating. Upon arrival and departure, we recorded a test photo and the time the photo was taken, permitting us to later evaluate whether the camera was functioning correctly and whether the time—automatically imprinted on each image—was accurate.
Supplemental Camera Surveys In addition to our long-term monitoring efforts at culverts, we conducted a limited number of short-term camera surveys at select sites. During summer and fall of 2009, we deployed a single camera on each of two paved bridges crossing I-90 at the Stampede Pass Road and Cabin Creek Road exits (Exits 62 and 63), respectively, to quantify the use of these “overpasses” by wildlife. We also deployed a second camera in the Swamp Creek East culvert—at eight feet across, one of our widest culverts—during summer and fall 2010 and 2011, in an effort to assess how often crossings would have been undetected by a single camera and whether small animals (e.g., mink, weasels) were missed more often than larger animals (e.g., raccoons).
Photo Analysis We reviewed all photos for detections of wildlife, humans, or vehicles, and recorded the following data: date of detection, time of detection, number of photos associated with a given detection occasion, species, a confidence rating for species identification, number of individuals, direction of travel, and outcome (i.e., crossed through structure, entered structure but aborted crossing, visited entry to structure only, unable to ascertain whether crossing occurred). Unless individuals could be distinguished with confidence, multiple detections of the same species within 15 minutes were recorded as the same detection “event.” We also evaluated water levels in culverts by reviewing photos once per month and assigning relative height values ranging from 0–5, with “0” indicating dry and “5” indicating very high flow.
We recorded a “crossing” whenever a camera detected an individual moving in one
direction through a structure and there was no indication that it turned and failed to complete the crossing. “Aborted” crossings were recorded when an animal entered a structure with the apparent intention to cross but then turned and failed to complete the crossing. We also noted “visits,” or detection events during which an animal visited a structure but exhibited no crossing behavior. The latter were primarily captured by cameras deployed outside of culverts, and at underpasses where cameras were able to detect individuals in the vicinity of the structure.
In addition to reporting the frequencies of crossings, aborted crossings, and visits, we calculated associated rates based on the frequency of detections at a site divided by the number of “camera nights” at that site, with a “camera night” defined as a full 24-hour survey period during which the camera was functional and capable of collecting detection data. This enabled standardization among sites with different levels of survey effort due to variation in dates of camera deployment and removal, or inoperative cameras.
Finally, we used the VLOOKUP function in MS Excel, along with the time of detection

Baseline wildlife monitoring at I-90 Snoqualmie Pass East Chapter 3
Western Transportation Institute Page 53
and a table of sunrise/sunset times for Roslyn, WA (U.S. Naval Observatory 2008–2012), to classify detections and crossings as having occurred during day, night, crepuscular dawn, or crepuscular dusk, with “crepuscular” being defined as within 1 hour of sunrise or sunset. In order to evaluate the timing of crossings by species-of-interest, we calculated an index of timing selection for each species. This index represents the proportion of total crossings for a given species detected during day, night, or dawn/dusk crepuscular periods, divided by the proportion of time each period represents of a 24-hour day. For example, we defined crepuscular as 1 hour before and after sunrise and sunset, so “crepuscular dawn” represents 2/24 = 0.083 of a 24-hour day, and “day” represents (on average over a year) 5/24 = 0.208 of a 24-hour day. Thus, index values greater than or less than 1.0 reflect the detection of more or fewer crossings, respectively, than would have been expected due to chance during a given time period. Snow Track Monitoring of At-Grade Crossings We conducted snow tracking surveys in an attempt to identify at-grade wildlife crossing locations and to evaluate the behavior of animals in close proximity to I-90. We identified three sets of paired survey transects (i.e., on either side of the highway)(Fig. 3.5) that: (1) collectively encompassed as much of the Project Area as possible; (2) included shoulders that could be safely traveled by researchers without their encountering cliffs or steep drop-offs; and (3) could be feasibly surveyed in a single day. The Swamp-Bonnie-Price Creek Transect extended 2.3 mi from Keechelus Dam to Exit 62 (Stampede Pass), the Toll-Swamp Creek Transect extended 1.6 mi from Exit 62 to Exit 63 (Cabin Creek), and the Easton Hill Transects extended 1.75 mi along both divided highway segments and bounded the large island between the eastbound (EB) and westbound (WB) lanes (Fig. 3.5).

Baseline wildlife monitoring at I-90 Snoqualmie Pass East Chapter 3
Western Transportation Institute Page 54
A.
B. Figure 3.5. Transects used for snow tracking along I-90 including (A) Swamp-Bonnie-Price Creek and Toll-Swamp Creek Transects, and (B) Easton Hill WB and EB Transects.

Baseline wildlife monitoring at I-90 Snoqualmie Pass East Chapter 3
Western Transportation Institute Page 55
We conducted snow tracking surveys by snowshoeing or skiing parallel to the highway immediately outside the plow zone (Fig. 3.6). Surveys were initiated 24–72 hours after a track-obliterating snow event (i.e., when new snowfall covered any previously existing tracks). Whenever possible, two researchers surveyed the north and south sides of the highway simultaneously—communicating by radio or cell phone—and completed transects in a single day. We recorded standard information during surveys, including the transect name, date, begin and end times, number of hours since last snowfall, and current snow conditions. When tracks were located, we recorded the name of the species that deposited them, our confidence in species identification, snow track quality, GPS coordinates for the beginning and end points of the observation, direction of travel, and if and how the tracks interacted with the highway (Table 3.1). A single animal could have more than one road encounter, but each was recorded as a unique observation. All animals larger than a snowshoe hare were recorded. Periodically, tracks were also documented by photograph or sketch.

Baseline wildlife monitoring at I-90 Snoqualmie Pass East Chapter 3
Western Transportation Institute Page 56
Table 3.1. Highway encounter categories for tracks found along snow tracking transects. Encounter Type Definition None Tracks had no apparent
interaction with the highway
Parallel Track trail paralleled the highway Turned back Track trail approached the highway but then
turned away from it
Entered roadway Track trail entered the highway but then turned back
Unconfirmed crossing Track trail entered the highway but no similar tracks were located on the opposite side
Confirmed crossing Track trail entered the highway and similar tracks were located on the opposite side
Figure 3.6. Researcher snow-tracking along I-90. (Photo: P. MacKay/WTI)

Baseline wildlife monitoring at I-90 Snoqualmie Pass East Chapter 3
Western Transportation Institute Page 57
Results
Identification of Structures for Monitoring We visited 18 of the 21 structures targeted for potential monitoring—safety concerns precluded access to 2 structures, and a third could not be located. Because these latter three structures were adjacent to Lake Keechelus, they presumably had a lower likelihood of being used by wildlife during much of the year. Further, records suggested that one of the three was a small culvert, and would therefore be low-priority for the purposes of our monitoring. Of the 18 structures that we did visit and evaluate, 8 culverts were ultimately selected for monitoring (Fig. 3.1). Those not selected were: (1) likely too small to permit crossings by mid- to large-bodied mammals; (2) cylindrical metal structures that might have had a lower likelihood of use given their curved floor; or (3) apparently prone to large flows of water during much of the year.
We also selected three de facto underpasses for monitoring because we felt they
represented potential crossing opportunities for medium-to-large mammals. The first was formed by a bridge spanning Gold Creek, and the other two by county road bridges spanning West Sparks Road. The Gold Creek underpass comprised two structures for our monitoring purposes, as each stream bank could have been used independently by wildlife. A double culvert at Swamp Creek was characterized as two structures for the same reason. In total, then, we targeted 12 structures (Table 3.2, Fig. 3.1; Appendix 3.1) for intensive camera-based monitoring.
We later deployed cameras at two bridges spanning the highway (Fig. 3.7), at exits 62
(Stampede Pass Road) and 63 (Cabin Creek Road), in an effort to detect crossings at these locations. Because we monitored these locations for only three and six months, respectively, we evaluated data from these locations separately from long-term camera site data.
Figure 3.7. Paved bridges that were monitored by remote cameras at Exit 62 and Exit 63. (Photo: J. Begley/WTI)

Baseline wildlife monitoring at I-90 Snoqualmie Pass East Chapter 3
Western Transportation Institute Page 58
Table 3.2 High-priority structures for wildlife monitoring. Monitoring end date for all structures was June 2012.
Structure Name` Milepost Type Culvert or
bridge length1 (ft)
Height (ft)
Span (ft)
Openness2 ([span x height] / highway width)
Monitoring Begin Date
Gold Creek Bridge Northeast 55.49 Underpass formed by bridge 41 223 138 22.64 October
2008
Gold Creek Bridge Northwest 55.5 Underpass formed by bridge 41 222 126 20.63 November
2008
Price Creek Culvert 61.35 Concrete box 272 10 10 0.11 April 2008
Bonnie Creek Culvert 62.4 Concrete tube (eastbound), concrete box (westbound) 187 6 6 0.06 April 2008
Swamp Creek Culverts (2) 62.71 Dual concrete double-boxes 201 6 8 0.07 April 2008
Cedar Creek Culvert 64.67 Concrete box 155 4 4 0.03 April 2008
Unnamed Creek Culvert 65.1 Concrete box with round metal insert on south side 145 4 4 0.03 April 2008
Telephone Creek Culvert 65.57 Concrete box 170 6 4 0.04 April 2008
Hudson Creek Culvert 66.6 Corrugated metal pipe 165 4 4 0.03 May 2008
Sparks Road Bridge North 69.04 Underpass formed by bridge 52 18 28 2.9 May 2008
Sparks Road Bridge South 69.04 Underpass formed by bridge 41 18 28 3.7 May 2008
1 Length is the measurement perpendicular to vehicle flow, and represents the distance an animal must traverse to cross from one side of the highway to the other. 2 Openness ratios are controversial, and have been inappropriately used as one-size-fits-all metrics to evaluate structure suitability (Clevenger and Huijser 2009). We include openness ratios here (calculated using meters) simply to provide some context for the structure’s shape and dimensions and for comparison with other studies. Ratios are calculated using meter units, so conversion from feet is required. 3 This height value is a maximum, when Gold Creek was sufficiently low that large animals could have effectively walked down the middle of the creek versus along the steep rip-rapped stream banks. 4 This openness value is a maximum, when Gold Creek’s bridge’s height above the creek was at a maximum (see above).

Baseline wildlife monitoring at I-90 Snoqualmie Pass East Chapter 3
Western Transportation Institute Page 59
Monitoring Summary and Camera Performance We monitored 12 structures from April 2008–June 2012 (Table 3.2). Start and end dates varied by structure, but all structures were monitored for 1200–1932 consecutive days, from October 2008–June 2012 (Fig. 3.8). During this period, cameras were operational for 1049–1527 camera nights (Fig. 3.8), yielding a total of 16,543 camera nights. The percentage of nonfunctional camera nights ranged from 0–14.2% (mean=6.4%), with functionality having been compromised by malfunction, theft, weather issues (e.g., snow obscuring the sensor or lens), or logistical constraints associated with camera re-deployment.
Figure. 3.8. Camera performance metrics, including the total number of nights that cameras were deployed, nights they were operational (Camera Nights), and percentage of total nights they were operational. Species-Specific Crossing Results from Long-Term Camera-Monitored Sites We detected 18 animal species, as well as individuals from four large groups of species (i.e., bats, small mammals, birds, squirrels; Table 3.3) that weren’t individually identified, at the 12 long-term monitoring sites. We routinely detected birds, squirrels, bats, and various other small mammals (e.g., mice, voles, chipmunks, woodrats), but did not differentiate between detections and crossings for these species for multiple reasons. First, we presume that small animals were photographed unreliably with our camera setup, which was optimized to maximize detections of larger wildlife across the entire width of the culvert or bridge. Second, it was often difficult to
75.00%
80.00%
85.00%
90.00%
95.00%
100.00%
0
200
400
600
800
1000
1200
1400
1600
1800
% o
f Tot
al N
ight
s Ca
mer
a w
as O
pera
tiona
l
Nig
hts
Camera Nights Total Nights Percent of total nights camera was operational

Baseline wildlife monitoring at I-90 Snoqualmie Pass East Chapter 3
Western Transportation Institute Page 60
assign a crossing status (i.e., crossed or not) to those small animals that were detected. Finally, many small animals occurred very frequently in photographs, and may have been using culverts as habitat—thus rendering the interpretation of crossing behavior and the assessment of crossing rates for these species problematic. Table 3.3. Species (or species groups) detected by remote cameras at long-term monitoring sites. Species American black bear American mink Bat (includes multiple species) Beaver Bird (includes all species smaller than waterfowl) Bushy-tailed woodrat Bobcat Canada goose Coyote Deer (includes both mule and black-tailed) Domestic dog Domestic cat Douglas’ squirrel Elk Mountain beaver Northern flying squirrel Northern raccoon Northern river otter Small mammal (includes mice, voles, shrews and chipmunks) Snowshoe hare Waterfowl Weasel (includes both long- and short-tailed)
We focused our crossings analysis on a subset of species (i.e., “species-of-interest”) comprising medium- to large-bodied mammals, and defined as (1) all carnivores and (2) other mammals larger than a snowshoe hare. The final wildlife crossings dataset totaled 605 individual animals representing 9 species-of-interest (Table 3.4, Appendix 3.2).

Baseline wildlife monitoring at I-90 Snoqualmie Pass East Chapter 3
Western Transportation Institute Page 61
Table 3.4. Crossings data for all “species-of-interest” (as defined in this report), including crossing frequency and (below frequency in parentheses) crossing rate, expressed as crossings/100 camera nights.
Species Gold Creek
NE
Gold Creek NW
Price Creek
Bonnie Creek
Swamp Creek E
Swamp Creek
W
Cedar Creek
Unnamed Creek
Telephone Creek
Hudson Creek
Sparks N
Sparks S
Total
Black bear 3 (0.20)
3 (0.20)
Bobcat 1 (0.07)
1 (0.07)
2 (0.13)
Coyote 7 (0.67)
1 (0.07)
8 (0.73)
Mink 4 (0.26)
16 (1.10)
73 (5.42)
4 (0.26)
97 (7.04)
Raccoon 4 (0.26)
12 (0.82)
84 (6.24)
13 (0.85)
2 (0.13)
9 (0.67)
124 (8.98)
River otter 10 (0.74)
40 (2.62)
50 (3.36)
Weasel 21 (1.44)
14 (1.04)
1 (0.07)
23 (1.53)
5 (0.35)
4 (0.30)
68 (4.72)
Deer 24 (2.07)
39 (3.72)
99 (7.70)
43 (2.89)
205 (16.37)
Beaver 5 (0.48)
1 (0.07)
25 (1.86)
18 (1.11)
49 (3.51)
Total 24 (2.07)
51 (4.86)
13 (0.86)
49 (3.36)
206 (15.29)
76 (4.91)
26 (1.73)
5 (0.35)
0 (0)
13 (0.97)
99 (7.70)
44 (2.96)
606 (45.06)

Baseline wildlife monitoring at I-90 Snoqualmie Pass East Chapter 3
Western Transportation Institute Page 62
Species-specific use of the culverts and bridges varied considerably. Deer and coyotes were never detected using culverts, but crossed only under the bridges (Fig. 3.9). Other terrestrial species-of-interest (e.g., raccoons, river otters, weasels) were documented using one or more of the Price Creek, Bonnie Creek, Swamp Creek, Cedar Creek, and Hudson Creek Culverts, but were not detected crossing under bridges (Fig. 3.9). In the case of smaller species such as weasels, this may have been due in part to our camera configurations under the bridges, which were necessarily designed to capture images across a wide area and therefore may have missed small animals. Aquatic animals (e.g., beavers, mink, river otters) and raccoons crossed most often through the Swamp Creek Culverts, although mink and raccoons were detected crossing through other culverts as well (Fig. 3.9). Beavers were also detected crossing under the Gold Creek Bridge. Notably, no elk crossings were detected, despite their presence at or near many of the structures (see below and Chapter 4). Further, we detected no crossings by species-of-interest at the Telephone Creek Culvert, and Unnamed Creek had the second-fewest crossings (i.e., 0.35 crossings/100 camera nights), with all documented crossings associated with weasels.
A.
B. Figure 3.9. Species-specific crossing rates (crossings/100 camera nights) for (A) terrestrial and (B) aquatic (or semi-aquatic, in the case of raccoons) species. Timing of Crossings We observed species-specific differences in the time of day when crossings tended to occur. Deer crossed during all periods of the day, with more crossings during crepuscular periods than
0.00
1.00
2.00
3.00
4.00
5.00
6.00
7.00
8.00
9.00
Gold Creek NE
Gold Creek NW
Price Creek
Bonnie Creek
Swamp Creek E
Swamp Creek W
Cedar Creek
Unnamed Creek
Hudson Creek
Sparks Road N
Sparks Road S
Rate
(cro
ssin
gs/1
00 c
amer
a ni
ghts
)
Structure
Black bear
Bobcat
Coyote
Deer
Weasel
0.00
1.00
2.00
3.00
4.00
5.00
6.00
7.00
Gold Creek NE
Gold Creek NW
Price Creek
Bonnie Creek
Swamp Creek E
Swamp Creek W
Cedar Creek
Unnamed Creek
Hudson Creek
Sparks Road N
Sparks Road S
Rate
(cro
ssin
gs/1
00 c
amer
a ni
ghts
)
Structure
Beaver
Mink
Raccoon
River otter

Baseline wildlife monitoring at I-90 Snoqualmie Pass East Chapter 3
Western Transportation Institute Page 63
would be expected by chance (Fig. 3.10). River otters and mink crossed primarily during the day, while raccoons, coyotes, and beavers crossed disproportionately at night (Fig. 3.10). Weasels crossed with similar frequency during day and night (Fig. 3.10). Black bears and bobcats were detected too infrequently to allow for a meaningful comparison of timing of crossings. Notably, deer were the only species that crossed disproportionately during crepuscular periods (Fig. 3.10).
Figure 3.10. Index of the timing of crossings by species-of-interest using the 12 crossing structures monitored with remote cameras. Index of timing values greater than or less than 1.0 reflect the detection of more or fewer crossings, respectively, than would have been expected due to chance during a given time period.
Seasonal Patterns of Crossings We observed clear seasonal patterns in crossing activity at most structures, with few if any crossings detected during January–March and most crossings detected during May–November (Fig. 3.11–3.13). There were a number of clear exceptions, however, specifically at Cedar Creek. We detected crossing activity by weasels at this culvert all through the winter months, and no crossing activity by any species-of-interest during June–July. Swamp Creek E, as well, had low but relatively consistent crossing activity throughout all months but December (during which we detected only a single crossing, by a raccoon), with most winter activity attributed to mink and raccoons. Water levels in most culverts tended to be highest during spring runoff (i.e., March–May), and generally corresponded to periods where fewer crossings were observed (Fig. Fig. 3.11–3.13)–with the exception of Swamp Creek E, where crossings of primarily aquatic species were detected.
0.00
0.50
1.00
1.50
2.00
2.50
3.00
Beaver Black bear
Bobcat Coyote Mink Deer Raccoon River otter
Weasel
Inde
x of t
imin
g of
cros
sings
Crepuscular-Dawn
Day
Crepuscular-Dusk
Night

Baseline wildlife monitoring at I-90 Snoqualmie Pass East Chapter 3
Western Transportation Institute Page 64
Gold Creek NE Gold Creek NW
Price Creek Bonnie Creek Figure 3.11. Detection frequencies by month and relative water levels for Gold Creek NE, Gold Creek NW, Price Creek, and Bonnie Creek structures.
0
0.5
1
1.5
2
2.5
3
3.5
4
4.5
5
0
2
4
6
8
10
12
14
16
Rela
tive
Wat
er L
evel
in S
truc
ture
Cros
sing
s Re
cord
ed
0
1
2
3
4
5
0
2
4
6
8
10
12
14
16
18
20
Rela
tive
Wat
er L
evel
in S
truc
ture
Cros
sing
s Re
cord
ed
0
1
2
3
4
5
0
1
2
3
4
5
6
Rela
tive
Wat
er L
evel
in S
truc
ture
Cros
sings
Rec
orde
d
0
0.5
1
1.5
2
2.5
3
3.5
4
4.5
5
0
2
4
6
8
10
12
14
16
Rela
tive
Wat
er L
evel
in S
truc
ture
Cros
sings
Rec
orde
d

Baseline wildlife monitoring at I-90 Snoqualmie Pass East Chapter 3
Western Transportation Institute Page 65
Swamp Creek East Swamp Creek West
Cedar Creek Unnamed Creek Figure 3.12. Detection frequencies by month and relative water levels for Gold Creek NE, Gold Creek NW, Price Creek, and Bonnie Creek structures.
0
1
2
3
4
5
0
10
20
30
40
50
60
Rela
tive
Wat
er L
evel
in S
truc
ture
Cros
sing
s Re
cord
ed
0
1
2
3
4
5
0
5
10
15
20
25
Rela
tive
Wat
er L
evel
in S
truc
ture
Cros
sing
s Re
cord
ed0
0.5
1
1.5
2
2.5
3
3.5
4
4.5
5
0
1
2
3
4
5
6
7
Rela
tive
Wat
er L
evel
in S
truc
ture
Cros
sing
s Re
cord
ed
0
1
2
3
4
5
0
0.5
1
1.5
2
2.5
Rela
tive
Wat
er L
evel
in S
truc
ture
Cros
sing
s Re
cord
ed

Baseline wildlife monitoring at I-90 Snoqualmie Pass East Chapter 3
Western Transportation Institute Page 66
Hudson Creek
Sparks Road N Sparks Road S Figure 3.13. Detection frequencies by month and relative water levels for Hudson Creek, Sparks Road N, and Sparks Road S structures. No water levels are reported for Sparks Road structures because they span roads not creeks.
0
0.5
1
1.5
2
2.5
3
3.5
4
4.5
5
0
1
2
3
4
5
6
7
Rela
tive
Wat
er L
evel
in S
truc
ture
Cros
sing
s Re
cord
ed
0
5
10
15
20
25
30
35
40
Cros
sing
s Re
cord
ed
0
2
4
6
8
10
12
14
Cros
sing
s Re
cord
ed

Baseline wildlife monitoring at I-90 Snoqualmie Pass East Chapter 3
Western Transportation Institute Page 67
Crossings by Humans and Domestic Animals
We also detected crossings by non-wildlife species, including humans, domestic dogs, and domestic cats, through various structures (Table 3.5). Most such detections occurred beneath the Gold Creek and Sparks Road Bridges, with those humans who were detected at culverts primarily comprising fish and amphibian researchers versus members of the general public. On busy days, we detected crossings by dozens of automobiles and trucks, as well as all-terrain vehicles (ATVs), at the Sparks Road structures. Motorized vehicle detections were not analyzed due to the impracticality of, and lack of utility in, reviewing such a high volume of photographs.

Baseline wildlife monitoring at I-90 Snoqualmie Pass East Chapter 3
Western Transportation Institute Page 68
Table 3.5. Crossings by humans and domestic animals, including crossing frequency and crossing rate (below frequency in parentheses) expressed as crossings/100 camera nights.
Type
Gold Creek
NE
Gold Creek NW
Price Creek
Swamp Creek E
Swamp Creek W
Unnamed Creek
Sparks Road N
Sparks Road S
Human 363 (31.3)
127 (12.1)
165 (10.9)
109 (8.1)
69 (4.5)
9 (0.6)
407 (31.6)
415 (27.9)
Human with dog 66 (5.7)
8 (0.8)
144 (11.2)
168 (11.3)
Bicyclist 157 (12.2)
192 (12.9)
Domestic dog 1 (0.1)
7 (0.5)
Domestic cat 1 (0.1)
Total 430 (37.1)
136 (12.9)
165 (10.9)
109 (8.1)
69 (4.5)
9 (0.6)
708 (55.0)
783 (52.7)

Baseline wildlife monitoring at I-90 Snoqualmie Pass East Chapter 3
Western Transportation Institute Page 69
Aborted Crossing Attempts We detected only 33 aborted crossing attempts across all 12 structures during the monitoring period (Fig. 3.14), with the species detected generally mirroring those that were detected making successful crossings at the various structures. Deer were most often associated with aborted crossings, and such activity was especially prevalent at the Sparks Road Bridges—where only deer were documented exhibiting this behavior.
Figure 3.14. Frequency of aborted crossings by species-of-interest and structure. Aborted crossings were defined as an individual being detected by remote camera, but turning around before a crossing was completed and exiting the same way it entered. Species Occurrence at Structures In some cases, we recorded the occurrence of species outside of structures, with no crossing event recorded. For example, during initial monitoring efforts in 2008—when cameras were deployed outside of culverts—or when cameras were moved from the inside to the outside of culverts during periods of high water runoff, we routinely detected birds, squirrels, and other small mammals near culvert entrances. Further, cameras deployed in faux electrical boxes at the four bridge locations also occasionally detected animals (e.g., deer, elk) that did not cross under the bridges. Because camera deployment efforts outside of structures was uneven, both in time and across structures, it would be misleading to report detection totals or even rates. Table 3.6, however, summarizes all species detections at structures, whether the detection comprised a “visit only” occurrence outside of the structure or a crossing through the structure. Note that we also discuss species detections in Chapter 4, which highlights occurrence data throughout the Project Area—both along I-90 and in abutting habitats.
0
2
4
6
8
10
12
14
Abor
ted
Cros
sings
Det
ecte
d
Deer Mink Raccoon Weasel Bobcat Beaver

Baseline wildlife monitoring at I-90 Snoqualmie Pass East Chapter 3
Western Transportation Institute Page 70
Table 3.6. Species-specific detections at all monitored culverts and bridges. “X” indicates that the species or group was detecte either outside of the structure or crossing through the structure. Species/group names are alphabetical.
6 Most “non-waterfowl” bird detections were American dippers, which were detected in most culverts and nested consistently in the Swamp Creek culvert.
Species
Gold Creek
NE
Gold Creek NW
Price Creek
Bonnie Creek
Swamp Creek
E
Swamp Creek
W Cedar Creek
Telephone Creek
Unnamed Creek
Hudson Creek
Sparks Road N
Sparks Road S
Bat X X X X X Beaver X X X X X Bicyclist X X Bird (non-waterfowl)6 X X X X X X X X X X X Black bear X Bobcat X X X Coyote X X Deer X X X X X Domestic dog X X Domestic cat X Elk X X Flying squirrel X Human X X X X X X X X X X X Human with dog X X X X Mink X X X X Mountain beaver X X X X Raccoon X X X X X X X X River otter X X Small mammal X X X X X X X X Snowshoe hare X X Squirrel X X X X X X X X Vehicle X X Waterfowl X X X Weasel X X X X X X Woodrat X X X

Baseline wildlife monitoring at I-90 Snoqualmie Pass East Chapter 3
Western Transportation Institute Page 71
Cameras Deployed on “Overpasses” We deployed a single remote camera under the guardrail on each of the paved Exit 62 (Stampede Pass Road) and 63 (Cabin Creek Road) bridges during May–August 2009 and May–November 2009, respectively. These two-lane bridges permit vehicles to cross over I-90 and could serve as “overpasses” for wildlife. We detected only crossings by vehicles, with no wildlife detections during the survey period. Further, high vehicle use of these bridges resulted in remote camera memory cards quickly filling to capacity during relatively short survey periods. The lack of detections and memory card issues led us to remove these cameras prior to winter 2009. Estimating Detection Omission Rates with Two Cameras During May–November 2010, and again during May–November 2011, we deployed a second camera in the Swamp Creek E Culvert in an attempt to estimate detection omission rates for the primary camera. This culvert, with a span of 8 feet, had the second longest culvert span after Price Creek (at 10 feet). Omission rates for the primary camera varied from zero omissions for river otters to 0.33 for beavers (Table 3.7). Table 3.7. Omissions and omission rate by primary camera at the Swamp Creek E Culvert, from May–November, 2010 and 2011.
Raccoon Beaver River otter Mink Weasel
Crossings omitted 8 3 0 7 2 Crossings detected 28 6 3 34 6 Crossings through culvert 36 9 3 41 8 Omission rate 0.22 0.33 0.00 0.17 0.25
Monitoring At-Grade Crossings Snow Tracking We monitored the weather for snow tracking opportunities during three winters: 2008–2009, 2009–2010, and 2010–2011. Only during the winter of 2008–2009, however, were we able to collect survey data. During the other two winters, weather patterns in the Project Area were inconsistent with those required for conducting effective track surveys along the highway. For example, track-obliterating snow events occurred too close together in time, resulting in insufficient time between storms for tracks to accumulate; rapid warming or rain-on-snow events followed too closely on the heels of track-obliterating storms to allow for quality track accumulation or tracking; and long periods characterized by no or very light snowfalls resulted in insufficient snow for track registration. Although tracking to establish presence would have been possible during some periods, our interest was in estimating or indexing track rate, which required us to know which tracks were recent and how long they had had to accumulate between track-obliterating snow events (Kauhala and Helle 2000).

Baseline wildlife monitoring at I-90 Snoqualmie Pass East Chapter 3
Western Transportation Institute Page 72
During January–April 2009, we conducted four surveys along the Easton Hill EB and WB Transects, and five surveys along each of the Swamp-Toll Creek and Swamp-Bonnie-Price Creek Transects. Of our species-of-interest, we detected only bobcats and coyotes (Fig. 3.15) adjacent to or crossing the highway (Table 3.8, Figs. 3.16–3.18). We detected coyote and bobcat tracks, and confirmed coyote crossings, along all transects. Bobcats were detected less often than coyotes, and we confirmed only a single crossing by a bobcat—along the Toll-Swamp Creek Transect (Table 3.8, Figs. 3.16–3.18).
Figure 3.15. Coyote tracks leading up to the shoulder of I-90, with a semi-trailer truck in the background. (Photo: R. Long/WTI)

Baseline wildlife monitoring at I-90 Snoqualmie Pass East Chapter 3
Western Transportation Institute Page 73
Table 3.8. Number of detections and rate of detections (number/survey/mile) within various encounter classifications along four snow track survey transects conducted during winter 2008–2009.
Easton Hill WB (n=4 surveys)
Easton Hill EB (n=4 surveys)
Toll/Swamp (n=5 surveys)
Swamp/Bonnie/Price (n=5 surveys)
Encounter Type Coyote Bobcat Coyote Bobcat Coyote Bobcat Coyote Bobcat Total Confirmed Crossing 8 (1.14) 0 (0)
3 (0.44) 0 (0)
7 (0.87) 1 (0.12)
5 (0.43) 0 (0) 24 (3.01)
Unconfirmed Crossing 0 (0) 0 (0)
0 (0) 0 (0)
3 (0.37) 0 (0)
3 (0.26) 2 (0.17) 8 (0.80) Back 2 (0.28) 0 (0)
2 (0.29) 0 (0)
5 (0.62) 1 (0.12)
4 (0.34) 2 (0.17) 16 (1.85)
Enter 0 (0) 0 (0)
0 (0) 0 (0)
0 (0) 0 (0)
1 (0.08) 0 (0) 1 (0.08) Parallel 4 (0.57) 0 (0)
1 (0.14) 1 (0.14)
9 (1.12) 2 (0.25)
3 (0.26) 2 (0.17) 22 (2.67)
Unknown 0 (0) 0 (0) 0 (0) 0 (0) 1 (0.12) 0 (0) 0 (0) 0 (0) 2 (0.12) Total 14 (8) 0 (0)
6 (3.52) 1 (0.58)
25 (15.62) 4 (2.5)
16 (6.95) 6 (2.60) 73 (8.56)

Baseline wildlife monitoring at I-90 Snoqualmie Pass East Chapter 3
Western Transportation Institute Page 74
A. B. Figure 3.16. Winter 2008–2009 snow track detections, including encounter type, along the Swamp-Bonnie-Price Creek Transect for (A) coyotes and (B) bobcats.

Baseline wildlife monitoring at I-90 Snoqualmie Pass East Chapter 3
Western Transportation Institute Page 75
A.
B. Figure 3.17. Winter 2008–2009 snow track detections, including encounter type, along the Toll-Swamp Creek Transect for (A) coyotes and (B) bobcats.

Baseline wildlife monitoring at I-90 Snoqualmie Pass East Chapter 3
Western Transportation Institute Page 76
A.
B. Figure 3.18. Winter 2008–2009 snow track detections, including encounter type, along the Easton Hill WB and EB Transects for (A) coyotes and (B) bobcats.
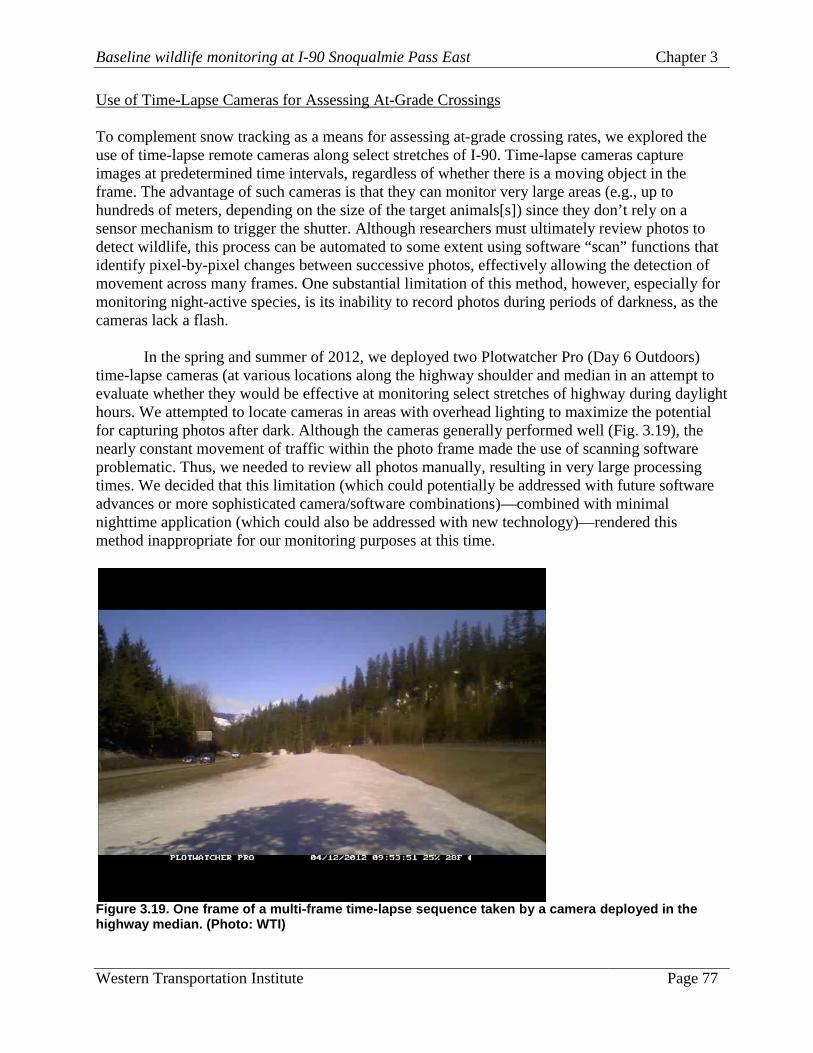
Baseline wildlife monitoring at I-
Western Transportation Institute
Use of Time-Lapse Cameras for To complement snow tracking as a means for assessing atuse of time-lapse remote cameras along select strimages at predetermined time intervals, regardless of whether there is a moving object in the frame. The advantage of such cameras is that they can monitor very large areas (e.g., up to hundreds of meters, depending on the size of the target animals[s]) since they don’t rely on a sensor mechanism to trigger the shutter. Although researchers must ultimately review photos to detect wildlife, this process can be automated to some extent using software “scan” functionsidentify pixel-by-pixel changes between successive photos, effectively allowing the detection of movement across many frames. One substantial limitation of this method, however, especially for monitoring night-active species, is its inability to recocameras lack a flash.
In the spring and summer of 2012,time-lapse cameras (at various locations along the highway shoulder and median in an attempt to evaluate whether they would be effective at monitoring select stretches of highway during daylight hours. We attempted to locate cameras in areas with overhead lighting to maximize the potential for capturing photos after dark. Although the cameras generally perfornearly constant movement of traffic within the photo frame made the use of scanning software problematic. Thus, we needed to review all photos manually, resulting in very large processing times. We decided that this limitation (whadvances or more sophisticated camera/software combinations)nighttime application (which could also be addressed with new technology)method inappropriate for our monitoring purposes at this time.
Figure 3.19. One frame of a multi-highway median. (Photo: WTI)
Baseline wildlife monitoring at I-90 Snoqualmie Pass East
apse Cameras for Assessing At-Grade Crossings
To complement snow tracking as a means for assessing at-grade crossing rates, we explored the lapse remote cameras along select stretches of I-90. Time-lapse cameras capture
images at predetermined time intervals, regardless of whether there is a moving object in the frame. The advantage of such cameras is that they can monitor very large areas (e.g., up to
ng on the size of the target animals[s]) since they don’t rely on a sensor mechanism to trigger the shutter. Although researchers must ultimately review photos to detect wildlife, this process can be automated to some extent using software “scan” functions
pixel changes between successive photos, effectively allowing the detection of movement across many frames. One substantial limitation of this method, however, especially for
active species, is its inability to record photos during periods of darkness, as the
In the spring and summer of 2012, we deployed two Plotwatcher Pro (Day 6 Outdoors) lapse cameras (at various locations along the highway shoulder and median in an attempt to
whether they would be effective at monitoring select stretches of highway during daylight hours. We attempted to locate cameras in areas with overhead lighting to maximize the potential for capturing photos after dark. Although the cameras generally performed well (Fig. nearly constant movement of traffic within the photo frame made the use of scanning software problematic. Thus, we needed to review all photos manually, resulting in very large processing times. We decided that this limitation (which could potentially be addressed with future software advances or more sophisticated camera/software combinations)—combined with minimal nighttime application (which could also be addressed with new technology)—rendered this
monitoring purposes at this time.
-frame time-lapse sequence taken by a camera deployed in the
Chapter 3
Page 77
grade crossing rates, we explored the lapse cameras capture
images at predetermined time intervals, regardless of whether there is a moving object in the frame. The advantage of such cameras is that they can monitor very large areas (e.g., up to
ng on the size of the target animals[s]) since they don’t rely on a sensor mechanism to trigger the shutter. Although researchers must ultimately review photos to detect wildlife, this process can be automated to some extent using software “scan” functions that
pixel changes between successive photos, effectively allowing the detection of movement across many frames. One substantial limitation of this method, however, especially for
rd photos during periods of darkness, as the
we deployed two Plotwatcher Pro (Day 6 Outdoors) lapse cameras (at various locations along the highway shoulder and median in an attempt to
whether they would be effective at monitoring select stretches of highway during daylight hours. We attempted to locate cameras in areas with overhead lighting to maximize the potential
med well (Fig. 3.19), the nearly constant movement of traffic within the photo frame made the use of scanning software problematic. Thus, we needed to review all photos manually, resulting in very large processing
ich could potentially be addressed with future software combined with minimal
rendered this
deployed in the

Baseline wildlife monitoring at I-90 Snoqualmie Pass East Chapter 3
Western Transportation Institute Page 78
Discussion Camera Performance Reconyx-brand remote cameras performed extremely well for us, especially given their year-round exposure to changing temperatures and dampness within the culverts. Many of the individual camera units were continuously operational for more than three years, and we sent cameras back to the factory for maintenance only 11 times. Indeed, due to the consistency with which cameras performed, the percent of operational nights (i.e., camera functional nights/total nights deployed) averaged a very high 93.6% (range 86%–100%). Although we did not rigorously test other camera brands, our experience is similar to comprehensive testing efforts (e.g., chasingame.com) that have suggested that the Reconyx cameras are unparalleled in terms of ruggedness and dependability. Sub-Grade Crossing Rates and Species Composition Comparisons of crossing rates and species compositions among regions and across studies should be undertaken with caution. Although there may be utility in comparing raw crossing rates for assessments of population connectivity or gene flow, it would be inappropriate to attempt a quantitative comparison of structure performance by simply comparing crossing rates. For instance, crossing rates may be linked to local densities of the species-of-interest (Clevenger 2011), which may or may not be similar between regions and are often unknown. Nonetheless, for the purposes of providing some context for the crossing frequencies we observed, here we provide a very brief comparison of our results to those of several other road monitoring projects.
Singleton and Lehmkuhl (2000) previously monitored 29 structures from Snoqualmie Pass to Cle Elum, including some of the same structures we monitored for this project. Overall, they detected fewer crossings of many of the same species documented by our monitoring efforts (i.e., deer, raccoons, weasels, river otters), but the structures they monitored included a much greater number of small- and medium-sized culverts (i.e., <44 in diameter) than did our effort, and they also employed film-based remote cameras—which were generally slower to respond and had lower image capacities than digital cameras. Both factors may help explain the disparity in crossing rates between our respective monitoring efforts.
As described above, we detected sub-grade highway crossings by a number of species,
including several carnivore species and deer. The crossing rates that we observed in our Study Area, however were generally lower than those that have been observed in other regions with structures of roughly similar design, size, and intended purpose (i.e., to facilitate the flow of water), and without accompanying wildlife fencing. For example, over approximately five months, Huisjer et al. (2008) documented 100 deer crossings under four bridges along State Highway 75 in Idaho (i.e., approximately 20 crossings per month). In contrast, we recorded a total of 212 deer crossings beneath the four bridges in our Study Area over the entire approximately four-year monitoring period (i.e., 4–5 crossings per month).
We detected deer crossings only through the largest of the four structures we monitored—
all bridges—and no elk crossings were observed at any structure, despite documented elk presence in the vicinity of the Gold Creek and Sparks Road Bridges (Chapter 4). The performance of

Baseline wildlife monitoring at I-90 Snoqualmie Pass East Chapter 3
Western Transportation Institute Page 79
structures for the passage of wildlife, especially elk and deer, has been strongly linked with the design characteristics and dimensions of the given structures (e.g., noise, height, span, length, openness [a metric calculated as {Span x Height}/Length; Reed and Ward 1985])(Clevenger and Waltho 2005, 2010; Gagnon et al. 2011). Ungulates have been shown to be reluctant to cross through underpasses with narrow spans and short heights (Reed et al. 1975; Yanes et al. 1995; Rosell et al. 1997), with suggested configurations for elk in the range of 23–33 ft wide and 11.5–13 ft high (A. Clevenger, unpublished data). In general, ungulates and large carnivores tend to favor structures that are high, wide, and short in length (Clevenger and Waltho 2005). Huisjer et al. (2008) detected no elk crossings under a bridge with openness ratios of 0.6–2.7 and a height of approximately 6.5 ft, despite the presence of elk near the bridge entrance. Further, studies in Utah documented few ungulate crossings through bridges and culverts not originally designed for wildlife—especially when fencing was not used (Cramer 2012).
Of the 12 structures we monitored, 8 were culverts 10 ft x 10 ft, and with low openness
ratios of only 0.03–0.11. Four of these culverts (Cedar Creek, Unnamed Creek, Telephone Creek, and Hudson Creek) also featured 4–5 ft drops to the streambed where they opened on the south side of the highway, requiring crossing individuals to either jump down or laterally to the adjacent cutslope. The other four structures—all bridges—had spans, heights, and lengths ranging from 28–138 ft, 10–18 ft, and 40–52 ft, respectively, and openness ratios7 of 2.9–22.68. The size and openness ratios of all 12 structures we monitored were presumably suboptimal for elk, which never used these structures for crossing.
Relatively high human use of the Sparks Road structures (which averaged 16 human
detections per month), in addition to consistent vehicle use, may have negatively influenced structure use by wildlife (e.g., Clevenger and Waltho 2000). Indeed, although aborted crossings were relatively rare in our dataset, 55% of those recorded (all deer) were at Sparks Road. Both Sparks Road bridges featured minimal shielding (Appendix 3.1), and therefore exposed any animals present to substantial auditory and visual stimuli—effects that may have been amplified given that semi-trailer trucks are common on I-90 at this location. Interestingly, Gagnon et al. (2007) estimated that semi-trailer trucks were four times more likely to cause flight behavior by elk, and although this finding was relevant primarily when traffic volumes were intermittent, it suggests that semi-trailer truck traffic may affect elk behavior.
Large carnivores are typically thought to avoid using underpasses that are relatively long and low (Hunt et al. 1987; Beier & Loe 1992; Foster & Humphrey 1995, Clevenger and Waltho 2010). Structure use by carnivores has also been related to road and landscape factors, such as distance to cover, and topography adjacent to structures (Yanes, Velasco & Suárez (1995) and Rodríguez, Crema & Delibes (1996), Clevenger et al. 2001, Clevenger and Waltho 2005, Gagnon et al. 2011). Regardless of cover and topography, we experienced very low overall crossing rates
7 As mentioned in the caption for Table 3.2, openness ratios are controversial, and have been inappropriately used as one-size-fits-all metrics to evaluate structure suitability (Clevenger and Huijser 2009). We include openness values in this section (calculated using meters) simply to provide some context for the structure’s shape and dimensions. 8 This openness ratio is a maximum, when Gold Creek is sufficiently low that larger animals can effectively walk down the middle of the creek, where the height is maximized, and when using rip-rap along the banks is unnecessary. Often, however, wildlife wishing to use this structure to cross would be confined to much lower, and narrower, rip-rap walkways on either side of the creek.

Baseline wildlife monitoring at I-90 Snoqualmie Pass East Chapter 3
Western Transportation Institute Page 80
for carnivores. Despite the presence of black bears, bobcats, coyotes, and cougars throughout the Study Area, we detected crossings of only three black bears, 2 bobcats, and 2 coyotes during our extensive monitoring period.
Given the relatively low observed crossing rates, and the relative paucity of wildlife-
vehicle collisions (WVCs) for carnivores (Chapter 2), it may be that I-90 had sufficiently high volumes to create an avoidance response in many species. Traffic volumes have been shown to affect use of areas adjacent to roads for many species (e.g., mule deer [Sawyer, Kauffman and Nielson 2009], elk [Rowland et al. 2000], wolves [Whittington et al. 2004], and grizzly bears [Wielgus et al. 2002; Apps et al. 2004, Northrup et al. 2012]), and even if densities of carnivores were substantial in the Snoqualmie Pass region, it may be that reluctance to approach the highway resulted in relatively few crossings and WVCs.
During our monitoring those non-ungulate species with the highest crossing rates—
raccoons, mink, weasels, river otters, and beavers—were observed crossing through structures only 1–2.7 times per month. For these species that were observed somewhat regularly, all but the weasels crossed almost exclusively through the two Swamp Creek culverts. These culverts, and the Gold Creek bridges, were the only structures that included a significant water component adjacent to their mouth or entrance. In the case of the Swamp Creek culverts, a small pond and wetland system was present immediately adjacent to the north entrance, and fed directly into the dual culverts. The Gold Creek bridges, on the other hand, spanned a large, deep creek, and the cameras used to monitor this structure were primarily focused on the banks of the creek. Although five beaver crossings were detected there, the lack of other aquatic species such as mink and river otters may have largely been a consequence of small body size and/or full immersion in the creek while crossing, either of which would have generally precluded detection by the cameras there.
To help put the crossing rates that we observed into perspective, crossing rates reported
from a mitigated highway stretch in Arizona equipped with both crossing structures (i.e., underpasses and overpasses) and associated wildlife fencing, and designed specifically for use by wildlife, reported maximum monthly crossing rates of 44 elk crossings, 11 deer crossings, 1.8 raccoon crossings, and 0.5 coyote crossings (Gagnon et al. 2011). This can be compared with maximum monthly crossing rates observed in our study of 0 elk crossings, 1.6 deer crossings, 2.3 raccoon crossings, and 0.2 coyote crossings. As part of the largest and most successful program to implement highway mitigation strategies in North America, Clevenger et al. (2009) documented average monthly crossing rates by deer and elk of 11.0 and 37.2 crossings (max=53.7–131.5 crossings), respectively, at 23 structures (a mix of both under- and overpasses) in Banff National Park from 1996–2009. Further, monthly crossing rates for coyotes and black bears were 2.1 (max=5.3) and 0.35 (max=1.53) respectively. These rates are all substantially higher than rates we recorded for similar species. Undetected Sub-Grade Crossings Despite our use of high-quality remote cameras, logistical constraints related to camera location and setup presumably resulted in some undetected crossings at all structures. This was most likely to be true for smaller species (e.g., weasels) and at larger structures (e.g., Gold Creek and Sparks Road bridges), where cameras were necessarily deployed to maximize the width of the detection

Baseline wildlife monitoring at I-90 Snoqualmie Pass East Chapter 3
Western Transportation Institute Page 81
area. In such cases, when the camera is facing a large, unbounded area, crossing animals may be able to slip through “blind spots” in the sensor area, either along the edges of the structure or below the sensor. Further, irregular surfaces within structures, such as the large rip-rap at Gold Creek, can create spaces that effectively permit smaller species to pass undetected.
Our two-camera test at Swamp Creek East Culvert yielded detection omission rates of 0–
0.33. Omission rates for the primary camera, which was deployed in what was assumed to be an optimal location, ranged from zero for river otters, to 0.33 for beavers. This culvert, which had a span of eight feet, was wide enough to have some sensor blind spots. We suspect that similar omissions occurred at our Price Creek culvert, which spanned 10 feet, and at all four bridges, which had even larger spans and, in the case of Gold Creek, rip-rap surfaces. Alternately, we presume that crossings by mammals of all sizes were consistently recorded at the smaller, four-foot culverts because the cameras were deployed low on the wall and had a narrower maximum detection area. At-Grade Crossings Our detection of only coyotes and bobcats during snow tracking surveys was not surprising. We did not expect to detect ungulates, as deer and elk would generally be found at lower elevations during winter, and bears were in hibernation. Although martens were present within the larger Project Area (see Chapter 4), their status in most locations immediately adjacent to the highway was questionable (see Chapter 4). And while cougars were also known to occur within the Project Area (e.g., White et al. 2011; Chapter 4), their densities were inherently low enough to have made detection by relatively few snow tracking surveys unlikely. Wolverines, Canada lynx, and mountain goats, although potentially detectable within the Project Area, generally had distributions further to the north.
Singleton and Lehmkuhl (2000) conducted snow tracking during two winters within the
same Study Area as our monitoring, collecting data from a much larger number of surveys than our single-season effort. Of wildlife species detected within the same Study Area as ours, 69% were of coyotes, 24% were of bobcats, and 6% were of ungulates (10 elk, 1 deer), as compared with 85% coyote and 15% bobcat detections in our case. Elk were present during early-spring in the easternmost portion of the Project Area, which may explain the elk detections by Singleton and Lehmkuhl (2000), who surveyed as late as March 20 and whose elk detections all occurred along their easternmost transects. Although our single season of snow tracking did not detect elk or deer, this may have been a function of our small sample size.
Monitoring at-grade crossings of wildlife continues to be problematic. Snow tracking can provide information about winter-active species, but only during one season and in locations where snow conditions permit. As we experienced, these limitations often make this method prohibitive. Track beds installed along the highway shoulder, or in the median, were deemed infeasible given the steep topography and minimal medians along most stretches of I-90 through the Project Area, and combined with relatively short snow-free seasons. We evaluated time-lapse cameras for monitoring at-grade crossings, but concluded that the inability to monitor at night, combined with the time-intensive nature of manually reviewing photos, also precluded the use of this method for large-scale, at-grade monitoring. This method, however, may be useful for

Baseline wildlife monitoring at I-90 Snoqualmie Pass East Chapter 3
Western Transportation Institute Page 82
monitoring specific highway stretches where daylight monitoring is sufficient and where vehicle detections could be minimized (i.e., where the direction of the camera is oriented parallel with the highway shoulder or median). Lastly, radio- and GPS-collar approaches were considered, but for our purposes, the constraints outweighed the advantages of applying this method, except in the case of flying squirrels (see Chapter 5).
Recommendations for Future Monitoring This chapter documents the results of over four years of monitoring in the I-90 SPE Project Area. Our primary objective was to collect baseline data prior to the installation of wildlife crossing structures and wildlife fencing such that the performance of these mitigation measures can ultimately be evaluated. Our data and results will be suitable for comparison with post-mitigation data and rates, assuming methods and efforts to collect post-mitigation data are similar to those described herein. The following recommendations should help to guide future monitoring efforts such that the performance of mitigation efforts can be most effectively evaluated:
We suggest that the monitoring of newly installed crossing structures begin as soon as
possible following their completion. Restricting human access to the structures wherever possible would be preferable, to minimize both the potential for remote camera theft and disturbance to wildlife that might attempt to cross.
We also strongly suggest that remote camera monitoring be initiated whenever possible,
prior to the installation of wildlife fencing. This isn’t to say that the installation of fencing should be postponed to enable pre-fence monitoring, but rather that monitoring should begin even if a gap between structure completion and fence installation is necessary. Valuable data concerning the performance of structures with and without fencing are difficult to collect, and the opportunity to monitor newly installed structures both pre- and post-fencing presents a unique opportunity.
We suggest that remote camera monitoring at crossing structures continue for at least 5–10 years after project completion, as other studies strongly suggest that rates of passage increase continually over time as animals habituate and adapt to structures (Clevenger et al. 2009, Gagnon et al. 2011).
When possible, we suggest that multiple remote cameras be deployed at each structure to enable the estimation of omission rates and to maximize detections of crossings.
Despite its limitations and our minimal success with snow tracking, we suggest that snow track surveys be conducted when feasible following crossing structure construction—both before and after the installation of wildlife fencing. Although relevant data can only be collected for winter-active species, snow tracking currently remains the only cost-effective method suitable for detecting at-grade crossing behavior for multiple species over large areas. Such data will be important for evaluating structure performance.

Baseline wildlife monitoring at I-90 Snoqualmie Pass East Chapter 4
Western Transportation Institute Page 83
Chapter 4 – Species Occurrence and Genetic Sampling
Introduction This chapter describes species occurrence and genetic data collected along I-90 and throughout the greater I-90 Snoqualmie Pass East (SPE) Project Area. We report detections from surveys conducted by WTI as part of its Tier 1 monitoring (see Chapter 1) of the I-90 corridor (e.g., snow tracking, small mammal sampling), and also from surveys conducted as part of a larger, cooperative effort to collect genetic information about American black bears and American martens in the North Cascades Ecosystem.
Baseline species occurrence and detection data are important to collect prior to the installation of crossing structures and wildlife fencing. If such pre-construction data are available, post-construction use of wildlife crossing structures can be evaluated within the context of the species expected to use them. For instance, if no bobcats were detected within a given region prior to crossing structure construction, there would be little expectation that crossing structures installed within that region should receive use by bobcats. Reciprocally, pre-construction occurrence data provides information about where species of interest may not have occurred prior to construction. These same locations could thus be surveyed post-construction to evaluate colonization of new areas—possibly as a result of the mitigation efforts. Such post-construction surveys may need to be conducted many years after structures have been installed, to allow suitable time for species dispersal and recolonization. To collect species detection data, we used a suite of noninvasive survey methods (Long et al. 2008) that did not require the capture, handling, or sedation of study animals (MacKay et al. 2008). In addition to minimizing risk to wildlife and researchers alike, such methods—including remote cameras, hair-snagging, scat collection, and track surveys—permit efficient surveys across large areas, and are effective for even low-density, secretive species such as carnivores. In addition, hair-snagging methods (Kendall and McKelvey 2008) provide an effective means for colleting genetic samples, which can then be combined with cutting-edge landscape genetic approaches (Holderegger and Wagner 2008) to evaluate possible landscape barriers to animal movement and the effects of such barriers on the genetic structure of wildlife populations. In 2008, WTI launched the highly collaborative Cascades Carnivore Connectivity Project (www.cascadesconnetivity.org) to explore barriers to the movement of carnivores using noninvasive genetic methods. Black bears and martens were selected as study-wide focal species, as these two species have very different movement capabilities and habitat requirements. Our goal was to obtain DNA from a spatially well-distributed sample of individuals across the North Cascades Ecosystem (i.e., from I-90 north to the Canadian border), and we exploited the synergy between noninvasive sampling and landscape genetics with the intent of investigating barrier effects at a very large scale. We include DNA sampling results from black bears and martens in this report, as well as some preliminary landscape genetic analyses for the subset of locations within the greater I-90 SPE Project Area.

Baseline wildlife monitoring at I-90 Snoqualmie Pass East Chapter 4
Western Transportation Institute Page 84
Finally, we report on two additional survey projects. The first was a live-trapping effort for small mammals (i.e., chipmunks, rodents and shrews) designed to collect occurrence information and genetic samples from within select Project Area Connectivity Emphasis Areas (CEAs). The second was a track survey of the eastern shoreline of Lake Keechelus, conducted as part of an assessment of whether wildlife fencing would be essential to eventual crossing structure performance in this portion of the Project Area. In summary, the objectives of the above-described survey efforts were to:
1. gather baseline DNA information for black bears and martens within the greater I-90 SPE Project Area;
2. map occurrences of large, high-mobility mammals across the Project Area;
3. collect genetic information, as well as data pertaining to baseline occurrence and relative abundance, for small mammals at select locations within the Project Area; and
4. assess wildlife access to I-90 and the need for fencing along the eastern shore of Lake Keechelus.
Study Area The Study Area is described in detail in Chapter 1. We conducted occurrence surveys along the 15-mile extent of the I-90 SPE Project Area, from MP 55.1 (Hyak) to MP 70.3 (Easton)(see Fig. 4.4 below). We surveyed at varying distances from the actual highway corridor, depending on the species group of interest. Survey grids for small mammals, for example, were located ¼–½ mi from the highway, whereas black bears were surveyed both close to and many miles away from the highway corridor.
Methods Carnivore Genetic Analysis During 2008–2012, we collected genetic material (i.e., DNA) and occurrence data from black bears and martens using a suite of noninvasive hair and scat collection methods. These methods are described in detail in Long et al. (2008).
A general rule of thumb suggests that DNA be collected from a minimum of 20–30 individuals from each side of a putative barrier to test for barrier effects (D. Paetkau [Wildlife Genetics International] and S. Kalinowski [Montana State University], personal communications). To maximize sampling efficiency, we mapped a tessellation of hexagonal sample units across the greater I-90 SPE Project Area. Each hexagon comprised 2500 ha, an area slightly smaller than the average home range of a female black bear in this region (Lyons et al. 2003). By focusing a discrete and predefined amount of survey effort on each sample unit and

Baseline wildlife monitoring at I-90 Snoqualmie Pass East Chapter 4
Western Transportation Institute Page 85
then shifting efforts to a new unit, we were able to efficiently collect DNA samples from as many individuals as possible while minimizing redundant sampling and associated field and laboratory costs.
For bears, we deployed two barbed wire corral-type hair snares (Kendall and McKelvey 2008) within each sample unit. Corrals comprised a single strand of barbed wire stretched around four or more trees at a height of 45–50 cm, with one liter of liquid scent lure (i.e., cattle blood and fish oil) poured onto a pile of woody debris in the center of the corral (Fig. 4.1). Corrals were revisited at 14 days and (1) removed if a sufficient sample was present or (2) rebaited and left for another 14 days if no sample was present. We attempted to locate corrals approximately 2.5–3.0 km apart within a given sample unit.
We collected hair samples from martens with gun cleaning brushes attached to a tree-mounted enclosure that was baited with chicken and scent lure (Fig. 4.2). We placed marten devices selectively—usually in groups of two or three spaced at approximately 100 m intervals—in presumed marten habitat (i.e., mature forest). After conducting unsuccessful marten surveys during the summer of 2008, we shifted to sampling in winter—when this species appeared to be more generally attracted to survey stations (R. Long, unpublished data).
Figure 4.1. Corral-type hair snagging station for bears showing barbed wire and debris pile, with black bear sliding under the wire. (Photo: WTI)

Baseline wildlife monitoring at I-90 Snoqualmie Pass East Chapter 4
Western Transportation Institute Page 86
Figure 4.2. Cubby-type hair snagging station for martens showing scent lure and chicken bait locations and gun brushes, with marten at base of tree. (Photo: WTI)
Hairs collected on a given barb or gun cleaning brush were assigned unique sample numbers, placed in paper envelopes, and stored with desiccant. A subsample of hair samples from each site, selected based on the presence of follicles and the number of actual hairs, was sent to Wildlife Genetics International (Nelson, BC) for analysis. Subsampling helped to increase the likelihood that sufficient DNA was obtained from as many samples as possible (Kendall and McKelvey 2008).
During summer/fall 2008, we employed two scat detection dog survey teams (Working
Dogs for Conservation, Three Forks, MT) to conduct 15 pilot surveys in the greater I-90 SPE Project Area. Each survey was carried out by a professional handler, an orienteer, and a dog, with the latter trained to detect scats from target species—as well as from other rare carnivores (e.g., wolves, grizzly bears, wolverines, cougars, and fishers)—and to alert the dog handler to the specific location of each scat (Fig. 4.3). DNA from scat samples was extracted and analyzed by Wildlife Genetics International using standard methods.
b

Baseline wildlife monitoring at I-90 Snoqualmie Pass East Chapter 4
Western Transportation Institute Page 87
Figure. 4.3. A scat detection dog alerts her handler to a marten scat (foreground). (Photo: P. MacKay/WTI)
We deployed digital remote cameras (Reconyx, Inc.; see full description and photos in Chapter 3) at a subset of survey stations to: (1) collect additional species detection data; (2) gather information about animal behavior and interactions with hair sampling devices, and; (3) attain photos for outreach and educational purposes. We also opportunistically deployed remote cameras, both with and without scent lure, throughout the five-year study. DNA Genotyping and Sex Determination
DNA was extracted from black bear hair and scat samples and amplified by Wildlife Genetics International using standard procedures. Six microsatellite loci were analyzed from each successfully extracted and amplified sample to determine individual identity. Further, as many as 14 additional loci were analyzed from each individual to enable the assessment of gene flow and barrier effects. Mixed samples (i.e., samples with hair from >1 bear) were reliably identified by evidence of 3 alleles at 1 locus (Roon et al. 2005a). Sex was determined by the amelogenin marker, which varies in length by sex (Ennis and Gallagher 1994). A similar approach was taken for marten genotyping, but with a single run of 12 loci (versus 6 for bears) analyzed for each sample. Sex determination for martens was accomplished by analyzing an intron in the ZFX and ZFY genes, whose length is sex-specific (D. Paetkau, Wildlife Genetics International, personal communication).
Baseline wildlife monitoring at I-90 Snoqualmie Pass East Chapter 4
Western Transportation Institute Page 88
Landscape Genetic Analysis We used a Bayesian model-based clustering method (STRUCTURE 2.2; Pritchard et al. 2000) to infer numbers of populations and assign individuals to populations based only on multi-locus genotype data and without knowledge of sample origin. We also used a method that employs both genotype data and sample location to assess population membership (Geneland 3.1; Guillot et al. 2005). We will apply other methods for detecting barrier effects in future analyses, especially in places where there may be gradients of connectivity as opposed to a complete barrier. Such methods will include evaluating the correlation between measures of genetic distance (Legendre and Legendre 1998) and landscape distance—a process called causal modeling (Cushman et al. 2006)—to test whether subtle genetic structuring is primarily a result of isolation due to barrier effects of the highway versus distance, elevation, or habitat. Species Occurrence Species occurrence data were collected from 2008–2012. We mapped species occurrences by combining detection results from:
genetic surveys; remote camera surveys and monitoring; snow tracking (Chapter 3); incidental tracks deposited at survey devices; track surveys conducted at Keechelus Lake (see below).
Note that we did not include data from wildlife-vehicle collision monitoring nor live animal
monitoring (Chapter 2) in our occurrence maps, as it was generally not possible to confirm species identities or locations for those data. Small Mammal Surveys We conducted small mammal surveys from September 15 –October 17, 2008. We deployed Sherman live traps (3 x 3.75 x 9”) using a 5 x 5 trapping grid configuration (i.e., 25 trapping stations) with 20-m spacing. We paired grids on both sides of I-90 in the following CEAs: Gold Creek, Price-Noble Creek, Swamp Creek, Toll Creek, Hudson Creek, and Easton Hill/Kachess River (Fig. 4.4). We baited traps with a mixture of peanut butter, oats, and molasses, and placed polyester filling in each trap to provide warmth to animals and to help reduce the risk of hypothermia.
We began trapping at the Gold and Price-Noble Creek CEAs, and then moved eastward to subsequent grids until finishing at the Easton Hill/Kachess River CEA. Initially, we monitored four grids (two CEAs) per week, but we reduced this to two grids (one CEA) per week after the first week due to time constraints. We opened traps on Monday of each week and checked them daily through Friday, resulting in a total of four trap nights per grid. We closed all traps on weekends.
We identified each trapped animal to species, and recorded sex and weight. We also temporarily marked each individual using a thick, black felt-tipped pen to allow the identification

Baseline wildlife monitoring at I-90 Snoqualmie Pass East Chapter 4
Western Transportation Institute Page 89
of recaptured animals. Northwestern (Keen’s) deermice were differentiated from common (North American) deermice by tail length; the tail of a Northwestern deermouse is generally >103 mm in length, whereas that of a deermouse is usually <103 mm (key provided by John Lehmkuhl, USDA Forest Service). To be conservative, we identified any individuals with tails <103 mm in length as deermice, and others as Northwestern deermice. We collected DNA from each individual by rubbing a swab inside the cheek to obtain epithelial cells, and then stored swabs in paper envelopes containing desiccant for future DNA analysis.
Keechelus Lake Survey We surveyed for wildlife tracks along the south side of the eastbound lanes of I-90 between mileposts 55.1–56.6, 59.2 –60.0, and 60.4–60.8 during three visits (10/5/09, 10/15/09, 10/28/09), with the objective of detecting any tracks that approached the roadway from the lakeside. We also surveyed portions of the lakebed and along the western lakeshore. These areas are available to terrestrial wildlife traveling from the west during periods of lake drawdown, and could potentially provide highway access. We recorded and followed all tracks until we could ascertain whether or not the animal encountered the highway. After each assessment, we returned to our previous survey route and continued to survey until we reached our predetermined route destination.

Baseline wildlife monitoring at I-90 Snoqualmie Pass East Chapter 4
Western Transportation Institute Page 90
Figure 4.4. Locations of small mammal trapping grids.

Baseline wildlife monitoring at I-90 Snoqualmie Pass East Chapter 4
Western Transportation Institute Page 91
Results and Discussion Carnivore Genetic Sampling and Landscape Genetic Analysis With DNA methods, we identified 77 individual black bears within the greater I-90 SPE Project Area (Appendix 4.1), including 38 females, 38 males, and one individual of undetermined sex. Both sides of the highway were almost equally represented in our dataset, with 36 and 41 individuals identified on the north and south sides, respectively. We were able to successfully identify at least 17 of 20 loci for 74 of the 77 individuals (Appendix 4.2), and this subset was used for landscape genetic assessments. We identified 18 individual martens within the greater I-90 SPE Project Area (Appendix 4.3), including 4 females and 14 males. Only one individual—a male—was identified south of I-90. We were able to successfully identify at least 10 of 12 loci for all individuals (Appendix 4.4), so all individuals were used for landscape genetic assessments. Detection dogs were successful at locating black bear scats in the steep, difficult terrain characteristic of the North Cascades. We collected 37 black bear scats, with 6 of these contributing to the pool of 77 black bear individuals mentioned above. Relatively poor success in genetic testing led us to conclude that black bear scats were an inadequate source of DNA for conducting landscape genetic analyses, thus this method was discontinued in subsequent years.
Detection dogs contributed to the collection of only three marten scats. This small number of samples may have reflected the dogs’ lack of experience with martens, the challenges associated with detecting small scats in a steep and thickly vegetated landscape, limited marten presence, or a combination of these factors.
Our preliminary landscape genetic analyses for black bears did not indicate that I-90 was a strong movement barrier for this species. The ability to detect movement barriers among populations, assuming such barriers exist, depends greatly on the extent of the barrier. As mentioned in the “Methods” section above, we intend to conduct further analyses to explore additional, highway-related connectivity issues for black bears (e.g., partial barriers, localized constraints to movement, intact linkages).
Landscape genetic analyses for martens were not complete at the time of this report,
however, because we were able to only collect a single marten DNA sample from south of I-90, evaluating any barrier effects of the highway will not be possible. Future analyses will, instead, focus on other landscape features that might cause genetic clustering for this species. Species Occurrence Using the suite of methods described above, we detected 18 individual species and 7 additional species groups (i.e., bats, birds, deer, small mammals, squirrels, weasels, waterfowl) in the greater I-90 SPE Project Area (Table 4.1). Most were detected via DNA testing or remote camera surveys (Fig. 4.5), but incidental tracks at survey stations (Fig. 4.6), snow tracks along I-90 (See Chapter 3), and tracks recorded during Lake Keechelus surveys were also informative.

Baseline wildlife monitoring at I-90 Snoqualmie Pass East Chapter 4
Western Transportation Institute Page 92
Table 4.1. Species (or species groups) detected by remote cameras, DNA extracted from hair or scat, and tracks within the greater I-90 SPE Project Area. Species American black bear American marten American mink Bat (includes multiple species) Beaver Bird (includes all species smaller than waterfowl) Bushy-tailed woodrat Cougar Bobcat Canada goose Coyote Deer (includes both mule and black-tailed) Domestic dog Domestic cat Elk Gray wolf9 Mountain beaver Northern flying squirrel Northern raccoon Northern river otter Small mammal (includes mice, voles, shrews and chipmunks) Snowshoe hare Squirrel (includes multiple species) Waterfowl (includes multiple species) Weasel (includes both long- and short-tailed)
9 This detection was recorded by remote cameras in the Swauk-Teanaway region as part of a targeted effort to detect a new pack of gray wolves. Our photos helped to confirm the pack’s presence.

Baseline wildlife monitoring at I-90 Snoqualmie Pass East Chapter 4
Western Transportation Institute Page 93
A. B.
C. D. Figure 4.5. Photos of (A) marten, (B) bobcat, (C) coyote, and (D) elk captured at remote camera/hair-snagging stations. (Photos: WTI)

Baseline wildlife monitoring at I-90 Snoqualmie Pass East Chapter 4
Western Transportation Institute Page 94
Figure 4.6. Marten tracks photographed just south of I-90 near Snoqualmie Pass. (Photo: R. Long/WTI)
Defining species distributions based on detection-nondetection data requires surveying: (1) a large enough area to be relevant (i.e., the extent); (2) evenly enough to ensure few unsampled regions (i.e., evenness), and; (3) a substantial enough number of sufficiently small areas within the extent to maintain resolution (i.e., the grain) (Long and Zielinski 2008). Most importantly, an adequate amount of survey effort must be expended at each location to ensure, with some a priori level of confidence, that false-negative errors are minimized. Our surveys were not designed to meet these criteria, and therefore should not be considered the basis for a distribution map.
Because we used specific protocols and minimum deployment times for surveys of black
bears and martens, we report locations where these species were not detected in addition to detection locations (Figs. 4.7, 4.8). Although the former locations should not be strictly interpreted as “absences”— the species may have been present but undetected—they do represent “nondetections.” In contrast, the detections presented for coyotes, bobcats, cougars, deer, and elk (Figs. 4.9–4.13should be interpreted as “presence-only” data, as we did not specifically target these species with our survey methods and protocols.
Although black bears and martens were detected on both sides of I-90, fewer detections
(per unit of effort) occurred south of the highway than north (R. Long, unpublished data). This was especially true for martens, which were rarely detected south of the highway despite substantial survey effort (Fig. 4.8). We speculate that this trend may have been due to the logging-induced fragmentation of forest stands in this area, as martens elsewhere have been

Baseline wildlife monitoring at I-90 Snoqualmie Pass East Chapter 4
Western Transportation Institute Page 95
shown to prefer contiguous, mature forest stands with large diameter trees (Slauson et al. 2007). Future analyses of these data may further help to explain the apparent dearth of marten and bear detections south of I-90.

Baseline wildlife monitoring at I-90 Snoqualmie Pass East Chapter 4
Western Transportation Institute Page 96
Figure 4.7. Locations where black bears were detected via the genetic analysis of hair or scat samples, or remote camera photographs. Hair-snagging survey locations yielding nondetections are also shown.

Baseline wildlife monitoring at I-90 Snoqualmie Pass East Chapter 4
Western Transportation Institute Page 97
Figure 4.8. Locations where martens were detected via the genetic analysis of hair samples, remote camera photographs, or snow tracks at hair-snagging stations. Hair-snagging survey locations yielding nondetections are also shown.

Baseline wildlife monitoring at I-90 Snoqualmie Pass East Chapter 4
Western Transportation Institute Page 98
Figure 4.9. Locations where coyotes were detected via the genetic analysis of hair or scat samples, remote camera photographs, snow tracks encountered during highway snow tracking, or mud tracks encountered during track surveys of Lake Keechelus.
Figure 4.10. Locations where bobcats were detected via the genetic analysis of hair or scat samples, remote camera photographs, snow tracks encountered during highway snow tracking, or mud tracks encountered during track surveys of Lake Keechelus.

Baseline wildlife monitoring at I-90 Snoqualmie Pass East Chapter 4
Western Transportation Institute Page 99
Figure 4.11. Locations where cougars were detected via the genetic analysis of hair or scat samples, or remote camera photographs.
Figure 4.12. Locations where mule deer were detected via the genetic analysis of hair samples, remote camera photographs, or mud tracks encountered during track surveys of Lake Keechelus.

Baseline wildlife monitoring at I-90 Snoqualmie Pass East Chapter 4
Western Transportation Institute Page 100
Figure 4.13. Locations where elk were detected by remote camera photographs.

Baseline wildlife monitoring at I-90 Snoqualmie Pass East Chapter 5
Western Transportation Institute Page 101
Small Mammal Surveys We captured 264 individual small mammals, with 157 recaptures and 10 mortalities (Table 4.2, Appendix 4.5). Swabs containing DNA samples from 258 unique individuals were collected and stored for potential future analysis. Table 4.2. Summary of small mammal captures, recaptures, and mortalities by species.
Common Name New
Captures Recaptures Mortalities DNA
Samples Northwestern deermouse 214 141 2 213 Townsend's chipmunk 33 15 2 33 Deermouse 6 1 0 5 Trowbridge's shrew 3 0 2 3 Northern flying squirrel 3 0 1 0 Red-backed vole 3 0 1 3 Vagrant shrew 2 0 2 1 Total Individuals 264 157 10 258
The Northwestern deermouse was the most commonly captured species, followed by Townsend’s chipmunks. These two species comprised 94% of all individuals captured, with others including deermice, shrews (Trowbridge’s, vagrant), northern flying squirrels, and red-backed voles. Only the Northwestern deermouse was captured at all trapping grid locations (Table 4.3)
Table 4.3. Summary of small mammal detections by species.
Common Name Gold Creek
Price Creek
Swamp Creek
Toll Creek
Hudson Creek
Easton Hill
Northwestern deermouse X X X X X X Deermouse X X Trowbridge's shrew X X Vagrant shrew X X Townsend's chipmunk X X X X Northern flying squirrel X Red-backed vole X X
As noted above, distinguishing between the two species of deermice is difficult in the field; thus, the genetic identification of captured individuals may prove informative.
We captured two species of shrews—putatively Trowbridge’s shrew and vagrant shrew. We may have misidentified the latter animals, however, which could have actually been montane shrews. Shrews are extremely difficult to identify in the field, and confirmation is best accomplished by examining skulls and dental patterns. Four of five shrew captures resulted in mortalities. Skulls from these carcasses, which were delivered to Central Washington University, could be examined for a more definitive identification.

Baseline wildlife monitoring at I-90 Snoqualmie Pass East Chapter 5
Western Transportation Institute Page 102
The three captures of flying squirrels were considered incidental, as this species was not one of our target species. Adult flying squirrels are generally too large to enter the model of Sherman traps used in our surveys. Notably, all three individuals captured—with one resulting mortality—were juveniles.
A total of ten animals died as a result of our trapping surveys—2.4% of all captures—with shrews experiencing the highest mortality rates (i.e., 40% of mortalities, and 80% of shrew captures). Shrews often experience higher mortality rates during live-trapping efforts than other species, primarily because of their high metabolic rate (Powell and Proulx 2003). After observing some mortality, we made efforts to reduce the risk of capturing shrews by stiffening the trap treadle to exclude them. This tactic appeared to be successful, as a higher number of traps were found open but with bait removed following this adjustment (and shrews were the most likely culprits due to their size). For future monitoring, alternative trapping methods for shrews should be explored, with the objective of increasing capture rates while decreasing mortality. The use of permanently placed, “non-lethal” pitfall traps may be a good option. Keechelus Lake Track Surveys We conducted approximately six miles of track surveys along Keechelus Lake (Fig. 4.14). All detected tracks remained alongside or within the lakebed, with the exception of a single deer track that crossed I-90 (Fig. 4.14). This animal, however, crossed from east to west (based on the direction of the track trail), and would have been presumably been precluded from accessing the highway after mitigation by wildlife fencing to be installed along the east side of the lake. Additional results, discussion, and recommendations from this monitoring effort can be found in Appendix 4.6.

Baseline wildlife monitoring at I-90 Snoqualmie Pass East Chapter 5
Western Transportation Institute Page 103
A.

Baseline wildlife monitoring at I-90 Snoqualmie Pass East Chapter 5
Western Transportation Institute Page 104
B. Figure 4.14. Survey routes and tracks detected during Lake Keechelus track surveys conducted on 10/5/09, 10/15/09, and 10/28/09.
Baseline wildlife monitoring at I-90 Snoqualmie Pass East Chapter 5
Western Transportation Institute Page 105
Chapter 5 – Evaluating the Effects of I-90 on Northern Flying Squirrel Movement and Gene Flow
Preface This research, collaboratively funded by WSDOT and WTI, is classified as a Tier II monitoring project because it focuses on research questions beyond the core monitoring objectives set forth in the I-90 Snoqualmie Pass East Wildlife Monitoring Plan (Clevenger et al. 2008). To help make this project possible, WSDOT funded field equipment, supplies, and a rental vehicle for two summers (2009, 2010). Meanwhile, WTI provided support for a Master's student (Joseph Smith, Montana State University [MSU] Department of Ecology), whose expenses included tuition, a stipend, and field housing at Snoqualmie Pass. In addition, the U.S. Forest Service’s Pacific Northwest Research Station provided generous funding for DNA analyses, and the Washington Department of Fish and Wildlife loaned us telemetry equipment for the radio-collaring component of the project. The research described below was conducted by Joseph Smith, with oversight and assistance provided by WTI staff and several faculty members associated with MSU's Ecology department. In contrast to the other chapters in this report, we use metric units throughout this chapter because the material within was originally developed as a thesis.
Introduction Northern flying squirrel movement is thought to be largely dependent on forest structure (e.g., tree size, canopy closure), with travel across the landscape accomplished via tree-to-tree gliding (Carey 2000). Wide gaps in forest canopy, such as those associated with large roads, may be barriers to movement for flying squirrels (Weigl et al. 2002). The maximum recorded glide distance of northern flying squirrels is 65 m (Scheibe et al. 2006), with more typical glide distances approaching 20–40 m (Vernes 2001). Although most movement takes place through the tree canopy, flying squirrels do spend some time on the ground—where they feed on hypogeous fungi (i.e., fungi with underground fruiting bodies, commonly known as truffles). Squirrel movement on the ground is slow and clumsy, however (Wells-Gosling and Heaney 1984, Maser et al. 1986), and may increase risk of predation. As the primary prey species of the northern spotted owl and an important disperser of ectomycorrhizal fungi spores, northern flying squirrels are considered a critical component of some forested ecosystems (Carey 1995, Lehmkuhl et al. 2004, Lehmkuhl et al. 2006). We selected the northern flying squirrel as a focal species for exploring potential barrier effects of I-90 and establishing baseline data that can be used to determine and monitor the overall success of mitigation measures to be implemented by WSDOT. We examined potential barrier effects using a combination of radio-telemetry and genetic analyses.
To our knowledge, this project represents the first research conducted in the Pacific Northwest regarding the response of flying squirrels to roads and/or highways. Weigl et al. (2002) studied a population of northern flying squirrels divided by a 2-lane highway in North

Baseline wildlife monitoring at I-90 Snoqualmie Pass East Chapter 5
Western Transportation Institute Page 106
Carolina, and observed no crossings or crossing attempts by any of the ten radio-tracked adults over a period of two years. The width of the highway in this study averaged 38 m, which is within the gliding range of flying squirrels (Vernes 2001, Scheibe et al. 2006). These findings suggest that flying squirrels may avoid crossing roads for reasons other than physical limitations. The relationship between dispersal/movement activities and habitat configuration are poorly studied in northern flying squirrels, but have been examined in several other gliding mammals. For example, juvenile Siberian flying squirrels (Pteromys volans), whose gliding abilities are very similar to those of northern flying squirrels (Vernes 2001, Asari et al. 2007), tended to disperse through preferred forested habitat; open areas that could not be crossed in a single glide were almost always avoided (Selonen and Hanski 2004). In a related study, one adult male was observed to cross a field 70 m wide in a single glide several times, and a single female crossed a gap wider than 50 m (Selonen and Hanski 2003). Road crossings by squirrel gliders (Petaurus norfolcensis) were inhibited though not precluded by wide gaps (i.e., > 50 m) in the tree canopy created by roads and power lines (van der Ree 2006, van der Ree et al. 2010).
Study Area and Methods
Site Selection The Study Area is described previously in detail (Chapter 1). Within the Project Area, WSDOT had previously highlighted specific highway segments that were considered to be especially important for connectivity mitigation efforts (WSDOT 2006). Fourteen of these Connectivity Emphasis Areas (CEAs) are used as reference points in our report (Fig. 5.1). We selected the Bonnie Creek, Toll Creek, Easton Hill, and Kachess River Connectivity Emphasis Areas (CEAs) as study sites for this research (Fig. 5.1). These CEA’s provided sufficient habitat (i.e., late-successional forest) on both sides of the highway to enable a pairwise comparison. We live-trapped flying squirrels in June–July of 2009 and 2010.

Baseline wildlife monitoring at I-90 Snoqualmie Pass East Chapter 5
Western Transportation Institute Page 107
Figure 5.1. Map of study area showing live-trap locations at four trapping sites. For analyses, each site was divided into a “north” and “south” component relative to I-90.
Live Capture We generally deployed traps within a mean home-range diameter (i.e., ~350 m) of I-90 in an effort to sample only squirrels with home ranges adjacent to or potentially overlapping the highway. We deployed trapping sites in pairs across the highway such that crossings by trapped and marked individuals could be detected. Trap stations were located approximately 30 m apart along trap lines situated parallel to the highway, and trap lines comprised 24–36 trap stations, with a resulting effective survey area of approximately 1.8–2.7 ha. At each trap station, we placed 1 41 x 13 x 13 cm trap (Tomahawk Model 201, Tomahawk, WI) on the ground, and fixed a second trap to the bole of a nearby tree at approximately 1.25–2 m above the ground. We covered traps with tight-fitting, wax-coated cardboard boxes, and nested a small cardboard box with polyester filling within each trap to help protect trapped animals from exposure. We also covered traps with natural debris to make them less conspicuous.
We opened traps in the evening, checked them early the following morning, and then left them closed during the day to reduce captures of non-target species and minimize heat stress. We baited traps with a mixture of peanut butter, rolled oats, and molasses, and changed or supplemented bait daily. When flying squirrels were captured, we recorded their weight, sex, and

Baseline wildlife monitoring at I-90 Snoqualmie Pass East Chapter 5
Western Transportation Institute Page 108
reproductive status. We also collected a sample of epithelial cells for use in genetic analyses by rubbing the inside of the cheek with a cotton and/or synthetic swab, and inserted a passive integrated transponder (PIT) tag subcutaneously between the shoulder blades to permit the identification of recaptured individuals. Lastly, we fitted flying squirrels weighing >120 g with a 4 g VHF transmitter to facilitate the collection of movement and home range data.
We recorded all information, including the designated trap number and site location, onto
field data forms. After we completed our processing protocol, we released squirrels at the capture location and monitored them briefly for injuries or stress. Any animal that exhibited injury or stress was cared for immediately and released after a full recovery.
Radio-Telemetry
We used radio-telemetry to track nightly movements and determine home ranges of radio-collared squirrels. To collar a given squirrel, we affixed a Holohil Model PD-2C transmitter (Holohil Systems Ltd., Carp, Ontario, Canada) around its neck with 30 lb.-test braided steel fishing line and padded the transmitter with flexible PVC tubing. We collared only squirrels weighing >120 g to guarantee that transmitter weight did not exceed the recommended maximum of 4% of the individual's weight (Cochran 1980), and thus to help ensure that gliding capabilities were not impeded by transmitters. During each tracking session, we used a radio receiver and handheld antenna (Telonics, Inc., Mesa, AZ, USA) to closely approach and record locations of radio-collared squirrels at 1-hour intervals. Once we felt that we were as close to a given squirrel as possible without disturbing its behavior, we recorded the location with a handheld global positioning system (GPS) unit. We estimated and recorded the accuracy of each location as: (1) visual confirmation or likely tree location of the squirrel; (2) within 20 m of the squirrel; (3) within 40 m of the squirrel; or (4) poor quality point, usually when we could not physically approach the squirrel or obtain a strong signal.
We monitored flying squirrel movements from late-June through late-August in 2009 and
2010. We tracked each radio-collared squirrel for 1–3 nights/week, with the resulting data consisting of several bursts of hour-spaced locations clustered temporally by individual tracking session and distributed evenly over the 2–3 month monitoring period.
Home Range and Movement Analyses We converted pairs of sequential locations for a given squirrel into a number of movement vectors. These vectors were straight-line movement segments representing simplifications of typical movements of squirrels during approximately one hour of nightly activity. Because we were often unable to locate a squirrel or record locations at exact one-hour intervals, we relaxed this constraint slightly and used only locations separated by 50–120 minutes in the analysis. We omitted locations with level 4 accuracies from our analyses. We performed a Monte Carlo randomization procedure in R (R Core Team 2012) to assess whether movement vectors crossed the highway less frequently than expected by chance. This procedure involved:
1. selecting a random sample (without replacement) of known locations for a given squirrel equal to the number of movement vectors observed for that squirrel;

Baseline wildlife monitoring at I-90 Snoqualmie Pass East Chapter 5
Western Transportation Institute Page 109
2. randomly assigning distances (sampled with replacement from observed vectors) and azimuths (sampled from a uniform distribution from 1–360) to those points to simulate random movement vectors;
3. counting the number of random vectors that would have crossed the highway.
We determined significance values by calculating the proportion of 10,000 randomized runs with crossing counts less than or equal to the observed number of crossings.
We determined home ranges by constructing simple minimum convex polygons (MCP)
in ArcGIS 10 (ESRI, Redlands, CA, USA). We only calculated home range sizes for squirrels with 30 recorded locations.
DNA Extraction and Analysis We stored epithelial cells from cheek swabs (cotton and/or synthetic) with silica desiccant. For extraction, we isolated genomic DNA from cheek swabs using Qiagen’s Investigator Kit. We chose eleven polymorphic microsatellite loci for genotyping, and used fluorescently labeled universal M13 primer with an attached M13 sequence at the 5’ end of the forward primer to view PCR amplicons. All loci shared the same PCR chemistry, which consisted of 2"L of 5X MyTaq RXN Buffer, 1"M of each primer, 0.5 Unit of MyTaq™ HS DNA Polymerase, ~50ng of DNA and enough water for a final volume of 10 "L (Bioline). Similarly, all 11 loci shared the same thermoprofile, which consisted of an activation step at 95°C for 1 min followed by 30 cycles (95°C for 15 sec, 55°C for 15 sec and 72°C for 10 sec). We performed 10 additional cycles (95°C for 15 sec, 53°C for 15 sec, and 72°C for 10 sec) to incorporate the fluorescently labeled universal M13 primer. Finally, PCR amplicons were visualized using the 3100-Avant Genetic Analyzer and scored with GeneMapper v3.5 (Applied Biosystems).
Population and Landscape Genetic Analyses We screened genotypes for linkage disequilibrium and deviations from Hardy-Weinberg equilibrium using the program GENEPOP (v.4.1; Raymond and Rousset 1995, Rousset 2008), and assigned levels using sequential Bonferroni correction for multiple comparisons (Rice 1989). We also used GENEPOP to estimate allele frequency-based fixation indices (FST) between all possible pairs of trapping sites. This approach employed Weir and Cockerham’s (1984) estimator , and pairwise individual genetic distances among all individuals using Rousset’s (2000) â, which is somewhat analogous to FST /(1-FST) (see Rousset 1997) for assessing isolation by distance of individual squirrels. We used Mantel tests and partial Mantel tests (Mantel 1967, Smouse et al. 1986) to test for effects of geographic distance and the highway on genetic differentiation at both the site level (pairwise FST) and the individual level (â).
We assigned geographic coordinates for individual animals in one of two ways. For radio-tracked individuals, we used the center of an individual squirrel home range defined by the mean Universal Transect Mercator (UTM) easting and mean UTM northing of all recorded locations. For non radio-tracked individuals, we used the location of the capture site. We calculated the geographic coordinates of all individuals from a capture site by taking the mean UTM easting and mean UTM northing of the site. We used the natural logarithm of the
Baseline wildlife monitoring at I-90 Snoqualmie Pass East Chapter 5
Western Transportation Institute Page 110
Euclidean distance (meters) between populations or individuals in evaluating isolation by distance. Mantel tests were performed in the R package ECODIST (v.1.2.3; Goslee and Urban 2010), and significance was determined with 100,000 randomizations. We used the Bayesian population assignment software STRUCTURE (v.2.3; Pritchard et al. 2000) to infer the most likely number of populations (K) in the study area, and to examine relationships between the inferred populations and landscape features that might affect gene flow.
STRUCTURE allows user-defined “populations” to be associated with each individual,
thereby improving the program’s ability to correctly assign individuals to groups when genetic structure is weak or when samples are clumped in space (Hubisz et al. 2009). We chose this approach based on the limited geographic extent of our samples and their clumped distribution. We employed model parameters recommended in the software documentation (i.e., the admixture model with correlated gene frequencies, inferred from the data, = 1, a burn-in period of 10,000 iterations, and 10,000 iterations of the Markov chain), and methods described in Evanno et al. (2005) to infer the most likely value of K based on 5 independent runs at each value of K from 1 to 6 (the maximum value being the number of sites from which the samples were collected). Finally, we used program BARRIER (v.2.2; Manni et al. 2004) to identify the most likely location of a gene flow barrier. BARRIER employs Monmonier’s algorithm to locate discontinuities in gene flow based on the locations of individuals and the magnitude of pairwise individual genetic distances (â).
Results
Home Range and Movement We deployed radio collars on 11 and 10 squirrels in 2009 and 2010, respectively. Three collars slipped-off or were removed by squirrels during the study. These collars were recovered and re-deployed on other squirrels. One radio-collared squirrel appeared to cease movement high in a tree after several days, and we presumed that it either died or slipped its collar. The collar was never recovered. In total, we used 548 locations from 17 individual squirrels for home range analyses (Table 5.1). Home ranges of squirrels with 30 locations (n = 11) ranged from 0.85 to 67.60 ha. Home range sizes of females (mean = 3.88 ha, range = 0.85–8.93 ha, n = 3) did not overlap home range sizes of males (mean = 24.99 ha, range = 10.67–67.60 ha, n = 8)(Figs. 5.2–5.5).

Baseline wildlife monitoring at I-90 Snoqualmie Pass East Chapter 5
Western Transportation Institute Page 111
Table 5.1. Summary of radio-telemetry results and movement vector analysis, including squirrel identification number, sex, year monitored, and numbers of: (a) vectors; (b) tracking nights; (c) detected crossings; and (d) expected crossings (i.e., the mean of the randomization distribution). Also shown are the detected crossing rate and the p-value of the movement randomization test for each squirrel.
Site Squirrel (sex) Year
monitored Movement
vectors Tracking Nights
Detected Crossings
Expected Crossings
Crossing Rate
p-value
Bonnie Creek 179 (F) 2009 5 11 0 0.66 0 0.4942 211 (F) 2009 5 5 0 0.53 0 0.5697 120 (M) 2009 17 12 1 3.32 0.06 0.1273 272 (M) 2009 16 11 4 3.05 0.25 0.8261
Toll Creek 091 (M) 2009 6 11 0 0.43 0 0.6452 239 (M) 2009 14 11 0 1.96 0 0.1187 060 (M) 2009 16 16 1 2.76 0.06 0.2057 031 (M) 2009 16 19 2 2.21 0.13 0.6201 300 (F) 2009 6 7 2 1.38 0.33 0.8623
Easton Hill 640 (M) 2010 28 10 0 4.45 0 0.0065 539 (F) 2010 29 9 0 4.12 0 0.0114 520 (M) 2010 30 10 0 4.97 0 0.0038 680 (F) 2010 30 8 0 3.78 0 0.0188
Easton Island 818 (M) 2010 15 4 0 2.98 0 0.0362 178 (F) 2010 32 10 0 6.47 0 0.0012 498 (M) 2010 33 10 5 8.32 0.15 0.1236 739 (M) 2010 35 7 16 7.64 0.46 0.9999
Pooled 2009 101 103 10 16.40 0.10 0.0493
2010 232 68 21 42.81 0.09 <0.0001 2009 and 2010 333 171 31 59.23 0.09 <0.0001

Baseline wildlife monitoring at I-90 Snoqualmie Pass East Chapter 5
Western Transportation Institute Page 112
Figure 5.2. Radio-tracking locations and minimum convex polygon home ranges for four northern flying squirrels tracked at the Bonnie Creek site. The background orthophoto shows I-90, smaller paved and unpaved roads, and other landscape features.

Baseline wildlife monitoring at I-90 Snoqualmie Pass East Chapter 5
Western Transportation Institute Page 113
Figure 5.3. Radio-tracking locations and minimum convex polygon home ranges for five northern flying squirrels monitored at the Toll Creek site. The background orthophoto shows I-90, smaller paved and unpaved roads, and other landscape features.

Baseline wildlife monitoring at I-90 Snoqualmie Pass East Chapter 5
Western Transportation Institute Page 114
Figure 5.4. Radio-tracking locations and minimum convex polygon home ranges for five northern flying squirrels monitored at the Easton Hill site. The background orthophoto shows I-90, smaller paved and unpaved roads, and other landscape features.

Baseline wildlife monitoring at I-90 Snoqualmie Pass East Chapter 5
Western Transportation Institute Page 115
Figure 5.5. Radio-tracking locations and minimum convex polygon home ranges for five northern flying squirrels monitored at the Easton Island site. The background orthophoto shows I-90, smaller paved and unpaved roads, and other landscape features.

Baseline wildlife monitoring at I-90 Snoqualmie Pass East Chapter 5
Western Transportation Institute Page 116
We detected squirrels crossing the highway at three of the four CEA’s: Bonnie Creek, Toll Creek, and Easton Island (Table 5.1. Fig. 5.6). We detected no crossings at Easton Hill. We assume that squirrel crossings were achieved by gliding across the highway, from tree-to-ground or tree-to-tree (see Discussion section for more on this subject). Seven squirrels (41%) were confirmed to have crossed the highway at least once. Crossing rates (i.e., the proportion of observed vectors that crossed the highway) for squirrels that were confirmed to have crossed at least once ranged from 0.06 to 0.46. Crossing rates did not differ between males and females (exact Wilcoxon rank sum test, W = 22.5, p = 0.27). Of the four CEAs, the crossing rate was highest at Easton Island (0.18). Due to a forested median separating the east- and west-bound lanes, this site also featured the narrowest (~40 m) highway-induced gap between forest edges. In contrast, Easton Hill, where we detected no squirrel crossings, was characterized by the widest gap between forest edges (>80 m)(Fig. 5.7).
We employed a total of 333 movement vectors for the movement analysis. Highway
crossings comprised about 10% of recorded movements in 2009, 9% of movements in 2010, and 9% of movements over both years combined (Table 5.1). When we pooled all squirrels over one or both years, highway crossings occurred significantly less frequently than would have been expected by chance (Monte Carlo p < 0.0001, all squirrels combined). These findings suggest that flying squirrels exhibited some avoidance of crossing I-90. The highway was estimated to reduce crossings by approximately 48% when all vectors were pooled for analysis (expected crossings = 59, observed crossings = 31, 95% confidence interval = 32.6–57.5% reduction).

Baseline wildlife monitoring at I-90 Snoqualmie Pass East Chapter 5
Western Transportation Institute Page 117
Figure 5.6. Diagram representing radio-tracked movements of collared squirrels relative to the highway. Within sites, individual squirrels are represented by different-colored lines. Site diagrams are arranged from northwest (top) to southeast.
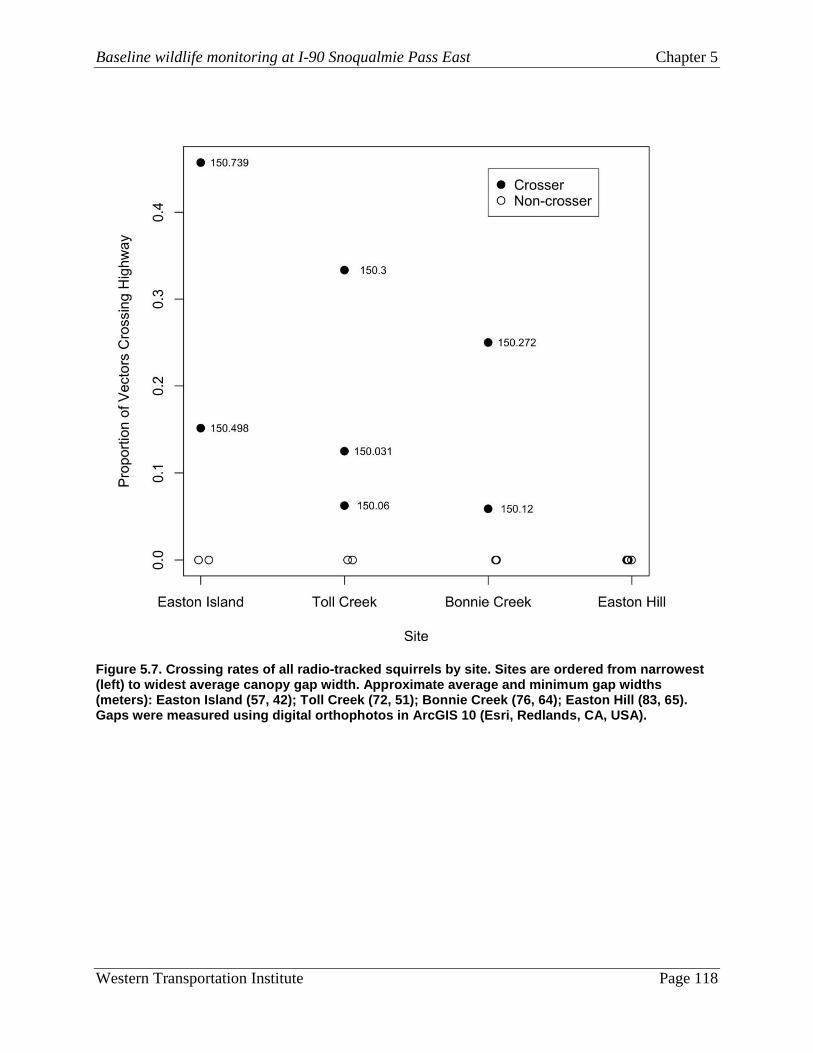
Baseline wildlife monitoring at I-90 Snoqualmie Pass East Chapter 5
Western Transportation Institute Page 118
Figure 5.7. Crossing rates of all radio-tracked squirrels by site. Sites are ordered from narrowest (left) to widest average canopy gap width. Approximate average and minimum gap widths (meters): Easton Island (57, 42); Toll Creek (72, 51); Bonnie Creek (76, 64); Easton Hill (83, 65). Gaps were measured using digital orthophotos in ArcGIS 10 (Esri, Redlands, CA, USA).

Baseline wildlife monitoring at I-90 Snoqualmie Pass East Chapter 5
Western Transportation Institute Page 119
Population and Landscape Genetics
We genotyped a total of 59 individuals at 11 loci (Appendix 5.1). Seven of 55 pairs of loci showed potential linkage (p < 0.05), but there was no evidence for gametic disequilibrium among any pairs of loci after sequential Bonferroni correction. The average number of alleles per locus was 7.73 (range 5–13). The average observed heterozygosity was 0.62. After sequential Bonferroni correction, Bonnie Creek South was the only site that deviated significantly from Hardy-Weinberg equilibrium (Fisher’s method, 2 = 42.905, d.f . = 20, p = 0.0021).
We detected statistically significant genetic structure between all but three pairs of sites
(Table 5.2). Pairwise FST among sites on the same side of the highway (mean = 0.050, range 0.014–0.77) was very similar to pairwise FST among sites on opposite sides of the highway (mean = 0.051, range 0.011–0.91). Global FST was 0.051. There was no evidence for a correlation between pairwise FST and geographic distance (Mantel’s r = - 0.18, p = 0.77) or between pairwise FST and highway presence (Mantel’s r = 0.026, p = 0.39). In sum, therefore, there was no indication that the highway was a major barrier to genetic connectivity for squirrels.
Given the close proximity of individuals sampled at the same site, we chose to modify the
individual-based analysis to exclude comparisons between individuals whose assigned locations were within a distance of 500 m. We took these measures because:
1. the relationship between geographic distance and genetic distance is thought to
deteriorate at distances that are below the dispersal distance of individuals, (Rousset 1997, 2000), and the size of our trap sets resulted in clusters of individuals far below this threshold distance from one another;
2. post-hoc relatedness analyses performed in the program MLRELATE (Kalinowski et al. 2006) indicated that individuals within sites were highly related ( within = 0.13, overall = 0.06). Pairwise comparisons between members of family groups are generally not suitable for analyzing whether a barrier is associated with genetic differences at the population scale;
3. estimated geographic distances between individuals within sites were unreliable because home ranges overlapped considerably, and any error associated with these estimates would have been magnified by the log transformation of distance.
The 500 m threshold excludes most comparisons within trapping sites and, as an
approximation of dispersal distance ( ), is in close agreement with the predicted mean dispersal distance of 430 m reported for northern flying squirrels (D’Eon 2002). However, although 96% of the movement lengths we recorded were less than 500 m, we also observed squirrels moving as far as 974 m in less than 2 hours.
After we excluded comparisons of individuals below the 500 m threshold, the remaining
dataset included 79% of the original dataset (n = 1355). A simple linear regression test indicated that neither geographic distance nor the barrier effect of the highway was significantly correlated with genetic distance (t = 0.441, df = 1454, p = 0.659 for geographic distance, and t = -0.003, df = 1454, p = 0.998 for barrier effect). Simple linear regression is typically not appropriate for tests such as this because non-independence among observations will always result in artificially

Baseline wildlife monitoring at I-90 Snoqualmie Pass East Chapter 5
Western Transportation Institute Page 120
small standard errors and, subsequently, inappropriately small p-values. Given this issue, the large p-values we observed under the simple linear regression model strongly indicated that there was no relationship between the explanatory variables—geographic distance and the highway— and genetic distances among individuals. Table 5.2. Pairwise relatedness, geographic distances, and FST between sites. NS = not significant, * = p < 0.05, ** = p < 0.005, *** = p < 0.0001 (after sequential Bonferroni correction). Average relatedness is reported within each site (r1 and r2) and between sites (rbetween). Bold values indicate average coefficients of relatedness consistent with first cousin or closer relationships.
Site Pair r1 r2 rbetween Distance (km) FST BCN–BCS 0.14 0.22 0.05 0.35 0.065** BCN–TCN 0.14 0.11 0.07 2.49 0.014 (NS) BCN–TCS 0.14 0.12 0.05 2.81 0.063* BCN–EHN 0.14 0.17 0.08 7.18 0.056* BCN–EHS 0.14 0.08 0.07 7.89 0.011 (NS) BCS–TCN 0.22 0.11 0.05 2.26 0.072*** BCS–TCS 0.22 0.12 0.03 2.54 0.077*** BCS–EHN 0.22 0.17 0.03 6.93 0.091*** BCS–EHS 0.22 0.08 0.06 7.64 0.057** TCN–TCS 0.11 0.12 0.05 0.48 0.060*** TCN–EHN 0.11 0.17 0.05 4.69 0.058*** TCN–EHS 0.11 0.08 0.06 5.40 0.022 (NS) TCS–EHN 0.12 0.17 0.07 4.38 0.034** TCS–EHS 0.12 0.08 0.05 5.10 0.042*** EHN–EHS 0.17 0.08 0.05 0.72 0.044**
The program BARRIER identified that the most likely barrier occurred through the Easton
Hill North site, perpendicular to the highway. The location of the inferred barrier did not correlate with any obvious landscape feature(s). STRUCTURE identified K = 4 as the most likely number of groups, but members of these inferred groups were geographically mixed. Thus, while genetic structure was evident among sampled squirrels, patterns consistent with geographically distinct groups did not emerge. Relatedness analyses in MLRELATE supported these results. We estimated relatedness coefficients of (r) 0.25 (consistent with half-sibling relationship) between squirrels in 11 of the 15 possible site pairs, including 6 of 9 possible across-highway site pairs.
Discussion
Although I-90 appeared to filter the movement of northern flying squirrels at sites where we monitored individuals, it did not appear to be an absolute barrier to movement. Almost half (41%) of the squirrels we tracked were observed to have crossed the highway at least once. Because radio-tracking occurred during hours of darkness, and flying squirrels are arboreal and use tall trees for movement, we rarely observed movement activity directly. Further, no squirrel

Baseline wildlife monitoring at I-90 Snoqualmie Pass East Chapter 5
Western Transportation Institute Page 121
was visually observed to cross the highway via gliding or at-grade movement (e.g., walking across the road surface). Concurrent monitoring (see Chapter 3, this report) of culverts and bridges by WTI staff indicated that no monitored culverts or bridges were used by flying squirrels to cross the highway. Further, no flying squirrels were reported in a concurrent study of wildlife-vehicle collisions and live animal sightings throughout the flying squirrel study area (see Chapter 2, this report). We assume, therefore, that highway crossings by flying squirrels detected during radio-tracking were accomplished via gliding over the highway from tree-to-tree or tree-to-ground; a phenomenon that has been documented for gliding mammals elsewhere (van der Ree 2010). We considered potential options for confirming this assumption (e.g., spotlighting, infrared cameras, covering individuals with ultraviolet-sensitive powder for visual tracking), but none was considered feasible.
Two squirrels, one from Bonnie Creek and one from Toll Creek, were only detected once on the opposite side of the highway from their respective sites of capture. For these individuals—both males—habitat on the opposite side of the highway may not have represented part of their home range as it is usually defined. Instead, we speculate that these observed crossings may have been extraterritorial “prospecting forays,” perhaps to seek out mates (Reed et al. 1999). Five other squirrels crossed the highway on a more regular basis—some almost every night they were tracked. Each of these squirrels followed similar routes on a regular basis, suggesting that their home range included territory on both sides of the highway.
Assuming maximum glide distances of approximately 65 m (Scheibe et al. 2006), and more typical glide distances of <25 m (Vernes 2001), it is reasonable to assume that some variation in crossing behavior may be attributable to among-site differences in the highway itself. Canopy gap width and crossing behavior varied predictably among the four tracking sites (Fig. Fig. 5.7). At Toll Creek and Easton Island, for example, where canopy gap was less than 50 m in places, our telemetry indicated that five of the nine crossed the highway—often on multiple occasions in a given night. In contrast, at the top of Easton Hill, where we observed no crossings, the minimum canopy gap exceeded 65 m (> 80 m along most of the length of the site). Also at Easton Hill, tall conifers were set back from the forest edge and an elevational gradient would have presumably made gliding from south to north difficult, if not impossible. The canopy gap at Bonnie Creek was also > 60 m in width, but mature, tall conifers at least 45m in height abutted the very edge of the highway on both sides. Such trees could enable >60 m glides by flying squirrels based on documented height-of-launch to glide ratios of 1:2 (Vernes 2001). Taken together, our results are consistent with the hypothesis that wide canopy gaps inhibit crossing by flying squirrels. Finer scale movement data, however, and the inclusion of several more sites along the highway, would be necessary to quantitatively address how highway characteristics and gap widths influence crossing behavior.
Given our observed rates of squirrel movement across the highway, one would expect that populations on either side are connected both demographically and genetically. The results of the molecular genetic analysis support this supposition, given the absence of a significant highway effect on genetic distances between squirrels at the landscape scale.
Simulations have shown partial Mantel tests to be sensitive to very recent barriers, and
significant positive values of Mantel’s r can be expected in 1–15 generations after establishment

Baseline wildlife monitoring at I-90 Snoqualmie Pass East Chapter 5
Western Transportation Institute Page 122
of a complete barrier (Landguth et al. 2010). As I-90 has existed in its present form for 50–60 years, a substantial barrier effect, if present, should have been detected. Although anthropogenic barriers to dispersal may be difficult to detect in species with large population sizes (e.g. Gauffre et al. 2008), our detection of squirrels moving across the highway provides evidence that the highway is not a complete dispersal barrier. And though the highway appears to have reduced the rate of crossing events significantly (i.e., a majority of tracked squirrels were never observed crossing the highway), it is reasonable to expect that the cumulative number of individuals moving across the highway is more than sufficient to prevent genetic differentiation.
Despite our detecting no highway effect on genetic patterns, our estimates of population
differentiation among sites were unexpectedly high for a vagile, non-territorial rodent—especially given the short geographic distances under consideration (Table 5.2). Our longest observed movement was 0.97 km in 83 minutes, even though we frequently observed squirrels moving at a pace that could exceed that distance in a shorter amount of time. For a species that can potentially travel 1 km/hr, one could reasonably expect dispersal distances that approach the extent of the study area. The study area was approximately 8 km in length, and distances between the centers of survey sites ranged from 0.35–7.89 km (Table 5.2). Because neither geographic distance nor the highway had a detectable effect on genetic distances between squirrels, the high degree of differentiation we observed among sites suggests that gene flow may be limited by philopatry (i.e., the tendency of an individual to locate and reproduce near where it was born) rather than dispersal limitations imposed by the landscape. This conclusion is consistent with the results of the relatedness analysis, which indicate a high number of probable parent-offspring, full sibling, and half-sibling relationships within sites. The relatively small scale at which squirrels were trapped (i.e., distances between traps were much smaller than the average home range of the radio-tracked squirrels) resulted in a sample that more closely represented a family group than a random sample of the populations of interest (i.e., squirrels occupying discrete, contiguous forest patches). Therefore, our estimates of FST were more descriptive of differences among family groups than differences among randomly mating individuals across a larger landscape. Overall, 57% of the variation in FST among pairs of sites was explained by within-site relatedness (Fig. 5.8).
Gap width (i.e., the distance between tall trees on the verges of the highway) may affect
the permeability of the highway to northern flying squirrels. Although we were unable to observe highway crossings directly, the general locations of crossings lead us to believe that they were accomplished by gliding. This is also supported by the absence of any observed crossings at Easton Hill, which has the largest gap between trees on either side of the highway of all the sites we monitored. Further, we have not detected any flying squirrels crossing I-90 during our long-term monitoring of existing bridges and culverts, and only one flying squirrel has been documented inside a culvert (i.e., Price Creek), and this animal entered and turned around after moving only a few meters. Likewise, researchers studying wildlife connectivity within the I-90 Snoqualmie Pass East project area during the late 1990s never detected flying squirrels crossing the highway through existing culverts (Singleton and Lehmkuhl 2000). Given the relatively poor locomotive abilities of flying squirrels on the ground, at-grade highway crossings would be substantially more dangerous than gliding, and fewer successful crossings of this type would be expected.

Baseline wildlife monitoring at I-90 Snoqualmie Pass East Chapter 5
Western Transportation Institute Page 123
Figure 5.8. Mean within-site relatedness and pairwise FST for all pairs of sites. Higher within-site relatedness is positively associated with estimated genetic distance between sites (t = 4.14 on 13 degrees of freedom, p = 0.001). Within-site relatedness of pairs of sites explained approximately 57% of the variation in pairwise FST. Within-site relatedness at each site is reported in Table 5.2.
Baseline wildlife monitoring at I-90 Snoqualmie Pass East Chapter 5
Western Transportation Institute Page 124
Management Implications and Recommendations
Results from this study suggest that habitat connectivity for flying squirrels on I-90 can be maintained if sufficiently tall trees (i.e., approximately 30 m) are present on either side of highway and canopy gaps created by the highway are limited to < ~65 m. The planned addition of new lanes via the I-90 Snoqualmie Pass East project will result in a widening of the canopy gap in most places. Mitigation measures for flying squirrels should be considered where gaps in tree canopy currently exceed the gliding ability of flying squirrels or where the addition of lanes will result in such gaps. Where highway-induced gaps in the canopy are > 65 m, potential mitigation measures could include: (1) retaining tall trees on opposite sides of the highway; (2) retaining or planting trees in the median; or (3) installing crossing poles, median poles, or suspension bridges along the highway corridor.
Crossing poles (Fig. 5.9) consist of launching platforms affixed to tall poles (e.g., 14 m;
Anonymous 2010) installed on opposite sides of the road. Such poles have been successfully used to aid road crossings by endangered Australian squirrel gliders (Petaurus norfolcensis) in Australia (Ball and Goldingay 2008) and endangered Carolina northern flying squirrels (Glaucomys sabrinus coloratus) in North Carolina, USA (Anonymous 2010). Voluntary use of poles by animals has been documented in both cases. Such poles, when placed in the median (Fig. 5.10) can provide both landing and launch options to enable gliding species to cross multiple lanes of traffic (van der Ree et al. 2010). With such poles in place, gliding species are able to launch from a high point on one side of a highway, land in the median or on the median pole itself, climb to the top of the pole, and then complete the crossing by gliding across the second set of highway lanes. Alternately, suspension bridges—typically constructed of cables or rope material (R. van der Ree, personal communication; Fig. 5.11)—are affixed to trees or other structures and stretched across the highway. Such bridges could potentially provide crossing opportunities for many other species (e.g., other squirrels, smaller rodents, reptiles) as well as flying squirrels.
In conclusion, the poor locomotive capacities of flying squirrels on the ground, and the
absence of tall trees in wildlife underpasses or on wildlife overpasses, will presumably make the use of I-90's future crossing structures by flying squirrels unlikely. To specifically address connectivity for northern flying squirrels within the I-90 Snoqualmie Pass East region, we would thus recommend that WSDOT consider the mitigation strategies described above.

Baseline wildlife monitoring at I-90 Snoqualmie Pass East Chapter 5
Western Transportation Institute Page 125
A.
B. Figure 5.9. (A) Glider poles deployed alongside the highway and in the median to facilitate crossing by gliding mammals in New South Wales, Australia. (B) Close-up of pole top and remote camera. (Photos: Kylie Soanes, Rodney van der Ree)

Baseline wildlife monitoring at I-90 Snoqualmie Pass East Chapter 5
Western Transportation Institute Page 126
Figure. 5.10. Glider pole deployed in the median of a split highway in New South Wales, Australia (Photo: Rodney van der Ree)
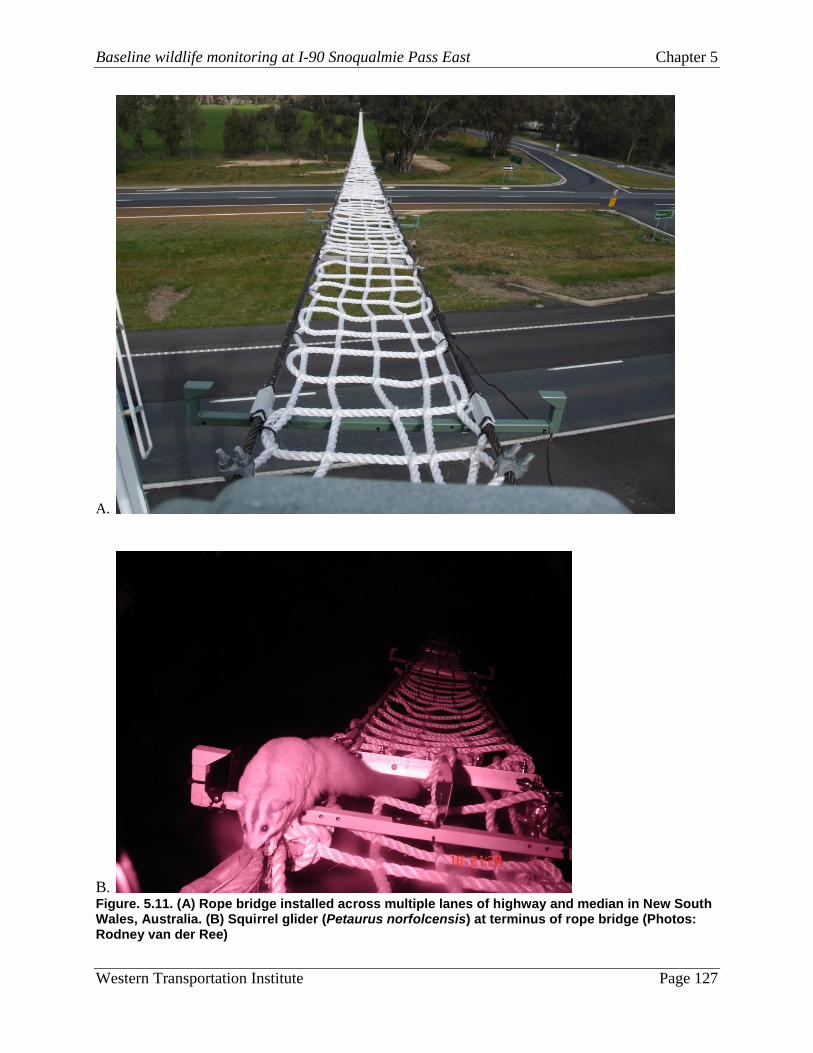
Baseline wildlife monitoring at I-90 Snoqualmie Pass East Chapter 5
Western Transportation Institute Page 127
A.
B. Figure. 5.11. (A) Rope bridge installed across multiple lanes of highway and median in New South Wales, Australia. (B) Squirrel glider (Petaurus norfolcensis) at terminus of rope bridge (Photos: Rodney van der Ree)

Baseline wildlife monitoring at I-90 Snoqualmie Pass East Literature Cited
Western Transportation Institute Page 128
Literature Cited
Alexander, S.M., N.M. Waters, and P.C. Paquet. 2005. Traffic volume and highway permeability for a mammalian community in the Canadian Rocky Mountains. Canadian Geographer 49:321–331.
Ament, R., D. Galarus, D. Richter, K. Bateman, M. Huijser, and J. Begley. 2011. Roadkill Observation Collection System (ROCS): Phase III development. A report to the Federal Highway Administration, U.S. Department of Transportation, Washington, D.C. and the Deer Vehicle Crash Information and Research Center, c/o Institute for Transportation, Ames, IA. 114 pp.
Anonymous. 2010. Endangered squirrels using poles to glide across road, In News Releases. North Carolina Wildlife Resources Commission, Raleigh, North Carolina.
Apps, C.D., B.N. McLellan, J.G. Woods, and M.F. Proctor. 2004. Estimating grizzly bear distribution and abundance relative to habitat and human influence. The Journal of Wildlife Management 68:138–152.
Asari, Y., H. Yanagawa, and T. Oshida. 2007. Gliding ability of the Siberian flying squirrel Pteromys volans orii. Mammal Study 32:151–154.
Ball, T., and R. Goldingay. 2008. Can wooden poles be used to reconnect habitat for a gliding mammal? Landscape and Urban Planning 87:140–146.
Barthelmess, E.L., and M.S. Brooks. 2010. The influence of body-size and diet on road-kill trends in mammals. Biodiversity and Conservation 19:1611–1629.
Bingham, B.B., and B.R. Noon. 1998. The use of core areas in comprehensive mitigation strategies. Conservation Biology 12:241–243.
Burnham, K.P., and D.R. Anderson. 2002. Model selection and multimodel inference: a practical information-theoretic approach. Springer-Verlag, New York.
Carey, A.B. 1995. Sciurids in Pacific Northwest managed and old-growth forests. Ecological Applications 5:648–661
Carey, A.B. 2000. Ecology of northern flying squirrels: implications for ecosystem management in the Pacific Northwest, USA. Pages 45–66 in R. Goldingay, J.S. Scheibe, editors. Biology of gliding mammals. Filander Verlag, Fürth, Germany.
Cattet, M., J. Boulanger, G. Stenhouse, R.A. Powell, and M.J. Reynolds-Hogland. 2008. An evaluation of long-term capture effects in ursids: implications for wildlife welfare and research. Journal of Mammalogy 89:973–990.
Chruszcz, B., A.P. Clevenger, K. Gunson, and M. Gibeau. 2003. Relationships among grizzly bears, highways, and habitat in the Banff-Bow Valley, Alberta, Canada. Canadian Journal of Zoology 81:1378–1391.
Clevenger A.P., B. Chruszcz, and K.E. Gunson. 2003. Spatial patterns and factors in uencing small vertebrate fauna road-kill aggregations. Biological Conservation 109:15–26.
Clevenger, A. 2011. 15 years of Banff Research: What we’ve learned and why it’s important to transportation managers beyond park boundaries. Proceedings of the 2011 International

Baseline wildlife monitoring at I-90 Snoqualmie Pass East Literature Cited
Western Transportation Institute Page 129
Conference on Ecology and Transportation. Center for Transportation and the Environment, North Carolina State University, Raleigh, NC.
Clevenger, A.P., A.T. Ford, and M.A. Sawaya. 2009. Banff wildlife crossings project: Integrating science and education in restoring population connectivity across transportation corridors. Final report to Parks Canada Agency, Radium Hot Springs, British Columbia, Canada. 165 pp.
Clevenger, A.P., and M.P. Huijser. 2009. Handbook for design and evaluation of wildlife crossing structures in North America. Department of Transportation, Federal Highway Administration, Washington, D.C., USA.
Clevenger, A.P., and N. Waltho. 2000. Factors influencing the effectiveness of wildlife underpasses in Banff National Park, Alberta, Canada. Conservation Biology 14:47–56.
Clevenger, A.P., and N. Waltho. 2005. Performance indices to identify attributes of highway crossing structures facilitating movement of large mammals. Biological Conservation 121:453–464.
Clevenger, A.P., B. Chruszcz, and K. Gunson. 2001. Drainage culverts as habitat linkages and factors affecting passage by mammals. Journal of Applied Ecology 38:1340–1349.
Clevenger, A.P., Chruszcz, B., Gunson, K. 2001. Highway mitigation fencing reduces wildlife-vehicle collisions. Wildlife Society Bulletin 29:646–653.
Clevenger, A.P., Chruszcz, B., Gunson, K., J. Wierzchowski. 2002. Roads and wildlife in the Canadian Rocky Mountain Parks - Movements, mortality and mitigation. Final Report (October 2002). Report prepared for Parks Canada, Banff, Alberta.
Clevenger, A.P., R.A. Long, and R. Ament. 2008. I-90 Snoqualmie Pass East wildlife monitoring plan. Final report prepared for the Washington Department of Transportation.
Cochran, W.W. 1980. Wildlife telemetry. Pages 507–520 in S.D. Schemnitz, editor. Wildlife management techniques manual. The Wildlife Society, Washington, D. C.
Cramer, P. 2012. Determining wildlife use of wildlife crossing structures under different scenarios. Prepared For Utah Department of Transportation Research Division Submitted By Utah State University Department of Wildland Resources and Utah Transportation Center.
Cushman, S.A., K.S. McKelvey, J. Haydon, and M.K. Schwartz. 2006. Gene flow in complex landscapes: testing multiple hypotheses with causal models. The American Naturalist 168:486–499.
D'Eon, R. G., S.M. Glenn, I. Parfitt, and M.-J. Fortin. 2002. Landscape connectivity as a function of scale and organism vagility in a real forested landscape. Conservation Ecology 6:10.
Dodd, N.L., J.W. Gagnon, S. Boe, and R.E. Schweinsburg. 2007. Assessment of elk highway permeability by using global positioning system telemetry. Journal of Wildlife Management 71:1107–1117.
Ennis, S. and T. F. Gallagher. 1994. PCR based sex determination assay in cattle based on the bovine Amelogenin locus. Animal Genetics. 25:425–427.
Epps, C.W., P.J. Palsboll, J.D. Wehausen, G.K. Roderick, R.R. Ramry, II, and D.R.

Baseline wildlife monitoring at I-90 Snoqualmie Pass East Literature Cited
Western Transportation Institute Page 130
McCullough. 2005. Highways block gene flow and cause rapid decline in genetic diversity of desert bighorn sheep. Ecology Letters 8:1029–1038.
Evanno, G., S. Regnaut, and J. Goudet. 2005. Detecting the number of clusters of individuals using the software Structure: a simulation study. Molecular Ecology 14:2611–2620.
Fielding, A.H., and J.F. Bell. 1997. A review of methods for the assessment of prediction error in conservation presence/absence models. Environmental Conservation 24:38–49.
Finder, R.A., J.L. Roseberry, and A. Woolf. 1999. Site and landscape conditions at white-tailed deer/vehicle collision locations in Illinois. Landscape and Urban Planning 44:77–85.
Forman, R.T.T., and R.D. Deblinger. 2000. The ecological road-effect zone of a Massachusetts (USA) suburban highway. Conservation Biology 14:36–46.
Fryxell, J.M., J. Greever, and A.R.E. Sinclair. 1988. Why are migratory ungulates so abundant? The American Naturalist 131:781–798.
Gagnon, J. W., N. L. Dodd, K. S. Ogren, and R. E. Schweinsburg. 2011. Factors associated with use of wildlife underpasses and importance of long-term monitoring. Journal of Wildlife Management 75:1477–1487.
Gagnon, J.W., T.C. Theimer, N.L. Dodd, S. Boe, and R.E. Schweinsburg. 2007. Traffic volume alters elk distribution and highway crossings in Arizona. Journal of Wildlife Management 71:2318–2323.
Gauffre, B., A. Estoup, V. Bretagnolle, and J.F. Cosson. 2008. Spatial genetic structure of a small rodent in a heterogeneous landscape. Molecular Ecology 17:4619–4629.
Gomes, L., C. Grilo, C. Silva and A. Mira. 2009. Identi cation methods and deterministic factors of owl roadkill hotspot locations in Mediterranean landscapes. Ecological Research 24:355–370.
Goslee, S., and D. Urban. 2010. Ecodist: Dissimilarity-based analysis functions including ordination and Mantel test functions, intended for use with spatial and community data. R Foundation for Statistical Computing.
Groot Bruinderink, G., and E. Hazebroek. 1996. Ungulate traf c collisions in Europe. Conservation Biology 10:1059–1067.
Guillot, G., F. Mortier, and A. Estoup. 2005. Geneland: a computer package for landscape genetics. Molecular Ecology Notes 5:712–715.
Gunson, K.E., A.P. Clevenger, A.T. Ford, J.A. Bissonette, and A. Hardy. 2009. A comparison of data sets varying in spatial accuracy used to predict the occurrence of wildlife-vehicle collisions. Environmental Management 44:268–277.
Hansen, A.J., T. A. Spies, F. J. Swanson, and J. L. Ohmann. 1991. Conserving biodiversity in managed forests. BioScience 41:382–392.
Hardy, A.R. and M. P. Huijser. 2007. US 93 Preconstruction Wildlife Monitoring Field Methods Handbook. FHWA/MT-06-008/1744-2. Montana Department of Transportation, Helena, Montana.
Hardy, A.R., J. Fuller, M.P. Huijser, A. Kociolek and M. Evans. 2007. Evaluation of wildlife crossing structures and fencing on US Highway 93 Evaro to Polson–Phase I:

Baseline wildlife monitoring at I-90 Snoqualmie Pass East Literature Cited
Western Transportation Institute Page 131
preconstruction data collection and finalization of Evaluation Plan Final Report. FHWA/MT-06-008/1744-2. Montana Department of Transportation, Helena, Montana. 210 pp.
Hesse, S.G. 2006. Collisions with wildlife: An overview of major wildlife vehicle collision data collection systems in British Columbia and recommendations for the future. Wildlife Afield 3:3–7.
Holderegger, R., and H.H. Wagner. 2008. Landscape genetics. Bioscience 58:199–207.
Hubbard, M.W., B.J., Danielson, and R.A. Schmitz. 2000. Factors influencing the location of deer-vehicle accidents in Iowa. Journal of Wildlife Management 64:707–713.
Hubisz, M. J., D. Falush, M. Stephens, and J.K. Pritchard. 2009. Inferring weak population structure with the assistance of sample group information. Molecular Ecology Resources 9:1322–1332.
Huijser, M. P., A. V. Kociolek, L. Oechsli, D. E. Galarus, C. Science, and F. A. South. 2008. Wildlife Data Collection and Potential Highway Mitigation along State Highway 75 , Blaine County , Idaho By Montana State University A report prepared for the Board of Blaine County Commissioners.
Huijser, M.P., J. Fuller, M.E. Wagner, A. Hardy, and A.P. Clevenger. 2007. Animal-vehicle collision data collection. A synthesis of highway practice. NCHRP Synthesis 370. Project 20-05/Topic 37-12. Transportation Research Board of the National Academies, Washington DC.
Jaeger, J.A.G., J. Bowman, J. Brennan, L. Fahrig, D. Bert, J. Bouchard, N. Charbonneau, K. Frank, B. Gruber, and K. Tluk von Toschanowitz. 2005. Predicting when animal populations are at risk from roads: interactive model of road avoidance. Ecological Modeling 185:329–348.
Kalinowski S.T., A.P. Wagner, and M.L. Taper. 2006. ML-Relate: a computer program for maximum likelihood estimation of relatedness and relationship. Molecular Ecology Notes 6:576–579.
Kauhala, K., and P. Helle. 2000. The interactions of predator and hare populations in Finland—A study based on wildlife monitoring counts. Annales Zoologici Fennici 37:151–160.
Keller, B.J., and L.C. Bender. 2007. Bighorn sheep response to road-related disturbances in Rocky Mountain National Park, Colorado. Journal of Wildlife Management 71:2329–2337.
Kendall, K.C., and K.S. McKelvey. 2008. Hair collection. Pages 141–182 in Long, R.A., P. MacKay, W.J. Zielinski, and J.C. Ray, editors. Noninvasive survey methods for carnivores. Island Press, Washington, D.C.
Landguth, E.L., S.A. Cushman, M.K. Schwartz, K.S. McKelvey, M. Murphy, and G. Luikart. 2010. Quantifying the lag time to detect barriers in landscape genetics. Molecular Ecology 19:4179–4191.
Lee, T. 2007. Evaluating the contribution of citizen participation in research to understand wildlife movement across Highway 3 in Crowsnest Pass, Alberta. Thesis, University of Calgary, Alberta, Canada.

Baseline wildlife monitoring at I-90 Snoqualmie Pass East Literature Cited
Western Transportation Institute Page 132
Legendre, P., and L. Legendre. 1998. Numerical ecology. 2nd English edition. Elsevier, Amsterdam.
Lehmkuhl, J. F., L. Gould, E. Cazares, and D. Hosford. 2004. Truffle abundance and mycophagy by northern flying squirrels in eastern Washington forests. Forest Ecology and Management 200:49–65.
Lehmkuhl, J.F., K.D. Kistler, J.S. Begley, and J. Boulanger. 2006. Demography of northern flying squirrels informs ecosystem management of western interior forests. Ecological Applications 16:584–600.
Long, R.A., and W.J. Zielinski. 2008. Designing effective noninvasive carnivore surveys. Pages 8–44 in Long, R.A., P. MacKay, W.J. Zielinski, and J.C. Ray, editors. Noninvasive survey methods for carnivores. Island Press, Washington, DC, USA.
Long, R.A., P. MacKay, W.J. Zielinski, and J.C. Ray, editors. 2008. Noninvasive survey methods for carnivores. Island Press, Washington D.C.
Lyons, A.L.,W.L. Gaines, and C. Servheen. 2003. Black bear resource selection in the northeast Cascades, Washington. Biological Conservation 113:55– 62.
MacKay, P., D.A. Smith, R.A. Long, and M. Parker. 2008. Scat detection dogs. Pages 183–222 in R.A. Long, P. MacKay, W.J. Zielinski, and J.C. Ray, editors. Noninvasive survey methods for carnivores. Island Press, Washington, D.C., USA.
Manni, F., E. Guerard, and E. Heyer. 2004. Geographic patterns of (genetic, morphological, linguistic) variation: how barriers can be detected by using Monmonier’s algorithm. Human Biology 76:173–190.
Mantel, N. 1967. Detection of disease clustering and a generalized regression approach. Cancer Research 27:209–220.
Maser, C., Z. Maser, J.W. Witt, and G. Hunt. 1986. The northern flying squirrel - a mycophagist in southwestern Oregon. Canadian Journal of Zoology 64: 2086–2089.
McCoy, K. 2005. Effects of transportation and development on black bear movement, mortality, and use of the Highway 93 corridor in NW Montana. Thesis, University of Montana, Missoula, USA.
Ng, J.W., C. Nielson, and C.C. St. Clair. 2008. Landscape and traffic factors influencing deer–vehicle collisions in an urban environment. Human–Wildlife Con icts 2:34–47.
Nielsen C.K, R.G. Anderson R.G, and M.D. Grund. 2003. Landscape in uences on deer–vehicle accident areas in an urban environment. Journal of Wildlife Management 67:46–51.
Northrup, J.M., J. Pitt, T.B. Muhly, G.B. Stenhouse, M. Musiani, and M.S. Boyce. 2012. Vehicle traffic shapes grizzly bear behaviour on a multiple-use landscape. Journal of Applied Ecology 49:1159–1167.
Paul, K.J.S. 2007. Auditing a monitoring program: can citizen science document wildlife activity along highways? Thesis, University of Montana, Missoula, USA.
Pearce, J., and S. Ferrier. 2000. Evaluating the predictive performance of habitat models developed using logistic regression. Ecological Modelling 133:225–245.
Phillips, S.J., R.P. Anderson, and R.E. Schapire. 2006. Maximum entropy modeling of species

Baseline wildlife monitoring at I-90 Snoqualmie Pass East Literature Cited
Western Transportation Institute Page 133
geographic distributions. Ecological Modelling 190:231–259.
Powell, R.A., and G. Proulx. 2003. Trapping and marking terrestrial mammals for research: integrating ethics, performance criteria, techniques, and common sense. ILAR Journal, 44:259–276.
Pritchard, J.K., M. Stephens, and P. Donnelly. 2000. Inference of population structure using multilocus genotype data. Genetics 155:945–959.
Raymond, M., and F. Rousset. 1995. GENEPOP (version 1.2): population genetics software for exact tests and ecumenicism. Journal of Heredity 86:248–249.
Reed, D.F., and A.L. Ward. 1985. Efficacy of methods advocated to reduce deer-vehicle accidents: research and rationale in the lJSA. Pages 285–293 in Routes et faune sauvage. Service d'Etudes Techniques de Routes et Autoroutes, Bagneaux, France.
Reed, J. M., T. Boulinier, E. Danchin, and L.W. Oring. 1999. Informed dispersal: Prospecting by birds for breeding sites. Pages 189–259 in V. Nolan, Jr., E. D. Ketterson, and C. F. Thompson, editors. Current Ornithology, Vol. 15. Plenum Press, New York.
Reijnen, R. and R. Foppen. 1994. The effects of car traffic on breeding bird populations in woodland. I. Evidence of reduced habitat quality for willow warblers (Phylloscopus trochilus) breeding close to a highway. Journal of Applied Ecology 31:85–94.
Rice, W.R. 1989. Analyzing tables of statistical tests. Evolution 43:223–225.
Rodriguez, A., G. Crema, and M. Delibes. 1997. Factors affecting crossing of red foxes and wildcats through non-wildlife passages across a high-speed railway. Ecography 20:287–294.
Roedenbeck, I.A., L. Fahrig, C.S. Findlay, J.E. Houlahan, J.A.G. Jaeger, N. Klar, S. Kramer-Schadt, and E.A. van der Grift. 2007. The Rauischholzhausen agenda for road ecology. Ecology and Society 12:11.
Roger, E., and D. Ramp. 2009. Incorporating habitat use in models of fauna fatalities on roads. Diversity and Distributions 15:222–231.
Romin, L.A., and J.A. Bissonette. 1996. Temporal and spatial distribution of highway mortality of mule deer on newly constructed roads at Jordanelle Reservoir, Utah. Great Basin Naturalist 56:1–11.
Roon, D.A., M.E. Thomas, K.C. Kendall, and L.P. Waits. 2005. Evaluating mixed samples as a source of error in non-invasive genetic studies using microsatellites. Molecular Ecology 14:195–201.
Rousset, F. 1997. Genetic differentiation and estimation of gene flow from F-statistics under isolation by distance. Genetics 145:1219–1228.
Rousset, F. 2000. Genetic differentiation between individuals. Journal of Evolutionary Biology 13:58–62.
Rousset, F. 2008. Genepop’007: a complete re-implementation of the Genepop software for Windows and Linux. Molecular Ecology Resources 8:103–106.
Rowland, M.M., M.J. Wisdom, B.K. Johnson, and J.G. Kie. 2000. Elk distribution and modeling in relation to roads. Journal of Wildlife Management 64:672–684.
Baseline wildlife monitoring at I-90 Snoqualmie Pass East Literature Cited
Western Transportation Institute Page 134
Saeki M and D.W. MacDonald. 2003. The effects of traf c on the raccoon dog (Nyctereutes procyonoides viverrinus) and other mammals in Japan. Biological Conservation 118:559–571.
Sawyer, H., Kauffman, M.J. & Nielson, R.M. (2009) Influence of well pad activity on winter habitat selection patterns of mule deer. Journal of Wildlife Management 73:1052–1061.
Scheibe, J.S., W.P. Smith, J. Bassham, and D. Magness. 2006. Locomotor performance and cost of transport in the northern flying squirrel Glaucomys sabrinus. Acta Theriologica 51:169–178.
Seiler, A. 2004. Trends and spatial patterns in ungulate–vehicle collisions in Sweden. Wildlife Biology 10:301–313.
Selonen, V., and I.K. Hanski. 2004. Young flying squirrels (Pteromys volans) dispersing in fragmented forests. Behavioral Ecology 15:564–571.
Singleton, P.H., and J.F. Lehmkuhl. 2000. I-90 Snoqualmie Pass Wildlife Habitat Linkage Assessment. Final Report to the Washington State Department of Transportation GCA1177. USDA Forest Service Pacific Northwest Research Station. PNW-98-0513-CC.
Slater, F.M. 2002. An assessment of wildlife road casualties—the potential discrepancy between numbers counted and numbers killed. Web Ecology 3:33–42.
Slauson, K.M., W.J. Zielinski, and J.P. Hayes. 2007. Habitat selection by American martens in coastal California. Journal of Wildlife Management 71:458–468.
Smouse, P.E., J.C. Long, and R.R. Sokal. 1986. Multiple-regression and correlation extensions of the Mantel test of matrix correspondence. Systematic Zoology 35:627–632.
Sullivan, T.L., and T.A. Messmer. 2003. Perceptions of deer–vehicle collision management by state wildlife agency and department of transportation administrators. Wildlife Society Bulletin 31:163–173.
Sweanor, L.L., K.A.Logan, and M.G. Hornocker. 2000: Cougar dispersal patterns, metapopulation dynamics, and conservation. Conservation Biology 14:798–808.
Thomas, J.W, E.D. Forsman, J.B. Lint, E.C. Meslow, B.R. Noon, and J. Verner 1990. A conservation strategy for the northern spotted owl: a report to the Interagency Scientific Committee to address the conservation of the northern spotted owl. U.S. Forest Service, U.S. Fish and Wildlife Service, and National Park Service, Washington DC.
Trombulak, S.C., and C.A. Frissell. 2000. Review of ecological effects of roads on terrestrial and aquatic communities. Conservation Biology 14:18–30.
U.S. Naval Observatory. 2008–2012. Astronomical Applications Department, Washington D.C. Acquired 1 November 2012, URL: http://aa.usno.navy.mil/data/docs/RS_OneYear.php
Ulm, K. 1990. A simple method to calculate the confidence interval of a standardized mortality ratio. American Journal of Epidemiology 131:373–375.
van der Ree, R. 2006. Road upgrade in Victoria a filter to the movement of the endangered squirrel glider (Petaurus norfolcensis): results of a pilot study. Ecological Management & Restoration 7:226–228.

Baseline wildlife monitoring at I-90 Snoqualmie Pass East Literature Cited
Western Transportation Institute Page 135
van der Ree, R., S. Cesarini, P. Sunnucks, J.L. Moore, and A. Taylor. 2010. Large gaps in canopy reduce road crossing by a gliding mammal. Ecology and Society 15:35.
Vernes, K. 2001. Gliding performance of the northern flying squirrel (Glaucomys sabrinus) in mature mixed forest of eastern Canada. Journal of Mammalogy 82:1026–1033.
Wang, Y., Y. Lao, Y. Wu, and J. Corey. 2010. Identifying high risk locations of animal-vehicle collisions on Washington state highways.
Warren, D.L., R.E. Glor, and M. Turelli. 2010. ENMTools: a toolbox for comparative studies of environmental niche models. Ecography 33:607–611.
Weigl, P.D., R.S. Hughes, and D.C. Battle. 2002. Study of the northern flying squirrel populations along the Cherohala Skyway: questions of fragmentation and ecology in the southernmost part of the range. Final report to the North Carolina Department of Transportation and U.S. Fish and Wildlife Service. Wake Forest University, Winston-Salem, North Carolina.
Weir, B.S., and C.C. Cockerham. 1984. Estimating F-statistics for the analysis of population structure. Evolution 38:1358–1370.
Wells-Gosling, and L.R. Heaney. 1984. Glaucomys sabrinus. Mammalian Species 1–8.
White, K.R., G.M. Koehler, B.T. Maletzke and R.B. Wielgus. 2011. Differential prey use by male and female cougars in Washington. Journal of Wildlife Management 75:1115–1120.
Whittington, J., C.C. St. Clair, and G. Mercer. 2004. Path tortuosity and the permeability of roads and trails to wolf movement. Ecology and Society 9:4.
Wielgus, R.B., Vernier, P.R. and T. Schivatcheva. 2002. Grizzly bear use of open, closed, and restricted forestry roads. Canadian Journal of Forest Research 32:1597–1606.
Wisdom, M.J., N.J. Cimon, B.K. Johnson, E.O. Garton, and J.W. Thomas. 2005. Spatial partitioning by mule deer and elk in relation to traffic. Pages 53–66 in M. J. Wisdom, editor. The Starkey Project: a synthesis of long-term studies of elk and mule deer. Reprinted from the 2004 Transactions of the North American Wildlife and Natural Resources Conference, Alliance Communications Group, Lawrence, Kansas, USA.
Worton, B.J. 1989. Kernel methods for estimating the utilization distribution in home-range studies. Ecology 70:164–168.
WSDOT. 2006. Recommendation package: Interstate 90 Snoqualmie Pass East mitigation development team. Washington State Department of Transportation, Yakima, WA. July 2006.
WSDOT. 2008. I-90 Snoqualmie Pass East Final Environmental Impact Statement and Section 4(f) Evaluation.
WSDOT. 2011. 2011 Annual Traffic Report. [online] URL: http://www.wsdot.wa.gov/mapsdata/travel/annualtrafficreport.htm
Yanes, M., J.M. Velasco, and F. Suarez. 1995. Permeability of roads and railways to vertebrates: the importance of culverts. Biological Conservation 71:217–222.

Baseline wildlife monitoring at I-90 Snoqualmie Pass East Appendices
Western Transportation Institute Page 136
Appendices

Baseline wildlife monitoring at I-90 Snoqualmie Pass East Appendices
Western Transportation Institute Page 137
Appendix 1.1. Common and scientific names of species mentioned in this report. Names are listed in alphabetical order and were taken from the Smithsonian National Museum of Natural History North American Mammals website (http://www.mnh.si.edu/mna/main.cfm). Mammals American black bear (Ursus americanus) American marten (Martes americana) Bobcat (Lynx rufus) Bushy-tailed woodrat (Neotoma cinerea occidentalis) Canada lynx (Lynx canadensis) Cougar (Puma concolor) Coyote (Canis latrans) Deermouse (North American) (Peromyscus maniculatus) Elk (Cervus elaphus) Fisher (Martes pennanti) Gray wolf (Canis lupus) Grizzly bear (Ursus arctos) Long-tailed weasel (Mustela frenata) Montane shrews (Sorex monticolus) Mountain beaver (Aplodontia rufa) Mountain goat (Oreamnos americanus) Mule deer (Odocoileus hemionus) Northern flying squirrel (Glaucomys sabrinus) Northwestern (Keen’s) deermouse (Peromyscus keeni) Pika (Ochotona princeps) Porcupine (Erethizon dorsatum) Raccoon (Procyon lotor) Red-backed vole (Clethrionomys rutilus) River otter (Lutra canadensis) Short-tailed weasel (ermine; Mustela erminea) Snowshoe hare (Lepus americanus) Townsend’s chipmunk (Neotamias townsendii) Trowbridge’s shrew (Sorex trowbridgii) Vagrant shrew (Sorex vagrans). Voles (Microtus spp.) Wolverine (Gulo gulo) Birds American dipper (Cinclus mexicanus) Canada goose (Branta canadensis) Northern spotted owl (Strix occidentalis caurina)

Baseline wildlife monitoring at I-90 Snoqualmie Pass East Appendices
Western Transportation Institute Page 138
Appendix 2.1. Summary report from Year 1 I-90 Wildlife Watch project. Note that internal table of contents and pages for figures and tables does not agree with pagination in this larger document.
I-90 Wildlife Watch: A Summary Report of
Year 1 Results November 2010–November 2011
Prepared by:
Paula MacKay Robert Long
James Begley
Western Transportation Institute Montana State University
Ellensburg, Washington Field Office 509-933-1340
February, 2012
Project partners: I-90 Wildlife Bridges Coaltion, Washington State Department of Transportation, Washington Department of Fish and Wildlife, U.S. Forest Service, and U.S. Fish & Wildlife Service.
Visit: www.i90wildlifewatch.org
Baseline wildlife monitoring at I-90 Snoqualmie Pass East Appendices
Western Transportation Institute Page 139
Table of Contents Acknowledgments..........................................................................................................3 I-90 Wildlife Watch Partners .........................................................................................4 Friends of I-90 Wildlife Watch ......................................................................................4 List of Tables and Figures..............................................................................................5 Executive Summary .......................................................................................................7 Background ....................................................................................................................8
Wildlife Monitoring at I-90 Snoqualmie Pass East ...........................................9 The I-90 Wildlife Watch Website ....................................................................11
Control Area versus I-90 SPE Project Area .........................................13 Volunteers ............................................................................................13 Outreach .......................................................................................................................14
Building Project Identity ..................................................................................14 Media Communications ...................................................................................15 Volunteer Recruitment .....................................................................................16 Billboard ..........................................................................................................16 Print Materials ..................................................................................................16
Results and Discussion ................................................................................................17 Wildlife Reports ...............................................................................................19 Control Area versus I-90 Snoqualmie Pass East Project Area ........................26 Volunteer Data .................................................................................................27
Conclusion ...................................................................................................................28 References ....................................................................................................................29 Appendix 1 ...................................................................................................................30

Baseline wildlife monitoring at I-90 Snoqualmie Pass East Appendices
Western Transportation Institute Page 140
Acknowledgments
The authors would like to thank the I-90 Wildlife Bridges Coalition (specifically Jen Watkins and Charlie Raines) for their co-leadership of this project; the Washington Department of Fish and Wildlife’s Aquatic Land Enhancement Account program for providing the critical funding necessary to initiate I-90 Wildlife Watch; and the TransWild Alliance for additional grant support. We also appreciate the support of our other project partners: the Washington State Department of Transportation (WSDOT), the U.S. Forest Service (USFS), and the U.S. Fish & Wildlife Service (USFWS). We are grateful to Doug Galarus, Kelvin Bateman, and Daniel Richter of the Western Transportation Institute (WTI) for their efforts in developing the interactive database for I-90 Wildlife Watch, and to WTI’s Marcel Huijser, Angela Kociolek, Rob Ament, and Jeralyn Brodowy for their helpful input and assistance. We thank Ron Rundus (jackfig design, Seattle) for designing the gateway page for the website, and Eric Snider (WSDOT) for creating our identity package, billboards, and other outreach materials. We appreciate Amanda Sullivan’s (PRR, Seattle) outreach efforts as well. Thanks to Paige Singer at I-70 Wildlife Watch/Rocky Mountain Wild for sharing lessons learned (and the project name!), and to other model programs (I-Spy at Bozeman Pass; State Highway 75 in Blaine County, Idaho; Road Watch in the Pass [The Mistakis Institute]) for valuable guidance. We also appreciate the assistance provided by the following individuals: Craig Broadhead (WSDOT) Jodi Broughton (Conservation Northwest) Jeff Buzas (University of Vermont) Tom Cottrell (Central Washington University) Patty Garvey-Darda (USFS) Karl Halupka (USFWS) Meagan McFadden (WSDOT) William Meyer (WDFW) Josh Nichols (WDFW) Anthony Novack (WDFW) Kylie Paul Trisha White (Defenders of Wildlife) We are indebted to the several volunteers (you know who you are!) who reported their wildlife sightings and lack of sightings during their regular commutes along I-90. Last but not least, we thank the many anonymous travelers who reported their wildlife observations on the I-90 Wildlife Watch website. Without your participation, this program would not be possible.

Baseline wildlife monitoring at I-
Western Transportation Institute
I
I-90 Wildlife Watch is a collaborative project of the following entities:
Friends of I
The organizations listed below are official endorse the program’s mission and help advance its visibility.
Cascade Land Conservancy Central Washington University Conservation Northwest Defenders of Wildlife Freedom to Roam Grizzly Bear Outreach Project The Humane Society of the United States Mountains to Sound Greenway Smithsonian Institution National Museum of Natural History Western Environmental Law Center The Wilderness Society TransWild Alliance
Baseline wildlife monitoring at I-90 Snoqualmie Pass East
I-90 Wildlife Watch Partners
90 Wildlife Watch is a collaborative project of the following entities:
Friends of I-90 Wildlife Watch
The organizations listed below are official Friends of I-90Wildlife Watch, which means that they endorse the program’s mission and help advance its visibility.
Society of the United States
Smithsonian Institution National Museum of Natural History Western Environmental Law Center
Appendices
Page 141
, which means that they

Baseline wildlife monitoring at I-90 Snoqualmie Pass East Appendices
Western Transportation Institute Page 142
List of Tables, Figures, and Boxes
Tables Table 1. Top 10 Washington cities from which website visits were documented ....................... 18 Table 2. Summary of live and dead individuals reported by species group ................................ 19 Table 3. Number of reported live and dead mammals ................................................................. 22 Figures Figure 1. Washington’s North Cascades Ecosystem ..................................................................... 8 Figure 2. A coyote killed by a vehicle on I-90 .............................................................................. 9 Figure 3. Visual concept of a wildlife crossing structure near I-90 Snoqualmie Pass East ........... 9 Figure 4. Map of 15-mile stretch of I-90 between Hyak and Easton ........................................... 10 Figure 5. The gateway page from the I-90 Wildlife Watch website ............................................ 11
Figures 6. The observation form from the I-90 Wildlife Watch website..................................... 12 Figures 7. The locator map from the I-90 Wildlife Watch website ............................................. 12 Figure 8. Website interface allowing visitors to view observations by other travelers ............... 13 Figure 9. Logo and banner from I-90 Wildlife Watch website.................................................... 14 Figure 10. The I-90 Wildlife Watch business card, featuring an American marten and other
branding elements ............................................................................................................ 14 Figure 11. I-90 Wildlife Watch billboard on I-90 near Cle Elum .............................................. 16 Figure 12. I-90 Wildlife Watch poster ......................................................................................... 17 Figure 13. Number of visits to the I-90 Wildlife Watch website and number of wildlife reports
during Year 1 ................................................................................................................... 18 Figure 14. Locations of Washington-based visitors to the I-90 Wildlife Watch website ............ 19

Baseline wildlife monitoring at I-90 Snoqualmie Pass East Appendices
Western Transportation Institute Page 143
Figure 15. Locations of live and dead wildlife reports (excluding live bird sightings) across the I-90 Wildlife Watch area ................................................................................................. 20 Figure 16. Number of individual animals (excluding deer and elk—see Fig. 17) reported by
species or species group ................................................................................................... 21 Figure 17. Number of reported deer and elk ............................................................................... 21 Figure 18. Locations of dead wildlife reports in the western portion of the survey area ............ 23 Figure 19. Locations of dead wildlife reports in the eastern portion of the survey area ............. 24 Figure 20. Actual rates of wildlife reports (reports/mile) of dead and live animals (excluding live
birds) for the control area (North Bend to Hyak) and I-90 SPE project area (Hyak to Easton) ............................................................................................................................ 26
Figure 21. Poisson-based estimates and 95% confidence intervals for the number of live and
dead wildlife individuals (excluding live birds and duplicates) per mile for the control area (North Bend to Hyak) and the I-90 SPE project area (Hyak to Easton) .................. 27
Figure 22. Visibility conditions under which observations were made ....................................... 27 Boxes Box 1. Examples of media promoting I-90 Wildlife Watch ........................................................ 15 Box 2. Examples of comments submitted with wildlife reports ................................................. 25

Baseline wildlife monitoring at I-90 Snoqualmie Pass East Appendices
Western Transportation Institute Page 144
Executive Summary
Washington’s North Cascades Ecosystem (NCE) provides invaluable habitat for wildlife. Landscape-scale habitat connectivity is a critical component of wildlife conservation, with the permeability of road networks and other human development affecting the ability of animals to move and disperse. Interstate 90 (I-90) crosses the NCE at Snoqualmie Pass, where increasing traffic volumes currently average 28,000 vehicles per day. This busy transportation corridor bisects an important link in the north-south movement of wildlife in the Cascades. Washington’s Department of Transportation (WSDOT) is committed to enhancing ecological connectivity in the I-90 Snoqualmie Pass East (SPE) region, and plans to construct 24 wildlife crossing structures along the 15-mile stretch of highway between Hyak and Easton over the next several years. Coupled with wildlife fencing, these structures are intended to facilitate the safe passage of wildlife through the area. Since 2007, researchers from the Western Transportation Institute (WTI) have been conducting pre-construction wildlife monitoring in the I-90 SPE area such that the effectiveness of the wildlife crossing structures and fencing can ultimately be evaluated. As a complement to these efforts, I-90 Wildlife Watch was launched in late 2010 to engage the public in wildlife monitoring at I-90 SPE. More specifically, motorists are encouraged to report sightings of living and road-killed wildlife on an interactive website developed by WTI. Website visitors can also view observations reported by other travelers. This program, which represents an innovative collaboration between WTI, the I-90 Wildlife Bridges Coalition, WSDOT, and other agency partners, is providing additional baseline data and promoting public participation in regional wildlife/roads issues. The total survey area for I-90 Wildlife Watch is 41 miles, including the 15-mile section of highway between Hyak and Easton (i.e., the I-90 SPE project area), and the 26-mile stretch from Hyak west to North Bend. The latter section serves as a control area for the I-90 Wildlife Watch program. This report summarizes Year 1 outcomes for I-90 Wildlife Watch. In its first 12 months, the website received 6,821 visits from all 50 states in the U.S.A. and 29 other countries. The vast majority of visits (83%) originated in Washington. Visitors reported 240 valid (i.e., presumed authentic) wildlife sightings made in the survey area during Year 1, comprising a total of 529 live and dead animals. Sightings included both mammals and birds, with ungulates (i.e., deer and elk) dominating the mammals list. Of 475 mammals reported, 423 were alive and 52 were dead. The number of reports of live and dead animals in the control area (North Bend to Hyak) and the I-90 SPE project area (Hyak to Easton), respectively, were similar after removing live bird sightings and adjusting for differences in the length of the respective highway sections. The estimate of the number of live animals along the highway in the SPE project area was higher than in the control area, but estimates of the number of dead animals were similar between areas.

Baseline wildlife monitoring at I-90 Snoqualmie Pass East Appendices
Western Transportation Institute Page 145
Background
The North Cascades Ecosystem (NCE) comprises 24,800 km2 in Washington, with an additional 10,350 km2 extending north into British Columbia. In the U.S., 90% of the NCE is managed by the U.S. Forest Service, the U.S. National Park Service, and the State of Washington (Fig. 1). This large network of wildlands provides valuable habitat for wildlife—including rare species such as gray wolves, Canada lynx, and wolverines (Gaines et al. 2000).
Figure 1. Washington’s North Cascades Ecosystem.

Baseline wildlife monitoring at I-90 Snoqualmie Pass East Appendices
Western Transportation Institute Page 146
Habitat connectivity allows wildlife to move freely across the landscape in search of food, mates, and other resources. Transportation corridors characterized by high road densities and substantial vehicle traffic can result in “fracture zones” that are detrimental to wildlife because they increase mortality and inhibit natural patterns of animal movement (Mace et al. 1996, Noss et al. 1996, Riley et al. 2006) (Fig. 2). This scenario may become especially problematic in the context of climate change, which will require large geographical shifts for certain wildlife populations (Parmesan 2006).
Figure 2. A coyote killed by a vehicle on I-90. Credit: Robert Long/WTI.
Wildlife Monitoring at I-90 Snoqualmie Pass East In Washington, Interstate 90 (I-90) crosses the NCE at Snoqualmie Pass, where traffic volumes average 28,000 vehicles per day and are increasing by ~2.1% per year (WSDOT 2008). I-90 bisects an important link in the north-south movement of wildlife in the Cascades (Singleton et al. 2002, Shirk 2009). As part of a major highway improvement project, the Washington State Department of Transportation (WSDOT) is committed to enhancing ecological connectivity in I-90’s Snoqualmie Pass East (SPE) region, and has begun construction on the first 3 of 24 wildlife crossing structures planned for the 15-mile stretch between Hyak and Easton (Figs. 3, 4).
Figure 3. Visual concept of a wildlife crossing structure near I-90 Snoqualmie Pass East. Credit: WSDOT

Baseline wildlife monitoring at I-90 Snoqualmie Pass East Appendices
Western Transportation Institute Page 147
Figure 4. Map of 15-mile stretch of I-90 between Hyak and Easton.

Baseline wildlife monitoring at I-90 Snoqualmie Pass East Appendices
Western Transportation Institute Page 148
Since 2007, researchers at the Western Transportation Institute (WTI) have been using remote cameras and other wildlife survey methods to gather pre-construction baseline data on wildlife movement in the I-90 SPE area such that the effectiveness of future crossing structures and associated wildlife fencing can be evaluated (Fig. 4). We also collaborate with WSDOT maintenance personnel to compile roadkill data with the Roadkill Observation Data Collection System (ROCS) designed by WTI. In 2010, I-90 Wildlife Watch was initiated to complement WTI’s existing monitoring efforts, as well as other citizen-based and academic monitoring programs at I-90 SPE. This program, which represents an innovative partnership between WTI, the I-90 Wildlife Bridges Coalition, WSDOT, and other agency partners, is providing additional baseline data and promoting public participation in wildlife/roads issues. In summary, the objectives of I-90 WILDLIFE WATCH are to:
1. engage citizens in wildlife monitoring at I-90 SPE; 2. inform planning for wildlife crossing structures and fencing at I-90 SPE; 3. provide additional baseline data for the future evaluation of crossing structure
performance at I-90 SPE; 4. contribute to rare species management in the NCE; 5. serve as a model project for other regions.
The I-90 Wildlife Watch Website To bring I-90 Wildlife Watch to fruition, WTI developed a website-based database (www.i90wildlifewatch.org) that allows citizens to report sightings of roadkill and live animals in the I-90 SPE area (Fig. 5). Observers can choose to remain anonymous. WTI had previously developed websites for similar citizen-based monitoring programs in 3 other regions (Blaine Country, Idaho; I-70 in Colorado; Bozeman Pass, Montana). The I-90 Wildlife Watch website includes a brief observation form (Fig. 6) intended to capture sighting information, and a detailed locator map that enables visitors to pinpoint sighting locations and to view observations from other observers (Figs. 7, 8).

Baseline wildlife monitoring at I-90 Snoqualmie Pass East Appendices
Western Transportation Institute Page 149
Figure 5. The gateway page from the I-90 Wildlife Watch website.
Figures 6. The observation form from the I-90 Wildlife Watch website.

Baseline wildlife monitoring at I-90 Snoqualmie Pass East Appendices
Western Transportation Institute Page 150
Figures 7. The locator map from the I-90 Wildlife Watch website.

Baseline wildlife monitoring at I-90 Snoqualmie Pass East Appendices
Western Transportation Institute Page 151
Figure 8. Website interface allowing visitors to view observations (in this case, of deer) reported by other travelers. Green markers indicated live animals; red markers indicate roadkill.
Control Area versus I-90 SPE Project Area. One of our objectives is to provide additional baseline data for evaluating the effectiveness of future crossing structures and fencing at reducing roadkill between Hyak and Easton. When attempting to evaluate change, it is beneficial to include a comparative stretch of highway to serve as a control area. Such controls permit stronger conclusions because they can help to identify broader patterns of change that might confound interpretations if results are taken only from the project area. For example, if deer roadkill rates decrease by 95% after crossing structures are installed, how can we be sure that this trend isn’t due to a decline in deer populations throughout the region? I-90 Wildlife Watch includes the 26-mile section of I-90 (Hyak to North Bend) immediately west of the I-90 SPE project area to serve as a control area. The total survey area for I-90 Wildlife Watch is 41 miles. Volunteers. Citizen reporting programs often find it challenging to quantify the amount of survey effort expended. Without such effort estimates, it is difficult to compare among different time periods or locations. Because we are interested in collecting baseline data that will be useful for comparing rates of live and dead wildlife along I-90 SPE before and after wildlife crossing structures and fencing are installed, we explored a data collection approach that would permit statistical comparisons between time periods. More specifically, we recruited several volunteers who drove I-90 on a consistent basis (i.e., 1–2 times per week) to report their wildlife observations. In addition to reporting live and dead wildlife, these volunteers also recorded trips during which they saw no wildlife. Volunteer observations of alive and dead individuals were

Baseline wildlife monitoring at I-90 Snoqualmie Pass East Appendices
Western Transportation Institute Page 152
modeled with a Poisson distribution and used to calculate Bayesian estimates of individual observation rates and associated confidence intervals for volunteers driving the survey route. Estimated rates can potentially be compared with similarly collected, post-construction rates.
Outreach
Numerous strategies were employed to inform motorists about the launch of I-90 Wildlife Watch, and to increase public awareness about the program throughout its first year. The results of these efforts are described in the Results section of this report. Outreach methods are summarized briefly below.
Building Project Identity During website development, we contracted an independent graphic designer to design the gateway page, and to establish the site’s style, color scheme, logo, and banner (Fig. 9). We then provided these elements to the technical development team at WTI such that the website would have a consistent look and feel throughout.
Figure 9. Logo and banner from I-90 Wildlife Watch website. Soon after the project was launched, we further developed the identity package for I-90 Wildlife Watch. Key features were incorporated into all outreach materials. The American marten was selected as a charismatic wildlife ambassador to help brand the program (Fig. 10.)
Figure 10. The I-90 Wildlife Watch business card, featuring an American marten and other branding elements.

Baseline wildlife monitoring at I-90 Snoqualmie Pass East Appendices
Western Transportation Institute Page 153
Media Communications
To officially launch I-90 Wildlife Watch, we distributed a press release to regional media outlets. We selected a launch date of November 4, 2010, to coincide with “Give Wildlife A Brake” week—a national campaign coordinated by the Humane Society of the United States. The story was picked-up by numerous media outlets, including the Seattle Times (Box 1). Announcements were also posted on partner websites and blogs, and the program was profiled in various other electronic venues as well (Box 1).
Box 1. Examples of media promoting I-90 Wildlife Watch
Press release: New project is launched to document wildlife sightings along I-90 November 4, 2010
Drivers encouraged to report wildlife on I-90 over Snoqualmie Pass Seattle Times, November 4, 2010 New website lets drivers track wildlife along stretch of I-90 Seattle Times, November 6, 2010
I-90 Wildlife Watch KOMOnews.com (radio), November 6, 2010
New web site tracks I-90 roadkill TechFlash, November 8, 2010
Heading over I-90 Snoqualmie Pass? Keep your eyes peeled for critters big or small WSDOT Blog, November 10, 2010 Wildlife sightings wanted from drivers on I-90 Northwest Public Radio, November 22, 2010
Help map wildlife crossings as you drive I-90 east of Snoqualmie in WA National Geographic Global Action Atlas, March 2011 Watching for wildlife on I-90 Fall City Newsletter, April 2011 (page 4) I-90 project to ease flow of traffic, wildlife east of Snoqualmie Pass Seattle Times, July 7, 2011 Volunteers keep eye on wildlife along Interstate 90 Ellensburg Daily Record, July 26, 2011

Baseline wildlife monitoring at I-90 Snoqualmie Pass East Appendices
Western Transportation Institute Page 154
We made periodic efforts to update media contacts throughout the Spring, and a second press release was distributed in July, 2011. Meanwhile, in March 2011, we broadly circulated an article about I-90 Wildlife Watch to regional newsletters, several of which published the piece (Box 1). Also in March, Defenders of Wildlife circulated an action alert to its Washington-based members. During late Summer/Fall 2011, we ran 42 PSAs on Northwest Public Radio. And an ongoing blog on the I-90 Wildlife Watch website allowed us to share periodic news with visitors. Volunteer Recruitment Volunteer commuters (see Volunteers above) were recruited by a variety of means. For example, Conservation Northwest, the umbrella organization for the I-90 Wildlife Bridges Coalition, circulated an announcement to its members. WTI notified contacts and project partners, who were asked to help spread the word. We posted flyers at a few targeted locations, and placed free ads in regional newspapers and on Craigslist. Lastly, we placed a recruitment “button” on the gateway page of the website. Once selected, volunteers were trained in how to use the volunteer interface of the website via a 1-hour telephone training with WTI personnel. Billboard In early March 2010, we leased a billboard (Fig. 11) on the westbound side of I-90 in Cle Elum, approximately 12 miles east of the project area. This high-profile billboard, which remains in place as of the date of this report, is within easy view of all motorists traveling toward Snoqualmie Pass from eastern Washington.
Figure 11. I-90 Wildlife Watch billboard on I-90 near Cle Elum. Credit: P. MacKay/WTI

Baseline wildlife monitoring at I-90 Snoqualmie Pass East Appendices
Western Transportation Institute Page 155
Print Materials Dozens of I-90 Wildlife Watch posters (Fig. 12) were hung on public bulletin boards along the I-90 corridor in eastern and western Washington, and in the greater Seattle area. I-90 Wildlife Watch business cards (Fig. 10) were also displayed at public venues and regional conferences. Finally, WSDOT incorporated I-90 Wildlife Watch into its displays at select rest areas.
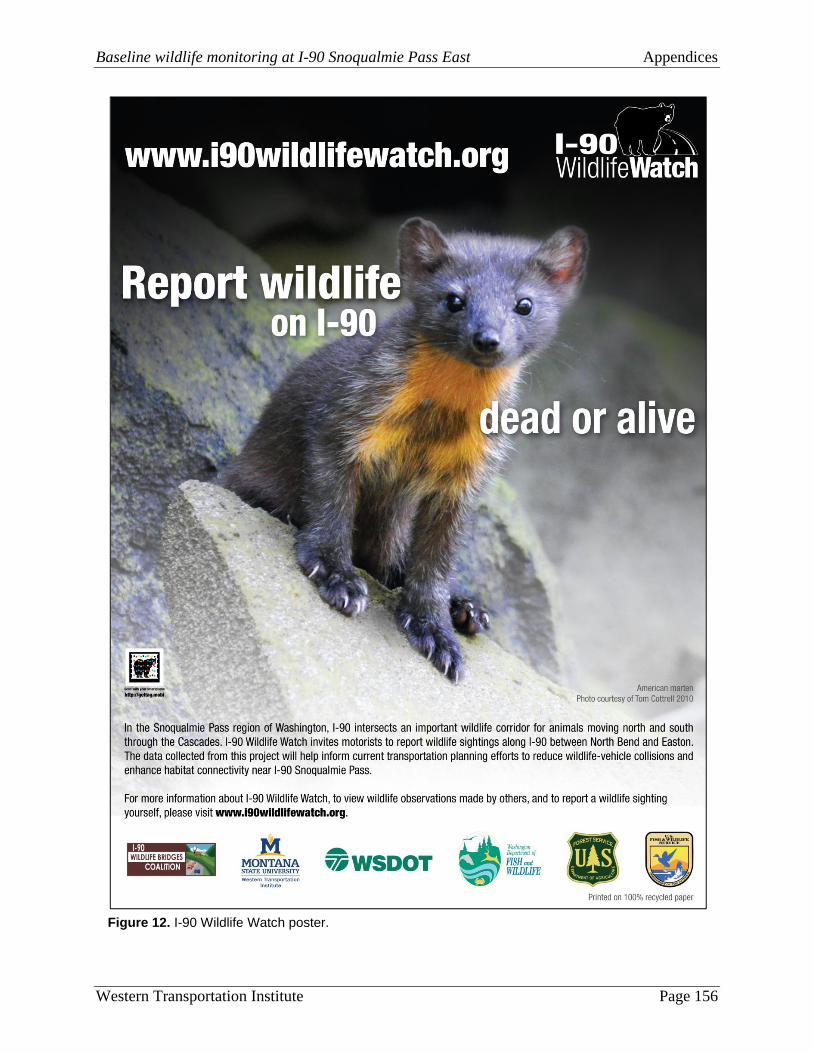
Baseline wildlife monitoring at I-90 Snoqualmie Pass East Appendices
Western Transportation Institute Page 156
Figure 12. I-90 Wildlife Watch poster.

Baseline wildlife monitoring at I-90 Snoqualmie Pass East Appendices
Western Transportation Institute Page 157
Results and Discussion
Google Analytics indicated that there were 6,821 visits to the I-90 Wildlife Watch website between November 4, 2010 and November 4, 2011—including visits by 5,352 unique visitors. Site visitation was highest immediately after the program launched (Fig. 13), and spiked again with outreach boosts in March and July, 2011.
Figure 13. Number of visits to the I-90 Wildlife Watch website (blue) and wildlife reports (red) in Year 1.
Visits were reported from all 50 states of the U.S.A. and 29 other countries, with 5,627 visits (~83%) originating in Washington. Of Washington visits, ~25% were made from Seattle (Table 1). The remaining 75% of Washington visits were made from locations across the state (Fig. 14). Table 1. Top 10 Washington cities from which website visits were documented. Source: Google Analytics City Visits % Visits Seattle 1,697 24.88% Bellevue 418 6.13% Spokane 307 4.50% Ellensburg 242 3.55% Kirkland 212 3.11% Redmond 210 3.08% Olympia 166 2.43% Lynnwood 154 2.26% Yakima 151 2.21% Renton 134 1.96%
0
10
20
30
40
50
60
70
80
90
100
0
20
40
60
80
100
120
140
160
180
200
Num
ber o
f wild
life
repo
rts
Num
ber o
f web
site
hits
Site Visits
Reports
Launch Defenders of Wildlife action alert
Seattle Times article
Max value = 2,052

Baseline wildlife monitoring at I-90 Snoqualmie Pass East Appendices
Western Transportation Institute Page 158
Figure 14. Locations of Washington-based visitors to the I-90 Wildlife Watch website. Source: Google Analytics
Wildlife Reports The I-90 Wildlife Watch website received 268 reports during Year 1. Of these, 9 were sightings made prior to the project’s launch, 7 were made outside of the survey area, and 12 were deemed fraudulent or otherwise invalid (e.g., Bigfoot, John Deere). Thus, we received a total of 240 valid reports of live and dead wildlife sighted between North Bend and Easton in the first 12 months of the program (Fig. 15). Note that many sightings included multiple individuals of the same species (e.g., deer). For some analyses, it was important to identify reports that were likely duplicates (i.e., 2 or more reports of the same sighting). We assumed that any 2 reports of live individuals were duplicates if their locations were 0.2 mile apart and they occurred within 2 hours of each other. Similarly, we assumed dead reports were duplicates if the locations were 0.2 mile apart and they occurred within 48 hours of each other. Applying these rules, we eliminated 2 reports of live animals (4 individuals), and 9 reports of dead animals (9 individuals). After an initial spike in reports following the program launch, relatively few reports were recorded during Winter 2010–2011 (Fig. 13). Reporting rates increased during Spring 2011, and were highest during late-Spring and Summer 2011 (Fig. 13). This trend generally corresponds with the period during which ungulates are most prevalent throughout the project area, although outreach efforts in March may have helped to increase the number of reports logged in the Spring (Fig. 13). Mammals and birds were the only species groups reported, and reports of live animals greatly outnumbered reports of dead animals (Table 2).

Baseline wildlife monitoring at I-90 Snoqualmie Pass East Appendices
Western Transportation Institute Page 159
Table 2. Summary of live and dead individuals reported by species group (i.e., mammals, raptors, other birds, unknown group). Alive Dead Total Mammals 423 52 475 Raptors 19 6 25 Other birds 23 4 27 Unknown 0 2 2 Total 465 64 5

Baseline wildlife monitoring at I-90 Snoqualmie Pass East Appendices
Western Transportation Institute Page 160
Figure 15. Locations of live and dead wildlife reports (excluding live bird sightings) across the I-90 Wildlife Watch area.
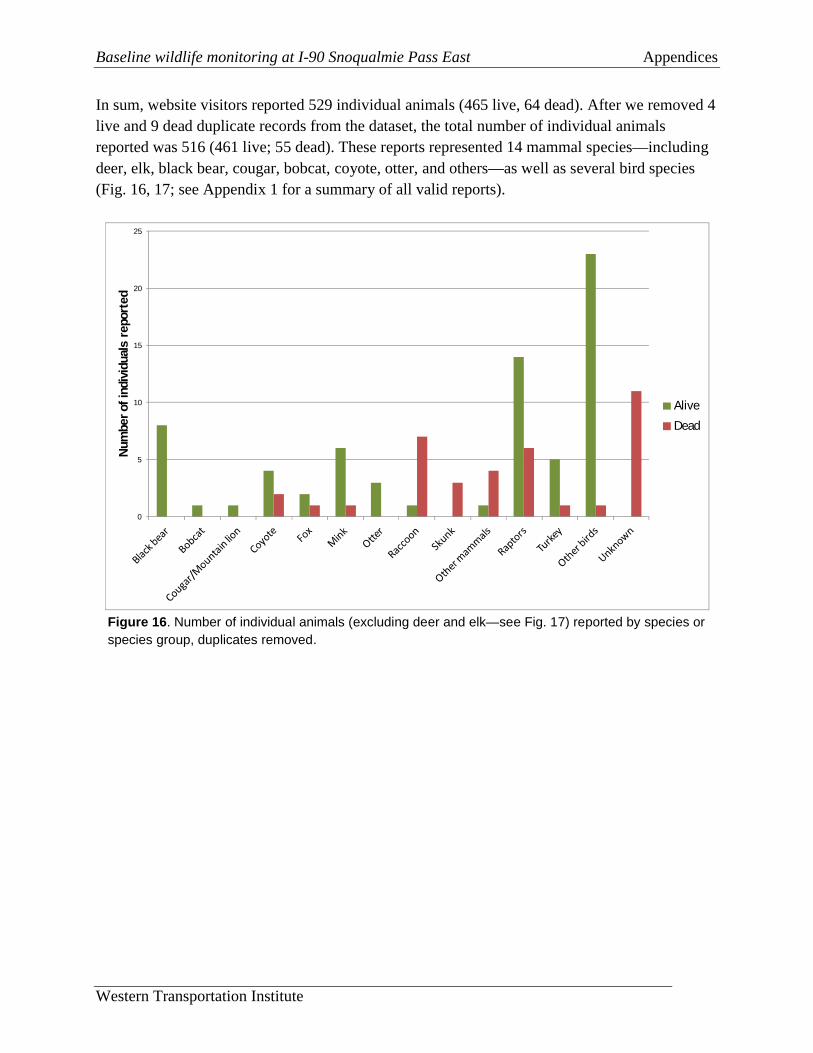
Baseline wildlife monitoring at I-90 Snoqualmie Pass East Appendices
Western Transportation Institute
In sum, website visitors reported 529 individual animals (465 live, 64 dead). After we removed 4 live and 9 dead duplicate records from the dataset, the total number of individual animals reported was 516 (461 live; 55 dead). These reports represented 14 mammal species—including deer, elk, black bear, cougar, bobcat, coyote, otter, and others—as well as several bird species (Fig. 16, 17; see Appendix 1 for a summary of all valid reports).
Figure 16. Number of individual animals (excluding deer and elk—see Fig. 17) reported by species or species group, duplicates removed.
0
5
10
15
20
25
Num
ber o
f ind
ivid
uals
repo
rted
Alive
Dead

Baseline wildlife monitoring at I-90 Snoqualmie Pass East Appendices
Western Transportation Institute
Figure 17. Number of reported deer and elk (duplicates removed).
Excluding live birds and duplicate reports, which we omitted from these analyses, most live animal sightings were clustered along the valley from North Bend east to about Exit 45 near the Bandera State Airport, and from Exit 63 (Cabin Creek) east to Easton. Another cluster occurred near Keechelus Lake dam. Excluding duplicates, a total of 55 dead animals were recorded throughout the survey area, yielding an estimated rate of 1.34 individuals/mile (95% CI = 0.99–1.69) (Figs. 18, 19). Given the large survey area, our small sample size makes it difficult to draw any strong conclusions about hotspots for wildlife-vehicle collisions. In general, however, there were 2 regions where roadkill were recorded in the highest numbers: (1) the broad, relatively low elevation area east of North Bend, near the convergence of the Middle and South Forks of the Snoqualmie River; and (2) an area at the lowest elevation point east of Snoqualmie Pass extending from Easton Lake to the end of the project area near the town of Easton. Multiple species, including coyote, porcupine, and deer, were reported in both areas. Dead elk were reported only in the area east of North Bend, and skunks were reported only in the Easton location. We stress again, however, that small sample sizes make it impossible to make any solid inferences from these observations. In the mammals group, the respective numbers of dead ungulates (deer and elk) and carnivores reported were almost equal (Table 3), while ungulates represented the majority (85%) of live mammal sightings. This would be expected given that ungulates congregate in groups, whereas carnivores are often solitary or occur in smaller groups. Further, carnivores tend to be more wary, and presumably spend less time near the roadway and behave more elusively when they do approach it. All dead carnivores reported were mesocarnivores (as opposed to large carnivores
85
307
13 50
50
100
150
200
250
300
350
Deer Elk
Num
ber o
f ind
ivid
uals
repo
rted
Alive
Dead

Baseline wildlife monitoring at I-90 Snoqualmie Pass East Appendices
Western Transportation Institute
such as bears, mountain lions, and wolves), and included raccoons (n=7), coyotes (n=2), skunks (n=3) a fox, and a mink. Table 3. Number of reported live and dead mammals (excluding duplicates), by species group. Alive Dead Total Carnivore 26 14 40 Ungulate 393 19 412 Other 42 15 57 Unknown 0 7 7 Total 461 55 516 When motorists reported sightings on the website, they had the option to expand upon their observations by providing comments. Some of the comments submitted during Year 1 yielded useful information about the behavior of animals moving near or across the roadway—information that may not otherwise have been captured (Box 2).

Baseline wildlife monitoring at I-90 Snoqualmie Pass East Appendices
Western Transportation Institute Page 164
Figure 18. Locations of dead wildlife reports (duplicate reports removed) in the western portion of the survey area, from North Bend to Snoqualmie Pass.

Baseline wildlife monitoring at I-90 Snoqualmie Pass East Appendices
Western Transportation Institute Page 165
Figure 19. Locations of dead wildlife reports (duplicate reports removed) in the eastern portion of the survey area, from Snoqualmie Pass to Easton.

Baseline wildlife monitoring at I-90 Snoqualmie Pass East Appendices
Western Transportation Institute Page 166
Box 2. Examples of comments submitted with wildlife reports
Bobcat bounded across the road in front of traffic, was really glad it wasn't hit!
The bear came running out from the side of the road out of the bushes, stopped in the second lane briefly, then turned and ran westbound in the road for 50 feet then ran back to the side of the road, then ran another 30 or 40 feet along the side of the road before I lost visual. There were two bucks on so. side trying to cross. One turned back around the other crossed in front of us as we were doing a slow down for blasting. The one that crossed to the north, ran through the snow park. Large female Elk, started in the median, came out onto the road way clear to the right lane before turning back and heading back into the median. My driver's side mirror barely clipped her rear end, just enough to fold my mirror back in towards my door which I adjusted back out afterwards. Heavy traffic at this time westbound. Deer seemed to be scanning the traffic and looking for a way out (not to personalize, but little options and eyes and head were scanning back and forth). East end of the snowshed. Spotted between MP40-42, 7:58 to 8:00pm. Animal [coyote] crossed under guard rail on south side of WB I-90, crossed median, crossed EB, then off shoulder to the south, focusing only straight ahead, never looking at traffic. I had to slow slightly to avoid striking it. I thought only coyote with speckled coat. A passenger wondered out loud about 'wolf', thinking it was large for a coyote. It looked like they [elk] were grazing alongside of the metal traffic barrier. It would have been very dangerous if not tragic if they attempted to cross the highway. With their size the barrier probably wasn't stopping them. thanks for representing the needs of the wildlife around the area. It [coyote] was standing on a snow berm within several feet of the shoulder, but seemed interested in something in the snow there. It stood parallel to or facing slightly from the road and only glanced sideways at the traffic--I think there was a guard rail for the off-ramp between it and the road. Didn't appear interested in crossing the highway, at any rate. a young black bear crossing the freeway to get to Lake Kacheless 2-3 does, with 2-3 young, crossing all 6 lanes from north to south. Light traffic, no hits.

Baseline wildlife monitoring at I-90 Snoqualmie Pass East Appendices
Western Transportation Institute Page 167
Control Area versus I-90 Snoqualmie Pass East Project Area
The number of reports of live and dead animals in the control area (North Bend to Hyak) and the I-90 SPE project area (Hyak to Easton) were surprisingly similar after removing live bird sightings (n=11, North Bend to Hyak; n=9, Hyak to Easton)—live bird sightings are interesting but difficult to interpret—and standardizing by dividing the number of reports by the number of miles in the area (Fig. 20). The estimated number of dead animals per mile was also similar between areas (Fig. 21). These rates will be important for ultimately evaluating the effectiveness of wildlife crossing structures and fencing at reducing roadkill. For example, because the rate of reported numbers of dead animals was similar between areas, a detected change in the post-construction rate of dead animals reported in the I-90 SPE project area without a corresponding change in the reported number of dead animals in the control area would potentially suggest that fencing and crossing structures were affecting roadkill rates. The ability to statistically detect a difference between pre- and post-construction of crossing structures, however, will ultimately depend on the number of reports submitted during post-construction roadkill surveys. The estimated number of live animals along the highway in the I-90 SPE project area was higher than in the control area (Fig. 21). However, this result may have been caused by a few reports of large elk groups near Easton Hill—reports which likely included some of the same animals sighted at different times or locations. Because there is no way to confirm unique individuals in this research effort, the rates of live animals reported are unreliable for estimating actual numbers of animals using the I-90 Wildlife Watch project area.

Baseline wildlife monitoring at I-90 Snoqualmie Pass East Appendices
Western Transportation Institute Page 168
Figure 20. Actual rates of wildlife reports (reports/mile) of dead and live animals (excluding live birds) for the control area (North Bend to Hyak) and I-90 SPE project area (Hyak to Easton).
Figure 21. Poisson-based estimates and 95% confidence intervals for the number of live and dead wildlife individuals (excluding live birds and duplicates) per mile for the control area (North Bend to Hyak) and the I-90 SPE project area (Hyak to Easton).
Most reports were made under “good” driving conditions, with fewer recorded under “moderate” or “poor” conditions (Fig. 22). Note that the “poor” conditions category included all periods of
3.8 3.8
1.71.4
0.0
0.5
1.0
1.5
2.0
2.5
3.0
3.5
4.0
4.5
North Bend to Hyak Hyak to Easton
Rate
(re
port
s /m
ile)
Alive
Dead
8.3
12.4
1.5 1.20.0
2.0
4.0
6.0
8.0
10.0
12.0
14.0
16.0
North Bend to Hyak
Hyak to Easton
Rate
(ind
ivid
uals
/mile
)
Alive
Dead

Baseline wildlife monitoring at I-90 Snoqualmie Pass East Appendices
Western Transportation Institute Page 169
darkness, when travelers would have been much less likely to observe small dead animals on the roadway or (live or dead) animals near the roadway. Volunteer Data Seven volunteers drove a combined total of 22,859 miles within the survey area, contributing 73 reports totaling 100 individual animals (live=65, dead=35). After removing miles driven in poor visibility (n=5,402) and live bird sightings (n=19), Bayesian estimates of reporting rates for live and dead individuals were 0.003 individuals/mile (95% credible interval = 0.002–0.003) and 0.002 individuals/mile (95% credible interval = 0.001–0.003), respectively. Assuming a similar effort is undertaken after wildlife fencing and crossing structures are in place, such rates—compared between time periods and between the control and I-90 SPE project areas—will contribute to post-construction evaluations of structure effectiveness.
Figure 22. Visibility conditions under which observations were made.
Conclusion
I-90 Wildlife Watch was designed to harness the potential of motorists to gather information about wildlife movement in the I-90 SPE area, while also engaging the public in important conservation issues surrounding wildlife and roads. In Year 1, we achieved measurable success in developing a user-friendly website for acquiring wildlife observation data, attracting thousands of visitors to the website, and receiving 240 valid reports of live and dead wildlife sightings between North Bend and Easton. Although data of this nature should be treated judiciously—for example, animals observed by citizens traveling at high-speed along a busy highway may be prone to being misidentified—they are nonetheless a valuable complement to other wildlife monitoring efforts associated with the I-90 SPE project. Given the success of I-90 Wildlife Watch in Year 1, we have decided to continue the project for at least one more year. Outreach will remain critical in Year 2 as we strive to maximize the
140
29
7
56
71
0
20
40
60
80
100
120
140
160
Good Moderate Poor
Num
ber o
f rep
orts
Alive
Dead

Baseline wildlife monitoring at I-90 Snoqualmie Pass East Appendices
Western Transportation Institute Page 170
number of motorists who know about and use the website. In addition to distributing print materials throughout the region, soliciting media coverage, and promoting I-90 Wildlife via billboards and WSDOT displays, we will explore other innovative opportunities for enhancing the visibility of the program. For example, we hope to reach out to truck drivers and other professionals whose work requires regular travel on I-90. As road signage on the survey route itself would be extremely helpful, we’re also hoping that WSDOT will be able to advertise I-90 Wildlife Watch on its variable message signs in the future. A second year of data will allow us to better evaluate whether reporting patterns that emerged in Year 1 (e.g., increased wildlife reports during the Spring and Summer; potential hotspots for elk and deer) reflect real patterns on the landscape. Further, after Year 2, we will have a more extensive dataset to compare with roadkill data compiled by WSDOT personnel. In the longer term, it will be vital to solicit motorist-based data again after wildlife crossing structures and fencing are installed, such that pre-construction and post-construction patterns and rates can be compared. As a final note, we think it’s important to emphasize the role of I-90 Wildlife Watch in building public support for enhancing habitat connectivity in the I-90 SPE region. Although this attribute may be difficult to quantify directly, it is no doubt reflected in the number of visits to our website and the observations reported. Indeed, in reading the comments provided by observers, it is clear that these individuals are concerned about wildlife on the highway (because of human safety, wildlife safety, or both), and appreciate having a forum for sharing their concerns.

Baseline wildlife monitoring at I-90 Snoqualmie Pass East Appendices
Western Transportation Institute Page 171
References
Gaines, W.L., P. Singleton, A.L. Gold. 2000. Conservation of rare carnivores in the North Cascades Ecosystem, western North America. Natural Areas Journal 20:366–375.
Mace, R.D., J.S. Waller, T.L. Manley, L.J. Lyon, and H. Zuuring. 1996. Relationships among grizzly bears, roads and habitat in the Swan Mountains, Montana. Journal of Applied Ecology 33:1395–1404.
Noss, R.F., H.B. Quigley, M.G. Hornocker, T. Merrill, and P.C. Paquet. 1996. Conservation biology and carnivore conservation in the Rocky Mountains. Conservation Biology 10:949–963.
Parmesan, C. 2006. Ecological and evolutionary responses to recent climate change. Annual Review of Ecology, Evolution, and Systematics 37:637–669.
Riley, S.P.D., J. Pollinger, R.K. Wayne, R.M. Sauvajot, E.C. York, and T.K. Fuller. 2006. A southern California freeway in a physical and social barrier to gene flow in carnivores Molecular Ecology 15:1733–1741.
Shirk, A.J. 2009. Mountain goat genetic structure, molecular diversity, and gene flow in the Cascade Range, Washington. MS Thesis. Western Washington University, Bellingham, WA.
Singleton, P.H., W.L. Gaines, and J.F. Lehmkuhl. 2002. Landscape permeability for large carnivores in Washington: A geographic information system weighted-distance and least-cost corridor assessment. USDA Forest Service, PNW-GTR-549.
Washington State Department of Transportation (WSDOT). 2008. I-90 Snoqualmie Pass East: Final environmental impact statement and section 4(f) evaluation. Yakima, WA.

Baseline wildlife monitoring at I-90 Snoqualmie Pass East Appendices
Western Transportation Institute Page 172
Appendix 1
Summary of all live and dead wildlife reports, including date observed, species, and number of individuals. Date Species Count Status 2010 5-Nov Elk 3 Alive 5-Nov Deer 1 Dead 7-Nov Deer 2 Alive 7-Nov Raccoon 1 Alive 7-Nov Cougar/Mountain lion 1 Alive 8-Nov Raptor 1 Dead 10-Nov Elk 2 Alive 12-Nov Black bear 1 Alive 6-Dec Raptor 1 Dead 6-Dec Deer 1 Dead 2011 1-Jan Elk 2 Alive 23-Jan Owl 1 Alive 9-Feb Elk 20 Alive 18-Feb Elk 4 Alive 3-Mar Deer 3 Alive 3-Mar Coyote 1 Alive 4-Mar Raccoon 1 Dead 5-Mar Elk 5 Alive 8-Mar Elk 5 Alive 11-Mar Coyote 1 Alive 11-Mar Raven 2 Alive 15-Mar Elk 9 Alive 25-Mar Otter 1 Alive 26-Mar Crow 3 Alive 1-Apr Elk 6 Alive 3-Apr Elk 3 Alive 7-Apr Elk 5 Alive 7-Apr Elk 1 Alive 9-Apr Elk 25 Alive 11-Apr Deer 1 Dead 12-Apr Elk 4 Alive 13-Apr Elk 6 Alive 15-Apr Elk 5 Alive 16-Apr Elk 3 Alive 17-Apr Deer 1 Alive

Baseline wildlife monitoring at I-90 Snoqualmie Pass East Appendices
Western Transportation Institute Page 173
17-Apr Elk 4 Alive 19-Apr Elk 2 Alive 20-Apr Elk 3 Alive 20-Apr Elk 3 Alive 21-Apr Unknown 1 Dead 21-Apr Elk 6 Alive 22-Apr Deer 3 Alive 22-Apr Elk 2 Alive 22-Apr Elk 3 Alive 23-Apr Porcupine 1 Dead 23-Apr Deer 2 Alive 23-Apr Bobcat 1 Alive 23-Apr Elk 8 Alive 24-Apr Elk 7 Alive 26-Apr Elk 3 Alive 26-Apr Elk 1 Alive 26-Apr Elk 6 Alive 26-Apr Mink 1 Dead 27-Apr Elk 2 Alive 28-Apr Skunk 1 Dead 29-Apr Elk 4 Alive 29-Apr Coyote 1 Alive 29-Apr Elk 2 Alive 3-May Elk 3 Alive 5-May Elk 5 Alive 5-May Elk 5 Alive 5-May Elk 25 Alive 6-May Elk 1 Alive 7-May Elk 2 Alive 8-May Deer 1 Alive 8-May Elk 1 Alive 8-May Elk 2 Alive 10-May Elk 4 Alive 10-May Elk 3 Alive 10-May Elk 5 Alive 10-May Unknown 1 Dead 11-May Deer 2 Alive 11-May Elk 2 Alive 11-May Elk 3 Alive 12-May Raptor 1 Alive 12-May Mink 6 Alive 13-May Elk 1 Alive 13-May Elk 3 Alive 13-May Deer 4 Alive

Baseline wildlife monitoring at I-90 Snoqualmie Pass East Appendices
Western Transportation Institute Page 174
13-May Elk 2 Alive 16-May Elk 2 Alive 16-May Hawk 1 Alive 16-May Unknown 1 Dead 18-May Hawk 1 Alive 18-May Bluebird 1 Alive 18-May Elk 2 Alive 18-May Elk 3 Alive 19-May Hawk 1 Dead 20-May Elk 2 Alive 21-May Deer 1 Alive 22-May Deer 1 Alive 22-May Deer 3 Alive 22-May Elk 1 Alive 23-May Elk 1 Alive 23-May Elk 6 Alive 24-May Coyote 1 Alive 24-May Elk 2 Alive 24-May Elk 1 Alive 24-May Elk 3 Alive 24-May Skunk 1 Dead 25-May Raptor 1 Alive 25-May Deer 4 Alive 26-May Deer 1 Alive 27-May Elk 20 Alive 27-May Elk 2 Alive 28-May Unknown 1 Dead 28-May Elk 4 Alive 29-May Fox 2 Alive 30-May Elk 1 Alive 30-May Deer 2 Alive 31-May Elk 1 Dead 31-May Skunk 1 Dead 1-Jun Deer 1 Alive 1-Jun Deer 1 Alive 4-Jun Elk 1 Alive 4-Jun Turkey 1 Dead 4-Jun Turkey 5 Alive 5-Jun Deer 1 Dead 5-Jun Deer 1 Dead 5-Jun Hawk 1 Alive 5-Jun Deer 1 Alive 5-Jun Unknown 1 Dead 6-Jun Deer 1 Dead

Baseline wildlife monitoring at I-90 Snoqualmie Pass East Appendices
Western Transportation Institute Page 175
6-Jun Unknown 1 Dead 6-Jun Unknown 1 Dead 6-Jun Deer 2 Alive 6-Jun Deer 1 Dead 7-Jun Raccoon 1 Dead 7-Jun Goose 5 Alive 8-Jun Deer 2 Alive 8-Jun Deer 1 Alive 9-Jun Elk 1 Alive 10-Jun Deer 2 Alive 10-Jun Elk 1 Alive 10-Jun Elk 2 Alive 10-Jun Porcupine 1 Dead 10-Jun Elk 1 Alive 11-Jun Black bear 1 Alive 11-Jun Black bear 1 Alive 11-Jun Deer 1 Alive 11-Jun Deer 1 Alive 11-Jun Porcupine 1 Dead 12-Jun Deer 1 Dead 12-Jun Deer 1 Alive 12-Jun Deer 1 Dead 13-Jun Hawk 1 Alive 13-Jun Deer 1 Alive 13-Jun Elk 1 Alive 14-Jun Deer 1 Alive 14-Jun Raccoon 1 Dead 14-Jun Deer 1 Alive 17-Jun Black bear 1 Alive 18-Jun Hawk 1 Dead 19-Jun Deer 1 Alive 19-Jun Deer 1 Alive 20-Jun Deer 1 Alive 20-Jun Deer 1 Alive 22-Jun Coyote 1 Dead 22-Jun Coyote 1 Dead 22-Jun Elk 1 Alive 22-Jun Elk 2 Alive 22-Jun Goose 5 Alive 23-Jun Coyote 1 Dead 24-Jun Deer 2 Alive 26-Jun Elk 7 Alive 26-Jun Elk 6 Alive 27-Jun Deer 1 Alive

Baseline wildlife monitoring at I-90 Snoqualmie Pass East Appendices
Western Transportation Institute Page 176
27-Jun Deer 1 Alive 27-Jun Deer 1 Dead 28-Jun Elk 1 Alive 28-Jun Deer 1 Alive 29-Jun Deer 1 Alive 30-Jun Vulture 1 Alive 30-Jun Deer 1 Alive 1-Jul Deer 1 Alive 2-Jul Vulture 4 Alive 3-Jul Deer 2 Alive 3-Jul Deer 1 Alive 4-Jul Unknown 1 Dead 4-Jul Elk 1 Alive 5-Jul Elk 2 Alive 5-Jul Black bear 1 Alive 5-Jul Goose 2 Alive 6-Jul Raccoon 1 Dead 6-Jul Deer 2 Alive 6-Jul Black bear 1 Alive 6-Jul Deer 1 Alive 7-Jul Raccoon 1 Dead 7-Jul Deer 1 Alive 7-Jul Deer 1 Alive 8-Jul Raccoon 1 Dead 10-Jul Black bear 1 Alive 12-Jul Unknown 1 Dead 12-Jul Eagle 1 Alive 12-Jul Eagle 2 Alive 13-Jul Deer 1 Alive 15-Jul Deer 1 Alive 18-Jul Deer 1 Alive 18-Jul Deer 1 Alive 21-Jul Deer 1 Alive 21-Jul Deer 1 Alive 22-Jul Deer 1 Alive 22-Jul Coyote 1 Dead 22-Jul Deer 1 Dead 23-Jul Hawk 3 Alive 26-Jul Unknown 1 Dead 26-Jul Deer 1 Dead 26-Jul Elk 2 Alive 30-Jul Hummingbird 1 Dead 31-Jul Owl 1 Dead 1-Aug Unknown 1 Dead

Baseline wildlife monitoring at I-90 Snoqualmie Pass East Appendices
Western Transportation Institute Page 177
1-Aug Elk 1 Dead 2-Aug Deer 1 Dead 2-Aug Black bear 1 Alive 5-Aug Deer 2 Alive 5-Aug Deer 1 Alive 8-Aug Unknown 1 Dead 8-Aug Deer 1 Dead 8-Aug Deer 1 Dead 9-Aug Deer 1 Alive 18-Aug Owl 1 Dead 19-Aug Moose 1 Alive 22-Aug Raccoon 1 Dead 23-Aug Opossum 1 Dead 29-Aug Deer 1 Alive 30-Aug Deer 1 Alive 1-Sep Fox 1 Dead 7-Sep Otter 2 Alive 10-Sep Deer 2 Alive 3-Oct Deer 1 Dead 4-Oct Osprey 1 Alive 8-Oct Deer 3 Alive 8-Oct Deer 1 Alive 17-Oct Raccoon 1 Dead 18-Oct Unknown 1 Dead 20-Oct Elk 1 Dead 25-Oct Elk 1 Dead 25-Oct Elk 1 Dead 29-Oct Raccoon 1 Dead 1-Nov Black bear 1 Alive

Baseline wildlife monitoring at I-90 Snoqualmie Pass East Appendices
Western Transportation Institute Page 178
Appendix 2.2. Wildlife-vehicle collision data collected by WSDOT maintenance crews from July 2008–June 2012 for the “Project” and “Control” areas as described in Chapter 2. Duplicates have been removed based on the protocol described in Chapter 2. UTM coordinates are NAD83.
Date UTMN UTME Species Count Sex Analysis Section 7/3/2008 5249780 622125 Canada Goose 1 Unknown Project 7/3/2008 5250030 621743 Deer 1 Unknown Project
7/14/2008 5253280 605801 Deer 1 Female Control 7/14/2008 5236330 633619 Elk 1 Male Project 7/16/2008 5246180 623286 Deer 1 Unknown Project 7/21/2008 5250310 621133 Deer 1 Male Project 7/21/2008 5234790 636820 Deer 1 Female Project 7/25/2008 5243620 624962 Deer 1 Female Project 7/25/2008 5243620 624957 Deer 1 Female Project 7/28/2008 5240860 627677 Deer 1 Female Project 8/27/2008 5250130 616005 Black Bear 1 Female Control 10/8/2008 5250530 620896 Deer 1 Male Control
10/24/2008 5257740 596676 Black Bear 1 Unknown Control 10/25/2008 5258130 595828 Deer 1 Male Control 10/27/2008 5250050 621711 Deer 1 Female Project 12/3/2008 5250410 611981 Deer 1 Unknown Control 12/4/2008 5255490 598342 Deer 1 Female Control 12/5/2008 5250130 621660 Deer 1 Unknown Project 12/6/2008 5257570 596860 Elk 1 Female Control 12/6/2008 5257730 596522 Elk 1 Female Control 2/7/2009 5256170 597988 Deer 1 Female Control
2/13/2009 5254900 601615 Coyote 1 Unknown Control 2/16/2009 5256200 597960 Bobcat 1 Unknown Control 3/1/2009 5250490 615723 Black Bear 1 Female Control 3/8/2009 5256520 597871 Deer 1 Unknown Control
3/10/2009 5236390 632081 Deer 1 Male Project 4/1/2009 5236590 631423 Elk 1 Female Project 4/6/2009 5257500 597035 Elk 1 Female Control 4/6/2009 5257520 596954 Elk 1 Female Control 4/6/2009 5257500 597035 Elk 1 Female Control 4/6/2009 5257520 596954 Elk 1 Female Control
4/15/2009 5236550 631550 Elk 1 Female Project 4/23/2009 5238150 629798 Coyote 1 Unknown Project 4/26/2009 5257860 596193 Elk 1 Female Control 5/4/2009 5257640 596968 Elk 1 Female Control 5/4/2009 5236190 633995 Elk 1 Female Project
5/28/2009 5256780 597832 Deer 1 Female Control 6/12/2009 5250340 612954 Deer 1 Male Control 6/19/2009 5250330 610230 Deer 1 Female Control

Baseline wildlife monitoring at I-90 Snoqualmie Pass East Appendices
Western Transportation Institute Page 179
7/1/2009 5254790 601641 Elk 1 Female Control 7/2/2009 5240170 628386 Deer 1 Female Project 7/8/2009 5240120 628369 Deer 1 Female Project
7/10/2009 5257100 597667 Deer 1 Female Control 7/28/2009 5253880 603051 Deer 1 Male Control 7/28/2009 5258190 595627 Deer 1 Male Control 11/6/2009 5248380 622519 Deer 1 Female Project
11/12/2009 5234990 636558 Elk 1 Female Project 12/4/2009 5253820 619546 Coyote 1 Unknown Control 12/5/2009 5236530 632676 Elk 1 Female Project
12/20/2009 5254650 601882 Elk 1 Female Control 12/28/2009 5254300 602425 Elk 1 Female Control 1/22/2010 5258350 595219 Elk 1 Female Control 1/24/2010 5255340 600410 Elk 1 Female Control 2/6/2010 5256600 597848 Coyote 1 Unknown Control
2/18/2010 5258190 595616 Elk 1 Unknown Control 3/22/2010 5254220 602494 Elk 1 Female Control 4/7/2010 5243060 625453 Mallard Duck 1 Unknown Project 4/7/2010 5236470 633263 Wild Turkey 1 Unknown Project
4/16/2010 5243150 625351 Coyote 1 Male Project 4/19/2010 5253800 603411 Elk 1 Female Control 5/4/2010 5257640 596968 Elk 1 Female Control
5/27/2010 5236570 631479 Elk 1 Female Project 6/1/2010 5255810 598080 Coyote 1 Unknown Control 6/1/2010 5253810 618337 Deer 1 Unknown Control
6/28/2010 5250440 614608 Elk 1 Female Control 6/30/2010 5251220 620333 Deer 1 Male Control 6/30/2010 5255280 600784 Deer 1 Female Control 7/11/2010 5250940 620371 Deer 1 Male Control 7/19/2010 5236110 634583 Deer 1 Male Project 7/20/2010 5247390 622865 Deer 1 Male Project 7/27/2010 5252030 619996 Deer 1 Unknown Control 8/7/2010 5235220 636115 Deer 1 Male Project
8/12/2010 5250970 616920 Deer 1 Female Control 10/4/2010 5253900 602978 Elk 1 Female Control
10/11/2010 5251450 617222 Deer 1 Female Control 10/11/2010 5250220 610818 Deer 1 Female Control 10/11/2010 5251450 617222 Deer 1 Unknown Control 10/11/2010 5251450 617222 Deer 1 Unknown Control 11/7/2010 5256540 597852 Deer 1 Male Control
11/14/2010 5237330 630784 Black Bear 1 Unknown Project 11/14/2010 5249140 622444 Coyote 1 Unknown Project 1/27/2011 5235320 635311 Otter 1 Unknown Project

Baseline wildlife monitoring at I-90 Snoqualmie Pass East Appendices
Western Transportation Institute Page 180
2/3/2011 5256920 597572 Deer 1 Female Control 2/4/2011 5257250 597643 Deer 1 Unknown Control
2/17/2011 5253000 619896 Coyote 1 Female Control 2/18/2011 5258230 595495 Elk 1 Female Control 4/17/2011 5257520 596875 Elk 1 Female Control 5/18/2011 5257900 596277 Elk 1 Female Control 5/31/2011 5257500 597044 Elk 1 Female Control 6/12/2011 5255060 601337 Deer 1 Male Control 6/16/2011 5255300 600302 Elk 1 Female Control 6/21/2011 5255090 601334 Elk 1 Female Control 6/27/2011 5240800 627657 Deer 1 Female Project 8/18/2011 5240140 628462 Deer 1 Female Project 8/18/2011 5240140 628461 Deer 1 Female Project 8/18/2011 5240140 628464 Deer 1 Unknown Project 9/6/2011 5242640 626385 Elk 1 Female Project
11/29/2011 5236680 633485 Deer 1 Female Project 12/7/2011 5253430 605374 Deer 1 Unknown Control
12/26/2011 5252830 606250 Coyote 1 Female Control 1/2/2012 5243280 625149 Bobcat 1 Female Project 1/7/2012 5242050 626693 Deer 1 Unknown Project 2/6/2012 5250890 620582 Bobcat 1 Unknown Control 2/6/2012 5250800 620709 Bobcat 1 female Control 2/9/2012 5255990 597990 Deer 1 Female Control
2/12/2012 5257190 597633 Bald Eagle 1 Male Control 2/28/2012 5246830 622814 Deer 1 Female Project 5/21/2012 5251622 620380 Beaver 1 Unknown Control 6/4/2012 5242187 626721 Deer 1 Female Project 6/7/2012 5242368 626601 Deer 1 Female Project
6/27/2012 5242963 625763 Deer 1 Male Project

Baseline wildlife monitoring at I-90 Snoqualmie Pass East Appendices
Western Transportation Institute Page 181
Appendix 2.3. I-90 Wildlife Watch data from November 2010–June 2012 for wildlife-vehicle collision observations for the “Project” and “Control” areas as described in Chapter 2. Duplicates have been removed based on the protocol described in Chapter 2. UTM coordinates are NAD83.
Date Hour of Day Mile Post UTMX UTMY Species Count Observation Location Travel Direction Visibility Analysis Section 11/5/10 15 45.9 611682 5250130 Deer 1 In Median Eastbound Good Control 11/8/10 14 32.2 593000 5258520 Raptor 1 Within 10 yards South Side Eastbound Good Control 12/6/10 10 36.3 598199 5255730 Deer 1 In Median Eastbound Good Control 12/6/10 10 33.4 594872 5258480 Raptor 1 On Highway Eastbound Good Control 3/4/11 7 32.4 593345 5258510 Raccoon 1 Within 10 yards North Side Westbound Moderate Control
4/11/11 17 35.2 597509 5257310 Deer 1 Within 10 yards South Side Eastbound Good Control 4/21/11 17 32 592682 5258510 Unknown 1 On Highway Westbound Good Control 4/23/11 17 34.5 596458 5257800 Porcupine 1 On Highway Westbound Good Control 5/10/11 19 49.8 617488 5251080 Unknown 1 On Highway Eastbound Good Control 5/16/11 7 48.6 615979 5250630 Unknown 1 On Highway Westbound Moderate Control 5/19/11 8 31.5 591660 5258710 Hawk 1 In Median Westbound Good Control 5/28/11 10 61.2 626271 5242680 Unknown 1 Within 10 yards South Side Eastbound Good Project 5/31/11 7 35 597255 5257460 Elk 1 In Median Eastbound Good Control 5/31/11 7 70.1 636776 5234780 Skunk 1 Within 10 yards South Side Eastbound Moderate Project 6/4/11 18 67.4 632936 5236500 Turkey 1 On Highway Westbound Good Project 6/5/11 9 65.1 629993 5237970 Unknown 1 On Highway Westbound Good Project 6/6/11 5 69.5 635970 5235250 Deer 1 In Median Westbound Good Project 6/6/11 8 32.3 593168 5258520 Unknown 1 On Highway Westbound Moderate Control 6/7/11 8 31 591051 5259570 Raccoon 1 On Highway Westbound Good Control
6/10/11 17 62.8 627846 5240650 Porcupine 1 On Highway Westbound Moderate Project 6/12/11 12 38.8 601874 5254710 Deer 1 On Highway Westbound Good Control 6/14/11 15 64.1 629517 5239500 Raccoon 1 Within 10 yards South Side Eastbound Good Project 6/18/11 8 51 618132 5252870 Hawk 1 On Highway Eastbound Good Control 6/22/11 6 31.4 591521 5258890 Coyote 1 In Median Westbound Good Control 7/4/11 6 36.8 598851 5255340 Unknown 1 On Highway Westbound Good Control 7/6/11 15 36.6 598559 5255440 Raccoon 1 In Median Eastbound Good Control
7/12/11 18 35.5 597755 5256920 Unknown 1 Within 10 yards South Side Eastbound Good Control 7/22/11 7 69.9 636555 5235020 Coyote 1 In Median Westbound Good Project 7/22/11 9 70 636643 5234900 Deer 1 On Highway Westbound Good Project 7/26/11 23 54.7 620919 5250500 Deer 1 In Median Eastbound Poor Control 7/26/11 21 39.5 602779 5254070 Unknown 1 On Highway Eastbound Moderate Control 7/30/11 14 61 625995 5242830 Hummingbird 1 Within 10 yards North Side Westbound Good Project 7/31/11 15 42.1 606519 5252620 Owl 1 On Highway Eastbound Good Control 8/1/11 7 38.2 601048 5255210 Elk 1 Within 10 yards South Side Eastbound Good Control 8/2/11 8 39.8 603225 5253820 Deer 1 In Median Westbound Good Control

Baseline wildlife monitoring at I-90 Snoqualmie Pass East Appendices
Western Transportation Institute Page 182
8/8/11 17 41.7 606108 5253020 Unknown 1 In Median Eastbound Good Control 8/18/11 8 42.1 606519 5252620 Owl 1 Within 10 yards South Side Eastbound Good Control 8/22/11 7 35.6 597769 5256760 Raccoon 1 Within 10 yards North Side Westbound Good Control 8/23/11 7 70.2 636877 5234640 Opposum 1 Within 10 yards North Side Westbound Good Project 9/1/11 14 67.6 633247 5236470 Fox 1 Within 10 yards South Side Eastbound Good Project
10/3/11 7 39.7 603067 5253880 Deer 1 Within 10 yards South Side Westbound Good Control 10/17/11 8 31.3 591396 5259080 Raccoon 1 Within 10 yards North Side Westbound Good Control 10/18/11 7 31 591051 5259570 Unknown 1 In Median Westbound Good Control 10/20/11 8 31 591051 5259570 Elk 1 Within 10 yards North Side NA Good Control 10/25/11 9 34.1 595921 5258060 Elk 1 In Median Westbound Good Control 10/25/11 9 32.1 592841 5258520 Elk 1 Within 10 yards South Side Westbound Good Control 10/29/11 11 37.2 599449 5255360 Raccoon 1 In Median Westbound Good Control 11/7/11 8 31.2 591271 5259260 Raccoon 1 Within 10 yards South Side Eastbound Moderate Control 11/9/11 7 62.9 627947 5240530 Hawk 1 Within 10 yards South Side Eastbound Good Project 2/27/12 19 57.8 623103 5246360 Deer 1 On Highway Eastbound Poor Project 3/9/12 14 32.1 592841 5258520 Deer 1 In Median Westbound Good Control
4/23/12 7 54.5 620736 5250790 Unknown 1 On Highway Eastbound Good Control 5/14/12 7 36.6 598559 5255440 Raccoon 1 In Median Eastbound Good Control 5/23/12 9 31 591051 5259570 Raccoon 1 On Highway Westbound Good Control 5/27/12 10 54.6 620832 5250660 Black bear 1 Within 10 yards South Side Westbound Good Control 5/27/12 11 60.7 625564 5243040 Raccoon 1 On Highway Eastbound Good Project 5/29/12 6 63.1 628183 5240320 Raccoon 1 Within 10 yards South Side Eastbound Good Project 6/4/12 6 61.7 626795 5242070 Deer 1 In Median Eastbound Moderate Project 6/9/12 14 31 591051 5259570 Elk 1 In Median Westbound Good Control
6/15/12 0 68.5 634558 5235870 Elk 1 On Highway Eastbound Moderate Project

Baseline wildlife monitoring at I-90 Snoqualmie Pass East Appendices
Western Transportation Institute Page 183
Appendix 2.4. I-90 Wildlife Watch data from November 2010–June 2012 for live animal observations for the “Project” and “Control” areas as described in Chapter 2. Duplicates have been removed based on the protocol described in Chapter 2. UTM coordinates are NAD83.
Date Hour of Day Mile Post UTMX UTMY Species Count Observation Location Travel Direction Visibility Analysis Section 11/5/10 21 32.4 593345 5258510 Elk 3 On Highway Eastbound Moderate Control 11/7/10 9 51.5 618384 5253590 Raccoon 1 Outside 10 yards North Side Eastbound Moderate Control 11/7/10 17 52.2 619416 5253840 Cougar/Mountain lion 1 In Median Eastbound Good Control 11/7/10 7 32.9 594123 5258510 Deer 2 Within 10 yards North Side Westbound Good Control
11/10/10 7 37.8 600419 5255270 Elk 2 Outside 10 yards South Side Eastbound Good Control 11/12/10 19 65.5 630237 5237400 Black bear 1 On Highway Eastbound Poor Project
1/1/11 8 44.6 609680 5250370 Elk 2 Within 10 yards South Side Eastbound Good Control 1/23/11 18 31.2 591271 5259260 Owl 1 On Highway Westbound Moderate Control 2/9/11 17 69.4 635806 5235260 Elk 20 Within 10 yards South Side Eastbound Good Project
2/18/11 16 35.3 597611 5257190 Elk 4 Outside 10 yards North Side Westbound Good Control 3/3/11 10 54.6 620832 5250660 Coyote 1 On Highway Eastbound Good Control 3/3/11 12 31.5 591660 5258710 Deer 3 Within 10 yards South Side Eastbound Moderate Control 3/8/11 7 39.8 603225 5253820 Elk 5 Within 10 yards North Side Westbound Good Control
3/11/11 14 63.2 628298 5240210 Coyote 1 Within 10 yards North Side Westbound Good Project 3/11/11 10 69.7 636285 5235190 Raven 2 Outside 10 yards South Side Westbound Good Project 3/15/11 16 64.3 629670 5239210 Elk 9 Within 10 yards North Side Eastbound Moderate Project 3/25/11 15 57.1 622796 5247450 Otter 1 Outside 10 yards South Side Eastbound Good Project 3/26/11 15 70.2 636877 5234640 Crow 3 Within 10 yards North Side Westbound Moderate Project 4/1/11 6 42.2 606614 5252500 Elk 6 Within 10 yards North Side Westbound Good Control 4/3/11 16 44.3 609210 5250570 Elk 3 Within 10 yards South Side Eastbound Good Control 4/7/11 16 42.3 606686 5252350 Elk 5 Within 10 yards South Side Eastbound Good Control 4/7/11 18 43.3 607820 5251250 Elk 1 Within 10 yards North Side Westbound Good Control
4/12/11 19 43.8 608549 5251010 Elk 4 Within 10 yards North Side Eastbound Good Control 4/13/11 6 42.5 606845 5252060 Elk 6 Within 10 yards North Side Westbound Moderate Control 4/16/11 18 44.8 610021 5250320 Elk 3 Within 10 yards South Side Eastbound Good Control 4/17/11 18 38.4 601336 5255050 Deer 1 Outside 10 yards North Side Eastbound Good Control 4/17/11 18 40.6 604512 5253780 Elk 4 Within 10 yards North Side Eastbound Good Control 4/19/11 18 40.6 604512 5253780 Elk 2 Within 10 yards North Side Eastbound Good Control 4/20/11 16 38.7 601725 5254790 Elk 3 Within 10 yards South Side Eastbound Good Control 4/22/11 14 41.9 606300 5252810 Elk 2 Within 10 yards South Side Eastbound Good Control 4/22/11 18 37.9 600597 5255280 Deer 3 Within 10 yards South Side Eastbound Good Control 4/22/11 18 42.1 606519 5252620 Elk 3 Within 10 yards South Side Eastbound Good Control 4/23/11 15 48.7 616118 5250690 Bobcat 1 On Highway Westbound Good Control 4/23/11 17 39.4 602649 5254160 Deer 2 Outside 10 yards North Side Westbound Good Control 4/23/11 18 60.1 624915 5243680 Elk 8 Within 10 yards North Side Eastbound Good Project

Baseline wildlife monitoring at I-90 Snoqualmie Pass East Appendices
Western Transportation Institute Page 184
4/24/11 12 35 597255 5257460 Elk 7 In Median Eastbound Good Control 4/26/11 6 39.1 602270 5254440 Elk 3 Within 10 yards North Side Westbound Moderate Control 4/26/11 16 42 606423 5252720 Elk 1 Within 10 yards South Side Eastbound Good Control 4/26/11 15 45.7 611403 5250120 Elk 6 Within 10 yards North Side Westbound Good Control 4/29/11 19 41 605091 5253530 Coyote 1 On Highway Eastbound Good Control 4/29/11 6 39.5 602779 5254070 Elk 4 Within 10 yards North Side Westbound Good Control 4/29/11 19 63 628059 5240430 Elk 2 Within 10 yards North Side Westbound Good Project 5/3/11 17 40.5 604334 5253800 Elk 3 Within 10 yards North Side Westbound Good Control 5/5/11 19 40.1 603719 5253760 Elk 5 Within 10 yards North Side Westbound Good Control 5/6/11 5 68.7 635034 5235970 Elk 1 Within 10 yards North Side Westbound Moderate Project 5/7/11 5 32.8 593974 5258510 Elk 2 Within 10 yards South Side Eastbound Poor Control 5/8/11 5 69 635349 5235630 Elk 2 Within 10 yards North Side Westbound Moderate Project 5/8/11 5 64.3 629670 5239210 Elk 1 Within 10 yards North Side Westbound Moderate Project 5/8/11 20 37.5 599919 5255290 Deer 1 Outside 10 yards North Side Westbound Good Control
5/10/11 7 40.1 603719 5253760 Elk 3 Within 10 yards North Side Westbound Good Control 5/10/11 15 38 600746 5255280 Elk 4 Within 10 yards South Side Eastbound Good Control 5/10/11 7 42.6 606980 5251950 Elk 5 Within 10 yards North Side Westbound Good Control 5/11/11 18 41.9 606300 5252810 Elk 3 Outside 10 yards North Side Eastbound Good Control 5/11/11 7 41.8 606190 5252910 Elk 2 Within 10 yards North Side Westbound Good Control 5/11/11 14 39.9 603398 5253790 Deer 2 Within 10 yards North Side Eastbound Good Control 5/12/11 17 33.1 594430 5258520 Raptor 1 Within 10 yards North Side Eastbound Good Control 5/13/11 8 39.2 602394 5254350 Elk 3 Outside 10 yards North Side Westbound Good Control 5/13/11 18 37.7 600246 5255270 Elk 1 Within 10 yards South Side Eastbound Good Control 5/13/11 22 47 613463 5250330 Elk 2 Within 10 yards North Side Westbound Good Control 5/13/11 18 39.3 602524 5254260 Deer 4 Outside 10 yards North Side Eastbound Good Control 5/16/11 17 42.3 606686 5252350 Hawk 1 Within 10 yards North Side Eastbound Moderate Control 5/16/11 8 37.3 599617 5255360 Elk 2 Outside 10 yards North Side Westbound Moderate Control 5/18/11 12 35 597255 5257460 Hawk 1 Within 10 yards North Side Westbound Good Control 5/18/11 13 38 600746 5255280 Bluebird 1 Within 10 yards North Side Westbound Good Control 5/18/11 12 65.2 629997 5237810 Elk 2 Within 10 yards North Side Westbound Good Project 5/18/11 18 65.8 630573 5237060 Elk 3 Within 10 yards North Side Eastbound Good Project 5/20/11 5 68.3 634294 5236060 Elk 2 Outside 10 yards North Side Eastbound Good Project 5/21/11 7 66.5 631538 5236550 Deer 1 Within 10 yards North Side Westbound Good Project 5/22/11 16 39 602129 5254510 Deer 1 Within 10 yards North Side Westbound Good Control 5/22/11 19 42.5 606845 5252060 Elk 1 Within 10 yards North Side Westbound Good Control 5/22/11 20 39.2 602394 5254350 Deer 3 Outside 10 yards North Side Eastbound Moderate Control 5/23/11 2 61 625995 5242830 Elk 1 Within 10 yards North Side Westbound Poor Project 5/23/11 11 66.2 631068 5236680 Elk 6 Within 10 yards North Side Westbound Good Project 5/24/11 2 46.2 612133 5250240 Coyote 1 Within 10 yards North Side Eastbound Poor Control 5/24/11 4 61.1 626137 5242770 Elk 1 Within 10 yards South Side Eastbound Moderate Project 5/24/11 4 56.8 622539 5247860 Elk 2 Outside 10 yards North Side Westbound Moderate Project

Baseline wildlife monitoring at I-90 Snoqualmie Pass East Appendices
Western Transportation Institute Page 185
5/24/11 3 69 635200 5235360 Elk 3 Within 10 yards South Side Eastbound Poor Project 5/25/11 7 53.6 620055 5251950 Raptor 1 Within 10 yards North Side Westbound Good Control 5/25/11 5 66.6 631691 5236500 Deer 4 Within 10 yards North Side Westbound Moderate Project 5/26/11 19 65.1 629993 5237970 Deer 1 Within 10 yards North Side Westbound Moderate Project 5/27/11 4 63 628059 5240430 Elk 20 Outside 10 yards North Side Westbound Good Project 5/27/11 20 69.1 635340 5235320 Elk 2 Within 10 yards South Side Eastbound Good Project 5/28/11 5 69.3 635643 5235280 Elk 4 Outside 10 yards South Side Eastbound Good Project 5/29/11 19 58 623339 5246100 Fox 2 Within 10 yards South Side Eastbound Good Project 5/30/11 17 66.4 631380 5236590 Deer 2 Within 10 yards North Side Westbound Good Project 5/30/11 17 61.7 626795 5242070 Elk 1 Within 10 yards South Side Westbound Good Project 6/1/11 2 62.9 627947 5240530 Deer 1 Within 10 yards South Side Eastbound Poor Project 6/1/11 15 38.4 601336 5255050 Deer 1 In Median Eastbound Good Control 6/4/11 18 67.4 632936 5236500 Turkey 5 Outside 10 yards North Side Westbound Good Project 6/4/11 21 39 602129 5254510 Elk 1 Within 10 yards South Side Eastbound Moderate Control 6/5/11 10 38.2 601048 5255210 Hawk 1 Within 10 yards North Side Westbound Good Control 6/5/11 18 60.5 625270 5243190 Deer 1 Within 10 yards North Side Westbound Good Project 6/6/11 7 61.6 626689 5242190 Deer 2 Within 10 yards South Side Eastbound Good Project 6/7/11 15 60.6 625415 5243120 Goose 5 In Median Eastbound Good Project 6/8/11 8 45.5 611106 5250130 Deer 2 Outside 10 yards North Side Westbound Good Control 6/9/11 8 44.3 609210 5250570 Elk 1 Within 10 yards North Side Westbound Good Control
6/10/11 5 31 591051 5259570 Deer 2 Within 10 yards North Side Westbound Good Control 6/10/11 5 31 591051 5259570 Elk 1 Within 10 yards North Side Eastbound Good Control 6/10/11 5 46 611811 5250140 Elk 2 Within 10 yards North Side Westbound Good Control 6/11/11 17 48.9 616377 5250290 Black bear 1 Outside 10 yards North Side Eastbound Good Control 6/11/11 17 61.6 626689 5242190 Deer 1 Within 10 yards South Side Eastbound Good Project 6/11/11 20 54.3 620496 5251000 Deer 1 Within 10 yards North Side Westbound Moderate Control 6/12/11 14 44.4 609349 5250470 Deer 1 Within 10 yards North Side Westbound Good Control 6/13/11 8 37.9 600597 5255280 Hawk 1 Within 10 yards North Side Westbound Moderate Control 6/13/11 20 49 616533 5250340 Elk 1 Within 10 yards North Side Eastbound Moderate Control 6/13/11 20 38.5 601461 5254960 Deer 1 Within 10 yards South Side Eastbound Moderate Control 6/14/11 8 67.2 632611 5236520 Deer 1 Within 10 yards North Side Westbound Good Project 6/14/11 15 49.8 617488 5251080 Deer 1 In Median Eastbound Good Control 6/17/11 16 39 602129 5254510 Black bear 1 Outside 10 yards South Side Eastbound Good Control 6/19/11 17 59.9 624747 5243940 Deer 1 Within 10 yards North Side Westbound Good Project 6/19/11 17 58 623339 5246100 Deer 1 Within 10 yards North Side Westbound Good Project 6/20/11 7 66.7 631839 5236450 Deer 1 Outside 10 yards North Side Westbound Good Project 6/20/11 18 38.9 602008 5254600 Deer 1 Outside 10 yards North Side Eastbound Good Control 6/22/11 6 59.6 624397 5244290 Goose 5 Outside 10 yards South Side Westbound Good Project 6/22/11 11 38.7 601725 5254790 Elk 1 Outside 10 yards North Side Westbound Good Control 6/22/11 11 45.1 610477 5250240 Elk 2 Outside 10 yards North Side Westbound Good Control 6/24/11 18 38.6 601591 5254880 Deer 2 Within 10 yards North Side Westbound Moderate Control

Baseline wildlife monitoring at I-90 Snoqualmie Pass East Appendices
Western Transportation Institute Page 186
6/26/11 6 69.8 636430 5235110 Elk 6 Within 10 yards North Side Westbound Good Project 6/26/11 8 38.4 601336 5255050 Elk 7 On Highway Westbound Good Control 6/27/11 12 68.5 634678 5236120 Deer 1 Within 10 yards North Side Westbound Good Project 6/27/11 19 65.8 630573 5237060 Deer 1 Within 10 yards South Side Eastbound Good Project 6/28/11 6 40.3 604013 5253740 Elk 1 On Highway Eastbound Good Control 6/28/11 5 66.7 631839 5236450 Deer 1 Within 10 yards South Side Eastbound Good Project 6/29/11 11 64.9 629916 5238280 Deer 1 Within 10 yards North Side Westbound Good Project 6/30/11 19 37.7 600246 5255270 Vulture 1 In Median Eastbound Good Control 6/30/11 9 69.2 635499 5235290 Deer 1 Within 10 yards North Side Eastbound Good Project 7/1/11 16 69 635200 5235360 Deer 1 In Median Eastbound Moderate Project 7/2/11 9 38.4 601336 5255050 Vulture 4 Within 10 yards South Side Westbound Good Control 7/3/11 0 58.4 623511 5245550 Deer 1 Within 10 yards North Side Westbound Poor Project 7/3/11 7 56.8 622539 5247860 Deer 2 Within 10 yards North Side Eastbound Good Project 7/4/11 6 43.7 608401 5251050 Elk 1 Within 10 yards North Side Westbound Good Control 7/5/11 7 53.1 619867 5252680 Black bear 1 On Highway Westbound Good Control 7/5/11 7 60.4 625132 5243270 Goose 2 Outside 10 yards South Side Westbound Good Project 7/5/11 21 38.5 601461 5254960 Elk 2 Within 10 yards South Side Eastbound Moderate Control 7/6/11 12 57.1 622796 5247450 Black bear 1 Within 10 yards North Side Eastbound Good Project 7/6/11 17 60.7 625564 5243040 Deer 1 Within 10 yards North Side Westbound Good Project 7/6/11 15 50.5 617340 5252800 Deer 2 Within 10 yards North Side Eastbound Good Control 7/7/11 7 68.6 634870 5236060 Deer 1 In Median Westbound Good Project 7/7/11 20 59 623579 5244600 Deer 1 Within 10 yards North Side Eastbound Good Project
7/10/11 9 49.9 617150 5251920 Black bear 1 On Highway Westbound Good Control 7/12/11 15 55.5 622025 5249830 Eagle 1 Outside 10 yards South Side Eastbound Good Project 7/12/11 13 56.5 622510 5248390 Eagle 2 Outside 10 yards North Side Eastbound Good Project 7/13/11 13 68.5 634678 5236120 Deer 1 In Median Westbound Good Project 7/15/11 19 64.4 629718 5239050 Deer 1 Within 10 yards North Side Westbound Good Project 7/18/11 7 69.1 635429 5235520 Deer 1 Within 10 yards North Side Westbound Good Project 7/18/11 18 68.9 635045 5235440 Deer 1 In Median Eastbound Good Project 7/21/11 7 68 633983 5236530 Deer 1 In Median Westbound Good Project 7/21/11 8 46.1 611979 5250200 Deer 1 Within 10 yards North Side Westbound Moderate Control 7/22/11 7 59.7 624536 5244200 Deer 1 Within 10 yards North Side Westbound Good Project 7/23/11 10 48.6 615979 5250630 Hawk 3 In Median Westbound Good Control 7/26/11 20 61.7 626795 5242070 Elk 2 On Highway Westbound Good Project 8/2/11 8 54.2 620434 5251140 Black bear 1 On Highway Westbound Good Control 8/5/11 7 34.1 595921 5258060 Deer 2 On Highway Westbound Good Control 8/5/11 18 70 636643 5234900 Deer 1 Within 10 yards South Side Eastbound Good Project 8/9/11 7 37.8 600419 5255270 Deer 1 Outside 10 yards North Side Westbound Good Control
8/19/11 17 53.1 619867 5252680 Moose 1 Outside 10 yards North Side Westbound Good Control 8/29/11 0 38.7 601725 5254790 Deer 1 On Highway Eastbound Moderate Control 8/30/11 9 31 591051 5259570 Deer 1 On Highway Eastbound Good Control

Baseline wildlife monitoring at I-90 Snoqualmie Pass East Appendices
Western Transportation Institute Page 187
9/7/11 7 55.5 622025 5249830 Otter 2 In Median Eastbound Good Project 9/10/11 16 67.9 633791 5236650 Deer 2 Within 10 yards South Side Westbound Good Project 10/4/11 8 69.8 636430 5235110 Osprey 1 Within 10 yards North Side Westbound Good Project 10/8/11 11 66.5 631538 5236550 Deer 3 Within 10 yards North Side Westbound Good Project 10/8/11 11 66.5 631538 5236550 Deer 1 Within 10 yards North Side Westbound Good Project 11/1/11 15 49.3 617013 5250460 Black bear 1 On Highway Eastbound Good Control
11/15/11 19 38.1 600909 5255250 Deer 1 On Highway Westbound Poor Control 11/29/11 14 55.4 621886 5249910 Hare 1 On Highway Eastbound Good Project 12/22/11 15 31 591051 5259570 Elk 1 Within 10 yards North Side Westbound Good Control 12/25/11 16 49.5 617179 5251280 Cougar/Mountain lion 1 Within 10 yards South Side Westbound Moderate Control
1/2/12 14 52.1 619287 5253920 Deer 1 Within 10 yards North Side Westbound Good Control 2/18/12 9 55.1 621411 5250190 Fox 1 Within 10 yards South Side Westbound Good Project 2/22/12 16 38.5 601461 5254960 Coyote 1 Within 10 yards South Side Westbound Good Control 2/22/12 16 36.4 598323 5255630 Elk 1 Within 10 yards North Side Westbound Good Control 2/27/12 15 35.9 597899 5256250 Hawk 1 In Median Eastbound Good Control 2/29/12 15 34.6 596617 5257730 Turkey 1 Within 10 yards North Side Westbound Good Control 3/3/12 16 38.3 601197 5255140 Fox 1 Outside 10 yards South Side Westbound Good Control 3/3/12 16 31 591051 5259570 Turkey 1 On Highway Westbound Good Control 3/4/12 15 35.2 597509 5257310 Turkey 1 Within 10 yards North Side Westbound Good Control 3/7/12 9 50.9 618072 5252730 Turkey 1 Within 10 yards North Side Eastbound Good Control
3/20/12 8 38.2 601048 5255210 Coyote 1 On Highway Eastbound Good Control 3/21/12 12 34.2 596060 5257990 Hawk 1 Within 10 yards North Side Westbound Good Control 3/27/12 17 46.2 612133 5250240 Elk 5 In Median Eastbound Good Control 3/28/12 0 61.8 626901 5241950 Woodrat 1 On Highway Eastbound Moderate Project 3/28/12 0 34.7 596775 5257670 Elk 2 On Highway Eastbound Poor Control 4/1/12 14 35.8 597836 5256420 Deer 2 Outside 10 yards North Side Westbound Good Control 4/5/12 18 57.2 622863 5247280 Otter 1 Outside 10 yards South Side Eastbound Good Project 4/6/12 17 35.8 597836 5256420 Deer 1 Within 10 yards South Side Eastbound Good Control 4/9/12 18 41 605091 5253530 Elk 5 Within 10 yards South Side Eastbound Good Control
4/10/12 19 40.4 604181 5253780 Elk 6 Within 10 yards South Side Eastbound Good Control 4/10/12 18 43 607479 5251580 Elk 1 Within 10 yards South Side Eastbound Good Control 4/14/12 16 42.1 606519 5252620 Elk 1 Within 10 yards South Side Eastbound Good Control 4/23/12 7 42.1 606519 5252620 Elk 7 Within 10 yards South Side Eastbound Good Control 4/24/12 17 44.2 609085 5250680 Elk 1 Within 10 yards North Side Westbound Good Control 4/28/12 17 47.4 614109 5250390 Raccoon 1 On Highway Westbound Good Control 4/29/12 19 65.1 629993 5237970 Elk 2 Within 10 yards North Side Westbound Good Project 5/3/12 8 37.2 599449 5255360 Deer 1 On Highway Eastbound Good Control 5/5/12 19 67.4 632936 5236500 Elk 1 Within 10 yards North Side Westbound Good Project 5/6/12 18 39.1 602270 5254440 Black bear 1 Outside 10 yards North Side Eastbound Good Control 5/6/12 1 47.2 613783 5250370 Elk 2 Within 10 yards South Side Eastbound Poor Control 5/6/12 17 68 633874 5236250 Elk 2 Within 10 yards South Side Eastbound Good Project

Baseline wildlife monitoring at I-90 Snoqualmie Pass East Appendices
Western Transportation Institute Page 188
5/6/12 19 68.4 634438 5235970 Elk 2 Within 10 yards South Side Eastbound Good Project 5/7/12 19 69.4 635806 5235260 Black bear 1 On Highway Eastbound Good Project 5/7/12 19 68.8 634899 5235550 Elk 3 Within 10 yards South Side Eastbound Good Project 5/8/12 8 36 597944 5256090 Elk 4 Within 10 yards South Side Eastbound Good Control 5/9/12 3 43.2 607685 5251350 Elk 1 Within 10 yards South Side Eastbound Poor Control
5/11/12 10 48 615048 5250100 Mouse 1 On Highway Eastbound Good Control 5/15/12 13 62.1 627247 5241560 Goose 2 Within 10 yards North Side Westbound Good Project 5/16/12 20 41.6 606007 5253150 Elk 3 Within 10 yards South Side Eastbound Moderate Control 5/19/12 18 66.7 598559 5255440 Deer 1 Within 10 yards North Side Westbound Good Control 5/19/12 18 36.6 631839 5236450 Deer 1 Within 10 yards North Side Westbound Good Project 5/20/12 20 56.9 622587 5247700 Elk 2 Outside 10 yards North Side Westbound Good Project 5/21/12 9 55.1 621411 5250190 Eagle 1 Outside 10 yards South Side Eastbound Good Project 5/22/12 6 69 635200 5235360 Elk 1 Within 10 yards South Side Eastbound Good Project 5/26/12 10 57.5 622858 5246780 Deer 1 Within 10 yards North Side Westbound Good Project 5/26/12 17 66.9 632155 5236380 Deer 1 Within 10 yards North Side Westbound Good Project 5/29/12 6 44.5 609507 5250410 Deer 1 In Median Westbound Good Control 6/1/12 8 68.1 620055 5251950 Elk 1 Within 10 yards North Side Westbound Good Control 6/1/12 8 67.4 634107 5236450 Deer 1 Within 10 yards North Side Westbound Good Project 6/1/12 9 61.8 632936 5236500 Deer 2 Within 10 yards North Side Eastbound Good Project 6/1/12 11 63.5 626901 5241950 Deer 2 Within 10 yards South Side Westbound Good Project 6/1/12 17 53.6 628720 5240010 Deer 1 Within 10 yards North Side Westbound Moderate Project 6/4/12 6 68.9 635045 5235440 Deer 1 Outside 10 yards South Side Eastbound Moderate Project
6/24/12 20 66.5 631538 5236550 Deer 1 On Highway Eastbound Good Project 6/27/12 18 68.3 634294 5236060 Deer 1 Outside 10 yards North Side Eastbound Good Project 6/28/12 12 67 632309 5236430 Deer 1 Within 10 yards North Side Westbound Good Project 6/28/12 13 61.6 626689 5242190 Deer 2 Outside 10 yards South Side Eastbound Good Project 6/28/12 17 63.4 628572 5240060 Deer 2 Within 10 yards North Side Westbound Good Project 6/29/12 18 52.7 619963 5253280 Deer 1 Within 10 yards North Side Westbound Good Control 6/30/12 23 40.5 604334 5253800 Cougar/Mountain lion 1 On Highway Eastbound Moderate Control

Baseline wildlife monitoring at I-90 Snoqualmie Pass East Appendices
Western Transportation Institute Page 189
Appendix 3.1. Conditions and representative crossing photos from 12 structures monitored during 2008–2012.
Gold Creek Bridges
Gold Creek Bridge NE (right bank) and NW (left bank). (Photo: WSDOT)
(A) Coyote crossing from north to south under eastbound lanes of I-90 on west bank of Gold Creek. (B) Deer crossing from south to north under westbound lanes of I-90 on east bank of Gold Creek. (Photos: WTI)

Baseline wildlife monitoring at I-90 Snoqualmie Pass East Appendices
Western Transportation Institute Page 190
An adult deer and fawn pass from north to south under the Gold Creek North Bridge. (Photo: WTI)

Baseline wildlife monitoring at I-90 Snoqualmie Pass East Appendices
Western Transportation Institute Page 191
Price Creek Culvert
Price Creek Culvert south entrance. (Photo: WTI)
Price Creek Culvert north entrance. (Photo: WTI)

Baseline wildlife monitoring at I-90 Snoqualmie Pass East Appendices
Western Transportation Institute Page 192
A. B. A deer (A) enters the Price Creek Culvert, but (B) turns around and does not complete the crossing. (Photos: WTI)
A bobcat—the first to cross in this culvert and only the second to cross in any monitored culvert—crosses through the Price Creek Culvert. (Photo: WTI)

Baseline wildlife monitoring at I-90 Snoqualmie Pass East Appendices
Western Transportation Institute Page 193
The first (and only) black bear detected using culverts monitored by WTI. This individual crossed through the Price Creek Culvert three times within a span of a week, but was detected moving only from north to south. We thus suspect that s/he crossed back to the north over the highway. (Photo: WTI)
A mink venturing into the Price Creek Culvert during high water flow. The mink, the first detected in this culvert, aborted two apparent crossing attempts within a 30-minute period. (Photo: WTI)

Baseline wildlife monitoring at I-90 Snoqualmie Pass East Appendices
Western Transportation Institute Page 194
Bonnie Creek Culvert
A. B. Bonnie Creek Culvert south entrance (A) and opening to median (B). (Photo: WTI)
A mink pauses in the Bonnie Creek Culvert. The mink, the first detected in this culvert, aborted the crossing just after this photo was taken. (Photo: WTI)

Baseline wildlife monitoring at I-90 Snoqualmie Pass East Appendices
Western Transportation Institute Page 195
Swamp Creek Culverts
South entrance of paired Swamp Creek Culverts. (Photo: WTI)
North entrance of Swamp Creek West Culvert. (Photo: WTI)

Baseline wildlife monitoring at I-90 Snoqualmie Pass East Appendices
Western Transportation Institute Page 196
Otter in Swamp Creek West Culvert. (Photo: WTI) Otters in Swamp Creek East Culvert. (Photo: WTI)
Three otters, one carrying a fish, in the Swamp Creek West Culvert. (Photo: WTI)

Baseline wildlife monitoring at I-90 Snoqualmie Pass East Appendices
Western Transportation Institute Page 197
Raccoon in Swamp Creek East Culvert, with bats overhead. (Photo: WTI)
Ducks in Swamp Creek East Culvert. (Photo: WTI)
Mink in Swamp Creek East Culvert. (Photo: WTI)

Baseline wildlife monitoring at I-90 Snoqualmie Pass East Appendices
Western Transportation Institute Page 198
Cedar Creek Culvert
Cedar Creek Culvert south entrance with dropoff. (Photo: WTI)
Cedar Creek Culvert north entrance. (Photo: WTI)
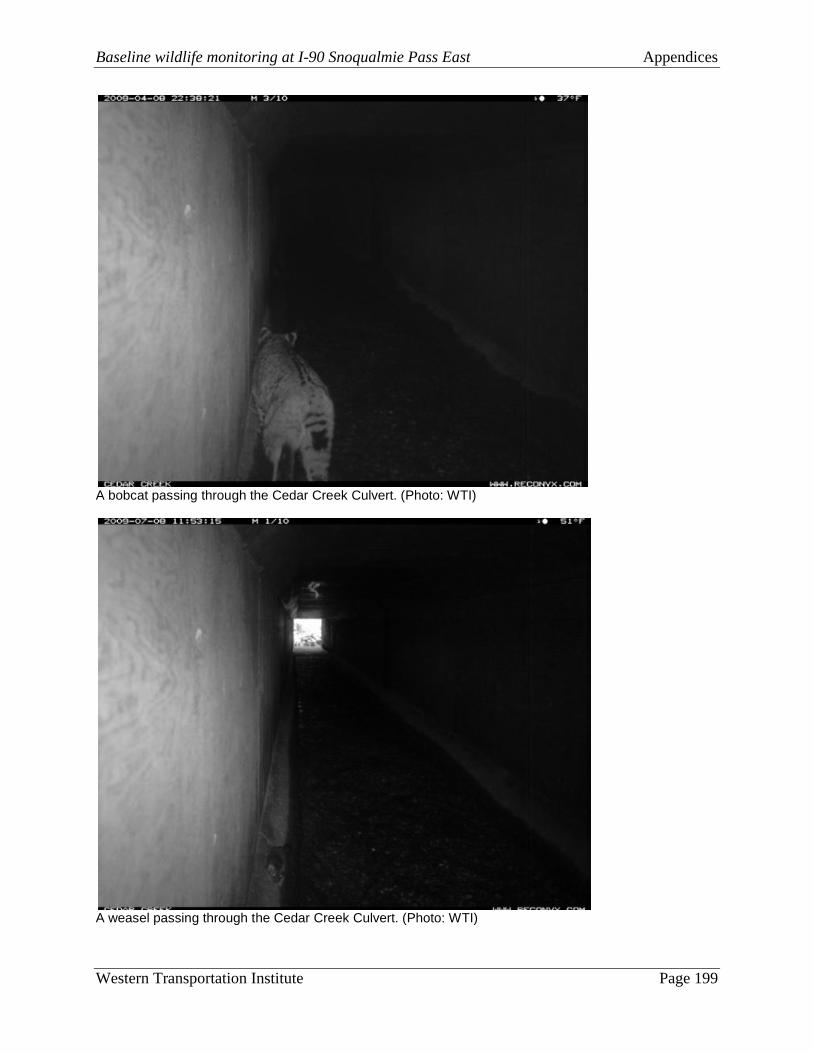
Baseline wildlife monitoring at I-90 Snoqualmie Pass East Appendices
Western Transportation Institute Page 199
A bobcat passing through the Cedar Creek Culvert. (Photo: WTI)
A weasel passing through the Cedar Creek Culvert. (Photo: WTI)

Baseline wildlife monitoring at I-90 Snoqualmie Pass East Appendices
Western Transportation Institute Page 200
Unnamed Creek Culvert
Unnamed Creek Culvert north entrance. (Photo: WTI)

Baseline wildlife monitoring at I-90 Snoqualmie Pass East Appendices
Western Transportation Institute Page 201
A bobcat—the first and only detected at this culvert— tentatively moves into the Unnamed Creek Culvert. The individual aborted the crossing just after the photo was taken. (Photo: WTI)
A mountain beaver in the Unnamed Creek Culvert. (Photo: WTI)

Baseline wildlife monitoring at I-90 Snoqualmie Pass East Appendices
Western Transportation Institute Page 202
Telephone Creek Culvert
Telephone Creek Culvert south entrance with dropoff. (Photo: WTI)
American dipper inside the Telephone Creek Culvert. (Photo: WTI)

Baseline wildlife monitoring at I-90 Snoqualmie Pass East Appendices
Western Transportation Institute Page 203
Hudson Creek Culvert
Hudson Creek Culvert south entrance with dropoff. (Photo: WTI)
Raccoons cross through Hudson Creek Culvert. (Photo: WTI)

Baseline wildlife monitoring at I-90 Snoqualmie Pass East Appendices
Western Transportation Institute Page 204
Sparks Underpasses
Sparks Road Bridge South. (Photo: WSDOT)
Sparks Road Bridge North. (Photo: WSDOT)

Baseline wildlife monitoring at I-90 Snoqualmie Pass East Appendices
Western Transportation Institute Page 205
A deer passes under the Sparks Road Bridge North, moving from south to north and exiting the “island” between east and westbound lanes west of Easton. (Photo: WTI)
A deer looks up at traffic as it approaches Sparks Road Bridge North. (Photo: WTI)

Baseline wildlife monitoring at I-90 Snoqualmie Pass East Appendices
Western Transportation Institute Page 206
A deer crosses under the Sparks Road Bridge South. (Photo: WTI)
A bull elk near the Sparks Road Bridge North. (Photo: WTI)

Baseline wildlife monitoring at I-90 Snoqualmie Pass East Appendices
Western Transportation Institute Page 207
Appendix 3.2. Crossings recorded for species-of-interest (i.e., large mammals) including location, camera number, date, time, period-of-day (as defined in Chapter 3; Day, Night, C-DA=crepuscular day, C-DU=crepuscular dusk), species, number of individuals, and heading (N=north, S=south).
Location Name Camera Date Time Period Species Number Heading Sparks_S RC60-1 6/3/08 16:26 Day Deer 1 N Sparks_N RC60-2 6/8/08 16:48 Day Deer 1 N Sparks_N RC60-2 6/8/08 20:11 C-DU Deer 1 S Sparks_N RC60-2 6/10/08 15:36 Day Deer 1 S Sparks_S RC60-1 6/15/08 5:17 C-DA Deer 1 N Sparks_N RC60-2 6/19/08 9:07 Day Deer 1 S Sparks_S RC60-1 6/19/08 9:32 Day Deer 1 S Swamp_Creek IR-3 6/28/08 15:54 Day Beaver 1 S Sparks_S RC60-1 7/6/08 5:44 C-DA Deer 1 N Swamp_Creek_E IR-3 7/18/08 10:34 Day Mink 1 N Swamp_Creek_W IR-6 7/18/08 3:25 Night Raccoon 1 S Swamp_Creek_E IR-3 7/19/08 3:01 Night River_otter 2 S Swamp_Creek_E IR-3 7/20/08 4:31 C-DA Raccoon 1 N Swamp_Creek_W IR-6 7/21/08 8:42 Day River_otter 1 N Sparks_S RC60-1 7/31/08 9:13 Day Deer 1 N Sparks_N RC60-2 8/8/08 10:59 Day Deer 1 S Sparks_S RC60-1 10/9/08 23:08 Night Coyote 1 S Gold_Creek_NE RC60-3 10/12/08 22:08 Night Deer 1 S Swamp_Creek_E IR-3 10/12/08 23:34 Night Raccoon 1 S Gold_Creek_NE RC60-3 11/2/08 0:19 Night Deer 1 N Gold_Creek_NW RC60-1 1/19/09 4:50 Night Coyote 1 S Gold_Creek_NW RC60-1 2/10/09 3:19 Night Coyote 2 S Swamp_Creek_W IR-6 3/20/09 20:51 Night Raccoon 1 N Swamp_Creek_E IR-3 3/21/09 12:02 Day River_otter 1 N Swamp_Creek_E IR-3 3/22/09 15:32 Day Mink 1 N Swamp_Creek_E IR-3 3/27/09 21:20 Night Mink 1 N Swamp_Creek_E IR-3 3/28/09 16:19 Day Mink 1 N Bonnie_Creek IR-1 4/4/09 10:52 Day Weasel 1 N Swamp_Creek_E IR-3 4/5/09 22:19 Night Mink 1 N Swamp_Creek_E IR-3 4/7/09 22:08 Night Mink 1 N Cedar_Creek IR-5 4/8/09 22:38 Night Bobcat 1 N Swamp_Creek_E IR-3 4/11/09 20:47 C-DU Mink 1 N Swamp_Creek_E IR-3 4/15/09 22:35 Night Beaver 1 S Gold_Creek_NW RC60-1 4/21/09 16:59 Day Beaver 1 N Swamp_Creek_E IR-3 4/24/09 4:26 Night Beaver 1 N Swamp_Creek_E IR-3 4/28/09 23:28 Night Raccoon 1 N Swamp_Creek_E IR-3 4/30/09 8:51 Day Mink 1 N Swamp_Creek_E IR-3 5/3/09 3:32 Night Beaver 1 N Swamp_Creek_E IR-3 5/3/09 3:57 Night Beaver 1 S

Baseline wildlife monitoring at I-90 Snoqualmie Pass East Appendices
Western Transportation Institute Page 208
Swamp_Creek_W IR-6 5/16/09 8:24 Day Mink 1 N Bonnie_Creek IR-1 5/20/09 22:52 Night Weasel 1 N Sparks_N RC60-2 5/22/09 9:21 Day Deer 1 S Sparks_N RC60-2 5/27/09 8:15 Day Deer 1 S Swamp_Creek_E IR-3 5/27/09 4:43 C-DA Raccoon 1 S Swamp_Creek_E IR-3 6/1/09 6:44 Day Beaver 1 S Gold_Creek_NW RC60-1 6/3/09 1:28 Night Beaver 1 S Sparks_N RC60-2 6/13/09 13:46 Day Deer 1 N Swamp_Creek_E IR-3 6/14/09 7:26 Day Beaver 1 N Swamp_Creek_E IR-3 6/19/09 1:11 Night Mink 1 N Swamp_Creek_E IR-3 6/25/09 12:29 Day Mink 1 N Gold_Creek_NW RC60-1 6/27/09 9:42 Day Beaver 1 N Sparks_S RC60-4 6/29/09 20:00 Day Deer 1 S Swamp_Creek_E IR-3 6/29/09 4:45 C-DA Raccoon 1 N Swamp_Creek_E IR-3 6/29/09 23:52 Night Raccoon 1 N Sparks_N RC60-2 6/30/09 5:56 C-DA Deer 1 S Swamp_Creek_E IR-3 6/30/09 5:02 C-DA Raccoon 1 S Swamp_Creek_E IR-3 6/30/09 23:50 Night Raccoon 1 S Sparks_N RC60-2 7/1/09 7:53 Day Deer 1 N Sparks_N RC60-2 7/1/09 11:44 Day Deer 1 N Swamp_Creek_E IR-3 7/1/09 7:29 Day Raccoon 1 S Swamp_Creek_E IR-3 7/5/09 2:10 Night Raccoon 1 N Swamp_Creek_E IR-3 7/5/09 22:52 Night Raccoon 1 S Gold_Creek_NW RC60-1 7/6/09 4:48 C-DA Deer 1 N Sparks_S RC60-4 7/7/09 8:35 Day Deer 1 N Swamp_Creek_E IR-3 7/8/09 8:15 Day Raccoon 1 S Sparks_N RC60-2 7/12/09 6:40 Day Deer 1 N Sparks_N RC60-2 7/12/09 8:19 Day Deer 1 S Sparks_S RC60-4 7/12/09 8:36 Day Deer 1 S Sparks_N RC60-2 7/13/09 18:28 Day Deer 1 N Swamp_Creek_E IR-3 7/13/09 2:52 Night Raccoon 1 N Gold_Creek_NE RC60-2 7/14/09 3:28 Night Deer 2 S Gold_Creek_NE RC60-2 7/14/09 3:37 Night Deer 2 N Gold_Creek_NE RC60-2 7/14/09 8:27 Day Deer 1 S Sparks_N RC60-2 7/16/09 4:28 C-DA Deer 1 S Sparks_N RC60-2 7/16/09 21:58 Night Deer 1 N Sparks_S RC60-4 7/16/09 9:47 Day Deer 1 N Swamp_Creek_E IR-3 7/16/09 4:15 Night Raccoon 1 S Swamp_Creek_E IR-3 7/19/09 7:57 Day Raccoon 1 S Sparks_N RC60-2 7/20/09 20:33 C-DU Deer 1 N Swamp_Creek_W IR-6 7/23/09 12:52 Day River_otter 3 S Swamp_Creek_W IR-6 7/26/09 11:48 Day River_otter 3 S

Baseline wildlife monitoring at I-90 Snoqualmie Pass East Appendices
Western Transportation Institute Page 209
Swamp_Creek_E IR-3 7/27/09 9:43 Day Weasel 1 N Swamp_Creek_E IR-3 7/28/09 5:51 C-DA Raccoon 1 S Swamp_Creek_E IR-3 7/30/09 5:14 C-DA Raccoon 1 S Sparks_N RC60-2 7/31/09 21:16 C-DU Deer 1 N Sparks_N RC60-2 8/1/09 5:50 C-DA Deer 1 S Swamp_Creek_E IR-3 8/1/09 5:44 C-DA Raccoon 1 S Hudson_Creek RM45-1 8/3/09 4:09 Night Raccoon 1 N Swamp_Creek_E IR-3 8/3/09 12:02 Day Raccoon 1 S Gold_Creek_NE RC60-2 8/4/09 20:36 C-DU Deer 1 N Sparks_N RC60-2 8/4/09 10:12 Day Deer 1 S Swamp_Creek_E IR-3 8/7/09 5:45 C-DA Raccoon 1 S Sparks_N RC60-2 8/11/09 8:57 Day Deer 1 N Sparks_N RC60-2 8/12/09 9:11 Day Deer 1 N Sparks_N RC60-2 8/12/09 16:09 Day Deer 1 S Gold_Creek_NE RC60-2 8/13/09 19:32 C-DU Deer 2 S Hudson_Creek RM45-1 8/13/09 23:32 Night Raccoon 1 S Cedar_Creek IR-5 8/16/09 8:59 Day Weasel 1 N Swamp_Creek_W IR-6 8/16/09 1:37 Night Weasel 1 N Swamp_Creek_E IR-3 8/17/09 12:56 Day Weasel 1 N Swamp_Creek_E IR-3 8/18/09 13:56 Day Mink 1 N Price_Creek IR-4 8/18/09 3:23 Night Raccoon 1 S Swamp_Creek_E IR-3 8/19/09 17:17 Day Mink 1 N Bonnie_Creek IR-1 8/20/09 18:14 Day Weasel 1 N Sparks_N RC60-2 8/21/09 7:25 Day Deer 1 N Swamp_Creek_E IR-3 8/21/09 21:20 Night Raccoon 1 N Gold_Creek_NE RC60-2 8/22/09 9:28 Day Deer 1 S Swamp_Creek_E IR-3 8/22/09 11:41 Day Weasel 1 N Sparks_N RC60-2 8/24/09 9:34 Day Deer 1 S Sparks_N RC60-2 8/24/09 23:44 Night Deer 1 N Swamp_Creek_E IR-3 8/25/09 2:45 Night Raccoon 1 S Bonnie_Creek IR-1 8/25/09 14:31 Day Weasel 1 N Bonnie_Creek IR-1 8/25/09 15:14 Day Weasel 1 S Bonnie_Creek IR-1 8/25/09 17:15 Day Weasel 1 N Sparks_N RC60-2 8/26/09 7:18 Day Deer 1 N Swamp_Creek_W IR-6 8/26/09 11:34 Day River_otter 1 S Swamp_Creek_W IR-6 8/27/09 22:23 Night River_otter 2 S Sparks_N RC60-2 8/29/09 20:38 C-DU Deer 1 N Bonnie_Creek IR-1 8/29/09 11:38 Day Weasel 1 N Swamp_Creek_E IR-3 8/30/09 4:32 Night Mink 1 N Bonnie_Creek IR-1 8/30/09 9:32 Day Weasel 1 N Swamp_Creek_E IR-3 8/31/09 8:09 Day Weasel 1 N Bonnie_Creek IR-1 9/1/09 12:57 Day Weasel 1 S

Baseline wildlife monitoring at I-90 Snoqualmie Pass East Appendices
Western Transportation Institute Page 210
Swamp_Creek_E IR-3 9/3/09 3:31 Night Mink 1 N Sparks_S RC60-4 9/6/09 0:03 Night Deer 1 N Sparks_S RC60-4 9/7/09 0:00 Night Deer 1 N Sparks_N RC60-2 9/8/09 20:15 C-DU Deer 1 N Swamp_Creek_E IR-3 9/10/09 0:00 Night Weasel 1 N Price_Creek IR-4 9/11/09 2:57 Night Raccoon 1 S Swamp_Creek_E IR-3 9/11/09 23:15 Night Raccoon 1 N Cedar_Creek IR-5 9/12/09 4:59 Night Weasel 1 N Cedar_Creek IR-5 9/12/09 5:41 C-DA Weasel 1 S Swamp_Creek_E IR-3 9/13/09 12:17 Day Mink 1 N Sparks_N RC60-2 9/13/09 7:09 C-DA Deer 1 S Sparks_N RC60-2 9/16/09 20:16 Night Deer 1 N Cedar_Creek IR-5 9/16/09 21:52 Night Weasel 1 N Sparks_N RC60-2 9/19/09 6:30 C-DA Deer 1 S Swamp_Creek_E IR-3 9/26/09 12:56 Day Weasel 1 N Bonnie_Creek IR-1 9/27/09 13:29 Day Weasel 1 S Swamp_Creek_W IR-6 10/2/09 11:41 Day River_otter 1 S Cedar_Creek IR-5 10/9/09 21:25 Night Raccoon 1 S Cedar_Creek IR-5 10/10/09 20:03 Night Raccoon 1 N Swamp_Creek_E IR-3 10/13/09 21:27 Night Raccoon 1 N Swamp_Creek_W IR-6 10/15/09 23:11 Night Beaver 1 N Swamp_Creek_W IR-6 10/15/09 23:47 Night Beaver 1 S Sparks_N RC60-2 10/15/09 6:40 C-DA Deer 1 N Sparks_N RC60-2 10/15/09 6:43 C-DA Deer 1 N Swamp_Creek_E IR-3 10/15/09 6:41 C-DA Raccoon 1 N Swamp_Creek_W IR-6 10/17/09 3:34 Night Beaver 1 N Swamp_Creek_E IR-3 10/17/09 20:11 Night Mink 1 N Swamp_Creek_W IR-6 10/18/09 3:35 Night Beaver 1 N Bonnie_Creek IR-1 10/19/09 8:16 C-DA Weasel 1 S Swamp_Creek_W IR-6 10/20/09 23:00 Night Beaver 1 N Swamp_Creek_E IR-3 10/20/09 5:00 Night Raccoon 1 N Bonnie_Creek IR-1 10/20/09 11:02 Day Weasel 1 N Swamp_Creek_W IR-6 10/21/09 1:37 Night Beaver 1 S Swamp_Creek_W IR-6 10/21/09 20:51 Night Beaver 1 N Swamp_Creek_W IR-6 10/22/09 23:13 Night Raccoon 1 N Swamp_Creek_E IR-3 10/26/09 4:54 Night Mink 1 N Swamp_Creek_W IR-6 10/26/09 11:17 Day River_otter 1 S Swamp_Creek_W IR-6 10/27/09 9:11 Day Beaver 1 N Swamp_Creek_W IR-6 10/31/09 19:59 Night Beaver 1 S Swamp_Creek_E IR-3 11/1/09 2:31 Night Beaver 1 N Swamp_Creek_W IR-6 11/1/09 3:17 Night Beaver 1 N Swamp_Creek_E IR-3 11/6/09 10:41 Day River_otter 4 S

Baseline wildlife monitoring at I-90 Snoqualmie Pass East Appendices
Western Transportation Institute Page 211
Swamp_Creek_E IR-3 11/8/09 20:03 Night Beaver 1 N Bonnie_Creek IR-1 11/9/09 21:25 Night Weasel 1 N Swamp_Creek_E IR-3 11/10/09 20:06 Night Mink 1 N Swamp_Creek_E IR-3 11/12/09 22:42 Night Raccoon 1 S Swamp_Creek_E IR-3 11/14/09 22:25 Night Raccoon 1 N Cedar_Creek IR-5 11/23/09 20:31 Night Weasel 1 N Swamp_Creek_E IR-3 11/30/09 23:47 Night Raccoon 1 S Swamp_Creek_E IR-3 12/1/09 5:48 Night Raccoon 1 N Gold_Creek_NW PC90-2(HO) 12/7/09 19:01 Night Coyote 2 S Cedar_Creek IR-5 12/15/09 22:38 Night Weasel 1 N Cedar_Creek IR-5 12/20/09 4:31 Night Weasel 1 N Gold_Creek_NW PC90-2(HO) 12/26/09 2:29 Night Coyote 1 N Cedar_Creek IR-5 1/5/10 23:07 Night Weasel 1 N Cedar_Creek IR-5 1/7/10 1:26 Night Weasel 1 N Swamp_Creek_E IR-3 1/12/10 4:43 Night Raccoon 1 S Swamp_Creek_E IR-3 1/12/10 21:38 Night Raccoon 1 N Cedar_Creek IR-5 1/13/10 0:27 Night Weasel 1 N Swamp_Creek_E IR-3 1/23/10 22:26 Night Mink 1 N Swamp_Creek_E IR-3 1/28/10 0:33 Night Raccoon 1 N Swamp_Creek_E IR-3 2/6/10 23:16 Night Raccoon 1 S Swamp_Creek_E IR-3 2/13/10 21:59 Night Raccoon 1 S Swamp_Creek_E IR-3 2/15/10 22:38 Night Raccoon 1 S Swamp_Creek_E IR-3 2/16/10 4:04 Night Raccoon 1 N Swamp_Creek_E IR-3 2/16/10 19:12 Night Raccoon 1 S Swamp_Creek_E IR-3 2/17/10 4:38 Night Raccoon 1 S Cedar_Creek IR-5 2/19/10 3:37 Night Weasel 1 N Cedar_Creek IR-5 3/11/10 4:00 Night Weasel 1 N Cedar_Creek IR-5 3/20/10 10:48 Day Weasel 1 N Swamp_Creek_E IR-3 3/26/10 7:22 C-DA Mink 1 N Swamp_Creek_E IR-3 3/28/10 12:59 Day Mink 1 N Swamp_Creek_E IR-3 3/30/10 20:25 C-DU Mink 1 N Swamp_Creek_E IR-3 4/14/10 2:02 Night Raccoon 1 S Swamp_Creek_E IR-3 5/4/10 21:55 Night Mink 1 N Swamp_Creek_W IR-6 5/4/10 21:44 Night Mink 1 N Bonnie_Creek IR-1 5/5/10 23:52 Night Weasel 1 N Swamp_Creek_E IR-3 5/9/10 4:15 Night Raccoon 1 S Sparks_N RC60-6 5/14/10 9:59 Day Deer 1 S Sparks_S RC60-4 5/15/10 6:11 C-DA Deer 1 S Price_Creek IR-4 5/16/10 4:04 Night Beaver 1 N Sparks_N RC60-6 5/18/10 5:04 C-DA Deer 1 S Sparks_S RC60-4 5/18/10 7:09 Day Deer 2 S Sparks_S RC60-4 5/18/10 7:12 Day Deer 2 N

Baseline wildlife monitoring at I-90 Snoqualmie Pass East Appendices
Western Transportation Institute Page 212
Swamp_Creek_E P-1 5/20/10 22:48 Night Beaver 1 S Sparks_S RC60-4 5/21/10 6:42 Day Deer 1 N Sparks_S RC60-4 5/21/10 7:31 Day Deer 1 S Swamp_Creek_E P-1 5/22/10 13:09 Day Beaver 1 S Sparks_N RC60-6 5/22/10 6:10 C-DA Deer 3 S Sparks_N RC60-6 5/22/10 7:49 Day Deer 2 N Gold_Creek_NE RC60-2 5/24/10 22:26 Night Deer 1 S Sparks_N RC60-6 5/24/10 21:56 Night Deer 1 N Gold_Creek_NW PC90-2(HO) 5/25/10 20:23 C-DU Deer 1 N Sparks_N RC60-6 5/25/10 8:19 Day Deer 1 S Sparks_N RC60-6 5/26/10 5:48 C-DA Deer 1 N Sparks_N RC60-6 5/26/10 19:26 Day Deer 1 N Sparks_N RC60-6 5/26/10 20:47 C-DU Deer 1 S Sparks_S RC60-4 5/27/10 9:56 Day Deer 1 N Sparks_N RC60-6 5/28/10 10:31 Day Deer 1 S Sparks_S RC60-4 5/29/10 20:33 C-DU Deer 1 S Sparks_S RC60-4 5/29/10 21:27 C-DU Deer 1 N Sparks_N RC60-6 5/30/10 18:07 Day Deer 1 S Sparks_S RC60-4 5/30/10 8:34 Day Deer 2 N Swamp_Creek_E P-1 5/30/10 22:32 Night Raccoon 1 S Swamp_Creek_E IR-3 5/30/10 23:25 Night Raccoon 1 N Swamp_Creek_E IR-3 5/30/10 23:46 Night Raccoon 1 S Swamp_Creek_E P-1 5/31/10 2:44 Night Raccoon 1 N Sparks_N RC60-6 6/1/10 4:49 C-DA Deer 1 N Sparks_S RC60-4 6/1/10 17:55 Day Deer 1 S Swamp_Creek_W IR-6 6/2/10 2:26 Night Beaver 1 S Sparks_N RC60-6 6/4/10 13:58 Day Deer 2 S Sparks_N RC60-6 6/4/10 20:27 C-DU Deer 1 N Sparks_S RC60-4 6/4/10 8:28 Day Deer 1 N Sparks_N RC60-6 6/7/10 15:26 Day Deer 1 S Sparks_S RC60-4 6/7/10 6:29 Day Deer 3 S Swamp_Creek_E IR-3 6/8/10 23:20 Night Mink 1 N Swamp_Creek_E P-1 6/8/10 5:19 C-DA Raccoon 1 N Swamp_Creek_E IR-3 6/9/10 22:43 Night Raccoon 1 N Sparks_N RC60-6 6/12/10 9:54 Day Deer 1 N Sparks_N RC60-6 6/12/10 19:43 Day Deer 1 N Gold_Creek_NW PC90-2(HO) 6/15/10 11:16 Day Beaver 1 S Sparks_N RC60-6 6/15/10 11:16 Day Deer 1 N Sparks_N RC60-6 6/15/10 11:24 Day Deer 2 S Sparks_N RC60-6 6/15/10 19:35 Day Deer 1 N Swamp_Creek_E IR-3 6/16/10 22:49 Night Raccoon 1 S Sparks_N RC60-6 6/17/10 18:47 Day Deer 2 S

Baseline wildlife monitoring at I-90 Snoqualmie Pass East Appendices
Western Transportation Institute Page 213
Sparks_N RC60-6 6/17/10 19:03 Day Deer 2 N Sparks_N RC60-6 6/18/10 0:07 Night Deer 2 N Swamp_Creek_E IR-3 6/19/10 2:16 Night Beaver 1 S Swamp_Creek_E IR-3 6/20/10 1:38 Night Beaver 1 N Swamp_Creek_E IR-3 6/20/10 1:46 Night Beaver 1 S Sparks_N RC60-6 6/21/10 23:28 Night Deer 1 N Swamp_Creek_W IR-6 6/23/10 14:52 Day Mink 1 N Sparks_N RC60-6 6/23/10 7:33 Day Deer 2 S Sparks_N RC60-6 6/23/10 11:27 Day Deer 1 N Sparks_N RC60-6 6/23/10 17:32 Day Deer 1 S Sparks_N RC60-6 6/24/10 0:19 Night Deer 2 S Sparks_N RC60-6 6/24/10 6:15 Day Deer 1 N Sparks_N RC60-6 6/25/10 20:20 C-DU Deer 1 S Swamp_Creek_W IR-6 6/25/10 22:09 Night Raccoon 1 N Sparks_N RC60-6 6/26/10 3:41 Night Deer 2 N Gold_Creek_NW PC90-2(HO) 6/27/10 22:18 Night Beaver 1 S Swamp_Creek_E IR-3 6/29/10 22:33 Night Raccoon 1 S Swamp_Creek_E IR-3 6/30/10 13:04 Day Mink 4 N Hudson_Creek RM45-1 6/30/10 21:55 C-DU Raccoon 1 S Sparks_N RC60-6 7/2/10 21:11 C-DU Deer 1 S Sparks_N RC60-6 7/3/10 1:17 Night Deer 1 N Swamp_Creek_E P-1 7/3/10 22:04 Night Weasel 5 N Swamp_Creek_E P-1 7/4/10 18:32 Day Mink 4 S Swamp_Creek_E IR-3 7/10/10 11:15 Day Mink 4 S Gold_Creek_NE RC60-2 7/10/10 4:29 C-DA Deer 1 S Swamp_Creek_E P-1 7/15/10 13:17 Day Mink 1 N Swamp_Creek_E IR-3 7/15/10 13:58 Day Mink 4 N Swamp_Creek_E P-1 7/15/10 14:21 Day Mink 1 S Swamp_Creek_E P-1 7/16/10 18:49 Day Mink 1 S Gold_Creek_NE RC60-2 7/16/10 21:23 C-DU Deer 1 S Sparks_N RC60-6 7/16/10 5:35 C-DA Deer 1 S Sparks_N RC60-6 7/16/10 6:37 Day Deer 2 S Sparks_N RC60-6 7/16/10 20:01 C-DU Deer 2 S Sparks_N RC60-6 7/16/10 23:08 Night Deer 2 N Swamp_Creek_E P-1 7/16/10 2:25 Night Raccoon 1 N Gold_Creek_NE RC60-2 7/17/10 21:31 C-DU Deer 1 N Gold_Creek_NW PC90-2(HO) 7/17/10 21:31 C-DU Deer 1 N Sparks_N RC60-6 7/17/10 21:02 C-DU Deer 1 S Bonnie_Creek IR-1 7/17/10 23:21 Night Raccoon 1 N Swamp_Creek_W IR-6 7/17/10 7:13 Day River_otter 3 N Gold_Creek_NW PC90-2(HO) 7/18/10 10:22 Day Deer 1 N Gold_Creek_NW PC90-2(HO) 7/18/10 21:37 C-DU Deer 1 N

Baseline wildlife monitoring at I-90 Snoqualmie Pass East Appendices
Western Transportation Institute Page 214
Swamp_Creek_E IR-3 7/20/10 10:41 Day Mink 1 S Swamp_Creek_W IR-6 7/21/10 10:56 Day River_otter 2 N Gold_Creek_NW PC90-2(HO) 7/24/10 11:00 Day Deer 1 S Gold_Creek_NW PC90-2(HO) 7/24/10 23:08 Night Deer 3 S Gold_Creek_NE RC60-2 7/25/10 15:51 Day Deer 1 N Gold_Creek_NW PC90-2(HO) 7/25/10 2:39 Night Deer 2 N Gold_Creek_NW PC90-2(HO) 7/25/10 6:07 C-DA Deer 1 N Gold_Creek_NW PC90-2(HO) 7/25/10 15:51 Day Deer 1 N Sparks_S RC60-1 7/25/10 22:51 Night Deer 1 S Unnamed_Creek IR-2 7/26/10 17:09 Day Weasel 1 S Gold_Creek_NE RC60-2 7/27/10 4:12 Night Deer 1 S Gold_Creek_NE RC60-2 7/27/10 22:17 Night Deer 1 S Gold_Creek_NW PC90-2(HO) 7/27/10 4:12 Night Deer 1 S Gold_Creek_NW PC90-2(HO) 7/27/10 22:18 Night Deer 1 S Gold_Creek_NE RC60-2 7/29/10 22:43 Night Deer 1 S Gold_Creek_NW PC90-2(HO) 7/29/10 22:48 Night Deer 1 N Sparks_N RC60-6 7/29/10 23:57 Night Deer 1 S Gold_Creek_NW PC90-2(HO) 7/30/10 21:09 C-DU Deer 1 S Sparks_N RC60-6 7/30/10 5:32 C-DA Deer 1 S Swamp_Creek_E IR-3 7/31/10 23:34 Night Raccoon 2 N Gold_Creek_NW PC90-2(HO) 8/1/10 15:45 Day Deer 1 N Gold_Creek_NW PC90-2(HO) 8/2/10 21:12 C-DU Deer 1 S Gold_Creek_NW PC90-2(HO) 8/2/10 21:43 Night Deer 1 N Swamp_Creek_E IR-3 8/2/10 13:11 Day Weasel 1 N Swamp_Creek_E P-1 8/4/10 16:23 Day Mink 1 N Gold_Creek_NW PC90-2(HO) 8/4/10 1:53 Night Deer 1 S Gold_Creek_NW PC90-2(HO) 8/4/10 22:41 Night Deer 1 S Gold_Creek_NE RC60-2 8/5/10 0:22 Night Deer 1 N Swamp_Creek_E IR-3 8/6/10 2:06 Night Raccoon 1 S Sparks_N RC60-6 8/7/10 18:58 Day Deer 1 S Sparks_S RC60-1 8/7/10 8:16 Day Deer 2 N Sparks_S RC60-1 8/7/10 8:19 Day Deer 1 S Sparks_S RC60-1 8/7/10 19:22 Day Deer 1 S Gold_Creek_NW PC90-2(HO) 8/9/10 6:06 C-DA Deer 1 N Sparks_S RC60-1 8/11/10 6:12 C-DA Deer 2 N Sparks_S RC60-1 8/11/10 17:20 Day Deer 2 S Price_Creek IR-4 8/13/10 9:44 Day Bobcat 1 N Gold_Creek_NE RC60-2 8/14/10 23:20 Night Deer 1 S Gold_Creek_NW PC90-2(HO) 8/14/10 23:20 Night Deer 1 S Sparks_S RC60-1 8/17/10 8:30 Day Deer 2 N Sparks_S RC60-1 8/17/10 18:54 Day Deer 2 S Cedar_Creek IR-5 8/17/10 22:18 Night Weasel 1 N

Baseline wildlife monitoring at I-90 Snoqualmie Pass East Appendices
Western Transportation Institute Page 215
Swamp_Creek_E IR-3 8/20/10 0:06 Night Raccoon 3 S Swamp_Creek_E IR-3 8/20/10 11:31 Day Weasel 1 N Gold_Creek_NW PC90-2(HO) 8/22/10 1:14 Night Deer 1 N Swamp_Creek_E IR-3 8/25/10 16:44 Day Mink 1 N Swamp_Creek_W IR-6 8/25/10 12:45 Day River_otter 4 N Cedar_Creek IR-5 8/27/10 16:57 Day Weasel 1 N Sparks_N RC60-6 8/28/10 7:51 Day Deer 1 N Gold_Creek_NW PC90-2(HO) 8/30/10 3:07 Night Deer 1 N Hudson_Creek RM45-1 8/31/10 10:31 Day Weasel 1 S Swamp_Creek_E IR-3 9/3/10 10:37 Day Mink 1 N Hudson_Creek RM45-1 9/3/10 14:33 Day Weasel 1 S Hudson_Creek RM45-1 9/3/10 15:00 Day Weasel 1 N Swamp_Creek_E P-1 9/3/10 12:50 Day Weasel 1 N Gold_Creek_NW PC90-2(HO) 9/4/10 5:41 C-DA Deer 1 N Sparks_S RC60-1 9/4/10 17:54 Day Deer 1 S Cedar_Creek IR-5 9/4/10 15:50 Day Weasel 1 N Swamp_Creek_E P-1 9/12/10 14:24 Day Mink 1 S Sparks_N RC60-6 9/12/10 18:22 C-DU Deer 2 S Unnamed_Creek IR-2 9/12/10 11:39 Day Weasel 1 S Gold_Creek_NW PC90-2(HO) 9/13/10 6:05 C-DA Deer 1 S Sparks_N RC60-6 9/13/10 10:11 Day Deer 2 N Swamp_Creek_E IR-3 9/18/10 22:59 Night Beaver 1 N Swamp_Creek_E IR-3 9/20/10 8:29 Day Mink 1 N Price_Creek IR-4 9/24/10 4:44 Night Raccoon 1 S Cedar_Creek IR-5 9/24/10 22:35 Night Weasel 1 N Swamp_Creek_E IR-3 9/26/10 20:45 Night Raccoon 1 N Swamp_Creek_E P-1 9/30/10 11:10 Day Mink 1 N Swamp_Creek_E IR-3 10/4/10 0:21 Night Raccoon 1 S Price_Creek IR-4 10/5/10 17:29 Day Black_bear 1 S Cedar_Creek IR-5 10/6/10 14:18 Day Weasel 1 N Price_Creek IR-4 10/7/10 3:01 Night Black_bear 1 S Bonnie_Creek IR-1 10/7/10 22:04 Night Raccoon 1 S Bonnie_Creek IR-1 10/7/10 23:36 Night Raccoon 1 S Swamp_Creek_E P-1 10/8/10 5:37 Night Raccoon 2 S Swamp_Creek_W IR-6 10/8/10 7:03 C-DA River_otter 3 S Swamp_Creek_E IR-3 10/10/10 0:11 Night Raccoon 2 N Price_Creek IR-4 10/14/10 13:32 Day Black_bear 1 S Swamp_Creek_E IR-3 10/14/10 15:01 Day Mink 1 N Hudson_Creek RM45-1 10/14/10 23:59 Night Weasel 1 S Swamp_Creek_E IR-3 10/19/10 16:39 Day Mink 1 N Swamp_Creek_E IR-3 10/20/10 4:32 Night Raccoon 1 S Swamp_Creek_E IR-3 10/20/10 22:26 Night Raccoon 1 N
Baseline wildlife monitoring at I-90 Snoqualmie Pass East Appendices
Western Transportation Institute Page 216
Unnamed_Creek IR-2 10/21/10 16:30 Day Weasel 1 S Swamp_Creek_E IR-3 10/25/10 0:58 Night Raccoon 1 S Swamp_Creek_E P-1 10/29/10 20:25 Night Raccoon 1 N Swamp_Creek_E IR-3 11/3/10 8:33 C-DA Mink 1 S Swamp_Creek_E IR-3 11/10/10 4:40 Night Raccoon 1 N Sparks_N RC60-6 11/16/10 19:33 Night Deer 1 S Gold_Creek_NW RC60HO-5 2/3/11 4:54 Night Coyote 1 N Swamp_Creek_E RC55-1 2/9/11 20:55 Night Raccoon 1 S Swamp_Creek_E RC55-1 3/12/11 3:06 Night Raccoon 1 S Swamp_Creek_E RC55-1 3/22/11 20:36 Night Raccoon 1 N Swamp_Creek_E RC55-1 3/27/11 21:00 Night Raccoon 1 S Swamp_Creek_E RC55-1 3/28/11 0:02 Night Raccoon 1 N Swamp_Creek_E RC55-1 4/5/11 2:17 Night Raccoon 1 S Swamp_Creek_E RC55-1 4/11/11 1:32 Night Beaver 1 S Swamp_Creek_E RC55-1 4/13/11 23:21 Night Beaver 1 S Cedar_Creek IR-5 5/1/11 23:18 Night Weasel 1 N Swamp_Creek_E IR-3 5/2/11 2:00 Night Raccoon 1 S Swamp_Creek_E IR-3 5/5/11 0:43 Night Raccoon 1 S Swamp_Creek_E IR-3 5/13/11 0:18 Night Mink 1 N Sparks_N RC60-6 5/18/11 5:15 C-DA Deer 1 S Sparks_N RC60-6 5/23/11 20:16 C-DU Deer 1 N Sparks_N RC60-6 5/24/11 3:42 Night Deer 1 S Unnamed_Creek IR-6 5/30/11 8:36 Day Weasel 1 S Swamp_Creek_E RC55-1 6/2/11 2:07 Night Beaver 1 N Bonnie_Creek IR-1 6/3/11 9:01 Day Mink 1 S Bonnie_Creek IR-1 6/3/11 9:39 Day Mink 1 N Bonnie_Creek IR-1 6/4/11 10:44 Day Mink 1 S Bonnie_Creek IR-1 6/4/11 12:39 Day Mink 1 N Bonnie_Creek IR-1 6/6/11 18:16 Day Mink 1 S Bonnie_Creek IR-1 6/26/11 10:29 Day Mink 1 N Bonnie_Creek IR-1 6/28/11 7:20 Day Mink 1 S Swamp_Creek_E IR-3 6/28/11 8:38 Day Mink 1 N Bonnie_Creek IR-1 7/3/11 8:34 Day Mink 1 S Swamp_Creek_E IR-3 7/6/11 15:14 Day Mink 1 N Bonnie_Creek IR-1 7/8/11 15:38 Day Mink 1 S Bonnie_Creek IR-1 7/9/11 10:18 Day Mink 1 N Swamp_Creek_W P-1 7/10/11 23:31 Night Raccoon 1 N Bonnie_Creek IR-1 7/12/11 16:05 Day Mink 1 N Bonnie_Creek IR-1 7/13/11 13:52 Day Mink 1 N Swamp_Creek_E IR-3 7/13/11 12:48 Day Mink 1 N Swamp_Creek_E RC55-1 7/13/11 3:10 Night Raccoon 1 S Swamp_Creek_E IR-3 7/15/11 4:05 Night Beaver 1 S

Baseline wildlife monitoring at I-90 Snoqualmie Pass East Appendices
Western Transportation Institute Page 217
Gold_Creek_NW RC60HO-5 7/21/11 1:39 Night Deer 1 S Gold_Creek_NW RC60HO-5 7/21/11 1:41 Night Deer 1 N Swamp_Creek_W P-1 7/24/11 12:03 Day River_otter 1 S Swamp_Creek_W P-1 7/24/11 15:55 Day River_otter 3 N Swamp_Creek_E IR-3 7/25/11 4:26 Night Raccoon 1 N Swamp_Creek_E IR-3 7/27/11 11:14 Day Mink 1 S Swamp_Creek_E RC55-1 7/27/11 13:37 Day Raccoon 1 S Swamp_Creek_W P-1 7/27/11 2:23 Night Raccoon 1 N Gold_Creek_NE RC60-2 7/29/11 5:16 C-DA Deer 1 S Gold_Creek_NE RC60-2 7/30/11 4:44 C-DA Deer 2 N Swamp_Creek_E IR-3 7/30/11 9:22 Day River_otter 3 N Swamp_Creek_W P-1 7/30/11 9:28 Day River_otter 2 S Swamp_Creek_W P-1 7/30/11 12:19 Day River_otter 1 N Swamp_Creek_E IR-3 8/2/11 21:04 C-DU Mink 1 N Bonnie_Creek IR-1 8/7/11 1:04 Night Raccoon 1 S Gold_Creek_NW RC60HO-5 8/8/11 21:19 C-DU Deer 1 S Gold_Creek_NW RC60HO-5 8/9/11 5:23 C-DA Deer 1 N Bonnie_Creek IR-1 8/9/11 22:28 Night Weasel 1 N Sparks_S RC60-1 8/13/11 6:56 C-DA Deer 1 N Bonnie_Creek IR-1 8/16/11 21:14 C-DU Raccoon 1 S Bonnie_Creek IR-1 8/16/11 8:41 Day Weasel 1 N Gold_Creek_NW RC60HO-5 8/20/11 8:24 Day Deer 1 N Gold_Creek_NW RC60HO-5 8/20/11 20:52 C-DU Deer 1 S Swamp_Creek_E IR-3 8/20/11 21:08 Night Raccoon 1 S Swamp_Creek_W P-1 8/20/11 15:36 Day River_otter 3 N Swamp_Creek_E IR-3 8/21/11 9:52 Day Mink 1 N Bonnie_Creek IR-1 8/22/11 14:42 Day Weasel 1 N Bonnie_Creek IR-1 8/26/11 13:49 Day Weasel 1 S Swamp_Creek_E IR-3 8/27/11 23:25 Night Mink 1 N Gold_Creek_NW RC60HO-5 8/27/11 3:16 Night Deer 3 N Bonnie_Creek IR-1 8/29/11 5:12 Night Raccoon 1 N Bonnie_Creek IR-1 8/30/11 5:02 Night Raccoon 1 S Bonnie_Creek IR-1 9/2/11 14:40 Day Weasel 1 S Price_Creek IR-4 9/3/11 10:33 Day Mink 1 N Gold_Creek_NW RC60HO-5 9/4/11 4:35 Night Deer 2 S Bonnie_Creek IR-1 9/6/11 21:44 Night Raccoon 1 N Hudson_Creek RC55-2 9/14/11 23:58 Night Raccoon 1 N Swamp_Creek_W P-1 9/18/11 11:11 Day Beaver 1 S Swamp_Creek_E IR-3 9/18/11 20:34 Night Mink 1 N Swamp_Creek_W P-1 9/18/11 6:03 C-DA Raccoon 1 S Swamp_Creek_W P-1 9/19/11 6:23 C-DA Beaver 1 N Swamp_Creek_E IR-3 9/22/11 21:16 Night Mink 1 N
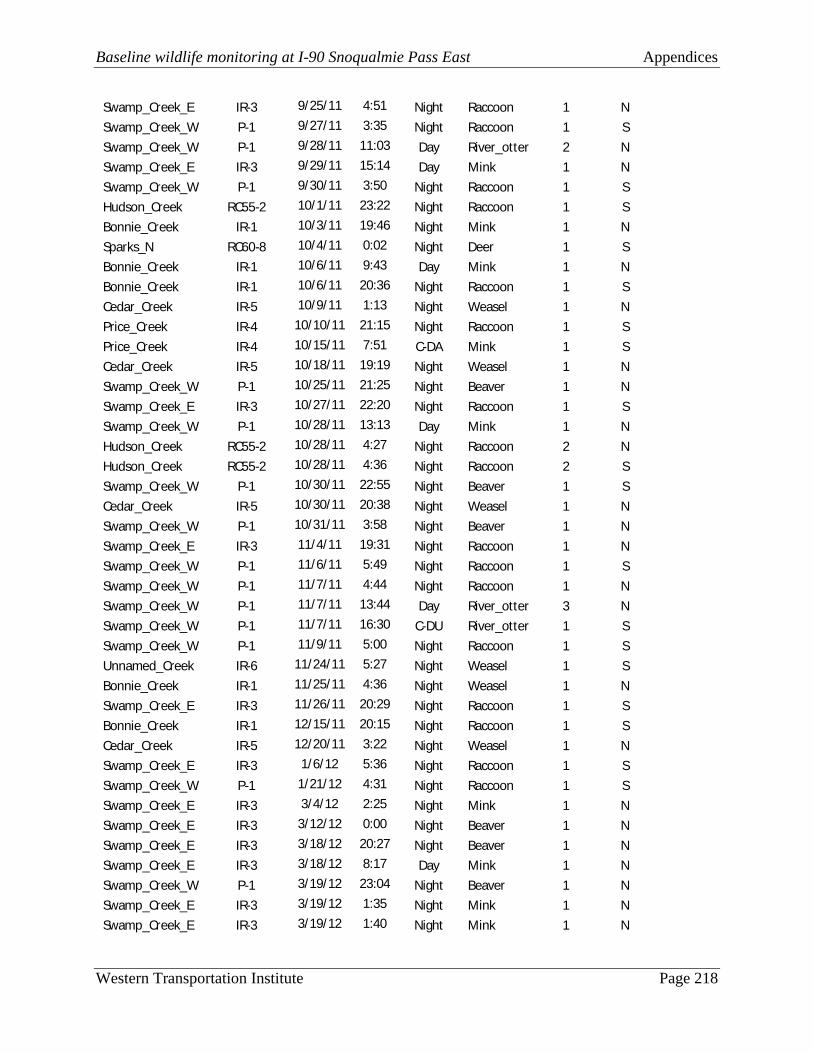
Baseline wildlife monitoring at I-90 Snoqualmie Pass East Appendices
Western Transportation Institute Page 218
Swamp_Creek_E IR-3 9/25/11 4:51 Night Raccoon 1 N Swamp_Creek_W P-1 9/27/11 3:35 Night Raccoon 1 S Swamp_Creek_W P-1 9/28/11 11:03 Day River_otter 2 N Swamp_Creek_E IR-3 9/29/11 15:14 Day Mink 1 N Swamp_Creek_W P-1 9/30/11 3:50 Night Raccoon 1 S Hudson_Creek RC55-2 10/1/11 23:22 Night Raccoon 1 S Bonnie_Creek IR-1 10/3/11 19:46 Night Mink 1 N Sparks_N RC60-8 10/4/11 0:02 Night Deer 1 S Bonnie_Creek IR-1 10/6/11 9:43 Day Mink 1 N Bonnie_Creek IR-1 10/6/11 20:36 Night Raccoon 1 S Cedar_Creek IR-5 10/9/11 1:13 Night Weasel 1 N Price_Creek IR-4 10/10/11 21:15 Night Raccoon 1 S Price_Creek IR-4 10/15/11 7:51 C-DA Mink 1 S Cedar_Creek IR-5 10/18/11 19:19 Night Weasel 1 N Swamp_Creek_W P-1 10/25/11 21:25 Night Beaver 1 N Swamp_Creek_E IR-3 10/27/11 22:20 Night Raccoon 1 S Swamp_Creek_W P-1 10/28/11 13:13 Day Mink 1 N Hudson_Creek RC55-2 10/28/11 4:27 Night Raccoon 2 N Hudson_Creek RC55-2 10/28/11 4:36 Night Raccoon 2 S Swamp_Creek_W P-1 10/30/11 22:55 Night Beaver 1 S Cedar_Creek IR-5 10/30/11 20:38 Night Weasel 1 N Swamp_Creek_W P-1 10/31/11 3:58 Night Beaver 1 N Swamp_Creek_E IR-3 11/4/11 19:31 Night Raccoon 1 N Swamp_Creek_W P-1 11/6/11 5:49 Night Raccoon 1 S Swamp_Creek_W P-1 11/7/11 4:44 Night Raccoon 1 N Swamp_Creek_W P-1 11/7/11 13:44 Day River_otter 3 N Swamp_Creek_W P-1 11/7/11 16:30 C-DU River_otter 1 S Swamp_Creek_W P-1 11/9/11 5:00 Night Raccoon 1 S Unnamed_Creek IR-6 11/24/11 5:27 Night Weasel 1 S Bonnie_Creek IR-1 11/25/11 4:36 Night Weasel 1 N Swamp_Creek_E IR-3 11/26/11 20:29 Night Raccoon 1 S Bonnie_Creek IR-1 12/15/11 20:15 Night Raccoon 1 S Cedar_Creek IR-5 12/20/11 3:22 Night Weasel 1 N Swamp_Creek_E IR-3 1/6/12 5:36 Night Raccoon 1 S Swamp_Creek_W P-1 1/21/12 4:31 Night Raccoon 1 S Swamp_Creek_E IR-3 3/4/12 2:25 Night Mink 1 N Swamp_Creek_E IR-3 3/12/12 0:00 Night Beaver 1 N Swamp_Creek_E IR-3 3/18/12 20:27 Night Beaver 1 N Swamp_Creek_E IR-3 3/18/12 8:17 Day Mink 1 N Swamp_Creek_W P-1 3/19/12 23:04 Night Beaver 1 N Swamp_Creek_E IR-3 3/19/12 1:35 Night Mink 1 N Swamp_Creek_E IR-3 3/19/12 1:40 Night Mink 1 N

Baseline wildlife monitoring at I-90 Snoqualmie Pass East Appendices
Western Transportation Institute Page 219
Swamp_Creek_E IR-3 3/19/12 2:06 Night Mink 1 N Swamp_Creek_E IR-3 3/23/12 4:20 Night Beaver 1 N Bonnie_Creek IR-2 3/23/12 4:00 Night Weasel 1 N Swamp_Creek_E IR-3 3/25/12 0:23 Night Mink 1 N Swamp_Creek_E IR-3 3/25/12 0:57 Night Mink 1 N Swamp_Creek_E IR-3 3/28/12 0:11 Night Mink 1 N Price_Creek IR-4 4/1/12 9:35 Day Mink 1 N Swamp_Creek_E IR-3 4/7/12 10:47 Day Mink 1 N Bonnie_Creek IR-2 4/7/12 21:11 Night Raccoon 1 N Swamp_Creek_E IR-3 4/10/12 2:54 Night Beaver 1 N Price_Creek IR-4 4/10/12 15:02 Day Mink 1 N Swamp_Creek_E IR-3 4/14/12 23:44 Night Beaver 1 N Swamp_Creek_E IR-3 4/20/12 0:32 Night Beaver 1 N Bonnie_Creek IR-2 4/21/12 12:55 Day Mink 1 N Bonnie_Creek IR-2 4/21/12 18:27 Day Mink 1 S Bonnie_Creek IR-2 5/16/12 22:23 Night Raccoon 1 S

Baseline wildlife monitoring at I-90 Snoqualmie Pass East Appendices
Western Transportation Institute Page 220
Appendix 4.1. Individual black bears identified within the greater I-90 SPE Project Area, including DNA source, sex, date of sampling, side of highway, and location of sample collection (UTM NAD83). Unique Individual Source Sex
Date Collected
Hwy Side UTM X UTM Y
URAM101468 Scat M
North 638381 5236793 URAM101474 Scat M 9/26/2008 North 638353 5236755 URAM101478 Scat F
North 636376 5255584
URAM101488 Hair M 8/6/2009 South 626991 5239246 URAM101490 Hair M 8/26/2009 South 623714 5241766 URAM101496 Hair F 8/26/2009 South 620908 5242022 URAM130508 Hair M 5/26/2010 North 635960 5239304 URAM130536 Hair M 10/13/2009 North 628341 5248013 URAM130632 Hair F 9/18/2009 North 630677 5241939 URAM130635 Hair M 9/18/2009 North 624350 5249358 URAM144800 Hair F 9/2/2010 North 635326 5261079 URAM144803 Hair M 9/3/2010 North 638699 5262507 URAM144804 Hair M 9/3/2010 North 638699 5262507 URAM144805 Hair F 9/14/2010 South 612284 5247689 URAM144809 Hair F 9/17/2010 South 658327 5218574 URAM144811 Hair F 9/17/2010 South 658327 5218574 URAM144828 Hair F 9/30/2010 South 615823 5223282 URAM161877 Scat F 10/17/2008 North 642503 5252916 URAM161881 Scat F 10/17/2008 North 642270 5253166 URAM166883 Hair F 8/25/2011 South 619229 5231571 URAM167752 Hair M 9/5/2008 South 632825 5234847 URAM167759 Hair F 9/5/2008 South 632825 5234847 URAM167765 Hair M 8/21/2008 South 632825 5234847 URAM167767 Hair F 7/28/2008 North 632978 5239556 URAM167806 Hair M 7/8/2008 North 620017 5254108 URAM167809 Hair F 8/8/2008 North 626767 5243171 URAM167812 Hair M 8/19/2008 South 621324 5244046 URAM167821 Hair M 9/17/2008 North 623887 5253814 URAM167825 Hair M 10/10/2008 South 627127 5234637 URAM173807 Hair F 7/9/2010 South 657157 5222728 URAM173811 Hair M 6/25/2010 South 654691 5222012 URAM173818 Hair F 7/16/2010 South 647302 5222075 URAM173823 Hair F 7/16/2010 South 647302 5222075 URAM173850 Hair F 9/2/2010 North 635326 5261079 URAM173851 Hair M 9/3/2010 North 636107 5263589 URAM173853 Hair f(m) 9/14/2010 South 612284 5247689 URAM173854 Hair M 9/1/2010 North 642478 5262134

Baseline wildlife monitoring at I-90 Snoqualmie Pass East Appendices
Western Transportation Institute Page 221
URAM173855 Hair f 9/1/2010 North 642478 5262134 URAM173856 Hair M 9/1/2010 North 642478 5262134 URAM191970 Hair M 8/12/2010 South 640536 5227202 URAM194205 Hair M 9/9/2008 North 625138 5245964 URAM194208 Hair M 9/10/2008 South 618434 5246781 URAM194211 Hair M 9/12/2008 North 627752 5244019 URAM197590 Hair M 8/6/2009 North 627605 5241846 URAM900101 Hair M 9/22/2011 South 617633 5235091 URAM901248 Hair F 10/20/2011 North 654312 5241023 URAM902584 Hair M 8/25/2011 South 636467 5223268 URAM902587 Hair F 8/25/2011 South 616060 5230280 URAM902787 Hair M 9/22/2011 South 616344 5237139 URAM902788 Hair F 9/22/2011 South 616344 5237139 URAM902790 Hair F 9/22/2011 South 616344 5237139 URAM902791 Hair M 9/21/2011 North 611744 5251423 URAM902792 Hair F 9/21/2011 North 611744 5251423 URAM902816 Hair M 9/1/2011 North 615377 5255014 URAM902836 Hair M 9/1/2011 North 616583 5253387 URAM903004 Hair F 7/12/2011 North 615699 5271285 URAM903011 Hair F 7/27/2011 North 613128 5271042 URAM903020 Hair F 8/25/2011 South 632663 5223463 URAM903038 Hair F 7/20/2011 South 630157 5226280 URAM903045 Hair M 7/21/2011 South 618503 5239359 URAM903046 Hair M 7/21/2011 South 618503 5239359 URAM903051 Hair M 9/8/2011 South 636467 5223268 URAM903064 Hair M 9/8/2011 South 616060 5230280 URAM903086 Hair F 9/8/2011 South 636432 5219667 URAM903088 Hair F 7/22/2011 South 651286 5217913 URAM903143 Hair F 10/20/2011 North 654312 5241023 URAM903144 Hair F 10/20/2011 North 654312 5241023 URAM903168 Hair F 10/20/2011 North 655245 5241739 URAM903191 Hair F 8/4/2011 South 622901 5227707 URAM903219 Hair M 8/4/2011 South 622901 5227707 URAM903225 Hair F 8/4/2011 South 618503 5239359 URAM903226 Hair M 8/5/2011 South 651286 5217913 URAM903229 Hair F 9/21/2011 South 620456 5269513 URAM903231 Hair F 9/22/2011 South 621387 5275352 URAM903240 Hair F 8/19/2011 North 611047 5269780 URAM903241 Hair M 8/19/2011 North 613128 5271042 URAM903274 Hair M 9/21/2011 South 620456 5269513

Baseline wildlife monitoring at I-90 Snoqualmie Pass East Appendices
Western Transportation Institute Page 222
Appendix 4.2. Raw results of genetic analyses for black bears. including number of loci successfully identified and locus-specific values for 20 microsatellite markers. Each 6-digit value represents 2, 3-digit alleles. Missing locus values or those containing fewer than six digits represent a failed analysis at that locus.
Locus
Unique Individual
# Loci Complete G10B G10H G10J G10L MU23 MU59 G1D G10C G1A G10M G10P CXX110 CXX20 MSUT-6 145P07 CPH9 D123 D1a G10O MSUT-2
URAM101468 18 158162 237245 201205 137159 187195 237241 176176 205215 192194 210217 165165 139141 139143 178180 165171 45145 141147 181183 6208 203203
URAM101474 15 158160 239239 205207 135165 195195 243243 72174 15215 90194 212212 15357 141155 131135 180180 171172 143147 145147 177179 9898 201203
URAM101478 19 160162 243263 187199 137159 191195 239243 172176 199207 192194 212216 153153 15359 131131 180180 163165 143143 145147 179179 196196 199203
URAM101488 20 160164 239241 205205 159165 191191 239243 172176 199205 184192 212213 161161 147157 131139 180180 163165 143147 145147 163181 196196 197199
URAM101490 20 158164 239241 187187 149159 187191 243243 174176 199215 184194 210212 153157 155157 131139 176176 163165 143143 145145 177179 156198 197199
URAM101496 20 162164 237239 187205 157159 191195 243243 172178 199205 184186 213218 153157 145153 131139 180180 165171 143143 141143 157177 150192 203203
URAM130508 20 160164 239243 187205 159165 187187 239239 176176 203215 190196 212217 155157 151155 139143 178180 163171 145145 141143 177179 196208 197203
URAM130536 20 160164 239259 199201 135155 187187 237241 174176 203203 190192 210212 159161 141151 139143 178180 163163 145145 145147 177181 198200 197207
URAM130632 20 156158 237239 205207 149165 187195 231243 172178 199215 184194 210218 153165 153157 131135 178180 163169 145147 141147 177181 192208 199207
URAM130635 20 160162 245245 187197 159165 187191 239239 174176 215215 190192 210212 157165 151157 137143 180184 163165 141143 141151 181181 196198 191209
URAM144800 20 156162 239263 199199 155165 191191 241243 172172 207215 184192 210216 159161 141153 131131 180180 157165 143143 145145 165177 192196 207209
URAM144803 20 160160 237243 195199 137159 187191 241243 176176 203203 194194 210212 161165 141157 131139 178180 169171 145147 147147 163181 196196 203209
URAM144804 20 156164 245245 187195 159169 191191 245245 176178 203205 184194 210220 157165 149157 131131 180180 165171 145145 145147 157179 150198 203207
URAM144805 20 158162 237239 187187 151171 191197 243243 176176 199203 194198 214218 157159 151157 131131 180180 165165 147147 141143 179181 200200 203209
URAM144809 20 162164 235239 187207 159163 191199 239241 172172 199199 194198 212212 157161 147155 135143 180180 169172 141143 147147 163181 196198 197199
URAM144811 20 164164 235237 187205 161163 191195 241241 172172 199203 194198 212218 157161 147157 143143 180180 165172 141147 145147 163177 150198 191199
URAM144828 20 156160 237245 195201 151159 191191 239243 172172 203205 190194 213216 157161 157157 139143 168176 157163 143145 141147 179185 150208 199203
URAM161877 20 158164 237243 187199 155159 191193 239241 172176 211215 190192 212213 153165 141151 135135 176176 163169 145147 141145 177179 198198 199207
URAM161881 19 162164 239243 205207 165169 187187 239243 172174 199199 184192 212212 153165 155155 139143 180182 165171 145145 145153 17981 154154 195199
URAM166883 20 156158 237239 205205 161165 191191 239243 172178 203211 186194 216218 153153 153153 131139 176180 163169 145145 141147 167177 196208 203209
URAM167752 20 158160 241249 199201 157159 191197 239239 172172 199203 192194 210212 157161 141157 131131 180180 163165 145147 145145 179181 196200 197201
URAM167759 20 158162 239241 195207 135159 191191 237239 172182 199215 192192 212213 153157 149153 131137 176178 163169 143145 141143 177177 196198 203203
URAM167765 20 156160 239249 201205 159159 199199 241243 172178 199199 192194 212212 155157 151151 131131 176180 163163 145149 141145 175179 198208 203203
URAM167767 20 156160 239259 207207 165169 191191 243245 172178 199215 194198 210210 153159 153157 135139 176178 165169 145145 145151 179181 198208 199209
URAM167806 20 160162 239245 195201 171171 195199 239241 178178 199215 192194 210210 157159 151155 131131 168180 165171 143147 141145 177179 196196 203203

Baseline wildlife monitoring at I-90 Snoqualmie Pass East Appendices
Western Transportation Institute Page 223
URAM167809 20 160164 237239 199207 137165 191191 243243 176178 205215 194194 210210 159165 139153 131135 178180 165169 145145 141145 179181 208208 199199
URAM167812 6 158158 237249 189201 159161 191195 241243
URAM167821 20 160162 245259 195197 165169 191191 239241 176176 205215 194194 212216 159159 141141 131139 180180 159171 145145 145147 157177 196196 203203
URAM167825 20 160160 239239 195205 159169 199199 239243 172178 199203 194194 212218 157165 151155 131131 180180 163172 145149 145147 175179 198208 203203
URAM173807 20 156162 237245 187205 159163 195199 243243 172178 199199 192194 212214 155157 141147 131139 180182 171172 145145 145147 175179 150198 199209
URAM173811 20 156162 237255 197205 151159 191195 239243 172176 203203 188198 214214 153157 141155 131135 180182 165165 145145 141145 179181 154156 203209
URAM173818 20 156160 239239 205207 159165 191195 243243 172176 199211 192194 213214 153155 151159 131131 180180 163165 145145 145147 181181 196198 203209
URAM173823 20 156160 243243 205207 159159 191195 243243 176176 203213 192192 208212 155157 141141 131139 176180 157165 145145 145147 175181 150154 201209
URAM173850 20 162164 239245 199205 159159 187187 237239 174176 203203 190198 210217 161161 141153 143147 178180 163165 145145 143147 181181 154198 209209
URAM173851 17 164164 243259 187199 159165 191195 239239 176176 199203 192194 212217 165165 141159 13141139 176180 157165 43143 141141 163177 150198 19703
URAM173853 16 160160 239239 199205 155169 191195 243243 72178 315 192194 212218 161161 145155 135137 176180 163171 47147 145147 179181 154196
URAM173854 20 160160 237263 195199 159165 191191 241243 176176 203211 184194 212216 161161 147157 131131 180180 163169 143147 145147 181181 150196 209209
URAM173855 17 160162 243263 199199 159165 191199 241243 176178 707 18496192 212216 155161 147159 131131 180180 157163 143143 141145 179181 150198 20709
URAM173856 20 160164 245259 187187 161169 191191 239245 176176 199199 194194 212217 153165 151159 131139 182184 165171 143147 143143 177181 198198 199203
URAM191970 20 160162 239239 197205 135159 191191 233243 172178 199211 194194 213217 161161 147155 131143 180182 165167 145145 145151 157177 150196 199203
URAM194205 20 158164 237255 199201 155165 187187 243245 174176 203205 192194 210210 161165 139153 135141 176180 163167 143145 141141 177183 196208 199203
URAM194208 20 160164 239245 187187 155159 187199 239243 172176 199203 194194 210210 153153 155157 131139 176176 163171 143145 145145 179179 198198 199203
URAM194211 20 160164 237243 197197 137159 187191 239243 176176 205215 192194 210212 157165 141157 131137 176184 165171 143145 141147 181181 196208 191203
URAM197590 20 156158 237239 195205 149161 191195 231231 172176 199215 184194 213218 157165 141157 131131 180184 163165 143147 145147 177177 192192 207209
URAM900101 20 160162 245249 199205 159165 191199 243243 172178 199205 186194 210212 157157 151151 131131 180182 163165 143149 141141 157179 154198 203203
URAM901248 20 160162 237239 187205 159159 187191 239243 176178 199207 192194 212216 157161 155155 131139 180180 163171 143145 145147 179183 196208 197199
URAM902584 20 160160 239239 201205 159163 191191 241243 172176 211215 194194 212216 161163 155155 131139 180182 165167 143145 141147 177177 150150 203207
URAM902587 20 164164 237237 201205 159171 191195 237239 172176 199203 188198 214216 153161 155157 135139 176180 165165 145145 145145 177181 150192 203203
URAM902787 20 162164 241245 187189 159171 191191 231239 172172 199215 194194 212213 157159 151157 139139 180180 163165 143145 145147 177179 192196 203203
URAM902788 20 162162 239241 201205 165171 191195 231239 176176 199203 184198 212216 159159 157159 131139 180180 157169 143145 141145 177179 198198 203207
URAM902790 20 154162 239245 187189 159165 191195 231243 172176 199215 194194 212213 157159 151157 139139 180180 163165 143145 143145 177179 196200 203203
URAM902791 20 158160 239245 201201 169171 191195 239241 174178 203215 194198 210214 153159 147151 131139 180180 165171 143147 141145 177179 196198 199203
URAM902792 20 158160 239245 195199 169171 191199 241241 174178 199203 192192 210216 155157 147151 131139 180180 171171 145147 141145 177179 198206 199203
URAM902816 20 156164 239249 201205 161171 195199 231239 172172 215215 194194 213216 155157 151157 131131 180184 165165 145147 145145 177179 192196 203209
URAM902836 20 160162 237245 201203 165171 191193 239243 172174 207215 192194 210214 153157 147153 139141 176182 165171 143145 141145 179179 196198 203203

Baseline wildlife monitoring at I-90 Snoqualmie Pass East Appendices
Western Transportation Institute Page 224
URAM903004 20 164164 237239 187201 137137 191195 241243 178184 203207 192194 214216 157159 153153 141141 180180 163165 143143 145145 177179 156196 191203
URAM903011 20 158162 239255 203207 151159 191195 241243 178178 203203 194194 212214 157165 153155 131139 180180 165171 143147 145145 175179 196200 203207
URAM903020 20 156160 245263 197201 165165 187191 239243 172172 203207 194198 212212 161161 151153 131139 176180 163171 145145 141143 177179 150196 199207
URAM903038 20 158160 239245 197199 151159 191195 243243 172172 199203 184190 212217 151161 155157 131135 176178 171173 145147 145147 177177 150198 199209
URAM903045 20 164164 237239 187205 159171 187195 231243 172176 203215 192194 210213 157159 153153 131139 180182 157171 143145 143147 177181 192198 197203
URAM903046 20 162164 255261 195205 159159 191191 231239 176178 199199 184194 210216 153159 153155 139139 180180 163165 143145 145147 177177 150150 197203
URAM903051 20 156160 235237 197197 159159 191195 239243 172172 203207 194194 212214 157161 147157 139143 176180 157171 145145 145145 177179 150198 199203
URAM903064 20 158160 239249 201201 159169 187191 245245 176176 199203 192194 212212 157157 151159 131139 180182 163163 143145 147147 177179 196198 191203
URAM903086 20 158164 239239 187205 149159 191195 243243 172172 199205 184190 212214 161161 151157 131143 176180 163171 145145 145145 177181 150182 195199
URAM903088 20 160162 239245 187205 159159 191191 239241 172176 203203 194194 212214 155157 141157 131143 180182 163165 145147 145147 163181 150208 195199
URAM903143 20 158160 243259 187205 155159 187191 239243 172176 199207 192196 210216 153153 157159 131131 180180 167171 145145 143143 163179 150198 203203
URAM903144 20 158160 243245 187197 155159 191195 231239 174178 199207 192194 212216 153153 157159 131131 180180 163165 145145 145145 163179 150198 199209
URAM903168 20 156158 245263 201207 155163 195195 237245 172176 199215 192198 212213 153155 137161 131139 180180 163163 145145 143147 177181 198208 191203
URAM903191 20 156158 237237 205207 159161 191191 241243 172172 199211 194194 216218 153161 141153 131141 176182 163171 145151 141141 177177 208208 207209
URAM903219 20 160162 239261 205205 151171 191195 239241 172172 203205 192194 212218 157163 157159 139141 178180 163171 145151 143147 177177 196208 195199
URAM903225 20 158162 237249 205207 157171 191199 243243 172176 205215 186194 212218 153157 141145 131131 182182 165167 143145 141143 157183 192200 197203
URAM903226 20 158162 239245 205205 159165 191191 239243 178178 199203 190194 212212 161161 153157 131139 182182 171173 145145 145145 157177 150150 203203
URAM903229 20 156160 239255 205205 159159 191195 241243 172176 199203 194198 210212 153157 141159 131139 180180 165165 143147 145145 175177 200208 203207
URAM903231 20 156160 237241 205205 157159 191195 243245 176178 203215 192194 210214 153165 141153 131131 180180 157165 143143 141147 177179 192198 203209
URAM903240 20 154164 239245 187187 137159 191195 231245 172178 203203 184194 210210 157161 137155 139141 180182 161163 143143 145145 157179 196198 203209
URAM903241 20 160164 245245 201205 151165 191199 241241 176178 199211 194198 216218 153153 151159 139139 180180 159173 145147 145145 177179 196198 203207
URAM903274 20 160160 239239 187205 159159 191191 241243 176176 203205 194198 210212 153157 159159 139139 176180 165165 145147 143145 157177 198208 203207

Baseline wildlife monitoring at I-90 Snoqualmie Pass East Appendices
Western Transportation Institute Page 225
Appendix 4.3. Individual martens identified within the greater I-90 SPE Project Area, including DNA source, sex, date of sampling, side of highway, and location of sample collection (UTM NAD83). Unique Individual Source Sex
Date Collected
Hwy Side UTM X UTM Y
MAAM101497 Hair M 2/9/2010 North 627970 5245076 MAAM130602 Hair M 4/4/2009 North 620285 5254827 MAAM130631 Hair F 10/22/2009 North 620455 5255151 MAAM130782 Hair M 3/4/2010 North 618388 5256330 MAAM130803 Hair F 2/23/2010 North 626415 5246528 MAAM130825 Hair M 2/23/2010 North 627051 5246870 MAAM144834 Hair F 1/27/2012 North 624307 5247865 MAAM160755 Hair M 1/13/2011 North 624912 5248045 MAAM167847 Hair M 3/21/2009 North 619933 5254494 MAAM193642 Hair F 3/4/2010 North 616992 5257191 MAAM197587 Hair M 5/8/2009 North 631343 5237791 MAAM900005 Hair M 3/17/2012 South 618458 5251190 MAAM900781 Hair M 2/13/2011 North 620294 5253235 MAAM900992 Hair M 1/27/2012 North 620570 5255247 MAAM903034 Hair M 2/3/2012 North 618928 5256090 MAAM903342 Hair M 1/27/2012 North 624912 5248045 MAAM903351 Hair M 2/10/2012 North 631024 5238034 MAAM903471 Hair M 1/23/2012 North 616700 5253637

Baseline wildlife monitoring at I-90 Snoqualmie Pass East Appendices
Western Transportation Institute Page 226
Appendix 4.4. Raw results of genetic analyses for martens, including number of loci successfully identified and locus-specific values for 12 microsatellite markers. Each 6-digit value represents 2, 3-digit alleles. Missing locus values represent a failed analysis at that locus.
Locus
Unique Individual # Loci
Complete MP55 MP114 MP175 MP197 MP59 MP85 MA-10 MA-7 MA-9 MP0227 MP0182 MP0144
MAAM101497 12 106108 154166 130130 235235 141141 127127 166168 189191 140140 116118 153155 157157
MAAM130602 12 106108 162170 130130 235235 141143 133133 168169 185191 141141 118118 155155 157157
MAAM130631 12 106106 166166 130130 235235 141141 127127 168169 189191 140141 118122 155155 157157
MAAM130782 12 106108 166170 130130 231235 141141 127133 166168 187189 140140 118122 153155 157157
MAAM130803 12 106106 158166 130130 231235 141143 127133 166166 187189 140140 118118 153153 157157
MAAM130825 12 106106 166166 130130 235235 141141 127127 168169 189189 140140 116118 155155 157157
MAAM144834 10 106106 235235 141141 127127 168169 185187 140141 116116 153153
MAAM160755 10 106106 231235 135141 127127 166169 185187 140141 118122 153155
MAAM167847 12 106106 158166 130130 231231 141141 127133 169169 187189 140140 118118 155155 157157
MAAM193642 12 106106 162166 130130 231235 141141 127133 168169 189191 140141 118118 155155 157157
MAAM197587 12 106108 158166 130130 235239 141143 127133 169170 185187 141142 118118 155155 157157
MAAM900005 10 106106 231231 141143 125127 166170 187189 140140 118118 153153
MAAM900781 11 106108 162166 231235 141141 127133 168168 185189 140140 118118 153155 157157
MAAM900992 10 106108 231235 135141 127135 168169 185189 140140 118118 153155
MAAM903034 10 106106 231235 141143 125127 166168 187189 140140 118118 153155
MAAM903342 10 106108 231235 141141 127133 168169 185191 141141 118118 155155
MAAM903351 10 106106 227231 141141 127133 168170 185187 140140 118118 153153
MAAM903471 10 106106 231235 141141 125127 169169 187189 140140 118122 155155
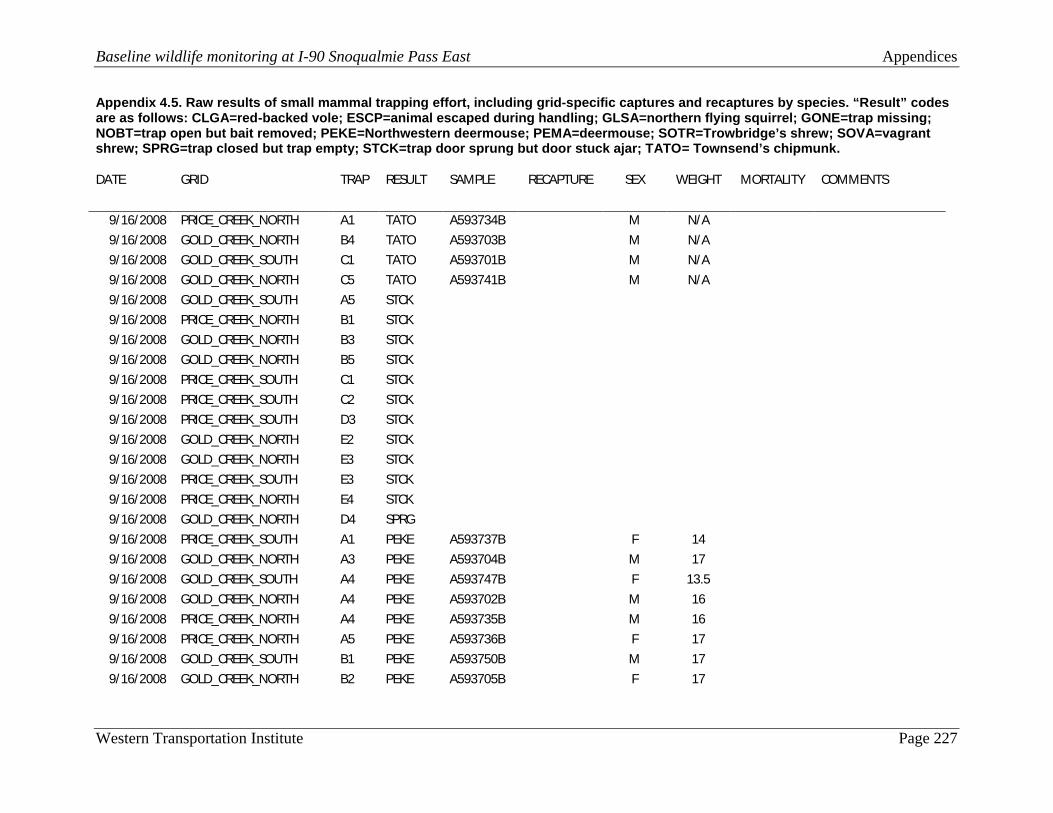
Baseline wildlife monitoring at I-90 Snoqualmie Pass East Appendices
Western Transportation Institute Page 227
Appendix 4.5. Raw results of small mammal trapping effort, including grid-specific captures and recaptures by species. “Result” codes are as follows: CLGA=red-backed vole; ESCP=animal escaped during handling; GLSA=northern flying squirrel; GONE=trap missing; NOBT=trap open but bait removed; PEKE=Northwestern deermouse; PEMA=deermouse; SOTR=Trowbridge’s shrew; SOVA=vagrant shrew; SPRG=trap closed but trap empty; STCK=trap door sprung but door stuck ajar; TATO= Townsend’s chipmunk. DATE GRID TRAP RESULT SAMPLE RECAPTURE SEX WEIGHT MORTALITY COMMENTS
9/16/2008 PRICE_CREEK_NORTH A1 TATO A593734B M N/A 9/16/2008 GOLD_CREEK_NORTH B4 TATO A593703B M N/A 9/16/2008 GOLD_CREEK_SOUTH C1 TATO A593701B M N/A 9/16/2008 GOLD_CREEK_NORTH C5 TATO A593741B M N/A 9/16/2008 GOLD_CREEK_SOUTH A5 STCK 9/16/2008 PRICE_CREEK_NORTH B1 STCK 9/16/2008 GOLD_CREEK_NORTH B3 STCK 9/16/2008 GOLD_CREEK_NORTH B5 STCK 9/16/2008 PRICE_CREEK_SOUTH C1 STCK 9/16/2008 PRICE_CREEK_SOUTH C2 STCK 9/16/2008 PRICE_CREEK_SOUTH D3 STCK 9/16/2008 GOLD_CREEK_NORTH E2 STCK 9/16/2008 GOLD_CREEK_NORTH E3 STCK 9/16/2008 PRICE_CREEK_SOUTH E3 STCK 9/16/2008 PRICE_CREEK_NORTH E4 STCK 9/16/2008 GOLD_CREEK_NORTH D4 SPRG 9/16/2008 PRICE_CREEK_SOUTH A1 PEKE A593737B F 14 9/16/2008 GOLD_CREEK_NORTH A3 PEKE A593704B M 17 9/16/2008 GOLD_CREEK_SOUTH A4 PEKE A593747B F 13.5 9/16/2008 GOLD_CREEK_NORTH A4 PEKE A593702B M 16 9/16/2008 PRICE_CREEK_NORTH A4 PEKE A593735B M 16 9/16/2008 PRICE_CREEK_NORTH A5 PEKE A593736B F 17 9/16/2008 GOLD_CREEK_SOUTH B1 PEKE A593750B M 17 9/16/2008 GOLD_CREEK_NORTH B2 PEKE A593705B F 17

Baseline wildlife monitoring at I-90 Snoqualmie Pass East Appendices
Western Transportation Institute Page 228
9/16/2008 PRICE_CREEK_SOUTH B2 PEKE A593708B M 15 9/16/2008 PRICE_CREEK_NORTH B3 PEKE A593729B M 15 SEX UNCERTAIN 9/16/2008 GOLD_CREEK_SOUTH C2 PEKE A593749B F 20 9/16/2008 GOLD_CREEK_SOUTH C3 PEKE A593748B F 14 9/16/2008 PRICE_CREEK_SOUTH C5 PEKE A593707B M 12.5 9/16/2008 PRICE_CREEK_NORTH C5 PEKE A593727B F 22 9/16/2008 PRICE_CREEK_SOUTH D1 PEKE A593738B M 15 9/16/2008 PRICE_CREEK_NORTH D1 PEKE A593733B F 16.5 9/16/2008 GOLD_CREEK_NORTH D2 PEKE A593706B M 21 9/16/2008 PRICE_CREEK_SOUTH D2 PEKE A593709B F 19 9/16/2008 GOLD_CREEK_SOUTH D4 PEKE A593746B F 24 9/16/2008 PRICE_CREEK_SOUTH D4 PEKE NO SAMPLE TAKEN 9/16/2008 PRICE_CREEK_NORTH D4 PEKE A593728B M 16 9/16/2008 GOLD_CREEK_SOUTH D5 PEKE A593743B M 21 9/16/2008 PRICE_CREEK_SOUTH E1 PEKE A593739B F 18 9/16/2008 PRICE_CREEK_NORTH E1 PEKE A593732B F 21 9/16/2008 PRICE_CREEK_NORTH E2 PEKE A593731B F 16 9/16/2008 PRICE_CREEK_NORTH E3 PEKE A593730B F 16 9/16/2008 GOLD_CREEK_SOUTH E4 PEKE A593745B M 17.5 9/16/2008 GOLD_CREEK_NORTH E4 PEKE A593740B F 15.5 9/16/2008 GOLD_CREEK_SOUTH E5 PEKE A593744B M 15 9/16/2008 GOLD_CREEK_NORTH E5 PEKE A593742B F 15 9/16/2008 PRICE_CREEK_NORTH E5 PEKE A593726B M 20 9/16/2008 GOLD_CREEK_SOUTH E1 ESCP MOST LIKELY A PEKE 9/17/2008 GOLD_CREEK_SOUTH C2 TATO A593724B F N/A 9/17/2008 GOLD_CREEK_SOUTH D1 TATO A593725B F N/A 9/17/2008 GOLD_CREEK_NORTH D4 TATO A593712B M N/A 9/17/2008 GOLD_CREEK_NORTH D5 TATO X M N/A 9/17/2008 GOLD_CREEK_SOUTH E3 STCK 9/17/2008 GOLD_CREEK_SOUTH A3 SPRG

Baseline wildlife monitoring at I-90 Snoqualmie Pass East Appendices
Western Transportation Institute Page 229
9/17/2008 GOLD_CREEK_NORTH B1 SPRG 9/17/2008 GOLD_CREEK_NORTH B4 SPRG 9/17/2008 PRICE_CREEK_NORTH C3 SPRG 9/17/2008 GOLD_CREEK_NORTH E1 SPRG 9/17/2008 PRICE_CREEK_NORTH E5 SPRG 9/17/2008 GOLD_CREEK_SOUTH A1 PEKE X M 16 9/17/2008 PRICE_CREEK_SOUTH A1 PEKE X F 14.5 9/17/2008 PRICE_CREEK_NORTH A2 PEKE A197502B M 14 9/17/2008 GOLD_CREEK_NORTH A3 PEKE X M 18 9/17/2008 GOLD_CREEK_SOUTH A4 PEKE A593723B M 21 9/17/2008 GOLD_CREEK_NORTH A5 PEKE A593720B M 21 9/17/2008 GOLD_CREEK_SOUTH B1 PEKE X F 21 9/17/2008 PRICE_CREEK_NORTH B1 PEKE A197550B F 14 9/17/2008 GOLD_CREEK_SOUTH B2 PEKE A593710B F 15.5 9/17/2008 PRICE_CREEK_SOUTH B2 PEKE A593716B M 16 9/17/2008 PRICE_CREEK_SOUTH B3 PEKE X N/A 15 9/17/2008 PRICE_CREEK_NORTH B4 PEKE A197545B F 18 9/17/2008 GOLD_CREEK_SOUTH B5 PEKE X M 21 9/17/2008 GOLD_CREEK_NORTH B5 PEKE X M 18 9/17/2008 PRICE_CREEK_NORTH B5 PEKE A197544B F 13 9/17/2008 GOLD_CREEK_SOUTH C3 PEKE X M 20 9/17/2008 PRICE_CREEK_SOUTH C4 PEKE A593718B F 14 9/17/2008 PRICE_CREEK_NORTH C4 PEKE X F 18 9/17/2008 GOLD_CREEK_SOUTH C5 PEKE X F 18 9/17/2008 GOLD_CREEK_NORTH C5 PEKE X M 18 9/17/2008 PRICE_CREEK_SOUTH C5 PEKE A593719B F 18 9/17/2008 PRICE_CREEK_NORTH C5 PEKE A197543B M 17 9/17/2008 PRICE_CREEK_SOUTH D1 PEKE A593714B M 15 9/17/2008 PRICE_CREEK_SOUTH D2 PEKE A593715B M 15.5 9/17/2008 GOLD_CREEK_SOUTH D3 PEKE A593711B M 16

Baseline wildlife monitoring at I-90 Snoqualmie Pass East Appendices
Western Transportation Institute Page 230
9/17/2008 GOLD_CREEK_NORTH D3 PEKE X M 21 9/17/2008 PRICE_CREEK_SOUTH D3 PEKE X F 21 9/17/2008 GOLD_CREEK_SOUTH D4 PEKE X F 16 9/17/2008 PRICE_CREEK_SOUTH D4 PEKE A593717B M 16 9/17/2008 GOLD_CREEK_SOUTH D5 PEKE A593721B F 17 SEX UNCERTAIN 9/17/2008 PRICE_CREEK_NORTH D5 PEKE X M 17 9/17/2008 PRICE_CREEK_NORTH E1 PEKE A197549B F 14.5 9/17/2008 PRICE_CREEK_NORTH E2 PEKE A197548B M 13 9/17/2008 PRICE_CREEK_NORTH E3 PEKE A197547B M 14.5 9/17/2008 GOLD_CREEK_SOUTH E4 PEKE X F 22 9/17/2008 GOLD_CREEK_NORTH E4 PEKE A593713B M 18 9/17/2008 PRICE_CREEK_NORTH E4 PEKE A197546B M 17 9/17/2008 GOLD_CREEK_SOUTH E5 PEKE A593722B M 20 9/17/2008 GOLD_CREEK_NORTH D1 GLSA RELEASED 9/17/2008 PRICE_CREEK_NORTH A3 ESCP TATO 9/17/2008 GOLD_CREEK_SOUTH C1 ESCP TATO 9/18/2008 GOLD_CREEK_NORTH A1 TATO A197538B F N/A 9/18/2008 GOLD_CREEK_NORTH A5 TATO A197539B M N/A 9/18/2008 PRICE_CREEK_NORTH C5 TATO X M N/A 9/18/2008 GOLD_CREEK_NORTH D4 TATO 9/18/2008 PRICE_CREEK_SOUTH E3 TATO A197536B M N/A 9/18/2008 GOLD_CREEK_SOUTH C1 SPRG 9/18/2008 GOLD_CREEK_NORTH C1 SPRG 9/18/2008 GOLD_CREEK_NORTH C3 SPRG 9/18/2008 GOLD_CREEK_NORTH D2 SPRG 9/18/2008 GOLD_CREEK_NORTH D1 SOVA N/A 5 X MAYBE SOMO(?) 9/18/2008 GOLD_CREEK_SOUTH A4 SOTR A197541B N/A 7 SPECIES WRONG? 9/18/2008 PRICE_CREEK_SOUTH A5 PEKE X F 16 9/18/2008 GOLD_CREEK_SOUTH B1 PEKE X F 17 9/18/2008 PRICE_CREEK_SOUTH B2 PEKE X F 16

Baseline wildlife monitoring at I-90 Snoqualmie Pass East Appendices
Western Transportation Institute Page 231
9/18/2008 PRICE_CREEK_SOUTH B3 PEKE A197537B M 18 9/18/2008 GOLD_CREEK_SOUTH B4 PEKE X F 14 9/18/2008 GOLD_CREEK_NORTH B4 PEKE X M 16 SHRT TAIL, <103mm 9/18/2008 PRICE_CREEK_NORTH B4 PEKE X M 16 9/18/2008 GOLD_CREEK_NORTH B5 PEKE A197540B F 17 9/18/2008 PRICE_CREEK_SOUTH C1 PEKE X M 14 9/18/2008 GOLD_CREEK_SOUTH C2 PEKE A197542B M 18 9/18/2008 PRICE_CREEK_NORTH C3 PEKE X F 14 9/18/2008 GOLD_CREEK_SOUTH C4 PEKE X F 15 9/18/2008 PRICE_CREEK_SOUTH C4 PEKE A197505B M 16 9/18/2008 PRICE_CREEK_NORTH C4 PEKE X M 17 9/18/2008 PRICE_CREEK_SOUTH D1 PEKE X M 16 9/18/2008 PRICE_CREEK_NORTH D1 PEKE X F 19 9/18/2008 PRICE_CREEK_SOUTH D2 PEKE 9/18/2008 GOLD_CREEK_SOUTH D3 PEKE X F 15 9/18/2008 PRICE_CREEK_SOUTH D3 PEKE X M 14.5 9/18/2008 GOLD_CREEK_SOUTH D4 PEKE X M 17 TWO IN TRAP 9/18/2008 GOLD_CREEK_SOUTH D4 PEKE X F 20 TWO IN TRAP 9/18/2008 PRICE_CREEK_SOUTH D4 PEKE A197504B F 15 9/18/2008 GOLD_CREEK_SOUTH D5 PEKE X M 18 9/18/2008 GOLD_CREEK_SOUTH E1 PEKE X M 17 9/18/2008 PRICE_CREEK_SOUTH E1 PEKE X M 16 9/18/2008 PRICE_CREEK_NORTH E3 PEKE A197507B F 15 9/18/2008 GOLD_CREEK_SOUTH E4 PEKE A197503B M 18 TAIL <103mm PEMA? 9/18/2008 GOLD_CREEK_NORTH E4 PEKE X M N/A TAIL <103mm PEMA? 9/18/2008 PRICE_CREEK_NORTH E4 PEKE A197506B M 15 TAIL < 103mm PEMA? 9/18/2008 GOLD_CREEK_SOUTH E5 PEKE X F 21 9/18/2008 PRICE_CREEK_NORTH A5 NOBT 9/18/2008 PRICE_CREEK_NORTH C1 NOBT 9/18/2008 PRICE_CREEK_SOUTH C2 NOBT

Baseline wildlife monitoring at I-90 Snoqualmie Pass East Appendices
Western Transportation Institute Page 232
9/18/2008 PRICE_CREEK_SOUTH E2 NOBT 9/18/2008 GOLD_CREEK_SOUTH A5 GLSA X 9/18/2008 GOLD_CREEK_SOUTH B2 ESCP TATO 9/18/2008 GOLD_CREEK_SOUTH D2 ESCP 9/19/2008 PRICE_CREEK_SOUTH A1 TATO A197512B M N/A 9/19/2008 PRICE_CREEK_NORTH B1 TATO X F N/A 9/19/2008 GOLD_CREEK_SOUTH B2 TATO X F N/A 9/19/2008 GOLD_CREEK_NORTH B5 TATO X M N/A 9/19/2008 GOLD_CREEK_SOUTH D1 TATO A197508B F N/A 9/19/2008 GOLD_CREEK_NORTH D2 TATO A197511B F N/A 9/19/2008 GOLD_CREEK_SOUTH D3 TATO X F N/A 9/19/2008 PRICE_CREEK_SOUTH E1 TATO X M N/A 9/19/2008 PRICE_CREEK_SOUTH D1 STCK 9/19/2008 GOLD_CREEK_NORTH B4 SPRG 9/19/2008 PRICE_CREEK_SOUTH C1 SPRG 9/19/2008 PRICE_CREEK_SOUTH A3 PEKE X F 19 9/19/2008 PRICE_CREEK_NORTH A3 PEKE A197513B F 17 9/19/2008 GOLD_CREEK_SOUTH A5 PEKE A197509B F 19 9/19/2008 PRICE_CREEK_NORTH A5 PEKE A197514B F 19 9/19/2008 GOLD_CREEK_SOUTH B1 PEKE X M 18 9/19/2008 PRICE_CREEK_SOUTH B2 PEKE X F N/A 9/19/2008 GOLD_CREEK_SOUTH B4 PEKE X M 18 9/19/2008 PRICE_CREEK_SOUTH B4 PEKE X M 14 9/19/2008 PRICE_CREEK_NORTH B4 PEKE X F 19 9/19/2008 GOLD_CREEK_SOUTH B5 PEKE A197535B M 17 9/19/2008 PRICE_CREEK_NORTH C1 PEKE A197515B M 16 9/19/2008 GOLD_CREEK_NORTH C2 PEKE A197510B F 16 9/19/2008 PRICE_CREEK_NORTH C2 PEKE A197534B M 12 9/19/2008 GOLD_CREEK_SOUTH C3 PEKE X M 17 9/19/2008 GOLD_CREEK_NORTH C3 PEKE X F 18

Baseline wildlife monitoring at I-90 Snoqualmie Pass East Appendices
Western Transportation Institute Page 233
9/19/2008 PRICE_CREEK_SOUTH C3 PEKE X F 16 9/19/2008 PRICE_CREEK_NORTH C3 PEKE X F 16 9/19/2008 GOLD_CREEK_SOUTH C4 PEKE F 16 9/19/2008 PRICE_CREEK_SOUTH C5 PEKE X M 14 9/19/2008 PRICE_CREEK_NORTH C5 PEKE A197517B M 15 9/19/2008 PRICE_CREEK_SOUTH D4 PEKE X N/A N/A ESCAPE B/F SEX/WT 9/19/2008 GOLD_CREEK_SOUTH D5 PEKE X F 22 9/19/2008 PRICE_CREEK_NORTH D5 PEKE X F 17 9/19/2008 PRICE_CREEK_NORTH E2 PEKE 9/19/2008 PRICE_CREEK_NORTH E3 PEKE A197516B F 17.5 9/19/2008 GOLD_CREEK_SOUTH E4 PEKE X F 20 9/19/2008 PRICE_CREEK_NORTH E4 PEKE X M 17 9/19/2008 GOLD_CREEK_SOUTH E5 PEKE X M 15.5 9/19/2008 PRICE_CREEK_NORTH A1 NOBT 9/19/2008 GOLD_CREEK_SOUTH A2 NOBT 9/19/2008 GOLD_CREEK_NORTH A2 NOBT 9/19/2008 PRICE_CREEK_NORTH A2 NOBT 9/19/2008 GOLD_CREEK_SOUTH D2 NOBT 9/19/2008 PRICE_CREEK_NORTH D2 NOBT 9/19/2008 GOLD_CREEK_NORTH D5 NOBT 9/19/2008 GOLD_CREEK_SOUTH E2 NOBT 9/19/2008 GOLD_CREEK_NORTH E2 NOBT 9/19/2008 PRICE_CREEK_SOUTH E2 NOBT 9/19/2008 GOLD_CREEK_SOUTH E3 NOBT 9/19/2008 PRICE_CREEK_SOUTH E4 NOBT 9/19/2008 PRICE_CREEK_NORTH E5 NOBT 9/19/2008 GOLD_CREEK_NORTH B3 GLSA RELEASED 9/19/2008 GOLD_CREEK_NORTH E4 ESCP SOVA(?) ESCAPED 9/23/2008 SWAMP_CREEK_SOUTH D1 TATO A197532B M N/A 9/23/2008 SWAMP_CREEK_NORTH B1 STCK

Baseline wildlife monitoring at I-90 Snoqualmie Pass East Appendices
Western Transportation Institute Page 234
9/23/2008 SWAMP_CREEK_SOUTH B5 STCK 9/23/2008 SWAMP_CREEK_SOUTH D2 STCK 9/23/2008 SWAMP_CREEK_SOUTH B2 SPRG 9/23/2008 SWAMP_CREEK_SOUTH C5 SPRG 9/23/2008 SWAMP_CREEK_NORTH A1 PEKE A197528B F 21 9/23/2008 SWAMP_CREEK_NORTH A2 PEKE A197527B M 17 9/23/2008 SWAMP_CREEK_SOUTH A2 PEKE A197518B F 19 9/23/2008 SWAMP_CREEK_SOUTH B1 PEKE A197533B F 21 9/23/2008 SWAMP_CREEK_SOUTH C1 PEKE A197519B M 17 TAIL < 103MM,
PEMA? 9/23/2008 SWAMP_CREEK_SOUTH D3 PEKE A197520B M 15 9/23/2008 SWAMP_CREEK_SOUTH E1 PEKE A197521B M 25 9/23/2008 SWAMP_CREEK_SOUTH E2 PEKE A197531B M 20 9/23/2008 SWAMP_CREEK_SOUTH E4 PEKE A197530B M 15 9/23/2008 SWAMP_CREEK_SOUTH E5 PEKE A197529B M 18 9/24/2008 SWAMP_CREEK_SOUTH A5 TATO A197526B F N/A 9/24/2008 SWAMP_CREEK_SOUTH B4 TATO A197524B F N/A 9/24/2008 SWAMP_CREEK_SOUTH C3 TATO A197650B M N/A 9/24/2008 SWAMP_CREEK_SOUTH D2 TATO A197649B F N/A 9/24/2008 SWAMP_CREEK_NORTH B1 PEKE X M 17 9/24/2008 SWAMP_CREEK_SOUTH B1 PEKE X M 17 9/24/2008 SWAMP_CREEK_SOUTH B2 PEKE A197522B M 20 9/24/2008 SWAMP_CREEK_NORTH B5 PEKE A197605B M 19 9/24/2008 SWAMP_CREEK_SOUTH B5 PEKE A197525B F 18 9/24/2008 SWAMP_CREEK_SOUTH C1 PEKE X F 21 9/24/2008 SWAMP_CREEK_SOUTH C2 PEKE A197523B F 18 9/24/2008 SWAMP_CREEK_SOUTH C5 PEKE A197601B M 16 9/24/2008 SWAMP_CREEK_SOUTH D3 PEKE X M 16 9/24/2008 SWAMP_CREEK_SOUTH D4 PEKE A197602B M 19 9/24/2008 SWAMP_CREEK_SOUTH E1 PEKE A197603B F 19 9/24/2008 SWAMP_CREEK_SOUTH E2 PEKE X F 20
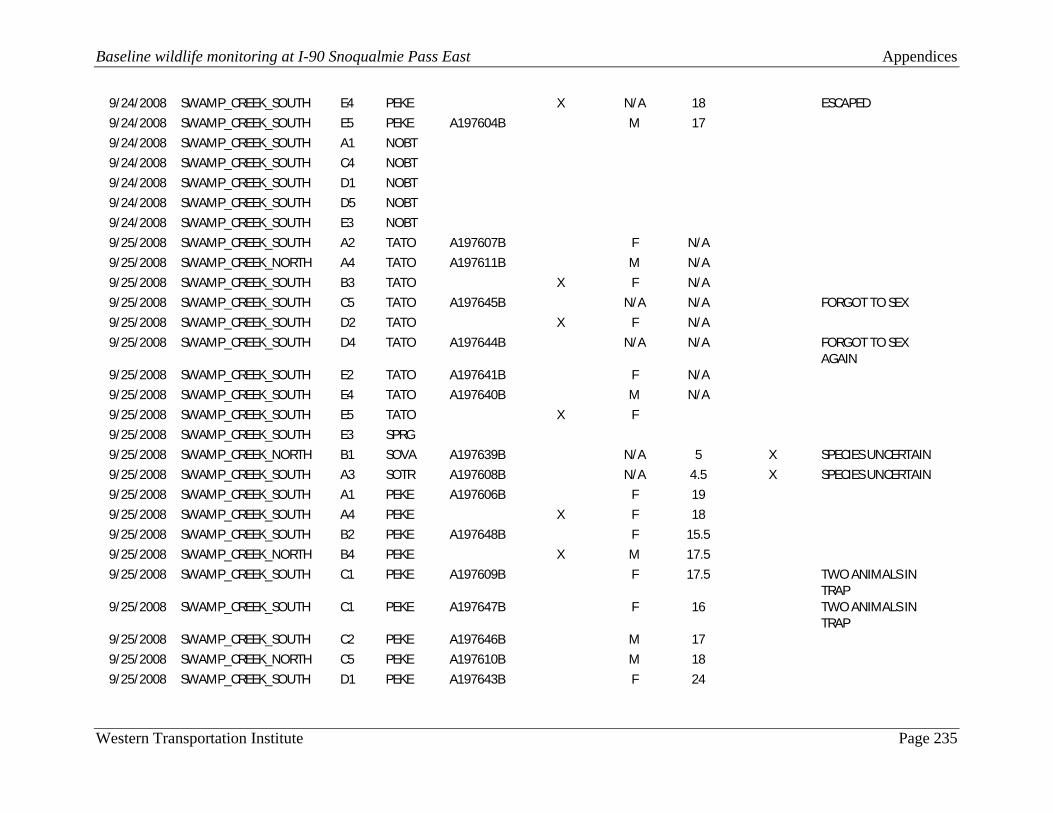
Baseline wildlife monitoring at I-90 Snoqualmie Pass East Appendices
Western Transportation Institute Page 235
9/24/2008 SWAMP_CREEK_SOUTH E4 PEKE X N/A 18 ESCAPED 9/24/2008 SWAMP_CREEK_SOUTH E5 PEKE A197604B M 17 9/24/2008 SWAMP_CREEK_SOUTH A1 NOBT 9/24/2008 SWAMP_CREEK_SOUTH C4 NOBT 9/24/2008 SWAMP_CREEK_SOUTH D1 NOBT 9/24/2008 SWAMP_CREEK_SOUTH D5 NOBT 9/24/2008 SWAMP_CREEK_SOUTH E3 NOBT 9/25/2008 SWAMP_CREEK_SOUTH A2 TATO A197607B F N/A 9/25/2008 SWAMP_CREEK_NORTH A4 TATO A197611B M N/A 9/25/2008 SWAMP_CREEK_SOUTH B3 TATO X F N/A 9/25/2008 SWAMP_CREEK_SOUTH C5 TATO A197645B N/A N/A FORGOT TO SEX 9/25/2008 SWAMP_CREEK_SOUTH D2 TATO X F N/A 9/25/2008 SWAMP_CREEK_SOUTH D4 TATO A197644B N/A N/A FORGOT TO SEX
AGAIN 9/25/2008 SWAMP_CREEK_SOUTH E2 TATO A197641B F N/A 9/25/2008 SWAMP_CREEK_SOUTH E4 TATO A197640B M N/A 9/25/2008 SWAMP_CREEK_SOUTH E5 TATO X F 9/25/2008 SWAMP_CREEK_SOUTH E3 SPRG 9/25/2008 SWAMP_CREEK_NORTH B1 SOVA A197639B N/A 5 X SPECIES UNCERTAIN 9/25/2008 SWAMP_CREEK_SOUTH A3 SOTR A197608B N/A 4.5 X SPECIES UNCERTAIN 9/25/2008 SWAMP_CREEK_SOUTH A1 PEKE A197606B F 19 9/25/2008 SWAMP_CREEK_SOUTH A4 PEKE X F 18 9/25/2008 SWAMP_CREEK_SOUTH B2 PEKE A197648B F 15.5 9/25/2008 SWAMP_CREEK_NORTH B4 PEKE X M 17.5 9/25/2008 SWAMP_CREEK_SOUTH C1 PEKE A197609B F 17.5 TWO ANIMALS IN
TRAP 9/25/2008 SWAMP_CREEK_SOUTH C1 PEKE A197647B F 16 TWO ANIMALS IN
TRAP 9/25/2008 SWAMP_CREEK_SOUTH C2 PEKE A197646B M 17 9/25/2008 SWAMP_CREEK_NORTH C5 PEKE A197610B M 18 9/25/2008 SWAMP_CREEK_SOUTH D1 PEKE A197643B F 24

Baseline wildlife monitoring at I-90 Snoqualmie Pass East Appendices
Western Transportation Institute Page 236
9/25/2008 SWAMP_CREEK_SOUTH E1 PEKE A197642B F 19 9/25/2008 SWAMP_CREEK_NORTH A1 NOBT 9/25/2008 SWAMP_CREEK_NORTH A5 NOBT 9/25/2008 SWAMP_CREEK_SOUTH A5 NOBT 9/25/2008 SWAMP_CREEK_SOUTH B1 NOBT 9/25/2008 SWAMP_CREEK_SOUTH B4 NOBT 9/25/2008 SWAMP_CREEK_SOUTH B5 NOBT 9/25/2008 SWAMP_CREEK_SOUTH C3 NOBT 9/25/2008 SWAMP_CREEK_SOUTH C4 NOBT 9/25/2008 SWAMP_CREEK_SOUTH D3 NOBT 9/25/2008 SWAMP_CREEK_SOUTH D5 NOBT 9/25/2008 SWAMP_CREEK_NORTH D5 ESCP PEKE 9/26/2008 SWAMP_CREEK_NORTH A4 TATO A197615B F N/A 9/26/2008 SWAMP_CREEK_SOUTH B3 TATO X F 9/26/2008 SWAMP_CREEK_SOUTH B5 TATO X F N/A 9/26/2008 SWAMP_CREEK_SOUTH C3 TATO A197637B M N/A 9/26/2008 SWAMP_CREEK_SOUTH C5 TATO X M N/A 9/26/2008 SWAMP_CREEK_SOUTH E1 TATO A197612B M N/A 9/26/2008 SWAMP_CREEK_SOUTH E2 TATO X M 9/26/2008 SWAMP_CREEK_SOUTH A1 SPRG 9/26/2008 SWAMP_CREEK_SOUTH B1 SPRG 9/26/2008 SWAMP_CREEK_NORTH C1 SPRG 9/26/2008 SWAMP_CREEK_SOUTH C1 SPRG 9/26/2008 SWAMP_CREEK_NORTH C2 SPRG 9/26/2008 SWAMP_CREEK_SOUTH C2 SPRG 9/26/2008 SWAMP_CREEK_NORTH D3 SPRG 9/26/2008 SWAMP_CREEK_SOUTH D3 SPRG 9/26/2008 SWAMP_CREEK_SOUTH E4 SPRG 9/26/2008 SWAMP_CREEK_NORTH A2 PEKE X F 17 9/26/2008 SWAMP_CREEK_SOUTH A3 PEKE A197638B M 18

Baseline wildlife monitoring at I-90 Snoqualmie Pass East Appendices
Western Transportation Institute Page 237
9/26/2008 SWAMP_CREEK_NORTH A5 PEKE X M 17 9/26/2008 SWAMP_CREEK_SOUTH B2 PEKE X F 21 9/26/2008 SWAMP_CREEK_SOUTH C4 PEKE A197636B F 22 9/26/2008 SWAMP_CREEK_NORTH C5 PEKE A197614B F 16 9/26/2008 SWAMP_CREEK_NORTH E4 PEKE A197613B M 19 9/26/2008 SWAMP_CREEK_SOUTH A2 NOBT 9/26/2008 SWAMP_CREEK_SOUTH A4 NOBT 9/26/2008 SWAMP_CREEK_SOUTH A5 NOBT 9/26/2008 SWAMP_CREEK_NORTH B4 NOBT 9/26/2008 SWAMP_CREEK_SOUTH B4 NOBT 9/26/2008 SWAMP_CREEK_SOUTH D1 NOBT 9/26/2008 SWAMP_CREEK_SOUTH D2 NOBT 9/26/2008 SWAMP_CREEK_SOUTH D4 NOBT 9/26/2008 SWAMP_CREEK_SOUTH D5 NOBT 9/26/2008 SWAMP_CREEK_NORTH E1 NOBT 9/26/2008 SWAMP_CREEK_NORTH E3 NOBT 9/26/2008 SWAMP_CREEK_SOUTH E3 NOBT 9/26/2008 SWAMP_CREEK_NORTH E5 NOBT 9/26/2008 SWAMP_CREEK_SOUTH E5 NOBT 9/30/2008 TOLL_CREEK_NORTH A2 TATO A197736B M N/A 9/30/2008 TOLL_CREEK_NORTH E5 TATO A197733B M N/A 9/30/2008 TOLL_CREEK_NORTH B2 SPRG 9/30/2008 TOLL_CREEK_SOUTH C2 SPRG 9/30/2008 TOLL_CREEK_NORTH D1 SPRG DAMAGED BY BEAR 9/30/2008 TOLL_CREEK_NORTH A1 PEKE A197737B M 20 9/30/2008 TOLL_CREEK_SOUTH A1 PEKE A197726B M 17 9/30/2008 TOLL_CREEK_SOUTH A3 PEKE A197729B M 17 9/30/2008 TOLL_CREEK_NORTH A5 PEKE A197735B M 16 9/30/2008 TOLL_CREEK_SOUTH B2 PEKE A197727B M 18 9/30/2008 TOLL_CREEK_NORTH B5 PEKE A197734B M 19

Baseline wildlife monitoring at I-90 Snoqualmie Pass East Appendices
Western Transportation Institute Page 238
9/30/2008 TOLL_CREEK_SOUTH C4 PEKE A197730B M 16 9/30/2008 TOLL_CREEK_SOUTH C5 PEKE A197731B M 15 9/30/2008 TOLL_CREEK_SOUTH D1 PEKE A197725B F 18 9/30/2008 TOLL_CREEK_SOUTH D2 PEKE A197728B M 17 9/30/2008 TOLL_CREEK_SOUTH D5 PEKE A197732B F 18 9/30/2008 TOLL_CREEK_NORTH E1 PEKE A197738B M 19 9/30/2008 TOLL_CREEK_SOUTH E3 PEKE A197724B F 17 9/30/2008 TOLL_CREEK_NORTH E4 PEKE A197740B F 20 9/30/2008 TOLL_CREEK_NORTH C5 NOBT 9/30/2008 TOLL_CREEK_NORTH D5 NOBT 9/30/2008 TOLL_CREEK_SOUTH E1 NOBT 9/30/2008 TOLL_CREEK_NORTH E3 CLGA A197739B UNK 14 X 10/1/2008 TOLL_CREEK_NORTH D1 STCK 10/1/2008 TOLL_CREEK_SOUTH C1 SPRG 10/1/2008 TOLL_CREEK_NORTH A1 PEKE A197703B M 15 10/1/2008 TOLL_CREEK_SOUTH A3 PEKE A197745B M 17 10/1/2008 TOLL_CREEK_NORTH A4 PEKE A197702B F 17 10/1/2008 TOLL_CREEK_SOUTH A4 PEKE A197746B M 16 10/1/2008 TOLL_CREEK_SOUTH A5 PEKE A197747B M 17 10/1/2008 TOLL_CREEK_NORTH B1 PEKE X M 19 10/1/2008 TOLL_CREEK_NORTH B2 PEKE A197705B F 17 10/1/2008 TOLL_CREEK_SOUTH C2 PEKE A197743B M 16 10/1/2008 TOLL_CREEK_NORTH C3 PEKE A197706B F 16 10/1/2008 TOLL_CREEK_SOUTH C3 PEKE X M 19 10/1/2008 TOLL_CREEK_SOUTH C4 PEKE X M 18 10/1/2008 TOLL_CREEK_SOUTH D1 PEKE A197742B F 20 10/1/2008 TOLL_CREEK_NORTH D2 PEKE A197704B F 18 10/1/2008 TOLL_CREEK_SOUTH D2 PEKE X F 18 10/1/2008 TOLL_CREEK_SOUTH D3 PEKE A197744B M 18 10/1/2008 TOLL_CREEK_SOUTH D4 PEKE X M 17
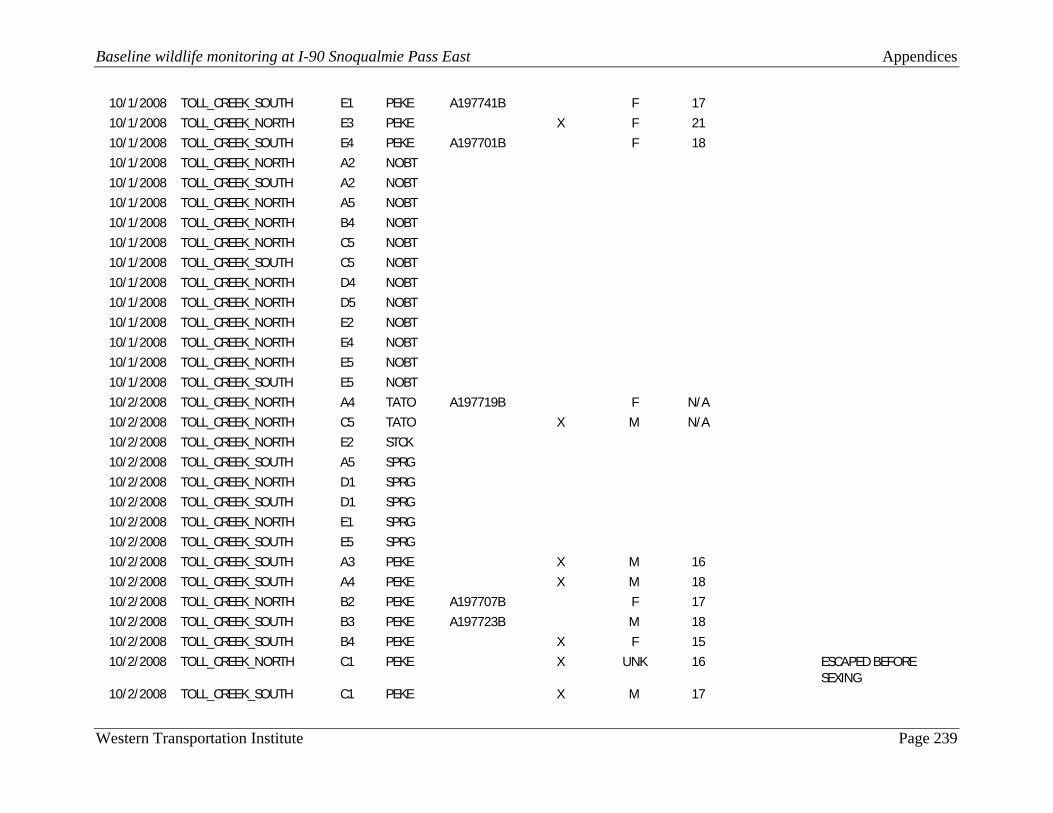
Baseline wildlife monitoring at I-90 Snoqualmie Pass East Appendices
Western Transportation Institute Page 239
10/1/2008 TOLL_CREEK_SOUTH E1 PEKE A197741B F 17 10/1/2008 TOLL_CREEK_NORTH E3 PEKE X F 21 10/1/2008 TOLL_CREEK_SOUTH E4 PEKE A197701B F 18 10/1/2008 TOLL_CREEK_NORTH A2 NOBT 10/1/2008 TOLL_CREEK_SOUTH A2 NOBT 10/1/2008 TOLL_CREEK_NORTH A5 NOBT 10/1/2008 TOLL_CREEK_NORTH B4 NOBT 10/1/2008 TOLL_CREEK_NORTH C5 NOBT 10/1/2008 TOLL_CREEK_SOUTH C5 NOBT 10/1/2008 TOLL_CREEK_NORTH D4 NOBT 10/1/2008 TOLL_CREEK_NORTH D5 NOBT 10/1/2008 TOLL_CREEK_NORTH E2 NOBT 10/1/2008 TOLL_CREEK_NORTH E4 NOBT 10/1/2008 TOLL_CREEK_NORTH E5 NOBT 10/1/2008 TOLL_CREEK_SOUTH E5 NOBT 10/2/2008 TOLL_CREEK_NORTH A4 TATO A197719B F N/A 10/2/2008 TOLL_CREEK_NORTH C5 TATO X M N/A 10/2/2008 TOLL_CREEK_NORTH E2 STCK 10/2/2008 TOLL_CREEK_SOUTH A5 SPRG 10/2/2008 TOLL_CREEK_NORTH D1 SPRG 10/2/2008 TOLL_CREEK_SOUTH D1 SPRG 10/2/2008 TOLL_CREEK_NORTH E1 SPRG 10/2/2008 TOLL_CREEK_SOUTH E5 SPRG 10/2/2008 TOLL_CREEK_SOUTH A3 PEKE X M 16 10/2/2008 TOLL_CREEK_SOUTH A4 PEKE X M 18 10/2/2008 TOLL_CREEK_NORTH B2 PEKE A197707B F 17 10/2/2008 TOLL_CREEK_SOUTH B3 PEKE A197723B M 18 10/2/2008 TOLL_CREEK_SOUTH B4 PEKE X F 15 10/2/2008 TOLL_CREEK_NORTH C1 PEKE X UNK 16 ESCAPED BEFORE
SEXING 10/2/2008 TOLL_CREEK_SOUTH C1 PEKE X M 17

Baseline wildlife monitoring at I-90 Snoqualmie Pass East Appendices
Western Transportation Institute Page 240
10/2/2008 TOLL_CREEK_NORTH C2 PEKE X M 16 10/2/2008 TOLL_CREEK_SOUTH C2 PEKE X F 16 10/2/2008 TOLL_CREEK_NORTH C4 PEKE A197717B F 16 10/2/2008 TOLL_CREEK_SOUTH C4 PEKE X M 15 10/2/2008 TOLL_CREEK_SOUTH C5 PEKE A197722B F 18 10/2/2008 TOLL_CREEK_SOUTH D2 PEKE X F 18 10/2/2008 TOLL_CREEK_SOUTH D4 PEKE 10/2/2008 TOLL_CREEK_NORTH D5 PEKE A197720B M 16 10/2/2008 TOLL_CREEK_NORTH E3 PEKE X F 17 10/2/2008 TOLL_CREEK_NORTH E4 PEKE X F 19 10/2/2008 TOLL_CREEK_NORTH E5 PEKE A197721B F 18 10/2/2008 TOLL_CREEK_SOUTH A2 NOBT 10/2/2008 TOLL_CREEK_NORTH A3 NOBT 10/2/2008 TOLL_CREEK_NORTH A5 NOBT 10/2/2008 TOLL_CREEK_NORTH B1 NOBT 10/2/2008 TOLL_CREEK_SOUTH B1 NOBT 10/2/2008 TOLL_CREEK_NORTH B5 NOBT 10/2/2008 TOLL_CREEK_SOUTH B5 NOBT 10/2/2008 TOLL_CREEK_SOUTH C3 NOBT 10/2/2008 TOLL_CREEK_NORTH D3 NOBT 10/2/2008 TOLL_CREEK_SOUTH D5 NOBT 10/2/2008 TOLL_CREEK_SOUTH E1 NOBT 10/2/2008 TOLL_CREEK_SOUTH E3 NOBT 10/2/2008 TOLL_CREEK_SOUTH E4 NOBT 10/2/2008 TOLL_CREEK_SOUTH D3 ESCP 10/2/2008 TOLL_CREEK_NORTH D4 ESCP TATO 10/2/2008 TOLL_CREEK_NORTH B4 CLGA A197708B 10/3/2008 TOLL_CREEK_NORTH C5 TATO A197753B F N/A X 10/3/2008 TOLL_CREEK_NORTH E1 TATO A197754B F N/A 10/3/2008 TOLL_CREEK_NORTH E4 TATO A197755B M N/A

Baseline wildlife monitoring at I-90 Snoqualmie Pass East Appendices
Western Transportation Institute Page 241
10/3/2008 TOLL_CREEK_NORTH E5 TATO X M N/A 10/3/2008 TOLL_CREEK_NORTH E3 SPRG 10/3/2008 TOLL_CREEK_SOUTH A1 PEKE A197751B F 20 10/3/2008 TOLL_CREEK_SOUTH A2 PEKE A197716B F 16 10/3/2008 TOLL_CREEK_SOUTH A4 PEKE X F 19 10/3/2008 TOLL_CREEK_SOUTH A5 PEKE X F 16 10/3/2008 TOLL_CREEK_NORTH B2 PEKE X M 16 10/3/2008 TOLL_CREEK_SOUTH B2 PEKE A197752B M 17 10/3/2008 TOLL_CREEK_SOUTH B3 PEKE X M 17 10/3/2008 TOLL_CREEK_SOUTH B4 PEKE A197715B F 16 10/3/2008 TOLL_CREEK_NORTH C1 PEKE A197713B M 18 10/3/2008 TOLL_CREEK_SOUTH C1 PEKE X F 16 10/3/2008 TOLL_CREEK_SOUTH C4 PEKE A197714B F 19 10/3/2008 TOLL_CREEK_SOUTH C5 PEKE X M 16 10/3/2008 TOLL_CREEK_SOUTH D3 PEKE X F 17 10/3/2008 TOLL_CREEK_SOUTH E4 PEKE X M 19 10/3/2008 TOLL_CREEK_SOUTH E5 PEKE X M 20 10/3/2008 TOLL_CREEK_NORTH A2 NOBT 10/3/2008 TOLL_CREEK_NORTH A3 NOBT 10/3/2008 TOLL_CREEK_NORTH A4 NOBT 10/3/2008 TOLL_CREEK_NORTH A5 NOBT 10/3/2008 TOLL_CREEK_NORTH B1 NOBT 10/3/2008 TOLL_CREEK_SOUTH B1 NOBT 10/3/2008 TOLL_CREEK_NORTH B3 NOBT 10/3/2008 TOLL_CREEK_NORTH B5 NOBT 10/3/2008 TOLL_CREEK_SOUTH B5 NOBT 10/3/2008 TOLL_CREEK_NORTH C3 NOBT 10/3/2008 TOLL_CREEK_NORTH D1 NOBT 10/3/2008 TOLL_CREEK_NORTH D2 NOBT 10/3/2008 TOLL_CREEK_SOUTH D2 NOBT

Baseline wildlife monitoring at I-90 Snoqualmie Pass East Appendices
Western Transportation Institute Page 242
10/3/2008 TOLL_CREEK_NORTH D3 NOBT 10/3/2008 TOLL_CREEK_NORTH D4 NOBT 10/3/2008 TOLL_CREEK_SOUTH D4 NOBT 10/3/2008 TOLL_CREEK_NORTH D5 NOBT 10/3/2008 TOLL_CREEK_SOUTH D5 NOBT 10/3/2008 TOLL_CREEK_NORTH E2 NOBT 10/3/2008 TOLL_CREEK_SOUTH E2 NOBT 10/3/2008 TOLL_CREEK_SOUTH E3 NOBT 10/7/2009 HUDSON_SOUTH B1 SPRG 10/7/2009 HUDSON_NORTH A1 PEKE A197801B F 16 10/7/2009 HUDSON_SOUTH A2 PEKE A197756B F 19 10/7/2009 HUDSON_NORTH A3 PEKE A197806B F 19 10/7/2009 HUDSON_NORTH A4 PEKE A197812B F 18 10/7/2009 HUDSON_SOUTH A4 PEKE A197850B M 17 10/7/2009 HUDSON_SOUTH A5 PEKE A197813B M 19 10/7/2009 HUDSON_NORTH B1 PEKE A197802B F 16 10/7/2009 HUDSON_NORTH B3 PEKE A197807B F 19 10/7/2009 HUDSON_SOUTH B5 PEKE A197757B M 17 10/7/2009 HUDSON_NORTH C1 PEKE A197803B F 23 10/7/2009 HUDSON_SOUTH C1 PEKE A197759B F 18 10/7/2009 HUDSON_NORTH C3 PEKE A197808B F 19 10/7/2009 HUDSON_NORTH C5 PEKE A197811B M 25 10/7/2009 HUDSON_SOUTH C5 PEKE A197758B F 18 10/7/2009 HUDSON_NORTH D1 PEKE A197804B F 17 10/7/2009 HUDSON_NORTH D2 PEKE A197805B M 20 10/7/2009 HUDSON_SOUTH D2 PEKE A197844B M 19 10/7/2009 HUDSON_NORTH D4 PEKE A197810B F 17 10/7/2009 HUDSON_NORTH D5 PEKE A197809B M 18 10/7/2009 HUDSON_SOUTH E1 PEKE A197848B F 20 10/7/2009 HUDSON_SOUTH E4 PEKE A197843B M 19

Baseline wildlife monitoring at I-90 Snoqualmie Pass East Appendices
Western Transportation Institute Page 243
10/7/2009 HUDSON_NORTH E1 NOBT 10/8/2009 HUDSON_NORTH B4 SPRG 10/8/2009 HUDSON_SOUTH B5 SPRG BEAR DAMAGE 10/8/2009 HUDSON_SOUTH C5 SPRG 10/8/2009 HUDSON_SOUTH E5 SPRG 10/8/2009 HUDSON_SOUTH E2 PEMA A197815B M 16 UNCERTAIN WITH
SPECIES ID, SHORT TAIL
10/8/2009 HUDSON_NORTH A1 PEKE A197760B F 18 10/8/2009 HUDSON_SOUTH A2 PEKE X M 18 10/8/2009 HUDSON_NORTH A3 PEKE X M 19 10/8/2009 HUDSON_NORTH A4 PEKE X F 21 10/8/2009 HUDSON_NORTH A5 PEKE X F 18 10/8/2009 HUDSON_SOUTH A5 PEKE X M 19 10/8/2009 HUDSON_NORTH B1 PEKE A197761B F 22 10/8/2009 HUDSON_NORTH B2 PEKE A197849B F 18 10/8/2009 HUDSON_SOUTH B2 PEKE X F 21 10/8/2009 HUDSON_NORTH C1 PEKE X M 21 10/8/2009 HUDSON_NORTH C3 PEKE A197711B F 16 10/8/2009 HUDSON_SOUTH C4 PEKE X F 19 10/8/2009 HUDSON_NORTH D1 PEKE A197846B F 17 10/8/2009 HUDSON_NORTH D2 PEKE A197847B F 16 10/8/2009 HUDSON_NORTH D3 PEKE A197712B M 21 10/8/2009 HUDSON_SOUTH D3 PEKE A197816B F 19 10/8/2009 HUDSON_NORTH D4 PEKE A197814B M 18 10/8/2009 HUDSON_NORTH D5 PEKE X M 20 10/8/2009 HUDSON_SOUTH D5 PEKE A197817B M 20 10/8/2009 HUDSON_NORTH E1 PEKE X M 16 10/8/2009 HUDSON_NORTH E2 PEKE A197845B M 17 10/8/2009 HUDSON_NORTH E3 PEKE A197710B M 19 10/8/2009 HUDSON_NORTH E4 PEKE A197709B M 16
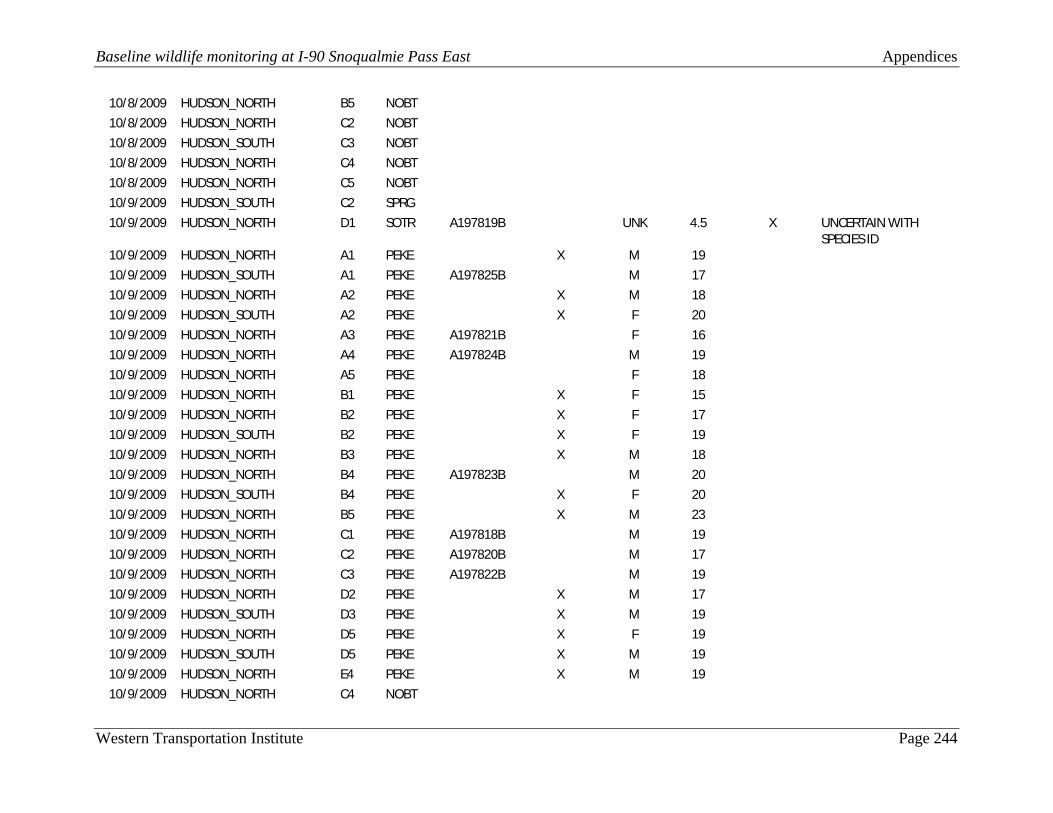
Baseline wildlife monitoring at I-90 Snoqualmie Pass East Appendices
Western Transportation Institute Page 244
10/8/2009 HUDSON_NORTH B5 NOBT 10/8/2009 HUDSON_NORTH C2 NOBT 10/8/2009 HUDSON_SOUTH C3 NOBT 10/8/2009 HUDSON_NORTH C4 NOBT 10/8/2009 HUDSON_NORTH C5 NOBT 10/9/2009 HUDSON_SOUTH C2 SPRG 10/9/2009 HUDSON_NORTH D1 SOTR A197819B UNK 4.5 X UNCERTAIN WITH
SPECIES ID 10/9/2009 HUDSON_NORTH A1 PEKE X M 19 10/9/2009 HUDSON_SOUTH A1 PEKE A197825B M 17 10/9/2009 HUDSON_NORTH A2 PEKE X M 18 10/9/2009 HUDSON_SOUTH A2 PEKE X F 20 10/9/2009 HUDSON_NORTH A3 PEKE A197821B F 16 10/9/2009 HUDSON_NORTH A4 PEKE A197824B M 19 10/9/2009 HUDSON_NORTH A5 PEKE F 18 10/9/2009 HUDSON_NORTH B1 PEKE X F 15 10/9/2009 HUDSON_NORTH B2 PEKE X F 17 10/9/2009 HUDSON_SOUTH B2 PEKE X F 19 10/9/2009 HUDSON_NORTH B3 PEKE X M 18 10/9/2009 HUDSON_NORTH B4 PEKE A197823B M 20 10/9/2009 HUDSON_SOUTH B4 PEKE X F 20 10/9/2009 HUDSON_NORTH B5 PEKE X M 23 10/9/2009 HUDSON_NORTH C1 PEKE A197818B M 19 10/9/2009 HUDSON_NORTH C2 PEKE A197820B M 17 10/9/2009 HUDSON_NORTH C3 PEKE A197822B M 19 10/9/2009 HUDSON_NORTH D2 PEKE X M 17 10/9/2009 HUDSON_SOUTH D3 PEKE X M 19 10/9/2009 HUDSON_NORTH D5 PEKE X F 19 10/9/2009 HUDSON_SOUTH D5 PEKE X M 19 10/9/2009 HUDSON_NORTH E4 PEKE X M 19 10/9/2009 HUDSON_NORTH C4 NOBT

Baseline wildlife monitoring at I-90 Snoqualmie Pass East Appendices
Western Transportation Institute Page 245
10/9/2009 HUDSON_NORTH C5 NOBT 10/9/2009 HUDSON_NORTH E1 NOBT 10/9/2009 HUDSON_NORTH E2 NOBT 10/9/2009 HUDSON_NORTH E3 NOBT 10/9/2009 HUDSON_SOUTH B5 GONE REPLACED 10/9/2009 HUDSON_SOUTH E5 GONE REPLACE
10/10/2009 HUDSON_NORTH D1 STCK 10/10/2009 HUDSON_SOUTH B1 SPRG 10/10/2009 HUDSON_SOUTH C4 SPRG 10/10/2009 HUDSON_SOUTH C5 SPRG 10/10/2009 HUDSON_NORTH A5 PEMA A197833B M 13 10/10/2009 HUDSON_NORTH C5 PEMA A197831B F 15 10/10/2009 HUDSON_NORTH D4 PEMA A197830B M 15 SPECIES UNCERTAIN,
SHORT TAIL 10/10/2009 HUDSON_NORTH A1 PEKE X M 19 10/10/2009 HUDSON_SOUTH A1 PEKE X M 19 10/10/2009 HUDSON_NORTH A2 PEKE X M 17 10/10/2009 HUDSON_NORTH A3 PEKE X M 18 10/10/2009 HUDSON_SOUTH A3 PEKE X M 20 10/10/2009 HUDSON_NORTH A4 PEKE X F 17 10/10/2009 HUDSON_NORTH B1 PEKE A197826B M 17 10/10/2009 HUDSON_SOUTH B2 PEKE X F 18 10/10/2009 HUDSON_NORTH B4 PEKE X F 20 10/10/2009 HUDSON_SOUTH B4 PEKE X F 17 10/10/2009 HUDSON_NORTH B5 PEKE A197832B F 18 10/10/2009 HUDSON_SOUTH B5 PEKE X F 18 10/10/2009 HUDSON_NORTH C1 PEKE A197827B M 18 10/10/2009 HUDSON_SOUTH C3 PEKE X F 22 10/10/2009 HUDSON_NORTH D2 PEKE A197828B M 18 10/10/2009 HUDSON_NORTH D3 PEKE X M 17 10/10/2009 HUDSON_SOUTH D3 PEKE X M 19

Baseline wildlife monitoring at I-90 Snoqualmie Pass East Appendices
Western Transportation Institute Page 246
10/10/2009 HUDSON_NORTH D5 PEKE X F 17 10/10/2009 HUDSON_SOUTH D5 PEKE A197835B M 20 10/10/2009 HUDSON_SOUTH E1 PEKE A197834B F 23 10/10/2009 HUDSON_NORTH E5 PEKE A197829B F 16 10/10/2009 HUDSON_SOUTH E5 PEKE A197836B F 19 10/10/2009 HUDSON_NORTH B2 NOBT 10/10/2009 HUDSON_NORTH B3 NOBT 10/10/2009 HUDSON_NORTH C2 NOBT 10/10/2009 HUDSON_NORTH C3 NOBT 10/10/2009 HUDSON_NORTH C4 NOBT 10/10/2009 HUDSON_SOUTH D4 NOBT 10/10/2009 HUDSON_NORTH E1 NOBT 10/10/2009 HUDSON_NORTH E2 NOBT 10/10/2009 HUDSON_NORTH E3 NOBT 10/14/2009 EASTON_HILL_SOUTH A4 SPRG 10/14/2009 EASTON_HILL_SOUTH B1 SPRG 10/14/2009 EASTON_HILL_SOUTH D2 SPRG 10/14/2009 EASTON_HILL_NORTH E3 SPRG 10/14/2009 EASTON_HILL_SOUTH A1 PEKE A197838B F 22 10/14/2009 EASTON_HILL_NORTH A3 PEKE A197839B F 16 10/14/2009 EASTON_HILL_NORTH B3 PEKE A197841B F 20 10/14/2009 EASTON_HILL_NORTH B4 PEKE A197842B F 17 10/14/2009 EASTON_HILL_NORTH C2 PEKE A197766B F 18 10/14/2009 EASTON_HILL_NORTH C3 PEKE A197762B F 18 10/14/2009 EASTON_HILL_NORTH C4 PEKE A197788B M 17 10/14/2009 EASTON_HILL_NORTH C5 PEKE A197840B M 17 10/14/2009 EASTON_HILL_SOUTH D1 PEKE A197837B F 17 10/14/2009 EASTON_HILL_NORTH D3 PEKE A197763B M 16 10/14/2009 EASTON_HILL_NORTH D5 PEKE A197790B M 18 10/14/2009 EASTON_HILL_NORTH E1 PEKE A197765B F 19

Baseline wildlife monitoring at I-90 Snoqualmie Pass East Appendices
Western Transportation Institute Page 247
10/14/2009 EASTON_HILL_NORTH E2 PEKE A197764B F 17 10/14/2009 EASTON_HILL_NORTH E5 PEKE A197789B M 19 10/14/2009 EASTON_HILL_NORTH B5 NOBT 10/14/2009 EASTON_HILL_NORTH C1 NOBT 10/15/2009 EASTON_HILL_NORTH A1 PEKE A197768B M 20 10/15/2009 EASTON_HILL_NORTH B4 PEKE A197786B M 18 10/15/2009 EASTON_HILL_NORTH C1 PEKE A197785B F 17 10/15/2009 EASTON_HILL_NORTH C2 PEKE X M 17 X 10/15/2009 EASTON_HILL_SOUTH C4 PEKE A197767B F 18 10/15/2009 EASTON_HILL_NORTH C4 PEKE A197769B F 17 10/15/2009 EASTON_HILL_NORTH C5 PEKE X M 18 10/15/2009 EASTON_HILL_SOUTH E4 PEKE A197787B M 20 10/15/2009 EASTON_HILL_SOUTH A1 NOBT 10/15/2009 EASTON_HILL_SOUTH B1 NOBT 10/15/2009 EASTON_HILL_NORTH B3 NOBT 10/15/2009 EASTON_HILL_NORTH B5 NOBT 10/15/2009 EASTON_HILL_NORTH D1 NOBT 10/15/2009 EASTON_HILL_NORTH D4 NOBT 10/15/2009 EASTON_HILL_NORTH E1 NOBT 10/15/2009 EASTON_HILL_NORTH E2 NOBT 10/15/2009 EASTON_HILL_NORTH A4 ESCP PEKE 10/16/2009 EASTON_HILL_NORTH A4 SPRG BEAR DAMAGE 10/16/2009 EASTON_HILL_SOUTH C5 SPRG 10/16/2009 EASTON_HILL_NORTH B4 PEMA X F 18 SPECIES ID
UNCERTAIN, SHORT TAIL
10/16/2009 EASTON_HILL_NORTH A2 PEKE X F 21 10/16/2009 EASTON_HILL_SOUTH B1 PEKE X M 19 10/16/2009 EASTON_HILL_NORTH B2 PEKE A197784B F 19 10/16/2009 EASTON_HILL_SOUTH C3 PEKE X F 20 10/16/2009 EASTON_HILL_SOUTH D2 PEKE X F 22

Baseline wildlife monitoring at I-90 Snoqualmie Pass East Appendices
Western Transportation Institute Page 248
10/16/2009 EASTON_HILL_SOUTH D3 PEKE A197770B M 19 10/16/2009 EASTON_HILL_NORTH E2 PEKE X M 18 10/16/2009 EASTON_HILL_SOUTH A1 NOBT 10/16/2009 EASTON_HILL_SOUTH A3 NOBT 10/16/2009 EASTON_HILL_NORTH A3 NOBT 10/16/2009 EASTON_HILL_NORTH B1 NOBT 10/16/2009 EASTON_HILL_NORTH B3 NOBT 10/16/2009 EASTON_HILL_NORTH B5 NOBT 10/16/2009 EASTON_HILL_NORTH C4 NOBT 10/16/2009 EASTON_HILL_NORTH C5 NOBT 10/16/2009 EASTON_HILL_NORTH D1 NOBT 10/16/2009 EASTON_HILL_NORTH D4 NOBT 10/16/2009 EASTON_HILL_SOUTH D5 NOBT 10/16/2009 EASTON_HILL_NORTH E1 NOBT 10/16/2009 EASTON_HILL_NORTH E4 NOBT 10/16/2009 EASTON_HILL_NORTH E5 NOBT 10/16/2009 EASTON_HILL_SOUTH E4 CLGA A197783B M 16 10/17/2009 EASTON_HILL_SOUTH E5 PEMA A197773B F 15 UNCERTAIN WITH
SPECIES ID, SHORT TAIL
10/17/2009 EASTON_HILL_SOUTH A1 PEKE X F 21 10/17/2009 EASTON_HILL_NORTH A3 PEKE A197771B M 18 10/17/2009 EASTON_HILL_NORTH A5 PEKE X M 17 10/17/2009 EASTON_HILL_NORTH B1 PEKE A197782B F 17 10/17/2009 EASTON_HILL_SOUTH B3 PEKE X F 16 10/17/2009 EASTON_HILL_SOUTH C5 PEKE A197774B M 19 10/17/2009 EASTON_HILL_NORTH C5 PEKE X M 17 10/17/2009 EASTON_HILL_NORTH D1 PEKE A197772B M 17 10/17/2009 EASTON_HILL_SOUTH D2 PEKE X M 17 10/17/2009 EASTON_HILL_NORTH E2 PEKE X F 17 10/17/2009 EASTON_HILL_NORTH A1 NOBT

Baseline wildlife monitoring at I-90 Snoqualmie Pass East Appendices
Western Transportation Institute Page 249
10/17/2009 EASTON_HILL_SOUTH A3 NOBT 10/17/2009 EASTON_HILL_NORTH A4 NOBT 10/17/2009 EASTON_HILL_NORTH B4 NOBT 10/17/2009 EASTON_HILL_NORTH B5 NOBT 10/17/2009 EASTON_HILL_NORTH C1 NOBT 10/17/2009 EASTON_HILL_SOUTH C2 NOBT 10/17/2009 EASTON_HILL_NORTH D2 NOBT 10/17/2009 EASTON_HILL_SOUTH D4 NOBT 10/17/2009 EASTON_HILL_NORTH D4 NOBT 10/17/2009 EASTON_HILL_NORTH E1 NOBT 10/17/2009 EASTON_HILL_NORTH E4 NOBT 10/17/2009 EASTON_HILL_NORTH E5 NOBT

Baseline wildlife monitoring at I-
Western Transportation Institute
Appendix 4.6. Report from track survey of Lake Keechelus. DATE: 6 NovemberTO: WSDOTTHRU: FROM: Western Transportation Institute SUBJECT: Keechelus Lake shoreline wildlife fencing recommendations memo. Attachment: Exhibits 1cc: Introduction This memo addresses questions regarding wildlife fencing on the proposed eastbound embankment along Keechelus Lake. Specifically, we sought twhether fencing this section of Iwildlife vehicle collisions (WVCs), wildlife tracks, and conditions that will be present after the construction of wildlife crossing structures and wildlife fencing on the eastern side of Ishould deter wildlife (mainly ungulates), and if not, what options exist for wildlife fencing given the proposed conditions. Review of Current and Proposed Condition and Existing Da51.2-61.0 We evaluated existing WVC data along this section of Itrack surveys along Lake Keechelus and on the lakebed during drawdown. Here we summarize these data in relation to lake levels, lake drawdown periods, alikely post-construction condition.
Current ConditionLake Keechelus is typically at or near full pool (elevation 2,517 feet) during MayThese drawdown periods result in exposure of the lakebethe northern part of the lake shoreline adjacent to the dam at the south end (Exhibit 1). In theselocations, during the drawdown period, it is possible for terrestrial wildlife species to approacrocky embankment drops off the west side of the eastbound highway shoulder (Exhibit 2a, b). Atinto Lake Keechelus along most of the section, resulting in almoshoreline availability for terrestrial wildlife. During drawdown this embankment still presents an obstacle to animals attempting to access the roadway from the lakebed, although access is possible for animals approaching directly off of the lakebed.along this section from January through March, with snow depth averaging between 40 and 65 inches (NWAC
Baseline wildlife monitoring at I-90 Snoqualmie Pass East
. Report from track survey of Lake Keechelus.
November 2009 WSDOT
Western Transportation Institute
Keechelus Lake shoreline wildlife fencing recommendations memo.
Exhibits 1-11
This memo addresses questions regarding wildlife fencing on the proposed eastbound embankment along Keechelus Lake. Specifically, we sought twhether fencing this section of I-90 is necessary, given observed patterns of wildlife vehicle collisions (WVCs), wildlife tracks, and conditions that will be present after the construction of wildlife crossing structures and wildlife fencing
the eastern side of I-90. We also discuss whether the proposed embankment should deter wildlife (mainly ungulates), and if not, what options exist for wildlife fencing given the proposed conditions.
Review of Current and Proposed Condition and Existing Data
We evaluated existing WVC data along this section of I-90, as well as conducting track surveys along Lake Keechelus and on the lakebed during drawdown. Here we summarize these data in relation to lake levels, lake drawdown periods, a
construction condition.
Current Condition Lake Keechelus is typically at or near full pool (elevation 2,517 feet) during May-July, and drawn-down considerably during all other months. These drawdown periods result in exposure of the lakebed over much of the northern part of the lake (Exhibit 1), as well as exposing portions of shoreline adjacent to the dam at the south end (Exhibit 1). In theselocations, during the drawdown period, it is possible for terrestrial wildlife species to approach the highway from west to east. Currently, a steep, rocky embankment drops off the west side of the eastbound highway shoulder (Exhibit 2a, b). At full pool this embankment descends directly into Lake Keechelus along most of the section, resulting in almoshoreline availability for terrestrial wildlife. During drawdown this embankment still presents an obstacle to animals attempting to access the roadway from the lakebed, although access is possible for animals approaching directly off of the lakebed. Snow levels are generally high along this section from January through March, with snow depth averaging between 40 and 65 inches (NWAC
Appendices
Page 250
Keechelus Lake shoreline wildlife fencing recommendations memo.
This memo addresses questions regarding wildlife fencing on the proposed eastbound embankment along Keechelus Lake. Specifically, we sought to address
90 is necessary, given observed patterns of wildlife vehicle collisions (WVCs), wildlife tracks, and conditions that will be present after the construction of wildlife crossing structures and wildlife fencing
90. We also discuss whether the proposed embankment should deter wildlife (mainly ungulates), and if not, what options exist for wildlife
ta—Mileposts
90, as well as conducting track surveys along Lake Keechelus and on the lakebed during drawdown. Here we summarize these data in relation to lake levels, lake drawdown periods, and
Lake Keechelus is typically at or near full pool (elevation 2,517 feet) down considerably during all other months.
d over much of (Exhibit 1), as well as exposing portions of
shoreline adjacent to the dam at the south end (Exhibit 1). In these locations, during the drawdown period, it is possible for terrestrial wildlife
h the highway from west to east. Currently, a steep, rocky embankment drops off the west side of the eastbound highway
full pool this embankment descends directly into Lake Keechelus along most of the section, resulting in almost no shoreline availability for terrestrial wildlife. During drawdown this embankment still presents an obstacle to animals attempting to access the roadway from the lakebed, although access is possible for animals
Snow levels are generally high along this section from January through March, with snow depth

Baseline wildlife monitoring at I-90 Snoqualmie Pass East Appendices
Western Transportation Institute Page 251
http://www.nwac.us/media/uploads/pdfs/Annual%20Northwest%20Snowdepths%20by%20Location.pdf ). During winter, most large species such as deer (Odocoileus spp.) and elk (Cervus elaphus) are at lower elevations and are not encountered in this section. Proposed Post-construction Condition Lake drawdown will be similar to the current condition in timing and extent after construction, as will expected snow depths. A steep, 1.5:1 or 2:1 engineered Select Rock Embankment (SRE) composed of 18” or smaller riprap will extend to the lakebed along the highway section, but no wildlife fencing is currently proposed along this side of the highway. A key difference will be that wildlife fencing will be installed throughout the entire section along the east side of I-90, east of the westbound lanes, and large wildlife underpasses (varying in size) will be installed at Gold Creek, Rocky Run Creek, Wolfe Creek, Resort Creek, and Townsend Creek. These underpasses will allow wildlife to cross under the highway and exit on the opposite side, heading either east into forest, or west onto the lakeshore or lakebed. WVC Data WVC data have been systematically collected via electronic/GPS data entry by WSDOT maintenance crews with oversight by Western Transportation Institute (WTI) since May 2007. To date, 18 WVCs have been recorded between mileposts 51.2 and 61.5 (Exhibit 1, Exhibit 3). Sixteen were mule deer (Odocoileus hemionus), one was a beaver (Castor canadensis), and one was a Canada goose (Branta Canadensis; not included on map or in table). Most WVCs involving mule deer were located near the WSDOT Maintenance Building at the northernmost end of the lake (5), at Rocky Run Creek (3), and just south of the dam at the southernmost end of the lake (3). Two others were located near the snowshed, and 3 more in the section north of the dam (Exhibit 1, Exhibit 3). Twelve of the 16 deer WVCs occurred during periods when the lake was at full pool (Exhibit 1, Exhibit 3). These animals were, therefore, almost certainly traveling from east to west (i.e., from the upland forest towards the lake), and would have been stopped by the wildlife fencing on the east side of the highway. Of the 4 WVCs that occurred when the lake was drawn down, 2 were just north of the lake at the WSDOT maintenance facility. This is a location where a terrestrial wildlife underpass will be installed. The remaining 2 WVCs occurred at the same time and location, and were in a location that could have been accessed from the lakebed, but which would have been unlikely given the pattern of lake drawdown and access points to this location. These deer, therefore, likely accessed the roadway from the east.
Baseline wildlife monitoring at I-90 Snoqualmie Pass East Appendices
Western Transportation Institute Page 252
Track Data Two WTI staff surveyed for wildlife tracks along the west side of the eastbound lanes of I-90 between mileposts 55.1 and 56.6, 59.2 and 60.0, and 60.4 and 60.8 during 3 visits (10/5/09, 10/15/09, and 10/28/09) (Exhibit 4a, b). The purpose was to detect any tracks or animal use areas that approached the roadway from the lakeside. The surveys also included parts of the lakebed, and the western lakeshore (Exhibit 4a, b). These are areas available to terrestrial wildlife from the west during periods of lake drawdown.
A total of approximately 6 miles of surveys were conducted. While some wildlife tracks were detected (Exhibit 4a, b), all stayed along or within the lakebed except for a single deer track that crossed the road. This animal, however, crossed from east to west (based on the direction of the track trail), and would have likely been stopped by the wildlife fencing on the east side of the roadway.
Remote Camera Data Two remote digital cameras have been deployed near mile 55 under the westbound Gold Creek bridges (one on each shoreline) since October 2008. To date, 6 mule deer crossings have been recorded under the bridge on the north shore. Only one of these crossings was a directional west-to-east movement, and this was during drawdown. Along the south shore, a single mule deer was detected and crossed heading east during full pool. Four coyote detections also occurred, but only one individual was heading east (during drawdown). Three beavers were also detected crossing through this structure, with 2 heading east—1 during drawdown. These data suggest that some animals are crossing the highway in an easterly direction during both full pool and drawdown. The Gold Creek bridge is, however, the most readily accessible from the west of all the structures between mileposts 51.2 and 61.5, given it’s proximity to terrestrial habitats to the north, and major exposure of the lakebed during drawdown in this location. Further, after construction of the Gold Creek crossing structure and associated terrestrial crossing structure just to the north, this location will be highly permeable to both aquatic and terrestrial wildlife, and the outlets to the west and north will make it easy for individual animals to move away from the highway after crossing. Given this, we would not expect to see excessive attempts by animals to reenter the highway from the west after exiting the structure on the west side.
Literature Review of Fencing and Fencing Alternatives
Function Highway fencing is designed to keep wildlife away from roadways, to lead animals to wildlife crossings, and to permit safe travel under or above the highway (Clevenger and Huijser 2009). Fences should be impermeable to
Baseline wildlife monitoring at I-90 Snoqualmie Pass East Appendices
Western Transportation Institute Page 253
wildlife movement in order to keep traffic-related mortality to a minimum, and to ensure that wildlife crossings are used. Defective or permeable fences result in reduced use of the wildlife crossings and increased risk of wildlife–vehicle collisions. The latter is a cause for concern for transportation agencies after making substantial investments in infrastructure to reduce WVCs. Little research or best management practices exist regarding effective fence designs or other innovative solutions to keep wildlife away from roads. We were unable to find any literature regarding technical design or performance of fences of any type in areas of high snowfall or steep terrain. Despite a general paucity of literature on highway fence design for wildlife exclusion, several studies have reported on their effectiveness in reducing wildlife-vehicle collisions and associated property damage (Reed et al. 1982, Foster and Humprey 1995, Clevenger et al. 2001, Huijser et al. 2009). Standard Fencing Description Fencing design used to mitigate road impacts depends on several variables associated with the specific location, primarily adjacent land use, traffic volumes and terrain. Both sides of the road are typically fenced. Fence ends must line up across the road (symmetric) and not be offset or staggered. Partial fencing at the opening of wildlife crossing structures is termed “wing wall” fencing. This type of fencing is intended to funnel animals to crossing structures. It is generally used in areas where land use does not permit continuous fencing. The length of wing wall fencing from crossing structures varies from 50 m (165 ft) to nearly 200 m (655 ft) and is dependent on the individual site, focal species and local terrain. Fencing Challenges Fencing can be fraught with problems related to maintenance, integrity, and, ultimately, performance under different site conditions. Automobile collisions, rockslides, and tree fall are just some of the issues that challenge successful fencing efforts. Naturally occurring problems associated with high snow loads, steep terrain and interceptions with watercourses (e.g., creeks, rivers) have yet to be properly resolved or addressed with best management practices. Snow-load problems such as failing fence posts and fencing material may be an issue in the upper section of the I-90 SPE project area. Fence type testing is currently taking place to determine the most suitable design for these extreme site conditions (Urlich et al. 2009). Further, guidelines currently being used in high snow load areas in Norway - with regard to fence mesh size, poles, distance between poles and fence height - are found in Appendix A of Clevenger (2005; Fencing specifications for high snowfall areas).

Baseline wildlife monitoring at I-90 Snoqualmie Pass East Appendices
Western Transportation Institute Page 254
Fence Height Determination Standard height for wildlife exclusion fencing is 2.4 m (8 ft) high. The height appears to be effective for most wildlife species and all ungulates in North America (e.g., elk, deer, bighorn sheep [Ovis canadensis], mountain goats [Oreamnos americanus], pronghorn [Antilocapra americana]). Fencing Alternatives There are some alternatives to standard fencing that can successfully deter wildlife from highways and direct them to crossing structures. Raised mechanically stabilized earth (MSE) retaining walls may be an option in places where the walls can effectively function as fences (see Exhibit 5). MSE walls are typically used in areas where the highway right-of-way is limited, or to protect areas of special conservation concern. Fences invariably intersect other linear features that allow for movement of people or transport materials. This can include access roads, but also people (e.g., recreations trails) and water (e.g., creeks, streams). These breaks or interceptions in the fence require special modifications to limit the number of wildlife intrusions into the right-of-way. Boulder walls or riprap barriers are a substitute for wildlife fencing in some areas where there rock material is abundant. We are aware of one location where such substrate was used as a substitute for wildlife fencing (US 95 in northern Idaho; Exhibits 6, 7). In this case, the 1.8-2 m (7-8 ft) high rock wall composed of 30-45 cm (12-18 in) boulders was not entirely effective. Deer and elk were able to cross the highway by “picking their way through the boulders, finding footholds on rock surfaces” and walking over the wall (Wayne Wakkinen, Idaho Department of Fish and Game, personal communication). Even on some steep-sloped highway sections, elk were still able to climb through the boulder walls and cross the highway. Given the failure of the boulder wall to prevent elk and deer movements, Idaho Department of Transportation subsequently constructed wildlife fencing behind the wall and installed escape ramps (see Exhibit 8) at regular intervals for the elk and deer that occasionally accessed the right-of-way through the fence ends (Wayne Wakkinen, Idaho Department of Fish and Game, personal communication). On some highways large boulders have been placed in the right-of-way, outside of the clear zone, as an alternative to wildlife fencing. Large boulders are thought to make it difficult for animals, especially ungulates, to walk across an area. Boulders have been used for this purpose along State Route 260 in Arizona (Terry Brennan, U.S. Forest Service, personal communication; Norris Dodd, Arizona Game and Fish Department, personal communication)(Exhibit 9). The boulder barrier was not extended through areas with steep slopes, as it was thought that wildlife would not move through steep sections. Observations after construction,

Baseline wildlife monitoring at I-90 Snoqualmie Pass East Appendices
Western Transportation Institute Page 255
however, suggest that animals continue to travel through these areas. The barrier is thought to be effective except for some access through the gaps occurring in steep areas. (Norris Dodd, Arizona Game and Fish Department, personal communication). Boulder barriers are typically constructed of subangular, quarried rock, ranging in size from 20-60 cm (10-25 in). To be most effective, however, most rocks should be larger than 30 cm (12 in) and project about 20-30 cm (10-12 in) above ground surface (see Exhibit 10). Clevenger et al. (2007) found a boulder barrier to be effective at keeping most ungulates from gaining access inside the fence line. Winter snow and ice, however, can render boulder barriers ineffective, as the surface becomes level and compacted by snow and ice. Natural terrain, in some instances, may be steep enough that wildlife movement is minimal if not impossible. Cliffs and steep cut-slopes adjacent to roads may serve as an alternative to fencing. Particularly if the habitat near the road is not suitable to most wildlife.
Concerns and Recommendations
Concerns Based on the existing data, the movement of terrestrial wildlife from west to east (i.e., across the lakebed at the northern part of Lake Keechelus, or from the dam and along the shoreline at the southern end of Lake Keechelus) within the section of interest appears to be minimal. Uncertainty still exists, however, regarding the behavior of animals that cross the highway from east to west via the crossing structures that will be installed at Gold Creek, Rocky Run Creek, Wolfe Creek, Resort Creek, and Townsend Creek. When these animals exit the structures on the lakeshore there is some probability that they will attempt to access the westbound lanes of the roadway. This probability will likely be higher at times when the lake is at full pool, and movement away from the structure directly to the west is not possible. This risk will be lower near Gold Creek and Townsend Creek, because animals will be able to use lakeshore routes to the north and south, respectively, to move away from the crossing structure. This risk will likely be higher at Rocky Run Creek, where the proposed highway realignment calls for a graded, forested slope west of the highway and above full pool that may attract animals that exit the western side of the structure. The proposed SRE should deter some highway access, but may not be completely successful at deterring all species. During winter, fencing on either side of the highway may be rendered ineffective due to snow accumulation. During these periods, however, very large species (e.g., deer and elk) are unlikely to be present in this section.
Baseline wildlife monitoring at I-90 Snoqualmie Pass East Appendices
Western Transportation Institute Page 256
Recommendations Even the most rigorous mitigation measures will not eliminate wildlife-vehicle collisions entirely. On the most well-designed and effective mitigation projects, wildlife-vehicle collisions are reduced substantially, but some collisions with wildlife still occur. These collisions generally result when animals climb fences, move through gaps or open gates, or travel over cattle guards. Here we address whether fencing is necessary along the lakeside of this section of highway. We also make some suggestions that should help to minimize WVCs. Wildlife exclusion fencing. We recommend that wildlife exclusion fencing along the west side of I-90 is not necessary between Mileposts 51.2 - 61.0. The WVC and tracking data presented earlier suggest that there are few movements by large wildlife species in a west-to-east direction across I-90. Most movement is observed to be in the east-to-west direction. The majority of east-to-west movement took place while Lake Keechelus was at full pool. Animals traveling east-to-west post-construction will intercept the wildlife fence on the east side of I-90 and be funneled to the five crossing structures noted above. Animals passing through the crossing structures and encountering Lake Keechelus at full pool will either: (a) reverse their direction of travel and return through the crossing structure or (b) travel along the edge of the lake until running out of space, and will either move upslope and attempt to cross I-90 or return to the crossing structure. The proposed SRE barrier may prevent some upslope movement in the event of (b). We also recognize that during high snow periods no fencing option will likely deter species active during the winter months. SRE-type barriers are not completely effective at deterring wildlife access to roads. The proposed 1.5:1 or 2:1 SRE barrier will be unlikely to completely prevent movement of wildlife intent on traveling from west-to-east. For this particular section of I-90, however, suboptimal habitat adjacent to the highway and relatively few crossing attempts across the proposed SRE barrier are expected. After construction of crossing structures, it is expected that some animals will attempt to cross west-to-east and will hopefully be deterred by the SRE barrier. For those animals that reach the right-of-way, escape ramps will need to be installed adjacent to the proposed crossing structures in addition to opportune locations between structures as a safety measure for motorists and wildlife (see Exhibit 8; Bissonette and Hammer 2000; Clevenger and Huijser 2009). Fencing at wildlife crossing structures. There is some concern that wildlife will move through the crossing structures, encounter the lakebed, and then attempt to access I-90 across the SRE (i.e., option [b] described above). To reduce the likelihood of this occurring, retaining walls should be constructed that flare out from the crossing structures. Most wildlife underpass structures are built with some form of retaining wall (see

Baseline wildlife monitoring at I-90 Snoqualmie Pass East Appendices
Western Transportation Institute Page 257
Exhibit 11). In this instance, we recommend that the underpass retaining walls be extended at least 100 m (165 ft) on both sides to minimize the chances of animals moving across I-90 via the SRE barrier once out of the crossing structures. As mentioned above, the risk of animals exiting the west end of a crossing structure and attempting to move back towards the highway may be highest at the Rocky Run Creek structure because of the graded and forested slope that will be installed along the western side of the highway immediately south of the structure exit. At this location we strongly recommend that fencing be installed from the structure and to the south that would deter entries into the highway zone. This fencing should be installed as close to the high water zone (i.e., away from the highway) as possible. This will both help deter animals from being attracted to the forested area, and will provide a refuge—and possibly a location for a jumpout—for animals that do end up on the highway. An untested alternative to the wing wall extension described above would be to ‘armor’ the SRE barrier with chain-link fence material. The small mesh size of chain-link fencing attached to a rocky and irregular surface such as the SRE may be an effective combination that deters animal movement across. We are unaware of this type of design being used with the purpose of deterring animal movement. Chain-link or other heavy woven-wire and woven-cable meshes, however, are routinely used by transportation agencies to retain debris fall on steep hillsides and cut slopes. Chain-link is relatively inexpensive. The aesthetics of this application would not be an issue because it will occur below grade and out of sight of motorists. Post-construction test sections could be compared with control areas (without chain-link application) of similar length, in terms of their association with reported WVCs and live wildlife occurrences. Median barriers. The above recommendations are based on best management practices and professional judgment. They have been carefully prepared taking into consideration available field data, experience, and logic. Inevitably, some animals will be able to access the I-90 right-of-way by one or more means. The placement of median (i.e., Jersey) barriers is typically discouraged because the concrete barriers can block wildlife movement across roads. On this section of I-90, however, we recommend that tall median barriers be installed to keep wildlife to one side of the highway should they access the right-of-way. This would keep wildlife movement across I-90 to a minimum (i.e., only 3 lanes of traffic could be crossed rather than all 6 lanes), and would encourage wildlife to return to the lakeshore and crossing structures via the escape ramps provided for this purpose.

Baseline wildlife monitoring at I-90 Snoqualmie Pass East Appendices
Western Transportation Institute Page 258
Additional monitoring. We suggest that additional track surveys be conducted during winter, full pool, and drawdown to further evaluate whether animals are attempting to access the roadway from the lake side.
Literature Cited Bissonette, J.A. and M. Hammer. 2000. Effectiveness of earthen ramps in reducing big game highway mortality in Utah. UTCFW RU Report Series 2000 (1): 1-29. Clevenger, A.P. and M.P. Huijser. 2009. Handbook for design and evaluation of wildlife crossing structures in North America. US Department of Transportation, Federal Highway Administration, Washington D.C., USA. Clevenger, A.P., B. Chruszcz and K. Gunson. 2001. Highway mitigation fencing reduces wildlife-vehicle collisions. Wildlife Society Bulletin 29:646-653. Clevenger, A.P., Dorsey, B.P., Reimer, J.A., 2007. Highway Mitigation Monitoring Project, Stewart Creek and Dead Man’s Flats. Final report (January 2004-January 2007). Alberta Sustainable Resources Development, Canmore, Alberta. Foster, M.L. and S.R. Humphrey. 1995. Use of highway underpasses by Florida panthers and other wildlife. Wildlife Society Bulletin 23:95-100. Huijser, M.P, J. W. Duffield, A.P. Clevenger, R.J. Ament and P.T. McGowen. 2009. Cost-benefit analyses of mitigation measures aimed at reducing collisions with large ungulates in North America; a decision support tool. Ecology and Society 14(2): 15. [online] URL: http://www.ecologyandsociety.org/vol14/issue2/art15/. Reed, D.F., T.D. Beck, and T.N. Woodard. 1982. Methods of reducing deer-vehicle accidents: benefit-cost analysis. Wildlife Society Bulletin 10:349-354. Urlich, C.M., D.S. Walker, and D. Schlaegel. 2009. I-90 Snoqualmie Pass East Project: Fence inspection report – Spring 2009. Wildlife exclusionary fence performance study. Report to Washington State Department of Transportation.

Baseline wildlife monitoring at I-90 Snoqualmie Pass East Appendices
Western Transportation Institute Page 259
Exhibit 1. Documented wildlife vehicle collisions detected between milepost 51.2 and 60.0 from May 2007 to present. Cross-hatching shows estimated lakebed exposure during drawdown periods.

Baseline wildlife monitoring at I-90 Snoqualmie Pass East Appendices
Western Transportation Institute Page 260
a.
b. Exhibit 2. Current condition embankment along the eastbound lanes of I-90.

Baseline wildlife monitoring at I-90 Snoqualmie Pass East Appendices
Western Transportation Institute Page 261
Approximate
Date Species Milepost Lake Level
5/26/2007 Mule deer 56.9 Full pool
5/28/2007 Mule deer 60.9 Full pool
6/20/2007 Mule deer 56.9 Full pool
5/29/2008 Mule deer 60.9 Full pool
6/19/2008 Mule deer 55.2 Full pool
6/23/2008 Mule deer 60.9 Full pool
6/24/2008 Mule deer 56.9 Full pool
6/27/2008 Mule deer 58.2 Full pool
6/30/2008 Mule deer 55.2 Full pool
6/30/2008 Mule deer 60.5 Full pool
6/30/2008 Beaver 59.7 Full pool
7/3/2008 Mule deer 55.2 Full pool
7/16/2008 Mule deer 58.1 Full pool
7/25/2008 Mule deer 60.1 Drawn down
7/25/2008 Mule deer 60.1 Drawn down
10/27/2008 Mule deer 5.3 Drawn down
12/5/2008 Mule deer 5.2 Drawn down
Exhibit 3. Wildlife vehicle collisions including date, species, location, and lake level.

Baseline wildlife monitoring at I-90 Snoqualmie Pass East Appendices
Western Transportation Institute Page 262
Exhibit 4a. Survey routes and tracks detected during northern Lake Keechelus track surveys on 10/5/09, 10/15/09, and 10/28/09.

Baseline wildlife monitoring at I-90 Snoqualmie Pass East Appendices
Western Transportation Institute Page 263
Exhibit 4b. Survey routes and tracks detected during northern Lake Keechelus track surveys on 10/5/09, 10/15/09, and 10/28/09.

Baseline wildlife monitoring at I-90 Snoqualmie Pass East Appendices
Western Transportation Institute Page 264
Exhibit 5. Mechanically stabilized earth (MSE) retaining wall along the Trans-Canada Highway in Banff National Park, Alberta. (copyright: Tony Clevenger)

Baseline wildlife monitoring at I-90 Snoqualmie Pass East Appendices
Western Transportation Institute Page 265
Exhibit 6. Boulder wall substituted for wildlife exclusion fence on eastside of US 95, near Bonners Ferry, Idaho. (copyright: Tony Clevenger)

Baseline wildlife monitoring at I-90 Snoqualmie Pass East Appendices
Western Transportation Institute Page 266
Exhibit 7. Wing wall at wildlife underpass and connection to large boulders, substituted for wildlife exclusion fence on west-side of US 95, near Bonners Ferry, Idaho. (copyright: Tony Clevenger)

Baseline wildlife monitoring at I-90 Snoqualmie Pass East Appendices
Western Transportation Institute Page 267
a.
b.
Exhibit 8. Escape ramps on US 95 near Bonners Ferry, Idaho. (a) Lateral view of escape ramp fitted into boulder wall on downhill side of highway; (b) elevated view of escape ramp under construction with landing pad in place. (copyright: Tony Clevenger [a] and Wayne Wakkinen [b])

Baseline wildlife monitoring at I-90 Snoqualmie Pass East Appendices
Western Transportation Institute Page 268
Exhibit 9. Large boulders placed in the right of way as a barrier to elk and deer along State Route 260 in Arizona (copyright: Marcel Huijser).
Exhibit 10. Boulder field at termination of wildlife fence on Trans-Canada Highway, near Canmore, Alberta (copyright: Tony Clevenger).
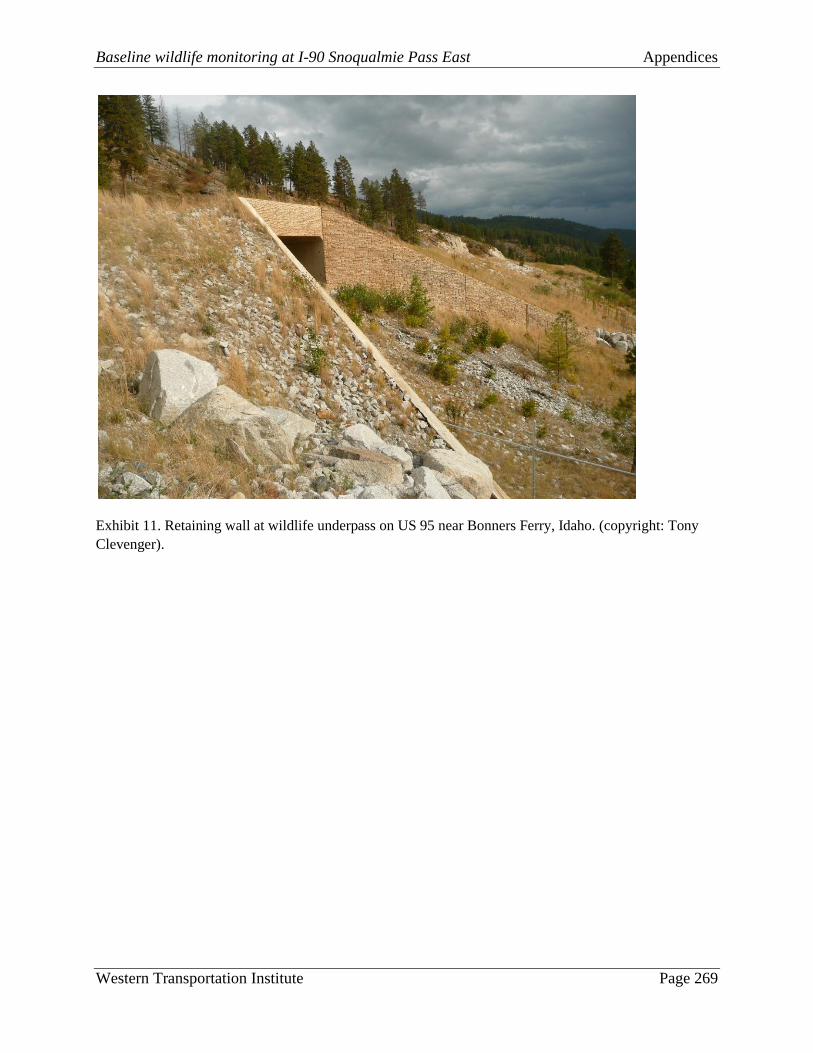
Baseline wildlife monitoring at I-90 Snoqualmie Pass East Appendices
Western Transportation Institute Page 269
Exhibit 11. Retaining wall at wildlife underpass on US 95 near Bonners Ferry, Idaho. (copyright: Tony Clevenger).

Baseline wildlife monitoring at I-90 Snoqualmie Pass East Appendices
Western Transportation Institute Page 270
Appendix 5.1. Northern flying squirrel genotypes including individual and capture grid.
Locus Individual Capture
Grid 194 1367 2035 2565 4185 4361 4732 5265 5430 6777 7299
A101487B BCN 987987 995997 106106 148152 113115 188176 115117 232234 109110 238238 000000
A144818B BCN 993995 989993 106106 148152 113115 176176 115117 232234 109110 237239 112114
A144819B BCN 993109 993997 106110 150152 113115 176176 117117 234236 109110 237239 108112
A197570B BCN 993997 993993 106106 148150 115115 178176 117117 232236 110110 236236 106110
A197573B BCN 993997 995997 106106 152154 113115 176176 117117 234240 110110 234237 112114
A197574B BCN 993997 993993 106106 148150 115115 176176 117117 232236 110110 236236 106110
A197792B BCN 981993 993993 106106 150154 113115 176176 115115 234236 106112 237240 112114
A101511B BCS 981981 989989 106106 147148 113115 176188 117117 236236 106112 236238 114114
A101512B BCS 981987 993993 106106 152152 115115 176186 117117 236240 109114 238240 000000
A159854B BCS 993993 993993 106106 148148 111113 186176 113117 234234 106110 237240 000000
A159855B BCS 981987 993993 106106 152152 115115 176186 117117 236240 109114 238241 112116
A197568B BCS 981981 989989 106106 147148 113115 176188 117117 236236 106112 236238 114114
A197569B BCS 981981 993993 106106 150152 111111 176186 117117 236240 109110 238240 112112
A197571B BCS 981993 989993 106106 152152 113115 176176 117117 236240 112114 238240 110116
A197572B BCS 981987 993993 106106 150152 115115 176186 115117 234236 109110 238242 112114
A197779B BCS 981101 993993 106106 150152 111111 176186 117117 236240 109110 238240 112112
A197791B BCS 987995 993997 106106 150152 113113 178186 111117 234234 109114 237239 112112
A101486B TCN 993105 993993 106106 148150 113115 176190 115117 238240 110110 236241 112112
A101508B TCN 105107 993998 106106 150150 113122 176178 115117 234236 109110 238238 112112
A101513B TCN 987103 993997 106106 148150 113113 176176 117121 236236 112112 235238 114116
A101514B TCN 993999 993995 106106 148152 113115 176176 115115 230232 110112 237239 114116
A144820B TCN 987993 989991 106110 148150 115115 176178 117117 234238 110112 240241 112114
A144821B TCN 993993 993993 106106 148148 113113 176186 113117 234236 110112 236236 106114
A144822B TCN 987993 993993 106106 148150 113113 176186 117117 234240 110112 236238 106116
A144825B TCN 993997 991993 106110 147150 115115 167188 115117 234234 110114 238238 110112
A144827B TCN 993993 989995 106110 148150 113113 176176 117117 232234 110112 240240 106116
A144829B TCN 993105 993998 106106 148152 113115 176186 115117 232236 105112 234240 106110
A191969B TCN 993993 993993 106106 148150 113113 176186 117117 234236 110112 236240 106114
A191973B TCN 981993 989993 106106 148152 113113 176176 115117 232234 109112 238239 112114
A101484B TCS 103109 989993 106106 152154 111115 176178 117117 234236 110110 238239 000000
A101485B TCS 981981 993993 106106 150154 113113 176176 107117 232234 109110 237242 112114

Baseline wildlife monitoring at I-90 Snoqualmie Pass East Appendices
Western Transportation Institute Page 271
A173828B TCS 981993 989997 106108 148150 113113 176190 115117 234236 106110 236238 997112
A173829B TCS 105113 989995 106106 148152 113113 176176 115117 236236 106110 236239 108118
A173830B TCS 981981 993997 108112 148152 113113 176190 117117 234236 106109 238239 114114
A173831B TCS 981993 989993 106112 148150 113113 176190 117117 234234 109110 236238 997114
A173834B TCS 981981 995997 106108 152152 113113 176176 117117 234236 000000 239239 112114
A173835B TCS 997103 993995 106106 148154 113115 176178 117117 236236 106110 238241 112118
A173840B TCS 981993 989995 106106 148152 113113 176176 113117 232236 106110 239239 114114
A173841B TCS 981993 993995 106110 148152 113113 176176 117119 236236 106106 239239 112114
A197567B TCS 981105 989993 106112 148150 113122 176178 113117 234236 109110 236238 112112
A197775B TCS 993107 993995 106106 148148 113113 176178 117117 234234 109110 238238 000000
A144823B EHN 993105 995997 106106 150152 113115 176176 117117 232234 000000 236242 110114
A144824B EHN 109113 102102 110110 152152 000000 176182 113113 222222 106106 233235 000000
A173832B EHN 981993 995997 106106 150152 113113 176188 115117 232234 109110 238238 112114
A173833B EHN 981993 989993 106106 148150 113113 176176 117117 232234 110110 238241 112116
A173839B EHN 981101 102105 106106 150150 113115 176176 115117 236236 110110 238240 112116
A173886B EHN 993105 995997 106106 150152 113113 176176 115117 232234 106109 236242 110114
A173887B EHN 981105 989995 106106 148150 113113 176176 117117 232236 106109 236236 108110
A173894B EHN 981981 993995 106106 150152 113122 176182 115117 232236 106110 238238 112116
A173901B EHN 981981 993995 106106 150152 113122 176182 115117 232236 106110 238238 112116
A166789B EHS 985993 993993 997106 148148 113120 176176 113117 236236 110110 238240 106110
A166790B EHS 993993 993993 106110 148152 120122 176178 113115 234236 106110 236240 106112
A173558B EHS 981993 989993 106110 152152 113120 176178 113117 234236 106110 236239 112112
A173881B EHS 987993 991993 108114 150152 113115 176188 115117 234236 109110 238238 108112
A173884B EHS 995101 993993 106106 147150 113115 176186 117117 232234 110110 236240 112112
A173885B EHS 981981 989989 106110 150152 113113 176182 117117 234236 110116 236241 116116
A173899B EHS 997997 993993 106106 150150 115115 176176 115117 236236 109110 238238 110112
A173902B EHS 981993 993993 106110 148152 113113 176176 115115 234236 109110 236238 112112
A173904B EHS 993993 989993 106106 147152 113124 176176 109117 232236 110110 236239 110114