BARRIER DISTRIBUTIONS IN HEAVY ION INDUCED ... - CORE
231
BARRIER DISTRIBUTIONS IN HEAVY ION INDUCED FUSION REACTIONS BY JIAN XIN WEI A thesis submitted for the degree of Doctor of Philosophy at the Australian National University Canberra, July 1993
-
Upload
khangminh22 -
Category
Documents
-
view
3 -
download
0
Transcript of BARRIER DISTRIBUTIONS IN HEAVY ION INDUCED ... - CORE

BARRIER DISTRIBUTIONS IN HEAVY ION INDUCED
FUSION REACTIONS
BY
JIAN XIN WEI
A thesis submitted for the degree of Doctor of Philosophy
at the Australian National University
Canberra, July 1993

To my family
and to the memory of my father.
It is my father who guided me on the road to science...
# & 7 £ ± 7 f 4 ^ W i t 8 & . . . .

Prefacei i i
This thesis describes the resu lts of an experim ental investigation of the distributions of barriers and angular m om enta involved in fusion reactions, which was carried out a t the D epartm ent of N uclear Physics in the A ustra lian N ational U niversity. The reactions studied were 154Sm + 160 and 186W + 16() a t the beam energies from 58 to 110 MeV.
Experim ental techniques were developed to enable the determ ination of evaporation residue cross-sections to a high precision. A large portion of the tim e in the course of this PhD study was spent on the developm ent of a compact velocity filter involving crossed m agnetic and electric fields, and a position sensitive m ultiw ire proportional counter (MWPC). To build such an apparatus was suggested by Dr. J.R. Leigh. The filter and the MWPC were designed, constructed and tested by m yself w ith some useful advice from Dr. D.C. W eisser and assistance from the technical staff in the D epartm ent. Although the construction of the experim ental apparatus was very difficult and very tim e consuming, and the date when it finally worked was alm ost a t the end of my PhD course, the achievements using th is apparatus are great. It has been shown th a t it works extrem ely efficiently and has enabled m easurem ents of evaporation residues cross-sections to be made w ith unprecedented precision (~1%, about one order of m agnitude higher th an before). U ntil now, it is the only apparatus in the world th a t has made fusion m easurem ents to such a high precision.
Fortu itously , w hen the ap p ara tu s was ju s t ready to work Dr. N. Rowley proposed a new technique of analysing fusion excitation functions in te rm s of the "barrie r d istribu tion"; th is technique required high precision da ta which was not available then. Unlike m any proposals which can not be exploited because of experim ental difficulties, my experim ental ap p ara tu s m ade th is proposal viable alm ost a t the same tim e when it was "born". The da ta I obtained not only gave my thesis its title, the results of the analyses of the data have also proved th a t th is proposal is a usefu l tool for "looking" the fusion process.
The bulk of the experim ental work was carried out by Dr. J.R . Leigh, Professor J.O . Newton, Dr. D .J. H inde, Dr. S. E lfstrom , Dr. J.X.
Chen, R.C. Lemmon and myself. Dr. D.G. Popescu, Dr. J. P. Lestone contributed at various stages.
The reduction of most of the raw data was performed by me with some assistance from R.C. Lemmon in part of the 186W data. All the subsequent analysis and interpretation of the data was carried out by myself. Various programs were written by me for these purposes. Dr. N. Rowley's code CONTACT was used to extract the deformation parameters of the target nuclei.
I was helped at all the stages of this course of work by many discussions with Dr. J. R. Leigh, Professor J.O. Newton and Dr. D.J. Hinde. I also gained useful discussions with Dr. N. Rowley when he was visiting this laboratory in 1992 and 1993.
Some of the work described in this thesis have appeared or will appear in the following publications:
(1) A Compact Velocity Filter For Evaporation Residue M easurementsJ.X. Wei, J.R. Leigh, D.C. Weisser, J.O. Newton, S. Elfstrom, J.P. Lestone, J.X. Chen, D.G. Popescu and D.J. HindeNucl. Instr. & Meth. in Phys. Res. A306 (1991) 557-562.
(2) Experimental Determination of The Fusion Barrier Distribution For The 154Sm + 160 ReactionJ.X. Wei, J.R. Leigh, D.J. Hinde, J.O. Newton, R.C. Lemmon,S. Elfstrom, J.X. Chen and N. RowleyPhys. Rev. Lett. 67 (1991) 3368-3371.
(3) Reconciling Deformation Parameters From Fusion With Those From Coulomb ExcitationJ.R. Leigh, N. Rowley, R.C. Lemmon, D.J. Hinde, J.O. Newton, J.X. Wei, J. Mein, C.R. Morton, S. Kuyucak and A. KruppaPhys. Rev. C47 (1993) R437-R440.
(4) High Precision Fusion Excitation Function Measurements; What Can We Learn From Them?J.R. Leigh, M. Dasgupta, C. Morton, D.J. Hinde, R.C. Lemmon, J.O. Newton, J.X. Wei, and N. RowleyInvited talk to RIKEN International Workshop,18-22 February, 1993, Tokyo, Japan. Proceedings of RIKEN

International Workshop On Heavy-Ion Reaction with Neutron- Rich Beams, to be published by World Scientific Press.
(5) Obtaining Average Angular Momenta From Fusion Excitation FunctionsN. Rowley, J.R. Leigh, J.X. Wei, and R. Lindsay Submitted to Phys. Lett. B.Daresbury Laboratory, UK; preprint, May 1993, (DL/NUC/P339T).
(6) Strong Dependence of Sub-barrier Fusion On The Nuclear Hexadecapole DeformationR.C. Lemmon, J.R. Leigh, J.X. Wei, C.R. Morton, D.J. Hinde, J.O. Newton, J.C. Mein, M. Dasgupta and N. RowleySubmitted to Phys. Lett. B.Australian National University, Canberra; preprint,June 1993, (ANU-P/1134).
(7) Experimental Determination of The Distribution of Barriers For Fusion of 154Sm + 160J.X. Wei, J.R. Leigh, J.O. Newton, D.J. Hinde, J.P. Lestone,R.C. Lemmon, J.X. Chen, S. Elfstrom and N. RowleyInternational Symposium "Towards a Unified Picture of Nuclear Dynamics", June 1991, Nikko, Japan.
(8) Fusion Barrier Distributions In The Reactions 186W + 160 and144,154S m + 160
J.X. Wei, D.J. Hinde, J.R. Leigh, R.C. Lemmon, and J.O. NewtonInternational Nuclear Physics conference,July 26 - August 1, 1992, Wiesbaden, Germany.
The rem aining m aterial in this thesis is being prepared for publication.
No part of this thesis has been submitted for a degree at any other university.
Jian Xin Wei Canberra, July 1993

Acknowledgements
I would like to express my sincere gratitude to my supervisors Jack
Leigh and John Newton for m any constructive discussions and the ir
critical reading of the draft and revisions of th is thesis. I am grateful
to David Hinde for his critical reading of some parts of th is thesis as
well.
I am indebted to David W eisser for his advice in designing and
building the velocity filter and the MWPC which have contributed a lot
to my experim ents. I would like to thank the technical staff in the
School for their help in the construction of the experim ental apparatus.
My thanks go to John, Jack, David, Jinxiang, Dom, Nami, Sven, John
Lestone and Roy Lemmon for the ir assistance in running experim ents.
I would like to thank people who helped me in the preparation of th is
thesis, particu larly Gavin for the photography and Anne for assisting
me to get used to the word processing package in the M acintosh.
Special th an k s are due to B ernhard Fabricius and his p rogram
"M ultiFig" which I used to produce m ost of the figures. Special
thanks also to N anda, Clyde and Jason for the ir proof reading of th is
thesis in such a short time.
I am grateful to A.N.U. for offering me th is research scholarship.
F in a lly a specia l th a n k to my wife S haohua for h e r g re a t
encouragem ent and support, and I wish she will hand in her Ph.D
thesis in L inguistics next year; and also th an k s to my lovely little
daughter Beina to whom I owe so much tim e for her kids games; and
thanks to my m other who misses me so much in China while I have
been in Canberra.

vii
Abstract
Fusion excitation functions for the reactions 154Sm + 160 and 186W + 160
have been accurately m easured a t small energy in tervals around the
Coulomb barrier. The accurate fusion cross-sections were obtained by
m easuring the evaporation residue cross-sections to an unprecedented
precision (~1%); about one order of m agnitude higher th an th a t of the
m easurem ents available earlier. The m easurem ents were made w ith
the help of a compact velocity filter and a MWPC developed by me
during th is work. These high precision m easurem ents have not only
improved the quality of the fusion data bu t challenged the common
view th a t the fusion excitation functions are featureless and do not
provide a good test of models.
The excitation functions are sensitive to the details of the structure of
the in teracting nuclei. This has been clearly dem onstrated by the well
defined fusion barrie r distributions extracted from these data, using a
recen tly proposed an a ly sis techn ique. The ex trac ted b a rr ie r
d istribu tions are in good agreem ent w ith those expected from the
static deformations of the target nuclei. The shapes of the two barrier
d is tr ib u tio n s from 154Sm and 186W are d ifferent, reflecting the
different hexadecapole deform ations of the two nuclei. It is shown
th a t the extracted b arrie r distribution provides a good test for fusion
m odels.
High precision fusion da ta can now be used to give a "snapshot" of the
im p o r ta n t c h an n e ls in re a c tio n s w here su b -b a r r ie r fu sion
enhancem ent cannot be explained using sim ple geom etric models.
vi i i
This will give in sigh t into the couplings which m ay be dom inant.
Such results will surely stim ulate new in terest in sub-barrier fusion.
These high precision d a ta can also be used to ex tract the fusion
a n g u la r m om entum d is trib u tio n as proposed a few years ago.
D is tr ib u tio n s of a n g u la r m om entum have been q u a n tita tiv e ly
extracted, for the first time, directly from fusion excitation function.
The lim itations of th is method have been studied.

CONTENTS
Preface iii
Acknowledgments vi
Abstract vii
Table of Contents ix
Chapter 1 Introduction l
Chapter 2 Theoretical Background 8
2.1 Fusion 8
2.1.1 The fusion barrier 9
2.1.2 Fusion cross-sections 12
2 .2 Sub-barrier Fusion 16
2.2.1 Barrier penetration 16
2 .2 .2 Static deformation of nuclei 19
2.2.3 Vibration of nucleus 24
2.2.4 Coupled channels calculations 26
2.3 Fusion Barrier and Angular Momentum Distributions 33
2.3.1 Fusion barrier distributions 34
2.3.2 Experimental determination of the distribution off u s io n b a r r i e r h e i g h t s 38
2.3.3 Fusion angular momentum distributions 45
2.3.4 Experimental determination of angular momentumdistributions of fusion 46
Chapter 3 Experimental Methods 54
3.1 Theory of Detector Operation 54
3.1.1 Silicon surface-barrier detectors 55

X
3.1.2 Gas ionization chamber 57
3.1.3 Gas proportional counter 60
3.1.4 Position sensitive gas counter 63
3.2 Particle Identification Techniques 64
3.2.1 A E -E 64
3.2.2 Time - of - flight 67
3.3 Particle Separation Techniques 69
3.3.1 Magnetic deflection 70
3.3.2 Electric deflection 72
3.3.3 The EXB velocity filter 73
3.4 Experimental Apparatus 75
3.4.1 Velocity filter 76
3.4.2 The position sensitive MWPC 84
3.5 Experimental Measurements 97
3.5.1 Experiment arrangement 97
3.5.2 The determination of the angles of the ER detectors 100
3.5.3 Determination of absolute cross-sections of ERs 105
3.5.4 Targets 107
3.5.5 Electronics 107
3.5.6 Efficiency of the experiment apparatus 111
3.5.7 Procedures 116
3.5.8 Accuracy of the measurements 118
Chapter 4 Experimental Results and Analysis 122
4.1 Evaporation Residues 122
4.1.1 Spectra 122
4.1.2 Differential cross-sections 125
4.1.3 Angular distributions of evaporation residues 126
4.1.4 The cross-section of evaporation residues 132
xi
4.2 Fusion and Its Excitation Function 137
4.2.1 F u s io n e x c i t a t io n fu n c t io n s 137
4.2.2 C urvature of the fusion excitation functions 144
Chapter 5 Discussions and Conclusions 151
5.1 Comparisons of Calculations to Experim ental Fusion D ata 151
5.1.1 Average fusion barrie r height 151
5.1.2 F la t barrier height distributions 152
5.1.3 B arrier distribution associated with static deformation 159
5.1.4 Deformation param eters determ ined from fusione x c i t a t io n f u n c t io n 171
5.2 Fusion A ngular M om entum D istributions 183
5.2.1 A ngular m om entum distributions extracted fromfusion excitation functions 184
5.2.2 The validity of th is method in the extraction ofa n g u la r m o m e n tu m d is t r ib u t io n s 187
5.2.3 T h e m e a n a n g u la r m o m e n tu m 193
5.3 C onclusions 200
A p p e n d ix 203
REFERENCES 210

Chapter 1 Introduction
One of the m ajor challenges in nuclear physics is to understand the
dynamical processes during the reactions of heavy ion induced fusion
on a tim e scale of ~10'21s or shorter. These processes are strongly
dependent on the barrier between the in teracting nuclei, formed by the
combination of Coulomb force, nuclear force and the centrifugal force.
These processes are difficult to describe because the in teraction is so
complicated when the projectile is tunnelling/overcom ing the m utual
in ternuclear barrier. Despite the complex process involved in fusion,
in energy region well above the fusion b a rr ie r , the q u an tu m
m echanical effects of tunnelling through the barrie r are insignificant,
and a classical p ictu re of overcoming a single fusion b a rr ie r is
adequate to describe th is process. However, a t bom barding energies
around and below the fusion barrier, quantum m echanical tunnelling
th rough the b a rr ie r becomes im p o rtan t and becomes the m ajor
process con tribu ting to fusion. T heoretically , the H ill-W heeler
formula of barrier penetration [Hil53] is routinely used to calculate the
fusion a t the energies around the barrier.
In the la te 1970s and early 1980s, S tokstad et al, published th e ir
system atic m easurem ents of fusion cross-section for the reactions of 160
on ta rg e ts of Sm isotopes [Sto78, Sto80] a t the energies around the
conventional barrier (known as the Coulomb barrier). They found th a t
fusion cross-sections were up to several orders of m agnitude h igher
2
th an expected from simple barrier penetration model. Subsequently,
th is enhancem ent has been observed by m any other groups in the
m easu rem en ts of fusion cross-sections a t energ ies around the
Coulomb b a rrie r [Bec80, Eve81, Bec82, Rei82, Löb83, A1J84]. The
e n h a n c e m e n t h a s , th e re fo re , been recogn ised as a global
phenom enon. I t was suggested th a t the enhancem ent m ay be
understood if there is a set of barrie rs encountered in fusion ra th e r
th an the single conventional Coulomb barrier [Vaz74, Rei85, Ste88].
A distribution of barriers may result, for example, classically from the
perm anent deformation [Sto78, Sto80] of the target and/or the projectile
and quan tum m echanically from the effects of coupling the fusion
channel to other channels such as inelastic scattering and particle
tran sfe r [Bec80, Pen83]. Calculation shows th a t for a given fusion
b a rr ie r he igh t B, a t bom barding energies around th is b a rrie r the
fusion cross-section falls very quickly as the energy decreases; an
exponential dependence on the difference betw een the bom barding
energy E and barrier height B is predicted. Thus, if a set of barriers is
involved in fusion, only the barrie rs whose heights are sm aller than
the bom barding energy contribute to fusion significantly.
The shape of b a rrie r d istribu tion therefore becomes im portan t in
affecting fusion and some a rb itrary type of barrie r distributions, such
as flat and G aussian distributions, have been introduced in order to fit
fusion excitation functions. These d istribu tions were successful to
some degree b u t often a num ber of different b a rrie r d istribu tions
p rov ided equally good fits w ith in the typ ical ex p erim en ta l
uncertain ties of -10%. This supported the common view th a t fusion
excitation functions are featureless and can be reproduced by a range
of different models.

3
C ontrasting with th is common view, a recent theoretical development
in the middle of 1990 [Row91, Row91a], showed th a t considerable
in form ation about dynam ical processes in fusion can indeed be
extracted directly from experim ental fusion excitation functions. In
particu la r, the d istribu tion of b a rrie rs involved in fusion can be
ex trac ted directly from the m easured experim ental fusion d a ta
w ithout reliance on models; the curvature of fusion excitation function
d 2(E a ) /d E 2 is re la ted to the d istribu tion of fusion barrie rs . This
represents a major advance in the understanding of heavy-ion fusion.
However, to take advantage of th is development, the m easurem ent of
the fusion excitation function to m uch higher precision (essentially
~1%) and in very fine energy steps (~0.5 MeV) is required. The data
previously available were not m easured in such detail, partially due to
the lim itation of experim ental methods used and partially due to the
common view th a t there was no need to m easure the da ta to be tter
th an 10% because of the little use of the details of fusion excitation
functions. The new method of analysing the fusion excitation function
essentially leads the study of heavy ion fusion into a new dim ension
and ra ises a new ta sk and challenge for the experim en tis ts to
m easure fusion cross-sections to much higher precision, by an order
of m agnitude, than before.
This experim ental challenge has been answered and the validity of the
proposed analysis technique has been tested in the work presented in
th is thesis.
A velocity filter w ith crossed electric and m agnetic fields and a
position sensitive m ulti wire proportional counter (MWPC) have been
developed by me during the course of th is PhD study [Wei91]. The
filter is compact (-20 cm long and -10 cm wide), and is capable of
4
tran sm ittin g evaporation residues from heavy ion fusion reactions
and suppressing elastic scattering, even a t angles as close as 0.5° to
the beam direction. The m easured efficiency of the filter is very close
to 100%. The transm itted evaporation residues were then detected by
the MWPC behind the filter.
U sing th is ap p ara tu s the fusion cross-sections can be easily and
quickly m easured and unprecedented precision (~1%) in evaporation
residue cross-section m easurem ents has been obtained. Details of the
experim ental method and the apparatus will be given in C hapter 3.
The m easu rem en ts were perform ed using a doubly closed shell
spherical projectile 160 , which is not expected to contribute to the
barrie r d istributions significantly, and ta rge t nuclei 154Sm and 186W,
w hich a re know n to have p e rm a n e n t defo rm ations. These
deform ations are expected to give rise to a continuous distribution of
barrie rs to fusion. Hence the extraction of these barrier distributions
from m easured fusion da ta provides a te s t of the valid ity of the
proposed analysis technique.
However, the resu lts of these tests proved to be even more exciting
th an an ticipated . Not only were well-defined b a rrie r d istributions
extracted from da ta b u t the shapes of these b arrie r d istributions for
the two reactions w ith different targets of 154Sm and 186W were quite
different. These difference were assigned to the difference in the
hexadecapole deform ation of the two nuclei. Thus as well as proving
the u tility of the new m ethod these d a ta have show n th a t the
m easurem ent of fusion excitation functions can be a powerful tool for
m easuring nuclear deform ation properties [Lei93]. In particu lar, the
signs of hexadecapole nuclear deform ation p aram eter, which are
5
notoriously difficult to determ ine by other methods, are determ ined.
More im portantly, th is sensitivity to relatively small effects suggests
th a t fusion da ta m ay be used as delicate probe of weak couplings.
Through the b a rrie r d istribution the im portan t channels which are
responsible for enhancing fusion may then be identified.
A nother im p o rtan t aspect in stud ies of fusion is the a n g u la r
m om entum distribution of the fused system which plays an im portant
role in governing the details of the decay processes of the hot, rapidly
ro ta tin g com pound nucleus, p a rticu la rly in com petition betw een
fission and particle emission. The angu lar m om entum d istribu tion
h as th e re fo re been ex ten siv e ly s tu d ied e x p erim e n ta lly and
theoretically.
E xperim entally , the angu lar m om entum d istribu tions are usually
estim ated using m easurem ent of y-ray m ultiplicities [Van83, Gil85,
Lei86, Gil90, Wuo91, Bie93], isom er ratios [Dig90], fission fragm ent
an g u la r d istrib u tio n s [Bac85, M ur86, Van86], a -p a rtic le a n g u la r
d istribu tions [Bor86] and elastic scattering [Uda85, Lei86, Kon87].
However, none of these m ethods directly m easures the an g u la r
m om entum d is trib u tio n in fusion. They generally rely on the
m easurem ents of one or other decay products following fusion, and all
require in te rp re ta tio n using various models or recipes. This model
dependence in tro d u ces large u n c e rta in ty in ex trac ted a n g u la r
m om entum d istribution in the compound nucleus.
Another m ethod, pointed out by various authors [Bal83, Rei85, Bal86,
Das86], is th a t the fusion angular m om entum may be extracted from
the slope of fusion excita tion function. T hus the tran sm iss io n
coefficient T, a t / = 0 can be w ritten as T0(E) = [d(Eo)/dE]/R2 and Tz can
6
be obtained by TZ(E) = T0(E'), w here R is the fusion rad ius and
E' = E - /(/ + l)/i/2|j.R2, (i is the reduce m ass of projectile. However,
th is method has not been used practically because of the relatively poor
precision of the existing data though some authors [Das91, Ste92] have
tried to extract the m ean angular m om entum from fusion excitation
function by in te rp re ting the experim ental fusion da ta w ith various
methods and models. As it has been point out by Stefanini [Ste92], th a t
only qua lita tive resu lts can be obtained from th e ir analyses and
q u an tita tiv e deductions cannot be m ade due to the difficulties of
obtaining the fusion data to the required precision. The availability of
the high precision fusion data , m easured in sm all energy steps,
p resented in th is thesis made th is technique viable quantitatively for
the first time.
Using th is method, the distributions of fusion angular m om entum for
the reactions of 154Sm and 186W + 16q have been extracted. The errors
relating to the replacem ent of the fusion radius, which varies w ith the
b a rr ie r and the an g u la r m om entum , by an average fusion rad ius
have been studied. The extracted m ean angular m om enta have been
com pared w ith th o se converted from y -ray m u lt ip l ic i t ie s
m easurem ents [Bie93]. D etails of these are p resen ted in the la s t
C hapter of th is thesis.
In sum m ary , for the f irs t tim e, well defined fusion b a rr ie r
d istributions have been extracted directly from experim ental data, and
fusion an g u la r m om entum d istribu tions have also been extracted
from the data . I t has been dem onstra ted th a t, con trary to the
commonly held view, fusion excitation function itse lf does contain a
considerab le am o u n t of in fo rm ation about the fusion process.
However, th is inform ation can only be explored w hen the fusion
excitation function is m easured to very high precision and in very
sm all energy intervals.
The analysis m ethods for the extraction of the fusion b a rrie r and
angular m om entum distributions have been shown to work extremely
well. It is w ith confidence th a t we can now expand th is analysis to
more complex reaction system s in which the quan tum m echanical
coupling effects are dom inant [Lei93a], ra th e r th an the classical
b a rrie r d istribu tion associated w ith deformed nuclei. These would
lead us to other new insights into the dynamical process in heavy ion
induced fusion.

Chapter 2Theoretical Background
2.1 FU SIO N
Fusion is a process in which two nuclei, a projectile and a target,
come together w ith sufficient kinetic energy to overcome their m utual
electrostatic and centrifugal repulsion to form a new nucleus. Fusion
is classified as complete or incomplete depending on w hether the final
charge Zc, and atom ic m ass Ac, of the newly form ed compound
nucleus (CN) are equal to the sum of those of the projectile and target
or not. I t has been shown experim entally (e.g. in [Wil80]) th a t
incom plete fusion becomes significant once the bom barding energy is
above a certain energy threshold corresponding to a critical angular
m om entum . This threshold is far above the b arrie r region, thus we
expect th a t incom plete fusion is insignificant a t the energies used
here and hence can be ignored in th is work. The term fusion in all
th a t follows refers only to a complete fusion.
B ecause of the large am ount of energy and an g u la r m om entum
involved in fusion, the newly formed CN is a "hot" and rapid ly
"spinning" system. In the energy region studied in th is work, the CN
decays m ainly by evaporating particles and y-rays, resu lting in an
evaporation residue, or by fission (the CN splits into two roughly equal
fragm ents). T hus, th e fusion cross-section can be de te rm ined
ex p erim en ta lly by m easu rin g evaporation res id u es and fission
9
fragm ents, and assum ing th a t it is the sum of the cross-sections for
these two decay processes. However, fission only becomes im portant
in the decay process when the fission barrier is equal to or less th an
the neutron bounding energy of CN [Van73]. In this work the decay
processes of evaporating particles are dom inant and the fusion cross-
sections are equal to those for evaporation residues. For the reaction of
186w + 160 a t the bom barding energies well above the fusion barrier
there is a sm all fission probability and th is has been taken into
account. Since the process of fission is not studied in th is thesis, the
fission cross-sections of 186W + 160 were taken from reference [Bem87].
2.1.1 The Fusion B arrier
The in ternuclear potential V, of the colliding projectile and target is a
function of the distance r, between the centres of the two nuclei. In a
head on collision V is the sum of an attractive nuclear potential -Vnuc,
and a repulsive Coulomb potential Vcoub thus:
V(r) = -Vnuc(r) + V COul(r) (2-1-1)
Vnuc is the strong, short range potential, and thus, it is only im portant
when the surfaces of the two nuclei are very close to each other. The
nuclear potential is not yet fully understood in detail, bu t a good and
sim ple approxim ation, successful in describing elastic scattering for
example, is a Woods-Saxon potential which can be w ritten as:
-Vnuc(r) = - V0 [ l + e x p ( ) ] _1 (2-1-2)C \
W here V0 and a are the depth and diffuseness of the potential, and RN
is the sum of the two nuclear radii.
10
The Coulomb potential can be w ritten exactly if the shapes of the two
nuclei are known and the the two nuclei are separa ted from each
other. If the two nuclei are spherical then Vcoul is simply
Vcoul(r) (2-1-3),
where Z u Z2 are the nuclear charges. For a deformed projectile and/or
ta rge t, V Coul and V nuc also depend on angle of the orientation of two
colliding nuclei; th is will be discussed in §2.2.2.
For non-head on collision, the in ternuclear potential becomes angular
m om entum l dependent,
V, (r) V(r) +/ ( / + m 2
2pr2 (2-1-4)
w here p is the reduced m ass of the projectile. The an g u la r
m om entum is conserved during the collision and is determ ined by the
asym ptotic im pact param eter of the projectile and target.
A plot of the in ternuclear potential Vz vs r is shown in Fig 2-1-1. For
Z=0, one can see th a t there is a peak in V(r) along the r axis and a
repulsive region to the righ t side of the peak, where the Coulomb
po ten tia l is dom inant. To the left side of the peak, for sm aller
d istances, the a ttra c tiv e nuc lear p o ten tia l is dom inan t and an
absorptive well is formed. Classically, the colliding system of the
projectile and ta rg e t m ust have sufficient energy to overcome the
potential peak in order to reach the absorptive well and thus to fuse.
The he igh t of the peak and the d istance a t which it occurs are
therefore defined as the fusion barrier (frequently called the Coulomb
barrier) B0 and the fusion radius R0. As will be discussed later, these

11
Fig. 2-1-1:Illustra tion of the angular m om ent dependence of in te r n u c le a r p o te n t ia l (ad ap ted from [Pof83]). T heoretically the b a rr ie r h e igh t and the position can be found a t th e s ta tio n a ry po in t for all po ten tia ls of l </Crit> and there is no absorption well when l > l CTit (see tex t for details). The potential a t th e g ra z in g a n g u la r m om entum Zg is indicated for a given incident energy E.
are two fundam ental param eters in the study of the fusion process.
Values of B0 and R0 can be found by finding the stationary point in the
first differential of V(r), thus
r dV(r)L d r -URo 0 (2-1-5),
and
B0 = -Vnuc(R) + (2-1-6)
However, since the form of nuclear potential is not exactly known, B0
and R0 cannot be precisely determ ined by theory alone. Instead they
are u sually ex tracted from the m easured fusion cross-sections, as
discussed in §2.1.2.

12
W hen / * 0, the centrifugal term is taken into account, both the barrier
height and fusion radius become l dependent (denoted as B, and R,).
T hus
B/ “V n u c ( B /) +ZxZ2e2 / ( / + m 2
R< + 2nR?(2-1-7)
Calculation shows th a t the Rz decreases as l increases. However R, is
no t very sensitive to Z, and to the firs t order it is not a bad
approxim ation [Won73] to take R, independent of Z. Thus
R/ = R0 = R (2-1-8)
The barrier height B, is then approximately
B/ - o ia + m 20 + 2|xR2 (2-1-9)
As Z increases, the absorptive well of the potential becomes shallower
and eventually vanishes. The value of Z a t which the absorption well
v an ish es , is th e so-called c ritica l a n g u la r m om entum , ZCrit-
Classically, there is no fusion when the l > Zcrit> because no absorption
region exists in the po ten tial of V(/ > /Crit), a n d the large angu la r
m om entum will d isru p t the in te rac ting system before a compound
nucleus is formed.
2.1.2 Fusion Cross-Sections
S tarting from a geometric view of the collision of two nuclei, one can
get the expression for the fusion cross-section G as
OO 00
0(E) = 7t*2£(2/+l)T ,(E)P, = £1=0 /=o
(2- 1- 10)

13
w here the T, and G/ are the transm ission coefficients, and p a rtia l
cross-sections a t angu lar m om entum l respectively. The Pz are the
fusion probabilities which are generally taken to be unity in the energy
range used in this work [Row91]. The reduced wave length is given by
where E is the kinetic energy of the projectile in the centre of m ass
system .
In the sharp cutoff model the T, is given by:
where lg is the m axim um angular m om entum which can fuse, often
referred to as the grazing angular m omentum, defined by
Inserting (2-1-11) into (2-1-10) and replacing the sum over l by an
in tegration, the fusion cross-section becomes
1 l < lg
0 l > lg(2- 1- 11)
E - B0 + 2 ^ 2 (2- 1- 12)
0 E < B0
(2-1-13)
which, using (2-1-12), gives
O(E) = i7rR2( l - ) E > B0
(2-1-14)0 E < B0

14
This equation is commonly known [Wei37, Gut73, Sco76] as the sharp
cutoff expression. I t predicts th a t the fusion cross-section varies
lin e a rly w ith 1/E, w ith in te rce p t B0 and slope ttR2 . For the
convenience of the discussions about the barrie r d istributions later,
the above equation, multiplied by E on both side, can be w ritten as:
The function Ea is, now, linear in E.
Shown in Fig. 2-1-2 is a plot of E a vs E for the reaction of 74Ge + 74Ge.
The fusion barrie r height B0 and the fusion radius (the fusion radius
is defined as the barrier radius R) can be extracted from such a plot by
fittin g the experim en tal da ta . This type of analysis was firs t
perform ed by Gutbord et al. [Gut73] and has been used since then by
m any au thors in the ir analyses of heavy ion induced fusion reactions
[Eis77, Jah82, Bec83, Mos84].
However, as expected, the sharp cutoff model fails a t energies near to
the b a rrie r regime. This is evident in Fig. 2-1-2 in which the data
deviate significantly from the stra igh t line a t low energies. Details of
th is phenom ena will be discussed in §2.2.
As shown in Fig. 2-1-1, the absorptive well of the in te rn u c lea r
p o ten tia l van ishes a t the an g u la r m om entum Zcrit. In a sim ple
c lassical model w hich re lies on trap p in g the nuclei inside the
potential well, no partia l waves l > Zcrit can lead t° fusion. Hence the
/g in Eq. 2-1-2 should be replaced by Zcrit if the energy E > E^ where
(2-1-15)
E' " B° + 2|iR2 /crit(Zcrit+l) (2-1-16)

15
The region of energy E > Ei is defined as high energy region, and the
region B0 < E < Ex is defined as intermediate energy region. While the
energy E < B0 is so-called sub-barrier region. Since the beam energies
used in this work are much lower than Ei the limit of Zcrit is not
reached, and hence it is not taken into account in our analyses of the
experimental fusion cross-section data.
xlOOOO
10000
« « » » *1
E (MeV)
Fig. 2-1-2: Plot of Eg vs E (in centre of mass) for the reaction of 74Ge + 74Ge (adapted from [Bec88]). At the energies above fusion barrier, Eg is essentially linear. The intercept of the linear fit and the abscissa gives the fusion barrier height B0 while the slope K of the straight line gives the fusion radius (rcR2). The inserts expand the view at the energies near and below the barrier.
Eg
(mb-
MeV
)

16
2.2 SUB-BARRIER FUSION
2.2.1 Barrier Penetration
The sharp cutoff model discussed in §2.1.2, given its simplicity, has
had great success in describing fusion cross-sections a t energies above
the potential barrier. It is, however, not appropriate a t energies near
and below the b a rrie r where the b a rrie r penetration effect becomes
im portant. Thus, Eq. 2-1-11 is no longer a good approxim ation. To
take into account the barrier penetration, WKB approxim ation [Kem35,
Fro65] is often used to calculate the transm ission coefficients T, . The
Tz for a projectile to tunnel through a barrier can be w ritten as
TZ(E)
1 + exp (+ Vz(r) - E I d r)
(2-2- 1)
where ra and rb are the inner and outer tu rn ing points of the potential
b a rr ie r , th e m inus/p lus signs in fron t of the in te g ra l refer to
above/below barrier energies, the Vz(r) is defined in Eq. (2-1-4).
In principle, the TZ(E) and hence the fusion cross-section, can be
calcu lated if the Vz(r) is known. However, because the nucleus-
n u c leu s p o te n tia l is no t know n, as d iscussed before, some
assum ptions about the Vz(r) have to be made. The usual assum ption
is th a t the potential barrie r is nearly parabolic in shape [Tho59, Hui61,
Ras71]. The Coulomb and nuclear potentials can then be replaced by
an inverted harm onic oscillator potential to give
Vz(r) B o -12 l ^ ( r - R o )2
iu+mß+ 2pr2 (2-2-2)

17
For an energy E, the transm ission coefficients TZ(E) can then be
calculated analy tically and are given by the H ill-W heeler form ula
[HÜ53]
T,(E) = ----------- —■------------ (2-2-3)1 + exp[— (B, - E)]
where Bz and /icoz are the barrie r height and barrie r curvature for the
/th partia l wave.
Bz and the coz are calculated num erically, from the to tal potential by
finding the stationary point Rz of the first differential of the potential,
th u s
Bz = V/(R/)
and
h i$
(2-2-4)
(2-2-5)
By inserting Eq. (2-2-3) into Eq. (2-1-10) the fusion cross-section G can
be found.
F u rth e r theoretical studies have been carried out by Wong [Won73]
and it was found th a t the Rz and 7ia)z are ra th e r insensitive to l. Hence,
it can be assum ed th a t the b a rr ie r positions and cu rva tu res are
independent of angu lar m om entum , thus
Rz ~ R0 = R hu>[ ~ hod0
and
R Kum2a ° + 2(xR2B,

1(2-2-6 )T/(E) =
and
(2-2-7)
This is a very useful theoretical approxim ation for the fusion cross
discussed later.
At energies well above the barrie r where E » B0 the logarithm ic
expression (2-2-7) reduces to the well-known classical formula (2-1-14).
For low energies such th a t E « B0, the cross-sections are given by
showing th a t the fusion cross-section decreases exponentially w ith
decreasing E.
One of the successful applications of th is penetration model is for the
reaction of 144Sm + 160 [DiG86]. DiGregorio et al, m easured the fusion
cross-section for th is system a t bombarding energies in the range of 63
MeV to 72 MeV in lab. The fusion cross-sections ranged from 0.3 mb
to 400 mb. They extracted the B0 and R from the data m easured above
the Coulomb b arrie r and then adjusted f u o 0 to fit all the m easured
fusion cross-sections. The m odel fitted th e d a ta w ith in the
experim ental error (-10%) using a value of 3.9 MeV for h < £ 0 . However,
extending the analysis to the 160 induced fusion reactions on the other
even Sm isotopes ( I 48 , l 5 0 , l 5 2 , l 5 4 g m )> they found th a t a t sub-barrier
section and it forms the basis of m any other models which will be
: p [ ~ - ( E - B 0)]?X COq
( 2-2-8 )

19
energies the cross-sections for the different isotopes varied far more
th an would be expected from simple A1/3 variations of the radii [Sto78,
Sto80, Sto81, DiG86].
The enhancem ent of sub-barrier fusion cross-sections, in these cases,
is m ainly due to the perm anent deformations of the Sm isotopes which
vary from spherical 144Sm (closed neu tron shell) to well deform ed
154Sm. However, such enhancem ent is a common phenom enon
observed in essentially all heavy ion reactions a t sub-barrier energies
[Bec80, Rei82, Pen83, Ste84, Bec85, Ste86]; the fusion cross-sections are
orders of m agnitude larger th an those expected from simple b a rrie r
penetration models. A num ber of possible theoretical explanations of
th is phenom enon have been developed and investigated . These
approaches consider effects of zero-point motion [Esb81], coupling to
inelastic excitation [Das83, Das83a, Bro83], particle transfer [Bro83a,
S te90], neck fo rm ation [Vaz81, Jah 8 2 , Ste90], and the s ta tic
deform ation of the reacting nuclei [Sto81]. D etails of some of these
theoretical approaches will be discussed.
2.2.2 Static Deformation of Nuclei
The penetra tion models discussed above assum e th a t the projectile
and ta rg e t are spherical. However, if one (or both) of the nuclei is
deformed the in teraction potential becomes strongly dependent on the
m utual orientation of the two nuclei. For example, when a spherical
projectile approaches a deformed prolate target, the fusion b a rrie r is
lower if the sym m etry axis is along the beam direction (0 = 0° in
Fig. 2-2-1) and is h igher if it is perpendicular to it. The transm ission
coefficient T, varies very quickly (exponentially) w ith bom barding
energy near the b arrie rs (for example in the (spherical) 160 + 144Sm

20
case, when E - B0 = 1.5 MeV, T0 ~ 0.9 and when E - B0 = -1.5 MeV, T0 ~
0.08). Hence only the barriers which are lower than the bom barding
energy contribute significantly to fusion. These orientation effects
should thus critically affect the sub-barrier fusion cross-sections.
Expanding the nuclear radius in term s of spherical harm onics Y^0O)
[Sto81], one gets
Rt(9) = R J l+ X ß x Y ^ e )] (2-2-9)
where ß*. ( X = 2,4,6,...) are the param eters describing the deviation of
the nuclear surface from a sphere with a radius Rt.
Replacing RN with RN(0) = Rp + Rt(0) (Rp is radius of projectile) in the
potential in Eq. 2-1-2 and replacing the monopole Coulomb potential
w ith m ultipole po ten tia l V COul(r,0), the 0 dependen t in te rn u c le a r
potential becomes
V/ (r,0) = -Vnuc(r,0) + VCOul(r,0) + £ (2-2-10)
W here 0 is the angle betw een the axis of sym m etry of the deformed
ta rg e t nucleus and the in itial direction of the spherical projectile as in
Fig. 2-2-1.
From th is equation, the fusion barrie r height B(0) and transm ission
coefficients T/(E,0) can be calculated. In stead of a single fusion
b a rrie r B0, as in the spherical case, there is a continuous distribution
of b a rrie rs B(0). Fig. 2-2-1 shows the barriers for the in teraction of
154Sm + 160 for / = 0 as a function of the angle 0 describ ing the
orientation of the deformed 154Sm [Sto81]. The fusion barriers heights
change by about 9 MeV as 0 varies from 0° to 90°. The potential a t 52.5°
shown in th is figure is close to th a t for a spherical case.

Barrier Hights for Fusion of 154Sm + 160 (1 = 0)
0 = 75
r (fm)
Fig. 2-2-1: Barriers (/ = 0) of 154Sm + 160 vary with the angles of orientation (adapted from [Sto81]). An incident energy of 54.3 MeV (60 MeV lab) is indicated, from which it is evident that the incident energy is much lower than the heights of most of the barriers but it is still higher than the lowest barriers. Only those lowest barriers significantly contribute to fusion (see Fig. 2-2-2 for details).
The fusion cross-section for an orientation 0 is given by
oo
0(0) = tc fc2 £(2/+l)T,(0) (2-2-11)1=0
Fig. 2-2-2 shows the calculated a(0) for 154Sm + 160 at centre of mass
energy of 54.3 MeV (60 MeV bombarding energy). The partial cross-
sections g (0) span three order of magnitude. This bombarding energy
22
Cross-Sections for Fusion of ^4gm + 16q
o(0) sin(0)
0 (degree)
Fig. 2-2-2: Calculated fusion cross-sections as a function of the angle of orien tation (adapted from [Sto81]). Only the sm allest angles, hence the low est b a rrie rs , significantly contributed to fusion at Ecm 54.3 MeV.
is equivalent to the b a rrie r height, B(0), a t 9 ~ 20°. One can see th a t
the g(9) drops dram atically as the barrier height B(9) becomes larger
th an the incident energy as 0 exceeds 20°.
The total fusion cross-sections have to be averaged over all 9 values
since the nucleus in the targe t have random orientation, thus
71/2
G = Ja(0)sin0d0 .0
(2-2- 12)

23
In th e a n a ly s is of th e ASm + 160 re a c tio n s , by S to k s ta d e t a l a n d
D iG regorio e t a l, 144Sm w as t re a te d as sp h erica l a n d for th e o th e r
iso to p es ß2 w as u sed as a free p a ra m e te r (the v a lu es of th e ß4 , ßö,
w ere s e t equal to zero) to m in im ise th e x2 of th e th eo re tica l fits to th e
d a ta . T hey found th a t th e b e st fits occurred w h en ß2 ~ 0.15, 0.18, 0.19,
0.22 for I48,150,l52,154gm re sp ec tiv e ly (see F ig . 2-2-3 a d a p te d from
[D iG 86]). H o w ev er th e se e x tra c te d ß 2 v a lu e s a re s y s te m a tic a lly
Fusion of ASm + ^ 0
Elab (MeV)
F ig . 2-2-3: F u s io n c ro ss-sec tio n s for ASm + 160 (a d a p te d
fro m [D iG 86]). T h e so lid c u rv e s a re c a lc u la te d c ro ss-
sec tions by W ong m odel, (see te x t for de tail).

24
sm aller th an those extracted from the a-partic le inelastic scattering
and other reactions [Hen68, Hen73, Bru74, Sha74, Lee74, Lee75]. For
exam ple, the value of the ß2 of 154Sm, extracted from the inelastic
scattering, ranged w ithin 0.27 to 0.33, roughly 30% larger th an th a t
ex tracted from fusion data. The reason for th is rem ained unknown
un til recently when the high precision fusion da ta for th is reaction,
obtained during the course of th is work, were re-analysed [Lei93], as
discussed in the C hapter 5.
2.2.3 Vibration of Nucleus
J u s t as the different orientations of a deformed nucleus resu lt in a
d is tr ib u tio n of b a rr ie r, the fluctuation of the surface-to-surface
d istance o rig inating from collective v ibrational m otion (zero-point
motion) of a nucleus [Esb78, Bro79, Bro79a, Esb81] also resu lts in a
d istribu tion of fusion radii, hence a distributions of b a rrie r heights.
Although these two barrier distributions may be quite different to each
other, both of them produce significant enhancem ent of fusion a t the
energies near and below the Coulomb barrier.
It can be shown th a t the d istribu tion of the nuclear rad iu s has a
G au ssian form, if one assum es th a t the surface v ib ra tio n s are
independent harm onic vibrations [Boh75, Bro76]. Using th is radius
d istribu tion , E sbensen [Esb81] param eterised the nuclear potential
and calcu lated fusion cross-sections. He investiga ted the fusion
excitation functions of 160 + I48,l50,l52,l54gm and 40Ar + 144»148>154Sm,
m easured by Stokstad, et al [Sto78,Sto80a]. The fusion cross-sections
were calculated assum ing th a t there are quadrupole and octupole
vibrations for the "lighter" targe ts of 144»148»150Sm, and quadrupole

25
deform ations and octupole vibrations for 152>154Sm. A quan tita tive
agreem ent w ith experim ental da ta (m easured to about ±10%) was
obtained a t the energies below the Coulomb barrier. As a comparison,
he calculated the fusion cross-sections of 40Ar + Sm by including the
quadrupole ZPM of 40Ar, based on the low-lying 2+ state in 40Ar. It
was found th a t including the ZPM of 40Ar improves the agreem ent
between experim ent and calculation a t the energies below the barrier.
However, the calculations overestim ated the fusion cross-sections in
the in term ediate energy region. This overestim ation was larger for
the 40Ar th an for 160 induced fusion. It was suggested [Esb81] th a t
th is may resu lt from the lack of consideration of the dynamical effect,
such as form ation of a "neck" betw een the in teracting nuclei during
the fusion process. A fter investiga ting m any fusion excita tion
functions Vaz et al and Jahnke et al [Vaz81, Jah82] have qualitatively
predicted th a t such a dynam ical effect would be proportional to the
ZjZ2 of the in teracting nuclei. However, because of the difficulties in
p a ram eteris in g the "neck" form ation dynam ically, no quan tita tive
calculations have been provided to testify this proposition.
However, Reisdorf, et al, had claimed th a t “there is no need to invoke
additional degrees of freedom such as neck form ation”, a fte r they
reinvestigated the reactions of 40Ar + l 44,l48,l54gm ancj m easured the
reactions of 40Ar + 112,116,122gn [Rei82]. They showed th a t the
experim ental da ta (overall accuracy of 15%) can be in terpreted by the
b a rrie r fluctuations correlated w ith the collective surface zero point
motion of nuclei. To fit the data, they found th a t the largest fluctuation
p a ra m e te r is requ ired for the ta rg e t nucleus 148Sm and la rg e r
fluctuations are required for 40Ar than for 16 0 induced fusion. The
firs t observation is consisten t w ith the fact th a t the 148Sm is a

26
transitional nucleus and has the largest vibration; 154Sm is known as
s ta tic deform ed and th is has been tak en in to account in th e ir
calculation . The la t te r one m ight re la te to the fusion channel
coupling w ith the inelastic channel a t the low lying 2+ state (1.46 MeV)
in 40Ar bu t not in 160 . More detailed analyses were carried out la te r
by the sam e authors [Rei85]. It was found th a t the experim ental data
can be well reproduced by sim plified coupled channel calculations,
which will be discussed in the following section.
2.2.4 Coupled Channels Calculations
I t was found by B eckerm an et al [Bec80] in an investigation for
reactions involving 58Ni and 64Ni nuclei, th a t the enhancem ent of
fusion cross-sections for 58Ni + 64Ni is much larger (up to 1 or 2 orders
of m agnitude) th an th a t for either of the reactions 58Ni + 58Ni and 64Ni
+ 64Ni, and th is cannot be simply explained by static deform ations or
surface vibrations. For example, if the enhancem ents were caused by
a sta tic deform ation of only one of the nuclei, the largest enhancem ent
should occur w hen bo th the projectile and ta rg e t are deformed.
B eckerm an et al [Bec82, Bec83] have explored fu rther the complex
v aria tion of the sub -barrie r fusion cross-sections in th e ir series of
fusion studies of 58»64Ni and 74Ge projectiles on a target of 74Ge.
In 1983, Dasso et al [Das83, Das83a] and Broglia et al [Bro83,Bro83a]
published a series of papers and introduced a new idea th a t fusion
m ay be enhanced by coupling the en trance channel to a non-fusion
channel such as inelastic excitation or transfer.
U sing partic le tra n s fe r reaction as an exam ple, for instance, if a
partic le , such as a n eu tro n or proton is exchanged betw een the
27
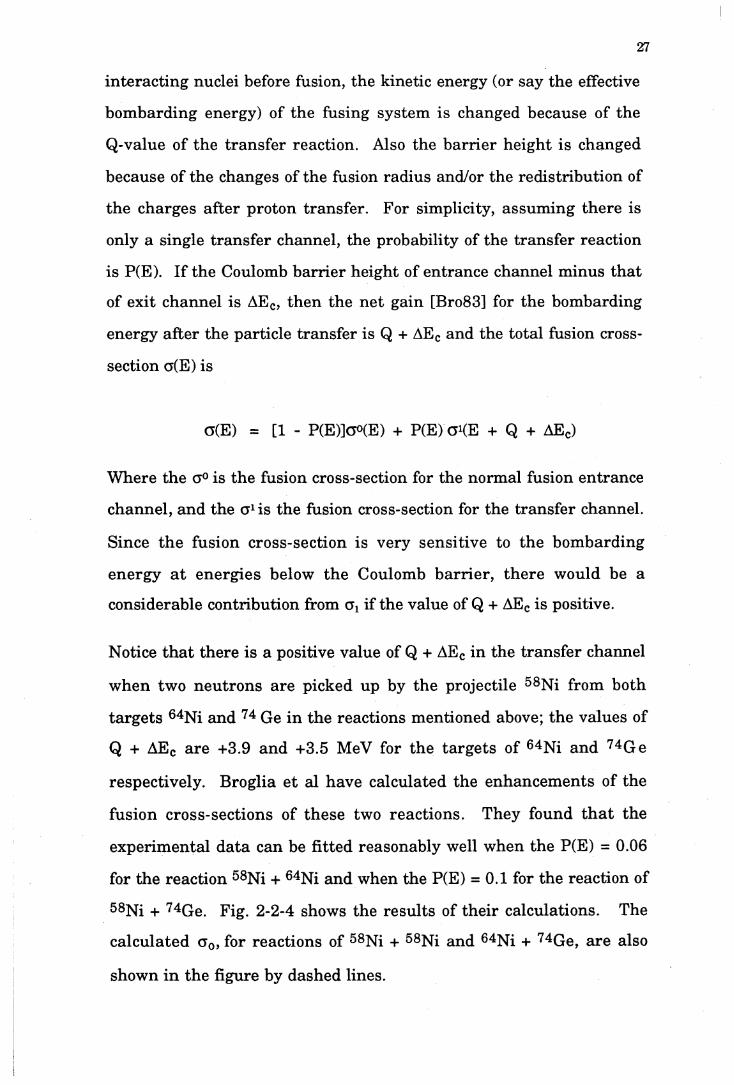
in teracting nuclei before fusion, the kinetic energy (or say the effective
bom barding energy) of the fusing system is changed because of the
Q-value of the tran sfer reaction. Also the barrie r height is changed
because of the changes of the fusion radius and/or the redistribution of
the charges after proton transfer. For simplicity, assum ing there is
only a single transfer channel, the probability of the transfer reaction
is P(E). If the Coulomb barrier height of entrance channel m inus th a t
of exit channel is AEC, then the net gain [Bro83] for the bom barding
energy after the particle transfer is Q + AEC and the total fusion cross-
section g(E) is
G(E) = [1 - P(E)]O0(E) + P(E) g KE + Q + AEC)
W here the g° is the fusion cross-section for the norm al fusion entrance
channel, and the gGs the fusion cross-section for the transfer channel.
Since the fusion cross-section is very sensitive to the bom barding
energy a t energies below the Coulomb b a rrie r, th ere would be a
considerable contribution from gx if the value of Q + AEC is positive.
Notice th a t there is a positive value of Q + AEC in the transfer channel
w hen two neutrons are picked up by the projectile 58Ni from both
ta rge ts 64Ni and 74 Ge in the reactions m entioned above; the values of
Q + AEC are +3.9 and +3.5 MeV for the ta rg e ts of 64Ni and 74G e
respectively. Broglia et al have calculated the enhancem ents of the
fusion cross-sections of these two reactions. They found th a t the
experim ental da ta can be fitted reasonably well when the P(E) = 0.06
for the reaction 58Ni + 64Ni and when the P(E) = 0.1 for the reaction of
58Ni + 74Ge. Fig. 2-2-4 shows the resu lts of their calculations. The
calculated g 0, for reactions of 58Ni + 58Ni and 64Ni + 74Ge, are also
shown in the figure by dashed lines.
28
Ecm (MeV)
Fig. 2-2-4: Fusion cross-sections for 58Ni + 64Ni and 58Ni +74Ge (adapted from [Bro83]). The solid curves and the dashed curves show the calculated fusion cross-sections w ith and w ithout the inclusion of transfer channels respectively.
This sim ple exam ple shows th a t how other reaction channels can
affect fusion. The real situation however is m uch more complicated.
The reac tion channels can couple to each o ther, re su ltin g in
enhancem ent a t sub-barrier energies even if negative Q-values are
involved. The to ta l H am iltonian for the in te rac ting nuclei can be
w ritten as a norm al term w ithout coupling plus a coupling term Vcpi
[Das83a], thus
H H0 + K + V + VCpi (2-2-13)
29
where the H 0 is an in trinsic H am iltonian for two colliding nuclei, the
K and V are relative kinetic and potential energies of the in teracting
system .
Assuming th a t there are only two channels, the problem is reduced to
solving the following two coupled Schrödinger equations in a single
spatial dimension x [Das83, Lan85],
r - H 2 d2 ~\[ +V(x ) - E° ] u° = "F(x)ui (2-2-14)
r - K 2 d2[ 2^ ^ + “ Ei J Ux = -F(x) u 0 (2-2-15)
where p is the reduced m ass of projectile and Ea is the energy of the
particu lar channel a. F(x) is the coupling streng th which depends on
the details of the interaction. For simplicity, F(x) has been taken as a
constant F for the following discussion.
The boundary conditions are
Ua5aoe-ik«x + raeik«x
ta e 'ikaX
X — +°o
X —> -oo(2-2-16)
where k a = A/ 2pEa//i2 is the asym ptotic wave num ber, the r a and t
are the reflection and transm ission coefficients.
a
Then equations (2-1-14) and (2-1-15) can be solved by diagonalising a
m a trix
M' 0 F '
_ F -Q _(2-2-17)
where Q = Ex - E0 is the reaction Q value.
30
The eigenvalues of M are
Ad = | ( - Q +V4F2 + Q 2 ) (2-2-18)
The transm ission probability for a given l is given by
T, = £ l t j 2 = X P ;T ([E,V,(x) + Ai] (2-2-19)
w here TZ[E, Vz(x) + A;] are the tran sm ission probabilities for the
potential barriers of V/(x) + A* a t the energy E, and
F2F 2 + A+
(2-2-20)
are the weight factors for individual channels.
T aking the parabolic b a rrie r approxim ation, TZ[E, Vz(x) + Az] for each
channel can be w ritten analytically as (refer to Eq. (2-2-6))
Tz[E ,V z(x) + ^ ] 1
1 + exp[2iz
h co0(B0 +
i n + m 22pR2 + V E)]
(2-2-21)
The fusion cross-section can then be w ritten as
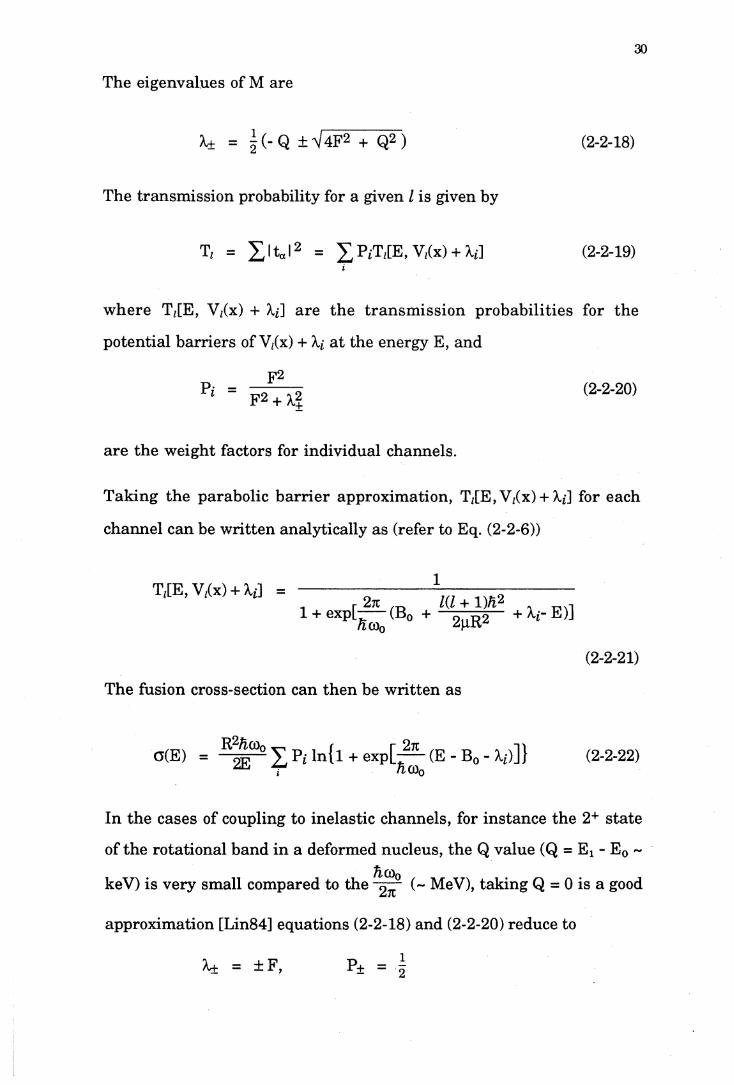
0(E) = ^ ^ ^ P i l n f l + e x p t ^ f E - B o - A i ) ] } (2-2-22)i ftCOo
In the cases of coupling to inelastic channels, for instance the 2+ state
of the rotational band in a deformed nucleus, the Q value (Q = El - E0 ~h(x)0
keV) is very small compared to the - ^ r (~ MeV), taking Q = 0 is a good
approxim ation [Lin84] equations (2-2-18) and (2-2-20) reduce to
A± = ± F , P± = i
31
The to tal transm ission probability is simply equal to the sum of two
transm ission probabilities through two split barriers w ith the heights
o fB0±F . Thus
T = T+ + T.
= i [ { l + exp[-^~ (B0 + F- E )])'1 + {1 + e x p t ^ (B0 - F -E )]} '1]Tt COq Tt COq
Fig. 2-2-5, in panels a and b, illu stra tes the splitting of the b a rrie r
heights and the changes of the transm ission function as a result of the
coupling. The transm ission function is m ainly affected around the
in itial barrier B0, T is increased in the region below the barrier B0 and
reduced above B0. Panels c and d of th is figure show the effects of a
non zero Q- value on the transm ission function and the weight factor
P+. In the case of positive Q-value both the effective barriers are a t
lower energies th an in the case of Q = 0; however the weight factor P.
is reduced and the P+ is increased. In the case of negative Q value the
changes of effective barrie rs and the weight factors are all reversed
compared w ith the case of positive Q-value. This gives us a picture of
a d istribution of discrete fusion barrier heights. The weight factors P/
m ay be in te rp re ted as the probability of encountering the fusion
b a rrie r of height B0 + Details of the distribution of fusion barrie r
heights will be discussed in the next section.
In general, the en trance channel can couple to m ore th a n one
reac tion channel. The m atrix M in Eq. (2-2-17) becomes NxN
dim ensional m atrix [Das83a], w here N is the num ber of reaction
channels. There are N eigenvalues and hence N effective fusion
barrie rs . D etails of the N excited sta tes of the reacting nuclei are
requ ired to uncouple the equations. The d istribu tion of b a rrie rs

32
energy
Bq + "K— Bq
energy
Fig. 2-2-5: Discrete barrier distributions resulting fromcoupling reaction channels. P indicates the probabilities of encountering the barriers during fusion and T illustrates the transmission coefficients (Z = 0). See text for the details.
becomes more complicated as N increases. However, as pointed out
[Bec88], there is always at least one negative eigenvalue, hence a lower
barrier compared to B0. Due to the exponential dependence of the
transmission probability upon the energy difference (E - B0+^, ), at
33
sub-barrier energies, the net effects of the barrier splitting is always to
enhance the sub-barrier fusion. It can be shown [Lan84] th a t the
fusion cross-section a t energies below the Coulomb b a rr ie r is
enhanced, compared with th a t of no coupling, by a factor of
y P; exp(- X , ~ ) . (2-2-23)i f r t o o
At energies E » B0 + K , there is little effect on the total fusion cross-
section re su ltin g from the channel coupling, and the classical
formula of (2-1-14) is again appropriate [Lin84].
2.3 FUSION BARRIER AND ANGULAR MOMENTUM DISTRIBUTIONS
M any different models have been proposed to explain sub-barrier
fusion cross-sections. Some of the models may have quite different
physics in p u t and hence give different b a rr ie r d istributions. The
coupled channels approach, for exam ple, gives a series of discrete
fusion b a rrie rs , w h ilst s ta tic deform ation and ZPM m odels give
co n tin u o u s b a r r ie r d is tr ib u tio n s . Some a rb i t r a ry b a r r ie r
d istributions, such as flat [Vaz74, Vaz78, Ste88, Ste89, Ste90, Ste91]
and G aussian [Rei85] d istribu tions, have also been in troduced a t
va rious tim es for specific reasons. Even though the b a rr ie r
d istribution predicted by different models is very different, they often
y ield s im ila r c ro ss-sec tions and rep roduce the d a ta w ith in
experim ental uncertain ties (typically -10%). The question then arises
as to w hether the fusion excitation function carries all inform ation
about the fusion b a rrie r distribution. Rowley et al [Row91, Row91a,
Wei91a] published papers which dem onstrated th a t the distribution of
fusion b a rrie rs can be determ ined uniquely from high precision
experim en ta l fusion excitation function a t energies a round the
Coulomb barrier.
2.3.1 Fusion Barrier Distributions
As m entioned above R eisdorf e t al, Vaz e t al and Stelson e t al
in troduced the concept of continuous b a rrie r d istribu tions in th e ir
analyses of the fusion cross-sections for heavy ion systems, the fusion
cross-section, then, can be w ritten as
oo
o(E) = J o(E,B) D(B) dB (2-3-1)
where o(E,B) is the cross-section for barrier B. For instance, a(E,B) can
be taken from expression (2-2-7) in Wong model [Won73], or from the
classical form ula of Eq. (2-1-14) in sharp cut off model. The quantity
D(B) is the b a rrie r d istribution, which represen ts the probability of
encountering a barrie r a t height of B for the interacting nuclei, and
oo
J D(B) dB = 1 (2-3-2)
34
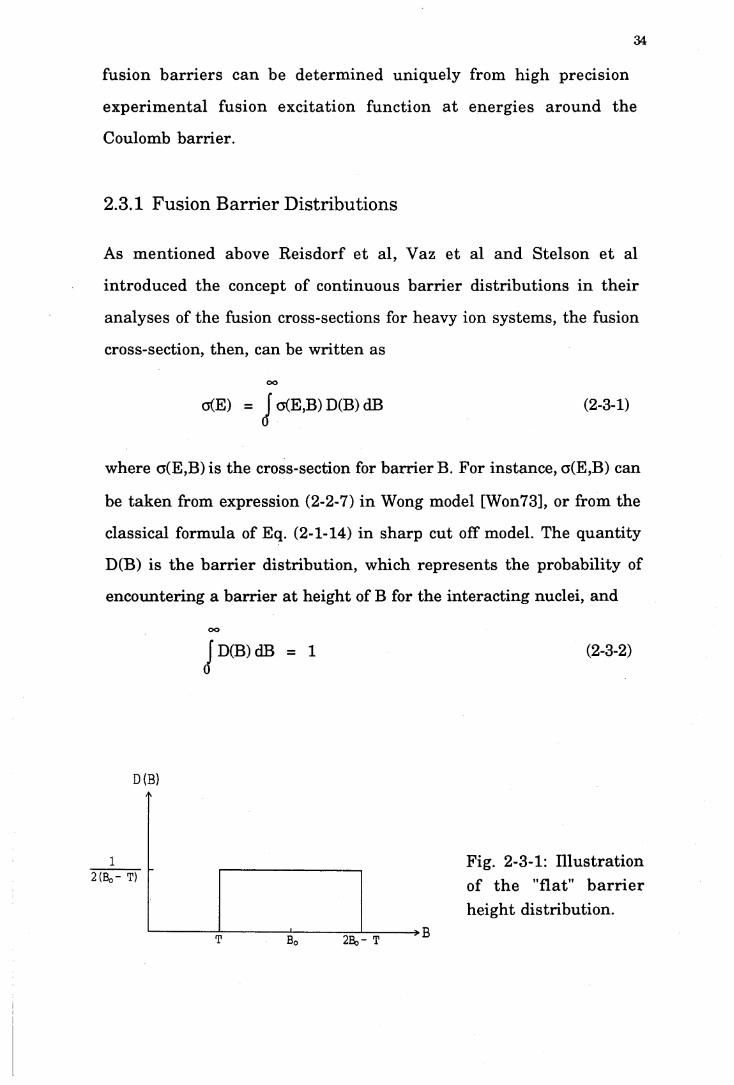
D(B)
Fig. 2-3-1: Illu stra tion of th e "flat" b a rr ie r height distribution.
35
Fig 2-3-1 shows a flat barrier height distribution [Ste88, Ste89, Ste90,
Ste91], and D(B) can be written as
D(B) 2(B0 - T)
0
T < B < 2B0 - T
elsewhere(2-3-3)
Using the classical model, for given energy E, and barrier B we have
g(E,B)ttR2( 1 - | )
l 0
E > B
E <B
(2-3-4)
then the fusion cross-section is
0 E < T
o(E) = <
tzR2 f, B m tcR2(E - T)2 2(B0- T ) J 1 ' E ) " 4(B0 - T)E T < E < B0 - T
2B„ ■ T
7CR22(B0 -T ) i (1 - | ) d B = " R2(1 - E > 2B0-T
(2-3-5)
which shows that at energies higher than 2B0 - T the cross-sections
revert to the classical expression of (2-1-14), and hence Eg is linear to
E. However, at energies around the Coulomb barrier, T < E < 2B0 -
T, the V Eg is linear in E, not Eg. Thus
V 5 S 5 " (e‘ t) (2-3'6)
Hence, i f the experimental data ^ E g v s E is plotted around the barrier
region (particularly cross-sections from ~10 mb to -200 mb), T can be
found from the zero intercept point of a straight line f it to the data. B0
(mb/MeV)
36
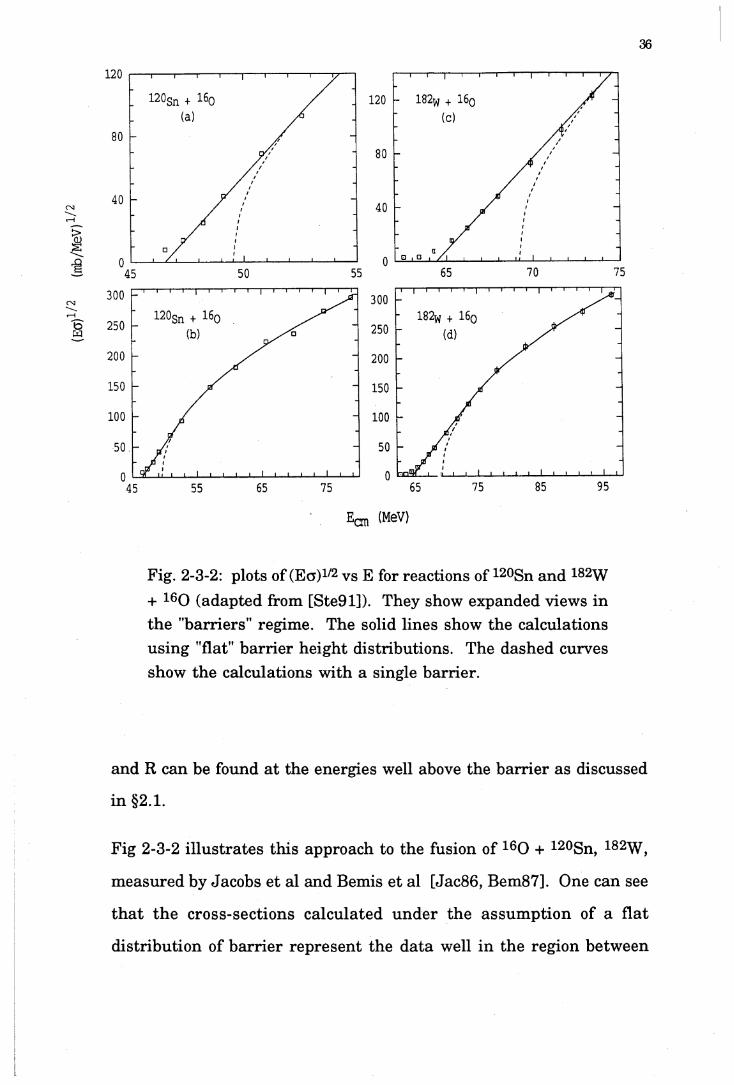
Fig. 2-3-2: plots of (Eg)1/2 vs E for reactions of 120Sn and 182W + 160 (adapted from [Ste91]). They show expanded views in the "barriers” regime. The solid lines show the calculations using "flat" barrier height distributions. The dashed curves show the calculations with a single barrier.
and R can be found at the energies well above the barrier as discussed
in §2.1.
Fig 2-3-2 illustrates this approach to the fusion of 160 + 120Sn, 182W,
measured by Jacobs et al and Bemis et al [Jac86, Bem87]. One can see
that the cross-sections calculated under the assumption of a flat
distribution of barrier represent the data well in the region between

(a) a
37
~10 mb to -200 mb level. There are still large variations in the far sub
b a rrie r region (< 10 mb). It may be due to the sharp cut off of the
b a rr ie r d is tr ib u tio n a t the th resh o ld energy T. A G au ssian
m odulation has been in troduced [Ste90] to sm ooth the b a rr ie r
distribution. Instead a single T there is a distribution, thus
M(T' - T) (2tzQ?) 12exp[-(T - T)2
2Q 2 ](2-3-7)
and
D(B)
B
r M(T’ - T)2(B0 - T )
(2-3-8)
where T is obtained from expression (2-3-6) described above, and Q is
the width of the m odulation to be adjusted to fit the data. When Q —» 0,
D(B) -» 1/2(B0 - T) reduces to the flat barrie r d istribution expression
(2-3-4).
B (MeV)
Fig. 2-3-3: F la t (dashed lines) and m odulated f la t (so lid cu rv es) b a r r i e r h e i g h t d is tr ib u tio n s for the reactions of 100Mo + 32S and 36S (adapted from [Row91]).

38
Fig. 2-3-3 shows the modulated flat barrier distribution with which the
calculated cross-sections fit the experim ental da ta (-10% ) for the
reactions of 32,36s + lOOMo [Pen83].
U sing th e m odula ted fla t b a rr ie r d is tr ib u tio n s , S te lson e t al
successfully reproduced the fusion cross-sections for a num ber of
reactions [Ste90]. However, as they pointed out in their paper, some
o ther b a rrie r d istributions, such as a G aussian d istribu tion or the
classical d istribution resu lting from static deform ation, fit the da ta
equally well.
2.3.2 Experimental Determination of The Distribution of Fusion Barrier Heights
S tarting with the classical model [Row91, Row91al, see equation (2-1-
15), with a distribution of barriers, one obtains
D ifferentiating both sides of the above equation with respect to E, we
get
E
Eg(E) (2-3-9)
(2-3-10)0
D ifferentiating again, we get
d2(EG)dE2 = 7lR2 D(E) (2-3-11)
or
(2-3-lla)

39
This tells us th a t the barrie r distribution can be found if the fusion
excitation function is known. In o ther words the probabilities of
encountering a barrier B can be determined by the second derivative of
Eg a t energy E = B.
For the simple case of a single barrier B0, the cross-section is given by
Eq. (2-1-14) for energies h igher th an B0, and is zero for energy less
th an B0, we have
d(Ea)“ dE-
ttR2
0
E > B0
E < B0(2-3-12)
th en
1 d2(Ea) tiR2 dE2 5(E - B0) (2-3-13)
hence
D(E) = 5(E - B0) (2-3-14)
which obviously rep resen ts the b a rrie r d istribu tion in th is single
b a rrie r case.
I t has been shown [Row91, Row91a] th a t the above consideration can
easily be extended to a set of discrete barriers, thus
d i2 ?|r = I w£8(E - Bj) (2-3-15)i
and
w; = 1 (2-3-16)
where wi are the probabilities of encountering fusion b arrie r heights
B/, and the D(B) can be w ritten as

dz(E
ö)/d
üz
d(Eö
) /dQ
40
D(B) = £ wj8(B - Bj) (2-3-17)i
Thus in the simple sharp cut off model the double differential of E g
reproduces the discrete set of barriers.
Fig. 2-3-4 illu stra tes the above procedure of determ ining the barrie r
d istribu tion in the simple cases; one b a rrie r (left panel) and two
barriers (right panel) w ith equal weight.
energy
Fig. 2-3-4: In the sharp cutoff model the b a rrie r heigh tdistributions can be extracted [Row91a].

41
However, the above did not consider barrier penetration effects, whichd2(E g)
smooths the function dE2
S tarting with the cross-section expression (2-2-7) of Wong model which
considered the quantum tunnelling, we now obtain
1 d2(Ea) 7tR2 dE2 G(x)
(Äa)) (1 + eX)2(2-3-18)
w here
x = f £ (E-B) h co
(2-3-19)
It can be shown th a t
J G(x) dx = 1
and when /ioo -» 0, the G(x) —> 6 (E - B), hence the expression (2-3-18)
becomes the sharp cut off expression (2-3-13). Fig. 2-3-5 shows G(x) for
----- Wong- - - O ptical model
Fig. 2-3-5: The single b a r r i e r h e i g h t d is trib u tio n has been sm oothed by b a r r ie r p e n e tra tio n (ad ap ted from [Row91al).
E (MeV)

42
the reaction of 32S + 64Ni. From this Figure one can see that the 8
distribution of the single barrier has been smeared by quantum
tunnelling over an energy region with a FWHM of 0.56/10).
For a distribution of barriers, the g is given by the Eq. (2-3-1), then the
second derivative of Eg gives
1 d2(Ea)7cR2 dE2 EKE) = J G(x) D(B) dB (2-3-20)
w here D(E) is barrier height distribution smoothed by quantum
tunnelling.
In terms of the discrete barrier height distribution
D(E) = X w‘G(x‘} (2-3-21)
wherex, = — (E - Bj) (2-3-22)
hm
Hence, the smoothed barrier height distribution D(E) can be extracted
directly if the fusion excitation function is known.
Rowley et al have extracted the barrier height distribution for fusion of
154Sm + 160 , using the data measured by Stokstad et al [Sto801. This
is illustrated in Fig. 2-3-6 along with the calculated barrier height
distributions, derived from coupled channels and classical static
deformation models. One can see that the barrier distribution of the
smoothed three-channel coupling approaches the classical one. More
generally, Nagarajan et al [Nag861 have shown that, in the limit of
including all members of rotational band, the coupled channel model

43
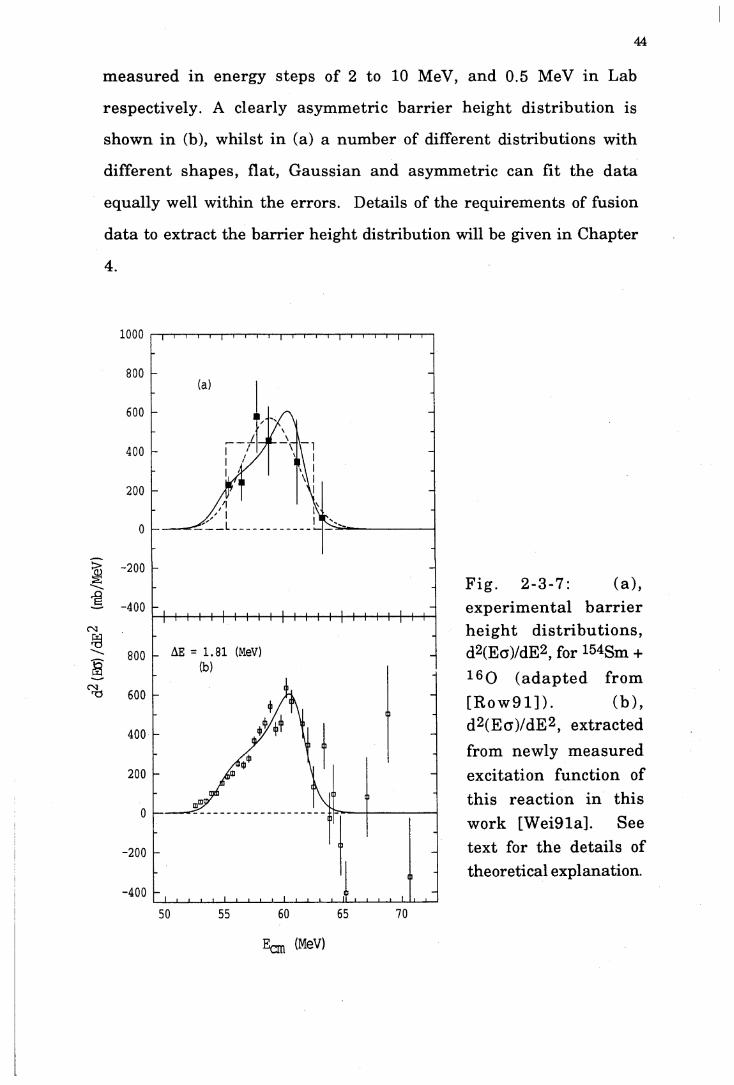
g iv e s th e s a m e b a r r i e r d is t r ib u t io n a s t h a t fro m th e c la s s ic a l s ta t ic
d e fo rm a tio n m ode l.
H o w e v e r , a s p o in te d o u t in [W ei9 1 a], to e x t r a c t th e b a r r i e r h e ig h t
d i s t r i b u t i o n w i th s u f f ic ie n t a c c u ra c y r e q u i r e s h ig h s t a t i s t i c a l
a c c u ra c y to g e th e r w ith sm a ll, p re c ise ly d e te rm in e d e n e rg y s te p s . A
c o m p a r is o n o f th e e x tra c te d b a r r ie r h e ig h t d is tr ib u t io n s fo r re a c tio n s
o f 154S m + 160 fro m tw o s e ts o f fu s io n d a ta w ith d if fe re n t p re c is io n s
a n d e n e rg y s te p s is i l lu s t r a t e d in F ig . 2-3-7. T h e e r ro rs on th e p o in ts in
(a ) a n d (b ) a r e a s s o c ia te d w i th r a n d o m e r r o r o f ~5% a n d ~1%
re s p e c tiv e ly [S to80 , W ei9 1 a]. T h e fu s io n d a ta u s e d in (a) a n d (b) w e re
F ig . 2-3-6 : C a lc u la te d
fu s io n b a r r i e r h e i g h t
d is t r ib u t io n s c o m p a re d
w ith th e e x p e r im e n ta l v a lu e o f d 2 ( E a ) / d E 2
(a d a p te d fro m [Row 91]).
(a ) , t h e tw o -c o u p le d -
c h a n n e l ; (b), th e th r e e
c o u p le d - c h a n n e l (so lid
c u r v e ) a n d c l a s s i c a l
b a r r i e r d i s t r i b u t i o n
(d a s h e d c u rv e ) d u e to
th e s t a t i c d e fo rm a t io n
o f th e ta r g e t 154S m .60
Eon (MeV)
154Sm + 160 (2-channel f i t )
154Sm + 160 (3-channel f i t )
55 65
44
m easured in energy steps of 2 to 10 MeV, and 0.5 MeV in Lab
respectively . A clearly asym m etric b a rr ie r height d istribu tion is
shown in (b), w hilst in (a) a num ber of different d istributions with
d ifferen t shapes, flat, G aussian and asym m etric can fit the da ta
equally well w ithin the errors. Details of the requirem ents of fusion
da ta to extract the barrier height distribution will be given in Chapter
4.
_ AE = 1.81 (MeV)
F ig . 2-3-7 : (a),ex p erim en ta l b a rr ie r h e ig h t d is tr ib u tio n s , d2(Eo)/dE2, for l 54Sm +160 (a d a p te d from [R o w 9 1 ]) . (b) ,d 2(E a )/d E 2, ex tracted from newly m easured excitation function of th is reac tion in th is work [W ei91a]. See tex t for the deta ils of theoretical explanation.
E o n (MeV)
2.3.3 Fusion A ngular Momentum D istributions45
D ifferen t fusion m odels pred icted d ifferen t an g u la r m om entum
distributions. For instance, in the sharp cut off model, as discussed in
§2.12, the angular m omentum is sharply cut and the distribution is a
trian g u la r, w hereas in the Wong model the edge of the triangle is
smoothed due to the penetration of the fusion barrier (see Fig. 2-3-8).
L
L
Fig. 2-3-8: C alcu la tedpartial-w ave distributions in sh a rp cu to ff m odel (solid line), and w ith the b a r r i e r p e n e t r a t i o n (dashed line).
Fig. 2-3-9: C alcu la tedpartial-w ave distributions for fusion of 144Sm + 40Ar a t incident energy of 178.9 M eV w ith d i f f e r e n t models: coupled-channels (solid line), WKB w ith a G a u s s i a n b a r r i e r d istribu tion (dashed line) and WKB w ithout barrier f lu c tu a tio n or coupling (do tted line). All the c a lc u la tio n s y ield th e sam e fusion cross-section of 330 mb. Adapted from [Rei85].

46
This sm oothing resu lts in higher angular m om entum being brought
in to the fused system , which may substan tia lly change the decay
mode of the CN; for example, the probability of fission can be increased
significan tly [Cha86, New88]. However, for a given bom barding
energy, the fusion cross-section may be equally well reproduced by a
num ber of fusion models w ith different fusion angu lar m om entum
distributions. Shown in Fig. 2-3-9 are the calculated fusion angular
m om entum d istribu tions w ith different models for the reaction of
40Ar + 144Sm a t the energy of 178.9 MeV and all the models yield about
the sam e total fusion cross-section of 330 mb. Therefore, it has been
generally considered th a t angular m om entum distribution provide a
much more sensitive test of the models [Wuo91].
However, it should be noticed th a t if a complete excitation function is
available the range of applicable models is restricted and became more
restric ted for high precision data.
2.3.4 Experimental Determination of Angular Momentum Distributions of Fusion
Considerable effort has been invested in determ ining fusion angular
m om entum distribu tions experim entally, through m easurem ents of
y-ray m ultiplicities [Wuo91, Van83, Gil85, Gil90, Lei86], isomer ratios
[DiG90], fission fragm en t an g u la r d is trib u tio n s [Van86, M ur86,
Bac85], a-partic le angular d istributions [Bor86] and elastic scattering
[Lei86, Kon87, Uda85].
H ow ever, none of the above m ethods d irec tly yields the spin
d istribution in fusion. For instance, the first two m easure properties
of evaporation residues, a fte r several particles have been em itted.
47
T here are also problem s in converting y-ray m u ltip lic ities in to
angu la r m om enta. The fission and a-decay studies m easure only a
p a rt of the CN decay, and again (as discussed below) rely on models to
in te rp re t the angular distribution. Details of the decay processes are,
therefore, required in the transform ation of m easured da ta to the
fusion angu lar m om entum (usually the m ean values </> and <Z2>).
For instance, to obtain the </2> from the m easured fission fragm ent
a n g u la r d is trib u tio n s W(0), the following expression of s tan d ard
transition-state theory is used
W(180°) <Z2>W(90°) ~ 1 + 4K2 (2-3-23)
w here the K0 is the w idth of the d istribution of the spin projection
along the sym m etry axis. However, th is can only determ ine the ratio
of <Z2>/K^. To deduce <Z2> one has to assum e, or otherwise determ ine,
a value for Kq which is dependent on the fusion-fission decay process
a t the saddle point (or alternatively to deduce the K0 by assum ing a
value of <Z2>). Since the extraction of the angular momentum depends
on K0, which depends on the tem p era tu re of CN, deta ils of the
dynam ical process of fission are then required. For exam ple, the
num ber of particles em itted before fission, which is often determ ined
by the nuclear viscosity, affects the tem perature . S trictly speaking,
th is m ethod does not deduce the angular m om entum brought into the
compound nucleus in fusion bu t the angular m om entum a t the saddle
point ju s t before fission. This method, of course, is only valid when
fission is the dom inant decay process. Sim ilarly, the m ethods of
m easuring y-ray m ultiplicities and isom er ratios relate to the angular
m om enta of the residues, and are only valid w hen the fusion-
evaporation decay process is dom inant.
48
The m ethod of deducing the fusion angular m om entum d istribution
from elastic scattering does not rely on the decay channels. However,
i t m easures the to ta l reaction cross-section, including quasi-elastic
processes in addition to fusion. The reduced /-d istribution thus also
includes the effect of peripheral collisions. To deduce the angular
m om entum of fusion, an assum ption th a t the shapes of fusion Z-
d istribution and the total reaction /-distribution are the same has to be
taken. U ncertainty in the fusion /-distribution is again introduced by
th is assum ption.
A nother m ethod, in troduced by [Bal83, Rei85, Bal86, Das86], is to
deduce the fusion an g u la r m om entum d istribu tion directly from
fusion excitation functions. Even though th is method was proposed a
num ber of years ago, it has not been successfully used because of a
lack of fusion da ta w ith sufficient high precision [Rei85]. D etails of
th is m ethod are given as follows.
S ta rtin g w ith the expression (2-1-10) for the fusion cross-section a t
centre of m ass energy E, the first derivative of Eg w ith respect to E is
d(Ea)dE (2-3-24)
where the sum in expression (2-1-10) has been replaced by an integral.
Now consider dT,(E)/dE. Notice th a t for a given / the transm ission
coefficient depends on energy E, and the variables E and / in T,(E) are
correlated to some degree. For instance, in the sharp cut-off model,
the transm ission coefficients are determ ined only by constant A, the
difference betw een the inciden t energy and the heigh t of the /-
dependent barrier:

49
A = B; - E B0i a + m 2
+ 2 |iR 2(2-3-25)
W hen A > 0, TZ(E) =0, for A < 0, TZ(E ) =1, as show n in Eq. (2-1-11).
In a m o re g e n e ra l case , for ex am p le , in th e W KB a p p ro x im a tio n ,
T/(E) can be w ritte n as
TZ(E)
1 + exp (+ ^ ^ I A ( r ) l d r )
(2-3-26)
w h e re
w V x r , v Id + DH2 „A(r) - V 0(r) + 2 |ir2 ' E (2-3-27)
If we a ssu m e th a t th e re is only a c o n s ta n t te rm ^ 2pR 2~ re la tin g Bz
to B 0, in o th e r w ords, th e sh ap e of th e p o te n tia l an d position of b a r r ie r
a re in d e p e n d e n t of l, we g e t
* / \ 7 ( \ M T?Az(r,E ) - V 0(r) + 2pR^ ” E
a n ddT/(E) _ dT;(E) dA/(r,E) _ dTz(E)
dE ” dAz(r,E ) dE ” dAz(r,E )
a n ddTz(E) _ dTz(E) dA/(r,E) _ (21 + 1 )h2 dTz(E)
d / “ dAz(r,E ) dl ~ 2pR 2 dAz(r,E )
(2-3-28)
(2-3-29)
(2-3-30)
F rom (2-3-29), (2-3-30) we have
dTz(E) _ 2pR 2 dTz(E) dE ' (21 + 1)A2 d/
(2-3-31)

50
Inserting this in (2-3-24), we get
(2-3-32)l = 0
since Too = 0, we obtain
(2-3-33)
Since th is expression holds for any barrier, in a situation where a
distribution of barriers is involved and the fusion radius changes with
ba rrie r, the g rad ien t of the m easured function E g determ ines the
average transm ission coefficient and the fusion radii, for / = 0, thus
If one assum es th a t the R does not change with the barrier, which is
approxim ately true for spherical in teracting nuclei, then
Thus the average of T 0(E) can be determ ined from the m easured
fusion cross-section data.
For deformed nuclei, the assum ption made above is incorrect because
the b a rrie r heights and the fusion radii change w ith the orientations
of the in terac ting nuclei. For instance, in the reaction 154Sm + 160 ,
the estim ated changes of the fusion radii range from +1.5 fm and -0.5
fm com pared w ith the average fusion radius of -10.56 fm (details of
these es tim ates are given in C hap ter 5). The m axim um e rro r
oo
= J 7tR2(B) T0(B,E) D(B) dB = jt R2T0(E) (2-3-34)0
(2-3-35)

51
estimated in the above case would be -30% on T0(E). However, this is
only for the extreme case, and it only occurs when the energy is far
lower than the Coulomb barrier, when only the lowest barrier, hence
the largest fusion radius contributes to the fusion. In the region of
energy well above the barriers the T0(E) - 1 and expression (2-3-34)
gives the average fusion radius R2.
Fig. 2-3-10 shows the T0(E) extracted from a recent measurement of the
fusion excitation functions [Wei91a] for the reaction 154Sm + 160. The
AE = 0.9 (MeV)
Fig. 2-3-10: Values of T0 (d(Ea)/dE/7iR2) extracted from newly measured fusion cross-sections in this work. The dashed curves indicated the maximum error of ±30% in the extracted T0, reflected the maximum uncertainty of 15% in R used in the extraction.
52
uncerta in ty of ±30% for th is case is also shown in th is figure by the
dashed lines in the barrier region.
An im portan t aspect of this m ethod is the ability to extract the full
fusion /-d istribution from the data. The /-dependence of the average
transm ission coefficients a t fixed energy TZ(E) can be simply extracted
m aking use of equation (2-3-26); thus
/(/ + l ) h 2T/(E) =: T0(E - -2uR2 - ) (2-3-36)
Therefore, the fusion /-distribution for any E can be determ ined if the
excitation function, and hence T0, is m easured over an appropriate
range in
E ’ /(/ + 1 ) K 2 2pR2 (2-3-37)
Knowing the transm ission coefficients TZ(E), the </> and <1(1 + 1)> can
be calculated, thus
h 2 ,</> = —— / (2/+ 1) TZ(E) d/
2pEo cr(2-3-38)
andoo
h 2 r</(/ + !)> = —— /(/ + 1)(2 /+ l ) T z(E)d/ (2-3-39)
2fiEa 0J
It can be shown th a t simple analytical expressions can be obtained for
</> and <1(1 + 1)>,
</>pR2
h 2 Eg j VE 'a(E ’)
2|J.R2 1ä ^ ( E ' E ) + 4
.dE’ (2-3-40)
53
and
<1(1+1 )> = j E 'afE 'JdE 'h zE<3 or
(2-3-41)
D etails of the extraction of fusion angular m om entum distributions
from the fusion d a ta and the uncerta in ty of th is m ethod will be
discussed fu rther in C hapter 5.

Chapter 3Experim ental Methods
The experim en ts in th is work were perform ed a t the ANU,
D epartm en t of N uclear Physics. Heavy ion beam s of 160 were
accelerated by the 14 UD Pelletron tandem electrostatic accelerator,
and were used to irrad ia te targets of 154Sm and 186W. The fusion of
these reactions was studied w ith the energy range of the beam
particles from 58 MeV up to 110 MeV in the lab system.
M easurem ent of the fusion reaction products involved the detection
and identification of particles. The principles of the detector operation
and the techniques of p roduct iden tification and separa tion are
described in the f irs t th ree sections. The specific experim ental
ap p a ra tu s and the experim en tal m ethods used in th is work are
described in §3.4 and §3.5 respectively.
3.1 THEORY OF DETECTOR OPERATION
I t is common in nuclear physics to detect particles by the ionization
produced in selected m ateria ls. To collect the re su lta n t charge an
electric field m ust be applied across these m aterials, which may be in
a solid, liquid or a gaseous state. They require, however, the following
two characteristics: 1. they m ust be free of charge carriers; 2. charges
created by ionization should be capable of rapid and easy movem ent

55
tow ard the electrodes w ithout recom bination and trapping. Thus,
solid m etals or insulators cannot be used for this purpose because the
two features do not sim ultaneously exist in either of them.
Semiconductors and gases are found to be amongst the best m aterials
to use in detectors. Two common types are the Si surface b arrie r
detector (SSB) and the gas ionization chamber, and both were used in
this work. The basic theory of their operation together with the details
of their construction, where appropriate, will be described.
3.1.1 Silicon Surface-Barrier Detectors
A Si surface-barrier (SSB) detector consists of a p-n junction (see for
example Fig. 3-1-1). In th is junction the charge carriers have been
com pletely rem oved and a strong electric field established . The
junction region is therefore a perfect charge-carrier-free region and is
used to detect the energetic and ionising particles. W hen a reversed
b ias, V, is applied across the junction , th is depleted region is
extended. For a th in detector, the extended region could be across the
whole depth of the detector. Electron-hole pairs, which are created by
the passage of an ionising particle , are quickly sw ept out of th is
region, giving a rapidly rising ou tpu t pulse from the detector, w ith
excellent tim ing properties. The average energy needed to create an
electron-hole pair is very small (about 3.6 eV). Good energy resolution
(about 16 keV for 5.4 MeV a-partic les [Eng74] ) is obtained in th is
detector because of the high s ta tis tica l accuracy of the collected
charge, resu lting from a large num ber of electron-hole pairs created
by the inc iden t charged partic le . The h e ig h t of the pulse is
proportional to the energy loss of the partic le in the depletion

56
region. Because of the high stopping power the detector can be m ade
very thin. For instance, for a 5 MeV a-partic le in Si the stopping
power is ~0.6 MeV/(mg/cm2) and the stopping range is -6 mg/cm2
[Nor70]. Typically detectors can be made varying from 20 pm to
several mm in th ickness. E nergetic charged partic les can pass
through, or stop in, the detector depending on its thickness and the
energy of the particles.
Si detectors are widely used owing to their excellent energy resolution,
linear response to the charged particle 's energy, compact size, wide
range of th ickness, the ability to produce very th in energy loss
detectors and th e ir ease of operation in vacuum of the scattering
cham ber.
toam plifier
+
Ohmic contact
Depletion layer
Fig. 3-1-1: Schem atic represen ta tion of a surface b arrie r silicon detector (adapted from [Coc68]).

57
However, there are also some disadvantages with this type of detector.
One of the disadvantages which affected the application in th is work is
the degradation of the detector performance after exposure to intense
radiation. Typically exposure to ~107/cm2 heavy ion particles [Mar78,
Eng74]) results in the deterioration of the energy and time resolution
accompanied by an increase in leakage current. For th is reason the
SSB detectors cannot be used effectively a t angles close to the beam
direction because of the intense elastic scattering.
All SSB detectors used in this work were m anufactured a t the ANU,
following the prescription of England [Eng74]. The thickness of these
detectors was 200 pm, which was sufficient to stop all the species of
in terest.
3.1.2 Gas Ionization Chamber
Fig. 3-1-2 is a rep resen ta tion of a simple para lle l-p la te ionization
cham ber. E lectrons which have been produced by the passage of a
charged particle through the sensitive gas volume are detected. The
electric field, which separates the electrons and positive ion pairs, is
norm ally e ither parallel or perpendicular to the particle 's trajectory.
The streng th of the field is high enough to move the electrons before
recom bination w ith the positive ions can take place and low enough
th a t an electron cannot gain sufficient energy to ionize the gas. Fig. 3-
1-3 shows how th e signal size varies w ith the applied voltage.
Ionization cham bers operate in the fla t p la tea u of the voltage
independent region. Because positive ions are m uch heavier th an
electrons, they d rift m uch more slowly. It takes about a hundred
tim es longer to collect the positive ions than the electrons. Ionization

sign
al s
ize
(log
scal
e)
58
+ v e
- v e
Fig. 3-1-2: Illustration of a simple parallel plate ionization chamber (adapted from [Eng74]).
BreakdownIonisationRegion
ProportionalRegion
GeigerRegion
(with Quenching)
field strengthFig. 3-1-3: Variation of signal size with applied voltage in a parallel plate ionization chamber (adapted from [Eng74]).
59
counters are, therefore, often operated in pulse mode. Only the fast
component of the output current, due to the motion of the electrons, is
utilized. However, the pulse height of the electron component of the
induced signal, m easured in the external circuit, is proportional to
the drift distance of the electrons in the field, hence, the pulse height
is dependent on the position of the particle track in the detector. This
deterio rates the energy resolution. A solution to th is problem was
found by placing a Frisch grid [Bun49] across the detector which
screens the anode from the area between grid and cathode. In this
way the induced charge is due only to the motion of electrons between
the grid and the anode. The pulse height is then independent of the
particle track position.
The signal on the anode of an ionization cham ber from a charged
particle is dependent on the num ber of prim ary electrons produced.
Charged particles not only lose kinetic energy from ionisation bu t also
from excitation of gas molecules. Therefore the relationship betw een
the output pulse height and the energy loss of the charged particle in
the gas depends on the com petition betw een the ion isation and
excitation processes. However, i t tu rn s out tha t, to a high degree of
accuracy, the num ber of electrons produced depends linearly on the
energy loss of the particle in the gas, if the particle energy is higher
th an a few hundred keV [Ste83], This linear response to the energy
loss of a charged particle m eans th a t there is a fixed m ean energy
required to create one electron-ion pair. Therefore, the output pulse
height is proportional to the energy deposited in the gas by the charged
particles. On the average, the am ount of energy needed to create an
electron-ion pair in isobutane gas is about 30 eV. Energy resolutions

60
of 0.7% (FWHM) have been routinely achieved by using ionisation
chambers [Ste83].
3.1.3 Gas Proportional Counter
As the electric field increases in an ionisation cham ber the electrons
gain more energy between collisions. Once this energy is sufficient to
ionize the gas, electron m ultiplication takes place and a Townsend
avalanche is created. The detector works in the avalanche m anner in
the proportional region, as shown on Fig. 3-1-3. The gas amplification
is dependent on the field and can be substantial (up to 106). The output
of the pulse is still proportional to the energy deposited in the gas by
the p a rtic le s b u t the charge collected is the p roduct of the
m ultiplication factor and the prim ary charge created by the particles.
This type of detector is therefore called a gas proportional counter.
Because of the m ultiplication, the m inim um energy deposited into the
gas, required to create a sufficiently large output pulse to be identified
from the noise, is m uch reduced compared w ith th a t required in the
ionisation detector. Since the energy loss of a particle in the chamber
is rela ted to the ionisation path and the gas pressure, the pressure
and the pa th length in a proportional counter could be significantly
reduced compared w ith th a t of ionisation counter. It tu rns out th a t in
the proportional counter a few Torr of isobutane and a few mm of
ionisation path is sufficient to detect energetic heavy ions (such as the
ones of in te res t in th is work). The counter, therefore, can be made
very th in (low gas pressure and th in entrance window) so th a t the
particles can easily pass though it. This feature has been frequently
u tilised in the tim ing m easurem ents. Detail of th is feature and the
principle of the detector will be discussed below.

61
PARALLEL PLATE AVALANCHE COUNTER (PPAC)
One type of gas proportional cham ber is the parallel plate avalanche
counter consisting of two parallel plate electrodes ju s t a few mm
apart. These parallel plates are often made of th in m etallized plastic
foils. The particles en ter the PPAC perpendicular to the plates. The
rise time, corresponding to the collection time of the the electrons in
the sensitive volume of the detector, is related to the drift velocity of the
electrons. A high drift velocity is achieved in PPAC by using a high
electric field, E, and a low gas pressure, p, in o ther words a high
reduced electric field, E/p (values of E/p are typically a few hundred
V/cm/Torr). These rapidly moving electrons form the fast component
of the output pulse in an external circuit, rise tim es of a few ns being
easily obtained. Because of the excellent tim e resolution, easy
tran sm ission of the particle , simple design and operation of th is
detector, it has been widely used as a s ta r t detector in time of flight
m easurem ents for particle identification.
MULTIWIRE PROPORTIONAL COUNTER (MWPC)
To fu rther reduce the total thickness of a PPAC one of the electrodes or
both of them could be replaced by one or two th in wire planes [Lei81].
This detector, which was first introduced by C harpak in 1968 [Cha68],
is called a m ultiw ire proportional counter.
The wire plane is norm ally m ade of wire 10 ~ 20 jim in d iam eter
spaced by 1 ~ 2 mm. The typical distance between two electrodes is 3
mm. By applying a potential to the wire plane, the electric field across
the gap in the vicinity of the wire varies approxim ately as the inverse
of the distance, r, from the centre of the wire. The electric field

62
becomes essen tia lly constan t a t a distance of a few ten th s of a
m illim etre from the wire plane [Bre77a]. The field close to the surface
of the wires can be about two orders of m agnitude higher than th a t in
the constant region. Different gas m ultiplication processes may occur
in the vicinity of the anode compared to the constant field region.
At h igher gas p ressu res, resu ltin g in lower a tta in ab le reduced
electric fields (E/p) in the constant region, the electrons released in the
gap by ionizing particles slowly drift tow ards the anode wires, and
s ta r t an am plification process only when the field streng th allows
them to undergo inelastic collisions with the gas molecules - therefore
in the region of the wires. The collection time of the electrons depends
on th e ir in itia l positions and takes several tens of nanoseconds,
depending on the drift velocity in the particu lar gas.
At low gas p ressures (about 1 ~ 5 Torr) the reduced electric field
s tre n g th in the constan t field region reaches values of several
hundreds of V/cm/Torr, which is very close to th a t reached in PPACs
operating w ith the same gases and pressures [Bre77,Bre82]. Electrons
released in the sensitive volume can gain enough energy to s ta r t an
avalanche in the constan t field region [Maz83, Bre79]; a second
amplification step occurs when the electron sw arm reaches the wires.
B ecause th e m u ltip lic a tio n of th e p rim a ry e lec trons v a rie s
exponentially w ith the distance from the anode to the position where
the p rim ary electrons were created, these prim ary electrons will be
m ultiplied by different factors for differing in itia l positions. Taking
th is into account, Mazor and Ribrag did a calculation [Maz83] which
shows th a t 90% of the signal observed on the anode comes from the
prim ary electrons originating in the first 8% of the distance from the
cathode to the anode. In m ost cases, the prim ary electrons released
63
on the track of a particle in the cathode region will experience a force
toward a single wire. Therefore, most of the secondary electron
swarm will be drifted toward and be collected on this single wire. In
the rare cases when electrons are produced exactly mid way between
the two wires each wire will produce a pulse with similar size.
This feature is of great use for position measurement. A very fast rise
time (a few ns) and excellent timing resolution of the order of 100 ps
(FWHM) [Bre82, Bre79] can be achieved with such a MWPC. Because
of the rather poor AE resolution (40% FWHM), due to energy
straggling of the charged particle in the gas resulting in a fluctuation
in the number of electron-ion pairs produced, these detectors are
mainly used to provide time signals and position information as will
be discussed below. On the average only about 26 ion pairs for 5.4 MeV a-particles and about 260 ion pairs for 27 MeV 160 are produced in 2
Torr isobutane with a gap of 3.2 mm [Bre82, Nor70, Bro59].
3.1.4 Position Sensitive Gas Counter
As discussed above most of the signal in a MWPC comes from a single
wire of the wire plane. If one can identify from which wire the signal
comes, the position where the particle enters the detector may be
determined. Two alternative methods are commonly used for this
purpose.
One method divides the charge along a resistive wire [Ful73, Ata70]
and the ratio of the signals from the two ends of the wire is a measure
of the wire position. The second method uses the finite propagation
time of electromagnetic signals in an LC delay line [Gro70]. The
propagation time difference between the ends of the delay line

64
represents a m easure of the wire position. This method uses standard
tim e-to -p u lse -h e ig h t (TAC) or tim e-to -d ig ita l converter (TDC)
electronics.
If we simply identify the wire which collects m ost of the secondary
electrons, the position resolution is equal to the separation between
two wires. The space between two wires is typically 1 mm, hence the
resolution is 1 mm. More accurate position resolution can be obtained
by comparing the charge collected on neighbouring wires. A position
resolution of 80 pm was obtained by using this method. The details of
this technique can be found in Bre82, Bre83 and references therein.
3.2 PARTICLE IDENTIFICATION TECHNIQUES
Following a heavy ion reaction m any different products can enter the
detecting system. To detect and select the species of in terest, a reliable
partic le identification technique is required. P a ram ete rs such as
energy, energy loss, time of flight and position are used individually or
in com bination to id en tify th e de tected p a rtic le s . Common
identification techniques are discussed.
3.2.1 AE-E
In th is id en tifica tio n m ethod bo th the energy loss (AE) in a
transm ission detector and the total kinetic energy (E) in a stop detector
are used. The ra te of energy loss (-dE/dx) of a non-relativistic ion in a
m edium is given by the Bethe-Bloch equation.
r,2/m ev2\
°c ^ i n ( — ) (3-2-1)

65
W here m e is the electron re s t m ass, I is the average ionization
potential of the m aterial, v is the velocity of incident ion and Zeff is the
effective charge state of the incident ion.
The effective charge sta te Zeff is used to account for the fact th a t heavy-
ions constantly change charge-state while traversing the m edium ,
and the Zeff does not depend on the initial charge state of the ions after
the ions have passed through a certain pa th of the m aterial. For
example 65 MeV Cu reaches it's equilibrium charge state (~18) after it
has passed through a carbon foil of ~15 pg/cm2 [Shi86, Zai84]. The Zefp
increases in itia lly as the particle energy increases and reaches the
atomic num ber of the ions Z when the energy of ions is sufficiently
high. For instance the Zeff of O beam particle becomes close to 8 a t an
energy larger th an 80 MeV. Hence, for a particle with m ass A and
atom ic num ber Z, -dE/dx in itia lly increases w ith energy as Zeff
increases. However, th is increase will be offset a t some point due to
the term of (1/v2). The -dE/dx will have a m axim um a t th is point and
decrease roughly as 1/v2 and thus as 1/E.
Showing on Fig. 3-2-1 is -dE/dx vs energy for various nuclear species
in isobu tane gas, tak en from the tab u la tio n s of N orthcliffe and
Schilling [Nor70]. F ission fragm ents (Z~40, A -100), which are
positioned near the m axim um of the -dE/dx curve have the largest
energy loss and hence are well separated from all other groups of
in te re s t in the AE-E plane. The electrons are alm ost fully stripped
from the elastically scattered beam particles, due to their high energy
(for instance the energies of 160 beams are 58 to 110 MeV in this work)
and relatively light mass. The scattered beam particles are positioned
on the tail of -dE/dx, well after the peak, and only lose a small am ount
of energy, so they are separated from other particles in the AE-E plane.

66
Fission Fragments
Target Recoils
Evaporation Residues
E (MeV)
Fig. 3-2-1: Illustration of energy losses (dE/dx) of different ion species passing through in isobutane gas. Taken from the tables of [Nor70].
However the evaporation residues (ER) of mass (-180) produced by
reactions with 160 ions at bombarding energies accessible with the 14
UD accelerator have low energy (about a few MeV). Because of their
low velocity, they are incompletely stripped, and thus have a low
-dE/dx. Fig. 3-2-1 shows that beam particles with the same energy as
typical evaporation residues have a similar -dE/dx. Such particles are
produced by scattering at apertures in the beam lines and can be
much more intense than ER at forward angles (a few degrees).
Though it may be possible to reduce this flux of slit-scattered beam
particles, it is often difficult to totally eliminate them. The AE-E
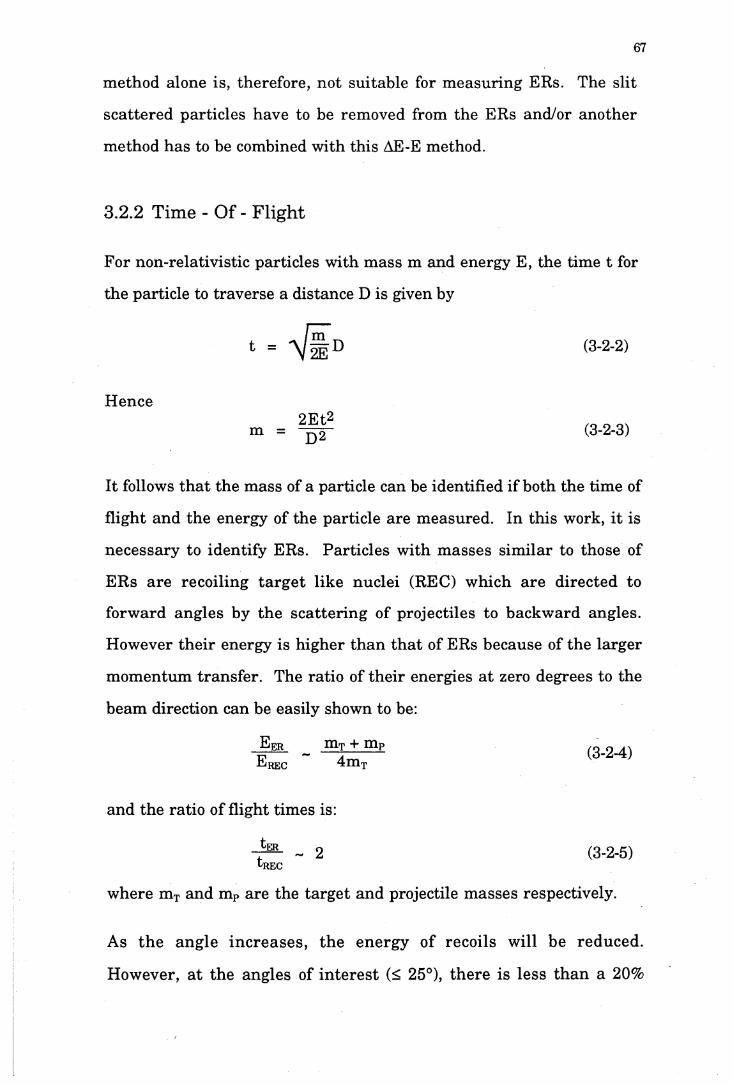
67
m ethod alone is, therefore, not suitable for m easuring ERs. The slit
scattered particles have to be removed from the ERs and/or another
method has to be combined with this AE-E method.
3.2.2 Time - Of - Flight
For non-relativistic particles with m ass m and energy E, the time t for
the particle to traverse a distance D is given by
(3-2-2)
Hence2 E t2
m - D 2(3-2-3)
It follows th a t the m ass of a particle can be identified if both the time of
flight and the energy of the particle are m easured. In this work, it is
necessary to identify ERs. Particles w ith m asses sim ilar to those of
ERs are recoiling ta rg e t like nuclei (REC) which are directed to
forward angles by the scattering of projectiles to backw ard angles.
However the ir energy is higher th an th a t of ERs because of the larger
m om entum transfer. The ratio of their energies a t zero degrees to the
beam direction can be easily shown to be:
EPr mT + nip E rec 4mT (3-2-4)
and the ratio of flight tim es is:
^ER~ 2 (3-2-5)
-'REC
where mT and mP are the target and projectile m asses respectively.
As the angle increases, the energy of recoils will be reduced.
However, a t the angles of in te res t (< 25°), there is less th an a 20%
68
reduction of the ir energies compared to th a t of the recoils a t 0°. This
resu lts in less th an a 10% increase of their time of flight (TOF) and
hence, it causes no problem in the identification of the ERs from the
recoils by their TOFs.
At energies higher than the Coulomb barrier, fewer targe t recoils are
em itted a t the angles of in te res t because the projectiles can easily
overcome the b a rrie r and fusion reactions take place. At energies
lower th an the Coulomb barrier, the recoils are well grouped by their
time of flight owing to their well defined energies.
Evaporation Residues
186^ + 16q 65 cm f l ig h t path
F ission Fragments
. . . . A=186 -
A=100
Scattered Beam P a rtic les
E (MeV)
Fig. 3-2-2: The TOF vs energy for various nuclei. The beam and recoil particles w ith well defined energies are indicated by solid circles and the other typical particles of in te rest are indicated by heavy solid lines.

69
The recoils can also be m ultiply-scattered when passing through the
ta rge t and their energy can be significantly reduced after th is process
if the target is thick. Calculations show th a t m ultiple scattering, with
the th in targets (—40 pm/cm2) used in this work, plays an insignificant
role, and the sm earing of the energy and angular d istribution of the
recoils can be ignored [Sig74, Hin82].
Thus in principle ERs can be identified uniquely by m easuring the
energy and time of flight as shown in Fig. 3-2-2. In practice, a direct
m easurem ent of ERs by th is m ethod is precluded a t the necessary
forward angles, because of the very intense elastically scattered beam
particles. Possible solutions to m easuring the ERs a t the very forward
angles are discussed in the following sections.
3.3 PARTICLE SEPARATION TECHNIQUES
The in itia l m om entum of a compound nucleus form ed following
fusion is the same as th a t of the projectile. The final momentum of an
evaporation residue is changed due to the emission of light particles
from th e com pound nucleus du rin g the de-excita tion process.
However, the m om entum of the ligh t partic les is re la tively sm all
com pared w ith th a t of the projectile, so th a t the deflection of the
evaporation residue is small. Hence evaporation residues concentrate
a t very small angles to the beam direction. For example, experim ental
m easurem ent shows th a t the full width a t ha lf m axim um (FWHM) of
the ERs for the reaction I^O + ^-^S rn to be about 3 degrees in the
laboratory system . It, therefore, becomes essential to m easure the
ERs very close to the beam direction if high precision experim ental
da ta are desired. The problem is then raised th a t any type of detector

70
cannot be directly placed a t such small angles because the intensity of
the elastic scattering O l/s in 49/2) is too strong. Si detectors can be
example, in the work of [Hin82], the Si detector, which was used to
m easure the ERs, had to be changed after m easuring for only few
hours and the m easurem ents were restricted to angles larger than 2°.
Gas counters may not be damaged bu t the counting rate m ay greatly
exceed th e ir counting capabilities. A lternatively , very low beam
in tensity m ay be used resulting in very long collection tim es. This
causes a m ajor difficulty which has to be overcome in order to
increase the precision of the m easurem ent of ERs.
To solve th is problem it is necessary to separate the elastic scattered
beam particles (EL) from the ERs. This should be done in such a way
th a t the separation does not resu lt in a loss of ERs. The common
separation techniques are described as below.
3.3.1 Magnetic Deflection
W hen a charged p a rtic le p a sse s th ro u g h a m agne tic field
perpend icu larly , a force is experienced by the partic le and it is
deflected from its in itia l direction as shown in Fig. 3-3-la . The
charged particle travels along a circular orbit perpendicular to the
m agnetic field. The force, F, applied to the particle and the radius, R,
of the orbit are related by
dam aged im m ediately if they have been placed close to 0°. For
F = Bqv (3-3-1)
(3-3-2)
where B is the m agnetic field, m, q, v are the m ass, charge, velocity of

30
20
10
0
-1030
20
10
0
-1030
20
10
0
-10
71
1 1 1
x \ x x
X x V X
X x x \ x
X X X
X X X )/
(a)
_i______ i______
i i
. X X X
X X X
x x x B
X X X
X X XV
m,v,q
i i i i |
_______ L____ n
/(b)
I i
Vm,v,q
i 1V > V0 v =
1 1 = V0 v<v0V f
X X ___ < k x x
X X ___ d x x x
/ p vRX X X \
CA D( X X X
x x x : : x x x
/( 0
i i
m,v,q
• i-10 0 10
Fig. 3-3-1 Principle of a positively charged particle separation technique by using magnetic and electric fields, (a) The charged particle travels in a magnetic field which is perpendicular to the paper and enters the paper from above. The particle is deflected to the left, (b) The charged particle travels in an electric field which is parallel to the paper and from left to the right. The particle is deflected to the right, (c) Positive charged particles passing through EXB fields. Those particles with velocity v0 are not deflected and those particles with different velocities will be deflected to the left or right depending on whether their velocity is bigger or smaller than v0.
distance (mm)

72
the partic le . However the m om enta of the ERs and elastically
scattered particles are sim ilar and their charge distributions overlap,
m aking th is method unattractive in this work.
3.3.2 Electric Deflection
Fig. 3-3-lb shows a charged particle passing through an electric field,
E. The forces, F, and the deflection, As, are:
F = Eq (3-3-3)
lE ^ L 2 EL2As = 2m ^ = 2 (W )2mq (3'3'4)
Where L is the length of the electric field region.
Hence the deflection is proportional to l/(m v)2 and mq. Since the ERs
have s im ila r m om entum to e lastica lly sca tte red partic les , the
separation of ERs from elastic scattering is proportional to mq. Then:
Ä S E R _ m ERflER
Asel mELqEL
Thus, in the case of projectile relatively lighter th an the target, the
ERs will be separated from elastic scattering by applying an electric
field because the mq of ERs is larger than th a t of elastically scattered
particles.
This m ethod has been used to separate ERs from elastically scattered
particles [Fre83, Fre83a, Beg85, Sch88, Cha88] bu t the efficiency of
transm ission and detection are not easily determ ined and varies from
reaction to reaction. This is because ERs have a wide range of charge
s ta te s , as well as a range of velocities. They are thus deflected
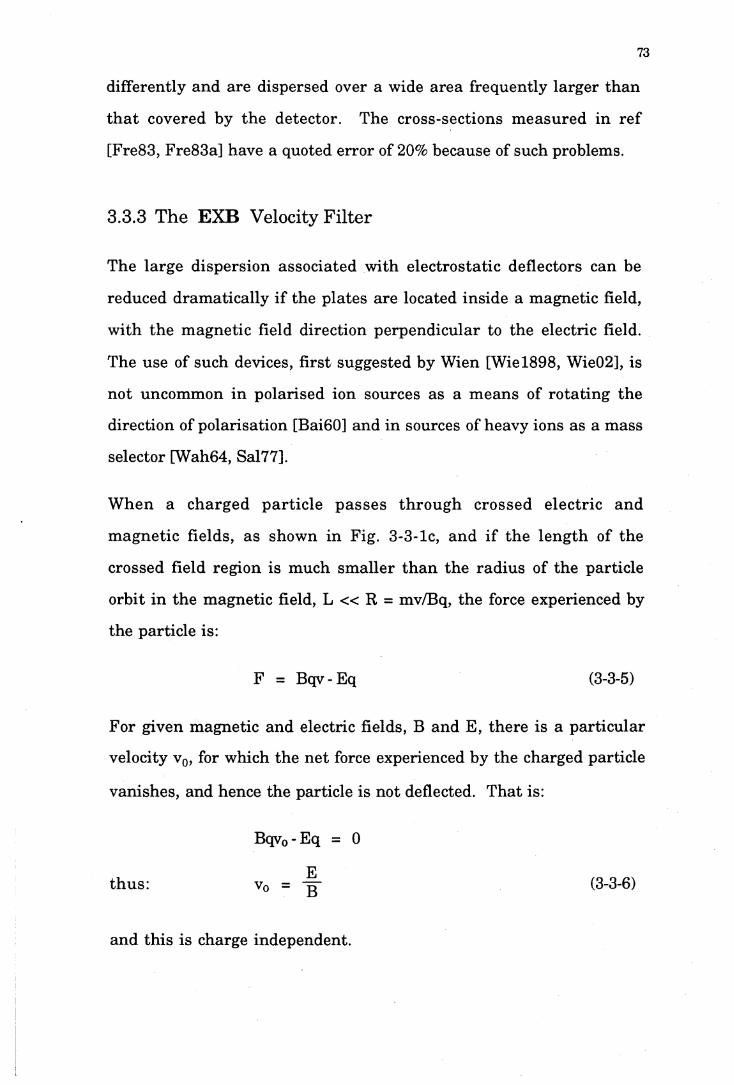
73
differently and are dispersed over a wide area frequently larger than
th a t covered by the detector. The cross-sections m easured in re f
[Fre83, Fre83a] have a quoted error of 20% because of such problems.
3.3.3 The EXB Velocity Filter
The large dispersion associated w ith electrostatic deflectors can be
reduced dram atically if the plates are located inside a m agnetic field,
w ith the m agnetic field direction perpendicular to the electric field.
The use of such devices, first suggested by Wien [W iel898, Wie02], is
not uncommon in polarised ion sources as a m eans of ro tating the
direction of polarisation [Bai60] and in sources of heavy ions as a m ass
selector [Wah64, Sal77].
W hen a charged p artic le passes th rough crossed electric and
m agnetic fields, as shown in Fig. 3-3-lc, and if the leng th of the
crossed field region is much sm aller th an the rad ius of the particle
orbit in the m agnetic field, L « R = mv/Bq, the force experienced by
the particle is:
F = Bqv - Eq (3-3-5)
For given m agnetic and electric fields, B and E, there is a particu lar
velocity v0, for which the net force experienced by the charged particle
vanishes, and hence the particle is not deflected. T hat is:
Bqv0 - Eq = 0
Ethus: v0 = -g- (3-3-6)
and th is is charge independent.
74
In principle, therefore, if one chooses the ratio of E/B, those particles
w ith velocity of v0 m ay be selected out by detecting them in the ir
original direction. The other particles are deflected from their original
direction e ither to the left side or to the righ t side, depending on
w hether the velocities of the particles are larger or sm aller than v0.
If we choose the E/B to let v0 be equal to the in itia l velocity of the
compound nucleus formed by a fusion reaction, th a t is
E m PvPB v° mp+niT (3-3-7)
where m p , u lt are the masses of the beam particle and target, the vp is
the velocity of beam particle, then the ERs will peak on the central axis
of the filter and all elastic scattering will be deflected to the left side.
Inserting (3-3-6) in (3-3-5) one may rewrite (3-3-5) as:
F = E q ( - ^ - l ) (3-3-8)v O
or: F = B q(v-v0) (3-3-9)
If we compare Eq. (3-3-8) with (3-3-3) and note th a t the velocity of ERs is
not too far from the in itia l velocity of the compound nucleus, we will
see th a t the force applied to the ER can be considered as an electric
force only, bu t be reduced by a factor of (v/v0 - 1). For those ERs with
the velocity of v0 the net force is reduced to zero, hence no deflection a t
all, even though they have a wide range of charge distribution. Due to
the em ission of ligh t particles during the de-excitation process, the
velocity of ERs spreads in a range of v0±Av0, and it has been shown
th a t the Av0/v0 is less than 30% [Hin82]. For those ERs with a velocity
not equal to v0, even though the net force is not reduced to zero, it is
reduced to less th an 30% of th a t in a simple electrostatic deflector.

75
Therefore the dispersion of ERs after passing through a Wien filter
will be m uch less th an th a t a fter passing through an electrostatic
deflector. In other words, the ER will be peaked around their original
direction w ith a small dispersion in angle.
If we compare equation (3-3-9) with (3-3-1) and note th a t in th is work
the velocity of elastic scattered beam particles, vEL, is about 10 times
bigger th an v0 (vEL/v0 = (mP + mx)/mP), we see th a t the electric force
experienced by the elastically scattered particles is only about 1/10 of
the m agnetic one. Thus, the net force applied to these particles is like
a purely m agnetic one but the strength of the force is reduced by about
10%, depending on the m asses of projectile and ta rg e t. If one
increases the m agnetic and electric field to m aintain the same ratio of
E/B = v0, the ERs will be still peaked in the original direction of particle
m omentum, bu t the deflection of the elastically scattered particles will
be increased, and the ir separation from ERs increases.
To conclude th is section, the velocity filter is a very suitable device to
separa te the ERs from the elastically scattered partic les for high
precision ER cross section m easurem ents.
A velocity filter [Wei91] has, therefore, been designed and constructed
for th is purpose.
3.4 EXPERIMENTAL APPARATUS
All experim ental m easurem ents have been carried out w ithin a 2 m
d iam eter sca ttering cham ber. Movable arm s inside the cham ber
allowed the velocity filter and associated detectors to be moved over a
wide range of angles. The movement of the arm s could be controlled

76
from outside of the chamber, and the angle could be reproduced to an
accuracy of -0.01°. The apparatus used is described in the following
sections.
3.4.1 Velocity Filter
As has been discussed in the la s t section, to m easure ER cross-
sections w ith high precision it is essential to separate ERs from ELs
and th is can be achieved by using a velocity filter. To build the velocity
filter the following factors were taken into account:
1. To achieve a sufficient streng th of m agnetic and electric
fields in a relatively big space to allow all the particles to be
transm itted by the velocity filter.
2. A small volume so th a t it can operate in the 2 m chamber.
3. Sufficiently ligh t w eight so th a t the movable arm will
operate, and be easy to move over a wide range of angles in
the forward direction.
It was found th a t requ irem ent 1 conflicted w ith 2 and 3 to some
degree, since m eeting w ith requ irem ent 1 requires more space and
increasing the weight. Therefore it becomes necessary to achieve the
strongest electric and m agnetic fields possible w hilst also m inim izing
the volume and weight. Fig. 3-4-1 shows the plan and section draw ing
of the velocity filter. Details of this filter are given as follows.
MAGNETIC DESIGN
As discussed in §3.3.3, if we keep E/B = v0, the elastically scattered
beam particles are m ainly deflected by the m agnetic field and ERs

77
peak a t the central axis of the filter. The strength and the length of the
m agnetic field determ ined the basic charac ter of the separa tion
function of the filter. Calculations showed th a t if a m agnetic field of ~
0.15 Tesla or stronger and an electric field up to 15 kV/cm or stronger
could be established w ithin a length of 200 mm, it would be sufficient
to separa te the ERs from the elastically scattered beam particles
w ith in the available energy and partic le ranges which could be
provided by the 14 UD accelerator in this laboratory.
P L A N S E C T I O N AT B - B( HALF SECTION )
Fig. 3-4-1: View of the velocity filter showing the positions of the m agnets and electrostatic deflector p lates. The high voltage feedthroughs and the field cups used to support the deflector p lates are illustrated.

M.F
. (T
esla
) E.
F.
(kV/
cm)
dist
ance
(m
m)
78
- 2 0 . 0
distance (mm) M.F. (Tesla)
Fig. 3-4-2: M easured m agnetic field and calculated electric field inside the velocity filter, (a) The cross-section of the filter, the lines and symbols indicated the regions where the electric fields in (b) have been calculated and the m agnetic fields in (c) were m easured, (b) Calculated electric field, the solid line represented the field across the middle of the electrodes, the dashed line is 5 m m from the m iddle as ind icated in (a), (c) M easuredm agnetic fields across the filter a t the position shown in (a), (d) M easured m agnetic fields on the central axis of the filter.
dist
ance
(m
m)
79
P erm an en t sam arium -cobalt m agnets* were chosen to build the
velocity filter. These commercial m agnets are 100 mm long, 60 mm
wide and 5 mm thick and they are m agnetised along the 5 mm
dimension. A soft iron yoke was designed to maximize the m agnetic
field. Four of these m agnets are then attached in pairs to the faces of
the soft iron yoke to give an overall length of 200 mm. Thin soft iron
spacers are needed to join the ends of each pair of m agnets; th is
resu lts in only a small reduction in field strength in the vicinity of the
joint. A relatively large distance between the two m agnets is needed to
place the electrodes inside the m agnetic field, b u t increasing the
separa tion resu lts in a w eaker m agnetic field. A prelim inary te s t
showed th a t when the distance between the two m agnets was 20 mm
and placed inside a proper yoke, a m agnetic field of 0.22 Tesla could be
achieved. This field would be reduced to 0.14 Tesla if the distance was
increased to 40 mm. Considering the space needed to house the
electrodes, the 40 mm distance between the m agnets has been used.
The m easured m agnetic fields are shown in Fig. 3-4-2 (c) and (d). A
uniform field, to w ithin a few percent is achieved over 20 mm on either
side of the filter central axis. Along the filter the magnetic field starts
to fall a t about 10 mm from the ends. The field in the vicinity of the
joints of the pairs of the m agnets is reduced by -10%, bu t only over a
distance of -5 mm.
THE ELECTRIC FIELD DESIGN
The ideal electric field should be uniform both in the horizontal and
vertical directions (refer to figure 3-4-2 (a)). In order to achieve this
uniform ity the dim ensions of the electrodes m ust be m uch g rea ter
* Rare-earth cobalt magnets, HICOREX-B, made by Hitachi Magnets Corp.

80
th an their separation, if a pair of flat plates are used. However, inside
the velocity filter the space is limited. The width of electrodes which
could be accommodated is about 20 mm but the space needed between
the two electrodes is about 20 mm as well. The electric field generated
by such flat electrodes is non-uniform in the horizontal as well as the
vertical direction. The calculated electric field shows th a t it changes
very quickly, even a t locations very close to the central axis. The non
uniform ity of electric field is caused by edge effects in which electric
flux escapes from the inside of the electrodes. If one could restore the
electric flux by reducing the distance between the two electrodes a t the
edge, the electric field would be more uniform in the middle.
F u rther studies showed th a t a much more uniform electric field could
be achieved by using a pair of Id shaped electrodes. The calculated
electric field for th is geometry is shown in Fig. 3-4-2b. The electric
field produced in the middle of the electrodes is only slightly lower
th an th a t for flat plates which are only 20 mm apart, bu t now the field
is uniform over a wide range. Field variations of up to 10% occur a t
displacem ents of 10 mm in either direction. Therefore, for the region
of in te res t of the filter both the electric field and m agnetic field are
sufficiently uniform; the typical elastically scattered particles and ERs
are deflected horizontally w ithin the filter by about 5 mm from the
c en tra l axis and constra ined geom etrically to ~3 mm vertica l
d isplacem ent.
As well as providing good electric field uniform ity in the region of
in terest, the electrode shape produces a reduced field inside the legs of
the EL Thus ERs of very low velocity which en ter into th is weak field
region experience a ne t force back towards the central axis because
the m agnetic field is still uniform. Therefore, the weak and sharply
81
reduced electric field inside the leg of FI may play a role in grouping
the position of very low energy ERs. The electrodes are made of
stainless steel and all the edges of the electrodes are properly rounded
to avoid electrical breakdown.
THE HIGH VOLTAGE PERFORMANCE
A high po ten tial difference up to 40 kV is requ ired betw een the
electrodes. This can be achieved by supplying +20 kV to one electrode
and -20 kV to another. It is not an easy task to produce th is high
voltage w ithin the lim ited space of the filter and to prevent sparking
during long running periods; a single spark can create thousands of
"noise signals" in the electronics m easuring position, AE and tim ing
in the MWPC.
Q uite often, un d er a good vacuum of ~ 10 '6 Torr, high voltage
breakdow n occurs on the surfaces of insulators, in other words, the
vacuum itse lf is a m uch b e tte r "m aterial" th an all o ther kinds of
insulators. Hence the best high voltage perform ance is achieved by
m inim ising the use of insu lato r m aterial. In the filter it is only used
in the electrode supports and in the high voltage connectors which
pass through the wall of the m agnet yoke. Field cups (see Fig. 3-4-1)
w ith 5 mm gaps are placed around the insulators to ensure th a t there
are no regions of high field s tren g th a t the insu lator-conductor
boundaries. W ith the exception of these field cups, the m inim um
voltage-to-earth distance is 6.5 mm, between the electrodes and the
m agnets. Breakdown in th is region is prevented by covering the rough
surfaces of the m agnets, m anufactured by sin tering , w ith smooth
stainless steel sheets, which are recessed into the walls of the yoke. All
other edges are appropriately rounded to make sure th a t the strength

82
of electric field everywhere in the filter is less than th a t across the field
cups. Hence, the breakdown, if there is any, should occur across the
field cups which were designed to hold more than 20 kV.
Because the filter is designed to m ount on the movable arm inside the
2 m diam eter scattering cham ber and is required to move over a wide
angu lar range, -15°< 0 < 30°, the high voltage connection from the
cham ber w alls to the filte r m ust be able to accom m odate th is
movement. It is equally im portan t to ensure th a t the connections,
especially the flexible parts, do not break down when the high voltage
is applied to them. This has been done by using two rigid m etal rods (6
mm in diam eter) to link to the filter and to pass through the wall of the
2 m chamber; these rods are then linked by a flexible conducting loop
of b ra id (3 mm in diam eter) for each connection. All the jo in ts,
between the rods and the flexible loops or between the rods, are covered
by appropriately rounded alum inium cylinders, 15 mm in diam eter.
As the filter is ro tated , the loops tigh ten or droop depending on the
d irection of m otion. The photographs show the velocity filte r
assem bled inside the 2 m diam eter scattering chamber. On the bottom
of each conducting loop is a stainless steel weight which prevents the
loops from touching each other due to the a ttractive electric force and
the tension in the loops themselves.
High voltage testing of the velocity filter was carried out in the 2 m
diam eter chamber; the vacuum inside was about IO'6 Torr, and up to
±20 kV was supplied to the electrodes of the velocity filter. Voltage
breakdow ns were recorded on a ch art recorder. In itia lly , a few
breakdow ns were recorded w ith ±20 kV applied, bu t no breakdowns
were recorded after the system had been "conditioned", by keeping
voltage on the filter for about 24 hours.
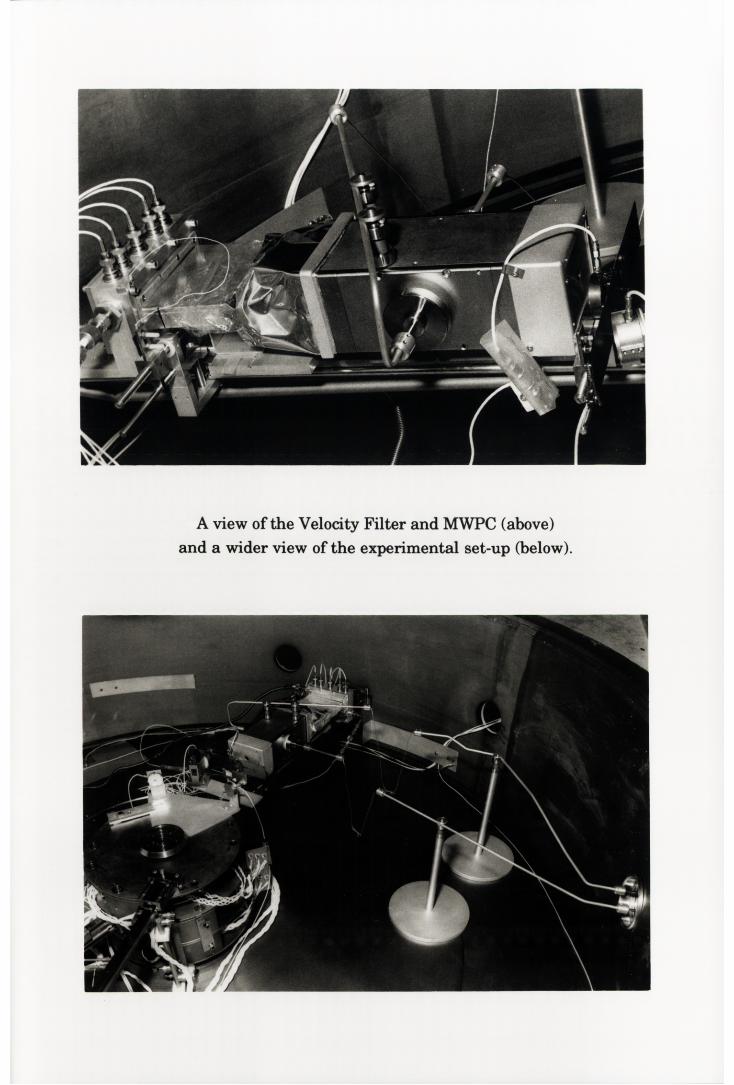
A view of the Velocity Filter and MWPC (above) and a wider view of the experimental set-up (below).

Si
3.4.2 The Position Sensitive MWPC
A position sensitive m ulti wire proportional counter (MWPC) was
located 20 cm behind the velocity filter to detect the ERs after they had
been separated from the in tense elastic scattering by the filter. The
ta rge t was firstly irrad iated by a low intensity pulsed beam with 1 ns
wide bursts every 533 ns. The ERs were identified by their energy loss
AE(s), position and time of flight (TOF). The TOF was m easured by
using the MWPC to give the s ta r t signal and a radio frequency (RF)
signal, related to the beam pulse, to give the stop signal. After the
position of the ELs had been determ ined in the MPWC, the ELs could
be physically blocked by a "finger" ju s t in front of the entrance window
of the MWPC and then the beam was increased to the required level
w ithout exceeding the allowable counting ra te of the detector. A
detailed description of this detector and the blocking of the ELs is given
in this section.
The following are the basic requirem ents for this detector.
1. A large a rea to accept all particles tran sm itted by the
filter. To do th is an active area of the detector of about 100
mm X 20 mm is required.
2. Reasonable tim e resolution to enable identification of all
incoming particles by their TOF.
3. Position sensitivity and good position resolution over the
100 mm length to localise the ERs and ELs.
4. Reasonable AE(s) resolution, to identify the ERs in the
presence of low energy beam particles scattered from the

85
s lits and the co llim ator, w hich cause a con tinuous
background in TOF and position.
5. In order to achieve requirem ents 2 and 3 the detector m ust
work with a very low gas pressure (around 2 Torr).
These requirem ents would not be too difficult to meet in the detection
of high energy heavy ions, like Fission fragm ents w ith energy of
hundreds of MeV, bu t th is is not the case for ERs. Actually, the
requirem ents are ra th e r difficult to meet due to the very small energy
loss of the heavy (A ~ 170) and "slow" (caused by their low energies, a
few MeV) ERs in the gas at the pressure of about 2 Torr.
For example, the technique which has been used to obtain the position
is to m easure the finite propagation time of electrom agnetic signals in
an LC delay line. Having a good fast rise time signal (a few ns) from
the w ires is, therefore, essen tia l to get good position resolution.
However, since the p rim ary ionization of ERs is very low, up to 10
tim es sm aller th an th a t of fission fragm ents, a m uch h igher gain,
thus, a much stronger reduced electric field E/P, should be achieved
for this detector than for a fission fragm ent detector [Maz83]. To reach
th is strong field requires very careful work a t every stage of designing
and constructing the detector.
A nother difficulty is in m eeting the requirem ent 4. Because scattered
beam particles have a continuous energy d istribution some of these
particles, w ith very low energy, could have sim ilar velocities to those
of ERs and be transm itted to the same position as ERs. Although the
energy of these particles is very small the ir energy loss (AE) is not so
sm all, so they are not well separated from the ERs since the AE
resolution of the MWPC is ra th e r poor.

86
Slit scattering has been m inim ised by not having collimators in the
scattering chamber. However, a small am ount of slit scattering still
arises from other, more distant, components of the beam line. At the
level of a few mb of ER cross-section, the intensity of this slit scattering
is low compared w ith the ERs and is not troublesome. W hen the ER
cross-section is below the 1 mb level, th is sm all am ount of slit
scattering will have a comparable in tensity w ith the ERs.
It is, therefore, necessary to find a way to m easure more param eters
of the ERs for those m easured a t sub-barrier energies. This has been
solved, in th is work, by coupling ano ther detector cell behind the
MWPC to obtain an additional, b e tter AE resolution signal w ithout
disturbing the MWPC itself. W ith th is improved AE m easurem ent the
detector, which now provides TOF, position and two AE signals, is
capable of m easuring the cross-section of ERs down to the 0.1 mb level.
It should also be m entioned th a t the foil a t the entrance window of the
detector or other foils inside the detector, should all be th in enough to
allow the "heavy” and "slow" ERs to pass through them . Calculation
shows the m axim um th ickness which will allow all ERs to pass
through is about 150 pg/cm2 of polypropylene.
DESIGN OF THE DETECTOR AND PRINCIPLE OF OPERATION
A fter considering all the effects m entioned above and a num ber of
different designs the final version of the detector is shown in Fig. 3-4-3.
I t consists of two elem entary cells w ith a common cathode which is
located betw een a wire plane and a m etal m esh plane. The wire
plane, in front of the cathode serves as an anode and provides the
position m easurem ent. The m esh m etal plane, a t the back of the
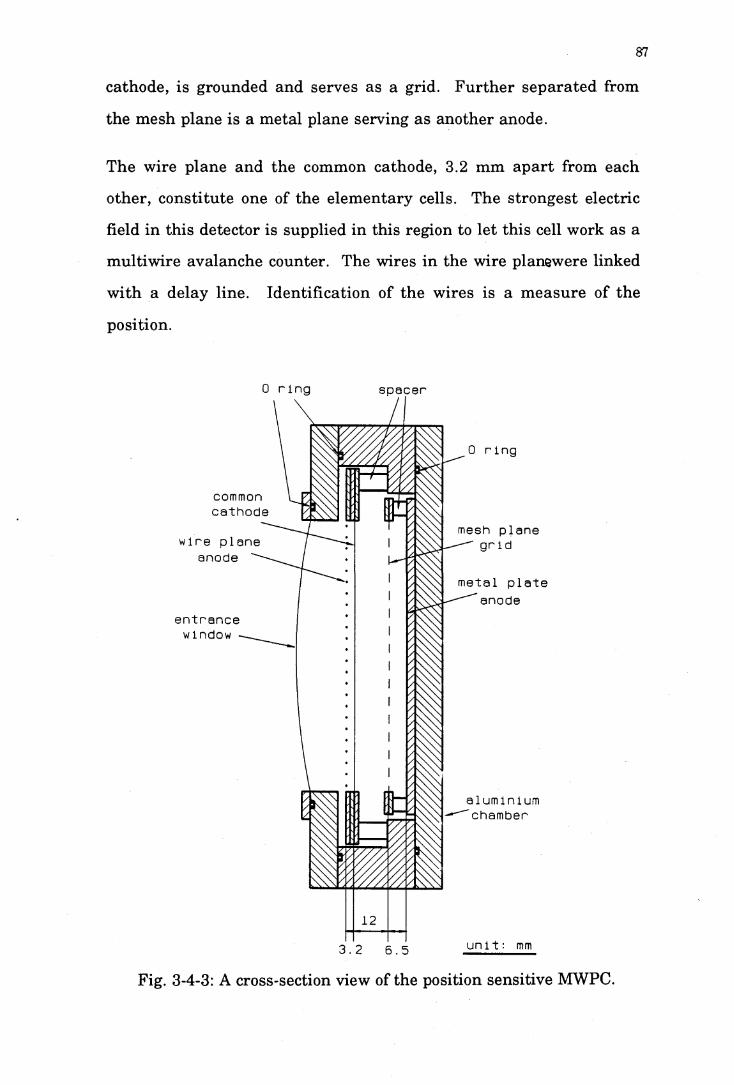
cathode, is grounded and serves as a grid. F u rth e r separated from
the mesh plane is a m etal plane serving as another anode.
The wire plane and the common cathode, 3.2 mm a p art from each
other, constitute one of the elem entary cells. The strongest electric
field in this detector is supplied in this region to let this cell work as a
m ultiw ire avalanche counter. The wires in the wire planewere linked
w ith a delay line. Identification of the wires is a m easure of the
position.
0 ring spacer
commoncathode
mesh plane gridwire plane
anodemetal plate
anodeentrance window -
aluminium'chamber
unit: mm
Fig. 3-4-3: A cross-section view of the position sensitive MWPC.

88
The m etal plane, grid plane and the common cathode constitu te
ano ther cell giving be tte r AE signals. This cell is divided into two
regions by the grid, and the strength of electric fields applied to the two
regions are different. The first region is from the cathode to the grid
and has a longer d istance of 12 mm. A weak electric field was
supplied across th is region to let it operate as an ionisation collection
area. The second region is from the grid to the m etal plate anode and
it has a sho rte r d istance of 6.5 mm. The stronger electric field
supplied in th is region is of sufficient strength to cause an avalanche.
This region is therefore working as an am plification region. The
potential on each electrode has been chosen to ensure both elem entary
cells of the detector operate w ithout in te rfe ring w ith each o ther
through the common cathode.
W hen a heavy ion en ters the detector it passes through the common
cathode and stops a t the anode of the solid m etal plate. A track of
prim ary electrons is created in the two elem entary cells on both sides
of the common cathode. These electrons drift away from the common
cathode in opposite directions on each side of the cathode, towards the
wire plane in front of the cathode and towards the grid a t the back of
the cathode.
These prim ary electrons created in the front cell will be m ultiplied as
they move tow ards the wire plane creating secondary electrons, and
m ost of these prim ary and secondary electrons will be collected on a
single wire which is closest to the in tercep t of particle track and
cathode (see §3.1.3 for details). This produces a negative pulse on this
wire and the pulse propagates through the delay line. The tim e
difference of the a rriva l of the pulse a t each end allows the exact

89
identification of the wire which has collected most of the electrons. In
the cases when the intercept has the same distance to two wires there
will be two pulses with sim ilar sizes on the two wires. This will resu lt
in a uncertain ty of 1 mm on the extracted position bu t the chance of
such cases is very rare . As discussed in §3.1.3 only the first 8%
distance (about 0.3 mm) close to the cathode constitutes the effective
ionisation path of the front cell. Hence, the sta tistical fluctuation of
the prim ary electrons a t such a short distance is large, which results
in a poor AE resolution of the front cell.
Those electrons drifting toward the grid in the back cell experience a
w eak electric field in which no m ultip lication of electrons occurs.
Since the grid is 98% transparen t, most prim ary electrons created by
the heavy ion along the 12 mm path pass through the grid. As soon as
these electrons pass th rough the grid they experience a m uch
stronger electric field in the sam e direction, and the num ber of
electrons is m ultiplied until the solid m etal plate anode is reached. As
all the prim ary electrons swept through the grid gain an equally large
m ultiplication, a bigger AE signal w ith be tte r resolution is observed
from this anode th an th a t from the first one. However because in the
ion isation region the d rift d istance varies from zero to 12 mm
depending on the electron’s in itial position and a weak, reduced field
is supplied, the d rift tim e for the electron is long and varies for
different electrons. This resu lts in a longer rise tim e of the signals
and therefore in a poorer tim e resolution th a n in the front cell.
Therefore only the AE signals from the back cell were used.
By electrostatic induction a positive signal is generated on the cathode.
Since the cathode is common the signal consists of two pulses coming
from the two cells on each side of the cathode. Due to the long drift

90
tim e of electrons behind the cathode, the pulse coming from the back
cell has a ra th e r long rise time and appears on the cathode la ter than
th a t coming from the front cell. If th is delayed and slowly rising pulse
had a size comparable with th a t of the pulse coming from the front cell
th is pulse would produce a deterioration of the rise time of the cathode
signal and hence the tim e resolution. However, because the slow
pulse is generated by the prim ary electrons w ithout m ultiplication its
size is small enough to cause no significant deterioration of the pulse
coming from the front cell of this detector. A tim ing signal and a AE
signal are obtained from this cathode, but the resolution of this AE is
ra th e r poor due to the short effective prim ary ionisation pa th in the
front cell as discussed before.
CONSTRUCTION AND ASSEMBLY
The cathode is a polypropylene foil (40 ~ 50 pg/cm2) stretched and
glued on to an epoxy frame. A layer of gold (~70pg/cm2) is evaporated
on each side of the cathode. The electrical contacts on each side are
made with great care outside the active area. Both sides of the cathode
are held a t the same negative potential.
The grid is a stain less steel m esh (98% transm ission) stretched and
clamped by two 1.6 mm thick resin bonded fibre-glass fram es and is
held a t ground potential.
The m etal plate anode consists of a prin ted circuit board with a layer
of copper, 104 mm X 24 mm, covering all the active area.
The wire plane consists of one hundred parallel 20 pm, gold plated
tungsten wires spaced by 1 mm over all of the detector active area.
The w ires are connected in pa irs and a ttach ed to a delay line
91
(ESC 2P50). Neighbouring pairs have nom inal 5 ns delay between
them . The position resolution is therefore 2 mm over the 100 mm
length. To m atch the impedance of the delay line, each end of the
delay line of the wire plane is connected through a 200 Q. resistor to a
charge sensitive pre-am plifier.
The potential difference is 550 V betw een the wire plane and the
cathode plane. The reduced electric field reaches 860 V/cm/Torr in
the constant field region. To make the detector work stably under this
strong electric field, it is essential to have a high quality wire plane
with uniform tension on all the wires and no sharp points.
The major problem initially encountered in m aking th is detector was
the therm al expansion of the wires when they were being soldered into
position directly to the circuit board as is commonly done for this type
of detector. This resu lts in non-uniform tension of these short (2 cm
long) wires; some being visibly loose. A loose wire could be deflected
tow ard the cathode by the electric field, and cause breakdown a t low
voltages. This problem was overcome by gluing the wires to the frame
then soldering them to the electrical contacts. Before the wires were
glued to the fram e the tension and the spacing of the wires could be
easily adjusted. After the wires had been firmly glued the soldering of
the w ires to the circuit board no longer caused problem s. A high
quality wire plane, w ith extremely uniform tension and spacing for all
the 100 wires, has been made by using this technique.
It is equally im portan t to choose very homogeneous wires to avoid
sharp edges which will cause discharge in the cham ber. Also dust
particles, sm all drops of glue or solder on the wires lead to sim ilar
problems and m ust be avoided. Before assem bling the detector, the

92
cham ber, w ire p lane and window fram es were w ashed in ethyl-
alcohol and cleaned in an ultrasonic bath.
The whole detector is assem bled inside an alum inium chamber. The
charged particles en ter the detector through a front window made of
stretched polypropylene 40-50 jig/cm2 thick. Viton O-rings are used to
seal the window to the front plate and this plate to the chamber. A
check for gas leaks of the window and the O-ring seals was carried out
by im m ersing the whole cham ber in alcohol and applying an in ternal
p ressure of up to 10 Torr above the external pressure. Any major
leakage of the window or of the O-ring seals would cause bubbles in
the alcohol. Those found to be gas tight by th is method were generally
found to be leak-proof in the high vacuum 2 m scattering cham ber
where extremely small leaks can be observed.
The a lum inium cham ber is connected to an external gas handling
system by two stainless steel bellows, which allow free angular travel
from -15° to +30° rela tive to the beam direction inside the 2 m
scattering chamber. The gas handling system allows isobutane gas to
flow through the detector and m aintains a steady gas pressure inside
the detector of ~2 Torr.
The particles will not enter the active area of the detector if they h it the
tu n g sten w ires on the wire plane. Since the w ires block an area
equivalent to their diam eter, 20 pm, in every 1 mm space, the detector
efficiency should be 98%.
Although the grid plane made by a mesh is also 98% tran sp a ren t it
will not affect the detection efficiency. Because even if the particle is
stopped by the grid the electrons produced by the particle before it h it
the grid will drift tow ards and pass through the grid. As discussed

93
before, these electrons will be multiplied and form the output signal on
the anode on the back of the grid.
ELECTRONICS SET-UP
The electronics set-up associated w ith th is detector is shown in
Fig. 3-4-4. Each of the signals is transm itted by 50 Q cables and is
amplified by a charge sensitive pre-am plifier (PA) ju s t outside the 2 m
scattering cham ber. The signal from the "energy" output of each PA
is fed into a m ain amplifier giving the AE signal. The fast signal from
the "time" output of the each PA is fed into a fast amplifier and then
in to a constan t fraction tim ing d iscrim inator to obtain a tim ing
signal. The position is given by the tim e difference betw een the
signals arriving a t each end of the delay line. This time difference is
m easured by m eans of a time to am plitude converter (TAC).
PERFORMANCE AND RESULTS
Figures 3-4-5 and 3-4-6 show respectively the time vs AE and a p art of
the position distribution obtained by m easuring the reaction of 1^0 +
154gm a t a beam energy of 70.5 MeV. The detector was set behind the
velocity filter a t 1.5° to the beam direction. The finger was used to
cover p a rt of the detector to prevent the scattered beam particles from
entering into the detector directly. Only those beam particles scattered
from the edge of the finger or the entrance collimater, resu lting in a
wide range of positions, can get into the detector. The flight path from
the ta rg e t to the detector was 650 mm. The pressure was 2 Torr of
isobutane and the voltages applied to the wire plane, cathode, grid and
m etal plate anode were +250V, -300V, 0V and +450V respectively.
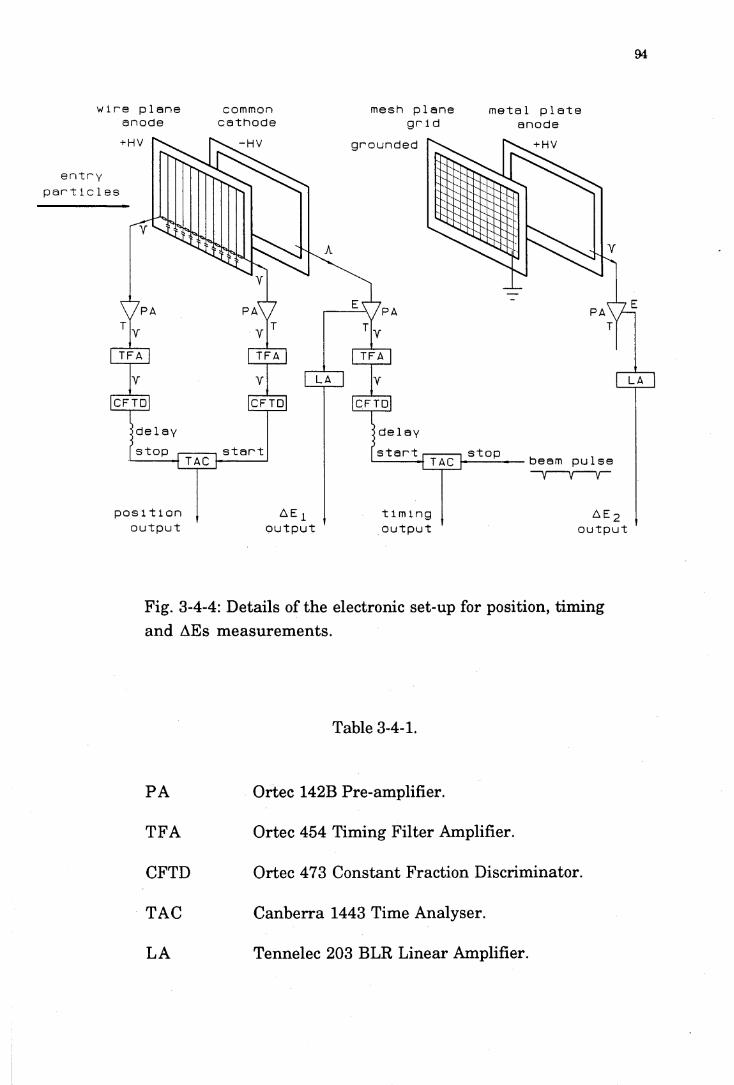
94
wire plane commonanode cathode
mesh plane metal plate grid anode
+ H V + H Vgrounded
entry part 1c 1 es
delay delaystop s t a r t start stop beam pulse
positionoutput
A E ioutput
timingoutput
AE 2 output
Fig. 3-4-4: Details of the electronic set-up for position, tim ing and AEs m easurem ents.
Table 3-4-1.
PA Ortec 142B Pre-amplifier.
TFA Ortec 454 Timing F ilter Amplifier.
CFTD Ortec 473 C onstant Fraction Discriminator.
TAC C anberra 1443 Time Analyser.
LA Tennelec 203 BLR Linear Amplifier.

counts
AE2
(channels)
AE^
(channels)
100095
Fig. 3-4-5: Energyloss in th e position s e n s i t i v e M W PC p lo tte d a g a in s t th e time of flight, (b) The A E 2 signal from the m etal plate in the back of the detector shows significantly improved e n e rg y r e s o lu t io n compared w ith th a t of(a) The AE± o u tp u tfrom the cathode in the middle of the detector. Low energy "recoiled" beam particles and slit s c a t t e r e d b e a m particles are not able to be d istingu ished from the ERs in (a), but they are well separa ted in(b) .
0 200 400 600 800 1000
<r- TOF (channels)
Fig. 3-4-6: P a r t of the position d istribution of s l i t s c a tte re d beam partic les on the wire plane anode.
position (channels)

96
The ER events are grouped on the plots of TOF vs AEi and AE2, shown
in Fig. 3-4-5 (a) and (b), where the AEi and AE2 are the signals from
the cathode and the m etal plate anode respectively. A long tail through
out the range of the TOF of these plots is a resu lt of low energy, slit
scattered beam particles (SSBP). Because of the poor AE resolution of
AEi (-30% FWHM) there is no clear gap between the ERs and the slit
scattered beam particles a t the bottom of Fig. 3-4-5 (a). A significant
im provem ent of AE resolution in AE2 (-15% FWHM) can be seen in
Fig. 3-4-5 (b) w ith an obvious gap between ERs and low energy slit
scattering. Fig. 3-4-5 shows th a t there are other well grouped particles
with sim ilar TOF to the ERs and with the AE between the ERs and the
low energy SSBPs. They are beam particles scattered from the carbon
backing of the ta rg e t, n ear 180° in the centre of m ass system .
However, these "recoiled" beam particles (RBP) continue to move in
the forw ard direction in the laboratory system . Calculation shows
RBPs have a very low energy (~1 MeV) and sim ilar velocity to ERs,
hence they are transm itted by the velocity filter to the same position of
ERs in the MWPC. Even though RBPs have a much sm aller energy
th an th a t of ERs, the ir energy loss, AE, is only slightly sm aller than
th a t of ERs. Clearly, RBPs can not be separated from the ERs in the
plane of TOF-AEi (Fig. 3-4-5 (a)) bu t they are well separated in the
plane of TOF-AE2 (Fig. 3-4-5 (b)) because of the much better resolution
of AE2 .
The rise time of the fast component output from the PA is about a few
ns for the signals coming from the wires and the cathode. The time
resolution of th is detector was m easured on line by detecting the target
recoils resulting from the elastic scattering of a pulsed 160 beam a t 20°
to the beam direction. The resolution was found to be 1.5 ns (FWHM)

97
but it should be noticed th a t th is also included the 1 ns width of the
pulsed beam.
A p a rt of the one dimensional projection of the position distribution of
slit scattered beam particles is shown in Fig. 3-4-6. Each peak shows
the signals from a pair of the wires and they are well separated from
each other. The peaks in Fig. 3-4-6 are not equally spaced because
each delay is slightly different. This was not however a drawback in
our case since we were still able to separate the signals from each pair
of wires. S im ilar resu lts were obtained by irrad ia ting the detector
w ith 5.5 MeV a-particles and 252Cf fission fragm ents under the same
conditions. Even though the ionization produced by a-partic les and
fission fragm ents differs by about a factor of 40, all types of particles
were detected sim ultaneously.
The ionization produced by a-particles and RBPs is sm aller than th a t
of ERs. The feature of these particles being efficiently detected is
im portant in th is work, as it guaranteed th a t the ERs can be efficiently
detected.
3.5 EXPERIMENTAL MEASUREMENTS
3.5.1 Experiment Arrangement
All experim ental m easurem ents were performed in the 2 m diam eter
scattering cham ber. The velocity filter and the MWPC, described in
the la s t section, were m ounted on a movable arm inside the 2 m
cham ber so as to m easure the ERs a t forw ard angles. Partic les
en tering the filter were confined to the central axis by a 1.5 mm

98
beam
targi
Filtertantalumplate
pos1tion sens 111ve
MWPC
Fig. 3-5-1 The overall a rrangem ent of the ER m easuring system . Except for the m onitors, all detectors and the velocity filter are m ounted on a movable arm which can be ro tated from -15° to 30° to beam direction. The calibration silicon-surface-barrier detector (CSD) and the tan ta lu m finger can be moved to in tercep t scattered particles. The beam is stopped by the tan talum plate.
d iam eter collim ator 250 mm from the target. The solid angle of the
en trance a p e rtu re w as ~ 2 .8 3 x l0 '5 sr. T ransm itted partic les were
detected in the position sensitive MWPC. The collimator was attached
to the front surface of the tan talum plate which stopped the beam. The
distance from the collimator to the entrance of the filter is ~50 mm and
the filter is 200 mm long. A fu rther 200 mm behind the back of the
filter, a tan ta lu m finger was located ju s t in front of the MWPC; it
could be moved a t right angles to the velocity filter axis and could block
up to ha lf of the detector length. During the m easurem ents th is finger
was positioned so th a t it to ta lly blocked the elastically scattered
particles and allowed all of the ERs which had passed through the
filter to be detected. This arrangem ent is illustra ted in Fig. 3-5-1.

99
The ta rg e ts used were ~40 (lg/cm2 thick and 2 mm wide stripes,
supported by carbon backings of thickness ~10 pg/cm2. They were
m ounted on a wheel which holds six targets; the locations of these can
be easily changed from one to another by ro ta ting the wheel. The
ta rg e t of in te re s t was located a t the centre of the 2 m diam eter
cham ber and perpendicular to the beam axis.
To m inim ise slit sca ttering the collim ators inside the two m eter
cham ber were removed. The beam was then focused in the following
m anner. One of the targets on the wheel was replaced by a tan talum
fram e w ith a 2 mm wide and 3 mm high rec tangu lar hole in the
centre. The tan ta lum fram e was first located in the ta rg e t position
and the beam was then focused through the hole of the fram e by
m inim ising the counting rate of beam particles, slit scattered from the
edge of the frame, a t the MWPC a t angle ~5°. The size of the focused
beam spot is about 1 mm diam eter. After the beam had been focused,
the frame was replaced by the targe t by rotating the wheel. The beam
spot m ay shift slightly during the m easurem ent, but the 2 mm strip
ta rge t ensured th is shift is less than ±1 mm horizontally. The average
shift of the beam spot was m onitored by the two monitors as discussed
below.
Two SSB detectors, w ith collim aters of ~16 mm in diam eter, were
m ounted on a fixed table inside the chamber a t about ±30° to the beam
ax is and 195 mm from th e ta rg e t. T hese d e tec to rs , w ith
approxim ately the sam e solid angles (~ 5 .3x l0 ‘3 sr), were used to
m onitor R utherford scattering. Yields of these elastic events were
used to norm alise the beam and to ex trac t the d ifferential cross
sections of ERs m easured in the MWPC. The ratio of the yields in the
two m onitors was also used to indicate, and correct for, small changes

100
in the beam spot position due to the movement of the beam spot and/or
the m inor changes in the angle of entry of the beam. D etails of the
e x trac tio n of the d iffe ren tia l cross section of ER, and the
determ inations of the angle and the solid angle of the filter will be
described in the following subsections.
As the angle increases the differential cross-section of the ERs
decreases very quickly. The angle, a t which the differential cross
section of ERs falls to 10% of th a t a t 0°, is -10° for the 160 induced
reactions. The small solid angle of the filter is not appropriate for
m easurem ents a t large angles (191 >10°); nor is its ability to remove
elastically scattered particles necessary a t such angles. A silicon
surface barrier detector, with a solid angle larger by a factor of 10 than
th a t of the velocity filter, was m ounted on the same arm as the filter
bu t displaced 20° from it. As ERs were m easured a t the angles 0 <
+ 10° by the filter, the ERs were sim ultaneously m easured a t the angle
9 < -10° by this Si detector. The ERs in this detector were identified by
th e ir energy and TOF. This detector is also shown on the Fig. 3-5-1
and assigned as the large angle ER detector (LAERD). The angle and
the solid angle of th is detector were determ ined in the same m anner
as th a t of the velocity filter, as described below.
3.5.2 The Determination of the Angles of the ER Detectors
Rutherford scattering varies rapidly a t the forward angles and can be
used to determ ine the angles and the solid angles of the ER detectors.
If the R utherford scattering cross-section is m easured (relative to the
fixed m onitor detectors) a t two angles w ith a well defined separation
angle cp th en these two angles can be determ ined. For instance,

10
C f ” "
± 0 . 01°
0 (lab)
Fig. 3-5-2: Illustrations of the determination of the angle of the ER detector by measuring the Rutherford scattering at forward angles of ±0. See text for details.
Fig 3-5-2 shows the calculated ratios of the Rutherford cross-sections
at angles 0 and 0 - 16° for 0-value near 8°. If measurements are
made at nominal angles of +8° and -8° then, as seen with the inset, an
offset of 0.1° in angle 0 results in a ratio different from unity by 10%. If
the beam is offset from the centre of the rotation arm, there is an offset of the solid angle Q of the detector as well. Taking this effect into
account the accuracy of the true angle of the ER detectors can be
defined to about ±0.02° if the ratio is measured to 1% and the
measurements are made at the nominal angle 0 ~ 10° (see the
102
Appendix for details). This technique becomes less precise as the
nom inal angle increases. For example, a ±1% m easurem ent of the
ratio of the cross-sections a t ±30° defines the angle to about ±0.03°.
In order to use the above method, the Rutherford scattering from the
ta rge t m aterial m ust be resolved from other reaction products such as
particles elastically scattered from the carbon backing of the ta rge t
and other light im purities (like oxygen and so on). At forward angles
the energy of these scattered particles is only slightly sm aller than of
those scattered from the ta rg e t m ateria l. For instance, a t 6° th e
energy of particles scattered from 160 is only about -500 keV less than
those scattered from a 154Sm target. This small energy difference can
not be resolved by a MWPC but can be using a SSB detector. Another
movable SSB detector was, therefore, m ounted in front of the filter
and ju s t behind the entrance apertu re, which is also shown on the
Fig. 3-5-1. This SSB detector is assigned as the calibration Si detector
(CSD). U sing th is detector, w hen it is im m ediately behind the
apertu re , the R utherford scattering from the ta rg e t (at angles 9>6°)
can be m easured hence the true angle of the filter and its solid angle
can be determ ined by the following procedures.
The sequence of m easurem ents made is shown schem atically in Fig.
3-5-3 and the changes of the angle 0 due to the shift of beam spot is
illu s tra ted in Fig. 3-5-4. For sim plicity, the velocity filter and the
MWPC, which are set behind the CSD and not being used for the
calibration purposes, have been om itted on th is figure. The entrance
collimator, ju s t in front of CSD, is approxim ately aligned on the centre
axis of the movable arm . A m easurem ent of elastic scattering was
firs t m ade by positioning the arm a t a nom inal angle 9. A nother
m easurem ent was then made w ithout changing any conditions of the
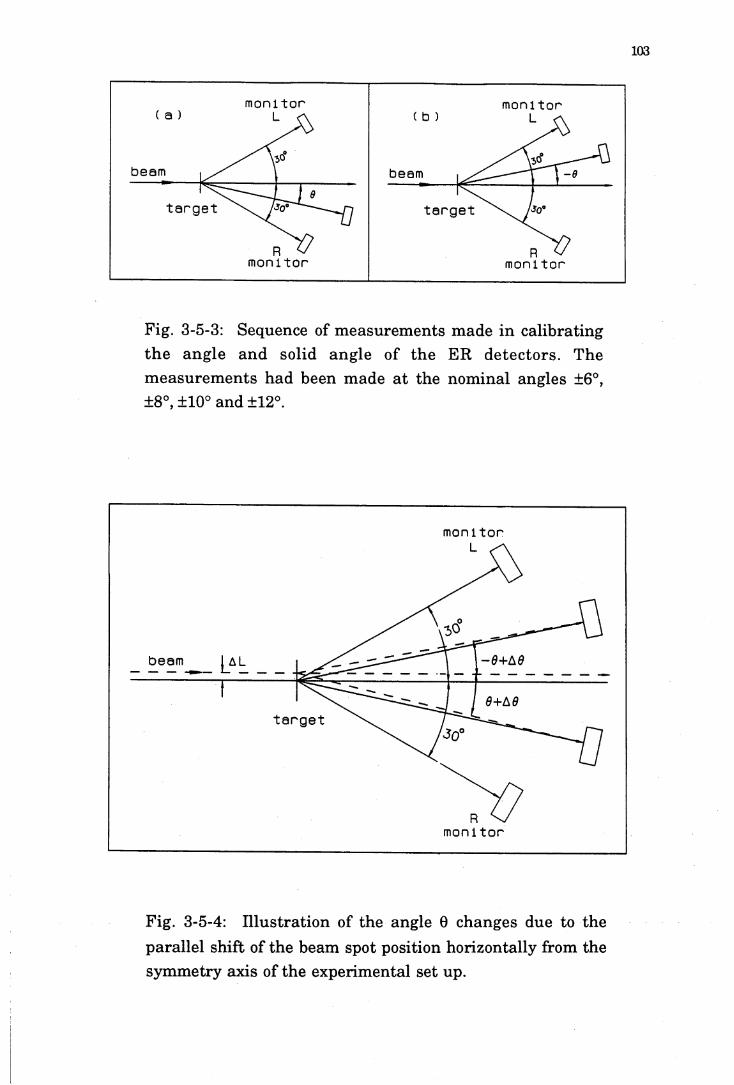
103
Fig. 3-5-3: Sequence of m easurem ents made in calibrating th e angle and solid angle of the ER detectors. The m easurem ents had been made a t the nom inal angles ±6°, ±8°, ±10° and ±12°.
monltor
L4L _ _beam
target
monitor
Fig. 3-5-4: Illu stra tion of the angle 0 changes due to the parallel shift of the beam spot position horizontally from the sym m etry axis of the experim ental set up.

104
set-up bu t the arm was moved through an angle cp = 20 to be located
nom inally a t -0 (Fig. 3-5-3b). As it will be discussed in §5.5.7, the
accuracy of the rotation angle cp was estim ated to be -0.01°. E lastic
scattering was m easured w ith sufficient sta tistics in all counters to
give <1% accuracy in the ratio of the R utherford cross-sections a t
angles ±0. This sequence of m easurem ents has been followed for a
nom inal angle 0 equal to 6°, 8°, 10°, 12° and a consistent value for A0
obtained w ithin the sta tistica l errors (<0.02°). After the angle had
been de term ined the CSD was w ithdraw n and the ERs can be
m easured by the position sensitive MWPC.
The re-tuning of the beam, during the changes of beam energy, m ay
shift the beam spot position. However, this will resu lt in a change of
the ratio of the elastic scattering of the two m onitors (at ±30° to the
beam). This change of the ratio of two m onitors was used to extract
the changes of beam spot a t each m easurem ent. Since the two
monitors were located approximately ±30° to the beam axis, only -0.03°
accuracy of the angle change A0 could be determ ined, as previously
discussed. C onsidering all factors the angle of the f ilte r w as
determ ined to an accuracy of ~±0.05° (see the Appendix for details).
The sam e procedure is applied to the large angle ER detecto r
(LAERD). A ±0.05° accuracy of the true angle of this detector is then
also achieved.
As well as a horizontal shift in beam spot, there could be a vertical
shift of it. Calculations show, to the first approximation, the change of
the angle and the solid angle of ERs are about one to two orders of
m agnitude sm aller th an th a t of the beam moving horizontally; hence
vertical movements have been ignored.
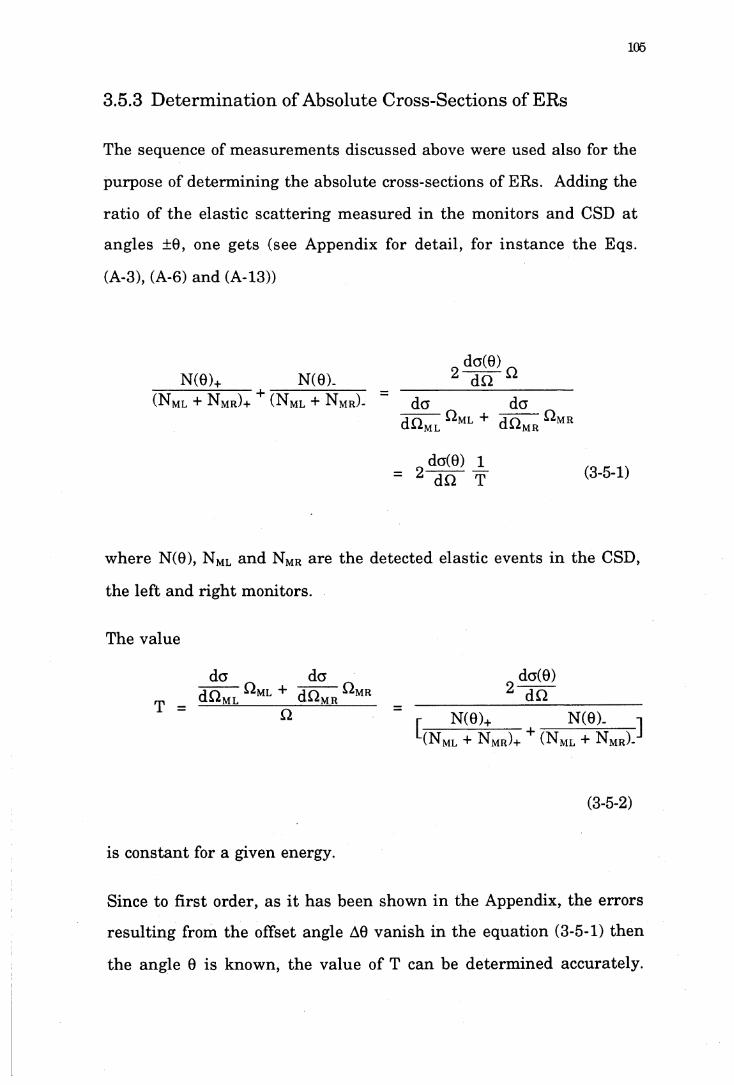
105
3.5.3 Determination of Absolute Cross-Sections of ERs
The sequence of m easurem ents discussed above were used also for the
purpose of determ ining the absolute cross-sections of ERs. Adding the
ratio of the elastic scattering m easured in the m onitors and CSD a t
angles ±0, one gets (see Appendix for detail, for instance the Eqs.
(A-3), (A-6) and (A-13))
N(0)+ N(0),(Nml + N mr)+ (N ml + N mr).
da(0) 2 da n
da _ daT o D ml + T o D mr
da(0) 12 da T (3-5-1)
where N(0), N ML and NMR are the detected elastic events in the CSD,
the left and right monitors.
The value
da ^ daT o D ml + T q Q Mr
T _ Q»*ml_________ Q“ mr
1 “ a
(3-5-2)
da(0)2 ~dn~
r N(8)+ N(9). 1(NMl + N mr)+ (Nml + N MR).
is constant for a given energy.
Since to first order, as it has been shown in the Appendix, the errors
resulting from the offset angle A0 vanish in the equation (3-5-1) then
the angle 0 is known, the value of T can be determ ined accurately.

106
Using all the ratios m easured a t ±6°, ±8°, ±10° and ±12°, and noting
th a t the ratios were m easured to ~1%, the T was determ ined to ~1% by
a least square fit.
For evaporation residue m easurem ents, the ratio of the num ber of ER
m easured, N ER, to the sum m ed num bers of elastic scattering events
m easured in monitor L and R , NML + NMR is:
/ do n( dQ U °
N ml + N mrHO **ML + pin Q i ‘ ML U 1 <Im R
-MR
(3-5-3)
th is gives:
da da( _ NER T dQ ML ML dQ MR MR ~1 dQ ' er “ N ml + N mr L q J
(3-5-4)
The factor in the square brackets is simply equal to T, hence the
differential cross-section of ER is known:
(V a n ER N ml + N (3-5-5)
MR
As shown in the above equation, elastic scatterings m easured in two
m onitors were sum m ed together for the norm alization. There is an
advantage to extracting ER differential cross-sections accurately by
placing the two monitors a t both sides of beam direction. Because even
though the m easured elastic events in both m onitors are affected by
the movement of the beam spot, the sum of them is not affected by the
changes of the effective beam spot a t each m easurem ent (see the
Appendix for details).

107
3.5.4 Targets
Targets of 154Sm and 186W were made by evaporating or sputtering the
isotopically enriched (-98.69%, -97.06% respectively) target m aterials
onto ~10pg/cm2 carbon backings. By placing a suitable m ask in front of
the carbon backing, ta rge t m aterial was deposited in a 2 mm vertical
strip so th a t only if the beam spot shifts less th an 1 mm horizontally
from the centre can it h it the ta rge t during the m easurem ents. The
thicknesses of the targe ts were approxim ately estim ated by weighing
reference foils, placed w ith the ta rg e ts in the evaporator. Since
m ultip le scattering sm ears out the angu lar d istribu tions and it is
dependent on the th ickness of the targe t, th is was m inim ised by
m aking th in (~40pg/cm2) targets. Calculation shows th a t w ith th is
th ickness of ta rg e ts , the sm earing of the angu la r d is tribu tion is
negligible [Sig74, Hin82]. Average energy loss of beam particles is -50
keV for passing through the carbon backing and -100 keV for passing
through the ta rg e t [Nor70]. The average beam energy was therefore
-100 keV lower th an the nominal value of beam energy.
3.5.5 Electronics
The electronics a rrangem ent used for the m easurem ents is shown in
Fig. 3-5-5 and a lis t of the units and the ir designations not given in
Table 3-4-1 is given in Table 3-5-1. I t consists of "fast" and "slow"
electronic un its . The fast un its , located n ear the 2 m scattering
cham ber, produced the TOF and position signals, and the slow
electronic units, located in the accelerator control room, produced the
AE, energy and logical signals. All the TOF signals obtained from
MWPC, LAERD, and m onitors were derived from Time to Am plitude

Larg
e An
gle
ER D
etec
tor
Moni
tor
L 8
R Po
siti
on S
ensi
tive
MWP
C
108
TIMING LOGICWire
Input
Test TAC SCAWire
Input
de 1 ayTest
Middle P 1 ate Input delayGate
Test TAC SCA
beam pulse RF
BackPlate Input
Test
Input
delayDetectorInput TAC SCA
2-fold
beam pulse RF
Low GainInput
High Gaindelay AntiDetector Gate
Input TAC SCA3-folO
beam pulse RF
LG + S
LG + S
CFTD
LG + S
LG + S
LG + S
CFTD
CFTD
LG + S
LG + S
LG + S
Come
Colne
Colne
Scaler
Scaler
Scaler
Pulser
Seal er
Pulser
■top
start
stop
start
atop
etert
stop
Fig. 3-5-5 Electronics scheme for ER measurements.
Table 3-5-1109
FP ANU F ast Pream plifier.
FA LeCroy 612A 12 Channel PM Amplifier.
Dis LeCroy 821 Quad Discriminator
SCA Canberra 1437 Time Single Channel Analyser.
LG+S Canberra 1454 Linear Gate and Stretcher.
Coinc C anberra 1446 Coincidence Unit.
G+D Ortec 416A Gate & Delay Generator.
A nti Anticoincidence input.
ADC Canberra 7432 UHS Analog to Digital Converter.
P re-scaler ANU Pre-scaler.
Scaler ANU Scaler.
P u lse r BNC BL-2 Pulse Generator.
Converters started by the signals from the detectors and stopped by the
RF signal from which the beam pulsing was derived.
The position signals from the MWPC were obtained, as discussed in
§3.4.2, by m easuring the finite propagation tim e of electrom agnetic
signals in the delay line linked to each wire of the MWPC. The time
difference a t each end of the delay line was also converted to amplitude
by a TAC.
The logic electronics selected only those events coincident w ith AEi
AE2 , TOF and position signals for the MWPC, and those events
coincident w ith TOF and energy for the LAERD and the monitors.

no
All the signals were recorded event by event on a m agnetic tape
through a VAX 750 computer. All the logic signals, used for gate
signals in the (LG+S), were counted by scalars. These counted
num bers were compared w ith the num ber of the events recorded by
the computer to extract the dead time of the computer and the LG+S
un its .
Since the position sensitive MWPC was used to m easure the ERs a t
very forward angles (as close as 0.5° to the beam). The counting rate of
the MWPC could be very high a t angles less than 2° resulting from slit
sca tte ring of beam partic les from the en trance collim ator of the
MWPC. In th is situation the beam was reduced to keep the counting
ra te of the MWPC less th an 5000 Hz . In order to monitor the dead
tim e of the whole system , electronic pulses were injected into the
detecting system. Two pulsers were used and both were triggered by
one of the monitors. The pulses were sent to the MWPC through the
test input of the pre-am plifiers and were sent also through an ADC to
be recorded on the m agnetic tape. A comparison was m ade between
the num bers of the injected pulses and the num bers of the coincident
events of AEi, AE2 , TOF and position of the MWPC, which were
generated by the pulses. The dead tim e of the whole system of the
MWPC was, therefore, extracted. The use of the m onitor signals to
trigger the pulsers is because the num ber of pulses sent to the MWPC
per-second reflects the in ten sity of the beam which changes the
counting rate of the system, hence the dead time of the system.
Since the MWPC had four output signals to inpu t to the computer, it
would cause a considerable dead tim e to the com puter when the
counting ra te is high. In order to reduce th is dead tim e the TOF
range was restric ted so th a t particles w ith "short" flight tim es were

Ill
rejected. Thus, the events of "elastic-like" particles which could
contribute high counting rates were suppressed and were not sent to
the computer.
In each m easurem ent the dead time of the whole system of the MWPC
was checked, and was found to be less th an 1%. The data were then
corrected by these extracted dead times.
Since the counting ra tes on the m onitors and the LAERD were low
(-100 Hz ), the dead time of these detectors was negligible and hence,
was not monitored.
There were two linear signals from the energy output of the large
angle ER detector, one with a low gain and the other with a high gain.
This was because the energy ou tpu t of ERs in the Si detector was
m uch sm aller th an th a t of ELs, therefore a ra th e r high gain of the
lin ear am plifier was required in order to obtain the ER's energy
signal. U nder this high gain the energy signals of EL were saturated .
The sa tu rated pulses (about 10 V) could not be cut completely by setting
an SCA window. The output of an additional low gain am plifier was
sent to ano ther SCA un it w ith a window on the elastic signals only.
The logic pulses from th is SCA were than used in anticoincidence to
ensure total rejection of the elastic events.
3.5.6 Efficiency of The Experimental Apparatus
The efficiency for tran sm iss io n of ER th rough the f ilte r was
determ ined in the following m anner [Wei91].
The velocity filte r is designed for the m easurem ents of ER cross-
sections a fte r fusion induced by a range of projectiles w ith a m ass
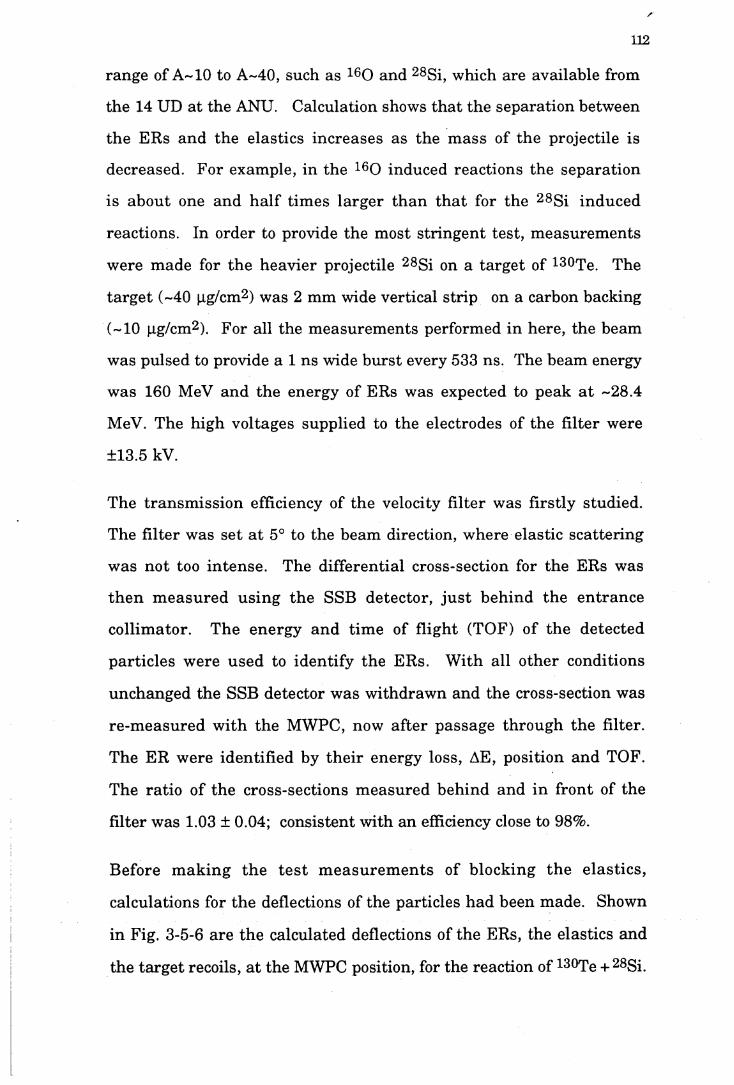
112
range of A -10 to A-40, such as 160 and 28Si, which are available from
the 14 UD at the ANU. Calculation shows th a t the separation between
the ERs and the elastics increases as the m ass of the projectile is
decreased. For example, in the 160 induced reactions the separation
is about one and h a lf tim es larger th an th a t for the 28Si induced
reactions. In order to provide the most stringent test, m easurem ents
were made for the heavier projectile 28Si on a target of 130Te. The
ta rge t (-40 pg/cm2) was 2 mm wide vertical strip on a carbon backing
(~10 pg/cm2). For all the m easurem ents performed in here, the beam
was pulsed to provide a 1 ns wide burst every 533 ns. The beam energy
was 160 MeV and the energy of ERs was expected to peak a t -28.4
MeV. The high voltages supplied to the electrodes of the filter were
±13.5 kV.
The transm ission efficiency of the velocity filter was firstly studied.
The filter was set a t 5° to the beam direction, where elastic scattering
was not too in tense. The differential cross-section for the ERs was
th en m easured using the SSB detector, ju s t behind the en trance
collim ator. The energy and tim e of flight (TOF) of the detected
particles were used to identify the ERs. W ith all other conditions
unchanged the SSB detector was w ithdraw n and the cross-section was
re-m easured w ith the MWPC, now after passage through the filter.
The ER were identified by th e ir energy loss, AE, position and TOF.
The ratio of the cross-sections m easured behind and in front of the
filter was 1.03 ± 0.04; consistent with an efficiency close to 98%.
Before m aking the te s t m easu rem en ts of blocking the elastics,
calculations for the deflections of the particles had been made. Shown
in Fig. 3-5-6 are the calculated deflections of the ERs, the elastics and
the targe t recoils, a t the MWPC position, for the reaction of 130Te + 28Si.

113
The m agnetic and electric fields of the filter are 0.14 Tesla and 10
kV/cm respectively. For 28Si and 130Te the solid line is for the
equilibrium charge sta te whilst the dashed lines show the effect of the
FWHM of the charge sta te d istribution (from ref. [Bet72]). For the
highly excited ER, represented by 154Dy, the average charge state is
expected to be h igher th an the equilibrium value (~15±5) and the
FWHM of the d istribution wider [Fre83a, Cor831. A higher average
charge state value of 20 is used in the calculation for the ERs of 154Dy
- - A=154— A=144— A=134
40 (MeV)
energy (MeV)
Fig. 3-5-6: Calculated deflections of elastic events, recoiling ta rg e t nuclei and ERs for the reaction 130Te + 28Si. The v e rtica l h a tch ed a reas ind ica ted the expected energy distributions of these products for 160 MeV 28Si. The dashed lines indicate the spread in deflection due to the charge state d istribu tions. The in se t shows the deflection for ERs of different m ass.
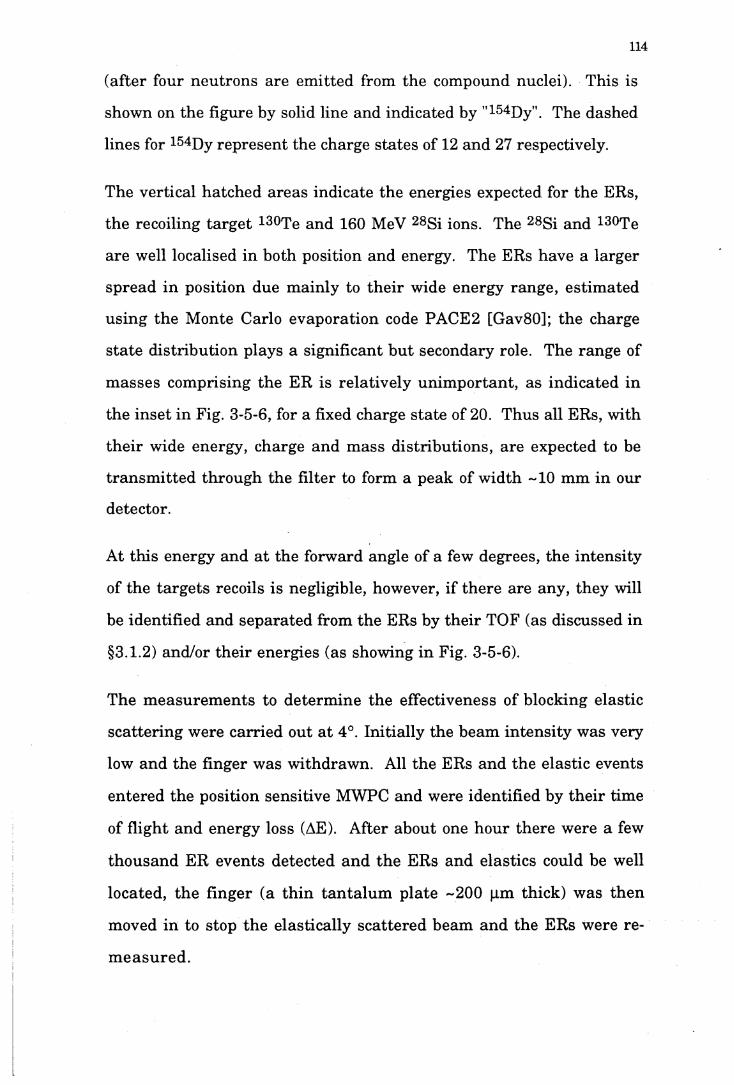
114
(after four neutrons are em itted from the compound nuclei). This is
shown on the figure by solid line and indicated by "154Dy". The dashed
lines for 154Dy represent the charge states of 12 and 27 respectively.
The vertical hatched areas indicate the energies expected for the ERs,
the recoiling target 130Te and 160 MeV 28Si ions. The 28Si and 130Te
are well localised in both position and energy. The ERs have a larger
spread in position due m ainly to their wide energy range, estim ated
using the Monte Carlo evaporation code PACE2 [Gav80]; the charge
sta te d istribution plays a significant bu t secondary role. The range of
m asses comprising the ER is relatively unim portant, as indicated in
the inset in Fig. 3-5-6, for a fixed charge state of 20. Thus all ERs, with
the ir wide energy, charge and m ass distributions, are expected to be
transm itted through the filter to form a peak of w idth ~10 mm in our
detector.
At th is energy and a t the forward angle of a few degrees, the intensity
of the targets recoils is negligible, however, if there are any, they will
be identified and separated from the ERs by their TOF (as discussed in
§3.1.2) and/or their energies (as showing in Fig. 3-5-6).
The m easurem ents to determ ine the effectiveness of blocking elastic
scattering were carried out a t 4°. Initially the beam intensity was very
low and the finger was w ithdrawn. All the ERs and the elastic events
entered the position sensitive MWPC and were identified by their time
of flight and energy loss (AE). After about one hour there were a few
thousand ER events detected and the ERs and elastics could be well
located, the finger (a th in tan ta lu m plate -200 pm thick) was then
moved in to stop the elastically scattered beam and the ERs were re
m easu red .
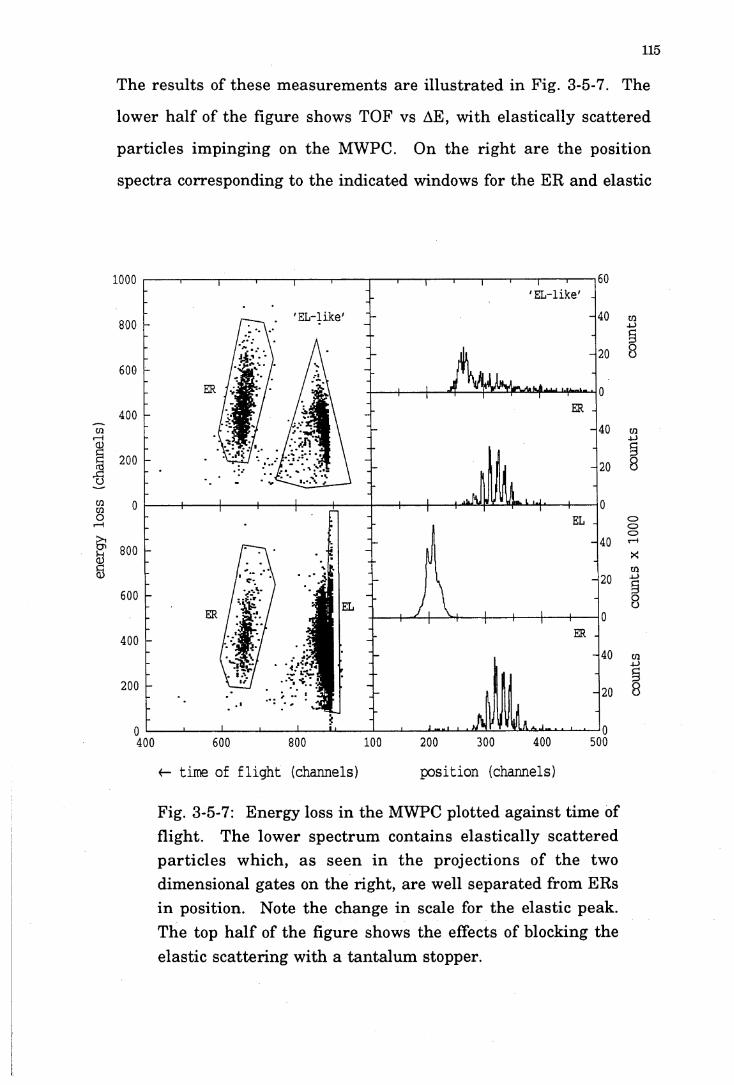
115
The resu lts of these m easurem ents are illu stra ted in Fig. 3-5-7. The
lower ha lf of the figure shows TOF vs AE, w ith elastically scattered
particles im pinging on the MWPC. On the righ t are the position
spectra corresponding to the indicated windows for the ER and elastic
<- time of fligh t (channels) position (channels)
Fig. 3-5-7: Energy loss in the MWPC plotted against time of flight. The lower spectrum contains elastically scattered partic les which, as seen in the projections of the two dim ensional gates on the right, are well separated from ERs in position. Note the change in scale for the elastic peak. The top h a lf of the figure shows the effects of blocking the elastic scattering with a tan ta lum stopper.

116
scattering. The ER position spectrum is well grouped in the MWPC,
covering only ~20 mm of the 100 mm length and the elastic peak is
only ~3 mm wide. The positions and w idths are in good agreem ent
with those expected from Fig. 3-5-6. The spikes in the spectrum show
individual position wires. The position and AE distributions show no
evidence of loss of the ERs, consistent with the m easured efficiency.
More im portantly, the ER group is well separated in position from the
elastic peak. Therefore the elastic peak can be physically blocked
w ithout effecting the detection of the ERs. The upper half of Fig. 3-5-7
shows the effect of blocking the elastic peak. In th is case the tan talum
stopper reduced the count rate in the MWPC by a factor 2000, totally
suppressing the elastic scattering.
A group of particles, now of only m inor in tensity , w ith TOF and AE
consistent w ith elastic-like particles, rem ains bu t the ir positions are
spread throughout the detector. These are alm ost certainly the resu lt
of scattering from the apertu re a t the entrance to the filter. E lastic
scattering from the target is deflected by only -1.5° in the filter, thus a
deflection of th is order a t the entrance to the filter can resu lt in
particles being transm itted and detected. Even so the ERs constitute
alm ost ha lf of the total count rate in the MWPC.
3.5.7 Procedures
The experim en ts in th is work were designed to m easu re the
evaporation residue cross-section to a high precision (up to ~1%) a t
energies around the Coulomb barrier. To achieve th is high precision
atten tion had to be paid to define the beam energy, detector angle and
target.
117
In order to set up the beam energy correctly the energy defining the
m agnet field was recycled slowly th ree tim es from zero to its
m axim um value and to zero again. Then the m agnet field was
increased slowly to reach the field required for the lowest beam energy
tak ing care not to exceed the required field. W hen a h igher field
se tting was required the m agnet was slowly increased bu t when a
lower value was required the recycling procedure was again used.
This procedure was adopted in order to avoid differential hysteresis
effects. The m agnetic field was m easured a t one point using a NMR
probe. The hysteresis effect may be slightly different betw een the
m easured point and along the trajectory of the particles. The recycling
method has been shown to accurately reproduce the field a t the NMR
location [Spe77]. More than tw enty m agnet calibration m easurem ents
over the las t 15 years have a standard deviation of ±0.04%. The most
recent m easurem ents, using the 12C(p,oc)9Be resonance a t 14.23 MeV,
were perform ed during these fusion experim ents. Thus, the absolute
energies of the beam can be defined b e tte r th an ±50 keV a t a
bom barding energy of 50 MeV and better than ±100 keV a t bombarding
energy of 100 MeV, and the relative beam energies in a 0.5 MeV
interval were defined with an accuracy of ±5 keV.
In order to reproduce the angle of the ER detector accurately the
ro ta tin g arm on which the ER detectors are m ounted was always
moved in the same direction when setting angles. The digital read-out
of the angle is lim ited to a precision of 0.1°, bu t it takes a few seconds
for the arm , when ro tating slowly to travel through th is angle. The
read-out will not change while the arm is ro tating until it reaches the
nex t 0.1° h igher (or lower) value. In order to set up the angle
accurately the arm was always rotated slowly and was de-clutched as

118
soon as the setting value appears on the control panel. This procedure
m ay introduce some "human" error, bu t it was shown th a t the error
is less the 0.01° after m easuring the ERs a t the same energy and the
same angle bu t re-setting the angle m any times.
Since, due to m ultip le scattering , the angu lar d istribu tion of the
evaporation residues may change if the target thickness changes, for
each reaction all the m easurem ents were carried out w ith one target.
At the end of each reaction m easurem ent, the ER differential cross-
sections which were m easured a t the beginning of the m easurem ent
were re-m easured. The resu lts consistently agreed w ith each other
w ithin experim ental error; indicating th a t there was no significant
change in the thickness of the target.
A num ber of ER angular distributions a t different beam energies were
m easured for each reaction. These spanned a range from a few MeV
below the Coulomb barrier to an energy of 110 MeV. It would be too
tim e consum ing to m easure full angular d istributions for each beam
energy. Therefore m ost m easurem ents were carried out only a t ±2°
for each ha lf MeV interval and these were then converted to the total
cross-sections.
3.5.8 Accuracy of the Measurements
As previously discussed in th is chapter the efficiency of the velocity
filte r and the position sensitive counter are consisten t w ith the
expected value of 98%. The angles of the ER detectors were
determ ined to be be tter than ±0.05°, the relative energies of the beam
were determ ined to be tter than ±5 keV and the absolute energies of the

119
beam were determ ined better th an 100 keV. The sm allest angle to the
beam direction a t which the ERs were m easured was 0.5°.
The m easurem ents carried out using th is system are reasonably
efficient. An excitation function can be completed w ithin 72 hours of
m achine tim e, involving 40 to 50 different energies spanning the
Coulomb barrie r region.
The statistical errors of the ER cross-sections were generally < 30% for
cross-sections up to 1 mb and ~±1% for cross-sections higher than 100
mb and < 5% in between. In principle, a lower statistical error for the
higher cross-sections (> 100 mb) can be obtained by m easuring more
ER events and th is can be done very easily and quickly in a short time
by using th is system (for example it took only about 20 m inutes to
achieve a precision of ±1% (-10 ,000 events) a t h igher energy).
However, other random errors, involved in, for example, defining the
energy steps and setting the ER detector angles a t ±2° have to be taken
into account. Though, as described before, extrem e care had been
taken to reduce these errors, we have chosen arb itrarily to restric t the
quoted errors to 1%, even though some of the total cross-sections had
sta tistical errors less th an th is value.
System atic errors, such as the defining of the absolute beam energy,
(even though they are expected to be very small), may occur and result
in a system atic sh ift of the m easured ER excitation function, for
exam ple a few tens of keV shift of the excitation function by the
uncertain ty in the absolute beam energy. However, because the major
aim in th is work is to extract the barrier d istribution from the fusion
e x c ita tio n fu n c tio n , th e se sy s te m a tic e rro rs a re re la tiv e ly
unim portant. It resu lts only in a minor scaling or a minor shift of the

120
extracted b arrie r d istribution w ithout affecting its overall shape; the
m ost in teresting features of the relative weighting of barriers can be
still observed in the distribution.
A system atic error in the beam energy may resu lt from the recycling
procedure of the m agnet. This resu lts in a shift of the excitation
functions m easu red before and a fte r the recycling procedure.
However, as discussed before and the details given in §4.2.1, th is has
been found to be sm all and no erro r la rger th a n the sta tis tica l
uncertain ty was found after the m agnet recycle procedure.
To extract the fusion cross-sections one needs to know both the ER and
the fission cross-sections. In the 154Sm + 160 reaction the fission
cross-sections are very small compared with the ER cross-sections in
the energy ranges studied in th is work. Even a t the highest energy of
110 MeV the fission constitu tes less th an 1% [Sik64, Cha84]. The
fusion cross-sections were simply taken as the ER cross-sections for
the reaction of 154Sm + 160 . The precision of the fusion cross-section is
therefore equal to th a t of ER cross-section.
There is a small b u t non-negligible fission possibility for the heavier
ta rge t 186W in the energy region we studied. The fission cross-sections
were taken from the m easurem ents of Bemis et al [Bem87], Though
the fission-cross-sections were not m easured to ±1%, they will not
affect the precision of our fusion cross-sections because the fission
cross-sections are less th an 2% of the ERs a t the energies of m ost
in te rest (—67 to -80 MeV in lab energy). For example, a t the worst case
of 80 MeV, the fission cross-section is only -4 mb while the ER cross-
section is -230 mb Even if the uncertainty in the fission cross-section is

121
10%, the to tal error of the fusion cross-section m ain tains the same
error of 1% of the ERs.
There m ay also be some system atic errors introduced by using these
fission cross-sections. The energy scale used in the fission
m easurem ents may be shifted slightly with respect to the scale used in
th is work and hence resu lt in a system atic shift for the to tal fusion
cross-section. For instance the ER excitation function m easured by
Bemis et al has a relative shift of ~0.5 MeV. Thus it is possible there is
a sim ilar relative shift in their fission m easurem ent even though the
fission cross-sections were m easured a t a m achine different w ith the
one used for th e ir ER m easurem ent. Taking the worst case as an
example again, ~±0.5 MeV shift of the absolute value a t th is lab energy
resu lts in an error of ~±1.1 mb in the fission cross-section of -4 mb.
Added th is to fusion, the total error of the fusion cross-section is -1.5%
instead of -1% of the statistical error only. However, since the 0.5%
error is the system atic error it will only cause a m inor error in the
extracted barrie r distribution a t the higher energies (close to 80 MeV)
and will not affect the shape of the extracted barrier distribution.
For the highest energies of 90 and 100 MeV, the fission cross-sections
are -12% and -30% to the ER cross-section. H alf MeV shift in these
energies will resu lt in extra -±6 mb and ~±10 mb errors to the fusion
cross-sections a t 90 and 100 MeV respectively. These will add a
considerable error to the fusion cross-sections (the total error in fusion
will be ~±3%), bu t since the energies are well above the barrier region,
they will not affect the extracted barrier distribution.
Chapter 4Experim ental Results and Analysis
4.1 EVAPORATION RESIDUES
4.1.1 Spectra
Typical spectra from the reaction induced by 74 MeV 160 on 154Sm in
the MWPC are shown in Fig 4-1-1; (a) and (b) of th is figure show the
position vs AEi and TOF respectively. The left side of the MWPC, up to
the vertical dashed line, has been covered by the tan ta lum finger to
stop the elastically scattered particles th a t are deflected to, and peaked
at, the left side of this line. However, this did not affect the detection of
ERs th a t deflected to the right side, as is clearly shown in Fig. 4-1-1 (b);
there was no cutoff on their position by the finger. The "elastic-like"
beam particles, slit scattered from the aperture a t the entrance to the
filter or the edge of the finger, spread over the whole range of position
in the MWPC and some of them had sim ilar tim es of flight to the
elastic events. On closer inspection of Fig. 4-1-1 (a) and (b) one may see
structure in the position, which shows the individual wire pairs. Fig.
4-1-1 (c) and (d) shows the TOF vs the AEi and AE2 . AEi which comes
from the front cell of the MWPC has been used to check w hether all
the ERs detected in the front cell have passed through the plastic foil
(—50 pg/cm2) of the cathode and given a AE2 signal in the back cell.
This has been checked for all the energies and all the angles. There is
no evidence th a t there is a loss of AE2 signals of ERs in the back cell of
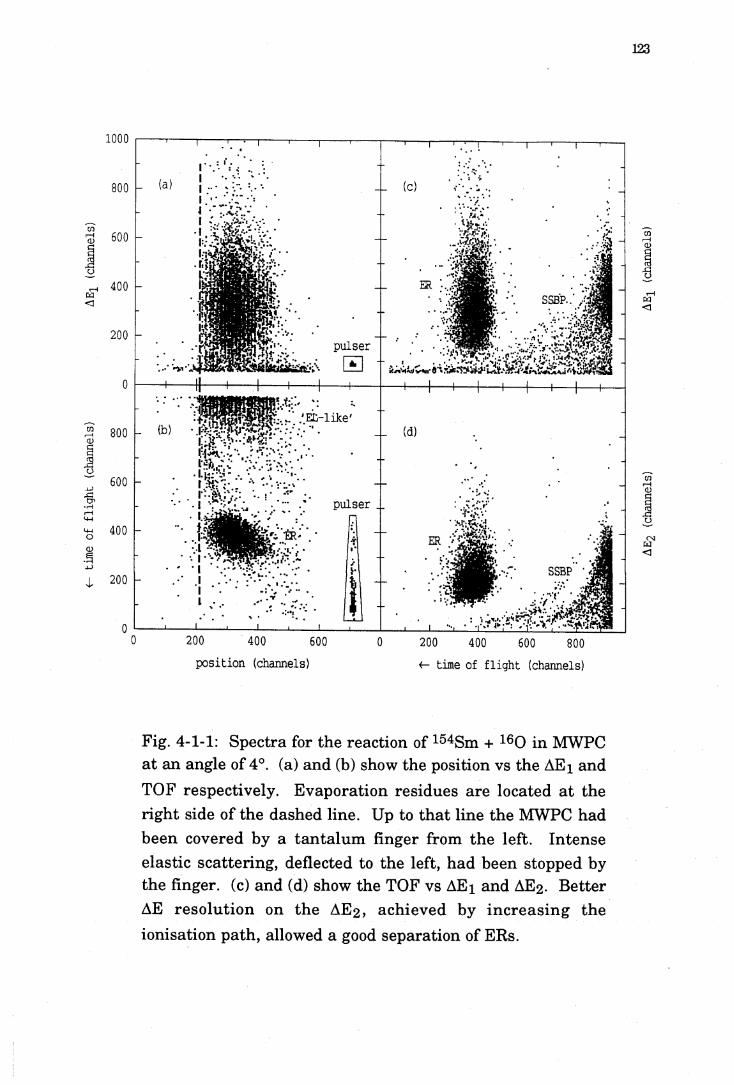
123
1000
CA
200 400 600
p o sitio n (channels)
200 400 600 800
f- time of f l ig h t (channels)
w"1<i
CO
OJ
O Jw< 1
Fig. 4-1-1: Spectra for the reaction of 154Sm + 160 in MWPC a t an angle of 4°. (a) and (b) show the position vs the AEi and TOF respectively. Evaporation residues are located a t the righ t side of the dashed line. Up to th a t line the MWPC had been covered by a tan ta lu m finger from the left. In tense elastic scattering, deflected to the left, had been stopped by the finger, (c) and (d) show the TOF vs AEi and AE2 . B etter AE reso lu tion on the AE2 , achieved by in creas in g the ionisation path , allowed a good separation of ERs.
chan
nel:

124
the MWPC. Since there is be tter AE resolution (-15% FWHM) from
the back cell, a very clear separation of ERs from other particles can be
seen in the spectrum TOF vs AE2 in the Fig. 4-1-1 (d). This was true
for all the angles and all the energies in the reactions studied in this
work. This spectrum, TOF vs AE2 was therefore used in the extraction
of the cross-sections m easured using the MWPC.
W hen the MWPC m easured the ERs a t an angle of 4° to the beam axis
the LAERD m easured ERs a t -16° sim ultaneously. Fig. 4-1-2 shows
the spectrum of TOF vs energy of the LAERD. Although there are
some low energy particles spread over a large range of TOF the ir
in te n s ity is re la tive ly low and the ERs can still be reasonably
identified. The statistical error a t this angle is still a few percent, and
th is gives a ra th e r reliable determ ination of the shape of the angular
distribution of the ERs as discussed in §4-1-3.
The background formed by these low energy particles in the spectra of
LAERD has been found to be alm ost independent of energy and only
increasing slightly w ith increasing angle. These particles are quite
possibly m ultip ly-scattered ta rg e t nuclei recoiling in itia lly a t large
angles. For examply, when 74 MeV beam particles elastically scatter
to 30°, the target particles recoil to -73° with energy -2 MeV. W ith the
recoiling angle of -73° to the beam direction the effective thickness of
the ta rge t is about three tim es greater than th a t if they recoil to 0° to
the beam direction , hence i t increases the chances of m ultip le
sca ttering . Though the in ten sity of these low energy m ultiply-
sca tte red recoils is very low, w hen the d ifferen tial cross-section
decreases as the angle increases or as beam energy decreases, these
low energy targe t recoils will still form a noticeable background in the
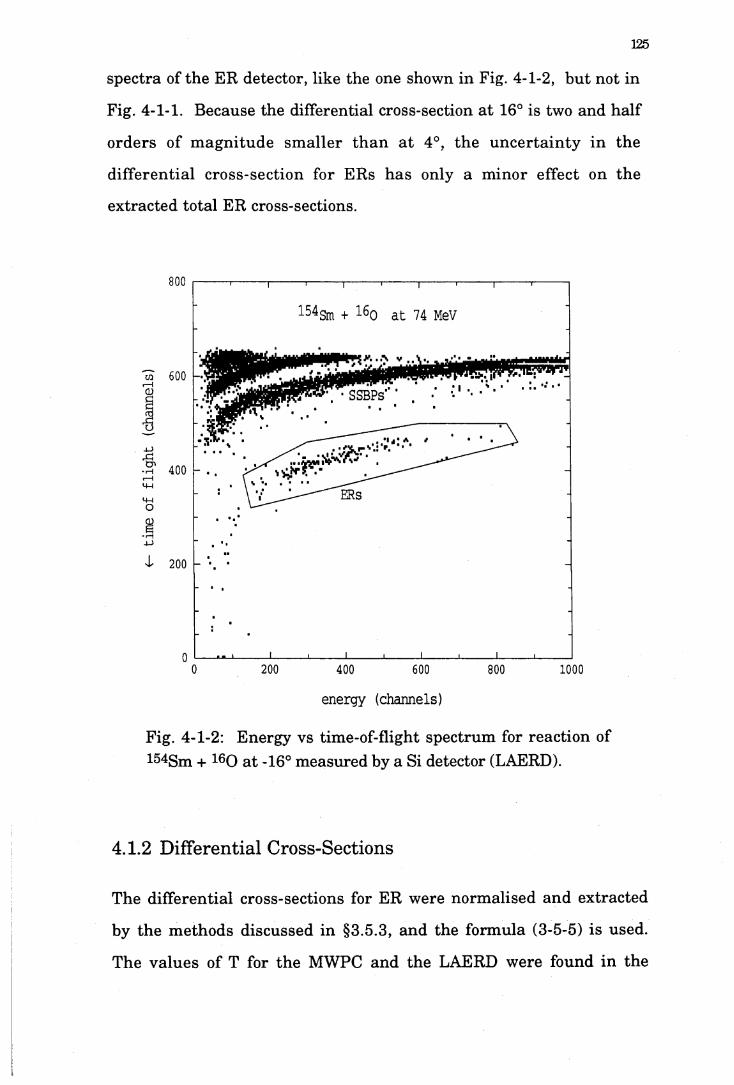
125
spectra of the ER detector, like the one shown in Fig. 4-1-2, but not in
Fig. 4-1-1. Because the differential cross-section at 16° is two and half
orders of magnitude smaller than at 4°, the uncertainty in the
differential cross-section for ERs has only a minor effect on the
extracted total ER cross-sections.
154Sm + 160 at 74 MeV
. !. • ■
* .
energy (channels)
Fig. 4-1-2: Energy vs time-of-flight spectrum for reaction of 154Sm + 160 at -16° measured by a Si detector (LAERD).
4.1.2 Differential Cross-Sections
The differential cross-sections for ER were normalised and extracted
by the methods discussed in §3.5.3, and the formula (3-5-5) is used.
The values of T for the MWPC and the LAERD were found in the
126
elastic scattering m easurem ents a t the energy of 90 MeV. Table 4-1-1
is the list of the m easured values of TMWPC and TLAERD.
Table 4-1-1: T values for the reactions listed
Reactions E l a b
(MeV)T m w p c
(mb/sr)T l a e r d
(m b/sr)
154Sm + 160 90 1.76 x 10⁶ 1.78 x 10⁷
186W + 16q 90 2.53 x 10⁶ 2.56 x 10⁷
The different values of T for different reactions reflect the variation of
the R utherford scattering cross-section w ith the product of reaction
atom ic num bers (Z1 Z2 ) 2 a t the same bom barding energy. At other
energies, the values of T were readily extracted from the m easured
values a t 90 MeV because R utherford scattering cross-sections are
°c j p • Thus:
902T(E) = ^ T(90) (4-1-1)
4.1.3 Angular Distributions of Evaporation Residues
Typical angular distributions of the ERs are shown in Fig. 4-1-3. The
common features of the angular distributions are the relatively strong
and narrow G aussian -like d is trib u tio n and a less in ten se ta il
ex tend ing to la rg e r angles. The exp lanation is based on the
evaporation of neutrons, protons, and a-partic les; the neu trons and
protons have relatively small m om entum and hence produce only a
sm all deflection to the ER; th is resu lts in the narrow G aussian-like
d is trib u tio n of ERs. The h igher m om entum of the a -p a r t ic le s
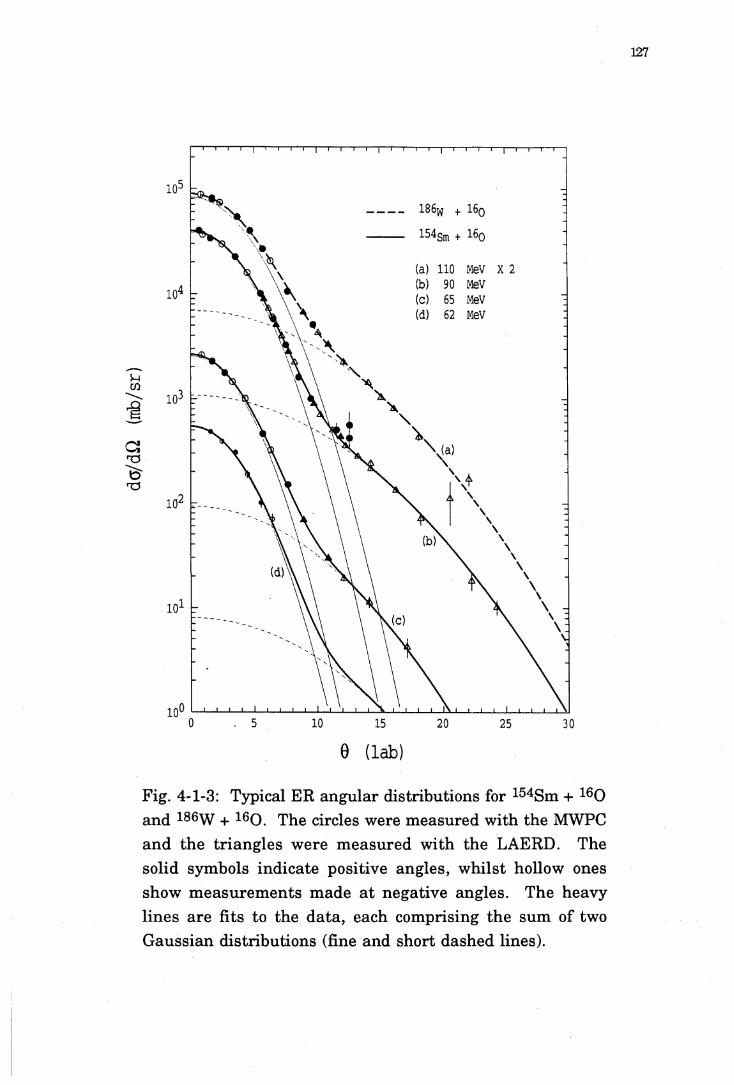
da/d
Q
(mb/
sr)
127
(a) 110 MeV X 2(b) 90 MeV(c) 65 MeV(d) 62 MeV
\ \ (c)
0 (lab)
Fig. 4-1-3: Typical ER angular distributions for 154Sm + 160 and 186w + 160 . The circles were m easured w ith the MWPC and the triang les were m easured w ith the LAERD. The solid symbols indicate positive angles, w hilst hollow ones show m easurem ents m ade a t negative angles. The heavy lines are fits to the data , each comprising the sum of two G aussian distributions (fine and short dashed lines).

128
produces m uch larger deflections to the ER, resu lting in the tail
extending to the larger angles.
A program has been used to fit these an g u la r d istribu tions by
ad ju sting the free p a ram ete rs of various functions in order to
minimize the %2 of the fit. A num ber of functions have been used for
th is purpose. The num ber of free param eters used in those functions
varies from 5 for two G aussians (two heights, two widths, and a small
offset of zero angle of the two G aussian functions) to 10 for a complex
function which combined a G aussian, exponential ta il and Ferm i
function. It was found th a t the more complex distributions gave only a
m arginal im provem ent in the quality of fitting when compared with
the two-Gaussian method.
Thus, because of the sim plicity and fewer p a ram ete rs the two-
G au ss ian d is tr ib u tio n w as chosen to fit all the ER an g u la r
distributions m easured in th is work. The typical norm alised x%0 the
fits are between 1 and 4, and vary from reaction to reaction. The heavy
solid lines shown in Fig. 4-1-3 are the tw o-G aussian fits to the
m easu rem en ts .
Even though both positive and negative angles were m easured, and
the true zero angle was determ ined to ±0.05° from elastic scattering as
in section §3.5, a small additional offset of zero angle was allowed in
the fitting procedure. Typical offsets of -0.01° were found indicating
th a t the m easured angles were indeed appropriate.
The total cross-section was extracted from the two G aussian functions
fitted to the data (details will be given in §4.1.4). However, a t a level of
a few percent the two G aussian distributions did not represent the ER
angular distribution. To ensure th a t th is did not affect the extracted

(js/qui) üp/op
129
cross-sections, the Monte Carlo code PACE2 [Gav80] was used to
ca lcu la te the ER d is tr ib u tio n for know n cross-sections. The
0 a t 90 MeV
— experiment
- - theory
9 (lab)
Fig. 4-1-4: The m easured and calculated (by PACE2) ER an g u la r d is trib u tio n s for 154Sm + 160 a t 90 MeV. The th eo re tica l calcu lation is system atically lower th a n the experim ental one for angles > 10°. The curves are two G aussian d istributions fitted to the data. The short dashed lines show the fit of the broader G aussian only.
130
calculated ER angu lar d istribu tions were then fitted w ith a two-
G aussian function. The %^for fitting these theoretical data were also
betw een 1 and 4, how ever the ex trac ted cross-sections were
consistently w ithin 1% of the input value to the PACE program. Also
the broader G aussian fit to the PACE data gave a cross-section close to
th a t calculated for a emission. Fig. 4-1-4 shows the two-Gaussian fits
to the PACE data and the m easured experim ental data. At the large
angles (>10°) the calculated "data" are system atically sm aller, by
about a factor 2, th an the experim ent. P resum ably , the PACE
calculation underestim ates the a emission cross-sections, though the
reasons for th is are not clear.
Full ER angular distributions for the reactions 154Sm + 160 and 186W +
160 are shown in Fig. 4-1-5. Typical widths of the two-Gaussian fit to
the m easured data were ~3° and -7.5° for the both reactions. Since the
ERs have been m easured up to 20° by the LAERD, the shape of the
an g u la r d is trib u tio n s are well defined a t m ost of the m easured
energies. At a few energies there were not enough m easured data a t
large angles to define the width of the broader G aussian distribution.
Hence the extracted width from the neighbouring energies have then
been used.
At 100 MeV bom barding energy in the reaction of 154Sm + 160 , the
fitted angular distribution crosses th a t for 90 MeV a t about 25°. This is
caused by a sm aller w idth (6.84°) found by the fitting program for the
broader G aussian distribution compared w ith those (-7.5°) found for
the neighbouring energies of 90 and 110 MeV. However, th is only
resu lts in a sm all change in the extracted to tal cross-section because
the contributions to the total cross-section from the large angles are
very small (see §4.1.4). For instance, there is only -0.5% change in the

131
« gW o
( «rH
3 'S
■H»73
• fHlO ^
T_l CÖI co
•Sf £f c CO
• rH
oa>
*o>ua
OCDrH
0)43-h>ua
73S3O
•I-H
ÜcOa»Oh
T 303O3
n 3a
0 3 — 03 4 3 ° ? 4 3^ rH ^
03 4 CU
«0 bfl t f
o4 3
a>>73
0343Eh
&H3• rHCGc003
aCO73
7303>Oh
S3o
0343Eh
53cOw73
COoo£
0-HO
0343
73Öo
» H
343
« £ V3 3
03S3
• rH
rT303
4373CO
T5
CO
0-1
H>cO
43
7303
CO03
• rHT3C
03Oh03£
oLO
0 -HO
03S3r—HcO>
O-Ho43T 3
%03
43-H73cOÖ03
4 4 cO
S3cO
'7373S3CO
OOh03
H3COOOh
4303
43
O hO
T 3CO03-H73S3
• rH
S3o+33
43* cCfl
00
0-hO
03j 3
l o>
0343
X03
0303
m
O O O O rH o <r> oo C* t-H
o o o - r o LO o <T\ oo r- r- vo v>
(is/cp) up/flp
(lab)
Ö
(lab)

132
total cross-section if a larger value of 7.5°, instead of the 6.85°, was
used for the width of the broader Gaussian distribution.
4.1.4 The Cross-Section of Evaporation Residues
For the reactions studied in this work, the full angular distributions of
ERs have been m easured from close to the Coulomb barrier up to 110
MeV for the 160 projectile a t intervals of 5 or 10 MeV. For the purpose
of the b a rr ie r d is trib u tio n m easurem ent, a t energies below and
around the Coulomb b a rrie r, the d ifferential cross-sections were
m easured a t ±2° in energy steps of ~0.5 MeV. The ER cross-sections
have been ex trac ted by two d ifferent m ethods for the d ifferent
m easu rem en ts .
W hen full an g u la r d is trib u tio n s were m easured , the ER cross-
sections were ex tracted by using the areas of the two G aussian
distributions. Thus:
O er( 0 ) 2jc s i n e ^ (9) d0J0
w here:
7~(0) = A,exp(-^j) + A2e x p G j)
(4-1-2)
(4-1-3)
is the fitted tw o-G aussian d is trib u tio n and A lf A2, o lf o2 w e r e
extracted from the m easured experim ental data. Typical examples of
do/d0 as function of angle are shown in Fig. 4-1-6 for the reaction of
154Sm + 160 a t 100 MeV. The fine lines show the contributions from the
narrow er and broader G aussian distributions. The error introduced
by changing the broader w idth by ±10% (from 6.84° to 7.5°) is also

133
0 a t 100 MeV
narrower Gaussian f i t
broader width =7.50
broader width =6.84
two Gaussian f i t
broader Gaussian f i t
0 (lab)
Fig. 4-1-6: ER angular distribution multiplied by 27isin0 to give do/dO. Total cross-sections were extracted through the two Gaussian distributions.
indicated in Fig. 4-1-6. The x2 of the fitting increases from ~3 to ~4 and
the extracted total cross-section increases from 1112 mb to 1117 mb
which is less than ±0.5% to the total cross-section. Therefore an error
of ±0.5% was assigned to the extracted cross-sections for this energy.
An extra error of ±0.5% was also assigned to total cross-sections for
134
those energies where only a few points of the angu lar d istribution
were m easured, since the neighbouring shapes were employed to fit
the data.
The ratios (R) of the total ER cross-section to dG/dO a t 2° are shown in
Fig. 4-1-7 for the reaction 154Sm + 160 . Theoretical calculations with
PACE are also shown in th is figure. Both the experim ental and
theoretical da ta vary linearly w ith the energy a t energies of 5 MeV
above the Coulomb barrier. At the lower energies the experim ental
ones were scattered by few percent from the line. The theoretical ratios
were system atically lower th an the experim ental ones. The solid and
dashed lines are the least square linear fits to the experim ental and
theoretical d a ta respectively. The gradient, K, is indicated in the
figure. I t is understood, as discussed in the la s t section, th a t the
PACE calcu lation u n d e re s tim a ted the a em ission cross-section
resu ltin g in a h igher d ifferential cross-section a t sm aller angles,
hence a sm aller ratio of the to ta l cross-section to differential cross-
section a t 2°. N evertheless, the g rad ien t of the theoretical fit is
consistent w ith the experim ent one. The differential cross-sections a t
2°, therefore, can confidently be converted to total cross-sections using
the fitted line. Details of the converting procedures will be given in the
next subsection. Sim ilar features for the ratios of differential cross-
section a t 2° to the total cross-section were obtained from the reaction
of 186W + 160, but their K value is close to zero.
The typical uncertain ty in K values is -15% and the resu ltan t error in
R is then energy dependent [Lyo86]. However, since the K is small, R
does not change much with energy; the error in R is less th an 1% for
energies above the barrier and up to 1.5% a t the lowest energies where
the statistical errors are much larger. Though the changes of absolute

135
value of R will resu lt in a system atic shift in the total cross-sections, it
has a m inor effect on the cu rva tu re of the excitation function.
Calculations show th a t a t an energy interval 2 MeV, which is used as
the energy steps, as discussed in §4.2.2, in the extraction of barrier
and angular m omentum distributions, the relative error of total cross-
sections caused by the uncertainties of the K and R is only ~±0.15%.
experiment (< f i t to experiment
K = 0 . 0 0 0 2 1
theoryf i t to theory ^ f i t to experiment
K = 0 . 0 0 0 2 1
Fig. 4-1-7: The ra tio s of ER to ta l cross-section to ER differential cross-section a t 2° a t the energies where the full angu lar d istributions have been m easured. The theoretical ones were calculated using PACE2. The solid and dashed lines are the lea s t square fits for the experim ental and theoretical da ta respectively. The K is the slope of these lines.
136
This will not affect the shape, but will resu lt in a minor scaling of the
ex tracted b a rrie r and angu lar m om entum d istribu tions which are
related to the curvature of the excitation function, as will be discussed.
At bom barding energies below the Coulomb barrier, the cross-section
of th e ERs becom es very sm all (less th a n a few mb). The
m easu rem en t of the full an g u la r d istrib u tio n s of ERs becomes
impracticable. At these energies the differential cross-sections are too
sm all to m easure a t angles larger th an a few degrees because the
counting ra te of background events becomes im portant compared with
th a t of the ERs. Thus the m easurem ents of the ERs a t these energies
were only carried out a t ±2° to the beam direction. When the energy is
fu rther reduced and the total cross-sections is below the 0.1 mb level
the m easurem ent of ERs become difficult even a t the angles of ±2°. The
lowest cross-sections m easured in this work is, therefore, ~0.1 mb.
Because the real angles of the Velocity F ilter were not precisely a t ±2°
the d iffe ren tia l cross-section a t 2° was in te rp o la ted using an
exponential function to link the two m easured points. The use of the
exponential ra th e r th an a G aussian function only introduces a minor
error in the extracted differential cross-sections a t 2° because the offset
of the angles were very small.
The extraction was done by solving the two equations:
_ a ea^+A0+) (4-1-4)
! <-r >_ A e a(2+A0.) (4-1-5)
The offset angles A0+ and A0. were extracted from the ratio of the
elastic scattering in the m onitors a t ±30° as discussed in C hapter 3.

137
Then
(4-1-6)
daThe ER cross section was obtained by using the — (2°) m ultiplied bydfl
the converting factor, R, th a t is
The excitation functions of the ERs are shown in Fig 4-1-8. The
triangles represent the m easurem ents a t ±2° and the circles represent
the full angular distributions.
§4.2 FUSION AND ITS EXCITATION FUNCTION
§4.2.1 Fusion Excitation Functions
As discussed in §3.5.7 the fusion cross-sections for the reaction of
154Sm + 160 are simply taken as the ER cross-sections because of
negligible fission decay a t the energies studied in th is work. For the
reaction of 186W + 160 the fission cross-sections, as shown in the Fig.
4-1-8, were taken from the reference [Bem87]. For those energies
w here th e m easu red fission cross-section is not availab le an
interpolated value has been used from the curve of fission in Fig. 4-1-8.
The m easured ER differential cross-sections a t ±2° and the fusion
excitation functions of the reaction of 160 + 154Sm and 186W are shown
in Table 4-2-1, 4-2-2, 4-2-3 and 4-2-4 respectively. The cross-sections,
from th e full a n g u la r d is tr ib u tio n m ea su re m e n ts a re lis te d
separately. As it is expected, those total ER cross-sections extracted
from full an g u la r d is trib u tio n m easu rem en ts agree, w ith in th e ir
(4-1-7)

cros
s-se
ctio
n (m
b)
138
fission
full dist.
fission
Fig.4-1-8: The evaporation residue excitation functions forthe reactions of 154Sm + 160 , 186\ v + 160. Fission cross- sections for 186W + 160, taken from [Bem87], are also shown. The dashed line guides the eye.

139
error, to the ones extracted from ±2° m easurem ents. However the
errors of the to ta l cross-sections from the full angu lar d istribution
m easurem ents were generally not m easured to the precision of 1%
and the energies of these m easurem ents were not so precisely set as
they were done in the ±2° m easurem ent. Hence these da ta are not
suitable and are not used in the applications of the extractions of the
b arrie r and angular m om entum distributions.
Only the sta tistica l errors are shown in these tables. No correction
was made to the cross-sections resulting from system atic errors. For
instance, no correction was made for the cross-sections resulting from
only 98% transparency of the MWPC, as discussed in §3.4.2 and the
100 keV energy less th a n the nom inal values resu lting from the
energy lo ss of beam passing the carbon backing and the target, as
discussed in §3.5.4.
N on-statistical random errors were estim ated from the reproducibility
of the cross-sections a t several different energies for each reaction and
by six m easurem ents a t one energy for reaction 154Sm + 160 after re
cycling the m agnet, re-focusing the beam and re-setting the velocity
f ilte r angles. The d is trib u tio n of cross-sections was generally
random ly scattered w ithin a range of ~±1%, even though sta tistical
errors were significantly sm aller. Thus the m inim um random error
was taken to be 1%. In one case, a t lab beam energy of 70.5 MeV in
reaction 154Sm + 160 , a difference in differential cross-section of 7%
was obtained and th is was probably due to "hum an” error. As it will
be shown in Fig. 4-2-2 (c) for the extracted d2(E G )/dE 2, th is re
m easured cross-section resu lts in the additional solid circles a t the
~62 and ~64 MeV, displaced significantly from the o ther da ta ,
illu stra ting the care required in m aking these m easurem ents.

Table 4-2-1: M easured da/dQ of 154Sm + 160 a t nom inalangles ±2°, and the extracted da/dQ at 2°. Only the statistical errors, A, are indicated.
140
E lab
(M eV)
do(+2°) , d a “ A(m b/sr)
do(-2°) . d a “ A(mb/sr)
do(2°) ^d a -A(mb/sr)
58.0 10 4 7.4 3 8.7 358.5 10 3 7.7 2 8.9 259.0 45 4 30 3 37 359.5 49 6 49 6 49 460.0 120 15 100 9 110 860.5 180 20 150 16 170 1261.0 260 20 210 16 230 1361.5 360 20 340 21 350 1462.0 490 20 460 20 480 1562.0 580 30 450 20 510 2062.5 770 30 610 20 690 2063.0 930 30 800 20 860 2063.5 1200 20 1040 20 1120 2064.0 1500 20 1310 30 1400 2064.5 1950 30 1570 30 1740 2065.0 2270 40 1910 30 2090 2065.0 2120 30 1870 30 1990 2065.5 2900 40 2450 30 2670 3066.0 3510 50 2930 50 3210 3066.5 4120 60 3390 50 3740 4067.0 4840 70 3990 50 4430 4067.5 5500 70 4620 60 5030 5068.0 6330 80 5400 80 5860 6068.0 6370 80 5300 60 5810 5068.5 7670 100 6220 80 6960 6069.0 8570 110 7040 80 7770 7069.0 8460 110 7410 80 7900 7069.5 9020 110 7940 100 8450 8069.5 9120 100 7750 80 8390 7070.0 9950 120 8570 100 9240 8070.0 10300 120 8330 100 9290 8070.5 11500 170 9670 130 10600 n o70.5 10800 130 9030 n o 9910 8070.9 11800 190 10100 160 10900 13071.5 13200 140 11100 120 12100 9072.0 14200 140 11900 120 13000 9072.5 14800 140 13000 160 13900 n o73.0 15400 140 13400 140 14400 10073.5 16100 180 14200 140 15100 n o74.0 16600 150 14800 130 15700 10076.0 19900 250 17000 210 18300 16078.0 23100 280 20500 250 21600 19080.0 26000 330 22300 220 24100 20090.0 35100 410 31300 310 33000 260
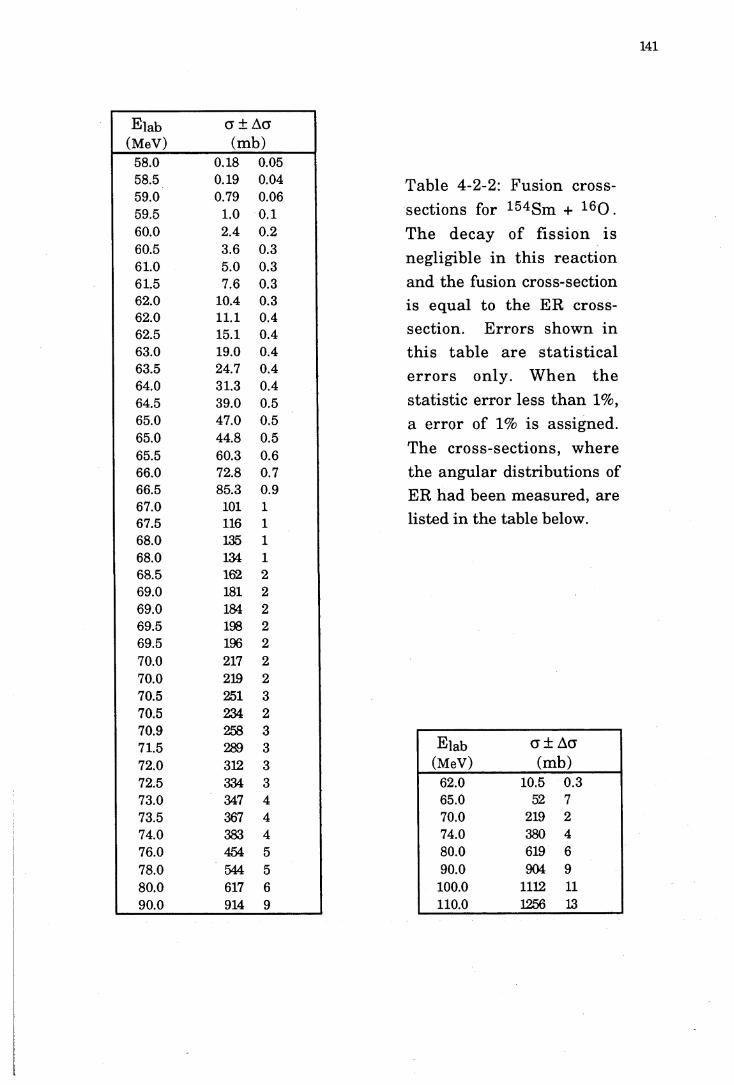
141
Elab( M e V )
G ± A a (m b )
58.0 0.18 0.0558.5 0.19 0.0459.0 0.79 0.0659.5 1.0 0.160.0 2.4 0.260.5 3.6 0.361.0 5.0 0.361.5 7.6 0.362.0 10.4 0.362.0 11.1 0.462.5 15.1 0.463.0 19.0 0.463.5 24.7 0.464.0 31.3 0.464.5 39.0 0.565.0 47.0 0.565.0 44.8 0.565.5 60.3 0.666.0 72.8 0.766.5 85.3 0.967.0 101 167.5 116 168.0 135 168.0 134 168.5 162 269.0 181 269.0 184 269.5 198 269.5 196 270.0 217 270.0 219 270.5 251 370.5 234 270.9 258 371.5 289 372.0 312 372.5 334 373.0 347 473.5 367 474.0 383 476.0 454 578.0 544 580.0 617 690.0 914 9
Table 4-2-2: Fusion cross- sections for 154Sm + 160. The decay of fission is negligible in th is reaction and the fusion cross-section is equal to the ER cross- section. E rro rs shown in th is tab le are s ta tis tic a l e rro rs only. W hen th e statistic error less th an 1%, a error of 1% is assigned. The cross-sections, w here the angular distributions of ER had been m easured, are listed in the table below.
Elab( M e V )
G ± AG (m b )
62.0 10.5 0.365.0 52 770.0 219 274.0 380 480.0 619 690.0 904 9
100.0 1112 11110.0 1256 13
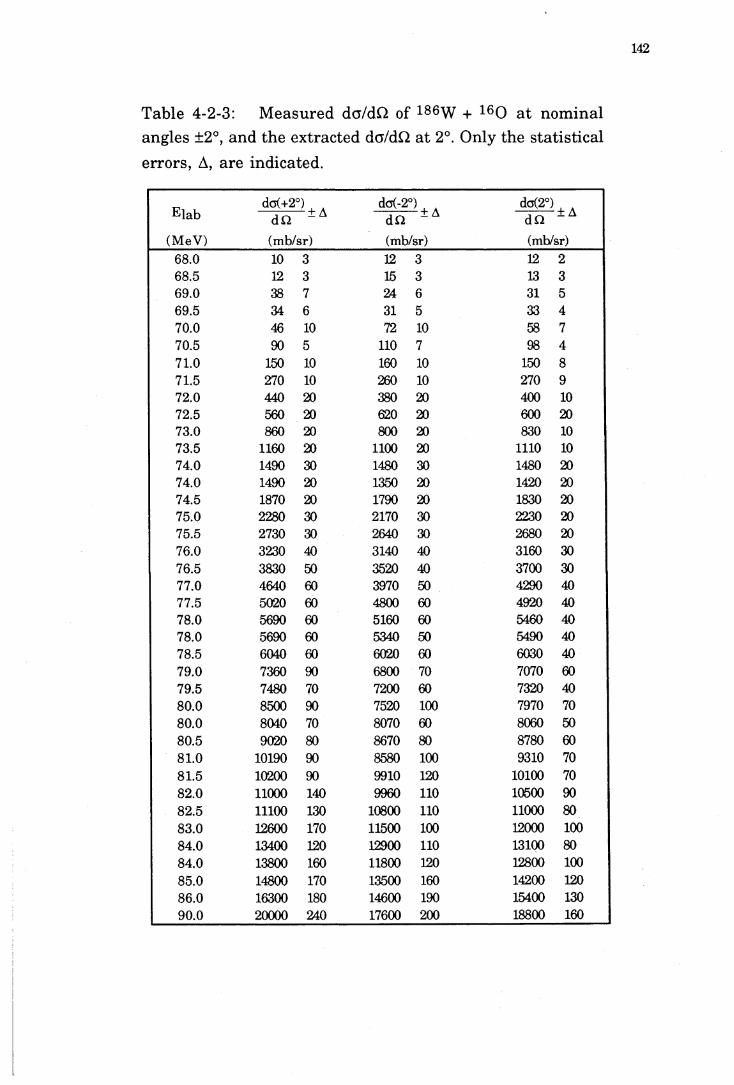
Table 4-2-3: Measured do/dQ of 186W + 160 at nominalangles ±2°, and the extracted da/dQ at 2°. Only the statistical errors, A, are indicated.
142
Elab
(MeV)
do(+2°) ,da ~A
(mb/sr)
do(-2°) , dQ _ A (mb/sr)
do(2°) ^ da _A(mb/sr)
68.0 10 3 12 3 12 268.5 12 3 15 3 13 369.0 38 7 24 6 31 569.5 34 6 31 5 33 470.0 46 10 72 10 58 770.5 90 5 110 7 98 471.0 150 10 160 10 150 871.5 270 10 260 10 270 972.0 440 20 380 20 400 1072.5 560 20 620 20 600 2073.0 860 20 800 20 830 1073.5 1160 20 1100 20 1110 1074.0 1490 30 1480 30 1480 2074.0 1490 20 1350 20 1420 2074.5 1870 20 1790 20 1830 2075.0 2280 30 2170 30 2230 2075.5 2730 30 2640 30 2680 2076.0 3230 40 3140 40 3160 3076.5 3830 50 3520 40 3700 3077.0 4640 60 3970 50 4290 4077.5 5020 60 4800 60 4920 4078.0 5690 60 5160 60 5460 4078.0 5690 60 5340 50 5490 4078.5 6040 60 6020 60 6030 4079.0 7360 90 6800 70 7070 6079.5 7480 70 7200 60 7320 4080.0 8500 90 7520 100 7970 7080.0 8040 70 8070 60 8060 5080.5 9020 80 8670 80 8780 6081.0 10190 90 8580 100 9310 7081.5 10200 90 9910 120 10100 7082.0 11000 140 9960 110 10500 9082.5 11100 130 10800 110 11000 8083.0 12600 170 11500 100 12000 10084.0 13400 120 12900 110 13100 8084.0 13800 160 11800 120 12800 10085.0 14800 170 13500 160 14200 12086.0 16300 180 14600 190 15400 13090.0 20000 240 17600 200 18800 160

Table 4-2-4: Fusion cross-sections a for 186W + 160 . The ER cross-sections g er are converted from da/dQ measured at nominal angles ±2°. Fission cross-sections Gfi are taken from [Bem87] and indicated by *. At the energies when fission was not measured interpolated values from the measured ones at the neighbouring energies are used. Errors shown in this table are statistical errors only. When the statistical error is less than 1%, an error of 1% is assigned.
Elab(M eV )
C*ER ± AGEr
(m b )Gfi ± AGfi
( m b )G ± AG
( m b )68.0 0.34 0.06 <0.05 0.34 0 .Q868.5 0.39 0.07 <0.05 0.39 0.0969.0 0.9 0.1 <0.05 0.9 0.269.5 1.0 0.1 < 0.05 1.0 0.170.0 1.7 0.2 <0.05 1.7 0.270.5 2.9 0.2 < 0.1 2.9 0.271.0 4.4 0.3 < 0.1 4.4 0.371.5 7.8 0.3 < 0.1 7.8 0.372.0 11.9 0.4 < 0.1 11.9 0.472.5 17.5 0.5 < 0.1 17.5 0.573.0 24.3 0.4 * 0.1 0.1 24.4 0.473.5 32.4 0.4 0.3 0.1 32.7 0.474.0 43.5 0.7 * 0.5 0.1 44.0 0.774.0 41.5 0.5 * 0.5 0.1 42.0 0.574.5 53.5 0.5 0.6 0.1 54.1 0.575.0 65.3 0.7 0.7 0.1 66.0 0.775.5 78.6 0.7 0.8 0.1 79.4 0.776.0 92.7 0.8 * 1.0 0.1 93.7 0.876.5 108 1 1.1 0.1 109 177.0 126 1 1.3 0.1 127 177.5 144 2 1.5 0.1 146 278.0 161 2 * 1.9 0.1 163 278.0 160 2 * 1.9 0.1 162 278.5 177 2 2.3 0.2 179 279.0 207 2 2.8 0.2 210 279.5 215 2 3.4 0.2 218 280.0 234 2 * 4.0 0.2 238 380.0 236 2 * 4.0 0.2 240 380.5 257 2 5.1 0.3 262 381.0 273 2 6.5 0.3 280 381.5 296 3 7.7 0.3 301 382.0 307 3 * 9.4 0.3 316 382.5 322 3 11 1 333 383.0 353 3 13 1 366 484.0 385 3 17 1 402 484.0 375 3 17 1 392 485.0 415 4 * 22 1 437 486.0 452 4 29 3 481 590.0 550 5 * 65 3 615 6

144
Table 4-2-5: Fusion cross-sections for 186W + 160 . ER cross- sections are converted from the m easu rem en ts of full angu lar d istribu tion of dG/dQ. Fission cross-sections are taken from [Bem87] and indicated by *. E rrors shown in this table are statistical errors only.
Elab(MeV)
Uer i AGer (mb)
Gfi ± AGfi (mb)
G ± AG (mb)
71.5 7.4 0.5 <0.10 7.4 0.574.0 42 1 * 0.45 0.1 43 180.0 229 4 * 3.95 0.2 233 490.0 556 13 * 65.4 3.1 621 13100.0 704 5 * 205. 8 909 10110.0 675 5
§4.2.2. Curvature of The Fusion Excitation Functions
I t is common to plot the fusion cross-section against 1/E or plot E g
against E to extract the average fusion barrier, B0, and fusion radius,
R [Gut73, Eis77, Jah82, Bec83, Mos84]. The plots of E g vs E for the two
system s of 160 + 154Sm and 186W are shown in Fig. 4-2-1. The fusion
barrier B0 and 7tR2 can be obtained by fitting the data by a straight line
w ith the least squares method. The m easured cross-sections used in
the fitting are those above 100 mb.
The in tercep t on the E axis is B0, and the slope of the stra igh t line is
7tR2. R esults are shown in Table 4-2-6 and indicated in Fig. 4-2-1.
Those data used in the fitting are indicated by solid symbols.
Table 4-2-6: The extracted B0, tcR2 and the fusion radius R.
Reactions Bo(MeV) tcR2 (mb) R (fm)
154Sm + 160 59.2 3300 10.25
186\y + 16Q 68.6 3520 10.59
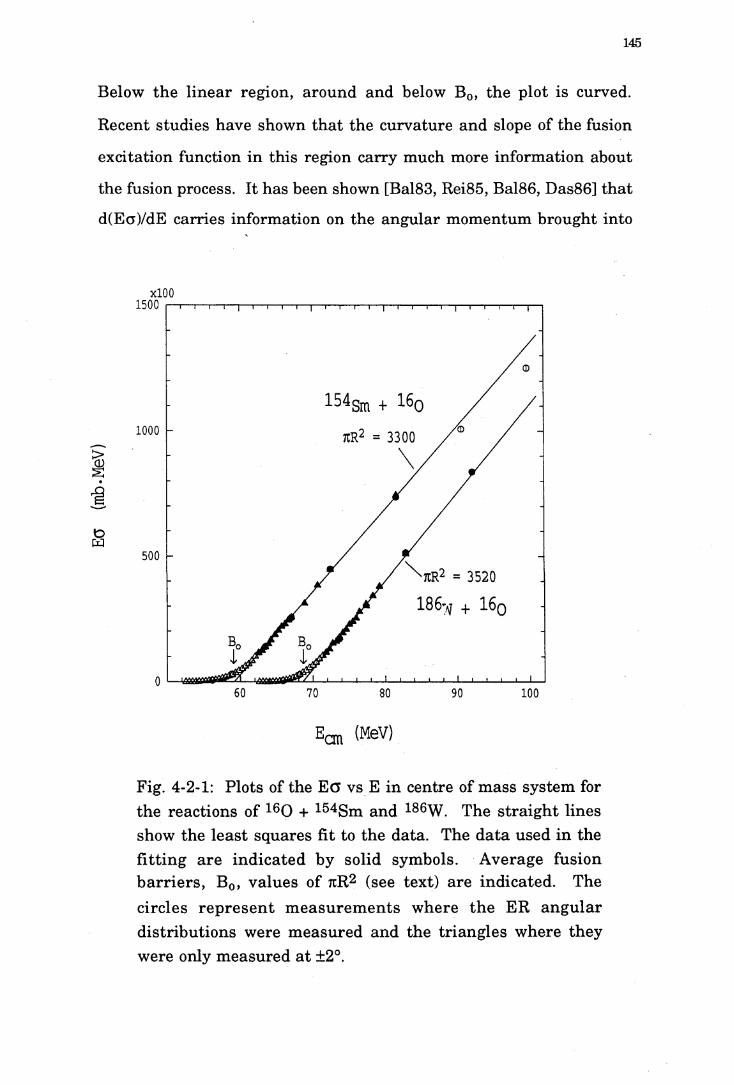
145
Below the linear region, around and below B0, the plot is curved.
Recent studies have shown th a t the curvature and slope of the fusion
excitation function in th is region carry much more inform ation about
the fusion process. It has been shown [Bal83, Rei85, Bal86, Das86] th a t
d(EG)/dE carries inform ation on the angular m omentum brought into
60 70 80 90 100
Ecm (MeV)
Fig. 4-2-1: Plots of the E o vs E in centre of m ass system for the reactions of 160 + 154Sm and 186W. The s tra ig h t lines show the least squares fit to the data. The da ta used in the fittin g are ind icated by solid symbols. Average fusion b a rr ie rs , B0, values of tcR2 (see text) are indicated. The circles re p re se n t m easu rem en ts w here the ER an g u la r d istribu tions were m easured and the triang les where they were only m easured a t ±2°.
146
the fused system and th a t d2(E a ) /d E 2 gives inform ation on the
d is trib u tio n of b a rr ie r heigh ts [Row91, Row91a]. These can be
extracted from the da ta using cross-sections a., a and g + a t centre of
m ass energies E-AE, E and E+AE respectively if the fusion cross-
sections have been m easured to a high precision and in fine energy
steps [Wei91a]. Thus
where d(Ea)/dE gives the value of the gradient a t the energy E+AE/2,
and the d2(EG)/dE2 gives the value a t energy E.
Experim entally, only a finite AE can be used in the above equations,
the extracted d(Ea)/dE and d2(Ea)/dE2 are therefore not the true values
in stric t m athem atical term s. However, it can be shown th a t there is
only a m inor difference when AE values up to ~1.8 MeV are used (see
§5.1.3 and Fig. 5-1-5 for details).
The sta tistica l uncerta in ty associated with d(Ea)/dE and d2(E a)/dE 2
are given approxim ately by
d(Eo) (E -I- AE)g+ - Eo dE Ä AE (4-2-1)
and
d2(Eo) (E + AE)g+ - 2Eg + (E - AE) g_ ÄE2 (4-2-2)dE2 ~
Sg - ^ A / (5a+)2 + (5a)2 (4-2-3)
and
(4-2-4)
respectively,
147
where the 8g ’s are statistical errors in the cross-sections in mb. The
values of 8g and 5C in Eqs. 4-2-3 and 4-2-4 increase with the value of 8g .
It is also evident from these two Eqs. th a t 8g and 8C are proportional to
AE-1 and AE*2 respectively. Fig. 4-2-2 illu stra tes the dependence of
error in d2(EG)/dE2 on the step length of AE. In the Fig. 4-2-2 (a), the
energy in terval is -0.45 MeV (0.5 MeV in lab energy); it is difficult to
see any structure in the distribution. However, the structure becomes
clear when the energy interval is -1 .8 MeV (2 MeV in beam energy),
as shown in Fig. 4-2-2- (c).
To m ain tain a constant value of 8C over the energy range of in te res t
requ ires m uch h igher s ta tis tica l accuracy in percentage term s a t
h igher energies. For instance, to achieve an error 8g = 1 m b requires
m easurem ents of only 10% precision a t beam energy - 66 MeV bu t
0.2% a t 71 MeV. We ensured, as discussed in §3.5.8, th a t statistical
errors were < 1 mb for cross-sections up to 100 mb (at about the energy
of the Coulomb barrier) and < 1% for higher values.
The extracted values of d(EG)/dE and d2(EG),dE2 for the reaction of
154Sm + 160 and l 86W + 160 are shown in Fig. 4-2-3 and Fig. 4-2-4.
Figures 4-2-3 (b) and 4-2-4 (b) show results for the subset of the data,
m entioned above, for which the analysing m agnet was increased
monotonically; (a) and (c) in figures 4-2-3 and 4-2-4 display all the
da ta , including the repeated points. Energy steps used in the
extraction are indicated in these figures.
Details of the features of the extracted d(EG)/dE and d2(EG)/dE2 will be
discussed in C hapter 5.

800
600
400
200
0
-200
-400
-600
800
600
400
200
0
-200
-400
-600
800
600
400
200
0
-200
-400
-600
148
AE = 0.45 (MeV) (a)
I I I I 1 I H
AE = 0.9 (MeV) (b)
.m
t i l l
“fli t ■ + +■> I t M m '1 I it t I ih-AE = 1.81 (MeV)
(c)
s% t:«
♦a
I I , I I I I I I I I
Fig. 4-2-2: Illustrations of th e v a r ia tio n of e rro rs of d2(E tf ) /d E 2 w ith th e e n e rg y interval AE. The errors are correlated to some degree. The correlated ones are ind icated by th e sam e sym bols. Each point is correlated w ith both neighbouring poin ts w ith the sam e sy m b o l. In th e extrem ely case of (a) they are all correlated w ith th e i r n e a r e s t neighbouring points.
Ecm (MeV)

2
1
0
800
600
400
200
0
-200
-400
-600
800
600
400
200
0
-200
-400
-600
1491 1 1 1 1 I- 1 " 1 I I I 1 1 1 f I I I ' 1 I r
AE = 0.9 (MeV) 154Sm + 160(a)
a!EA
4 -+■ M I I I I
AE = 1.81 (MeV) (b)
♦ V,+ + I
H— h t M t I I I I I I I II I
AE = 1.81 (MeV) (c)
50 55 60 65
E o n (MeV)70
Fig. 4-2-3: E xtractedd ( E a ) / d E a n d d2(Ea)/dE2 for reaction 154Sm + 160 . The data points in (a) have been norm alised by tcR2 = 3300. The energy steps in (a) are 0.9 MeV ( 1 MeV in Lab system ) excepting the diamond ones a t th e h ig h en erg ies w here th e energy steps are 1.81 MeV (2 MeV in Lab system ). C urvatu re d 2( E a ) / d E 2 from (b) d a ta m easu red w ith monotonically increasing energy and (c) all data. Each point is evaluated using two or three cross-sections; n e ig h b o u rin g p o in ts with the same symbol have a t le a s t one of these cross-sections in co m m on a n d a r e therefore correlated.

2
1
0600
400
200
0
-200
600
400
200
0
-200
150-I I I I I I I I I-----1----- 1 I I I-----r
AE = 0.92 (MeV) 186W + 160 (a)
M
— — f^ 4 H---- ---- 1----1---- 1----1---- ---- 1----h
AE = 1.84 (MeV) (b)
H----1----1---- h
AE = 1.84 (MeV) (c)
Fig. 4-2-4: E xtractedd ( E G ) / d E a n d d2(E a)/dE 2 for reaction I86w + 160. The da ta points in (a) have been norm alised by tcR2 = 3520. The energy steps in (a) are 0.92 MeV ( 1 MeV in Lab system ) excepting the diamond ones a t th e h ig h en e rg ies w here th e energy steps are 1.84 MeV (2 MeV in Lab system ). C urvatu re d 2( E a ) / d E 2 from (b) d a ta m easu red w ith monotonically increasing energy and (c) all data. Each point is evaluated using two or three cross-sections; n e ig h b o u rin g p o in ts w ith the same symbol have a t le a s t one of these cross-sections in c o mmo n a n d a r e therefore correlated.
E c m (MeV)
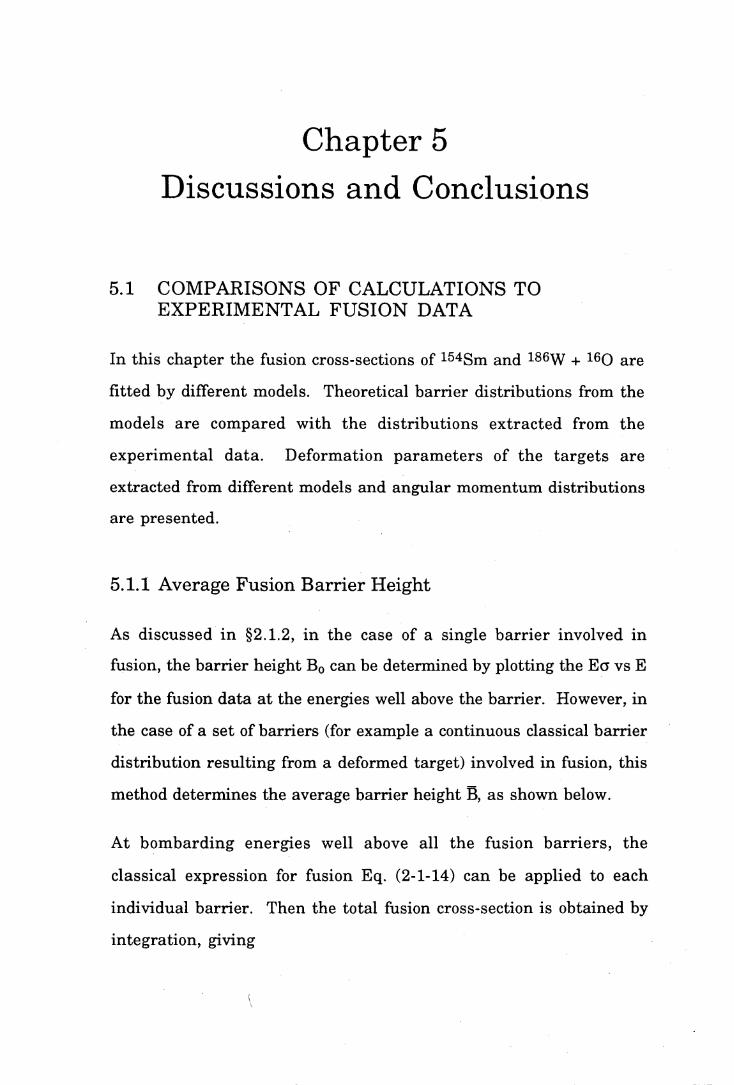
Chapter 5Discussions and Conclusions
5.1 COMPARISONS OF CALCULATIONS TO EXPERIMENTAL FUSION DATA
In th is chapter the fusion cross-sections of 154Sm and 186W + 160 are
fitted by different models. Theoretical barrier distributions from the
m odels are com pared w ith the d istribu tions ex tracted from the
experim ental da ta . D eform ation p a ram ete rs of the ta rg e ts are
extracted from different models and angular m om entum distributions
are presented.
5.1.1 Average Fusion Barrier Height
As discussed in §2.1.2, in the case of a single b a rrie r involved in
fusion, the barrier height B0 can be determ ined by plotting the E g vs E
for the fusion data a t the energies well above the barrier. However, in
the case of a set of barriers (for example a continuous classical barrier
distribution resu lting from a deformed target) involved in fusion, this
m ethod determ ines the average barrier height B, as shown below.
At bom barding energies well above all the fusion b a rrie rs , the
classical expression for fusion Eq. (2-1-14) can be applied to each
individual barrier. Then the total fusion cross-section is obtained by
in tegration , giving

152Bmax
a = tcR2 J ( 1 - g) D(B) dB (5-1-1)^min
Since JD(B) dB = 1, the above expression can be w ritten as
.j Bmax
o = 7iR2[ l - g J BD(B)dB] (5-1-2)^min
Now the in tegration is ju st the average barrier B, thus
a = 7cR2( 1 - § ) (E » Bm ax) (5-1-3)
This expression is the same as th a t for single barrie r of Eq. (2-1-14),
except th a t B replaces B0. Hence the expression (5-1-3) holds for
d ifferen t fusion b a rr ie r d istribu tions and the excitation function
behaves as if the average b a rrie r was a single b arrie r. For th is
reason, in the following the average B will be designated by B0 which
is extracted from high energy fusion data (as showing in Fig. 4-2-1
and listed on Table 4-2-6).
5.1.2 Flat Barrier Height Distributions
The fusion excita tion functions were fitted w ith the fla t b a rrie r
d istribution model using the recipe of Stelson [Ste90]. As discussed in
C hapter 2, the barrie r distribution width is defined by 2(B0 - T) and the
T can be found from the in tercept of a stra igh t line extended from the
linear region of the plotted data \ E a, to the E axis. The param eter Q,
which characterises the modulation of the edge of the flat distribution,
in Eq. (2-3-7) was varied to minimise the x 2 o f the theoretical fit to the
experim ental fusion excitation function. The param eters extracted
for the reactions 154Sm + 160 and 186W + 160 are listed on Table 5-1-1.

Table 5-1-1: The extracted B0, T (centre of mass system) from the experim ental data; the Q, with the best fit to the fusion excitation function, and associated x2 per point for the fits.
153
Reactions Bo(MeV) To(MeV) Q . (MeV) X 2
154Sm + 160 59.2 55.0 1.8 17
186\V -i- 16Q 68.6 64.4 1.1 3.3
The spectrum VE g vs E for the reaction of I86\y + 160 is shown in Fig.
5-1-1 (a). The solid symbols were used to extract the stra igh t line by
the least squares method. As required by Stelson’s recipe, these solid
symbols are the fusion cross-sections between 10 mb and 200 mb. It
appears th a t they represent the stra igh t line very nicely and the x2 per
point of the least square fitting is very close to one (-1.25). Since, in the
suggested linear region of 'V Eö, E g ^ E2 then the curvature of E g ,
d2(Ea)/dE2, should be a constant. Indeed, in (b) of this figure, there is
a p lateau appearing in the extracted d2(Ea)/dE2 from the data in the so
called "linear" region of V E g.
The value of T extracted from (a) of the figure is 4.2 MeV less th an B0.
The dashed line in Fig. 5-1-1 (b) shows the flat b a rrie r d istribution
whose w id th is 2(B0 - T) = 8.4 MeV. The solid line shows the
m odulated b a rr ie r d istribu tion w ith Q = 1.1 MeV w ith which the
calculation yields a best fit to the fusion excitation function. The
theoretical fit to the fusion excitation function and the ratio of the
theoretical calculation to the experim ent for each m easured point, by
using th is m odulated barrie r d istribution model, are shown in Fig. 5-
1-2 (a) and (b). The x2 per point for this fit is -3.3.
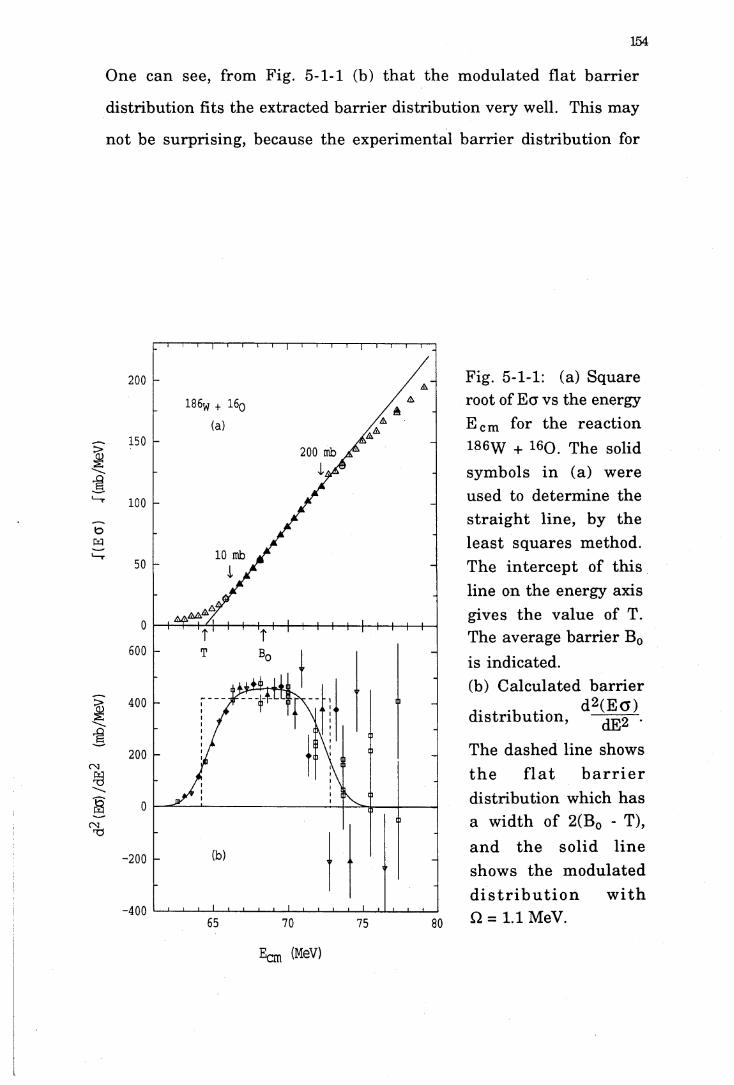
d2(E
G)/
dE2
(mb/
MeV
) [(
Eo
) 1
(mb/
MeV
)
154
One can see, from Fig. 5-1-1 (b) th a t the m odulated fla t b a rrie r
distribution fits the extracted barrier distribution very well. This may
not be surprising, because the experim ental b a rrie r d istribution for
200 mb
10 mb
65 70 75 80
Fig. 5-1-1: (a) Square root of E g v s the energy E cm for the reaction 186W + 160. The solid sym bols in (a) w ere used to determ ine the s tra ig h t line, by the least squares m ethod. The in te rcep t of th is line on the energy axis gives the value of T. The average barrier B0 is indicated.(b) C alculated b a rrie r
d 2(E o )d is trib u tio n , dE2
The dashed line shows th e f l a t b a r r i e r d istribution which has a w idth of 2(B0 - T), and th e so lid lin e shows the m odulated d i s t r i b u t i o n w ith Q = 1.1 MeV.
E o n (MeV)
155
• fu l l d ist .v ± 2°Q= 1.1 MeV
64.4 MeVB0= 68.60 MeV
a 1.5
l . o
~ 0.5
Fig. 5-1-2: (a) The fusion excitation function of 186W + 160. The curve is the result of the calculation using the modulated flat barrier distribution of Fig. 5-1-1 (b). (b) The ratio of calculation to experiment.

156
th is reaction is sym m etrical about the B0, and the recipe of Stelson
applies specifically to such cases. However, the sym m etric barrie r
d istribution is not applicable for the reaction 154Sm + 160 , since its
d istribution is asymmetric.
Fig. 5-1-3 (a) shows v E c vs E for the reaction 154Sm + 160 . As in the
I86\v + 160 case, the solid symbols in (a) were fitted by a stra igh t line.
However, th is s tra ig h t line does not fit the symbols rela ted to the
fusion cross-sections from 10 to 200 mb, as suggested by Stelson
[Ste90]. The a/ E g appears linear a t the range related to the fusion
cross-sections from 33 mb to 340 mb, which are much larger th an
Stelson suggested and much larger than th a t in the case of 186\ v + 160
as well. The x2 per point of the least square fitting is -12.6; about 10
tim es larger th an th a t of 186 w case. The poor fit of the stra igh t line to
the plot v E g is clearly shown in (b) of this figure; in contrast to the
I86\v case there is no p lateau appearing in the extracted curvature,
d2(EG)/dE2, from data in the region where the a/ e g is "linear”.
As in the 186W case, the extracted T-value is 4.2 MeV less th an B0.
The dashed line in (b) shows the flat barrier distribution w ith width
2(B 0 - T) = 8.4 MeV. The solid line shows the m odulated b arrie r
distribution giving the optimum fit to the data. A large value of Q = 1.8
MeV is required, so as to fit all the cross-sections below 33 mb. The
sym m etry of th is m odulated barrie r distribution still rem ains, but the
shape of the b a rrie r d istribu tion is far from flat. The m odulated
d istribu tion fits the barrie rs well a t energies lower th an B0, but, it
cannot reproduce the barriers higher th an B0; since the experim ental
ba rrie r d istribution is clearly not sym m etrical. The fit to the fusion
excitation function is shown in Fig. 5-1-4 (a) and the ratio of the

d2 (E
g) /
dE2
(mb/
MeV
) f(
E g
) /(m
b/M
eV)
157
theoretical calculation to the experim ental cross-section is illustra ted
in (b) of this figure. An average x2 of 17 per point is obtained.
200 mb
10 mb
55 60 65 70
Fig. 5-1-3: (a) Square root of E a vs the energy
for the reactioncm
154Sm + 160. The solid sym bols in (a) w ere used to determ ine the s tra ig h t line, by the least squares m ethod. The in te rcep t of th is line on the energy axis gives the value of T. The average barrier B0 is indicated.(b) C alculated b a rrie r
d2(Ea)d is tr ib u tio n , dE2The dashed line shows th e f l a t b a r r i e r d istribution which has the w idth of 2(B0 - T), and th e so lid line shows the m odulated d i s t r i b u t i o n w ith Q = 1.8 MeV.
Ecm (MeV)

158
• f u l l d is t .v ± 2°ft = 1.8 MeVT = 55 MeVB0= 59.2 MeV
a 1.5
^ 1.0
~ 0.5
50 60 70 80 90 100
Eon (MeV)
Fig. 5-1-4: (a) Fusion excitation function of 154Sm + 160. The curve is the result of the calculation using the modulated flat barrier distribution of Fig. 5-1-3 (b). (b) The ratio of calculation to experiment.
5.1.3 Barrier Distribution Associated With Static Deformation
The recipe in Stelson et al is an empirical one, based on a flat and
sym m etric distribution of barriers. It makes no a ttem p t to take the
properties of the in te rac ting nuclei into account. As discussed in
C hapter 2, the static deformation of the projectile and/or target results
in a d istribution of fusion barriers, and the targets , studied in th is
work, are well deformed.
To illustra te the effects of the deformation I have used a simple model
which includes quadrupole deformation, to first order, in the nuclear
potential, w hilst still using a monopole (spherical) Coulomb potential.
T hen the shape of a nucleus w ith a quadrupo le deform ation
param eter ß2, can be represented by (see Chapter 2)
Rt(6) = Rttl + ß2Y2oO)] (5-1-4)
The b a rrie r height of a deformed ta rge t in teracting w ith a spherical
projectile, can be approxim ately w ritten as [Row91]
B(0) = B0[ l - ^ Y 2o(e)] (5-1-5)
w here
Rt - 1.2 At1/3(fm)
and Rc — ZtZ2 e2B0
It has been show th a t the barrier height B(0) in equation (5-1-5) varies
m onotonically w ith in c id en t angle 9 of the projectile, and the
distribution of barrier heights can be found [Bac85, Row91] by
__________1_________
V6a(B0 + 0.5a - B)4BD(9)d0 = sin0d0 = D(B)dB

160
th u s
D(B) = ----------------■ =V 6a(B0 + 0.5a - B)
w here
nr ß2ßoRta= V4i“ RT"
(5-1-6)
(5-1-7)
Ignoring the changes of the barrier position R and curvature fro) with
angu lar m om entum Ik, the fusion cross-section for each barrier can
be w ritten as [Won73]
ftcoR2 . 2tu (E - B) ,g(E, B) = 2e ” ln [ l + exp(---- — ---- )] (5-1-8)
The total fusion cross-section for the full d istribution of barriers D(B)
can be calculated analytically
o(E)
B0 + o.5oc
ÄcüR2 , r (E - B)J ~2E~ I11 1 + exP( ~j~B0 - a
)] , 1 = - < i B\ 6a(B0 + 0.5a - B)
(5-1-9)
From th is expression the sm oothed d istribu tion D(E) can be also
obtained
D(E)
B0 + 0 .5 a
d2(Eo) ^ f 2k ex_____________1________dE2 = J f tc o (l + ex)2 -^6a(B0 + 0 . 5 a " - B ) °
B0 - a
where x = — (E - B) as it is defined by Eq. (2-3-19). ftco
(5-1-10)

161
The best fit to the fusion excitation function can then be found by
adjusting the deform ation param eter p2 , hence the param eter a , in
the expressions (5-1-9) and (5-1-10).
Fig. 5-1-5 illu stra tes the barrie r d istribution for this classical, static
deformation model for the reaction of 154Sm + 160 . The fine line in (a)
is the classical barrier distribution D(B) for a target with a quadrupole
deform ation p a ram eter p2 = 0.23. This d istribution is smoothed by
b a rrie r penetration , and the heavy line shows the smoothed barrier
distribution D(E) of the expression (5-1-10). These distributions were
obtained with the average barrie r B0 = 59.2 MeV and nR2 = 3300 mb,
both obtained from the high energy fusion data (as discussed in §4.2.2
and §5.1.1), and the barrier curvature /ico = 4.3 MeV was taken from
Ref. [Row91a]. As discussed in §4.2.2, instead of the energy steps
dE —> 0 in d2(E a)/dE 2, energy steps of AE = 1.81 MeV in the centre of
m ass system have been used to ex tract the experim ental b a rrie r
d istribu tion A2(E g )/AE2. This finite energy step introduces a fu rther
smoothing of the barrier distribution. This is illustra ted by the dashed
line in Fig. 5-1-5 (a) which shows the D(B) ex tracted from the
theoretical cross-sections; trea ting them in the same m anner as the
experim ental data , using energy steps AE = 1.81 MeV. Only m inor
differences were found in the regions where the cu rvatu re of the
barrie r distribution d2(Ea)/dE2 is changing very quickly.
The targe t deformation param eter p2 was adjusted and the best fit was
obtained w ith p2 = 0.23, consistent w ith th a t from previous fusion
analyses [Sto78, Sto80], bu t significantly lower than the value of ß2 ~
0.3 extracted from the Coulomb excitation m easurem ents (see the
la te r discussion and references [Fis77, Har79] for detail). The larger

162
ß2-value results in the much wider distribution in this simple model,
as shown in Fig. 5-1-5 (b).
Fusion cross-sections calculated with th is model are compared with
experim ent in Fig. 5-1-6. The agreem ent is good for all bu t the lowest
energies, w here the sm oothed theoretical b a rr ie r d istribu tion is
I I I I
55 60 65 70
Fig. 5-1-5:C u rv a tu re d2(E a ) /d E 2 from (a) data m easured w ith m o n o to n ic a lly increasing energy and (b) all data. The curves in (a) are the classical b a r r ie r d is tr ib u tio n s for a ta rg e t w ith a quadrupole deform ation p a ram eter ß2 = 0.23 (fine line), smoothed by b a r r i e r p e n e t r a t io n (heavy line) and the effect of analysis w ith AE = 1.81 MeV (dashed line). The curves in (b) c o rre sp o n d to th e sm oothed d is tr ib u tio n (heavy line) from (a), th e d is t r ib u t io n for ß2 = 0.3 (short dash) and th e m o d u la te d f la t b a r r i e r d i s t r ib u t io n (long dash).
Eon (MeV)

163
• fu l l d ist .v ± 2°fc = °-23ha> = 4.3 MeV
Fig. 5-1-6: (a) Fusion excitation function of 154Sm + 160. The curve is the result of the calculation using the classical barrier distribution of Fig. 5-1-5 (b). Only the quadrupole deformation of the target was taken into account in the calculation, (b) The ratio of calculation to experiment.
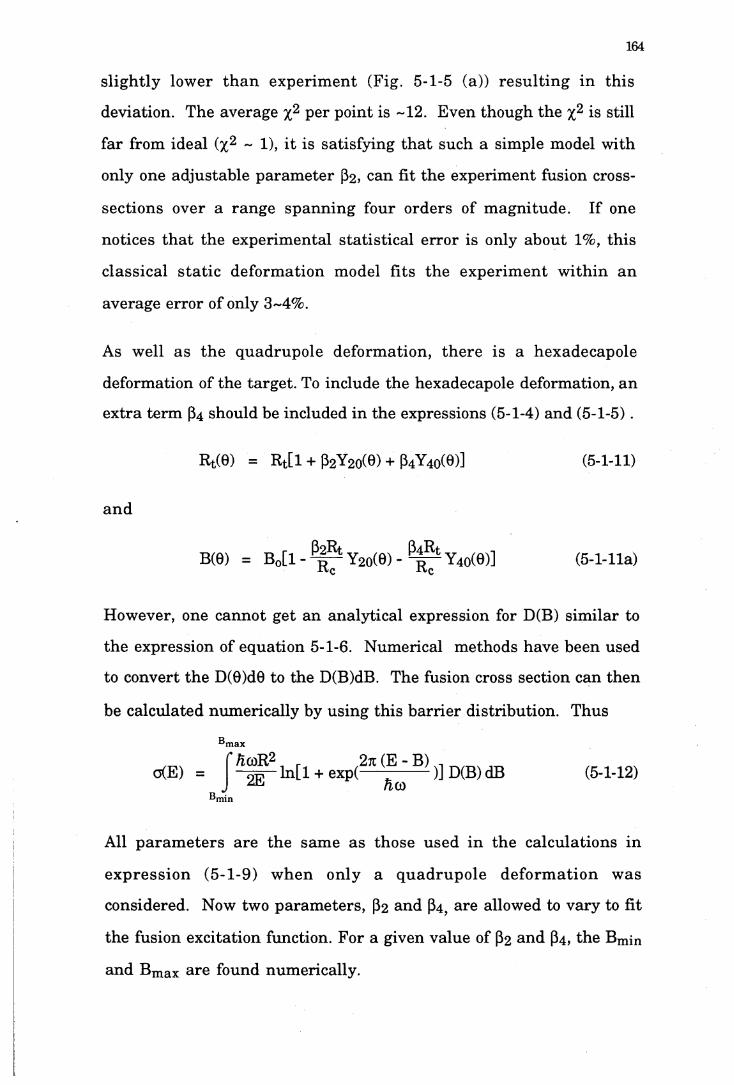
164
s l ig h tly lo w er th a n e x p e r im e n t (F ig . 5-1-5 (a)) r e s u l t in g in th is
d ev ia tion . T he averag e x 2 p e r p o in t is ~12. E ven th o u g h th e x 2 is still
fa r from id ea l (x2 ~ 1), i t is sa tis fy in g th a t su ch a sim ple m odel w ith
only one a d ju s ta b le p a ra m e te r ß2, can fit th e e x p e rim en t fusion cross-
sec tio n s over a ra n g e s p a n n in g fo u r o rd e rs of m a g n itu d e . I f one
n o tices th a t th e e x p e r im en ta l s ta t is t ic a l e r ro r is only ab o u t 1%, th is
c la s s ic a l s ta t ic d e fo rm a tio n m odel fits th e e x p e r im e n t w ith in a n
av erag e e rro r of only 3 -4% .
As w ell a s th e q u a d ru p o le d e fo rm a tio n , th e re is a h ex ad ecap o le
d e fo rm atio n of th e ta rg e t. To inc lude th e hexadecapo le defo rm ation , a n
e x tra te rm ß4 shou ld be inc luded in th e exp ressions (5-1-4) a n d (5-1-5) .
R t(0) = R t [ l + ß2Y20(9) + ß4Y4O(0)] (5-1-11)
a n d
B(0) B 0[ lß2RtRc
Y20(0) -ß4RtRc Y4O(0)] (5 -1 -lla )
H ow ever, one c a n n o t g e t a n a n a ly tic a l ex p ress io n for D(B) s im ila r to
th e ex p ress io n of e q u a tio n 5-1-6. N u m erica l m eth o d s h ave b een used
to co n v ert th e D(0)d0 to th e D(B)dB. T he fusion cross sec tion can th e n
be c a lc u la te d n u m e ric a lly by u s in g th is b a r r ie r d is tr ib u tio n . T hu s
cXE)
^m ax
* /icoR2 2E
Bm in
l n [ l + exp(2n (E - B)
ftco)] D(B)dB (5-1-12)
All p a ra m e te r s a re th e sam e a s th o se u se d in th e c a lc u la tio n s in
e x p re s s io n (5 -1 -9 ) w h e n o n ly a q u a d ru p o le d e fo rm a tio n w as
considered . Now tw o p a ra m e te rs , ß2 an d ß4> a re allow ed to v a ry to fit
th e fusion ex c ita tio n function . F o r a g iven v a lu e of ß2 a n d ß4, th e B min
a n d B max a re found n u m erica lly .

165
For the reaction of 154Sm + 160 , the best fit was found when ß2 and ß4
had the values of 0.24 and 0.030 respectively; again they are significant
sm aller than those extracted from Coulomb excitation m easurem ents
[F is77, H ar79]. F ischer e t al ex trac ted the nucleus charge
deform ation param eters ß2 , ß4 from their m easured electric moments
E2 and E4, by assum ing a deformed Ferm i distribution with diffuse
nuclear surface. The radius param eter r 0 and the diffuseness a which
they used ranged from r 0 = 1.10 fm, a = 0.6 to r0 = 1.16 fm, a = 0.66,
which yielded values of ß2 from 0.309±0.005 to 0.277±0.005 and ß4 from
0.122±0.020 to 0.096±0.019 respectively . The reasons for the
d isagreem ent of the extracted deform ation param eters ß2 , ß4 from
fusion and from Coulomb excitation m easurem ents [Fis77, Sto80] have
rem ained unknown for a long time. This will be discussed in more
details in §5.1.4 when a more realistic model is used in the analysis of
our high precision data.
Fig. 5-1-7 (a) shows the best fit to the fusion excitation function. The
ratios of the theoretical calculations to the experim ental cross-sections
are illustra ted in Fig. 5-1-7 (b). This calculation gives a better fit to the
fusion excitation function. The average x2 per point obtained from this
fit is reduced to 7.4 from 12 obtained without ß4 as discussed before.
Fig. 5-1-8 shows th a t the comparison of the barrie r distributions from
the calculations w ith and w ithout the ß4 deform ation. There is a
sm all bu t a significant change in the shape of the d istribution when
the ß4 deformation is included.
Fig. 5-1-9 shows the calculated b a rrie r d istribu tions of 186W + 160
obtained from the classical model with the quadrupole deformation of
target, ß2 = 0.195, w ithout (a) and with (b) the hexadecapole deformation.

166
o full dist.v ± 2h(0 = 4.3 MeV
ß4 = 0.03
a 1.5
^ 1.0
~ 0.5
Fig. 5-1-7: (a) Fusion excitation function of 154Sm + 160. The curve is the result of the calculation using the classical barrier distribution of Fig. 5-1-5 (b). Both the quadrupole and hexadecapole deformations of target were taken into account in the calculation, (b) The ratio of calculation to experiment.
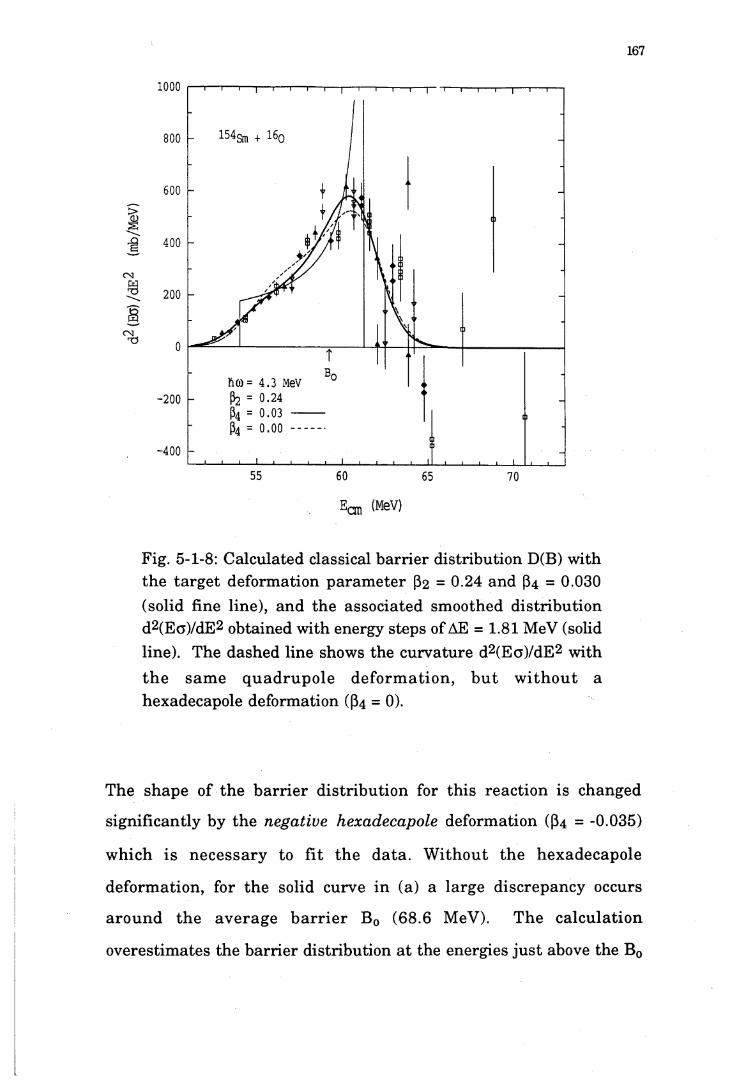
167
h ö ) = 4 . 3 MeVf c = 0 - 2 4ß4 = 0 . 0 3ß4 = 0 . 0 0
(MeV)
Fig. 5-1-8: Calculated classical barrier distribution D(B) with the ta rg e t deform ation param eter ß2 = 0.24 and ß4 = 0.030 (solid fine line), and the associated smoothed d istribution d2(Eo)/dE2 obtained with energy steps of AE = 1.81 MeV (solid line). The dashed line shows the curvature d2(Ea)/dE2 with th e sam e q u ad ru p o le d e fo rm ation , b u t w ith o u t a hexadecapole deformation (ß4 = 0).
The shape of the b a rrie r d istribu tion for th is reaction is changed
significantly by the negative hexadecapole deform ation (ß4 = -0.035)
w hich is necessary to fit th e da ta . W ithou t the hexadecapole
deform ation, for the solid curve in (a) a large discrepancy occurs
a ro u n d the average b a rr ie r B0 (68.6 MeV). The calcu lation
overestim ates the barrier distribution a t the energies ju s t above the B0
d2(E
ff) /d
E2
(mb/M
eV)
168
and underestim ates them a t the energies ju s t below the B0. A negative
hexadecapole deform ation dram atically improves the fit as shown in
Fig. 5-1-9 (b). As in the Sm case, the extracted ß2 = 0.195 and ß4 = -0.035
are system atica lly sm aller th a n those ex trac ted from Coulomb
excitation m easurem ents (ß2 = 0.224 ~ 0.244 and ß4 = -0.088 ~ -0.178).
ho) = 4 .0 MeV
ß4 = 0.000
hco = 4 .0 MeVfc = 0-195ß4 = - 0 .0 3 5
65 70 75 80
Fig. 5-1-9: C alculated cu rva tu re d2(E a )/d E 2 o b ta in e d w ith th e energy steps of AE = 1.84 MeV for th e perm anently deformed target 186W. (a) For the target w ith quadrupole d e f o r m a t i o n on ly (ß2 = 0.195), (b) w iththe sam e quadrupole deform ation in (a), bu t w ith a hexadecapole defo rm ation as well (ß4 = -0.035). The dash curves correspond to the c lassical b a rr ie r d istribu tions resu lting from the deform ation of ta rg e t and the solid curves correspond to the sm oothed b a rr ie r d istributions.
Eon (MeV)

169
o fu l l d ist .a ± 2°hco = 4.0 MeVfc = 0.195ß4 = -0.035
_ 1.0
0.5
^ 1.0 A A A
ß4 = -0.035
Fig. 5-1-10: (a) Fusion excitation function of 186W + 160. The curves are the results of the calculations using the classical barrier distributions of Fig. 5-1-9. The dashed line corresponds to a quadrupole deformation of target only. The solid line corresponds to quadrupole and hexadecapole deformations of target, (b) and (c) the ratios of these calculations to the experiment.
170
Fig. 5-1-10 shows the calculated fusion excitation functions, with (solid
line) and w ithou t (dashed line) the hexadecapole deform ation,
compared w ith the m easured data; the average x2 per point for these
two calculations are ~3.6 and ~11 respectively. For energies higher
th an B0 the calculations are alm ost identical and fit the fusion cross
sections well. However, a t lower energies the ß4 = 0 calculation
overestim ates the fusion.
The param eters of the best fit, used in the classical model, are listed in
Table 5-1-2.
Table 5-1-2: The param eters used in the classical model, w ith which the calculations have the best fit to the fusion excitation function, and associated x2 per point for the fits.The energy indicated is in the centre of m ass system.
Reactions B0(MeV) jtR2 ß2 ß4 X 2
154Sm + 160 59.2 3300 0.24 0.030 7.4
1 8 6 \y + 1 6 0 68.6 3520 0.195 -0.035 3.6
Concluding th is section, various calculations using simple models
appear to fit the fusion excitation function alm ost equally well (2~4%).
However, they do not equally well reproduce the barrier distribution of
the reaction system. For instance, w ithout the negative hexadecapole
deform ation the b a rr ie r d is trib u tio n of 186W + 160 can not be
reproduced. The deform ation param eters ß2 , and ß4 deduced from
fusion in the simple classical deformation model are not quantitatively
consistent w ith those deduced from Coulomb excitation. This may not
be su rp ris in g because the sim ple m odels do not consider the

171
in te rn u c le a r po ten tia l properly; for in stance , the effects of the
m ultipole Coulomb poten tial resu lting from the deform ed charge
distribution of the nucleus are not taken into account. These effects
deform ation param eters are discussed below.
5.1.4 Deformation Param eters Determ ined From Fusion Excitation Function
In the above analysis, w ith the simple static deformation model, only
the monopole term of the Coulomb interaction was used. However, the
monopole in te rac tion is not adequate for large deform ations. For
more accurate calculations, the Coulomb poten tial for a deform ed
charged distribution should have been used. This is derived from the
general formulae of reference [Ald75] and, to first order in ß2 , is given
where Z x and Z2 are the atomic num bers of target and projectile and Rt
is the m ean radius of the target, as defined earlier.
It can be easily shown th a t expanding the above a t Rc = Z1Z2e2/B0 and
ignoring the higher order ß2 term s one gets
and the possible reasons for the above discrepancy in the extracted
by
(5-1-13)
B(0) = B0[ l - - g — Y2o(0) + 5 ^ 2” Y2o(0)] l l />c
(5-1-14)
Com paring th is w ith Eq. 5-1-5 for the barrie r height of the monopole
Coulomb poten tial, one can see th a t it gives essen tia lly the sam e

172
distribution of barrier heights if p2( l - 3Rt/5Rc) is equal to the p2-value
obtained using the spherical Coulomb potential. For 154Sm + 160 ,
Rt/Rc ~ 0.6, implying th a t the p2 , extracted in the last section (§5.1.3)
for 154Sm, was about 64% of the value expected using a more realistic
deformed Coulomb potential.
It has been shown, in the course of th is work [Lei93], th a t in the
earlie r analyses of the fusion da ta for 160 induced reactions on
isotopes of Sm performed by other authors [Sto78,81, DiG86, DiG89],
th e q u a d ru p o le d e fo rm atio n p a ra m e te r , p 2 , had also been
underestim ated for various reasons. This may explain why the ß2
extracted in the las t section is consistent with their resu lt of p2 = 0.2 ~
0.23.
In order to investigate the above effect in more details, calculations of
th e o r ie n ta t io n d e p e n d e n t b a r r ie rs , w ith o u t th e p rev ious
approxim ations, and including the effects of angu lar m om entum l
have been performed.
The n uc lear p o ten tia l, VN(r,0 ), is essen tia lly taken to have an
exponential tail and may therefore be simply param eterised by its
surface diffuseness a and po ten tial s tren g th a t some radius. The
advantage of using the exponential form is th a t the potential can also
be param eterised in term s of the resu lting b a rrie r height B0 for the
spherical case. Since a t the barrier position R
dVN(r) _ dVc dr d r
we can param eterise VN(r) as
a Z ^ e 2 = 'R R
r - Rexp(- i )VN(r) a (5-1-15)

173
and
B0 = Vn(R) + VC(R) ZjZ2e2 . a_R 1 " R (5-1-16)
To account for the angular dependence of the radius of the deformed
target, the exponent in VN(r,0) can be w ritten as [Gut73, Row89]
VN(r,0) a Z ^ e 2 , r - R(9)x :------------ exp(-— ----- ) (5-1-17)
w here
R(0) = R + Rt[ß2Y2o(6)+ p4Y4o(0)l (5-1-18)
where the targe t radius Rt can be obtained from its atomic num ber At,
th u s
Rt r A1M) - t t - i1/3 (5-1-19)
and 1.06 fm was used for the radius param eter r 0.
The Coulomb potential, Vc(r,0), now including the quadrupole and
hexadecapole term s and expanded to order ß2 and ß4, becomes
2 ____ 4
Vc(r,e) = B0[ l + ! (ß, + -y! )Y20(e) + I^ (ß4 + ß2 )Y40(e)]
(5-1-20)
Knowing the VN and Vc, and including the usual angular m omentum
barrie r, h 2l{l + l)/2pr2, the 0 dependent in ternuclear potential V)(r,0)
is obtained.
The b a rr ie r he igh t, Bz(0), position Rz(0) and cu rva tu re /icoz are
calculated num erically for each l and ta rg e t orien tation angle. The
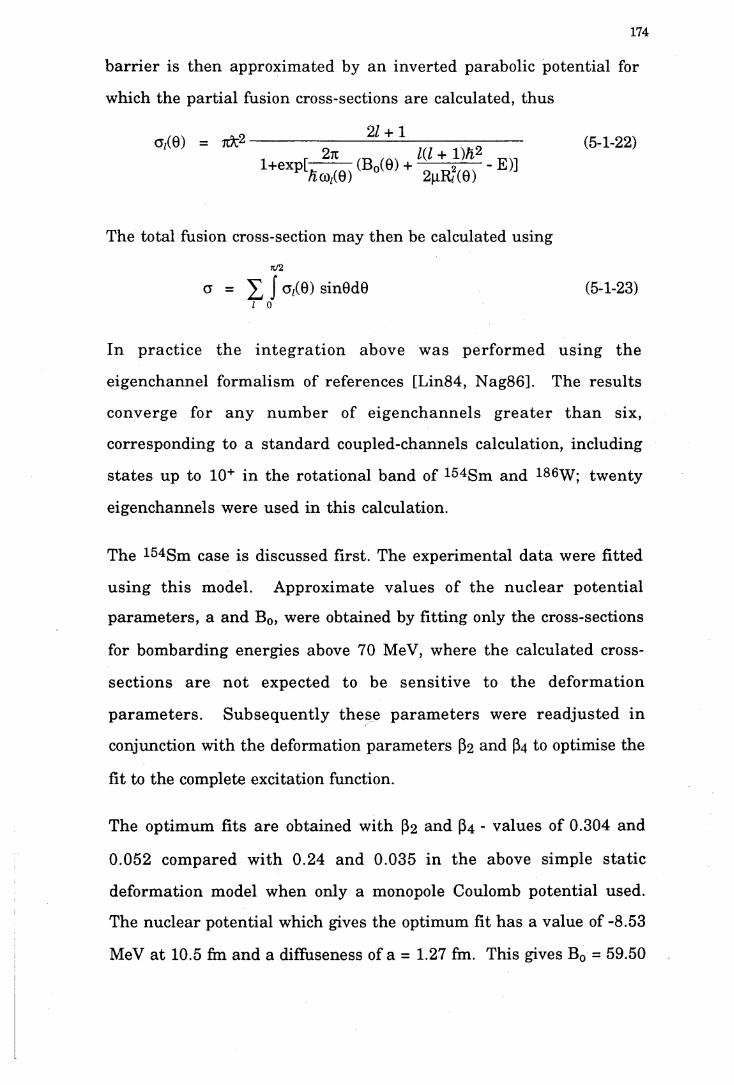
174
b a r r i e r is th e n a p p ro x im a te d b y a n in v e r te d p a ra b o lic p o te n t ia l fo r
w h ic h th e p a r t i a l fu s io n c ro ss -se c tio n s a re c a lc u la te d , th u s
a /(0 ) = 7i k 221 + 1
l+ e x p [/ico ,(0)
(Bo(0) +1(1 + l ) h 22pR?(0)
- E ) ](5-1-22)
T h e to ta l fu s io n c ro ss -sec tio n m a y th e n be c a lc u la te d u s in g
71/2
° = X 1 ° ' (e) s in 6 d e (5-1-23)l 0
I n p r a c t i c e th e i n t e g r a t i o n a b o v e w a s p e r f o r m e d u s in g th e
e ig e n c h a n n e l fo rm a lis m o f re fe re n c e s [L in 8 4 , N a g 8 6 ]. T h e r e s u l t s
c o n v e rg e fo r a n y n u m b e r o f e ig e n c h a n n e l s g r e a t e r t h a n s ix ,
c o r re s p o n d in g to a s t a n d a r d c o u p le d -c h a n n e ls c a lc u la t io n , in c lu d in g
s t a t e s u p to 10+ in th e ro ta t io n a l b a n d o f 154S m a n d 186W ; tw e n ty
e ig e n c h a n n e ls w e re u s e d in th is c a lc u la tio n .
T h e 154S m ca se is d is c u s s e d f ir s t . T h e e x p e r im e n ta l d a ta w e re f i t te d
u s in g th i s m o d e l. A p p ro x im a te v a lu e s o f th e n u c l e a r p o te n t ia l
p a r a m e te r s , a a n d B 0, w e re o b ta in e d by f i t t in g o n ly th e c ro ss -se c tio n s
fo r b o m b a rd in g e n e rg ie s ab o v e 70 M eV , w h e re th e c a lc u la te d cro ss-
s e c t io n s a r e n o t e x p e c te d to b e s e n s i t iv e to th e d e f o r m a t io n
p a r a m e te r s . S u b s e q u e n t ly th e s e p a r a m e te r s w e re r e a d ju s t e d in
c o n ju n c tio n w ith th e d e fo rm a tio n p a r a m e te r s ß2 a n d ß4 to o p tim ise th e
f i t to th e co m p le te e x c ita t io n fu n c tio n .
T h e o p tim u m f i ts a r e o b ta in e d w ith ß 2 a n d ß 4 - v a lu e s o f 0 .3 0 4 a n d
0 .0 5 2 c o m p a re d w i th 0 .2 4 a n d 0 .0 3 5 in th e a b o v e s im p le s ta t ic
d e fo rm a tio n m o d e l w h e n o n ly a m o n o p o le C o u lo m b p o te n t ia l u se d .
T h e n u c le a r p o te n t ia l w h ich g ives th e o p tim u m f it h a s a v a lu e o f -8 .5 3
M eV a t 10.5 fin a n d a d iffu se n e ss o f a = 1.27 fm . T h is g iv es B 0 = 59 .50

175
MeV and the resulting free of the spherical barrier at l = 0 is 3.4
MeV. The value of a = 1.27 fm is higher than that obtained from elastic
scattering data [Chr76]. However, a double-folded potential for heavy
ions [Sat791 does produce a rather deep potential with an effective
surface diffuseness of the same order as that obtained in this analysis.
o full dist.
fc = 0 . 3 0 4ß4 = 0 . 0 5 2
Fig. 5-1-11: Fusion excitation function of 154Sm + 160. The curve is the result of the calculation using the classical barrier distribution (see text for details and see Fig. 5-1-12 for the smoothed barrier distribution). The deformation parameters of the target are listed on the figure.
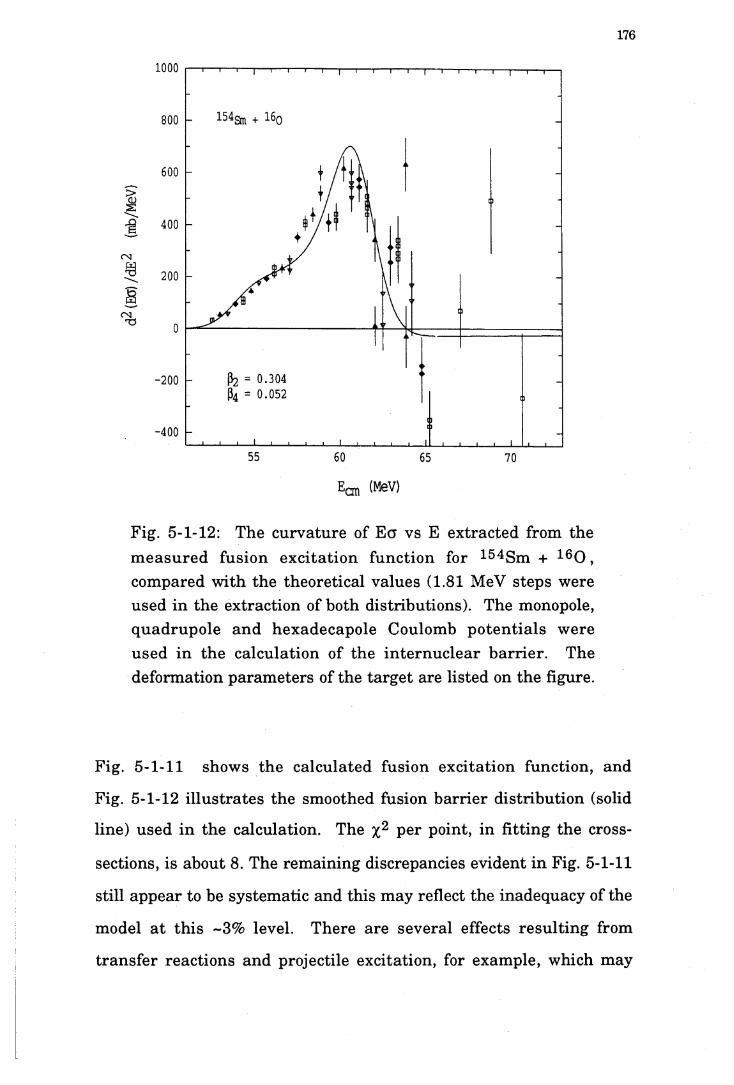
176
ß2 = 0 . 3 0 4ß4 = 0 . 0 5 2
55 60 65 70
Fig. 5-1-12: The curvature of E g vs E extracted from the m easu red fusion excita tion function for 154Sm + 160 , compared w ith the theoretical values (1.81 MeV steps were used in the extraction of both distributions). The monopole, quadrupole and hexadecapole Coulomb p o ten tia ls were used in the calculation of the in te rn u c lea r barrie r. The deform ation param eters of the targe t are listed on the figure.
Fig. 5-1-11 shows the calculated fusion excitation function, and
Fig. 5-1-12 illu stra tes the smoothed fusion b arrie r d istribution (solid
line) used in the calculation. The %2 per point, in fitting the cross-
sections, is about 8. The rem aining discrepancies evident in Fig. 5-1-11
still appear to be system atic and this m ay reflect the inadequacy of the
model a t th is ~3% level. There are several effects resu lting from
tran sfe r reactions and projectile excitation, for example, which may

177
affect the theoretical distribution bu t are more difficult to be taken into
account.
Though the quality of fit to the experimental data over the whole range
of the excitation function is alm ost the same as the simple classical
model, the value of ß2 is now, however, consistent w ith other non-
fusion estim ates which vary from 0.26 to 0.34 [Ste71, Fis77, Ram86].
The value ß4 is also w ithin the range of previously published values,
0.044 to 0.13 [Ste71, Bru74, Fis77]. These ranges of deform ation
param eters resu lt, in large degree, from the choice of the Coulomb
radius param eter; analyses of Coulomb excitation data [Sha74, Lee74,
Lee75, Fis77] which use a radius param eter of -1.10, close to our value
of 1.06, all yield values of ß2 close to 0.30 and ß^s near 0.11. The
inelastic scattering da ta of reference [Hen68, Hen73] gives ß2 = 0.29
and ß4 = 0.06, when adjusted to th is same rad ius param eter. The
agreem ent betw een these resu lts and the new fusion analysis is
rem arkable for th is case though there is uncertain ty in the choice of
the nucleus rad ius r 0. However, the sensitiv ity of the deform ation
param ete rs to the choice of rad ius is sm all in th is model; a 10%
increase in radius gives -5% decrease in the beta's. Thus it is clear
th a t the in te rp re ta tion of fusion for th is reaction does require m uch
larger deform ation param eters than those previously published. It is
also evident th a t the fusion excitation function is not only sensitive to
the ß2 deform ation b u t also to the higher orders of the deform ation
such as the ß4 deformation.
Fig. 5-1-13 (a) show s the typical shapes of calcu lated b a rr ie r
distributions associated with a spherical projectile incident on a target
w ith a positive quadrupole deform ation (prolate shape, ß2 > 0). The
solid line in (a) shows the barrier distribution associated to the target
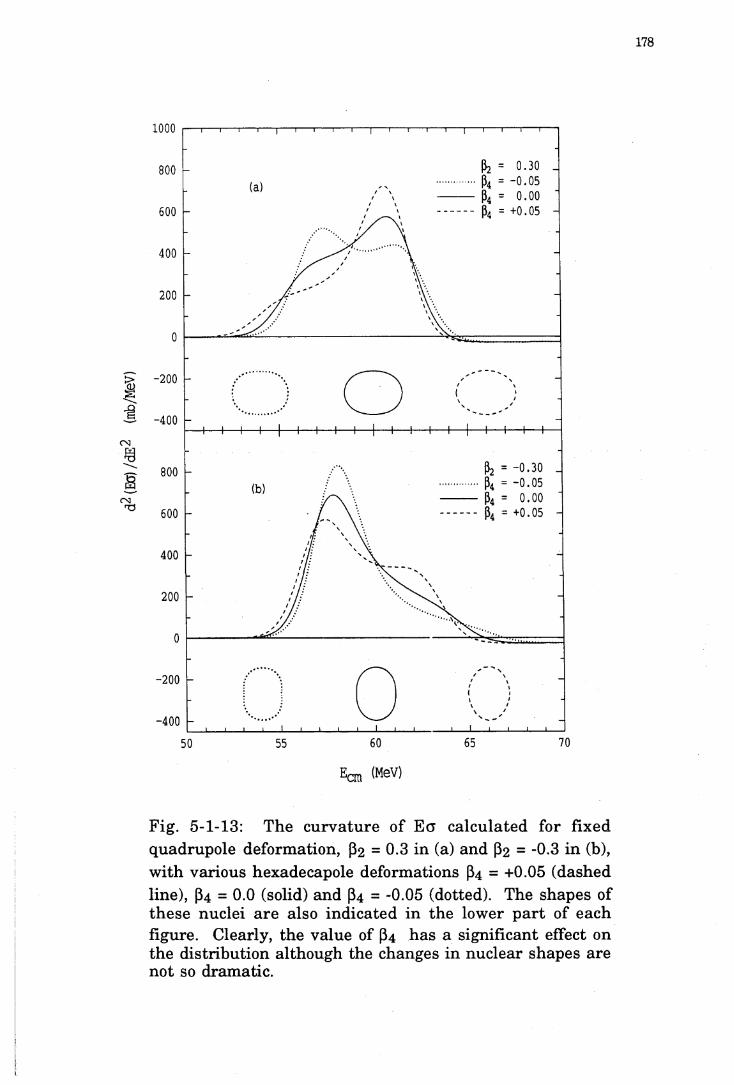
178
ß2 = 0 . 3 0ß4 = -0.05
ß4 = +0.05
ß2 = -0.30
ß4 = 0.00ß4 = +0.05
Fig. 5-1-13: The cu rva tu re of E g calcu lated for fixedquadrupole deform ation, ß2 = 0.3 in (a) and ß2 = -0.3 in (b), w ith various hexadecapole deform ations ß4 = +0.05 (dashedline), ß4 = 0.0 (solid) and ß4 = -0.05 (dotted). The shapes of these nuclei a re also indicated in the lower p a rt of each figure. Clearly, the value of ß4 has a significant effect on the distribution although the changes in nuclear shapes are not so dram atic.

179
w ith a positive quadrupole deformation only, while the dot and dashed
lines are associated with the same quadrupole deformation bu t w ith a
negative and a positive hexadecapole deform ation respectively .
Clearly, the dashed line, with the positive hexadecapole deformation,
represents best the experim ental barrier distribution of 154 Sm + 160 .
Fig. 5-1-13 (b) shows the other typical shapes of barrier d istributions
associated with reactions induced by a spherical projectile incident on
a ta rg e t w ith negative quadrupole deformation (oblate shape, ß2 < 0).
The shapes are significantly different w ith those of (a), though there
m ay be some confusion a t some stage between a prolate ta rg e t w ith
negative ß4 deform ation and an oblate ta rg e t w ith positive ß4
deform ation. However, since there are few oblate deformed nuclei,
th is will not resu lt in confusion for the determ ination of the signs of
deform ation p a ram ete rs for m ost nuclei. Q ualita tively , w ithout
looking a t the details of the distribution, the signs of the deformations
param eters, ß2 , ß4 , can be easily determined.
Fig. 5-1-14 shows the calculated fusion excitation function which has
the best fit to the data for reaction 186W + 160. The smoothed barrier
d istribu tion used in the calculations is shown in Fig. 5-1-15. The
nuclear potential which gives the optimum fit has a value of -9.1 MeV
a t 10.9 fm and a diffuseness of a = 1.27 fm. This gives B0 = 69.03 MeV
and the resulting ^co of the spherical barrier a t / = 0 is 3.5 MeV. Again
the value of a = 1.27 fm is h igher th an th a t obtained from elastic
scattering da ta [Chr76]. The param eters ß2 and ß4 for the optim um
fits are 0.295 and -0.023 respectively. This, however, overestim ates the
ß2-value by 20 ~ 30%, and underestim ates the ß4-value compared with
other non-fusion estim ates of ß2 and ß4 which vary from 0.224 [Ram86]
to 0.244 [Bru74], and from -0.088 [Lee75] to -0.178 [Bru74] respectively.

180
The reason for these discrepancies is unknown a t the moment. It is
possible th a t the excellent agreem ent in the extracted deform ation
param eters in 154Sm case is ju st fortuitous; alternatively there m ay be
other effects in the 186W case which are not included in th is model.
For instance, coupling to additional channels, such as v ibration or
• fu l l d i s t .
fo = 0.295ß4 = -0.023ß4 = +0.023
Fig. 5-1-14: Fusion excitation function of 186W + 160 . The curve is the resu lt of the calculation using the classical b a rrie r d istribution (see text for details and see Fig. 5-1-14 for the sm oothed b a rrie r d istribution). The deform ation param eters of the target are listed on the figure.

181
ß2 = 0 . 2 9 5ß4 = - 0 . 0 2 3ß4 = + 0 . 0 2 3
—*--- 1---- 1---- 1---- 1---- 1---- 1----1----1---- 1----1---- 1 I__ I__ I__65 70 75 80
Ecm (MeV)
Fig. 5-1-15: The curvatu re Eo vs E extracted from them easu red fusion excita tion function for 186W + 1 6 0 , com paring w ith the theore tical values. The monopole, quadrupole and hexadecapole Coulomb potential are used in the calculations of in te rnuclear barrier. The deform ation param eters of the target are listed on the figure.
tran s fe r channels, will resu lt in additional ba rrie rs , producing a
sm earing of the b a rrie r d istribution. Since, in th is model, we only
considered the classical deform ation (or coupling to the ground sta te
rotational band), any additional coupling would require a larger value
of ß2 and/or a sm aller absolute value of the negative ß4 to compensate
the broader barrie r d istribution [Lem93]. System atic m easurem ents

182
using a range of projectiles on the various targets may be helpful in
clarifying th is problem.
Nonetheless, the classical deformation param eters of the targe t 186W
have been qualitatively determ ined and the barrie r d istribution has
been well reproduced. There is no doubt th a t a negative value of ß4 is
necessary to fit the excitation function and to reproduce the barrie r
distribution; as shown in Fig. 5-1-14 and Fig. 5-1-15 a positive, or even
a zero value of ß 4 cannot fit the fusion excitation function and
reproduce the barrie r distribution. The %2 per point of the calculated
fit to the cross-sections is about 5.6. This m akes the quality of the
average fitting to the level of 2 ~ 3%.
The p aram eters of the best fit, used in th is model, are lis ted in
Table 5-1-3.
Table 5-1-3: The param eters used in this model, w ith which the calculations have the best fit to the fusion excitation function, and associated %2 per point for the fits. The energy indicated is in the centre of m ass system.
Reactions B o (M eV ) a (fm) ß2 ß4 X2
154Sm + 160 59.50 1.27 0.304 0.052 8.0
186 \V + 1 6 0 69.03 1.27 0.295 -0.023 5.6
To conclude th is section, distributions of barriers have been effectively
ex trac ted from the high precision m easu rem en ts of fusion cross-
sections for the reactions of 154Sm + 160 and 186W + 16(). There are
pronounced differences betw een the two d istribu tions. Com paring
qualitatively the shapes of the barrier d istributions extracted from the
183
data to the calculated ones in Fig. 5-1-13, shows th a t these two cases
are typical of prolate deformed targets w ith either positive (154Sm) or
negative (186W) hexadecapole deformations. Though the values of ß2
and ß4 ex tracted from these fusion m easurem ents do not always
quan tita tive ly agree with those extracted from Coulomb excitation
m easu rem en ts , these deform ation p a ra m ete rs are q u a lita tiv e ly
determ ined, in particularly the signs of the hexadecapole deformation
can be unam biguously determ ined. This is an im portan t and model
independent feature. W ith th is feature, the negative sign of the ß4
deformation of 186W can be undoubtedly determined.
5.2 FUSION ANGULAR MOMENTUM DISTRIBUTIONS
As discussed in C hapter 2, i t may be possible to extract the angular
m om entum distribution in fusion from an excitation function if it has
been m easured to high precision and if certain approxim ations are
made. Those approxim ations are:
1. th a t the shape of the in ternuclear potential and the position R of the
barrier are independent of Z, and
2. th a t the /-dependent barriers have the same form as the Z = 0 barrier,
bu t the heights are increased in energy by /(/ + l)/i2/2(j.R2.
The high precision m easurem ents of fusion cross-sections for 154Sm
and 186W + 180 reactions in th is work offer the opportunity to extract
the an g u la r m om entum d is trib u tio n directly from the excitation
functions q u a n tita tiv e ly . D e ta ils of the ex trac tio n and the
uncertainties of th is m ethod are discussed in the following sections.

184
5.2.1 Angular Momentum Distributions Extracted From Fusion Excitation Functions
Figures 5-2-1 and 5-2-2 show the ex tracted d(Ea)/dE , using the
expression (4-2-1), from the experim ental data of reactions 154Sm and
186w + 16(3. The data points in this figure have been norm alised by the
ttR2 values shown in Table 4-2-6. As discussed in C hapter 2, if one
assum es fu rther th a t the fusion radius R does not change with the
barrie rs (this is approxim ately true when both projectile and targe t
are spherical), th en the norm alised value of d(Eo)/dE gives the
average / = 0 transm ission coefficient T0(E). Thus
T0(E)1 d(Ea)
7i R2 dE (5-2-1)
In the reactions studied here, th is approxim ation of R not changing
with the barriers introduces an error in the extracted T0 and angular
m om entum d istribu tions due to the deform ations of the targe ts .
However, we shall in itially ignore this and will discuss it later.
The figures show th a t the T0 increase smoothly from zero to unity over
the energy range 52 to 63 MeV and 61 to 73 MeV for the reactions
154Sm + 160 and l86\y + 160 respectively. At the average fusion
barriers of 59.2 and 68.6 MeV respectively, the values of T0 are -0.5, as
expected.
The T0(E) are also calculated theoretically using the Wong expression
(2-2-6) averaged over the distribution of barriers, thus
T0(E) 1T0(E,B) D(B) dB (5-2-2)

185
As indicated by dashed lines in Fig. 5-2-1 and Fig. 5-2-2, the T0 are well
fitted by the above calculations using the classical barrier distributions
(see Eq. 5-1-12) with the targe t deformation param eters indicated in
Table 5-1-2. The excellent agreem ent, in these and subsequent
figures, is not particu larly surp rising since the model param eters
w ere chosen to fit th e ex p erim en ta l cross-sec tions and the
assum ptions m ade in th is analysis are also im plicit in the Wong
expression (2-2-6), which applies to deformed nuclei. Therefore the
calculations m ainly serve to guide the eye, a lthough such good
agreem ent may not be expected in general.
E c m (MeV)
Fig. 5-2-1: V alues of T0, ex tracted from m easured fusion cross-sections, calculated a t energy in tervals of 0.91 MeV (squares) and 1.81 MeV (circles) a t the h ighest energies. The curves are calculated using the Wong expression of (2-2- 6) averaged by the distribution of barriers (dashed line) and by a single barrier B0 (dotted line) respectively.
186
‘O g Q B B B H .
Fig. 5-2-2: Values of T 0, ex tracted from m easured fusion cross-sections, calculated a t energy in tervals of 0.92 MeV (squares) and 1.84 MeV (circles) a t the h ighest energies. The curves are calculated using the Wong expression of (2-2- 6) averaged by the distribution of barriers (dashed line) and by a single barrier B0 (dotted line) respectively.
For comparison, the T0 values calculated by using a single barrier B0
are also indicated in these figures by the dotted line. The transition
from 0 to 1 is much sharper th an the experim ental one which reflects
the deform ation, hence the b a rrie r d istribu tion of the targets . For
instance, the long ta il of the dashed lines indicate th a t the barriers
extend to energies much lower th an B0.
A useful aspect of this analysis is the ability to extract the full fusion /-
d istrib u tio n s from the data . The /-dependence of th e average
tran sm iss io n coefficients a t a fixed energy T,(E) can be extracted
m aking use of equation (2-3-36); thus T,(E) = T0(E') for any /-va lue ,
where E' = E - Z(Z + l)/i2/2pR2.

187
Full TZ(E) distributions for a series of energies are shown in Fig. 5-2-3
(a) and Fig. 5-2-4 (a) for reactions 154Sm and 186W + 160 respectively.
They were obtained using each of the extracted values of the T0 a t 0.5
MeV beam energy intervals, for energies equal to or below the incident
energy and ca lcu la ting the /-va lue (n o n -in teg er) g iv ing the
appropria te value of A/. Thus the same transm ission coefficients are
used repeatedly but appear a t different /-values for each energy. The
diffuseness of the extracted d istribu tions increases as the b a rrie r
region is approached as expected; again the model calculations guide
the eye. The more fam iliar shapes of the reduced p a rtia l cross-
sections, Gi/nk2 for the experim ental da ta are shown in Fig. 5-2-3 (b)
and Fig. 5-2-4 (b).
5.2.2 The Validity of This Method In The Extraction of A ngular M omentum Distributions
The validity of the approxim ations 1 and 2, as stated a t the beginning
of §5.2, th a t the fusion b a rr ie r rad ius and shape are essen tia lly
in d ep en d en t of /, have been checked in the following m anner.
C alculations have been perform ed for a fusion potential comprising
Coulomb, nuclear and centrifugal term s; the radius and curvature of
the b a rr ie r for each /-value were th en determ ined. A classical
d istribution of ba rrie r heights, for a ta rge t nucleus w ith a perm anent
quadrupole deform ation, was then im posed on each /-d e p e n d e n t
b a rr ie r. T ransm ission coefficients and cross-sections were then
calculated using the parabolic barrier, Hill-W heeler, approxim ation.
The calculated T, are shown by the curves in Fig. 5-2-5 (a). The
calculated cross-sections were then trea ted as da ta and subjected to
the analysis described above, assum ing a constant value of rcR2 taken

188
♦ 8 0 MeV♦ 75 MeV♦ 70 MeVo 65 MeV• 60 MeV
■*— » i - » •
L
Fig. 5-2-3: (a) A ngular m om entum dependent, averagetran sm iss io n coefficients for reaction 154Sm + 160 a t bom barding energies of 60, 65, 70, 75 and 80 MeV in lab. (b) R educed p a r t ia l cross-sections, a , / ^ 2 , for th e sam e energies. The dashed curves are calculations with the Wong expression of (2-2-6) averaged by the distribution of barriers. The p aram eters used in the calculations are indicated in Table 5-1-2.

189
♦ 90 MeVv 85 MeV^ 80 MeV□ 75 MeV• 70 MeV
L
Fig. 5-2-4: (a) A ngular m om entum dependent, averagetra n sm iss io n coefficients for reac tion 186W + 160 a t bombarding energies of 70, 75, 80, 85 and 90 MeV in lab. (b) R educed p a rtia l cross-sections, G i/ tz% 2 , for the sam e energies. The dashed curves are calculations with the Wong expression of (2-2-6) averaged by the distribution of barriers. The p aram eters used in the calculations are indicated in Table 5-1-2.

190
as the gradient of Eg a t 75 MeV. The extracted T, are shown by the
various symbols in the Fig. 5-2-5 (a). The extracted distributions are
good approxim ations to the calculated ones a t the h igher /-v a lu es
when the T, are less th an one. However, there is a small but system atic
discrepancy occurring in the region when T, ~ 1. As the / decreases
and when the Tz approach unity, they over-predict the transm ission
coefficient, then decline as / fu rther decreases; they underpredict the
transm ission coefficient when / approaches zero. This effect is more
obvious a t the higher energies. This has been studied.
Since we have taken TZ(E) = T0(E')
m + m 2when E -2|i R 2
E' » B,
we have Tq(E') ~ 1 (5-2-3)
Then from Eq. (5-2-1) we have
d(E'ö(E'))d E ’ ttR2 E ’ » B0 (5-2-4)
Now the decrease in the extracted T /s in Fig. 5-2-5 (a) reflects the
decrease in the average R-value as the energy increases and the
b a rrie r rad iu s for h igher /-values decreases. In o ther words, the
effects are caused by the changes of the potential shape and barrie r
position with /, and appear as an energy dependence of R2(E).
It can be shown tha t, w ithout m aking the two approxim ations 1 and 2
m entioned a t the beginning of 5.2, in an inverse parabolic model, the
R2(E) can be approxim ately w ritten as:
2 r ^ 2 2 1B0 - E i n / 2 I B q - E IR2(E) - [R2 - ----- 5- — K / l - ----- T T “ (5-2-5)
p oo0 \ p coqRq

191
w here 11 is the reduce mass, R0 and h co0 are the barrie r rad ius and
in ternuclear potential curvature a t l = 0.
w
L
Fig. 5-2-5: (a) T ransm ission coefficients, a t the energiesindicated in Fig. 5-2-3, calculated using a parabolic ba rrie r approxim ation (solid lines) and those using our analysis m ethod on th e c ross-sec tions from th a t ca lcu la tio n (symbols), (b) A fter corrections have been m ade to the energy dependent of R2(E) (See the text for details).

192
Fig. 5-2-5 (b) shows the extracted T,(E) from the calculated cross-
sections using the same model used in (a), bu t using the R2(E) instead
of a constan t R2, in the extraction of T 0(E). One can see an
im provem ent in the agreem ent between the extracted Tz and those
from th is m ethod, though some discrepancies rem ain a t h igh
energies and low l .
To conclude th is section, the an g u la r m om entum d is tr ib u tio n
extracted from the fusion excitation functions are based on the WKB
approx im ation for th e tran sm iss io n coefficient of a pro jectile
travelling through the fusion barrier. Two basic approxim ations (1
and 2) have to be made in order to extract the transm ission coefficient
T0. These have been tested above, showing th a t the extracted T,(E)
agree w ith the theoretical ones w ithin a few percent. Hence the
approxim ations 1 and 2 are good approximations.
However, in the above te s t the fusion radii do not change w ith
barriers, which is approxim ately true only for the spherical case. For
deform ed nuclei, in s tea d of a single fusion rad iu s , there is a
d istribu tion of fusion rad ii, dependent on the o rien tation of the
in terac ting nuclei, which produce a d istribu tion of fusion barrie rs .
Calculations show, th a t changes in up to 15% of the average fusion
radius can occur for well deformed nuclei (for example in the 154Sm
case). Then the assum ption th a t fusion radii do not change w ith the
fusion barrier is not valid. Since the L and R always appear together in
the potential, 1(1 + l)/i2/2|j.R2, the variation in R results in a variation
in the extracted l d istributions. This effect will be discussed in the
following, together w ith the discussions of the extracted m ean value of
fusion angu lar m om entum .
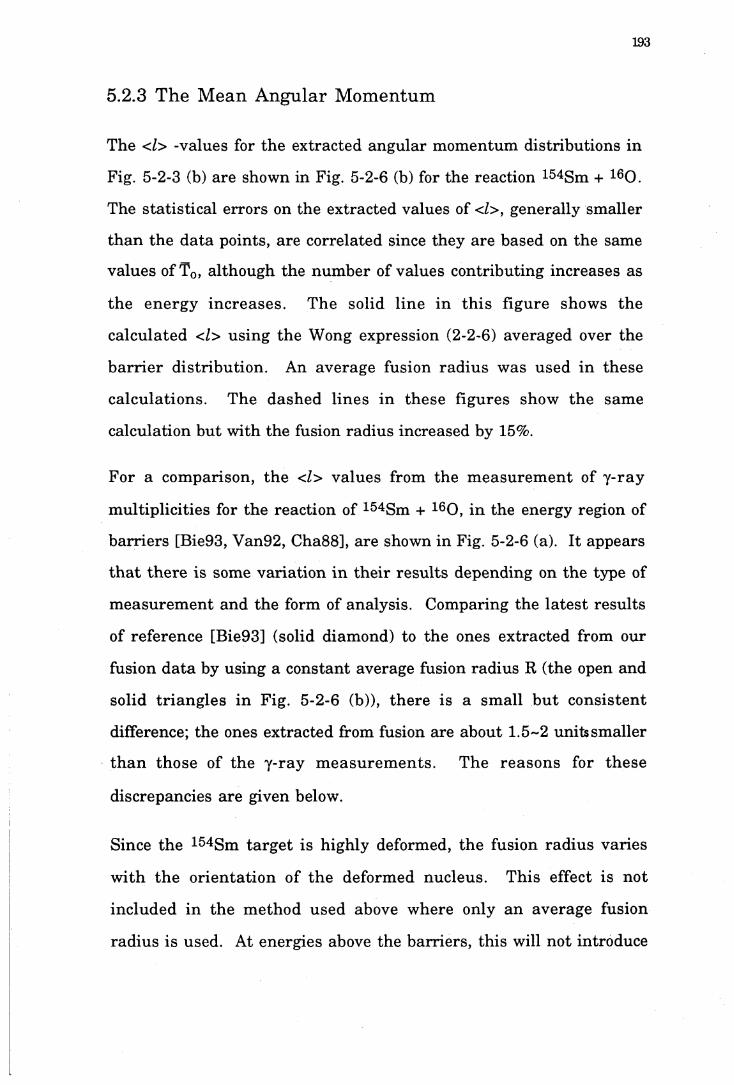
193
5.2.3 The M ean Angular M omentum
The <l> -values for the extracted angular m omentum distributions in
Fig. 5-2-3 (b) are shown in Fig. 5-2-6 (b) for the reaction 154Sm + 160 .
The statistical errors on the extracted values of </>, generally sm aller
th an the data points, are correlated since they are based on the same
values of T0, although the num ber of values contributing increases as
the energy increases. The solid line in th is figure shows the
calculated </> using the Wong expression (2-2-6) averaged over the
b a rr ie r d istribution . An average fusion rad ius was used in these
calculations. The dashed lines in these figures show the sam e
calculation but w ith the fusion radius increased by 15%.
For a com parison, the </> values from the m easurem ent of y -ray
m ultiplicities for the reaction of 154Sm + 160 , in the energy region of
barriers [Bie93, Van92, Cha88], are shown in Fig. 5-2-6 (a). It appears
th a t there is some variation in the ir results depending on the type of
m easurem ent and the form of analysis. Comparing the la tes t results
of reference [Bie93] (solid diamond) to the ones extracted from our
fusion da ta by using a constant average fusion radius R (the open and
solid trian g les in Fig. 5-2-6 (b)), there is a sm all b u t consistent
difference; the ones extracted from fusion are about 1.5-2 units sm aller
th a n those of the y-ray m easu rem en ts . The reasons for these
discrepancies are given below.
Since the 154Sm ta rg e t is highly deformed, the fusion rad ius varies
w ith the o rien tation of the deform ed nucleus. This effect is not
included in the m ethod used above where only an average fusion
radius is used. At energies above the barriers, th is will not introduce
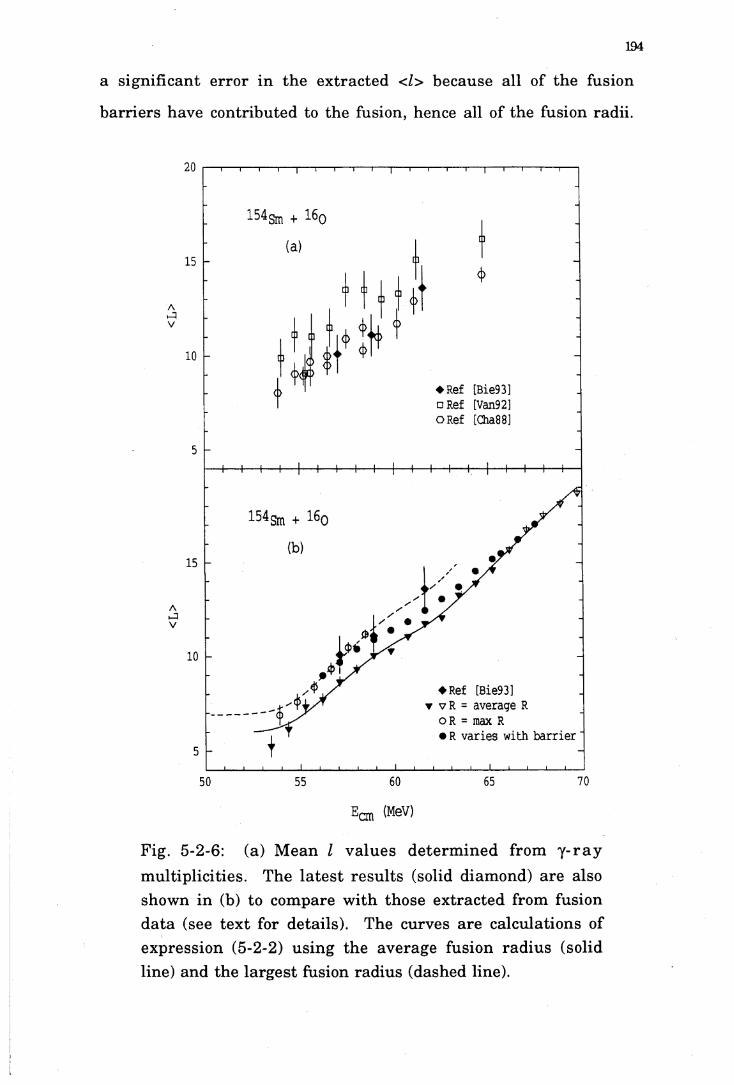
194
a s ig n if ic a n t e r r o r in th e e x t r a c te d <l> b e c a u s e a l l o f th e fu s io n
b a r r ie r s h a v e c o n tr ib u te d to th e fu s io n , h en ce a ll o f th e fu s io n ra d ii .
♦ Ref [Bie93] □ Ref [Van92] ORef [Cha88]
♦ Ref [Bie93]t vR = average R
OR = max R• R varies with barrier
Eon (MeV)
F ig . 5 -2 -6 : (a ) M e a n l v a lu e s d e t e r m in e d f ro m y - r a y
m u l t ip l ic i t ie s . T h e l a t e s t r e s u l t s (so lid d ia m o n d ) a r e a lso
sh o w n in (b) to c o m p a re w i th th o s e e x t r a c te d fro m fu s io n
d a t a (see te x t fo r d e ta i ls ) . T h e c u rv e s a r e c a lc u la t io n s o f
e x p re s s io n (5 -2 -2 ) u s in g th e a v e ra g e fu s io n r a d iu s (so lid
lin e ) a n d th e l a r g e s t fu s io n r a d iu s (d a sh e d lin e ).

195
Therefore, using an average fusion radius in the extraction should be
a good approxim ation. However, a t energies in the b a rrie r region,
only the barrie rs th a t are lower than the bom barding energies give a
significant contribution to fusion, so th a t these fusion radii are, in
general, larger th an the average fusion rad ius obtained a t the high
energies. At the lowest energies studied in th is work, the fusion
occurs only when the projecticle encounters the tip of the deformed
target. Hence using the largest fusion radius in the extraction should
be a good approxim ation a t these low energies.
The varia tion of the fusion rad ius and its effect on the extracted
angu lar m om entum can be estim ated assum ing the deformed targe t
has radii
The m axim um and m inim um radii are R(0°) and R(90°) respectively.
Hence the m axim um variations in the radius are
In the reaction of 154Sm + 160 , ß2 ~ 0.3 and ß4 ~ 0.05 which gives AR+ ~
1.5 fm and AR_ ~ 0.5 fm respectively. If the fusion radius changes the
same am ount as the ta rg e t rad ius, and the average fusion rad ius
determ ined a t the high energies is -10.56 fm, the actual fusion radius
can be up to 15% la rg e r or 5% lower th an R for the two extrem ely
cases. Because the </> is proportional to R, as seen in expression of
Rt(0) = Rt [1 + ß2Y2o(0) + ß4Y4o(0)l
(5-2-6)
and
(5-2-7)

196
(2-3-40), using the largest fusion radius results in a 15% increase in
the extracted </> value. This has been illustra ted by open circles in
Fig. 5-2-6 (b) in which the la rgest fusion rad ius was used in the
extraction. The dashed line follows these data points very well; th is is
not particu larly surprising because in the calculations of the dashed
line the largest fusion radius (15% larger than the average radius R)
was also used.
The effect of the changes of the fusion radius on the extracted Tz is
dem onstrated in Fig. 5-2-7. It shows the variation of (21 + 1)T, when
the fusion radius is taken as the average one (solid line) and increased
= 61 .6 MeV
L
Fig. 5-2-7: C alculated transm ission co-efficient varies w ith the fusion rad ius; average R (solid line), and the rad ius increased by +15% (dashed line) or decreased by 5% (long dashed line) from the average.

197
by 15% (d ash ed line) or d ecreased by -5% (long d ash ed line) from th e
av erag e . T he "true" v a lu es of th e T,, a s d iscu ssed above, sh o u ld lie
b e tw een th e d a sh e d an d solid lin es . T he v a lu e of <l> is 11.8 w hen a
av e rag e R is u sed a n d is 13.6 w h en th e la rg e s t fu sion ra d iu s is used .
As is ex p ec ted th e m e an a n g u la r m o m e n tu m ch an g es by th e sam e
p e rcen tag e as th e fusion ra d iu s .
Now, we h av e good re a so n to be lieve t h a t u s in g th e a v e rag e fu sio n
ra d iu s a n d th e la rg e s t fu s io n ra d iu s a re good a p p ro x im a tio n s for
en erg ies above a n d w ell below th e fusion b a r r ie r s respec tive ly . W hile
in th e en erg y reg io n a ro u n d th e b a r r ie rs , R sh o u ld lie b e tw een th e se
tw o ap p ro x im a tio n s . A re c e n t d ev e lo p m en t, in th e co u rse o f th is
w o rk [Row 93], show s th e m e a n ra d iu s , a n d h en ce th e < /> , can be
e s tim a te d in th e in te rm e d ia te en erg y ran g e .
E q u a tio n (5-1-16) show s, to f ir s t o rd e r for a know n fusion b a r r ie r , th a t
th e fusion ra d iu s can be w r it te n as
_ Z ^ e 2 a a ~ R(B) 1 " R(Bp (5-2-8)
T h is gives
RR(B) = ~ ^ (1 + V l-4 a /R c ) (5-2-9)
w h ere R c = Z!Z2e 2/B is th e d is ta n c e of c lo sest ap p ro a ch a t w h ich th e
Coulom b p o te n tia l eq u a ls th e fu sion b a rr ie r .
K now ing th e fu s io n ra d iu s a sso c ia te d w ith b a r r ie r B, w e can re w rite
eq u ation (2-2-3) as
TZ(E, B)1
1 + e x p [ ^ - (B +l(l+ l)h 22pR 2(B) -E )]
(5-2-10)

198
Now if we know the weights associated w ith each barrie r B, we can
use the above formula to evaluate </>.
Since the sm oothed b a rrie r d istribu tion , as discussed in the la s t
section, has been extracted from the experim ental fusion data , we
m ay now use it to obtain those weights approxim ately. Thus for a
given energy bin between E n and E n+1 the weights are
E n + if - 1 /dE o \
W" = J D(B)dB = (5-2-U)
Where the average energy E n+1/2 = (En + En+1)/2.
Using these weights, the <l> values can be calculated, thus
</> = + l)W nTz(E,En+1/2) (5-2-12)n i
The solid circles in Fig. 5-2-6 (b) show the resu lts of th is calculation.
As expected, the solid circles provide a nice bridge betw een the open
triangles extracted directly from data using the average fusion radius
a t energies above the barriers and the open circles extracted directly
from d a ta using the la rg est fusion rad ius R a t energies below the
barrie rs .
Now, over all the energy range around the Coulomb barrier, for the
reaction 154Sm + 160 , the open circles, the solid circles and the open
triangles give a clear and smoothly changing picture of the extracted
m ean fusion an g u la r m om entum from fusion around the barrie rs .
Com paring these ex tracted </> from fusion w ith the la te s t resu lts
obtained by y-ray m ultiplicity m easurem ents they agree very well as
dem onstrated in Fig. 5-2-6 (b).
199
Ecm (MeV)
Fig. 5-2-8: M ean / values determ ined from fusion d a ta(triangles). The solid curve is a calculation using the Wong expression of (2-2-6) averaged by the distribution of barriers. The dashed curve is the same calculation as the solid one bu t with an increase of 10% in the fusion radius R.
Fig. 5-2-8 shows the extracted <l> by using the average fusion radius.
The solid and dashed lines in th is figure shows the calculated </>
using the average and the largest fusion rad ius respectively. The
largest fusion radius is estim ated by Eq. 5-2-14 and is -10% (-15% in
154Sm case, as above ) larger th an the average one. The error of </>
introduced by using the average fusion radius is, therefore, <10% and
less th an th a t in 154Sm case. This reflects the fact th a t 186W js less
elongated th an the 154Sm. Since there is only about 1 h difference
betw een the two approxim ations in the barrie r region, a line, even a

200
stra igh t line (the dotted line as shown in this figure) across the barrier
region, should serve as a good guide to link the two curvatures (solid
and dashed) a t the energies above and below the barriers.
5.3 CONCLUSIONS
The fusion cross-sections of 160 induced reactions on the targe ts of
154Sm and 186W have been m easured to unprecedented precision. This
was done by m easuring the ER cross-sections using new experimental
a p p a ra tu s consisting of a velocity filter and a position sensitive
m ultiw ire proportional counter. This apparatus was developed in the
course of this work and it has been shown to work very effectively.
W ith the high precision data , well defined barrie r distributions have
been obtained for the firs t tim e. These d istribu tions are in good
agreem ent w ith those expected from the sta tic deform ations of the
ta rg e t nuclei. I t has been shown th a t sm all differences in fusion
excitation functions appear as large effects in the barrier distribution.
Thus the b a rr ie r d is tribu tion is very sensitive way of displaying
excitation function. For example, the large difference in shapes of the
b a rr ie r d istribu tions for the reactions studied reflects the sm all
difference in shapes of the targe t nuclei resulting from their different
hexadecapole deform ations.
It can be concluded th a t p lotting the excitation function in term of
barrie r distribution provides a powerful tool for testing fusion models
a t the energies n ear the Coulomb barrier. Any model which can
reproduce the cross-sections (w ithin the experim ental error) m ust of
201
course reproduce the behaviour of d2(E a ) /d E 2 and hence m ust
reproduce the barrier distribution.
This conclusion has challenged the common view th a t the excitation
function itse lf contains little inform ation about the details of fusion.
However, this common view would be still valid if the fusion excitation
functions had not been m easured to such high precision, as presented
in th is thesis.
The chosen fusion reactions studied in th is work, involve classically
deformed targets, 154Sm, 186W, and the doubly-closed-shell spherical
projectile, 160 . The in itial aim of choosing these reactions was to test
the validity of the novel analysis method proposed by Rowley et al in
1990. W ith the excellent resu lts obtained we are now confident of
expanding th is m ethod to cases where sta tic deform ation is not the
only effect responsible for the enhancem ent of the sub-barrier fusion.
This will give insight into other couplings which may be dom inant.
The fusion angu lar m om entum distributions for these two reactions
have been quantitatively extracted for the first time directly from the
fusion excitation functions. The uncertain ty resulting from using an
the average fusion rad ius in the extraction varies from reaction to
reaction , depending on the sta tic deform ation of the in te rac tin g
nuclei. This u n certa in ty is la rger for 154Sm th an th a t for 186W,
because the former is some more "elongated" th an the la tter.
Nonetheless, after correcting the fusion radii in the barrie r region the
ex tra c ted </> is in a good agreem ent w ith th a t from the y -ray
m ultip licity m easurem ents for the reaction of 154Sm + 160 [Bie93j.
There is no such data available for comparison in the 186W case.
202
A simple way of correcting for the distribution of fusion radii in the
extraction of T/ has not yet been found. However, the maximum error
is not difficult to estim ate. There is no significant error a t energies
sm aller th an the lowest b a rrie r if the largest fusion rad ius is used.
Since the </2> sa tu ra te s and is proportional to the R2 [Das86] a t
energies lower th an the barrie rs , the largest fusion rad ius can, in
p rinc ipal, be deduced from the ex trac ted an g u la r m om entum
distribution. To do so, however, we need to m easure fusion cross-
sections a t low er energ ies th a n those m easu red here. Such
m easurem ents of cross-sections less th an 0.1 mb, though in teresting,
are beyond the scope of th is thesis.
However, i t m ay be em phasized th a t even including all the aforesaid
uncerta in ties, the angu lar m om entum distribu tion and </> derived
from the fusion excitation function are of com parable accuracy to
those from other m ethods such as the y-ray m ultiplicities and isomer
ratios which involve other uncertainties.

A ppendix
If the sequence of measurements, as shown schematically in Fig. 3-5-
3, are made, for a misalignment of the beam axis to the symmetry axis
of the experimental setting, as shown in Fig. 3-5-4, there is an off set
A6 of the angle. The true angles change from ±0 to ±0+A0, and the
solid angle of the detector changes from Q to Q±AQ. The changes in
the angle 0 and the solid angle a can be written:
a a ALAÖ = ~ cos0 (A-l)
A Q.2ALsin0
= l n (A-2)
where AL is the off set of the effective beam axis from the symmetry
axis of the experimental setting and the L is the distance from the
target, at the centre of the 2 m chamber, to the entrance collimater of
the detector.
The numbers of elastic events, detected at angles (±0 + A0), N(0)±,
relative to the numbers detected in both monitors, (NML + NMR)±, are
given by
N(0)±(Nml + Nmr)+
da(±0 + A0)dö— (Q±AQ)
dada da
aMi, + T7Ä a(A-3)
ML da MRMR
XV _The ratio > which is measured, is given by:
da(-0 + A0)K _ d q ( a ~ A a )
da(+0 + A0)dO ^ + AQ)
(A-4)

204
w h ere th edG(0)
is th e d if fe re n tia l c ro ss-sec tio n in th e la b o ra to ry
d c(9 )sy stem . To tr a n s fe r - to th e c en tre of m ass sy stem we deno te
su b sc rip t cm for th e cen tre of m ass sy stem an d have:
s in 9 cmtan0
y + cos0cm(A-5)
a n ddo(9) , da(9cm)
dQ - F(0cm) dn (A-6)•cm
W here vL cm is th e R u th e rfo rd s c a tte r in g d iffe ren tia l c ross-section CllZf'rn
in th e cen tre of m ass sy stem an d is g iv ing by
d o (9 cm)•cm
s in 4 9cm(A-7)
F (0 cm) is th e tra n s fo rm a tio n fu n c tio n of th e d iffe ren tia l c ross-section
from th e cen tre of m ass sy stem to th e lab o ra to ry system , an d
F ( 9 c m )(y2 + 2ycos9Cm + 1 )3/2
1 + ycos0Cm(A-8)
w h e rey _ m P
“ m T
C o n sid e rin g a sm all ch an g e in an g le , from 0 to 0 + A9, th e n (A-6) can
be, a t th e f ir s t ap p ro x im a tio n , ex p an d ed as:
da(9 + A9) , d a (9 cm)d n - F(9cm) da<:m
[F(9cm) ( ^ Sl) , + F'(0cm)ui^ cm
dG(0Cm )1d Q Cm
d 9 c m
d0A0
(A-9)
205
h e re
^ ( 9 c m )d
dQcmf (9cm)
F ro m (A-5) a n d (A-7), i t can be found th a t:
d 9 cm _ (y2 + 2ycos0cm + 1 ) d9 1 + ycos9cm
a n d
(d o (9 cm) do(9cm)
d f lCme
cot (-
(A-10)
(A -ll)
In s e r t (A - l l ) in to (A-9) we get:
da(9 + A0) t da ( 0cm) j T ,9cm F(0cm) 1 1 |_2cot( 2 ) -
F (9cm)~|d9
F (0 cm) d0] = a s}
S ince
F ( 0 c m ) ysin0cm y2 - ycos0cm - 2F (0 cm) 1 + ycos9cm T2 + 2ycos9cm + 1
an d in th is w ork, y ~ —
(A-12)
F (9cm)
F ( 9 Cm)2ysin0cm
a n d a t fo rw ard an g les
sin0 ~ 0, cot0 ~ — 0
H ence th e te rm of
a n d th e n
F (0cm)
F(0cm)cm,
can be ig n o red co m p arin g to 2 cot(_ 2_ )
dote + A6) , dq(9em) fa r* — r locm j A [ 1
■c m2 c < Ä % I1Ae}
z d0(A-13)

206
Insert (A-13) into (A-4) and consider that from (A-7) and (A-8) we
have:
da(-9Cm) _ da(9cm) d n cm dQCm
F (-9Cm) = F(öcm)
and
cot(-9cm) — cot(9cm)
we get:
R+(Q - AQ)
1 + 2cot(%!1) ^ A6 z d91 , ,öcm d9cm (n + AQ)1 - 2cot(— .. .....A9
z d9
Up to first approximation it becomes:
KR+
i . i d9cm 2AQ.l + 4 c o t e ^ ) - ^ - A 9 - ^ r
(A-14)
(A-15)
insert (A-l) and (A-2) we get:
tt- = 1 - 4{cot(—£p) —7^- + tan9} 4^ cos9 (A-16)K+ 2 d9 L
or
ü“ = 1 + 4{cot(-?p) + tand} A9 (A-16a)R+ d9
Thus the offset of the beam on the target AL can be found, hence the
true angle of the detector can be known.
Since the two monitors are located approximately symmetrically to the
beam axis the same procedure can be applied to the monitors. The
offset angle of monitor A9M can be found by the ratio of which can^MR
be written as:

207
N mr
MLMR
1 + 4{cot(~7p0 - + tan0}M A0 -MLM Q (A-17a)MR
Above, there is a new term , 77— , with the value of 1±0.02. However,“ MR
the uncerta in ty of the ratio of monitors' solid angle only introduced a
system atic error of A0M and it could not affect the relative error of
8(A0m) which was used to monitor the beam spot position movement as
described below.
Knowing the A0O, AL0, the A0MO ALM0 and the ratio of m onitor yields
)0, a t the in itial, any changes of ALM due to the beam position^MR
m ovem ent during subsequent ER m easurem ents can be found from
the changes in the ratio of the two m onitor's yields a t th a tMR
m easu rem en t.
The difference of to (^rML )0 is:MRMR
ML _ / N ML r '"NTMR MR
)0 = - 4 { c o t f e de cmd0
+ tan©}:AL m ALMO
COS0M ^2MR
ML
th u s
5(ALm) ALm ALmo
rN ML _ N mlVXT ) o XT
MR MR
4{cot(%!1) decmd0
+ tan©} •ML cos0,M Q
MR
(A-18)

208
From (A-l)
(A-18a)
Hence since 5(ALM) = 5(AL) and
8(A0) = - —^— cos9 , (A-19)
we get
(A-19a)
Therefore, the true angle 0ER of the ER detector at each measurement
is known:
where 0 is the reading angle of the turnable arm on which the ER
detector is mounted. The A0O, as defined before, is the initial offset of
the angle 0.
As discussed in §3.5.2, the arm can be set at an accuracy to ±0.01°, the
accuracy for A0O is ±0.02° and for A0M and A0MO is ±0.3°. The accuracy
for 0ER can then be written as:
0ER = 0 + A0O + 5(A0) (A-20)
or
L cos0M(A-20a)
T co s0(A 6 e r )2 = (0.01)2 + (0.02)2 + 2 e r 1-------- 0.03°)2 (A-21)
Lj r n s f i , .COS0M
Since in this work the ratio
Lm COS0
L COS0M1
209
th en
A0er = 0.05°
Thus the true angle of the velocity filter can be determ ined to an
accuracy of ±0.05°.
The same procedure can be applied to the large angle ER detector. An
accuracy of ±0.05° can then also be achieved.
R eferences
[Ald75]
[Alj84]
[Ata70]
[Bac85]
[Bai60]
[Bal83]
[Bal86]
[Bec80]
[Bec81]
[Bec82]
[Bec83]
[Bec85]
[Bec88]
[Beg85]
[Bem87]
K. Alder and A. Winther, in Electromagnetic Excitation (North Holland Publishing Co, Amsterdam, 1975), p. 17.
H. Aljuwair, R.J. Ledoux, M. Beckermam, S.B. Gazes, J. Wiggins, E.R. Cosman, R.R. Betts, S. Saini and Ole Hansen, Phys. Rev. C30 (1984) 1223.
M. Atac and J. Lack, Nucl. Instr. and Meth. 86 (1970) 173.
B. B. Back, R.R. Betts, J.E. Gindler, B.D. Wilkins, S. Saaini, M.B. Tsang, C.K. Gelble, W.G. Lynch, M.A. McMahan and P.A. Baisden, Phys. Rev . C32 (1985) 195.
L. E. Bailey, Rev. Sei. Inst. 31 (1960) 1147.
A.B. Balantekin, S.E. Kbonin, J.W. Neggele, Phys. Rev. C28 (1983) 1565.
A.B. Balantekin and P.E. Reimer, Phys. Rev. C33 (1986) 379.
M. Beckerman, M. Salomaa, A. Sperduto, H. Enge, J. Ball, A. DiRienzo, S. Gazes, Yan Chen, J.D. Molitoris and Mao Nai-feng, Phys. Rev. Lett. 45 (1980) 1472.
M. Beckerman, J. Ball, H.A. Enge, M. Salomaa, A. Sperduto, S. Gazes, A. DiRienzo and J.D. Molitoris, Phys. Rev. C23G981) 1581.
M. Beckerman, M. Salomaa, A. Sperduto, J.D. Molitoris and A. DiRienzo Phys. Rev. C25 (1982) 837.
M. Beckerman, M. Salomaa, J. Wiggins and R. Rohe, Phys. Rev. C28 (1983) 1963.
M. Beckerman, Phys. Rep. 51 (1985) 145.
M. Beckerman, Rep. prog. Phys. 51 (1988) 1047.
S. Beghini, C. Signorini, S. Lunardi, M. Morando, G. Fortuna, A.M. Stefanini, W. Mexzynski and R. Pengo, Nucl. Instr. and Meth. A239 (1985) 585.
C. E. Bemis, F.E. Obenshain, T.C. Awes, F. Plasil, J.R. Beene, P. Jacobs, R.L. Ferguson, Z. Frankel, H.J. Kim, U. S m ilansky , F.K. McGowan, I. T serruya , ORNLProgress Report for Period Ending September 30, 1986, p. 110.

211
[Bet72]
[Bie92]
[Bie93]
[Boh75]
[Bor86]
[Bre77]
[Bre77a]
[Bre79]
[Bre82]
[Bre83]
[Bre84]
[Bro59]
[Bro76]
[Bro79]
[Bro79a]
[Bro83]
[Bro83a]
H.D. Betz, Rev. Mod. Phys. 44 (1972) 465.
J.D. Bierman, A.W. Charlop, D.J. Prindle and R. Vandenbosch, Annual Report, University of Washington, (1992) p. 22.
J.D. Bierm an, A.W. Charlop, D.J. P rindle, R. Vandenbosch and DYe, University of Washington, Seattle; preprint, March (1993).
A. Bohr and B. Mottelson, Nuclear Structure, Vol. II (Benjamin, NY, 1975).
A.M. Borges, et al, Proceedings o f Symposium, ANL Report, NoPHY-86-1, (1986) p. 441.
A. Breskin and N. Zwang, Nucl. Instr. and Meth. 144 (1977)609.
A. Breskin, Nucl. Instr. and Meth. 141 (1977) 505.
A Breskin, R. Chechik and N. Zwang, Nucl. Instr. and Meth. 165 (1979) 125.
A. Breskin, Nucl. Instr. and Meth. 196 (1982) 11.
A. Breskin R. Chechik, I. Levin and N. Zwang, Nucl. Instr. and Meth. 217 (1983) 107.
A.Breskin, R. Chechik, Z. Fraenkel, P. Jacobs, I. Tserruya and N. Zwang, Nucl. Instr. and Meth. A221 (1984)363.
S.C. Brown, Basic Data of Plasma Physics, (MIT Press., Cambridge, Mass., 1959).
R.A. Broglia, C.H. Dasso and A. Winther, Phys. Lett. 61B (1976)113.
R.A. Broglia, C.H. Dasso, H. Esbensen, G. Pollarolo, A. Vitturi and A. Winther, Phys. Lett. 87B (1979) 15.
R.A. Broglia, C.H. Dasso, H. Esbensen, G. Pollarolo, A. Vitturi and A. Winther, Phys. Lett. 89B (1979) 22.
R.A. Broglia, C.H. Dasso, S. Landowne and A. Winther, Phys. Rev. C27 (1983) 2433.
R.A. Broglia, C.H. Dasso, S. Landowne and A. Winther, Phys. Lett. 133B (1983) 34.

212
[Bru74]
[Bun49]
[Cha68]
[Cha84]
[Cha86]
[Cha88]
[Chr76]
[Coc68]
[Cor83]
[Cor90]
[Das83]
[Das83a]
[Das86]
[Das91]
W. Bruckner, D. Husar, D. Pelte, K. Traxel, M. Samuel and V. Smilansky, Nucl. Phys. A231 (1974) 159.
O. Bunemann, T.E. Cranshaw and J.A. Harvey, Can. J. Res A27 (1949) 191.
G. Charpak, R. Bouclier, T. Bressani, J. Favier and C. Zupancic, Nucl. Instr. and Meth. 62 (1968) 262.
R.J. Charity, Ph.D Thesis, Australian National University 1984 (unpublished).
R.J. Charity, J.R. Leigh, J.J.M. Bokhorst, A. Chatterjee,G. S. Foote, D.J. Hinde, J.O. Newton, S. Ogaza and D. Ward, Nucl. Phys. A457 (1986) 441.
A. Charlop, A. Garcia, S. Gil, S.J. Luke and R. Vandenbosch, in Proceedings of a Symposium on Heavy Ion Reactions around the Coulomb Barrier (Legnaro, Italy, 1988), Lecture Notes in Physics, 317 edited by C. Signorini et al. (Springer-Verlag, Berlin, Heidelberg, New York, London Paris and Tokyo, 1988) p. 157.
P. R. Christensen and A. Winther, Phys. Lett. 65B (1976) 19.
A. Coche and P. Siffert, Semiconductor Detectors, edited by G. Bertolini and A. Coche, (North-Holland Publishing Company - Amsterdam, 1968) p.132.
T.M. Cormier, P.M. Cormier, M. Herman, N.G. Nicolis and P.M. Stwertka, Phys. Rev. Lett. 51 (1983) 542.
L. Corradi, S.J. Skorka, U. Lenz, K.E.G. Löbner, P.R. Pascholai, U. Quade, K. Rudolph, W. Schomburg, M. Steinmary, H.G. Thies, G. Montagnoli, D.R. Napoli, A.M. Stefanini, A. Tivelli, S. Beghini, F. Scarlassara, C. Signorini and F. Soramel, Z. Phys. A (1990) 55.
C.H. Dasso, S. Landowne and A. Winther, Nucl. Phys. A405 (1983) 381.
C.H. Dasso, S. Landowne and A. Winther, Nucl. Phys. A407 (1983) 221.
C.H. Dasso, H. Esbensen and S. Landowne, Phys. Rev. Lett. 57 (1986) 1498.
M. Dasgupta, A. Navin, Y.K. Agarwal, C.V.K. Bada,H. C. Jain, M.L. Jhingan and A. Roy, Phys. Rev. Lett. 66 (1991)1414.

213
[DiG86] D.E. Digregorio, J.O. Fernandez Niello, A.J. Pacheco, D. Abriola, S. Gil, A.O. M acchiavelli, J.E . Testoni, P.R. Pascholati, V.R. Vanin, R.L iguori Neto, N. Carlin Filho, M.M. Coimbra, P.R. Silveira Gomes and R.G. Stokstad, Phys. Lett. 176B (1986) 322.
[DiG89] D.E. Digregorio, M. diTada, D. Abriola, M. Elgue, A. Etchegoyen, M.C. Etchegoyen, J.O . Fernandez Niello, A.M.J. Ferrero, S. Gil, A.O. Macchiavelli, A.J. Pacheco, J .E . T estoni, P.R. S ilveira Gomes, V.R. V anin , R. Liguori Neto, E. Crem a and R.G. S tokstad, Phys. Rev. C39 (1989) 516.
[DiG90] D.E. D iG regorio, K.T. Lesko, B.A. H arm on , E.B. Norm an, J . Pouliot, B. Sur, Y. Chen and R.G. Stokstad, Phys. Rev. C42 (1990) 2108.
[D0I88] P. Doll, F.P. Brady, T.D. Ford, R. G arrett, H. Krupp and H.O. Klages, Nucl. Instr. and Meth. A270 (1988) 437.
[Eis77] Y. E isen, I. T serruya , Y. Eyal, Z. F raenkel and M. Hillman, Nucl. Phys. A291 (1977) 459.
[Eng74] J.B.A . E ngland , Techniques in N uclear S truc ture P h y s ic s , Vol. 1 (M acm illan P ress, London andBasingstoke, 1974).
[Eng77] H. Enge and D. Horn, Nucl. Instr. and Meth. 145 (1977) 271.
[Esb78] H .Esbensen, A. W inther, R.A. Broglia and C.H. Dasso, Phys. Rev. Lett. 41 (1978) 296.
[Esb81] H. Esbensen, Nucl. Phys. A352 (1981) 147.
[Eve81] D. Evers, K. Rudolf, I. Weidl. P. Konrad, U. Quade, K.E.G. Löbner and S .J. Skorka, in Proceedings o f XlXW inter Meeting on Nuclear Physics, Bormio, 1981, p. 500.
[Ewa76] H. Ewald, K. G uttner, G. M ünzenberg, P. A rm bruster, W. Faust, S. Hoffman, K.H. Schm idt, W. Schneider and K. Valli, Nucl. Instr. and Meth. 139 (1976) 233.
[Fer89] J. Fernändez-N iello and C.H. Dasso, Phys. Rev. C 39 (1989)2069.
[Fis77] H. F ischer, D. K am ke, H .J. K ittling , E. K uhlm an, H.Plicht and R. Schormann, Phys. Rev. C15, (1977) 921.
[Fre83] W.S. Freem an, H. E rnst, D.F. Geesam an, W. Henning, T .J. H um anic, W. K ühn, G. Rosner, J .P . Schiffer, B.
214
[Fre83a]
[Fro65]
[Ful73]
[Gav80]
[Gil85]
[Gil90]
[Gil91]
[Gro7 0]
[Out73]
[Har79]
[Har81]
[Hem75]
[Hen68]
[Hen73]
[HÜ53]
Zeidman and F.W. Prosser, Phys. Rev. Lett. 50 (1983) 1563.
W.S. Freeman, H. Ernst, D.F. Geesaman, W. Henning, T.J. Humanic, W. Kühn, J.P. Schiffer, and B. Zeidman, Phys. Rev. 028(1983)919.
N. Froman and P.O. Froman, JWKB Approximation (North-Holland Publishing Company - Amsterdam, 1965).
H.W. Fulbright, R.G. Markham and W.A. Lanford, Nucl. Instr. and Meth. 108 (1973) 125.
A. Gavron, Phys. Rev. C21 (1980) 230.
S.Gil, R. Vandenbosch, A. Lazzarini, D.-K. Lock, and A. Ray, Phys. Rev. C31 (1985) 1752.
S.Gil, D. Abriola, D.E. Digregorio, M, di Tada, M. Elgue, A. Etchegoyen, M.C. Etchegoyen, J. Fernandez Niello, A.M.J. Ferrero, A.O. Macchiavelli, A.J. pacheco, J.E. Testoni, P.Silveira Gomes, V.R. Vanin, A. Charlop, A. Garcia, S. Kailas, S.J. Luke, E.Renshaw and R.Vandenbosch, Phys. Rev. Lett. 65 (1990) 3100.
S. Gil, R. Vandenbosch, A. Charlop, A. Garcia, D.D. Leach, S.J. Luke and S.Kailas, Phys. Rev. C43 (1991) 701.
R. Grove, I. Ko, B. Koskovar and V. Perez-Mendez, Nucl. Instr. and Meth. 99 (1970) 381.
H.H. Dutbrod, W.G. Winn and M. Blann, Nucl. Phys. A213 (1973) 267.
B. Harmatz, Nuclear Data Sheets 26 (1979) 281.
L.H. Harwood and J.A. Nolen Jr, Nucl. Instr. and Meth. 186(1981)435.
G. Hemple, F. Hopkins and G. Schatz, Nucl. Instr. and Meth. 131(1975)445.
D.L. Hendrie, N.K. Glendenning, B.G. Harvey, O.N. Jarvis, H.H. Duhm, J. Saudinos and J. Mahoney, Phys. Lett. 26B, (1968) 127.
D.L Hendrie, Phys. Rev. Lett. 31 (1973) 478.
D.L. Hill and J.A. Wheeler, Phys. Rev. 89 (1953) 1102.

215
[Hin82] D.J. Hinde, Ph.D Thesis, A ustralian National University 1982 (unpublished)
[Hui61] J. Huizenga and G. Igo, Nucl. Phys. 29 (1961) 462.
[Jac86] P. Jacobs, Z. F raenkel, G. M am ane and I. T serruya, Phys. Lett. B175 (1986) 271.
[Jah82] U. Jah n k e , H.H. Rossner, D. H ilscher and E. Holub, Phys. Rev. lett. 48 (1982) 17.
[Jam88] A.N. Jam es, T.P. M orrison, K.L. Ying, K.A. Connell, H.G. Price and J. Simpson, Nucl. Instr. and Meth. A267 (1988)144.
[Kem35] E.C. Kemble, Phys. Rev. C17 (1935) 111.
[Kon87] Y. Kondö, B.A. Robson, J.J.M . Bokhorst. D.J. Hinde, J.R. Leigh, Phys. Rev. C35 (1987) 828.
[Lan84] S. Landowne and S.C. Pieper, Phys. Rev. C29 (1984) 1352.
[Lan85] S. Landowne, in Fusion Reactions Below the Coulomb B a rr ie r , Lecture Notes in Physics 219, edited by S.G. S teadm an (Springer-V erlag, B erlin , H erdelberg , New York and Tokyo 1985), p. 182.
[Lee74] I.Y. Lee, J.X. Saladin, C. B aktash , J.E . Holden and J. O'Brien, Phys. Rev. Lett. 33, (1974) 383.
[Lee75] I.Y.Lee, J.X. Saladin, J. Holden, J. O'Brien, C. B aktash, C. Bemis, Jr., P.H. Stelson, F.K. McGowan, W.T. Milner, J.L.C. Ford, J r., R.L.Robinson and W. Tuttle, Phys. Rev. C12, (1975) 1483.
[Lei81] J.R . Leigh, D .J. H inde and W.Qalster, Nucl. Instr. and Meth. 186(1981) 541.
[Lei86] J.R. Leigh, et al, Proceedings of XIII W inter School, Zakopane, Poland April (1986).
[Lei88] J.R. Leigh, J.J.M . Bokhorst, D.J. Hinde and J.O. Newton, J. Phys. G14 (1988) L55.
[Lei93] J.R . Leigh, N. Rowley, R.C. Lemmon, D.J. Hinde, J.O. Newton, J.X. Wei, J. Mein, C. Morton, S. Kuyucak and A. Kruppa, Phys. Rev. C47 (1993) R437.
[Lei93a] J.R . Leigh, M. D asguta, C.R. M orton, D.J. H inde, R.C. Lemmon, J.O . Newton, J.X. Wei and N. Rowley, Invited ta lk to RIKEN In ternational Workshop, 18-22 February, 1993, Tokyo, Japan . Proceedings R IK E N International

216
[Lem93]
Workshop On Heavy-Ion Reaction w ith Neutron-R ich Beams, to be published by World Scientific Press.
R.C. Lemmon, J.R . Leigh, J.X.W ei, C.R. M orton, D.J. H inde, J.O . Newton. J.C . Mein, M. D asgupta and N. Rowley, Strong Dependence o f Suh-harrier Fusion On The Nuclear Hexadecapole D eform ation , subm itted to Phys. Lett. B (1993).
[Lin84] R. Lindsay and N. Rowley, J. Phys. G10 (1984) 805.
[Löb83] K.E.G. Löbner, D. Evers, R. Pengo, U. Quade, K. Rudolf, S.J. Skorka and I. Weidl, in Proceedings of XXI W inter Meeting on Nuclear Physics, Bormio, (1983) p. 292.
[Lyo86] L. Lyons, S ta tistics for N uclear and Particle Physicists, (C am bridge U n iversity P ress , London New York New Rochelle Melbourne and Sydney, 1986).
[Mar78] B. M artin, H. Stelzer, in Experimental mathods in Heavy Ion Physics, Lecture Notes in Physics 83, edited by K. Bethge (Springer-V erlag, Berlin, H erdelberg and New York, 1978), p. 150.
[Maz83] C. M azur and M. Ribrag, Nucl. Instr. and Meth. 212 (1983) 203.
[Mos84] U. Mosel, in Treatise on H eavy-Ion Science, Vol. 2, F usion an d Q uasi-F usion P henom ena , ed ited D.A. Bromley (Plenum Press, New York, 1984) p. 3.
[Mur86] T. M urakam i, C-C. Sahm , R. Vandenbosch, D.D. Leach, A. Ray and M.J. Murphy, Phys. Rev. C34 (1986) 1353.
[Nag86] M.A. N agara jan , A.B. B alan tek in , N. Takigaw a, Phys. Rev. C34 (1986) 894.
[New88] J.O . N ew ton, D .J. H inde, R .J. C harity , J.R . Leigh, J.J.M . Bokhorst, A. Chatterjee, G.S. Foote, and S. Ogaza, Nucl. Phys. A483 (1988) 126.
[Nor 70] L.C. Northcliffe and R.F. Schilling, N uclear D ata Table, A7 (1970) 256.
[Pen83] R. Pengo, D. E vers, K.E.G. Löbner, U. Q uade, K. Rudolph, S.J. Skorka and I Weidl, Nulc. Phys. A 411 (1983)255.
[Pof83] N. Poffe, N. Rowley and R. Lindsay, Nucl. Phys. A 410 (1983)498.
217
[Ram86] S. Ram an, C.H. M alarkey, W.T. M ilner, C.W. Nestor, Jr. and P.H. Stelson, At. D ata Nucl. D ata Tables 36 (1986) 1.
[Ras71] J. R asm ussen and K. Sugaw ara-T anabe, Nucl. Phys. A171 (1971) 711.
[Rei82] W. Reisdorf, F.P. H essberger, K.D. H ildenbrabd , S. H ofm ann, G. M ünzenberg , K.-H. Schm idt, J.H .R . Schneider, W.F.W. Schneider, K. S üm m erer and G. Wirth, Phys. Rev. Lett. 49 (1982) 1811.
[Rei85] W. Reisdorf, F.P. H essberger, K.D. H ildenbrabd , S. H ofm ann, G. M ünzenberg , K.-H. S chm idt, J.H .R . Schneider, W.F.W. Schneider, K. S üm m erer and G. W irth, Nucl. Phys. A438 (1985) 212.
[Rho83] M .J. Rhoades-Brow n and V.E. O beracker, Phys. Rev. Lett. 50(1983) 1435.
[Row89] N. Rowley, A. Kabir and R. Lindsay, J. Phys. G15 (1989) L269.
[Row91] N. Rowley, in: Proceedings W orkshop on Heavy Ion C ollisions A t E nergies N ear the Coulomb B a rrie r , D a re sb u ry , 1990, ( In s t i tu e of P h y sics , B ris to l, Philadelphia and New York, 1991) p. 177.
[Row91a] N. Rowlß^G.R. Satchler and P.H. Stelson, Phys. Lett. 254BG991) 25.
[Row93] N. Rowfy, J.R . Leigh, J.X, Wei and R. Lindsay, O bta in Average A ngu lar M omenta From E xcitation Functions N ear The Coulomb B arrier , subm itted to Phys. Lett. B (1993).
[Sal77] M .Salom aa and H.A. Enge, Nucl. Instr. and Meth. 145 (1977)279.
[Sat79] G.R. Satchler and W.G. Love, Phys. Rep. 55 (1979) 183.
[Sch88] R. Schicker, N. A lam anos, P. B raun-M unzinger, T. S tachel and L. W aters, Nucl. In str . and M eth. A 2 6 9 (1988)585.
[Sco76] W. Scobel, H.H. G utbord, M. B lann and A. M ignerey, Phys. Rev. C14 (1976) 1808.
[Sha74] A.H. Shaw and J.S. Greenberg Phys. Rve. CIO (1974) 263.
[Shi86] K. Shim a, T. Mikumo and H. T aw ara, Atomic D ata and Nuvl. Data Tables 34 (1986) 358.
218
[Sig74] P. Sigm und and K.B W interbon, Nucl. Instr. and Meth. 119(1974)541.
[Sik64] T. Sikkeland, Phys. Rev. 135 (1964) B669.
[Spe77] R.H. Spear, D.C. Kean, M.T. E sat, A.N.R. Joye and M.P. Fewell, Nucl. Instr. and Meth. 147 (1977) 455.
[Ste71] F.S. Stephens, R.M. Diamond and J. de Boer, Phys. Rev. Lett 27(1971)1151.
[Ste76] H. Stelzer, Nucl. Instr. and Meth. 133 (1976) 409.
[Ste83] H. S te lze r, in P roceed ings of the sym posium on Com m em orating the 100 A nniversary of H ans Geiger's B irth , (Berlin 1982), Detectors in Heavy-Ion R eactions, Lecture Notes in Physics 178, edited by W. von O ertzen (Springer-V erlag, B erlin , H eidelberg , New York and Tokyo, 1983) p. 25.
[Ste84] A.M. Stefanini, G. Fortuna, A. Tivelli, W. Meczynski, S. Beghini, C. Signorini, S. Lunardi and M. Morando, Phys. Rev. C30 (1984) 2088.
[Ste86] S.G. S teadm an and M .J. Rhoades-Brown, Annu. Rev. Nucl. Part. Sei 36 (1986) 649.
[Ste88] P.H. Stelson, Phys. Lett. B205 (1988) 190.
[Ste89] P.H. Stelson, in Heavy-ion Reaction D ynam ics in the Tandem Energy Region, eds. Y. Sugiyam a, A. Iwamoto and I. Ikezoe, (U niversity Academic Press, Tokyo, 1989) p.49.
[Ste90] P.H. Stelson, H .J. Kim, M. Beckerm an, D. S hapira and R.L. Robinson, Phys. Rev. C41, (1990) 1584.
[Ste91] P.H. Stelson, in: Proceedings Workshop on Heavy Ion C ollisions A t E nergies N ear the Coulomb B arrier, D a re sb u ry , 1990, ( In s t i tu e of P h y sics , B ris to l, Philadelphia and New York, 1991) p. 191.
[Ste92] A.M. Stefanini, Nucl. Phys. A538 (1992) 195c.
[Sto78] R.G. S tokstad , Y. E isen , S. K aplan is, D. P e lte , U. Sm ilansky and I. Tserruya, Phys. Rev. Lett. 41 (1978) 465.
[Sto80] R.G. S to k stad , Y. E isen , S. K aplan is, D. P e lte , U. Sm ilansky and I. Tserruya, Phys. Rev. C21 (1980) 2427.
[Sto80a] R.G. Stokstad, W. Reisdorf, K.D. H ildenbrand, J.V Kratz. G. W irth, R. Lucas and J. Poitou, Z. Phys. 295 (1980) 269.

219
[Sto81] R.G. Stokstad, E.E. Gross, Phys. Rev. C23 (1981) 281.
[Tho59] T.D. Thomas, Phys. Rev. 116 (1959) 703.
[Tri89] R.E. Tribble, R.H. Burch and C.A. G agliard i, Nucl. Instr. and Meth. A285 (1989) 441.
[Uda85] T. Udagawa, B.T. Kim and T. Tam ura, Phys. Rev. C32 (1985) 124.
[Van73] R. V andenbosch and J.R . H uizenga, N uclear F ission , (Academic Press, New York and London, 1973).
[Van83] R. Vandenbosch, B.B. Back, S. Gil, A. L azzarini and A.Ray, Phys. Rev C28 (1983) 1161.
[Van86] R. Vandenbosch, T. M urakam i, C-C. Sahm, D.D. Leach, A. Ray and M.J. Murphy, Phys. Rev. Lett. 56 (1986) 1234.
[Van91] R. Vandenbosch, in: Proceedings Workshop on Heavy Ion C ollisions A t E nergies N ear the Coulomb B a rrie r , D a re sb u ry , 1990, ( In s t i tu e of P h y sics , B ris to l, Philadelphia and New York, 1991) p. 269.
[Van92] R. Vandenbosch, Annu. Rev. Nucl. P art. Sei. 42 (1992) 447.
[Vaz74] L.C. Vaz, J.M. Alexander, Phys. Rev. CIO (1974) 464.
[Vaz78] L.C. Vaz, J.M. Alexander, Phys. Rev. C18 (1978) 2152.
[Vaz81] L.C. Vaz, J.M . A lexander and G.R. S atch ler, Phys. Reports 69 (1981) 373.
[Wah64] L. W ahlin, Nucl. Instr. and Meth. 27 (1964) 55.
[Wei37] V. Weisskopf, Phys. Rev. 52 (1937) 295.
[Wei91] J.X. Wei, J.R . Leigh, D.C. W eisser, J.O . Newton, S. Elfstrom , J.P . Lestone, J.X. Chen, D.G. Popescu and D.J. Hinde Nucl. Instr. & Meth. in Phys. Res. A306 (1991) 557.
[Wei91a] J.X. Wei, J.R . Leigh, D .J. H inde, J.O . Newton, R.C. Lemmon, S. Elfstrom, J.X. Chen and N. Rowley, Phys. Rev. Lett. 67 (1991) 3368.
[Wiel898] W. Wien, Ann. Physik. 65 (1898) 440.
[Wie02] W. Wien, Ann. Physik. 8 (1902) 260.

220
[Wil80] J. Wilczynski, K. Siwek-Wilczynska, J. Van Driel, S.Gonggrijp, D.C.J.M. Hageman, R.V.F. Janssens, J. Lukasiak and R.H. Siemssen, Phys. Rev. Lett. 45 (1980) 606.
[Won73] C.Y. Wong, Phys. Rev. Lett. 31 (1973) 766.
[Wuo91] A.H. Wuosmaa, R.R. Betts, B.B. Back, M.P. Carpenter, H. Esbensen, P.B. Fernandez, B.G. Glagola, Th. Happ, R.V.F. Janssens, T.L. Khoo, E.F. Moore, F. Scarlassara, Phys. Lett. B263 (1991) 23.
[Zai84] V.P. Zaikov, E.A. K ral'kina, N.F. Vorobjev, I.S.Dmitriev, V.S. Nikolaev and Ya.A. Teplova, Nucl. Instr. and Meth. B5G984) 10.