Spinal Cord Stimulation Is Effective in the Management of Reflex Sympathetic Dystrophy
Upload
independentCategory
view
3download
0
R-00147-2008
1
Baroreflex control of lumbar and renal sympathetic nerve
activity in conscious rats
Roy Kanbar, Bruno Chapuis, Valérie Oréa, Christian Barrès, Claude Julien
Université de Lyon, Lyon, F-69008, France; Université Lyon 1, Lyon, F-69008, France,
Centre National de la Recherche Scientifique FRE 3075
Running head: Baroreflex control of regional sympathetic activities
Corresponding author:
Roy Kanbar
Laboratoire de Physiologie
Faculté de Pharmacie
8, avenue Rockefeller
69373 Lyon Cedex 08, France
Tel.: +33 478 77 70 72
Fax: +33 478 77 71 18
E-mail: [email protected]
Page 1 of 26Articles in PresS. Am J Physiol Regul Integr Comp Physiol (April 30, 2008). doi:10.1152/ajpregu.00147.2008
Copyright © 2008 by the American Physiological Society.

R-00147-2008
2
ABSTRACT
This study compared the baroreflex control of lumbar and renal sympathetic nerve activity
(SNA) in conscious rats. Arterial pressure (AP), lumbar and renal SNA were simultaneously
recorded in 6 freely behaving rats. Pharmacological estimates of lumbar and renal
sympathetic baroreflex sensitivity (BRS) were obtained by means of the sequential
intravenous administration of sodium nitroprusside and phenylephrine. Sympathetic BRS was
significantly (P < 0.05) lower for lumbar [3.0 +/- 0.4 normalized units (NU)/mmHg] than for
renal (7.6 +/- 0.6 NU/mmHg) SNA. During a 219-min baseline period, spontaneous lumbar
and renal BRS were continuously assessed by computing the gain of the transfer function
relating AP and SNA at heart rate frequency over consecutive 61.4-s periods. The transfer
gain was considered only when coherence between AP and SNA significantly differed from
zero, which was verified in 99 +/- 1 and 96 +/- 3% of cases for lumbar and renal SNA,
respectively. When averaged over the entire baseline period, spontaneous BRS was
significantly (P < 0.05) lower for lumbar (1.3 +/- 0.2 NU/mmHg) than for renal (2.3 +/- 0.3
NU/mmHg) SNA. For both SNAs, spontaneous BRS showed marked fluctuations (variation
coefficients were 26 +/- 2 and 28 +/- 2% for lumbar and renal SNA, respectively). These
fluctuations were positively correlated in 5 of 6 rats (R = 0.44 +/- 0.06; n = 204 +/- 8; P <
0.0001). We conclude that in conscious rats, the baroreflex control of lumbar and renal SNA
shows quantitative differences but is modulated in a mostly coordinated way.
Key words: arterial pressure, baroreceptor reflex, sympathetic nervous system, transfer
function
Page 2 of 26
R-00147-2008
3
INTRODUCTION
The arterial baroreceptor reflex plays a major role in the short-term control of arterial
pressure (AP) mainly through the modulation of efferent sympathetic nerve activity (SNA) to
regional circulations (12). In rats, studies aimed at characterizing the baroreflex control of
SNA under physiological conditions, i.e. in the conscious state, have been based mostly on
recordings of renal SNA (RSNA) (3, 5, 7, 10, 13, 16, 20, 23, 25), mainly because of the
purely postganglionic nature of this activity. Most often, authors implicitly assumed that
RSNA provided a reliable reflection of other regional SNAs. In the meantime, evidence has
accumulated suggesting a differential baroreflex control of regional SNAs in several animal
species (22). In the rat, the comparison of the baroreflex control of regional SNAs has been
carried out in urethane-chloralose anesthetized animals by using the vasoactive drug injection
technique, i.e., the so-called pharmacological method (29, 30). In these studies, it was
reported that the characteristics of the baroreflex function curves differed between RSNA,
lumbar SNA (LSNA) and adrenal SNA. In conscious rats, this information has not been
obtained.
Recently, the concept has emerged that the characteristics of the baroreflex control of
SNA might continuously change as part of normal autonomic responses accompanying
natural behaviors (23), physical exercise (20) and exposure to emotional stress (13). All these
data were obtained using the pharmacological method. Although this method is a valuable
tool to describe the characteristics of the baroreflex function curves, it suffers from some
important limitations. First, a proper use of the method requires stationary conditions, i.e., it
should be applied only when changes in cardiovascular variables have reached a steady state.
Secondly, its temporal resolution is low (several min or tens of min). For these reasons, the
pharmacological method is not suitable for capturing dynamic and short-lasting changes in the
Page 3 of 26

R-00147-2008
4
functional characteristics of the sympathetic baroreceptor reflex. To circumvent these
limitations, we have recently described a new method to assess the renal sympathetic
baroreflex sensitivity (BRS) that does not necessitate the administration of vasoactive drugs.
It is based on the computation of the gain of the transfer function relating RSNA and AP at
heart rate (HR) frequency (24). The method has been validated in partially (aortic)
baroreceptor denervated rats (14). One major advantage of the method is that its temporal
resolution is about 1 min. Therefore, it provides a continuous estimate of sympathetic BRS
and has already been used to show that the renal BRS exhibits minute-to-minute spontaneous
variations (14).
The objective of the present study was to compare the baroreflex control of RSNA and
LSNA in the same conscious rats. The lumbar nerve was chosen because it innervates mainly
the skeletal muscle circulation of the hindlimb (1, 32). The majority of studies performed in
humans are based on recordings of muscle SNA from the peroneal nerve in the leg.
Comparing the baroreflex control of LSNA and RSNA is therefore clinically relevant. LSNA
and RSNA were simultaneously recorded in conscious freely moving rats. Pharmacological
estimates of the sympathetic BRS were obtained by means of the sequential administration of
sodium nitroprusside and phenylephrine (7, 13). Spontaneous renal and lumbar BRS were
assessed with the transfer function method (14).
Page 4 of 26

R-00147-2008
5
METHODS
Animals and surgery. Experiments were performed on 10 to 12 week-old male Sprague-
Dawley rats (Charles River Laboratories, L’Arbresle, France) and were approved by the local
Animal Ethics Committee.
One day before the study, rats (n = 6) were anesthetized with isoflurane (2% in oxygen)
and received an injection of penicillin G (50,000 IU sc). Femoral arterial and venous
polyethylene catheters were then inserted. Four to 6 h later, rats were reanesthetized with
pentobarbital sodium (60 mg/kg iv, supplemented with 10 mg/kg iv as needed) and received
an injection of ketoprofen (5 mg/kg ip). The lumbar chains were accessed through a midline
abdominal incision after gentle retraction of the abdominal aorta and vena cava. One of the
chains was dissected and placed on a bipolar electrode at the L3-L4 level. The nerve-electrode
preparation was embedded in a silicone gel and fixed to the surrounding tissue with alpha-
cyanoacrylate glue, as described by Miki et al. (19). The electrode cable was sutured to the
psoas muscle and guided subcutaneously to exit at the back of neck, at the same site as the
catheters. The abdominal wall was then closed in layers and the rat was turned onto its right
side. Through a flank incision, a branch of the left renal nerve was dissected and a recording
electrode was implanted, as previously described in detail (7, 13, 14). The electrode cable was
also exteriorized at the back of the neck. Both catheter ends and electrode plugs were
protected in a small cap sewn to the skin. Each electrode had a separate ground wire that was
left under the skin. Rats were allowed to recover from anesthesia and surgery during 16 to 18
h in the recording room before starting the study.
Data collection and experimental protocol. AP was measured using a pressure transducer
(TNF-R; Becton Dickinson, Sandy, UT) coupled to an amplifier (model 13-4615-52; Gould,
Page 5 of 26

R-00147-2008
6
Cleveland, OH). Both SNAs were band-pass filtered (300-3,000 Hz) and amplified with a
gain of 100,000 (Model P-511J; Grass, Quincy, MA). AP and SNA signals were sampled at
500 and 10,000 Hz, respectively, by a computer equipped with a 12-bit A/D converter (model
AT-MIO-16; National Instruments, Austin, TX) and LabVIEW 5.0 software (National
Instruments).
After an acclimatization period, AP, LSNA and RSNA were continuously recorded for ~4
h. Thereafter, the baroreflex control of LSNA and RSNA was assessed in awake, resting
animals by means of sequential intravenous injections of sodium nitroprusside (100 µg/kg)
and phenylephrine (50 µg/kg/min for 1 min), as previously described (13). Finally, the mean
level of LSNA and RSNA was recorded after administration of the ganglionic blocker
chlorisondamine (2.5 mg/kg iv). As the lumbar and renal nerves were not cut distal to the
electrode, both remaining SNAs incorporated afferent nerve activity, if present. On
completion of the experiment, rats were euthanized with an intravenous overdose of
pentobarbital sodium and the residual electrical activities were recorded for an additional 20-
min period, which provided estimates of the background noise.
Off-line data analysis. SNA signals were full-wave rectified, low-pass filtered (cut-off
frequency: 150 Hz) and resampled at 5,000 Hz with LabVIEW 6i software. For each SNA,
the corresponding background noise was subtracted from the time series. The spontaneous
sympathetic BRS were calculated as previously described (14). AP, LSNA and RSNA were
resampled at 50 Hz and time series were segmented into 512-points (10.24 s) consecutive data
sets. Coherence and transfer functions were calculated between AP (input signal) and SNA
(output signal) over 11 segments overlapping by half (total duration of 61.4 s) using a fast
Fourier transform algorithm. Autospectra of AP served to locate the frequency at which
maximum power spectral density occurred in the frequency band encompassing HR (usually
Page 6 of 26

R-00147-2008
7
5-8 Hz). For each SNA, coherence, gain and phase were noted at this particular frequency.
Only gain and phase values associated with a significant coherence (0.348 at P < 0.05) (2)
were retained for further calculations. In each rat, the mean of the coherence and transfer gain
and phase were calculated over a 219-min baseline period, which yielded a maximum of 213
values (in case all coherence values were significant). The mean LSNA and RSNA values
were calculated over the same 219-min period and were used as reference values (set to
100%) for normalizing SNA data in spontaneous gain computations.
Pharmacological estimates of the sympathetic BRS were obtained by fitting a sigmoid
function to AP-LSNA and AP-RSNA data pairs collected from the beginning of the
nitroprusside-induced fall in AP up to the maximum phenylephrine-induced rise in AP (7).
This was possible because each SNA followed similar trajectories during the falling and rising
phases of AP, i.e., there was no apparent hysteresis in the sympathetic responses. AP, LSNA
and RSNA time series were resampled at 1Hz by averaging over consecutive 1-s periods. For
each SNA, data were normalized by their respective mean value calculated over the 2-min
period preceding baroreflex testing (set to 100%). A 4-parameter logistic function was then
fitted to AP-SNA data pairs (SigmaPlot 2000, SPSS Inc., Chicago, IL) by an iterative least-
squares procedure: SNA = P1 / {1 + exp[P2(AP-P3)]} + P4, where P1 is the full range of SNA
variation; P2 is a slope coefficient, P3 is AP at half the SNA range; and P4 is the lower plateau
of the curve. From these parameters, the upper plateau (P1 + P4), the threshold AP (P3 – 2/P2),
the saturation AP (P3 + 2/P2) and the operating range (saturation pressure – threshold
pressure) were derived (6, 13). Threshold and saturation AP values lay 11.9 % (of the SNA
range) below and above the upper and lower plateaus, respectively (18). The operating range
indicates the range of AP over which SNA is responsive. The first derivative of the sigmoid
function was computed to determine the baroreflex gain across the full range of AP variation,
including the maximum gain (measured at P3) and the operational gain (measured at the
Page 7 of 26

R-00147-2008
8
reference AP, i.e. the 2-min average value before baroreflex testing). Only the absolute values
of gain are presented.
Statistics. All data are presented as means ± SE. Statistical comparisons were performed
using the Wilcoxon signed rank test.
Page 8 of 26
R-00147-2008
9
RESULTS
Cardiovascular variables. Rats displayed normal behavior, notably eating, drinking,
grooming and resting during the whole recording session. During the 219-min baseline
period, mean values of AP and HR were 109 ± 2 mmHg and 389 ± 13 bpm, respectively. The
mean LSNA and RSNA levels were 4.5 ± 0.8 µV and 1.1 ± 0.3 µV, respectively. After
chlorisondamine administration, the RSNA level did not significantly differ from post-
mortem activity. By contrast, the LSNA level remained 0.39 ± 0.08 µV above post-mortem
activity.
Pharmacological assessment of baroreflex control of regional SNAs. Fig. 1 shows an
example of the reflex responses of LSNA and RSNA to drug-induced changes in AP. The
sigmoid equation could be fitted satisfactorily to each set of AP-SNA data pairs, as indicated
by highly significant, similar coefficients of determination (Fig. 1D and Table 1). Overall,
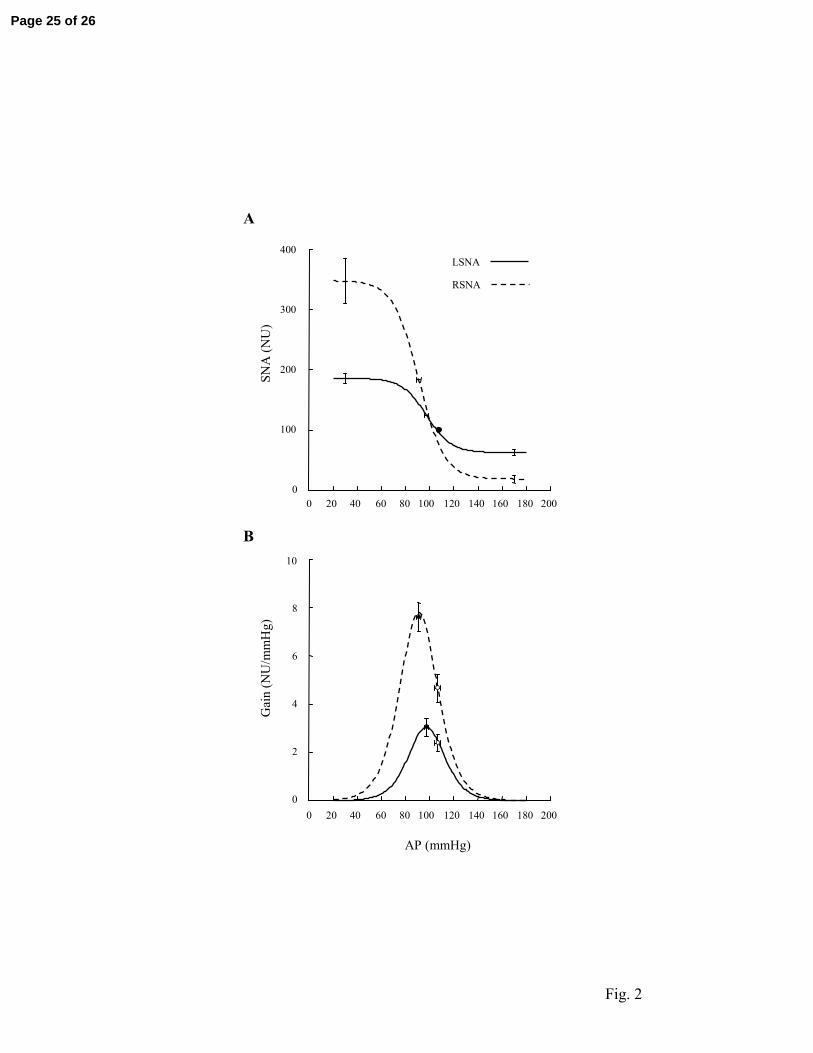
LSNA appeared less reactive to AP changes than RSNA (Fig. 1). This was reflected in a
lesser maximum reflex sympathoexcitation and a lesser maximum reflex sympathoinhibition
(Fig 2A), which resulted in a range-dependent decrease in the maximum gain for LSNA
compared with RSNA (Fig. 2B and Table 1). The operational gain was also lower for LSNA
than for RSNA. On the other hand, the operating range of baroreflex function curves did not
differ between LSNA and RSNA (Table 1).
Assessment of baroreflex control of regional SNAs by the transfer function method.
Frequency of the AP spectral peak was 6.5 ± 0.2 Hz. At this frequency, coherence between
AP and either SNA was almost always significant (Table 2). These significant coherence
values were usually high (Fig. 3C), so that reliable gain and phase values could be computed.
Page 9 of 26
R-00147-2008
10
The spontaneous index of sympathetic BRS was lower for LSNA than for RSNA (Table 2).
The phase of the transfer function at HR frequency was significantly lower (more negative)
for LSNA than for RSNA (Table 2), suggesting that LSNA lagged behind RSNA by ~20 ms.
Correlation analysis. Both transfer gains showed large variability over time (Fig. 3A).
Variation coefficients were 26 ± 2 and 28 ± 2 % for LSNA and RSNA transfer gain,
respectively. Variations of LSNA and RSNA transfer gain were positively correlated in five
of six rats (R = 0.44 ± 0.06; n = 204 ± 8; P < 0.0001 in all 5 cases) (Fig. 3D). In one rat, the
correlation did not reach significance (R = 0.071; n = 200; P = 0.3161), due to a few outlying
points that were characterized by increases in LSNA transfer gain associated with either no
change or a decrease in RSNA gain. Opposite variations of the transfer gains were sometimes
associated with a slight increase in AP, a decrease in HR, an increase in the LSNA level and a
decrease in the RSNA level. After removing data pairs associated with this particular pattern
of cardiovascular variations (n = 12), the correlation between transfer gains became
significant (R = 0.30; n = 188; P < 0.0001).
Page 10 of 26
R-00147-2008
11
DISCUSSION
In this study, we compared the baroreflex control of lumbar and renal SNA in the same
conscious rats. The pharmacological method provided a description of the entire baroreflex
function curves and demonstrated noticeable differences in some of their characteristics,
especially a range-dependent decrease in lumbar BRS compared with renal BRS. The
spontaneous BRS index derived from transfer function analysis confirmed the decreased
lumbar BRS and allowed extending this observation to most of its spontaneous fluctuations
over time. In most cases, however, these fluctuations were positively correlated with those of
renal BRS, which indicates that the baroreflex control of both regional SNAs is essentially
coordinated.
Methodological issues. Surgery for electrode implantation was performed in two steps.
We did not succeed in chronically implanting both electrodes through a single approach,
either abdominal or retroperitoneal. In addition, the recovery time from surgery was relatively
short when considering the extensive surgery rats underwent. In our hands, the recording of
both SNAs at 24 h post-surgery was possible in about one half of the rats having acutely
recordable signals. This percentage was drastically reduced at 48 h post-surgery.
Notwithstanding these limitations, it should be noted that rats of the present study showed
reasonably low HR values (<400 bpm), which is a good indicator of an acceptable level of
surgical stress, possibly owing to the administration of a long-acting non-steroidal anti-
inflammatory drug before surgery. It is important to note that this class of drugs has been
reported not to impair the baroreceptor sensitivity in rats (28) or the sympathetic BRS in
humans (21).
Page 11 of 26

R-00147-2008
12
The normalization procedure is an important issue that should be considered when
comparing results from different studies. For each SNA, we assigned the value 100% to a
mean level recorded over 219 min under baseline conditions for spontaneous BRS
computation, and during 2 min of rest for pharmacological baroreflex testing. Under these
conditions, any spontaneous or evoked change reflected a variation around the mean. In a
recent study performed on conscious rabbits (27), baroreflex function curves for lumbar and
renal SNA were compared, and the conclusion drawn was that BRS did not differ between the
two SNAs. In this study, the background noise level was taken as the minimum SNA level
observed during phenylephrine infusion, and data were normalized by the maximum value
reached during sodium nitroprusside infusion. Consequently, the SNA range was constrained
to 100 % for both SNAs so that the gain only depended on the slope coefficient P2. In the
present study, it was observed first that phenylephrine was far from eliminating discharges in
LSNA, and secondly that sodium nitroprusside induced much more robust increases in RSNA
than in LSNA (Fig. 1). With the normalization procedure used, the range of SNA variation
was smaller for LSNA than for RSNA, which accorded with the visual inspection of raw data.
As a consequence, and although the slope coefficient P2 did not differ between the two SNAs,
the LSNA gain was markedly lower than the RSNA gain, which is in agreement with previous
studies in anesthetized rats (29, 30).
Physiological issues. SNA was recorded from the lumbar chain at the L3-L4 level
assuming that sympathetic nerves at this level mostly innervate blood vessels in skeletal
muscles of the hindlimb. This assumption is supported by anatomical (1, 32) and functional
(15, 19) studies. In particular, Miki et al. (19) found an inverse relationship between LSNA
and iliac vascular conductance during the various stages of sleep in rats. An inverse
relationship with triceps surae muscle vascular conductance was also found during the early
Page 12 of 26
R-00147-2008
13
stage of fictive locomotion induced by electrical stimulation of the mesencephalic locomotor
region in decerebrate, paralyzed rats (15). However, it should not be ignored that a small
proportion of cutaneous nerve fibers is present in the lumbar chain at this level (11, 31).
Regarding the post- versus preganglionic nature of LSNA, it is of note that the residual LSNA
recorded after ganglionic blockade amounted to almost 10 % of baseline activity, which
would point to a significant contribution from preganglionic axons to overall LSNA, in
accordance with a previous study (29). However, this contribution is probably overestimated
because of the reflex increase in preganglionic SNA that was elicited by the large AP fall
caused by ganglionic blockade. In the present study, it was indeed observed that, after
chlorisondamine administration, residual LSNA could be almost halved by raising AP above
baseline levels with a phenylephrine infusion (data not shown).
Baroreflex control of regional SNAs. LSNA showed a strong rhythmicity at HR frequency
that was strongly correlated to the cardiac beat as shown by the high coherence values
observed between AP and LSNA. These values were comparable to those observed between
AP and RSNA, and thus allowed calculating a reliable spontaneous BRS index for both
SNAs. This method allowed demonstrating that both BRS fluctuate widely over time. These
variations are probably dependent, at least in part, on the behavioral state of the rats (13, 19,
20, 23). Most of the time, spontaneous fluctuations of the renal and lumbar indices of
sympathetic BRS were positively correlated. However, opposite variations were sometimes
observed. This was particularly apparent in one rat that did not show a significant correlation
between the two BRS indices. This was mainly due to outlying points that corresponded to
situations when increases in LSNA gain were associated with decreases in RSNA gain.
During these periods, it was observed that AP slightly increased while HR decreased, LSNA
Page 13 of 26
R-00147-2008
14
slightly increased and RSNA decreased. This particular pattern of cardiovascular changes has
been shown to occur during REM sleep in rats (19, 23).
Both methods for assessing sympathetic baroreflex control revealed a significantly lower
BRS for LSNA than for RSNA, which is in agreement with earlier observations in
anesthetized rats (29, 30). It is known that most, if not all, renal sympathetic nerve fibers are
responsive to the stimulation of arterial baroreceptors (9, 25). On the other hand, the lumbar
sympathetic chain contains a proportion of cutaneous nerve fibers that are poorly
barosensitive (11). It is therefore possible that cutaneous SNA would lower overall BRS
measured at the level of the lumbar chain.
Machado et al. (17) reported that electrical stimulation of the aortic depressor nerve
produces a large reduction in hindlimb vascular resistance with little or no change in renal
vascular resistance, thus suggesting that aortic baroreceptors play a predominant role in the
regulation of hindlimb vascular resistance in rats. This is in apparent disagreement with the
results of the present study which point to a more powerful baroreflex control of RSNA than
of LSNA. Although the reasons for this discrepancy are unclear, it might be suggested that
sympathetic withdrawal is not the sole mechanism of baroreflex vasodilatations in the
hindlimb circulation and that active phenomena are also involved. It has indeed been shown
that the hindlimb circulation of the rat receives a nitroxidergic innervation (8) that might be,
at least partly, under baroreflex control (26). During stimulation of the aortic depressor nerve,
both sympathetic withdrawal and active neurogenic vasodilatation could act in concert,
evoking stronger vasodilatory effects in the hindlimbs than in the kidney.
Relationships between SNA and vascular conductance are not necessarily identical
between different vascular beds, i.e. a given change in SNA will not necessarily result in
identical changes in vascular conductance. Pharmacological studies indicate that the
hindquarter circulation of the conscious rat is less sensitive to the vasoconstrictor effects of
Page 14 of 26
R-00147-2008
15
exogenously administered norepinephrine than the renal circulation (4). It remains, however,
that in conscious rats, both iliac and renal vascular conductance are inversely related to LSNA
and RSNA, respectively (19, 33).
Perspectives and significance. Owing to the simultaneous recording of LSNA and RSNA
in conscious rats, and to the use of pharmacological and spontaneous approaches, we have
shown that the sympathetic BRS is lower when assessed using LSNA than when using
RSNA. In addition, the study shows that renal and lumbar BRS fluctuate widely over time and
that these spontaneous fluctuations are mostly coordinated. The mechanism and physiological
significance of these fluctuations, however, remains to be established. In particular, further
studies are needed to clarify the effect of behavior on the baroreflex control of regional SNAs
and its modulation.
Page 15 of 26

R-00147-2008
16
ACKNOWLEDGEMENTS
This study was partially funded by the French Society of Hypertension.
Page 16 of 26
R-00147-2008
17
REFERENCES
1. Baron R, Jänig W, Kollmann W. Sympathetic and afferent somata projecting in
hindlimb nerves and the anatomical organization of the lumbar sympathetic nervous
system of the rat. J Comp Neurol 275: 460-468, 1988.
2. Barrès C, Cheng Y, Julien C. Steady-state and dynamic responses of renal sympathetic
nerve activity to air-jet stress in sinoaortic denervated rats. Hypertension 43: 629-635,
2004.
3. Barrès C, Lewis SJ, Jacob HJ, Brody MJ. Arterial pressure lability and renal
sympathetic nerve activity are dissociated in SAD rats. Am J Physiol 263: R639-R646,
1992.
4. Bennett T, Mahajan RP, March JE, Kemp PA, Gardiner SM. Regional and temporal
changes in cardiovascular responses to norepinephrine and vasopressin during continuous
infusion of lipopolysaccharide in conscious rats. Br J Anaesth 93: 400-407, 2004.
5. Burgess DE, Zimmerman TA, Wise MT, Li SG, Randall DC, Brown DR. Low-
frequency renal sympathetic nerve activity, arterial BP, stationary "1/f noise," and the
baroreflex. Am J Physiol 277: R894-R903, 1999.
6. Chen HI, Chang KC. Assessment of threshold and saturation pressure in the baroreflex
function curve: a new mathematical analysis. Jpn J Physiol 41: 861-877, 1991.
7. Cheng Y, Cohen B, Oréa V, Barrès C, Julien C. Baroreflex control of renal sympathetic
nerve activity and spontaneous rhythms at Mayer wave's frequency in rats. Auton
Neurosci 111: 80-88, 2004.
8. Davisson RL, Possas OS, Murphy SP, Lewis SJ. Neurogenically derived nitrosyl
factors mediate sympathetic vasodilation in the hindlimb of the rat. Am J Physiol 272:
H2369-H2376, 1997.
Page 17 of 26

R-00147-2008
18
9. DiBona GF, Sawin LL, Jones SY. Differentiated sympathetic neural control of the
kidney. Am J Physiol 271: R84-R90, 1996.
10. Grisk O, Dibona GF. Influence of arterial baroreceptors and intracerebroventricular
guanabenz on synchronized renal nerve activity. Acta Physiol Scand 163: 209-218, 1998.
11. Häbler HJ, Jänig W, Krummel M, Peters OA. Reflex patterns in postganglionic
neurons supplying skin and skeletal muscle of the rat hindlimb. J Neurophysiol 72: 2222-
2236, 1994.
12. Julien C. Baroreflex control of sympathetic nerve activity and blood pressure variability.
Clin Exp Pharmacol Physiol 35: 512-515, 2008.
13. Kanbar R, Oréa V, Barrès C, Julien C. Baroreflex control of renal sympathetic nerve
activity during air-jet stress in rats. Am J Physiol Regul Integr Comp Physiol 292: R362-
R367, 2007.
14. Kanbar R, Oréa V, Chapuis B, Barrès C, Julien C. A transfer function method for the
continuous assessment of baroreflex control of renal sympathetic nerve activity in rats. Am
J Physiol Regul Integr Comp Physiol 293: R1938-R1946, 2007.
15. Koba S, Yoshida T, Hayashi N. Differential sympathetic outflow and vasoconstriction
responses at kidney and skeletal muscles during fictive locomotion. Am J Physiol Heart
Circ Physiol 290: H861-H868, 2006.
16. Lundin S, Ricksten SE, Thorén P. Interaction between "mental stress" and baroreceptor
reflexes concerning effects on heart rate, mean arterial pressure and renal sympathetic
activity in conscious spontaneously hypertensive rats. Acta Physiol Scand 120: 273-281,
1984.
17. Machado BH, Bonagamba LG, Castania JA, Menani JV. Aortic baroreceptors play a
predominant role in the regulation of hindlimb vascular resistance in rats. Am J Physiol
267: R476-480, 1994.
Page 18 of 26
R-00147-2008
19
18. McDowall LM, Dampney RA. Calculation of threshold and saturation points of
sigmoidal baroreflex function curves. Am J Physiol Heart Circ Physiol 291: H2003-
H2007, 2006.
19. Miki K, Oda M, Kamijyo N, Kawahara K, Yoshimoto M. Lumbar sympathetic nerve
activity and hindquarter blood flow during REM sleep in rats. J Physiol 557: 261-271,
2004.
20. Miki K, Yoshimoto M, Tanimizu M. Acute shifts of baroreflex control of renal
sympathetic nerve activity induced by treadmill exercise in rats. J Physiol 548: 313-322,
2003.
21. Monahan KD, Ray CA. Cyclooxygenase inhibition and baroreflex sensitivity in humans.
Am J Physiol Heart Circ Physiol 288: H737-H743, 2005.
22. Morrison SF. Differential control of sympathetic outflow. Am J Physiol Regul Integr
Comp Physiol 281: R683-R698, 2001.
23. Nagura S, Sakagami T, Kakiichi A, Yoshimoto M, Miki K. Acute shifts in baroreflex
control of renal sympathetic nerve activity induced by REM sleep and grooming in rats. J
Physiol 558:975-983, 2004.
24. Oréa V, Kanbar R, Chapuis B, Barrès C, Julien C. Transfer function analysis between
arterial pressure and renal sympathetic nerve activity at cardiac pacing frequencies in the
rat. J Appl Physiol 102: 1034-1040, 2007.
25. Petiot E, Barrès C, Chapuis B, Julien C. Frequency response of renal sympathetic
nervous activity to aortic depressor nerve stimulation in the anaesthetized rat. J Physiol
537: 949-959, 2001.
26. Possas OS, Johnson AK, Lewis SJ. Role of nitrosyl factors in the hindlimb vasodilation
elicited by baroreceptor afferent nerve stimulation. Am J Physiol Regul Integr Comp
Physiol 290: R741-R748, 2006.
Page 19 of 26

R-00147-2008
20
27. Ramchandra R, Barrett CJ, Guild SJ, Malpas SC. Evidence of differential control of
renal and lumbar sympathetic nerve activity in conscious rabbits. Am J Physiol Regul
Integr Comp Physiol 290: R701-R708, 2006.
28. Salgado MC, Justo SV, Joaquim LF, Fazan R Jr, Salgado HC. Role of nitric oxide and
prostanoids in attenuation of rapid baroreceptor resetting. Am J Physiol Heart Circ
Physiol 290: H1059-H1063, 2006.
29. Scislo TJ, Augustyniak RA, O'Leary DS. Differential arterial baroreflex regulation of
renal, lumbar, and adrenal sympathetic nerve activity in the rat. Am J Physiol 275: R995-
R1002, 1998.
30. Scislo TJ, Ichinose TK, O'Leary DS. Stimulation of NTS A1 adenosine receptors
differentially resets baroreflex control of regional sympathetic outputs. Am J Physiol
Heart Circ Physiol 294: H172-H182, 2008.
31. Stauss HM, Stegmann JU, Persson PB, Häbler HJ. Frequency response characteristics
of sympathetic transmission to skin vascular smooth muscles in rats. Am J Physiol 277:
R591-R600, 1999.
32. Strack AM, Sawyer WB, Marubio LM, Loewy AD. Spinal origin of sympathetic
preganglionic neurons in the rat. Brain Res 455: 187-191, 1988.
33. Yoshimoto M, Sakagami T, Nagura S, Miki K. Relationship between renal sympathetic
nerve activity and renal blood flow during natural behavior in rats. Am J Physiol Regul
Integr Comp Physiol 286: R881-R887, 2004.
Page 20 of 26

R-00147-2008
21
FIGURES LEGENDS
Fig 1. Original recordings of AP (A), lumbar (B) and renal (C) SNA during sequential
administration of sodium nitroprusside (SNP) and phenylephrine (PHE) in one conscious rat.
Open traces show mean values averaged over 1 second. D, Baroreflex function curves fitted
to 1-s mean values of SNAs taken from the SNP bolus injection to the end of PHE infusion.
For each SNA, the background noise has been subtracted and data have been normalized by a
reference value calculated over the 2 min preceding baroreflex testing. NU, normalized units;
R², coefficient of determination (observed versus predicted values).
Fig 2. Baroreflex relationships between AP and LSNA and between AP and RSNA
determined under resting conditions in the same conscious rats (n = 6). Group average
parameters were used to generate baroreflex function curves (A) and their first derivative (B).
In A, error bars show SE for the upper and lower plateaus and for AP at midrange of the curve
(P3). The filled circle shows the reference AP-SNA data pair. For both SNAs, the reference
value is equal to 100 normalized units (NU) by definition. In B, filled and open circles show
the maximum and operational (measured at reference AP) gains, respectively.
Fig 3. Example of chronograms of spontaneous indices of lumbar and renal sympathetic BRS.
Transfer function gains (A), phases (B) were computed over 213 adjacent 61.4-s periods. In C,
the horizontal dotted line shows the significance threshold (P < 0.05) for coherence. D, linear
regression analysis between LSNA and RSNA transfer function gains. Note that one value of
RSNA gain was associated with a non significant coherence and thus was eliminated from
further calculations. For each SNA, all gain values were normalized by the corresponding
mean SNA level calculated over the entire recording period.
Page 21 of 26
R-00147-2008
22
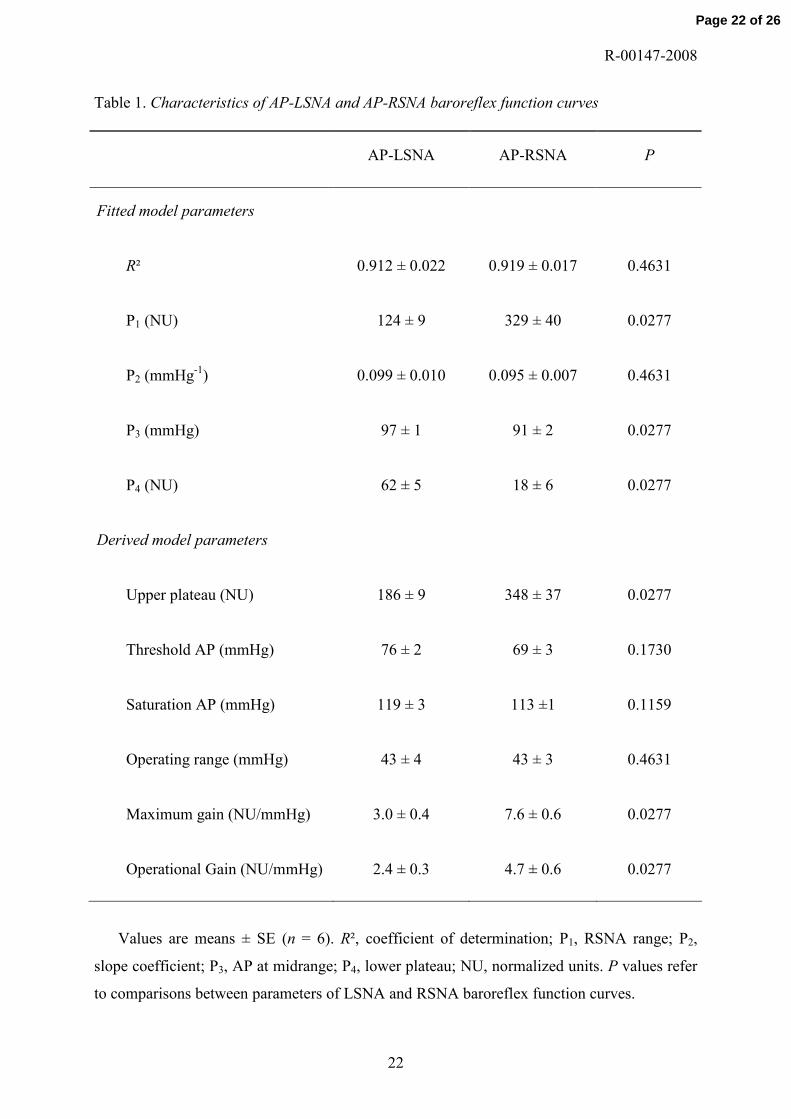
Table 1. Characteristics of AP-LSNA and AP-RSNA baroreflex function curves
AP-LSNA AP-RSNA P
Fitted model parameters
R² 0.912 ± 0.022 0.919 ± 0.017 0.4631
P1 (NU) 124 ± 9 329 ± 40 0.0277
P2 (mmHg-1) 0.099 ± 0.010 0.095 ± 0.007 0.4631
P3 (mmHg) 97 ± 1 91 ± 2 0.0277
P4 (NU) 62 ± 5 18 ± 6 0.0277
Derived model parameters
Upper plateau (NU) 186 ± 9 348 ± 37 0.0277
Threshold AP (mmHg) 76 ± 2 69 ± 3 0.1730
Saturation AP (mmHg) 119 ± 3 113 ±1 0.1159
Operating range (mmHg) 43 ± 4 43 ± 3 0.4631
Maximum gain (NU/mmHg) 3.0 ± 0.4 7.6 ± 0.6 0.0277
Operational Gain (NU/mmHg) 2.4 ± 0.3 4.7 ± 0.6 0.0277
Values are means ± SE (n = 6). R², coefficient of determination; P1, RSNA range; P2,
slope coefficient; P3, AP at midrange; P4, lower plateau; NU, normalized units. P values refer
to comparisons between parameters of LSNA and RSNA baroreflex function curves.
Page 22 of 26

R-00147-2008
23
Table 2. Characteristics of AP-LSNA and AP-RSNA coherence and transfer functions at HR
frequency
AP-LSNA AP-RSNA P
Percentage occurrence of
significant coherence values, % 99 ± 1 96 ± 3 0.3430
Mean of significant coherence
values 0.85 ± 0.02 0.81 ± 0.02 0.1730
Transfer function phase, degrees -81 ± 7 -34 ± 3 0.0277
Transfer function gain, NU/mmHg 1.3 ± 0.2 2.3 ± 0.3 0.0277
Values are means ± SE (n = 6). NU, normalized units. P values refer to comparisons
between indices of baroreflex control for LSNA and RSNA.
Page 23 of 26

AP (mmHg)
40 60 80 100 120 140 160 180
SNA
(N
U)
0
100
200
300
400
500LSNA
RSNA
R² = 0.960
R² = 0.953
0
50
100
150
200
250
20 s
0
20
40
60
0
20
40
60
RSN
A (
µV
)L
SNA
(µ
V)
AP
(m
mH
g)
SNP PHEA
B
C
D
Fig. 1
Page 24 of 26
SNA
(NU
)
0 20 40 60 80 100 120 140 160 180 2000
100
200
300
400G
ain
(NU
/mm
Hg)
2
4
6
8
10
00 20 40 60 80 100 120 140 160 180 200
A
LSNA
RSNA
AP (mmHg)
B
Fig. 2
Page 25 of 26

Fig. 3
0
1
2
3
4
0 1 2 3 4
LSNA gain (NU/mmHg)
RSN
A g
ain
(NU
/mm
Hg)
N = 212R = 0.367P < 0.0001
D Time (min)0 55 110 165 220
A
B
C
LSNA
RSNA
0
0.2
0.4
0.6
0.8
1.0
Coh
eren
ce
0
1
2
3
4
Gai
n (N
U/m
mH
g)
-180
-135
-90
-45
0
Pha
se (
degr
ees)
Page 26 of 26
Copyright © 2022 FDOKUMEN