Midsagittal Anatomy of Lumbar Lordosis in Adult Egyptians: MRI Study
13
Research Article Midsagittal Anatomy of Lumbar Lordosis in Adult Egyptians: MRI Study Abdelmonem A. Hegazy 1 and Raafat A. Hegazy 2 1 Anatomy Department, Faculty of Medicine, Zagazig University, Zagazig 44519, Egypt 2 Pathology Department, Faculty of Medicine, Zagazig University, Zagazig 44519, Egypt Correspondence should be addressed to Abdelmonem A. Hegazy; [email protected] Received 9 July 2014; Accepted 24 July 2014; Published 18 August 2014 Academic Editor: Robert J. Spinner Copyright © 2014 A. A. Hegazy and R. A. Hegazy. is is an open access article distributed under the Creative Commons Attribution License, which permits unrestricted use, distribution, and reproduction in any medium, provided the original work is properly cited. Despite the increasing recognition of the functional and clinical importance of lumbar lordosis, little is known about its description, particularly in Egypt. At the same time, magnetic resonance imaging (MRI) has been introduced as a noninvasive diagnostic technique. e aim of this study was to investigate the anatomy of the lumbar lordosis using midsagittal MRIs. Normal lumbar spine MRIs obtained from 93 individuals (46 males, 47 females; 25–57 years old) were evaluated retrospectively. e lumbar spine curvature and its segments “vertebrae and discs” were described and measured. e lumbar lordosis angle (LLA) was larger in females than in males. Its mean values increased by age. e lumbar height (LH) was longer in males than in females. At the same time, the lumbar breadth (LB) was higher in females than in males. Lumbar index (LI = LB/LH × 100) showed significant gender differences ( < 0.0001). Lordosis was formed by wedging of intervertebral discs and bodies of lower lumbar vertebrae. In conclusion, MRI might clearly reveal the anatomy of the lumbar lordosis. Use of LI in association with LLA could be useful in evaluation of lumbar lordosis. 1. Introduction ere is an increasing recognition of the functional and clinical importance for lumbar lordosis [1]. It is the key postural component in maintaining sagittal balance [2]. Affection of lumbar lordotic curve oſten results in sagittal spinal imbalance causing low back pain that represents one of the leading causes of disability [3]. erefore, there is a need for accurate reconstruction of the lordotic curvature [2]. However, the current knowledge base for such reconstruction and spinal surgery is insufficient [4]. e normal range of lumbar lordosis is so wide (30 to 80 ∘ ) that it becomes difficult to determine its value for an individual [2]. Unfortunately, the available data measuring the lumbar spine curvature using MRI are still limited, particularly in Egypt. Such data are used in assessing postural abnormalities [2]. Also, determining the size of the intervertebral disc and lumbar body vertebra is needed for the interbody fusion and artificial disc replace- ment [5]. Studies on the cadaver are subject to distortion because of postmortem tissue changes [6]. Meanwhile, the development of MRI has greatly enhanced understanding of the living human anatomy [7]. Aim of the study was to illustrate the normal mid- sagittal lumbar lordosis in adult Egyptians, its morphology and values using magnetic resonance imaging (MRI), and to evaluate the role of lumbar spine segments “vertebrae and intervertebral discs” in its formation. e established database could be useful as reference values for the evaluation of lumbar bodies and discs in symptomatic patients. 2. Material and Methods 2.1. Subjects and MRI. A retrospective study was done for cases referred to the Diagnostic Radiology Department, Zagazig University Hospitals, in the period between January 2011 and June 2014. e data about the age and sex were recorded. MRI of the lumbosacral region for each case was studied. It was performed for the subject in the routine supine position with the hips and knees flexed. e images were obtained for various reasons such as soſt tissue injuries, Hindawi Publishing Corporation Anatomy Research International Volume 2014, Article ID 370852, 12 pages http://dx.doi.org/10.1155/2014/370852
Transcript of Midsagittal Anatomy of Lumbar Lordosis in Adult Egyptians: MRI Study

Research ArticleMidsagittal Anatomy of Lumbar Lordosis inAdult Egyptians: MRI Study
Abdelmonem A. Hegazy1 and Raafat A. Hegazy2
1 Anatomy Department, Faculty of Medicine, Zagazig University, Zagazig 44519, Egypt2 Pathology Department, Faculty of Medicine, Zagazig University, Zagazig 44519, Egypt
Correspondence should be addressed to Abdelmonem A. Hegazy; [email protected]
Received 9 July 2014; Accepted 24 July 2014; Published 18 August 2014
Academic Editor: Robert J. Spinner
Copyright © 2014 A. A. Hegazy and R. A. Hegazy. This is an open access article distributed under the Creative CommonsAttribution License, which permits unrestricted use, distribution, and reproduction in any medium, provided the original work isproperly cited.
Despite the increasing recognition of the functional and clinical importance of lumbar lordosis, little is known about its description,particularly in Egypt. At the same time, magnetic resonance imaging (MRI) has been introduced as a noninvasive diagnostictechnique. The aim of this study was to investigate the anatomy of the lumbar lordosis using midsagittal MRIs. Normal lumbarspine MRIs obtained from 93 individuals (46 males, 47 females; 25–57 years old) were evaluated retrospectively. The lumbar spinecurvature and its segments “vertebrae and discs” were described and measured. The lumbar lordosis angle (LLA) was larger infemales than in males. Its mean values increased by age. The lumbar height (LH) was longer in males than in females. At thesame time, the lumbar breadth (LB) was higher in females than in males. Lumbar index (LI = LB/LH× 100) showed significantgender differences (𝑃 < 0.0001). Lordosis was formed by wedging of intervertebral discs and bodies of lower lumbar vertebrae.In conclusion, MRI might clearly reveal the anatomy of the lumbar lordosis. Use of LI in association with LLA could be useful inevaluation of lumbar lordosis.
1. Introduction
There is an increasing recognition of the functional andclinical importance for lumbar lordosis [1]. It is the keypostural component in maintaining sagittal balance [2].Affection of lumbar lordotic curve often results in sagittalspinal imbalance causing low back pain that represents oneof the leading causes of disability [3]. Therefore, there is aneed for accurate reconstruction of the lordotic curvature [2].However, the current knowledge base for such reconstructionand spinal surgery is insufficient [4]. The normal range oflumbar lordosis is so wide (30 to 80∘) that it becomes difficultto determine its value for an individual [2]. Unfortunately, theavailable data measuring the lumbar spine curvature usingMRI are still limited, particularly in Egypt. Such data are usedin assessing postural abnormalities [2]. Also, determining thesize of the intervertebral disc and lumbar body vertebra isneeded for the interbody fusion and artificial disc replace-ment [5]. Studies on the cadaver are subject to distortionbecause of postmortem tissue changes [6]. Meanwhile, the
development of MRI has greatly enhanced understanding ofthe living human anatomy [7].
Aim of the study was to illustrate the normal mid-sagittal lumbar lordosis in adult Egyptians, its morphologyand values using magnetic resonance imaging (MRI), andto evaluate the role of lumbar spine segments “vertebraeand intervertebral discs” in its formation. The establisheddatabase could be useful as reference values for the evaluationof lumbar bodies and discs in symptomatic patients.
2. Material and Methods
2.1. Subjects and MRI. A retrospective study was done forcases referred to the Diagnostic Radiology Department,Zagazig University Hospitals, in the period between January2011 and June 2014. The data about the age and sex wererecorded. MRI of the lumbosacral region for each case wasstudied. It was performed for the subject in the routinesupine position with the hips and knees flexed. The imageswere obtained for various reasons such as soft tissue injuries,
Hindawi Publishing CorporationAnatomy Research InternationalVolume 2014, Article ID 370852, 12 pageshttp://dx.doi.org/10.1155/2014/370852

2 Anatomy Research International
muscle pain, and low back pain. The selected cases were 93in number, showing normal findings on T1 and T2 imageswithout any change in the intervertebral discs and the sur-rounding bones according to the reading of the radiologist.The images were excluded if a fracture, congenital anomaly(such as lumbarisation and sacralisation), previous lumbarsurgery, or pathology affecting the anatomy of the vertebraeand intervertebral discs was present. Also, the preliminarycoronal scans were examined to ensure that the spine did notshow significant scoliosis or any other rotation.
2.2. Protocol of MRI. The lumbar spine was examined withthe use of a 1.5 Tesla scanner. T1-weighted images in the sagit-tal plane were obtained using a single spin-echo techniquewith a repetition time (TR) of 400milliseconds and echo time(TE) of 8 milliseconds. Repetition time (TR) for T2-weightedimages was 2800 milliseconds while for echo time (TE) itwas 120 milliseconds. Slice thickness was 4mm. The field ofview (FOV) used was 25–30 cm which readily contained thelumbar spine with the last thoracic vertebra and a part of thesacrum.
2.3.Measurements. AllMRIs were examined in themidsagit-tal plane. Confirmation that the resulting images were trulymidline for all lumbar segments was determined from thepresence of the spinous processes and clear demarcation ofthe spinal cord (Figure 1(a)) [8]. Twenty-three anatomicalparameters were measured for each case (Table 1). Eachmeasurement was recorded twice by each author, one fromsagittal T1-weighted MRI and the other from T2-weightedMRI. This procedure was performed on two different days.The average of the readings for each parameter was used inthe final calculation of the statistics. The angle of lumbarcurvature was measured according to the modified Cobb’smethod (Table 1, Figure 1(b)) [9]. Also, the height (LH)and breadth (LB) of the lumbar curvature were recorded(Figure 1(c)).Metricmeasurements included the anterior andposterior heights for each one of the five lumbar vertebrae(L1 to L5) and the intervertebral discs (L1/2 to L5/S1) (Figures2(a) and 2(b)). All measurements were taken to the nearest0.1mm.
2.4. Statistical Analysis. First, the number of males andfemales was calculated. Then, each gender group wasarranged into two age groups; the first group included agesfrom 25 to 41 years while the second one ranged from 42 to 57years. This was followed by determining the mean age (±SD)of individuals for each group.
Second, we calculated the mean values (m) of lumbarlordosis angle (LLA), height (LH), and breadth (LB) forlumbar spine curvature and anterior and posterior heights ofvertebrae (AL and PL) and intervertebral discs (AD and PD)for each group.
Third, the data were analyzed for reliability. The datawere analyzed for inter- and intraobserver reliability using theinterclass correlation coefficient (ICC). A reliability greaterthan or equal to an ICC of 0.75 (𝑃 < 0.05) was consideredhighly reliable [10].
Fourth, the following indices were determined.
(i) Lordosis index (LI) was calculated as the ratio of thebreadth (LB) and height (LH) of the lumbar spine, asLI = LB/LH × 100 [11].
(ii) Wedge index (WI) for each lumbar segment wascalculated as the ratio of the anterior height to theposterior height [12] as follows.
(a) Lumbar vertebral index = AL/PL × 100,(b) Intervertebral disc index = AD/PD × 100.
A vertebral body or disc with WI more than 100 wasconsidered as a wedged (lordotic) segment. At the same time,the index less than 100 was a wedged segment in the oppositeside (kyphosis); and that equaled 100 was a neutral “square”structure. Then, the mean values (m) of the indices for eachgroup were calculated.
Finally, the obtained data were scrutinized, tabulated, andstatistically analyzed, using maximum and minimum values,range (R),mean (m), difference betweenmeans of two groups(MD), standard deviation (SD), and 95% confidence intervals(CI) of mean.The existence of significant differences betweenthe means for the gender and the age groups was analyzedby using independent Student’s t-test. A 𝑃 value <0.05 wasconsidered to be statistically significant.
3. Results
3.1. Ages and Numbers. There were 46 males (M) and 47females (F). Their ages ranged from 25 to 57 years. The firstage group (G1) included 26 males and 20 females, whilethe second group (G2) included 20 males and 27 females(Table 2).
3.2. Morphological MRI Findings. The lumbar spine pre-sented a posterior concavity “lordosis.” The lordosis wasnoticed to be more obvious in females than in males (Figures1(a) and 1(b)) and increased by age (Figures 3(a), 3(b),and 3(c)). The lumbar spine comprised five vertebrae andfive intervertebral discs. The vertebral bodies appeared onsagittal MRI as square masses separated by wedged ellipticalintervertebral discs. The bodies demonstrated a low-signalouter rim surrounding the high-signal cancellous bone. Thelumbar endplates were concave, while that of the uppersurface of the sacrum was more or less flat. Meanwhile, theintervertebral discs had slightly less signal than the adjacentvertebral bodies; each disc was shown to consist of a centralpart, the nucleus pulposus, and a peripheral part, the annulusfibrosus, well differentiated on T2-weighted images.The discsincreased in size in a craniocaudal direction. The maximumconcavity of lumbar lordosis was noticed opposite to theupper edge of the fourth lumbar vertebra (Figures 1(c) and3(a)). The height of fifth intervertebral disc (L5/S1) appearedto be markedly increased anteriorly, causing posterior incli-nation of the sacrum (Figures 2-3).
3.3. Inter- and Intraobserver Agreement. The values obtainedat the different days by the same and each author were in

Anatomy Research International 3
Table 1: Definitions of measured lumbar parameters.
Parameter Abbreviation Definition
1 Angle of lumbarlordosis LLA The angle between two straight lines passing along the upper border of the body of
first lumbar vertebra (L1) and the upper sacral border.
2 Height of lumbarspine curvature LH The maximum distance between the upper anterior end of first lumbar vertebra (L1)
to that of sacrum.
3 Breadth of lumbarspine curvature LB The maximum distance between the deepest point of lumbar curvature (at the back
of upper part of L4 body) to the line representing the length of lumbar curvature.
4 Anterior height oflumbar vertebral body AL (1 to 5) The maximum distance between superior and inferior limits of the anterior border
of lumbar vertebral body at the midsagittal plane.
5 Posterior height oflumbar vertebral body PL (1 to 5) The maximum distance between superior and inferior limits of the posterior border
of lumbar vertebral body at the midsagittal plane.
6 Anterior height ofintervertebral disc AD (L1/2 to L5/S1) The maximum distance between superior and inferior limits of the anterior border
of lumbar intervertebral disc at the midsagittal plane.
7 Posterior height ofintervertebral disc PD (L1/2 to L5/S1) The maximum distance between superior and inferior limits of the posterior border
of lumbar intervertebral disc at the midsagittal plane.
Table 2: Profile of subjects.
Number Mean (m) Standarddeviation (SD)
GenderMales (M) 46 39.37 ±9.09Females (F) 47 39.60 ±9.06
Age groupsM: 25–41 y 26 32.42 ±3.30
42–57 y 20 48.40 ±5.44F: 25–41 y 20 30.35 ±4.20
42–57 y 27 46.44 ±4.23
close agreement with one another. The interclass correlationcoefficient and the intraobserver agreement ranged from 0.90to 0.97 and 0.95 to 0.98, respectively.
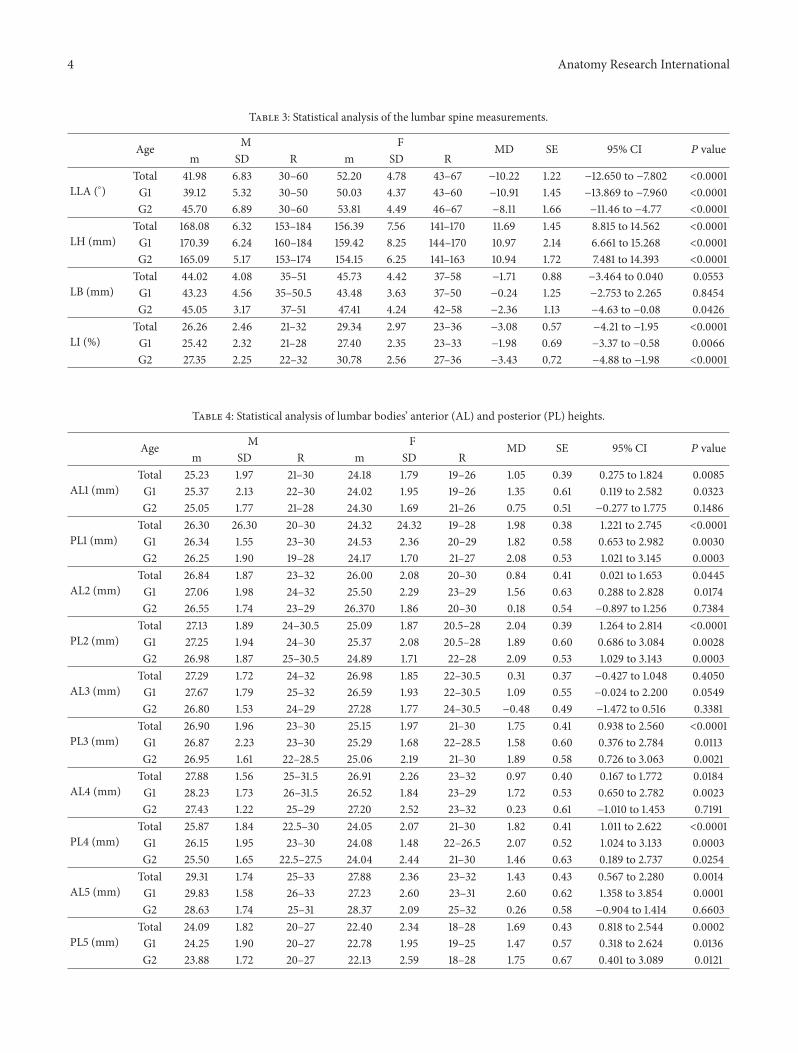
3.4. Measurement of Lumbar Lordosis Angle and Index. Thevalues obtained for the angle of lumbar lordosis (LLA) rangedfrom 30∘ to 67∘. Itsmean in females (52.20∘) was larger than inmales (41.98∘).This differencewas considered to be extremelystatistically significant (𝑃 value <0.0001).The angle increasedby age, in both sexes. In males, its mean increased from 39.12∘to 45.70∘ and in females from 50.03∘ to 53.81∘, for the firstand second age groups, respectively. Also, the lumbar height(LH) showed a significant increase in males (m: 168.08mm)compared to that in females (m: 156.39mm), with 𝑃 value<0.0001. There was LH decrease in both sexes by age; meansin males decreased from 170.39mm in the first age groupto 165.09mm in the second group and in females from to159.42 in the first group to 154.15mm in the second group.At the same time, LB was slightly increased in females (m:45.73mm) compared to that in males (m: 44.02mm), with 𝑃value =0.0553. On calculating the LI, there was a significant
difference in its means between males (m: 26.26) and females(m: 29.34), with 𝑃 value <0.0001 (Table 3).
3.5. Measurement of the Vertebral Body. The anterior height(AH) of lumbar vertebral bodies in both sexes increasedin a craniocaudal direction. Its mean for L1 vertebra was25.23mm and 24.18mm in males and females, respectively.The value increased to reach 29.31mm and 27.88mm for L5vertebra of males and females, respectively. In regard to theposterior height (PH), there was an increase in its mean inmales from L1 (m: 26.30mm) to L2 (m: 27.13mm), followedby a slight and gradual decrease to reach L5 (m: 24.09mm).The PH in females showed the same trend of the male PH,but the change in the values occurred at L3 instead of L2. Allinvestigated dimensions of male vertebrae were greater thanthose of females, with variable𝑃 values (Figure 4(a); Table 4).
3.6. Measurement of the Intervertebral Disc. The lumbardisc heights generally increased toward the lower lumbarlevels, except for the posterior height of L5/S1. The mean ofanterior disc height (AD) was 8.91mm and 8.11mm for thefirst disc (L1/2) in males and females, respectively. Then, itincreased gradually till it reached the last disc (L5/S1) whereits value was 14.41mm and 13.97mm in males and females,respectively. On the other hand, the mean of posterior discheight (PD) of L1/2 was 6.60mm in males and 6.69mm infemales; then, it increased gradually till the L4/5, where itreached its maximum values about 8.0mm in both sexes.Then, the PD of L5/S1 decreased to reach about 7.0mm inboth sexes. Despite the increased disc dimensions in malescompared to those in females in most cases, these differenceswere not statistically significant (Figure 4(b); Table 5).
3.7. Assessment of the Wedging of Lumbar Spine Segments.Investigation of lumbar indices (WI) in males showed thatthe lumbar bodies presented kyphotic wedging (WI < 100)at L1 and tended to be neutral “square” (WI = 100) at L2 and
4 Anatomy Research International
Table 3: Statistical analysis of the lumbar spine measurements.
Age M F MD SE 95% CI 𝑃 valuem SD R m SD R
LLA (∘)Total 41.98 6.83 30–60 52.20 4.78 43–67 −10.22 1.22 −12.650 to −7.802 <0.0001G1 39.12 5.32 30–50 50.03 4.37 43–60 −10.91 1.45 −13.869 to −7.960 <0.0001G2 45.70 6.89 30–60 53.81 4.49 46–67 −8.11 1.66 −11.46 to −4.77 <0.0001
LH (mm)Total 168.08 6.32 153–184 156.39 7.56 141–170 11.69 1.45 8.815 to 14.562 <0.0001G1 170.39 6.24 160–184 159.42 8.25 144–170 10.97 2.14 6.661 to 15.268 <0.0001G2 165.09 5.17 153–174 154.15 6.25 141–163 10.94 1.72 7.481 to 14.393 <0.0001
LB (mm)Total 44.02 4.08 35–51 45.73 4.42 37–58 −1.71 0.88 −3.464 to 0.040 0.0553G1 43.23 4.56 35–50.5 43.48 3.63 37–50 −0.24 1.25 −2.753 to 2.265 0.8454G2 45.05 3.17 37–51 47.41 4.24 42–58 −2.36 1.13 −4.63 to −0.08 0.0426
LI (%)Total 26.26 2.46 21–32 29.34 2.97 23–36 −3.08 0.57 −4.21 to −1.95 <0.0001G1 25.42 2.32 21–28 27.40 2.35 23–33 −1.98 0.69 −3.37 to −0.58 0.0066G2 27.35 2.25 22–32 30.78 2.56 27–36 −3.43 0.72 −4.88 to −1.98 <0.0001
Table 4: Statistical analysis of lumbar bodies’ anterior (AL) and posterior (PL) heights.
Age M F MD SE 95% CI 𝑃 valuem SD R m SD R
AL1 (mm)Total 25.23 1.97 21–30 24.18 1.79 19–26 1.05 0.39 0.275 to 1.824 0.0085G1 25.37 2.13 22–30 24.02 1.95 19–26 1.35 0.61 0.119 to 2.582 0.0323G2 25.05 1.77 21–28 24.30 1.69 21–26 0.75 0.51 −0.277 to 1.775 0.1486
PL1 (mm)Total 26.30 26.30 20–30 24.32 24.32 19–28 1.98 0.38 1.221 to 2.745 <0.0001G1 26.34 1.55 23–30 24.53 2.36 20–29 1.82 0.58 0.653 to 2.982 0.0030G2 26.25 1.90 19–28 24.17 1.70 21–27 2.08 0.53 1.021 to 3.145 0.0003
AL2 (mm)Total 26.84 1.87 23–32 26.00 2.08 20–30 0.84 0.41 0.021 to 1.653 0.0445G1 27.06 1.98 24–32 25.50 2.29 23–29 1.56 0.63 0.288 to 2.828 0.0174G2 26.55 1.74 23–29 26.370 1.86 20–30 0.18 0.54 −0.897 to 1.256 0.7384
PL2 (mm)Total 27.13 1.89 24–30.5 25.09 1.87 20.5–28 2.04 0.39 1.264 to 2.814 <0.0001G1 27.25 1.94 24–30 25.37 2.08 20.5–28 1.89 0.60 0.686 to 3.084 0.0028G2 26.98 1.87 25–30.5 24.89 1.71 22–28 2.09 0.53 1.029 to 3.143 0.0003
AL3 (mm)Total 27.29 1.72 24–32 26.98 1.85 22–30.5 0.31 0.37 −0.427 to 1.048 0.4050G1 27.67 1.79 25–32 26.59 1.93 22–30.5 1.09 0.55 −0.024 to 2.200 0.0549G2 26.80 1.53 24–29 27.28 1.77 24–30.5 −0.48 0.49 −1.472 to 0.516 0.3381
PL3 (mm)Total 26.90 1.96 23–30 25.15 1.97 21–30 1.75 0.41 0.938 to 2.560 <0.0001G1 26.87 2.23 23–30 25.29 1.68 22–28.5 1.58 0.60 0.376 to 2.784 0.0113G2 26.95 1.61 22–28.5 25.06 2.19 21–30 1.89 0.58 0.726 to 3.063 0.0021
AL4 (mm)Total 27.88 1.56 25–31.5 26.91 2.26 23–32 0.97 0.40 0.167 to 1.772 0.0184G1 28.23 1.73 26–31.5 26.52 1.84 23–29 1.72 0.53 0.650 to 2.782 0.0023G2 27.43 1.22 25–29 27.20 2.52 23–32 0.23 0.61 −1.010 to 1.453 0.7191
PL4 (mm)Total 25.87 1.84 22.5–30 24.05 2.07 21–30 1.82 0.41 1.011 to 2.622 <0.0001G1 26.15 1.95 23–30 24.08 1.48 22–26.5 2.07 0.52 1.024 to 3.133 0.0003G2 25.50 1.65 22.5–27.5 24.04 2.44 21–30 1.46 0.63 0.189 to 2.737 0.0254
AL5 (mm)Total 29.31 1.74 25–33 27.88 2.36 23–32 1.43 0.43 0.567 to 2.280 0.0014G1 29.83 1.58 26–33 27.23 2.60 23–31 2.60 0.62 1.358 to 3.854 0.0001G2 28.63 1.74 25–31 28.37 2.09 25–32 0.26 0.58 −0.904 to 1.414 0.6603
PL5 (mm)Total 24.09 1.82 20–27 22.40 2.34 18–28 1.69 0.43 0.818 to 2.544 0.0002G1 24.25 1.90 20–27 22.78 1.95 19–25 1.47 0.57 0.318 to 2.624 0.0136G2 23.88 1.72 20–27 22.13 2.59 18–28 1.75 0.67 0.401 to 3.089 0.0121

Anatomy Research International 5
Nucleus pulposus
Posterior epidural
S1
ColonUterus
Subarachnoid space
Cauda equinaFilum terminale
Spinous process
Spinal cord
L5L4/5
L1Conus medullaris
Annulus fibrosus
fat
(a) T2-weighted MRI for a female aged 35 years (b) T1-weighted MRI for a male aged 35 years with LLA (41.2∘)measured between L1 and S1
S1
L1
(c) T2-weighted MRI for a male aged 35 years. The curvature appears likethat in the previous figure, but itsmeasurement (LLA) shows increased angle(54.5∘), caused by posterior inclination of sacrum. Also, the height (verticalline) and breadth (horizontal line) of lumbar curvature are shown
Figure 1: Sagittal MRIs showing a gender difference in curvature of lumbar spine.
then were followed from L3 to L5 by a progressive lordoticbent (WI > 100), with variable 𝑃 values between the two agegroups. Female lumbar WI showed that lordotic trend beganas high as L2 (Figure 4(c); Table 6).
The wedging of the intervertebral discs showed a lordotictrend (WI > 100) at all levels and an increase from the L1/2(m: 137.02 for males and 124.68 for females) to the L5/S1 disc
(m: 214.85 for males and 212.43 for females). The increasewas in a gradient manner from L1/2 till L4/5 and then wasfollowed bymarked increase at L5/S1.TheWI of discs showedno statistically significant difference between the two sexes.In regard to bodies of lumbar vertebrae, the WI means werehigher in females than in males, with statistically significantdifferences, particularly in the second age group (Figure 4(c);

6 Anatomy Research International
(a) Measurements of heights of bodies of lumbarvertebrae
(b) Measurements of heights of intervertebral discs
Figure 2: Sagittal T1-weighted MRI of a male aged 32 years showing measurements of lumbar spine segments.
Table 6). At all levels of lumbar segments, there was anincrease in the mean values of WI by age, which appeared inthe second age group in comparison with the first one. Thedifference was highly significant at the last disc “L5/S1” (𝑃value =0.0024) (Figure 4(d); Table 7).
4. Discussion
Lumbar lordosis is the inward (ventral) curvature of thelumbar spine [13]. It is a key factor in maintaining sagit-tal balance or “neutral upright sagittal spinal alignment”which represents a postural goal for surgical, ergonomic,and physiotherapeutic intervention [2]. The normal rangeof LLA in the current study was 30∘ to 67∘. The recordedrange of LLA differed from that recorded in other studies,using radiographs in their assessment. Jackson andMcManus[14] described values which ranged from 31∘ to 88∘; andDamasceno et al. [15] reported a range from 33∘ to 89∘.Our data showed an increased LLA in females (m: 52.20∘)than in males (m: 41.98∘), with 𝑃 value <0.0001. Murrie etal. [16] agreed with the current results that lumbar lordosisis more prominent in females but they were unable todemonstrate any significant variation in lordosis with age.Stagnara et al. [17] argued that females apparently had greaterlumbar lordosis owing to their greater buttock size. Anotherexplanation for increased lordosis in females is the numberof pregnancies. Nourbakhsh et al. [18] stated that the degreeof lumbar lordosis was positively related with the numberof pregnancies. During the later months of pregnancy, withthe increase in size and weight of the fetus, women tendto increase the posterior lumbar concavity in an attempt topreserve their center of gravity [19]. Our results showed thatLLA also increased by aging in both sexes, more markedlyin males (m: 39.12∘ and 45.70∘ for the first and second age
groups, resp.) than in females (m: 50.03∘ and 53.81∘ for the firstand second age groups, resp.). These findings are in generalin agreement with that of Tuzun et al. [20] who stated thatlumbar lordosis and thoracic kyphosis are increased withage. Lee et al. [21] recognized a difference between youngerand older subjects; but they accounted this difference tothe disparity in flexibility or function of body parts. Withlumbar hyperlordosis, the middle thoracic vertebrae tend tobe more wedged, and the lumbar vertebrae tend to be morereverse-wedged [22]. Ghandhari et al. [23] agreed that lumbarlordosis and thoracic kyphosis are correlated, so that lumbarlordosis would increase as thoracic kyphosis increases. Thethoracic kyphosis angle increases with age and the increaseis greater in females than in males [24]. Similar results arerecorded in the current study, regarding lumbar lordosis.Thisincrease in lordosis may be attributed to an alteration in theintervertebral discs and a loss in the posterior vertebral bodyheight of lumbar spine. Also, the imbalance in the supportinganterior and posterior soft tissues and musculature might beanother contributing factor [25].
Increased lumbar lordosis is one of numerous etiologicfactors for low back pain [26]. Also, prolonged sitting isgenerally accepted as a high risk factor in low back pain; andit is frequently suggested that a lordotic posture of the lumbarspine should be maintained during sitting [27]. Nowadays,measurement of lumbar spine curvature and motion hasbecome common place in the clinical assessment of LBP. Ithelps in assessment of spinal function and is often used as anoutcome measure for clinical intervention studies [28]. Thelumbar curvature measurement, as used in Cobb’s method[9], may not fully represent the curvature of the spine asshown in some cases of the current study due to differencesin posterior inclination of sacrum (Figures 1(b) and 1(c)).Cobb’s angle reflects changes in the end vertebrae inclination

Anatomy Research International 7
(a) A female aged 36 years with LLA = 58.4∘
66∘
(b) A female aged 47 years with LLA = 66∘
(c) A female aged 55 years, showing irregularitiesin the posterior aspects of lower lumbar vertebrae(arrows)
Figure 3: Sagittal T1-weighted female MRIs showing an increase in curvature of lumbar spine with aging.
rather than changes within the spinal curvature; moreover, itneglects the translation of the apical vertebra [29]. Therefore,we added the lordosis index (LI) in assessment. This LIshowed significant gender differences in both age groups,with 𝑃 value =0.0066 and <0.0001, for the first and secondage groups, respectively. It could be useful in the evaluationof lumbar lordosis, as it depends on the ratio of the breadth(depth) of lumbar curvature and height of the lumbar spine.
Lumbar lordosis is formed by the wedging of the lumbarvertebral bodies and of the intervertebral discs [13]. Lordoticor dorsal wedging (ventral height greater than dorsal height)of the vertebral bodies and the intervertebral discs willincrease the LLA, while kyphotic or ventral wedging willdecrease it [30]. In the current study, the vertebral bodiesas well as the intervertebral discs showed a progressive
craniocaudal participation in lumbar lordosis. The vertebralbodies in males showed kyphotic bent in L1, tended toneutral in L2, and then showed progressive lordotic bentfrom L3 downwards with statistically significant differencebetween the anterior and posterior heights of the vertebrae.In females, the participation of bodies in lordosis began athigher level, at L2 instead of L3 in males. Similar findingsreported that posterior wedging of these vertebrae is abouttwice as common in females as in males [31]. Bernhardtand Bridwell [32] agreed with the current study that lumbarlordosis usually starts at L1-2 and gradually increases at eachlevel caudally. They added that the lowest three segmentsaccount for 80% of the lumbar lordosis. In regard to discs, thecurrent results showed lordotic bent at all levels, progressivein a craniocaudal direction, with maximum lordosis at

8 Anatomy Research International
30
25
20
15
10
5
0
L1L2L3
L4L5
Male AL Male PL Female AL Female PL
(a)
16
14
12
10
8
6
4
2
0
Male AD Male PD Female AD Female PD
L1/2L2/3L3/4
L4/5L5/S1
(b)
250
200
150
100
50
0
L1 L2 L3 L4 L5 L1/2 L2/3 L3/4 L4/5 L5/S1
MF
(c)
250
200
150
100
50
0
L1 L2 L3 L4 L5 L1/2 L2/3 L3/4 L4/5 L5/S1
Group1Group2
(d)
Figure 4: Graphs showing the differences in themean values: (a) vertebral body heights (mm) in total investigated cases ofmales and females,(b) intervertebral disc heights (mm) in total investigated cases of males and females, (c) indices of wedging of lumbar spine segments in theinvestigated cases of males and females. Number 100 indicates the base line; above it is lordotic and below it is kyphotic segment; (d) indicesof wedging of lumbar spine segments in the investigated groups of ages.
L5/S1. This trend of increased participation in lumbar lor-dosis towards caudal segments was also mentioned in otherstudies [15, 33]. The WI increased by age in the lumbarsegments, with statistically significant difference at L5/S1 (𝑃 =0.0024).
The lumbar spine is the part of the vertebral column,which is subjected to the compressive load exerted by theincumbent trunk. Its structure is ideally suited to withstandcompressive loads [34].The compressive loads occurredmoreon the posterior concave aspects, particularly of lower lumbarsegments resulting in decrease in the posterior heights andhence increase in lumbar lordosis was noticed in the secondage group of the present study (Figures 3(c) and 4(d)).
Despite the X-ray examination being valid and usefulfor evaluating spinal curvatures, it carries many limitationsthat include clarifying disc structure and obtaining measure-ments free from problems due to overlapping of anatomical
images [35]. Several studies have proven the accuracy of MRIthat has recently become a popular imaging modality, invertebralmeasurements, identifying the details of its anatomy[12, 36]. Given its high resolution, it has largely replacedthe computed tomography (CT) in the differentiation of theseveral adjacent structures comprising the spine [36]. Weutilized MRI for this study rather than CT scans, becauseit is more reliable in detecting soft tissue degeneration andhence choosing the cases for study [30]. MRI produces truesagittal tomographic profiles for the spine [37]. In the currentstudy, all cases underwent lumbosacral spine MRI in supineposition, with hips and knees flexed, resulting in relativespinal flexion. This position maximizes the dimensions, thusreducing the magnitude of any stenotic effect [38]. Also,it creates a hypolordosis of the lumbar spine relative tothe standing position. Positioning the subject in the supineposition with extended lower limbs produces the lumbar

Anatomy Research International 9
Table 5: Statistical analysis of lumbar discs’ anterior (AD) and posterior (PD) heights.
Age M F MD SE 95% CI 𝑃 valuem SD R m SD R
AD1 (mm)Total 8.91 1.20 7–12.8 8.11 1.17 5.5–10 0.80 0.25 0.316 to 1.293 0.0015G1 9.02 1.40 7–12.8 7.89 1.10 5.5–9.5 1.13 0.38 0.372 to 1.904 0.0045S2 8.77 0.90 7–10 8.27 1.21 6–10 0.50 0.32 −0.152 to 1.144 0.1301
PD1 (mm)Total 6.60 1.10 4–9.5 6.69 1.06 5–8.5 −0.09 0.22 −0.532 to 0.358 0.6976G1 6.74 1.14 4–9.5 6.64 1.28 5–8.5 0.10 0.36 −0.617 to 0.823 0.7735G2 6.42 1.06 5–8 6.72 0.88 5–8 −0.30 0.28 −0.877 to 0.262 0.2829
AD2 (mm)Total 10.00 1.23 7–12 9.69 1.34 6.7–13 0.31 0.27 −0.221 to 0.838 0.2497G1 9.93 1.25 8–12 9.34 1.66 6.7–13 0.59 0.43 −0.271 to 1.455 0.1737G2 10.11 1.23 7–12 9.96 0.99 8–12 0.15 0.32 −0.509 to 0.793 0.6626
PD2 (mm)Total 7.03 0.92 5–9 6.95 1.01 5–9 0.08 0.20 −0.316 to 0.480 0.6850G1 7.92 1.47 6–10.5 6.81 1.23 5–9 1.11 0.41 0.289 to 1.937 0.0093G2 6.91 0.93 5–9 7.06 0.82 5–8.5 −0.15 0.26 0.667 to 0.366 0.5604
AD3 (mm)Total 11.30 1.41 8.5–14.5 11.07 1.19 8–13.5 0.23 0.27 −0.302 to 0.770 0.3880G1 11.14 1.47 8.5–14 11.08 1.41 8–13 0.06 0.43 −0.811 to 0.921 0.8994G2 11.52 1.32 9–14.5 11.06 1.03 9.5–13.5 0.46 0.34 −0.230 to 1.149 0.1861
PD3 (mm)Total 7.73 1.35 5.5–10.5 7.52 1.23 5.5–9.5 0.21 0.27 −0.326 to 0.736 0.4454G1 7.92 1.47 6–10.5 7.53 1.29 5.5–9.5 0.39 0.42 −0.444 to 1.231 0.3493G2 7.48 1.14 5.5–10 7.52 1.21 5.5–9 −0.04 0.35 −0.746 to 0.659 0.9013
AD4 (mm)Total 12.76 1.27 10.5–16 12.51 1.40 8–14.5 0.25 0.28 −0.301 to 0.801 0.3695G1 12.83 1.38 10.5–16 12.76 1.41 8–14 0.07 0.41 −0.760 to 0.911 0.8558G2 12.68 1.14 11–15 12.33 1.39 10–14.5 0.35 0.38 −0.426 to 1.109 0.3749
PD4 (mm)Total 7.87 1.22 6–11 8.01 1.27 5.5–10 −0.15 0.26 −0.659 to 0.368 0.5753G1 8.20 1.17 6.5–11 8.28 1.34 5.5–10 −0.08 0.37 −0.825 to 0.665 0.8297G2 7.44 1.18 6–9 7.82 1.21 5.5–9 −0.38 0.35 −1.090 to 0.331 0.2874
AD5 (mm)Total 14.41 1.55 11–18 13.97 1.80 10.5–17 0.44 0.35 −0.249 to 1.138 0.2057G1 14.25 1.44 11–16.5 14.55 1.50 10.5–16 −0.30 0.44 −1.179 to 0.579 0.4951G2 14.63 1.71 11–18 13.54 1.91 10.5–17 1.09 0.54 0.003 to 2.172 0.0493
PD5 (mm)Total 6.82 0.96 5–9 6.73 1.16 4.5–9 0.09 0.22 −0.357 to 0.520 0.7140G1 7.37 0.82 6–9 7.03 0.99 4.5–8.5 0.34 0.27 −0.198 to 0.879 0.2094G2 6.10 0.60 5–7 6.52 1.24 5–9 −0.42 0.30 −1.023 to 0.186 0.1699
lordosis of the upright position [39]. In regards to inter-and intraobserver reliability using the interclass correlationcoefficient (ICC), the recorded ranges were considered excel-lent reproducibility. This might render the use of MRI tobe more or less an accurate method for study of lumbarspine.
The primary strength of the work was the study of mor-phology of lumbar lordosis in correlation with other relatedparameters including the lumbar lordosis angle, lumbarindex, and heights of lumbar segments (vertebrae and discs),using highly reliable MRI measures. This is of great valuefor planning orthopedical surgical procedures, monitoringthe progression and treatment of spinal deformities, anddetermining reference values in normal and pathologicalconditions [29]. The information is also necessary for con-structing accurate mathematical models of the human spine[40]. Such procedures should restore disc height and spine
curvature as normally as possible and provide a certainamount of mobility [41].
In conclusion, the study highlights the morphology anddimensions of the lumbar lordosis which represents animportant postural factor for sagittal spinal balance. Wesuggest using WI in association with Cobb’s method of LLAin evaluating lumbar curvature. Further studies using MRIare recommended to confirm presence of any associationof lordosis with ethnicity and physical activities. Any wideapplication of the current parameters has to consider thepotential limitations of our sampling populations, such as theeffect of body height and weight in vertebral angle.
Conflict of Interests
The authors declare that there is no conflict of interestsregarding the publication of this paper.

10 Anatomy Research International
Table 6: Statistical analysis of wedge indices (WI) of lumbar spine segments; lumbar bodies (L); and intervertebral discs (L/) in gender groups.
Age M F MD SE 95% CI 𝑃 valuem SD R m SD R
L1Total 95.93 4.69 85–108 99.66 5.57 91–119 −3.72 1.07 −5.85 to −1.60 0.0008G1 96.19 4.54 88–107 98.30 3.61 93–106 −2.11 1.24 −4.61 to 0.39 0.0961G2 95.60 4.97 85–108 100.67 6.55 91–119 −5.07 1.75 −8.59 to −1.54 0.0058
L2Total 98.98 3.96 92–112 103.77 7.11 92–123 −4.79 1.20 −7.16 to −2.41 0.0001G1 99.35 3.39 92–100 100.65 4.32 92–107 −1.30 1.14 −3.59 to 0.99 0.2575G2 98.50 4.65 92–112 106.07 7.92 94–123 −7.57 1.99 −11.58 to −3.57 0.0004
L3Total 101.78 4.24 78–109 107.57 5.30 99–118 −5.79 1.00 −7.77 to −3.81 <0.0001G1 103.23 3.99 78–109 105.35 4.51 99–113 −2.12 1.08 −4.27 to 0.03 0.0536G2 99.90 3.86 88–105 109.22 5.31 100–118 9.32 1.40 −12.15 to −6.50 <0.0001
L4Total 108.04 5.76 100–120 111.74 8.03 98–130 −3.70 1.45 −6.59 to −0.82 0.0125G1 108.23 6.33 100–117 109.45 8.74 98–122 −1.22 2.22 −5.69 to 3.26 0.5857G2 107.80 5.07 100–120 113.44 7.16 103–130 −5.64 1.88 −9.43 to −1.86 0.0043
L5Total 122.17 9.87 108–165 125.30 12.56 96–152 −3.12 2.35 −7.78 to 1.54 0.1862G1 123.65 10.47 108–165 120.00 11.85 96–135 3.65 3.30 −2.99 to 10.30 0.2738G2 120.25 8.92 108–140 129.22 11.78 108–152 −8.97 3.15 −15.31 to −2.63 0.0066
L1/2Total 137.02 20.97 100–200 124.68 26.02 86–182 12.34 4.91 2.59 to 22.09 0.0136G1 135.73 20.40 100–200 123.20 23.98 88–160 12.53 6.55 −0.67 to 25.73 0.0622G2 138.70 22.11 100–180 125.78 27.83 86–182 12.92 7.54 −2.27 to 28.11 0.0936
L2/3Total 143.41 21.05 113–200 141.36 20.58 100–190 2.05 4.32 −6.52 to 10.63 0.6358G1 139.77 18.75 113–176 138.90 20.79 106–190 0.87 5.85 10.91 to 12.65 0.8825G2 148.15 23.34 121–200 143.19 20.63 100–183 4.96 6.44 −8.00 to 17.93 0.4445
L3/4Total 148.89 22.42 110–207 150.38 26.45 118–237 −1.49 5.09 −11.60 to 8.62 0.7701G1 142.54 15.84 110–169 148.95 18.72 127–183 −6.41 5.10 −16.69 to 3.86 0.2151G2 157.15 27.08 113–207 151.44 31.28 118–237 5.71 8.73 −11.87 to 23.28 0.5166
L4/5Total 165.13 24.84 110–217 159.87 30.72 122–236 5.26 5.80 −6.26 to 16.78 0.3670G1 158.69 24.09 110–215 156.85 25.60 123–236 1.84 7.36 −12.99 to 16.68 0.8036G2 173.50 23.81 141–217 162.11 34.33 122–236 11.39 8.95 −6.64 to 29.41 0.2097
L5/S1Total 214.85 38.21 133–320 212.43 39.70 131–340 2.42 8.08 −13.63 to 18.48 0.7651G1 195.08 22.88 133–233 209.80 26.32 153–260 −14.72 7.26 −29.36 to −0.08 0.0487G2 240.55 39.24 187–320 214.37 47.68 131–340 26.18 13.07 −0.15 to 52.51 0.0513
Table 7: Statistical analysis of wedge indices (WI) of lumbar spine segments; lumbar bodies (L); and intervertebral discs (L/) in both agegroups.
Group 1 (number 46) Group 2 (number 47) MD SE 95% CI 𝑃 valuem SD R m SD R
L1 97.11 4.25 88–107 98.51 6.39 85–119 −1.40 1.13 −3.64 to 0.84 0.2173L2 99.91 3.83 92–110 102.85 7.66 92–123 −2.94 1.26 −5.44 to −0.43 0.0220L3 104.15 4.31 99–113 105.26 6.62 88–118 −1.10 1.16 −3.41 to 1.20 0.3445L4 108.76 7.41 98–122 111.04 6.90 100–130 −2.28 1.48 −5.23 to 0.67 0.1276L5 122.07 11.11 98–122 125.40 11.47 96–165 −3.34 2.34 −7.99 to 1.31 0.1574L1/2 130.28 22.66 88–200 131.28 26.10 86–182 −0.99 5.07 −11.07 to 9.08 0.8451L2/3 139.39 19.44 106–190 145.30 21.72 100–200 −5.91 4.28 −14.40 to 2.59 0.1707L3/4 145.33 17.25 110–183 153.87 29.40 113–237 −8.55 5.01 −18.50 to 1.41 0.0916L4/5 157.89 24.49 110–236 166.96 30.54 122–236 −9.07 5.75 −20.48 to 2.35 0.1182L5/S1 201.48 25.25 133–260 225.51 45.74 131–340 −24.03 7.69 −39.30 to −8.77 0.0024

Anatomy Research International 11
Acknowledgments
Theauthorswish to express their cordial gratitude toProfessorOsama Daoud, Dr. Riham Amir, and Mr. Ahmed Naser atDiagnostic Radiology Department, Zagazig University, forinvaluable help and cooperation throughout the work.
References
[1] J.-S. Jang, S.-H. Lee, J.-H. Min, and D. H. Maeng, “Influence oflumbar lordosis restoration on thoracic curve and sagittal posi-tion in lumbar degenerative kyphosis patients,” Spine, vol. 34,no. 3, pp. 280–284, 2009.
[2] E. Been and L. Kalichman, “Lumbar lordosis,”TheSpine Journal,vol. 14, pp. 87–97, 2014.
[3] K. Chang, X. Leng, W. Zhao et al., “Quality control of recon-structed sagittal balance for sagittal imbalance,” Spine, vol. 36,no. 3, pp. E186–E197, 2011.
[4] R. Lin, R. Lee, Y. Huang, S. Chen, and C. Yu, “Analysis of lum-bosacral lordosis using standing lateral radiographs throughcurve reconstruction,” Biomedical Engineering—Applications,Basis and Communications, vol. 14, no. 4, pp. 149–156, 2002.
[5] C. H. Hong, J. S. Park, K. N. Jung, andW. J. Kim, “Measurementof the normal lumbar intervertebral disc space using magneticresonance imaging,” Asian Spine Journal, vol. 4, no. 1, pp. 1–6,2010.
[6] I. G. Parkin and G. R. Harrison, “The topographical anatomyof the lumbar epidural space,” Journal of Anatomy, vol. 141, pp.211–217, 1985.
[7] A. Cilliers, D. H. Schulenburg, J. J. van Rensburg, and D. Gen,“MRI determination of the vertebral termination of the duralsac tip in a South African population: clinical significance dur-ing spinal irradiation and caudal anaesthesia,” SA Journal ofRadiology, vol. 14, no. 3, pp. 52–55, 2010.
[8] S. Goh, C. Tan, R. I. Price et al., “Influence of age and genderon thoracic vertebral body shape and disc degeneration: anMRinvestigation of 169 cases,” Journal of Anatomy, vol. 197, no. 4,pp. 647–657, 2000.
[9] D. E. Harrison, R. Cailliet, D. D. Harrison, T. J. Janik, and B.Holland, “Reliability of centroid, Cobb, and Harrison posteriortangent methods: which to choose for analysis of thoracickyphosis.,” Spine, vol. 26, no. 11, pp. E227–234, 2001.
[10] L. T. Cronbach, G. C. Gleser, H. Nanda, and N. Rajaratnam,TheDependability of Behavioral Measurements:Theory of Generaliz-ability for Scores and Profiles, JohnWiley & Sons, NewYork, NY,USA, 1972.
[11] S. A. Voutsinas and G. D. MacEwen, “Sagittal profiles of thespine,” Clinical Orthopaedics and Related Research, vol. 210, pp.235–242, 1986.
[12] M. Matsumoto, E. Okada, Y. Kaneko et al., “Wedging of ver-tebral bodies at the thoracolumbar junction in asymptomatichealthy subjects on magnetic resonance imaging,” Surgical andRadiologic Anatomy, vol. 33, no. 3, pp. 223–228, 2011.
[13] R. Vialle, N. Levassor, L. Rillardon, A. Templier, W. Skalli, andP. Guigui, “Radiographic analysis of the sagittal alignment andbalance of the spine in asymptomatic subjects,” Journal of Boneand Joint Surgery A, vol. 87, no. 2, pp. 260–267, 2005.
[14] R. P. Jackson and A. C. McManus, “Radiographic analysis ofsagittal plane alignment and balance in standing volunteers andpatients with low back pain matched for age, sex, and size: aprospective controlled clinical study,” Spine, vol. 19, no. 14, pp.1611–1618, 1994.
[15] L. H. F. Damasceno, S. R. G. Catarin, A. D. Campos, and H.L. A. Defino, “Lumbar lordosis: a study of angle values and ofvertebral bodies and intervertebral discs role,” Acta OrtopedicaBrasileira, vol. 14, no. 4, pp. 193–198, 2006.
[16] V. L. Murrie, A. K. Dixon, W. Hollingworth, H. Wilson, andT. A. C. Doyle, “Lumbar lordosis: study of patients with andwithout low back pain,”Clinical Anatomy, vol. 16, no. 2, pp. 144–147, 2003.
[17] P. Stagnara, J. C. de Mauroy, G. Dran et al., “Reciprocal angula-tion of vertebral bodies in a sagittal plane: approach to refer-ences for the evaluation of kyphosis and lordosis,” Spine, vol. 7,no. 4, pp. 335–342, 1982.
[18] M. R. Nourbakhsh, S. J. Moussavi, and M. Salavati, “Effects oflifestyle andwork-related physical activity on the degree of lum-bar lordosis and chronic low back pain in a Middle East popu-lation,” Journal of Spinal Disorders, vol. 14, no. 4, pp. 283–292,2001.
[19] R. Snell, Clinical Anatomy by Regions, chapter 12, LippincottWilliams &Wilkins, 9th edition, 2012.
[20] C. Tuzun, I. Yorulmaz, A. Cindas, and S. Vatan, “Low back painand posture,” Clinical Rheumatology, vol. 18, no. 4, pp. 308–312,1999.
[21] E. S. Lee, C.W. Ko, S.W. Suh, S. Kumar, K. Kang, and J. H. Yang,“The effect of age on sagittal plane profile of the lumbar spineaccording to standing, supine, and various sitting positions,”Journal of Orthopaedic Surgery and Research, vol. 9, p. 11, 2014.
[22] X. G. Cheng, Y. Sun, S. Boonen et al., “Measurements of ver-tebral shape by radiographicmorphometry: Sex differences andrelationships with vertebral level and lumbar lordosis,” SkeletalRadiology, vol. 27, no. 7, pp. 380–384, 1998.
[23] H. Ghandhari, H. Hesarikia, E. Ameri, and A. Noori, “Assess-ment of normal sagittal alignment of the spine and pelvis inchildren and adolescents,” BioMed Research International, vol.2013, Article ID 842624, 7 pages, 2013.
[24] Y. Nishiwaki, Y. Kikuchi, K. Araya et al., “Association of thoracickyphosis with subjective poor health, functional activity andblood pressure in the community-dwelling elderly,” Environ-mental Health and Preventive Medicine, vol. 12, no. 6, pp. 246–250, 2007.
[25] A. A. De Smet, R. G. Robinson, B. E. Johnson, and B. P. Lukert,“Spinal compression fractures in osteoporotic women: patternsand relationship to hyperkyphosis,” Radiology, vol. 166, no. 2,pp. 497–500, 1988.
[26] H. Kim, S. Chung, S. Kim et al., “Influences of trunkmuscles onlumbar lordosis and sacral angle,” European Spine Journal, vol.15, no. 4, pp. 409–414, 2006.
[27] M. Lengsfeld, A. Frank, D. L. van Deursen, and P. Griss, “Lum-bar spine curvature during office chair sitting,” Medical Engi-neering and Physics, vol. 22, no. 9, pp. 665–669, 2000.
[28] J. M.Williams, I. Haq, and R. Y. Lee, “Dynamicmeasurement oflumbar curvature using fibre-optic sensors,” Medical Engineer-ing and Physics, vol. 32, no. 9, pp. 1043–1049, 2010.
[29] T. Vrtovec, F. Pernus, and B. Likar, “A review of methods forquantitative evaluation of spinal curvature,” European SpineJournal, vol. 18, no. 5, pp. 593–607, 2009.
[30] P. Lakshmanan, B. Purushothaman, V. Dvorak, W. Schratt, S.Thambiraj, and B. M. Boszczyk, “Sagittal endplate morphologyof the lower lumbar spine,” European Spine Journal, vol. 21, pp.S160–S164, 2012.
[31] M. F. Ericksen, “Aging in the lumbar spine. II. L1 and L2,”American Journal of Physical Anthropology, vol. 48, no. 2, pp.241–246, 1978.

12 Anatomy Research International
[32] M. Bernhardt and K. H. Bridwell, “Segmental analysis of thesagittal plane alignment of the normal thoracic and lumbarspines and thoracolumbar junction,” Spine, vol. 14, no. 7, pp. 717–721, 1989.
[33] D. E. Gelb, L. G. Lenke, K. H. Bridwell, K. Blanke, and K. W.McEnery, “An analysis of sagittal spinal alignment in 100 asymp-tomatic middle and older aged volunteers,” Spine, vol. 20, no. 12,pp. 1351–1358, 1995.
[34] P. Rajnics, V. Pomero, A. Templier, F. Lavaste, andT. Illes, “Com-puter-assisted assessment of spinal sagittal plane radiographs,”Journal of Spinal Disorders, vol. 14, no. 2, pp. 135–142, 2001.
[35] U. Tarantino, E. Fanucci, R. Iundusi et al., “Lumbar spine MRIin upright position for diagnosing acute and chronic low backpain: statistical analysis of morphological changes,” Journal ofOrthopaedics and Traumatology, vol. 14, no. 1, pp. 15–22, 2013.
[36] G. Jindal and B. Pukenas, “Normal spinal anatomy onmagneticresonance imaging,” Magnetic Resonance Imaging Clinics ofNorth America, vol. 19, pp. 475–488, 2011.
[37] N. Roberts, C. Gratin, and G. H. Whitehouse, “MRI analysis oflumbar intervertebral disc height in young and older popula-tions,” Journal of Magnetic Resonance Imaging, vol. 7, no. 5, pp.880–886, 1997.
[38] F. Alyas, D. Connell, and A. Saifuddin, “Upright positionalMRIof the lumbar spine,” Clinical Radiology, vol. 63, no. 9, pp. 1035–1048, 2008.
[39] M. L. Andreasen, L. Langhoff, T. S. Jensen, and H. B. Albert,“Reproduction of the lumbar lordosis: A comparison of stand-ing radiographs versus supine magnetic resonance imagingobtained with straightened lower extremities,” Journal of Mani-pulative and PhysiologicalTherapeutics, vol. 30, no. 1, pp. 26–30,2007.
[40] M. M. Panjabi, V. Goel, T. Oxland et al., “Human lumbar ver-tebrae. Quantitative three-dimensional anatomy,” Spine, vol. 17,no. 3, pp. 299–306, 1976.
[41] F. Schwab, V. Lafage, R. Boyce, W. Skalli, and J. Farcy, “Gravityline analysis in adult volunteers: age-related correlation withspinal parameters, pelvic parameters, and foot position,” Spine,vol. 31, no. 25, pp. E959–E967, 2006.

Submit your manuscripts athttp://www.hindawi.com
Hindawi Publishing Corporationhttp://www.hindawi.com Volume 2014
Anatomy Research International
PeptidesInternational Journal of
Hindawi Publishing Corporationhttp://www.hindawi.com Volume 2014
Hindawi Publishing Corporation http://www.hindawi.com
International Journal of
Volume 2014
Zoology
Hindawi Publishing Corporationhttp://www.hindawi.com Volume 2014
Molecular Biology International
GenomicsInternational Journal of
Hindawi Publishing Corporationhttp://www.hindawi.com Volume 2014
The Scientific World JournalHindawi Publishing Corporation http://www.hindawi.com Volume 2014
Hindawi Publishing Corporationhttp://www.hindawi.com Volume 2014
BioinformaticsAdvances in
Marine BiologyJournal of
Hindawi Publishing Corporationhttp://www.hindawi.com Volume 2014
Hindawi Publishing Corporationhttp://www.hindawi.com Volume 2014
Signal TransductionJournal of
Hindawi Publishing Corporationhttp://www.hindawi.com Volume 2014
BioMed Research International
Evolutionary BiologyInternational Journal of
Hindawi Publishing Corporationhttp://www.hindawi.com Volume 2014
Hindawi Publishing Corporationhttp://www.hindawi.com Volume 2014
Biochemistry Research International
ArchaeaHindawi Publishing Corporationhttp://www.hindawi.com Volume 2014
Hindawi Publishing Corporationhttp://www.hindawi.com Volume 2014
Genetics Research International
Hindawi Publishing Corporationhttp://www.hindawi.com Volume 2014
Advances in
Virolog y
Hindawi Publishing Corporationhttp://www.hindawi.com
Nucleic AcidsJournal of
Volume 2014
Stem CellsInternational
Hindawi Publishing Corporationhttp://www.hindawi.com Volume 2014
Hindawi Publishing Corporationhttp://www.hindawi.com Volume 2014
Enzyme Research
Hindawi Publishing Corporationhttp://www.hindawi.com Volume 2014
International Journal of
Microbiology