BALTIC SEA ENVIRONMENT PROCEEDINGS - HELCOM
85
BALTIC SEA ENVIRONMENT PROCEEDINGS No. 27 C GUIDELINES FOR THE BALTIC MONITORING PROGRAMME FOR THE THIRD STAGE PART C. HARMFUL SUBSTANCES IN BIOTA AND SEDIMENTS BALTIC MARI NE ENVIRONMENT PROTECTI ON COM MI SS IO N - HELSINKI COMM ISS ION -
-
Upload
khangminh22 -
Category
Documents
-
view
0 -
download
0
Transcript of BALTIC SEA ENVIRONMENT PROCEEDINGS - HELCOM

BALTIC SEA ENVIRONMENT PROCEEDINGS
No. 27 C
GUIDELINES FOR THE BALTIC MONITORING PROGRAMME FOR
THE THIRD STAGE
PART C. HARMFUL SUBSTANCES IN BIOTA AND SEDIMENTS
BALTIC MARI NE ENVIRONMENT PROTECTION COM MISSION - HELSINKI COMM ISSION -

BALTIC SEA ENVIRONMENT PROCEEDINGS
No. 27 C
GUIDELINES FOR THE BALTIC MONITORING PROGRAMME FOR
THE THIRD STAGE
PART C. HARMFUL SUBSTANCES IN BIOTA AND SEDIMENTS
BALTIC MARINE ENVIRONMENT PROTECTION COMMISSION - HELSINKI COMMISSION -
December 1988

For bibliographic purposes this document should be cited Baltic Marine Environment Protection Commission
- Helsinki Commission -1988
Guidelines for the Baltic Monitoring Programme for the Third Stage; Part C. Harmful Substances in
Biota and Sediments Baltic Sea Environment Proceedings No. 27 C
Copyright by the Baltic Marine Environment Protection Commission - Helsinki Commission
ISSN 0357-2994
Helsinki 1988 ··-Government Printing Centre
as:
-------------
PREFACE
The Guidelines for the Third Stage of the Baltic Monitoring
Programme (BMP) are based on the Guidelines for the Second Stage
of the BMP, published by the Commission as Baltic Sea Environment
Proceedings No. 12 (BSEP No.l2). They have been revised by an
expert group nominated by the Commission. The group was chaired
by Dr. Gunni Aertebj erg and experts from all the Baltic Sea
States participated in the work, with assistance from the
International Council for Exploration of the Sea (ICES) and
experts of the Baltic Marine Biologists (BMB).
The ninth. meeting of the Helsinki Commission (15-19 February
1988) accepted the Guidelines in general as HELCOM Recommendation
9/7. The Commission recommends that the Governments of the
Contracting Parties to the Helsinki
Guidelines for the Third Stage of
Convention should apply the
the BMP, i.e. from 1989 to
1993, and also, whenever possible, to follow the Guidelines in
the monitoring of the internal waters as well. The data is to be
submitted to the data bases of the Commission, as specified in
the Guidelines.
The Guidelines for the Third Stage of the BMP are published in
the BSEP series as four separate volumes (27 A, 27 B, 27 C, 27 D)
and also as one combined volume of loose sheets.
The contents of the Guidelines for the Third Stage of the BMP is
as follows:
BSEP 27 A; Part A; Introductory Chapters
27 B; Part B; Physical and Chemical Determinands in Sea
Water
27 C; Part C; Harmful Substances in Biota and Sediments
27 D; Part D; Biological Determinands
Volumes B, C and D are interided to be used together with Part A
which contains general information on e.g. station networks,
sampling requirements and data submission.
1 4B3155T

Any corrections or proposals for · t lmprovemen s concerning
content of these Guidelines are welcomed, and to be addressed
Baltic Marine Environment Protection Commission
- Helsinki Commission -
Mannerheimintie 12 A
SF - 00100 Helsinki
Finland
Tel.: 90- 602 366
Tlx.: 125105 hlcom sf
Tfx.: 90 - 644 577
the
to:
Possible comments concerning the formats prepared by the ICES
should be addressed to the ICES, accordingly, as indicated in the formats.
---------------------------------
GUIDELINES FOR THE BALTIC MONITORING PROGRAMME FOR THE THIRD STAGE
C 0 N T E N T S
of the Baltic Sea Environment Proceedings No. 27 A, B, C, D
A.
B.
B. I
INTRODUCTORY CHAPTERS (Baltic Sea Environment Proceedings No. 27 A)
Table of contents of Part A
1. Introduction 2. Station grid and maps 3. Sampling frequency and timetable 4. Data 5. Conditions required for carrying out scientific
research in the fishing/economic zone (for programmes adopted by the Helsinki Commission)
6. Format for notification of proposed research cruises 7. Research vessels operating in the Baltic Sea Area
PHYSICAL AND CHEMICAL DETERMINANDS IN SEA WATER (Baltic Sea Environment Proceedings No. 27 B)
Table of contents of Part B
Basic Hydrographic and Hydrochemical Determinands
1. Temperature 2. Salinity 3. Density structure 4. Oxygen 5. Hydrogen sulphide 6. pH 7. Alkalinity 8. Nutrients 9. Sampling and preservation of samples
10. References in Chapter B I 11. Reporting format for hydrographic and hydrochemical
data
B. II Heavy Metals, Petroleum Hydrocarbons and Chlorinated Hydrocarbons in Sea Water
1. Heavy metals 2. Petroleum hydrocarbons (PHCs) 3. Chlorinated hydrocarbons (CHCs) 4. Sampling and preservation of samples 5. References in Chapter B II 6. Reporting format for contaminants in sea water 7. Exchange of data on contaminants in sea water via
magnetic tape

c. HARMFUL SUBSTANCES IN BIOTA AND SEDIMENTS (Baltic Sea Environment Proceedings No. 27 C)
Table of contents of Part C
c. I Harmful Substances in Biota
1. Harmful substances in selected species 2. Analytical procedures for mercury, cadmium and lead in
biological material 3. Chlorinated hydrocarbons in biological material 4. References in Chapter C I 5. Reporting format for contaminants in marine biota 6, Exchange of data on contaminants in fish and shellfish
via magnetic tape
C. II Trend Monitoring of Contaminants in the Coastal Zone
1. Choice of monitoring organisms 2. Sampling procedures 3, Subsampling and handling 4. References in Chapter C II
C. III Harmful Substances in Sediments
1. Contaminants in sediments 2. Reporting format for contaminants in sediments
D. BIOLOGICAL DETERMINANDS (Baltic Sea Environment Proceedings No. 27 D)
Table of contents of Part D
1. Phytoplankton primary production 2. Phytoplankton chlorophyll-a and phaeopigments 3. Phytoplankton -4. Checklist of phytoplankton 5. Rubin codes of phytoplankton 6. Phytoplankton identification sheets 7. Zooplankton 8. Macrozoobenthos 9. Micro-organisms
10, Biological data reporting format 11. Forms to be used in relation to the biological data
reporting format 12. Microbiological data reporting format
c.
C. I
TABLE OF CONTENTS OF PART C
HARMFUL SUBSTANCES IN BIOTA AND SEDIMENTS
Harmful Substances in Biota
1. Harmful substances in selected species 2. Analytical procedures for mercury, cadmium
and lead in biological materlal 3. Chlorinated hydrocarbons in biological
material 4. References in Chapter C I 5. Reporting format for contaminants in
marine biota 6. Exchange of data on contaminants in
fish and shellfish via magnetic tape
Tables of Section C.I.:
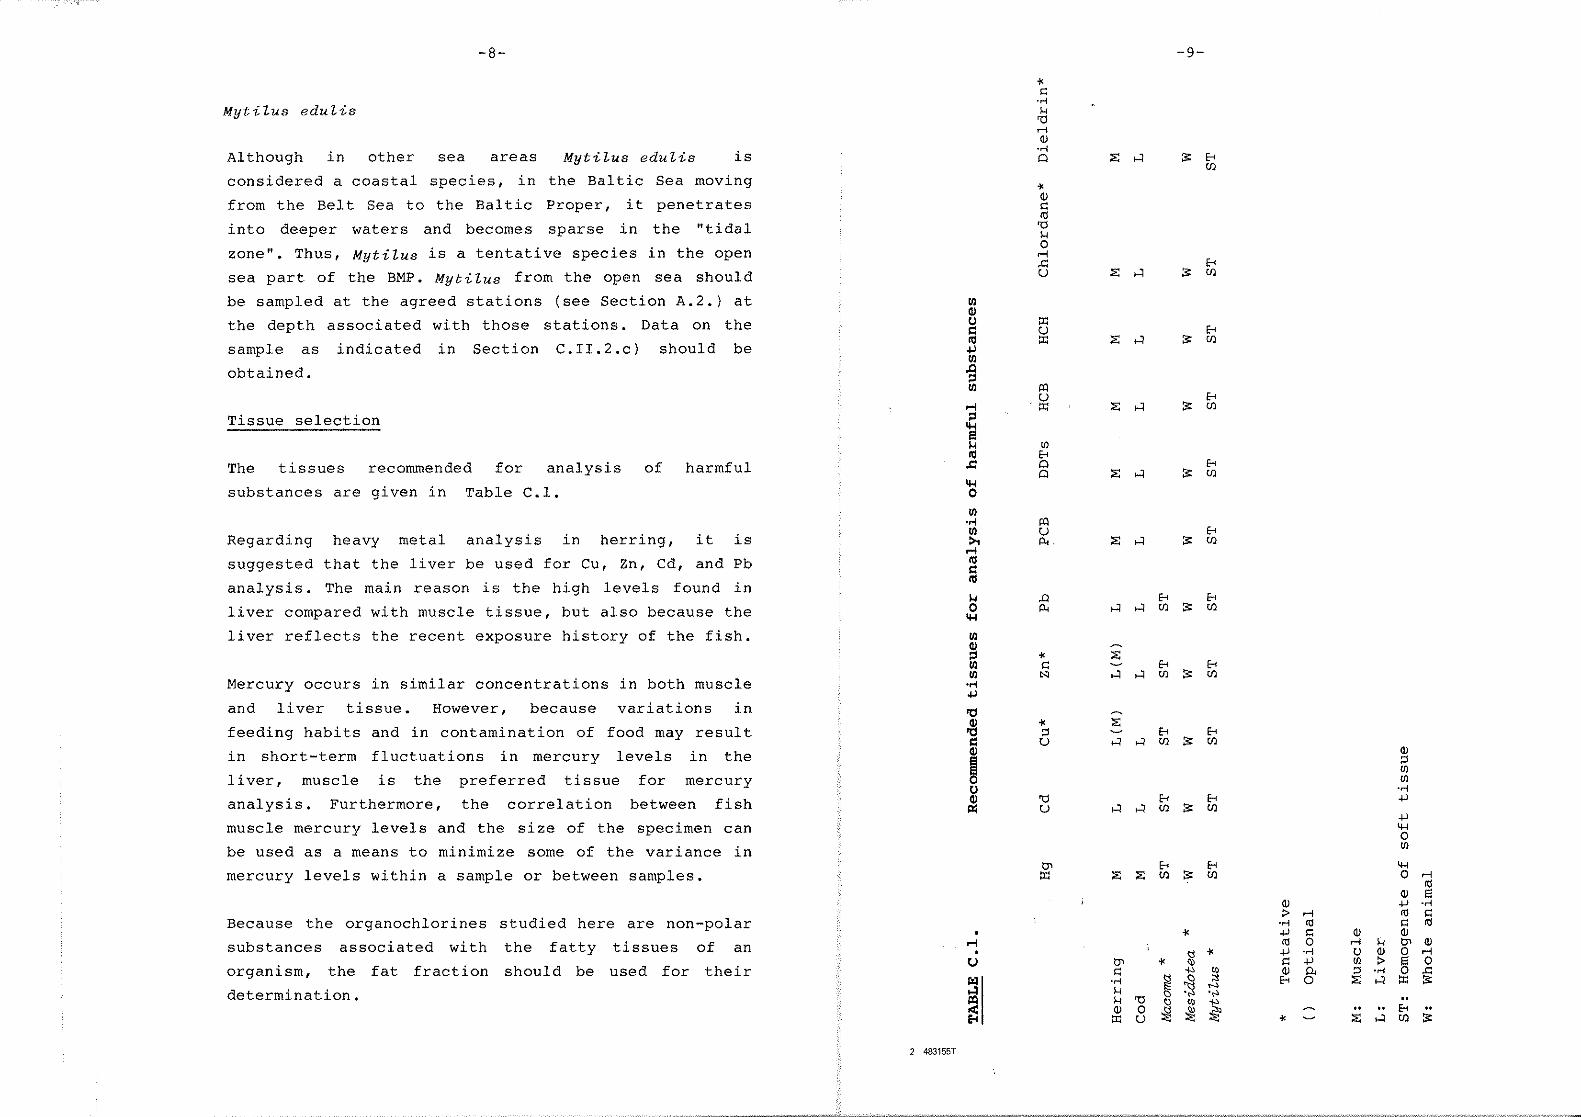
Tab.C.l. Recommended tissues for analysis of harmful substances
Tab.C.2. Tab.C,3. Tab.C.4. Tab.C.5.
Sampling procedures Sample information sheet Sampling procedures Determination of precision: 20 replicate analyses of total mercury in two fish flour samples
Figures of Section C.I.:
Fig.C.l
Fig.C.2.
Schematic diagram of the apparatus for wet digestion under reflux with acids Schematic diagram of the apparatus for mercury determination by CVAAS
C. II Trend Monitoring of Contaminants in the Coastal Zone
1. Choice of monitoring organisms 2. Sampling procedures 3. Subsampling and handling 4. References in Chapter C II
Tables of Secion C.II.:
Tab.C.6. Recommended tissues for analysis of harmful s~bstances in coastal areas
c. III Harmful Substanc~s in Sediments
1. Contaminants in sediments 2. Reporting format for contaminants
in sediments
Page
1
1 36
57
58 63
104
9
16 34 35 51
43
45
112
112 119 125 126
114
128
128 129

-1-
C. HARMFUL SUBSTANCES IN BIOTA AND SEDIMENTS
C. I Harmful Substances in Biota
1. Harmful substances in selected species
1.1 Species to be sampled
-Herring (CLupea harengus) obligatory
Cod (Gadus morhua) obligatory in areas where normally
found
- Macoma baLtica (only metals) tentative
- MytiLus eduLis tentative
- Me[1,idotea entomon tentative
Remark:
It is recommended that, in addition to this, the Contracting Parties conduct trend monitoring bf contaminants in relevant coastal species. Further det,ails concerning such sampling are described in Chapter c. II.
1.2 Substances to be analyzed
The following harmful substances are selected to be
analyzed:
a) Obligatory contaminants
pp'-DDT, pp'-DDE, pp'-DDD, PCBs
Due to the greater accuracy of analyses using capillary
column gas chromatography, it is recommended that the
determination of individual chlorobiphenyl compounds
(CBs) be made obligatory by the end of the Third Stage,
with quantification of the following CBs: IUPAC Nos.
28, 52, 101, 118, 138, 153, 180. These are substances
for which the levels, despite some decreases, are still
of significant magnitude in Baltic biota.

-2-
Hexachlorobenzene (HCB), ~- andY-hexachlorocyclohexane
( <>: - and Y- HCH)
These are substances which can be determined with
existing analytical competence and for which further
information is useful.
Total concentrations of Hg, Cd, Pb
These are metals which, at least in coastal areas and
dredge spoil disposal grounds, can be harmful.
b) Tentative contaminants
Chlordanes, dieldrin
These are substances which can be of biological sig
nificance and for which more information is needed. ' Many Contracting Parties already have analytical
programmes for these contaminants.
Zn, Cu
These have been.tentative elements in the Second Stage
of the BMP. However, because they are homeostatic
elements in fish, it is doubtful whether the impact of
their contaminant burden on the marine environment can
be successfully monitored using open sea fish species.
c) Contaminants to be investigated in the future
Polychlorinated camphenes (PCCs, e.g., toxaphene),
dibenzodioxins and -furans (PCDDs, PCDFs), PAHs
Analytical methods for these groups of substances (all
of them probably of biological significance) are not r
well developed and much work remains before comparable
data will be obtained. It is important that research
continues in order to determine their biological impact
and to develop efficient analytical methods to be used
for serial analyses.
-3-
d) Intercalibrations
Laboratories of the Contracting Parties reporting data
to the Helsinki Commission are encouraged to partici
pate in any future intercalibration exercises organized
by national and international bodies. It is obligatory
for reporting laboratories to participate in inter
calibrations organized by the Helsinki Commission.
e) Good Laboratory Practice
Laboratories are required to follow a system of Good
Laboratory Practice (GLP), as described in, e.g., (15).
GLP is a policy for all aspects of the laboratory which
influence the quality of the analytical work: for
laboratory spaces in which the work is done, for staff,
analysts and technicians, for safety and equipment,
handling of chemicals, and for recording and reporting
the results. This includes the use of standards and
certified reference materials, to test methods and
ensure that they produce accurate and precise results,
and the use of quality control charts. Participation in
intercalibration exercises is also part of quality
assurance.
1. 3 Sampling, sample preparation, analytical standards and
reporting procedures
u) Sampling sites
For suitable sampling sites, see the Tables and Figures
1-4 in section A.
The Contractin~ Parties shall provide results for
obligatory 'species and contaminants from the sampling
areas selected as their 11 responsibility areas 11•
Contracting Parties are encouraged to participate in
various optional analytical programmes aimed at
improving the monitoring system for the BMP.

-4-
In order to save materials from various areas of the
Baltic Sea for future analyses of contaminants for
which the analytical methods still have to be improved,
the Contracting Parties are requested to bank extra
material of the species select.ed as trend moni taring
material. If a Contracting Party cannot carry out the
annual analysis of obligatory samples, it is rec
ommended to sample and save the material in a national
environmental specimen bank. The material shall be
saved deep frozen, preferably at -30°C.
b) Test organisms and tissues
Test organisms
Two fish species, cod and herring, have been used as
test organisms for the open Baltic Sea since 1979.
Since 1982 when the ICES Cooperative Monitoring Studies
Programme began (as a revision of a programme carried
out since 1974), there have been differences in the
guidelines for monitoring temporal trends in contami
nants between the ICES programme for the North Atlantic
and the BMP. There has been a wish to harmonize the
programmes between ICES and the BMP.
Before considering the details of new BMP trend
monitoring guidelines, some principles for trend
monitoring programmes have to be defined.
The trend of an environmental contaminant has to be
studied for a defined area. The species and the part of
its population selected as study material in a trend
monitoring programme shall be chosen so that it will
represent the defined study area. The selection of a
representative material is the most important choice to
be made for a monitoring programme. By sampling in
-5-
several areas of a marine region, the trend studies in
various areas of the region will describe its general
contamination.
Although species such as pike (Esox Lucius) and female
juvenile eel (Anguilla anguiLLa) occur locally and may
be useful in the study of coastal trends, for pelagic
and demersal fish species of the open Baltic Sea there
are certain difficulties to fulfill the demand of
having a species which throughout its life is
stationary.
For various reasons, herring and cod are used as study
organisms in the Baltic trend monitoring programme.
Some of these reasons include:
a) they can be caught in all parts of the Baltic, b) they are easy to collect, c) they are a suitable size for pre-analytical sample
treatment, d) their biology is fairly well known, and e) they are important commercial species.
However, these two species are migratory and any
sampling of them must pay due attention to the period
of their life at which they most probably represent the
area where they are caught.
Herring
The moni taring programme for the
recommends sampling a broad size
including a broad representation
North
range
of
Atlantic
of fish,
However, a recent reassessment indicates
age classes.
that sampling
within a constant narrow age band may be an acceptable
alternative. It ,would be unwise to recommend sampling
over a broad size range of Baltic herring for the BMP
if we accept the principles mentioned at the beginning
of this chapter.

-6-
Baltic herring spawn along the coasts of the Baltic
Sea. Tagging experiments have shown that the herring in
the eastern part of the Gulf of Bothnia are stationary
(13). In the rest of the Baltic, it is well known that
there are different rates of annual growth increments,
especially in the earlier age classes of herring. This
is interpreted as indicating that herring are a local
or regional species at young age classes.
Thus, the young age classes up to the time of sexual
maturity are regarded as being more representative of
the areas where they are collected than older age
classes, for which far distance migration often occurs
after the spawning period. Data on organochlorine
levels in various catches of Baltic herring have
clearly shown that older age classes of herring display
a higher variation in organochlorine levels than young
age classes, supporting the opinion that young herring
are stationary (2).
In order to fulfill the intention of a trend monitoring
programme in which different Contracting Parties take
responsibility for their regions in the study of
trends, young prespawning age classes of herring are
recommended to be collected. Because of the need for a
certain volume of tissue (especially the liver) for the
analytical work, only herring more than 1-2 years old
can be used. Thus, herring 2-3 years old are
recommended to be sampled.
Cod
In the previous recommendation for sampling cod within
the Baltic, it had not been taken into consideration
that the northern and eastern areas are only tempor
arily inhabited by cod, so that it is only in the
southern and southwestern areas that cod can be found
-7-
on a regular basis. In those areas of the Baltic Sea
where cod can be sampled on a regular basis, it is
useful to sample cod as a complementary species to
herring.
Cod is sampled in the trend monitoring programme in the
North Atlantic using a different sampling strategy than
that used in the BMP. To obtain more harmonization with
the programme in the North Atlantic, it is suggested
that the sampling strategy for that area also be used
for cod from the Baltic Sea. This is described later.
The large variations in the fat content of cod liver as
a re·sul t of seasonal variations and due to aging
processes in cod imply that any analytical work on cod
liver demands special consideration with respect to
this fat content variation (11).
Macoma baltica and Mesidotea entomon
Macoma and Mesidotea (syn. Saduria entomon ) occur
throughout almost the
inhabiting the coastal
entire
zone as
Baltic
well as
Sea area,
certain lo-
calities of the open sea. Mesidotea is the most
important benthic species in the open sea areas of the
Gulf of Bothnia. There are practical problems in the
sampling procedure, making these species not useful for
the analysis of organochlorines. For Macoma, the
variation in growth rate at different sampling sites,
the difficulties in determining the age, sex, and the
sexual maturity stages of the individuals as well as
their infestation by parasites - all phenomena of rel
evance for the body burden of contaminants - make the
species hard to work with. However, for practical
reasons, · orily species with a relatively large indi
vidual size can be used. Thus, because Macoma baltica
and Mesidotea entomon are the only large-sized bottom
living species in the Gulf of Bothnia and the Gulf of
Finland, they are included as optional species in the
BMP.
-8- -9-
"' 1::: ·<-<
Myti7..us edul.is ., '0
""" (!)
in edul.is is ·<-<
Although other sea areas Mytil.us Q ;:;: '-'! :;: E-< Cfl
considered a coastal species, in the Baltic Sea moving "'
from the Belt Sea to the Baltic Proper, it penetrates (!) 1::: Ill
into deeper waters and becomes sparse in the "tidal '0 ., zone" .. is tentative species in the
0 Thus, Mytil.us a open
""" ..c: E-< sea part of the BMP. Myti1..us from the open sea should u ;:;: '-'! :;: Cfl
be sampled at the agreed stations (see Section A. 2. ) at Ill (J)
the depth associated with those stations. Data on the C) :I: r:: u E-<
"' :I: ;:;: '-'! :;: Cfl sample as indicated in Section C.II.2.c) should be .jJ
Ill
obtained. .a ::l Ill m
u E-<
""" ':I: ;:;: '-'! :;: Cfl
Tissue selection :;l
'g ., Ill
"' E-< The tissues recommended for analysis of harmful ..c: Q E-<
Q ;:;: '-'! :;: Cfl
substances given in Table C.l. ~
are 0 Ill
•ri m Regarding metal analysis in herring, it is
Ill u E-< heavy >t P., . ;:;: '-'! :;: Cfl
..-!
suggested that the liver be used for Cu, Zn, Cd, and Pb "' r:: analysis. The main is the high levels found in "' reason
~ .a E-< E-< liver compared with muscle tissue, but also because the 0 p., '-'! '-'! Cfl :;: Cfl
~
liver reflects the recent exposure history of the fish. Ill
~ "' ;:;: Ill 1::: E-< E-< Ill "' '-'! '-'! Cfl :;: Cfl
Mercury occurs in similar concentrations in both muscle •ri .jJ
and liver tissue. However, because variations in '0
~ "' ;:;: feeding habits and in contamination of food may result ::l E-< E-<
r:: u '-'! '-'! Cfl :;: Cfl
in short-term fluctuations in mercury levels in the (J) (!)
~ ::l Ul
liver, muscle is the preferred tissue for mercury Ul C) ·.-<
analysis. Furthermore, the correlation between fish ~ '0 E-< E-< .j.l
u '-'! '-'! Cfl :;: Cfl .j.l
muscle mercury levels and the size of the specimen can .... 0
be used as a means to minimize some of the variance in Ul
tl'> E-< E-< .... mercury levels within a sample or between samples. :r: ;:;: ;:;: Cfl :;: Cfl 0
""" Ill (!) s
(!) .j.l ·<-< :> """ "' s::
Because the organochlorines studied here are non-polar ·.-< Ill 1::: Ill
"' .j.l 1::: QJ (!)
substances associated with the fatty tissues of an ..-! Ill 0 """ ., tl'> (!)
• <j "' .j.l ·r< {) (!) 0 ..-! u tl'> "' "' r:: .j.l Ul :> @ 0
organism, the fat fraction should be used for their 1::: "" "' QJ p. ::l ·.-< ..c: r.:l ·rl ~ {l ;:; E-< 0 ;:;: '-'! :I: :;:
~ ., .-.>
determination. . .. . .. ., '0 ~ "' "" (!) 0 ~ ~ ~ .. E-< ..
:r: u "' ;:;: '-'! Cfl :;:
2 483155T

-10-
For herring, the fat should be extracted from the
muscle tissue for DDT and PCB analyses. For cod,
however, the fat pool is to a major extent associated
with the liver, and thus liver should be used for the
analysis of organochlorines.
For Maeoma and Mesidotea 1 it is not practicable to
distinguish between tissues. Thus, homogenates of the
entire soft tissues of Maeoma should be used for heavy
metal analyses. For Mesidotea, the entire animals
should be homogenized prior to analysis.
Sampling procedures
General considerations
Until the effects of physiological variables on
contaminant levels are better understood, in monitoring
for trend analysis sampling procedures should be
carefully observed and should remain the same from year
to year. To ensure sample comparability, it is
recommended that the samples be collected at the same
place and at the same time each year, within the
guidelines given below for each species. For best
results, it is suggested that the samples be collected
by a trained biologist.
The recommended sampling time for each species is given
for a specific period of the year, often covering two
months for the whole Baltic Sea area. The longer
periods given in the sampling recommendations are
simply to allow flexibility for the different con
ditions from south to north in the Baltic Sea area.
However, at an individual sampling locality, a narrow
sampling period should be observed during the same
portion of the appropriate season each year.
-11-
Each collection of samples should be reported according
to details given in Section C.I.S.
The sampling procedures for each species have been
designed to obtain a sample during a relatively stable
period for
physiology.
the organisms in terms of migration and
The stability of the habitat during the
period preceding sampling is particularly important.
In the Baltic Sea it has been shown that herring have
higher organochlorine levels during spring than in
early autumn (6, 12). Coastal Baltic fish and fresh
water fish .from the vicinity of the Baltic show a dra
matic increase in organochlorine levels during spring
(Edgren et al. 1981, Olsson et al. 1978). For several
reasons, spring seems to be an unstable period with
regard to physiology (starvation after winter, repro
duction, temperature increase etc.) but also the cli
matic factors might have an influence (ice and snow
melting, spring flow).
Because of this, autumn is recommended as the sampling
period, a time when
processes are avoided.
many of the above-mentioned
For both coastal fish species
and freshwater species, the levels of organochlorine
residues have been shown to be stable during the autumn
(6, 12).
For herring it is important to stress the presence of
both spring and autumn spawning populations. The spring
spawning herring shall be used in the BMP and, to
obtain such material, reproductive maturity shall be
determined. To obtain the stationary prespawning
specimens, age shall be determined. To continue the
monitoring ·programme already started, only females
shall be used.

-12-
For Macoma , due to difficulties of identifying age,
sex, and reproductive maturity in the large number of
organisms to be sampled, a wide cross-section of the
population (of adequate specimen size) should be taken
and this cross-sectional distribution should remain the
same from year to year as far as practicable. The same
procedure should be used for Mesidotea; however, as
reproductive maturity is easy to detect in Mesidotea,
females carrying eggs should be avoided. Mesidotea
reproduces at various times throughout the year and
thus egg-carrying females will be found during the BMP
sampling period.
Only specimens which are not obviously diseased should
be used, For Macoma, in particular, the degree of
infestation by parasites (which differs from year to
year and affects the condition of the animals) should
be checked in random specimens and recorded. It is
suggested that a larger number of specimens than the
minimum be collected to allow for possible discards at
a later stage.
In collecting herring, a sample should consist of at
least 20 females collected at one site. This number is
necessary for statistical treatment of the data. See
Table C.2. for overall sampling recommendations.
Herring should be caught away from the coast at the
sampling areas designated for the Baltic Monitoring
Programme. See Maps A.l.-4.
The samples should consist of female spring-spawning
fish in their second to third year of life in the
southern Baltic (ICES Statistical Areas 23-26) or third
year of life in the central and northern Baltic. The
specimens should
and September in
during September
Sea.
be caught during the months of August
the southern and central Baltic, and
to November in the northern Baltic
-13-
Cod
A sample of fish should consist of at least 25
individuals, and preferably more individuals. The
sample should be collected in a length-stratified
manner, i.e., the sizes of the fish should span as wide
a length range as possible and there should be an equal
number of individuals in each length grouping.
The stratification should be based upon an equidistant
logged length interval, i.e. the log (upper bound)
minus log (lower bound) should be equal for each length
interval. The. length range of the entire sample should
be selected so that the individuals in the lower bound
yield sufficient tissue for the chemical analyses,
while the upper bound should be selected such that at
least five fish can readily be found in the sampled
catch. The length range should be divided into five (or
more) length intervals of equal size (after log
transformation). (See notes on length stratification,
below, for an example.) Once the length stratification
for a particular species and area has been agreed, this
stratification should be strictly adhered to for a
number of years. No length interval should be less than
2-3 em. If the length range is smaller than 2-3 em, the
species is not
analysis.
ideally suited for the proposed
Each fish should be analysed individually and the
following biological variables should always be
recorded when sampling for time trend analysis
purposes:

- Age
- Total weight
- Total length
Liver weight
determined
when
-14-
contaminants in liver are
(if another fatty organ is used, the weight should be
recorded).
- Sex
- Degree of sexual maturation }
Notes on length stratification
where applicable
The main finding from the statistical analyses of data
on contaminants in fish tissue is the gain in precision
which can be obtained from stratification using bio
logical variables. Although several biological para
meters have been shown to be significant as
stratification variables in different materials, length
appears to be the only parameter which is simple to
apply at sea and which shows up as being significant in
most cases.
Much discussion has been devoted to whether simple
linear or log-linear (multiplicative) models give the
better fit. General experience with other fish and
other types of data indicate preference for the
log-normal model, at least for the present. As the
length dependence of the contaminant level is not well
understood, sampling should keep the length-contaminant
relationship under constant surveillance, i.e., the
entire length range should be covered evenly. The
length range should be defined from practical
considerations, the lower bound ensuring that enough
tissue is available for chemical analysis and the upper
bound such that at least 5 fish in the largest length
interval can readily be found. The length strati
fication should be determined in such a way that it can
be maintained over many years. The length interval
should be at least 2-3 em in size.
-15-
It is suggested that the length range be split into 5
size after log length intervals which are of
transformation.
20-70 em, then
For example, if
the interval
(rounded to 0.5 em) as follows:
em No. of fish Log
20 - 25.5 5
25.5 - 33.0 5
33.0 - 42.5 5
42.5 - 54.5 5
54.5 - 70.0. 5
Total 25
equal
the length
boundaries
upper - Log
0.243
0.258
0.253
0.249
0.250
range
could
lower
is
be
Care should be taken that samples are not unduly
clustered within each stratum (length interval). More
length intervals could be used and the test of the
hypothesized contaminant-length relationship becomes
stronger if the lengths are evenly distributed. But the
item of major importance is to keep the length strati
fication identical from one year to the next.

-16-
c) Sampling procedures
TABLE C.2. Sampling procedures
Species Time Age Size of Sex Sample
organism size
Herring Aug-Sep 1+,2+,3+ N.S. Female 20 fish
Cod Aug-Sep Length Stratified Female 25 fish
Maeoma* Sep N.S. > 5 mm N.S. 40 g
Mesidotea* oct-Nov N.S. 40-60 mm N.S. 80 g
Mytitus* Oct-Nov N.S. N.S. N.S. 80 g
N.S. = Not Specified
*) = Tentative
d) Specimen data requirements
When the sample has been taken, the appropriate fish
specimens should be selected according to the recommen
dations given for each species in the previous section.
For each fish, the total body weight in grams should be
recorded, as well as the total length
the nose tip and the tip of the
millimetres.
(length between
caudal fin) in
-17-
Each specimen selected should have an intact epidermis
and should be placed whole in a polyethylene plastic
bag (in no case should PVC plastic be used). The air
should be squeezed out and the bag should be sealed and
marked with the information specified in Table C.l. For
best results, the specimens should be deepfrozen as
soon as possible (preferably immediately) and should
remain frozen until they are to be prepared for
analysis. If any procedure other than fairly immediate
deep-freezing is used, this should be noted on the
Table C.3.-type data sheet.
The sex should be indicated.
Information on the maturity of the gonads should be re
corded.
The age should be determined and should generally be
given according to the number of annual rings on the
scales or otoliths. For cod, the annual rings on the
otoliths should be used along with the length of the
fish for the determination of age.
'I'he weight of the liver should be recorded in grammes.
Obtaining the correct liver weight can depend on using
the appropriate procedure. The complete liver should be
removed very carefully during dissection of the
partly-thawed specimen. This should be done by a person
!;killed in the technique to ensure that the full sample
i. r3 obtained.
Preparation of the sample
o.eganochlorine analyses will
C,J.l.3.g).
for heavy metal and
be discussed in Section

-18-
e) Macoma baltica and Mytilus edulis
Sampling and specimen data determination
Sampling procedures
The sampling sites for Maeoma baUiea. are given in
tables and maps in Section A. Samples should be
collected in the period of August-September (preferably
September) .
Although it is difficult to determine the maturity of
the gonads, this will remain constant at any individual
site when the same month is used for sample collection
each year. The sex of the organism is also difficult to
distinguish, as this requires microscopic examination,
and age is difficult to determine, whether by shell
rings or by size-frequency distributions. Both growth
rate and maximum size vary greatly in different
localities in the Baltic Sea area. Thus, it is not
practical to specify overall requirements on these
bases for the Monitoring Programme.
Nonetheless, it is important to obtain samples as
comparable as possible from year to year. To do this, a
representative specimen distribution for the sample
should be established for each site and should be
utilized each year thereafter. Thus, the first year,
organisms should be collected and arrayed to obtain a
representative sample of the whole population above the
5 mm length. When possible, the specimens should be
arranged in three length classes: small, medium and
large. The length of each organism should be measured
as the maximum length, regardless of orientation. The
number of individuals in each length class should be
recorded and this distribution should thereafter be
utili zed for that site each year that samples are
collected. The sample size for Maeoma is 40 g of soft
body tissue. The sample size for MytiLus is 80 g of
soft body tissue.
-19-
Sample data requirements
For bivalves, it is best to carry out the initial post
sampling procedures on board the vessel to avoid a
two-step procedure of freezing and re-freezing (which
causes variable water losses). Thus, it is recommended
that a person skilled in these procedures collect the
bivalves and carry out the initial procedures as soon
as possible thereafter.
For each sampling site, a Sample Information Sheet
(shown in Table C.l.) should be filled out and smaller
copies made to label each sample container.
When the organisms have been collected, they should be
rinsed externally in clean water from the area of
collection to wash away sediments and other foreign
matter. They should then be allowed to remain in clean
sea water from the area of collection for 12-24 hours
to allow them to remove sediments and other foreign
matter as pseudofaeces. The specimens should be kept
alive at a temperature similar to that observed at the
sampling site (preferably in a refrigerator). The
storage tank should preferably be of glass.
When this time is over, the total length of each
organism should be measured and the
recorded.
information
After draining off the shell liquor, the whole soft
body of the organism including the adductor muscle
should be carefully removed from the shell and combined
with the others to be included in the sample. Care
should be taken; to avoid excessive tissue damage and
thus cause water loss during this procedure. In
removing the tissue and placing it in containers, it is
very important to utilize the appropriate materials for

-20-
cutting tools and storage containers (see Section
C.I.l.3.g) for detailed discussion). In particular, for
heavy metal analysis, one should avoid direct contact
of the tissue to be analyzed with metallic materials;
for organochlorine analysis, one should avoid direct
contact of the tissue to be analyzed with plastic
materials.
For initial preparation of invertebrate samples, the
required l) amount of soft tissues should be collected
in an appropriate container, e.g., a flask with tightly
fitting stopper. For heavy metal analysis, 40 g of
material are required and a similar amount is needed
for organochlorine analysis. For Macoma., 4 0 g only is
needed and for Mytilus, 80 g is needed, or the amount
requested by the analytical laboratory.
The container with the composite sample of organic
material should be closed tightly in order to avoid any
water loss and stored in a deep-freezer until the
respective analytical procedures are carried out.
Prior to analysis, the organic material is homogenized.
From the homogenate, subsamples are taken for dry
weight, heavy metal and organochlorine determinations.
1) to be specified by the laboratory in which analysis
is made
-21-
f) Mesidotea entomon
The above text for Macoma and Mytilus applies in
general also to Mesidotea, with the exception that the
whole animals of Mesidotea are homogenized for analysis
and 80 g are required ( 40 g for trace metal analyses
and 40 g for organochlorine determinations).
The sampling sites for Mesidotea are indicated in the
tables and maps in Section A. The size to sample is
40-60 mm, and specimens less than 30 mm should be
avoided as they often show high concentrations of some
trace metals. Egg-carrying females should not be
sampled.
<1) Subsampling and handling
Instrument handling during dissection and subsampling
As mentioned earlier, when directly handling tissues to
be used in the analysis of harmful substances, all
sources of possible contamination should be avoided.
For materials to be used for heavy metal analysis,
there should be no direct contact with metallic
substances. Similarly, materials to be used in the
analysis for organochlorines should not be placed in
direct contact with plastics. The next two subsections
describe recommended procedures for tools to be used in
dissection and sample preparation. As a general rule,
the contact time between the sample and the tools
should be kept as short as possible. Grinding
procedures should be checked very critically to make
certain that no contamination can occur.

-22-
Subsampling for metal analysis
Cutting tools:
Tools for
grinding:
Tools for
holding:
Use cut or
glass or
latter are
crushed pieces of
(the quartz knives
available from e.g.,
Hans Klirner, D-8200 Rosenheim)
Use silica or Teflon mortar with
glass pestle for grinding of
deep-frozen material. Equipment
for homogenizing should be selec
ted carefully according to the
above-mentioned criteria.
Use colourless polyethylene
tweezers or haemostats.
After each sample has been prepared, including the
samples of different organs from the same individual,
the tools should be changed and washed as follows:
1.
2.
3.
Wash in acetone or alcohol and distilled water.
Wash in HN0 3 (p.a. 1+1) diluted with double
distilled water. Tweezers and haemostats in (1+6)
acid.
Rinse with double distilled water.
The glass plate used during dissection should be
cleaned in the same manner. The tools must be kept
dust-free between working hours. Plastic tweezers and
heamostats are disposable tools and should be replaced
after one or two days of work.
-23-
Subsampling for analysis of chlorinated hydrocarbons
Cutting tools:
Tools for
grinding:
1'ools for
holding:
Use acid-resistant steel scalpels
or cut or crushed pieces of
glass.
Homogenize using an Ultra Turrax
homogenizer or, if the tissue
contains mineral particles which
will dull the homogenizer, freeze
the sample hard in liquid air,
then homogenize by mounting it in
a Teflon or glass beaker.
Acid-resistant steel tweezers.
The instruments should be washed as follows:
l .
2 .
3 •
Wash in laboratory detergent and distilled water.
Rinse in double distilled water.
Rinse with 50:50 acetone (p.a.): 99% ethanol.
lle observant when cleaning the tweezers because the
notches on them are difficult to clean. The glass plate
used during dissection should be cleaned in the same
way. The tools should be kept dust-free.
[>,~sampling procedures
'J.'he dissection room should be kept clean and the air
t>hould be freed from particles as much as possible. It
la an advantage if the work can be carried out in a
hood or under some shelter in order to prevent a direct
ffdl-out of particles onto the sample.
'I'IH? dissection should be carried out on a clean glass
plate using the tools mentioned in the preceding
r::-lt~ct.i.on.

-24-
Sample handling
Fish
The dissection of fish is easiest when the material, at
least the surface layers of the muscle tissue, is half
frozen. For dissection of other organs, the thawing
must proceed further, but it is an advantage if, for
example, the liver is still frozen. It must be noted
that any loss of liquid or fat due to improper cutting
or handling of the tissue makes the determinations of
dry weight and fat content, and consequently the
reported concentrations of harmful substances, less
accurate.
The epidermis and subcutaneous tissue should be
carefully removed from the fish. Samples should be
taken . under the red muscle layer. In order to ensure
uniformity of samples, the right side dorso-lateral
muscle should be taken as the sample. If possible, the
entire right dorsal lateral filet should be used as a
uniform sample, from which subsamples can be taken
after homogenizing for replicate. dry weight, heavy
metal and organochlorine determinations. If, however,
the amount of material so obtained would be too large a
sample, a specific portion of the dorsal musculature
should be chosen for the sample. It is recommended that
the portion of the muscle lying directly under the
first dorsal fin be utilized in this case. As both fat
and water content vary significantly in the muscle
tissue from the anterior to the caudal muscle of the
fish, it is important to obtain the same portion of the
muscle tissue for each sample. This is necessary in
order to ensure comparability.
-25-
Based on present knowledge and analytical experience ,
it is obvious that determinations of lead concen
trations especially at the s ub- mg/kg level in marine
organisms are often significantly influenced by con
tamination during sampling, sample handling during
dissection, and sample pretreatment for analysis. As a
consequence, serious doubts are raised about the
validity of published measurements of lead in biota of
maritime origin as they often seem to be erroneous
high.
Chow et al. s tated already in 1974 ( 14) that "
recent studjes ~f the hazards of lead pollution may be
misleadi~g if they are based on analyses of ... animal
tissues determined by routine analytical methods
carried out without the use of clean-laboratory
techniques and without the necessary sensi ti vi ty and
accuracy ... " Apart from clean-room procedures as a
necessary prerequisite for extreme trace lead analysis
the aforementioned authors pointed to further possible
sources of systematic errors . The latter might arise
from mucosal slime as a potent i a l reservoir of large
amounts of lead . They argued from their investigations
that muc in secreted by the mucus cells of the epidermis
contained a glycoprotein wh ich reacted with water to
form mucous slime. It is possible tha t strong heavy
metal complexing sites in epidermal proteins withdraw
lead from seawater and incorporate it into the slime.
Therefore, addi tiona! precautions have to be taken to
minimize or avoid transfer of mucosal slime to interior
tissues during dissection .
For every tenth fish specimen, a duplicate sample
should be obtained to check the whole analytical
procedure· starting with dissection and subsampl.i,.ng. The
duplicate sample should be obtained by taking the
corresponding left side dorso-lateral mu scle i n the
same region as is used for the regular right side
samp l e .
3 483155T

After muscle
completely and
-26-
preparation, the
carefully removed
liver
while
should be
still partly
frozen to avoid water and fat loss. Immediately after
removing it from the fish, the liver should be returned
to the freezer so that it will be completely frozen
prior to further handling. This is particularly
important for cod liver.
Invertebrates
The procedures for initial handling of Maeoma, Myti~ue
and Meeidotea have been described in Sections
C.I.l.3.e) and f). An appropriate sample size should be
chosen so that at least duplicate analyses for heavy
metals and duplicate dry weight determinations can be
carried out.
h) Analytical procedures
General considerations
Each laboratory has developed its own methods of
analysis and it is not the intention of this manual to
standardize these methods in any way (except dry weight
determination). Rather, this section of the manual will
mention analytical procedures which are in common use
in many Baltic laboratories today. A detailed example
of a procedure for analysis of heavy metals is given in
Section C. I. 2. and a detailed organochlorine deter
mination method is given in (16). An earlier method for
the analysis of organochlorines is
These are intended as examples only.
described in ( 9 ) .
-27-
Fat weight determination
The determination of fat weight is important in the
interpretation of the results of organochlorine
analyses. Recognizing that each laboratory has its own
particular method of measuring fat weight, this manual
does not attempt to standardize this determination.
However, a basic factor in the comparability of results
of organochlorine analyses from different laboratories
involves comparability in the methods of fat extrac
tion. As different fat determination methods may give
different results, the results can vary from laboratory
to laboratory. A difference in the fat determination
will result in a difference on the same magnitude in
the organochlorine levels on a fat weight basis. It is
an advantage if the residues can be related to a
neutral lipid (triglyceride) basis. New techniques,
such as dense liquid extraction, by which the fat can
be fractionated, are available but not generally used.
Thus, it is strongly recommended that the fat weight
determination used relate to some recognized procedure,
such as the Torrey Method (10), where the extraction is
performed using a mixture of chloroform and methanol.
This method gives higher values than soxhlet extraction
with ether or extraction with ether-hexane mixtures,
but provides slightly lower values than the hydro
chloric acid/ether extraction method.
When the fat estimation is carried out according to a
recognized fat estimation method, it is
certain that the chlorinated hydrocarbons
spondingly be extracted quantitatively.
also
will
rather
corre-

-28-
Dry weight determination
In contrast to the rest of this section, it has been
decided to standardize the determination of dry weight.
This value should be determined by drying 1-2 g of
tissue material in a pre-heated oven at 105°C for 4
hours. If any other method is used it should be related
to the above method, so that the results are
comparable.
i) Digestion procedures and analytical techniques for the
determination of heavy metals
General considerations
There are a number of procedures in common use in
Baltic laboratories for digesting samples of biological
materials and subsequently analysing them to determine
levels of heavy metals. The procedures used by the
laboratories taking part in the 1985 ICES baseline
study of contaminant levels in Baltic biota are dis
cussed in ( 3) and detailed descriptions of some of
these procedures can be found in the open literature.
The most common general procedure for digestion appears
to be wet digestion. This can be done either in an open
system or in a closed system (e.g., the bomb
technique). Dry ashing can also be used, for instance
with oxygen in a closed system (Schoninger system) or
with activated oxygen plasma.
Among the common analytical techniques are atomic
absorption spectrophotometry, anodic stripping volta
mmetry and neutron activation analysis.
-29-
Standard solutions
It is recommended that laboratories participating in
the Baltic Moni taring Programme purchase quantitative
standards and prepare their standards according to a
common procedure. The ICES intercalibration exercises
have shown that when common standards and standard
solution preparation procedures are used, the
comparability of analytical results among ·laboratories
is enhanced. Thus, the techniques used in inter
calibration exercises are recommended here for use in
the Baltic Monitoring Programme.
Individual stock solutions of each metal standard (Cu,
Zn, Cd, Pb and Hg) should be prepared from stock
standards (1 000 ppm) or the equivalent, e.g., Merck
AAS standards or British Drug House AA standards.
Replicates should be compared.
Mercury
Stock solutions (1 000 ppm) should be prepared in
lN H2so
4 or lN HCl and stored in glass bottles. Fresh
stock solutions should be prepared every six months or
when the level of solution in the container falls below
the halfway mark.
Working
of the
solutions should be prepared daily by dilution
above stock solution using lN H2so4 together
with a sufficient amount of 6% KMno 4 solution to
produce a distinct pink colour in the final sol uti on.
(Check the mercury content of the potassium
permanganate solution as this can contain very high
levels of mercury.) In practice, the working solution
should be prepared immediately before use and should
only have a bench life'of about 2 hours.

-30-
Other metals
Stock solutions (1 000 ppm) should be made up in lN
acid and can be stored in either glass or plastic
bottles. Fresh solutions should be prepared every 6
months or when the level of the solution in the
container falls below the halfway mark.
Working solutions should be prepared daily by dilution
of the above stock solutions using lN acid.
j) Extraction and analysis techniques for the deter
mination of organochlorine residues
General considerations
All laboratories working with organochlorine residue
analysis of biological material use the same general
procedure, namely extraction, clean-up, and gas liquid
chromatography ( GLC) with electron capture detection
(ECD) and quantitation. New techniques to pre-separate
different classes of contaminants on adsorption or
exclusion chromatography can be used to make the final
detection less complicated.
Extraction
To ensure complete extraction of the lipophilic
substances DDT, DDD, DDE, PCB, HCB and HCH from
biological material, it is necessary to perform a de
hydration and disruption of the cells. This can be
achieved either by homogenization of the sample with a
dehydrating solvent such as 2-propanol or acetone
followed by batch extraction, or a biphasic extraction
using Na2so4;acetone/hexane (1/1/1; w/v/v) using a ball
mill.
-31-
Clean-up procedures
In some methods, removal of the fat before GLC analysis
is performed in two steps. The first consists of three
partitions between hexane and acetonitrile, N,N-di
methylformamide or dimethylsulphoxide. By this method,
however, traces of fat are co-extracted and must be
removed, e.g., by column chromatography, before GLC
analysis. This clean-up procedure is non-destructive
but time consuming, and is not necessary if only PCBs,
DDT and its metabolites DDD and DDE are to be analyzed.
In an alternative method, the fat is easily removed
from the extract by means of concentrated sulphuric
acid; Several methods described in the literature
include an additional separation step in which DDE and
PCBs are separated from DDD and DDT by column
chromatography before GLC analysis. If this additional
column separation step is omitted, confirmation
analysis can be performed by treating an aliquot of the
extract with potassium hydroxide in ethanol. This
treatment will convert DDT to DDE and DDD to DDMU while
PCBs and DDE are unaffected. DDE can be converted
further to 1,1-dichlorodibenzophenone (DBP) by oxi
dation of the extract with potassium dichromate in
sulphuric acid so that a pure PCB chromatogram can be
obtained.
GLC analysis
The final extract can be analyzed with any GLC system
having an EC-detector ( 63 Ni). The risk for decompo
sition of pesticides on the column is a common problem
in residue analysis. Therefore, fused silica capillary
columns or megalDore columns are recommended. A packed
column machine can easily be retrofitted with a
megabore column, of which a chemically bonded one is
best.

-32-
It is recommended that extracts be analyzed on columns
of different polarities to verify the presence of a
particular substance; in other methods, chemical con
version is used, as described above.
Quantitation
DDT and its metabolites are quantitated by comparison
of the peak heights or areas in the chromatograms of
the sample with the peak heights or areas in the
chromatograms of the standard. This procedure normally
creates no problem. PCBs can be quantitated in several
ways.
In the most common method so far, the PCB standard that
has a gas chromatographic pattern most similar to that
of the sample is selected, and the heights of the cor
responding peaks are compared. Other quantitation
procedures are based on the use of a specific GLC
columnn combination with knowledge about the compo
sition and concentrations of the different major
components in a technical PCB mixture. The levels of
the major components in the sample can be calculated in
this method, but it is restricted to the specified GLC
conditions mentioned above. Now that individual CBs are
available, it is recommended that they be used and the
results reported on a compound basis. The latest
quantifying techniques make use of chemometrics by
which multi-level statistical similarities are used for
comparison.
Standard reference materials
Standard reference materials are now available for
several types of matrices and their use is encouraged.
-33-
Standard solutions
It is recommended that standard solutions be prepared
from compounds supplied by, for example, the United
States Environmental Protection Agency. The standard
prepared from the stock solution should be composed in
such a manner that the components included do not
interfere with each other on the applied GLC-column,
and the resulting chromatogram should give peak heights
of the same order.
The preparation of a stock solution (in mg/ml) should
be done by weighing approximately 100 mg of the sub
stande with an accuracy of 0.1 mg (equal to 0.1%) in a
100 ml Class A volumetric flask followed by 100 ml
(69.2 g) of 2,2,4-trimethylpentane (iso-octane) weighed
with an accuracy of 100 mg (0.1%). The stock solution
should be checked against previously prepared stock
solutions to ascertain that they contain the same
concentrations.
After diluting by a factor of one hundred, which is
also done by weighing, the final standard solution
mixture is made up from the different stock solutions
by weighing the proper volumes into a 100 ml volumetric
flask adjusted to 100 ml (69.2 g) with iso-octane.
Internal standards
Normally, an
sample. The
follow the
procedure.
internal standard is added directly to the
standards should be chosen so that they
compounds through the entire analytical

-34- -35-~ .c .c .c .c .c
QJrl U) U) U) U) U) U)
""' ·rl ·rl ·rl ·rl ·rl 0 QJ O,QJ "-' "-' "-' "-' "-' tn tn tn N {) k) Reporting of data S N • ·rl <U·rl 0 l[) 0 0 0 0 0 0 <UO. U)U) N N N N N "' co co {) <U
For each sample, the concentrations of the measured heavy metals should be reported on a wet weight (fresh
QJ QJ QJ QJ ~ rl rl ""' rl tissue) basis and the organochlorines both on a fat QJ <U <U <U QJ <U Ul s s s rl s Ul Ul Ul .0: weight and wet weight basis. For the results QJ QJ QJ <U QJ . a Maooma,
li. li. li. ;:,; li. :z: :z: :z: :z: should also be reported on a dry weight basis. The
U) reporting format and advice given in c. I. 5 and U) are s s s 0
"-' U) {) s ""' C.I.6. O·rl ~ 0 H ,::; 0 QJ <U l[) "" 0 N tn Ul Ul Ul I l[) Ul I Ul "-' ·rl H . • • 0 • 0 . Ul 0 :z: '0 :z: :z: "' (\ :z: "' :z: .,_,
QJ ,::; {) {) ·rl ::>
·rl ·rl 4-l 0 .,_, .,_, ·rl U) {) TABLE C.3. SAMPLE INFORMATION SHEET ""' . rn r-; U) .,_, H {)
'O<U H <U H <U <U ((j
I:: Ill ((jt:Q ((j H QJ ((j QJ QJ .,_, :>. 0
,::; >.I:: :>. U) U) .,_, Species: rl H H H 01
<U QJ + QJ + .c <U ;;: I +J.C '0 Analyses to be Conducted: QJ >-<..C:Ol.CN .,_, QJ 0 QJ N l::.j..l QJ
tn ..,.,_, .,_, tn :>. rl tn QJ ;;: .,_, .0: C H ' ::> ' c Ul rl ((j Ul Ul {) 0 {) Person Responsible: OJO+O+ QJ + QJ.j..l ((j QJ H QJ
U:Z:NUlri ...:1 N :z: >< U) :z: :z: {) ~tn ""' ri Date of Collection: 0
~i {) Area of Catch: N
~Y{ 0. 0. 0. 0. tn 0. > > > Q) (including co-ordinates and depth) QJ QJ QJ QJ ::> QJ 0 0 0 ..0 ~~l
QJ Ul Ul Ul Ul .0: Ul :z: :z: :z: ~i s I I I I I I I I I QJ Description of Bottom Sediments: u ·rl tn tn tn tn ""' tn ..., .,_, ..., H r. E-< ::> ::l ::l ::> ::l ::l {) {) {) 0 (e.g., rocky, sandy, muddy) i'% .0: .0: .0: .0: 1-) .0: 0 0 0 s
f1J .,_, General Environmental Conditions: ro li'J .c Fishing Gear Sampling Method: ~ s s .,_, or
((j !- ~
0 QJ '0 ,.) 0 Condition of Organisms: ~· N 'ri U) QJ
l .c ..., s .j..l s .,_, Method for Determination of Age: 141 .j..l U) c !/l !/l
U1 0. Ul Ul X Ul Ul <U ~ l[) QJ <1lN QJ QJ • • ((j 0 <U I 0. 0 I tn Storage of Sample: Q :z: :z: :;:: :z: :z: u s N 0 Uri tn
::l (if other than immediate deep-freezing) !/l
' !/l w ·rl ' .j..l .,_,
tJ !/l !/l .,_, s s s ro <U ·rl
f%j ..., ..., 0 0 0 0 0
~ !/l !/l H H H {) {) "H ro ro "-' "-' 4-l QJ Q)
0 0 '0 '0 N.O }o)
{) :>. :>. :>. c c ·rl s fiH c {) 0 ((j ro ((j ((j <U !/l Q) ·rl s s ;;: ;;: ;;: ..., ..., 0 0 ro <U ((j ro <U ro QJ QJ 0. ((j H H QJ Q) Q) ""'""' Q) {) 4-l 4-l ' !/l ' !/l ' !/l !/l !/l !/l QJ .0 0. Ul 0 +' H +' H +' H
..., .-l <U S ...:1 :>. :>. !/l Q) !/l QJ !/l QJ ,::; ,::; ,::; !/l u ro ><
((j ((j <U > ((j > <U > QJ QJ QJ ((j r-l ·rl tfJ rl ;;: ;;: 0·.-i O·ri O·rl 0. 0. 0. 0 Uri .0 .0: .0: U H U H U H 0 0 0 u GJO..S<U
O.O..::lH !/l <U s Q)
·rl 4-l .j..l+JCQJ
(j 0 O·rl H H '" cs;::a;p,
!/l tn Q) "' ..,
II QJ c '0 (j ;:; () II ·rl ·rl ,::; ., N '<:1 "' {) H ::l QJ () ., .• , ;:; . ·~~ QJ H '0 0 -"' rl ~ ..,
"' ~ Ul .0: rl N 0.. QJ 0 ""' ·rl QJ
~ ;, '" ;:; • .
Ul ~ u li. p, ~ ~ ~ ""'
:z::z:

-36-
2. Analytical procedures for mercury, cadmium and lead in biological material*)
Introduction
The analytical potential of atomic spectrometry (AAS) has gained significantly
absorption
during the last years with respect to detection ability, precision and accuracy.
mentation have
current status
Improvements in commercial instru
made considerable contributions to the
of AAS. Therefore, this instrumental
technique at present can be regarded as an increasingly
valuable routine analytical method frequently used for
the performance of trace element analyses in biological
and other materials of different origin.
The author wishes to demonstrate by this article his
experience in the field of applied atomic absorption
spectrometry recommending some methodological ap
proaches for the determination of mercury, cadmium and
lead in biological material. Some of the obvious still
existing limitations, from the author's perspective,
will also be discussed.
Pre-instrumental treatment procedures
Atomspectrometric procedures applied to the deter
mination of trace elements in organic materials have
associated calibration problems, as in most cases
standard solutions cannot be completely matched to the sample under study.
*) Draft prepared by: Uwe Harms Bundesforschungsanstalt flir Fischerei Labor flir Radiookologie der Gewasser Wlistland 2, 2000 Hamburg 55 Federal Republic of Germany
-37-
Different chemical and physical properties of the
sample have a significant influence on the atomization
of the element to be determined. Therefore, for the
sensitive and reliable determination of trace elements
in biological matrices, analytical procedures have been
introduced which involve decomposition and further
pretreatment of the sample prior to the instrumental
measurement.
Among the preferable sample
employed are wet ashing with
decomposition
acids, either
techniques
in open or
closed systems, and low-temperature oxygen plasma
ashing.
In the widely applied wet ashing procedure the sample
is treated with acids, mainly nitric, sulphuric and
perchloric acids in different ratios (27, 24, 36, 37,
40, 25). Usually large quantities of reagents and large
apparatus surfaces are needed for complete de-
structions, with the consequence
serious contamination problems (too
arise.
that very often
high blank values)
Within the concept of providing a blank-optimized
sample pretreatment procedure for
biological
the ultra-trace
element analysis
materials, May et
in
al.
digestion in specially
and
(53) developed
designed quartz
environmental
a HN0 3/HC10 4-
vessels that
proved to be very effective with respect to reducing
contamination.
A variety of instruments specially designed for acid
decomposition in closed PTFE-vessels under pressure and
high temperature' (pressure decomposition) have been de
scribed in the literature (e.g. 17, 18, 35, 42,.68).

-38-
The versatile range of systems
the handling of practically
required for analysis in the
now available permits
any sample
laboratory.
quantity
For the unexperienced investigator, however, it is important to
note that the properties of PTFE can vary considerably.
Especially contamination due to desorption of im
purities from the inside vessel surface may pose
problems. Therefore, it must be strongly recommended
that the PTFE-digestion vessel, which is to be used for
trace element analysis, has to be checked before use on
its qualification for the purpose desired.
In cases where large quantities of reagents and acids
and large apparatus surfaces are needed for complete
destruction, decomposition with an oxygen plasma
excited at high frequency may be given priority over
wet decomposition methods. The ashing of organic
samples using an oxygen plasma which is excited at
high-frequency under low pressure has been known for a
long time ( 26). Based on the work and experience of Carter et al. (20) and Raptis et al. (59), promising powerful plasma decomposition
recently been introduced by several
preclude (with the exception
possibility of element losses.
arrangements have
manufacturers which
of mercury) the
Compared to other
methods for decomposition, low-temperature o2-plasma
ashing is characterized by low blanks and has almost no
consumption of chemicals.
Possibilities for the determination of mercury by cold
vapour atomic absorption spectrometry
The most widely used method for the determination of
mercury in various materials is the cold vapour atomic
absorption technique. In this, Hg is reduced to
metallic mercury in acidic solution using a powerful
reducing agent, usually stannous chloride. Subsequently
the mercury metal is volatilized by a suitable aeration
-39-
technique and the mercury vapour carried into an
absorption cell where the 253.6 nm wavelength
absorbance of mercury atoms is measured.
Organic matrices require a pretreatment according to
the afore-mentioned wet decomposition procedures.
The cold vapour technique was first described by
Poluektov et al. (57, 58) and later elaborated in more
detail by Hatch et al. ( 34) • Since the early 1970s
several commercial accessories have been introduced and
several modifications of the methodology have been in
vestigated to reach the lowest detection limit and to
improve the reliability of mercury determinations (31,
7 8) •
Sodium tetrahydroborate has also been proposed as a
reducing agent (47, 60) and found advantageous for
several applications because of its higher reducing
power and faster reaction. Kaiser et al. ( 39) observed
that several interferences were considerably reduced
with this reducing agent, in particular the effect of
iodide.
Substantial improvement of the atomspectrometric
mercury determination was evident with preconcentration
of the analyte element.
Several authors have described the collection of
mercury vapour by amalgamation on silver (38, 55, 52)
or gold (38, 39, 56, 51, 79). This technique eliminates
kinetic interferences due to a different vapourization
rate or a different distribution function of the
mercury between, the liquid and the vapour phases.
Further, the sensitivity is increased because the
collected mercury can• rapidly be released into an
absorption cell by heating the absorber. With these
methods, detection limits as low as 0. 5 ng absolute

-40-
(and even lower) are realized but they do depend on
blank values and the minimization of any contamination
in the system.
Despite the apparent simplicity of the cold vapour
atomic absorption technique there, are a number of
problems associated with the measurement of mercury,
especially at extremely low concentration levels.
The major difficulties arise due to the mobility of
this element. Uncontrolled contamination and/or losses
of this element through desorption from or adsorption
on container surfaces can lead to severe systematic
errors.
Several authors reported high rates of mercury adsorp
tion on glass and plastic materials ( 38, 43). Quartz
and glassy carbon seemed to be the best materials,
especially after they were pre-conditioned by fuming
out with nitric acid (39). Losses can also be found
when a desiccant is uncritically
mercury vapour (Stuttgart, 1978). used to dry the
A further complication regarding mercury measurements
is that mercury in dilute solutions often exhibits
unexpected losses on storage.
Tor ibara et al. ( 7 5)
oxidation potential
system, almost any
found that because of the high
of the mercury (II)-mercury (I)
reducing substance can convert mercury (II) into mercury (I).
behaviour of dilute solutions of
realized that loss of mercury was
In studies on the
mercury (II), they
due to reduction of
some mercury (II) to mercury (I) which then
spontaneously disproportionated into mercury (II) and
metallic mercury. The latter escaped as metallic vapour
from the solution into the gas phase.
-41-
The afore-mentioned authors as well as Feldman ( 2 3)
have well established that oxidizing agents and acids
are effective in preserving ionic mercury in solution.
It is recognized that stannous chloride or tetrahydro
borate reduce only inorganic mercury species (reactive
mercury).
Organic associates, especially organomercury compounds
such as methylmercury are not affected (32, and further
references cited there). This circumstance can entail a
considerable under-estimation of the total mercury
present in a sample, if these compounds are not
prope.rly destroyed through chemical attack during the
decomposition procedure.
Outline of method
The analysis of
following sections
steps:
total mercury described in the
involves the following operational
4 483155T
preparation of the sample
form of a solution (test
to be analyzed in
solution) through
the
two
different decomposition procedures
under reflux with acids and
composition) ;
(wet digestion
pressure de-
transformation of the element to be determined
(analyte) into mono-atomic vapour at
temperature through reduction-aeration
by pre-enrichment on a gold absorber;
ambient
followed
measurement of absorption by the atomic vapour of
the analyte at a characteristic spectral line
(253. 7 nm) after liberation from the gold
absorber; ;
determination of the concentration of analyte in
the sample on wh•ich the measurement is carried
out by comparison with
(calibration standards) of
reference solutions
known concentrations.

---____,., ~-•• ----------~-------- .
-42-
Equipment
a) Instrumental device for wet digestion under reflux
with acids
Wet digestion with acids under reflux is carried out in
an apparatus the schematic diagram of which is shown in
Figure C .1. The apparatus consists of a round bottom
flask (A), a condensation reservoir (B) with pressure
equalising tube {C), two-way stopcock (D) and dropping
tip (E), a high intensity condenser (F), and a safety
trap (G). The latter is attached at the outlet of the
reflux condenser in order to prevent fumes possibly
containing mercury compounds from escaping through the
reflux condenser.
b) Instrumental device for acid decomposition in a
closed PTFE-vial under pressure and high temperature
(pressure decomposition)
Pressure decomposition is carried out in a device
developed and described by Kotz et al. (42).
The sample to be decomposed is weighed into a vial of
pure, isostatically pressed PTFE with round bottom
(capacity 10 ml), and treated with a pure decomposition
agent (HN0 3 ). The PTFE-vial is placed into a pressure
jacket made of special stainless steel, which, by means
of a safety device, is protected against any inadmiss
ible excess pressure (max. 100 bar). With the aid of
special mounting tools the pressure jacket can be
defined and closely sealed. Safe and controlled heating
of the pressure jacket is accomplished by an aluminium
heating block provided with water connection for quick
cooling. The heating block, protected by an over-
temperature safety
temperature regulator
device, is connected to a
via a thermocouple compensating
-43-
F
8
c D
£ G
A
FIGURE c.l. Schematic diagram of the apparatus for wet
digestion under reflux with acids
A. round bottom flask (100-250 ml),
B. condensation reservoir (capacity "''' 250 ml, ;:::: !1l 45
mm, length~ 200 mm),
C. pressure equalising tube,
D. two-way stopc0ck with standardized PTFE key,
E. dropping'tip,
F. high intensity condenser (length R:. 250 mm),
G. safety trap (capacity ~50 ml) .

-44-
line and heating line. The temperature is regulated,
infinitely variable, from oa to 25ooc.
c) Instrumental device for mercury
through cold-vapour technique
determination
The device (see Figure C.2.) consists of a gas regu
lating unit (A) (needle valve, checked by a flow
meter), a reaction vessel in the form of a cylindrical
round bottom flask, capacity 15 ml (B), fitted to a
head for gas washing bottle with sintered disc porosity
1 (C), a Pyrex-glass drying tube (D) containing
magnesium perchlorate as a water absorbent.
Two three-way PTFE stopcocks (E, F) are placed between
the gas regulating unit, the reaction vessel, and the
drying tube to permit the reaction vessel to be
by-passed during heating and elution steps.
The mercury collector (G) follows after the water
absorbing tube. The collector consists of a silica tube
(i. d. 3 mm, length 120 mm) which is packed with a gold
coated silica wool plug (50 mg silica coated with 50 mg
gold) to form a 50 mm column. The collector tube is
closely wound with ca 2 m Nichrome wire (diameter 0. 5
mm) connected to a variable transformer (H).
The mercury which is rapidly vaporized and eluted from
the column by electrical heating (maximum temperature
inside the tube 550°C) is fed directly into the optical
cell (I), which is centered in relation to the axis of
the light beam (J) and the optical unit (K) (wavelength
selector, photoelectric detector and measuring device).
-45-
H F t::<}-
A c
A G 0 E :tl '
CJ K
8 I
FIGURE C.2. Schematic diagram of the apparatus for
mercury determination by CVAAS
A. gas regulation unit (needle valve, flow meter),
B. reaction vessel (capacity 15 ml),
c. head for gas washing bottle with sintered disc
porosity 1, D. drying tube ( ;::: 0 20 mm, length >=::: 200 mm),
E. and F. stopcocks with standardized PTFE keys,
G. mercury collector (¢ 3 mm, length 120 mm) with gold
silica wool/
H. transformator,
. I. optical cell ( >=::: 0, 15 mm, length 120 mm),
J. spectral source, K. optical unit (wavelength selector, photoelectric
detector, measuring device).

-46-
All the connections in the system are made of PTFE
tubing (i. d. 0.5 mm) and PTFE fittings. Nitrogen is
used as a purging and carrier gas.
Reagents
Nitric acid, 10 mol/1, high purity grade,
diluted nitric acid, 1 mol/1.
Sulphuric acid 18 mol/1, high purity grade.
Hydrochloric acid, 12 mol/1, high purity grade,
diluted hydrochloric acid 6 mol/1.
Double-distilled water.
Hydroxylamine chloride salt, 69.49 g/mol,
hydroxylamine chloride salt/water 1.4 mol/1.
Magnesium perchlorate GR (for drying).
Stannous chloride hydrate 225.63 g/mol,
stannous chloride hydrate/diluted hydrochloric acid 0.5
mol/1, prepared fresh daily.
The solution is aerated with nitrogen for 30 min.
immediately before use to remove traces of mercury.
Procedure
a) Sample digestion under reflux with nitric/sulphuric acid ·--
A sample amount of 10 g (wet weight) at maximum is
transferred into the round bottom flask (reaction
flask), which is then attached to the condensation
reservoir with the stopcock closed.
Ten ml of sulphuric acid and 20 ml of nitric acid are
then added into the condensation reservoir and the main
water tap is opened to allow the water to flow through
the reflux condenser. The safety trap at the outlet of
the reflux condenser is filled with 5 ml nitric acid.
-47-
When the apparatus has been fitted up fully, the
stopcock is opened slowly so that the acid mixture
flows into the sample in the reaction flask. The flask
is then heated very cautiously under constant ob
servation. When the reaction becomes too violent, the
heating is immediately interrupted.
The decomposition process is carried out in three
separate phases:
Phase 1)
Phase 2)
Phase 3)
Initial reaction of the organic material with the acid mixture: During this phase the organic material reacts violently with the acid mixture forming nitric oxides and foam. In case the reaction becomes too violent and the foam threatens to reach the reflux condenser through the pressure equalising tube, it is advisable to introduce the acid mixture stepwise into the reaction flask.
Second decomposition step: After the initial reaction has subsided, the mixture is heated under reflux for at least 60 minutes (up to 3 hours). When the liquid in the reaction flask becomes clear, the sample is ready for the next phase of decomposition.
Complete oxidation of the organic matter: The stopcock is now closed in order to collect as much acid condensate as possible in the reservoir. Principally, a certain amount of nitric acid should remain in the reaction flask to complete the oxidation of the remaining organic material in the flask. In the event that the liquid in the reaction flask darkens at this stage of the process, the stopcock is opened to introduce a few milliliters of the acid condensate from the reservoir. The stopcock is then immediately closed and the heating procedure is continued in order to allow the rest of the nitric acid in the flask to evaporate into the condensate reservoir. The liquid in the flask should now become colourless, failing which the process of introducing a few more ml O'f acid condensate is repeated.
When the decomposition process has been completed, the
apparatus is allowed to cool down.

-48-
The condensate is released through the stopcock into
the flask, and the contents of the safety trap attached
to the reflux condenser are then poured through the
reflux condenser into the reaction flask. The reflux condenser
reservoir
is
is
next
rinsed
removed
with 10
and the condensation ml of double-distilled
water. The stopcock is kept in the open position to
allow the water to flow down into the reaction flask.
The apparatus is then fitted up again and the contents
of the reaction flask is boiled for another 10 minutes.
The solution will now be colourless or slightly yellow.
The solution is finally cooled down and transferred
into a 100 ml standard flask and filled up to the 100
ml mark with double-distilled water (test solution).
Remark: Samples with a high fat content are not fully oxidized. However, during the analysis of fish flesh, it was established that no residues of Hg were to be found in the fatty phase.
b) Sample decomposition with nitric acid in a closed
PTFE-vial under pressure and high temperature (pressure decomposition)
A sample amount of 0.5 g (wet weight) at maximum is
transferred into the PTFE digestion vial and the
necessary quantity (0.7 ml) of nitric acid is carefully
added. The vial is placed into the stainless steel
jacket, which is sealed with a screw cap.
The unit is slowly (ramptime 60 min) heated up to about
80 °C, controlled by a thermocouple, then heated with
rapidly rising temperature up to 140°C (ramptime 45
min). The system is held at this temperature for
another 120 min. The screw cap is untightened when the
unit has been cooled down to room temperature (Caution!
Fumes of nitrogen oxides will be expelled. Therefore,
the use of a fume cupboard is absolutely necessary.)
-49-
Following this, the PTFE vial is taken out of the
jacket with its contents (test solution) available for
further investigation.
c) Determination of total mercury by
absorption spectrometry (CVAAS)
cold vapour atomic
An aliquot of 5 ml of
according to procedure
reaction vessel of the
mercury (Fig. C.2.).
the test solution1 ) obtained
a) is transferred to the
unit for the determination of
In the case of procedure b), the digestion vial is
emptied into the reaction vessel of the said unit and
rinsed with two portions of 2 ml double-distilled
water 2 ) .
1 ml of hydroxylamine
slowly added, followed
solution after 5 min.
chloride
by 1 ml
salt solution 3 ) is
of stannous chloride
l) The actual amount of test solution required for mercury determination by CVAAS is dependent on the mercury concentration in the organic ~aterial under investigation. In order to meet the l~near range of the calibration curve, aliquots smaller than 5 ml may be favourable.
2 ) For the same reason, if necessary, the test solution should be appropriately dilut.ed and only aliquots used for the determination procedure.
' 3 ) Nitrogen oxides produced during the sample
decomposition proced,ure fornz_powerful oxidants which inhibit the reduction of Hg to elemental mercury. Residues of the said oxidants are removed with hydroxylamine.

-50-
The reaction vessel is attached to the system by
connecting it carefully with the head for gas washing
bottle.
The three-way stopcocks are switched to the
purging/collecting position and the flow rate of
nitrogen is adjusted to 40 ml/sec.
The mercury is deposited by amalgamation on the gold
coated silica wool plug. After purging has been
completed (10 min), the stopcocks are
bypass position and the flow rate
increased to 90 ml/sec. The elemental
switched to the
of nitrogen is
mercury is then
vaporized from the Au column by electrical heating of
the wire coil using the variable transformer. The
absorption at 253.7 nm occurs in the gas cell about 1-2
sec after reaching the mercury elution temperature. The
absorption peak is recorded in arbitrary units. When
the response has returned to the baseline, the heating
is discontinued. After a cooling period of about 5 min,
the system is ready for the next cycle.
Calibration
A mercury standard stock solution (0.1 g/1 Hg) is
prepared by diluting a commercially available atomic
spectral standard ("Baker instra-analyzed'') with
1M HN03 . For the working standard (0.1 mg/1 Hg) 100 ~1
of the stock solution are diluted to 100 ml with 1M
HN03 (prepared fresh daily).
Calibration curves are established
nitric acid (4-5 ml) with 5, 10, by spiking diluted
2+ 2 0 and 4 0 ng Hg ,
respectively. The calibration curve is linear in this
range.
-51-
Calculation of results
The mercury concentration C (mg/kg)
sample analyzed is calculated by
equation:
in the organic
the following
c = w
-3 v02
• 10
(mg/kg)
m = amount of mercury (ng) measured in the aliquot of
test solution,
v =volume of test solution (ml) obtained after sample 01 .. · decomposition,
v02 = aliquot of v01 (ml) used for mercury determination
by CVAAS,
w = sample amount (g) used for decomposition.
Precision
The reproducibility of the method was tested by 20
replicate analyses of two different fish flour samples
(laboratory internal standards). The results are shown
in Table C.5.
TABLE C.S.
Fish flour 1
Fish flour 2
Determination of precision: 2 0
replicate analyses of total mercury in
two fish flour samples. All data in
J.lg/kg.
Decomposition Decomposition
procedure a) procedure b)
mean s.d. mean s.d.
21 ± 2. 6 22 2: 1. 7
700 ± 65 685 :!: 59
s.d. = standard deviation

-52-
Possibilities for the determination of cadmium and lead by graphite furnace atomic absorption spectrometry
Due to its highly enhanced sensitivity graphite furnace
atomic absorption spectrometry is frequently used for
cadmium and lead determinations. Most of the commercial
furnaces belong to the pulsed-type atomizers, such as
the Massmann design (50). Experience has shown that the
electrothermal atomization with pulsedtype graphite
furnaces in combination with continuum background
correction is often subject to serious interferences,
both spectral and non-spectral (physiochemical) in origin.
The method of standard additions has been widely used
as a way to analyse quantitatively where interferences
are present. It is based on the assumption that
inherent matrix dependent interferences have an influ
ence on the absorbance both of the added analyte and of
the analyte in the original sample to the same extent.
The analyst has to consider and to investigate in each
individual case whether this pre-supposition is valid.
Slavin et al. (65) stated in a recently published
article that a variety of spectral interferences orig
inated from non-uniform absorption by matrix components
of the continuum energy used for background correction.
Most of these were elemental absorption lines within
the bandwidth of the monochromator which resulted in
over-correction of the background and therefore low
results for the analyte. Similar effects were found in
connection with structured molecular absorption, which
could, in principal, cause positive or negative errors.
In commercial AAS instruments it is widely recognized
that efficient background correction systems, in
particular those based on the Zeeman effect, greatly
-53-
enhance the possibilities to perform determinations
free of spectral interferences. Publications of de
Loos-Vollebregt et al. (44, 45, 46) describe in detail
the theoretical background and practical application of
this method, which is presently well in use.
Several authors, in particular L 'vov
et al. ( 71) , van den Broek et al. ( 19) ,
( 4 8) , Sturgeon
Slavin et al.
( 62), Hagemann et al. ( 29), have explained both by
theoretical calculations and experimental measurements
that many of the observed non-spectral interference
problems result in fact from the nonuniform temperature
environment
furnaces.
provided by conventional pulsed-type
The established limitations of such systems have led to
the development of modified designs of atomizer
furnaces, especially those that operate closer to
isothermal atomization conditions.
Of many approaches to achieving isothermal atomization
conditions the platform technique has become the most
widely applied contribution to graphite furnace atomic
absorption spectrometry.
L'vov (48) developed a technique by placing a graphite
platform within the pulsed-type furnace which allowed a
constant temperature to be achieved for the sample
atomization. The temperature of the platform, heated
primarily by radiation, lags behind that of the
graphite tube wall thus delaying vapourization of the
analyte until the tube atmosphere is at a higher and
more constant temperature. This leads to a reduction in
vapour-phase interferences and produces less effect on
the analyte signal from matrix-dependent variations in
appearance temperature (62).

-54-
Many workers (41, 61, 63, 64, 66, 77) have shown exper
imentally that physico-chemical interferences are sub
stantially reduced or eliminated when the concept of
atomization in a stabilized temperature platform fur
nace is applied. The basis of this technique lies with
vapourization of the sample from a L'vov platform in
connection with a procedure which is called "matrix
modification". The modifier, a chemical compound such
as ammonium hydrogen phosphate or magnesium nitrate
which is added to the sample prior to thermal pre
treatment and atomization in the furnace, will bind the
analyte in a compound, which will delay vapourization
of the analyte while permitting a char temperature high
enough to remove as much matrix as possible.
In the event that non-spectral interferences observed
cannot be overcome by the afore-mentioned approaches,
improvements in the analysis may be achieved by
adopting pre-instrumental chemical separation pro
cedures. Methods of determination which incorporate
chemical separation techniques are much easier to
calibrate, as simple standards with a minimum of matrix
matching are required to interpolate the analysis of
unknown samples from conventional
tion curves. The most frequently analytical calibra
applied principle is
the conversion of the metal ions into stable, neutral
chelate complexes which are transferred to an organic
solvent by liquid-liquid extraction. Back-extraction
with acid (decomposition of the metal complexes)
eventually allows an improvement of the desired selec
tivity and has the advantage that metals are trans
ferred to a solution in which their concentrations do
not change with time. Furthermore, the need to prepare
adequate standards by solvent extractions is elim
inated. Reference is made in this connection to an
earlier method ( 3 0) ' which was recently slightly
modified ( 33). The procedure applied involved sample decomposition in a closed system (pressure
-55-
decomposition) followed by solvent extraction with
1,5-diphenyl-thiocarbazone ("dithizone'') I toluene, and
back-extraction with dilute acid (hydrochloric acid).
See also the contribution to ICES Techniques in Marine
Environmental Sciences.
As described by Stoeppler et al. (67, 68), other
complexing reagents such as dithiocarbamates may be
used successfully for solvent extraction. Systems using
mixtures of dithiocarbamates (ammonium pyrrolidine
dithiocarbamate and diethyl-ammoniumdiethyl-dithio
carbamate), which were also successfully developed for
the determination of trace metals in sea water (21, 22,
49'), may also be employed for biological material if
appropriately modified.
In view of the relatively low levels of cadmium and
lead often encountered in various natural biological
materials in the marine environment, improvement of the
unfavourable ratio of analyte to matrix by preinstru
mental chemical separation and enrichment procedures
remains one of the strongest means to increase sensi
tivity to a realistic degree and to guarantee inter
ference-free analysis.
However, pre-instrumental chemical treatment will be
effective only if both contamination and loss of the
analyte are properly controlled and minimized. Both
contamination and losses represent significant sources
of systematic errors (80, 72, 73, 74, 76, 69).
Contamination is of particular importance, as the
elements of interest usually occur in the environment
from a variety of natural and anthropogenic sources.
As the blank value, which originates from impurities
introduced by reagents, apparatus, reaction vessels,
and laboratory air, primarily affects the reproduci
bility and actually obtainable limit of detection of an

-56-
analysis, special attention must be focused on holding
the size and variability of the blank as small as
possible (80). For these reasons, precautions have to
be maintained throughout the analysis, including the
thorough cleaning of labware and purification of
reagents prior to use. Sample container and reaction
vessels represent potentially one of the largest
sources of systematic errors, since impurities leached
from the materials for construction may lead to
uncontrollable sample contamination. Therefore, much of
the analytical reliability in the analysis of extremely
low element concentrations will depend on the choice of
appropriate container materials and the method of
cleaning container surfaces (54).
In general, analyses at low concentrations
dictable error limits are only feasible
within pre
if certain
principles, as postulated by Tolg (74), are followed:
In the measurement of ext.reme trace quanti ties, the size and variability of the blank can be reduced by carrying out the essential operation steps in a reaction room in as rapid a sequence as possible and also with a minimum surface exposure to the reagents. All vessels used must as far as possible be of materials (quartz, PTFE, graphite of high purity) that exclude any adsorptive or reactive effects (adsorption losses, contamination by desorption of impurities). The optimum conditions for decomposition and further analytical steps are a favourable ratio of the sample amount to surface area and only a small excess of reagents which can easily be purified. All possible contamination through the air in the laboratory should be minimized.
3.
-57-
It is recognized that in the determination of trace
metals such as mercury, cadmi urn and lead in organic
material, conflicting features must be considered in
the choice of the optimal analytical procedure. The
problems become more obvious as the concentrations of
the elements to be determined become lower.
The analyst's confidence in any analytical method can
be strengthened considerably if appropriate quality
assurance is performed. This includes participation in
interlaboratory comparisons as well as checking of
measurements by independent analytical procedures
(e.g., differential pulse anodic stripping voltammetry
or ~soiope dilution spark source mass spectrometry).
Possibilities for the determination of cadmium and lead
by graphite furnace atomic absorption spectrometry
A detailed description of a method for the deter
mination of low concentrations of cadmium and lead in
biological
published
tissues, prepared by
in the ICES series
Dr. U. Harms, has been
Techniques in Marine
Environmental Sciences as Volume No. l.
Chlorinated hydrocarbons in biological material
A detailed description of an appropriate method for the
analysis of organochlorine contaminants in biological
tissue, prepared by Dr. L.
published in the ICES series
Environmental Sciences as Volume
5 483155T
Reutergardh,
Techniques
No. 7.
has been
in Marine

·--,>?f.ti0~!il::~!il,!!!,,aaaamm••·--------------------------------..,,.......---
-58-
4. References in Chapter C I (Harmful Substances in B1ota)
1. Report of the Meeting of Experts on Monitoring the Marine Environment of the Baltic Sea Area (Szczecin, 17-21 October, 1977).
2.
3.
Jensen, S., Johnels, A.G., Olsson, M. and Otterlind, G., 1972. DDT and PCB in herring and cod from the Baltic, the Kattegat and the Skagerrak. AMBIO Spec.Rep., No. 1: 71-85.
Berman, S.S., and Boyko, V.J., 1986. Report on the Results of the Seventh Intercalibration Exercise on Trace Metals in Biota (Part 1). ICES Coop.Res.Rep. No. 138.
4. Segerstrale, s.G., 1960. Investigations on Baltic populations of the bivalve Macoma baltica (L.) Part 1. Introduction. Stud1es on recru1 tment and its relation to depth in Finnish coastal waters during the period 1922-1959. Age and growth. Commentat. Biol., XXIII (2).
5. Bernhard, M., 1976. Manual of Methods in Aquatic Environment Research. Part 3. Sampling and analyses of Biological Material. FAO Fish. Tech.Pap., No. 158.
6. Olsson, M., Jensen, s., and Reutergardh, L., 1978. Seasonal variation of PCB levels in fish. An important factor in planning aquatic monitoring programmes. AMBIO, 7(2): 66-69.
7. Olsson, M., 1975. Mercury level as a function of size and age in Northern Pike, one and five years after the mercury ban in Sweden. AMBIO, 5(2): 73-76.
8.
9.
10.
Kremling, K. and Slazcka, W. (Eds.), 1974. Report on applied methods for the analysis of selected potential pollutants in Baltic laboratories. (Available from UNESCO).
Jensen, s. et al. 1983. Analytical methods for measuring-organochlorines and Methyl-mercury by Gas Chromatography. FAO/SIDA Manual of Methods in Aquatic Environmental Research, Part 9. Analysis of metals and Organochlorines in Fish. FAO Fish. Tech.Pap., No. 212: 33 p.
Hanson, s.w.F. and Olley, J., 1963. Applications of the Bligh and Dyer method of lipid extraction to tissue homogenates. Biochem. J. 89: 101.
11.
12.
13.
14.
15.
16.
-59-
Grimas, u., GBthberg, A., Notter, M., Olsson, M. and Reutergardh, L., 1985. Fat amount A factor to consider in monitoring studies of heavy metals in cod liver. AMBIO 14(3): 175-178.
Edgren, M., Olsson, M. and Reutergardh, L., 1981. A one year study of the seasonal variations of DDT and PCB levels in fish from heated and unheated areas near a nuclear power plant. Chemosphere 10(5): 447-452.
Parmanne, R. and Sj6blom, V., 1986. Recaptures of Baltic herring tagged off the coast of Finland in 1982-85. ICES C.M. 1986/J:28, Baltic Fish Committee.
Chow, T.J., Patterson, C.C., Occurrence of lead in 159-161.
Settle, D., tuna. Nature
1974. 251:
Vijverberg, F.A.J.M. and Cofino, W.P., 1987. Control Procedures: Good Laboratory Practice and Quality Assurance. ICES Techniques in Marine Environmental Sciences No. 6.
Reutergardh, L. (1989). Determination of some organic compounds in biological material: ICES Techniques in Marine Environmental Sc1ences No. 7 (In prep.)
References in part C.I.2. (Analytical Procedures for Mercury, Cadmium and Lead in Biological Material)
17.
18.
19.
20.
21.
22.
23.
24.
Bernas B 1968. Anal. chem. 40, 1682. , . , Bernas, B., 1970. At. Absorpt. Newslett. 9, 52.
van den Broe k, W. G. T. , de Gal an L. , 19 7 7 • Anal • Chern. 49, 2176.
Carter, G.F., Yeoman, (London), 105, 295.
W. B., 1980. Analyst
Danielsson, L.-G., Magnusson, B., Westerlund, S., 1978. Anal. Chim. Acta 98, 47.
Danielsson, L.-G., Magnusson, B., Westerlund, S., Hang, K~Z., 1982. Anal. Chim. Acta 144, 183.
Feldmann, c., 1974. Anal. Chern. 46, 99.
Fiorino, J. A., Jo~es, J. W., Capar, S. G., 1976. Anal. Chern. 48, 120.

25.
-60-
Flanjak, J., 1978. J. Assoc. Off. Anal. Chern. 1299.
61,
26. Gleit, C. E., Holland, W. D., 1965. Anal. Chern. 34, 1454.
27. Gorsuch, T. T., 1970. "The Destruction of Organic Matter", Pergamon Press, Oxford.
28. Gregoire, D. C., Chakrabarti, C. L., 1977. Anal. Chern. 49, 2018.
29. Hagemann, L. R., Nichols, J. A., Niswanadham, P., Woodriff, R., 1979. Anal. Chern. 51, 1406.
30. Harms, u., 1979. Analytical procedures for the determination of copper, zinc, cadmium, lead and total mercury in organic material. In: Guidelines for the Baltic Monitoring Programme for the First Stage. Ed. by the Scientific Expert of the Interim Baltic Marine Environment Protection Commission (from 3.5.80 Helsinki Commission) Helsinki, Finland, Annex I, 93.
31. Harms, U., 1981. z. Lebensm. Unters. Forsch. 172, 118.
32. Harms, u., Luckas, B., 1984. "Fortschritte in der atomspektrometrischen Spurenanalytik''. Welz, B. (Ed.), Verlag Chemie, Weinheim p. 421.
33. Harms, u., 1985. Fresenius Z. Anal. Chern. 322, 53.
34. Hatch, W. R., Ott, W. L., 1968. Anal. Chern. 40, 2085.
35. Holak, W., Krinitz, B., Williams, J. c., 1972. J. Ass. Off. Anal. Chern. 55, 741.
36. Ihnat, M., 1976. J. Assoc. Off. Anal. Chern. 59, 911.
37. Ihnat, M., Miller, H., 1977. J. Assoc. Off. Anal. Chern. 60, 1414. ·
38. Kaiser, G., Gotz, D., Schoch, P., Tolg, G., 1975.
3 9.
Talanta 22, 889.
Kaiser, G., Gotz, D., Maichin, B., Spitzy, Anal. Chern. 291, 278.
Tolg, G., H., 1978.
Knapp, G., Freseni us Z.
40. Kang, H. K., Valentine, J. L., 1977. Anal. Chern. 49, 1829.
41. Koirtyohann, s. R., E. J., 1982. J. 999.
-61-
Kaiser, Assoc.
M. L., Hinderberger, Off. Anal. Chern. 6 5,
42. Kotz, L., Kaiser, G., Tschopel, P., Tolg, G., 1972. Fresenius Z. Anal. Chern. 260, 207.
43. Litman, R., Finston, H.L., Williams, E.T., 1975. Anal. Chern. 47, 2364.
44. de Loos-Vollebregt, M. T. c., de Galan, L., 1980. Spectrochim. Acta 35 B, 495.
45. de Loos-Vollebregt, M. T. C., van Uffelen, J. W. M., de Galan, L., 1982a. Spectrochim. Acta 37 B, 527.
46. de Loos-Vol1ebregt, M. T. c., de Galan, L., 1982b. Spectrochim. Acta 37 B, 659.
47. Lopez-Escobar, L., Burne, D. N., 1973. Anal. Lett. 6, 343.
48. L'vov, B. V., 1978. Spectrochem. Acta 33 B, 153.
49. Magnusson, B., Westerlund, S., 1980. Mar. Chern. 8, 231.
50. Massmann, H., 1968. Spectrochim. Acta 23 B, 215.
51. Matsunaga, K., Takahashi, S., 1976. Anal. Chim. Acta 87, 487.
52. Matthes, W., Flucht, R., Stoeppler, M., 1978. Fresenius z. Anal. Chern. 291, 20.
53. May, K., Stoeppler, M., 1984. Fresenius Z. Anal. Chern. 317, 248.
54. Moody, J. R., 1977. Anal. Chern. 49, 2264.
55. Murphy, J., 1975. At. Absorpt. Newslett. 14, 151.
56. Olafsson, J., 1974. Anal. Chim. Acta 68, 207.
57. Poluektov, N.S., Vitkun, R. A., 1963. Zh. Anal.
58.
59.
Khim. 18, 33.
Poluektov, N. S., Vitkun, R. A., Zelynkova, Y. V., 1964. ,zh. Anal. Khim. 19, 873.
Raptis, S. E., Knapp, G., Schalk, A. P., 1983. Fresenius z. ,Anal. Chern. 316, 482.
60. Rooney, R. C., 1976. Analyst (London) 101, 678.

-62-
61. Slavin, W., 1984. Anal. Proc. 21, 59.
62. Slavin, W., Manning, D. C., 1979. Anal. Chern. 51, 261.
63. Slavin, W., Manning, D. c., Carnrick, G. R., 1981. At. Spectrosc. 2, 137.
64. Slavin, W., Carnrick, G. R., Manning, D. C., Pruszkowska, E., 1983. At. Spectrosc. 4, 69.
65. Slavin w., Carnrick, G. R •' 1986a. Atom. Spectrosc. 7, 9.
66. Slavin, w. , Carnrick, G. R. ' 1986b. Atom. Spectrosc. 6, 157.
67. Stoeppler, M •' Kampe!, M.' Welz, B. ' 1976. Fresenius z. Anal. Chern. 282, 369.
68. Stoeppler, M., Backhaus, F., 1978. Fresenius z. Anal. Chern. 291, 116.
69. Stoeppler, M., Valenta, P., Nlirnberg, H. W., 1979. Fresenius Z. Anal. Chern 297, 22.
70. Stuart, D. C., 1978. Anal. Chim. Acta 101, 429.
71. Sturegon, R. E., Chakrabarti, C. L., 1977. Anal. Chern. 49, 1100.
72. T6lg, G., 1972. Talanta 19. 1489.
73. T6lg, G., 1974. Talanta 21, 327.
74. T6lg, G., 1979. Fresenius z. Anal. Chern. 294, I.
75. Toribara, T. Y., Schields, C. P., Koval, L., 1970.
76.
Talanta 17, 1025.
Tsch6pel, T6lg, 1.
P. , Kot z, L. , Schulz, W. , Weber, M. , G., 1980. Fresenius Z. Anal. Chern. 302,
77. Welz, B., Voellkopf, U., Grobenski, Z., 1982. Anal. Chim. Acta 136, 201.
78. Welz, B., Melcher, M., Sinemus, H. W., Maier, D., 1984. Atom. Spectrosc. 5, 37.
79. Yamamoto, Y., Kumamaru, T., Shiraki, A., 1978.
80.
Fresenius z. Anal. Chern. 292, 273.
Zief, M., Mitchell, Control in Trace John Wiley.
J. W., 1976. "Contamination Analysis", Vol. 47, New York,
-63-
5. Reporting format for contaminants in marine biota
International council for the Exploration of the Sea
INTERIM REPORTING FORHAT FOR CONTAMINANTS IN MARINE BIOTA
HELCOH-VERSION
Revised Nov. 1988

-64-
REPORTING FORMAT FOR CONTAMINANTS IN MARINE BIOTA
(NOVEMBER 19!illl
MAJOR REVISIONS TO THE ICES INTERIM REPORTING FORMAT CONTAMINANTS IN FISH AND SHELLFISH DATED MAY 1986
FOR
Thls HELCOM versJon of the format for reporting data on 1986 contamJnants in marJne bJota is a development of the May.
t Reporting Format for contam1nants in printing of the ICES In er1m Fish and Shellfish.
With the exception of minor editorial incorporates the Reporting Format for shellfish, without any maJor changes.
changes, this format fully contaminants in Fish and
The revlsions to this format are essentially thosefto allowb1~:a ·~ of data on contaminants in other types o mar1ne '
~:~~I~~c:lly marine birds (and their eggs) and ma~roph~t~s. The details of these extensions to the format are presente Jn addenda to this document.
-65-
International Council for the Exploration of the Sea
Revised t•1ay 1986
1.
IN}:J;.RIM .REPORTING FORMAT FOR CONTAMINANTS
INTRODUCTION
This Interim Reporting Format for Contaminants in Fish and Shellfish has been developed by a sub-group of the ICES Marine Data Management Working Group for use in the ICES Cooperative Monitoring Studies Programme. It is also intended to be used for reporting data on contaminants l.n organisms for the Baltic Monitoring Programme of the Helsinki Commission and the Joint Monitoring Programme of the Olso and Paris Commissions.
The format has been devised to provide for the reporting of all data necessary to an evaluation of contaminant concentrations in organisms, with positions provided for comments containing additional information, where necessary. This format 1s to be considered an interim format and will be revised if and when experience shows this to be required.
Data reported to ICES using this format should be sent to: Environment Officer ICES Palmgade 2-·4 DK-1261 Copenhagen K Denmark
2. OVERVIEW QF THE SYSTEM
Three types of forms Fish/Shellfish Contaminant Tissue Data Form.
are included in this format: Master, a Specimen Data Form, and
a a
The Fish/Shellfish Contaminant Master serves as the master record for the entire series of data obtained on one species from one station or area. This form provides general information on the sample and where it was obtained (see definition of sample in Annex 1).
The Specimen Data Form provides the record for the data on the physical characteristics (length, weight, sex, age, etc.) of the organisms in the sample. If the organisms have been analyzed individually, one Specimen Data Form is filled out for each individual organ~sm. If the entire sample has been analyzed in bulk as an homogenate, then only one Specimen Data Form needs to be filled in for the entire sample. If, however, the sample has been divided into several,sub-samples each of which was analyzed as an homogenate, a Specimen Data Form should be filled in for each sub-sample.

-66-
The Tissue Data Form is keyed to the Specimen Data Form and is used to record the data on the concentrations of contaminants in each of the tissues analyzed from the organisms. If the organisms have been analyzed individually, one Tissue Data Form is filled in for each tissue analyzed from each organism. For samples analyzed as homogenates, two Tissue Data Forms are filled in for each tissue analysed so that the results of the duplicate analyses of the homogenates can be reported.
Positions have been provided on all forms for comments and additional information. These pos1t1ons should be used for information which will assist in the interpretation of the data, thus making the data more valuable for future use. One example is the inclusion of information on methods which have been changed from previous years.
lt is intended that all types of relevant data these forms. If codes for any items are missing, developed on request to the ICES Environment address given above.
be reported on they can be
Officer at the
3. DETAILED DESCRIPTION
3. 1 General
The following description applies to all three forms. The page number should be inserted in the upper left-hand corner of each page. On the first page of a series, i.e., on the Fish/Shellfish Contaminant Master Form, the total number of pages of forms associated with that Fish/Shellfish Contaminant Master Form should also be inserted.
The upper right-hand corner of the forms should be filled in as follows:
1. Laboratory code
2. Year
3. Sequence number
Code Description
Insert a 4-letter mnemonic code for the laboratory reporting the data (see Annex 2) .
Insert the last two digits of the year in which the samples were taken.
On the Fish/Shellfish contaminant Master Form, insert the number of the Master Form being filled in beginning with 001 for the first Master Form in a year, 002 for the second, etc. All other forms associated with that Master Form will have the same sequence number.
3.2
-67-
Fish/Shellfish Contaminant Master Form
One Fish/Shellfish Contaminant Master is species sampled at each station or area occasion. The Master Form should be filled following description.
filled in for each on each sampling
in according to the
Code Description
4. Form identifier code The code M identifies the Fish/Shellfish Contaminant Master Form.
5. Sampling country Insert the roc Country Code (see Annex 3)
6. Organization code
7. Sampling area indicator
Indicate the organization(s) for which data are submitted, as follows:
I - International Council for the Exploration of the Sea
J - Joint Monitoring Programme (JMP) of the Oslo and Paris Commissions
B - Baltic Monitoring Programme (BMP) of the Helsinki Commission
More than one designation is allowed.
In the first column, indicate the code of the system used to identify the area of sampling as follows:
I - ICES Statistical Rectangles
B - Baltic Monitoring Programme stations
C - Coordinates
The remainder of the field should contain the area code, left justified, space filled.

-68-
The codes, as presently available, are given in Annex 4, as follows:
Annex 4-1 ICES Statistical Rectangles Annex 4-2 BMP Stations
Example 1: A sampling area with the coordinates 55°10'N 15°30'E would be designated according to the ICES system as:
Example 2: Monitoring designated
samples taken at Baltic Station BVII would be as follows:
Example 3: A sample taken at the coordinates 59°20'N 18°55'E would be designated according to the coordinates system as:
H5191210111815151EI
8. Sampling date
9. Purpose
10. Species code
11. Number of individuals used for analysis
12. Number of Specimen Data Forms following this Master
-69-
Indicate the year (last two digits only), month, and date of sampling or starting sampling, i.e., catching the fish or shellfish. (The day may be omitted, if desired, and the applicable columns filled with zeroes.)
Indicate purpose of monitoring in relation to the "New ICES Guidelines for Monitoring Contaminant Concentrations in Fish and Shellfish in the North Atlantic" (May 1982) or other purposes according to the following code:
0 - No specific purpose 1 - Human health 2 - Geographical distribution 3 - Trend determination 4 -- Baltic Monitoring Programme
In the first two columns, indicate the species code list which has been used, as follows:
01- ICES 4-digit species code list 02- RUBIN code system 03- US NODC Taxonomic code
In the remaining columns,indicate the code for the species sampled, left justified, space filled. NOTE: when reporting to ICES, the RUBIN 8-letter species code is strongly preferred. Codes for common species are contained in Annex 5.
Right justified, zero filled. Insert number of individual organisms which have been used for analysis.
Right justified, zero filled. Insert number of Specimen Data forms following the Master.

13. Comments
3.3 Specimen Data Form
-70-
Plain language comments can be inserted as needed. Such comments can include detailed coordinates of the sampling location, station name, bottom type, depth to bottom, sampling depth, ship name or code, or any other information of interest when interpreting the data. In addition, any information on the stock of organisms sampled should be given, e.g., stock structure and related biological information.
If the entire sample was analyzed as an homogenate, only one Specimen Data Form should be filled in. If a sample was divided into several sub-samples each of which was analyzed as an homogenate, a Specimen Data Form should be filled in for each sub-sample. For a sample in which each organism was analyzed individually, a Specimen Data Form should be filled in for each organism. The Specimen Data Form should be filled in according to the following description.
Code Description
1. Laboratory code Insert same information as on
2. Year Fish/Shellfish Contaminant Master
3. Sequence Number
4. Form identifier code The code s identifies the Specimen Data Form.
5. Individual or bulked Insert the appropriate code, as follows: specimens analyzed
I - if each individual organism, or parts thereof, has been analyzed separately;
P - if the specimens in the sample have been grouped into sub-samples and each sub-sample homogenized and analysed separately (e.g., 25 fish divided into sub-samples of 5 fish each);
H - if all the specimens in the sample have been bulked together and homogenized prior to analysis.
6 · Specimen or sub-sample number
7. Number of individuals 1n homogenate
8. Lel)gth
9. Whole weight
-71-
If ~eporting results of analyses of lndlVldual organisms, these should be ordered according to increasing length lnsert 01 for the first (smallest) ' organlsm reported, 02 for the second 03 for the third etc. If several sub- ' samples were taken and each was analysed as an homogenate, the first sub-sample should be reported as 01, the second as 02, etc. If the entire sample was analyzed as an homogenate, leave these columns blank.
If the sample or sub-sample was analyzed as an.homogenate, indicate the number of o~gan1sms 1n the homogenate· if individual organisms were a~alyzed leave blank. '
Right justified, zero filled. Insert total length in mm.
For individual specimens: Insert value 1n columns marked •mean'.
For samples analyzed in bulk: Insert in the appropriate columns the minimum length, maximum length and mean (arithmetic) length of the organisms in the sample (or sub-sample) and the standard deviation of these values.
Right justified, zero filled. Insert we1ght of whole, ungutted fish in grams.
For individual fish: Insert value in columns marked 'mean'.
For fish analyzed in bulk: Insert in the app7opr1at7 columns the minimum weight, max1mum w71ght and mean weight (ar1thmet1c) of the fish in the sample (or.su~-sample) and the standard dev1atlon.
Fo7 shellfish: Insert the total fresh we1ght of the soft parts analyzed (tail muscle or whole soft body) in the columns marked 'mean'.

10. Sex
11 . Age
-72-
Insert sex of fish according to the following code:
o - not determined 1 - male 2 - female 3 mixed 4 - immature 5 hermaphrodite
Right justified, zero filled. Insert age in years.
For individual fish: Insert value in columns marked "mean".
For samples analysed in bulk: .I~sert in the appropriate columns the mlnlmu~ agef maximum age and mean age (arlthmetlc) o the fish in the sample (or sub-sample).
12. Shell weight of molluscs
Right justified, zero filled. Insert weight of mollusc shell(s) ln grams to one decimal place. This should be the total weight for the shells of.all molluscs included on this Speclmen Data Form.
13. Number of Tissue Data Forms filled in
Insert the number of Tissue Data Forms which have been completed in assoclatlon with this particular Specimen nata Form.
14. comments Plain language comments can be inserted
d d Such comments can lnclude the as nee e · d"
NOTE:
presence of parasites or other lS~ase in the organism, or other informatlon about the organisms sampled.
. h fish is analysed individually when the muscle tlssue of ~a~. h e bulked together before but the livers fr?m severaf t~! r:~orting procedure should analysis, a modlflcatlon ~ there are 25 fish in a sample be used. As an example, wden d'viduallY for each fish but and the muscle lS analyse l~·~e are pooled together before the livers from 5 fl~h at a ~ing procedure should be used: analysis, the followlng repor 'lled in a Specimen nata after the Master.Form has beeni~~ 01 followed by a Tissue Form should be f1lled :n for Fl th~n a Specimen Data Form Data Form f?r mus~le tlssueho~2y, followed by a Tissue Data should be f1lled 1 n for FlS ' the Tissue Data Form for Form for muscle only, etc. After Data Form should be filled the muscle of Fish 25, a Speclmen ll in for the group of Fish 01 to 05 as fa ows:
-73-
5. Individual or bulked specimens analysed -insert a P for partially bulked.
6. Sub-sample number - insert 26.
7. Number of individuals in homogenate - insert 005.
8. Length insert minimum, maximum and mean length.
9. Weight insert minimum, maximum and mean weight.
10. Sex - insert if all specimens are same sex.
11. Age- insert minimum, maximum and mean age.
12. Number of tissue data forms filled in - insert appropriate number.
13. Comments- insert comment 'bulked livers of Fish 01 to 05".
After this, a Tissue Data Form should be filled in with the appropriate information, using the Sub-Sample Number 26. For the bulked livers of Fish 06 to 10, the same procedure should be followed, assigning this the Sub-Sample Number 27, and so on for the other groups of fish livers.
3.4 Tissue Data Form
If an entire sample was analyzed in bulk as an homogenate, two Tissue Data Forms should be filled in for each tissue analyzed so that the results of the duplicate analyses can be reported. If a sample was subdivided into several sub-samples each of which was analyzed as an homogenate, then two Tissue Data Forms should be filled in for each sub-sample and for each tissue analyzed. For a sample in which each organism was analyzed individually, one Tissue Data Form should be filled in for each tissue analyzed, according to the following description.
1. Laboratory code
2. Year
3. Sequence Number
4. Form identifier code
5. Specimen or sub-sample number
6 483155T
Code Description
Insert same information as on Fish/Shellfish contaminant Master
The code T identifies the Tissue Data Form
Insert the specimen or sub-sample number given on the corresponding Spec;imen Data Form.

6. Replicate number
7. Tissue analyzed
8. Tissue weight/total organ weight
9. Dry weight (%)
10. Fat weight (%)
11. No. of contaminants analysed
12. Contaminant code
-74-
Insert identification number for the replicate in cases where replicate analyses of the tissue or homogenate have been done (eg., 1 for the first replicate and 2 for the second).
Insert a code for the tissue analyzed, as follows:
01 - Muscle 02 - Liver 03 - Tail muscle (crustaceans) 04 - Whole soft body (molluscs) 05 - Kidney 06 - Bone 99 - Other (describe in comments)
Right justified, zero filled. Insert in grams to two decimal places. NOTE: This should be the total weight of the tissue or organ for that individual specimen Cor a mean weight if several individuals have been bulked), not the amount taken for analysis. This figure will be used to calculate tissue burdens.
Right justified, zero filled . Insert as %, to two decimal places.
·Right justified, zero fill~d. Insert as %, to two decimal places. In last column, insert letter code for method used to determine fat weight.
Right justified, zero filled. Insert total number of contaminants reported for the tissue . If the available number of reporting lines on one form (23) is exceeded, a second form should be used as a continuation sheet, but not be counted as a Tissue Data Form (ie. items 4 to 11 should not be filled out on a continuation sheet).
Left justified, space filled. Insert the code for each contaminant analysed, according to the code list in Annex 6.
13. Basis
14. Unit
15. Qualifier
-75-
Insert a one-letter code for the basis on which the value . is being reported, as follows:
W - Wet weight (fresh weight) 0 - Dry weight L - Lipid weight (fat weight)
Insert the unit in which the value is being reported, either:
MGKG for mg/kg, or UGKG for ~g/kg.
as appropriate for the contaminant concerned according to the information given in Annex 6.
In the first column. indicate whether the value should be qualified by:
> - greater than, or < - less than
If not, leave blank. When not detected, use < the detection limit in numerical terms.
In the second cplumn, insert a Validation Flag ) as follows:
Blank - unspecified or quality control check has not been made
A - Acceptable: data found acceptable during quality control checks
S - ~uspect value: data considered suspect (but not replaced) by the data originator on the basis of either quality control checks or recorder/instruaent /platform performance.
From Unesco,. 1~82. The IOC General Magnetic Tape ~ormat for th~ Intefnat1onal Exchange of Oceanographic Data. Manuals and Gu1des No. 9, Part 2, p.12.
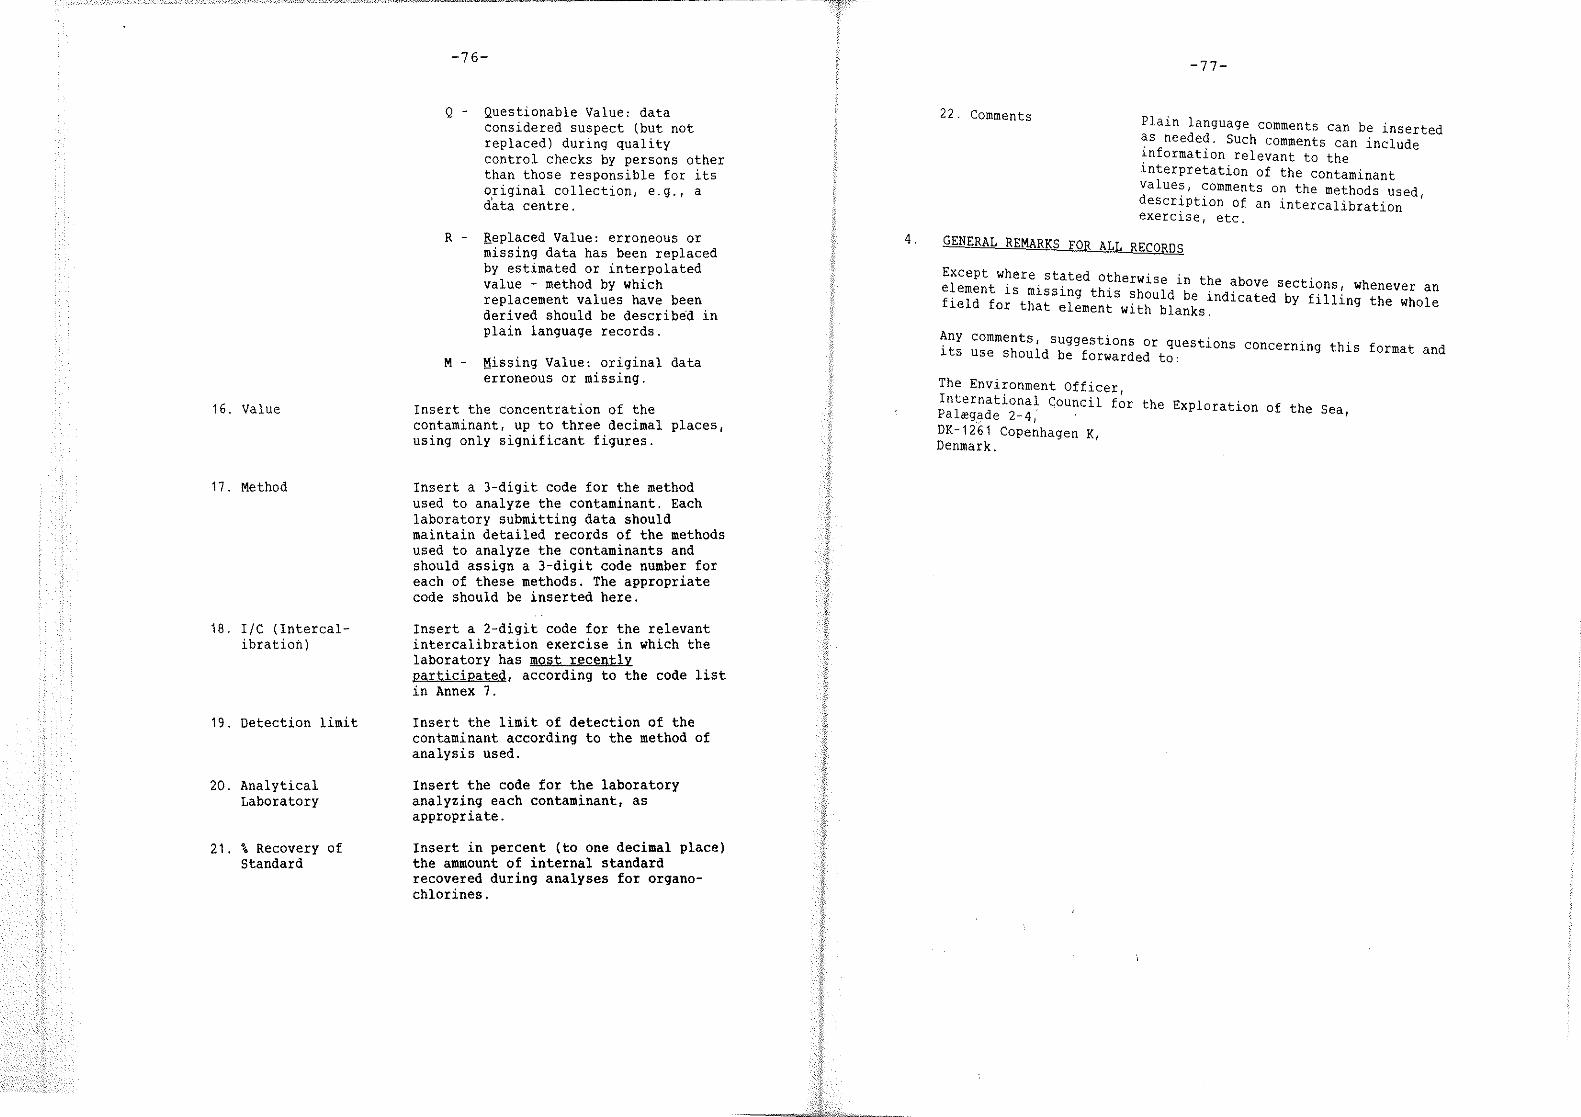
16. Value
17. Method
18. I/C (Intercalibration)
19. Detection limit
20. Analytical Laboratory
21.% Recovery of Standard
-76-
Q - Questionable Value: data considered suspect (but not replaced) during quality control checks by persons other than those responsible for its original collection, e.g., a d'ata centre.
R - Replaced Value: erroneous or missing data has been replaced by estimated or interpolated value - method by which replacement values have been derived should be describe'd in plain language records.
M - Missing Value: original data ~rroneous or missing.
Insert the concentration of the contaminant, up to three decimal places, using only significant figures.
Insert a 3-digit code for the method used to analyze the contaminant. Each laboratory submitting data should maintain detailed records of the methods used to analyze the contaminants and should assign a 3-digit code number for each of these methods. The appropriate code should be inserted here.
Insert a 2-digit code for the relevant intercalibration exercise in which the laboratory has most recently participated, according to the code list in Annex 7.
Insert the limit of detection of the contaminant according to the method of analysis used.
Insert the code for the laboratory analyzing each contaminant, as appropriate.
Insert in percent (to one decimal place) the ammount of internal standard recovered during analyses for organochlorines.
4.
22. Comments
-77-
Plain language comments can be inserted as needed. Such comments can include information relevant to the interpretation of the contaminant values, comments on the methods used, description of an intercalibration exercise, etc.
GENERAL REMARKS FOR ALL RECORDS
Except where stated otherwise in the above sections whenever an element is missing this should be indicated by filling the whole f1eld for that element with blanks.
Any comments, suggestions or questions concerning this format and its use should be forwarded to:
The Environment Officer, International Council for the Exploration of the Sea, Pal<egade 2-4,· DK-1i61 Copenhagen K, Denmark.

-78-
Reporting format for contaminants in marine biota
ANNEX
GUIDELINES TO BE FOLLOWED FOR MONITORING LEVELS OF HARMFUL SUBSTANCES IN SELECTED SPECIES FOR THE BALTIC MONITORING
PROGRAMME
For an indication of the methods to use for the collection, preparation and analysis of samples, see:
THE GUIDELINES FOR THE BALTIC MONITORING PROGRAMME FOR THE THIRD STAGE: Sections C.I. and C.II. 'Levels of Harmful Substances in Selected Species'.
-79-
Reporting format for contaminants in marine biota
ANNEX 2
LABORATORY CODES FOR THE REPORTING AND ANALYTICAL
LABORATORIES OF THE MONITORING PROGRAMMES - BY COUNTRY
DENMARK HFLD Mil j¢styrelsens !!avforureninqsl_abor.atorium Jregersborg Alle 18
scss
DK-2920 Charlottenlund QENMARK
~tate khernical ~upervision ~ervice M¢rkh¢j Bygade 26-H DK-2860 S¢borg DENMARK
ICDK Danish Isotope ~enter Skelbrekgade 2 OK -1717 Copenhaqen v D.ENMARK
FINLAND IMRF Institute of Marine Research P.O. Box 33
G.D.R AHZL
00931 Helsinki 93 fiNLAND
Arbeithygienisches z_ent.rurn der chemischen Industrie GERMAN DEMOCRATIC REPUBLIC
FRET Forschungsinstitut fUr NE-Metalle Freiberg 9200 GERMAN DEMOCRATIC REPUBLIC
BHIR )2ezirksjwqiene-rnstitut Rostock GERMAN DEMOCRATIC REPUBLIC
IGOR Institut fUr Meereskunde Akadernie der Wissenschaft.en de DDR Seestrasse 15 QDR-2530 Rostock··WarnernUnde QERMAN QEMOCRATIC REPUBLIC

F.R.G AHHG
BFRG
BFKG
BFGG
DHIG
NLWG
WGEG
FITG
ISHG
-80-
FEDERAL REPUBLIC OF GERMANY
~undesforschungsanstalt fur £ischerei Laboratory fur Radiookologie
der !:Zewasser Wustland 2, 2000 Hamburg 55 FEDERAL REPUBLIC OF GERMANY
aundesforschungsanstalt fur £ischerei Institut fur Kusten- und
ainnenfischerei Palmaille 9 2000 Hamburg 50 FEDERAL REPUBLIC OF GERMANY
~UNDESANSTALT fUR !:ZEWAESSERKUNDE Kaiserin-Augusta-Anlagen 15-17 D-5400 Koblenz FEDERAL REPUBLIC OF !:ZERMANY
Deutsches fiydrogtaphisches Institut Bernhard-Nocht-S trasse 78 D-2000 Hamburg 50 FEDERAL REPUBLIC ·oF QERMANY
Niedersaechsisches 1andesamt - fuer Wasserwirtschaft An der S~harlake 39 D - 3200 Hildesheim FEDERAL REPUBLIC OF QERMANY
~asser~uetestelle glbe Focksweg 32 a D - 2103 Hamburg 95 FEDERAL REPUBLIC OF QERMANY
Fresenius Institut Chemische und Biologische Laboratorien GmbH D-6204 Taunusstein-Neuhof FEDERAL-REPUBLIC OF QERMANY
Institute Schumacher Laboratorium fur Wasser-, Abwasser-
und olanalytik Dr . Harald Schumacher (Dipl. Chern.) Sophie-Dethleffs-Str. 4 D- 2240 Heide FEDERAL-REPUBLIC OF QERMANY
LWKG
VUCG
POLAND IMWP
VHRP
SFIP
IIAP
SWEDEN HRFS
liCKS
MNHS
-81-
. 1andesamt fur ~asserhaushalt und
Kusten SaarbrilckenstraOe 38 D-2300 .Kiel 1 FEDERAL REPUBLIC OF QERMANY
Yeterinaryntersuchungsamt Cuxhaven SchleusenstraBe D-2190 ~.uxhaven FEDERAL REPUBLIC OF QERMANY
Institute of Meteorology and ~ater Management
Wazingtona 42 81-342 Gdyni.a £OLAND
Yeterinary Hygiene Research Station Gdansk £OLAND
~ea fish er ies Institute Aleja Zjednoczenia 8 1·-345 Gdyn.i.a £OLANO
Institute of Ichthyology Agriculture Academy Szczecin !?,OLAND
Institute of Hydrographic Research National Board of f i sheries
Box 2566 403 17 Goteborg ~WED EN
University ~allege of Kalmar Inst. Natural Sciences and Technology Box 905 S--391 29 Kalmar ~.WED EN
Miljogiftsovervakning PMK Naturhistoriska riksmuseet Box 50007 S-1 04 05 Stockholm ~WED EN
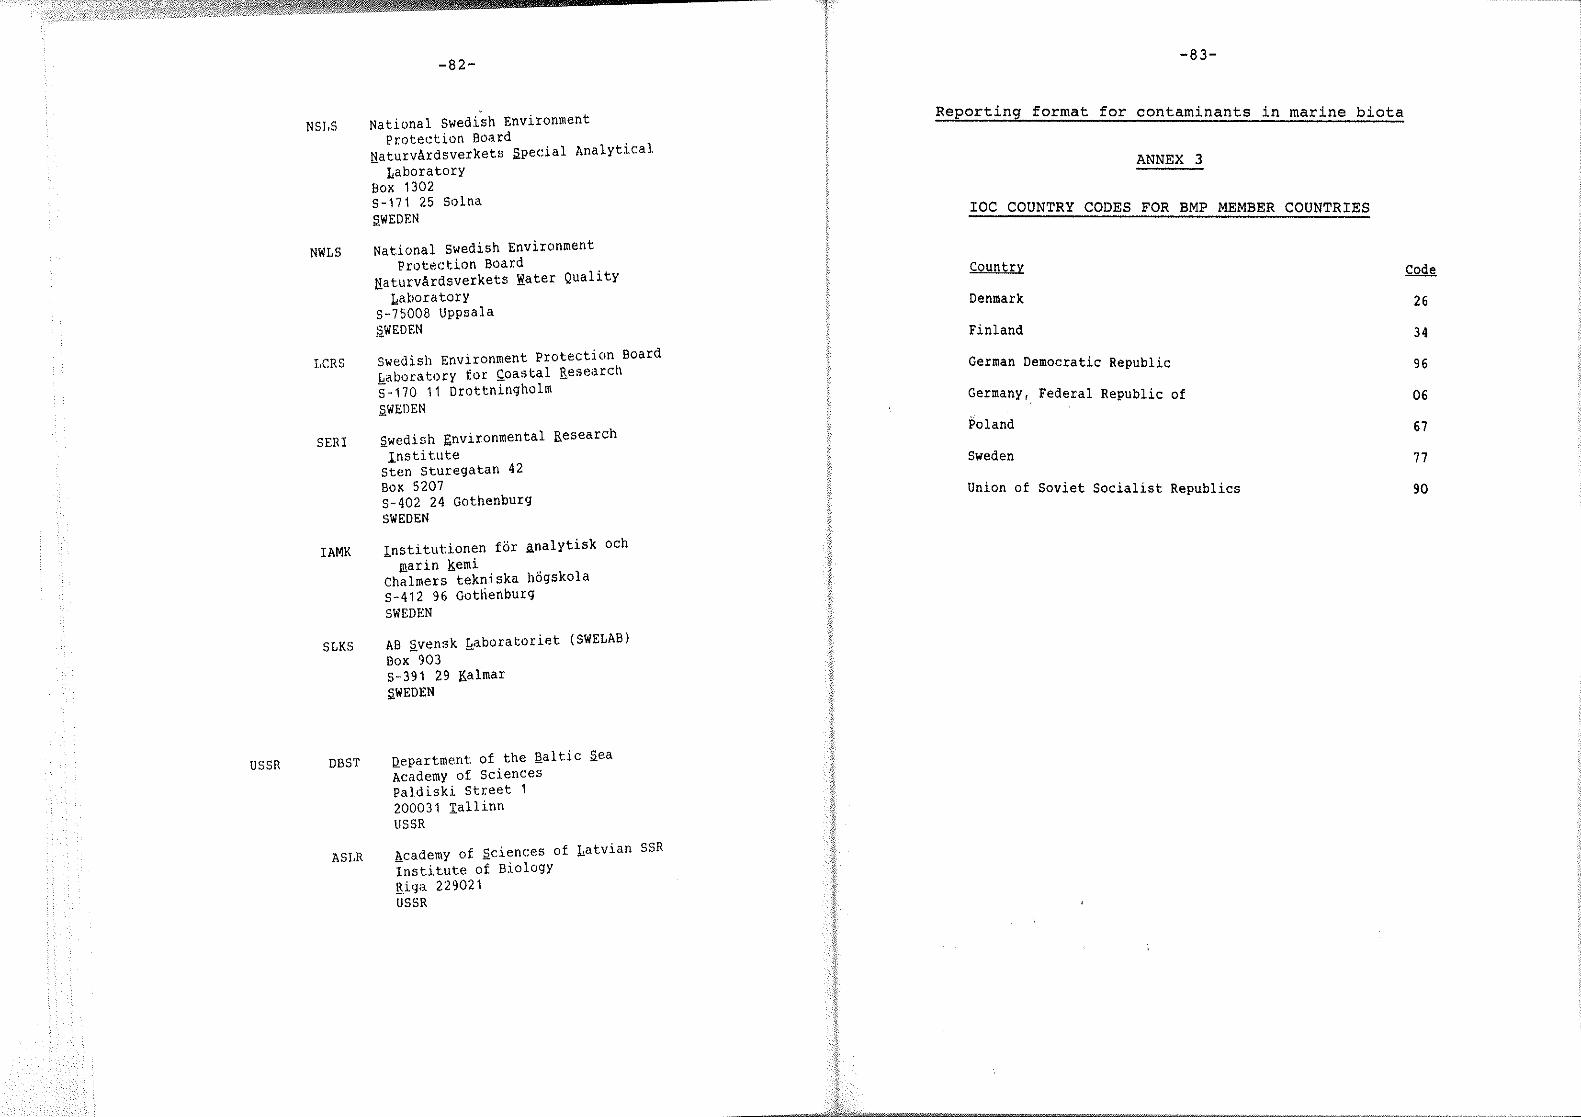
USSR
NSJ,S
NWLS
LCRS
SERI
-82-
' National Swedish Environment
Protection Board !'J.aturvArdsverkets jipec:ial Analytical
Laboratory Box 1302 S-171 25 Solna jiWEDEN
National swedish Environment Protection Board
!'J.aturvArdsverkets ~ater Quality Laboratory
S-75008 Uppsala ;J.WEDEN
swedish Environment Protection Board Laboratory for ~oastal jl,esearch i-170 11 Drottningholm jiWEDEN
jiwedish Environmental Research Institute
Sten Sturegatan 42 Box 5207 S-402 24 Gothenburg SWEDEN
IAMK Institut:ionen for analytisk och marin ll;emi
Chalmers tekn.i ska hogskola s-412 96 Gotnenburg SWEDEN
SLKS AB ;l_vensk ~aboratoriet (SWELAB) Box 903
DBST
S-391 29 Kalmar jiWEDEN
l)_epartment. of the !laltic jiea Academy of Sciences Paldiski Street 1 200031 Iallinn USSR
ASLR academy of :l_ciences of Latvian SSR Institute of Biology giqa 229021 USSR
-83-
Reporting format for contaminants in marine biota
ANNEX 3
IOC COUNTRY CODES FOR BMP MEMBER COUNTRIES
Country
Denmark
Finland
German Democratic Republic
Germany, Federal Republic of
Poland
Sweden
Union of Soviet Socialist Republics
26
34
96
06
67
77
90

-84-
Reporting format for contaminants in marine biota
ANNEX 4-1
ICEE STATISTICAL REDTANGLE CODING sYSTEM
The principle of the statistical rectangle coding system is as follows. The latitudinal rows, each of which are 30 1 wide, are numbered (t~ digits) from 01 at the southern boundary of the ICES statistical area (36 00 1N latitude (see ICEE No.2 ohart)) northwards )lo 99. The northern limit of the statistical rectangle system is thus 85 39'N latitude. The longitudinal columns, each of which a.re 1 wide, are coded according to an alphanumeric system which starts at the western boundar¥ of the ICES statistical area (44°00'W longitude (see ICEE No~l chart)) with AO, continuing Al, A2, A3, to 40~ longitude. East of 40-w the system continues BO, Bl, ~2 •••••• to B9, CO, Cl, C2 ••• 09 etc., using a different letter for each 10 block and covering the entire west-east extent of the ICES statistical area, thus:
Note that letter I is omitted
G: 10°E - 20°E H: 20°E - 30°E J: 30°E - 40°E K: 40°E - 50°E L:. 50°E - 60°E M: 60°E - 68°3Q•E (M8)
When designating a statistical rectangle, the northing co-ordinate is to be stg.ted f~t. Thus, the rectangle of which the south-west corner iB 54 00 1N, 3 00 1E is designated 37 F3.
Five charts of the ICES fishing areas with the rectangle network auperimposed on them are attached to this document 1
1) ICEE No.1
2) ICEE No.2
3) ICEE No.3
4) ICEE No.4
5) ICES 27.3.03.00 (Baltic)
- Divisions XIVa, XIVb and Va1
- Divisions of Sub-e.reaa VI and VII, Sub-areas VIII and lX, major parte of Sub-areas X and XII, Sub-divisions Vbl and Vb21
- Divisions of Sub-area IV and those parte of Sub-areas VI and VII adjacent to UK and IrelBildl
- Major parts of Divisions IIa and IIb adjacent to the coast of No~ and of Spitzbergen!
- Divisions IIId, IIIb, IIIo and part of Division IIIa brought down to Sub-divisions 21 - 32.
-85-
When it is necessary or desirable t · than is possible with a statisticalo s~cifi an area w~th more precision designation may be given by d" idi reo ang e designat~on, a sub-rectangle sub-divisions, aa follows: ~v ng a statistical rectangle into nine
The number of the sub-rectangle should be placed after the alphanumeric code designation for longitude, e.g., 36F84 1
2
3
4 7
5 8
6 9

-86-
~~~--~~~~~_.--~~~--._~~~~_.--~~_.--~~~--J
F9 GO G1 G2 G3 Glt GS GG G7 G8 G9 HO H1 H2 H3 H4 HS H6 H7 H8 H9 JO
ICES 27.3.03.00 (Baltic) Division IIIa includes Sub-division 21 (plus Skagerrak) Division IIIb is equivalent to .Sub-division 23 Division IIIo is equivalent to Sub-division 22 Division IIId is divided into Sub-divisions 24-32
42 41
40 39
38
37 3&
-87-
format for contaminants in marine biota
ANNEX 4-2
M~=::c ~~~F ~SH IN THE BALTIC SINKI COMMISSION
FOSI'l'ION
54°,8.0'N S9°3s.o•N-640la.,•N 61°55.0'N 59°37.5'N
14°17.0'E 23°18.0'E 22°21.5'E 19°06.o•E 23°19.7'E
Sl'ATION NO./CODE
P38
BY25 B03
BVII
LLlla
It additional stations are sampled utilize the ooordinatee ot the •tation. '

RUBIN COQE
-88-
· f t f contaminants i n marine biota Report1 ng orma or
RUBIN CODES FOR SELECTED SPECIES
LATIN ENGLISH FRANCAIS
ALCA TOR Alll~ Razorbill
ICES CODE
ANGU ANG Angyi lla angyilla European eel Anquille d ' Europe 0202
CANC PAG ~~ Edible crab Torteau 1101
CLUP HAR Ullm harengys Atlantic herrinq Harenq 0701
CRAN CRA ~~ common shrimp crevette qrise 1110
CRAS GIG ~'~~~Q~tt~a ~ Pacific oys ter Huitres creuse
ENGR ENC Enguylis Anchovy Anchois 0705 ~D!;U~.i.!;DQlu~
FUCU VES ~ ~~~.i.!;ulQ~u~ Bladderwrack
GADU MOR ~ IWhlla Atlantic cod Morue fraiche 0402
HIPP HIG H .i. 121229l 2~~u~ Atlantic halibut Fletan de 0304 bii212Q9l Q~~y~ 1 'atlantique
HOMA GAM ~ 9ammarys European lobster Homard Europeen 1106
LIMA LIM iliArua liiiwW Common dab Limande 0309
MACO SAL ~ baltbica 1225
MELA AEG t!!:laDQ!U:aiiiiY:I Haddock Eqlefin 0407 aealefinys
MERG SER ~ seUHQr Merqanser
> MERL MNG Merhog .i, ys Whitinq Merlan 041 5 medaogys
> MERL MCC Medycdys ·European hake Merluche 0403 merlycdys
MYTI EDU ~Will Blue mussel Houle 1206
MYTI GAL ~ Medi terranean Houle aall212tQ~.i.o~.i.al.i.:~ mussel medi terraneenne
NEPH NOR NeebrQps oot~eg.i,cys Norway lobser Lanqoustine 1107
OSTR EDU ~Will European flat Hui tre plate 1204 oyster
PAND BOR Paodalus botealis Prawn Crevette 1109
PECT MAX ~ ~ Common scallop Coquilles 1207 St . Jacques
PLAT FLE Plat.i.chtbys ~ EuropeJ.n Flet 0311 flounder
PLEU PLA PleutQoectes European pla1ce Pl i e at lantique 0305 elates a
SADU ENT ~ ~ syn : Mes.i,dQ t bea ~
SARD PIL ~ pi l cbatdus European p;!ch- Sardine/ pilchard 0703 ard (sardine)
SCOM sco ~ sr.Qmbrus Atlantic Maquereau 0902 mackerel
SOLE VUL Sol ea vulgar is Common sole Sole commune 03 12
SPRA SPR Sorattys serattys Sprat Sprat 0704
STER PRO ~ 12atadisae Arctic tern
URIA AAL llW ~ Guillemot
7 483155T
-89-
Reporting format for contaminants in marine biota
ANNEX 6
CODE LIST FOR CONTAMINANTS AND UNITS
CONTAMINANT NAME
Arsenic AS MGKG
Cadmium CD MGKG
Chromium CR MGKG
Copper cu MGKG Mercury
HG MGKG Manganese
MN MGKG Nickel
NI MGKG Lead
PB MGKG Zinc
ZN MGKG
DOE (pIp I) DDEPP UGKG
DDT (o 1 p) .DDTOP UGKG
DDT (PIp I) DDTPP UGKG
TOE (pIp I )
TDEPP UGKG DDT(p 1 p 1
) + DDE(p1p 1 ) DDTEP UGKG
[P 1 P 1 - DDT sDDTp UGKG [DDT
sDDT UGKG Dieldrin DIELD UGKG HCH-alpha HCHA UGKG HCH-beta HCHB UGKG HCH - gamma HCHG UGKG Hexachlorobenzene HCB UGKG
Polychlorinated terphenyls PCT UGKG
Polychlorinated camphenes PCC UGKG
... continued

-90-
CONTAMINANT NAME CODE UNIT
Trans -chlordane TCDAN UGKG
Cis-chlordane CCDAN UGKG
Trans-nonachlor TNONC UGKG
Oxychlordane OCDAN UGKG
Heptachlorepoxide HCEPX UGKG
Polychlorinated biphenyls :
The contaminant phenyls has been PCB congeners.
code list associated with polychlor~na~e~ biextended to allow the reporting of lndlVldual
d ll.st for PCBs is as follows: The complete co e
CONTAMINANT NAME CODE UNIT
Polychlorinated biphenyls PCB MGKG
PCB congeners: CB28 UGKG
(by IUPAC numbers) CB52 UGKG CB101 UGKG CB118 UGKG CB153 UGKG CB138 UGKG CB180 UGKG
CB18 UGKG CB31 UGKG CB44 UGKG
CB66/95 => CBs01 UGKG CB110 UGKG CB149 UGKG CB187 UGKG CB170 UGKG CB194 UGKG CB206 UGKG CB209 UGKG
CB128 UGKG CB137 UGKG CB195 UGKG
Defined combinations: PCB7 MGKG PCB? A MGKG PCB6 MGKG sCB MGKG
- 91-
Method for reporting PCBs:
1) In the case of determining PCB by a technique which does not involve differentiation of individual PCB congeners a single value should be reported using the contaminant code PCB and the unit MGKG.
2) If individual PCB congeners are determined the concentrations fo r each should be reported separately us ing the appropriate contami nant (CB) code fr om the list above (note the unit for reporting individual congeners is UGKG). Codes for other congeners not listed can be generated as required as CB followed by the congener IUPAC number. In addition, a value for the summation of the individual congener concentrations may be reported using one of the ' defined combination' codes above (note the units for reporting summations of congeners is MGKG ); these codes refe r to specific combinations of PCB congeners as follows:
PCB7 = CB28 + CB52 + CB101 + CB 118 + CB 138 + CB153 + CB180 PCB7A = ( PCB7 ] + CB44 + CB128 + CB137 + CB194 + CB195
PCB6 = CB28 + CB52 + CB101 + CB138 + CB153 + CB180
s CB = any other combination of PCB congeners (describe in comments).

-92-
Reporting format for contaminants in marine biota
ANNEX 7
CODE LIST FOR INTERCALIBRATION EXERCISES
1A 1/TM/BT - ICES First Intercomparison Exercise on Trace Metals in Biological Tissues - 1972
1B 2/TM/BT - ICES Second Intercomparison Exercise on Trace Metals in Biological Tissues - 1973
1C 3/TM/BT - ICES Third Intercomparison Exercise on Trace Metal s in Biological Tissues - 1975
10 4/TM/BT - ICES Fourth Intercomparison Exercise on Trace Metals (Cadmium and Lead only) in Biological Tissues - 1977
1E 5/TM/BT - ICES Fifth Intercomparison Exercise on Trace Metals in Biological Tissues - 1978
1F 6/TM/BT - ICES Sixth Intercomparison Exercise on Trace Metals (Cadmium and Lead only) in Biological Tissues - 1979
1G 7/TM/BT - ICES Seventh Intercomparison Exercise on Trace Metals in Biological Tissues - Part A - 1983
1H 7/TM/BT - ICES Seventh Intercomparison Exercise on
1Z
2A
2B
2C
20
Trace Metals in Biological Tissues - Part B - 1985
Other Intercomparison/Intercalibration Exercise on Trace Metals in Biological Tissues - Describe in comments
- 0 -
1/0C/BT - First ICES Intercomparison Exercise on Organochlorines in Biological Tissues (Sample Nos. 2A, 2B) - 1972
2/0C/BT - Second ICES Intercomparison Exercise on Organochlorines in Biological Tissues (Sample Nos. 3A, 3B) - 1974
3/0C/BT Third ICES Intercomparison Exercise on Organochlorines in Biological Tissues (Sample No. 4) - 1978
4/0C/BT - Fourth ICES Intercomparison Exercise on Organochlorines (mainly PCBs) in Biological Tissues (Sample No . 5) - 1979
2E
2F
2Z
-93-
5/0C/BT - Fifth ICES Intercomparison Exercise on Organochlorines (PCBs only) in Biological Tiss ues - 1982
6/0C/BT - Sixth ICES Intercomparison Exercise on O~ganochlorines (PCBs only) in Biological T1ssues - 1983
Other Intercalibration/Intercomparison ~xercise in Biological Tissues - Describe 1n Comments

Page __ of __ pages de
-94-
I I I I I I I I I I LAB. YR . SEQ.NO.
AN . NO . SEQ . 1 . 2 . 3.
ICES INTERIH REPORTING FORHAT FOR CONTAHINANTS IN FISH AND SHELLFISH FORHAT ~ RAPPORT PRDVISOIRE SUR LES CONTAHINANTS ~ PDISSONS ET CRUSTACES ET HOLLUSQUES
FISH/SHELLFISH CONTAHINANT HASTER FORHULAIRE PRINCIPAL S£R LES CONTAHINANTS ~ POISSONS/CRUSTACES ET HOLLUSQUES
4. Form identifier code/Code d'identification formulaire
5. sampling country/Pays effectuant echantillonnage
6 . Organization code/Code de ! ' organisation
7 . Sampling area indicator/indicateur zone d'echantillonnage
8. Sampling date/Date d'echantillonnage
9 . Purpose/Objet
10 . Species code/code l'espece
11. Number of individuals used for analysis/Nombre d'individus utilises pour l'analyse
12. Number of specimen data cards following this master/ Nombre de formulaires de donnees de specimens accompagnant le present Formulaire Principal
ll1J
l....LJ
uuu
Y Y M M 0 0
u
13. Coaaents (e .g. detailed coordinates of sampling location, station name, bottom type, depth to bottom, sampling depth, ship name, measurement period, information on stock of organisms, stock structure, etc . )/Commentaires (par · ex. coordonnees detaillees de l ' emplaceaent d'enchantillonnage, nom de la station, type de fond marin, profondeur vers le fond, profondeur d'echantillonnage, nom ou code de navire, information sur le stock, structure de stock, periode des prises de mesures, etc.)
Date received by ICES Date recu par ClEM
I I I I I I I
Y Y M M D 0
-95-
(Revised June 1985) I I I I I I I I I I LAB . YR . SEQ.NO.
AN . NO .SEQ. 1. 2. 3 .
ICES INTERIH REPORTING FORMAT FOR CONTAHINANTS IN FISH AND SHeLLFISH
FORMAT DE RAPPORT PREOTVISOIRE 00 CIEH SUR LES CONTAHINANTS lE POISSONS lE CRUSTACES ET HOLLUSQUES
SPECIHEN DATA FORHIFORHULAIRE Df DONNEES DE SPECIHENS
4 . Form identifier code/Code d'identification du formulaire
5. Individual or bulk d · individ 11 e speclmens analysed/Specimens analyses ue ement ou en bloc
6 . Specimen or sub-sample number/Numbre de specimen ou de sous-echantillon
-7. Number f · d · : Nombre ~-; i~~ -l~~dua~s in homo?enate (if analysed as an homogenate)/ en homogenat~Vl us ans homogenat (au cas ou !'analyse est effectuee
u LW
8 . Length minimum / longueur minimum maximum/ maximum mean (or individual specimen value)/ moyenne (ou valeur pour specimen individuel) Standard deviation/Ecart type
9 . Whole weight minimum/poids entier minimum maximum; maximum
10. Sex/Sexe
11. Age minimum maximum
mean (or individual specimen value)/ moyenne (ou valeur pour specimen individual) Standard deviation/Ecart type
mean (or individual specimen value)/ moyenne (ou valeur pour specimen individuel)
12. Shell weight of molluscs / Poids de coquilles des molluscs
13. Number of tissue data forms filled in Nombre de formulaires de donnees de tissus remplis
14 . Comments . (e . g . , disease in organism, etc . ) Commentalres (par ex mal d · d • · · a 1e ans 1 organ1sme, etc.)
'-L-...1--..L-L.-.JI mm L-JL-...1--..L--L-.JI mm ..._.,__.--.~..--'-.....JI mm
.._.__.__._--L._JI g '--1-J..--.l-..L......JI g "--1.--J..--.l-..L......JI g
u ~yr(s)an LWyr(s)an
yr(s)an
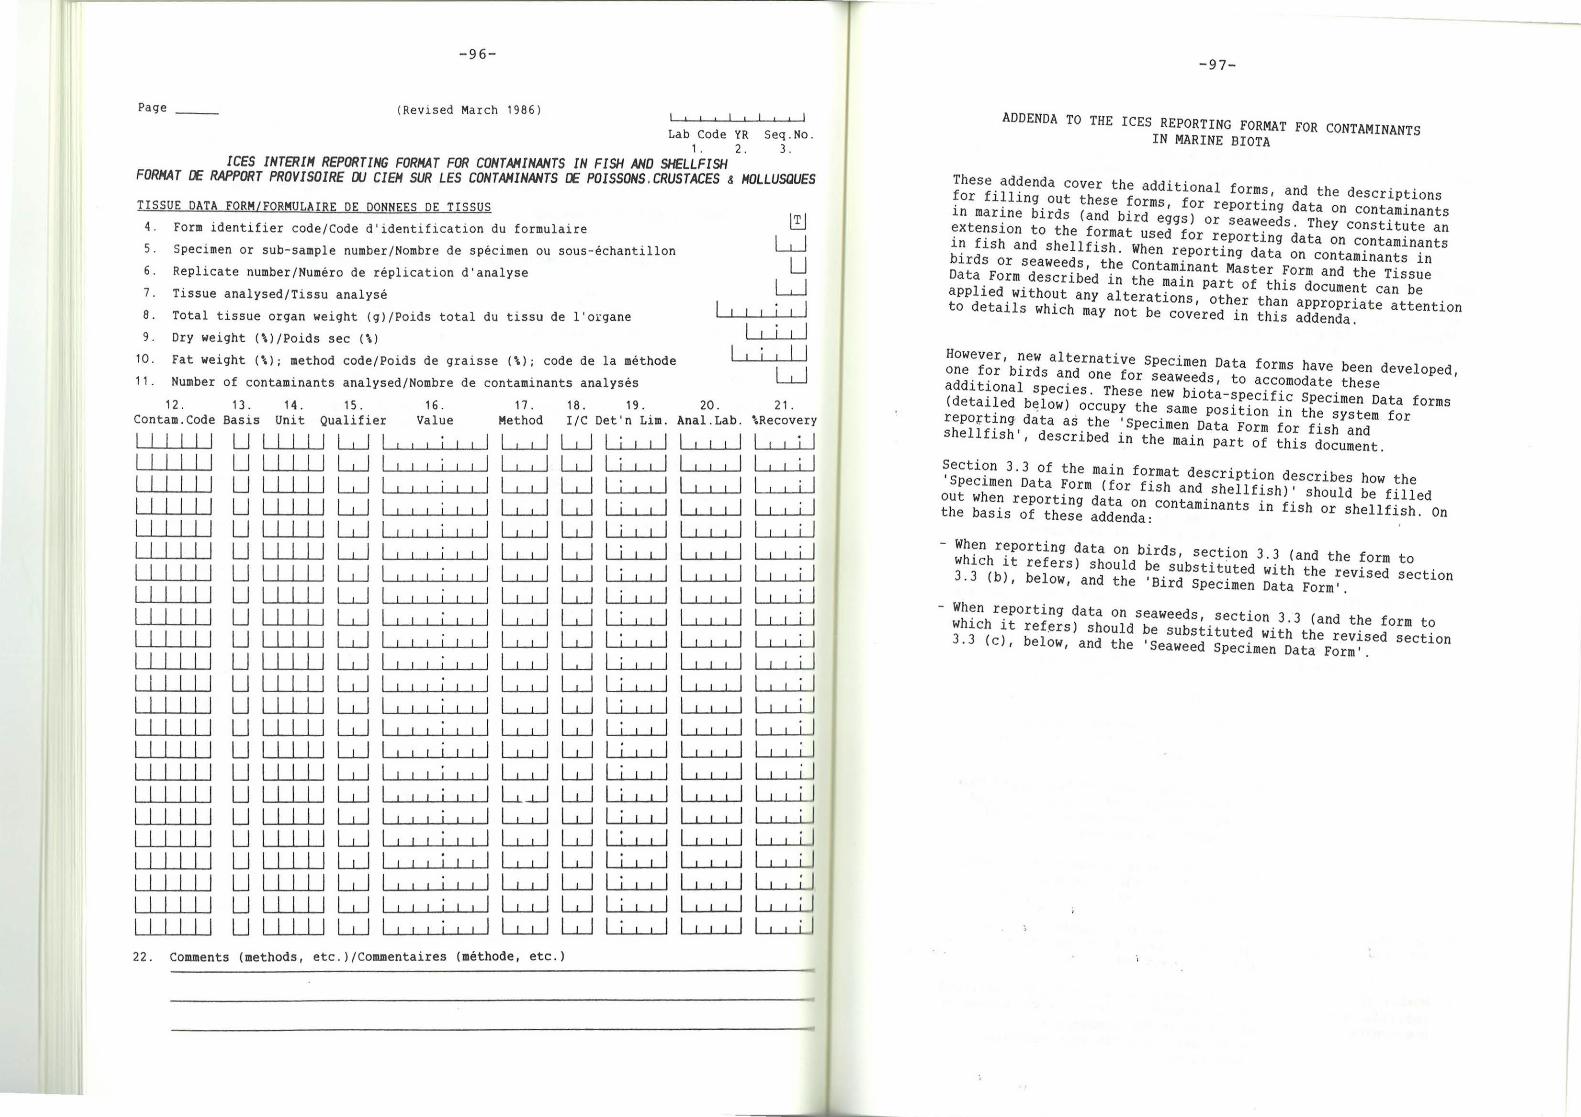
- 96-
Page _ _ (Revised March 1986) I I I I I I I I I I
Lab Code YR Seq . No. 1 . 2. 3 .
ICES INTERIH REPORTING FORHARTLFESOR C~~~~~~S~Np~i~~~C~~~k~& HOLLUSQUES FORHAT ~ RAPPORT PROVISDIRE 00 CIEH SU
TISSUE DATA FORM/FORMULAIRE DE DONNEES DE TISSUS ~
4. Form identifier code/Code d'identification du formulaire ~
5. Specimen or sub-sample number/Nom re e b d specimen ou sous-echantillon U 6. Replicate number/Numero de repl i cation d'analyse ~
7. Tissue analysed/Tissu analyse
8. Total tissue organ weight (g) / Poids total du t1ssu e · d l'organe I i I I I I I
9 . Dry weight {\)/Poids sec (\) .
. · (" ) · code de la methode 10. Fat weight( \ ); method code/Po1ds de gra1sse \ • .
11 . Number of contaminants analysed/Nombre de contaminants analyses
16 . 17 . 18 . 19. . 20 . 12. 13 . 14 . 15 · h d I /C Det • n Llm Anal . Lab. \Recovery · f · Value Met o · Con tam . Code Basis Unit Quall ler 1 I I I
21 .
I I I I I I I I J I J I I J J J I J I I J J J I I J J J I I I J I I I I I J I I I I I J I J I J I I J J I J I I J I I J
I J I J I J I I I J I I I I J J I I I I J I I I I I J J I I I I I J I I I I I J I J I J J I I J I J J I I I I I I I J I I J I I I I I I I J I I I J I J I I
U I I I I I LLJ 1~-~~~1 ..._I ..__.__.I LJ I I ..._...__.___.~, ..._j ....._.__.~1 U I III I LLJI II ILLJI II ._....._.__~1 UIJJIJLLJI Jl ILLJI II II I UIIIIJLUI II ILLJI II II I UIIJJJLLJI Jl ILLJI Jl Jl J UIIIJILLJI II ILLJI II II I UIIIIILUI II JLLJI Jl II J U I JIIILr_ll II JLLJI Jl II J UIJIIILLJI II JLLJI II ].__..I__.__
1 II I LUI II II J UIIIIILLJ I ~I 11 II J UIIIIILUI I LLJI Jl 11 I UIIIIILUI I LUI 11 I J u IIIII LUI I 'I II II J UIIIJJLJI I LLJ II J UIIIIJLJI l LUI Jl 1
UIIIIILUI I II LUI J U I I I I I I . I I I I L~ LU '--'-1 ~ J
LLJ I JLUI UIJIIJLJI I ILUI J i l UIJIIJLLJI I JLLJI J i l u I I I I I LtJ I I I I I I ~....._.__.II'----' ___.___._i J U I I J J I LLJ I L..L..J I I - -, •j
. . I I I I I J LLJ ..._I ....._.___.~ 1--L.....L.-.I,__,j 1~-.-...__..__.._.. -. U I I I J LLJ I I J LU 1 1 ._I ...__.___.~] .__.I ~i J U I I J I I LtJ ~__I .L...l-..._.__~. ·
t · (methode, etc.) 22 . Comments (methods, etc . )/Commen alres
-97-
ADDENDA TO THE ICES REPORTING FORMAT FOR CONTAMINANTS IN MARINE BIOTA
These addenda cover the additional forms, and the descriptions for filling out these forms, for reporting data on contaminants in marine birds (and bird eggs) or seaweeds. They constitute an extension to the format used for reporting data on contaminants in fish and shellfish . When reporting data on contaminants in birds or seaweeds, the Contaminant Master Form and the Tissue Data Form described in the main part of this document can be applied without any alterations, other than appropriate attention to detail s which may not be covered in this addenda.
However, new alternative Specimen Data forms have been developed, one for birds and one for seaweeds, to accomodate these additional species. These new biota- specific Specimen Data forms (detailed b~low) occupy the same position in the system for repor.ting data as the 'Specimen Data Form for fish and shellfish', described in the main part of this document.
Section 3. 3 of the main format description describes how the 'Specimen Data Form (for fish and shellfish)' should be filled out when reporting data on contaminants in fish or shellfish . On the basis of these addenda:
When reporting data on birds, section 3. 3 (and the form to which it refers) should be substituted with the revised section 3.3 (b), below, and the 'Bird Specimen Data Form' .
When reporting data on seaweeds, section 3.3 (and the form to which it refers) should be substituted with the revised section 3. 3 (c), below, and the 'Seaweed Specimen Data Form'.

-98-
3.3 (b) Specimen Data Form - Birds
The present guidelines for monitoring using marine birds or bird eggs require that samples are analyzed and reported on an individual specimen basis. For such samples, a Bird Specimen Data Form should be filled in for each specimen.
To provide for possible future extensions to the guidelines, the possibility of alternative procedures for sample analysis are accommodated, but should in principle not be required at present. Thus, if the entire sample were to be analyzed as an homogenate, only one Bird Specimen Data Form should be filled in . If a sample were to be divided into several sub-samples each of which was analyzed as an homogenate, a Bird Specimen Data Form should be filled in for each sub-sample.
The Bird Specimen Data Form should be filled in according to the following description:
1. Laboratory code
2. Year
3. Sequence Number
4 . Form identifier code
5. Individual .or bl!lked specimens analyzed
6. Specimen or sub-sample number
7. Number of individuals in homogenate
Code Description
Insert same information as on Marine Biota Contaminant Master
The code BS identifies the Bird Specimen Data Form.
Insert the appropriate code, as follows: (NB: the code 'I' is appropriate if present guidelines are followed correctly . )
I - if each individual organism, or parts thereof , has been analyzed separately;
P - if the specimens in the sample have been grouped into sub-samples and each sub-sample homogenized and analysed separately;
H - if all the specimens in the sample have been bulked together and homogenized prior to analysis.
Insert an identifier number for the specimen concerned: 01 for the first, 02 for the second, etc .
If the sample or sub-sample was analyzed as an homogenate, indicate the number of organisms in the homogenate; if individual organisms were analyzed, leave blank .
8. Length of wing
9. Whole weight of bird or egg
10. Age of bird
11. Thickness of egg shell
12. Maximum length of egg
13. Maximum diameter of egg
14. Number of Tissue Data Forms filled in
15. Comments
-99-
Right justified, zero filled. Insert the length of the wing in mm, as measured from the carpal joint to the tip of the longest feather.
Ri~ht justified, zero filled. Insert we1ght of whole bird body or egg in grams, to one decimal place . '
Right justified, zero filled. Insert age of bird in days.
Right justified, zero filled . Insert egg. shell thickness in mm to three dec1mal places. Shell thickness should be measured with a micrometer.
Rig~t justified, zero filled. Insert the max~mum length of the egg in mm, to one dec~mal place, measured with a slide callper.
Rig~t jus~ified , zero filled. Insert the max1mum .d1ameter of the egg in mm, to one .dec1mal place, measured with a slide callpher .
In~ert the number of Tissue Data Forms W~lch h~ve bee~ completed in association Wlth thls partlcular Bird Specimen Data Form.
Plain language comments can be inserted as .needed. Such comments can include the ma1n sources of food for the specimens sampl~d, detailed information on nest local~ty or other information about the organ1sms sampled.

-100-
I I I
(November 1988) LAB. 1 0
ICES REPORTING FORMAT FOR CONTAMINANTS IN MARINE BIOTA
BIRD SPECIMEN DATA FORM
4 . Form identifier code
5. Individual or bulked specimens analysed
6. Specimen or sub~sample number
7. Number of individuals in homogenate (if analysed as homogenate)
8. Length of wing (carpal joint to tip of longest feather)
9. Weight (whole bird body or egg)
10. Age
11. Thickness of shell
12. Maximum length of egg
13 . Maximum diameter of egg
14. Number of tissue data forms filled in
I I I I I I YR. SEQ.NO. 2. 3 .
u LLJ
mm
g
days
mm
mm
mm
comments (e.g., main sources of food, use RUBIN codes where possible; 15 · details of sampling locality and nest locality, etc., l
-101-
3.3 (c) Specimen Data Form - Macrophytes
The Macrophyte Specimen Data Form should be filled in according to the following description:
1. Laboratory code
2. Year
3. Sequence Number
Code Description
Insert same information as on Marine Biota Contaminant Master
4 . Form identifier code The code MS identifies the Macrophyte Specimen Data Form.
··' 5. Individual or bulked Insert the appropriate code, as follows:
specimens analyzed
6. Specimen or sub- sample number
7. Number of individuals in homogenate
8. Whole plant or tip
I - if the specimens in the sample have been analyzed on an individual plant basis (including situations where the analysis concerned subsamples which derived from a single i~dividual plant);
P - if the specimens in the sample have been grouped into sub-samples derived from different plants and each sub-sample analysed separately;
H - if all the specimens in the sample have been bulked together and homogenized prior to analysis, with the sample derived from several distinct plants.
Insert the identifier number of the specimen or sub-sample concerned: 01 for the first, 02 for the second, etc.
If the sample or sub-sample was analyzed as an homogenate of material derived from several distinct plants, indicate the number of plants concerned; if individual plants (or parts thereof) were analyzed, leave blank.
Insert the appropriate code , as follows:
P - if the whole plant was analyzed
T - if the tips of the plant were removed and analyzed

9. Age of plant
10 . Number of Tissue Data Forms filled in
11. Comments
-102-
Right justified, zero filled. Insert age of plant in years .
Insert the number of Tissue Data Forms which have been completed in association with this particular Macrophyte Specimen Data Form.
Plain language comments can be inserted as needed. Such comments can include details about the sampling locality or other information relevant to the sample .
-]03-
(November 1988)
ICES REPORTING FORMAT FOR CONTAMINANTS IN MARINE BIOTA
MACROPHYTE SPECIMEN DATA FORM
4. Form identifier code
5 . Individual or bulked specimens analysed
6 . Specimen or sub-sample number
I I I
LAB . 1 .
7 . Number of individuals in homogenate (if analysed as homogenate)
8 . Whole plant or tip
9 . Age .. -
10. Number of tissue data forms fill ed in
11. Comments (e .g . , details of sampling locality, etc . ,)
YR . SEQ.NO. 2 . 3 .
~
u LLJ
I I
u LL..J yrs
LLJ

-104-
6. Exchange of data on contaminants in fish and shellfish
via magnetic tape
(ICES, rev version May 1986)
Exchange of data on CONTAMINANTS IN FISH AND SHELLFISH on magnetic tape ====================;================================================== This document should be read in parallel with "INTERIM REPORTING FORMAT FOR CONTAMINANTS IN FISH AND SHELLFISH•, published by ICES (May 1986 revised version). This Format is described in three versions: the full ICES version, the JMP version and the HELCOM version, ~he latter two are essentially subsets of the first with reference to the particular requirements of the JMP and HELCOM . The magnetic tape format (described below) can be used in conjunction with either of the three versions, where reference is made to specific sections of the full ICES version an equivalent section appears in the JMP and HELCOM subsets.
Magnetic tapes sent to ICES should be :
9 tracks, odd parity 800, 1600 or 6250 bpi (1600 bpi is strongly preferred) EBCDIC OR ASCII --no label fixed blocked records logical record length 80 characters blocksize, a suitable multiple of 80
The exchange- format consists of the following record types;
01 - Fish/Shellfish Contaminant Master Record 04 - Specimen Data Record 07 - Tissue Data Record 10 - Contaminant Data Record 13 - Plain Language Record
An entire series of data obtained on one species from one station/area should be organized as follows;
01-Master Record 13-Plain Language Records (optional,max 5)
04-Specimen Record 13-Plain Language Records (optional,max 5)
07-Tissue Record 13-Plain Language Records (optional,max 5)
10-Contaminant Records (as many as needed) 07-Tissue Record 13-Plain Language Records (optional,max 5)
10-Contaminant Records (as many as needed)
-105-
04-Specimen Record 13-Plain Language Records (max 5)
07-Tissue Record 13-Plain Language Records (max 5)
10-Contaminant Records (as many as needed) 07-Tissue Record
01-Master Record (next series)
Record layout for the different record types :
Fish/Shellfish Contaminant Master Record: ****************************************
Field name Columns Valid values Comments ================================================================================ Record id 1-2
Laboratory code 3- 6
Year 7- 8
Sequence number 9-11
Sampling country 12-13
Organization code 14-14
Sampling area indicator
8 483155T
15- 15
16-16
17-17
18-26
01
See Annex 2
74-present year
001-999
See Annex 3
0 or 1
0 or 1
0 or 1
I ,J,B, or c
See Annex 4-1 to 4-3
Mandatory.
Mandatory . All Annexes refer to "Interim Reporting Format ... •.
Mandatory . Last two digits of the year in which the samples were taken.
Mandatory, right justified, zero filled. Consecutive numbers for one year, starting with 001 for the first Master Form in a year, 002 for the second, etc.
Mandatory .
Mandatory . If data submitted for ICES insert 1, otherwise 0.
Mandatory . If data submitted for JMP insert 1, otherwise 0 .
Mandatory. If data submitted fo r BMP insert 1, otherwise 0.
NOTE: At least one of the columns 14-16 must contain a '1'. Data can be submitted for more than one. organization .
Mandatory.
Mandatory, left justif i d , filled.

ICES statistical rectangles
samplin<J date
Purpose
species code RUBIN
US-NODC ICES
Number of individuals used for analysis
Number of specimen data records following this Master record
Filler
27-31
32-37
38-38
39-60 39-46 47-56 57-60
61-63
64-65
66-80
-106-
Spaces or see Annex 4-1
0-4
See Annex 5
001-999
01-99
Spaces
Left justified, space filled. ICES will store the sampling area in two systems : in the system reported by the originator, and in the ICES system (ICES will manually convert all sampling areas to the ICES system). It would therefore be a nice help if the participatin<J laboratories would report the samplin<J area also in the ICES system. If a sample has been collected over more than one statistical rectanqle then the most siqnificant rectangle should be inserted. If col 17= ' 1' then simply copy the content of col 18-22 to col 27-31. Col 31 can be used to . . designate a sub-rectangle w~th~n an ICES rectanqle, see Annex 4-1.
Mandatory. In the fora YYMMDD, if day not reported then 00=00 .
Mandatory.
The species must be reported in ~t least one of the codinqsystems. If, for instance~ only RUBIN-code is used, then 1nsert this code in col 39-46- and fill col 47-56 and 57-60 with spaces.
Mandatory, right justified, zero filled.
Mandatory, riqht justified, zero filled .
For future use .
Specimen Data Record : ********************
Field name Columns
- 107-
Valid values Comments ================================================================================ Record id
Individual or bulked specimens analyzed
Specimen or subsample number
Number of individuals in.hoaoqenate
Length min
max
mean or
individual
standard deviation
1-2
3-3
4-5
. 6-8
9-13
14-18
19-23
24-28
04
I,P or H
00 or 01-99
000 or 001-999
Mandatory.
Mandatory.
Mandatory, right justified, zero filled. If the entire sample was analyzed as a homogenate then insert 00 .
Mandatory, right justified , zero filled. If individual organisms were analyzed then insert 000 .
Total length in ma. If individuals analyzed: space filled. If bulk(s) analyzed: space filled if value missing, otherwise right justified , zero filled.
Total length in mm. If individuals analyzed: space filled. If bulk(s) analyzed: space fi lled if value missing, otherwise right justified, zero filled .
Total length in mm. Mandatory, right justified, zero· filled. (mean=arithmetic mean)
If individuals analyzed: space filled. If bulk(s) analyzed : space filled if value missing, otherwise right justified , zero filled .

Weight min 29-33
max 34-38
mean 39-43 or
individual
standard 44-48 deviation
Sex
Age min
max
mean or
individual
Shell weight of molluscs
49-49
50-51
52-53
54-55
56-60
Number of tissue 61-62 data records belonging to this Specimen record
Filler 63-80
-108-
0-5
01-99
Spaces
Whole weight of ungutted fish in grams. If individuals analyzed: space filled. If bulk(s) analyzed: space filled if value missing, otherwise right justified, zero filled.
Whole weight of ungutted fish in grams. If individuals analyzed: space filled. If bulk(s) analyzed: space filled if value missing, otherwise right justified, zero filled.
Whole weight of ungutted fish in grams . Mandatory, right justified, zero filled . (mean=arithmetic mean)
If individuals analyzed: space filled. If bulk{s) analyzed: space filled if value missing, otherwise right justified, zero filled.
Mandatory.
In year(s). If individuals analyzed: space filled. If bulk(s) analyzed: space filled otherwise if value missing, right justified, zero filled .
In year(s). If individuals analyzed : space filled. If bulk(s) analyzed: space filled otherwise if value missing, right justified, zero filled.
In year(s) . Mandatory, right justified, zero filled. (mean=arithmetic mean)
In grams to 1 decimal place. Space filled if value missing, otherwise right justified, zero filled . NOTE: For numerical fields with implied decimals,"zero filled" means both leading and trailing zeroes . This is also valid for a couple of items in the Tissue Data Record and the Contaminant Data Record
Mandatory, right justified, zero filled .
For future use.
Tissue Data Record: *********** *******
Field name
-109-
Columns Valid values ===============---- ----- Comments Record id -----~~~-=====::=================================================
Specimen or subsample number
Replicate ri·umber
Tissue analyzed
Tissue weight
Dry Weight {\)
Fat Weight (\) and
method code
Number of contaminants analyzed
Filler ·
3-4
5-5
6- 7
8-13
14-17
18-21
22-22
25-80
00 or 01-99
0 or 1-6
01 -06 or 99
01-99
Spa<!es
Mandatory.
M~ndatory, right justified, zero fllled . Sa~e number as in the correspondlng Specimen Data Record .
Mandatory. If no replicates a~alyzed then insert o.
M~ndatory, right justified zero f1lled . '
In ?rams to two implied d7c1~als . Space filled if value m1ss1ng, otherwise right justified, zero filled.
In \ to . two implied decimals. Space ~llle~ if value missing, o~herwlse rlght justified, zero fllled .
In\ to . two implied decimals . Space ~llle~ if value missing, o~herwlse rlght justified, zero fllled .
Space filled if method not given and/or value missing in col 18 _ 21, otherwise insert code . Each labo7at~ry gives its own code and 1t 1s recommended to describe , or give reference to method used in Plain Language ' Records .
Mandatory, right justified, zero filled.
For future use.

Contaminant Data Record: ***********************
Field name Columns
- 110- 7
Valid values Comllents ================================================================================ Record id
Contaminant
Basis
Unit
Qualifier
Value
Method
I/C (Intercalibration)
Detection limit
Analytical lab-code
\ Recovery of Standard
Filler
1-2
3- 7
8-8
9-9
10-10
11-11
12-18
19-21
22-23
24-27
28-31
32-35
36-80
10
See Annex 6
W,D or L
M or U (See Annex 6)
space,> or <
space,A,S,Q, R or M
See Annex 7
See Annex 2
Spaces
Mandatory.
Mandatory, left justified, space filled. Mandatory.
Mandatory. M=mg/kg, U=~g/kg.
See page 13 in "Interim Reporting Format ... •.
See page 13 in "Interim Reporting Format . . . -.
In 'unit' to three implied decimals. Space filled if value missing, otherwise right justified, zero filled. NOTE: At first glance it seems to make no sense to allow for 'value missing', since in that case a Contaminant Record would not be filled in, but in col 11 is given option M='Missing value: original data erroneous or missing' and therefore a unique value must be assigned for 'value missing'.
Mandatory, left justified, space filled. See page 14 in "Interim Reporting Format ... •.
Mandatory.
Limit to three implied decimals. Space filled if not given, otherwise right justified, zero filled.
NOTE: This item is now Mandatory
New Item. \ Recovery of internal standard to one implied decimal. Space filled if not appropriate otherwise right justified, zero filled.
For future use .
Plain Language Record: *********************
-111-
!!:=~=~============~:~~~~----~alid values comments ------------==================================================
Record id 1-2 13 Mandatory. Couents 3-62 Left justified, space filled . Filler 63-80 Spaces

=-----~~-------------------------------------------------
-112-
c. HARMFUL SUBSTANCES IN BIOTA AND SEDIMENTS
c. II Trend Monitoring of Contaminants in the Coastal zone
1. Choice of monitoring organisms
a) General considerations
In this chapter a general overview is given for using
coastal organisms to monitor temporal trends in
contaminants such as heavy metals, organochlorines and
petroleum hydrocarbons. It must be emphasized, however,
that the use of any of the proposed species is
optional.
In selecting the monitoring organisms, priority has
been given to species with a wide geographical range
within the Baltic, availability, adequ ate size of the
organism, and of course their ability to reflect levels
of contaminants in the coastal zone. If all the
proposed types of organisms are included in a
monitoring programme, the results will provide infor
mation on the concentrations of contaminants in species
at several trophic levels, from algae to predatory
birds.
When the monitoring species have been selected, a
choice should be made regarding the tissues to be
analyzed for each type of contaminant. The general
considerations for this choice have been given in
Section C.I.l.3.b) of the Guidelines.
In vertebrates, the essential metals copper and, to a
lesser extent, zinc are under homeostatic control (1).
Because of that, copper in vertebrates will not reflect
environmental concentrations adequately. The essential
and the non-essential metals except mercury are mai nly
stored/accumulated in the liver and kidney. These
-113-
tissues, and the liver in particular due to its larger
size, are therefore the recommended tissue(s) for
analysis of heavy metals in vertebrates ( see Table
C.6.).
Mercury occurs in almost similar concentrations i n
muscle and liver. However , as muscle tissue generally
shows less variation in mercury concentration due to
variations in nutritional status, etc. ( 2), muscle
tissue is recommended for mercury analysis.
As heavy metals in macroalgae and bivalves are under
poor o~ no homeostatic control (3 ) , these organisms are
·highly recommended for metal monitoring purposes.
Although most metals are mainly concentrated in the
kidney and hepatopancreas, it is not practicable to
distinguish between tissues
ogenates of the entire soft
adductor muscle of bivalves,
metal analysis.
in bivalves. Thus, hom
tissues, including the
should be used for heavy
In macroalgae, only those parts developed in the
sampling year should be used for metal analysis.
In the Baltic Sea, salinity varies from a few parts per
thousand in the Bothnian Bay to more than 2 0 ° /oo i~
the Kattegat. These changes in salinity are accompanied
by changes in chemical speciation and bioavailabili ty
of heavy metals ( 4) . Thus, comparison of heavy metal
concentrati ons in coastal species from different areas
should be done with great care.
The organic .xenobiotics to be monitored are non-polar
substances mainly associated with lipids. In
vertebrates, they ·should be determined i n the lipid
fraction of the muscle tissue. In bivalves, analysis
should be performed in the lipid fraction of the whole soft body.

:z:: () :z::
'0 ()
E-i CJ)
1/J Q) :> ru :> r-1
11:1
-114-
~ ~
~ Q) '0 s:: ::s Q)
0 ..!< r-1 •r-1 ~ ~
~ ~ ,ex;
1/J CQ '0 ~
r-1 ~ ~ Q) ·r-1 ~ ILl 11:1 ~
Q) ::s 1/J 1/J r-1 • ..-~ ru E-iQ) ::>., s:: r-I~Q)Q)0
+J () Q) s:: () · r-1 Ii-I 1/J :> '0 ·r-1 +J 0 ::::S ·r-l·r-1 0. 0. Cll~H~,cx;o
II II II II II II
E-i ........ Cll~H~,cx;-
b)
-115-
The ability of macroalgae to reflect environmental
concentrations of non-polar xenobiotics has not been
documented convincingly ( 3) • Thus, macroalgae are not
recommended for monitoring organochlorines and petroleum hydrocarbons.
Organic tin
It is recommended that measurements of total organic
tin be made in water from harbour areas and in coastal
areas with ship and pleasure boat traffic . This
proposal is made because it has been shown that the
organo-ti~ .compounds used in antifouling paints have
serious effects on the larvae and other life stages of molluscs and other marine organisms.
Detailed procedures for the measurement of organic tin
and total tin in sea water are described in (15).
Macroalgae
Several species of macroalgae have been used success
fully worldwide to monitor heavy metals in the coastal
zone. The most extensively used species is probably
Fucus vesiculosus, which has shown good linearity in
response to environmental concentrations of heavy
metals (3). As Fucus vesiculosu 8 is a dominant species
in the algal zone in many coastal areas around the
Baltic Sea, this species is an obvious candidate for monitoring purposes in the Baltic.
The accumulation of heavy metals in macroalgae is under
some influence of their growth rate (3). In spring and
summer, growth . may be so intense that accumulation of
heavy metals cannot "catch up" with the production of
metal binding sites in the algae. As the degree of this
"growth dilution" varies according to time and site of
sampling, care must be taken to sample algae outside their growth season.

-116-
c) Bivalves
The blue mussel MytiLus eduLis is by far the most
commonly used organism to monitor contaminants in the
coastal zone. Its extensive use in both national and
international monitoring programmes is due to a number
of qualities that almost makes this species the
monitoring organism par excellence (3).
MytiLu s e duLis can be found in the coastal zone in
nearly all temperate waters. It is widely distributed
in the Baltic Sea area except in the northern part of
the Bothnian Bay and the inner parts of the Gulf of
Finland (5).
Going from the Belt Sea to the Baltic Proper, My t iLus
e duLis penetrates into deeper waters and becomes sparse
in the "tidal zone". Their growth rate also decreases
and they attain a smaller size. As size, age and growth
rate are closely linked to vertical distribution in the
Baltic, mussels for time trend monitoring should be
sampled at approximat ely the same depth each year.
In Myt i Lus edu Lis , the reproductive cycle and
nutritional status cause rather large variations in the
different body cons tituents during the year (6) and, as
the various contaminants differ in their affinity to
lipids, proteins and carbohydrates, mussels must be
sampled in periods showing only minor changes in body
constituents. Otherwise, high or low concentrations of
contaminants in mussels may result, even though the
environmental concentrations remain the same .
-117-
d) Fish
To gain additional information about contaminant loads
in the coastal zone, monitoring in predatory fish might
be useful. Fish are not, as macroalgae and bivalves,
strictly stationary. Thus, they are not equally suited
for monitoring very localized differences in contami
nant concentrations (7). However, if they are caught in
their nonmigratory periods, they may provide valuable
information about contaminant loads in restricted areas.
In the Guidelines for the Second Stage it was rec·ommended to use young
anguiLla , pike (Es ox Lucius)
fL e sus ) • Of these, only eel
species. Flounder, used in
"yellow" eel Anguilla
and flounder (PLatichthys
and pike are stationary
many countries in their coastal monitoring programmes, make annual migrations
and are thus less suitable for trend monitoring studies in the coastal zone.
Eel can be found in all areas of the Baltic Sea, while
the geographical range of pike is more restricted.
Flounder cannot be caught in the Gulf of Bothnia (8),
and belongs more to the open part of the s ea in the
eastern and northern part of the Baltic.
Since the coastal programme is optional, and especially
applies to the regional interests of the individual
Contracting Party, it is recommended that Contracting
Parties make a choice of species for trend study
purposes from among the three mentioned above, con
sidering the comparability, stationariness and avail
ability of the, species along their coasts.
·A·S both organochloritle and heavy metal concentrations
i n fish s how annua l var iations not r e lated t o
variations in contaminant load ( 9, 3 1 o) ' ' sampling

-118-
should be carried out in periods during which
concentrations show only minor variations. For the
three proposed species, sampling should be carried out
in the autumn.
e) Birds
Birds can provide valuable information to a monitoring
programme because they indicate the concentrations of
contaminants at a higher trophic level than fish; they
also integrate the contaminant levels of the individual
fish or shellfish they consume. Additionally, the data
obtained may be more easily correlated with population
figures than can be done with fish or bivalves because
bird populations and reproduction are more easily
determined.
In the choice of bird species for test organisms, diet
is an important factor. The bird species chosen must
feed primarily on marine organisms of a particular type
and not on miscellaneous materials, such as human
garbage.
The experiences from the last 20 years show that fish
consuming birds can be useful also in a Baltic
Monitoring Programme, as part of a temporal trend
monitoring system (11). Comparing available data on
organochlorine levels in eggs of fish-consuming birds
and in herring both used as test organisms in a Baltic
trend study has disclosed a mu ch clearer trend for the
bird egg series than for the fish series (11). The bird
species used was guillemot ( Uria aalge ) nesting in a
colony in the central part of the Baltic. Eggs of
another bird species of the family Alcidae, the
razorbill (Atea torda), also nesting in colonies along
the Baltic coast, have shown much the same homogeneity
with respect to both organochlorine levels and mercury
(12). Since the two bird species are stationary within
-119-
the Baltic Sea area all the year and thus no far
distance migration occurs, their eggs can be used for
chemical analysis in trend studies.
These two species have also been monitored biologically
with respect to both population status, reproductive
rate, and egg shell thickness ( 12, 13). These para
meters are easy to follow compared to reproduction and
population parameters for fish and bivalves.
The alcids do not nest in all areas of the Baltic. As
an alternative, two other fish-consuming bird species
can be reQommended, the arctic tern (Sterna paradisae)
and ··· the merganser <Mergus s errator>. Since these two
species migrate during winter time to areas outside the
Baltic, fledglings are recommended as material for
analysis. They shall be sampled just before they are
nearly full grown and are just about to learn to fly.
At this stage they will represent the fish fauna of the area where they have been hatched.
2. Sampling procedures
a) General considerations
For a discussion of the general considerations
regarding sampling procedures and the information which
should accompany the sample, see Section C.I.l.3.b ) of the Guidelines.
The purpose of the sampling procedures outlined below
is to ensure that samples are as homogeneous as
possible. By following the procedures, more rigorous
comparisons between yearly samples or between samples
from different areas can be made.
For all the proposed species, sampling should be done once a year.

-120-
b) Macroalgae
In addition to load, growth rate is the most important
factor influencing heavy metal concentrations in Fucus
vesicuLosus. To minimize bias due to variations in
growth rate, the algae should be sampled in
October/November at 1-2 rn depth. Apices (i.e., tips of
the algae, representing recent growth) of similar
length, free of epiphytic organisms, from several
plants (ca. 20) should be sampled. Fertile portions of
the plants should not be collected.
Sample data parameters and reporting system
At each sampling occasion, a sample information sheet
(Table C.3. in Section C.I.) should be filled out.
The apices should be cleaned for epiphytic organisms
using a polyethylene or glass spatula and rinsed well
in sea water from the collection site. After draining
as well as possible, the pooled sample is placed in a
polyethylene bag which should be sealed and 1 abel led.
The sample is kept deep frozen until analysis.
c) Bivalves
MytiLus eduLis should be collected at appropriate
coastal sampling sites at a depth of 2-5 rn in
October/November. In the northern Baltic Proper and the
Gulf of Bothnia, samples may be taken down to a depth
of 15 rn.
As both growth rate (size/age relationship) and
dominant size within populations vary greatly among
locations in the Baltic, it is not practical to specify
overall requirements on these bases.
-121-
Nonetheless, it is important to obtain samples as corn
parable as possible . This can partly be achieved by
choosing similar sized individuals (within 5 rnrn). As a
check of similarity between samples, the Condition
Factor could be calculated in a subsarnple of 10
specimens. The Condition Factor of each My t iLus e duL is in a subsarnple is calculated as
~3 L
where W (in rng ) is the soft body weight and L ( in ern ) is the shell length.
Th~ Condition Factor is largely independent of size and
usually attains values between 3-5 in autumn.
Each sample to be analyzed should contain 25-5 0
individuals ( at least 50 g soft body weight ) .
Sample data parameters and reporting system
See Sections C.I.l.3.e) and C.I.l.S or c.r.l.6 of the
Guidelines for recommendations on this subject.
If sampling is carried out in non-turbid waters, the
cleansing period in sea water can be omitted.
d) Fish
The sampling procedures for each
designed to obtain a sample during
period for the organism in terms of migration. More detailed discussion of the f t ac ors considered can be
species have been
a relatively stable
found in Section C.I.l.3.b) of the Guidelines.
Flounder should be sampled close to the shore to ensure
that they will be representative of the area of catch.
Because the fish start to migrate to deeper waters i n
9 483155T
------~--------------------------------------

-122-
late fall, samples must be collected before that time.
samples of flounder should consist of females in their
third year of life caught in September using a gill
net. The maximum recommended sampling depth is 20 m.
sampled near the coastline in Male pike should
August/September.
be
No
specified because no
other requirements have
correlations for size or
been
age
have been found.
size but not with versus levels of org~nochlorines
Mercury levels correlate only with age (14). This correlation can be calculated and a mean
value and the variance for a standardized weight can be
estimated for comparison between years. Thus, it does
not seem important to select only fish of the same age
class or year class for monitoring mercury or
organochlorines.
Mercury levels have been shown to differ between sexes
in pike of similar size ( 14), and thus only one sex
should be used. The males have been chosen because a
higher proportion of males is generally caught using
gill nets.
Female yellow eel should be sampled in August (July)
near the coastline. As age is difficult to determine,
no standard age requirement can be made, except that
the eels are in the yellow stage. The total length of
the fish should be 40-50 em.
To avoid the direct influence of river inputs of conta
minants and to get more regionally representative data,
the fish should be caught at some distance from river
mouths.
For all the three species, a sample should consist of
at least 2 0 specimens from the same site. The same
number of specimens should be collected each year.
- ) 23-
Specimen data requirements and repor t ing system
The overall recommendations
found in Sections C.I.l.3.d )
the Guidelines. All of the
on t his subject can be
and C.I.l.S or C.I.l.6 of
information requested in
Section C. I .1. 3. d ) should be obtained for samples of
the three species discussed here, with the following
exceptions. Information on the maturity of gonads
should be recorded for flounder, but not for pike and
eel. Age need not be determined for eel and pike; for
flounder, however, the age should be determined and re
corded according to the number of otolith annual rings.
e) Birds
Birds should be sampled from only one area or
population for each bird species. A total sample should
include ten birds per species, each bird collected from
a different nest or duckling brood.
Fledgling birds should be collect ed just before they
learn to fly. Because of the rapid growth rate during
this period of the bird's life, it is important that
the birds collected are at the same age in days for
each year of sampling.
When collecting the birds, the main types of food for
that species and area should be identified, as within a
species the birds may have different feeding habits in
the different parts of the Baltic.
Ten undeveloped eggs of the alcids shall be collected
in the beginning of May. The female normally produce
only one egg. If the egg is collected in the beginn jnq
of the nesting season, the egg will be replac~d by t llr
female with a new one l

-124-
The eggshell shall be saved after drying at room
temperature. Measurements of eggshell thickness shall
be carried out in order to monitor the quality of the
eggshell.
Young merganser leave the nest just after hatching and
follow the mother in the gathering of food. When the
ducklings are essentially fully grown in August, they
will begin to fly. They should be collected just before
that, with only one bird taken per brood.
Arctic terns remain in their nesting colonies until the
time comes for them to learn to fly. Thus, they should
be collected from their colonies (one per nest) just
before they are ready to leave them.
Productivity (number of eggs
fledglings) and population size
be followed by field work in
during the reproductive season.
and production
(number of birds)
the investigated
of
can
area
A sample information sheet should be filled out with
information on sampling area, main sources of food and
other relevant information (similar to Table C. 3. in
Section c. I.) •
Specimen data requirements and reporting system
After collection, the bird should be grasped just under
the base of the wing and, using the forefinger and the
thumb, it should be squeezed until the heart is
stopped. For each bird, the total body weight in grams
should be recorded and the age should be estimated in
number of days. The size should be estimated by
measuring the wing length from the carpal joint to the
tip of the longest feather. This measurement should be
made on a flattened wing. Thereafter, each whole bird
should be placed in a polyethylene bag. The air should
-125-
be squeezed out and the bag sealed and labelled. The
birds should be deep frozen as soon as possible there
after and should remain frozen until they are prepared for analysis.
Each bird should be assigned a specimen identification
number and the relevant information concerning it
should be recorded on a Bird Specimen Data Form.
Upon dissection, the liver and kidneys should be
completely and carefully removed and weighed.
3. Sub,sainplihg and handling
a) Tool handling during dissection and subsampling
The tools
C.I.l.3.g) and procedures described in Section
of the Guidelines should be carefully observed to avoid contamination of the samples during preparation for analysis.
b) Subsampling procedures
Macroalgae
Prior to analysis, the algae sample is homogenized .
Subsamples are taken for dry weight and heavy metal determinations.
Bivalves
The procedures for initial handling of a bivalve
mollusc have ~een described in Section c.r.l.3.e) of
the Guid~lines. An appropriate sample size ·should be
chosen so that at le,ast duplicate analyses for heavy
·metals, organochlorines and duplicate dry weight and
lipid (in case of organochlorines) determinations can be carried out.

4.
-126-
Fish
A description of the preparation of fish tissue samples
is contained in Section C.I.l.3.g) of the Guidelines.
Birds
working with a partly thawed specimen, the pectoral
muscle of the fledgling birds should be sampled from
under the subcutaneous fat layer. The right pectoral
muscle should be used. For every fifth bird, a dupli
cate sample should be taken using the left pectoral
muscle.
The liver should be removed carefully and completely
for use in copper, zinc and lead analyses. As the
kidneys of a bird are easy to obtain, they should be
carefully removed for cadmium analysis.
Bird eggs shall be blown after drilling a hole at the
equator of the egg. Only undeveloped ·eggs can be blown.
The soft egg material shall then be homogenized.
References in chapter C II (Trend Monitoring of Contaminants in the Coastal Zone)
1.
2.
3.
Bryan, G. W. 19 7 6. Heavy metal contamination in the sea. In: Marine Pollution (R. Johnston (Ed.)), pp-.-185-302, Academic Press, London & NY.
Riisgard, H. u. & P. B. Famme. 1988. Distribution and mobility of organic and inorganic mercury in flounder, Platichthys flesus, from a chronically polluted area. Toxicol. Environ . Chern., 16, 219-228.
Phillips, D. J. H. 1980. Biological Indicators. London 488 p.
Quantitative Aquatic Applied Sci. Pub.
-1-27-
4. Florence, T. M. & G. E. Batley. 1980. Chemical speciation in natural waters. CRC Critical Reviews in Analytical Chemistry 9: 219-296.
5. Jarvekulg, A. 1979. Dannaj Fauna Vostochnoi Chasti Baltiiskogo Morj. Tallinn, Valgys, 382 pp .
6. Dare, P. J. & D. B. Edwards. 1975. Seasonal changes in flesh weight and biochemical composition of mussel (Mytilus edulis L. ) in the Conway Estuary, North Wales. J. Exp. Mar . Biol. Ecol. 18: 89-97.
7. Kiorboe, T., Mohlenberg, F. & H. u. Riisgard. 1983. Mercury levels in fish, invertebrates and sediment in a recently recorded polluted area (Nissum Broad, Western Limfjord, Denmark). Mar. Pollut. Bull. 14: 21-24.
8· ·~ Neuman, E. 19 82. Species composition and seasonal migrations of the coastal fish and fauna in t~e southern Bothnian sea. In: Monographic B~ologice 45 (Ed. K. Muller) pp. 317-353, Dr. W. Junk Pub. The Hague.
9. Edgren, M., Olsson, M. & L. Reutergardh. 1981. A one year study of the seasonal variations of DDT and PCB levels in fish from heated and unheated areas near a nuclear power plant. Chemosphere 10: 447-452.
10. Grimas, u. Personal comm.
11.
12.
Olsson, M. & L. Reutergardh . 1986. DDT and PCB pollution trends in the Swedish a quat ic environment. AMBIO 15: 103-109.
Andersson, A., Odsjo, T. & M. Olsson. Breeding success of razorbi ll in Archipelago of Stockholm in relation eggshell thickness and levels of DDT, PCB mercury in eggs. SNV PM 30.
19 74 . the to
and
13. Hedgren, s. 1980. Reproduct ive success of Guillemots Uria aalge on the island of Stora Karlso. Orn~s Fenn~ca 5 7 : 49-57.
14. Olsson, M. 1975. Mercury levels as a function of size and age in Northern Pike, one and five years .after the mercury ban in Sweden. AMBIO 5: 73 -76.
15. Jensen, A. & Cheng, J. 1989. Determination of organic and total tin in sewater by extraction and graphite furnace atomic absorption spectroscopy. ICES Techniques i n Marine Environmental Sciences No . 8. ( In prep.)

-128-
c. HARMFUL SUBSTANCES IN BIOTA AND SEDIMENTS
C. III Harmful Substances in Sediments
1. Contaminants in sediments
A critical assessment of data on contaminants in
sediments from the Baltic Sea is presently being
conducted by ICES for the Helsinki Commission. Although
this work has not yet been completed, the preliminary
conclusion is that monitoring of contaminant
concentrations in sediments in the open areas of the
Baltic Sea need only be conducted at a frequency of
once every five, or possibly even ten, years depending
on the sedimentation rate and other characteristics of
the specific areas to be monitored. However, for
certain substances, particularly phosphorus, there may
be a requirement for more frequent monitoring, at least
in certain areas. Detailed proposals for moni taring
contaminants in sediments will be prepared by ICES
after the critical assessment of sediment data in the
Baltic Sea, and other relevant information, have been
completed and evaluated.
~J 29-
2. Reporting format for contaminants in sediments
International Council for the Exploration of the Sea
INTERIH REPORTING FORHAT FOR CONTAHINANTS IN SEOIHENTS
June 1987

International Council for the Exploration of the Sea
-130-
June 1987
INTERIM REPORTING FORMAT FOR CONTAMINANTS IN SEDIMENTS
(VERSION 1, DRAFT 2)
1. INTRODUCTION
This Interim Reporting Format for Contaminants in Sediments has been drafted on the basis of the present requirements of monitoring programmes for contaminants, primarily trace metals, in sediments.
2. OVERVIEW OF THE SYSTEM
Four types of forms have been included in the system: a Sediment Sampling Methods Form, a Sediment Analytical Methods Form, a sediment Contaminant Master Form, and a Sediment Contaminant Data Form.
The Sediment Sampling Methods Form records information on the type of sediment sampler used, the method of sample storage or preservation, the method of grain size analysis, and the m~thod of structural analysis of a sediment core. The number of Sed1ment sampling Methods Forms to be filled in will depend on the number of combinations of methods used.
The Sediment Analytical Methods Form records information on the method of dissolution or extraction used on a sediment sample and the method of analysis for a particular contaminant by the analytical laboratory involved for the year concerned. A series of these forms should be filled in and should precede the first Master form; they should describe the methods associated with any contaminant subsequently reported. One form will need to be filled out for each contaminant according to the method of extraction or dissolution of the sediment used. Thus, the number of forms will depend on the number of contaminant-extraction combinations used in the data series being reported. Each contaminant analysis reported later on the Sediment Contaminant Data Forms is unambiguously associated with a specific Sediment Analytical Methods Form by means of a Method Identifier code.
The Sediment Contaminant Master Form serves as the master record for the series of data obtained at one sampling station on one sampling occasion. This form provides general information on when and where the sample was obtained.
The Sediment Contaminant Data Form provides the record for the data on the sediment samples obtained. The initial parameter to be recorded is the sediment grain size range which has been analyzed, after which is recorded the depth of the core slice analyzed. Thereafter, the concentrations of. all parame~ers determined can be recorded, linked w1th the Sed1ment AnalytLcal Methods Form by the Analytical Method Identifier Code. This form is very flexible, providing the opportunity to record data on any contaminant or parameter measured in a grab sample or at all depths in a sediment core.
2 -131-
Positions have been provided on all forms for comments and additional information. These positions should be used for information which will assist in the interpretation of the data thus ~aking.the data more valuable for future use. one example i~ the 1nclus1on of information on methods which have been changed from previous years.
It 1s intended that all types of relevant data be reported on these forms. If codes for any items are missing, they can be developed on request to the ICES Environment Officer.
3. DETAILED DESCRIPTION
3. 1 General
The following description applies to all forms. The page number should be inserted in the upper left-hand corner of each page. on the first page of the series, i.e., on the first Sediment Sampling Methods Form, the total number of pages of forms ass?ciated with the series should be included.
3.2 Sediment Sampling Methods Form
A Sediment Sampling Methods Form is filled in for each combination of the type of sediment sampler used, method of sample storage used, method of grain size analysis used and method of structural analysis of the core used. The Sampling Method Identifier Code from the appropriate Sediment Sampling Methods Form is inserted on the Sediment Contaminant Master Form as a reference for the sampling methods used for that sample.
The Sediment Sampling Methods Form should be filled in according to the following description.
1. Form identifier code
2. Country
3. Year
4. Reporting Laboratory
5. Analytical Laboratory
Code Description
The code "S" identifies the Sediment Sampling Methods Form.
Insert the roc Country code (see Annex 2), the same information appears on the Sediment Master Form.
Insert the last two digits of the sampling year.
Insert the four-letter mnemonic code (see Annex 1) for the laboratory reporting the data, the same information appears on the Sediment Master Form.
Insert the four-letter mnemonic code (see Annex 1) for the analytical laboratory concerned.

6. sampling method identifier
7. Type of sampler
8. Method of storage/ sample preservation
9. Method of grain size analysis
10. Method of structural analysis
11. Comments
-132-
Insert a method identifier code for the combination of methods described on this form. It is suggested that a code "1' is given for the first Sampling Methods form for each type of sampler, then 11 2 11
, "3", etc., for additional forms, if more than one combination of type of sampler with other methods given on this form is used. This item links the method information which follows with the sample taken in the Sediment Contaminant Master, and the code should be inserted in item 14 of this Master Form.
Insert code according to the code list given in Annex 6.
Insert code for method of sample storage or sample preservation. Each laboratory should maintain detailed records of the methods used and should assign: a code number for each of these methods.
Insert code for method of grain size analysis. Each laboratory should maintain detailed records of the methods used and should assign a code number for each of these methods.
Insert code for method of structural analysis of cores. Each laboratory should maintain detailed records of the methods used and should assign a code number for each of these methods.
Plain language comments can be inserted as needed.
3.3 sediment Analytical Methods Form
The Sediment Analytical Methods Form should be used to record all details of the methods used in the extraction or dissolution ~f the sediment and the analysis of a particular contam1nant. Th1s removes the need to duplicate this information repeatedly on other forms where data for the same contaminant/extraction method are included. Thus, a series of these forms is filled in, pr~ceding the first Sediment Contaminant Master, to cover all comblnations of methods used by a particular laboratory in that year. The methods forms can therefore be referred to repeatedly from the Sediment Contaminant Data Forms.
-133-
Often it will only be necessary to fill in one Sediment Analytical Methods Form for each contaminant reported. If more than one method description applies to any one contaminant, then additlonal methods forms should be filled in for that contaminant e~ch with a different Analytical Methods Identifier (see descrip~ t1on of Method Identifiers on page 6). If analysis of a contaminant is carried out by more than one analytical laboratory, the appropr1ate number of methods forms should be filled in for each laboratory.
It should be noted that the sampling and analytical methods are descr1bed on these two forms by means of codes which should be l1nked to a full description of the details, including types of equ1pme~t~ th~t i~ retained in the laboratory. If the laboratory 1s part1c1pat1ng 1n the Joint Monitoring Programme, these details should also be sent to the Secretariat of the Oslo and Paris Commissions.
The Sediment Analytical Methods Form should be filled in as follows.
1. Form identifier code
2. Country
3. Year
4. Reporting Laboratory
5. Analytical Laboratory
6. Parameter/Contaminant code
7, Analytical method identifier
Code Description
The code "A' identifies the Sediment Analytical Methods Form.
Insert the roc Country code (see Annex 2), the same information appears on the Sediment Master Form.
Insert the last two digits of the sampling year.
Insert the four-letter mnemonic code (see Annex 1) for the laboratory reporting the data, the same information appears on the Sediment Master Form.
Insert the four-letter mnemonic code (see Annex 1) for the analytical laboratory concerned.
Insert the code for the parameter/contaminant for which the methods data apply, according to the codes given in Annex 4.
Insert a method identifier code for the combination of methods described on this form. It is suggested that a code '1' is given for the first Methods Form for each contaminant, then '2', '3' etc. for additional forms, if more than one combination of methods has been used for that contaminant. This item links the

-134-
8. Method of extraction/ condition when extracted
9. Method of analysis of parameter/ contaminant
10. Limit of detection of parameter/ contaminant
11. I/C (intercalibration)
12. Comments
method information which follows with any analysis (of the contaminant identified in item 6 by the laboratory identified in item 5) for which this Identifier code is reported on a Sediment Contaminant Data Form (item7).
Insert code for the method of sediment extraction, using the appropriate code for the general method (see Annex 5) in the first three columns and a code for the individual laboratory version of this method, assigned by the data originator, in the fourth column. Each laboratory should maintain detailed records of the methods used and should assign a code number for each of these methods. An additional column for reporting the condition of the sample when extracted should be filled in according to the codes in Annex 5'
Insert a 3-digit code for the method used to analyse the contaminant. Each laboratory submitting data should maintain detailed records of the methods used to analyse the contaminants and should assign a 3-digit code number for each of these methods. The appropriate code should be inserted here.
Right justified, zero filled. Insert the detection limit for the method of analysis used to determine the contaminant reported in the units appropriate to that contaminant (see Annex 4). The limit of detection is defined here as that concentration of analyte which yields an analytical response equal to three times the standard deviation of the complete procedural blank.
Insert a 2-digit code for the relevant intercalibration exercise in which the laboratory has most recently participated, according to the list in Annex 3.
Plain language comments can be inserted as needed. such com-
-135-
ments can include information of relevance to the interpretation of the methods used, description of an intercalibration exercise, etc.
3.4 Sediment Contaminant Master Form
One Sediment pling station Form should description.
Contaminant Master is filled in for each samor area on each sampling occasion. The Master
be filled in according to the following
PART I
1. Form identifier code
2. Sampling country
3. Sequence number or core number
4. sampling date
5, Sampling time
6. Sampling area coordinates
Code Description
The code Sediment Form.
'M' identifies the Contaminant Master
Insert .the roc country Code (see Annex 2).
Insert the number of the Master Form being filled in beginning with 0001 for the first Master form in a year, 0002 for the second, etc.
Indicate the year (last two digits only), month, and date of sampling. (The day may be omitted, if desired, and the applicable columns filled with zeroes.)
Insert the time 'at which sampling commenced (optional parameter to permit correspondence with the Hydrographic Data Format).
Insert coordinates of sampling area, as follows:
the
Note that decimal fractions of minutes are recorded and not seconds.
(1) A samp~e taken Ut the coordinates 59 20.15'N 18 55.3'E would be designated according to the coordinates system as:
(2) A samp&e taken at the coordinates 50 10.5'N 4°30.25'W

-136-
7. Depth of water
8. Total length of core
9. Estimated sedimentation rate
PART II
10. Reporting Laboratory
11. Organization code
12. Sampling area designation (eg. JMP Area (sub-area))
13. Purpose of monitoring
14. Number of Sediment Contaminant Data
would be designated according to the coordinates system as:
Insert the depth of water at the sampling station in meters. If the sampling takes place in an estuary, the water depth should be taken from a sea level map.
If a sediment core has been taken, insert the total depth of the core in centimeters.
If desired, record the estimated sedimentation rate at the area of sampling, in mm/yr.
Insert the four-letter mnemonic code for the laboratory reporting the data (see Annex 1 ) .
Indicate the which data follows:
organization(s) for are submitted, as
I - International Council for the Exploration of the Sea
J - Joint Monitoring Programme of the Oslo and Paris Commissions
B - Baltic Monitoring Programme of the Helsinki commission
If the organization code J has been included in item 11 (above) then insert, left-justified, the code number of the JMP area sampled. If appropriate, insert a sub-area or station number, leaving one blank after the area number.
Indicate purpose of monitoring according to the following code:
0 - No specific purpose 2 - Geographical distribution 3 - Temporal trend determination
Right Insert
justified, number of
zero filled. contaminant
3.5
Forms following this Master
15. Sampling method identifier code
16. Comments
-137-
Data Forms following this Master.
Insert appropriate sampling method identifier code.
Insert plain language comments, as needed.
Sediment Contaminant Data Form
The Sediment Contaminant Data Form records data on the various 'parameters' which are associated with each sample. In this connection, parameters include measurements such as grain size distribution and chemical analyses of sediment constituents as well as information on the portions of the sediment for which the subsequent data are being reported, e.g., gra1n s1ze fraction analyzed and depth of core slice. A list of the parameters, with associated codes and units . . . , 1s g1ven 1n Annex 4. A Sediment Analytical Methods Form should be filled in for all parameters involving chemical or radiochemical measurements.
Each line on the Contaminant Data Form (items 4-8) records data for one 'parameter'. One form can include data for all parameters associated with a sample taken at a particular station. Grain size fraction and, for sediment cores upper and lower core slice depth, are 'key' parameters; all parameters wh1ch follow a particular grain size and core depth record are assumed to be parameters associated with analyses of the portion of the sample of that grain size range (and at that core depth, if applicable). Thus the first record line on a Sediment Contaminant Data Form should contain data on the maximum grain size of this fraction and the second line should contain data on the percentage of the total sediment this fraction comprises. If a grab sample is analyzed, no data need be given on the depth of the sediment sample. If a core is analyzed, the next two lines of data should give the upper and lower depth of the core slice analyzed. Thereafter, all parameters associated with that portion of the sample are reported on the following lines. A new core depth record and/or a new maximum of grain size indicates that subsequent parameter records are associated with analyses of this next portion of sample.
The Sediment Contaminant Data Form should be filled in according to the following description:
1. Year
2. Sequence number (core number)
Code Description
Insert the last two digits of the sampling year, the same as on the Sediment Contaminant Master Form.
10 483155T
Insert the Sequence number (or core number), the same information as on the Sediment Contaminant Master.

3. Form identifier code
4. Parameter/contaminant code
5. Analytical Method Identifier code
6. Qualifier
-138-
The code "C" identifies the ~ediment Contaminant Data Form.
Insert the code for the parameter or contaminant according to the codes given in Annex 4.
If relevant, insert the appropriate Analytical Method Identifier code corresponding to that inserted on the associated Sediment Analytical Methods Form for the methods of extraction and analysis for the contaminant or geochemical parameter reported on this line.
In the first column, whether the value under item 7 should be by:
> - greater than, or < - less than.
indicate reported
qualified
If not, leave blank. When not detected, use < the detection limit in numerical terms.
In the second column, insert a Validation Flag as follows:
Blank unspecified or quality control check has not been made
A - ,Acceptable: ceptable during checks.
data found acquality control
s - auspect Value: data considered suspect (but not replaced) by the data originator on the basis of either quality control checks or recorder/ instrument/platform performance.
Q - Questionable Value: data considered suspect (but not replaced) during quality control checks by persons other than those responsible for its original collection, e.g., a data centre.
R - Replaced Value: erroneous or missing data has been replaced by estimated or interpolated value method by which replacement values have been derived should be described in
7. Parameter value or
Contaminant concentration
9. Analytical Laboratory
10. comments
-139-
plain language records.
M - Missing Value: original data erroneous or missing.
Decimal point justified, blank filled. Insert the parameter value or the concentration of the contaminant as obtained from the analysis of the sediment, in the appropriate units (see Annex 4), using scientific notation. Note - Do not use normalized values. The value should be inserted in the four columns on the left, with the sign and power of ten on the three columns on the right.
Examples:
A grain size of 63 ~m should be written:
A lead concentration of 85.3 mg/kg should be written:
A moisture content of 0.46 (:46%) should be written:
4.6 - 0 1 I " , I I I , I
Insert the four-letter mnemonic code (see Annex 1) for the analytical laboratory. This is a mandatory item and should correspond to the code reported on the Sampling and Analytical Methods Form which contains details of the methods applied.
Plain language comments can be inserted as needed. Such comments can include information relevant to the interpretation of the contaminant values or sample data.
All questions or inquiries concerning this format and its use should be directed to the ICES Environmental Officer, I C E S, Palregade 2, DK-1261 Copenhagen K, Denmark.

-140-
Reporting format for contaminants in sediments
ANNEX 1
LABORATORY CODES FOR THE REPORTING AND ANALYTICAL
LABORATORIES OF THE MONITORING PROGRAMMES - BY COUNTRY
DENMARK HFLD
scss
ICOK
FINLAND IMRF
G.IJ.R AHZL
FRET
BHIR
IGOR
Milj¢styrelsens !.!avforureninqslaboratorium Jregersborg Alle 1B DK-2920 Ch•ulottenlund QENMARK
~tate Chemical .S,upervision ~ervice M¢rkh¢j Bygade 26-H DK-2860 S¢borg DENMARK
Oani5h Isotope ~enter Skelbcekgade 2 DK - 1717 Copenhagen v QENMARK
Institute of Marine Research P.O. Box 33 00931 Hels inki 93 fiNLAND
Arbeithygienisches Ientrum der chemischen Industrie GERMAN DEMOCRATIC REPUBLIC
Forschungsinstitut fur NE-Metalle Freiberg 9200 GERMAN DEMOCRATIC REPUBLIC
~ezirkshygiene-Institut Rostock GERMAN DEMOCRATIC REPUBLIC
Institut ftir Meereskunde Akademie der Wissenschaften de DDR Seestrasse 15 DDR-2530 Rostock-Warnemtinde ~ERMAN ~EMOCRATIC REPUBLIC
F.R.G AHHG
BFRG
BFKG
BFGG
OHIG
NLWG
WGEG
FITG
ISHG
-141-
FEDERAL REPUBLIC OF GERMANY
aundesforschungsanstalt fur rischerei Laboratory fur Radiookologie
der ~ewasser Wustland 2, 2000 Hamburg 55 FEDERAL REPUBLIC OF GERMANY
aundesforschungsanstalt fur rischerei Institut fur Kusten- und
ainnenfischerei Palmaille 9 2000 Hamburg 50 FEDERAL REPUBLIC OF GERMANY
auNDESANSTALT fOR ~EWAESSERKUNDE Kaiserin-Augusta-Anlagen 15-17 0-5400 Koblenz FEDERAL REPUBLIC OF ~ERMANY
Qeutsches ffydrographisches Institut Bernhard-Nocht-Strasse 78 D-2000 Hamburg 50 FEDERAL REPUBLIC 'OF QERMANY
liiedersaechsisches 1andesamt fuer ~asserwirtschaft
An der Scharlake 39 D - 3200 Hildesheim FEDERAL REPUBLIC OF QERMANY
~asserguetestelle glbe Focksweg 32 a 0 - 2103 Hamburg 95 FEDERAL REPUBLIC OF QERMANY
rresenius Institut Chemische und Biologische Laboratorien GmbH D-6204 Taunusstein-Neuhof FEDERAL REPUBLIC OF QERMANY
Institute lichumacher Laboratorium fur wasser- , Abwasser-
und blanalytik Dr. Harald Schumacher (Dipl. Chem.) Sophie-Dethleffs-Str. 4 D-2240 ffeide FEDERAL REPUBLIC OF QERMANY

LWKG
VUCG
POLAND IMWP
VHRP
SFIP
IIAP
SWEDEN HRFS
liCKS
MNHS
-142-
1andesamt fur ~asserhaushalt und Kusten
Saarbruckenstraae 38 D-2300 Kiel 1 FEDERAL REPUBLIC OF ~ERMANY
~eterinaruntersuchungsamt cuxhaven Schleusenstraae D-2190 ~uxhaven FEDERAL REPUBLIC OF 9.ERMANY
Institute of Meteorology and ~ater Management
Wazingtona 42 81-342 Gdynia £OLAND
~eterinary Hygiene Research Station Gdansk !'_OLAND
2ea fisheries Institute Aleja Zjednoczenia 1 81··345 Gdynia £OLAND
Institute of Ichthyology ~griculture Academy Szczecin £OLAND
Institute of Hydrographic Research National Board of. l'..i.sheries
Box 2566 403 17 Goteborg ~WED EN
llniversity kollege of Kalmar Inst. Natural Sciences and Technology Box 905 S··391 29 Kalmar li.WEDEN
Miljogiftsovervakning PMK Naturhistoriska riksmuseet Box 50007 S-104 05 Stockholm S.WEDEN
NSJ.S
NWLS
I.CRS
SERI
IAMK
SLKS
USSR DBST
ASLR
-143-
National Swedish Environment Protection Board
tlaturvardsverkets ;ipecial Analytical !,aboratory
Box 1302 S-171 25 Solna S.WEDHN
National Swedish Environment Protection Board
NaturvArdsverkets ~ater Quality 1aboratory
S-75008 Uppsala !?_WED EN
Swedish Environment Protection Board 1aboratory for Coastal Research S-170 11 Drottnlngholm S.WEDEN
S.wedish Environmental Research Institute
Sten Sturegatan 42 Box 5207 S-402 24 Gothenburg SWEDEN
Institutionen for ~nalytisk och marin kemi
Chalmers tekn.i ska hogskola S-412 96 Gothenburg SWEDEN
AB ~vensk 1aboratoriet (SWELAB) Box 903 S-391 29 Kalmar ;!WED EN
Qepartment of the aaltic ~ea Academy of Sciences Paldiski Street 1 200031 I all inn USSR
~cademy of ;!ciences of 1atvian SSR Institute of Biology Riga 229021 USSR

-144-
Reporting format for contaminants in sediments
ANNEX 2
IOC COUNTRY CODES FOR BMP MEMBER COUNTRIES
COUNTRY CODE
Denmark 26
Finland 34
German Democratic Republic 96
Germany, Federal Republic of 06
Poland 67
Sweden 77
Union of Soviet Socialist Republics 90
CODE
7A
7B
7C
7D
7E
7Z
-145-
Reporting format for contaminants in sediments
ANNEX 3
CODE LIST FOR INTERCALIBRATION EXERCISES ON CONTAMINANTS IN SEDIMENTS
INTERCALIBRATION EXERCISE
First JMG intercalibration exercise on trace metals in marine sediments - 1980
Second JMG intercalibration exercise on trace metals in marine sediments - 1983
Baltic Sediment Intercalibration Exercise 1983
Part A
Baltic Sediment Intercalibration Exercise - Part B -1984
ICES First Intercalibration Exercise on Trace Metals in Marine Sediments (1/TM/MS) - 1984
Other Intercomparison/Intercalibration Exercise on Trace Metals in Sediments - Describe in comments .
- o-o-o-o-
8A JMG Intercalibration on Analyses of PCBs in Sediments -1987
8Z Other Intercomparison/Intercalibration Exercise on Organochlorines in Sediments - Describe in comments.
11 4831 55T

-146--147-
Reporting format for contaminants in sediments ~NNEX 4 - continued
ANNEX 4
CODE LIST FOR PARAMETERS/CONTAMINANTS Redox potential REDOX mv no no
PARAMEIERLCONTAMINANT METHODS FORM MANADATORY REQUIRED FIELD
NAME CODE UNITS
Total Nitrogen NTOT gfg yes no Total Phosphorus PTOT g/g yes Calcium carbonate no
CAC03 g/g yes no Inorganic carbon CINOR g/g yes no Organic carbon CORG gjg yes no Loss on ignition LOIGN g/g yes no
Grain size, maximum GSMAX ~rn no yes Amount in grain size GSAMT none no yes fraction
Cesium-137 CS137 mBq/g yes no Lead-210 PB210 mBq/g yes (unsupported) no
Moisture content MOCON none no yes
Core slice depth from surface, upper SDEPU em no yes
Plutonium-239 PU239 mBq/g yes no Plutonium-240 PU240 mBq/g yes no Radium-226 RA226 mBq/g yes no Thorium-23.4 TH234 mBq/g yes no (unsupported) lower SDEPL ern no yes
Replicate number REPLN no no
Aluminium AL g/g yes no Arsenic AS g(g yes no Cadmium CD gjg yes JMP Chromium CR gjg yes no Cobalt co gjg yes no Copper cu gjg yes JMP Iron FE gjg yes no Lithium LI gjg yes no Mercury HG gjg yes JMP Manganese MN gjg yes no Nickel NI gjg yes no Lead PB gjg yes JMP Scandium sc gjg yes no Titanium TI gjg yes no Vanadium VA gjg yes no Zinc ZN g/g yes JMP
Lindane h-HCH) HCHG gjg yes (JMP) Polychlorinated PCB gjg yes (JMP)
biphenyls Chlorobiphenyl CB28 gjg yes (JMP)
congeners (CBs) CB52 gjg yes (JMP) (by IUPAC numbers) CB101 gjg yes (JMP)
CB118 gjg yes (JMP) CB138 gjg yes (JMP) CB153 gjg yes (JMP) CB180 gjg yes (JMP)
Sum of these CBs PCB7 gjg yes (JMP)
Hexachlorobenzene HCB gjg yes no
. . . . continued ....

-148-
Reporting format for contaminants in sediments
ANNEX 5
CODE LIST FOR METHODS OF SEDIMENT EXTRACTION
The following codes should be used in condition when extracted' item on the (item 8).
reporting the 'Method of extraction I Sediment Analytical Methods form,
The field for this item has the following format:
Defined method code (3 character code, see list below)
I I I I
~ u L code for condition of
sediment when extracted (overpage)
Fourth character of method code to be assigned by laboratory to refer to details of their particular variant of the defined method.
SEDIMENT EXTRACTION METHOD CODE
a) inorganic contaminants
HCL
HAC
HNO
AQR
SAD
HFO
HFC
HFB
DESCRIPTION
Extraction with dilute HCl.
Extraction with acetic acid.
Extraction with 1 : 1 HN03
.
Extraction with 'aqua regia' (HN03
/HCl = 1 : 3) .
Extraction with mixture of strong mineral acids without HF (e.g. HClo4 and/or H2so4 in addition to HN0
3).
11 Totaln HF, in before
digestion with mineral acids including open vessels, evaporation of excess HF analysis.
as HFO above, but with digestion performed in closed vessels (pressurized decomposition).
as HFC above, but with complexation of excess HF with H
3so
3.
ALK Alkaline fusion digestion.
SCE Selective chemical extraction of metal species in particulate phases (e.g. by hydroxylamine, oxalate, H7o2, dithionite, ammonium acetate), define proceaure used in comments .
. . . continued
SEDIMENT EXTRACTION METHOD CODE
b) organic contaminants
EXP
EXN
EXC
EXH
EXO
CODE FOR CONDITION OF SEDIMENT WHEN
EXTRACTED
1 2 3
-149-
DESCRIPTION
Extraction of (organic) contaminants by shaking with polar solvents. Extraction of (organic) contaminants by shaking with non-polar solvents. Extraction of (organic) contaminants by
continuous treatment in a Soxhlet or similar apparatus.
Separation of (organic) contaminants from sediment slurries using water steam distillation.
Other principles of extraction/separation of (organic) contaminants from sediment samples, define procedure used in comments.
DESCRIPTION
Oven dried. Freeze dried. Fresh material.

-150-
Reporting format for contaminants in sediments
ANNEX 6
CODE LIST FOR TYPES OF SEDIMENT SAMPLER
The following codes should be used in reporting the 'Type of sampler' item on the Sediment sampling Methods form, (item 7).
The field for this item has the following format:
Sampler code
SAMPLER CODE
GS BC GC vc DC DD OS
u_j I I I
_j l__ diameter of device if appropriate
DESCRIPTION
Grab sampler. Box corer. Gravity corer. Vibro-corer. Diver operated corer. Drilling device.
in mm
Other sampling device: define in comments.
-151-
INTERIH REPORTING FORHAT FOR CONTAMINANTS IN SEDIMENTS VERSION 1 (DRAFT 21
SEDIHENT SAMPLING HETHDDS FORH
1. Form identifier code
2. Country
3. Year
4. Reporting Laboratory
5. Analytical Laboratory
6. Sampling method identifier
7. Type of sampler I diameter (mm)
8. Method of storage/sample preservation
9. Method of grain size analysis
10. Method of structural analysis
LLJ
LLJ
l I I
11. Comments --------------------------

-152-
Page __ of __ pages
INTERIM REPORTING FORMAT FOR CONTAMINANTS IN SEDIMENTS VERSION 1 (DRAFT 21
SEDIMENT ANALYTICAL METHODS FORM
1. Form identifier code
2. Country
3. Year
4. Reporting Laboratory
5. Analytical Laboratory
6. Parameter/Contaminant code
7. Analytical method identifier
8. Method of extraction 1 condition when extracted
9. Method of analysis of parameter/contaminant
10. Limit of detection of parameter/contaminant
11. Intercalibration exercise
12. Comments
u
-153-
INTERIM REPORTING FORMAT FOR CONTAMINANTS IN SEDIMENTS VERSION 1 CDRAFT 21
SEDIMENT CONTAMINANT MASTER
PART I
1. Form identifier code
2. Country l...L.J
3. Sequence number (core number)
4. Sampling date I I
Y Y M M D D
5. Sampling time
6. S~rnpling area coordinates I I 0 0 E/W
7. Depth of water (rn)
8. Total length of core (ern)
9. Estimated sedimentation rate (rnrn yr- 1)
PART II
10. Reporting Laboratory I I I I I
11. Organization uuu
12. Sampling area designation (eg. JMP area) I I I ! l
13. Purpose of monitoring
14. Sampling method identifier code
15. Number of sample data forms following this master
16. Comments

-154-
INTERIM REPORTING FORMAT FOR CONTAMINANTS IN SEDIMENTS VERSION 1 CORAFT 21
SEDIMENT CONTAMINANT DATA FORM
1 . Year 2. Sequence/Core number 3. Form identifier code
4 5 6 7 8
~.-1 _,I__.__JI I I ._1 -'-1 __J._._..;I I I ._I ...l.l _,__I Ll _L_J..J_I ._1 -'-1 _,__I I I .__I _._I ~I I I ~.-1 _,l'--'-_1 I I '-1 _,l'--'-_1 I I ._1 -'-1 _.__I I I ._I -'-1 ___,__I I I ._1 -'-1 _,__I I I c_l ...._1 -'-'I I I ._I ~~~~I I I ._I ~~~~I I I ._I ~1_.___,1 I I ._I ~1_.___,1 I I '-1 _,1_,___,1 I I 1-l _.1_,___,1 I I c_l ...._1 _.__,I I I ._I ~~~~I I I ._I ~~~_JI I I ._I _,I~_JI I I ~...1 _.l_.___,l I I ~...1 _,I_.__JI I I c_l ...._1 _.__,I I I ._I ~~~~I I I '-I _,1~__,1 I I ._I _._I _.___.1 I I ~...1 _,I_..__JI I I '-1 -'-1 -'---'1 I I ~.-1 _,1_..__,1 I I
~_.__.,___, I I I I I l-..L-'--'' ..J I I I I I '--'-'--'---'1 I I II I ~_.._-'-:!! I I I I '--'-'--'--'1 I I I I I
4. Parameter/contaminant code 5. Analytical method identifier code 6. Qualifier 7. Parameter/contaminant value (using scientific notation) 8. Analytical Laboratory 9. Comments
LLJ I I
No. 1
No. 2
No. 3
No. 4
No. SA
No. SB
No. 6
No. 7
No. 8
BALTIC SEA ENVIRONMENT PROCEEDINGS
JOINT ACTIVITIES OF THE BALTIC SEA STATES WITHIN THE FRAMEWORK OF THE CONVENTION ON THE PROTECTION OF THE MARINE ENVIRONMENT OF THE BALTIC SEA AREA 1974-1978 (1979)*
REPORT OF THE INTERIM COMMISSION ( IC) TO THE BALTIC MARINE ENVIRONMENT PROTECTION COMMISSION (1981)
ACTIVITIES OF THE COMMISSION 1980 - Report on the activities of the Baltic Marine Envi
ronment Protection Commission during 1980 - HELCOM Recommendations passed during 1980 (1981)
BALTIC MARINE ENVIRONMENT BIBLIOGRAPHY 1970-1979 (1981)
ASSESSMENT OF THE EFFECTS OF POLLUTION ON THE NATURAL RESOURCES OF THE BALTIC SEA, 1980 PART A-1: OVERALL CONCLUSIONS (1981)*
ASSESSMENT OF THE EFFECTS OF POLLUTION ON THE NATURAL RESOURCES OF THE BALTIC SEA, 1980 PART A-1: OVERALL CONCLUSIONS PART A-2: SUMMARY OF RESULTS PART B: SCIENTIFIC MATERIAL (1981)
WORKSHOP ON THE ANALYSIS OF HYDROCARBONS IN SEAWATER Institut fur Meereskunde an der Universitat Kiel, Department of Marine Chemistry, March 23 - April 3, 1981 (1982)
ACTIVITIES OF THE COMMISSION 1981 - Report of the activities of the Baltic Marine Envi
ronment Protection Commission during 1981 including the Third Meeting of the Commission held in Helsinki 16-19 February 1982
- HELCOM Recommendations passed during 1981 and 1982 (1982)
ACTIVITIES OF THE COMMISSION 1982 - Report of the activities of the Baltic Marine Envi
ronmen~ Protection Commission during 1982 including the Fourth Meeting of the Commission held in Helsinki 1-3 February 1983
- HELCOM Recomm~ndations passed during 1982 and 1983 (1983)
----------------* out of print

No. 9
No. 10
No. 11
No. 12
No. 13
No. 14
No. 15
No. 16
No. 17A
No. 17B
SECOND BIOLOGICAL INTERCALIBRATION WORKSHOP Marine Pollution Laboratory and Marine Division of the National Agency of Environmental Protection, Denmark, August 17-20, 1982, R0nne, Denmark (1983)
TEN YEARS AFTER THE SIGNING OF THE HELSINKI CONVENTION National Statements by the Contracting Parties on the Achievements in Implementing the Goals of the Convention on the Protection of the Marine Environment of the Baltic Sea Area (1984)
STUDIES ON SHIP CASUALTIES IN THE BALTIC SEA 1979-1981 Helsinki University of Technology, Ship Hydrodynamics Laboratory, Otaniemi, Finland P. Tuovinen, v. Kostilainen and A. Hamalainen (1984)
GUIDELINES FOR THE BALTIC MONITORING PROGRAMME FOR THE SECOND STAGE (1984)
ACTIVITIES OF THE COMMISSION 1983 - Report of the activities of the Baltic Marine Envi
ronment Protection Commission during 1983 including the Fifth Meeting of the Commission held in Helsinki 13-16 March 1984
- HELCOM Recommendations passed during 1983 and 1984 (1984)
SEMINAR ON REVIEW OF PROGRESS MADE IN WATER PROTECTION MEASURES 17-21 October 1983, Espoo, Finland (1985)
ACTIVITIES OF THE COMMISSION 1984 - Report on the activities of the Baltic Marine Envi
ronment Protection Commission during 1984 including the Sixth Meeting of the Commission held in Helsinki 12-15 March 1985
- HELCOM Recommendations passed during 1984 and 1985 (1985)
WATER BALANCE OF THE BALTIC SEA A Regional Cooperation Project of the Baltic Sea States; International Summary Report (1986)
FIRST PERIODIC ASSESSMENT OF THE STATE OF THE MARINE ENVIRONMENT OF THE BALTIC SEA AREA, 1980-1985; GENERAL CONCLUSIONS (1986)
FIRST PERIODIC ASSESSMENT OF THE STATE OF THE MARINE ENVIRONMENT OF THE BALTIC SEA AREA, 1980-1985; BACKGROUND DOCUMENT (1987)
No. 18
No. 19
No. 20
No. 21
No. 22
No. 23
No. 24
No. 25
No. 26
ACTIVITIES OF THE COMMIE;n !ON l 'JfF; - Report on the acti vi tic,t: c:r 1 IJc: !l;c;Jt !c Marine Envi
ronment Protection CommiHf41i>ll (iiil i1;r1 1985 including the Seventh Meeting of \.l,r; \'i>iiH\ill:rN.i.on held in Helsinki 11-14 February 1986
- HELCOM Recommendations passed illlr IIHI 1 'I ill'> (1986)*
BALTIC SEA MONITORING SYMPOSIUM Tallinn, USSR, 10-15 March 1986 (1986)
FIRST BALTIC SEA POLLUTION LOAD COMPILATION (1987)*
SEMINAR ON REGULATIONS CONTAINED IN ANNEX I I OF' MAIU'OL 73/78 AND REGULATION 5 OF ANNEX IV OF THE llELSlNl<J CONVENTION National Swedish Administration of Shipping and Navigation; 17-18 November 1986, Norrk6ping, Sweden (1987)
SEMINAR ON OIL POLLUTION QUESTIONS 19-20 November 1986, Norrk6ping, Sweden (1987)
ACTIVITIES OF THE COMMISSION 1986 - Report on the activities of the Baltic Marine Envi
ronment Protection Commission during 1986 including the Eighth Meeting of the Commission held in Helsinki 24-27 February 1987
- HELCOM Recommendations passed during 1987 (1987)*
PROGRESS REPORTS ON CADMIUM, MERCURY, COPPER AND ZINC (1987)
SEMINAR ON WASTEWATER TREATMENT IN URBAN AREAS 7-9 September 1986, Visby, Sweden (1987)
ACTIVITIES OF THE COMMISSION 1987 - Report on the activities of the Baltic Marine Envi
ronment Protection Commission during 1987 including the Ninth Meeting of the Commission held in Helsinki 15-19 February 1988
- HELCOM Recommendations passed during 1988 (1988)
* out of print

Baltic Marine Environment Protection Commission
-Helsinki Commission Mannerheimintie 12 A
SF-00100 Helsinki
ISSN 0357-2994
Helsinki 1988. Government Printing Centre