Vertical distribution and settling of spring phytoplankton in the offshore NW Baltic Sea proper
13
MARINE ECOLOGY PROGRESS SERIES Mar Ecol Prog Ser Vol. 283: 15–27, 2004 Published November 30 INTRODUCTION Spring blooms are conspicuous events in temperate waters. In a few weeks, most of the easily available inorganic nutrients in the upper water column are con- sumed and the phytoplankton biomass produced dis- appears almost as quickly as it appeared. Due to the low biomass of zooplankton in spring and, therefore, low grazing pressure (von Bodungen et al. 1981, Kuparinen et al. 1984, Larsson et al. 1986b), sedimen- tation is thought to be the predominant loss process of spring blooms (Reynolds & Wiseman 1982, Riebesell 1989). This flux of newly produced phytoplankton cells to the sediments is considered the main supply of food to the benthic system in the Baltic Sea (Elmgren 1978). Due to species-specific sedimentation (Passow 1991a, Heiskanen 1998, Tallberg & Heiskanen 1998), the spe- cies composition of the spring phytoplankton bloom influences both the quantity and quality of material settling to the benthos (Passow 1991a, Heiskanen & Kononen 1994, Olli & Heiskanen 1999). Rapidly set- tling diatoms can reach the sediment relatively intact (Davies & Payne 1984) and are, therefore, high quality food for benthic deposit feeders (Òlafsson & Elmgren 1997, Lehtonen & Andersin 1998). With the exception of settling resting cysts (Heiskanen 1993), dinoflagel- © Inter-Research 2004 · www.int-res.com *Corresponding author. Email: [email protected] Vertical distribution and settling of spring phytoplankton in the offshore NW Baltic Sea proper Helena Höglander, Ulf Larsson*, Susanna Hajdu Department of Systems Ecology, Marine and Brackish Water Ecology, Stockholm University, Svante Arrhenius väg 21 A, 106 91 Stockholm, Sweden ABSTRACT: We studied the vertical distribution and settling of dominant diatoms and dinoflagellates during the 1996 spring phytoplankton bloom in the offshore NW Baltic Sea proper. We sampled phytoplankton at 11 depths (to 80 m) and collected settling cells in sediment traps at 25, 50 and 100 m depth, every week from March 26 to May 7. Phytoplankton were counted and sized from both water and trap samples, to estimate the share of phytoplankton in bulk settling carbon. Diatoms, mainly Chaetoceros spp. and Achnanthes taeniata, dominated the early bloom, but were replaced by the dinoflagellates cf. Scrippsiella hangoei and Peridiniella catenata when inorganic nitrogen was de- pleted above the seasonal pycnocline at ca. 10 m depth. By late April, vertically migrating dinoflagel- lates had depleted inorganic nitrogen down to 30 m, well below the seasonal pycnocline. We found clear species-specific sedimentation patterns. Scrippsiella hangoei and Chaetoceros spp., which dominated in the water column, were clearly underrepresented in the traps, while Thalassiosira baltica and T. levanderi, which were sparse in the water column, were overrepresented in sediment traps. Only 4, 3 and 0.5 g C m –2 (or 16, 12 and 2% of phytoplankton primary production) settled as intact phytoplankton cells at 25, 50 and 100 m, respectively, although these numbers may be overes- timated due to migrating P. catenata. The settling bulk carbon was ~3 g C m –2 or 12% of the primary production at all depths. This is low compared to other estimates from coastal waters and suggests additional loss mechanisms, e.g. disintegration in the water column and grazing by zooplankton over- wintering in the permanent halocline area. KEY WORDS: Phytoplankton · Spring bloom · Sedimentation · Diatoms · Dinoflagellates · Vertical distribution · Baltic Sea Resale or republication not permitted without written consent of the publisher
-
Upload
independent -
Category
Documents
-
view
0 -
download
0
Transcript of Vertical distribution and settling of spring phytoplankton in the offshore NW Baltic Sea proper

MARINE ECOLOGY PROGRESS SERIESMar Ecol Prog Ser
Vol. 283: 15–27, 2004 Published November 30
INTRODUCTION
Spring blooms are conspicuous events in temperatewaters. In a few weeks, most of the easily availableinorganic nutrients in the upper water column are con-sumed and the phytoplankton biomass produced dis-appears almost as quickly as it appeared. Due to thelow biomass of zooplankton in spring and, therefore,low grazing pressure (von Bodungen et al. 1981,Kuparinen et al. 1984, Larsson et al. 1986b), sedimen-tation is thought to be the predominant loss process ofspring blooms (Reynolds & Wiseman 1982, Riebesell1989). This flux of newly produced phytoplankton cells
to the sediments is considered the main supply of foodto the benthic system in the Baltic Sea (Elmgren 1978).Due to species-specific sedimentation (Passow 1991a,Heiskanen 1998, Tallberg & Heiskanen 1998), the spe-cies composition of the spring phytoplankton bloominfluences both the quantity and quality of materialsettling to the benthos (Passow 1991a, Heiskanen &Kononen 1994, Olli & Heiskanen 1999). Rapidly set-tling diatoms can reach the sediment relatively intact(Davies & Payne 1984) and are, therefore, high qualityfood for benthic deposit feeders (Òlafsson & Elmgren1997, Lehtonen & Andersin 1998). With the exceptionof settling resting cysts (Heiskanen 1993), dinoflagel-
© Inter-Research 2004 · www.int-res.com*Corresponding author. Email: [email protected]
Vertical distribution and settling of springphytoplankton in the offshore NW Baltic Sea
proper
Helena Höglander, Ulf Larsson*, Susanna Hajdu
Department of Systems Ecology, Marine and Brackish Water Ecology, Stockholm University, Svante Arrhenius väg 21 A,106 91 Stockholm, Sweden
ABSTRACT: We studied the vertical distribution and settling of dominant diatoms and dinoflagellatesduring the 1996 spring phytoplankton bloom in the offshore NW Baltic Sea proper. We sampledphytoplankton at 11 depths (to 80 m) and collected settling cells in sediment traps at 25, 50 and 100 mdepth, every week from March 26 to May 7. Phytoplankton were counted and sized from both waterand trap samples, to estimate the share of phytoplankton in bulk settling carbon. Diatoms, mainlyChaetoceros spp. and Achnanthes taeniata, dominated the early bloom, but were replaced by thedinoflagellates cf. Scrippsiella hangoei and Peridiniella catenata when inorganic nitrogen was de-pleted above the seasonal pycnocline at ca. 10 m depth. By late April, vertically migrating dinoflagel-lates had depleted inorganic nitrogen down to 30 m, well below the seasonal pycnocline. We foundclear species-specific sedimentation patterns. Scrippsiella hangoei and Chaetoceros spp., whichdominated in the water column, were clearly underrepresented in the traps, while Thalassiosirabaltica and T. levanderi, which were sparse in the water column, were overrepresented in sedimenttraps. Only 4, 3 and 0.5 g C m–2 (or 16, 12 and 2% of phytoplankton primary production) settled asintact phytoplankton cells at 25, 50 and 100 m, respectively, although these numbers may be overes-timated due to migrating P. catenata. The settling bulk carbon was ~3 g C m–2 or 12% of the primaryproduction at all depths. This is low compared to other estimates from coastal waters and suggestsadditional loss mechanisms, e.g. disintegration in the water column and grazing by zooplankton over-wintering in the permanent halocline area.
KEY WORDS: Phytoplankton · Spring bloom · Sedimentation · Diatoms · Dinoflagellates · Verticaldistribution · Baltic Sea
Resale or republication not permitted without written consent of the publisher

Mar Ecol Prog Ser 283: 15–27, 2004
lates seem instead to disintegrate in the water columnand settle as unidentifiable detritus (Heiskanen &Kononen 1994, Olli & Heiskanen 1999), or be retainedas suspended particles or dissolved organic matter inthe water column (Heiskanen 1998). Whether diatomsor dinoflagellates dominate the spring bloom may thusgreately influence the input of carbon to the deepwater.
In the Baltic Sea, most studies of particle settling arefrom coastal areas (e.g. Smetacek et al. 1978,Smetacek 1980, Forsskåhl et al. 1982, Larsson et al.1986b, Heiskanen & Kononen 1994), where resus-pended particulate material may bias estimates of fluxas well as of composition of settled material (Blomqvist& Larsson 1994). In the offshore Baltic Sea, flux esti-mates are less likely to be influenced by resuspension,but since few studies are available (Leppänen 1988,Leppänen & Kononen 1988, Passow 1991a, Struck etal. 2004), our understanding of the settling dynamics islimited (Blomqvist & Heiskanen 2001).
Use of particulate organic carbon (POC) and nitro-gen (PON) for measurements of bulk settling material(e.g. Leppänen 1988) mean that both detritus andresuspended material will be included in the flux esti-mates (Horn & Horn 1993). By combining these mea-surements with microscope identification, and count-ing of phytoplankton cells in water column samplesand sediment trap material, it is possible to estimatethe amount of settled newly produced material (Horn &Horn 1993). It is also possible to identify whether car-
bon fluxes are severely biased by migrating speciesentering the traps (Heiskanen 1995, 1998).
This study of the spring phytoplankton bloom in theoffshore Baltic Sea proper aimed to quantify the set-tling flux of carbon and how it was influenced by thespecies composition of the bloom. The study site, theLandsort Deep, is the deepest in the Baltic Sea (459 m)and has a well-studied phytoplankton species compo-sition (Larsson & Hajdu 1997, Hajdu 2002). We quanti-fied the contribution of different species to the springvertical carbon flux using microscopical analysis ofphytoplankton in the water column and in settledmaterial as well as carbon analysis of settled particu-late organic carbon (POC). We focused on the diatomsand dinoflagellates, which dominate the spring phyto-plankton biomass and are easily recognisable in micro-scopic analysis.
MATERIALS AND METHODS
Phytoplankton and sedimentation. We sampled theLandsort Deep station (BY31, 58° 35’ N, 18° 14’ E, depth459 m, Fig. 1) weekly during the 1996 spring bloom(March 26 to May 7). Phytoplankton samples weretaken at 0, 2.5, 5, 10, 20, 30, 40, 50, 60 and 80 m withserial 5 l water samplers (Hydrobios). Subsamples of200 ml were immediately preserved with acetic Lugol’ssolution (0.75 ml Lugol 200 ml–1 seawater). Settlingmaterial was collected in gimbal suspended cylindricalsediment traps (dual cylinders with inner diameter of10.5 cm, height 50 cm, Larsson et al. 1986a) fromMarch 26 to May 21. Before deployment, 2 ml ofchloroform was added as preservative. The traps weremoored at 25, 50 and 100 m depth, 5 n miles east ofBY31 (58° 36’ N, 18° 23’ E, depth 180 m) to reduce theimpact of long anchor lines on the vertical position oftraps exposed to currents. We have no indication ofsystematic differences between the 2 locations thatwould jeopardize comparison of water column andsediment trap data.
One set of traps was emptied weekly from March 26to May 7, and finally on May 21 for counts and identi-fication of settling cells. The April 23 to 30 sample from25 m depth was lost. Upon retrieval, water wassiphoned from the trap cylinders and the remainingsediment with some water was allowed to settleovernight in Imhoff funnels in darkness at 5°C. Theclear supernatant was siphoned off and the remainingaliquot diluted to 199 ml with (filtered) seawater and1 ml acetic Lugol’s solution. Two more sets of trapswere used to collect material for carbon analysis andwere emptied every second week (March 26 to May21). Settling material from the 2 trap cylinders per setwas pooled to obtain enough material for analysis.
16
Fig. 1. Location of the sampling station BY31 (Landsort Deep), NW Baltic Sea proper
Höglander et al.: Setting of Balthic spring phytoplankton
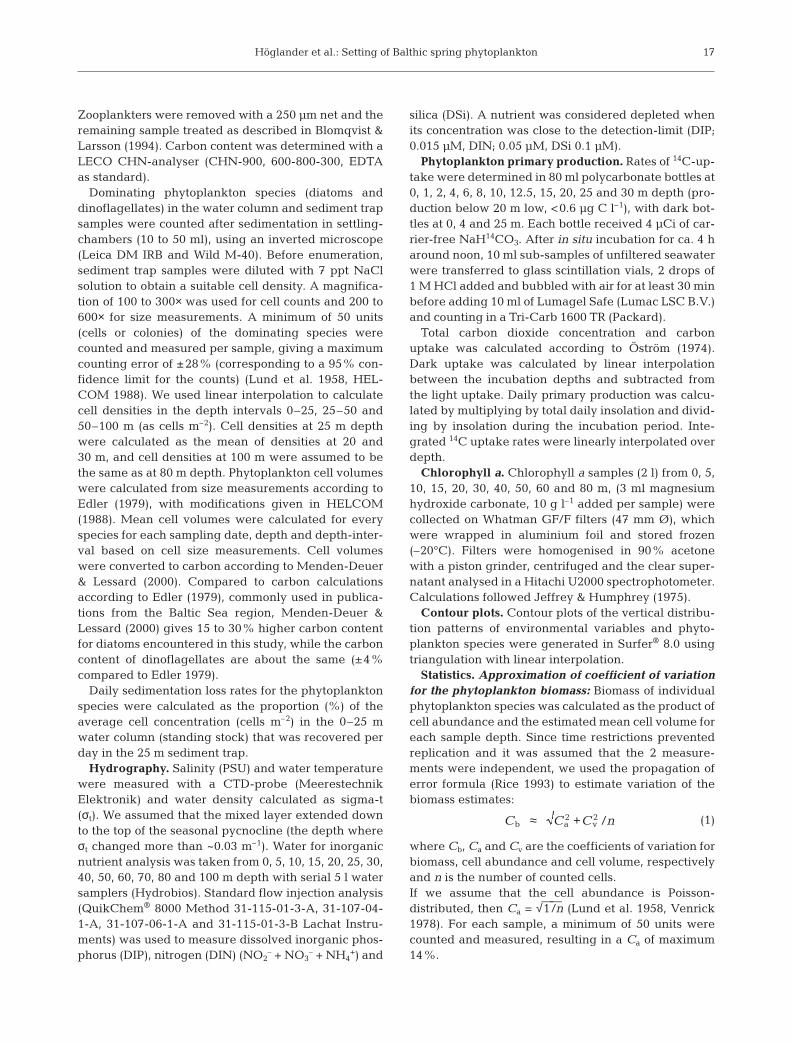
Zooplankters were removed with a 250 µm net and theremaining sample treated as described in Blomqvist &Larsson (1994). Carbon content was determined with aLECO CHN-analyser (CHN-900, 600-800-300, EDTAas standard).
Dominating phytoplankton species (diatoms anddinoflagellates) in the water column and sediment trapsamples were counted after sedimentation in settling-chambers (10 to 50 ml), using an inverted microscope(Leica DM IRB and Wild M-40). Before enumeration,sediment trap samples were diluted with 7 ppt NaClsolution to obtain a suitable cell density. A magnifica-tion of 100 to 300× was used for cell counts and 200 to600× for size measurements. A minimum of 50 units(cells or colonies) of the dominating species werecounted and measured per sample, giving a maximumcounting error of ±28% (corresponding to a 95% con-fidence limit for the counts) (Lund et al. 1958, HEL-COM 1988). We used linear interpolation to calculatecell densities in the depth intervals 0–25, 25–50 and50–100 m (as cells m–2). Cell densities at 25 m depthwere calculated as the mean of densities at 20 and30 m, and cell densities at 100 m were assumed to bethe same as at 80 m depth. Phytoplankton cell volumeswere calculated from size measurements according toEdler (1979), with modifications given in HELCOM(1988). Mean cell volumes were calculated for everyspecies for each sampling date, depth and depth-inter-val based on cell size measurements. Cell volumeswere converted to carbon according to Menden-Deuer& Lessard (2000). Compared to carbon calculationsaccording to Edler (1979), commonly used in publica-tions from the Baltic Sea region, Menden-Deuer &Lessard (2000) gives 15 to 30% higher carbon contentfor diatoms encountered in this study, while the carboncontent of dinoflagellates are about the same (±4%compared to Edler 1979).
Daily sedimentation loss rates for the phytoplanktonspecies were calculated as the proportion (%) of theaverage cell concentration (cells m–2) in the 0–25 mwater column (standing stock) that was recovered perday in the 25 m sediment trap.
Hydrography. Salinity (PSU) and water temperaturewere measured with a CTD-probe (MeerestechnikElektronik) and water density calculated as sigma-t(σt). We assumed that the mixed layer extended downto the top of the seasonal pycnocline (the depth whereσt changed more than ~0.03 m–1). Water for inorganicnutrient analysis was taken from 0, 5, 10, 15, 20, 25, 30,40, 50, 60, 70, 80 and 100 m depth with serial 5 l watersamplers (Hydrobios). Standard flow injection analysis(QuikChem® 8000 Method 31-115-01-3-A, 31-107-04-1-A, 31-107-06-1-A and 31-115-01-3-B Lachat Instru-ments) was used to measure dissolved inorganic phos-phorus (DIP), nitrogen (DIN) (NO2
– + NO3– + NH4
+) and
silica (DSi). A nutrient was considered depleted whenits concentration was close to the detection-limit (DIP;0.015 µM, DIN; 0.05 µM, DSi 0.1 µM).
Phytoplankton primary production. Rates of 14C-up-take were determined in 80 ml polycarbonate bottles at0, 1, 2, 4, 6, 8, 10, 12.5, 15, 20, 25 and 30 m depth (pro-duction below 20 m low, <0.6 µg C l–1), with dark bot-tles at 0, 4 and 25 m. Each bottle received 4 µCi of car-rier-free NaH14CO3. After in situ incubation for ca. 4 haround noon, 10 ml sub-samples of unfiltered seawaterwere transferred to glass scintillation vials, 2 drops of1 M HCl added and bubbled with air for at least 30 minbefore adding 10 ml of Lumagel Safe (Lumac LSC B.V.)and counting in a Tri-Carb 1600 TR (Packard).
Total carbon dioxide concentration and carbonuptake was calculated according to Öström (1974).Dark uptake was calculated by linear interpolationbetween the incubation depths and subtracted fromthe light uptake. Daily primary production was calcu-lated by multiplying by total daily insolation and divid-ing by insolation during the incubation period. Inte-grated 14C uptake rates were linearly interpolated overdepth.
Chlorophyll a. Chlorophyll a samples (2 l) from 0, 5,10, 15, 20, 30, 40, 50, 60 and 80 m, (3 ml magnesiumhydroxide carbonate, 10 g l–1 added per sample) werecollected on Whatman GF/F filters (47 mm Ø), whichwere wrapped in aluminium foil and stored frozen(–20°C). Filters were homogenised in 90% acetonewith a piston grinder, centrifuged and the clear super-natant analysed in a Hitachi U2000 spectrophotometer.Calculations followed Jeffrey & Humphrey (1975).
Contour plots. Contour plots of the vertical distribu-tion patterns of environmental variables and phyto-plankton species were generated in Surfer® 8.0 usingtriangulation with linear interpolation.
Statistics. Approximation of coefficient of variationfor the phytoplankton biomass: Biomass of individualphytoplankton species was calculated as the product ofcell abundance and the estimated mean cell volume foreach sample depth. Since time restrictions preventedreplication and it was assumed that the 2 measure-ments were independent, we used the propagation oferror formula (Rice 1993) to estimate variation of thebiomass estimates:
(1)
where Cb, Ca and Cv are the coefficients of variation forbiomass, cell abundance and cell volume, respectivelyand n is the number of counted cells.If we assume that the cell abundance is Poisson-distributed, then Ca = √—
1—/n (Lund et al. 1958, Venrick
1978). For each sample, a minimum of 50 units werecounted and measured, resulting in a Ca of maximum14%.
C C C nb a v /≈ +2 2
17

Mar Ecol Prog Ser 283: 15–27, 2004
The coefficient of variation for the cell volume (Cv)was estimated from cell volume measurements for allspecies and equalled 45%. Insertion in Eq. (1) gives amaximum coefficient of variation for the biomass (Cb)of 15.5%. The addition of the volume measurementerror only increased the biomass coefficient of varia-tion from 14 to 15.5%, i.e. the main contribution to thebiomass error is from the number of counted cells persample.
Comparisons of phytoplankton carbon (PC) andtotal particulate organic carbon (POC) in sedimenttraps: Estimates of phytoplankton carbon wereassumed to have the same maximum coefficient ofvariation (CPC) as biomass (Cb 15.5%) since it was cal-culated by multiplying biomass with a fixed factor.
The total particulate organic carbon was estimatedfrom duplicate samples and we used all samples toestimate the coefficient of variation to CPOC = 9.1%.
Approximate 95% confidence intervals for PC andPOC were calculated using the estimated coefficientsof variation and assuming normally distributed data.
For each depth, the ratio PC/POC was calculatedand a test was made of the hypothesis that all particu-late organic carbon found in a sediment trap is phyto-
plankton carbon, i.e. H0: PC/POC = 1. The coefficientof variation for this ratio (CPC/POC) was calculatedaccording to Eq. (1) and gave:
The test was done assuming normally distributeddata and the test score used was:
z = [(PC/POC)–1]/(CPC/POC · PC/POC)
p-values < 0.05 were regarded as significant.
RESULTS
Hydrography and nutrients
The water temperature in the top 30 m of the watercolumn was near 0°C in March (Fig. 2a), graduallyincreasing to about 3.5°C in mid-May. A seasonal pyc-nocline gradually formed due to salinity stratificationof the surface water, with mixed layer depth decreas-ing from 30 to about 15 m by mid to late March, andthen varying between 5 and 20 m (Fig. 2b, c). Mixedlayer salinity varied from 6.2 to 6.8 (Fig. 2b) with occa-
C C CPC/POC PC POC≈ + = + ≈2 2 2 20 155 0 091 0 18. . .
18
–100
–90
–80
–70
–60
–50
–40
–30
–20
–10
0a) Temperature (°C) b) Salinity
e) DIN (NO2+NO3+NH4) (µmol l–1)
Mar Apr May
f) DIP (µmol l–1)
Mar Apr May–100
–90
–80
–70
–60
–50
–40
–30
–20
–10
0d) Chlorophyll a (mg m–3)
Mar Apr May
c) Sigma-t
Dep
th (m
)
< 0.2
77
Fig. 2. Hydrography and dissolved inorganic nutrients at the sampling station March to May 1996. (a) Temperature (°C), (b) salin-ity, (c) sigma-t with mixed layer depth indicated by a broken bold line, (d) chlorophyll a (mg m–3), (e) nitrogen (DIN = NO2 +
NO3 + NH4) (µmol l–1) and (f) phosphate (DIP = PO4) (µmol l–1). Sampling depths indicated by ×× in c–f
Höglander et al.: Setting of Balthic spring phytoplankton
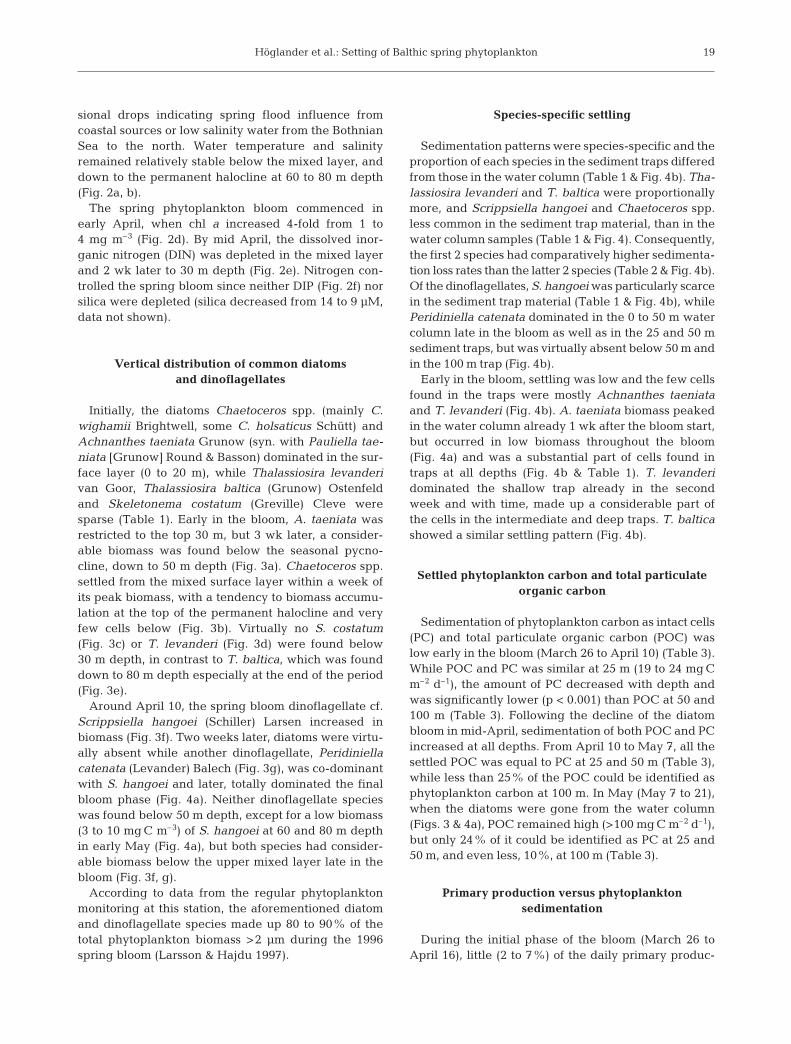
sional drops indicating spring flood influence fromcoastal sources or low salinity water from the BothnianSea to the north. Water temperature and salinityremained relatively stable below the mixed layer, anddown to the permanent halocline at 60 to 80 m depth(Fig. 2a, b).
The spring phytoplankton bloom commenced inearly April, when chl a increased 4-fold from 1 to4 mg m–3 (Fig. 2d). By mid April, the dissolved inor-ganic nitrogen (DIN) was depleted in the mixed layerand 2 wk later to 30 m depth (Fig. 2e). Nitrogen con-trolled the spring bloom since neither DIP (Fig. 2f) norsilica were depleted (silica decreased from 14 to 9 µM,data not shown).
Vertical distribution of common diatoms and dinoflagellates
Initially, the diatoms Chaetoceros spp. (mainly C.wighamii Brightwell, some C. holsaticus Schütt) andAchnanthes taeniata Grunow (syn. with Pauliella tae-niata [Grunow] Round & Basson) dominated in the sur-face layer (0 to 20 m), while Thalassiosira levanderivan Goor, Thalassiosira baltica (Grunow) Ostenfeldand Skeletonema costatum (Greville) Cleve weresparse (Table 1). Early in the bloom, A. taeniata wasrestricted to the top 30 m, but 3 wk later, a consider-able biomass was found below the seasonal pycno-cline, down to 50 m depth (Fig. 3a). Chaetoceros spp.settled from the mixed surface layer within a week ofits peak biomass, with a tendency to biomass accumu-lation at the top of the permanent halocline and veryfew cells below (Fig. 3b). Virtually no S. costatum(Fig. 3c) or T. levanderi (Fig. 3d) were found below30 m depth, in contrast to T. baltica, which was founddown to 80 m depth especially at the end of the period(Fig. 3e).
Around April 10, the spring bloom dinoflagellate cf.Scrippsiella hangoei (Schiller) Larsen increased inbiomass (Fig. 3f). Two weeks later, diatoms were virtu-ally absent while another dinoflagellate, Peridiniellacatenata (Levander) Balech (Fig. 3g), was co-dominantwith S. hangoei and later, totally dominated the finalbloom phase (Fig. 4a). Neither dinoflagellate specieswas found below 50 m depth, except for a low biomass(3 to 10 mg C m–3) of S. hangoei at 60 and 80 m depthin early May (Fig. 4a), but both species had consider-able biomass below the upper mixed layer late in thebloom (Fig. 3f, g).
According to data from the regular phytoplanktonmonitoring at this station, the aforementioned diatomand dinoflagellate species made up 80 to 90% of thetotal phytoplankton biomass >2 µm during the 1996spring bloom (Larsson & Hajdu 1997).
Species-specific settling
Sedimentation patterns were species-specific and theproportion of each species in the sediment traps differedfrom those in the water column (Table 1 & Fig. 4b). Tha-lassiosira levanderi and T. baltica were proportionallymore, and Scrippsiella hangoei and Chaetoceros spp.less common in the sediment trap material, than in thewater column samples (Table 1 & Fig. 4). Consequently,the first 2 species had comparatively higher sedimenta-tion loss rates than the latter 2 species (Table 2 & Fig. 4b).Of the dinoflagellates, S. hangoei was particularly scarcein the sediment trap material (Table 1 & Fig. 4b), whilePeridiniella catenata dominated in the 0 to 50 m watercolumn late in the bloom as well as in the 25 and 50 msediment traps, but was virtually absent below 50 m andin the 100 m trap (Fig. 4b).
Early in the bloom, settling was low and the few cellsfound in the traps were mostly Achnanthes taeniataand T. levanderi (Fig. 4b). A. taeniata biomass peakedin the water column already 1 wk after the bloom start,but occurred in low biomass throughout the bloom(Fig. 4a) and was a substantial part of cells found intraps at all depths (Fig. 4b & Table 1). T. levanderidominated the shallow trap already in the secondweek and with time, made up a considerable part ofthe cells in the intermediate and deep traps. T. balticashowed a similar settling pattern (Fig. 4b).
Settled phytoplankton carbon and total particulateorganic carbon
Sedimentation of phytoplankton carbon as intact cells(PC) and total particulate organic carbon (POC) waslow early in the bloom (March 26 to April 10) (Table 3).While POC and PC was similar at 25 m (19 to 24 mg Cm–2 d–1), the amount of PC decreased with depth andwas significantly lower (p < 0.001) than POC at 50 and100 m (Table 3). Following the decline of the diatombloom in mid-April, sedimentation of both POC and PCincreased at all depths. From April 10 to May 7, all thesettled POC was equal to PC at 25 and 50 m (Table 3),while less than 25% of the POC could be identified asphytoplankton carbon at 100 m. In May (May 7 to 21),when the diatoms were gone from the water column(Figs. 3 & 4a), POC remained high (>100 mg C m–2 d–1),but only 24% of it could be identified as PC at 25 and50 m, and even less, 10%, at 100 m (Table 3).
Primary production versus phytoplankton sedimentation
During the initial phase of the bloom (March 26 toApril 16), little (2 to 7%) of the daily primary produc-
19

Mar Ecol Prog Ser 283: 15–27, 2004
tion settled as intact identifiable cells (Table 4). Afterthe diatom peak in mid April, this fraction increased to40% (Table 4). The total amount of carbon, estimatedfrom cell counts, that settled into the 25 m trap duringthe whole spring period (26 March to 7 May) was 4 g Cm–2 or 16% of the primary production (24.9 g C m–2,
Table 5). A similar amount, 3 g C m–2 or 12% of the pri-mary production, was estimated for the sediment trapat 50 m, while only 0.5 g C m–2 or 2% of the primaryproduction reached the 100 m sediment trap below thehalocline in the form of intact cells (Table 5). The set-tled total particulate organic carbon (POC) (Table 5)
20
Species Date Water column (mg C m–2) Sediment trap (mg C m–2 d–1)dd/mm 0–25 m 25–50 m 50–100 m 25 m 50 m 100 m
Achnanthes 26/03–02/04 573 (53) 25 (34) 0 (–) 5 (54) 1 (58) 0.7 (78)taeniata 02/04–10/04 683 (18) 30 (12) 0 (–) 2 (8) 0.4 (11) 0.6 (31)
10/04–16/04 190 (5) 53 (8) 13 (10) 20 (35) 33 (52) 0.5 (21)16/04–23/04 155 (4) 268 (13) 102 (22) 24 (15) 19 (20) 3 (24)23/04–30/04 131 (5) 349 (17) 157 (29) nd 20 (16) 9 (26)30/04–07/05 63 (3) 137 (13) 97 (20) 4 (2) 13 (9) 9 (40)07/05–21/05 21 (<1) 17 (2) 56 (11) 0.6 (2) 2 (4) 2 (11)
Chaetoceros 26/03–02/04 274 (25) 34 (46) 0.2 (81) 0.7 (8) 0.2 (7) 0 (–)spp. 02/04–10/04 1389 (37) 71 (29) 2 (81) 2 (7) 1 (24) 0.5 (28)
10/04–16/04 1717 (42) 398 (59) 97 (71) 10 (18) 5 (8) 0.3 (14)16/04–23/04 615 (17) 399 (19) 266 (58) 4 (3) 12 (13) 3 (23)23/04–30/04 87 (3) 75 (4) 231 (42) nd 3 (2) 15 (43)30/04–07/05 52 (2) 34 (3) 65 (13) 0.2 (<1) 2 (2) 4 (17)07/05–21/05 7 (<1) 2 (<1) 8 (2) 0.2 (1) 0.3 (<1) 1 (6)
Skeletonema 26/03–02/04 10 (1) 1 (2) <0.1 (19) <0.1 (<1) <0.1 (<1) 0 (–)costatum 02/04–10/04 23 (1) 2 (1) 0 (–) 0.1 (<1) <0.1 (<1) <0.1 (<1)
10/04–16/04 17 (<1) 1 (<1) 0.1 (<1) 0.3 (<1) 0.2 (<1) <0.1 (<1)16/04–23/04 4 (<1) 0.6 (<1) 0.4 (<1) 0.3 (<1) 0.6 (<1) 0.2 (2)23/04–30/04 1 (<1) 1 (<1) 1 (<1) nd 0.1 (<1) 0.6 (2)30/04–07/05 1 (<1) 0.8 (<1) 1 (<1) <0.1 (<1) 0.1 (<1) 0.3 (1)07/05–21/05 0 (–) 0 (–) 0 (<1) <0.1 (<1) <0.1 (<1) <0.1 (<1)
Thalassiosira 26/03–02/04 62 (6) 4 (5) 0 (–) 1 (12) 0.4 (16) 0.2 (22)baltica 02/04–10/04 95 (3) 13 (5) 0 (–) 3 (10) 0.2 (6) 0.2 (9)
10/04–16/04 83 (2) 44 (7) 8 (6) 10 (17) 6 (10) 0.3 (11)16/04–23/04 86 (2) 88 (4) 50 (11) 16 (10) 7 (7) 0.7 (5)23/04–30/04 96 (3) 98 (5) 98 (18) nd 21 (17) 3 (7)30/04–07/05 62 (3) 81 (8) 108 (22) 3 (2) 16 (10) 3 (12)07/05–21/05 5 (<1) 69 (6) 106 (20) 3 (11) 4 (9) 3 (18)
Thalassiosira 26/03–02/04 51 (5) 7 (9) 0 (–) 2 (24) 0.4 (16) 0 (–)levanderi 02/04–10/04 98 (3) 27 (11) 0.4 (19) 20 (74) 2 (58) 0.2 (12)
10/04–16/04 63 (2) 29 (4) 5 (4) 9 (16) 16 (26) 1 (43)16/04–23/04 15 (<1) 10 (<1) 9 (2) 8 (5) 26 (28) 5 (37)23/04–30/04 0.6 (<1) 2 (<1) 4 (1) nd 2 (2) 6 (17)30/04–07/05 0.2 (<1) 0 (–) 0 (–) 0 (–) 0 (–) 0.5 (2)07/05–21/05 0 (–) 0 (–) 0 (–) 0 (–) 0 (–) 0.1 (1)
Peridiniella 26/03–02/04 66 (6) 2 (3) 0 (–) <0.1 (<1) 0.1 (4) 0 (–)catenata 02/04–10/04 195 (5) 7 (3) 0 (–) 0 (–) <0.1 (<1) 0.4 (20)
10/04–16/04 272 (7) 17 (3) 0 (–) 8 (13) 3 (5) 0.3 (11)16/04–23/04 704 (20) 487 (24) 18 (4) 110 (67) 29 (31) 1 (9)23/04–30/04 1041 (36) 624 (31) 18 (3) nd 75 (59) 0.6 (2)30/04–07/05 1759 (84) 594 (57) 41 (8) 144 (93) 105 (68) 0.2 (<1)07/05–21/05 2560 (94) 887 (76) 81 (15) 19 (71) 33 (73) 0.2 (1)
Scrippsiella 26/03–02/04 45 (4) 1 (1) 0 (–) 0.1 (1) <0.1 (<1) 0 (–)hangoei 02/04–10/04 1277 (34) 98 (39) 0 (–) 0.2 (<1) <0.1 (<1) 0 (–)
10/04–16/04 1774 (43) 128 (19) 14 (10) 0.1 (<1) 0.1 (<1) <0.1 (<1)16/04–23/04 1953 (55) 818 (40) 18 (4) 0.5 (<1) <0.1 (<1) <0.1 (<1)23/04–30/04 1522 (53) 885 (44) 42 (8) nd 5 (4) 1 (3)30/04–07/05 162 (8) 192 (19) 178 (36) 3 (2) 17 (11) 6 (27)07/05–21/05 145 (5) 186 (16) 280 (53) 4 (14) 6 (14) 10 (63)
Table 1. Average phytoplankton carbon biomass (mg C m–2) in different depth intervals during the deployment of the sedimenttraps and phytoplankton biomass in sediment traps (mg C m–2 d–1) (March 26–May 21). Percent (%) of total phytoplankton
biomass per depth interval or depth in brackets. nd = no data

Höglander et al.: Setting of Balthic spring phytoplankton
was 3.0 to 3.1 g C m–2 for the same period at all 3depths, i.e. only 12% of the primary production set-tled as POC.
DISCUSSION
Settling of spring bloom primary production
Temperate spring phytoplankton blooms are con-sidered to export a considerable fraction of the pri-mary production (PP) to deeper waters, but reportedvariability is large. Wassmann (1991), when compil-ing data from the Baltic Sea, Norwegian fjords andthe Atlantic Ocean, found that between 14 and 85%(average 46%) of the spring bloom primary produc-tion settled out. Most of the data were of coastalorigin and potentially biased by resuspension(Blomqvist & Larsson 1994). Methodological differ-ences (trap designs, preservatives, exposure timeetc.) further complicate comparison of different stud-ies (Hargrave & Burns 1979, Bloesch & Burns 1980,Gardner 1980, Blomqvist & Håkansson 1981). Muchvariability may also stem from differences in food-web structure affecting sedimentation loss (Peinertet al. 1989, Wassmann 1998). Our results indicate amixed layer spring settling loss at the lower end (4g C m–2 or ~15% of PP) given by Wassmann (1991).Stigebrandt (1991) used 25 yr of oxygen measure-ments and calculated oxygen fluxes through the seasurface to estimate net production of organic matterin the top 15 m of 2 Baltic Sea proper sub-areas to 38and 49 g C m–2 yr–1. Earlier, Rahm (1987) arrived at asimilar export production estimate of 50 g C m–2 yr–1,from calculations of below halocline oxygen con-sumption. Our carbon settling of 3 to 4 g C m–2 inspring is less than 10% of the above yearly estimatesand may seem low in comparison, and recent cali-bration of similar traps as used in this study against234Th flux suggested under trapping in spring by afactor of about 2 (Gustafsson et al. 2004). Struck etal. (2004) arrived at similar new production esti-mates (28 to 66 g C m–2 yr–1, calculated assumingC/N = 8) as above but measured a very low flux of1 g C m–2 (March–May, average 1995–1998) in trapsmoored at 140 m in the Eastern Gotland Basin. Theyconcluded water column remineralisation to be very ef-fective, particularly below the halocline. In addition tounder-trapping, several factors may have added to alow carbon settling in 1996. Available time seriessuggest a between year variability in primary produc-tion of a factor of 2 and PP in 1996 was in the lower endof that range (U. Larsson pers. comm.). This, combinedwith an early shift from diatoms to dinoflagellates,likely resulted in a low settling loss.
Water column
Kahru & Nômmann (1990) concluded that the springbloom in the Baltic Sea proper was initiated by salinitystratification and light since the bloom starts before themaximum density temperature (about 2.5°C, Stige-brandt 2001) was reached in the surface water. Theyfound spring blooms in the northern Baltic Sea properto progress from the coast to the open sea and fromnorth to south, with the central Baltic as the last area tobloom. The salinity stratification is provided by horizon-
21
–80
–70
–60
–50
–40
–30
–20
–10
0
Mar MayApr
Chaetoceros spp.
–80
–70
–60
–50
–40
–30
–20
–10
0Skeletonema costatum
Thalassiosira baltica
Thalassiosira levanderi
–80
–70
–60
–50
–40
–30
–20
–10
0 250Peridiniella catenata
Mar Apr May
Scrippsiella hangoei
Dep
th (m
)
–80
–70
–60
–50
–40
–30
–20
–10
0
b)
c) d)
e) f)
g)
160
400
9040
2.2 86
100
130
120
30
8 6
20
a) Achnanthes taeniata
Fig. 3. Vertical distribution(and biomass mg C m–3) ofdominating diatoms and dino-flagellates, during the springbloom (March 26–May 7).Sampling depth indicated by ××

Mar Ecol Prog Ser 283: 15–27, 2004
tal advection of lower salinity water (Eilola 1997). Thisseems to be particularly important in the NW part of theBaltic Sea proper where juvenile freshwater from theGulf of Bothnia spreads along the Swedish coast, prob-ably in narrow coastal currents (Eilola & Stigebrandt1998). Such currents may well be responsible for theobserved variability in surface salinity with time in thestudy area, if they change in direction and in salt con-tent. They can also supply the surface water with thebuoyancy needed to initiate the spring bloom (Kaiser &Schulz 1978, Smetacek & Passow 1990).
Less saline water originating from the Gulf of Both-nia is expected to carry other phytoplankton species,particularly after a winter with ice cover, as in 1996.The peak of the ‘ice-alga’ Achnanthes taeniata(Heacky et al. 1998) early in the bloom coincided witha marked drop in salinity. After salinity increasedagain, this species was only present in low abundance,indicating a replacement of the surface water.Although A. taeniata was also common in the ice-cov-ered coastal area NW of station BY31 (H. Höglanderunpubl. data), the comparatively low freshwater out-
22
Date Achnanthes Chaetoceros Skeletonema Thalassiosira Thalassiosira Peridiniella Scrippsiellataeniata spp. costatum baltica levanderi catenata hangoei
26/03–02/04 1 <1 <1 2 5 <0.1 <102/04–10/04 <1 <1 <1 3 16 <<0.1 <0.110/04–16/04 11 <1 2 13 8 2 <0.116/04–23/04 17 1 9 22 44 6 <0.123/04–30/04 nd nd nd nd nd nd nd30/05–07/05 6 <1 1 5 <<0.1 7 2
Table 2. Settling ratio: Percentage (%) of the average cell concentrations in the 0–25 m water column which settles daily at 25 m depth during the studied periods (March 26–May 7). nd = no data
Fig. 4. Species composition in (a) integrated water column samples 0–25, 25–50 and 50–100 m (mg C m–2), and (b) sediment trapsamples from 25, 50 and 100 m depth (mg C m–2 d–1) during the spring bloom in 1996 at the Landsort Deep station (BY31).
(ND = no data)

Höglander et al.: Setting of Balthic spring phytoplankton
flow to this area and the general circu-lation in the Baltic makes an influenceof this coastal water at the open sea sta-tion BY31 less likely.
The decrease in the surface layerdiatom biomass (the dominant Chaeto-ceros spp. and the sub-dominantAchnanthes taeniata, Skeletonemacostatum, Thalassiosira levanderi), co-incided with a decrease in the mixedlayer depth during the first 2 wk ofApril, and depletion of mixed-layerdissolved inorganic nitrogen (DIN) to10 m depth. Nitrogen depletion is acommon cause of diatom bloom col-lapse in the Baltic Sea (e.g. von
23
Date Primary Sedimentation of Percentage of primaryproduction phytoplankton production settling as
(mg C m–2 d–1) carbon phytoplankton(mg C m–2 d–1) carbon (% d–1)
0–25 m 25 m 50 m 100 m 25 m 50 m 100 m
26/03–02/04 445 9 2 0.9 2 0.6 0.202/04–10/04 756 27 4 2 4 0.5 0.210/04–16/04 949 57 64 2 6 7 0.316/04–23/04 680 164 94 14 24 14 223/04–30/04 315 nd 126 35 nd 40 1130/04–07/05 441 155 154 23 35 35 5
Table 4. Average daily primary production, daily phytoplankton carbonsedimentation (based on cell counts, mg C m–2 d–1) and percentage of daily
settled primary production (% d–1). (nd = no data)
Date Depth Total particulate organic Phytoplankton carbon Phytoplanktondd/mm (m) carbon (POC) (PC) carbon as % of
mg C m–2 d–1 mg C m–2 d–1 POC
26/03–10/04 25 24 ± 4 19 ± 6 79 ± 29(15 d) 50 24 ± 4 3 ± 1 13 ± 5***
100 39 ± 7 1 ± 0.4 4 ± 1***
10/04–23/04 25 100 ± 18 114 ± 35 114 ± 41(13 d) 50 101 ± 18 80 ± 25 80 ± 29
100 61 ± 11 9 ± 3 14 ± 5***
23/04–07/05 25 99 ± 18 nd nd(14 d) 50 95 ± 17 140 ± 43 147 ± 53
100 123 ± 22 29 ± 9 24 ± 9***
07/05–21/05 25 112 ± 20 27 ± 8 24 ± 9***(14 d) 50 198 ± 36 45 ± 14 23 ± 8***
100 154 ± 28 15 ± 5 10 ± 4***
Total 25 82 ± 15 77 ± 24a 94 ± 34a
26/03–21/05 50 103 ± 19 66 ± 20 64 ± 23**(56 d) 100 92 ± 17 13 ± 4 15 ± 5***aTo estimate total sedimentation at 25 m, we used the averages of April 16–23 and April 30–May 7 to estimate the sedimen-tation for April 23–30 (where data was missing)
Table 3. Comparison of total settling particulate organic carbon (POC) and settling phytoplankton carbon (PC, estimated from cellcounts) from March 26 to May 21. Biomass values in mg C m–2 d–1 with estimated 95% confidence limits (see ‘Materials and meth-ods’). Also given is phytoplankton carbon as % of total settling particulate organic carbon, with estimated 95% confidence limits(see ‘Materials and methods’). Hypothesis testing of H0: POC = PC, i.e. PC/POC-ratio = 1 with standardized normal distribution.
*p < 0.05, **p < 0.01, ***p < 0.001, nd = no data
Date Primary Sedimentation 25 m Sedimentation 50 m Sedimentation 100 mproduction (g C m–2 period–1) (g C m–2 period–1) (g C m–2 period–1)
(g C m–2 period–1) PC POC PC POC PC POC
26/03–07/05 24.9 4.0 ± 1.2a 3.0 ± 0.6 3.0 ± 0.9 3.0 ± 0.5 0.5 ± 0.2 3.1 ± 0.6(16) (12) (12) (12) (2) (12)
aTo estimate total sedimentation for 25 m for the whole spring period, we used averages of April 16–23 and April 30–May 7to estimate sedimentation for April 23–30 (where data was missing)
Table 5. Total primary production, sedimentation of phytoplankton carbon (PC, estimated from cell counts and cell volumes) andtotal settling particulate organic carbon (POC) for the period March 26 to May 7 (in g C m–2 period–1) ± 2SD. Percent (%) of the
primary production that settled at different depths is in brackets

Mar Ecol Prog Ser 283: 15–27, 2004
Bodungen et al. 1981, Larsson et al. 1986b, Kuuppo etal. 1998). Silica deficiency can also cause the declineof diatom blooms (Bienfang et al. 1982), but was obvi-ously not the cause here, since there was still plentyof silica left in the water column. In contrast to otherdiatoms, the large-celled T. baltica persisted in lowabundance throughout the study despite continuoussettling losses, suggesting a slow, steady growth inthe nitrogen- deficient mixed layer possibly sustainedby internally stored nutrients.
A shift from a dominance of diatoms to dinoflagel-lates during the spring bloom is commonly seen in theinvestigated area (Larsson & Hajdu 1997, Hajdu 2002),as well as in other parts of the Baltic Sea proper (e.g.Niemi 1973, Kononen & Niemi 1984, Niemi & Åström1987, Heiskanen & Kononen 1994, Wasmund et al.1998). Our data indicate that the early shift from non-swimming diatoms to swimming dinoflagellatesresulted from the establishment of a shallow mixedlayer that limited the fraction of the winter-storage ofinorganic nitrogen available to the diatoms andenhanced their sedimentation out of the photic zone.This suggests that the dominance of diatoms in springis climatically controlled and determined by the bal-ance between the spreading of juvenile freshwater(Eilola & Stigebrandt 1998), which stabilise the watercolumn, and wind-forced mixing.
Scrippsiella hangoei became abundant when DINwas depleted in the surface mixed layer and thencontinued to increase its biomass and vertical distrib-ution concomitant to an extension of the nitrogen-depleted layer to 30 m depth. Olli et al. (1998) consid-ered S. hangoei to be non-migratory and a resident ofthe nutrient-depleted mixed layer. Our data, how-ever, suggest migration for nutrients to sub-pycno-cline waters to sustain the observed increase in bio-mass. It is not possible to determine to what extentactively migrating cells were responsible for theobserved distribution to 40 m depth in late April, butestimates of potential migration amplitudes for similarsized dinoflagellates (Sommer 1988) suggest a sub-stantial contribution from settling cells. A substantialsettling is also indicated by the drastic decline of S.hangoei a week after the peak. Nutrients at below 30m decreased further when Peridiniella catenata,known to migrate vertically (Passow 1991b, Heiska-nen 1995), also built up a substantial biomass andhelped to consume most of the DIN down to 40 mdepth. The dominance of P. catenata late in thebloom suggests they out-compete S. hangoei bymigrating deeper, since DIN was depleted almostdown to 50 m depth. This is consistent with theobservation that species (e.g. P. catenata) that formcell chains swim faster than single-celled species(Fraga et al. 1989).
Selective sedimentation
Differences in species composition between thewater column and the sediment traps indicate largebetween-species variability in settling. Waite et al.(1992b) found similar differences in settling of the gen-era Thalassiosira and Chaetoceros in Auke Bay(Alaska), with higher sedimentation loss rates of Tha-lassiosira than of Chaetoceros species. Thalassiosiraspecies are nutrient-sensitive (Waite et al. 1992a) andseem to need high nutrient concentrations to sustainrapid growth, to compensate for their high settlingrate. T. levanderi, with a high growth rate at the begin-ning of the bloom as well as a high sedimentation rate,disappeared quickly from the water column once nitro-gen was depleted in the mixed layer, as has regularlybeen observed in the area (S. Hajdu, unpubl. data) andalso reported by Passow (1991a). Mucus produced bysenescent cells (e.g. T. levanderi), can induce aggre-gate formation and greatly increase the settling rate ofdiatoms (Smetacek 1985). To the extent that aggregateformation occurred, in this case it seemed to be a selec-tive process which did not remove species from thewater column. Much of the large-celled T. baltica pop-ulation was found at deeper depths late in the bloom,indicating settlement as intact cells. Thick cells wallsand rapid settling presumably prevented this speciesfrom disintegrating in the water column while settling.The slow settling of delicate Chaetoceros cells may bedue to their long hair-like spines, which increase fric-tion and lower sinking rates (Smayda & Boleyn 1966,Brönmark & Hansson 1998). Disintegration of the deli-cate cells might be another explanation for their lowrecovery in the sediment traps.
Dinoflagellates have also been found to disintegratein the water column (Heiskanen & Kononen 1994) andhence, their vegetative cells are seldom found in sedi-ment traps. The colony forming Peridiniella catenatawas, however, found in the 25 and 50 m sediment trapsin about the same proportions as in the water column(Table 1). P. catenata is a vertically migrating species(Passow 1991b, Olli et al. 1998) and has been found toactively swim into sediment traps, which may bias themeasurements, especially when preservatives are used(Heiskanen 1995). Passow (1991b) found P. catenata tomigrate to at least 30 m depth, but our water columndata indicate they may actually migrate to 50 m depth.We used a preservative (chloroform) and our settlingrates of P. catenata may be biased by vertically migrat-ing cells. Since P. catenata constituted the bulk of set-tling cells above the halocline, PC and POC settlingrates also may therefore be overestimated. Below 50 mand in the 100 m trap we found very few P. catenata in-dicating a very low settling rate or high loss throughdisintegration or grazing in the halocline layer.
24

Höglander et al.: Setting of Balthic spring phytoplankton
The other dominant dinoflagellate, Scrippsiella han-goei, was very abundant in the surface layer, but rarein the sediment traps. S. hangoei has very thin and del-icate plates (Larsen et al. 1995) and is sensitive topreservatives such as formaldehyde, which causedeformation and dissolution of the cells (Heiskanen1995). If chloroform has a similar effect, this couldexplain a low recovery in the traps. S. hangoei isreported to form resting cysts that settle rapidly(Heiskanen 1993), but we found no cysts in the sedi-ment traps or in the water column. Cyst formation canbe preceded by planozygotes, large cells with a diam-eter >22 µm according to Kremp & Heiskanen (1999).We found these larger cells throughout the bloom, butthey were scarce (<10% of total abundance) and wefound no mass production of planozygotes. Cell sizeremained at a mean diameter of 18 to 19 µm through-out the bloom.
Phytoplankton carbon and total particulate organiccarbon (POC) in settling material
Early in the bloom, particulate organic carbon (POC)and phytoplankton carbon (PC) were not statisticallydifferent in shallow traps indicating almost all carbonsettled as intact cells. On 1 occasion, estimated PCclearly exceeded POC in material collected at 50 mdepth. Differences in exposure time and losses due tothe preservative used (cf. Kähler & Bauerfeind 2001)may have reduced the carbon content of the settledPOC due to longer exposure time (2 wk compared to1 wk). Over-estimation of PC when converting cell vol-umes to carbon might be another explanation for thediscrepancies between PC and POC.
POC settling rates were very similar at all trapdepths when summed over the bloom period (3.0 to3.1 g C m–2, March 26 to May 7, Table 5) and were only12% of measured phytoplankton primary production(24.9 g C m–2). Contrary to POC, the fraction of recog-nisable cells decreased with depth, particularly from50 to 100 m, as did the number of cells in the watermass. This suggests that diatoms as well as dinoflagel-lates are rapidly degraded and will settle as unrecog-nisable detritus or not at all. This is well known fordinoflagellates (Heiskanen & Kononen 1994), butdiatoms are generally considered to settle as intactcells (Davies & Payne 1984). During the bloom(March 26 to May 7), only 18% of the POC settled inthe 100 m trap could be attributed to recognisablephytoplankton, of which 87% was diatoms.
Predation by mesozooplankton is commonly consid-ered of minor importance in spring due to the low zoo-plankton abundance (Larsson et al. 1986b), althoughmigrating zooplankton may alter the collected material
in the trap, if no preservative is used (Lee et al. 1992).The open Baltic Sea proper has an over-wintering pop-ulation of Pseudocalanus in the deep water, if thewater carries sufficient oxygen, even below the perma-nent halocline (E. Gorokhova pers. comm.) (Ackefors1969). They start to reproduce in spring and their graz-ing might explain some of the loss of cells from 50 to100 m depth. Microzooplankton may also consume asignificant fraction of spring phytoplankton in theBaltic proper (Johansson et al. 2004).
Concluding remarks
Our estimated export production is lower than gen-erally reported from coastal waters (e.g. Larsson et al.1986b, Wassmann 1991, Heiskanen & Leppänen 1995)and suggests that extrapolation from coastal studiesmay overestimate offshore settling rates. Furthermore,our estimates of settling rates at 25 and 50 m depthwere likely biased by trapped vertically migratingdinoflagellates. This bias is counteracted by a likelyunder-trapping (Gustafsson et al. 2004) and conse-quently, the absolute magnitude of export productionis uncertain.
It is not clear why settling of recognisable cellsdecreased sharply below 50 m depth, as indicated bycell numbers in the water mass and in traps, but disin-tegration due to lowered settling rates in the pycnolineand grazing from deep over-wintering zooplanktonpopulations likely contributed.
The low sedimentation of identifiable cells below thehalocline and the species-specific sedimentation pat-terns may complicate the interpretation of paleoeco-logical studies of sedimentary records since settlingspecies composition at depth will not accurately mirrorthe true surface phytoplankton community.
It is commonly assumed that silica availability deter-mines the dominance of diatoms in spring, but our dataindicate that climate factors determining the mixedlayer depth, and consequently the amount of nutrientsavailable to non-swimming diatoms, may initiate adecline in diatoms and succession to dinoflagellateseven while significant amounts of silica are stillpresent.
Acknowledgements. We thank V. Lindblom for counting thephytoplankton cells in the water and sediment trap samples.We are also grateful to B. Abrahamsson, L. Lundgren and J.Walve for help taking the samples, and to A. Sjösten and thestaff at the Chemical Analysis laboratory at our departmentfor chemical analysis. We thank J. O. Persson (Mathematicalstatistics, Stockholm University) for kindly helping us with thestatistics, R. Elmgren for linguistic corrections and T. Hamaand 3 anonymous reviewers for valuable comments on themanuscript. Funding was given by the EU through BASYSwithin the MAST III program (MAS3-CT96-0058), the
25

Mar Ecol Prog Ser 283: 15–27, 2004
Swedish Foundation for strategic Environmental Research(MISTRA: SUCOZOMA) and the Swedish EPA which alsoprovided data collected within the Swedish Marine Monitor-ing Program.
LITERATURE CITED
Ackefors H (1969) Ecological zooplankton investigations inthe Baltic proper 1963–1965. Inst Mar Res Lysekil Ser BiolRep 18:1–139
Bienfang PK, Harrison PJ, Quarmby LM (1982) Sinking rateresponse to depletion of nitrate, phosphate and silicate infour marine diatoms. Mar Biol 67:295–302
Bloesch J, Burns N (1980) A critical review of sedimentationtrap technique. Schweiz Z Hydrol 42:15–55
Blomqvist S, Håkansson L (1981) A review on sediment trapsin aquatic environments. Arch Hydrobiol 91:101–132
Blomqvist S, Heiskanen AS (2001) The challenge of sedimen-tation in the Baltic Sea. In: Wulff FV, Rahm LA, Larsson P(eds) A systems analysis of the Baltic Sea. Ecologicalstudies, Vol. 148. Springer-Verlag, Heidelberg, p 211–227
Blomqvist S, Larsson U (1994) Detrital bedrock elements astracers of settling resuspended particulate matter in acoastal area of the Baltic Sea. Limnol Oceanogr 39:880–896
Brönmark C, Hansson LA (1998) The biology of lakes andponds. In: Crawley M, Little C, Southwood TRE, UlfstrandS (eds) Biology of habitats. Oxford University Press,Oxford
Davies JM, Payne R (1984) Supply of organic matter to thesediment in the northern North Sea during a spring phyto-plankton bloom. Mar Biol 78:315–324
Edler L (1979) Recommendations on methods for marine bio-logical studies in the Baltic Sea. Phytoplankton andchlorophyll. The Baltic Marine Biologists Publ 5:1–38
Eilola K (1997) Development of a spring thermocline at tem-peratures below the temperature of maximum density,with application to the Baltic Sea. J Geophys Res 102:8657–8662
Eilola K, Stigebrandt A (1998) Spreading of juvenile freshwa-ter in the Baltic proper. J Geophys Res C Oceans 103:27795–27807
Elmgren R (1978) Structure and dynamics of Baltic benthoscommunities, with particular reference to the relationshipbetween macro- and meiofauna. Kieler Meeresforsch Son-derh 4:1–22
Forsskåhl M, Laakonen A, Leppänen JM, Niemi Å, SundbergA, Tamelander G (1982) Seasonal cycle of production andsedimentation of organic matter at the entrance to the Gulfof Finland. Neth J Sea Res 16:290–299
Fraga S, Gallager SM, Anderson DM (1989) Chain-formingdinoflagellates: An adaptation to red-tides. In: Okaichi T,Anderson DM, Nemoto T (eds) Red tides: biology, envi-ronmental science, and toxicology. Elsevier, New York,p 281–284
Gardner WD (1980) Field assessment of sediment traps. J MarRes 38:41–52
Gustafsson Ö, Andersson P, Roos P, Kukulska Z, Broman D,Larsson U, Hajdu S, Ingri J (2004) Evaluation of the collec-tion efficiency of upper ocean sub-photic-layer sedimenttraps: a 24-month in situ calibration in the open Baltic Seausing 234Th. Limnol Oceanogr: Methods 2:62–74
Haecky P, Jonsson S, Andersson A (1998) Influence of sea iceon the composition of the spring phytoplankton bloom inthe northern Baltic Sea. Polar Biol 20:1–8
Hajdu S (2002) Phytoplankton of Baltic environmental gradi-
ents: observations on potentially toxic species. PhD thesis,University of Stockholm
Hargrave BT, Burns NM (1979) Assessment of sediment trapcollection efficiency. Limnol Oceanogr 24:1124–1136
Heiskanen AS (1993) Mass encystment and sinking ofdinoflagellates during a spring bloom. Mar Biol 116:161–167
Heiskanen AS (1995) Contamination of sediment trap fluxesby vertically migrating phototrophic micro-organisms inthe coastal Baltic Sea. Mar Ecol Prog Ser 122:45–58
Heiskanen AS (1998) Factors governing sedimentation andpelagic nutrient cycles in the northern Baltic Sea. MonogrBoreal Environ Res 8:1–80
Heiskanen AS, Kononen K (1994) Sedimentation of vernaland late summer phytoplankton communities in thecoastal Baltic Sea. Arch Hydrobiol 131:175–198
Heiskanen AS, Leppänen JM (1995) Estimation of export pro-duction in the coastal Baltic Sea: effect of resuspensionand microbial decomposition on sedimentation measure-ments. Hydrobiologia 316:211–224
HELCOM (1988) Guidelines for the Baltic monitoring pro-gramme for the third stage. Part D. Biological determi-nants. Baltic Sea Environment Proceedings No 27D.Helsinki Commission, Helsinki
Horn H, Horn W (1993) Sedimentary losses in the reservoirSaidenbach: flux and sinking velocities of dominant phyto-plankton species. Int Rev Gesamten Hydrobiol 78:39–57
Jeffrey SW, Humphrey GF (1975) New spectrophotometricequations for determining chlorophyll a, b, c-1 and c-2 inhigher plants, algae and natural phytoplankton. BiochemPhysiol Planzen 167:191–194
Johansson M, Gorokhova E, Larsson U (2004) Annual vari-ability in ciliate community structure, potential prey andpredators in the open northern Baltic Sea proper. J Plank-ton Res 26:67–80
Kähler P, Bauerfeind E (2001) Organic particles in a shallowsediment trap: Substantial loss to the dissolved phase.Limnol Oceanogr 46:719–723
Kaiser W, Schulz S (1978) On the causes for the differences inspace and time of the commencement of the phytoplank-ton bloom in the Baltic. Kieler Meeresforsch 4:161–170
Kahru M, Nômmann S (1990) The phytoplankton springbloom in the Baltic Sea in 1985, 1986: multitude of spatio-temporal scales. Cont Shelf Res 10:329–354
Kononen K, Niemi Å (1984) Long-term variation of the phyto-plankton composition at the entrance to the Gulf of Fin-land. Ophelia Suppl 3:101–110
Kremp A, Heiskanen AS (1999) Sexuality and cyst formationof the spring-bloom dinoflagellate Scrippsiella hangoei inthe coastal northern Baltic Sea. Mar Biol 134:771–777
Kuparinen J, Leppänen JM, Sarvala J, Sundberg A, VirtanenA (1984) Production and utilization of organic matter in aBaltic ecosystem off Tvärminne, southwest coast of Fin-land. Rapp P-V Reun Cons Int Explor Mer 183:180–192
Kuuppo P, Autio R, Kuosa H, Setälä O, Tanskanen S (1998)Nitrogen, silicate and zooplankton control of the plank-tonic food-web in spring. Estuar Coast Shelf Sci 46:65–75
Larsen J, Kuosa H, Ikävalko J, Kivi K, Hällfors S (1995) Aredescription of Scrippsiella hangoei (Schiller) comb.nov. — a ‘red tide’ dinoflagellate from the northern Baltic.Phycologia 34:135–144
Larsson U, Hajdu S (1997) The high frequency monitoring. In:Tidlund A (ed) Baltic 96. Stockholm Marine ResearchCentre, Stockholm, p 28–31 (In Swedish)
Larsson U, Blomqvist S, Abrahamsson B (1986a) A new sedi-ment trap system. Mar Ecol Prog Ser 31:205–207
Larsson U, Hobro R, Wulff F (1986b) Dynamics of a phyto-
26

Höglander et al.: Setting of Balthic spring phytoplankton
plankton spring bloom in a coastal area of the northernBaltic proper. Contrib Askö Lab Univ Stockholm 30:1–32
Lee C, Hedges JI, Wakeham SG, Zhu N (1992) Effectivenessof various treatments in retarding microbial activity insediment trap material and their effects on the collectionof swimmers. Limnol Oceanogr 37:117–130
Lehtonen K, Andersin AB (1998) Population dynamics, re-sponse to sedimentation and role in benthic metabolism ofthe amphipod Monoporeia affinis in an open-sea area ofthe northern Baltic Sea. Mar Ecol Prog Ser 168:71–85
Leppänen JM (1988) Cycling of organic matter during the ver-nal growth period in the open northern Baltic proper. VI.Sinking of particulate matter. Finn Mar Res 255:97–118
Leppänen JM, Kononen K (1988) Cycling of organic matterduring the vernal growth period in the open northernBaltic proper. III. Phytoplankton composition and estima-tion of loss rates of phytoplankton production. Finn MarRes 255:37–54
Lund JWG, Kipling C, Le Cren ED (1958) The inverted micro-scope method of estimating algal numbers and the statisti-cal basis of estimations by counting. Hydrobiologia 11:143–170
Menden-Deuer S, Lessard EJ (2000) Carbon to volume rela-tionships for dinoflagellates, diatoms and other protistplankton. Limnol Oceanogr 45:569–579
Niemi Å (1973) Ecology of phytoplankton in the Tvärminnearea SW coast of Finland. I. Dynamics of hydrography,nutrients, chlorophyll a and phytoplankton. Acta Bot Fenn100:1–68
Niemi Å, Åström AM (1987) Ecology of phytoplankton in theTvärminne area, SW coast of Finland. IV: Environmentalconditions, chlorophyll a and phytoplankton in winter andspring 1984 at Tvärminne Storfjärd. Ann Bot Fenn 24:333–352
Ólafsson E, Elmgren R (1997) Seasonal dynamics of sublittoralmeiobenthos in relation to phytoplankton sedimentationin the Baltic Sea. Estuar Coast Shelf Sci 45:149–164
Olli K, Heiskanen AS (1999) Seasonal stages of phytoplank-ton community structure and sinking loss in the Gulf ofRiga. J Mar Syst 23:165–184
Olli K, Heiskanen AS, Lohikari K (1998) Vertical migration ofautotrophic micro-organisms during a vernal bloom at thecoastal Baltic Sea — coexistence through niche separation.Hydrobiologia 363:179–189
Öström B (1974) An algorithm for the computation of primayproduction. Bot Mar 17:20–22
Passow U (1991a) Species-specific sedimentation and sinkingvelocities of diatoms. Mar Biol 108:449–455
Passow U (1991b) Vertical migration of Gonyaulax catenataand Mesodinium rubrum. Mar Biol 110:455–463
Peinert R, von Bodungen B, Smetacek VS (1989) Food webstructure and loss rate. In: Berger WH, Smetacek VS,Wefer G (eds) Productivity of the ocean: past and present.John Wiley & Sons, Chicester, p 35–48
Rahm L (1987) Oxygen consumption in the Baltic proper.Limnol Oceanogr 32:973–978
Reynolds CS, Wiseman SW (1982) Sinking losses of phyto-plankton in closed limnetic systems. J Plankton Res 4:489–522
Rice JA (1993) Mathematical statistics and data analysis.Duxbury Press, Belmont, CA
Riebesell U (1989) Comparison of sinking and sedimentationrate measurements in a diatom winter/spring bloom. MarEcol Prog Ser 54:109–119
Smayda TJ, Boleyn BJ (1966) Experimental observationson the flotation of marine diatoms. III. Bacteriastrumhyalinum and Chaetoceros lauderi. Limnol Oceanogr 11:35–43
Smetacek V (1980) Annual cycle of sedimentation in relationto plankton ecology in western Kiel bight. Ophelia Suppl1:65–76
Smetacek V (1985) Role of sinking in diatom life-historycycles: ecological, evolutionary and geological signifi-cance. Mar Biol 84:239–251
Smetacek V, von Bröckel K, Zeitzschel B, Zenk W (1978)Sedimentation of particulate matter during a phytoplank-ton spring bloom in relation to the hydrographical regime.Mar Biol 47:211–226
Smetacek V, Passow U (1990) Spring bloom initiation andSvedrup’s critical-depth model. Limnol Oceanogr 35:228–234
Sommer U (1988) Some size relationships in phytoplanktonmotility. Hydrobiologia 161:125–131
Stigebrandt A (1991) Computations of oxygen fluxes throughthe sea surface and the net production of organic matterwith application to the Baltic and adjacent seas. LimnolOceanogr 36:444–454
Stigebrandt A (2001) Physical oceanography of the Baltic Sea.In: Wulff F, Rahm L, Larsson P (eds) A system analysisof the Baltic Sea. Ecological Studies Vol 148. Springer-Verlag, Heidelberg, p 19–74
Struck U, Pollehne F, Bauerfeind E, von Bodungen B (2004)Sources of nitrogen for the vertical particle flux in theGotland Sea (Baltic Proper) — results from sediment trapstudies. J Mar Syst 45:91–101
Tallberg P, Heiskanen AS (1998) Species-specific phyto-plankton sedimentation in relation to primary productionalong an inshore-offshore gradient in the Baltic Sea.J Plankton Res 20:2053–2070
Venrick EL (1978) How many cells to count? In: Sournia A (ed)Phytoplankton manual. monographs on oceanographicmethodology 6. UNESCO, Paris, p 167–180
von Bodungen B, von Bröckel K, Smetacek V, Zeitzschel B(1981) Growth and sedimentation of the phytoplanktonspring bloom in the Bornholm Sea (Baltic Sea). KielerMeeresforsch Sonderh 5:49–60
Waite A, Bienfang PK, Harrison PJ (1992a) Spring bloomsedimentation in a subarctic ecosystem. I. Nutrient sensi-tivity. Mar Biol 114:119–129
Waite A, Bienfang PK, Harrison PJ (1992b) Spring bloomsedimentation in a subarctic ecosystem. II. Succession andsedimentation. Mar Biol 114:131–138
Wasmund N, Nausch G, Matthäus W (1998) Phytoplanktonspring blooms in the southern Baltic Sea — spatio-temporal development and long-term trends. J PlanktonRes 20:1099–1117
Wassmann P (1991) Dynamics of primary production and sed-imentation in shallow fjords and polls of western Norway.Oceanogr Mar Biol Annu Rev 29:87–154
Wassmann P (1998) Retention versus export food chains:processes controlling sinking loss from marine pelagicsystems. Hydrobiologia 363:29–57
27
Editorial responsibility: Otto Kinne (Editor), Oldendorf/Luhe, Germany
Submitted: June 20, 2003; Accepted: July 22, 2004Proofs received from author(s): November 18, 2004