BAE SYSTEMS - DTIC
140
Annual Performance Technical Report Underwater Acoustic Data Communications for Autonomous Platform Command, Control and Communications 12 February 2001 Contract No. N00014-99-1-0208 Prepared For: Office of Naval Research (ONR) Ballston Centre Tower One Arlington, VA 22217-5660 Prepared By: BAE SYSTEMS Advanced Systems and Technology P. O. Box 868 Nashua, N. H. 03061-0868 DISTRIBUTION STATEMENT A Approved for Public Release Distribution Unlimited 20010226 077
-
Upload
khangminh22 -
Category
Documents
-
view
0 -
download
0
Transcript of BAE SYSTEMS - DTIC
Annual Performance Technical Report
Underwater Acoustic Data Communications for
Autonomous Platform Command, Control and Communications
12 February 2001
Contract No. N00014-99-1-0208
Prepared For: Office of Naval Research (ONR)
Ballston Centre Tower One Arlington, VA 22217-5660
Prepared By:
BAE SYSTEMS
Advanced Systems and Technology P. O. Box 868
Nashua, N. H. 03061-0868
DISTRIBUTION STATEMENT A Approved for Public Release
Distribution Unlimited 20010226 077
12 February 2001
Underwater Acoustic Data Communications for
Autonomous Platform Command, Control and Communications
12 February 2001
Signature, Title & Date
M. Shinego, Principal Investigator
Prepared By: i, Co-Principal Investigator
F. Menas, Principal Engineer
M. Richman, Principal Engineer
R. Nation, Co-Principal Investigator
E. Will, Co-Principal Investigator
Document Number 8346749 Rev. A
12 February 2001
Table of Contents
LIST OF TABLES 4
LIST OF FIGURES 5
1. INTRODUCTION 6
2. ACOUSTIC COMMUNICATIONS AS A DISCRIMINATOR 7
3. ENVIRONMENT OVERVIEW 8
3.1. CHANNEL VARIABILITY 8 3.2. MULTIPATH 8 3.3. CONVENTIONAL METHODS FOR DEALING WITH INTERSYMBOL INTERFERENCE 9
4. COMMUNICATIONS OVERVIEW 10
4.1. AMPLITUDE MODULATED SIGNALING 10 4.1.1. Selected Experimental Results 11
4.2. PULSE PERIOD MODULATION 12 4.2.1. Selected Experimental Results 12
4.3. PULSE CODE MODULATION 12 4.4. ANGLE MODULATED SIGNALING 13
4.4.1. Frequency Modulation 13 4.4.2. Frequency Shift Keying 14 4.4.3. Phase Shift Keying 14 4.4.4. Quadrature Amplitude Modulation 15
4.5. NON-COHERENT COMMUNICATIONS PROCESSING 15 4.5.1. Reliability Issues 16 4.5.2. Limitations 18 4.5.3. Selected Experimental Results 19
4.6. COHERENT COMMUNICATIONS PROCESSING 20 4.6.1. Channel Equalization 21 4.6.2. Selected Experimental Results 26 4.6.3. ACOMMS ATD Results 33
4.7. ALTERNATIVE MODULATION/DEMODULATION APPROACHES 43 4.7.1. Orthogonal Frequency Division Multiplexing 43 4.7.2. Equalization via System Identification 44 4.7.3. Phase-Encoded Frequency-Hopped Signaling 45
4.8. MULTI-USER COMMUNICATIONS 48 4.8.1. Time-Division Multiple Access 48 4.8.2. Frequency-Division Multiple Access 52 4.8.3. Code-Division Multiple Access 54 4.8.4. Other Networking Protocols 55
4.9. CLANDESTINE COMMUNICATIONS 57 4.9.1. Direct Sequence-Spread Spectrum 57 4.9.2. Frequency Hopped Spread Spectrum 60 4.9.3. Environmental/Biological Mimicry 62 4.9.4. High Frequency 63 4.9.5. Directional Transmit 64
5. SURVEY OF AT-SEA RESULTS AND MODEM IMPLEMENTATIONS 66
5.1. COMPILED AT-SEA RESULTS 66
3 Document Number 8346749 Rev. A
12 February 2001
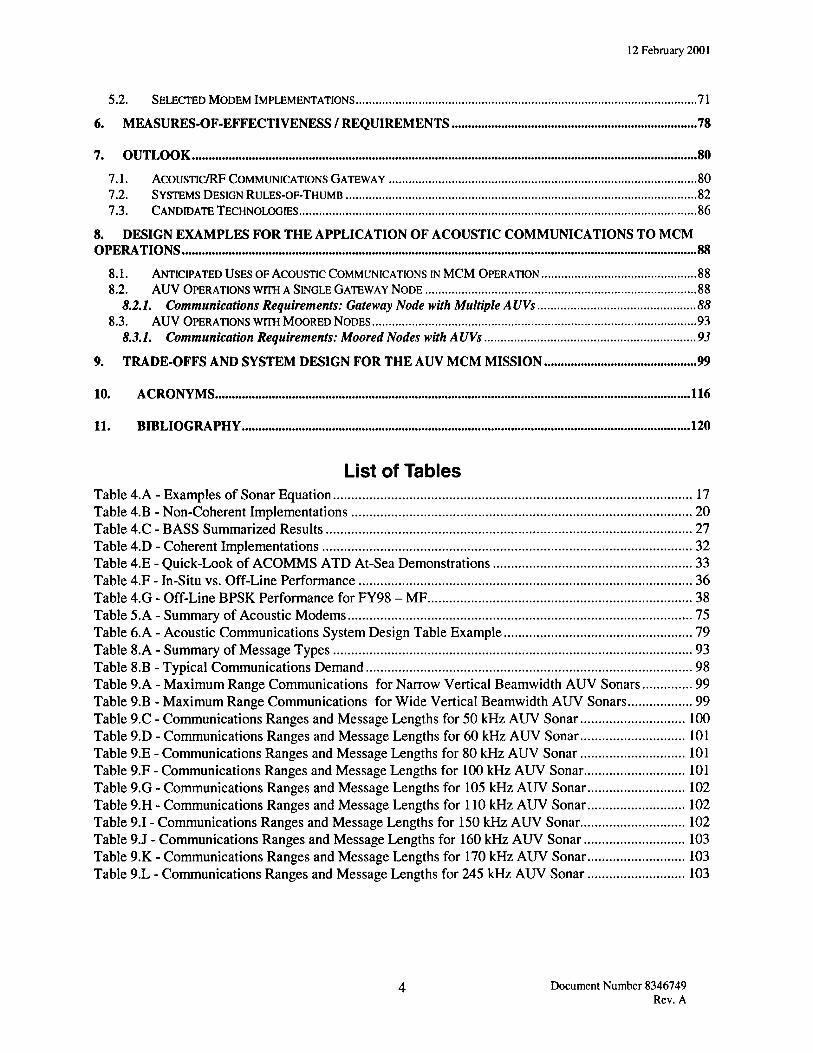
5.2. SELECTED MODEM IMPLEMENTATIONS 71
6. MEASURES-OF-EFFECTIVENESS / REQUIREMENTS 78
7. OUTLOOK 80
7.1. Acousnc/RF COMMUNICATIONS GATEWAY 80 7.2. SYSTEMS DESIGN RULES-OF-THUMB 82 7.3. CANDIDATE TECHNOLOGIES 86
8. DESIGN EXAMPLES FOR THE APPLICATION OF ACOUSTIC COMMUNICATIONS TO MCM OPERATIONS 88
8.1. ANTICIPATED USES OF ACOUSTIC COMMUNICATIONS IN MCM OPERATION 88 8.2. AUV OPERATIONS WITH A SINGLE GATEWAY NODE 88
8.2.1. Communications Requirements: Gateway Node with Multiple AUVs 88 8.3. AUV OPERATIONS WITH MOORED NODES 93
8.3.1. Communication Requirements: Moored Nodes with AUVs 93
9. TRADE-OFFS AND SYSTEM DESIGN FOR THE AUV MCM MISSION 99
10. ACRONYMS 116
11. BIBLIOGRAPHY 120
List of Tables Table 4.A -Examples of Sonar Equation 17 Table 4.B - Non-Coherent Implementations 20 Table 4.C - BASS Summarized Results 27 Table 4.D - Coherent Implementations 32 Table 4.E - Quick-Look of ACOMMS ATD At-Sea Demonstrations 33 Table 4.F - In-Situ vs. Off-Line Performance 36 Table 4.G - Off-Line BPSK Performance for FY98 - MF 38 Table 5.A - Summary of Acoustic Modems 75 Table 6.A - Acoustic Communications System Design Table Example 79 Table 8.A - Summary of Message Types 93 Table 8.B - Typical Communications Demand 98 Table 9.A - Maximum Range Communications for Narrow Vertical Beamwidth AUV Sonars 99 Table 9.B - Maximum Range Communications for Wide Vertical Beamwidth AUV Sonars 99 Table 9.C - Communications Ranges and Message Lengths for 50 kHz AUV Sonar 100 Table 9.D - Communications Ranges and Message Lengths for 60 kHz AUV Sonar 101 Table 9.E - Communications Ranges and Message Lengths for 80 kHz AUV Sonar 101 Table 9.F - Communications Ranges and Message Lengths for 100 kHz AUV Sonar 101 Table 9.G - Communications Ranges and Message Lengths for 105 kHz AUV Sonar 102 Table 9.H - Communications Ranges and Message Lengths for 110 kHz AUV Sonar 102 Table 9.1 - Communications Ranges and Message Lengths for 150 kHz AUV Sonar 102 Table 9.J - Communications Ranges and Message Lengths for 160 kHz AUV Sonar 103 Table 9.K - Communications Ranges and Message Lengths for 170 kHz AUV Sonar 103 Table 9.L - Communications Ranges and Message Lengths for 245 kHz AUV Sonar 103
Document Number 8346749 Rev. A
12 February 2001
List of Figures Figure 4.1 - Block Diagram of Single-Side-Band Amplitude Modulation 11 Figure 4.2 - Block Diagram of Frequency Modulated System 14 Figure 4.3 - Decision Feedback Equalizer Block Diagram 23 Figure 4.4 - Multichannel Decision Feedback Equalizer 26 Figure 4.5 - NBOA97 Shelf-Break (Wedge) Channel Responses 34 Figure 4.6 - NBOA97 Deep-Water Channel Responses 35 Figure 4.7 - NBOA98 Deep (a-d) and Shallow (e-h) Water Channel Responses 37 Figure 4.8 - FBE Echo Deep (a-d) and Shallow (e-h) Water Channel Responses 40 Figure 4.9 - HT99 Deep (a-d) and Shallow (e-h) Water Channel Responses 42 Figure 4.10 - Block Diagram of the EQSID Method in Decision Directed Mode 45 Figure 4.11 - Time-Frequency Representation of the ALAN Protocol 50 Figure 4.12 - BPSK DSSS Performance in an AWGN Channel 58 Figure 4.13 - BPSK DSSS Performance in a Rayleigh-Fading Channel 59 Figure 4.14 - Acoustic CHESS Performance in an AWGN Channel 62 Figure 4.15 - Acoustic CHESS Performance in a Rayleigh-Fading Channel 63 Figure 4.16 - High Frequency Acoustic Transmissions Configuration 64 Figure 5.1 - Compilation of Published Range-Rate Results 66 Figure 5.2 - Compilation of Published Range vs. Frequency Results 68 Figure 5.3 - Range vs. Frequency Results as a Function of Source Level 69 Figure 5.4 - Compilation of Published Efficiency Results 70 Figure 5.5 - Compilation of Published Data Rate vs. Frequency Results 71 Figure 7.1 - Test Configuration 80 Figure 7.2 - Real-Time Web Site with Data from the Demo 81 Figure 7.3 - Rules-of-Thumb, Throughput vs. Range 83 Figure 7.4 - Rules-of-Thumb, Throughput vs. Bandwidth 84 Figure 7.5 - Rules-of-Thumb, Range vs. Center frequency 85 Figure 7.6 - Rules-of-Thumb, Processing Load vs. Bandwidth 86 Figure 9.1 - ALS Center Frequency vs. Range as a Function of Message Length 104 Figure 9.2 - Message Length vs. Range as a Function of ALS Center Frequency 105 Figure 9.3 - Message Transmission Time vs. Message Length for 50 kHz AUV Sonar 106 Figure 9.4 - Message Transmission Time vs. Message Length for 60 kHz AUV Sonar 107 Figure 9.5 - Message Transmission Time vs. Message Length for 80 kHz AUV Sonar 108 Figure 9.6 - Message Transmission Time vs. Message Length for 100 kHz AUV Sonar 109 Figure 9.7 - Message Transmission Time vs. Message Length for 105 kHz AUV Sonar 110 Figure 9.8 - Message Transmission Time vs. Message Length for 110 kHz AUV Sonar Ill Figure 9.9 - Message Transmission Time vs. Message Length for 150 kHz AUV Sonar 112 Figure 9.10 - Message Transmission Time vs. Message Length for 160 kHz AUV Sonar 113 Figure 9.11 - Message Transmission Time vs. Message Length for 170 kHz AUV Sonar 114 Figure 9.12 - Message Transmission Time vs. Message Length for 245 kHz AUV Sonar 115
Document Number 8346749 Rev. A
12 February 2001
1. Introduction The purpose of this study is to provide an analysis and assessment of the state-of-the-art of underwater acoustic (UWA) data communications technology with application to multiple vehicle operation in support of shallow-water mine countermeasures (MCM) operations. This document is intended to provide system architects with a reference to what the current state of acoustic communications technology can provide and to support the execution of system architecture trades. Included are discussions and analyses that may be used to predict the performance, strengths, and limitations of different approaches to acoustic communications in facilitating the overall MCM system approach.
UWA communications is one technology that provides autonomous undersea vehicles (AUVs) with the potential to effectively perform shallow-water missions that would not otherwise be possible with present MCM assets [Bovio99]. Conversely, the bandwidth limitation imposed by the environment and existing transducers, in turn, limits the MCM concepts of operations when multiple AUV assets are considered.
Not only does the underwater environment constrain the data rates achievable but it also limits the maximum ranges achievable. Acoustic attenuation in the ocean is frequency-dependent with higher frequencies propagating shorter distances. The requirement to provide connectivity to submerged Naval assets over very long ranges is unlikely to be met directly with a single acoustic link due to the complex effects of acoustic propagation and limited propagation ranges. One solution is to create an UWA network of communications nodes. Another solution to this requirement is to use a buoy to convert acoustic signals to and from radio frequency (RF) signals. This solution provides real-time two-way communications to distant surface ships, aircraft and/or satellites that can act as relays to integrate undersea communications into the RF-based communications network.
The next section provides some insight into some of the advantages derived from using acoustic communications with AUVs. The third section addresses the complexity of the UWA environment and the resulting effects on the communications signal. Section 4 presents a detailed analysis of communications technologies for the UWA environment including standard and novel modulation/demodulation approaches, multi-user communications, and non-overt signaling. This section also describes selected experimental results. Figures summarizing achieved data rates, ranges, and bandwidths as functions of one another are presented and discussed in Section 5. This section also contains a survey of UWA modem implementations.
Section 6 presents a list of measures-of-effectiveness and an approach for using these measures for system comparison. The seventh section contains an outlook toward the future of UWA data communications. It contains subsections on an acoustic/RF communications node concept, on UWA communications design rules-of-thumb for designers of an overall MCM concept, and on technologies that are likely to provide breakthroughs in UWA communication. The acoustic communications requirements for two example MCM system designs are detailed in Section 8. Acoustic communications parameter trade-offs and system design for application to the AUV MCM mission are presented in Section 9.
The final two sections contain a listing of the acronyms and a bibliography of the material used in the preparation of this study, respectively.
This study was sponsored by the Office of Naval Research (initially Dr. Randall S. Jacobson, ONR- 32 ITS and currently Dr. Thomas B. Curtin, ONR-3220M).
Document Number 8346749 Rev. A
12 February 2001
2. Acoustic Communications as a Discriminator The conclusion that multiple vehicles must be deployed in order to accomplish thorough, timely, cost- effective underwater mine reconnaissance using autonomous undersea vehicles is quite widespread. If the vehicles are not to be recovered, a means of communicating mission results back to user must be provided. It is generally acknowledged that tethered operation (by fiber or copper) is not a workable solution for a number of reasons. This leaves radio and acoustic communications.
Beyond the communication of mission product data to the user, acoustic communications may be employed alone or in conjunction with radio communications to enhance the mission effectiveness of a multi-AUV based mine reconnaissance system.
Acoustic data interconnection enhances the robustness of a multi-platform system. Acoustic communications can provide the command and control link from the operator to the vehicle(s). Using such a link, an operator can modify vehicle tasking to suit changing conditions. As the vehicle does not need to break task to receive acoustic messages, only acoustic communications can be used asynchronously to modify vehicle tasking.
If vehicle status is transmitted, the system can respond to changing conditions, such as the loss of a vehicle or the failure of its sensor(s). Depending on the sophistication of the vehicles, this retasking could take place without operator intervention.
Depending on the operating area and the technical sophistication of the adversary, acoustic communications can be considered completely clandestine. This trait provides flexibility to the system architect because acoustic communications technology spans a wide range of capabilities and costs.
Ultimately, the details of what UWA communications can add in terms of enhanced overall MCM system performance and/or in terms of providing new MCM system capabilities can best be measured by how the MCM system-level measures-of-effectiveness are improved. Within the framework of the MCM system itself, the different signaling technologies can be compared and the communications system design trades made.
Document Number 8346749 Rev. A
12 February 2001
3. Environment Overview It has been proposed that MCM capabilities can be significantly improved by incorporating timely measures of the shallow-water environment into the MCM operation [Tubridy98]. Appropriately instrumented AUVs can provide in-situ measures of parameters such water depth, currents, water column properties, sound speed, and propagation conditions back to the MCM commander via a system based, at least in part, on UWA communications. The environment not only affects the performance of the MCM sensors but also affects UWA communications performance.
From the perspective of communications, the characteristics of the UWA channel drive the design of any system. The UWA environment presents a bandlimited communications channel that causes temporal and frequency dispersion of the signal [Quazi82, Baggeroer84, Catipovic90c]. The Doppler spreading is caused by relative motion of the platform, surface, and the ocean volume. The multipath is most-often caused by reflections of the acoustic energy off the surface and bottom. The environment also imposes absorption and geometric spreading losses as a function of frequency and high levels of ambient noise especially in shallow water.
3.1. Channel Variability Any environment has unique deterministic properties that are defined by the bathymetry and the geo- acoustic parameters of the bottom, and the sound speed profile. Long-term variability of these properties observed at a given location can result from seasonal or large-scale oceanographic phenomena.
The non-stationary ocean environment causes the stochastic variability of acoustic signals. Very short- term variability (VSTV) in the fine- and micro-structure can cause phase and amplitude fluctuations within the duration of a signal. Short-term variability (STV) in the internal wave pattern perturbs the local sound speed profile and fluctuates the coherence of the acoustic field between signals received at the same location. VSTV affects signal-related statistics between receivers and the STV serves to create different propagation paths.
Variability can also be introduced by the tactics/dynamics of the transmitters and receivers. Changes in geometry over time caused by forward motion, depth excursions, etc. result in variations in the acoustic propagation paths between signals and potentially within the signal duration. For example, the delay between a direct path and a bottom-bounced arrival in an isovelocity channel is given by
A x
c cos a 1
where a = tan x{lylx), c is the speed of sound, x is the distance between the source and receiver, and y is the source and receiver elevation over the bottom. For small ylx ratios, the interpath time delay varies as the square of the elevation.
3.2. Multipath The UWA channel, particularly in shallow water, is also characterized by rapidly fluctuating multipath [Catipovic90c]. Sound is refracted by inhomogeneities in the water and reflected by boundaries. The inhomogeneities and surface are constantly moving. Only the boundary represented by the ocean bottom is considered to be fixed, especially if the source and receiver are moving. The net result of this motion is that sound transits from transmitter to receiver over a multiplicity of paths, each path changing over time. Depending on the exact transit time for a path, it may combine constructively or destructively at the receiver with another path or paths. This can result in deep, rapidly changing, and severely localized
Document Number 8346749 Rev. A
12 February 2001
fading. In severe shallow-water environments, the time scale for these channel fluctuations can be on the order of tenths of seconds.
Another effect of multipath arrivals is that of intersymbol interference (ISI). ISI occurs in multipath channels energy from different transmitted symbols arrives at the receiver simultaneously. The act of recovering data from a transmitted signal is that of deciding which symbol was actually sent. This estimation is made difficult if multiple, overlapping, delayed versions of a sequence of symbols is received.
3.3. Conventional Methods for Dealing with Intersymbol Interference ISI severely challenges any data communications system's ability to accurately recover the transmitted data. Three straightforward methods can be employed to counteract its effect [Baggeroer84]. These methods, however, limit data rate performance.
The first is to sustain each symbol for a time much greater than the duration of the ISI. Thus, the receiver can observe the signal during the interval when only a single symbol is present. The problem with this method is that since the symbol duration is artificially prolonged, it severely limits the achievable data rate [Widmer93].
The second method is to shorten the duration of the entire message to a time less than the difference between successive arrivals of the signal [Howe92, Edelson98]. This allows the receiver to capture the entire message prior to the onset of any ISI. The problem with this method is that the required signal bandwidth is proportional to the symbol rate. Shortening the symbols in order to pack more into the available time requires additional bandwidth that may not be available.
The third method of dealing with multipath is to use beamforming to receive only a single arrival. The problem with this method is that the available signal energy is distributed over all the multipath arrivals. To isolate and use only one is to throw away a good portion of the available signal resulting in degraded signal to noise at the receiver.
Document Number 8346749 Rev. A
12 February 2001
4. Communications Overview Acoustic telemetry from underwater submersibles and sensors has been researched and tested since it was recognized that the ocean was able to support signal transmission. Because of the attenuation properties of the ocean, the transmission of information between a source and receiver underwater has been achieved most reliably by the use of sound. Sound is taken here to include frequencies both well above and well below the range of human hearing. Many of the advances in underwater acoustic (UWA) communications have come from the Navy needs for communications with submarines, and other government interests.
While an information bearing signal on a wire may be transduced directly into pressure fluctuations proportional to the instantaneous signal voltage, the characteristics of the underwater acoustic environment, as well as the equipment used to transmit and receive sound underwater, make this impractical. The underwater acoustic environment and equipment limitations are analogous to those encountered in using radio signals to convey information above the waterline. The limitations give rise to the same need to perform frequency translation in order to transmit information. The process of frequency translation is a reversible one where the spectrum of the information bearing signal is shifted to a frequency range more conducive to transmission.
As outlined in the previous section, due to absorption losses, low frequencies propagate farther underwater than high frequencies. So frequency translation may be employed to ensure adequate link range. Translation also may be employed to limit link range as a means of providing privacy.
However, acoustic transmitters operate effectively only when their dimensions are of the order of magnitude of the wavelength of the signal transmitted. Thus practical physical considerations place a lower limit on the frequency range employed. The practical limitation on bandwidth for acoustic transmitters is one to two octaves. For a given transmit power, information theory dictates that channel information capacity increases with bandwidth. To increase the link information rate, the operating frequencies must be increased.
Finally, frequency translation may be employed to avoid frequency bands already occupied by other signals such as noise or other natural and manmade signals. This may be done so as not to interfere with other users.
Frequency translation is accomplished by multiplying the information-bearing signal with an auxiliary sinusoidal signal known as a carrier signal. This modulation of a carrier signal may be performed in a number of different ways. Common forms of modulation include amplitude modulation, pulse position modulation, pulse code modulation, angle modulation, and hybrids of those methods.
4.1. Amplitude Modulated Signaling In amplitude modulation (AM), the amplitude of the information signal is used to vary the transmitted level of the carrier signal. Through multiplication, the information-bearing signal m(t) is impressed on the amplitude of the carrier signal. Thus, the signal that is transmitted is of the form
y(t) = m(t) x Acos(coct)
Here the signal m(t) is the signal to be transmitted, and y(t) is the modulated signal that is transmitted through the water. Demodulation consists of removing the carrier signal from the received waveform.
A form of AM useful for digital communications is amplitude shift keying (ASK) modulation or pulse amplitude modulation (PAM). Given digital data for transmission, a signal is generated by representing a T bit by the presence of a tone and a '0' bit by the absence of a tone. Alternatively, a T bit corresponds
10 Document Number 8346749 Rev. A
12 February 2001
to the acoustic transducer being on (a tone is transmitted) and a '0' bit corresponds to the acoustic transducer being off (a tone is not transmitted). For this reason, ASK is also known as On-Off Keying (OOK).
4.1.1. Selected Experimental Results The best known example of the use of amplitude modulation for underwater communication is probably the US Navy's AN/WQC-2 (Gertrude). The AN/WQC-2 system is a single sideband (SSB) analog voice transmission system that employs existing platform mid-frequency (MF) sonars for transmission and reception [Quazi82]. Three fundamental limitations result from its being an analog voice system.
First, analog systems tend not to be suited to exchanging large amounts of data, tactical or otherwise. Being an analog system also limits the amount of signal processing that may be employed to aid intelligibility at the receiver. In particular, multipath is not cancelled, so the signal becomes less intelligible as multipath levels increase. That the AN/WQC-2 is usable at all is due to the fact that there is a man in the loop who can understand speech in a crowded, noisy environment.
Second, SSB voice transmission makes very poor use of available transmitter power. The average amplitude, and hence power, of a voice signal is a small fraction of its peak amplitude. The transmitted power of an AN/WQC-2 signal is often as much as 30dB below the peak available sonar transmit power. This peak sonar transmit power can be achieved only for constant amplitude signals.
Third, analog voice systems are hard to make secure. Voice scramblers are difficult to implement, particularly for the underwater acoustic environment. Digital methods of encryption are not feasible, as there is no obvious way to adapt this system for the transfer of digital data.
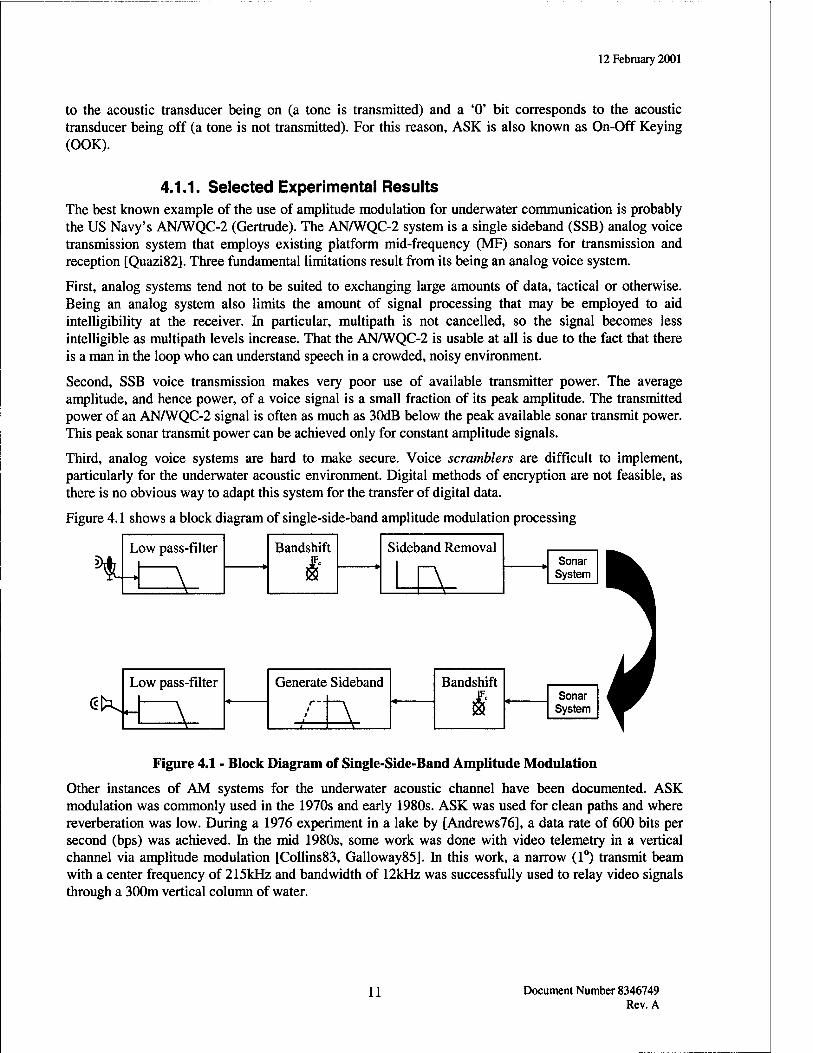
Figure 4.1 shows a block diagram of single-side-band amplitude modulation processing
2) tJ Low pass-filter
1 Bandshift Sideband Removal
Sonar System
«KJ Low pass-filter
1 Generate Sideband Bandshift
Sonar System
Figure 4.1 - Block Diagram of Single-Side-Band Amplitude Modulation
Other instances of AM systems for the underwater acoustic channel have been documented. ASK modulation was commonly used in the 1970s and early 1980s. ASK was used for clean paths and where reverberation was low. During a 1976 experiment in a lake by [Andrews76], a data rate of 600 bits per second (bps) was achieved. In the mid 1980s, some work was done with video telemetry in a vertical channel via amplitude modulation [Collins83, Galloway85]. In this work, a narrow (1°) transmit beam with a center frequency of 215kHz and bandwidth of 12kHz was successfully used to relay video signals through a 300m vertical column of water.
11 Document Number 8346749 Rev. A
12 February 2001
4.2. Pulse Period Modulation In pulse position modulation (PPM), the temporal positions of transmitted pulses are varied in accordance with some characteristic of the information signal. In analog PPM, a short transmitted pulse is delayed with respect to the sampling start by an amount that is linearly proportional to the amplitude of the information signal. Digital PPM (DPPM) exhibits greater bandwidth efficiency than its analog counterpart and is less complex to implement. However, DPPM is more sensitive than analog PPM to synchronization errors.
4.2.1. Selected Experimental Results An early UWA communication system that employs the use of time delays to transmit information is the Navy's AN/WQC-6 (ProbeAlert). The AN/WQC-6 system is, in essence, an acoustic Morse code signaling scheme using continuous wave (CW) transmission. This system allows the transfer of small amounts of digital information by transmitting a known waveform with various time delays. The received signal is correlated against delayed versions of itself, so that the delay between transmissions can be measured. These delays are then converted to digital information.
This method overcomes the average versus peak power problem of the AM-based AN/WQC-2. Given that it is a data transmission, it can easily be made secure. The AN/WQC-6 does not, however, have very high data rates (the actual rate is classified). The system is generally used with a set of preformatted messages in order to confine the transmitted data to as few bits as possible. This method of employment severely restricts the flexibility of the system. For transfer of sensor data as would be done with an Unmanned Underwater Vehicle (UUV) data link, its data rate is completely inadequate.
[Smith93] reports that Sonardyne developed a PPM operating in a frequency range of 8 to 50kHz and a communications range of up to 5km. In addition, [Woodward96] reports on a DPPM system designed to establish voice communications between a pair of divers or divers and a surface ship. This system involves transmitting 3 bit frames of 1.25ms each. Within each frame are 8 time slots of 125^s each, plus a 250|j.s guard band. The three bits are encoded by transmitting a signal during only one of the 8 time slots in each frame. The receiver attempted to decode the data by determining which time slot had the most received energy. Synchronization pulses are occasionally added between frames. There have been no reports of testing this system outside of a laboratory. The system seems unlikely to work reliably except under benign conditions because the simple receiver design does not adequately address the problems associated with multipath.
An enhanced version of PPM, referred to as sequence position modulation (SPM), is introduced for acoustic communications in [Sanchez99] and discussed in [PreisigOO]. SPM uses signals phase modulated by maximum-length sequences, or m-sequences, that have wide bandwidth as well as good auto-correlation and cross-correlation properties. The data is encoded in the relative delay between the transmission of different sequences. For example, two bits of information can be communicated via a transmitter that sends two sequences with any of four delays between them. If the receiver can resolve the arrival time of a sequence to within one half of the smallest of the possible delays, the signal can be successfully demodulated. The system was tested in a time-varying surf-zone environment using 6 m- sequences. Performance depends on the ability to resolve arrival times and the stability of the arrival time over the duration of the sequence transmissions.
4.3. Pulse Code Modulation Pulse code modulation (PCM), differential PCM (DPCM), and adaptive DPCM (ADPCM) are techniques for converting analog waveforms to digital signals, and are frequently used for speech. When performing
12 Document Number 8346749 Rev. A
12 February 2001
speech conversion, PCM typically results in a data rate of 64kbps, while ADPCM typically results in 16, 24, 32, or 40bps (according to the standards of the International Telecommunications Union standards).
It would be possible to transmit digital data by converting it to an analog waveform by one of these techniques, then transmitting the resulting analog waveform, and converting back to digital on the receiving side. There would typically be referred to as amplitude modulation, which is essentially an analog transmission technique.
PCM refers to representing analog waveforms in discrete amplitude steps, typically with a fixed sample rate, as would be generated by an analog to digital converter. DPCM performs the same conversion, but instead of storing the full amplitude value for each conversion, it just stores the difference between successive samples, allowing the use of fewer bits for each sample. ADPCM is DPCM where the number of bits used to represent each sample is allowed to vary.
The digital data generated by converting analog waveforms to digital data streams via one of these techniques could be transmitted via any of the time-delay, non-coherent, or coherent communications techniques described in this report. However, in this context, PCM, DPCM, and ADPCM are not modulation techniques that can be used directly for acoustic communications.
4.4. Angle Modulated Signaling In angle modulation, the amplitude of the information signal is used to vary the transmitted frequency (frequency modulation) or phase (phase modulation) of the carrier signal.
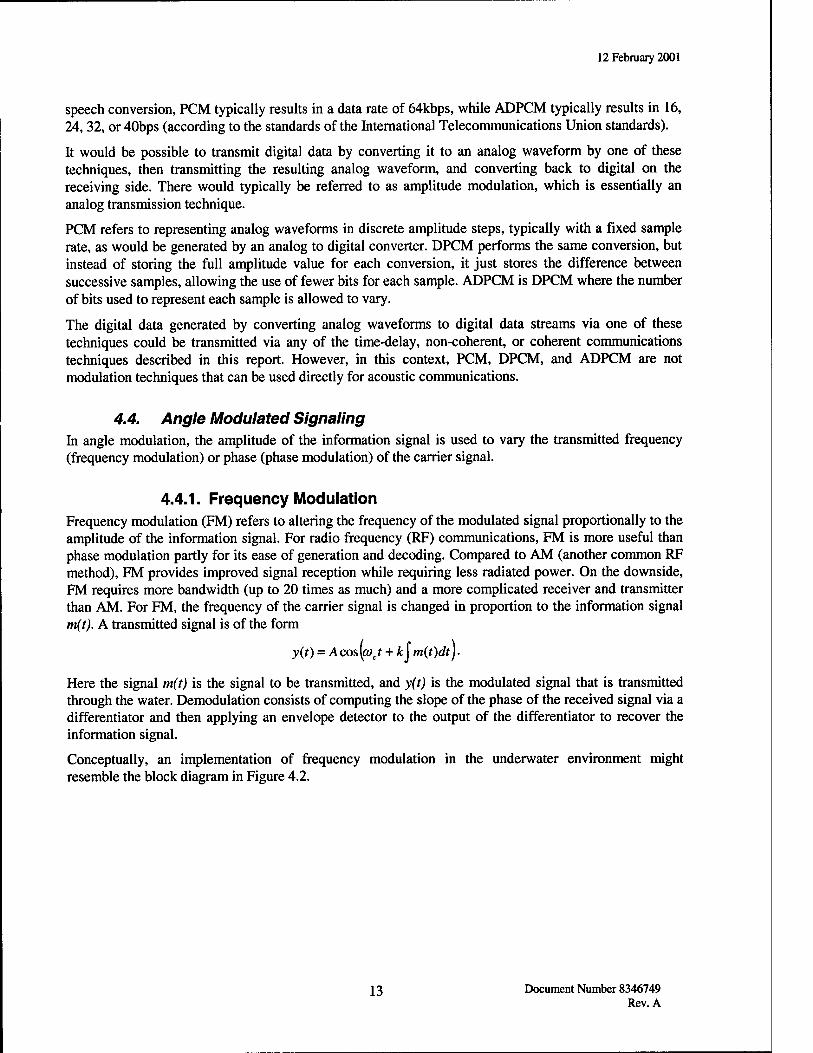
4.4.1. Frequency Modulation Frequency modulation (FM) refers to altering the frequency of the modulated signal proportionally to the amplitude of the information signal. For radio frequency (RF) communications, FM is more useful than phase modulation partly for its ease of generation and decoding. Compared to AM (another common RF method), FM provides improved signal reception while requiring less radiated power. On the downside, FM requires more bandwidth (up to 20 times as much) and a more complicated receiver and transmitter than AM. For FM, the frequency of the carrier signal is changed in proportion to the information signal m(t). A transmitted signal is of the form
y(t) = Acos\fOct + k\m{t)dtj-
Here the signal m(t) is the signal to be transmitted, and y(t) is the modulated signal that is transmitted through the water. Demodulation consists of computing the slope of the phase of the received signal via a differentiator and then applying an envelope detector to the output of the differentiator to recover the information signal.
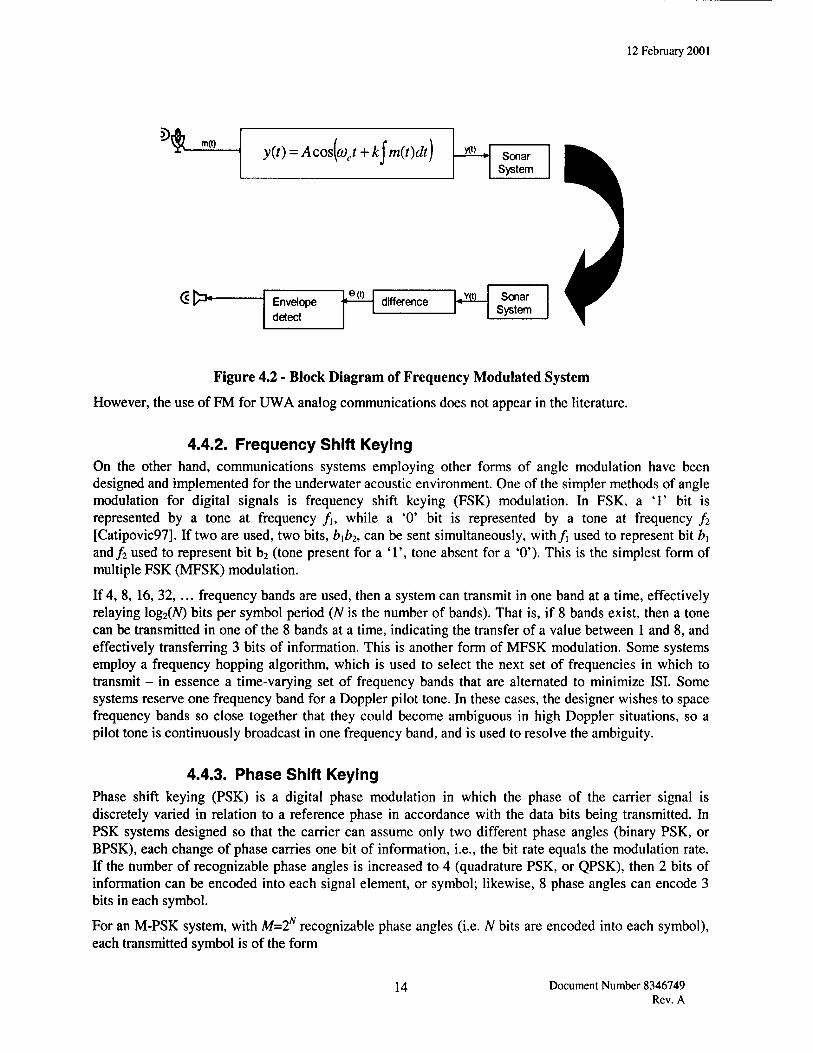
Conceptually, an implementation of frequency modulation in the underwater environment might resemble the block diagram in Figure 4.2.
13 Document Number 8346749 Rev. A
12 February 2001
<st> H(t) ,Y(t) Sonar System
]4 Envelope detect
difference
Figure 4.2 - Block Diagram of Frequency Modulated System
However, the use of FM for UWA analog communications does not appear in the literature.
4.4.2. Frequency Shift Keying On the other hand, communications systems employing other forms of angle modulation have been designed and implemented for the underwater acoustic environment. One of the simpler methods of angle modulation for digital signals is frequency shift keying (FSK) modulation. In FSK, a T bit is represented by a tone at frequency fu while a '0' bit is represented by a tone at frequency f2
[Catipovic97]. If two are used, two bits, bib2, can be sent simultaneously, with/j used to represent bit b\ and/2 used to represent bit b2 (tone present for a T, tone absent for a '0'). This is the simplest form of multiple FSK (MFSK) modulation.
If 4, 8, 16, 32, ... frequency bands are used, then a system can transmit in one band at a time, effectively relaying log2(A0 bits per symbol period (JV is the number of bands). That is, if 8 bands exist, then a tone can be transmitted in one of the 8 bands at a time, indicating the transfer of a value between 1 and 8, and effectively transferring 3 bits of information. This is another form of MFSK modulation. Some systems employ a frequency hopping algorithm, which is used to select the next set of frequencies in which to transmit - in essence a time-varying set of frequency bands that are alternated to minimize ISI. Some systems reserve one frequency band for a Doppler pilot tone. In these cases, the designer wishes to space frequency bands so close together that they could become ambiguous in high Doppler situations, so a pilot tone is continuously broadcast in one frequency band, and is used to resolve the ambiguity.
4.4.3. Phase Shift Keying Phase shift keying (PSK) is a digital phase modulation in which the phase of the carrier signal is discretely varied in relation to a reference phase in accordance with the data bits being transmitted. In PSK systems designed so that the carrier can assume only two different phase angles (binary PSK, or BPSK), each change of phase carries one bit of information, i.e., the bit rate equals the modulation rate. If the number of recognizable phase angles is increased to 4 (quadrature PSK, or QPSK), then 2 bits of information can be encoded into each signal element, or symbol; likewise, 8 phase angles can encode 3 bits in each symbol.
For an M-PSK system, with M=2N recognizable phase angles (i.e. N bits are encoded into each symbol), each transmitted symbol is of the form
14 Document Number 8346749 Rev. A
12 February 2001
y(t) = g(t)cos{(Oct + eml me{l Ml 0<t<T,
where g(t) is the signal pulse shape, 0m = (2/r/M) (m -1) is the assigned phase of the carrier signal, and T
is a time interval known as the symbol interval.
4.4.3.1. Differential Phase Shift Keying Differential phase shift keying (DPSK) is a variant of PSK modulation in which the phase of the carrier signal is discretely varied in relation to the phase of the immediately preceding signal element. The same set of phase values is used to transmit the data bits, but these values are now associated with the differences between the phases in two adjacent symbols rather than the actual phases themselves. The advantage of DPSK over PSK is that the receiver does not require a perfect reference phase. However, differentially coherent detection suffers from a performance loss as compared to coherent detection.
4.4.4. Quadrature Amplitude Modulation Quadrature amplitude modulation (QAM) improves upon amplitude modulation and phase modulation by combining the two. QAM uses two carrier signals out of phase by 90° and amplitude modulated by separate signals corresponding to two data sources. Each transmitted symbol is of the form
y(f) = Amc8(t)cos{(Oct)- Amsg(t)sm{coct),
where Amc and Ams are the information-bearing signal amplitudes of the quadrature carriers. In this formulation, the phase modulation aspect of QAM is not readily apparent. However, y(t) can equivalently be written as
y(t) = Vmg(t)cos(o)ct + <pm),
where Vm = -yA^ + A^s and $m = tan'1 (Ams / Amc). This expression more clearly indicates the
combination of phase and amplitude modulations involved in QAM.
4.5. Non-Coherent Communications Processing The limitations of UWA communication systems is a combination of the effects of multipath propagation and temporal channel variability that cause intersymbol interference (ISI) and strong phase fluctuations of the signal [Catapovic90c, Stojanovic96a]. These limiting factors led to non-coherent detection and low signaling rates for system design in the 1980' s. Non-coherent demodulation works well with lower signal-to-noise ratios (SNRs), uses less processing power, and usually costs lower to implement. Even though there are non-coherent methods like FSK modulation that are reliable, non-coherent systems make inefficient use of bandwidth underwater. Therefore, the major drawback with non-coherent modulation is that throughput is generally limited.
Non-coherent communications systems generally operate by transmitting a tone or set of tones for a short period of time (the tone or set of tones is called a symbol, and the period of time is a symbol period). The symbol period is generally selected to be at least as long as the expected channel multipath duration; if the symbol period is much longer than the multipath duration then decoding the symbols becomes easier.
When multipath is present, a tone that is transmitted for T seconds will be received for T+M seconds, where the additional M seconds accounts for the multipath. If T is much longer than M, then the effect is generally negligible, but if M is on the same order as T, then ISI is present, and the effect is time- smearing which can cause incorrect symbol decisions to be made. It is possible to reduce the effect of ISI through the use of an equalizer. Since the multipath conditions in the UWA channel tend not to be very stable, the filtering which makes up an equalizer is generally adaptive, and can become quite
15 Document Number 8346749 Rev. A
12 February 2001
complicated. While equalizers have been used with non-coherent signaling, they are generally very simple or not present.
4.5.1. Reliability Issues Non-coherent communications systems reliability depends on a few key issues:
• Sonar equation parameters
• Throughput versus multipath extent
• Frequency selective fading
• Temporal fading
• Spatial fading
Each of these topics is discussed here separately. The specifics of this section apply to non-coherent systems but the conceptual framework applies to coherent systems as well.
4.5.1.1. Sonar Equation Parameters The non-coherent receiver must determine which frequencies have been transmitted. As received SNR decreases, the probability of a decision error increases. The exact received SNR required for reliable operation of a receiver depends on the details of the design, the acceptable false alarm rate, and the environment. Typical received SNRs are approximately 7 to 12dB.
The one-way sonar equation, which is appropriate for communications, is
^^'Veceive = "transmit — L — IN + Ultransrrrit + i-'ireceive ■*■ *J>
where SNRreceive is the received SNR, Pmnsmit is the transmit power level, L is the one-way propagation loss, N is the ambient noise level in the band over which the signal must be detected, DI,,.^,,^ is the transmitters directivity gain, DIreceive is the receiver's directivity gain, and G is any other processing gain that the system may achieve. This equation can be used to estimate the received SNR, required transmit power level, or maximum acceptable propagation loss, if all other parameters are known.
Propagation losses can be modeled as spherical spreading plus absorption or can be looked up in tables of experimental results. Details of the spherical spreading plus absorption model can be found in any underwater acoustics textbook, but it is important to remember that this model assumes a constant speed of sound, which is rarely observed in nature. In general, the speed of sound varies with depth, causing some depths to be well ensonified. A number of experimental measurements are described in the report "Range Performance Summary Plots, Volume I, World and Representative SSPs", (available from Naval Undersea Warfare Center Division in Newport (NUWCDiVNPT)). This volume plots propagation losses versus range and expresses the percentage of environments in which these losses may be observed. In general, the measured propagation losses exceed the spherical spreading plus absorption model by a considerable margin.
The ambient noise level can be estimated from Wentz curves, or from experimental results if they are available. The effect of bandwidth on the system noise level is:
Nbw = N1Hz+101og10(BW)
where Nbw is the noise in the system's detection bandwidth, NiHz is the Wentz curve value for noise in a 1Hz bandwidth, and BW is the system's detection bandwidth.
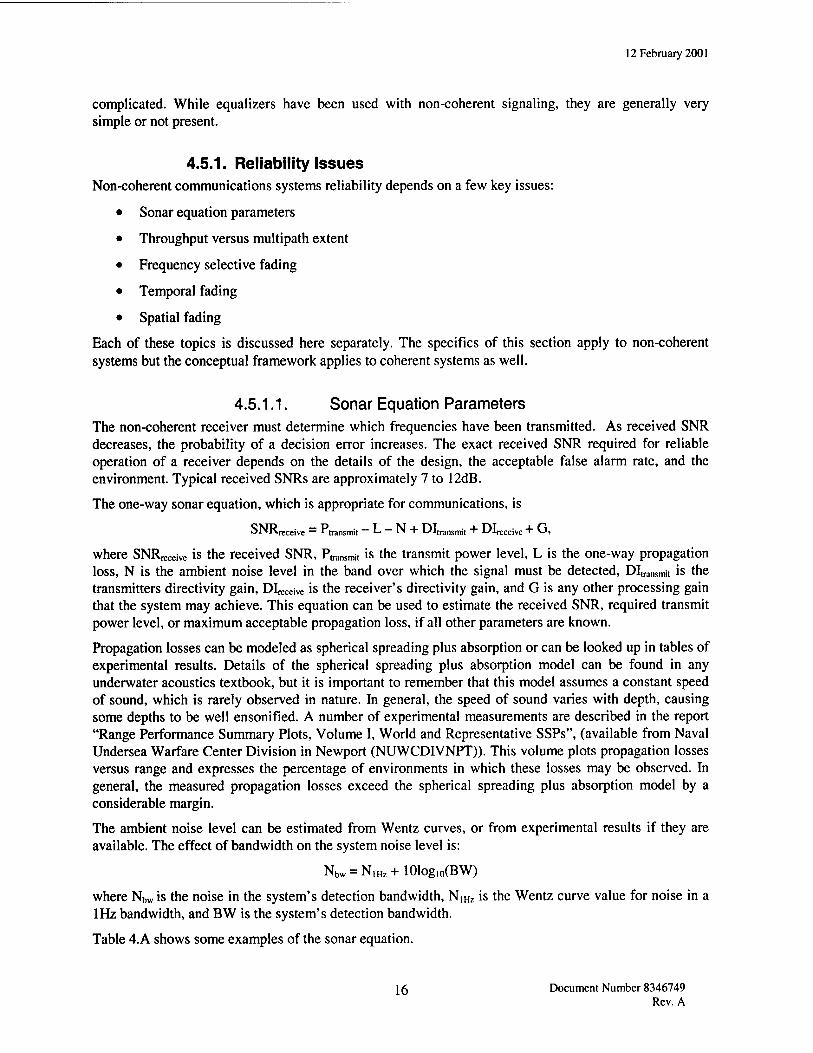
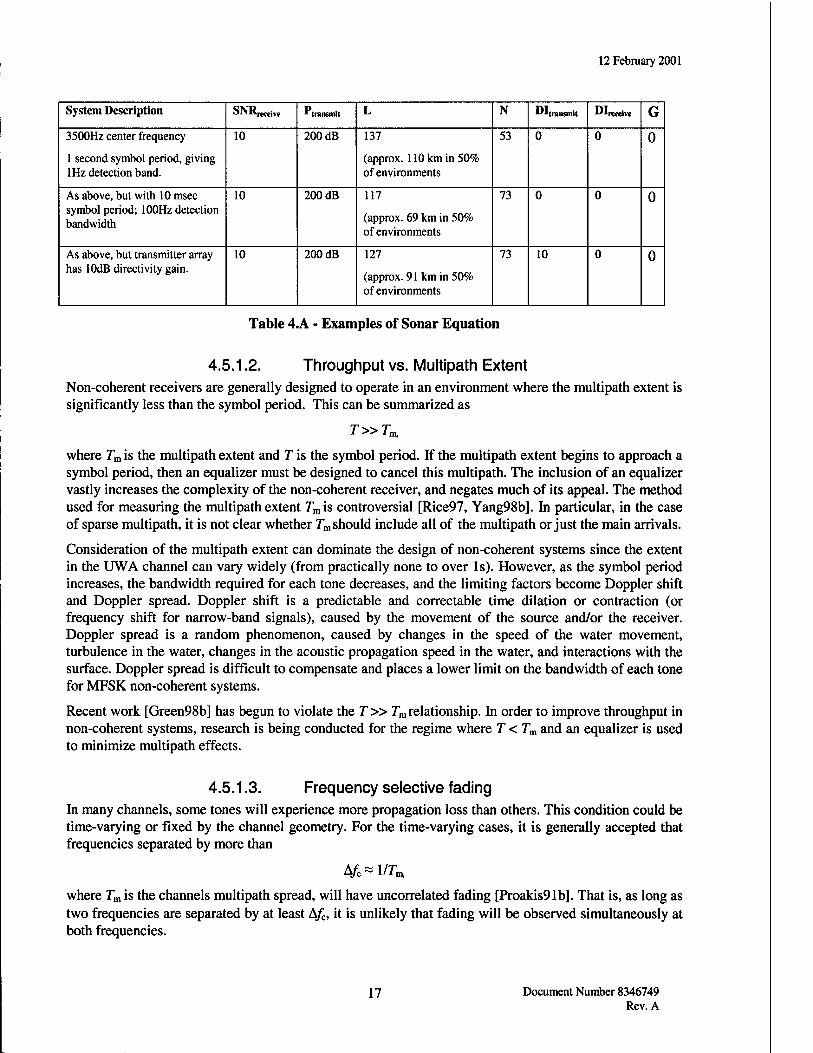
Table 4.A shows some examples of the sonar equation.
16 Document Number 8346749 Rev. A
12 February 2001
System Description aiNKrecejye "transmit L N Dltransmlt "^receive G 3500Hz center frequency
1 second symbol period, giving 1Hz detection band.
10 200 dB 137
(approx. 110 km in 50% of environments
53 0 0 0
As above, but with 10 msec symbol period; 100Hz detection bandwidth
10 200 dB 117
(approx. 69 km in 50% of environments
73 0 0 0
As above, but transmitter array has lOdB directivity gain.
10 200 dB 127
(approx. 91 km in 50% of environments
73 10 0 0
Table 4.A - Examples of Sonar Equation
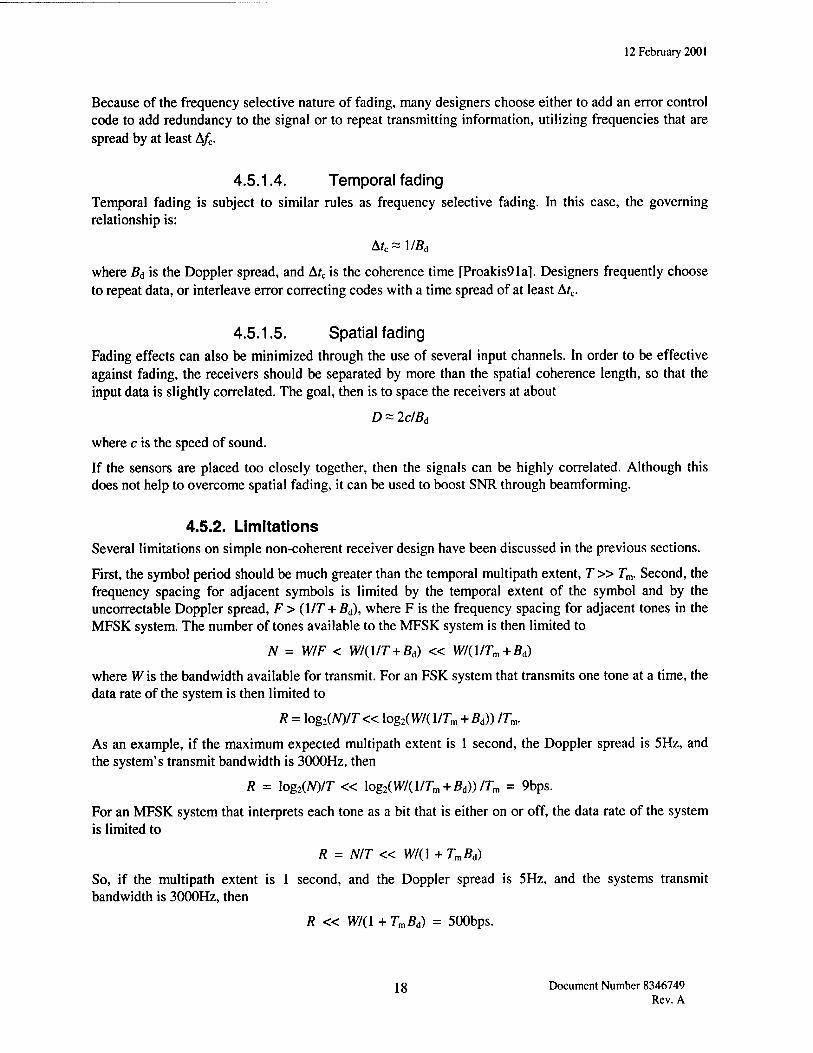
4.5.1.2. Throughput vs. Multipath Extent Non-coherent receivers are generally designed to operate in an environment where the multipath extent is significantly less than the symbol period. This can be summarized as
where Tm is the multipath extent and T is the symbol period. If the multipath extent begins to approach a symbol period, then an equalizer must be designed to cancel this multipath. The inclusion of an equalizer vastly increases the complexity of the non-coherent receiver, and negates much of its appeal. The method used for measuring the multipath extent Tmis controversial [Rice97, Yang98b]. In particular, in the case of sparse multipath, it is not clear whether Tm should include all of the multipath or just the main arrivals.
Consideration of the multipath extent can dominate the design of non-coherent systems since the extent in the UWA channel can vary widely (from practically none to over Is). However, as the symbol period increases, the bandwidth required for each tone decreases, and the limiting factors become Doppler shift and Doppler spread. Doppler shift is a predictable and correctable time dilation or contraction (or frequency shift for narrow-band signals), caused by the movement of the source and/or the receiver. Doppler spread is a random phenomenon, caused by changes in the speed of the water movement, turbulence in the water, changes in the acoustic propagation speed in the water, and interactions with the surface. Doppler spread is difficult to compensate and places a lower limit on the bandwidth of each tone for MFSK non-coherent systems.
Recent work [Green98b] has begun to violate the T» Tm relationship. In order to improve throughput in non-coherent systems, research is being conducted for the regime where T < Tm and an equalizer is used to minimize multipath effects.
4.5.1.3. Frequency selective fading In many channels, some tones will experience more propagation loss than others. This condition could be time-varying or fixed by the channel geometry. For the time-varying cases, it is generally accepted that frequencies separated by more than
A/c^l/7^
where Tm is the channels multipath spread, will have uncorrelated fading [Proakis91b]. That is, as long as two frequencies are separated by at least A/c, it is unlikely that fading will be observed simultaneously at both frequencies.
17 Document Number 8346749 Rev. A
12 February 2001
Because of the frequency selective nature of fading, many designers choose either to add an error control code to add redundancy to the signal or to repeat transmitting information, utilizing frequencies that are spread by at least Afc.
4.5.1.4. Temporal fading Temporal fading is subject to similar rules as frequency selective fading. In this case, the governing relationship is:
Atc~\/Bd
where Bd is the Doppler spread, and Atc is the coherence time [Proakis91a]. Designers frequently choose to repeat data, or interleave error correcting codes with a time spread of at least Atc.
4.5.1.5. Spatial fading Fading effects can also be minimized through the use of several input channels. In order to be effective against fading, the receivers should be separated by more than the spatial coherence length, so that the input data is slightly correlated. The goal, then is to space the receivers at about
D ~ 2clBd
where c is the speed of sound.
If the sensors are placed too closely together, then the signals can be highly correlated. Although this does not help to overcome spatial fading, it can be used to boost SNR through beamforming.
4.5.2. Limitations Several limitations on simple non-coherent receiver design have been discussed in the previous sections.
First, the symbol period should be much greater than the temporal multipath extent, T » Tm. Second, the frequency spacing for adjacent symbols is limited by the temporal extent of the symbol and by the uncorrectable Doppler spread, F > (1/T + Bd), where F is the frequency spacing for adjacent tones in the MFSK system. The number of tones available to the MFSK system is then limited to
N = WIF < WI(\IT + Bd) « W/(VTm + Bd)
where W is the bandwidth available for transmit. For an FSK system that transmits one tone at a time, the data rate of the system is then limited to
R = log2(A0/r «log2(W/(l/Tm + Bä)) ITm.
As an example, if the maximum expected multipath extent is 1 second, the Doppler spread is 5Hz, and the system's transmit bandwidth is 3000Hz, then
R = iog2(A0/r « iog2(w/(i/rm+ßd))/rm = %Ps.
For an MFSK system that interprets each tone as a bit that is either on or off, the data rate of the system is limited to
R = NIT « W/(l + TmBd)
So, if the multipath extent is 1 second, and the Doppler spread is 5Hz, and the systems transmit bandwidth is 3000Hz, then
R « W/(l + TmBd) = 500bps.
1 g Document Number 8346749 Rev. A
12 February 2001
Of course, practical limitations such as the need for error correcting codes, fade resistance, synchronization, and Doppler compensation will significantly reduce throughput. In cases where the multipath extent and/or the Doppler spread are known to be limited, the throughput of a non-coherent system could be significantly improved.
4.5.2.1. Diversity Processing One way to enhance the performance of a communications system is to employ some form of diversity processing. If many frequency bands are available for use, the same data may be transmitted in multiple bands simultaneously, in case one band had a frequency dependent fade at the transmission time. This is known as frequency diversity. Time diversity is implemented by transmitting the same signal at separate times to combat time-selective fading. The use of multiple receivers to combat spatially-selective fading is referred to as spatial diversity. Some systems split the available frequency band into two or more banks, switching banks every symbol period to minimize ISI effects.
4.5.3. Selected Experimental Results Acoustic telemetry systems in the 1970s and early 1980s were often based on FSK modulation. FSK was used when high reliability was needed and when reverberant acoustic channels existed. This is because FSK systems are robust to time and frequency spreading of the channel. Furthermore, the FSK modulation of digitally encoded data enabled the use of explicit error-correction techniques to increase reliability of transmissions and permitted some level of compensation for the channel reverberation both in time (multipath) and frequency (Doppler spreading) [Kilfoyle99, Garrood82].
A wide range ranges of data rates have been achieved using FSK modulation. Low data rates of less than 100bps were achieved by employing simple coding techniques to improve reliability. The use of FSK in combination with a parametric sonar that generated very narrow beams enabled getting the highest data rates at several kilobits per second with high signal-to-noise ratios. The limitations of using this technique were caused by the power requirements of the parametric sonars [Baggeroer84].
As processor technology improved, technologies that increased demodulation speeds were implemented. These included the use of frequency sweeps instead of tones as well as high-MFSK modulation. With the use of MFSK modulation in the early 1980s, systems operated as low as 40bps for data rates with very low error probability, less than 10"6 [Garrod81, Jarvis84]. MFSK systems did achieve data rates of 1200bps for short-range reverberant channels [Baggeroer81, Catipovic84]. Using linear acoustics that employed phase shift encoding, data rates reached 20kbps [Mackelburg81, Kearney84].
[Widmer93] describes a low-frequency, long-range incoherent MFSK communications system that was tested in 1991. This system used waveform blocks that span a bandwidth of 160Hz. Within each block, tones were transmitted at the low and high frequencies to measure and correct for Doppler. The block was then divided into 8 frequency bands corresponding to 8 bits of data, with guard bands separating the data bands. AT was represented by the presence of a tone, while a '0' was represented by the absence of a tone. At the transmitter, a block of data was encoded using a 3/4 convolutional encoder (which generated 4 encoded bits for every 3 data bits). After encoding, the data was interleaved to reduce the effects of errors on adjacent bits, and then the signal was modulated. At the receiver, a transmitted signal was automatically detected using criteria based on frequency coverage and duration. The beginning of a transmission was found by searching for the maximum energy over the duration of the communication, and the signal was corrected for Doppler. The received signal was deinterleaved, and a Viterbi decoder was used to recover the data bits.
Testing of this system occurred in both deep and shallow water at ranges of over 185km. For communications in the deep ocean with a surface duct, a bit error rate of 1.3% was observed. In the deep
19 Document Number 8346749 Rev. A
12 February 2001
ocean with a convergence zone, 88% of the messages were received without error. These error rates were measured for data rates of up to 40bps. In shallow water, a message success rate of 95% was measured for the same data rates.
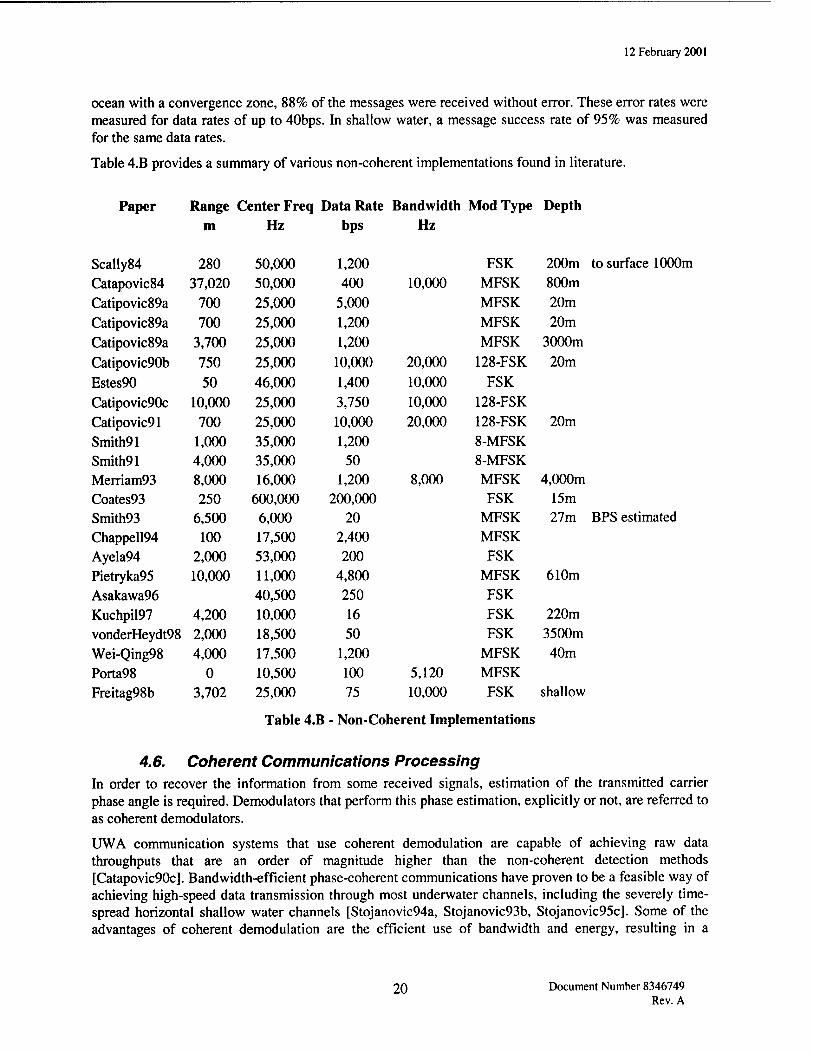
Table 4.B provides a summary of various non-coherent implementations found in literature.
Paper Range Center Freq Data Rate Bandwidth Mod Type Depth m Hz bps Hz
Scally84 280 50,000 1,200 FSK 200m to surface 1000m Catapovic84 37,020 50,000 400 10,000 MFSK 800m
Catipovic89a 700 25,000 5,000 MFSK 20m
Catipovic89a 700 25,000 1,200 MFSK 20m
Catipovic89a 3,700 25,000 1,200 MFSK 3000m
Catipovic90b 750 25,000 10,000 20,000 128-FSK 20m
Estes90 50 46,000 1,400 10,000 FSK
Catipovic90c 10,000 25,000 3,750 10,000 128-FSK
Catipovic91 700 25,000 10,000 20,000 128-FSK 20m
Smith91 1,000 35,000 1,200 8-MFSK Smith91 4,000 35,000 50 8-MFSK Merriam93 8,000 16,000 1,200 8,000 MFSK 4,000m Coates93 250 600,000 200,000 FSK 15m Smith93 6,500 6,000 20 MFSK 27m BPS estimated Chappell94 100 17,500 2,400 MFSK Ayela94 2,000 53,000 200 FSK
Pietryka95 10,000 11,000 4,800 MFSK 610m
Asakawa96 40,500 250 FSK
Kuchpil97 4,200 10,000 16 FSK 220m
vonderHeydt98 2,000 18,500 50 FSK 3500m
Wei-Qing98 4,000 17,500 1,200 MFSK 40m
Porta98 0 10,500 100 5,120 MFSK Freitag98b 3,702 25,000 75 10,000 FSK shallow
Table 4.B - Non-Coherent Implementations
4.6. Coherent Communications Processing In order to recover the information from some received signals, estimation of the transmitted carrier phase angle is required. Demodulators that perform this phase estimation, explicitly or not, are referred to as coherent demodulators.
UWA communication systems that use coherent demodulation are capable of achieving raw data throughputs that are an order of magnitude higher than the non-coherent detection methods [Catapovic90c]. Bandwidth-efficient phase-coherent communications have proven to be a feasible way of achieving high-speed data transmission through most underwater channels, including the severely time- spread horizontal shallow water channels [Stojanovic94a, Stojanovic93b, Stojanovic95c]. Some of the advantages of coherent demodulation are the efficient use of bandwidth and energy, resulting in a
20 Document Number 8346749 Rev. A
12 February 2001
potentially a higher data rate. The disadvantages are increased processing complexity, cost, and higher SNR required to maintain a given error rate [Porta98].
4.6.1. Channel Equalization The optimal demodulator for decoding digital signals received over channels that introduce ISI (see Section 3) in a background of additive Gaussian noise is the maximum-likelihood sequence estimator (MLSE) [Proakis95]. The MLSE receiver for decoding phase coherent modulated signals is unfortunately too impractical for use in underwater acoustic channels due to the symbol extent of the ISI. For channels of this type, signal processing techniques have been developed to compensate for the ISI caused by the multipath. These techniques are termed equalizers and can either be linear or nonlinear in their structure.
A linear equalizer consists of a finite impulse response filter with coefficients that can be updated over time. Linear equalizers are only used when the channel is not overly distorted. For many fading channels, particularly the shallow-water acoustic channel, spectral nulls can appear in the frequency response due to the time-varying multipath. Linear equalizers tend to provide higher gain in the regions near these nulls to compensate for the distortion, thereby amplifying the additive noise [Proakis91a].
Nonlinear equalization methods have been designed for linear channels that exhibit severe ISI-induced distortion. The most popular of these nonlinear techniques for UWA communications has been the decision-feedback equalizer (DFE). The underlying concept behind the DFE is that, after a symbol has been detected, its ISI contribution to future symbols can be estimated and removed. The DFE can be thought of as equalizing a channel in two steps: first, a feedforward section (linear filter) with coefficients {a[k^ shapes the overall response appropriately, and then the feedback section with coefficients {&[&]} uses previously recovered symbols (termed symbol decisions) to cancel postcursor ISI.
The output of a (nonsparse) DFE, d[n], which is an estimate of the current symbol to be recovered, can be expressed as
U M
ä[n}= ]£ a[*M"-*]+]£4t]rf[n-*] , *=-L, k=l
where z[n\ represents the baseband received data and d[n\ the symbol decisions. For a multiple input
receiver, e.g. a receive array, there will be one feedforward filter a, [n] for each array element i. For a
fractionally-spaced equalizer, the received data z[n] will arrive at some integer/times the rate of the
decisions d[n] and d[n] [Proakis95]. In the equation for d[n], L = Lx+L2 contiguous feedforward taps and M contiguous feedback taps are used. The goal of a sparse equalizer is to set as many of the values of a[k] and b[k] as possible to zero, while still correctly decoding the data or achieving some prescribed mean squared error (MSE).
4.6.1.1. Evolution of the current ACOMMS ATD equalizer The seminal work on the use of a DFE for the coherent processing of PSK signals collected in horizontal channels at sea was first reported in the early 1990s [Stojanovic93b, Stojanovic94a]. This original receiver algorithm design accounts for the combined time-varying multipath and the severe phase fluctuations exhibited by the horizontal underwater acoustic (UWA) channel. Adaptive channel tracking was addressed by a fractionally-spaced DFE that used a recursive least squares (RLS) algorithm in combination with a second-order phase-locked loop (PLL).
21 Document Number 8346749 Rev. A
12 February 2001
The inclusion of the PLL for phase synchronization within the DFE structure is primarily meant to deal with the rapid and/or large phase fluctuations caused by the channel. The receiver algorithm in [Stojanovic93b] and [Stojanovic94a] incorporates one PLL per channel at the output of the feedforward filter (FFF) to allow for phase synchronization to occur after equalization. Without the PLL, the basic DFE is only capable of correcting for constant phase offset and some slow variability in the phase by continuously varying the phase of the FFFs. The interaction between the DFE update algorithm and the PLL complicates the behavior of both.
This multichannel receiver structure had limited success across deep and shallow environments [Stojanovic94a] because it exhibited slow convergence and instabilities under certain conditions. These performance limitations were caused by the location of the PLLs and their potential to cause the RLS adaptation algorithm to diverge. The performance shortfall was handled by placing a PLL before each FFF rather than after [Johnson97].
More recently, investigations at the Woods Hole Oceanographic Institution (WHOI) have shown that a single PLL can be more robust when dealing with channels that require large feedforward sections [Freitag97a]. The robustness is derived from a basic decoupling of the PLL operation from the RLS operation (or the operation of a least mean squares algorithm) by applying the phase correction to the combined outputs of the feedforward and feedback filters. The single-PLL receiver has provided robust performance across a variety of channels [Freitag97b] and is currently the structure of record on the Acoustic Communications Advanced Technology Demonstration (ACOMMS ATD).
4.6.1.2. ACOMMS ATD Coherent Processing
4.6.1.2.1. Signal Preprocessor Several signal preprocessing functions are performed on the post-detected input signal prior to equalization using the DFE. The signal is frame synchronized to more precisely estimate the turn-on time of the signal in each input channel. The synchronization is performed by matched filtering to the frequency-modulated probe pulse. The magnitude of the matched filter output is used as an estimate of the channel impulse response.
Next the signal is processed to compensate for gross Doppler shift due to transmit/receive clock mismatch as well as interplatform relative motion. As there is no explicit symbol timing recovery built into the equalizer, it is necessary to compensate for any Doppler induced signal compression or dilation.
Doppler is estimated by picking the peak of a wide-band ambiguity function calculated over the duration of the training symbols [Johnson97]. This is performed by postulating a Doppler induced carrier offset and corresponding compaction/dilation of the training sequence, retuning a reference sequence (the training data) by that shift and correlating the frequency shifted sequence with the received signals. The set of correlator outputs forms an ambiguity surface.
The peak of this surface is found for each input channel. The location of the peak in frequency is used as the Doppler estimate. The signal is retuned by the mean Doppler carrier offset. Then, if the Doppler shift exceeds a programmable threshold, the signal is resampled to compensate for apparent Doppler induced signal compression or dilation. Resampling, if performed, is done to each input signal using a sliding interpolation filter. The slide of the filter is calculated to offset the Doppler.
After retuning and, possibly, resampling, the equalizer is initialized. An order estimation routine is performed to determine the size and relative locations of significant multipath energy so that filter support can be placed at these locations. The filter tap placement algorithm places feedforward taps based on the distribution of energy in the estimate of the impulse response and feedback taps based on thresholding.
22 Document Number 8346749 Rev. A
12 February 2001
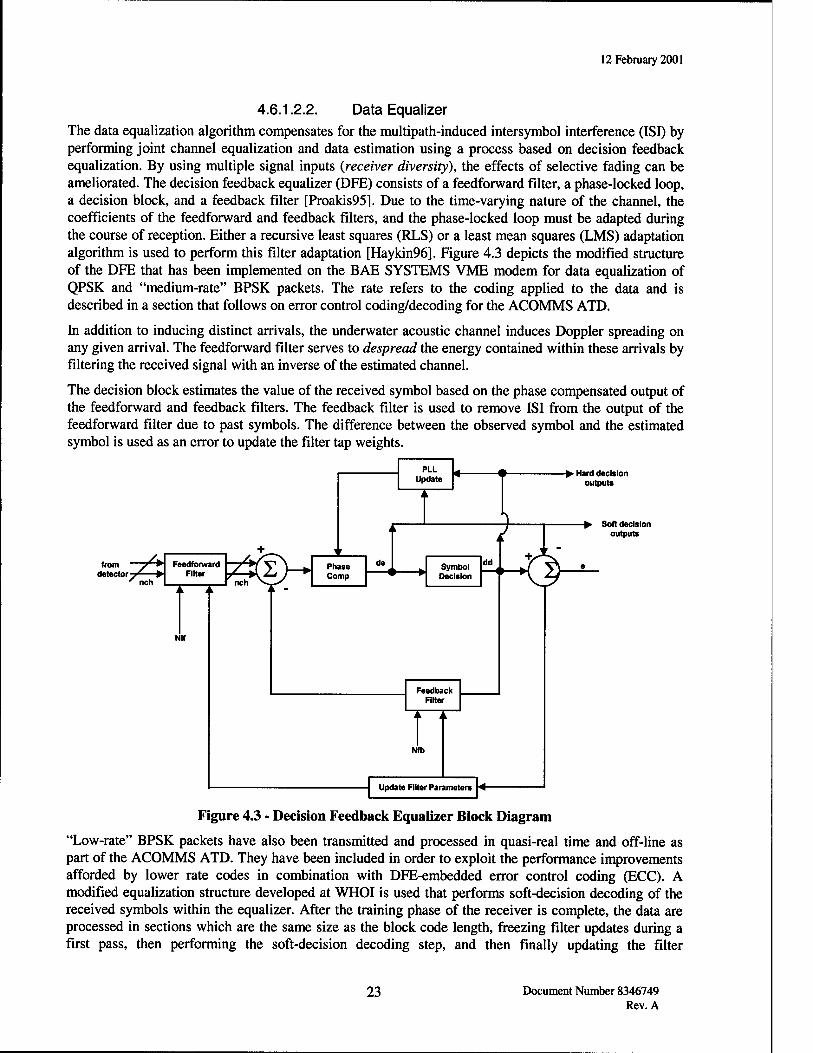
4.6.1.2.2. Data Equalizer The data equalization algorithm compensates for the multipath-induced intersymbol interference (ISI) by performing joint channel equalization and data estimation using a process based on decision feedback equalization. By using multiple signal inputs (receiver diversity), the effects of selective fading can be ameliorated. The decision feedback equalizer (DFE) consists of a feedforward filter, a phase-locked loop, a decision block, and a feedback filter [Proakis95]. Due to the time-varying nature of the channel, the coefficients of the feedforward and feedback filters, and the phase-locked loop must be adapted during the course of reception. Either a recursive least squares (RLS) or a least mean squares (LMS) adaptation algorithm is used to perform this filter adaptation [Haykin96]. Figure 4.3 depicts the modified structure of the DFE that has been implemented on the BAE SYSTEMS VME modem for data equalization of QPSK and "medium-rate" BPSK packets. The rate refers to the coding applied to the data and is described in a section that follows on error control coding/decoding for the ACOMMS ATD.
In addition to inducing distinct arrivals, the underwater acoustic channel induces Doppler spreading on any given arrival. The feedforward filter serves to despread the energy contained within these arrivals by filtering the received signal with an inverse of the estimated channel.
The decision block estimates the value of the received symbol based on the phase compensated output of the feedforward and feedback filters. The feedback filter is used to remove ISI from the output of the feedforward filter due to past symbols. The difference between the observed symbol and the estimated symbol is used as an error to update the filter tap weights.
from " detector^
■/V Feedforward "T^/VN <£—»• Filter / »VZi ) ► nch I f nch >«_-/
PLL Update
Phase Comp
de
• Hard decision outputs
} Symbol Decision
dd
Feedback Filter
Nfb
o -fcv Soft decision
outputs
Update Filter Parameters 4
Figure 4.3 - Decision Feedback Equalizer Block Diagram
"Low-rate" BPSK packets have also been transmitted and processed in quasi-real time and off-line as part of the ACOMMS ATD. They have been included in order to exploit the performance improvements afforded by lower rate codes in combination with DFE-embedded error control coding (ECC). A modified equalization structure developed at WHOI is used that performs soft-decision decoding of the received symbols within the equalizer. After the training phase of the receiver is complete, the data are processed in sections which are the same size as the block code length, freezing filter updates during a first pass, then performing the soft-decision decoding step, and then finally updating the filter
23 Document Number 8346749 Rev. A
12 February 2001
coefficients with reliable feedback decisions. The equalization proceeds through the packet in this manner so that the final output of the equalizer is the data with the inner block code already decoded.
4.6.1.2.3. Carrier Phase Synchronization Another component of the joint channel equalization and data estimation process is that of carrier phase synchronization. Doppler frequency shift is equal to relative phase shift per unit time. In the underwater acoustic channel, the received carrier phase offset varies with time and arises from three sources - a constant phase offset between transmitter and receiver clocks, a difference in clock frequency between transmitter and receiver, and the propagation time of the signal from transmitter to receiver. The propagation time is affected by propagation distance and by sound speed along the signal path. These, in turn, vary with platform motion and with changes in the transmission medium. In order to achieve the bandwidth and power efficiency of coherent communications systems, phase synchronization is performed jointly with channel equalization. This results in proper operation of the equalizer even in the presence of the severe phase fluctuations encountered in the underwater acoustic channel. The decision block measures the distance from the expected location of the symbols to the measured location. Phase offsets result in a rotation of the received signal constellation about the origin. The resulting offset of the received symbol must be minimized along with other error sources.
4.6.1.2.4. Error Control Decoding Error control coding (ECC) takes advantage of redundancy introduced into the input symbol stream at the transmitter to detect and/or correct channel errors. The parameters of the code determine the type of errors that can be detected/corrected. The approach implemented for QPSK and medium-rate BPSK on the ACOMMS ATD modem is designed to correct both random errors as well as burst errors of some nominal length.
The input and output to the encoders and decoders are arrays of symbols. Two types of block encoder/decoder pairs are employed. The notation (x,y) indicates the number of encoded symbols x for each y input symbols. The interleaver is parameterized by /, the interleaver block size. In the current implementation, a heavily coded inner code is used to correct short burst errors. An interleaver and highly coded outer code cleans up the residual errors. The combination of these two codes allows for the correction of a wide combination of random and burst bit errors.
The output from the second coder then passes through a bit interleaver. This interleaver takes in a defined number of blocks and rearranges the bits in a manner that will increase the resilience to channel burst errors. Finally the data undergoes a pseudo-random bit-flipping process referred to as whitening. This process removes any correlation in the data stream and ensures that the transmitted symbols occur with equal probability.
Decoding of the data stream is done in reverse of the encoding. First, the pseudo-random bit-flipping and then the bit interleaving are undone. The inner code and outer code decoders then attempt to correct any errors that occurred during transmission and produce an output bit stream.
The low-rate BPSK packets are encoded differently. A very heavily coded inner code is deciphered within the equalizer, while an outer code is able to correct the occasional code-word errors in the inner code.
Applying coherent demodulation to appropriately modulated waveforms potentially allows for greatly increased bandwidth efficiency. This burst rate efficiency for the ACOMMS ATD, specified in bits per second per Hertz of bandwidth (bits/s/Hz), is 0.5 and 1 bits/s/Hz for BPSK and QPSK, respectively. The realized throughput is not this high as a number of transmitted bits must be allocated to protocol maintenance and error detection and correction.
24 Document Number 8346749 Rev. A
12 February 2001
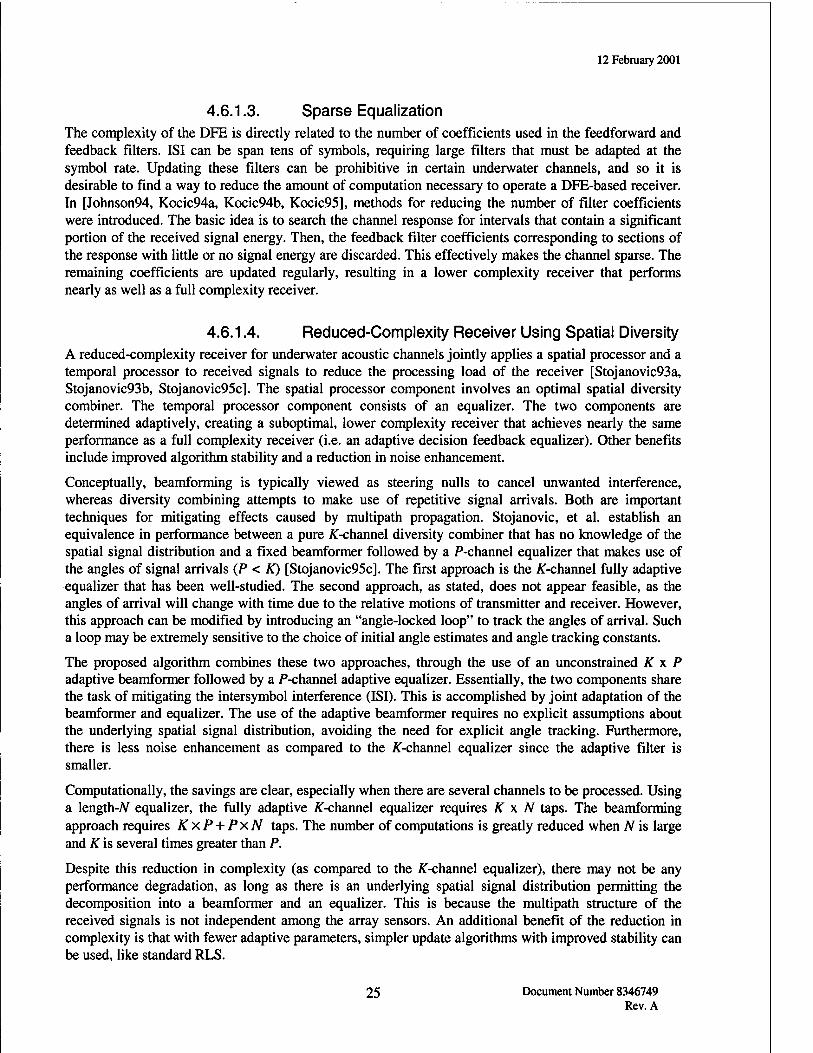
4.6.1.3. Sparse Equalization The complexity of the DFE is directly related to the number of coefficients used in the feedforward and feedback filters. ISI can be span tens of symbols, requiring large filters that must be adapted at the symbol rate. Updating these filters can be prohibitive in certain underwater channels, and so it is desirable to find a way to reduce the amount of computation necessary to operate a DFE-based receiver. In [Johnson94, Kocic94a, Kocic94b, Kocic95], methods for reducing the number of filter coefficients were introduced. The basic idea is to search the channel response for intervals that contain a significant portion of the received signal energy. Then, the feedback filter coefficients corresponding to sections of the response with little or no signal energy are discarded. This effectively makes the channel sparse. The remaining coefficients are updated regularly, resulting in a lower complexity receiver that performs nearly as well as a full complexity receiver.
4.6.1.4. Reduced-Complexity Receiver Using Spatial Diversity A reduced-complexity receiver for underwater acoustic channels jointly applies a spatial processor and a temporal processor to received signals to reduce the processing load of the receiver [Stojanovic93a, Stojanovic93b, Stojanovic95c]. The spatial processor component involves an optimal spatial diversity combiner. The temporal processor component consists of an equalizer. The two components are determined adaptively, creating a suboptimal, lower complexity receiver that achieves nearly the same performance as a full complexity receiver (i.e. an adaptive decision feedback equalizer). Other benefits include improved algorithm stability and a reduction in noise enhancement.
Conceptually, beamforming is typically viewed as steering nulls to cancel unwanted interference, whereas diversity combining attempts to make use of repetitive signal arrivals. Both are important techniques for mitigating effects caused by multipath propagation. Stojanovic, et al. establish an equivalence in performance between a pure AT-channel diversity combiner that has no knowledge of the spatial signal distribution and a fixed beamformer followed by a P-channel equalizer that makes use of the angles of signal arrivals (P < K) [Stojanovic95c]. The first approach is the ^-channel fully adaptive equalizer that has been well-studied. The second approach, as stated, does not appear feasible, as the angles of arrival will change with time due to the relative motions of transmitter and receiver. However, this approach can be modified by introducing an "angle-locked loop" to track the angles of arrival. Such a loop may be extremely sensitive to the choice of initial angle estimates and angle tracking constants.
The proposed algorithm combines these two approaches, through the use of an unconstrained K x P adaptive beamformer followed by a P-channel adaptive equalizer. Essentially, the two components share the task of mitigating the intersymbol interference (ISI). This is accomplished by joint adaptation of the beamformer and equalizer. The use of the adaptive beamformer requires no explicit assumptions about the underlying spatial signal distribution, avoiding the need for explicit angle tracking. Furthermore, there is less noise enhancement as compared to the ^-channel equalizer since the adaptive filter is smaller.
Computationally, the savings are clear, especially when there are several channels to be processed. Using a length-iV equalizer, the fully adaptive ^-channel equalizer requires K x N taps. The beamforming approach requires KxP + PxN taps. The number of computations is greatly reduced when N is large and K is several times greater than P.
Despite this reduction in complexity (as compared to the ^-channel equalizer), there may not be any performance degradation, as long as there is an underlying spatial signal distribution permitting the decomposition into a beamformer and an equalizer. This is because the multipath structure of the received signals is not independent among the array sensors. An additional benefit of the reduction in complexity is that with fewer adaptive parameters, simpler update algorithms with improved stability can be used, like standard RLS.
25 Document Number 8346749 Rev. A
12 February 2001
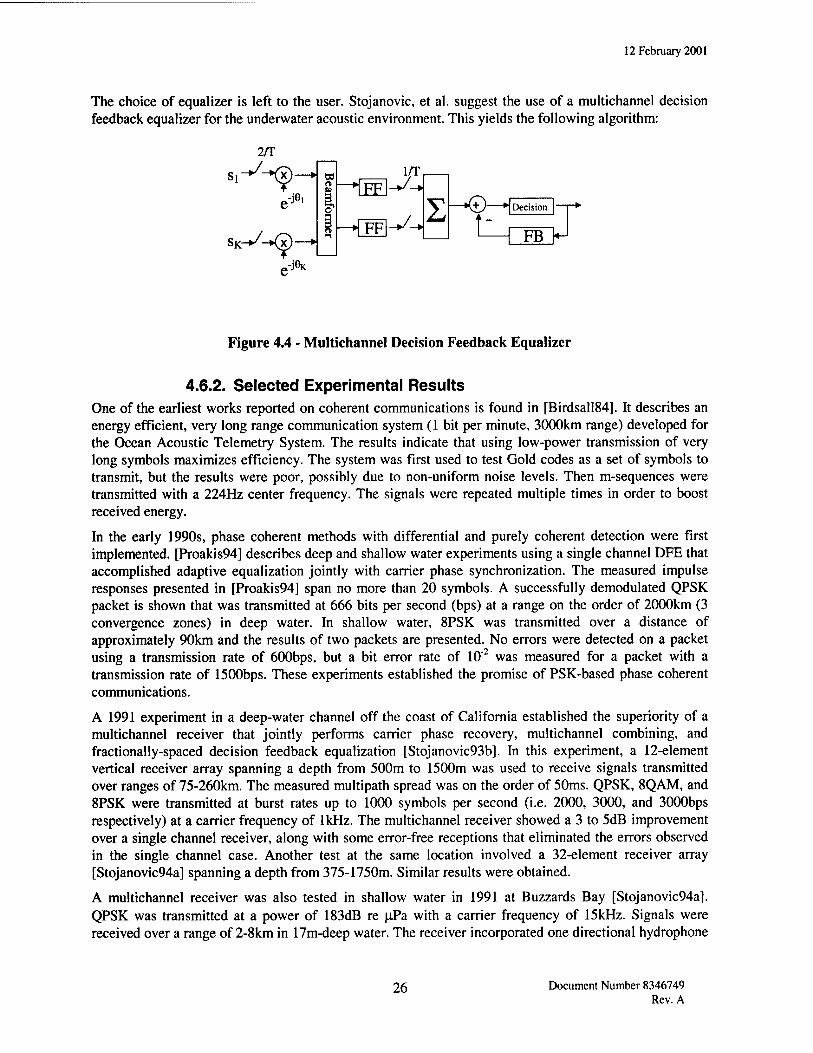
The choice of equalizer is left to the user. Stojanovic, et al. suggest the use of a multichannel decision feedback equalizer for the underwater acoustic environment. This yields the following algorithm:
2/T
Si V- -(x)-
,-je.
sK- •V- -(*)-
l/T
FB
JOK
Figure 4.4 - Multichannel Decision Feedback Equalizer
4.6.2. Selected Experimental Results One of the earliest works reported on coherent communications is found in [Birdsall84]. It describes an energy efficient, very long range communication system (1 bit per minute, 3000km range) developed for the Ocean Acoustic Telemetry System. The results indicate that using low-power transmission of very long symbols maximizes efficiency. The system was first used to test Gold codes as a set of symbols to transmit, but the results were poor, possibly due to non-uniform noise levels. Then m-sequences were transmitted with a 224Hz center frequency. The signals were repeated multiple times in order to boost received energy.
In the early 1990s, phase coherent methods with differential and purely coherent detection were first implemented. [Proakis94] describes deep and shallow water experiments using a single channel DFE that accomplished adaptive equalization jointly with carrier phase synchronization. The measured impulse responses presented in [Proakis94] span no more than 20 symbols. A successfully demodulated QPSK packet is shown that was transmitted at 666 bits per second (bps) at a range on the order of 2000km (3 convergence zones) in deep water. In shallow water, 8PSK was transmitted over a distance of approximately 90km and the results of two packets are presented. No errors were detected on a packet using a transmission rate of 600bps, but a bit error rate of 10'2 was measured for a packet with a transmission rate of 1500bps. These experiments established the promise of PSK-based phase coherent communications.
A 1991 experiment in a deep-water channel off the coast of California established the superiority of a multichannel receiver that jointly performs carrier phase recovery, multichannel combining, and fractionally-spaced decision feedback equalization [Stojanovic93b]. In this experiment, a 12-element vertical receiver array spanning a depth from 500m to 1500m was used to receive signals transmitted over ranges of 75-260km. The measured multipath spread was on the order of 50ms. QPSK, 8QAM, and 8PSK were transmitted at burst rates up to 1000 symbols per second (i.e. 2000, 3000, and 3000bps respectively) at a carrier frequency of 1kHz. The multichannel receiver showed a 3 to 5dB improvement over a single channel receiver, along with some error-free receptions that eliminated the errors observed in the single channel case. Another test at the same location involved a 32-element receiver array [Stojanovic94a] spanning a depth from 375-1750m. Similar results were obtained.
A multichannel receiver was also tested in shallow water in 1991 at Buzzards Bay [Stojanovic94a]. QPSK was transmitted at a power of 183dB re uPa with a carrier frequency of 15kHz. Signals were received over a range of 2-8km in 17m-deep water. The receiver incorporated one directional hydrophone
26 Document Number 8346749 Rev. A
12 February 2001
and two omnidirectional hydrophones. Successful packet transmissions were achieved at burst rates reaching 20kbps.
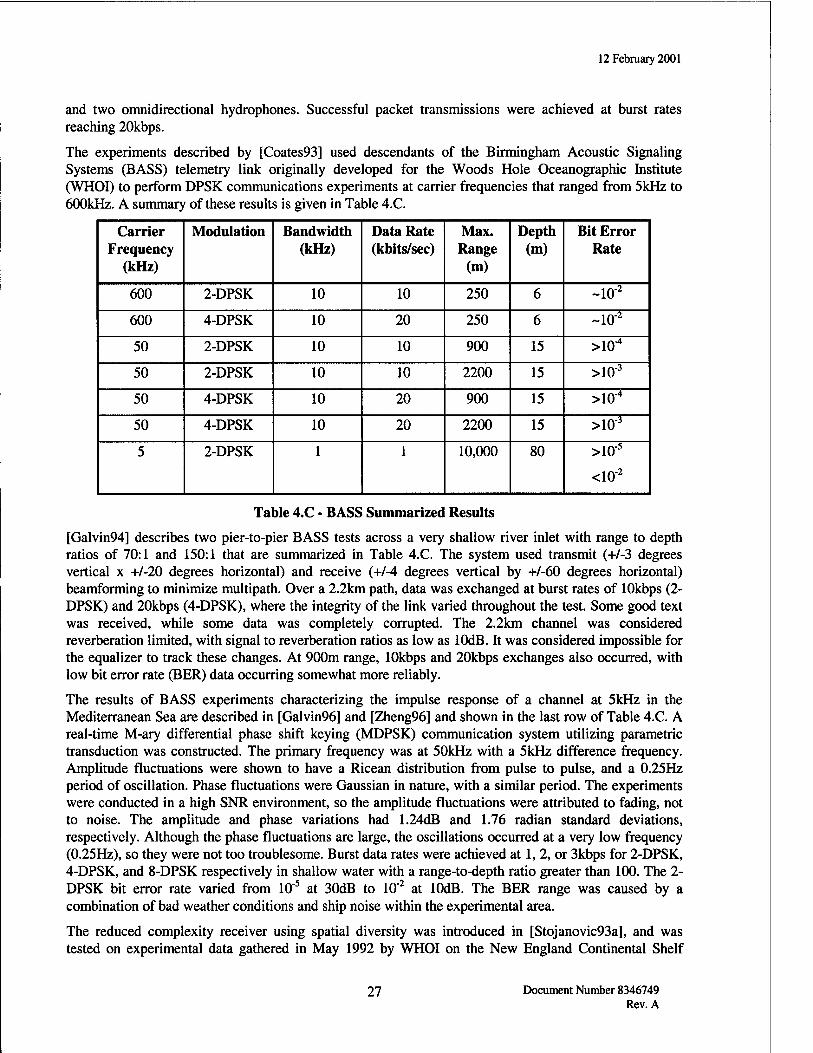
The experiments described by [Coates93] used descendants of the Birmingham Acoustic Signaling Systems (BASS) telemetry link originally developed for the Woods Hole Oceanographic Institute (WHOI) to perform DPSK communications experiments at carrier frequencies that ranged from 5kHz to 600kHz. A summary of these results is given in Table 4.C.
Carrier Frequency
(kHz)
Modulation Bandwidth (kHz)
Data Rate (kbits/sec)
Max. Range
(m)
Depth (m)
Bit Error Rate
600 2-DPSK 10 10 250 6 ~10"2
600 4-DPSK 10 20 250 6 ~io-2
50 2-DPSK 10 10 900 15 >10'4
50 2-DPSK 10 10 2200 15 >10"3
50 4-DPSK 10 20 900 15 >10"4
50 4-DPSK 10 20 2200 15 >10'3
5 2-DPSK 1 1 10,000 80 >10"5
<10-2
Table 4.C - BASS Summarized Results
[Galvin94] describes two pier-to-pier BASS tests across a very shallow river inlet with range to depth ratios of 70:1 and 150:1 that are summarized in Table 4.C. The system used transmit (+/-3 degrees vertical x +/-20 degrees horizontal) and receive (+/-4 degrees vertical by +/-60 degrees horizontal) beamforming to minimize multipath. Over a 2.2km path, data was exchanged at burst rates of 10kbps (2- DPSK) and 20kbps (4-DPSK), where the integrity of the link varied throughout the test. Some good text was received, while some data was completely corrupted. The 2.2km channel was considered reverberation limited, with signal to reverberation ratios as low as lOdB. It was considered impossible for the equalizer to track these changes. At 900m range, 10kbps and 20kbps exchanges also occurred, with low bit error rate (BER) data occurring somewhat more reliably.
The results of BASS experiments characterizing the impulse response of a channel at 5kHz in the Mediterranean Sea are described in [Galvin96] and [Zheng96] and shown in the last row of Table 4.C. A real-time M-ary differential phase shift keying (MDPSK) communication system utilizing parametric transduction was constructed. The primary frequency was at 50kHz with a 5kHz difference frequency. Amplitude fluctuations were shown to have a Ricean distribution from pulse to pulse, and a 0.25Hz period of oscillation. Phase fluctuations were Gaussian in nature, with a similar period. The experiments were conducted in a high SNR environment, so the amplitude fluctuations were attributed to fading, not to noise. The amplitude and phase variations had 1.24dB and 1.76 radian standard deviations, respectively. Although the phase fluctuations are large, the oscillations occurred at a very low frequency (0.25Hz), so they were not too troublesome. Burst data rates were achieved at 1, 2, or 3kbps for 2-DPSK, 4-DPSK, and 8-DPSK respectively in shallow water with a range-to-depth ratio greater than 100. The 2- DPSK bit error rate varied from 10"5 at 30dB to 10"2 at lOdB. The BER range was caused by a combination of bad weather conditions and ship noise within the experimental area.
The reduced complexity receiver using spatial diversity was introduced in [Stojanovic93a], and was tested on experimental data gathered in May 1992 by WHOI on the New England Continental Shelf
27 Document Number 8346749 Rev. A
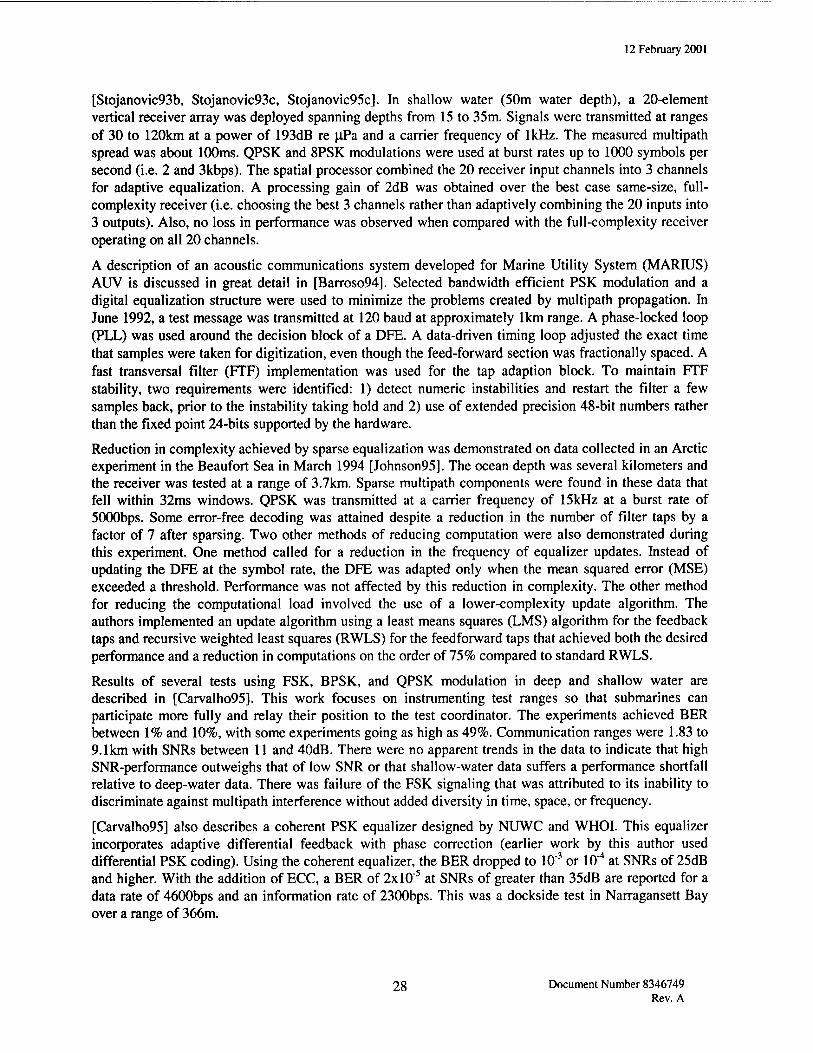
12 February 2001
[Stojanovic93b, Stojanovic93c, Stojanovic95c]. In shallow water (50m water depth), a 20-element vertical receiver array was deployed spanning depths from 15 to 35m. Signals were transmitted at ranges of 30 to 120km at a power of 193dB re uPa and a carrier frequency of 1kHz. The measured multipath spread was about 100ms. QPSK and 8PSK modulations were used at burst rates up to 1000 symbols per second (i.e. 2 and 3kbps). The spatial processor combined the 20 receiver input channels into 3 channels for adaptive equalization. A processing gain of 2dB was obtained over the best case same-size, full- complexity receiver (i.e. choosing the best 3 channels rather than adaptively combining the 20 inputs into 3 outputs). Also, no loss in performance was observed when compared with the full-complexity receiver operating on all 20 channels.
A description of an acoustic communications system developed for Marine Utility System (MARIUS) AUV is discussed in great detail in [Barroso94]. Selected bandwidth efficient PSK modulation and a digital equalization structure were used to minimize the problems created by multipath propagation. In June 1992, a test message was transmitted at 120 baud at approximately 1km range. A phase-locked loop (PLL) was used around the decision block of a DFE. A data-driven timing loop adjusted the exact time that samples were taken for digitization, even though the feed-forward section was fractionally spaced. A fast transversal filter (FTF) implementation was used for the tap adaption block. To maintain FTF stability, two requirements were identified: 1) detect numeric instabilities and restart the filter a few samples back, prior to the instability taking hold and 2) use of extended precision 48-bit numbers rather than the fixed point 24-bits supported by the hardware.
Reduction in complexity achieved by sparse equalization was demonstrated on data collected in an Arctic experiment in the Beaufort Sea in March 1994 [Johnson95]. The ocean depth was several kilometers and the receiver was tested at a range of 3.7km. Sparse multipath components were found in these data that fell within 32ms windows. QPSK was transmitted at a carrier frequency of 15kHz at a burst rate of 5000bps. Some error-free decoding was attained despite a reduction in the number of filter taps by a factor of 7 after sparsing. Two other methods of reducing computation were also demonstrated during this experiment. One method called for a reduction in the frequency of equalizer updates. Instead of updating the DFE at the symbol rate, the DFE was adapted only when the mean squared error (MSE) exceeded a threshold. Performance was not affected by this reduction in complexity. The other method for reducing the computational load involved the use of a lower-complexity update algorithm. The authors implemented an update algorithm using a least means squares (LMS) algorithm for the feedback taps and recursive weighted least squares (RWLS) for the feedforward taps that achieved both the desired performance and a reduction in computations on the order of 75% compared to standard RWLS.
Results of several tests using FSK, BPSK, and QPSK modulation in deep and shallow water are described in [Carvalho95]. This work focuses on instrumenting test ranges so that submarines can participate more fully and relay their position to the test coordinator. The experiments achieved BER between 1% and 10%, with some experiments going as high as 49%. Communication ranges were 1.83 to 9.1km with SNRs between 11 and 40dB. There were no apparent trends in the data to indicate that high SNR-performance outweighs that of low SNR or that shallow-water data suffers a performance shortfall relative to deep-water data. There was failure of the FSK signaling that was attributed to its inability to discriminate against multipath interference without added diversity in time, space, or frequency.
[Carvalho95] also describes a coherent PSK equalizer designed by NUWC and WHOI. This equalizer incorporates adaptive differential feedback with phase correction (earlier work by this author used differential PSK coding). Using the coherent equalizer, the BER dropped to 103 or 10"4 at SNRs of 25dB and higher. With the addition of ECC, a BER of 2xl0"5 at SNRs of greater than 35dB are reported for a data rate of 4600bps and an information rate of 2300bps. This was a dockside test in Narragansett Bay over a range of 366m.
28 Document Number 8346749 Rev. A
12 February 2001
A counterintuitive result is presented in [Stojanovic96c]. Improved performance of an adaptive equalizer was made possible through the use of higher signaling rates. This was demonstrated for a shallow water channel at a range of 2km, transmitting at a 15kHz carrier frequency. Communications signals were successfully equalized at a transmission rates up to 20kbps.
Early work in placing an acoustic modem on an UUV for the Autonomous Minehunting and Mapping Technology (AMMT) program are described in [Freitag96]. During trials in the winter and spring of 1996 off Fort Lauderdale, Florida, the acoustic modem uploaded regular status messages from an UUV to a surface vessel once every two minutes and periodically transmitted images from an on-board camera. The modem successfully operated at ranges over 2km with vehicle depths up to 300m. Raw burst data rates of the uplink were up to 10kbps, with the system operating consistently at 5kbps. The downlink achieved burst data rates of 2.5kbps. The configuration for the system served as the initial form of the ACOMMS ATD equalization structure with a sparse equalizer, soft-decision decoder, QPSK modulation, block encoding, and intra-packet interleaving.
Improvements due to better Doppler tracking and correction were tested by WHOI and reported in 1997 [Johnson97]. The authors studied two different scenarios: 1) Doppler shift experienced when an AUV passes a stationary vessel and 2) Doppler shift for two moving vessels. During each of these tests, the Doppler was successfully tracked for data rates of up to 10kbps using QPSK modulation. The superior tracking allowed for a reduction in receiver complexity on the order of a factor of 50.
Doppler tracking and correction were also incorporated into a study described in a 1997 WHOI report [Freitag97a]. This study specifically focused on the long-range shallow water channel. At a close range of 6.5km, error free receptions were achieved for QPSK data transmitted at a rate of 2.5kbps at a carrier frequency of 2.25kHz. At a longer range of 45km, QPSK was transmitted with similar parameters and similar success. A wedge channel (deep water to shallow water propagation) with a range of 11 miles was also tested for this report. Using the same parameters, transmissions were not completely error-free, although error correcting codes compensated for some of the errors present.
[Chang-Hong98] and [Wei-Qing98] describe tests of an MPSK UWA communication system of an AUV with design nearly identical to that originally presented in [Stojanovic93b] and [Stojanovic94a]. The modem used a 13-element Barker probe, a short gap between the probe and the packet, training symbols, an then data symbols. LMS, RLS and FOLMS (fast self-optimized LMS) algorithms were analyzed to adjust the equalizer weights. FOLMS is an LMS variant where the step-size parameter is adapted. For the phase correction block (one phase correction in each feed-forward section), both the second-order digital PLL (DPLL) and a FOLMSPE (fast self-optimized LMS phase estimator) algorithm were used. Experimental results showed that FOLMS and FOLMSPE together worked better than FOLMS and DPLL or SFTF (stabilized fast transverse filter) and DPLL (based on output SNR and BER (103 and 10"2
respectively)) for the very simple channels that were encountered (1 or 2 feedforward (FF) taps, 11-15 feedback (FB) taps, 3 input channels). Data received at ranges from 100 to 4000m with a transmission rate of 10kbps were successfully processed and the BER was on the order of 10"5.
In [Freitag98b], medium and high bit rate coherent communications from an AUV to a support research vessel (RV) are reported. The high data-rate communications implemented PSK, while FSK was used as a back-up communications scheme for lower data rates and noisy conditions. The modem transmitted at a raw burst rate of 10kbps, reduced to 6.7kbps with the addition of error-correction coding. The reception ranges were from one to two kilometers. Data were sent from the AUV to the RV twice per minute in one kilobyte packets. The down-link data from RV to the AUV operated at a 3kHz carrier frequency and 2kbps to ranges greater than 3km.
As discussed previously, the error rates for the DFE can be improved through the use of error control coding (ECC). Such coding works by introducing redundancy into the signal being transmitted, with the primary downside being that the bit transmission rate is effectively decreased along with the error rate.
29 Document Number 8346749 Rev. A
12 February 2001
[Subramaniam98] describes a trellis coded modulation (TCM) scheme that was implemented through simulation for the vertical channel and for shallow-water medium range channels. A rate 2/3 convolutional code was used to encode bits and then was "transmitted" using 8PSK.
A similar scheme has been investigated as part of the ACOMMS ATD. Processed data collected on and just off the New England Continental Shelf in 1997 was reported in [Kilfoyle98a]. Here signals were coded with a concatenated outer block code and a TCM inner code. The received signal was processed using a DFE and decoded using a Viterbi decoder with finite, truncated decision delay embedded in the DFE. QPSK with no coding, 8PSK with a rate 2/3 code (truncated to length 3), and 16-QAM with a rate % (truncated to length 7) were compared. Carrier frequencies of 3.5 and 25kHz were used with symbol rates of 1.25 and 5kHz, respectively (bit rates depend on the type of modulation and the coding employed). An average coding gain of 2 to 3dB was reported for the 8PSK TCM packets while a coding gain of 2 to 5dB was reported for the 16-QAM TCM packets. Coding gains did not attain the theoretical limits possibly due, in part, to impulsive biological noise sources.
Communications in a shallow-water underwater environment has been demonstrated as part of the EC MAST II project ROBLINKS (long-range shallow-water ROBust acoustic communications LINKS) by [vanGijzenOO]. The experiments took place in the Dutch coastal waters of the North Sea in April-May 1999. The transmitter was located on a moving vessel while the receiver was fixed on a platform. The average water depth was 18m, and the signaling range varied between 1 and 10km. The source depth was 9m and the average power was 190dB over a frequency range of l-14kHz. The receiver consisted of a vertical array with 20 hydrophones with a 13m aperture. A bit rate of 4kbps was observed using BPSK modulation with the moving vessel traveling at 4kts away from the source.
A communications sea trial performed in the wake of a surface vessel is described in [EggenOO]. The dominant interference source is due to propeller cavitation. Receiver structures studied for this problem include a decision feedback equalizer and a Viterbi receiver. Ranges between the transmitter and receiver varied from 300m to 3km. The water depth varied from 15m to a few hundred meters. The bandwidth used by the PSK signaling was 2kHz. Bit rates of 1.5-5kbps were observed over the specified ranges. A performance gain was observed for the Viterbi receiver structure in the presence of ship noise.
The use of a coherent path beamformer (CPB) and recursive least squares (RLS) adaptive beamformer, both in combination with an RLS time filter to process communications signals in the underwater channel was studied by [LeBlancOOa]. The CPB forms a beam adaptively in the direction of a collection of coherent signals representing the strongest path while forming nulls in the direction of uncorrelated signals (assumed to be interference). The RLS adaptive beamformer is an application of the RLS algorithm to beamforming. These approaches were tested near Tampa, FL in a water depth of 7m. The transmitter was mounted on an AUV 2m above the seafloor and generated a source level of 175dB at a center frequency of 50kHz and a bandwidth of 20kHz. A 64-element receiver array was located at a range of 200m. The CPB beamformer/RLS time filter combination was found to be more robust and had less stringent SNR levels required for successful equalization as compared to the RLS beamformer/RLS time filter combination. Error-free transmission was observed at bit rates.
The CPB/RLS approach was enhanced by [BeaujeanOO] to include angle beam diversity and was termed the multiple beam adaptive decoder. In addition to forming the beam corresponding to the strongest path, this method also involves forming beams along secondary paths that contain useful information. The single and multiple CPB/RLS approaches were tested in 14m deep water off of the coast of Fort Lauderdale, FL. The distance between source and receiver varied between 3000 and 3500m. The test involved a real-time implementation for communications in a marginally overspread channel operating between 16-32kHz. BPSK and QPSK modulation was used to encode data. With the single CPB method, rates up to 8000bps were processed reliably. The multiple CPB/RLS combination enabled reliable
30 Document Number 8346749 Rev. A
12 February 2001
communications at rates up to 32000bps. The limitation on performance was determined to be the 14kHz bandwidth of the source transducer.
Table 4.D provides a summary of various coherent implementations found in literature.
31 Document Number 8346749 Rev. A
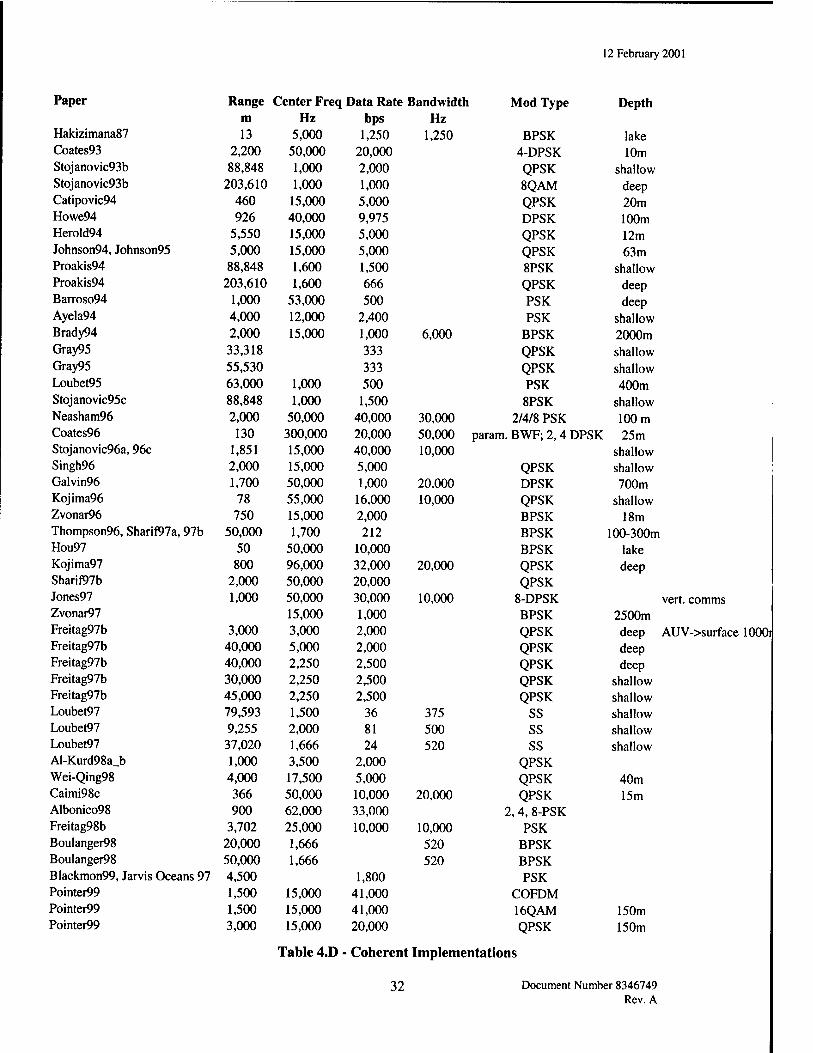
12 February 2001
Paper Range Center Freq Data Rate Bandwidth Mod Type Depth m Hz bps Hz
Hakizimana87 13 5,000 1,250 1,250 BPSK lake Coates93 2,200 50,000 20,000 4-DPSK 10m Stojanovic93b 88,848 1,000 2,000 QPSK shallow Stojanovic93b 203,610 1,000 1,000 8QAM deep Catipovic94 460 15,000 5,000 QPSK 20m Howe94 926 40,000 9,975 DPSK 100m Herold94 5,550 15,000 5,000 QPSK 12m Johnson94,Johnson95 5,000 15,000 5,000 QPSK 63m Proakis94 88,848 1,600 1,500 8PSK shallow Proakis94 203,610 1,600 666 QPSK deep Barroso94 1,000 53,000 500 PSK deep Ayela94 4,000 12,000 2,400 PSK shallow Brady94 2,000 15,000 1,000 6,000 BPSK 2000m Gray95 33,318 333 QPSK shallow Gray95 55,530 333 QPSK shallow Loubet95 63,000 1,000 500 PSK 400m Stojanovic95c 88,848 1,000 1,500 8PSK shallow Neasham96 2,000 50,000 40,000 30,000 2/4/8 PSK 100 m Coates96 130 300,000 20,000 50,000 param. BWF; 2,4 DPSK 25m Stojanovic96a, 96c 1,851 15,000 40,000 10,000 shallow Singh96 2,000 15,000 5,000 QPSK shallow Galvin96 1,700 50,000 1,000 20,000 DPSK 700m Kojima96 78 55,000 16,000 10,000 QPSK shallow Zvonar96 750 15,000 2,000 BPSK 18m Thompson96, Sharif97a, 97b 50,000 1,700 212 BPSK 100-300m Hou97 50 50,000 10,000 BPSK lake Kojima97 800 96,000 32,000 20,000 QPSK deep Sharif97b 2,000 50,000 20,000 QPSK Jones97 1,000 50,000 30,000 10,000 8-DPSK vert, comms Zvonar97 15,000 1,000 BPSK 2500m Freitag97b 3,000 3,000 2,000 QPSK deep AUV->surface lOOOi Freitag97b 40,000 5,000 2,000 QPSK deep Freitag97b 40,000 2,250 2,500 QPSK deep Freitag97b 30,000 2,250 2,500 QPSK shallow Freitag97b 45,000 2,250 2,500 QPSK shallow Loubet97 79,593 1,500 36 375 SS shallow Loubet97 9,255 2,000 81 500 SS shallow Loubet97 37,020 1,666 24 520 SS shallow Al-Kurd98a_b 1,000 3,500 2,000 QPSK Wei-Qing98 4,000 17,500 5,000 QPSK 40m Caimi98c 366 50,000 10,000 20,000 QPSK 15m Albonico98 900 62,000 33,000 2,4, 8-PSK Freitag98b 3,702 25,000 10,000 10,000 PSK Boulanger98 20,000 1,666 520 BPSK Boulanger98 50,000 1,666 520 BPSK Blackmon99, Jarvis Oceans 97 4,500 1,800 PSK Pointer99 1,500 15,000 41,000 COFDM Pointer99 1,500 15,000 41,000 16QAM 150m Pointer99 3,000 15,000 20,000 QPSK 150m
Table 4.D ■ Coherent Implementations
32 Document Number 8346749 Rev. A
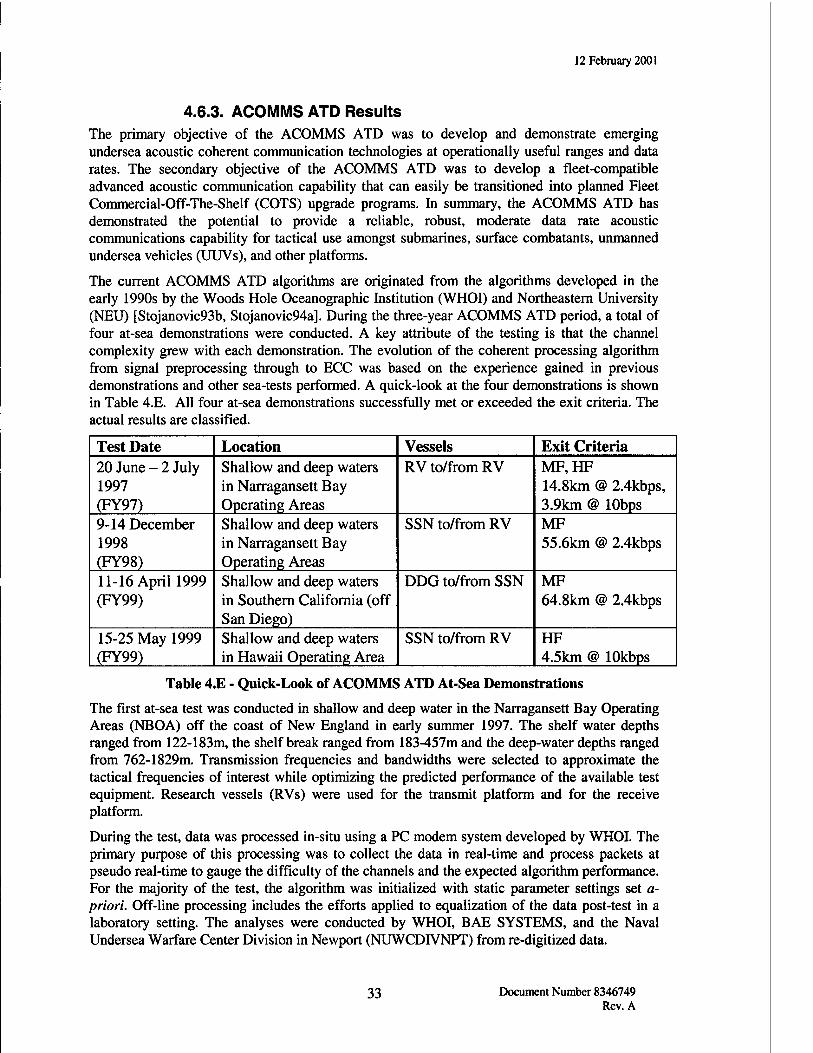
12 February 2001
4.6.3. ACOMMS ATD Results The primary objective of the ACOMMS ATD was to develop and demonstrate emerging undersea acoustic coherent communication technologies at operationally useful ranges and data rates. The secondary objective of the ACOMMS ATD was to develop a fleet-compatible advanced acoustic communication capability that can easily be transitioned into planned Fleet Commercial-Off-The-Shelf (COTS) upgrade programs. In summary, the ACOMMS ATD has demonstrated the potential to provide a reliable, robust, moderate data rate acoustic communications capability for tactical use amongst submarines, surface combatants, unmanned undersea vehicles (UUVs), and other platforms.
The current ACOMMS ATD algorithms are originated from the algorithms developed in the early 1990s by the Woods Hole Oceanographic Institution (WHOI) and Northeastern University (NEU) [Stojanovic93b, Stojanovic94a]. During the three-year ACOMMS ATD period, a total of four at-sea demonstrations were conducted. A key attribute of the testing is that the channel complexity grew with each demonstration. The evolution of the coherent processing algorithm from signal preprocessing through to ECC was based on the experience gained in previous demonstrations and other sea-tests performed. A quick-look at the four demonstrations is shown in Table 4.E. All four at-sea demonstrations successfully met or exceeded the exit criteria. The actual results are classified.
Test Date Location Vessels Exit Criteria 20 June - 2 July 1997 (FY97)
Shallow and deep waters in Narragansett Bay Operating Areas
RV to/from RV MF.HF 14.8km @ 2.4kbps, 3.9km @ 10bps
9-14 December 1998 (FY98)
Shallow and deep waters in Narragansett Bay Operating Areas
SSN to/from RV MF 55.6km @ 2.4kbps
11-16 April 1999 (FY99)
Shallow and deep waters in Southern California (off San Diego)
DDG to/from SSN MF 64.8km @ 2.4kbps
15-25 May 1999 (FY99)
Shallow and deep waters in Hawaii Operating Area
SSN to/from RV HF 4.5km @ 10kbps
Table 4.E - Quick-Look of ACOMMS ATD At-Sea Demonstrations
The first at-sea test was conducted in shallow and deep water in the Narragansett Bay Operating Areas (NBOA) off the coast of New England in early summer 1997. The shelf water depths ranged from 122-183m, the shelf break ranged from 183-457m and the deep-water depths ranged from 762-1829m. Transmission frequencies and bandwidths were selected to approximate the tactical frequencies of interest while optimizing the predicted performance of the available test equipment. Research vessels (RVs) were used for the transmit platform and for the receive platform.
During the test, data was processed in-situ using a PC modem system developed by WHOI. The primary purpose of this processing was to collect the data in real-time and process packets at pseudo real-time to gauge the difficulty of the channels and the expected algorithm performance. For the majority of the test, the algorithm was initialized with static parameter settings set a- priori. Off-line processing includes the efforts applied to equalization of the data post-test in a laboratory setting. The analyses were conducted by WHOI, BAE SYSTEMS, and the Naval Undersea Warfare Center Division in Newport (NUWCDIVNPT) from re-digitized data.
33 Document Number 8346749 Rev. A
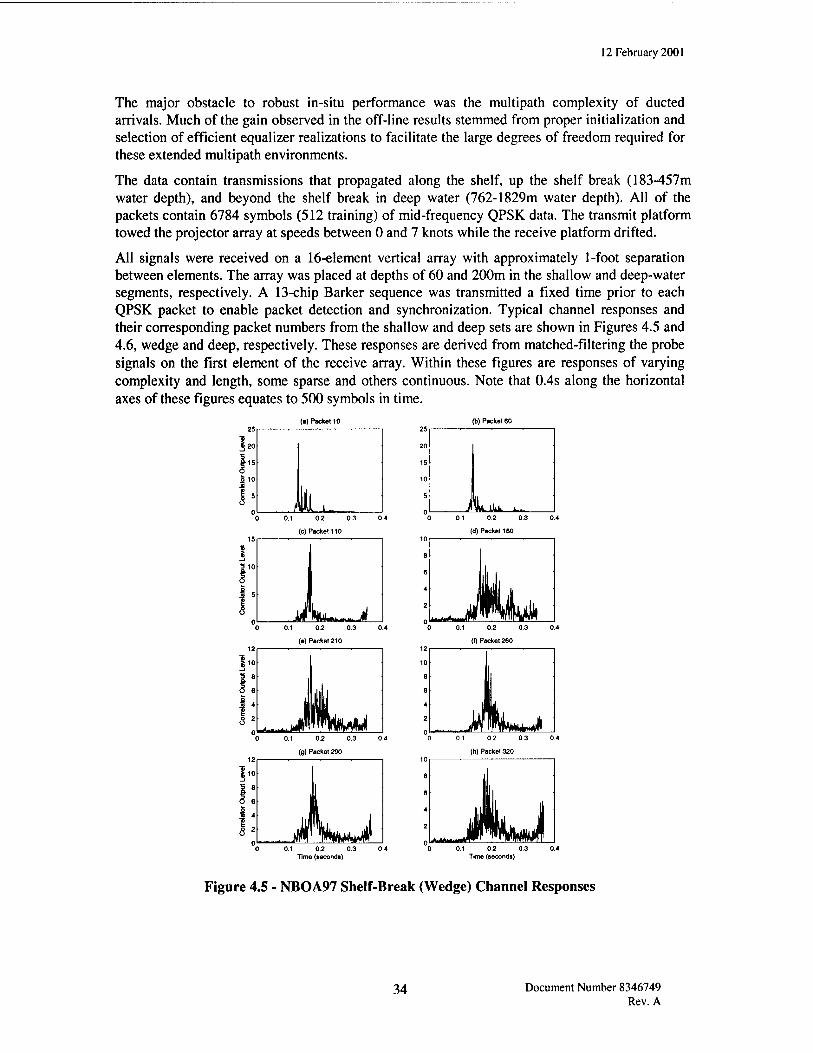
12 February 2001
The major obstacle to robust in-situ performance was the multipath complexity of ducted arrivals. Much of the gain observed in the off-line results stemmed from proper initialization and selection of efficient equalizer realizations to facilitate the large degrees of freedom required for these extended multipath environments.
The data contain transmissions that propagated along the shelf, up the shelf break (183-457m water depth), and beyond the shelf break in deep water (762-1829m water depth). All of the packets contain 6784 symbols (512 training) of mid-frequency QPSK data. The transmit platform towed the projector array at speeds between 0 and 7 knots while the receive platform drifted.
All signals were received on a 16-element vertical array with approximately 1-foot separation between elements. The array was placed at depths of 60 and 200m in the shallow and deep-water segments, respectively. A 13-chip Barker sequence was transmitted a fixed time prior to each QPSK packet to enable packet detection and synchronization. Typical channel responses and their corresponding packet numbers from the shallow and deep sets are shown in Figures 4.5 and 4.6, wedge and deep, respectively. These responses are derived from matched-filtering the probe signals on the first element of the receive array. Within these figures are responses of varying complexity and length, some sparse and others continuous. Note that 0.4s along the horizontal axes of these figures equates to 500 symbols in time.
(a) Pack» 10 (b) Packet 60
0.1 0.2 03 04
(c) Packet 110
0.1 0.2 0.3 0.4
(d) Packet 160
S'O
I"*'!'* -J«
8
e
4
a^fc^JW™. WlrW 0.1 0.2 0.3
(e) Packet 210
0 0.1 0.2 03 04
(I) Packet 280
0 0.1 0.2 0.3 0.4
(h) Packet 320
^JP^uJ 0.1 0.2 0.3 0.4
Time (seconds) 0 0.1 0.2 0.3 0.4
Time (seconds)
Figure 4.5 - NBOA97 Shelf-Break (Wedge) Channel Responses
34 Document Number 8346749 Rev. A
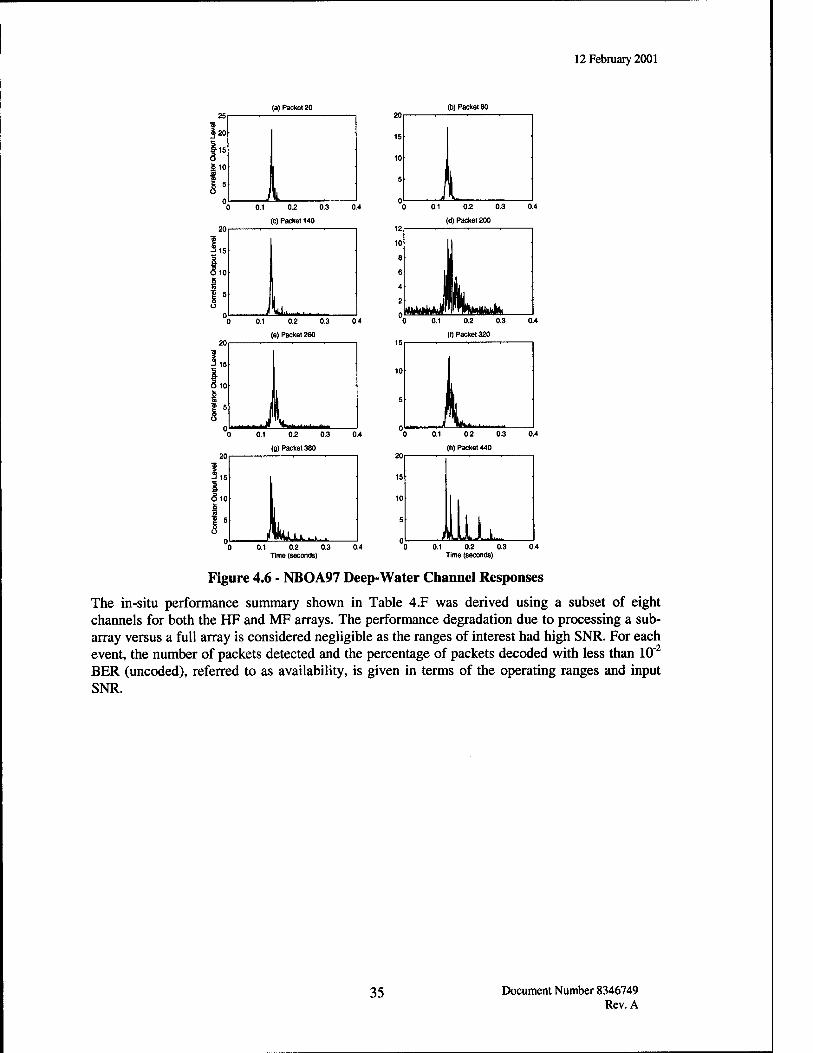
12 February 2001
(a) Packet 20
0.1 0.2 0.3 Time (seconds)
(b) Packet 80
0.1 0.2 0.3 0.4 Time (seconds)
Figure 4.6 - NBOA97 Deep-Water Channel Responses
The in-situ performance summary shown in Table 4.F was derived using a subset of eight channels for both the HF and MF arrays. The performance degradation due to processing a sub- array versus a full array is considered negligible as the ranges of interest had high SNR. For each event, the number of packets detected and the percentage of packets decoded with less than 10"2
BER (uncoded), referred to as availability, is given in terms of the operating ranges and input SNR.
35 Document Number 8346749 Rev. A
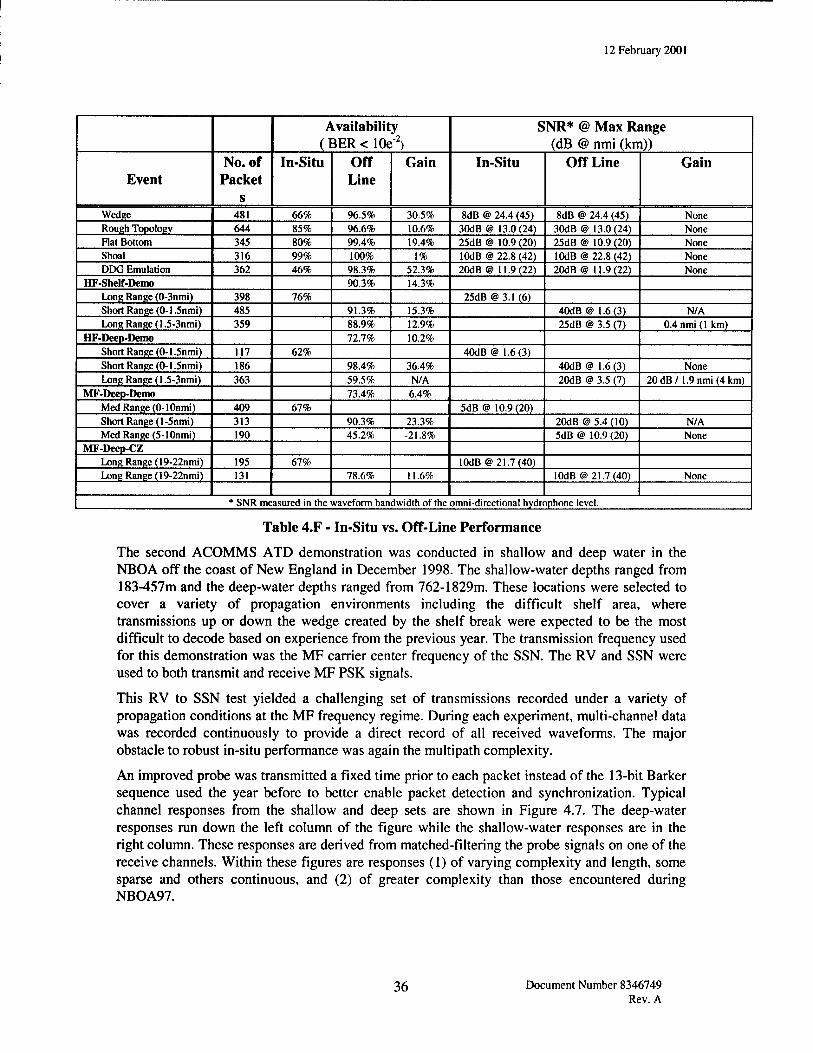
12 February 2001
(1 availability 3ER < 10e2)
SNR* @ Max Range (dB @ nmi (km))
Event No. of
Packet s
In-Situ Off Line
Gain In-Situ Off Line Gain
Wedge 481 66% 96.5% 30.5% 8dB @ 24.4 (45) 8dB @ 24.4 (45) None Rough Topology 644 85% 96.6% 10.6% 30dB@ 13.0(24) 30dB@ 13.0(24) None Flat Bottom 345 80% 99.4% 19.4% 25dB @ 10.9 (20) 25dB@ 10.9(20) None Shoal 316 99% 100% 1% lOdB @ 22.8 (42) lOdB @ 22.8 (42) None DDG Emulation 362 46% 98.3% 52.3% 20dB@ 11.9(22) 20dB@ 11.9(22) None
HF-Shclf-Demo 90.3% 14.3% Long Range (0-3nmi) 398 76% [email protected](6) Short Range (0-1.5nmi) 485 91.3% 15.3% 40dB@ 1.6(3) N/A Long Range (1.5-3nmi) 359 88.9% 12.9% 25dB @ 3.5 (7) 0.4 nmi (1 km)
HF-Deep-Demo 72.7% 10.2% Short Range (0-1.5nmi) 117 62% 40dB@ 1.6(3) Short Range (0-1.5nmi) 186 98.4% 36.4% 40dB@ 1.6(3) None Long Range (1.5-3nmi) 363 59.5% N/A 2MB @ 3.5 (7) 20dB/1.9nmi (4km)
MF-Deep-Demo 73.4% 6.4% Med Range (0-10nmi) 409 67% 5dB@ 10.9(20) Short Range (1-Snmi) 313 90.3% 23.3% 20dB @ 5.4 (10) N/A Med Range (5-10nmi) 190 45.2% -21.8% 5dB@ 10.9(20) None
MF-Deep-CZ Long Range (19-22nmi) 195 67% lOdB @ 21.7 (40) Long Range (19-22nmi) 131 78.6% 11.6% [email protected](40) None
* SNR measured in the waveform bandwidth of the omni-directional hydrophone level.
Table 4.F - In-Situ vs. Off-Line Performance
The second ACOMMS ATD demonstration was conducted in shallow and deep water in the NBOA off the coast of New England in December 1998. The shallow-water depths ranged from 183-457m and the deep-water depths ranged from 762-1829m. These locations were selected to cover a variety of propagation environments including the difficult shelf area, where transmissions up or down the wedge created by the shelf break were expected to be the most difficult to decode based on experience from the previous year. The transmission frequency used for this demonstration was the MF carrier center frequency of the SSN. The RV and SSN were used to both transmit and receive MF PSK signals.
This RV to SSN test yielded a challenging set of transmissions recorded under a variety of propagation conditions at the MF frequency regime. During each experiment, multi-channel data was recorded continuously to provide a direct record of all received waveforms. The major obstacle to robust in-situ performance was again the multipath complexity.
An improved probe was transmitted a fixed time prior to each packet instead of the 13-bit Barker sequence used the year before to better enable packet detection and synchronization. Typical channel responses from the shallow and deep sets are shown in Figure 4.7. The deep-water responses run down the left column of the figure while the shallow-water responses are in the right column. These responses are derived from matched-filtering the probe signals on one of the receive channels. Within these figures are responses (1) of varying complexity and length, some sparse and others continuous, and (2) of greater complexity than those encountered during NBOA97.
36 Document Number 8346749 Rev. A
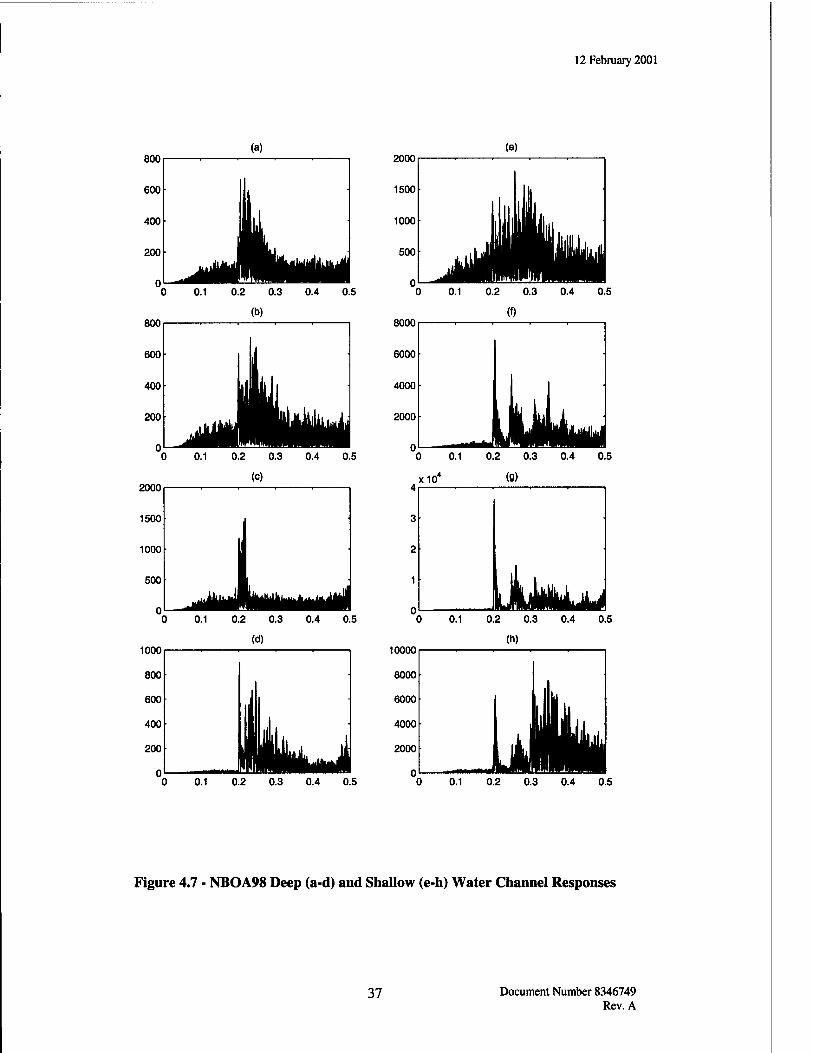
12 February 2001
0.1 0.2 0.3 0.4 0.5 0 0.1 0.2 0.3 0.4 0.5
Figure 4.7 - NBOA98 Deep (a-d) and Shallow (e-h) Water Channel Responses
37 Document Number 8346749 Rev. A
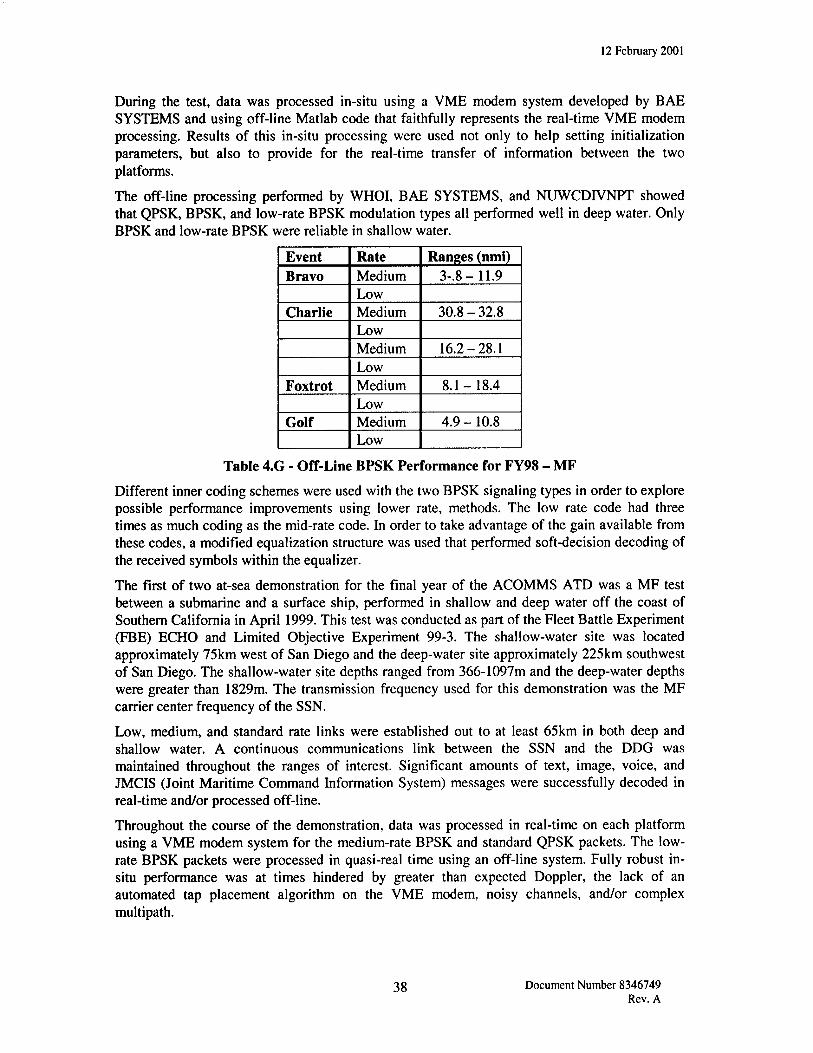
12 February 2001
During the test, data was processed in-situ using a VME modem system developed by BAE SYSTEMS and using off-line Matlab code that faithfully represents the real-time VME modem processing. Results of this in-situ processing were used not only to help setting initialization parameters, but also to provide for the real-time transfer of information between the two platforms.
The off-line processing performed by WHOI, BAE SYSTEMS, and NUWCDIVNPT showed that QPSK, BPSK, and low-rate BPSK modulation types all performed well in deep water. Only BPSK and low-rate BPSK were reliable in shallow water.
Event Rate Ranges (nmi) Bravo Medium 3-8- 11.9
Low Charlie Medium 30.8-32.8
Low Medium 16.2-28.1 Low
Foxtrot Medium 8.1-18.4 Low
Golf Medium 4.9 -10.8 Low
Table 4.G ■ Off-Line BPSK Performance for FY98 - MF
Different inner coding schemes were used with the two BPSK signaling types in order to explore possible performance improvements using lower rate, methods. The low rate code had three times as much coding as the mid-rate code. In order to take advantage of the gain available from these codes, a modified equalization structure was used that performed soft-decision decoding of the received symbols within the equalizer.
The first of two at-sea demonstration for the final year of the ACOMMS ATD was a MF test between a submarine and a surface ship, performed in shallow and deep water off the coast of Southern California in April 1999. This test was conducted as part of the Fleet Battle Experiment (FBE) ECHO and Limited Objective Experiment 99-3. The shallow-water site was located approximately 75km west of San Diego and the deep-water site approximately 225km southwest of San Diego. The shallow-water site depths ranged from 366-1097m and the deep-water depths were greater than 1829m. The transmission frequency used for this demonstration was the MF carrier center frequency of the SSN.
Low, medium, and standard rate links were established out to at least 65km in both deep and shallow water. A continuous communications link between the SSN and the DDG was maintained throughout the ranges of interest. Significant amounts of text, image, voice, and JMCIS (Joint Maritime Command Information System) messages were successfully decoded in real-time and/or processed off-line.
Throughout the course of the demonstration, data was processed in real-time on each platform using a VME modem system for the medium-rate BPSK and standard QPSK packets. The low- rate BPSK packets were processed in quasi-real time using an off-line system. Fully robust in- situ performance was at times hindered by greater than expected Doppler, the lack of an automated tap placement algorithm on the VME modem, noisy channels, and/or complex multipath.
38 Document Number 8346749 Rev. A
12 February 2001
Once again, the improved probe was transmitted a fixed time prior to each packet to enable packet detection and synchronization. Typical channel responses from the shallow and deep sets are shown in Figure 4.8. The deep-water responses run down the left column of the figure while the shallow-water responses are in the right column. These responses are derived from matched- filtering the probe signals on one of the receive channels. Within these figures are (1) responses of varying complexity and length, some sparse and others continuous, (2) deep-water responses with distinct main arrivals, and (3) some shallow-water responses of greater complexity than those encountered during NBOA97.
The post-test analysis of the data conducted by WHOI, BAE SYSTEMS, and NUWCDIVNPT served to mitigate most of the issues affecting in-situ performance and demonstrated the results achievable with automated parameter and algorithm selection techniques.
The low-rate BPSK packets were processed off-line both in-situ and in the lab using not only the embedded ECC as described previously but also (i) with a fully-automated filter tap placement algorithm and (ii) with Doppler tracking throughout the entire packet. The tap placement algorithm placed feedforward taps based on the distribution of energy in the estimate of the impulse response and feedback taps based on thresholding. The embedded ECC, automated filter tap placement, and Doppler tracking algorithms were not yet implemented on the VME modem.
The medium-rate BPSK and standard QPSK packets were processed in-situ using the VME modem. The VME modem did not have the embedded ECC implemented and also required user intervention to manipulate the number of feedforward taps. In addition, the VME modem did not track Doppler throughout the packet, making only a single estimate at the beginning of the packet.
These packets were processed off-line in the lab using a fully automated filter tap placement algorithm that differs from the one used to process the low-rate BPSK packets. This technique is based on taking advantage of the interaction between the expected minimum mean-squared error optimal feedforward and feedback filters, rather than attempting to optimize over each separately [Lopez99]. One limitation of this automated tap placement approach is that the feedforward support is centered on the peak of the impulse response estimate, thereby not directly addressing the overall energy distribution. Again, as with the VME implementation, Doppler tracking was not used to process these packets off-line. It is expected that with the inclusion of Doppler tracking certain performance gains will be achieved for these packets.
39 Document Number 8346749 Rev. A
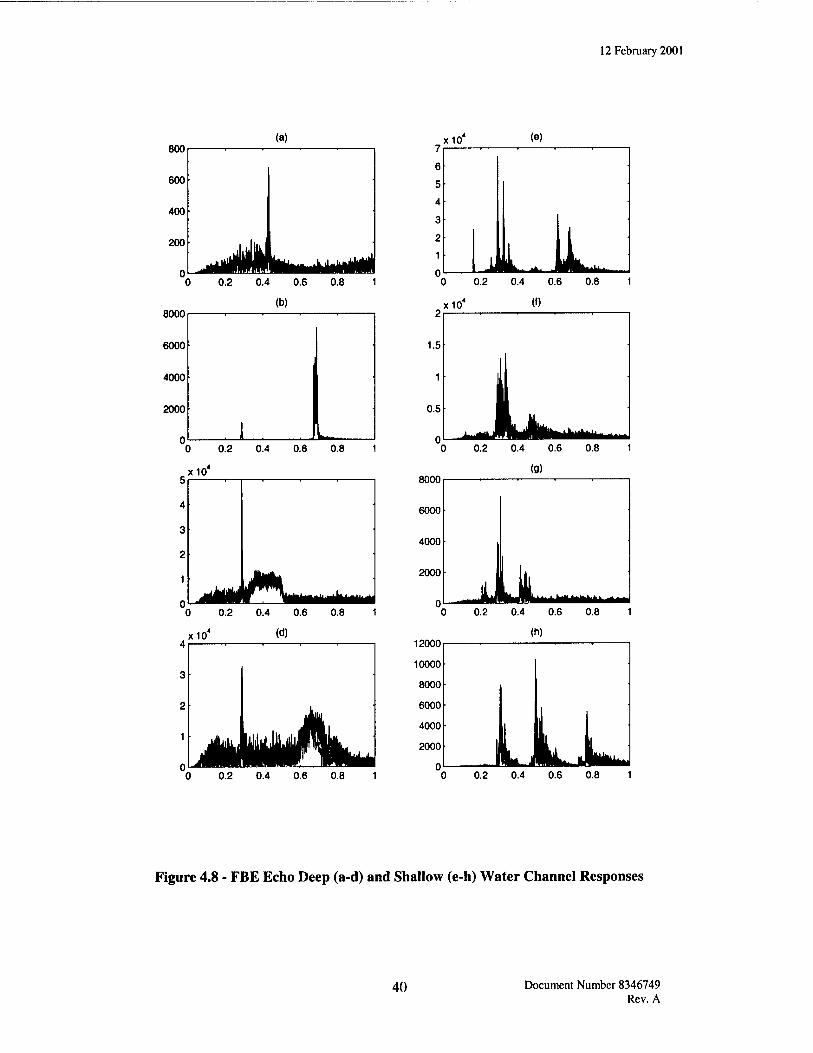
12 February 2001
800
600
400
200
(a)
"0 0.2 0.4 0.6 0.8 1
8000 (b)
6000 ■
4000 •
2000 •
. I . , b., 0 0.2 0.4 0.6 0.8 1
x10
■I .JM .... 0 0.2 0.4 0.6 0.8 1
x10 «fl
3
8000
6000
4000
2000
0 _jj Li : 0.2 0.4 0.6 0.8 1
(h) 12000
10000 ■
8000 ■
6000
4000 i 2000
0 HL JLL JLW.
0 0.2 0.4 0.6 0.8 1 0 0.2 0.4 0.6 0.8 1
Figure 4.8 - FBE Echo Deep (a-d) and Shallow (e-h) Water Channel Responses
40 Document Number 8346749 Rev. A
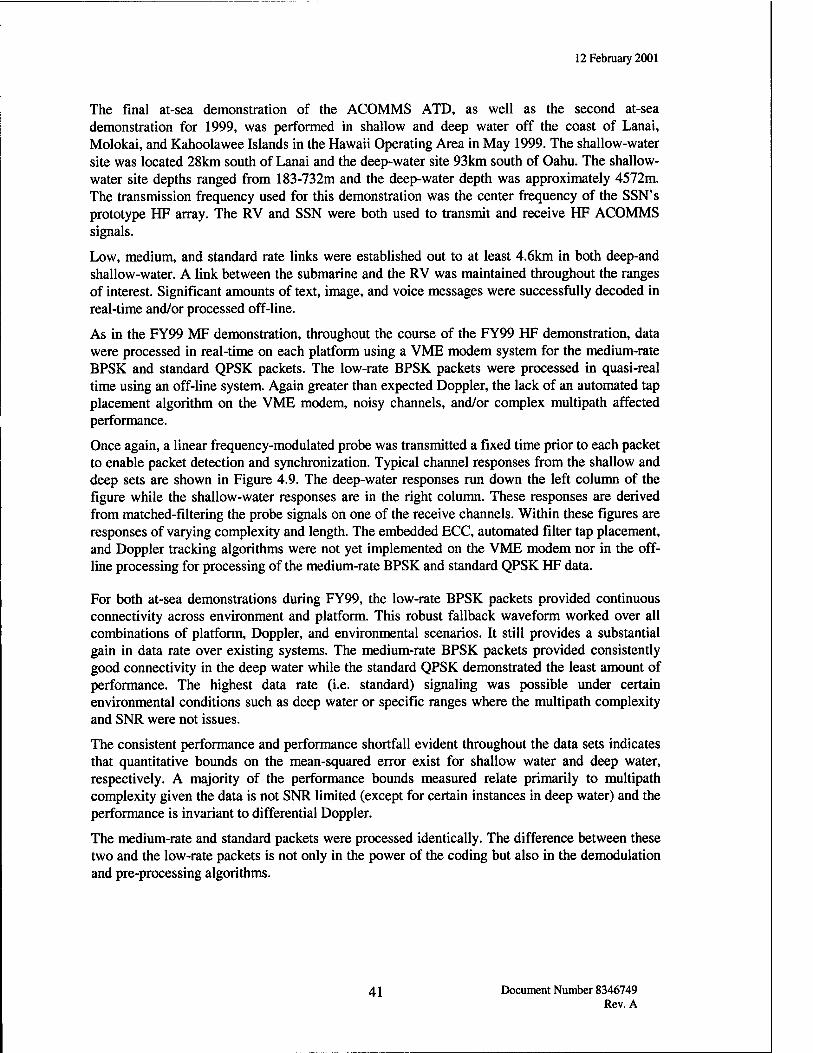
12 February 2001
The final at-sea demonstration of the ACOMMS ATD, as well as the second at-sea demonstration for 1999, was performed in shallow and deep water off the coast of Lanai, Molokai, and Kahoolawee Islands in the Hawaii Operating Area in May 1999. The shallow-water site was located 28km south of Lanai and the deep-water site 93km south of Oahu. The shallow- water site depths ranged from 183-732m and the deep-water depth was approximately 4572m. The transmission frequency used for this demonstration was the center frequency of the SSN's prototype HF array. The RV and SSN were both used to transmit and receive HF ACOMMS signals.
Low, medium, and standard rate links were established out to at least 4.6km in both deep-and shallow-water. A link between the submarine and the RV was maintained throughout the ranges of interest. Significant amounts of text, image, and voice messages were successfully decoded in real-time and/or processed off-line.
As in the FY99 MF demonstration, throughout the course of the FY99 HF demonstration, data were processed in real-time on each platform using a VME modem system for the medium-rate BPSK and standard QPSK packets. The low-rate BPSK packets were processed in quasi-real time using an off-line system. Again greater than expected Doppler, the lack of an automated tap placement algorithm on the VME modem, noisy channels, and/or complex multipath affected performance.
Once again, a linear frequency-modulated probe was transmitted a fixed time prior to each packet to enable packet detection and synchronization. Typical channel responses from the shallow and deep sets are shown in Figure 4.9. The deep-water responses run down the left column of the figure while the shallow-water responses are in the right column. These responses are derived from matched-filtering the probe signals on one of the receive channels. Within these figures are responses of varying complexity and length. The embedded ECC, automated filter tap placement, and Doppler tracking algorithms were not yet implemented on the VME modem nor in the off- line processing for processing of the medium-rate BPSK and standard QPSK HF data.
For both at-sea demonstrations during FY99, the low-rate BPSK packets provided continuous connectivity across environment and platform. This robust fallback waveform worked over all combinations of platform, Doppler, and environmental scenarios. It still provides a substantial gain in data rate over existing systems. The medium-rate BPSK packets provided consistently good connectivity in the deep water while the standard QPSK demonstrated the least amount of performance. The highest data rate (i.e. standard) signaling was possible under certain environmental conditions such as deep water or specific ranges where the multipath complexity and SNR were not issues.
The consistent performance and performance shortfall evident throughout the data sets indicates that quantitative bounds on the mean-squared error exist for shallow water and deep water, respectively. A majority of the performance bounds measured relate primarily to multipath complexity given the data is not SNR limited (except for certain instances in deep water) and the performance is invariant to differential Doppler.
The medium-rate and standard packets were processed identically. The difference between these two and the low-rate packets is not only in the power of the coding but also in the demodulation and pre-processing algorithms.
41 Document Number 8346749 Rev. A
12 February 2001
6000
5000
4000
3000
2000
1000
(a)
4000
0.02 0.04 0.06 0.08 0.1
(b)
0.02 0.04 0.06 0.08 0.1
(c)
0.02 0.04 0.06 0.08 0.1
(d) 5000
5000 (e)
4000
3000 1
2000 h 1000
n .^üUJ. u WNliiJliiäU
0.02
0.02 0.04 0.06 0.08
Figure 4.9 - HI'99 Deep (a-d) and Shallow (e-h) Water Channel Responses
42 Document Number 8346749 Rev. A
12 February 2001
4.7. Alternative Modulation/Demodulation Approaches
4.7'.1. Orthogonal Frequency Division Multiplexing Orthogonal Frequency Division Multiplexing (OFDM) is a technique for achieving bandwidth efficient frequency-division multiplexing with either a coherent or non-coherent receiver. OFDM allows the symbol period to be extended, in order to minimize the effects of inter-symbol interference.
OFDM requires that the transmit band be separated into N subbands, with carriers spaced at precisely l/NT Hz, where l/T is the bandwidth of the entire transmit band. If the subbands are spaced correctly at l/NT Hz, and the symbol's time-domain windows are rectangular, then the frequency response of each subband has a sine function shape, which has a null at every other subband's carrier frequency. This feature makes the bands orthogonal to one another and allows the bands to be placed very closely together.
If a single-carrier system transmits one symbol every T seconds, then the equivalent OFDM system will transmit N symbols in N subbands every NT seconds. Unfortunately, the orthogonality of the subbands of the OFDM system is violated at symbol boundaries, so that ISI is present at these boundaries. This can be overcome by introducing a cyclic prefix, which is a temporal guard band of a particular set of well-studied sequences attached to the beginning of each symbol. All ISI is encountered during this prefix. If the cyclic prefix has length A, then the efficiency of the OFDM system is N/(N+&) when compared to the single carrier system. The product A7 is typically chosen to be equal to the longest expected multipath extent.
In the case of underwater acoustics, the multipath extent may be a second or more (AT = 1). If the single carrier symbol rate is 1000 symbols per second, then T=lms, so A=1000. In order to maintain 90% efficiency, the OFDM system will require N > 9000, which means that symbol periods will be 9 seconds long.
Because the OFDM system uses such narrow frequency bands, it may suffer from frequency selective fading. This can be corrected by the use of error correcting codes that span across all the symbols transmitted during a single time interval. Since single carrier systems which are subject to large amounts of ISI require error correcting codes over several symbol periods to combat errors induced by ISI, this requirement for error correcting codes probably does not present any additional overhead. Theoretical analyses of coded OFDM, or COFDM, are presented in [Davies98a] and [Davies98b]. While the promise of COFDM to combat multipath is described, difficulties arise due to the severity of acoustic Doppler in the underwater channel. The authors conclude that spatial processing is necessary to reduce the effects of Doppler.
4.7.1.1. Multi-frequency orthogonal chirp keying [LeBlanc96] has developed an acoustic modem that relies on encoding a signal in the frequency domain using many narrow-band phase or amplitude-encoded chirp pulses. Each chirp pulse is uniquely situated between other chirp pulses within the frequency band. Each bit to be transmitted is translated into a combination of two adjacent chirp spectra that are assigned based on the binary message to be sent and the packet number. If a bit is a 1, the second spectrum is set to be all zeros, while if a bit is a 0, the first spectrum is set to be all zeros. The received bits are recovered by comparing the magnitudes of the two spectra. Extra pairs of chirp spectra are transmitted for labeling and parity checking.
A modem containing a single TI320c31 DSP and employing this scheme was tested at sea. Each chirp pair was allocated a bandwidth of 150Hz at center frequencies ranging from 8 to 16.4kHz.
43 Document Number 8346749 Rev. A
12 February 2001
32 packets of 28 chirps were tested with both phase and amplitude modulation. MFSK chirp pulses were transmitted at a rate of 2000bps at ranges of 100m, 500m, and 1000m. Performance was affected by the wind at a range of 100m, though not at farther distances. At 1000m, performance degraded at SNRs near lOdB. DPSK chirp pulses were transmitted at a rate of 4000bps, but more errors were detected.
4.7.2. Equalization via System Identification Recently, researchers at the Harbor Branch Oceanographic Institution in Florida suggested an alternative approach based on system identification [Caimi98a, Caimi98b]. The channel impulse response is explicitly estimated and the transmitted symbols are then recovered from the received signal via deconvolution. The overall approach is termed equalization via system identification or EQSID. EQSID is conceptually different from the DFE approach and could potentially provide improved performance in the underwater environment. Specifically, Caimi, et al. claim that EQSID will require fewer coefficients than the DFE, is not subject to accumulated decision errors, and avoids the difficulties associated with deep spectral nulls in the frequency response of the underwater acoustic channel.
EQSID divides the problem of equalization into two blocks: channel estimation and deconvolution. To characterize a channel, Caimi relies on an adaptive channel model. The model is adapted in response to an error criterion based on the difference between the received transmission and an estimated received signal as computed using the model. During training, the estimated received signal is obtained via the convolution of the training symbols with the computed channel response as specified by the model. In decision-directed mode, the estimated channel response is convolved with actual decisions to produce the estimated received signal.
While Caimi acknowledges that nonlinear or complicated physical-based models can be used with this approach, he suggests the use of a linear moving average (MA) model to estimate the channel. Using the model, the length L estimated channel impulse response h(«) is computed. To
update the model, an estimate of the received signal y(n) is computed by convolving h(«)with
the vector of data symbols s(n) = U(«-L+1) ... d{n)\ , where d(n) is the symbol decision at
time n. The update is accomplished using either the recursive least square (RLS) algorithm or the least mean squares (LMS) algorithm to minimize the error e0i) = |y(n)-y(")| > trie magnitude of
the difference between the actual received signal y(n) and the estimated received signal at
timen.
A deconvolution block follows the channel estimation block. If the channel response is minimum phase, the transfer function G(z) of the deconvolution block is the inverse of the transfer function
of the channel H(z), i.e. G(z) = l/H(z). For non-minimum phase channel responses, the deconvolution transfer function takes on a more complicated form. While deconvolution can be attempted in either the frequency domain or the time domain for a time-invariant channel, time domain processing allows for symbol-by-symbol updates of the time-varying underwater channel. If G(z) is properly chosen, the deconvolution block should produce the symbols that were transmitted. Because the deconvolution cannot be done perfectly, the output of the deconvolution block is processed to make symbol decisions.
The following is a block diagram of the EQSID method in decision directed mode:
44 Document Number 8346749 Rev. A
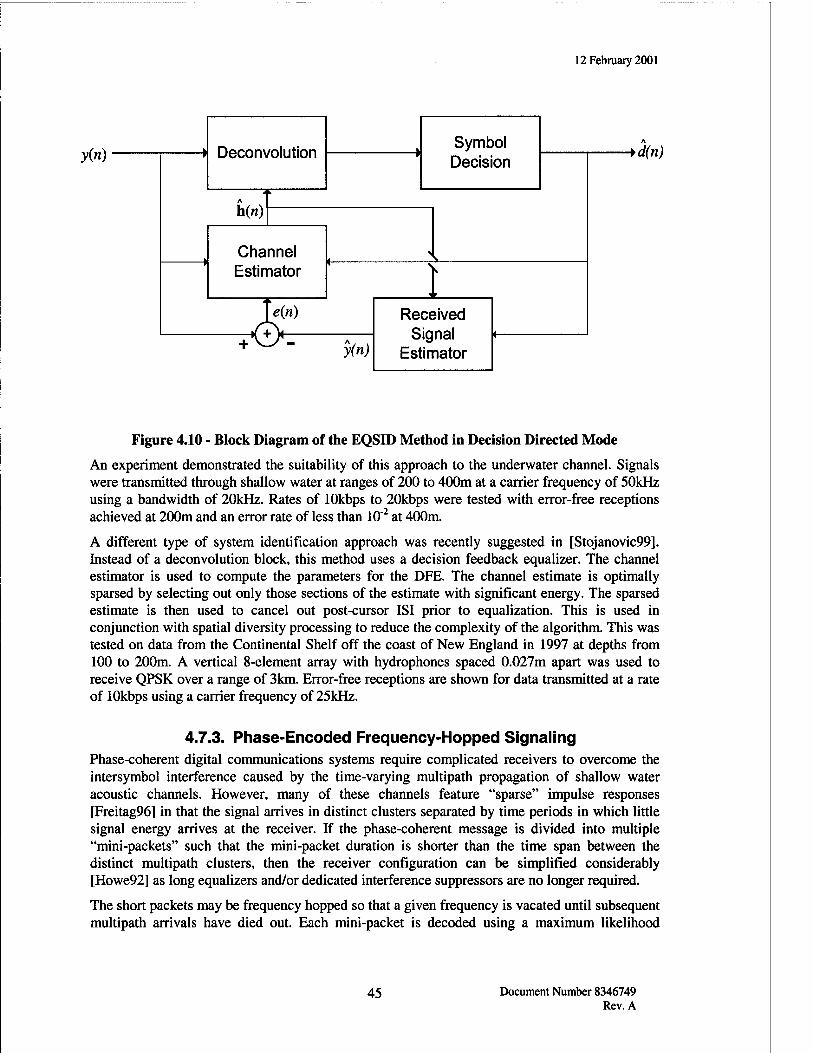
12 February 2001
y(n) Deconvolution
h(f!) :
Symbol Decision
Channel Estimator
A_
y(n)
Received Signal
Estimator
+d(n)
Figure 4.10 - Block Diagram of the EQSID Method in Decision Directed Mode
An experiment demonstrated the suitability of this approach to the underwater channel. Signals were transmitted through shallow water at ranges of 200 to 400m at a carrier frequency of 50kHz using a bandwidth of 20kHz. Rates of 10kbps to 20kbps were tested with error-free receptions achieved at 200m and an error rate of less than 10"2 at 400m.
A different type of system identification approach was recently suggested in [Stojanovic99]. Instead of a deconvolution block, this method uses a decision feedback equalizer. The channel estimator is used to compute the parameters for the DFE. The channel estimate is optimally sparsed by selecting out only those sections of the estimate with significant energy. The sparsed estimate is then used to cancel out post-cursor ISI prior to equalization. This is used in conjunction with spatial diversity processing to reduce the complexity of the algorithm. This was tested on data from the Continental Shelf off the coast of New England in 1997 at depths from 100 to 200m. A vertical 8-element array with hydrophones spaced 0.027m apart was used to receive QPSK over a range of 3km. Error-free receptions are shown for data transmitted at a rate of 10kbps using a carrier frequency of 25kHz.
4.7.3. Phase-Encoded Frequency-Hopped Signaling Phase-coherent digital communications systems require complicated receivers to overcome the intersymbol interference caused by the time-varying multipath propagation of shallow water acoustic channels. However, many of these channels feature "sparse" impulse responses [Freitag96] in that the signal arrives in distinct clusters separated by time periods in which little signal energy arrives at the receiver. If the phase-coherent message is divided into multiple "mini-packets" such that the mini-packet duration is shorter than the time span between the distinct multipath clusters, then the receiver configuration can be simplified considerably [Howe92] as long equalizers and/or dedicated interference suppressors are no longer required.
The short packets may be frequency hopped so that a given frequency is vacated until subsequent multipath arrivals have died out. Each mini-packet is decoded using a maximum likelihood
45 Document Number 8346749 Rev. A
12 February 2001
decoder. For highly dispersive channels the system reduces to a non-coherent frequency-hopped modulation technique [Gillespie97, Edelson98].
The motivation for the frequency-hopped modulation technique is multifold. Primarily, the goal is to define a technique that can be supported by a low complexity receiver and that can provide medium data rates relative to the system bandwidth if so desired. Additional design goals are to be detection resistant by operating at low signal-to-noise ratios (SNR) without channel probes and/or training data, to provide the flexibility to communicate across a wide variety of environments, to support network applications, and to mitigate the effects of channel- and frequency-selective fading.
The relatively short packet duration suggested above is amenable to frequency hopping and the transmitter dwell time is governed by the minimum time span between clusters. The use of differential frequency hopping allows several "next hops" chosen from a larger hop set. The one taken is determined by the data being transmitted. For a given data symbol, XL, and previous hop frequency, FL.h the frequency of the next hop is defined as
FL = G(FL.h XL)
where G is known only to the transmitter and to the intended receiver. This frequency-encoding scheme lends itself well to a network application, where each node in a "neighborhood" will be assigned a unique initial frequency and hop-encoding scheme. This aids in waveform conflict resolution and in identifying the transmit node by the receiver.
The frequency-hopped signaling method has two operational modes. The features of the available transmission channel and/or the demands of the mission determine the exercised mode. The concept is not to adaptively alternate between the two modes, but to offer the flexibility to operate over a broad range of environments and throughput requirements.
For channels having a resolvable multipath structure, this method would burst a phase-modulated mini-packet with duration such that multipath interference is avoided. At the conclusion of the burst, the next packet would be transmitted in a different, independent frequency sub-band (as determined by G), thereby preventing intersymbol interference. This phase-encoded modulation and demodulation exploits the channel capacity often offered by the presence of resolvable first multipath arrival via direct-path, ducted, or specular propagation. For dispersive channels not supporting the coherent "mini-packet" bursts, the idea is to revert to a non-coherent frequency- hopped spread-spectrum (FHSS) signal with data-driven hopping patterns.
This multi-mode frequency-hopped signaling concept provides a self-consistent structure to exploit geographic variability. In addition, the coherent mini-packet mode provides a means to increase data rates which, in the case of fixed message sizes, may provide for a decrease in the exposure time of the system. The differential frequency hopped encoding scheme works to ensure that false alarms die out quickly and that detections from other nodes using different encoding algorithms in an acoustic network also die out.
4.7.3.1. Coherent Mode The coherent realization of this modulation technique is predicated on the existence of a clear gap between two multipath arrivals in the channel impulse response. This gap allows the use of a simplified channel equalizer. To mitigate the inter-symbol interference caused by additional multipath arrivals, an entire mini-packet of data is transmitted before the next multipath arrival can begin to corrupt packet symbols at the receiver. Each packet is encoded by a phase shift keying system, with information symbols contained completely within the chip. The chip length is driven by the multipath/channel impulse response. The minimum hop distance becomes a
46 Document Number 8346749 Rev. A
12 February 2001
function of the mini-packet symbol rate and expected Doppler spread of the channel. The chip rate is selected to ensure that the channel has cleared within a particular frequency band prior to the next chip being sent. The individual chips are now spread in frequency and have data driven content.
With multiple receive hydrophones, both temporal and spatial diversity can be exploited. When the mini-packets are time-aligned, the micro-multipath structure for each multipath component will be different. Consequently, the phase structure imposed by the channel on each multipath component will differ. Assuming that there are N diversity data vectors of equal SNR denoted XI,...,XAT and K codewords denoted cu...,cK, the maximum likelihood receiver
i = argmaxE|c"x„|2
accounts for this variability in phase structure.
4.7.3.2. Non-Coherent Mode In the event that it is known a priori that the dispersive channel cannot support the coherent mini-packet bursts, this signaling technique reverts to a non-coherent frequency-hopped spread- spectrum (FHSS) signal with a differential frequency hopping modulation pattern whereby all the information is contained in the hopping sequence (in frequency). The potential detection and intercept resistant (LPI/LPD) properties of this waveform are discussed in Section 4.9.
An advantage of this non-coherent method is that hop-sequence dropouts can be recreated by "backtracking" through the hop tree using knowledge of the symbols decoded before and after the dropout sequence. This is analogous to the transition path of a knight on a chessboard, which is determined by the constraints placed on an individual move and can be deduced even if every move is not observed. Similarly, the function G constrains the signal hop sequence, allowing missed hops to be recreated.
4.7.3.3. Experimental Results This clearing property of certain underwater acoustic channels was first utilized for communications on tests that were conducted over a 13m deep, 100m range shallow-water channel and utilized a 2-DPSK waveform [Howe92]. A single hydrophone was used as a receiver while the transmitted signal was a 10kbps burst centered at 50kHz. Between two and five bits were contained in each mini-packet, with a new burst transmitted every 3ms, to achieve an maximum data rate of 1.6kbps. Bit error rates were small until the number of bits per mini-packet reached five, at which point the burst was corrupted by multipath. The system failed to function at 250m because the multipath arrived with a delay of less than one bit (in time).
"Proof-of-concept" frequency-hopped mini-packet data were collected as part of an at-sea experiment in the Narragansett Bay Operating Area of the Continental Shelf in June 1997 [Edelson98]. A 16-hydrophone vertical receive array was positioned at 40 06.0N, 70 58.8W at a depth of 69.5 to 73 meters in one-meter seas. An 8-llkHz UQC projector was positioned at a range of approximately 1.8nmi from the receiver and at a depth of 3 meters. The simple hop sequence of [8.5 9.25 10.0 8.75 9.5 10.25 9.0 9.75 10.5] (in kHz) was used for demonstration purposes.
Under these conditions, the channel impulse response was sufficiently sparse to support coherent mini-packet signaling with gaps between significant multipath clusters on the order of 15ms.
47 Document Number 8346749 Rev. A
12 February 2001
Both coherent and non-coherent signals were successfully decoded at effective data rates between 100bps and 500bps using the maximum likelihood receiver described above.
4.8. Multi-User Communications A multiuser communications system involves the transmission and reception of communications signals from several users. Ideally, a multiuser system will allow simultaneous signal transmissions, enabling efficient use of available bandwidth. In radio frequency (RF) communications, several different protocols have been developed to facilitate multiuser communications, including time-division multiple access (TDMA), frequency-division multiple access (FDMA), and code-division multiple access (CDMA). These RF protocols, however, are not easily applied to underwater acoustic communications. In some cases, they can be adapted to operate in the underwater acoustic environment. In this section, these protocols will be defined and relevant underwater adaptations will be described.
The applicability of existing network technology to the underwater acoustic environment is explored in [SozerOO]. Network topologies applicable to underwater communications include a centralized network, where communications is controlled by a hub, and multi-hop peer-to-peer networks, which are formed by establishing links only between neighboring nodes. Of the multiple access methods discussed, TDMA and FDMA are found to be less promising than CDMA for use in the underwater channel. Media access protocols suitable for an underwater network include Carrier Sense Media Access (CSMA) for low throughput scenarios and Multiple Access with Collision Avoidance (MACA) or its variant MACAW. Automatic Repeat Request (ARQ) methods with potential for use in underwater communications include GoBack N and Selective Repeat Protocol. Routing is feasible using ad hoc network routing protocols, since typical routing schemes are based on the shortest path algorithm with stationary nodes. Suitable ad hoc routing protocols include Destination Sequence Distance Vector (DSDV), Temporally Ordered Routing Algorithm (TORA), Dynamic Source Routing (DSR), and Ad hoc On-demand Distance Vector (AODV).
A design example is provided that incorporates a large number of nodes in a shallow water environment with depths between 50-100m. The nodes are mounted on the bottom at distances of up to 10km. The desired transmission rate is 100bps from each node, using a frequency band of 8-15kHz. Packet sizes are 256 bits, and each node is allowed to transmit up to five packets per hour at half-duplex. Relaying is utilized to minimize energy consumption, which is the dominant constraint. Both FDMA and CDMA are considered for multiple access. The media access protocol is based on MACA, and Stop & Wait ARQ is used. The overall network routing is ad hoc, so initialization is required to generate neighbor tables indicating each node's neighbors and the quality of the links between neighbors. The master node generates a routing tree based on the neighbor tables, and then assigns new routing as needed to the other nodes. The design was tested via simulation. Peak throughput is 10"6 packets per second. The design is expected to be tested as part of SEA WEB over the next few years.
4.8.1. Time-Division Multiple Access The idea behind TDMA is to divide the time domain into frames and allocate a unique time slot within each frame to a different user. Each user can make full use of the frequency band of the channel within the assigned time slot. A master node synchronizes transmission frames. For N users, each frame is divided into N time slots that are appropriately assigned. The master node sends a frame synchronization signal to all users. Each user waits for the designated time slot within the frame and then transmits a message. When all users have transmitted, another frame
48 Document Number 8346749 Rev. A
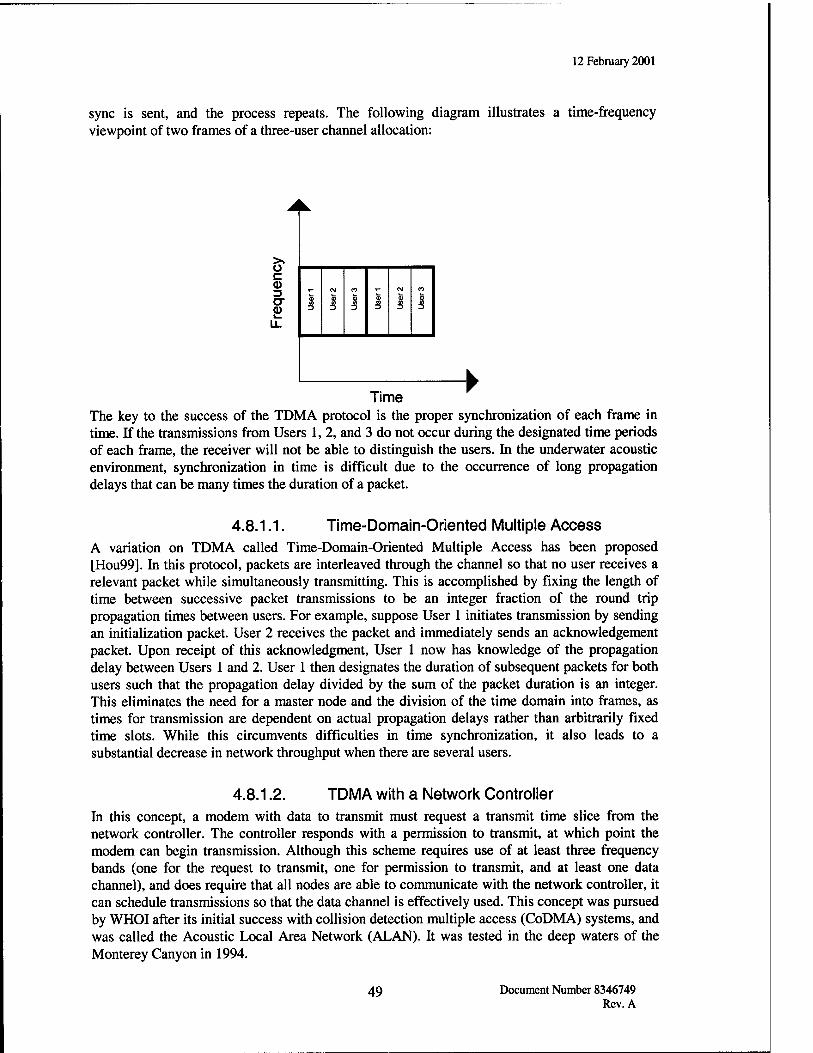
12 February 2001
sync is sent, and the process repeats. The following diagram illustrates a time-frequency viewpoint of two frames of a three-user channel allocation:
c <D
a-
Li.
Time The key to the success of the TDMA protocol is the proper synchronization of each frame in time. If the transmissions from Users 1, 2, and 3 do not occur during the designated time periods of each frame, the receiver will not be able to distinguish the users. In the underwater acoustic environment, synchronization in time is difficult due to the occurrence of long propagation delays that can be many times the duration of a packet.
4.8.1.1. Time-Domain-Oriented Multiple Access A variation on TDMA called Time-Domain-Oriented Multiple Access has been proposed [Hou99]. In this protocol, packets are interleaved through the channel so that no user receives a relevant packet while simultaneously transmitting. This is accomplished by fixing the length of time between successive packet transmissions to be an integer fraction of the round trip propagation times between users. For example, suppose User 1 initiates transmission by sending an initialization packet. User 2 receives the packet and immediately sends an acknowledgement packet. Upon receipt of this acknowledgment, User 1 now has knowledge of the propagation delay between Users 1 and 2. User 1 then designates the duration of subsequent packets for both users such that the propagation delay divided by the sum of the packet duration is an integer. This eliminates the need for a master node and the division of the time domain into frames, as times for transmission are dependent on actual propagation delays rather than arbitrarily fixed time slots. While this circumvents difficulties in time synchronization, it also leads to a substantial decrease in network throughput when there are several users.
4.8.1.2. TDMA with a Network Controller In this concept, a modem with data to transmit must request a transmit time slice from the network controller. The controller responds with a permission to transmit, at which point the modem can begin transmission. Although this scheme requires use of at least three frequency bands (one for the request to transmit, one for permission to transmit, and at least one data channel), and does require that all nodes are able to communicate with the network controller, it can schedule transmissions so that the data channel is effectively used. This concept was pursued by WHOI after its initial success with collision detection multiple access (CoDMA) systems, and was called the Acoustic Local Area Network (ALAN). It was tested in the deep waters of the Monterey Canyon in 1994.
49 Document Number 8346749 Rev. A
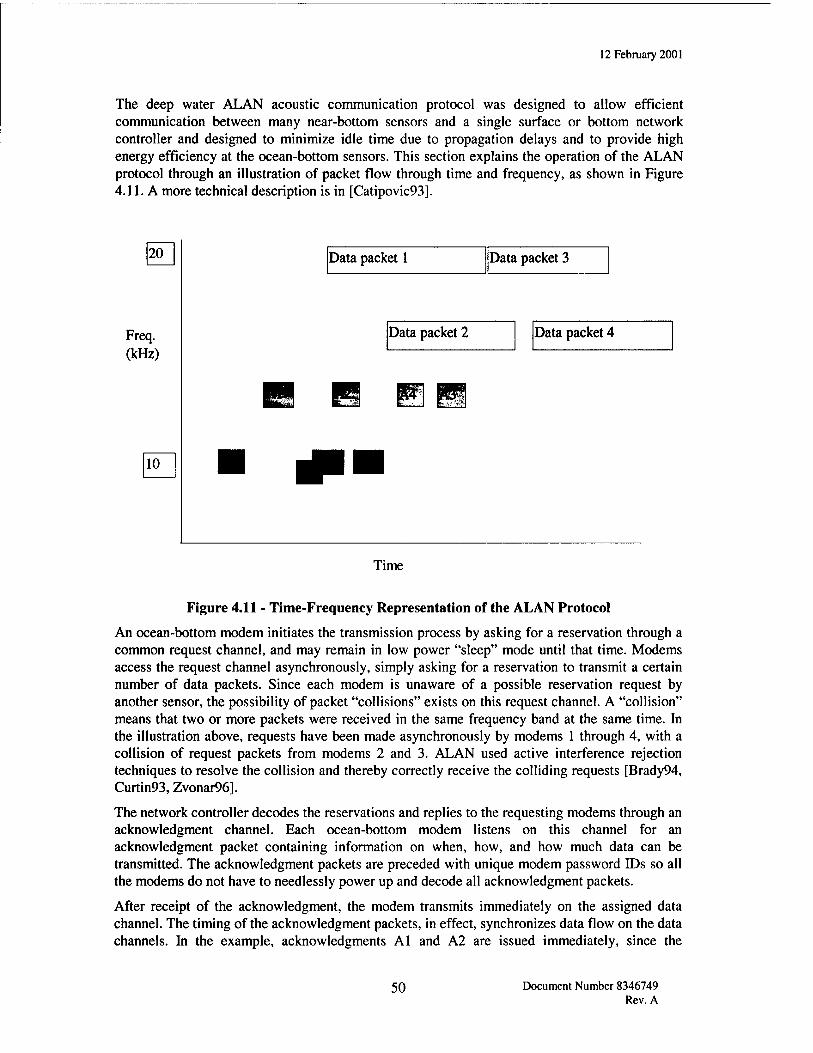
12 February 2001
The deep water ALAN acoustic communication protocol was designed to allow efficient communication between many near-bottom sensors and a single surface or bottom network controller and designed to minimize idle time due to propagation delays and to provide high energy efficiency at the ocean-bottom sensors. This section explains the operation of the ALAN protocol through an illustration of packet flow through time and frequency, as shown in Figure 4.11. A more technical description is in [Catipovic93].
20
Freq. (kHz)
10
Data packet 1 Data packet 3
Data packet 2 Data packet 4
Time
Figure 4.11 - Time-Frequency Representation of the ALAN Protocol
An ocean-bottom modem initiates the transmission process by asking for a reservation through a common request channel, and may remain in low power "sleep" mode until that time. Modems access the request channel asynchronously, simply asking for a reservation to transmit a certain number of data packets. Since each modem is unaware of a possible reservation request by another sensor, the possibility of packet "collisions" exists on this request channel. A "collision" means that two or more packets were received in the same frequency band at the same time. In the illustration above, requests have been made asynchronously by modems 1 through 4, with a collision of request packets from modems 2 and 3. ALAN used active interference rejection techniques to resolve the collision and thereby correctly receive the colliding requests [Brady94, Curtin93, Zvonar96].
The network controller decodes the reservations and replies to the requesting modems through an acknowledgment channel. Each ocean-bottom modem listens on this channel for an acknowledgment packet containing information on when, how, and how much data can be transmitted. The acknowledgment packets are preceded with unique modem password IDs so all the modems do not have to needlessly power up and decode all acknowledgment packets.
After receipt of the acknowledgment, the modem transmits immediately on the assigned data channel. The timing of the acknowledgment packets, in effect, synchronizes data flow on the data channels. In the example, acknowledgments Al and A2 are issued immediately, since the
50 Document Number 8346749 Rev. A
12 February 2001
controller has slots available on data channels 1 and 2. A3 is timed such that the round trip delay to modem 3 causes the data reception to start immediately following the end of transmission from modem 1. The controller is assumed to know the round trip travel time to the modems. Similarly, A4 is timed to allow data from modem 4 to follow that of modem 2. The small "quiet time" gap between data packet 2 and data packet 4 reflects the controller's uncertainty of the round trip delay to modem 4. The controller underestimates the delay to minimize collisions. However, if a collision is detected, the data is still recoverable using the collision resolution algorithm [Travis94]. Note that in the example, the order of the acknowledgment packets A3 and A4 is reversed from the order of the request packets or data sessions, since modem 4 is more distant than modem 3. Requests are scheduled sequentially, and a data channel is selected based on modem range and current channel quality estimates in order to minimize packet delay. If the network is congested and the controller has no channels available for a requesting modem, it does not reply, and the modem will re-request channel access after a time-out period.
Upon reception of the request packets, the controller resolves request packet collisions, schedules the requests on the available data channels, and notifies each packet of their reservation one round-trip propagation time before the expected data packet reception. Request packets are very short (<10 bytes) in order to reduce the probability of packet collision.
Upon reception of the data packets, the receiver updates the estimate of round-trip propagation time. The Forward Error Correction Automatic Repeat reQuest (FEC-ARQ) error correction protocol ensures error-free data by requesting retransmissions of uncorrectable corrupted data sequences. [Catipovic93, Talavage94] Each ocean-bottom modem retains the most recently transmitted packet in the event of a transmission error requiring partial retransmission. The holding period for each packet is designed to make the chance of lost data vanishingly small.
4.8.1.3. Shallow-water ALAN The above deep water ALAN in Monterey canyon relied on the ability of each network node to reach the controller most of the time. Thus the protocol is a "star" protocol, where each node communicates only with the controller and can afford to neglect all its neighbors. This assumption is quite valid in the Reliable Acoustic Propagation (RAP) "cone" encountered in deep water. In Monterey Canyon, with the network controller at a depth of about 1000 meters, the RAP cone extended some 6-8km from the controller, encompassing most of the canyon area.
In shallow water, the RAP cone extends some 3-4 water depths from a surface node, and is not a useful feature. Then the network needs to rely on the time-variant, high multipath acoustic propagation encountered in shallow water. In these conditions, a reliable communication link between any two points in the network could not be guaranteed.
The key assumption in the design of a shallow water ALAN concept is the inability to guarantee a viable acoustic path directly from a network node to the network controller. A follow-on assumption is that the newly-deployed network node does not know its location relative to the network and does not know the nodes or controller(s) in the network with which it can directly communicate. An implicit assumption is that a newly-deployed node can communicate directly with at least one network member. Given the above constraints, an adaptive network initialization and path definition protocol is required [Talavage94].
An early demonstration of multipoint networking was the Arctic local area network, deployed in March and April 1994 approximately 370km north of Prudhoe Bay. The network consisted of 6 nodes deployed in a 10km x 10km area surrounding an Ice Camp.
51 Document Number 8346749 Rev. A
12 February 2001
The shallow-water ALAN protocol concept is based on the premise that node-to-node connectivity cannot be guaranteed over multi-day periods, but that node-to-node links are stable over a several minute duration. The ALAN nodes maintain a "neighbor" list, which includes all relevant network initialization and status information. Specifically, each node maintains:
1. A list of all "reachable" neighbors, defined as nodes that were communicated with at least once.
2. A list of node locations for all reachable nodes, indexed with respect to the "master node," i.e. the node with the surface-piercing RF connection.
3. The history (mean and variance) of the power settings used to reach each of the neighbors. When initiating a new transaction, the node initializes the power setting to one standard deviation above the mean power setting.
4. Channel multipath structure to and from each neighbor.
5. Neighbor node ID and related protocol and packet design information.
6. Status (busy or free) for each of the neighbor nodes and related channel utilization.
Each shallow water ALAN node would have three bi-directional data channels and a single command and control (C2) channel. The data channels nominally occupy 5kHz of bandwidth centered at 15kHz, 25kHz, and 35kHz. The C2 channel occupies the 8-10kHz band.
When a node desires to communicate, it (the "originator" node) broadcasts a request for a virtual link to the network, using the C2 channel. The virtual link request contains the length of the message to be sent and the address of the terminal network node (in most cases the master node with the RF interface). If the terminal node is a neighbor and decodes the request, it allocates two available frequencies for the transmit and receive links and telemeters that information to the originator node. The other neighbor nodes mark the selected channels as busy.
The originator node transmits data on the assigned channel and expects an end of message acknowledgment from the terminator node. If it is received, the originator and all of the neighbor nodes mark the used channels as available, and become dormant. If the end of message is not received, the originator renegotiates the channel allocation after a timeout.
If the destination node is not a neighbor of the originator, a store-and-forward protocol can be used. This is described in [Talavage94], but it has not been implemented to date on an actual in- water network.
4.8.2. Frequency-Division Multiple Access FDMA is the frequency domain analogue of TDMA. With FDMA, a unique portion of the available frequency spectrum is allocated to each user. There need not be any time domain restrictions on transmissions. The following diagram illustrates a time-frequency viewpoint of one packet of a three-user channel allocation:
52 Document Number 8346749 Rev. A
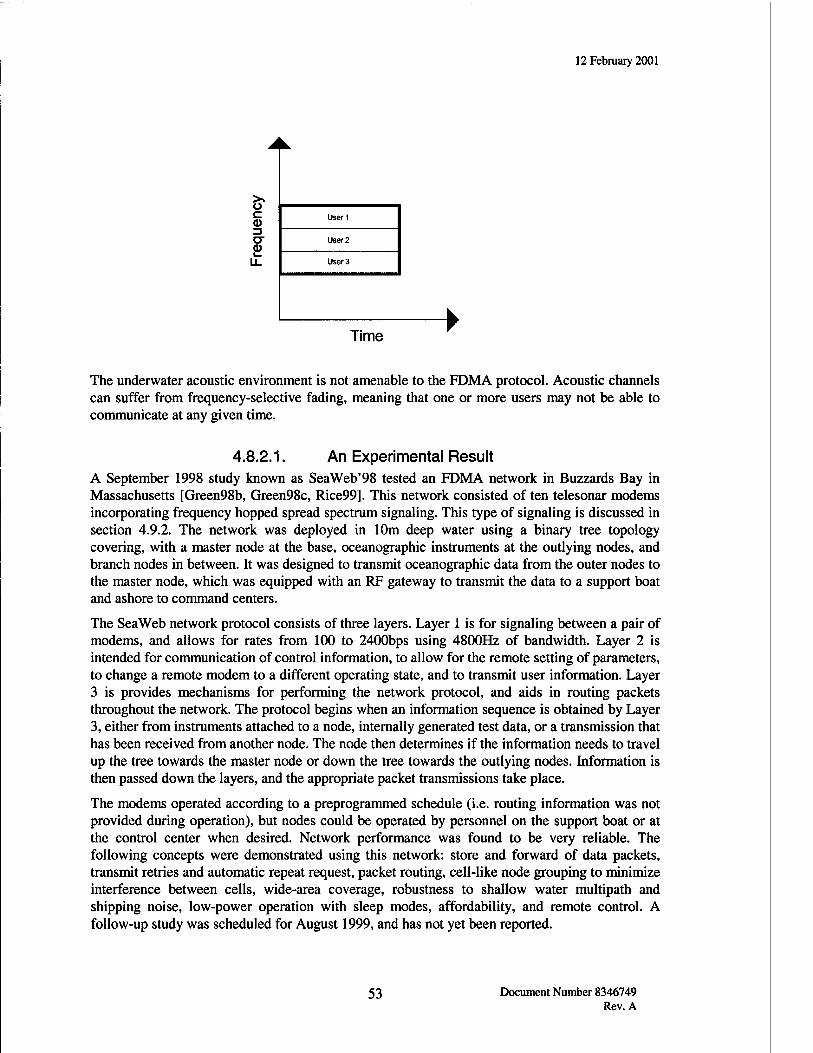
12 February 2001
fr c <D 3 C7 2?
LL User 3
Time
The underwater acoustic environment is not amenable to the FDMA protocol. Acoustic channels can suffer from frequency-selective fading, meaning that one or more users may not be able to communicate at any given time.
4.8.2.1. An Experimental Result A September 1998 study known as SeaWeb'98 tested an FDMA network in Buzzards Bay in Massachusetts [Green98b, Green98c, Rice99]. This network consisted of ten telesonar modems incorporating frequency hopped spread spectrum signaling. This type of signaling is discussed in section 4.9.2. The network was deployed in 10m deep water using a binary tree topology covering, with a master node at the base, oceanographic instruments at the outlying nodes, and branch nodes in between. It was designed to transmit oceanographic data from the outer nodes to the master node, which was equipped with an RF gateway to transmit the data to a support boat and ashore to command centers.
The SeaWeb network protocol consists of three layers. Layer 1 is for signaling between a pair of modems, and allows for rates from 100 to 2400bps using 4800Hz of bandwidth. Layer 2 is intended for communication of control information, to allow for the remote setting of parameters, to change a remote modem to a different operating state, and to transmit user information. Layer 3 is provides mechanisms for performing the network protocol, and aids in routing packets throughout the network. The protocol begins when an information sequence is obtained by Layer 3, either from instruments attached to a node, internally generated test data, or a transmission that has been received from another node. The node then determines if the information needs to travel up the tree towards the master node or down the tree towards the outlying nodes. Information is then passed down the layers, and the appropriate packet transmissions take place.
The modems operated according to a preprogrammed schedule (i.e. routing information was not provided during operation), but nodes could be operated by personnel on the support boat or at the control center when desired. Network performance was found to be very reliable. The following concepts were demonstrated using this network: store and forward of data packets, transmit retries and automatic repeat request, packet routing, cell-like node grouping to minimize interference between cells, wide-area coverage, robustness to shallow water multipath and shipping noise, low-power operation with sleep modes, affordability, and remote control. A follow-up study was scheduled for August 1999, and has not yet been reported.
53 Document Number 8346749 Rev. A
12 February 2001
4.8.3. Code-Division Multiple Access CDMA does not involve division of the time domain or the frequency domain. Instead, each user is allocated a unique spreading code for use in modulating transmissions. Spreading codes are sequences resembling noise that have very low correlation with one another, and are discussed in more detail in the chapter on covert communications. Each user makes use of the same available channel bandwidth. Users are distinguished by correlating the received transmission with the set of spreading codes in use. For example, if User 1 modulates a transmission with the sequence {1 1 1} and User 2 modulates a transmission with the sequence {1-1 1}, the correlation of {1 1 1} with itself is three times larger than the correlation of {1 1 1} and {1 -1 1}. Thus, if a transmission from User 1 is received, correlation by {1 -1 1} will more resemble noise, while correlation by {1 1 1} will yield the message from User 1.
4.8.3.1. Selected Experimental Results There have been a few proposed implementations of CDMA modified for the underwater acoustic environment. Modification is necessary because of extensive multipath and the severely limited available bandwidth. These factors restrict the choice of spreading codes to short sequences with higher cross-correlations. One proposed method permits two-way data telemetry between ocean-bottom nodes and a central, surface-deployed receiver in the 10-40kHz vertical acoustical channel [Brady92, Brady94]. "Central" refers to the ability of the receiver to demodulate signals from more than one transmitter. The ocean bottom nodes initiate transmissions by requesting a data channel time slot through a common narrow-band channel. Request packets from different nodes may overlap, or collide, and the system is designed to resolve such collisions.
The system works as follows: each user modulates a pre-assigned length-3 spreading sequence by a sequence of symbols and transmits asynchronously through a unique channel. The received waveforms are processed with a bank of matched filters, one per user. The matched filter output for each user contains interference from other users (known as multiple access interference or MAI) due to the partially overlapping cross-correlations. The receiver estimates the MAI through soft decisions that depend on the received signal estimates. The estimated MAI is subtracted out and the resulting signal is used together with a channel estimate to form final decisions for the data. This strategy utilizes the attribute that packets that collide usually have portions that do not contain MAI.
Evaluation of this strategy was accomplished using recorded in-water data from 1992 [Brady92]. Two modems transmitted 700-bit BPSK packets in an asynchronous manner at a range of 2000m in deep water south of Martha's Vineyard with weather at sea state 5 and 6'-8' seas. Both the transmitters and the shipborne receiver were omni-directional. Each packet was initiated by a transmitter-specific 13-bit address. This was followed by a 4-bit silent period, used to initialize decoding and channel estimation, and provide data buffering. The method exhibited success even under conditions where one user was lOdB in signal energy below the other user.
Another type of implementation employs receivers that implicitly perform adaptive matched filtering, MAI suppression, linear equalization of ISI and timing error compensation. This method adaptively determines the component of the desired signal that is orthogonal to the interference. Implementations of this type include a decentralized receiver based on a decision feedback equalizer (DFE) [Zvonar93], a decentralized minimum mean squared error (MMSE) receiver with a fractionally spaced transversal filter [Zvonar94, Zvonar97], and a centralized receiver based on a multidimensional DFE [Zvonar96].
54 Document Number 8346749 Rev. A
12 February 2001
These methods were tested in a 1993 shallow-water experiment conducted by WHOI in the Woods Hole Harbor. The range between transmitters and receiver was 750m in 18-m deep water. The geometry of the setup precluded the use of beamforming techniques for interference cancellation. The carrier frequency was 15kHz and the data rate was 2000bps using BPSK modulation over length-3 spreading sequences. The bandwidth utilized by the transmitted signals was 9-21kHz. One transmitter generated a signal at a power of 185dB re ljiPa while the other transmitted a signal that was lOdB weaker. The methods generally worked, although conditions causing severe fading led to a loss of communications, even for the stronger user.
4.8.3.1.1. CDMA with Spatial Diversity A further variation on these adaptive methods introduces spatial signal processing techniques to improve performance. As discussed earlier with regards to coherent acoustic communications, the spatial structure of the multipath can be exploited to reduce receiver complexity. Included in this category are a decentralized receiver based on multidimensional DFE with spatial precombining to reduce complexity [Stojanovic93c, Stojanovic94b] and a centralized receiver based on multidimensional DFE with spatial precombining [Stojanovic94b, Stojanovic96b].
In the aforementioned methods, the adaptive filters are updated at the symbol rate. Another implementation incorporating spatial signal processing takes a different approach. This method consists of a receiver with a multi-input, single output array processing filter followed by a single-channel adaptive equalizer [Gray94, Preisig95, Gray97]. The array processing filter is designed to exploit the deterministic multipath component and is updated infrequently at a rate commensurate with the rate of change of the macro-multipath structure of the environment, which is far slower than the symbol rate. The adaptive equalizer is designed to track the stochastic multipath component and is updated at the symbol rate. The array processing filter allows for a reduction in the complexity of the adaptive equalizer, just like the spatial precombiner.
A recent simulation analyzed a modified CDMA approach that uses spatially and temporally adaptive receivers with spreading codes of up to length-31 [Tsimenidis99], which are longer than previously studied. Longer code lengths improve the viability of a CDMA-based underwater acoustic communications network. This method has yet to be tested in the field.
4.8.4. Other Networking Protocols Channels for terrestrial networks are relatively stationary and have few multipath arrivals. Undersea channels have multipath arrival structures that can span several tens to hundreds of symbols, whereas terrestrial multipath typically spans only adjacent symbols. Terrestrial channel time-variability is slow enough that almost all work in the research literature assumes that the channel can be estimated once with a probe, and that it then remains constant for the duration of the transmission. Also, terrestrial channels have "rapid" feedback, which enables cooperative communication techniques such as efficient energy distribution across frequency and requests for retransmission.
The nominal speed of sound is an undersea channel 1500m/s, making TDMA scheduling and network synchronization difficult. Worse than this, it makes any feedback difficult to use, since the channel may change significantly over the propagation time delay to-and-from the receiver. Without feedback, adapting techniques from terrestrial networks (i.e. Code Division Multiple Access (CDMA), Auto Repeat reQuest (ARQ), routing optimization, etc.) is difficult. CDMA techniques, which use orthogonal spreading sequences, may suffer because orthogonality would be impossible to maintain and timing would never be precise. In addition, the severe bandwidth
55 Document Number 8346749 Rev. A
12 February 2001
restrictions in the undersea environment would cause CDMA to suffer from very low throughput. Because of these challenges, alternative networking protocols have been investigated for use in the underwater acoustic channel, such as Collision Detection Multiple Access, an Acoustic Local Area Network (ALAN) for deep water, an ALAN for shallow water, and the Autonomous Oceanographic Sampling Network (AOSN).
4.8.4.1. Collision Detection Multiple Access Collision Detection Multiple Access (CoDMA) is appropriate for low-duty cycle networks. In this approach, any modem that has data to transmit simply transmits it. The recipient is expected to acknowledge the message. If no acknowledgement is received, or if the recipient indicates decoding errors, then the modem re-transmits.
This concept was pursued and tested with ONR University Research Initiative (URI) funding at Woods Hole Oceanographic Institution (WHOI) in 1987 and 1988. It was intended to replace electrical conductors for communicating along deep-sea mooring cables from mid-water instrumentation to the surface buoy and then ashore via satellite. The project used WHOI- developed, non-coherent multitone acoustic modems (the forerunners of the Datasonics ATM acoustic modem series). They communicated at 1200bps using 8-FSK in two frequency diversity bands.
A mooring was deployed with three acoustic modems at 3000m, 1500m, and 150m below the surface. The surface modem was attached to the buoy, which also provided the digital satellite link. The modems were interfaced to acoustic current meters but also broadcasted test data once every six hours.
Since the modems only broadcasted a single packet every six hours, a simple CoDMA protocol was used in order to allow the bottomed modems to broadcast asynchronously. If a transmission was garbled, the surface modem could poll each of the three subsurface units for a retransmission. The experiment lasted for six months and the system is fully described in the Oceans 1989 proceedings [Catipovic89b].
4.8.4.2. Autonomous Oceanographic Sampling Network
The Autonomous Oceanographic Sampling Network (AOSN) is a highly integrated remote sensing and communication system concept described in [Curtin93, Schmidt96, Herold97]. It was intended for deployment in Haro Strait, British Columbia to locate and track a 1km tidal front. It consists of a network of four acoustic remote sensing moorings supplemented by a network of small AUVs. Each mooring consists acoustic modems, tomography sources, and 16- element vertical arrays arranged over a 100m aperture. In addition, each mooring has a 900MHz Ethernet radio to generate a link with a land-based repeater. The moorings were deployed at depths ranging from 110-230m. The AUVs are equipped with local sensors that transmit real- time data. The objective was to improve the mapping resolution by combining the capabilities of the distributed moorings and the AUVs.
The required functions of the network included tomography, acoustic communications between all components of the system, and real-time remote control and configuration of the system. The network is linked by the modems on the AUVs and the moorings. The moorings communicate among themselves and establish protocols for information routing in response to changes in the acoustic channel and ambient noise levels. Transmission loss among the many internodal paths is
56 Document Number 8346749 Rev. A
12 February 2001
measured periodically using 28 symbol Barker codes to probe the channel. A centrally-located network controller, either one of the moorings and/or an onshore node, processes the incoming data in real-time. The moorings would emit tones at different frequencies to steer an AUV (i.e. fi for turn left, f2 for turn right, f3 for turn up, f4 for turn down). The network sources operate with carrier frequencies between 9 and 15kHz. The practicality of the AOSN is based on the number and capabilities of the AUVs, as well as the performance of the acoustic communications in the deployed environment for both navigation and data transmission.
4.9. Clandestine Communications Clandestine (or non-overt) communications is a particularly challenging task in the underwater acoustic environment [Park86]. Transmissions are subject to frequency-selective fading and distance-dependent attenuation. As a result, it is impossible to attain a consistent level of covertness at different ranges. Clandestine communications signals ideally have a low probability of detection (LPD) and a low probability of interception (LPI). LPD means that there is a low probability that an adversary will determine that observed signal energy is not attributable to the environment. LPI means that there is a low probability that an adversary will be able to extract useful information from detected energy. Some methods that show promise in the underwater environment include direct sequence-spread spectrum (DSSS), frequency-hopped spread spectrum (FHSS), mimicry, high frequency transmission, and frequency-hopped mini-packets (see Section 4.7.3).
A clandestine communications system has no utility unless it provides the required communications functionality. So, measuring the performance of such a system must presume that the communications system is providing the specified amount of link availability. A generic measure of clandestine (or LPI) performance compares the signal strength needed to support a certain level of communications performance to the signal strength needed to support a specified level of intercept success. These signal strengths must be determined for the same noise and interference backgrounds. The "LPI margin" is therefore defined as the ratio of the signal power required for intercept success to the signal power required for successful communications. A communications system becomes more and more covert as the LPI margin increases. An alternative definition of the LPI margin is the ratio of the input SNR needed for intercept success to the input SNR needed for communications success. This definition is more convenient to use because the two SNR values can be determined separately and then combined as an LPI margin.
For the sake of simplicity, it is assumed in this section that the intercept system employs a wide- band energy detector (or radiometer). Then, the intercept performance equations for reasonable time-bandwidth product DSSS or FHSS waveforms are identical in additive white Gaussian noise (AWGN) given the waveforms occupy the same bandwidth and are transmitted over the same duration of time. In this case, any difference in the LPI margin between two waveforms is measured in terms of the communications performance, i.e. the SNR at which the specified probability of a bit error (Pe) is achieved.
4.9.1. Direct Sequence-Spread Spectrum Direct sequence-spread spectrum signals were introduced in the section describing CDMA. In fact, CDMA is sometimes referred to as Spread Spectrum Multiple Access or SSMA. The description here will focus on the application of DSSS to clandestine communications. One distinguishing characteristic of DSSS signals is that the bandwidth is increased beyond the minimum necessary to exchange information. Another is that the spreading codes used to generate DSSS signals resemble noise to receivers other than the intended one and are thus
57 Document Number 8346749 Rev. A
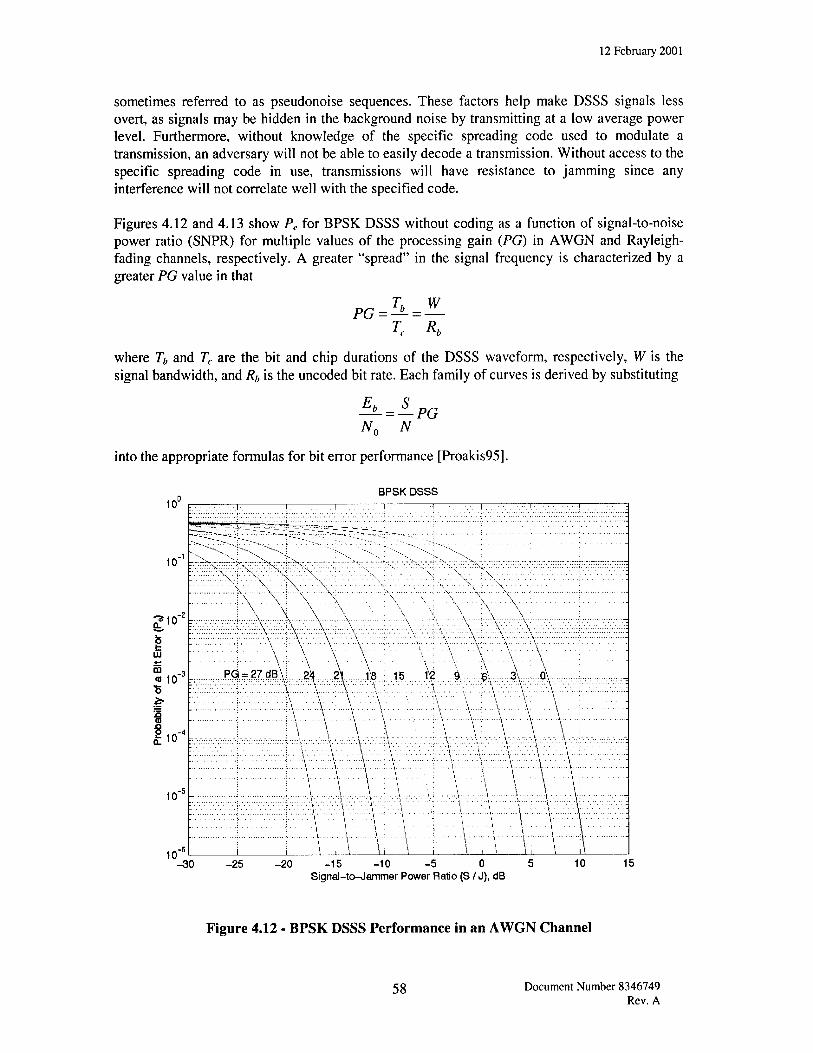
12 February 2001
sometimes referred to as pseudonoise sequences. These factors help make DSSS signals less overt, as signals may be hidden in the background noise by transmitting at a low average power level. Furthermore, without knowledge of the specific spreading code used to modulate a transmission, an adversary will not be able to easily decode a transmission. Without access to the specific spreading code in use, transmissions will have resistance to jamming since any interference will not correlate well with the specified code.
Figures 4.12 and 4.13 show Pe for BPSK DSSS without coding as a function of signal-to-noise power ratio (SNPR) for multiple values of the processing gain (PG) in AWGN and Rayleigh- fading channels, respectively. A greater "spread" in the signal frequency is characterized by a greater PG value in that
where Tb and Tc are the bit and chip durations of the DSSS waveform, respectively, W is the signal bandwidth, and Rb is the uncoded bit rate. Each family of curves is derived by substituting
N0 N PG
into the appropriate formulas for bit error performance [Proakis95].
BPSK DSSS
-30 -25 -20 -15 -10 -5 0 5 Signal-to-Jammer Power Ratio (S / J), dB
Figure 4.12 - BPSK DSSS Performance in an AWGN Channel
58 Document Number 8346749 Rev. A
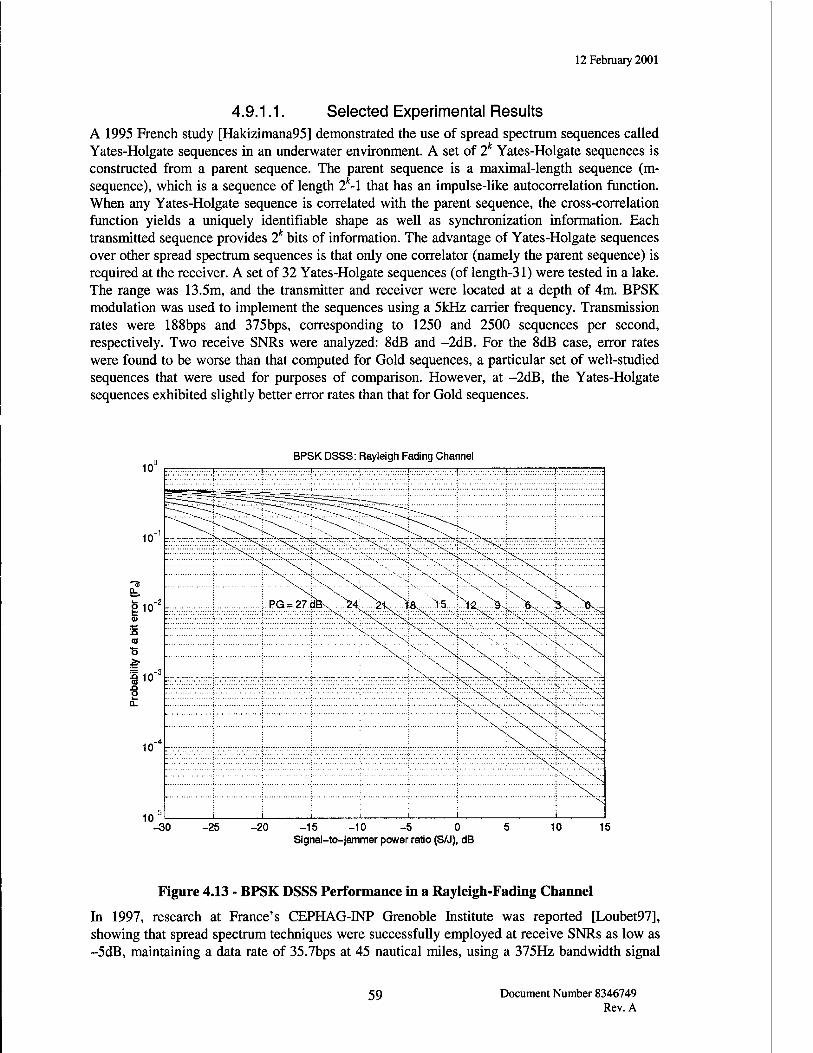
12 February 2001
4.9.1.1. Selected Experimental Results A 1995 French study [Hakizimana95] demonstrated the use of spread spectrum sequences called Yates-Holgate sequences in an underwater environment. A set of 2k Yates-Holgate sequences is constructed from a parent sequence. The parent sequence is a maximal-length sequence (m- sequence), which is a sequence of length 2*-l that has an impulse-like autocorrelation function. When any Yates-Holgate sequence is correlated with the parent sequence, the cross-correlation function yields a uniquely identifiable shape as well as synchronization information. Each transmitted sequence provides 2k bits of information. The advantage of Yates-Holgate sequences over other spread spectrum sequences is that only one correlator (namely the parent sequence) is required at the receiver. A set of 32 Yates-Holgate sequences (of length-31) were tested in a lake. The range was 13.5m, and the transmitter and receiver were located at a depth of 4m. BPSK modulation was used to implement the sequences using a 5kHz carrier frequency. Transmission rates were 188bps and 375bps, corresponding to 1250 and 2500 sequences per second, respectively. Two receive SNRs were analyzed: 8dB and -2dB. For the 8dB case, error rates were found to be worse than that computed for Gold sequences, a particular set of well-studied sequences that were used for purposes of comparison. However, at -2dB, the Yates-Holgate sequences exhibited slightly better error rates than that for Gold sequences.
10u
10"
-3 Q-,
| 10":
<D
m •s
O
10 r
10"
BPSK DSSS: Rayleigh Fading Channel ——r —i —-i- : T
\
-30 -25 -20 -15 -10 -5 0 5 Signal-to-jammer power ratio (S/J), dB
10 15
Figure 4.13 - BPSK DSSS Performance in a Rayleigh-Fading Channel
In 1997, research at France's CEPHAG-INP Grenoble Institute was reported [Loubet97], showing that spread spectrum techniques were successfully employed at receive SNRs as low as -5dB, maintaining a data rate of 35.7bps at 45 nautical miles, using a 375Hz bandwidth signal
59 Document Number 8346749 Rev. A
12 February 2001
centered at 1.5kHz. These experiments were conducted at a military site, Cap Ferrat, in conjunction with the French Navy. The experiments involved transmitting length-63 Gold sequences. Gold sequences were selected for their outstanding autocorrelation properties, which allow them to be reliably detected at low SNR. Due to their length, the transmit time is 63 times longer than it would be without spreading the signal, while the power level is 18dB lower (which corresponds to 1/63).
A follow-up study looked at finding spreading codes that are more efficient than Gold sequences [Boulanger98]. The researchers developed spreading codes that minimized a criterion on both odd and even correlation functions. Previous spreading code development neglected the so-called odd correlation function. These new codes were found to have better performance than the Gold sequences. The sequences were tested at the same location, Cap-Ferrat, in the Mediterranean Sea at 20 and 50km ranges. The carrier frequency was 1.666kHz and the bandwidth was 520Hz. Receive SNRs were as low as -14dB with an error rate no greater than 0.2%.
Researchers at Northeastern University have developed a direct sequence-spread spectrum underwater acoustics communications system [Stojanovic98, Sozer99]. The transmitter uses two Gold sequences of length-2047 to spread differentially-coded data. The same data bit is spread both in the quadrature and the in-phase branches of the channel. The signaling rate is 100bps and the carrier frequency is 12kHz. The receiver makes use of a rake receiver to incorporate the energy present in multiple propagation paths. The self-noise generated within the taps of the rake receiver is eliminated via thresholding. The system was tested using data taken in 1999 from the Baltic Sea. The receiver was placed at a depth of 30m, the transmitter was placed at a depth of 6m, and the distance between the two was about 3km. Error-free transmissions were achieved at the SNR levels tested.
4.9.2. Frequency Hopped Spread Spectrum An alternative to spreading the bandwidth of a signal in time is to spread the signal in frequency by employing FSK with frequency hopping. M = 2* tones are assigned with a spacing of \IT between tones, where T is the tone duration. With this spacing, the tones are orthogonal to one another. T is chosen to be much greater than the multipath spread, similar to the FSK limitations discussed previously. Frequency diversity is obtained by means of frequency redundancy in the encoded signal to be transmitted. As the bandwidth of a tone is much smaller than the bandwidth of the channel, this serves as the method for combating fading within the channel.
A 1988 study [Solaiman88] discussed a slow frequency hopped binary FSK scheme. Theoretical bit error rates were derived for Rayleigh selective and Ricean selective fading channels. Improvements in the error rates were made possible by the use of convolutional coding. [Stojanovic98] described an 8-FSK frequency hopped spread spectrum modem design. By using a wide bandwidth, fading is expected to be uncorrelated. There is mention of the necessity of accurate Doppler tracking to reduce the effects of Doppler spread and Doppler shift.
[Green97] proposed a frequency hopped MFSK approach that uses a whitening filter and strong error correction coding to facilitate low SNR transmissions. Whitening is accomplished by varying the durations of the transmitted tones at different frequencies. This is done in such a manner as to enhance energy at known fade frequencies in the channel and reduce energy at good frequencies. This also makes cyclostationary counter detection techniques less effective. Transmissions are encoded using a constraint-length 10 nonbinary (the alphabet size is greater than 2) rate 1/2 convolutional code with interleaving. A sync signal is also transmitted with a message to indicate time of arrival and any needed frequency correction based on the range and
60 Document Number 8346749 Rev. A
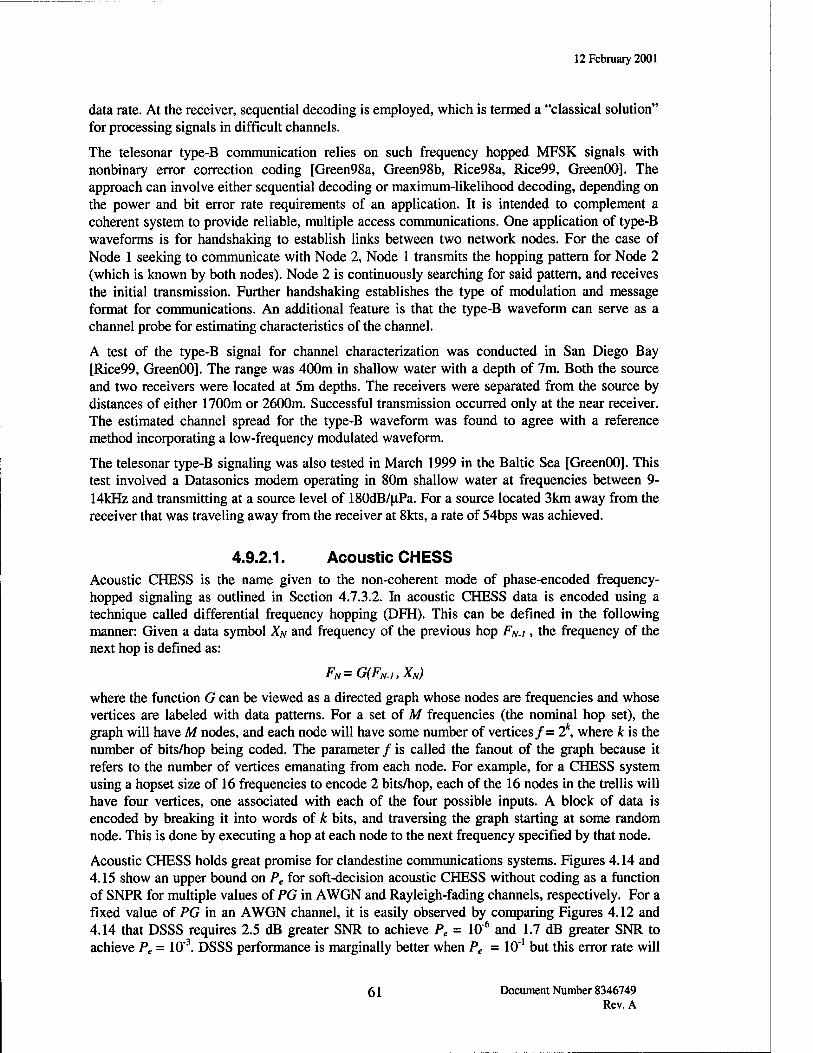
12 February 2001
data rate. At the receiver, sequential decoding is employed, which is termed a "classical solution" for processing signals in difficult channels.
The telesonar type-B communication relies on such frequency hopped MFSK signals with nonbinary error correction coding [Green98a, Green98b, Rice98a, Rice99, GreenOO]. The approach can involve either sequential decoding or maximum-likelihood decoding, depending on the power and bit error rate requirements of an application. It is intended to complement a coherent system to provide reliable, multiple access communications. One application of type-B waveforms is for handshaking to establish links between two network nodes. For the case of Node 1 seeking to communicate with Node 2, Node 1 transmits the hopping pattern for Node 2 (which is known by both nodes). Node 2 is continuously searching for said pattern, and receives the initial transmission. Further handshaking establishes the type of modulation and message format for communications. An additional feature is that the type-B waveform can serve as a channel probe for estimating characteristics of the channel.
A test of the type-B signal for channel characterization was conducted in San Diego Bay [Rice99, GreenOO]. The range was 400m in shallow water with a depth of 7m. Both the source and two receivers were located at 5m depths. The receivers were separated from the source by distances of either 1700m or 2600m. Successful transmission occurred only at the near receiver. The estimated channel spread for the type-B waveform was found to agree with a reference method incorporating a low-frequency modulated waveform.
The telesonar type-B signaling was also tested in March 1999 in the Baltic Sea [GreenOO]. This test involved a Datasonics modem operating in 80m shallow water at frequencies between 9- 14kHz and transmitting at a source level of 180dB/^Pa. For a source located 3km away from the receiver that was traveling away from the receiver at 8kts, a rate of 54bps was achieved.
4.9.2.1. Acoustic CHESS Acoustic CHESS is the name given to the non-coherent mode of phase-encoded frequency- hopped signaling as outlined in Section 4.7.3.2. In acoustic CHESS data is encoded using a technique called differential frequency hopping (DFH). This can be defined in the following manner: Given a data symbol XN and frequency of the previous hop FN.t, the frequency of the next hop is defined as:
FN — G(FN.i, XN)
where the function G can be viewed as a directed graph whose nodes are frequencies and whose vertices are labeled with data patterns. For a set of M frequencies (the nominal hop set), the graph will have M nodes, and each node will have some number of vertices/= 2k, where k is the number of bits/hop being coded. The parameter / is called the fanout of the graph because it refers to the number of vertices emanating from each node. For example, for a CHESS system using a hopset size of 16 frequencies to encode 2 bits/hop, each of the 16 nodes in the trellis will have four vertices, one associated with each of the four possible inputs. A block of data is encoded by breaking it into words of k bits, and traversing the graph starting at some random node. This is done by executing a hop at each node to the next frequency specified by that node.
Acoustic CHESS holds great promise for clandestine communications systems. Figures 4.14 and 4.15 show an upper bound on Pe for soft-decision acoustic CHESS without coding as a function of SNPR for multiple values of PG in AWGN and Rayleigh-fading channels, respectively. For a fixed value of PG in an AWGN channel, it is easily observed by comparing Figures 4.12 and 4.14 that DSSS requires 2.5 dB greater SNR to achieve Pe = 10'6 and 1.7 dB greater SNR to achieve Pe = 10"3. DSSS performance is marginally better when Pe = 10"1 but this error rate will
61 Document Number 8346749 Rev. A
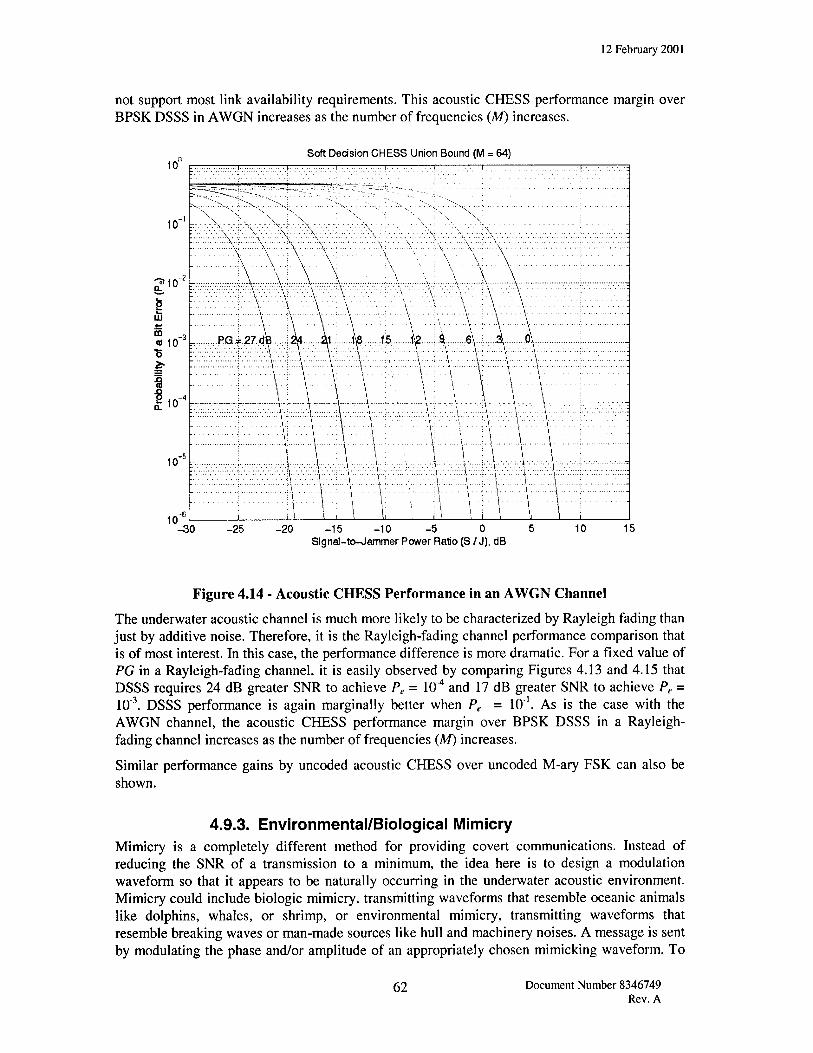
12 February 2001
not support most link availability requirements. This acoustic CHESS performance margin over BPSK DSSS in AWGN increases as the number of frequencies (M) increases.
Soft Decision CHESS Union Bound (M = 64)
-30 -25 -20 -15 -10 -5 0 5 Signal-to-Oammer Power Ratio (S / J), dB
Figure 4.14 - Acoustic CHESS Performance in an AWGN Channel
The underwater acoustic channel is much more likely to be characterized by Rayleigh fading than just by additive noise. Therefore, it is the Rayleigh-fading channel performance comparison that is of most interest. In this case, the performance difference is more dramatic. For a fixed value of PG in a Rayleigh-fading channel, it is easily observed by comparing Figures 4.13 and 4.15 that DSSS requires 24 dB greater SNR to achieve Pe = 10"4 and 17 dB greater SNR to achieve Pe = 10"3. DSSS performance is again marginally better when Pe = 10"1. As is the case with the AWGN channel, the acoustic CHESS performance margin over BPSK DSSS in a Rayleigh- fading channel increases as the number of frequencies (M) increases.
Similar performance gains by uncoded acoustic CHESS over uncoded M-ary FSK can also be shown.
4.9.3. Environmental/Biological Mimicry Mimicry is a completely different method for providing covert communications. Instead of reducing the SNR of a transmission to a minimum, the idea here is to design a modulation waveform so that it appears to be naturally occurring in the underwater acoustic environment. Mimicry could include biologic mimicry, transmitting waveforms that resemble oceanic animals like dolphins, whales, or shrimp, or environmental mimicry, transmitting waveforms that resemble breaking waves or man-made sources like hull and machinery noises. A message is sent by modulating the phase and/or amplitude of an appropriately chosen mimicking waveform. To
62 Document Number 8346749 Rev. A
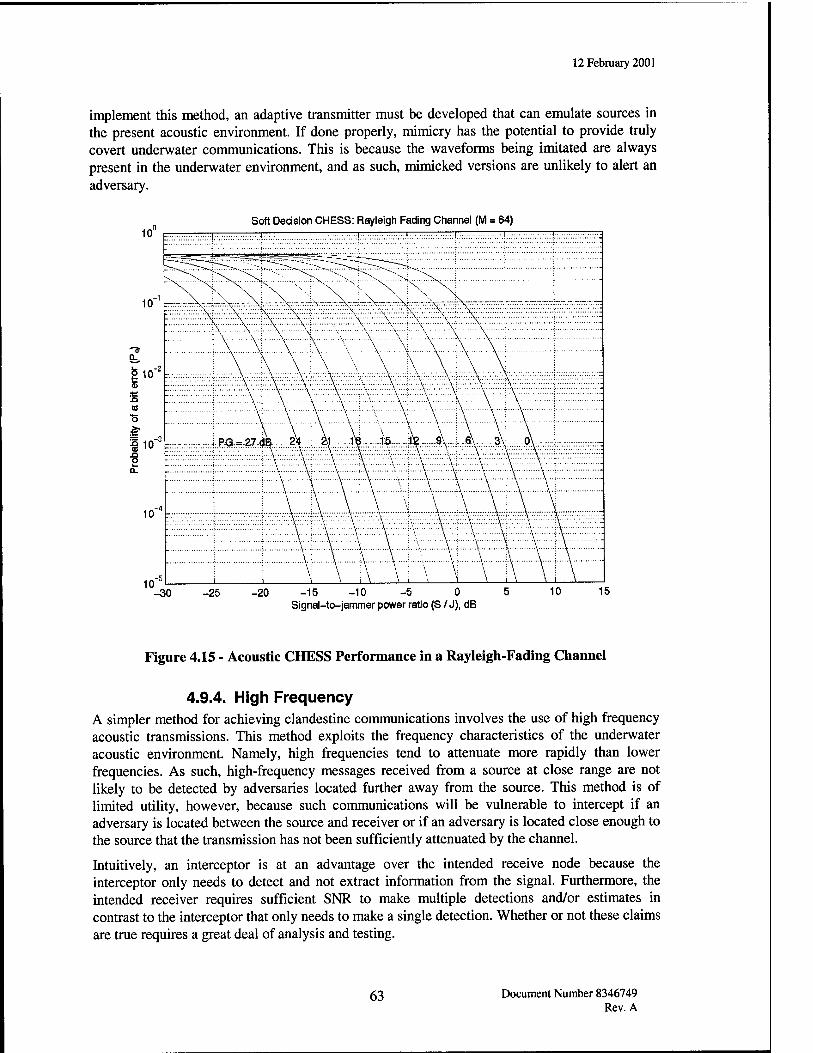
12 February 2001
implement this method, an adaptive transmitter must be developed that can emulate sources in the present acoustic environment. If done properly, mimicry has the potential to provide truly covert underwater communications. This is because the waveforms being imitated are always present in the underwater environment, and as such, mimicked versions are unlikely to alert an adversary.
Soft Decision CHESS: Rayleigh Fading Channel (M = 64)
-30 -25 -20 -15 -10 -5 0 Signal-to-jammer power ratio (S / J), dB
10
Figure 4.15 - Acoustic CHESS Performance in a Rayleigh-Fading Channel
4.9.4. High Frequency A simpler method for achieving clandestine communications involves the use of high frequency acoustic transmissions. This method exploits the frequency characteristics of the underwater acoustic environment. Namely, high frequencies tend to attenuate more rapidly than lower frequencies. As such, high-frequency messages received from a source at close range are not likely to be detected by adversaries located further away from the source. This method is of limited utility, however, because such communications will be vulnerable to intercept if an adversary is located between the source and receiver or if an adversary is located close enough to the source that the transmission has not been sufficiently attenuated by the channel.
Intuitively, an interceptor is at an advantage over the intended receive node because the interceptor only needs to detect and not extract information from the signal. Furthermore, the intended receiver requires sufficient SNR to make multiple detections and/or estimates in contrast to the interceptor that only needs to make a single detection. Whether or not these claims are true requires a great deal of analysis and testing.
63 Document Number 8346749 Rev. A
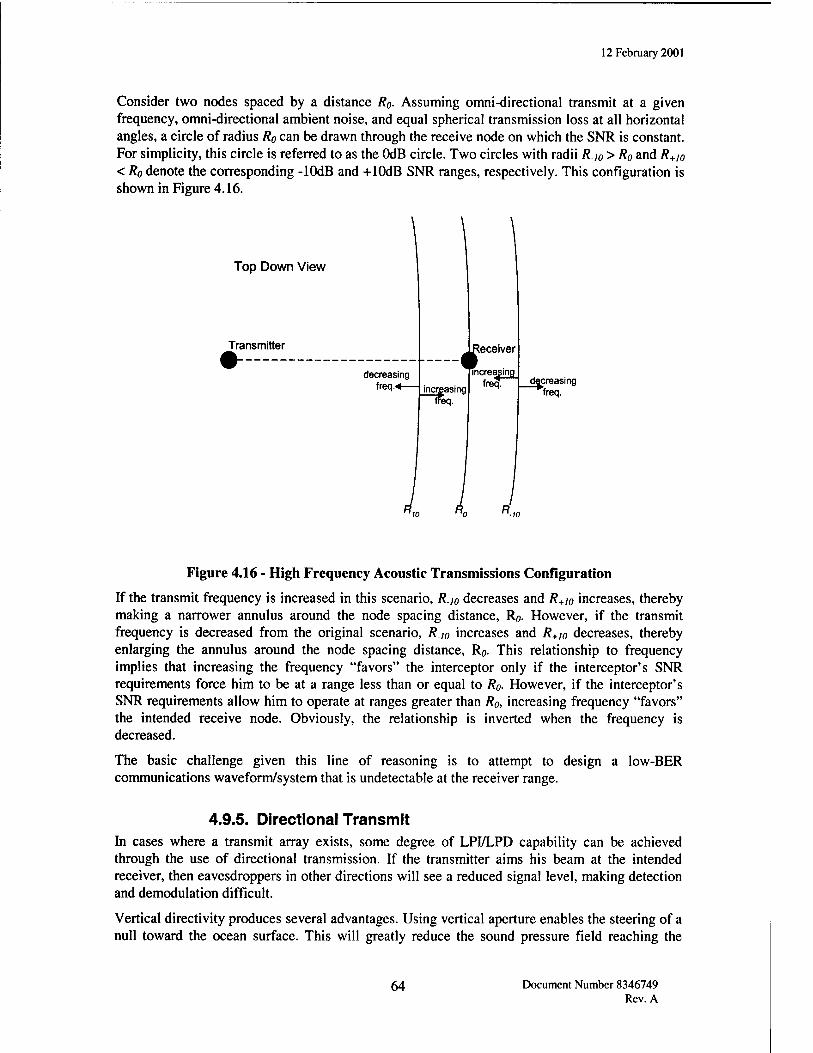
12 February 2001
Consider two nodes spaced by a distance R0- Assuming omni-directional transmit at a given frequency, omni-directional ambient noise, and equal spherical transmission loss at all horizontal angles, a circle of radius Ro can be drawn through the receive node on which the SNR is constant. For simplicity, this circle is referred to as the OdB circle. Two circles with radii R_,0 > R0 and R+t0
< R0 denote the corresponding -lOdB and +10dB SNR ranges, respectively. This configuration is shown in Figure 4.16.
Top Down View
Transmitter
decreasing freq.*—
leceiver
increasing fre?-^ decreasing
freq
Figure 4.16 - High Frequency Acoustic Transmissions Configuration
If the transmit frequency is increased in this scenario, R.l0 decreases and R+I0 increases, thereby making a narrower annulus around the node spacing distance, Ro. However, if the transmit frequency is decreased from the original scenario, R.w increases and R+I0 decreases, thereby enlarging the annulus around the node spacing distance, R0. This relationship to frequency implies that increasing the frequency "favors" the interceptor only if the interceptor's SNR requirements force him to be at a range less than or equal to R0. However, if the interceptor's SNR requirements allow him to operate at ranges greater than R0, increasing frequency "favors" the intended receive node. Obviously, the relationship is inverted when the frequency is decreased.
The basic challenge given this line of reasoning is to attempt to design a low-BER communications waveform/system that is undetectable at the receiver range.
4.9.5. Directional Transmit In cases where a transmit array exists, some degree of LPI/LPD capability can be achieved through the use of directional transmission. If the transmitter aims his beam at the intended receiver, then eavesdroppers in other directions will see a reduced signal level, making detection and demodulation difficult.
Vertical directivity produces several advantages. Using vertical aperture enables the steering of a null toward the ocean surface. This will greatly reduce the sound pressure field reaching the
64 Document Number 8346749 Rev. A
12 February 2001
ocean surface in a region directly over the transmit platform/node. Furthermore, if a thermocline is present in the transmission region, it is possible to design a transmit system with a half- beamwidth that is less than the critical angle of the thermocline. This design would force an interceptor to deploy a receiver below the knee in the sound speed profile, a sometimes difficult and potentially expensive procedure. It has the added benefit of greatly reducing the potential for inadvertent interception.
Horizontal directivity is advantageous in that the azimuthal area that is being ensonified is reduced basically to the azimuthal beamwidth of the array. This will reduce the probability of detection for omni-transmit by the probability that the potential interceptor is within the azimuthal area of ensonification.
65 Document Number 8346749 Rev. A
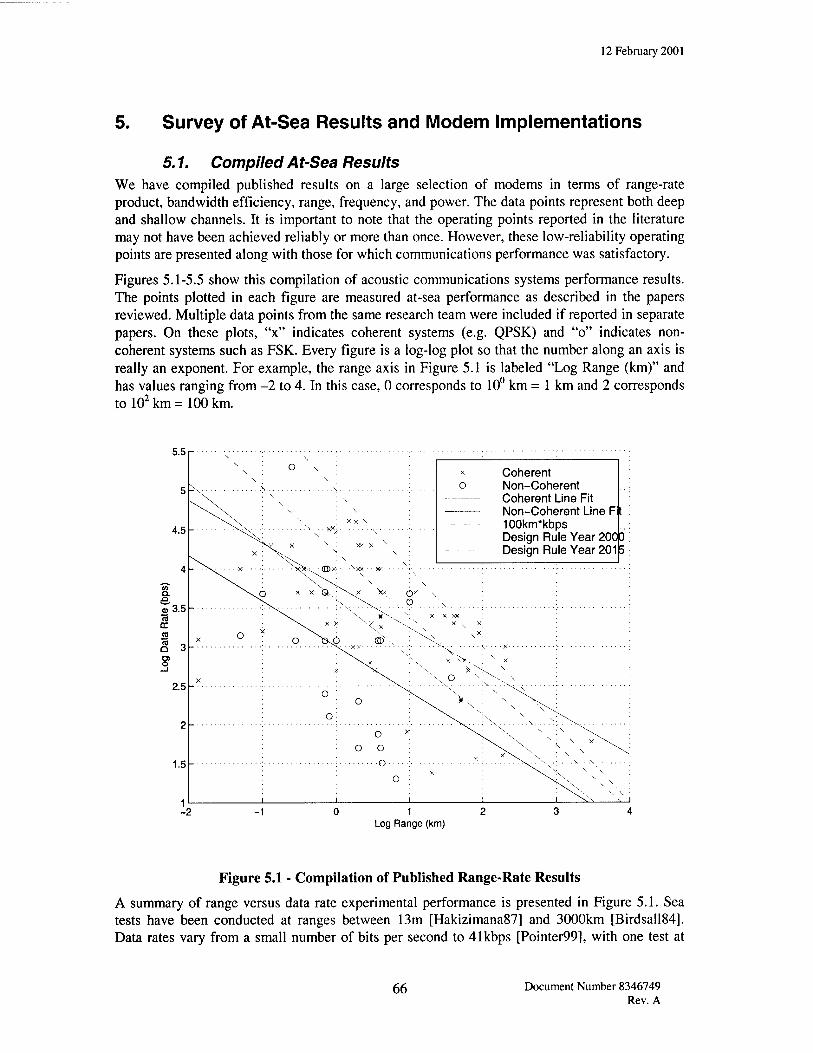
12 February 2001
5. Survey of At-Sea Results and Modem Implementations
5.1. Compiled A t-Sea Results We have compiled published results on a large selection of modems in terms of range-rate product, bandwidth efficiency, range, frequency, and power. The data points represent both deep and shallow channels. It is important to note that the operating points reported in the literature may not have been achieved reliably or more than once. However, these low-reliability operating points are presented along with those for which communications performance was satisfactory.
Figures 5.1-5.5 show this compilation of acoustic communications systems performance results. The points plotted in each figure are measured at-sea performance as described in the papers reviewed. Multiple data points from the same research team were included if reported in separate papers. On these plots, "x" indicates coherent systems (e.g. QPSK) and "o" indicates non- coherent systems such as FSK. Every figure is a log-log plot so that the number along an axis is really an exponent. For example, the range axis in Figure 5.1 is labeled "Log Range (km)" and has values ranging from -2 to 4. In this case, 0 corresponds to 10° km = 1 km and 2 corresponds to 102 km = 100 km.
Log Range (km)
Figure 5.1 - Compilation of Published Range-Rate Results
A summary of range versus data rate experimental performance is presented in Figure 5.1. Sea tests have been conducted at ranges between 13m [Hakizimana87] and 3000km [Birdsall84]. Data rates vary from a small number of bits per second to 41kbps [Pointer99], with one test at
66 Document Number 8346749 Rev. A
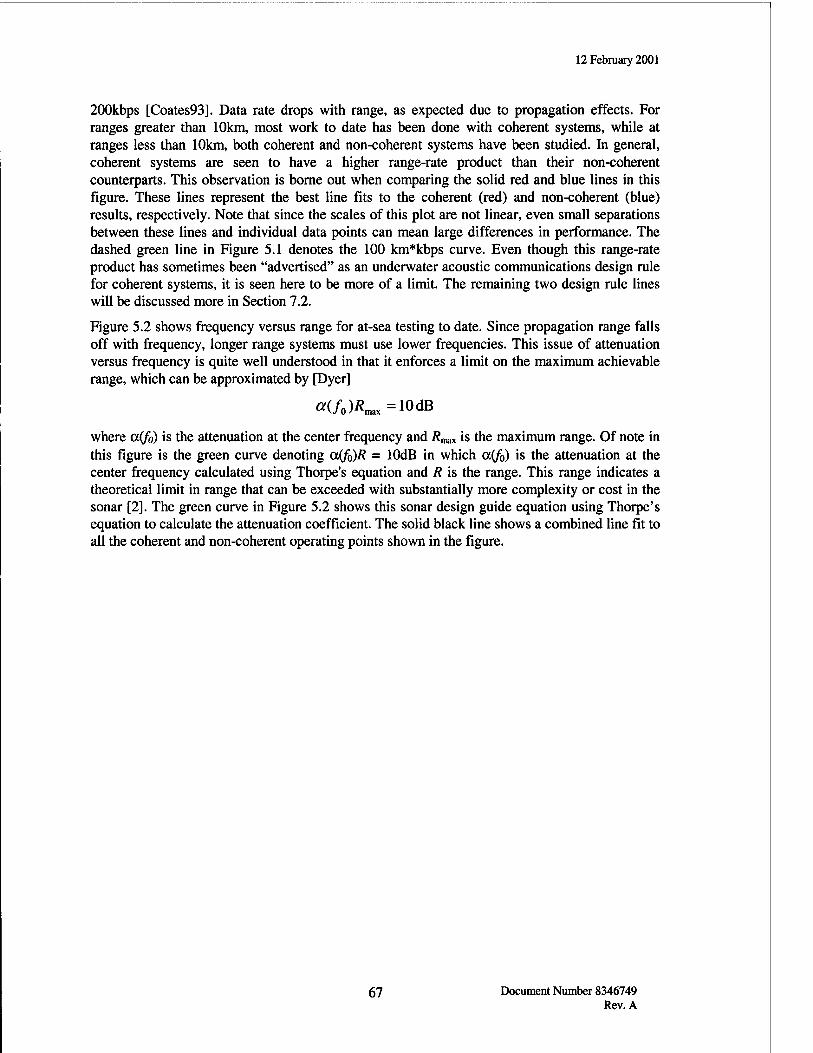
12 February 2001
200kbps [Coates93]. Data rate drops with range, as expected due to propagation effects. For ranges greater than 10km, most work to date has been done with coherent systems, while at ranges less than 10km, both coherent and non-coherent systems have been studied. In general, coherent systems are seen to have a higher range-rate product than their non-coherent counterparts. This observation is borne out when comparing the solid red and blue lines in this figure. These lines represent the best line fits to the coherent (red) and non-coherent (blue) results, respectively. Note that since the scales of this plot are not linear, even small separations between these lines and individual data points can mean large differences in performance. The dashed green line in Figure 5.1 denotes the 100 km*kbps curve. Even though this range-rate product has sometimes been "advertised" as an underwater acoustic communications design rule for coherent systems, it is seen here to be more of a limit. The remaining two design rule lines will be discussed more in Section 7.2.
Figure 5.2 shows frequency versus range for at-sea testing to date. Since propagation range falls off with frequency, longer range systems must use lower frequencies. This issue of attenuation versus frequency is quite well understood in that it enforces a limit on the maximum achievable range, which can be approximated by [Dyer]
«(/o)^max=10dB
where a(f0) is the attenuation at the center frequency and Rmax is the maximum range. Of note in this figure is the green curve denoting a(f0)R = lOdB in which a(f0) is the attenuation at the center frequency calculated using Thorpe's equation and R is the range. This range indicates a theoretical limit in range that can be exceeded with substantially more complexity or cost in the sonar [2]. The green curve in Figure 5.2 shows this sonar design guide equation using Thorpe's equation to calculate the attenuation coefficient. The solid black line shows a combined line fit to all the coherent and non-coherent operating points shown in the figure.
67 Document Number 8346749 Rev. A
12 February 2001
5.5
"X ; 0 ; ;
v \ : - \ : \ : :
x Coherent o Non-Coherent
— Combined Line Fit -— aR<=10dB
\x : \° ; ;
Xro o ■ i
0 ^ ; X: o © i : Y O > v ; «Ni'p: >: : : i O : X ' .O : ;
; : O'^-v ■> :
X ; : ■ ^v >' :
• y \v ■
i ■ 0 >: **\ ! \ I " * « X :
• ; : 0
i i i i i "■ N
W4.5r
9. 1 3.5
2.5
-2 1 Log Range (km)
Figure 5.2 - Compilation of Published Range vs. Frequency Results
Figure 5.3 contains the subset of points plotted in Figure 5.2 for which source level information was reported. Shown in this figure is the same combined line fit used in the previous figure in combination with operating points represented by the reported source level. The three operating points shown in red, and all located well above the combined line fit, denote those experiments fortunate enough to have source levels greater than 200dB. The two operating points shown in blue, and located well below the combined line fit, denote those experiments with source levels less than 170dB. The remaining experiments (shown in green) utilized sonars with source levels between 170 and 200dB. As expected, greater ranges can be expected with greater source level for a given frequency.
68 Document Number 8346749 Rev. A
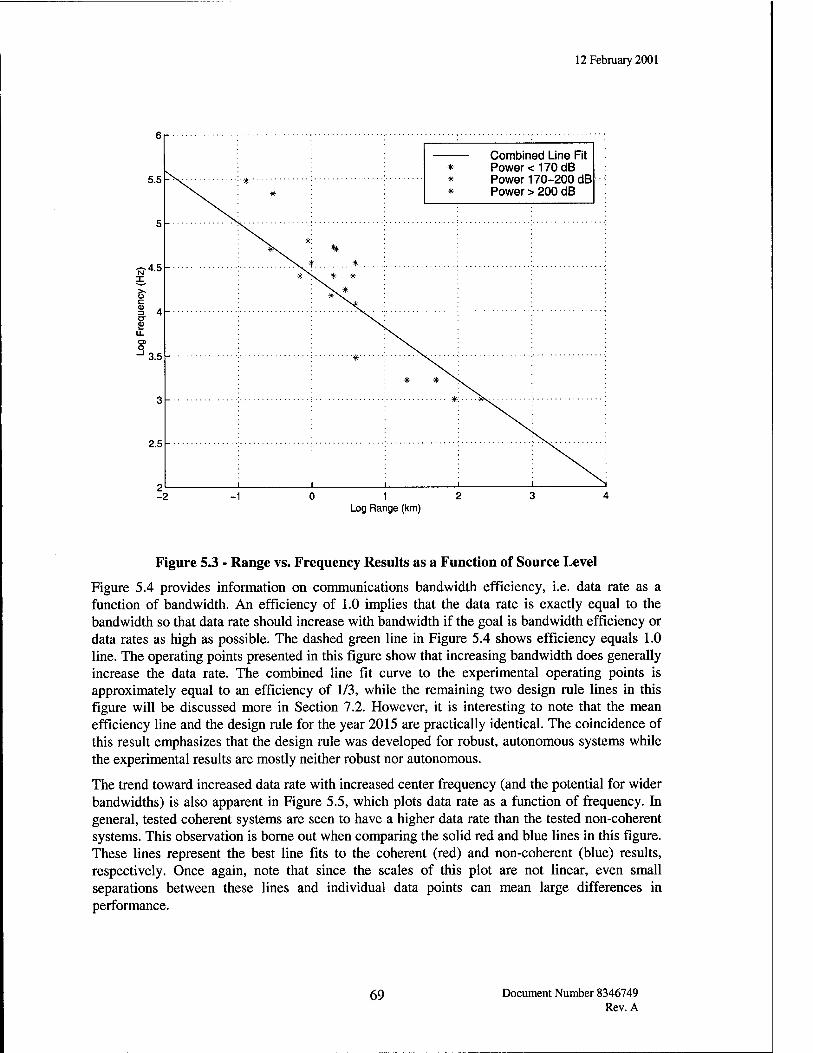
12 February 2001
5.5-
5-
* Power < 170 dB * Power 170-200 dB * Power > 200 dB
•* #
*v : % : ^V * * : : .. .: ^ \ * * : :
# \-
* * >^
i i i N
I
3.5
2.5-
-2 1 2 Log Range (km)
Figure 5.3 - Range vs. Frequency Results as a Function of Source Level
Figure 5.4 provides information on communications bandwidth efficiency, i.e. data rate as a function of bandwidth. An efficiency of 1.0 implies that the data rate is exactly equal to the bandwidth so that data rate should increase with bandwidth if the goal is bandwidth efficiency or data rates as high as possible. The dashed green line in Figure 5.4 shows efficiency equals 1.0 line. The operating points presented in this figure show that increasing bandwidth does generally increase the data rate. The combined line fit curve to the experimental operating points is approximately equal to an efficiency of 1/3, while the remaining two design rule lines in this figure will be discussed more in Section 7.2. However, it is interesting to note that the mean efficiency line and the design rule for the year 2015 are practically identical. The coincidence of this result emphasizes that the design rule was developed for robust, autonomous systems while the experimental results are mostly neither robust nor autonomous.
The trend toward increased data rate with increased center frequency (and the potential for wider band widths) is also apparent in Figure 5.5, which plots data rate as a function of frequency. In general, tested coherent systems are seen to have a higher data rate than the tested non-coherent systems. This observation is borne out when comparing the solid red and blue lines in this figure. These lines represent the best line fits to the coherent (red) and non-coherent (blue) results, respectively. Once again, note that since the scales of this plot are not linear, even small separations between these lines and individual data points can mean large differences in performance.
69 Document Number 8346749 Rev. A
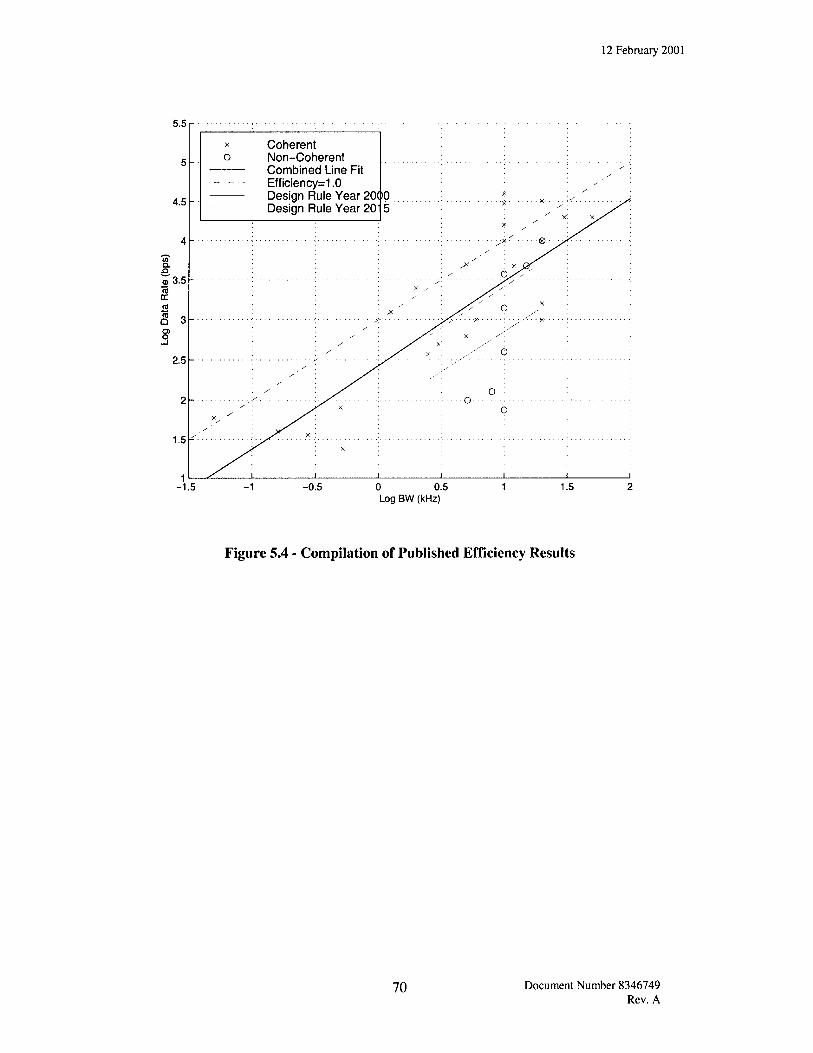
12 February 2001
5.5 r
4.5-
3.5
-•
x Coherent o Non-Coherent
Combined Line Fit Efficiency=1.0 Design Rule Year 2000
Design Rule Year 20 5 ' X. ^y^
j/s' ■ ■ ■ -X ; ■ ■;. ■-' ■ ■ X ;
X ,/'■ ■
/' 0 ;
y
.-■
O : •
--
/ x,.-''
^r X
' X 6
s
X
i i
CO cn
2.5
1.5^-
-1.5 -0.5 0 0.5 Log BW (kHz)
1.5
Figure 5.4 - Compilation of Published Efficiency Results
70 Document Number 8346749 Rev. A
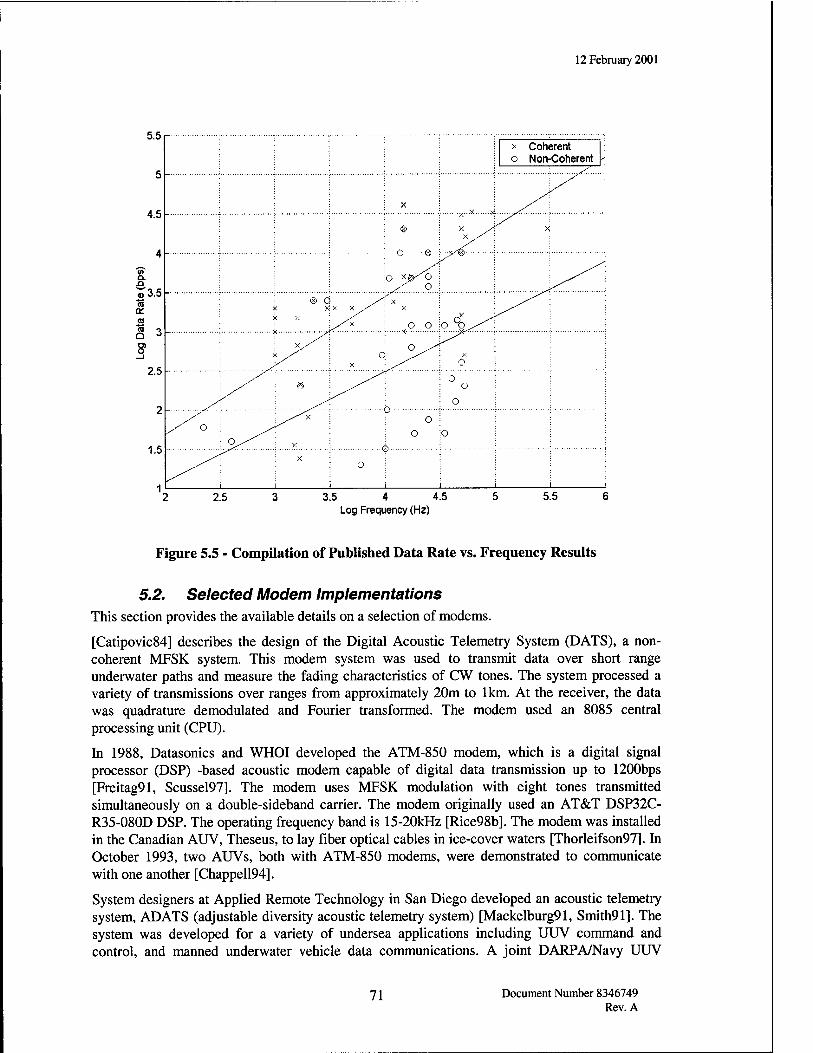
12 February 2001
2.5 3.5 4 4.5 Log Frequency (Hz)
Figure 5.5 - Compilation of Published Data Rate vs. Frequency Results
5.2. Selected Modem Implementations This section provides the available details on a selection of modems.
[Catipovic84] describes the design of the Digital Acoustic Telemetry System (DATS), a non- coherent MFSK system. This modem system was used to transmit data over short range underwater paths and measure the fading characteristics of CW tones. The system processed a variety of transmissions over ranges from approximately 20m to 1km. At the receiver, the data was quadrature demodulated and Fourier transformed. The modem used an 8085 central processing unit (CPU).
In 1988, Datasonics and WHOI developed the ATM-850 modem, which is a digital signal processor (DSP) -based acoustic modem capable of digital data transmission up to 1200bps [Freitag91, Scussel97]. The modem uses MFSK modulation with eight tones transmitted simultaneously on a double-sideband carrier. The modem originally used an AT&T DSP32C- R35-080D DSP. The operating frequency band is 15-20kHz [Rice98b]. The modem was installed in the Canadian AUV, Theseus, to lay fiber optical cables in ice-cover waters [Thorleifson97]. In October 1993, two AUVs, both with ATM-850 modems, were demonstrated to communicate with one another [Chappell94].
System designers at Applied Remote Technology in San Diego developed an acoustic telemetry system, AD ATS (adjustable diversity acoustic telemetry system) [Mackelburg91, Smith91]. The system was developed for a variety of undersea applications including UUV command and control, and manned underwater vehicle data communications. A joint DARPA/Navy UUV
71 Document Number 8346749 Rev. A
12 February 2001
program used the ADATs to demonstrate UUVs to meet specific Navy mission requirements [Pappas91]. The modem system supported data rates from 19.5 to 1200bps using 8-tone MFSK modulation. The modem system was tested at ranges of 300m at 1200bps and 2000m at 50bps. The newer generation ADATS II is able to support eight transmission rate options from 31 to 2500bps. ADATS II has been tested at ranges of 1000m at 1200bps and 4000m at 50bps.
ORCA instrumentation developed, in cooperation with IFREMER (Institut Francois de Recherche pour l'Exploitation de la Mer) and ENSTB (Ecole Nationale SupeYieure des Telecommunications de Bretagne), an acoustic communication system to transmit images and data on a vertical link channel in deep water. The system transmitted at 19.2kbps on a carrier frequency of 53kHz over a 2000m range using 2-DPSK modulation [Ayela94].
WHOI developed a high-performance acoustic modem for use in the Acoustic Local Area Network (ALAN), where higher data rates are needed in an acoustically-difficult shallow water environment [Herold94]. The DSP board is the TMS320C40 processor, chosen for its relatively low power consumption. The system contains eight-channel, 16-bit analog-to-digital converters (ADCs) and ten-channel, 16-bit digital-to-analog converters (DACs). The data rate of the system is 10kbps and QPSK modulation is used with a carrier frequency of 15kHz. A personal-computer (PC) based system controller manages the various subsections of the modem. There is a capability to attach radio Ethernet and global positioning system (GPS) to the system. This modem was installed on the MIT Odyssey HB class AUVs for communicating between the AUV and a docking station [Singh96].
The multimodulation acoustic transmission system is an acoustic modem based on two low- power consumption microcontrollers and one 56002 DSP [Ayela94]. The modulation schemes and baud rates of the modem were remotely controlled by the operator. Three types of modulation were implemented on the system: PSK for vertical transmission, chirp and frequency hopping for horizontal transmission. Two frequency bands existed within the system, 10-14kHz (20bps) and 50-58kHz (100-200bps), which have both been tested in shallow water.
The hardware structure of the receiving unit for an acoustic system designed for use between an AUV and its surface base station is presented in [Barroso94]. The input has a pre-amplifier stage, followed by an automatic gain control unit (AGC) and a bandpass filter. The AGC ensures the signal level delivered to the remaining stages stays constant. The bandpass filter is centered around a carrier frequency of 53kHz. The non-coherent demodulation of the signal is broken out into the in-phase and quadrature components around 53kHz. The two signals are then sampled and delivered to a digital processing card, the Motorola DSP56002 at 40MHz with 8 K program RAM. The decoded bits processed by the DSP are sent to a 68HC11 microcontroller, which supervises the whole system. The emitter is based on the same DSP card, which outputs the PSK modulated signal after scrambling and differential coding. The modulated signal is then amplified before being applied to the acoustic transducer.
An underwater acoustic modem has been developed by Edge Tech for AUVs that is advertised as robust and low cost [LeBlanc96, LeBlanc99, LeBlancOOb]. The modem uses a single TI320C31 DSP to generate multi-frequency chirp pulses for transmission and uses continuous matched filter processing in the receiver mode. The modem can operate in either a Chirp MFSK or Chirp DPSK mode. The MFSK mode is more robust but lower in baud rate (2000 baud) versus the DPSK (4000 baud). The modem is presented as being reliable at ranges up to 10km range in shallow water. The Advanced Marine Systems (AMS) group at Florida Atlantic University developed a peer-to-peer communication protocol, which was implemented on the Edge Tech modem with the Ocean Explorer (OEX) AUV [Smith97].
72 Document Number 8346749 Rev. A
12 February 2001
The computer system on-board the AQUA EXPLORER 1000 AUV consists of a MC68040 CPU board, a hard drive, two DSP boards, a frame grabber board for video image processing, and an I/O board [Asakawa96, Kojima96]. The software is developed on a multi-task real-time operating system (VX Works). The modulation is performed with the software on one DSP (AT&T DSP32C), while the demodulation is performed with the software on two DSPs. The data transmission rate is 16kbps, the modulation used is QPSK, the acoustic frequency band is 50- 60kHz, and the modem operates to ranges greater than 1200m. Almost all the signal processing, filtering, modulation, demodulation, and synchronization are performed with the DSPs.
The acoustic modem developed for the Autonomous Minehunting and Mapping Technology (AMMT) program is located in the forward and aft free-flood sections of the UUV, with a computer in the center section of the vehicle for control [Freitag96, Paglia96, Regan96]. A ruggedized PC consists of a commercially available DSP motherboard that holds up to four TI C40 processor modules and a custom multichannel analog front-end and A/D converter that interfaces directly to a C40 processor. Multi-pole fixed filters set for 10 to 20kHz perform the signal conditioning internal to the modem to reduce out-of-band interference. In the forward section of the AUV four directional receivers are located on each side. The aft freeflood area contains two directional projectors.
The second-generation AUV called the AQUA EXPLORER 2 (AE-2) has a low bit rate acoustic link to communicate non-video data and a high bit rate for video signal transmission [Kojima97]. The low bit rate is 125bps using an FSK modulation. The carrier frequency is apparently 48kHz. Almost all the signal processing, filtering, modulation, demodulation, and synchronization are done with one DSP. The video high transmission rate is 32kbps, using a QPSK modulation. The QPSK frequency band is 86 to 106kHz. Both the high and low bit signals use Reed-Solomon error correction coding.
The next-generation Datasonics modem, a telesonar type-A MFSK (ATM-875) acoustic modem is advertised to communicate at rates between 100 and 2400bps [Scussel97]. The modem preserves the l-of-4 MFSK modulation mode used in the Datasonics ATM-850 for higher data rates, but incorporates Hadamard modulation code when detection resistance is preferred and/or when only low data rates are needed. The bandwidth of the ATM-875 is 5120Hz, operating in the frequency band between 8 and 13kHz. The modem uses a TI TMS320C50 processor [Rice98b]. The use of the ATM-875 modem in the Telesonar development effort is discussion in [McDonald98a, McDonald98b, McDonald99].
[Chang-Hong98] discusses a prototype MPSK underwater acoustic communication modem for an AUV application. The transmitter unit consists of a transducer, a transmitter, a TMS320C30 DSP board with a DAC, and a PC. The receiver consists of four hydrophones, a 4-channel receiver, a 16-channel ADC board, and a PC. The fast self-optimized LMS (FOLMS) algorithm is implemented as the DFE update algorithm.
The constraints of power and space on a UUV drive towards an on-board acoustic modem that is compact and low power. The Utility Acoustic Modem (UAM) designed by WHOI is a compact, low-power device with high-performance DSP, multichannel receiver, and efficient power amplifier [Freitag98b]. It is capable of transmitting and receiving PSK and FSK communication signals, offers both 10 to 1000bps and 2.5 to 10kbps transmission and reception for MFSK and PSK, respectively. It can be installed as a board set within an existing pressure housing or used stand-alone in a free-flood area with an internal lithium battery pack. The UAM can operate at frequencies up to 30kHz with the appropriate transducers. The unit draws four watts in receive mode and 30 watts when transmitting at 180dB. The modem achieved a raw burst data rate of 10kbps during a test in 1997 that was reduced to 6.7kbps with ECC. The UAM has achieved a
73 Document Number 8346749 Rev. A
12 February 2001
maximum range from an AUV to a support ship of approximately 2km. The demonstrated range increases to greater than 3km for the down-link from the surface ship to the AUV.
The Underwater Digital Acoustic Telemetry (UDAT) system consists of a set of underwater acoustic telemetry modems used for test-range applications [Blackmon98, Blackmon99]. Each modem has a VME chassis and a notebook computer, which acts as the user interface. The VME chassis is controlled by a Force 5CE CPU running SUN OS 4.1.3-ul. The chassis contains a hard drive, a VME clock and timing board, and two octal TMS320C40 DSP boards. The transmit processing resides on two of the TMS320C40 processors. The receiver, which uses a FTF-update DFE, is implemented using eight TMS320C40 processors.
Three different users have successfully tested acoustic modems by LinkQuest, Inc. [YuOO]. LinkQuest, Inc. has four models to choose from, see Table 5-A, of which each test had a modem implemented for a specific use. All the modems maintained a consistent bit error rate of less than 10'7. Global Marine Systems Ltd. of UK used a UWM2000 acoustic modem transmitted data from 500 meters below ocean surface at a data rate of 6,600 bps. Shell Oil Company also used a UWM2000 acoustic modem to upload current profiles from sub-sea ADCP in real-time instead of cable. Lastly, a commercial survey company, C&C Technologies customized a UWM4000 acoustic modem for AUV operations. Image files from the side-scan sonar sub-bottom profiler were transmitted to the surface to gain knowledge of the survey site.
Finally, a VME modem system has been developed at BAE SYSTEMS as part of the ACOMMS ATD. The system was used to develop the ACOMMS ATD software for various platforms and for all at-sea demonstrations on-board research vessels, SSNs, and surface ships. The entire system was designed to fit through an SSN hatch.
The software is a combination of commercial-off-the-shelf (COTS) products and code written in C. The Matlab version of the algorithms was ported to run on the Mercury PowerPC (PPC) environment implementing Mercury vector library code. Several of the Mercury PPC processors in the modem are dedicated to tuning/decimating and packet detection. The remaining DSP processors are arranged in a processor farm, each assigned to perform the signal preprocessing and data equalization for one received packet at a time. Additional processors may be easily added to support real-time operation at higher data rates. The software was written in a modular fashion to support the development effort and to support easy transition to fleet platforms.
The hardware is all COTS products. The VME modem system contains two digital signal processing (DSP) boards (Mercury PowerPC/RACEway). The total processing power is one GFLOPS (gigafloating point operating per second) to modulate and demodulate packets for transmit and receive. These processors were selected to maximize compatibility with near term upgrades to the BSY-1 and SQS-53C sonars and with the NSSN design.
There are several platform interface boards that provide access to sonar systems. The 16-channel, 100kHz analog-to-digital converter board provides input analog data from hydrophones and sonobuoys. The 100kHz digital-to-analog converter board transmits the data. The fiber optic interface board provides input digital data from the sonars aboard the SSN and DDG.
The VME modem system has three storing devices to collect data and process the results for later laboratory results. The internal hard drive can save up to 2GB of packets, while the JAZ disk drive can save up to 1GB of packets. The internal digital linear tape (DLT) drive is capable of archiving 10 hours of input data.
The graphical user interface (GUI) is located on a Unix-based notebook PC that provides an X11R6 display terminal for modem control. An Ethernet interface between the notebook PC and VME modem provides real-time access to results and allows on-site performance tuning.
74 Document Number 8346749 Rev. A
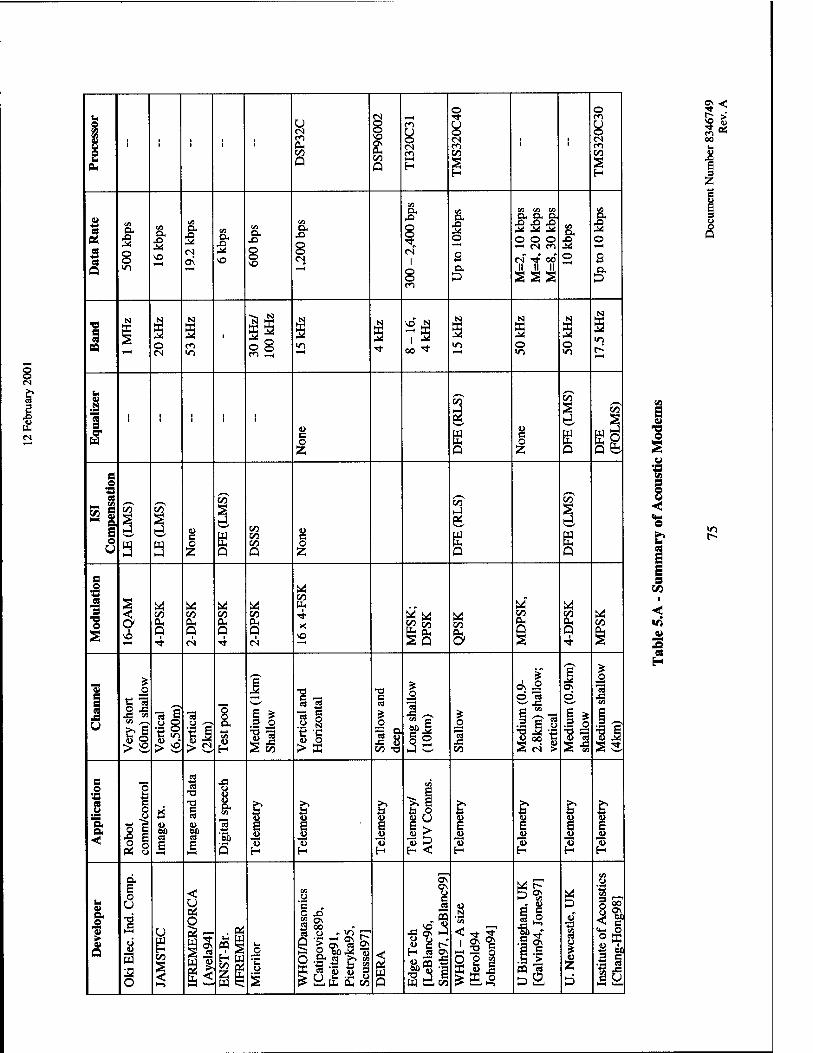
ft.
2 es 8 Q </->
«1 I1 o
e .3 U
S a a a
ä a
o
SO ^ ,
SO
00
ä
5
u v a o
u Q
« 8
a
ON
CN
a» a
co
i
a
*0
_o
CO is
u
CO Q
a .o 8
8 §
ä i "«3 H
T3 c
_o "3 & £ ö CO T)
8 I
so
3*
a
1 s
CO
CO
to OH
CA CA U) a OH a -^ M * © o
CN "* 00
l3*
«I Ö "3
4> 00 S c4
a
o
CO
.5 ,o
2 "
a
5-
CO
£
I!
I H
I 13 H
O »
e<—i o o a U t
3 5 c U
00 W. u
1 z
i 3 o
1
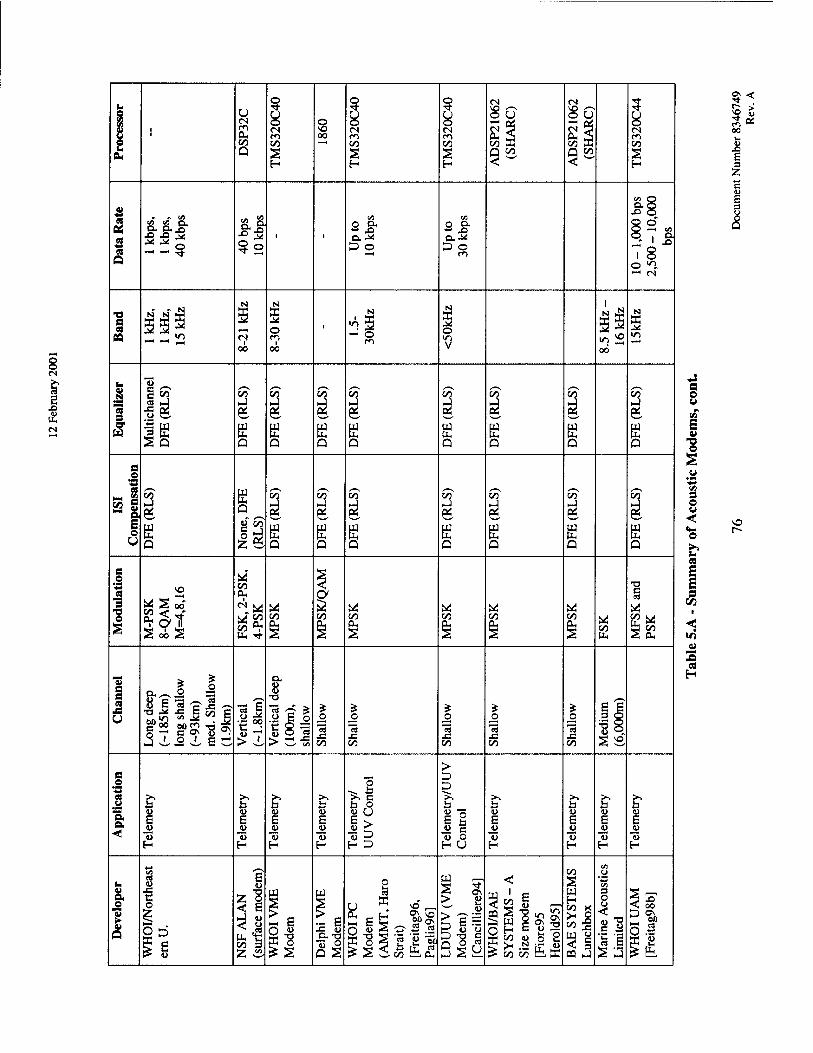
!
a <
u a o
O
» •• 09 09 09 Q. P. O. o
o o a^ o S3 «» - - «i
W5 8 6 "3 -a »a 5X§
60 £ O 1
QD
U rs m PL, on Q
* a
cs
On
u on
Si £1
E 13 H
on 3
on
on
u E
13 H
OS o o.
D o
•A 3 -< o
m
h o » <-> E >>
— C
OJ O O.
D o
ä £ i8 R ^ U on a a- J 2 Ü
g E = O ."a
on ffi n on
b u E
13 H
on on ri ffi
E 13 H
E 13 H
3 o < S3 S3
5 > 05
on
u E
13 H
a o u
s a* ■g
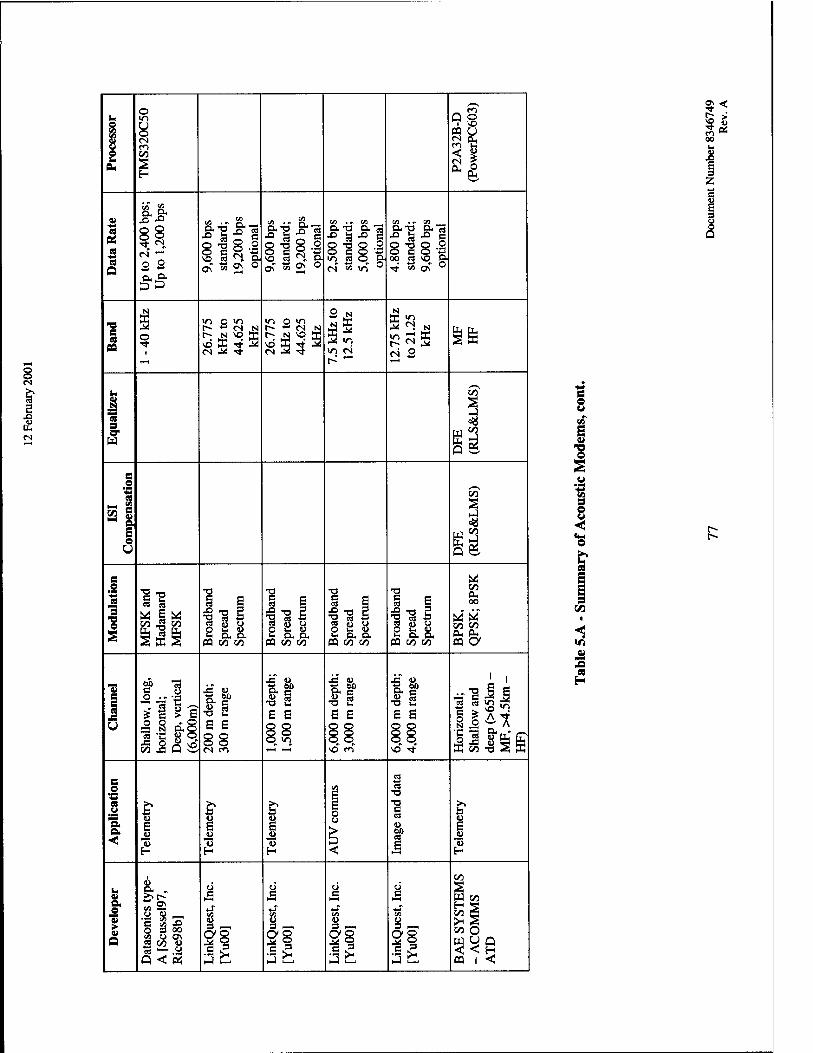
O
u 2 a,
«8 ft 2 es o
■a es 03
S
a1
«5
O
"8 2
1 u
e e
a. a
co CO
ss
88
2 2 ft £<
co £ Q
t 4)
H
.- OS u
SS .ir a«
sll »O 3. B cs ON ts 2
"9 § I o 2 1 *> aa
PQ co co
ft e •8 § s s 88
O 3 OO M y ON
12. 8 Q < ft
as
ftT>
o\ M
ft —
8| ON O
« S £•8 E 12 «s r? i- a« a
CQ co co
-8 2 a a
8
ig i) E T3 w S §28
CQ co co
NO CO
OS
CA
2"g ft"e3
81 3 ^ «5 ON
T3
s cd «j O C _ "- ft ft
pa co co
E
* 8
•s s. 'S M -8 2 e a
VO Tt
I s u a» a
u >
OS
n CO
1 CO r-
co OH OO
co co
H
3 r—i
si as
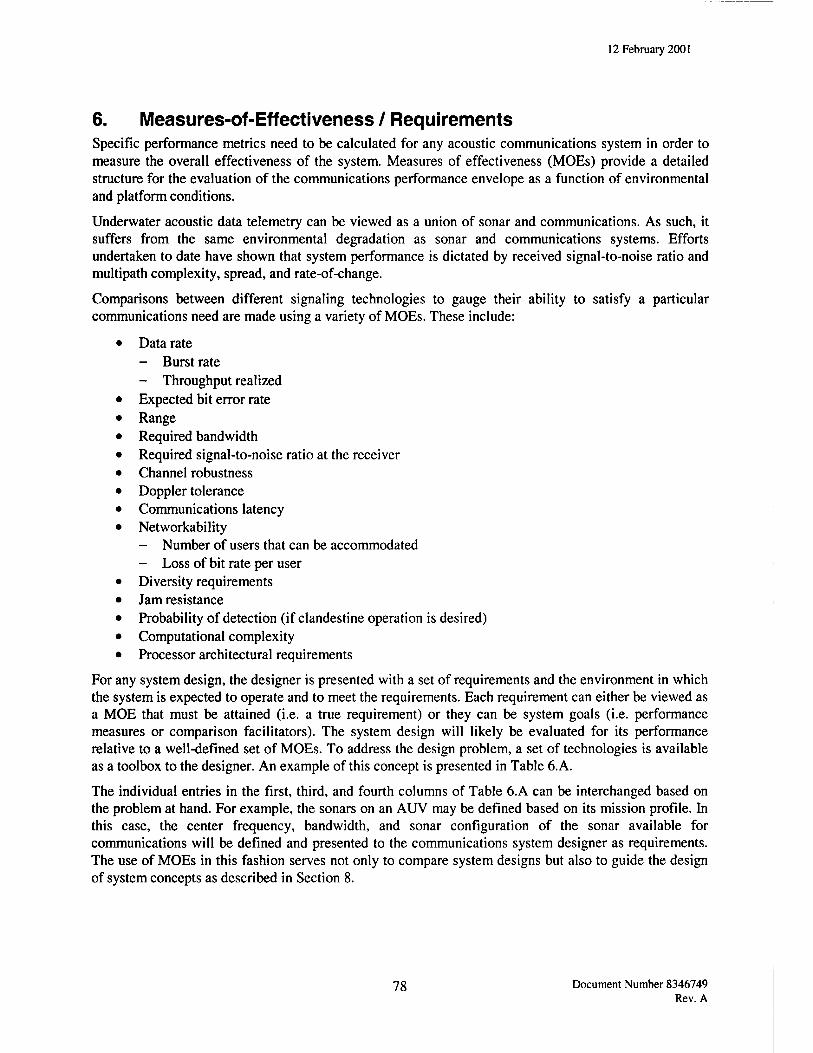
12 February 2001
6. Measures-of-Effectiveness / Requirements Specific performance metrics need to be calculated for any acoustic communications system in order to measure the overall effectiveness of the system. Measures of effectiveness (MOEs) provide a detailed structure for the evaluation of the communications performance envelope as a function of environmental and platform conditions.
Underwater acoustic data telemetry can be viewed as a union of sonar and communications. As such, it suffers from the same environmental degradation as sonar and communications systems. Efforts undertaken to date have shown that system performance is dictated by received signal-to-noise ratio and multipath complexity, spread, and rate-of-change.
Comparisons between different signaling technologies to gauge their ability to satisfy a particular communications need are made using a variety of MOEs. These include:
• Data rate - Burst rate - Throughput realized
• Expected bit error rate • Range • Required bandwidth • Required signal-to-noise ratio at the receiver • Channel robustness • Doppler tolerance • Communications latency • Networkability
- Number of users that can be accommodated - Loss of bit rate per user
• Diversity requirements • Jam resistance • Probability of detection (if clandestine operation is desired) • Computational complexity • Processor architectural requirements
For any system design, the designer is presented with a set of requirements and the environment in which the system is expected to operate and to meet the requirements. Each requirement can either be viewed as a MOE that must be attained (i.e. a true requirement) or they can be system goals (i.e. performance measures or comparison facilitators). The system design will likely be evaluated for its performance relative to a well-defined set of MOEs. To address the design problem, a set of technologies is available as a toolbox to the designer. An example of this concept is presented in Table 6. A.
The individual entries in the first, third, and fourth columns of Table 6.A can be interchanged based on the problem at hand. For example, the sonars on an AUV may be defined based on its mission profile. In this case, the center frequency, bandwidth, and sonar configuration of the sonar available for communications will be defined and presented to the communications system designer as requirements. The use of MOEs in this fashion serves not only to compare system designs but also to guide the design of system concepts as described in Section 8.
78 Document Number 8346749 Rev. A
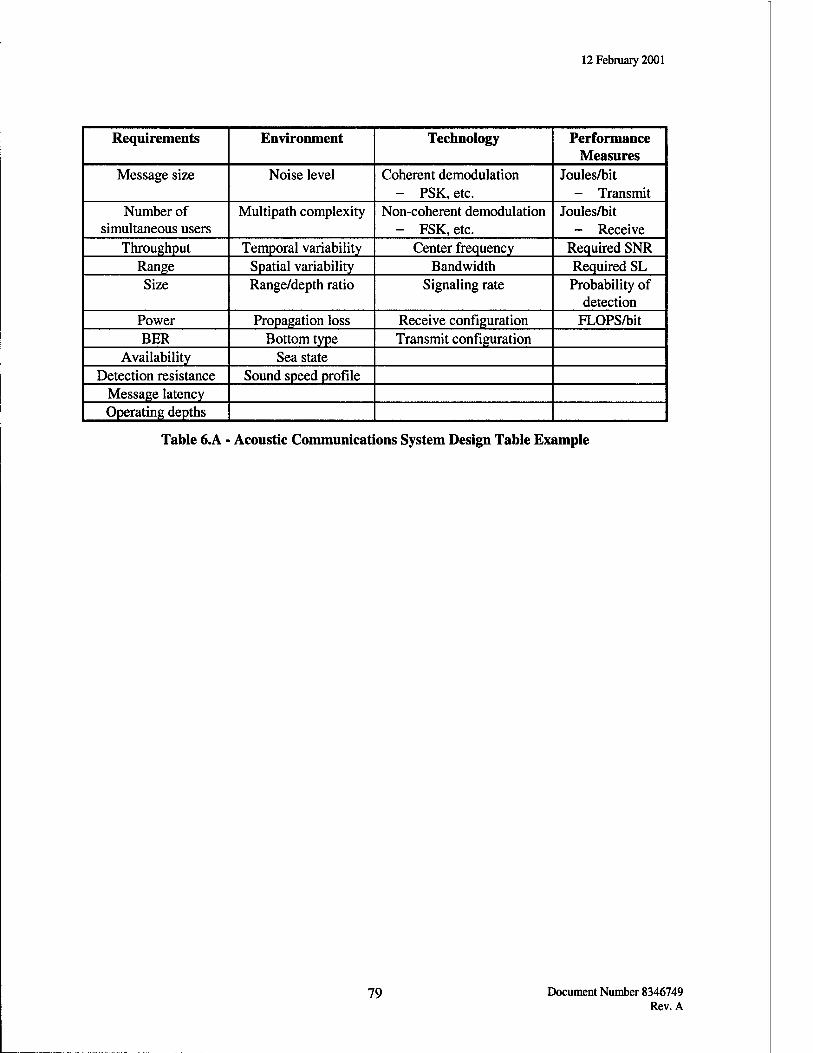
12 February 2001
Requirements Environment Technology Performance Measures
Message size Noise level Coherent demodulation - PSK, etc.
Joules/bit - Transmit
Number of simultaneous users
Multipath complexity Non-coherent demodulation - FSK, etc.
Joules/bit - Receive
Throughput Temporal variability Center frequency Required SNR Range Spatial variability Bandwidth Required SL Size Range/depth ratio Signaling rate Probability of
detection Power Propagation loss Receive configuration FLOPS/bit BER Bottom type Transmit configuration
Availability Sea state Detection resistance Sound speed profile
Message latency Operating depths
Table 6.A - Acoustic Communications System Design Table Example
79 Document Number 8346749 Rev. A
12 February 2001
7. Outlook
7.1. Acoustic/RF Communications Gateway The requirement to provide connectivity to submerged Naval assets over very long ranges is unlikely to be met directly with an acoustic link due to the complex effects of acoustic propagation and limited propagation ranges. A solution to this requirement is to use a buoy to convert acoustic signals to and from RF signals creating an acoustic/RF communications gateway. This solution provides real-time two- way communications to distant surface ships, aircraft and/or satellites that can act as relays to integrate undersea communications into the RF-based communications network.
The conceptual system includes a free floating surface buoy or a bottom deployed node with a pop-up RF unit. Acoustic linkage would be via HF to the buoy unit to both support high data rates and to limit vulnerability counter-detection by supporting only short-range acoustic propagation. The bottomed unit would deploy a network of acoustic notes with remote commandable pop-up RF units able to cover a large undersea area. This system could operate either at MF or HF and further limit vulnerability by allowing an AUV or submarine to transmit in a downward direction, and by extending the range between the RF unit and the submarine.
>r^7 / /// / / ///~7>-—/7vT7w
Figure 7.1 - Test Configuration
Coherent acoustic communications technology was employed to demonstrate this concept as a piggy- back to a source evaluation test at the Seneca Lake Sonar Test Facility in September 1999. The
80 Document Number 8346749 Rev. A
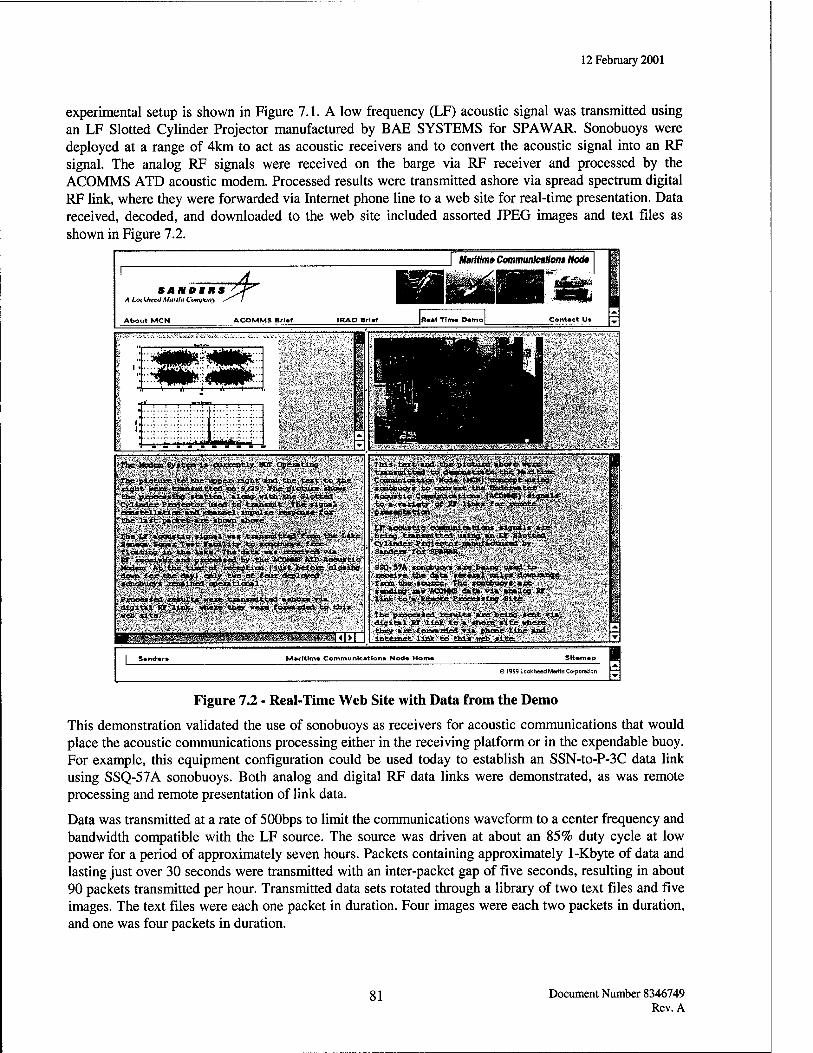
12 February 2001
experimental setup is shown in Figure 7.1. A low frequency (LF) acoustic signal was transmitted using an LF Slotted Cylinder Projector manufactured by BAE SYSTEMS for SPAWAR. Sonobuoys were deployed at a range of 4km to act as acoustic receivers and to convert the acoustic signal into an RF signal. The analog RF signals were received on the barge via RF receiver and processed by the ACOMMS ATD acoustic modem. Processed results were transmitted ashore via spread spectrum digital RF link, where they were forwarded via Internet phone line to a web site for real-time presentation. Data received, decoded, and downloaded to the web site included assorted JPEG images and text files as shown in Figure 7.2.
SANOIHS A U*ck/tft:<i Marttn Company x"
About MCN ACOMMS Brl*f IRAD BrTaf
-1'—— ITMIISJIMII
The Modem System is currently: NOT Operating
■The picture to the upper* right and the text to the right were transmitted on 9/2$ The picture shows the processing station along with the Slotted
'Cylinder Projector used to transmit .The signal oxistell*>tton^Ah^:onftimelr se response for the la it packet are shown .above.
• The Vt acoustic signal was transmitted from the Lake Seneca Sonar Test facility to sonobuoys free floating in the lake. The data was received via RT receiver and processed by the ACOMC5 ATX> Acoustic Modem At. the1 tine of reception (just before closing, down for the day} only two of four deployed sonobuoys re-mined operational
Processed .results were transmitted «shore via digital SOT link, where they were forwarded to this web site
Mf^^äM^hM&^^MTlTt
;-tms^£ev|W transmitted to demonstrate the Maritime Ccnnunloation Node (MCN) eenoept using sonobuoys to convert the Underwater Acoustic Cenuunloatlons (ACOMMS) signals to a variety of KT links for remote presentation
IX acoustic oonaunloatlons signals are
Cylinder Projector nanufaotured by Sanders for SPAKAP.!
5SQ-57A, sonobuoys are being used to receive the data several miles dovnrange ; from the source. The sonobuoys are sending raw ACOMHS data via analog RT link to a Remote Processing Site
The processed results are being sent via ' digital RT link to a shore site where they are forwarded via phone line and internet link to this web site.
M*rltlm« Communication» Nod« Horn«
O 1999 Lockheed Martin Corporation
I
Figure 7.2 - Real-Time Web Site with Data from the Demo
This demonstration validated the use of sonobuoys as receivers for acoustic communications that would place the acoustic communications processing either in the receiving platform or in the expendable buoy. For example, this equipment configuration could be used today to establish an SSN-to-P-3C data link using SSQ-57A sonobuoys. Both analog and digital RF data links were demonstrated, as was remote processing and remote presentation of link data.
Data was transmitted at a rate of 500bps to limit the communications waveform to a center frequency and bandwidth compatible with the LF source. The source was driven at about an 85% duty cycle at low power for a period of approximately seven hours. Packets containing approximately 1-Kbyte of data and lasting just over 30 seconds were transmitted with an inter-packet gap of five seconds, resulting in about 90 packets transmitted per hour. Transmitted data sets rotated through a library of two text files and five images. The text files were each one packet in duration. Four images were each two packets in duration, and one was four packets in duration.
81 Document Number 8346749 Rev. A
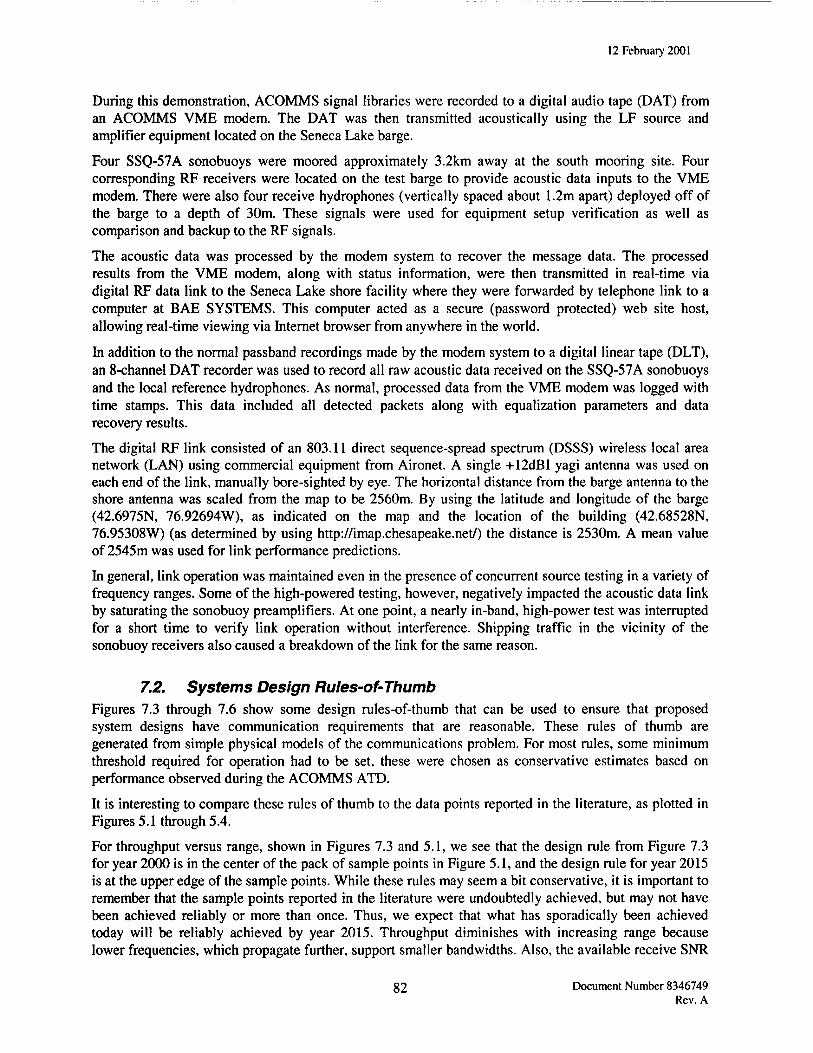
12 February 2001
During this demonstration, ACOMMS signal libraries were recorded to a digital audio tape (DAT) from an ACOMMS VME modem. The DAT was then transmitted acoustically using the LF source and amplifier equipment located on the Seneca Lake barge.
Four SSQ-57A sonobuoys were moored approximately 3.2km away at the south mooring site. Four corresponding RF receivers were located on the test barge to provide acoustic data inputs to the VME modem. There were also four receive hydrophones (vertically spaced about 1.2m apart) deployed off of the barge to a depth of 30m. These signals were used for equipment setup verification as well as comparison and backup to the RF signals.
The acoustic data was processed by the modem system to recover the message data. The processed results from the VME modem, along with status information, were then transmitted in real-time via digital RF data link to the Seneca Lake shore facility where they were forwarded by telephone link to a computer at BAE SYSTEMS. This computer acted as a secure (password protected) web site host, allowing real-time viewing via Internet browser from anywhere in the world.
In addition to the normal passband recordings made by the modem system to a digital linear tape (DLT), an 8-channel DAT recorder was used to record all raw acoustic data received on the SSQ-57A sonobuoys and the local reference hydrophones. As normal, processed data from the VME modem was logged with time stamps. This data included all detected packets along with equalization parameters and data recovery results.
The digital RF link consisted of an 803.11 direct sequence-spread spectrum (DSSS) wireless local area network (LAN) using commercial equipment from Aironet. A single +12dBI yagi antenna was used on each end of the link, manually bore-sighted by eye. The horizontal distance from the barge antenna to the shore antenna was scaled from the map to be 2560m. By using the latitude and longitude of the barge (42.6975N, 76.92694W), as indicated on the map and the location of the building (42.68528N, 76.95308W) (as determined by using http://imap.chesapeake.net/) the distance is 2530m. A mean value of 2545m was used for link performance predictions.
In general, link operation was maintained even in the presence of concurrent source testing in a variety of frequency ranges. Some of the high-powered testing, however, negatively impacted the acoustic data link by saturating the sonobuoy preamplifiers. At one point, a nearly in-band, high-power test was interrupted for a short time to verify link operation without interference. Shipping traffic in the vicinity of the sonobuoy receivers also caused a breakdown of the link for the same reason.
7.2. Systems Design Rules-of-Thumb Figures 7.3 through 7.6 show some design rules-of-thumb that can be used to ensure that proposed system designs have communication requirements that are reasonable. These rules of thumb are generated from simple physical models of the communications problem. For most rules, some minimum threshold required for operation had to be set, these were chosen as conservative estimates based on performance observed during the ACOMMS ATD.
It is interesting to compare these rules of thumb to the data points reported in the literature, as plotted in Figures 5.1 through 5.4.
For throughput versus range, shown in Figures 7.3 and 5.1, we see that the design rule from Figure 7.3 for year 2000 is in the center of the pack of sample points in Figure 5.1, and the design rule for year 2015 is at the upper edge of the sample points. While these rules may seem a bit conservative, it is important to remember that the sample points reported in the literature were undoubtedly achieved, but may not have been achieved reliably or more than once. Thus, we expect that what has sporadically been achieved today will be reliably achieved by year 2015. Throughput diminishes with increasing range because lower frequencies, which propagate further, support smaller bandwidths. Also, the available receive SNR
82 Document Number 8346749 Rev. A
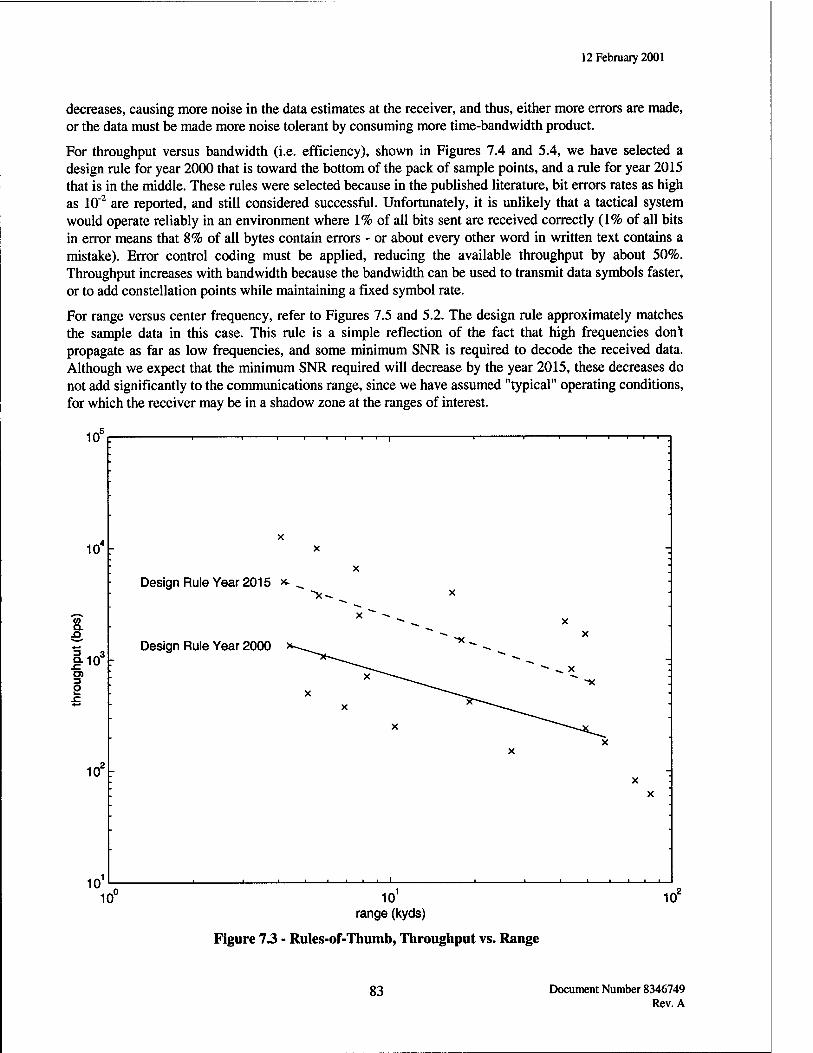
12 February 2001
decreases, causing more noise in the data estimates at the receiver, and thus, either more errors are made, or the data must be made more noise tolerant by consuming more time-bandwidth product.
For throughput versus bandwidth (i.e. efficiency), shown in Figures 7.4 and 5.4, we have selected a design rule for year 2000 that is toward the bottom of the pack of sample points, and a rule for year 2015 that is in the middle. These rules were selected because in the published literature, bit errors rates as high as 10"2 are reported, and still considered successful. Unfortunately, it is unlikely that a tactical system would operate reliably in an environment where 1% of all bits sent are received correctly (1% of all bits in error means that 8% of all bytes contain errors - or about every other word in written text contains a mistake). Error control coding must be applied, reducing the available throughput by about 50%. Throughput increases with bandwidth because the bandwidth can be used to transmit data symbols faster, or to add constellation points while maintaining a fixed symbol rate.
For range versus center frequency, refer to Figures 7.5 and 5.2. The design rule approximately matches the sample data in this case. This rule is a simple reflection of the fact that high frequencies don't propagate as far as low frequencies, and some minimum SNR is required to decode the received data. Although we expect that the minimum SNR required will decrease by the year 2015, these decreases do not add significantly to the communications range, since we have assumed "typical" operating conditions, for which the receiver may be in a shadow zone at the ranges of interest.
105
104
V) a n
|103
O) 3 O
102
1 1 1 1 1 1 1 1—1 1 1 1 1 1— —' ' '—.
X
■
r X - ; x ■
Design Rule Year 2015 *■ ^ ■
~*- - x
x """ -» -" - x .
~~ -. X
Design Rule Year 2000 *-»^...^ ~* ~~ - ^
f ^^"^^~^^ "" ~~ "• -~ x ~
^~"~~"--~^ ~* ■
X ~""~~"*~-5>_ ■
X ^^^ '
x ^^^~~~~^<-^ x ■
X
- X
■ X
1 1 1 1 1 1 1 1 1 1 1 1 1 1— —1 1 1—
1°io° 101 102
range (kyds)
Figure 7.3 - Rules-of-Thumb, Throughput vs. Range
83 Document Number 8346749 Rev. A
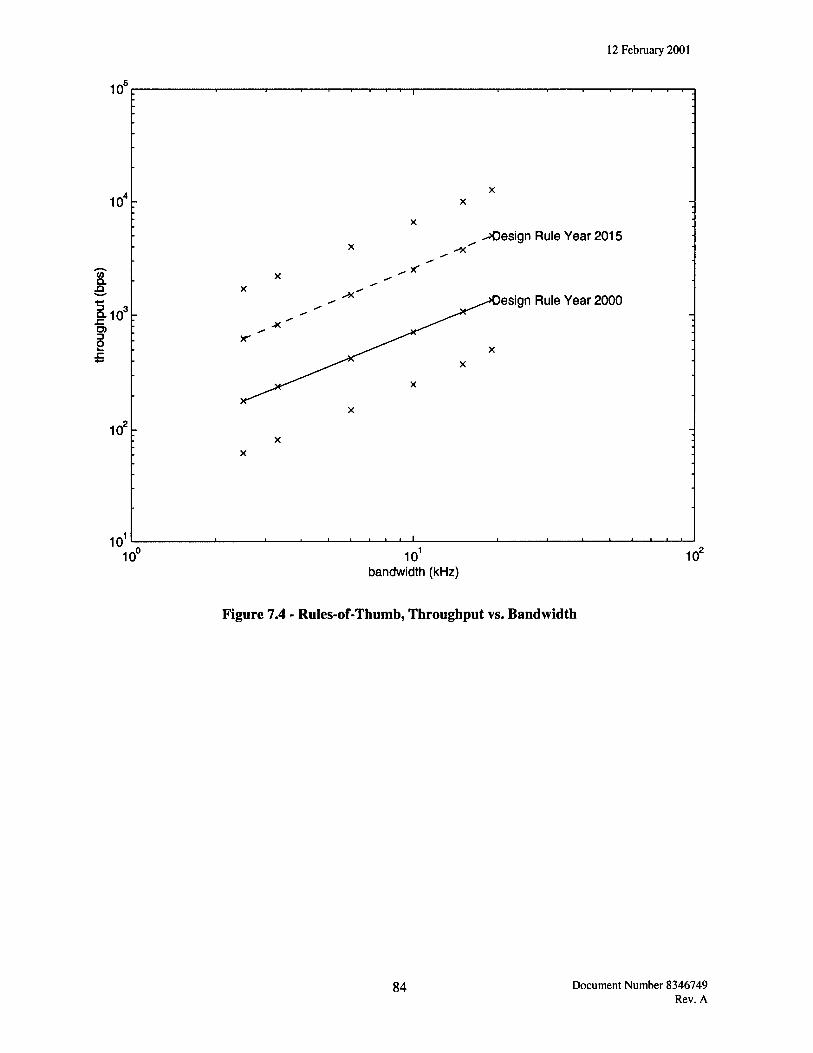
12 February 2001
10° "■'i 1 1 i r— i i 1 i i r-
10'
CO Q.
fio3
O
10 :
10'
-•X
^Design Rule Year 2015
)esign Rule Year 2000
>r
_i i ■ ■ i i
10" 10' bandwidth (kHz)
10'
Figure 7.4 - RuIes-of-Thumb, Throughput vs. Bandwidth
84 Document Number 8346749 Rev. A
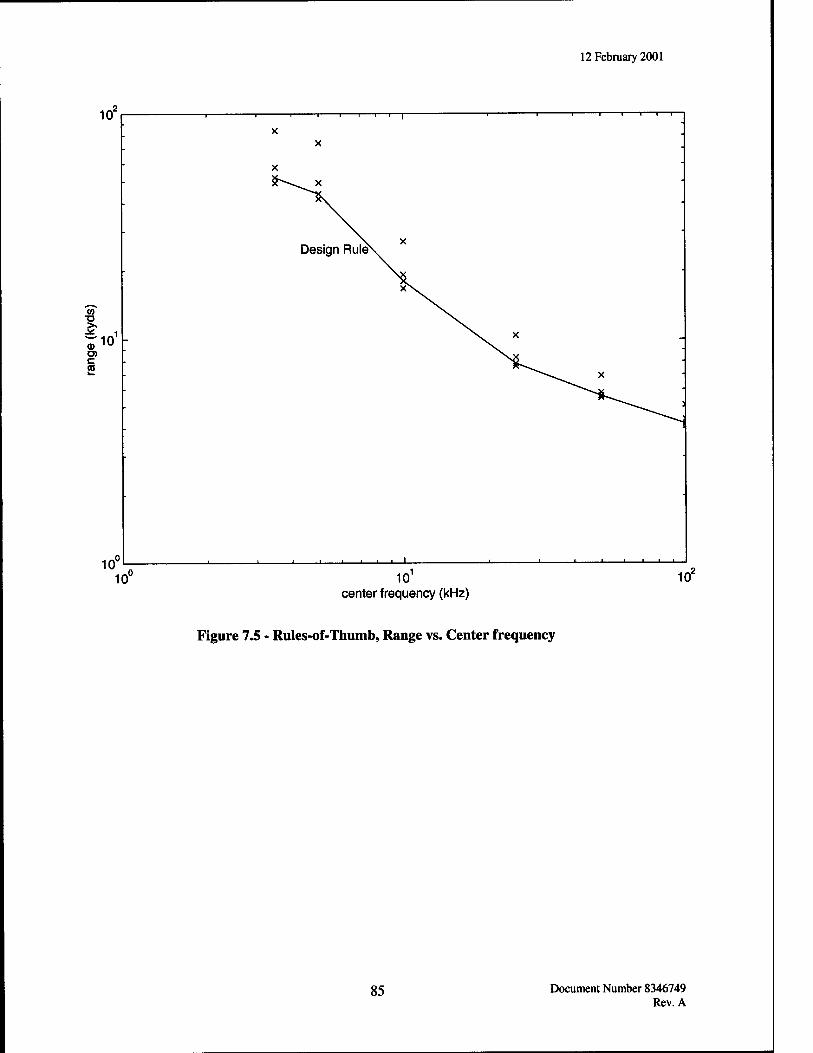
12 February 2001
i<r
CO T3
c co
10"
-I 1 III 1 I |
Design Rule^
f ■ i i |_
i i l i ■ ■ ■
■ ■
10" 10' center frequency (kHz)
10'
Figure 7.5 - Rules-of-Thumb, Range vs. Center frequency
85 Document Number 8346749 Rev. A
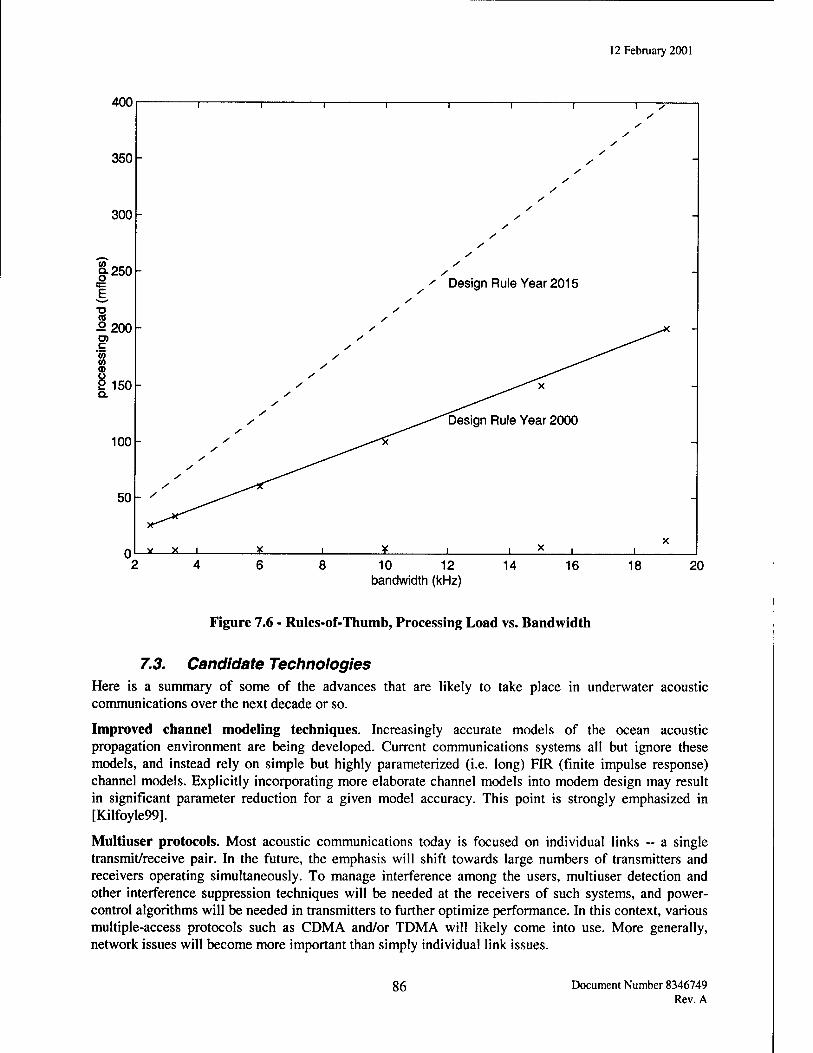
12 February 2001
400
350
300
a 250
5 200 c
"35 CO
£ 150
100-
50
Design Rule Year 2015
Design Rule Year 2000
10 12 bandwidth (kHz)
14 16 18 20
Figure 7.6 - Rules-of-Thumb, Processing Load vs. Bandwidth
7.3. Candidate Technologies Here is a summary of some of the advances that are likely to take place in underwater acoustic communications over the next decade or so.
Improved channel modeling techniques. Increasingly accurate models of the ocean acoustic propagation environment are being developed. Current communications systems all but ignore these models, and instead rely on simple but highly parameterized (i.e. long) FIR (finite impulse response) channel models. Explicitly incorporating more elaborate channel models into modem design may result in significant parameter reduction for a given model accuracy. This point is strongly emphasized in [Kilfoyle99].
Multiuser protocols. Most acoustic communications today is focused on individual links — a single transmit/receive pair. In the future, the emphasis will shift towards large numbers of transmitters and receivers operating simultaneously. To manage interference among the users, multiuser detection and other interference suppression techniques will be needed at the receivers of such systems, and power- control algorithms will be needed in transmitters to further optimize performance. In this context, various multiple-access protocols such as CDMA and/or TDMA will likely come into use. More generally, network issues will become more important than simply individual link issues.
86 Document Number 8346749 Rev. A
12 February 2001
Content-specific techniques. This is more speculative. The sense is that there may be a move towards modems tuned to specific types of applications and data. By designing transmitters and receivers that are adapted to and optimized for specific kinds of data (say corresponding to the MCM scenario), in principle, better performance can be obtained. Joint source and channel coding techniques are examples of techniques that can be viewed in this class. The basic idea is one of "application-specific" networks.
Iterative algorithms. There has been a lot of activity in the past decade on iterative decoding algorithms for error-correction coding. This is changing the ECC landscape significantly and new codes (such as Turbo codes) are emerging with attractive characteristics. More generally, a variety of iterative algorithms with attractive performance characteristics are finding their way into communication systems.
Universal (blind) algorithms. Most existing communication systems rely on some kind of explicit (and periodic) training phase to bootstrap the modem and keep it tracking. However, training is inherently inefficient. Progress is being made on universal modems that do not require training data, but learn the channel in the course of transmitting data and adapt accordingly, ultimately achieving the performance as if the channel were known a priori. Current blind algorithms (such as blind equalizers) are generally too slow in learning the channel to be practical in underwater applications. However, as these algorithms improve, they will naturally find their way into acoustic modems.
A blind receiver architecture was recently proposed and tested by [WaldhorstOO] using data from the ROBLINKS project. The receiver is based on a self-trained adaptive equalizer designed to jointly process signals from a vertical array and perform the tasks of timing and carrier recovery. Blind system startup is permitted by use of a toggling decision rule that exploits the Offset Quadriphase-Shift Keying (OQPSK) modulation. With this rule, decision regions toggle between two perpendicular BPSK constellations depending on the parity of the symbol index. The equalizer coefficients are updated using a simple gradient-type complex LMS algorithm. For the 2km range test, a bit error rate of approximately 10"4 was observed with an estimated output SNR of 9.3dB. For the 5km range test, the bit error rate was 4x10"* at an output SNR of 12.5dB. For the moving source test, a bit error rate of 2xl0"3 with an output SNR of 8.5dB was observed.
Alternative coding and modulation techniques. This is also on the speculative side. The current canonical transmission model has the data being error-control coded, then modulated (possibly separately, possibly jointly). In current practice, we have been constrained to think of coding and modulation techniques quite narrowly. Many alternative strategies await discovery, possibly with very different performance-complexity tradeoffs.
Spatial modulation. A technique termed spatial modulation that seeks to control the spatial distribution of signal energy such that multiple parallel communication channels are supported by the single, physical ocean channel is introduced in [KilfoyleOO]. The basic idea consists of transmitting independent data streams over different, separable propagation paths. At a fundamental level, the availability of multiple, resolvable propagation paths can be interpreted as increased spatial bandwidth with signal design strategies and subsequent benefits similar to those associated with increased frequency bandwidth. The implementation of spatial modulation involves the transformation of a multiple transmitter, multiple receiver framework into a set of virtual parallel channels. The superiority of this approach is demonstrated both theoretically and experimentally. In two different experiments, a bandwidth efficiency of 4 was possible using two parallel channels with an observed relative improvement characterized by a 2.9dB diversity gain as compared to the use of a single channel. In a third experiment, the construction of three parallel channels in a shallow water environment achieved a bandwidth efficiency of 6 with an associated 4dB diversity gain. A data rate of 24kbps was attained for spatial modulation, whereas conventional signaling could not achieve such a rate.
87 Document Number 8346749 Rev. A
12 February 2001
8. Design Examples for the Application of Acoustic Communications to MCM Operations
8.1. Anticipated Uses of Acoustic Communications in MCM Operation In this section, two possible scenarios are described. They are:
1. Mine search from a surface ship or submarine using multiple AUVs simultaneously to find mines at significant ranges from the host platform. The host platform is coordinating the operation in real- time.
2. Use of moored nodes in conjunction with AUVs to monitor activity in a potentially hostile area. The operation is expected to be semi-automatic, since real-time control will be limited to that available through an LPI/LPD long-range communications link.
8.2. AUV Operations with a Single Gateway Node In order to analyze the acoustic communications requirements in MCM applications, some assumptions must be made about the scenarios and ancillary equipment that will be available. A single gateway node is used to convert acoustic signals to and from RF signals to provide real-time two-way communications over long distances. See Section 7.1 for further explanation.
We will make these assumptions about AUV operations:
• It is desirable to operate more than one AUV at a time, thus presenting a problem with contention for use of the communications channel.
• The sensor data is processed in the AUV so that images are transmitted back to the gateway buoy and not raw sonar data.
8.2.1. Communications Requirements: Gateway Node with Multiple AUVs
In this section, the likely communication requirements between the AUV and the gateway node are considered. Many possible message contents are considered and the requirements for communication will exceed the bandwidth available if all message types are selected. As the MCM system is designed, it will be necessary to pick only the messages that are needed and send them only as frequently as needed.
The requirements can be refined as system concepts firm up. In many cases, it will be possible to omit some message types and shorten others. For example, contact lists will likely not require target speed and course since most mines are stationary.
8.2.1.1. AUV Location and Health Feedback The vehicle will need to provide the gateway node with location feedback periodically. Somewhere between once per minute and once per 10 minutes is probably a good frequency. More than once per minute will burden the communications channel unnecessarily (unless these AUVs move very quickly) and less than every 10 minutes presents the possibility of loosing the AUV without realizing it.
A probe pulse could be used to indicate health (still working) and angle to the host, which would be significantly more efficient than actually transmitting the location of the AUV as a digital message. However, it would be difficult to indicate health of each subsystem or the range to the AUV with this technique.
gg Document Number 8346749 Rev. A
12 February 2001
8.2.1.1.1. Throughput The location can be expressed in any number of coordinate systems. If latitude and longitude coordinates are assumed, then 32 bits for each component is enough to specify location on the face of the earth to within 1 cm (circumference of the earth is about 40,000,000m), which should be sufficient. Depth can be specified to within 6cm in 16 bits (assuming a 4000m maximum depth). It is also desirable to get course and speed information (3 components at 16 bits each).
In addition to all this, the vehicle health must be monitored. We will assume 8 bits for the battery or fuel level and another 16 bits for other data (i.e. OK/failed status for 16 subsystems). All this location and health information totals approximately 19 bytes, or 152 bits, sent from the AUV to the host every minute or so.
Summary: Each AUV must be able to send the gateway about 19 bytes of location and health data every minute. A simplified version could indicate operational status (working/ not working) and direction using simple analog probes.
8.2.1.1.2. Bit Error Rate Errors in the location and health messages are not likely to be critical. It is unlikely that the operator will need to take action as a result of a single incorrect message. If 9 out of 10 messages arrive intact, an intelligent operator can easily ignore an error in the tenth. The bit error rate is (1 error)/(10 messages*19 bytes each*8bits/byte)
Summary: For the vehicle health messages, a bit error rate of 7x10⁴ or less is sufficient.
8.2.1.2. Update AUV Mission Profile On-the-fly The AUV's mission profile is likely to consist of a sequence of waypoints and a short set of instructions to follow at each point (i.e. collect image data, collect sonar data, etc.).
8.2.1.2.1. Throughput Each waypoint will consist of a latitude, longitude, and depth (or equivalent). As described previously, these require at most 32 bits for latitude and longitude, and 16 bits for depth (10 bytes total). Ten bytes of instruction data are added to each so that each waypoint and associated instruction set will require 20 bytes of data. If the mission profile consists of 10 hours of waypoints, with an update every minute, then the mission profile will contain a total of 600 waypoints, requiring 12 Kbytes or 96,000 bits of information.
Mission profiles would not be sent routinely but, when they need to be sent, it is likely to be a result of a high-priority change in the mission or a result of unexpected returns from one of the AUVs. In either case, the mission profile update occurs rarely, but must be serviced with high priority (e.g. all AUVs must be reprogrammed within 10 minutes of some alarm).
Summary: 12 Kbytes of mission profile data must be sent to each A UV within 10 minutes of an alarm.
8.2.1.2.2. Bit Error Rate Errors in the mission profile are likely to cause serious problems. The AUV may not be able to determine that a message has an error by virtue of its content. Mission profile messages should have checksums or similar error detection features to allow the AUV to determine that a message is faulty. When a faulty message is detected, several options are available:
89 Document Number 8346749 Rev. A
12 February 2001
• If the error can be localized to a single waypoint, omit the waypoint and proceed with the mission.
• If the error can be localized to a single waypoint, request retransmission of that waypoint.
• Request retransmission of the entire mission profile.
All of these are serious errors, which may significantly affect mission performance, and should be avoided. An error rate of one error per 20 mission profiles is probably about the maximum tolerable.
Summary: For mission profile download, an error rate of about 5x10'7 is sufficient.
8.2.1.3. Vehicle Provides a List of Contacts In this scenario, each AUV is capable of analyzing returns from is sensors (sonar, camera, magnetic, etc), and maintains a list of contacts that it is tracking. Furthermore, the AUV is somehow capable of initially classifying these contacts to provide the remote operator with a more complete picture of the environment near the AUV.
8.2.1.3.1. Throughput If the AUV is capable of simultaneously managing 20 contacts, then 10 bytes are needed to specify the location and perhaps two bytes to specify the target type. Total: 12 bytes x 20 contacts = 240 bytes.
The AUV would like to return this data as frequently as possible, probably at least once a minute.
Summary: The AUV must be able to send 240 bytes of contact information every minute.
8.2.1.3.2. Bit Error Rate As in the case of vehicle health messages, an error in a contact list message can be detected and ignored by an intelligent operator. Since a new contact list will come in another minute, the impact is typically minimal. An error rate of one bit per 5 to 10 messages should be acceptable, particularly since these errors should generally only affect one contact out of the entire message. At a rate of one bit per 10 messages, this will amount to an error rate of 5xl0"5.
Summary: For contact list messages, a bit error rate of 5x10' or less is sufficient.
8.2.1.4. Direct Vehicle to Return Snapshot of Sensor Data In this scenario, a remote operator is studying contact information returned from one of the AUVs and finds a contact of interest. The operator then requests sensor data regarding the contact.
8.2.1.4.1. Throughput The contact number (8 bits) and possibly some information about which sensor to use or how much data to return (another 4 bytes) needs to be specified.
Summary: Each AUV must be able to receive 5 bytes of data occasionally, about every 30 minutes.
8.2.1.4.2. Bit Error Rate These commands to investigate a target of interest are among the most important in the system. An error in one of these messages directly affects the performance of the mission. As a result, a low error rate is appropriate, probably 1 bit in 100 messages.
Summary: For messages directing the A UV to investigate a target, a bit error rate of 3x10 is sufficient.
90 Document Number 8346749 Rev. A
12 February 2001
8.2.1.5. Vehicle Images or Sensor Data for Selected Contacts In this case, we assume that the AUV has identified a target of interest or the remote operator, reviewing contact information from the AUVs, has requested sensor data regarding some contact that is considered to be of interest.
8.2.1.5.1. Throughput Assume that a 128x128 image is required with 8 bits per sample. This yields an image containing 128 Kbytes of data.
Some kind of data compression may be possible on this data, lets assume an optimistic 4:1, comparable to lossless text compression, but still far less than photo-quality lossy compression of images (10:1 or 20:1).
Summary: Each AUV must be able to send about 32 Kbytes of sensor data to the gateway on command, about once every 30 minutes.
8.2.1.5.2. Bit Error Rate It is difficult to draw any reasonable conclusions about acceptable bit error rates for sensor data without any information about how the data is processed.
Assume that the entire snapshot of data is ruined if it contains a single bit error. Since the data constitutes critical information, it is unacceptable to loose a significant number of these messages. An error rate of 1 error in 100 messages will yield a bit error rate of 4xl0"8.
If one error per snapshot can be accommodated, then the required error rate drops considerably to 4xl0"6.
Summary: For sensor data snapshots, a bit error rate of between 4x10'6 and 4x10' is acceptable.
8.2.1.6. Propagation Time Measurements In some cases, it may be desirable to use the AUVs to collect sound speed information. This can be accomplished with minimal communication overhead if (1) the AUVs have accurate clocks, which are synchronized to the gateway prior to departure, and (2) the AUV knows its location relative to the gateway or some other reference with high accuracy. Given these assumptions, the AUV only needs to add a time field to the location and health reports that it sends back to the host regularly.
8.2.1.6.1. Throughput Specifying the transmit time with an accuracy of more than 1msec will require some attention in the design of the time-stamping logic. At a 1.5km range, this 1msec timing error would result in a speed of sound estimate error of about 1.5 m/s. (This assumes that the AUV's location is known with great accuracy, much better than 1.5 meters. Given that the AUV is likely to be several meters long, and thus have a location measurement error of several meters, we must conclude that realistic speed of sound errors will be more like 5 m/s).
To specify the time to within 1 millisecond on a 10-hour mission will require 25 bits. We will round up to 32 bits for this study.
Summary: Each AUV must time-stamp its outgoing messages to within 1 msec accuracy (requires 4 bytes) to provide useful speed of sound estimates.
8.2.1.6.2. Bit Error Rate
91 Document Number 8346749 Rev. A
12 February 2001
An error in one of these messages will typically yield unreasonable results, which are easily detected. Although these messages are likely to be non-critical, an error rate of 1 bit out of 5 or 10 messages is the maximum that is likely to be acceptable.
Summary: Propagation time measurements require a bit error rate of3xl0'3 or less.
8.2.1.7. Range Checking If the AUV does not have a good self-location mechanism, then its range from the gateway can be determined by the travel time of a message from the AUV to the gateway. Range can be determined by measuring the round-trip time for a message to go from the gateway to the AUV and back. This provides no functionality beyond the scope of active sonar and requires the AUV to provide a return message to the gateway at a fairly exact time after the gateway's message is received.
8.2.1.7.1. Throughput If the AUV has a synchronized 1-msec accuracy clock as noted previously, then the range can be determined to an accuracy of 1.5 meters, providing that the speed of sound is known perfectly. If there is a 10 m/s error in the speed of sound estimate, then the range estimate error is dominated by the speed of sound error and is 10 meters when the AUV is approximately 1.5km from the gateway.
Summary: Each AUV must time-stamp its outgoing messages to within 1 msec accuracy (requires 4 bytes) to provide ranging estimates.
8.2.1.7.2. Bit Error Rate An error in one of these messages will typically yield unreasonable results, which are easily detected. Since these messages would be used to track the AUV, repeated errors may cause a loss of track on the vehicle. An error rate of 1 bit out of 10 messages should be acceptable.
Summary: Propagation time measurements require a bit error rate of3xW3 or less.
8.2.1.8. AUV Communications Requirements Summary Table 8.A summarizes the message types complete with their communications burdens and provides an unsupported opinion, based on review of sea-test results, about whether or not each type of message transfer is feasible using acoustic communications.
It seems likely that the communications range requirement for these operations will be the full range of the AUV operations. There are alternatives, in which the AUV goes on a mission, returns near the gateway platform to dump its contact reports, downloads a new mission profile, and leaves. While this scenario is potentially useful, it is much more limiting than a scenario in which the AUV is in constant communication with the gateway.
Table 8.A lists a typical communications demand (item numbers 1, 3, and 6) of 263 bytes/minute/AUV (35 bits per second/node), with occasional burst traffic for mission profile changes (item number 2). With the exception of a mission profile change, most traffic is from the AUV to the gateway. Item number 5 will require approximately 1kbps of realized throughput, which should be straightforward at high frequencies.
Current communications technology should support about 10 AUV nodes sharing the same communications channel (35 bits/second per AUV * 10 AUVs = 350 bits/second. Fifteen percent of the total bandwidth has been allocated to network access overhead). The emphasis needs to be in
92 Document Number 8346749 Rev. A
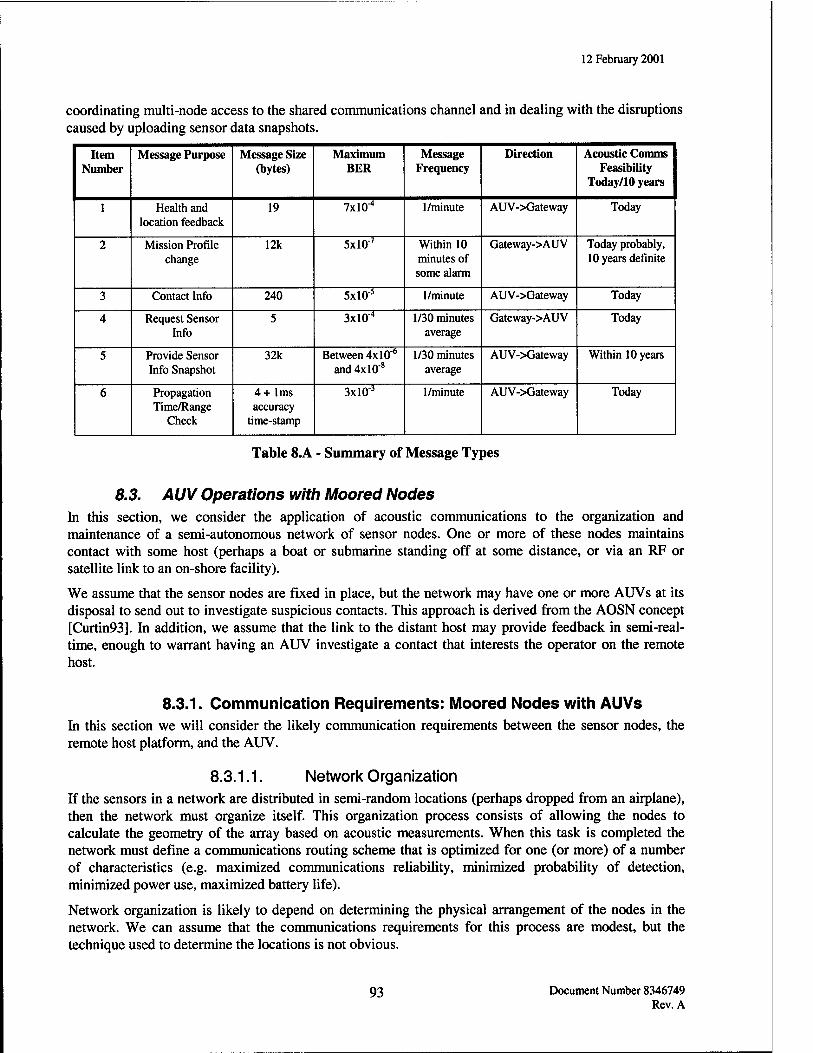
12 February 2001
coordinating multi-node access to the shared communications channel and in dealing with the disruptions caused by uploading sensor data snapshots.
Item Number
Message Purpose Message Size (bytes)
Maximum BER
Message Frequency
Direction Acoustic Comms Feasibility
Today/10 years
1 Health and location feedback
19 7xl0"4 1/minute AUV->Gateway Today
2 Mission Profile change
12k 5xl0"7 Within 10 minutes of some alarm
Gateway->AUV Today probably, 10 years definite
3 Contact Info 240 5xl0"5 1/minute AUV->Gateway Today
4 Request Sensor Info
5 3xl0"4 1/30 minutes average
Gateway->AUV Today
5 Provide Sensor Info Snapshot
32k Between 4xl0"6
and 4xl0"8 1/30 minutes
average AUV->Gateway Within 10 years
6 Propagation Time/Range
Check
4+ 1ms accuracy
time-stamp
3xl0"3 1/minute AUV->Gateway Today
Table 8.A - Summary of Message Types
8.3. AUV Operations with Moored Nodes In this section, we consider the application of acoustic communications to the organization and maintenance of a semi-autonomous network of sensor nodes. One or more of these nodes maintains contact with some host (perhaps a boat or submarine standing off at some distance, or via an RF or satellite link to an on-shore facility).
We assume that the sensor nodes are fixed in place, but the network may have one or more AUVs at its disposal to send out to investigate suspicious contacts. This approach is derived from the AOSN concept [Curtin93]. hi addition, we assume that the link to the distant host may provide feedback in semi-real- time, enough to warrant having an AUV investigate a contact that interests the operator on the remote host.
8.3.1. Communication Requirements: Moored Nodes with AUVs In this section we will consider the likely communication requirements between the sensor nodes, the remote host platform, and the AUV.
8.3.1.1. Network Organization If the sensors in a network are distributed in semi-random locations (perhaps dropped from an airplane), then the network must organize itself. This organization process consists of allowing the nodes to calculate the geometry of the array based on acoustic measurements. When this task is completed the network must define a communications routing scheme that is optimized for one (or more) of a number of characteristics (e.g. maximized communications reliability, minimized probability of detection, minimized power use, maximized battery life).
Network organization is likely to depend on determining the physical arrangement of the nodes in the network. We can assume that the communications requirements for this process are modest, but the technique used to determine the locations is not obvious.
93 Document Number 8346749 Rev. A
12 February 2001
If the nodes are equipped with some self-localization equipment similar to GPS, then determining the geometry of the array is trivial, and the problem is reduced to optimizing the network of some characteristic such as maximized communications reliability.
In addition, the network must either have a master node that coordinates the communications traffic on the network, or it must utilize a self-regulating protocol. In either case, it is likely that a single node will need to be designated to communicate with the remote host, in order to reduce the need for long range communications equipment. For the remainder of this discussion, the node that contacts the remote host is referred to as the "network master".
Summary: The network must have a mechanism for the nodes to determine the initial geometry of the array. Given the geometry of the network, paths are determined to maximize communications reliability.
8.3.1.2. Nodes Provide List of Contacts to Master In this scenario, each sensor node is capable of analyzing the returns from its neighboring AUV(s) and maintains a list of contacts that it is tracking. Furthermore, the nodes are assumed to be capable of classifying these contacts to provide the host platform with a complete picture of the environment near the node.
8.3.1.2.1. Throughput If the node is capable of tracking 20 targets, then 10 bytes are needed to specify the location (see longitude/latitude discussion above) and two bytes are needed to specify the target type for each contact. Total: 12 bytes x 20 contacts = 240 bytes.
The nodes would like to return this data to the master node frequently, on the order of once every 10 minutes.
Summary: Each node must relay 240 bytes of information to the network master every 10 minutes.
8.3.1.2.2. Bit Error Rate Since a new contact list will come in another 10 minutes, the impact of an error is minimized. An error rate of one per 10 messages should be acceptable, particularly since these errors should generally only affect one contact out of the entire message. At a rate of one bit per 10 messages, this will amount to an error rate of 5xlO"5.
Summary: For contact list messages, a bit error rate of 5x10' or less is sufficient.
8.3.1.3. Each Node Provides Status to Master Each node can relay its health and battery status to the master along with its contact list.
8.3.1.3.1. Throughput
This function requires approximately 5 bytes every 10 minutes.
Summary: Each node must be able to relay 5 bytes of data to the network master every 10 minutes.
8.3.1.3.2. Bit Error Rate Errors in the health messages are not likely to be critical. It is unlikely that the operator will need to take action as a result of a single incorrect message. If 9 out of 10 messages arrive intact, an intelligent operator can easily ignore an error in the 10th.
94 Document Number 8346749 Rev. A
12 February 2001
Summary: For health messages, a bit error rate of 3x10' is acceptable.
8.3.1.4. Master Relays Contacts List to Remote Host The network master must periodically reconcile the contact reports from the entire network and relay it to the remote host.
8.3.1.4.1. Throughput If there are 20 nodes maintaining 20 contacts each and each contact requires 12 bytes, then the network master will need to send about 4800 bytes of contact information to the remote host approximately every 10 minutes or so. Addition of node health information will increase this to approximately 4900 bytes every 10 minutes.
Summary: The network master must be able to relay 4900 bytes of contact and health data to the remote master every 10 minutes.
8.3.1.4.2. Bit Error Rate Since a new contact list will come in another ten minutes, the impact of an error is minimized. An error rate of one bit per 10 messages should be more than acceptable, particularly since these errors should generally only affect one contact out of the entire message. At a rate of one bit per 10 messages, this will amount to an error rate of 3xl0"6.
Summary: For contact list messages, a bit error rate of 3x10' or less is sufficient.
8.3.1.5. Master Node Assigns AUV to Investigate Contact In this scenario, the network master, after reconciling contacts from individual nodes, finds a contact of interest. It assigns a local AUV to investigate.
8.3.1.5.1. Throughput The network master needs to specify the location of the contact (10 bytes), the amount of data to return (4 bytes), and possibly some information about which sensor to use (another 4 bytes).
Summary: The network master must be able to send the AUV 18 bytes of data every 30 minutes.
8.3.1.5.2. Bit Error Rate These commands to investigate a target of interest are among the most important in the system. An error in one of these messages directly affects the performance of the mission. As a result, only a low error rate is appropriate, say 1 in 100 messages.
Summary: For messages directing the AUV to investigate a target, a bit error rate of 7x10' is sufficient.
8.3.1.6. AUV Returns Sensor Data to Network Master See Section 8.2.1.5.
8.3.1.6.1. Throughput Summary: Each AUV must send 32Kbytes of sensor to the network master on command, approximately once every 30 minutes.
95 Document Number 8346749 Rev. A
12 February 2001
8.3.1.6.2. Bit Error Rate
Summary: For sensor data snapshots, a bit error rate of between 4x10'6 and 4x10s is acceptable.
8.3.1.7. Autonomous vehicle returns contact identification In this scenario, the AUV is capable of analyzing returns from its sensors (sonar, camera, magnetic, etc). When sent to investigate a contact of interest, the AUV will form a contact list and possibly classify any contacts that it has detected.
8.3.1.7.1. Throughput If the AUV maintains a contact list of 20 targets, then 10 bytes are needed to specify the location (see lat/long discussion in a previous section) and another two bytes to specify the target type. Total: 12 bytes x 20 contacts = 240 bytes.
The AUV would like to return this data as frequently as possible, probably at least once a minute.
Summary: The AUV must be able to send 240 bytes of contact information every minute.
8.3.1.7.2. Bit Error Rate Since a new contact list will come in another minute, the impact of an error is minimized. An error rate of one bit per 10 messages should be acceptable, particularly since these errors should only affect one contact out of the entire message. At a rate of one bit per 10 messages, this will amount to an error rate of 5xl0"5.
Summary: For contact list messages, a bit error rate of 5x10' or less is sufficient.
8.3.1.8. Remote Host Requests Sensor Data for Contact In this scenario, an operator on the host platform is studying contact information returned from the nodes, and finds a contact of interest. A request for sensor data regarding the contact is then made.
8.3.1.8.1. Throughput The host platform need only specify the contact number (8 bits), node number (8 bits) and possibly some information about which sensor to use or how much data to return (another 4 bytes).
Summary: The host platform must be able to send each network master 6 bytes of data approximately every 30 minutes
8.3.1.8.2. Bit Error Rate These commands to investigate a target of interest are among the most important in the system. An error in one bit of these messages directly affects the performance of the mission. As a result, a low error rate of 1 bit in 100 messages is appropriate.
Summary: For messages directing the AUV to investigate a target, a bit error rate of 2x10⁴ is sufficient.
8.3.1.9. Node-to-Node Propagation Time Measurements In some cases, it may be desirable to use the sensor nodes to collect sound propagation speed information. This can be accomplished at minimal communication overhead if the nodes have accurate clocks, which are synchronized to the host prior to departure, and if the nodes know their locations with
96 Document Number 8346749 Rev. A
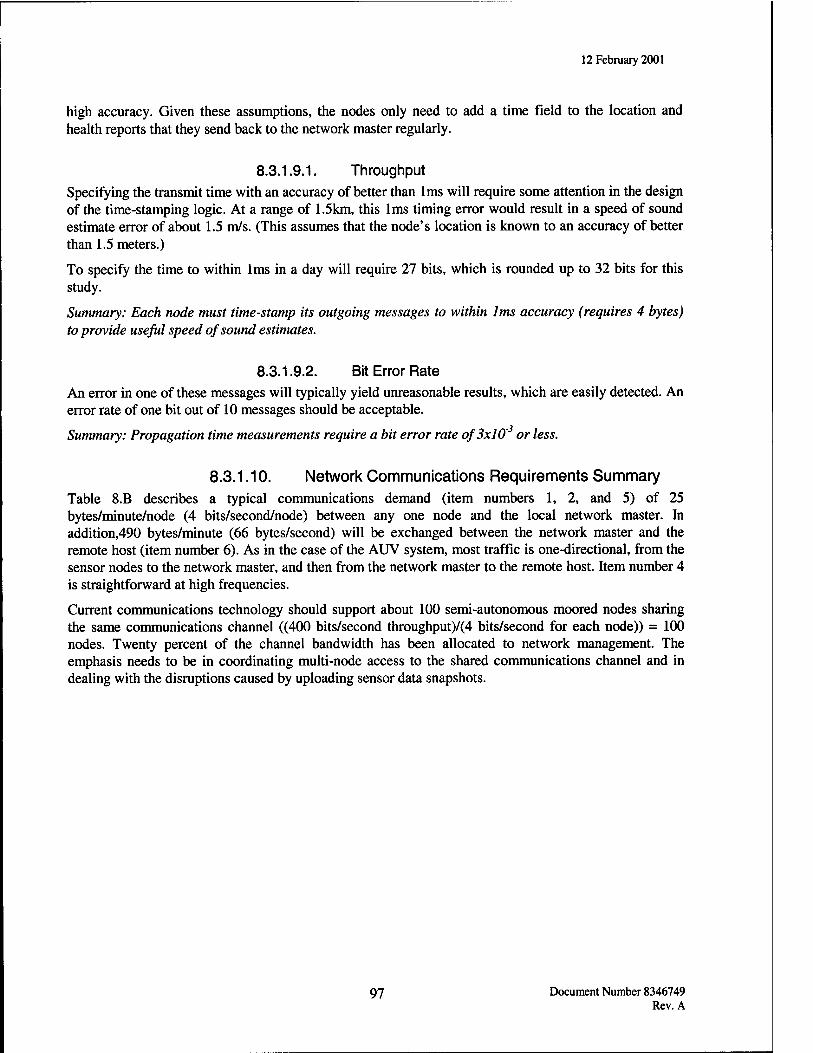
12 February 2001
high accuracy. Given these assumptions, the nodes only need to add a time field to the location and health reports that they send back to the network master regularly.
8.3.1.9.1. Throughput Specifying the transmit time with an accuracy of better than 1ms will require some attention in the design of the time-stamping logic. At a range of 1.5km, this 1ms timing error would result in a speed of sound estimate error of about 1.5 m/s. (This assumes that the node's location is known to an accuracy of better than 1.5 meters.)
To specify the time to within 1ms in a day will require 27 bits, which is rounded up to 32 bits for this study.
Summary: Each node must time-stamp its outgoing messages to within lms accuracy (requires 4 bytes) to provide useful speed of sound estimates.
8.3.1.9.2. Bit Error Rate An error in one of these messages will typically yield unreasonable results, which are easily detected. An error rate of one bit out of 10 messages should be acceptable.
Summary: Propagation time measurements require a bit error rate of 3x10' or less.
8.3.1.10. Network Communications Requirements Summary Table 8.B describes a typical communications demand (item numbers 1, 2, and 5) of 25 bytes/minute/node (4 bits/second/node) between any one node and the local network master. In addition,490 bytes/minute (66 bytes/second) will be exchanged between the network master and the remote host (item number 6). As in the case of the AUV system, most traffic is one-directional, from the sensor nodes to the network master, and then from the network master to the remote host. Item number 4 is straightforward at high frequencies.
Current communications technology should support about 100 semi-autonomous moored nodes sharing the same communications channel ((400 bits/second throughput)/(4 bits/second for each node)) = 100 nodes. Twenty percent of the channel bandwidth has been allocated to network management. The emphasis needs to be in coordinating multi-node access to the shared communications channel and in dealing with the disruptions caused by uploading sensor data snapshots.
97 Document Number 8346749 Rev. A
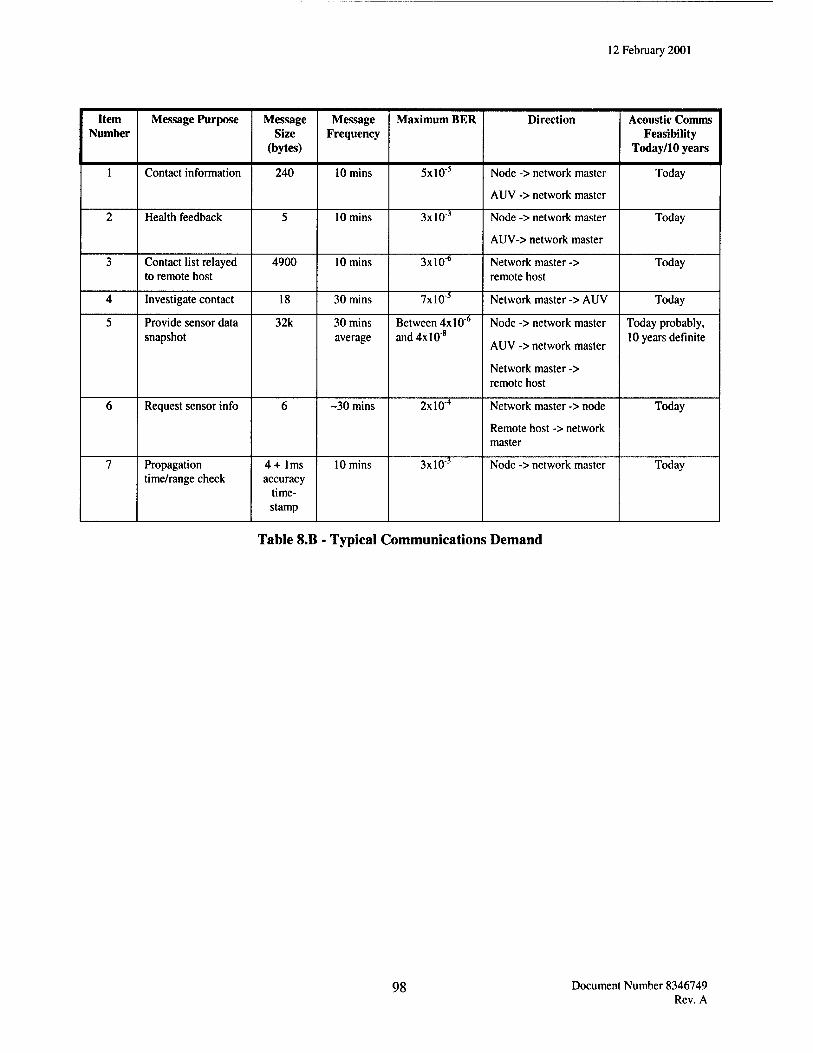
12 February 2001
Item Number
Message Purpose Message Size
(bytes)
Message Frequency
Maximum BER Direction Acoustic Comms Feasibility
Today/10 years
1 Contact information 240 10 mins 5xl0"5 Node -> network master
AUV -> network master
Today
2 Health feedback 5 10 mins 3xl0-3 Node -> network master
AUV-> network master
Today
3 Contact list relayed to remote host
4900 10 mins 3xl06 Network master -> remote host
Today
4 Investigate contact 18 30 mins 7xl0"5 Network master -> AUV Today
5 Provide sensor data snapshot
32k 30 mins average
Between 4x10"6
and 4x10'8 Node -> network master
AUV -> network master
Network master -> remote host
Today probably, 10 years definite
6 Request sensor info 6 -30 mins 2xl04 Network master -> node
Remote host -> network master
Today
7 Propagation time/range check
4+ 1ms accuracy
time- stamp
10 mins 3xl03 Node -> network master Today
Table 8.B - Typical Communications Demand
98 Document Number 8346749 Rev. A
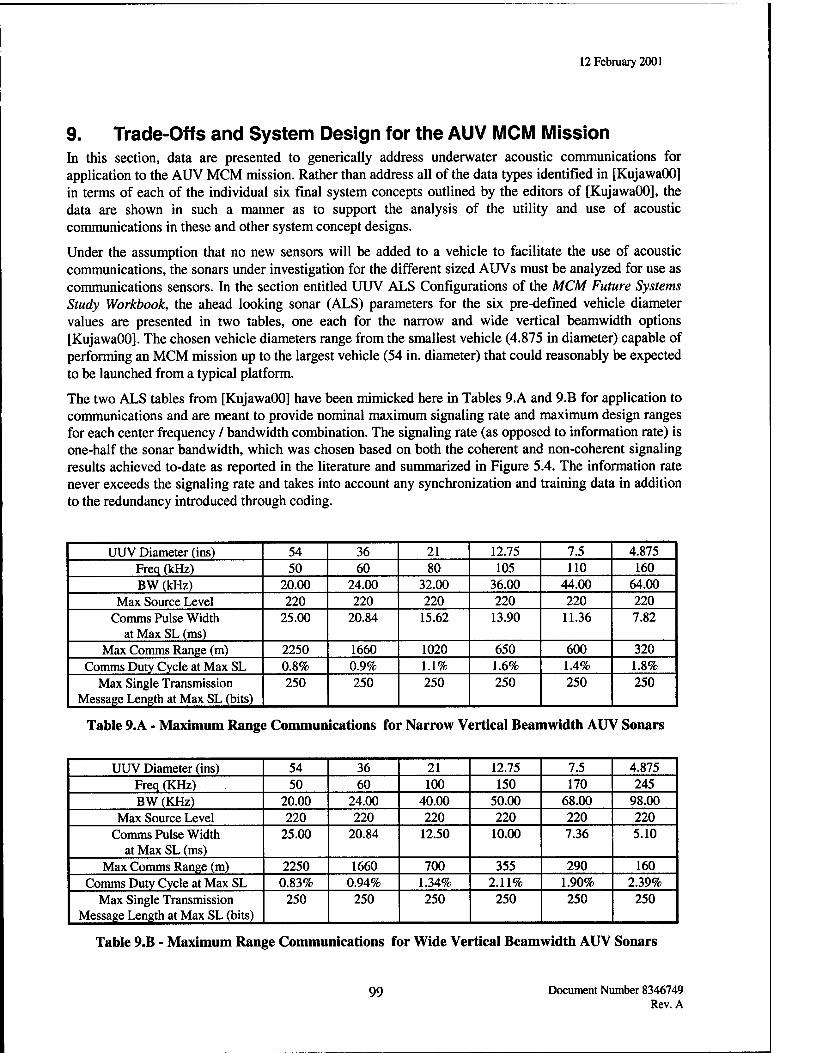
12 February 2001
9. Trade-Offs and System Design for the AUV MCM Mission In this section, data are presented to genetically address underwater acoustic communications for application to the AUV MCM mission. Rather than address all of the data types identified in [KujawaOO] in terms of each of the individual six final system concepts outlined by the editors of [KujawaOO], the data are shown in such a manner as to support the analysis of the utility and use of acoustic communications in these and other system concept designs.
Under the assumption that no new sensors will be added to a vehicle to facilitate the use of acoustic communications, the sonars under investigation for the different sized AUVs must be analyzed for use as communications sensors. In the section entitled UUV ALS Configurations of the MCM Future Systems Study Workbook, the ahead looking sonar (ALS) parameters for the six pre-defined vehicle diameter values are presented in two tables, one each for the narrow and wide vertical beamwidth options [KujawaOO]. The chosen vehicle diameters range from the smallest vehicle (4.875 in diameter) capable of performing an MCM mission up to the largest vehicle (54 in. diameter) that could reasonably be expected to be launched from a typical platform.
The two ALS tables from [KujawaOO] have been mimicked here in Tables 9.A and 9.B for application to communications and are meant to provide nominal maximum signaling rate and maximum design ranges for each center frequency / bandwidth combination. The signaling rate (as opposed to information rate) is one-half the sonar bandwidth, which was chosen based on both the coherent and non-coherent signaling results achieved to-date as reported in the literature and summarized in Figure 5.4. The information rate never exceeds the signaling rate and takes into account any synchronization and training data in addition to the redundancy introduced through coding.
UUV Diameter (ins) 54 36 21 12.75 7.5 4.875 Freq (kHz) 50 60 80 105 110 160 BW (kHz) 20.00 24.00 32.00 36.00 44.00 64.00
Max Source Level 220 220 220 220 220 220 Comms Pulse Width
at Max SL (ms) 25.00 20.84 15.62 13.90 11.36 7.82
Max Comms Range (m) 2250 1660 1020 650 600 320 Comms Duty Cycle at Max SL 0.8% 0.9% 1.1% 1.6% 1.4% 1.8%
Max Single Transmission Message Length at Max SL (bits)
250 250 250 250 250 250
Table 9.A - Maximum Rang« ; Commun ications foi * Narrow V ertical Bean »width Atn / Sonars
UUV Diameter (ins) 54 36 21 12.75 7.5 4.875 Freq (KHz) 50 60 100 150 170 245 BW (KHz) 20.00 24.00 40.00 50.00 68.00 98.00
Max Source Level 220 220 220 220 220 220 Comms Pulse Width
at Max SL (ms) 25.00 20.84 12.50 10.00 7.36 5.10
Max Comms Range (m) 2250 1660 700 355 290 160 Comms Duty Cycle at Max SL 0.83% 0.94% 1.34% 2.11% 1.90% 2.39%
Max Single Transmission Message Length at Max SL (bits)
250 250 250 250 250 250
Table 9.B - Maximum Range Communications for Wide Vertical Beamwidth AUV Sonars
99 Document Number 8346749 Rev. A
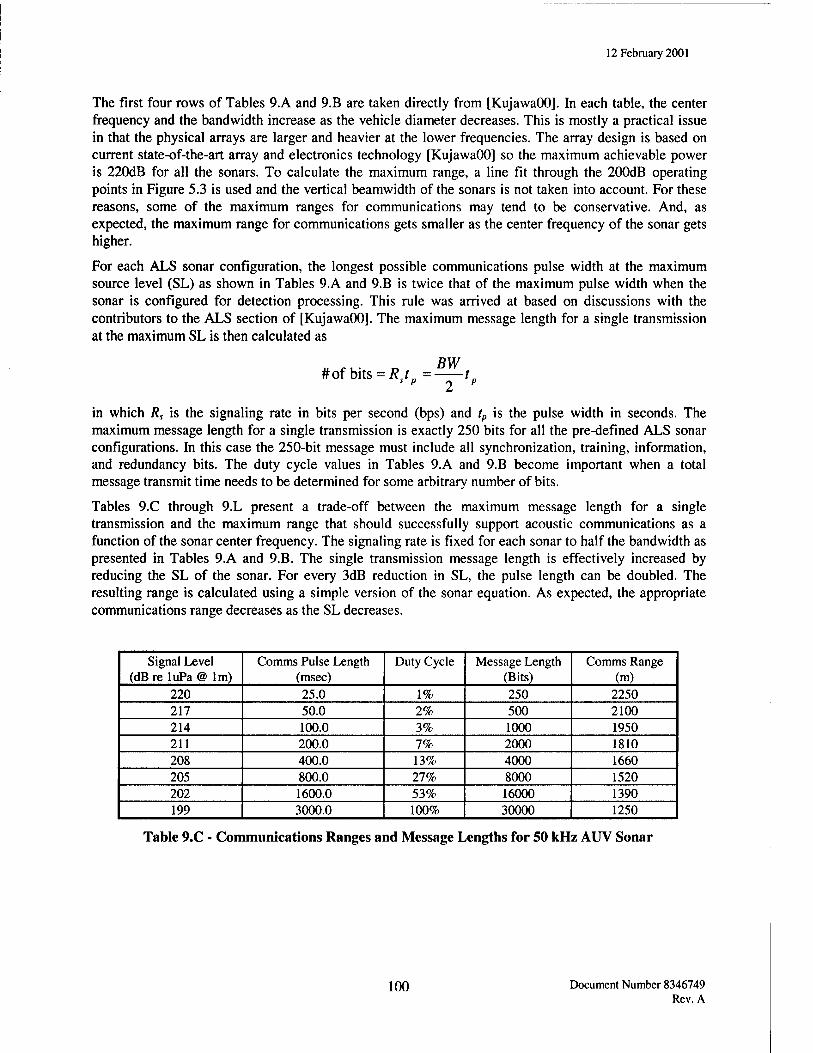
12 February 2001
The first four rows of Tables 9.A and 9.B are taken directly from [KujawaOO]. In each table, the center frequency and the bandwidth increase as the vehicle diameter decreases. This is mostly a practical issue in that the physical arrays are larger and heavier at the lower frequencies. The array design is based on current state-of-the-art array and electronics technology [KujawaOO] so the maximum achievable power is 220dB for all the sonars. To calculate the maximum range, a line fit through the 200dB operating points in Figure 5.3 is used and the vertical beamwidth of the sonars is not taken into account. For these reasons, some of the maximum ranges for communications may tend to be conservative. And, as expected, the maximum range for communications gets smaller as the center frequency of the sonar gets higher.
For each ALS sonar configuration, the longest possible communications pulse width at the maximum source level (SL) as shown in Tables 9.A and 9.B is twice that of the maximum pulse width when the sonar is configured for detection processing. This rule was arrived at based on discussions with the contributors to the ALS section of [KujawaOO]. The maximum message length for a single transmission at the maximum SL is then calculated as
BW #ofbits = /?/ =—tB s p 2 p
in which Rs is the signaling rate in bits per second (bps) and tp is the pulse width in seconds. The maximum message length for a single transmission is exactly 250 bits for all the pre-defined ALS sonar configurations. In this case the 250-bit message must include all synchronization, training, information, and redundancy bits. The duty cycle values in Tables 9.A and 9.B become important when a total message transmit time needs to be determined for some arbitrary number of bits.
Tables 9.C through 9.L present a trade-off between the maximum message length for a single transmission and the maximum range that should successfully support acoustic communications as a function of the sonar center frequency. The signaling rate is fixed for each sonar to half the bandwidth as presented in Tables 9.A and 9.B. The single transmission message length is effectively increased by reducing the SL of the sonar. For every 3dB reduction in SL, the pulse length can be doubled. The resulting range is calculated using a simple version of the sonar equation. As expected, the appropriate communications range decreases as the SL decreases.
Signal Level (dB re luPa @ lm)
Comms Pulse Length (msec)
Duty Cycle Message Length (Bits)
Comms Range (m)
220 25.0 1% 250 2250 217 50.0 2% 500 2100 214 100.0 3% 1000 1950 211 200.0 7% 2000 1810 208 400.0 13% 4000 1660 205 800.0 27% 8000 1520 202 1600.0 53% 16000 1390 199 3000.0 100% 30000 1250
Table 9.C - Communications Ranges and Message Lengths for 50 kHz AUV Sonar
100 Document Number 8346749 Rev. A
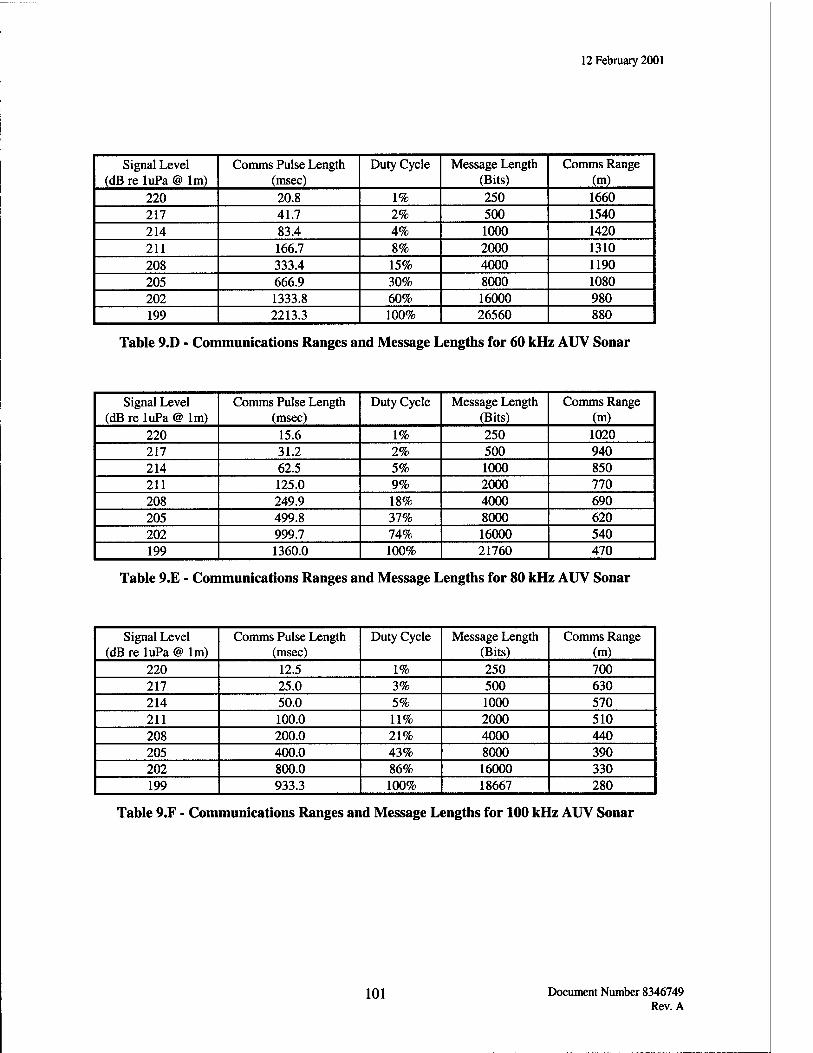
12 February 2001
Signal Level (dB re luPa @ lm)
Comms Pulse Length (msec)
Duty Cycle Message Length (Bits)
Comms Range (m)
220 20.8 1% 250 1660 217 41.7 2% 500 1540 214 83.4 4% 1000 1420 211 166.7 8% 2000 1310 208 333.4 15% 4000 1190 205 666.9 30% 8000 1080 202 1333.8 60% 16000 980 199 2213.3 100% 26560 880
Table 9.D - Communications Ranges and Message Lengths for 60 kHz AUV Sonar
Signal Level (dB re luPa @ lm)
Comms Pulse Length (msec)
Duty Cycle Message Length (Bits)
Comms Range (m)
220 15.6 1% 250 1020 217 31.2 2% 500 940 214 62.5 5% 1000 850 211 125.0 9% 2000 770 208 249.9 18% 4000 690 205 499.8 37% 8000 620 202 999.7 74% 16000 540 199 1360.0 100% 21760 470
Table 9.E - Communications Ranges and Message Lengths for 80 kHz AUV Sonar
Signal Level (dB re luPa @ lm)
Comms Pulse Length (msec)
Duty Cycle Message Length (Bits)
Comms Range (m)
220 12.5 1% 250 700 217 25.0 3% 500 630 214 50.0 5% 1000 570 211 100.0 11% 2000 510 208 200.0 21% 4000 440 205 400.0 43% 8000 390 202 800.0 86% 16000 330 199 933.3 100% 18667 280
Table 9.F - Communications Ranges and Message Lengths for 100 kHz AUV Sonar
101 Document Number 8346749 Rev. A
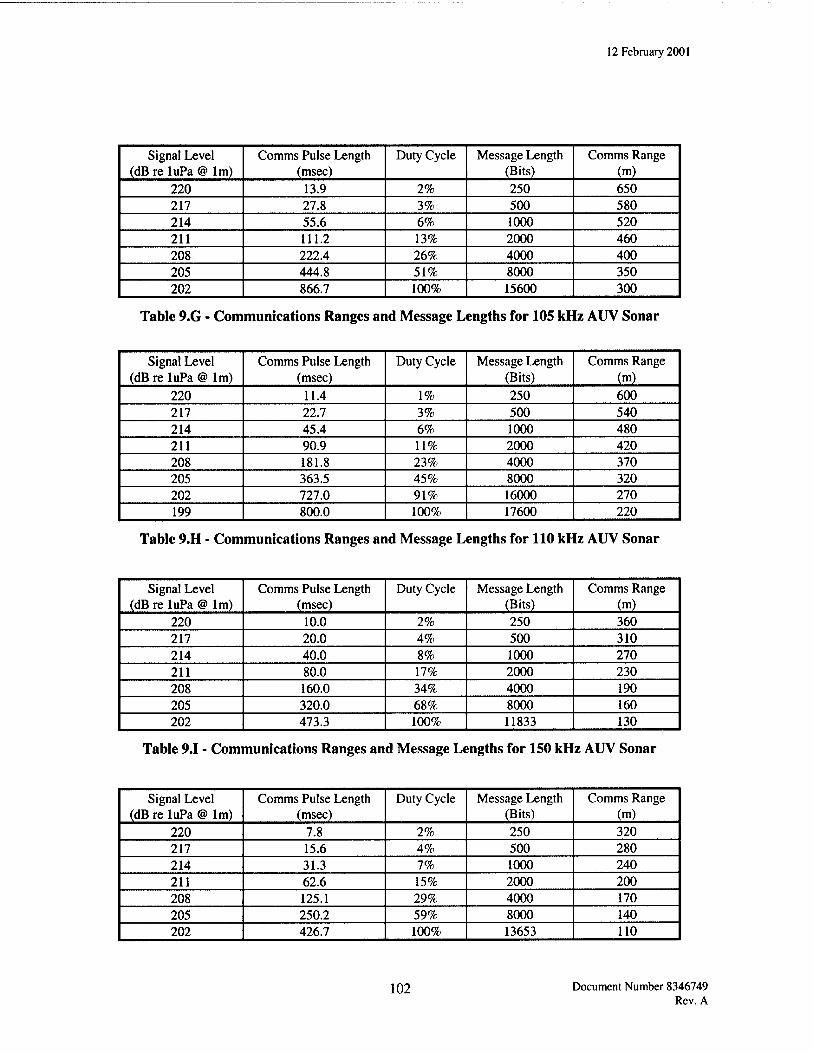
12 February 2001
Signal Level (dB re luPa @ lm)
Comms Pulse Length (msec)
Duty Cycle Message Length (Bits)
Comms Range (m)
220 13.9 2% 250 650 217 27.8 3% 500 580 214 55.6 6% 1000 520 211 111.2 13% 2000 460 208 222.4 26% 4000 400 205 444.8 51% 8000 350 202 866.7 100% 15600 300
Table 9.G - Communications Ranges and Message Lengths for 105 kHz AUV Sonar
Signal Level (dB re luPa @ lm)
Comms Pulse Length (msec)
Duty Cycle Message Length (Bits)
Comms Range (m)
220 11.4 1% 250 600 217 22.7 3% 500 540 214 45.4 6% 1000 480 211 90.9 11% 2000 420 208 181.8 23% 4000 370 205 363.5 45% 8000 320 202 727.0 91% 16000 270 199 800.0 100% 17600 220
Table 9.H - Communications Ranges and Message Lengths for 110 kHz AUV Sonar
Signal Level (dB re luPa @ lm)
Comms Pulse Length (msec)
Duty Cycle Message Length (Bits)
Comms Range (m)
220 10.0 2% 250 360 217 20.0 4% 500 310 214 40.0 8% 1000 270 211 80.0 17% 2000 230 208 160.0 34% 4000 190 205 320.0 68% 8000 160 202 473.3 100% 11833 130
Table 9.1 - Communications Ranges and Message Lengths for 150 kHz AUV Sonar
Signal Level (dB re luPa @ lm)
Comms Pulse Length (msec)
Duty Cycle Message Length (Bits)
Comms Range (m)
220 7.8 2% 250 320 217 15.6 4% 500 280 214 31.3 7% 1000 240 211 62.6 15% 2000 200 208 125.1 29% 4000 170 205 250.2 59% 8000 140 202 426.7 100% 13653 110
102 Document Number 8346749 Rev. A
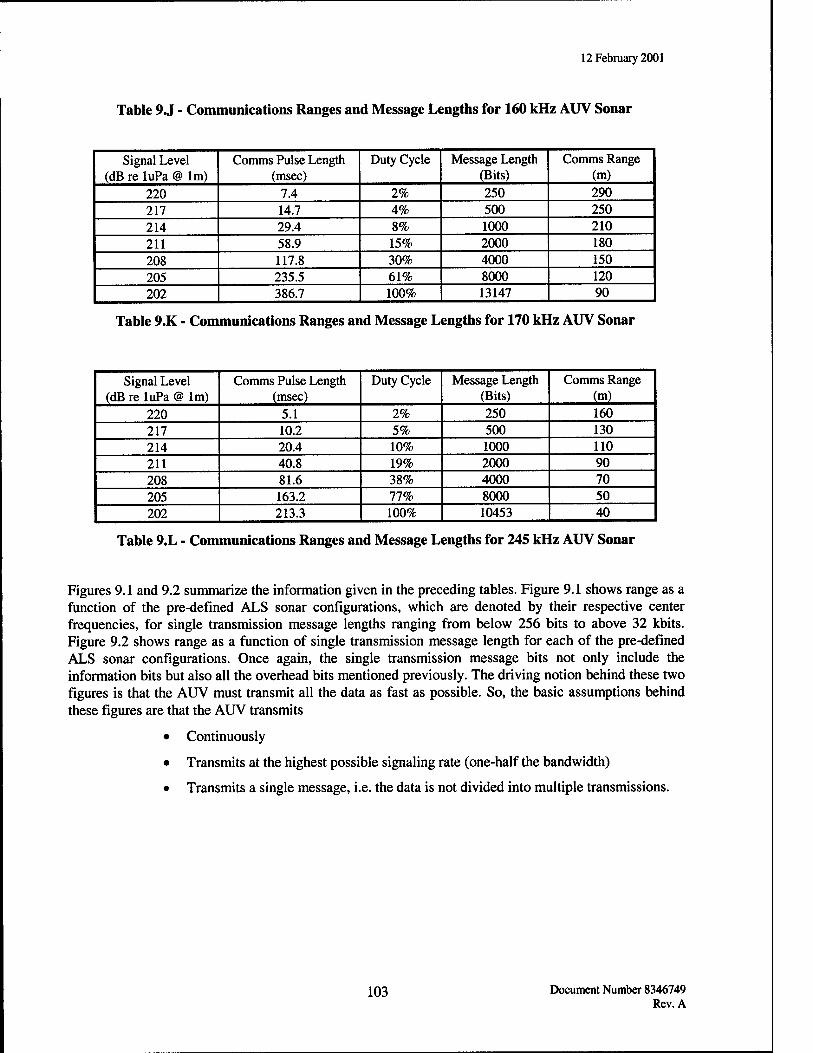
12 February 2001
Table 9 J - Communications Ranges and Message Lengths for 160 kHz AUV Sonar
Signal Level (dB re luPa @ lm)
Comms Pulse Length (msec)
Duty Cycle Message Length (Bits)
Comms Range (m)
220 7.4 2% 250 290 217 14.7 4% 500 250 214 29.4 8% 1000 210 211 58.9 15% 2000 180 208 117.8 30% 4000 150 205 235.5 61% 8000 120 202 386.7 100% 13147 90
Table 9.K - Communications Ranges and Message Lengths for 170 kHz AUV Sonar
Signal Level (dB re luPa @ lm)
Comms Pulse Length (msec)
Duty Cycle Message Length (Bits)
Comms Range (m)
220 5.1 2% 250 160 217 10.2 5% 500 130 214 20.4 10% 1000 110 211 40.8 19% 2000 90 208 81.6 38% 4000 70 205 163.2 77% 8000 50 202 213.3 100% 10453 40
Table 9.L - Communications Ranges and Message Lengths for 245 kHz AUV Sonar
Figures 9.1 and 9.2 summarize the information given in the preceding tables. Figure 9.1 shows range as a function of the pre-defined ALS sonar configurations, which are denoted by their respective center frequencies, for single transmission message lengths ranging from below 256 bits to above 32 kbits. Figure 9.2 shows range as a function of single transmission message length for each of the pre-defined ALS sonar configurations. Once again, the single transmission message bits not only include the information bits but also all the overhead bits mentioned previously. The driving notion behind these two figures is that the AUV must transmit all the data as fast as possible. So, the basic assumptions behind these figures are that the AUV transmits
• Continuously
• Transmits at the highest possible signaling rate (one-half the bandwidth)
• Transmits a single message, i.e. the data is not divided into multiple transmissions.
103 Document Number 8346749 Rev. A
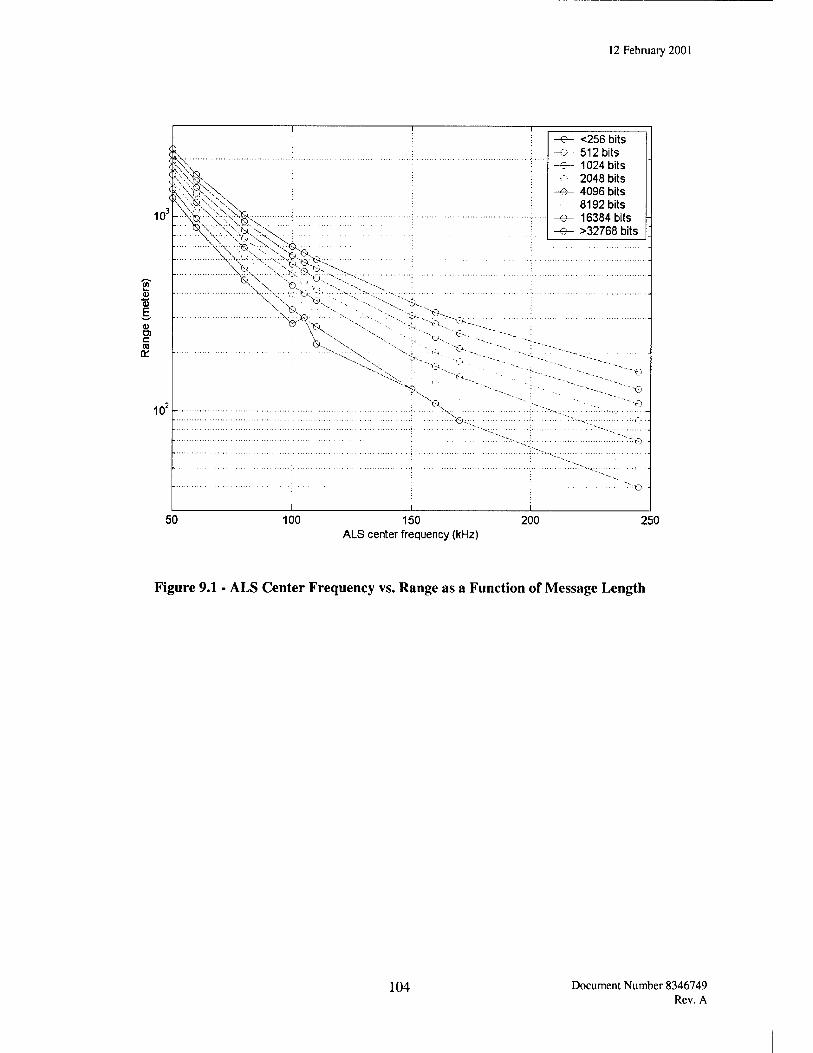
12 February 2001
150 ALS center frequency (kHz)
200 250
Figure 9.1 - ALS Center Frequency vs. Range as a Function of Message Length
104 Document Number 8346749 Rev. A
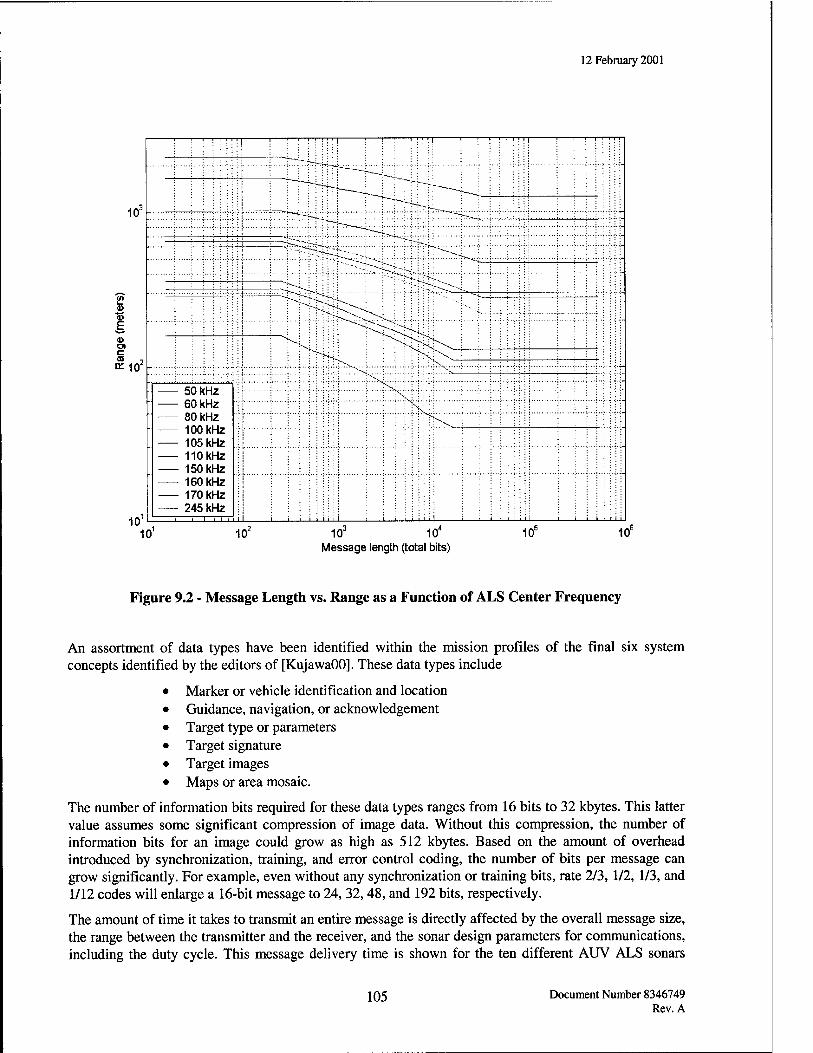
12 February 2001
10J-
(A k_ d> 'S E <D CD
QMO'
101
1 1 1—i i i i | ■ j 1 1—r-i r i l | 1 1 1 i-i IT r | 1 1 (—i—i-i yj j i i ■ | i ill
!■■■■! pH-jj || j- ■frfrtfr^^. 1 Mr ! "= :H ; ; Hp;- : ■ : : • : : i ~—-___ : ~!~-"~:---^; : '■ : : j ■ :■:■:'! f^^^^-U.: : I ; ; ! : • • I H •
~ : ■■■'.••••■ .* •■ -.- -; ~r-^->~4__v^j :'■': ; : ' : ' -^^_ - _ : ; : ' : : :.Z
■■■•• . ■. ■ :-v ■;..i-|p^--i^]:;--v-v-H : f; i :• ■ i-; ■■■;•;•;■; ■ ■.•••;.-i-;-:-^-
• ;-fj-;-f?r ; ":. r"^*—"-^:--^ : ..: .; , ,.":>.^.,.. . . , i. , . . ■ ^TÄp^ . ;
: Zr~--~: ' : : ~>-^i>;. : ; : :
! j-}-j4fii I r^^$5\< ; "i' M =:: .! j : I I: !_
^J ; : ■ ^'^^^^ : '■ : ; :
■ : '^-si. ' : : ^X \. : : : ■ : : ■
- : '■■ .|..;..:.A.:|' . ;""--<:•• ■•■ "-V ■ : |- :- : : :;:; \: .. ;..i ' :,v ; ;...;..: ;.! ; ;...!..:.:;.;.
50 kHz ' 60 kHz ' 80 kHz 100 kHz 105 kHz 110 kHz 150 kHz 160 kHz 170 kHz 245 kHz
Nv^
; , i ; ;,,i i I ; , i ; i ; I 1 ,!,,<; i i . , ■ i , 1 i ;
10' 1(f 103 104
Message length (total bits) 10° 10°
Figure 9.2 - Message Length vs. Range as a Function of ALS Center Frequency
An assortment of data types have been identified within the mission profiles of the final six system concepts identified by the editors of [KujawaOO]. These data types include
• Marker or vehicle identification and location • Guidance, navigation, or acknowledgement • Target type or parameters • Target signature • Target images • Maps or area mosaic.
The number of information bits required for these data types ranges from 16 bits to 32 kbytes. This latter value assumes some significant compression of image data. Without this compression, the number of information bits for an image could grow as high as 512 kbytes. Based on the amount of overhead introduced by synchronization, training, and error control coding, the number of bits per message can grow significantly. For example, even without any synchronization or training bits, rate 2/3, 1/2, 1/3, and 1/12 codes will enlarge a 16-bit message to 24, 32,48, and 192 bits, respectively.
The amount of time it takes to transmit an entire message is directly affected by the overall message size, the range between the transmitter and the receiver, and the sonar design parameters for communications, including the duty cycle. This message delivery time is shown for the ten different AUV ALS sonars
105 Document Number 8346749 Rev. A
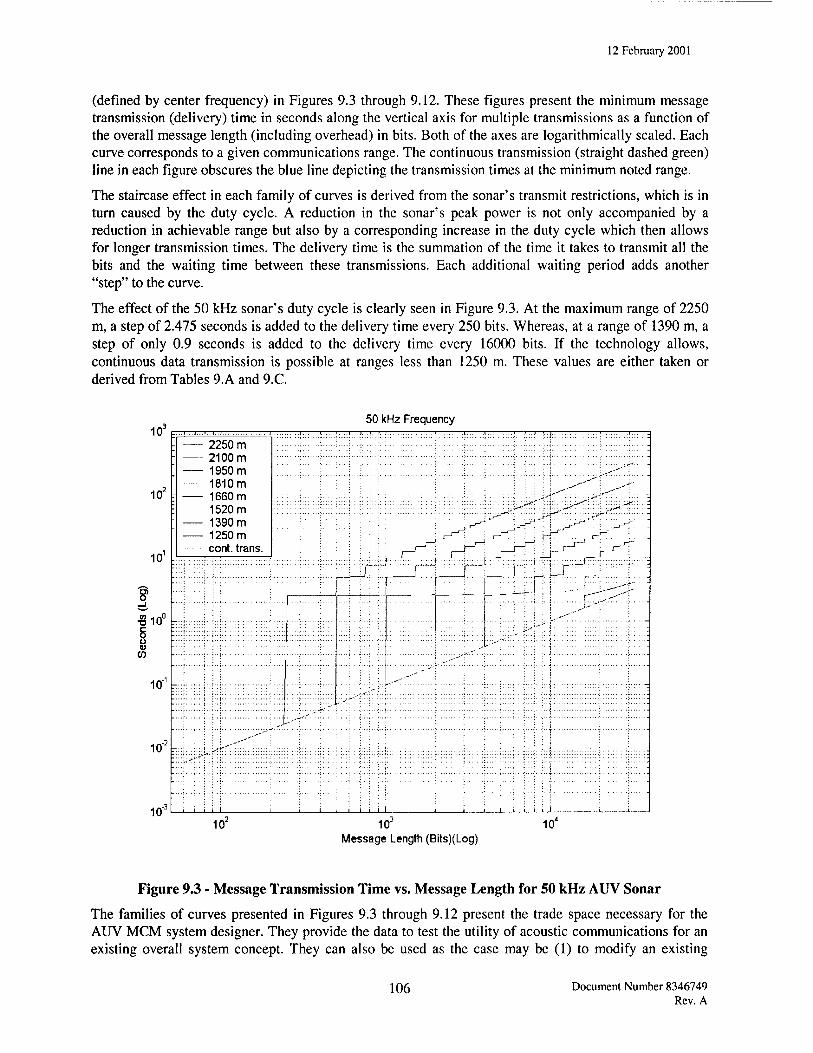
12 February 2001
(defined by center frequency) in Figures 9.3 through 9.12. These figures present the minimum message transmission (delivery) time in seconds along the vertical axis for multiple transmissions as a function of the overall message length (including overhead) in bits. Both of the axes are logarithmically scaled. Each curve corresponds to a given communications range. The continuous transmission (straight dashed green) line in each figure obscures the blue line depicting the transmission times at the minimum noted range.
The staircase effect in each family of curves is derived from the sonar's transmit restrictions, which is in turn caused by the duty cycle. A reduction in the sonar's peak power is not only accompanied by a reduction in achievable range but also by a corresponding increase in the duty cycle which then allows for longer transmission times. The delivery time is the summation of the time it takes to transmit all the bits and the waiting time between these transmissions. Each additional waiting period adds another "step" to the curve.
The effect of the 50 kHz sonar's duty cycle is clearly seen in Figure 9.3. At the maximum range of 2250 m, a step of 2.475 seconds is added to the delivery time every 250 bits. Whereas, at a range of 1390 m, a step of only 0.9 seconds is added to the delivery time every 16000 bits. If the technology allows, continuous data transmission is possible at ranges less than 1250 m. These values are either taken or derived from Tables 9.A and 9.C.
103
1<f
10'
50 kHz Frequency
81
2250 m 2100 m 1950 m
1810 m 1660 m
1520 m 1390 m 1250 m
cont. trans.
■810° 5 o V W
101
10"'
10;
i<r 10J
Message Length (Bits)(Log) 10"
Figure 9.3 - Message Transmission Time vs. Message Length for 50 kHz AUV Sonar
The families of curves presented in Figures 9.3 through 9.12 present the trade space necessary for the AUV MCM system designer. They provide the data to test the utility of acoustic communications for an existing overall system concept. They can also be used as the case may be (1) to modify an existing
106 Document Number 8346749 Rev. A
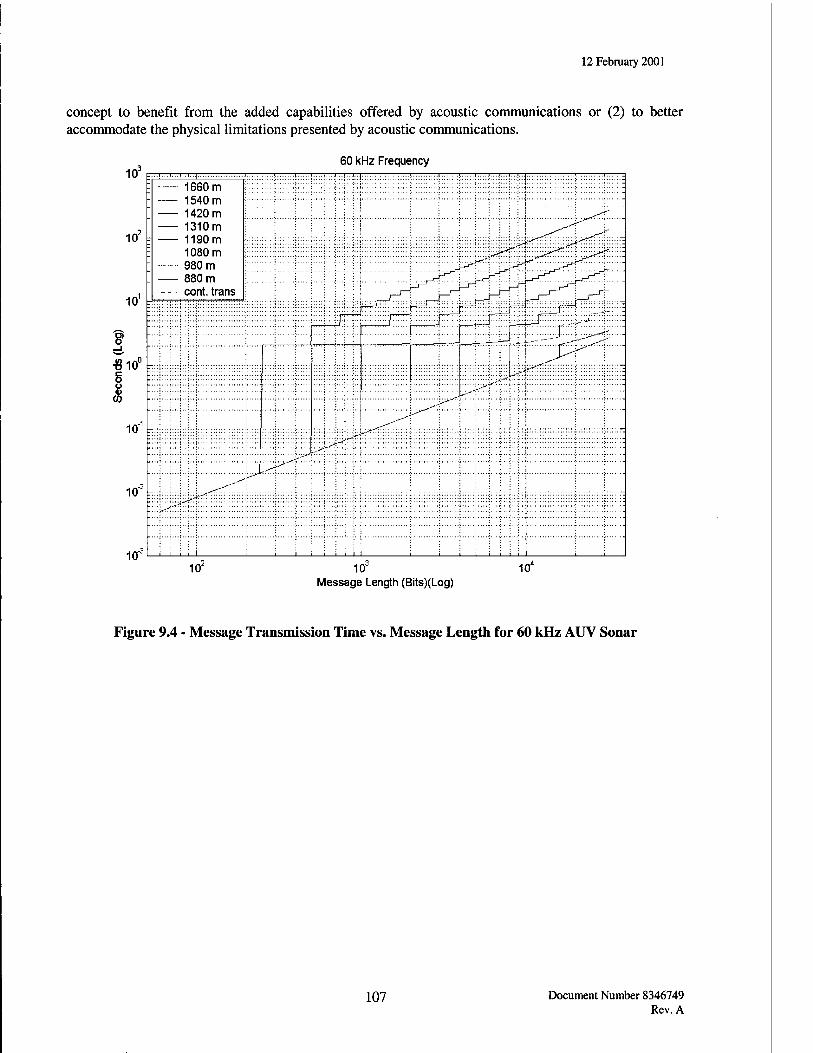
12 February 2001
concept to benefit from the added capabilities offered by acoustic communications or (2) to better accommodate the physical limitations presented by acoustic communications.
m3 60 kHz Frequency ■ ••' ■■'••■!■■'••(
102
10'
: 1660 m - 1540 m 1420 m
1310 m - 1190m
1080 m ; 980 m . 880 m
- - cont. trans
M ^nyi ^SSjE^S^
ff
310° g u V
CO
io-1
io-2
Iff3 i i
^
—>■-■
. ; . i
.■*
> i ; i
1<f 10J
Message Length (Bits)(Log) 10'
Figure 9.4 - Message Transmission Time vs. Message Length for 60 kHz AUV Sonar
107 Document Number 8346749 Rev. A
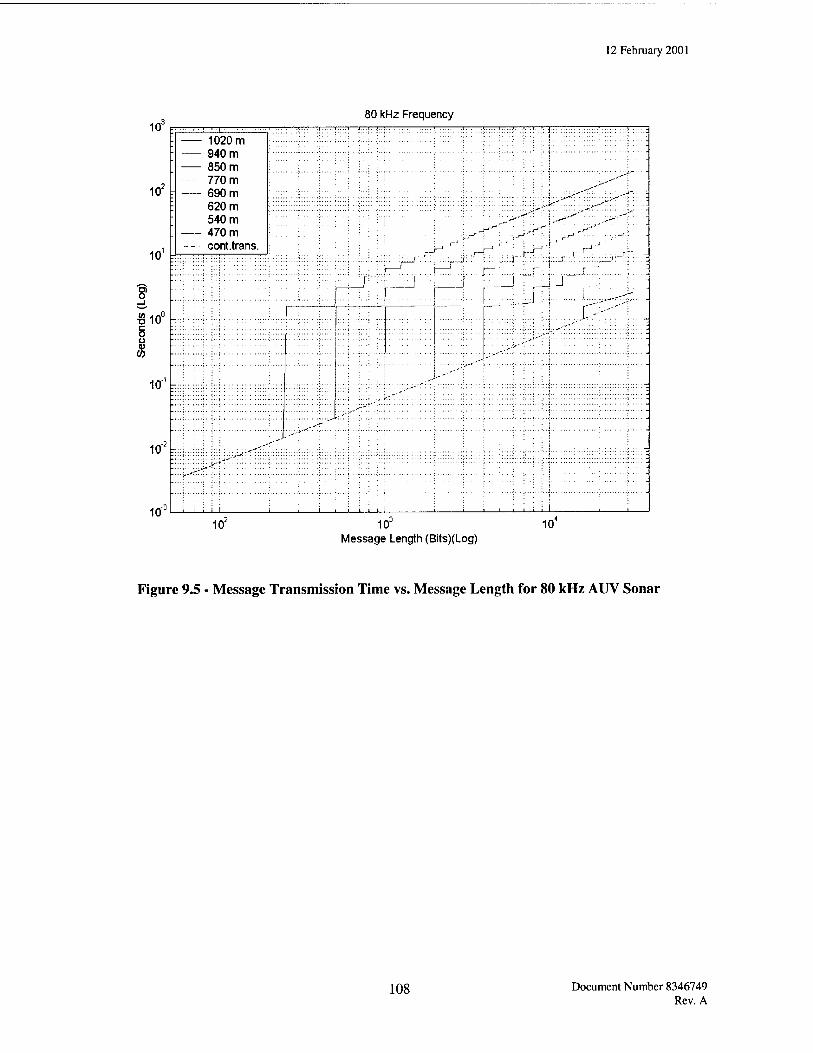
12 February 2001
103
102
10'
80 kHz Frequency
- 1020 m 940 m 850 m
770 m - 690 m
620 m 540 m 470 m
- - cont.trans.
r,.*—
i i
..... J
—' : r~ ' Lf-.l > "J_... :. :
■S100
8 u V W
101
io-2
■m3
|
....; ':.'..'.
1tf 10J
Message Length (Bits)(Log) 10*
Figure 9.5 - Message Transmission Time vs. Message Length for 80 kHz AUV Sonar
108 Document Number 8346749 Rev. A
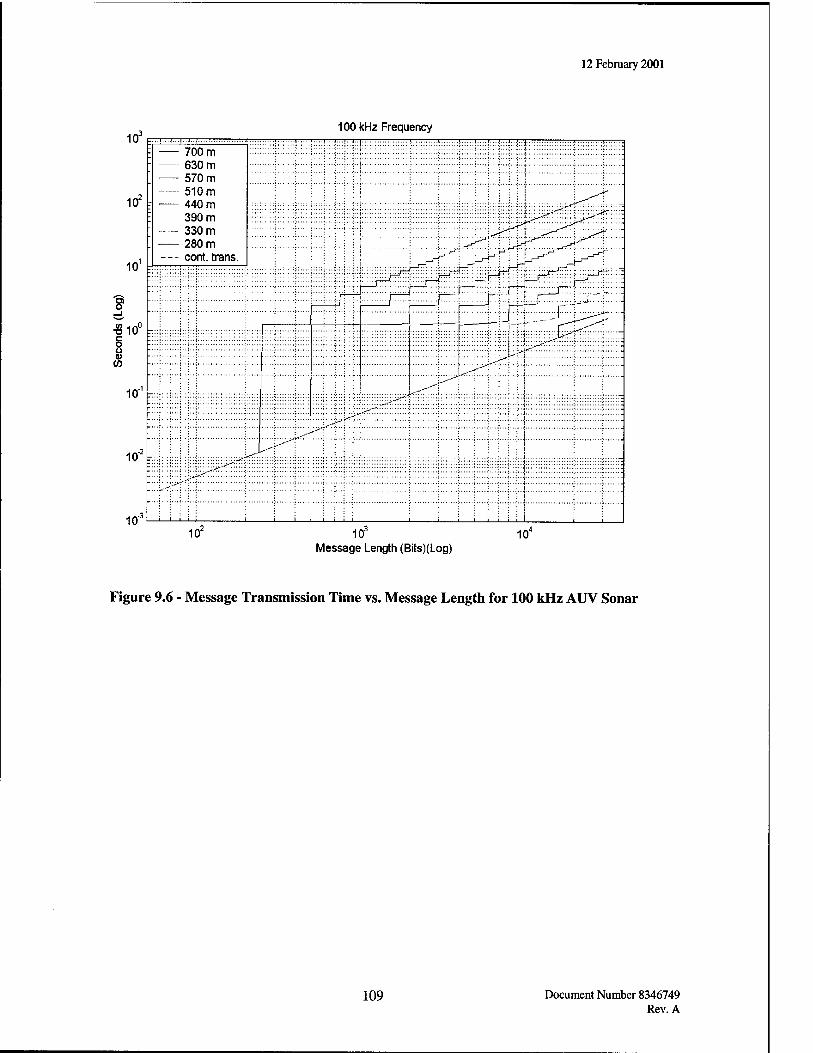
12 February 2001
m3 100 kHz Frequency
102
10'
3
i 700 m - 630 m " 570 m
-— 510 m : 440 m I 390 m " 330 m . 280 m
--• cont. trans.
i
...;.^:>.>-
3 ZS^ß^&W o
«10u
5 ü V
CO
Iff1
10"3
-irr3 i ;
Z
i i i i . i . , , : ,
10' 10J
Message Length (Bits)(Log) 10'
Figure 9.6 - Message Transmission Time vs. Message Length for 100 kHz AUV Sonar
109 Document Number 8346749 Rev. A
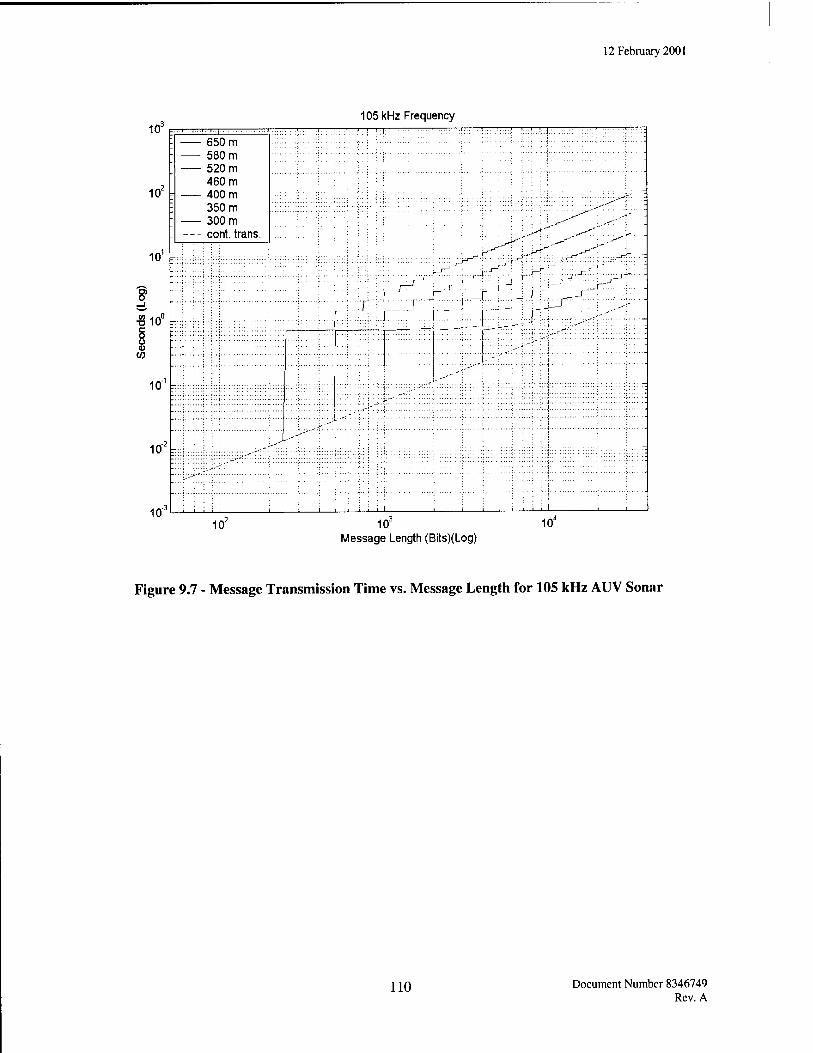
12 February 2001
103 105 kHz Frequ sncy
...I...I...I.. i..| 1 i ■''!'! ' •!.'.-' '...! ' 1 : :.:.. ' :
102
650 m 580 m 520 m
460 m : 400 m
350 m 300 m
. — cont. trans.
!;::: iji:: p:;i R : ■ ■ ::': v 1 \ v\ \ [:J^j) ;
10'
-■■■ ■
■\.:r i ^';'7'hJ^44^y: ■8io° 5 o V W
io-1
io-2
in3
.--'':
, , ; ; i i . ; i i ' ■ ; , i
1tf 10J
Message Length (Bits)(Log) 104
Figure 9.7 - Message Transmission Time vs. Message Length for 105 kHz AUV Sonar
110 Document Number 8346749 Rev. A
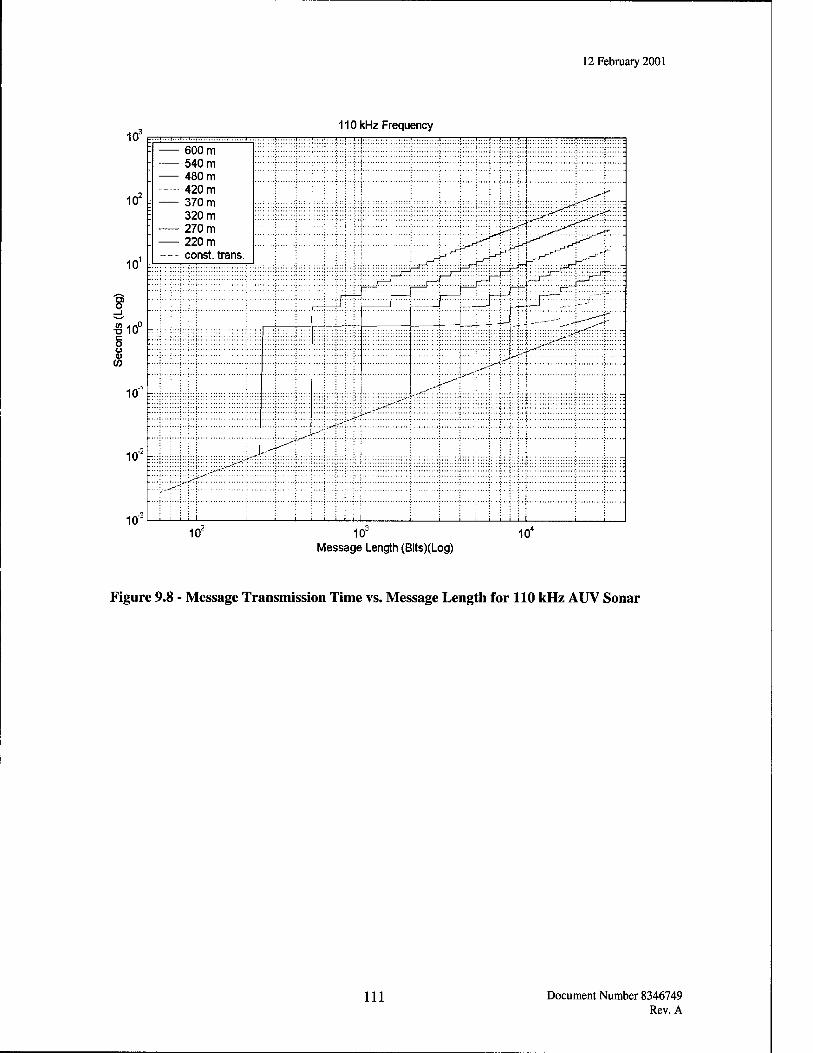
12 February 2001
m3 110 <Hz Frequency
102
101
8*
| 600 m 540 m 480 m - 420 m
^ 370 m 320 m
270 m . 220 m
--■ const, trans. ■ rj,~riJ^ U-r^" ■ i ^-r-,~H -:-'~r
; , ! I i :
\ '
Spr|:pl|10 _i
, ; ; 1 ; i i ;
■Sio° g o V W
Iff1
io-2
•m3 i i i i i i i
i<r 10J
Message Length (Bits)(Log) 10*
Figure 9.8 - Message Transmission Time vs. Message Length for 110 kHz AUV Sonar
111 Document Number 8346749 Rev. A
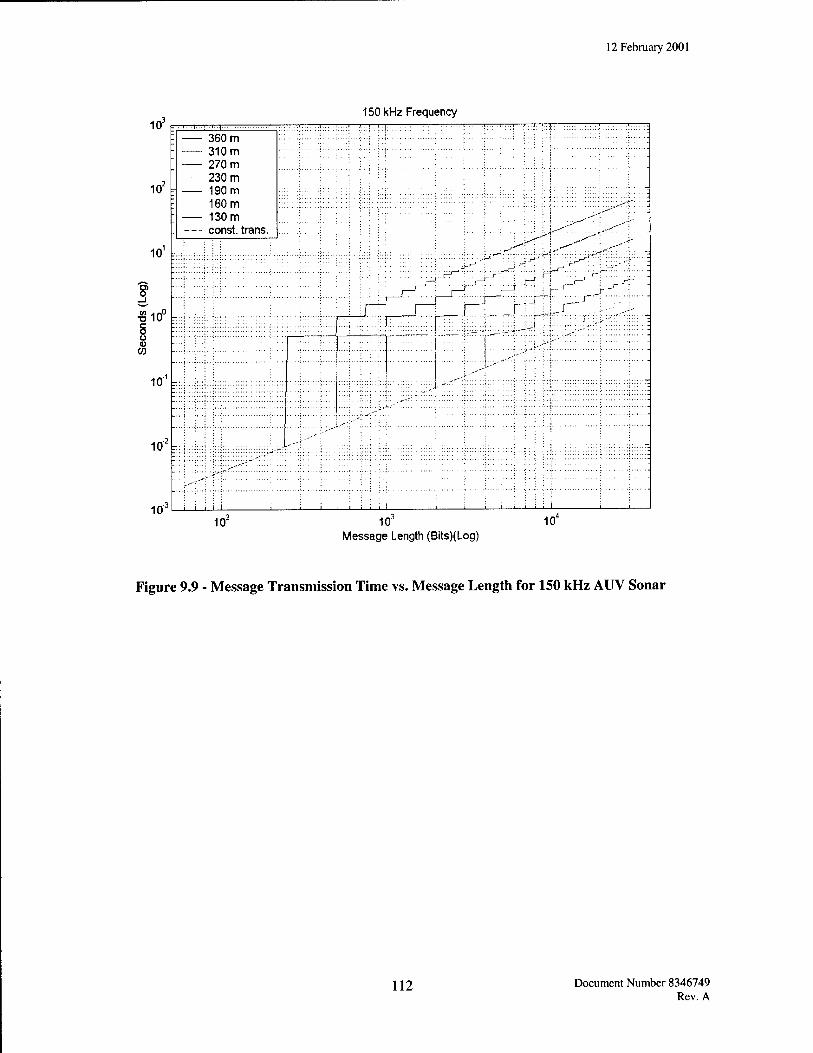
12 February 2001
m3 150 kHz Frequency ..I...I...!■■"■■( '
102
- • 360 m - — 310 m 270 m
230 m - 190 m
160 m ; 130 m . — const, trans.
•■■ • • ■;■■ ; • : ; ' ; ■". ,^'"^'"" ;
10'
310° S ::,-^-
. , . . i , ;
u V
CO
10-1
io-2
-m3 : ! ■ i
; :..
■ ill
10' 10J
Message Length (Bits)(Log) 10*
Figure 9.9 - Message Transmission Time vs. Message Length for 150 kHz AUV Sonar
112 Document Number 8346749 Rev. A
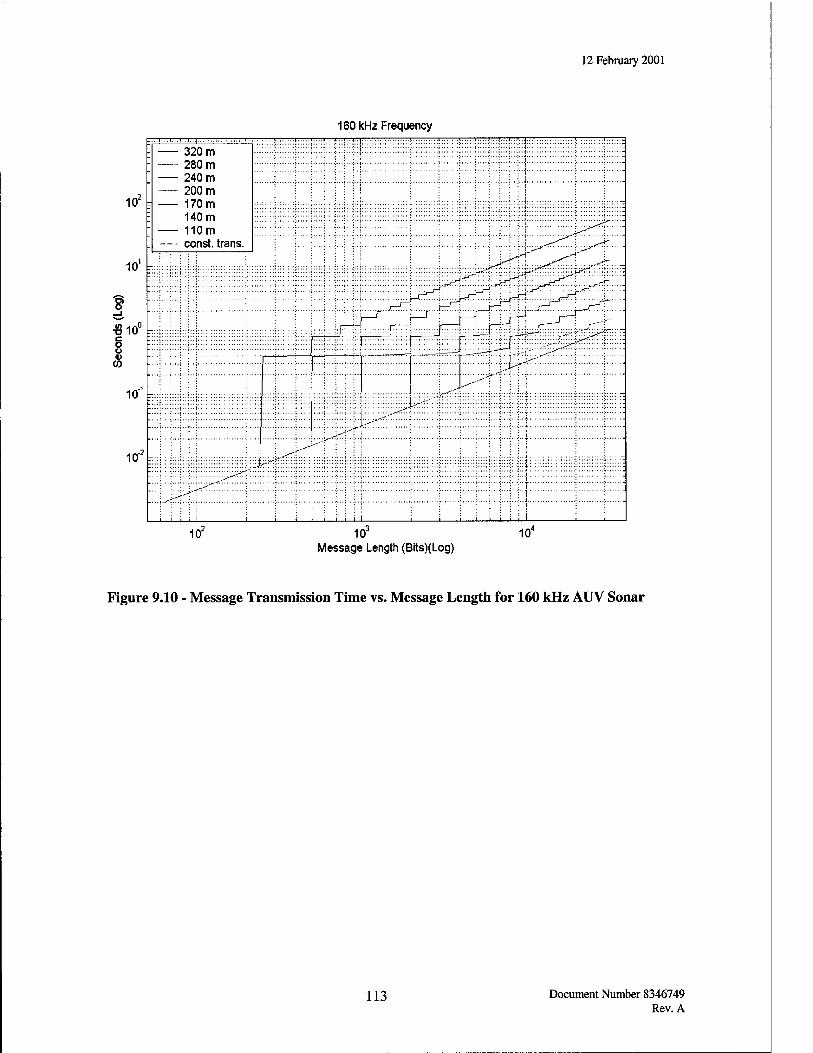
12 February 2001
160 kHz Frequency
102:
320 m 280 m 240 m 200 m 170 m
140 m 110m - const, trans.
E:E::;:iÜL.:.LÜlliMEEEEi:.:?:::! ::-:i;l::: :EEE::":::^L|::Li!^::^EI^L::ElEEh::EEE:l:^:^::I:::":^
%; 10' f.
3 o _i
£l0° =::
i i
_....rrr%_J__H-^ ^
1 1 1
uoo ;::::;ji^^:pü:E^E^::::::p:::: CO
101 r;
IQ2 f:i
i i i i i i i
^- ^E^:■}■■■:
i . i i i ; !
1(f 10J
Message Length (Bits)(Log) 10*
Figure 9.10 - Message Transmission Time vs. Message Length for 160 kHz AUV Sonar
113 Document Number 8346749 Rev. A
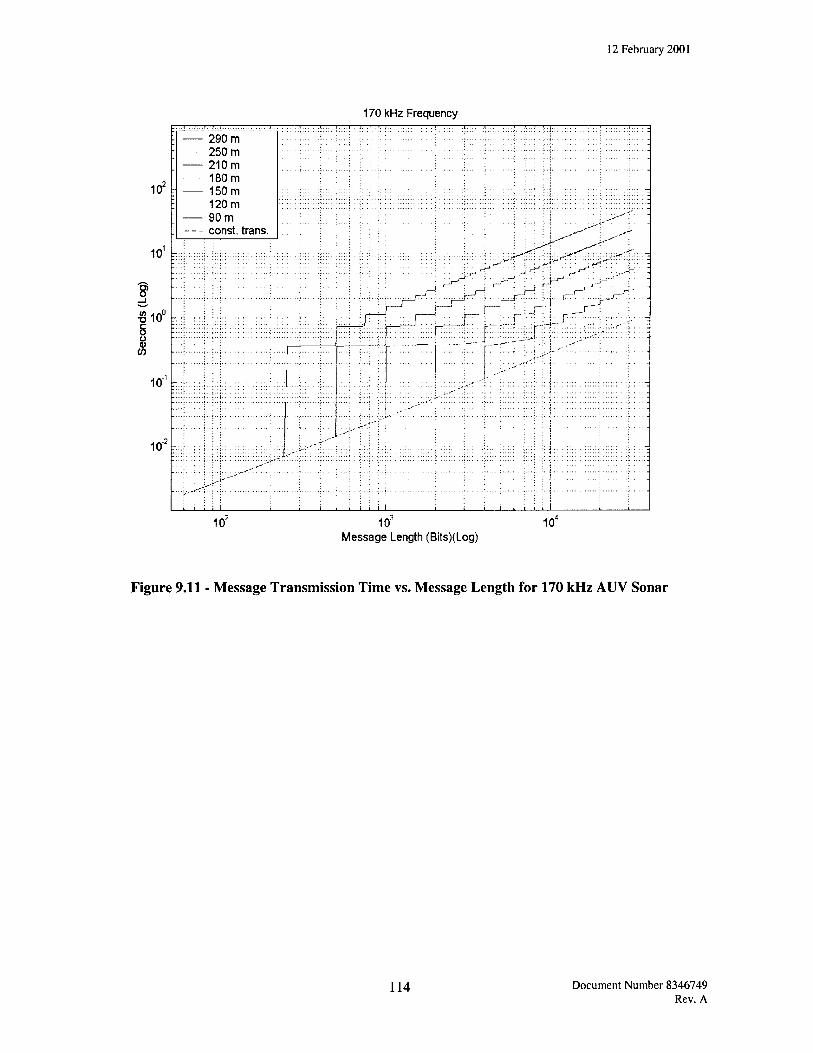
12 February 2001
170 kHz Frequency
102:
290 m 250 m 210 m
180 m 150 m
120 m 90 m - const, trans.
10':
1?
£l0° r ;_.-
i... : t-,^---\..\.. t,*---r .;.*■■" \r--r''- '■;'". '^A'' ;^>.~'
■ "^—' ; |! • '■ i i ^ ^ ! , rJ
r4"rM;dJ~r:"r', S O ::: :;:: :p
;_ .■--
'-'". ■■'"'
:"}>A'~ CO
10'r
io2r
: i
Jr , ; . ;
10' 10J
Message Length (Bits)(Log) 10*
Figure 9.11 - Message Transmission Time vs. Message Length for 170 kHz AUV Sonar
114 Document Number 8346749 Rev. A
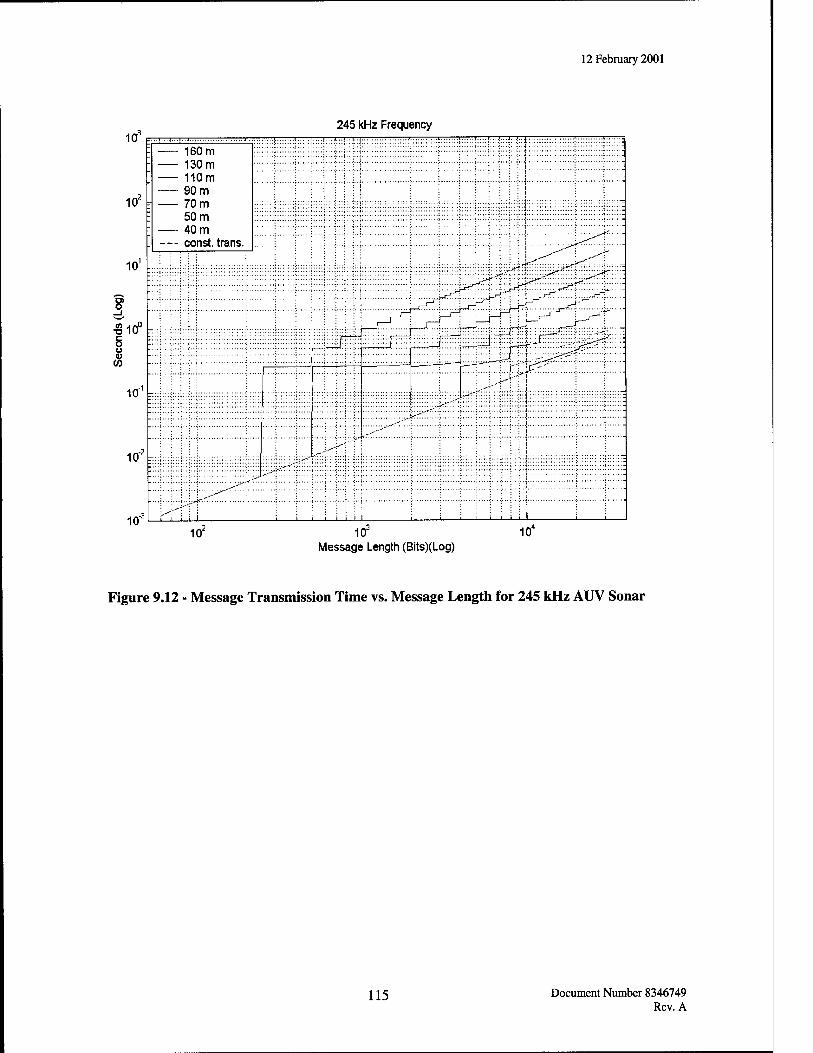
12 February 2001
10J
10' r
245 kHz Frequency
10'
81 _i
«10° c o o <u
CO
10"' r::
1<T
10:
■ ••'■ --I..■!■■"■■( '■■ ■ ■.." .1 1 I • •••i ..J...I..I... t t I::.:!::::!:::!:::!:::!:::
t r'J_ LJ—T
: 160 m - 130 m ; 110m 90 m
: 70 m ': 50 m ; 40 m
— const, trans.
y^ i
::...;;..:.;;:::...:::;...;...;..,:
i -i i-—i—i— i i ; i ; i
^.'.. ...
i<r 10J
Message Length (Bits)(Log) 10*
Figure 9.12 - Message Transmission Time vs. Message Length for 245 kHz AUV Sonar
115 Document Number 8346749 Rev. A
10. Acronyms
12 February 2001
A ACOMMS Acoustic Communications ADCs Analog-to-Digital Converters ADPCM Adaptive Differential Pulse Code Modulation AGC Automatic Gain Control ALAN Acoustic Local Area Network AM Amplitude Modulation AMMT Autonomous Minehunting and Mapping Technology AMS Advanced Marine Systems AODV Ad-hoc On-demand Distance Vector AOSN Autonomous Oceanographic Sampling Network ARQ Automatic Repeat reQuest ASK Amplitude Shift Keying ATD Advanced Technology Demonstration AUVs Autonomous Undersea Vehicles AWGN Additive White Gaussian Noise
B BASS Birmingham Acoustic Signaling BCH Bose-Chaudhuri-Hochquenghem bps Bits Per Second BER Bit Error Rate BPSK Binary Phase Shift Keying BSY-1 Submarine Integrated Sonar System (6881 Class) BW Bandwidth
C c2
Command and Control CDMA Code-Division Multiple Access CoDMA Collision Detection Multiple Access COFDM Coded Orthogonal Frequency Division Multiplexing COTS Commercial-Off-The-Shelf CPB Coherent Path Beamformer CPU Central Processing Unit CSMA Carrier Sense Media Access CW Continuous Wave
D DACs Digital-to-Analog Converters DARPA Defense Advanced Research Projects Agency DATS Digital Acoustic telemetry System dB Decibel DDG Guided Missile Destroyer DFE Decision Feedback Equalizer DFH Differential Frequency Hopping DLT Digital Linear Tape
116 Document Number 8346749 Rev. A
12 February 2001
DPCM DPLL DPPM DPSK DSDV DSR DSP DSSS
Differential Pulse Code Modulation Digital Phase-Locked Loop Digital Pulse Position Modulation Differential Phase Shift Keying Destination Sequence Distance Vector Dynamic Source Routing Digital Signal Processor Direct Sequence-Spread Spectrum
E ECC ENSTB EQSID
Error Control Coding Ecole Nationale Superieure des Telecommunications de Bretagne Equalization via System Identification
F FB FBE FDMA FEC-ARQ FP FFF FHSS FM FOLMS FOLMSPE FTF
Feedback Fleet Battle Experiment Frequency-Division Multiple Access Forward Error Correction Automatic Repeat reQuest Feedforward Feedforward Filter Frequency Hopped Spread-Sprectrum Frequency Modulation Fast self-Optimized Least Mean Squares Fast self-Optimized Least Mean Squares Phase Estimator Fast Transversal Filter
G GB GFLOP GPS GUI
Gigabytes Gigafloating Point Operating per second Global Positioning System Graphical User Interface
H HF Hz
High Frequency Hertz
I IC ID IFREMER I/O ISI
Inner Code Identification Institut Francais de Recherche pour l'Exploitation de la Mer Input/Output Intersymbol Interference
J JMCIS Joint Maritime Command Information System
K kbps kHz
Kilo Bits Per Second KiloHertz
117 Document Number 8346749 Rev. A
12 February 2001
km Kilometer
L LE Linear Equalizer LF Low Frequency LMS Least Mean Squares LPD Low Probability of Detection LPI Low Probability of Interception
M m Meter MA Moving Average MACA Multiple Access with Collision Avoidance MAI Multiple Access Interference MARIUS Marine Utility System MCM Mine Countermeasures MDPSK M-ary Differential Phase-Shift Keying MF Mid-Frequency MFSK Multiple Frequency Shift Keying MHz MegaHertz MIT Massachusetts Institute of Technology MLSE Maximum-Likelihood Sequence Estimator MMSE Minimum Mean Squared Error MOEs Measures of Effectiveness ms Millisecond MSE Mean Squared Error
N NBOA Narragansett Bay Operating Areas NEU Northeastern University NSSN New Attack Submarine, Nuclear NUWCDIVNPT Naval Undersea Warfare Center Division in I*
O OEX Ocean Explorer OFDM Orthogonal Frequency Division Multiplexing ONR Office of Naval Research OOK On-Off Keying OQPSK Offset Quadriphase-Shift Keying
P PAM Pulse Amplitude Modulation PC Personal Computer PCM Pulse Code Modulation PG Processing Gain PLL Phase-Locked Loop PPC PowerPC PPM Pulse Position Modulation PSK Phase Shift Keying
118 Document Number 8346749 Rev. A
12 February 2001
Q QAM QPSK
Quadrature Amplitude Modulation Quadrature Phase Shift Keying
R RAM RAP RF RLS RV RWLS
S s SFTF SL SNR SPM SQS-53C SSB SSMA SSN STV
T TCM TDMA TORA
U UAM UDAT URI UUV UWA
Random Access Memory Reliable Acoustic Propagation Radio Frequency Recursive Least Squares Research Vessel Recursive Weighted Least Squares
seconds Stabilized Fast Transverse Filter Source Level Signal-to-Noise Ratio Sequence Position Modulation Surface Ship Bow Sonar System Single Sideband Spread Spectrum Multiple Access Attack Submarine, Nuclear Short-Term Variability
Trellis Coded Modulation Time-Division Multiple Access Temporally Ordered Routing Algorithm
Utility Acoustic Modem Underwater Digital Acoustic Telemetry University Research Initiative Unmanned Underwater Vehicle Underwater Acoustic
V VME VSTV
Versa Module Europa Very Short-Term Variability
W WHOI Woods Hole Oceanographic Institution
119 Document Number 8346749 Rev. A
12 February 2001
11. Bibliography
[Albonico98] D. Albonico, F. Fohanno, and J. Labat, "Test of an high data rate acoustic link in shallow water," OceansV8 Conf. Proc, vol. 2, pp. 1028-1032, Sept. 1998.
[Al-Kurd98a] A. Al-Kurd, T.C. Yang, J. Schindall, and E. Carey, "Performance evaluation of phase coherent underwater acoustic communications during the LWAD 98-1 experiment," Proc. 16th Intl. Congress on Acoustics and 135th Mtg. of the Acoust. Soc. Am., vol. 1, pp. 309-310, June 1998.
[Al-Kurd98b] A. Al-Kurd and T.C. Yang, "Underwater coherent acoustic communications performance during the LWAD 98-1 experiment," Proc. MTS Ocean Community Conf. '98, Nov. 1998.
[Andrews76] R.S. Andrews and L.F. Turner, "On the performances of underwater data transmission using amplitude shift keying techniques," IEEE 3. Sonics Ultrason., vol. SU-23, no. 1, pp. 64-71, June 1976.
[Appleby98a] S. Appleby and J. Davies, "Time, frequency and angular dispersion modelling in the underwater communications channel," Oceans'98 MTS/IEEE Conf. Proc, vol. 2, pp. 644-649, Sept. 1998.
[Appleby98b] S. Appleby and J. Davies, "Time frequency and angular dispersion modelling in the underwater communications channel," UDT Europe 98, pp.281-289, June 1998.
[Asakawa96] K. Asakawa, J. Kojima, Y. Ito, S. Takagi, Y. Shirasaki, and N. Kato, "Autonomous underwater vehicle AQUA EXPLORER 1000 for inspection of underwater cables," Proc. of the 1996 Symposium on Autonomous Underwater Vehicle Technology, pp. 10- 17, June 1996.
[Ayela94] G. Ayela, M. Nicot and X. Lurton, "New innovative multimodulation acoustic communication system," Proc. 1994 IEEE Oceans Conf, vol. 1, pp. 292-295, Sept. 1994.
[Bachmann81] W. Bachmann, "Estimates of the channel capacity for acoustic underwater communication," Underwater Acoustics and Signal Processing, L. Bjorno (ed), pp. 659- 662, 1981.
[Backes83] J.L. Backes, B.M. Bell, and J.B. Miller, "Implementation of error detection and correction codes for acoustic data telemetry," Proc. Oceans'83, vol. 1, pp. 167-175, Aug. 1983.
[Baggeroer81] A.B. Baggeroer, D. Koelsch, K. von der Heydt, and J. Catipovic, "DATS-A digital acoustic telemetry system," Proc. Oceans'81, pp.55-66, 1981.
[Baggeroer84] A.B. Baggeroer, "Acoustic telemetry - an overview," 1EEEJ. Oceanic Eng., vol. OE-9, no. 4, pp. 229-235, Oct. 1984.
120 Document Number 8346749 Rev. A
12 February 2001
[Baggeroer98] A.B. Baggeroer and D.B. Kilfoyle, "Telemetry and the underwater channel: progress and challenges," Proc. 16th Intl. Congress on Acoustics and 135th Mtg. oftheAcoust. Soc. Am., vol. 1, pp. 299-300, June 1998.
[Barroso94] V. Barroso, J. Gomes, G. Ayela, and M. Nicot, "Shallow water communication system for an AUV," Proc. 1994 IEEE Oceans Conf., vol. 1, pp. 608-613, Sept. 1994.
[Baxley98] P.A. Baxley, H. Bucker, and J.A. Rice, "Shallow-water acoustic communications channel modeling using three-dimensional Gaussian beams," Proc. MTS Ocean Community Conf. '98, vol. 2, pp. 1022-1026, Nov. 1998.
[Baxley99] P.A. Baxley, H. Bucker, J.A. Rice, M.D. Green, and J. Woxstroem, "Acoustic communication channel modeling for the Baltic Sea", Oceans'99 MTS/IEEE Conf. Proc, vol. 3, pp. 1504-1511, Sept. 1999.
[BeaujeanOO] P.J. Beaujean and L. R. LeBlanc, "Spatio-temporal processing of coherent acoustic communications data in shallow water," Oceans 2000 MTS/IEEE Conf. Proc, vol. 3, pp. 1625-1631, Sept. 2000.
[Bejjani96] E. Bejjani and J-C. Belfiore, "Multicarrier coherent communications for the underwater acoustic channel," Oceans '96 MTS/IEEE Conf. Proc, pp. 1125-1130, 1996.
[Benson98] R.A. Benson, "Office of Naval Research program in underwater acoustic communications," Proc. MTS Ocean Community Conf. '98, Nov. 1998.
[Bessios94] A.G. Bessios and F.M. Caimi, "Multipath compensation for underwater acoustic communications," Proc. 1994 IEEE Oceans Conf, vol. 1, pp. 317-322, Sept. 1994.
[Bessios95] A.G. Bessios and F.M. Caimi, "Fast underwater acoustic data link design via multicarrier modulation and higher-order statistics equalization," Oceans'95 Proc, vol. 1, pp. 594- 599, Oct. 1995.
[Bessios96] A.G. Bessios, "Compound compensation strategies for wireless data communications over the multimodal acoustic ocean waveguide," IEEEJ. Oceanic Eng., vol. 21, no. 2, pp. 167-180, April 1996.
[Billon94] D. Billon and B. Quellec, "Performance of high data rate acoustic underwater communication systems using adaptive beamforming and equalizing," Proc 1994 IEEE Oceans Conf, vol. 3, pp. 507-512, Sept. 1994.
[Birdsall84] T. Birdsall, "Acoustic telemetry for ocean acoustic tomography," IEEE J. Oceanic Eng, vol. OE-9, no. 4, pp. 237-239, Oct. 1984.
[Bjerrum96] C. Bjerrum-Niese, L. Bjorno, M. A. Pinto, and B. Quellec, "A simulation tool for high data-rate acoustic communication in a shallow-water, time-varying channel," IEEE J. Oceanic Eng., vol. 21, no. 2, pp. 143-149, April 1996.
[Blackmon98] F. Blackmon, S. Jarvis, R. Morrissey, and D. Lambert, "High-rate underwater acoustic telemetry with applications in training, test and evaluation," Proc MTS Ocean Community Conf '98, Nov. 1998.
121 Document Number 8346749 Rev. A
12 February 2001
[Blackmon99] F. Blackmon, S. Jarvis, R. Morrissey, and D. Lambert, "High-rate underwater acoustic telemetry with naval applications," Sea Technology, vol. 40, no. 5, pp. 67-70, May 1999.
[Boulanger98] C. Boulanger, G. Loubet, and J. Lequepeys, "Spreading sequences for underwater multiple-access communications," Oceans'98MTS/IEEE Conf. Proc, pp. 1038-1042, Sept. 1998.
[Bovio99] E. Bovio, "A review of the applicability of UUV technology to mine coutermeasures," SACLANTCEN SM-345, 1999.
[Brady92] D. Brady and J. Catipovic, "An adaptive, soft-decision multiuser receiver for underwater acoustical channels," Conf. Rec. of the Twenty-Sixth Asilomar Conf. On Signals, Systems and Computers, vol. 2, pp. 1137-1141, Oct. 1992.
[Brady94] D. Brady and J.A Catipovic, "Adaptive multiuser detection for underwater acoustical channels," 1EEEJ. Oceanic Eng., vol. 19, no. 2, pp. 158-165, Apr. 1994.
[Brady98] D. Brady and J.C. Preisig, "Underwater acoustic communications," Wireless Communications Signal Processing Perspectives, pp. 330-379, 1998.
[Bunce98] J. Bunce, J. Boatman, and Lt. Cdr. J. Waddell, "Unmanned underwater vehicles: technology demonstration 2," Sea Technology, pp. 25-28, Dec. 1998.
[Cadiou98] J.F. Cadiou, S. Coudray, P. Leon, and M. Perrier, "Control architecture of a new deep scientific ROV: VICTOR 6000," Oceans'98 MTS/IEEE Conf. Proc, vol. 1, pp. 492-497, Sept. 1998.
[Caimi98a] F.M. Caimi, R. Tongta, S.H. Murshid, and M.C. Carroll, "Performance degradation factors and channel estimation for coherent acoustic communications systems in a shallow water environment: estimation using the system identification (SID) method," U.S. NavyJ. of Underwater Acoustics, vol. 48, no. 3, pp. 503-516, July 1998.
[Caimi98b] F.M. Caimi, R. Tongta, M. Carroll, and S. Murshid, "Acoustic impulse response mapping for acoustic communications in shallow water," Oceans'98 Conference Proceedings, vol. 1, pp. 1739-1743, Sept. 1998.
[Caimi98c] F.M. Caimi, D.M. Kocak, G.X. Ritter, and M.S. Schmalz, "Comparison and development of compression algorithms for AUV telemetry: recent advancements," Proc. MTS Ocean Community Conf. '98, Nov. 1998.
[Caimi98d] F.M. Caimi, S.H. Murshid, R. Tongta, and M. Carroll, "Channel characterization for acoustic communications in shallow water using QPSK data," Proc. MTS Ocean Community Conf. '98, Nov. 1998.
[Caimi99] F.M. Caimi and G.A. Hassan, "Results using an alternative approach to channel equalization using pattern classification strategy," Oceans'99 MTS/IEEE Conf. Proc, vol. 2, pp. 580-584, Sept. 1999.
122 Document Number 8346749 Rev. A
12 February 2001
[Caldera87] M.K. Caldera, "A multi-frequency digital communication technique for acoustic channel with multipaths," Oceans'87Proc, vol. 1, pp. 140-145, Sept. 1987.
[Cancilliere94] F.M. Cancilliere, "Advanced UUV technology," Proc. IEEE Oceans '94, vol. 1, pp. 147- 151, Sept. 1994.
[Capellano96] V. Capellano, G. Loubet, and G. Jourdain, "Adaptive multichannel equalizer for underwater communications," OceansV6 MTS/IEEE Conf. Proc, pp. 994-999,1996.
[Capellano98] V. Capellano and G. Jourdain, "Comparison of adaptive algorithms for multichannel adaptive equalizers. Application to underwater acoustic communications," Oceans"98 Conf. Proc, vol. 2, pp. 1178-1182, Sept. 1998.
[Carvalho95] D. Carvalho, F. Blackmon, and R. Janiesch, "The results of several acoustic telemetry tests in both deep and shallow water," Oceans'95 MTS/IEEE Conf. Proc, pp. 604-614, Oct. 1995.
[Catipovic84] J. Catipovic, A.B. Baggeroer, K. von der Heydt, and D. Koelsch, "Design and performance analysis of a digital acoustic telemetry system for the short range underwater channel," IEEEJ. Oceanic Eng., vol. OE-9, no. 4, pp. 242-252, Oct. 1984.
[Catipovic89a] J. Catipovic and L. Freitag, "WHOI acoustic telemetry project interim report 12/1/88- 6/1/89," WHOI-89-21, July 1989.
[Catipovic89b] J. Catipovic, M. Deffenbaugh, L. Freitag, and D. Frye, "An acoustic telemetry system for deep ocean mooring data acquisition and control," Proc. Oceans'89, pp. 887-892, Sept. 1989.
[Catipovic90a] J.A. Catipovic and A.B. Baggeroer, "Performance of sequential decoding of convolutional codes over fully fading ocean acoustic channels," IEEEJ. Oceanic Eng., vol. 15, no. 1, pp. 1-7, Jan. 1990.
[Catipovic90b] J.A. Catipovic and L.E. Freitag, "High data rate acoustic telemetry for moving ROVs in a fading multipath shallow water environment," Proc. 1990 IEEE Symp. on Autonomous Underwater Technology, pp. 296-303, June 1990.
[Catipovic90c] J.A. Catipovic, "Performance limitations in underwater acoustic telemetry," IEEE J. Oceanic Eng., vol. 15, no. 3, pp. 205-216, July 1990.
[Catipovic91] J.A. Catipovic and L.E. Freitag, "Spatial diversity processing for underwater acoustic telemetry," IEEEJ. Oceanic Eng., vol. 16, no. 1, pp. 86-97, Jan. 1991.
[Catipovic93] J. Catipovic, D. Brady, and S. Etchemendy, "Development of underwater acoustic modems and networks," Oceanography, vol. 6, no. 3, pp. 112-119,1993.
[Catipovic94] J. Catipovic, M. Johnson, and D. Adams, "Noise cancelling performance of an adaptive receiver for underwater communications," Proc. 1994 Symp. on Autonomous Underwater Vehicle Technology, pp. 171-178, July 1994.
123 Document Number 8346749 Rev. A
12 February 2001
[Catipovic97] J.A. Catipovic, "Acoustic telemetry," Encyclopedia of Acoustics, M.F. Crocker and John Wiley & Sons, Inc. (ed), pp. 591-596, 1997.
[Chang-Hong98]W. Chang-Hong, Z. Min, P. Feng, Z. Xiang-Jun, and Z. Wei-Qing, "MPSK underwater acoustic communication modem," Proc. MTS Ocean Community Conf. '98, Nov. 1998.
[Chaplin90] G.F. Chaplin, "Acoustic telemetry system for real-time monitoring of the Gulf Stream path," Conf. Proc. Oceans'90, pp. 46-51, Sept. 1990.
[Chappell94] S.G. Chappell, J.C. Jalbert, P. Pietryka, and J. Duchesney, "Acoustic communication between two autonomous underwater vehicles," Proc. 1994 IEEE Symp. on Autonomous Underwater Vehicle Technology, pp. 462-469, July 1994.
[Coates93] R. Coates, "Underwater acoustic communications," Proc. Oceans'93, vol. 3, pp. 420- 425, Oct. 1993.
[Coates96] R.F.W. Coates, M. Zheng, and L. Wang, '"BASS 300 PARACOM': A "model" underwater parametric communication system," IEEE J. Oceanic Eng., vol. 21, no. 2, pp. 225-232, April 1996.
[Collins83] J.S. Collins and J.L. Galloway, "Acoustic telemetry of video information," Proc. Oceans'83, vol. 1, pp. 163-166, Aug. 1983.
[Cox93] H. Cox, H. Lai, and M. Hirano, "Reciprocity based channel compensation for wideband communications in a multipath environment," The Twenty-Seventh Asilomar Conf. On Signals, Systems and Computers, vol. 1, pp. 593-597, Nov. 1993.
[Curcio98] J.A. Curcio, F.S. Hover, and J.G. Bellingham, "CETUS: design of a production AUV," Sea Technology, pp. 10-17, Dec. 1998.
[Curtin93] T.B. Curtin, J.G. Bellingham, J. Catipovic, and D. Webb, "Autonomous oceanographic sampling networks," Oceanography, vol. 6, no. 3, pp. 86-94, 1993.
[Curtin99] T.B. Curtin and R.A. Benson, "ONR program in underwater acoustic communications," Sea Technology, vol. 40, no. 5, pp. 17-27, May 1999.
[Davies98a] J.J. Davies and S.A. Pointer, "High rate underwater acoustic communications: moving times," UDT Europe 98, pp. 26~'-276, June 1998.
[Davies98b] J.J. Davies and S.A. Pointer, "UW communication system design for severely dispersed channels," Oceans98 Conf Proc, vol. 2, pp. 1022-1027, Sept. 1998.
[Davies99] J.J. Davies and S.A. Pointer, "High data rate for doubly spread underwater acoustic channels," UDT Eruope '99 Conf. Proc, pp. 1-6, June 1999.
[Deaett90] M.A. Deaett and P.P. Audi, "Interleaver performance for FSK transmission on the acoustic fading channel," Proc. Symp. on Autonomous Underwater Vehicle Technology, pp. 313-317, June 1990.
124 Document Number 8346749 Rev. A
12 February 2001
[Duarte99] C.N. Duarte, "The distributed control of multiple autonomous vehicles for mine countermeasure in littoral waters," UDTEurope 99 Conf. Proc, pp. 247-250, June 1999.
[Dyer] I. Dyer, Class notes for subject 13.85, Fundamentals of Underwater Acoustics, Massachusetts Institute of Technology.
[Edelson98] G.S. Edelson and B.W. Gillespie, "Phase-encoded frequency-hopped signaling for underwater acoustic communications," Proc. 16th Intl. Congress on Acoustics and 135th Mtg. oftheAcoust. Soc. Am., vol. 1, pp. 313-314, June 1998.
[Egeskov94] P. Egeskov, A. Bjerrum, A. Pascoal, C. Silvestre, C. Aage, and L.W. Smitt, "Design, construction and hydrodynamic testing of the AUV MARIUS," Proc. of the 1994 Symp. Autonomous Underwater Vehicle Technology, pp. 199-207, July 1994.
[Eggen98] T.H. Eggen and G.H. Sandsmark, "High bandwidth coherent underwater acoustic communication," UDT Europe 98, pp. 277-280, June 1998.
[EggenOO] T.H. Eggen, "Phase coherent communication in the presence of ship noise," Oceans 2000MTS/IEEE Conf. Proc, vol. 2, pp. 1433-1436, Sept. 2000.
[Essebbar94] A. Essebbar, G. Loubet, and F. Vial, "Underwater acoustic channel simulations for communication," Proc. 1994 IEEE Oceans Conf, vol. 3, pp. 495-500, Sept. 1994.
[Essebbar95] A. Essebbar and E. Vercelloni, "Simulation of communication system for underwater acoustics," Oceans'95 MTS/IEEE Conf. Proc, vol. 2, pp. 1204-1207, Oct. 1995.
[Estes90] L.E. Estes, G. Fain, and P. Caron, "Description of and experimental results for a high data rate underwater acoustic telemetry link," Proc. of the Symp. on Autonomous Underwater Vehicle Technology, pp 304-312, June 1990.
[Falahati91] A. Falahati, B. Woodward, and S.C. Bateman, "Underwater acoustic channel models for 4800 b/s QPSK signals," IEEEJ. Oceanic Eng., vol. 16, no. 1, pp. 12-20, Jan. 1991.
[Feder91] M. Feder and J.A. Catipovic, "Algorithms for joint channel estimation and data recovery - application to equalization in underwater communications," IEEEJ. Oceanic Eng., vol. 16, no. 1, pp. 42-55, Jan. 1991.
[Fiore95] P. Fiore, E. Will, G. Edelson, and D. Herold, "Rapid prototyping applied to underwater acoustic modem research and development," Proc. 2nd Annual RASSP Conf, pp. 73-77, July 1995.
[Fiorillo90] M. Fiorillo, J. Irza, and I. Ekhaus, "Improved underwater acoustic communication for AUVs," Proc. of the 1990 Symp. on Autonomous Underwater Vehicle Technology, pp 289-295, June. 1990.
[Foxwell99] D. Foxwell and R. Scott, "Offboard sonar charts a fresh course for ASW," Jane's Navy International, pp. 17-25, March 1999.
125 Document Number 8346749 Rev. A
12 February 2001
[Freitag91] L.E. Freitag, J.S. Merriam, and J.A. Catipovic, "A long term deep water acoustic telemetry experiment," Proc. Oceans'91, vol. 1, pp. 254-260, Oct. 1991.
[Freitag96] L.E. Freitag, J.A. Catipovic, and R.L. Eastwood, "Acoustic communications system for the AMMT program," Oceans'96 MTS/IEEE Conf. Proc. Suppi, pp. 87-92, Sept. 1996.
[Freitag97a] L. Freitag, "Phase coherent equalization methods for complex underwater acoustic communication channels," Long Range Acoustic Communication Based on Optimal Waveform Design, Woods Hole Oceanographic Institution Tech. Rep., Sept. 1997.
[Freitag97b] L. Freitag, M. Johnson, and M. Stojanovic, "Efficient equalizer update algorithms for acoustic communication channels of varying complexity," Oceans '97 MTS/IEEE Conf. Proc, vol. 1, pp. 580-585, Oct. 1997.
[Freitag98a] L.E. Freitag, M. Grund, S. Singh, S. Smith, R. Christenson, L. Marquis, and J. Catipovic, "A bidirectional coherent acoustic communications system for underwater vehicles," Oceans'98 Conf. Proc, vol. 1, pp. 482-486, Oct. 1998.
[Freitag98b] L.E. Freitag, M. Johnson, and J Preisig, "Acoustic communications for UUVs," Sea Technology, pp. 65-71, June 1998.
[FreitagOOa] L. Freitag, M. Johnson, M. Stojanovic, D. Nagle, and J. Catipovic, "Survey and analysis of underwater acoustic channels for coherent communication in the medium-frequency band," Oceans 2000 MTS/IEEE Conf. Proc, vol. 1, pp. 131-138, Sept. 2000.
[FreitagOOb] L. Freitag, M. Grand, S. Singh, and M. Johnson, "Acoustic communication in very shallow water: results from the 1999 AUV fest," Oceans 2000 MTS/IEEE Conf. Proc, vol. 3, pp. 2155-2160, Sept. 2000.
[Galloway85] J.L. Galloway, J.S. Collins, and M.R. Balderson, "Auto aligning system for narrow beam acoustic telemetry," Oceans'85 Conf. Record, vol. 1, pp. 490-493, Nov. 1985.
[Galvin94] R. Galvin and R.F.W. Coates, "Analysis of the performance of an underwater acoustic communications system and comparison with a stochastic model," Oceans'94 Conf. Proc, vol. 3, pp. 478-482, Sept. 1994.
[Galvin96] R. Galvin, R.F.W. Coates, L.S. Wang, and R. Stoner, "Measured channel sounding characteristics and their relationship with the performance of a parametric communication system," Oceans'96 MTS/IEEE Conf. Proc, vol. 2, pp. 826-831, Sept. 1996.
[Garrod81] D. Garrod, "Applications of MFSK acoustic communication systems," Proc. Oceans'81, pp. 67-71, 1981.
[Garrood82] D.J. Garrood and N.D. Miller, "Acoustic telemetry for underwater control," Oceans '82 Conf. Record, pp. 111-114, Sept. 1982.
[Geller96] B. Geller, V. Capellano, J-M. Brossier, A. Essebbar, and G. Jourdain, "Equalizer for video rate transmission in multipath underwater communications," IEEE J Oceanic Eng., vol. 21, no. 2, pp. 150-155, Apr. 1996.
126 Document Number 8346749 Rev. A
12 February 2001
[Geng95] X. Geng and A. Zielinski, "An eigenpath underwater acoustic communication channel model," Oceans'95MTS/IEEE Conf. Proc, vol. 2, pp. 1189-1196, Oct. 1995.
[Gillespie97] B. Gillespie, G. Edelson, J.A. Catipovic, et. al., "System analysis of acoustic communications networks for distributed undersea surveillance," Sanders, A Lockheed Martin Company, Final Report (Contract # N66001-96-C-6002), June 1997.
[Gomes99] J. Gomes and V. Barroso, "A matched field processing approach to underwater acoustic communication," Oceans'99 MTS/IEEE Conf. Proc, vol. 2, pp. 991-995, Sept. 1999.
[GomesOOa] J. Gomes and V. Barroso, "Acoustic channel equalization results for the ASMOV high- speed coherent data link," Oceans 2000 MTS/IEEE Conf. Proc, vol. 2, pp. 1437-1442, Sept. 2000.
[GomesOOb] J. Gomes, V. Barroso, G. Ayela, and P. Coince, "An overview of the ASMOV acoustic communication system," Oceans 2000 MTS/IEEE Conf. Proc, vol. 3, pp. 1633-1637, Sept. 2000.
[Gray94] S.D. Gray, J.C. Preisig, and D. Brady, "Adaptive multiuser detection in dispersive channels with array observations," Conf Record of 28th Asilomar Conf. on Signals, Systems and Computers, pp. 801-805, Oct. 1994.
[Gray97] S.D. Gray, J.C. Preisig, and D. Brady, "Multiuser detection in a horizontal underwater acoustic channel using array observations," IEEE Trans, on Sig. Proc, vol. 45, no. 1, pp. 148-160, Jan. 1997.
[Green97] M.D. Green and J.A. Rice, "Error correction coding for communication in adverse underwater channels," Oceans'97 MTS/IEEE Conf. Proc, vol. 2, pp. 854-861, Oct. 1997.
[Green98a] D. Green and J.A. Rice, "Low-probability-of-detection communications in adverse underwater acoustic channels," Proc. 16th Intl. Congress on Acoustics and 135th Mtg. of the Acoust. Soc Am., vol. 1, pp. 307-308, June 1998.
[Green98b] M.D. Green and J.A. Rice, "Handshake protocols and adaptive modulation for underwater communications networks," Oceans'98 Conf Proc, vol. 1, pp. 487-491, Sept. 1998.
[Green98c] D. Green, J.A. Rice, and S. Merriam, "Implementing an undersea wireless network using COTS acoustic modems," Proc. MTS Ocean Community Conf. '98, vol. 2, pp. 1027- 1031, Nov. 1998.
[GreenOO] M.D. Green and J.A. Rice, "Channel-tolerant FH-MFSK acoustic signaling for undersea communications and networks," IEEEJ. Oceanic Eng., vol. 25, no. 1, pp. 28-39, Jan. 2000.
[Hakizimana87]G. Hakizimana, G. Jourdain, and G. Loubet, "Communication through the underwater channel the multipath problem and the coding approach," IEEE Pacific Rim Conf. on Communications, Computesr, and Signal Processing, pp. 351-354, June 1987.
127 Document Number 8346749 Rev. A
12 February 2001
[Hakizimana95]G. Hakizimana, G. Jourdain, and G. Loubet, "A new M-ary wideband communication system with application to multipath channels-part II: experimental results," IEEE Trans. Comm., vol. 43, no. 5, pp. 1894-1897, May 1995.
[Hardy87] J.S. Hardy and J.S. Collins, "Factors affecting the design of a high-performance underwater acoustic telemetry system," IEEE Pacific Rim Conf. on Communications, Computers and Signal Processing, pp. 346-350, June 1987.
[Haykin96] S. Haykin, Adaptive Filter Theory, third edition, Prentice-Hall, Inc., Upper Saddle River, 1996.
[Henderson94] G.B. Henderson, A. Tweedy, G.S. Howe, O. Hinton, and A.E. Adams, "Investigation of adaptive beamformer performance and experimental verification of applications in high data rate digital underwater communications," Proc. 1994 IEEE Oceans Conf., vol. 1, pp. 296-301, Sept. 1994.
[Herold94] D. Herold and M. Johnson, "A compact underwater acoustic modem," Proc. 1994 IEEE Symp. on Autonomous Underwater Vehicle Technology, pp. 393-398, July 1994.
[Herold95] D. Herold, P. Fiore, E. Will, and G. Edelson, "The application of rapid prototyping to underwater acoustic modem research and development," Proc. Sixth Intl. Conf. on Rapid Sys. Prototyping, pp. 68-74, June 1995.
[Herold97] D. Herold, M. Grund, M. Johnson, and K. von der Heydt, "An integrated acoustic remote sensing and communications system for tidal front mapping," Oceans'97 MTS/IEEE Conf. Proc, vol. 1, pp. 736-742, Oct. 1997.
[Hou97] B. Hou and B. Woodward, "Performance of spatial diversity for underwater communications," 7th Intl. Conf. on Electronic Eng. in Oceanography, pp. 183-185, June 1997.
[Hou99] B. Hou, O.R. Hinton, A.E. Adams, and B.S. Sharif, "An time-domain-oriented multiple access protocol for underwater acoustic network communications," Oceans'99 MTS/IEEE Conf. Proc, vol. 2, pp. 585-589, Sept. 1999.
[Howe92] G.S. Howe, O.R. Hinton, A.E. Adams, and A.G.J. Holt, "Acoustic burst transmission of high rate data through shallow underwater channels," Electronics Letters, vol. 28, no. 5, pp. 449-451, Feb. 1992.
[Howe94] G.S. Howe, P.S.D. Tarbit, O.R. Hinton, B.S. Sharif, and A.E. Adams, "Sub-sea acoustic remote communications utilizing an adaptive receiving beamformer for multipath suppression," Proc. 1994 IEEE Oceans Conf, vol.1, pp. 313-316, Sept. 1994.
[Jarvis84] F.C. Jarvis, "Description of a secure reliable acoustic system for use on offshore oil blowout preventer (BOP) or wellhead control," IEEE J. Oceanic Eng., vol. OE-9, no. 4, pp. 253-258, Oct. 1984.
[Jarvis95] S.M. Jarvis and N.A. Pendergrass, "Implementation of a multichannel decision feedback equalizer for shallow water acoustic telemetry using a stabilized fast transversal filters algorithm," Oceans'95 MTS/IEEE Conf Proc, Oct. 1995.
128 Document Number 8346749 Rev. A
12 February 2001
[Johnson94] M. Johnson, D. Herold, and J. Catipovic, "The design and performance of a compact underwater acoustic network node," Proc. 1994 IEEE Oceans Conf., vol. 3, pp. 467-471, Sept. 1994.
[Johnson95] M. Johnson, D. Brady, and M. Grand, "Reducing the computational requirements of adaptive equalization in underwater acoustic communications," Oceans '95 MTS/IEEE Conf. Proc, vol. 3, pp. 1405-1410, Oct. 1995.
[Johnson97] M. Johnson, L. Freitag , and M. Stojanovic, "Improved Doppler tracking and correction for underwater acoustic communications," Proc. 1997 IEEE ICASSP, vol. 1, pp. 575- 578, Apr. 1997.
[Johnson99] J. Johnson, J. Preisig, L. Freitag, and M. Stojanovic, "FSK and PSK performance of the utility acoustic modem," Oceans'99 MTS/IEEE Conf. Proc, vol. 3, p. 1512, Sept. 1999.
[Jones97] J.C. Jones, A. DiMeglio, L.S. Wang, R.F.W. Coates, A. Tedeschi, and R.J. Stoner, 'The design and testing of a DSP, half-duplex, vertical, DPSK communication link," Oceans'97MTS/IEEE Conf. Proc, vol. 1, pp. 259-266, Oct. 1997.
[Kearney84] P.O. Kearney and CA. Laufer, "SONARLINK-A deep ocean, high data rate, adaptive- telemetry system," Proc. Oceans'84, pp. 49-54, 1984.
[Kilfoyle98a] D.B. Kilfoyle, "Experimental performance of concatenated coding in shallow water channels," Proc. 16th Intl. Congress on Acoustics and 135th Mtg. of the Acoust. Soc Am., vol. 1, pp. 305-306, June 1998.
[Kilfoyle98b] D.B. Kilfoyle and A.B. Baggeroer, "Underwater acoustic telemetry: looking at the last decade and the next," Proc. MTS Ocean Community Conf. '98, Nov. 1998.
[Kilfoyle99] D.B. Kilfoyle and A.B. Baggeroer, "Research directions in underwater acoustic telemetry," Sea Technology, vol. 40, no. 5, pp. 10-15, May 1999.
[KilfoyleOO] D.B. Kilfoyle, "Spatial modulation in the underwater acoustic communication channel," Ph.D. Thesis, MJT, June 2000.
[Kim96] J.H. Kim B.A. Moran, J.J. Leonard, J.G. Bellingham, and S.T. Tuohy, "Experiments in remote monitoring and control of autonomous underwater vehicles," Oceans'96 MTS/IEEE Conference Proc, pp. 411-416, Sept. 1996.
[Kocic94a] M. Kocic and D. Brady, "Complexity-constrained LS estimation for sparse systems," Proc. 1994 IEEE Intl. Symp. on Info. Theory, p. 116, June 1994.
[Kocic94b] M. Kocic, D. Brady, and S. Merriam, "Reduced-complexity RLS estimation for shallow- water channels," Proc. 1994 IEEE Symp. on Autonomous Underwater Vehicle Technology, pp. 165-170, July 1994.
[Kocic95] M. Kocic, D. Brady, and M. Stojanovic, "Sparse equalization for real-time digital underwater acoustic communications," Oceans'95 Conf. Record, vol. 3, pp. 1417-1422, Oct. 1995.
129 Document Number 8346749 Rev. A
12 February 2001
[Kojima96] J. Kojima and Y. Shirasaki, "Acoustic video-signal transmission system for autonomous underwater vehicle," Proc. of the 1996 Symp. on Autonomous Underwater Vehicle Technology, pp. 348-353, June 1996.
[Kojima97] J. Kojima, Y. Kato, K. Asakawa, S. Matumoto, S. Takagi, and N. Kato, "Development of autonomous underwater vehicle 'Aqua Explorer 2' for inspection of underwater cables," Oceans'97MTS/IEEE Conf. Proc, pp.1007-1012, Oct. 1997.
[Kuchpil97] C. Kuchpil, A.L.F. Xavier, J.A.P. da Silva, and M.R.B.P.L. Jimenez, "Autonomous control system for offshore oil exploitation using digital acoustic communication," Oceans'97 MTS/IEEE Conf. Proc, vol. 2., pp. 849-852, Oct. 1997.
[KujawaOO] W. Kujawa, C. Loeffler, R. Nelson, et al., Ed. "MCM future systems study workbook," ver. 2.3, Oct. 2000.
[Kwon86] H. M. Kwon and T. G. Birdsall, "Channel capacity in bits per joule," IEEE J. Oceanic Eng., vol. OE-11, no. 1, pp. 97-99, Jan. 1986.
[Labat98] J. Labat, J. Trubuil, and M. Nicot, "Blind decision feedback equalization application to underwater acoustic communication systems," OceansV8 Conf. Proc, vol. 2, pp. 805- 809, Sept. 1998.
[Lam98] W. K. Lam, R. F. Ormondroyd, and J.J. Davies, "A frequency domain adaptive coded decision feedback equalizer for a broadband UWA COFDM system," Oceans'98 MTS/IEEE Conf. Proc, vol 2, pp. 794-799, Sept. 1998.
[LeBlanc96] L. LeBlanc and P-P. Beaujean, "Multi-frequency shift key and differential phase shift key for acoustic modem," Proc. 1996 Symp. on Autonomous Underwater Vehicle Technology, pp. 160-166, June 1996.
[LeBlanc98] L.R. LeBlanc and P-P.J. Beaujean, "Adaptive beamformer for communication in shallow water," Proc. MTS Ocean Community Conf. '98, Nov. 1998.
[LeBlanc99] L.R. LeBlanc, P-P. Beaujean, M. Singer, C. Boubli, and G.T. Strutt, "Chirp FSK modem for high reliability communication in shallow water," Oceans'99 MTS/IEEE Conf. Proc, vol. 1, pp. 222-227, Sept. 1999.
[LeBlancOOa] L.R. LeBlanc and P.J. Beaujean, "Spatio-temporal processing of coherent acoustic communication data in shallow water," IEEE J. Oceanic Eng., vol. 25, no. 1, pp. 40-51, Jan. 2000.
[LeBlancOOb] L.R. LeBlanc, M. Singer, P-P. Beaujean, C. Boubli, and J.R. Alleyne, "Improved chirp FSK modem for high reliability communications in shallow water," Oceans 2000 MTS/IEEE Conf Proc, vol.1, pp. 601-603, Sept. 2000.
[Leinhos96] H. Leinhos, "Capacity calculations for rapidly fading communications channels," IEEE J. Oceanic Eng., vol. 21, no. 2, pp. 137-142, April 1996.
130 Document Number 8346749 Rev. A
12 February 2001
[Lo89] E. Lo, R.H.S. Hardy, C. Anderson, and J.S. Bird, "Acoustic test bed for underwater communications: system modeling and performance," IEEE Pacific Rim Conf. on Communications, Computers and Signal Processing, pp. 548-552, June 1989.
[Lopez99] M.J. Lopez, A.C. Singer, S.L. Whitney, and G.S. Edelson, "A DFE coefficient placement algorithm for underwater digital acoustic communications," Oceans "99 MTS/IEEE Conf. Proc, vol. 2, pp. 996-1001, Sept. 1999.
[Loubet95] G. Loubet and E. Petit, "Underwater acoustic communications with Viterbi detector," Oceans'95 Conf. Record, vol. 1, pp. 600-603, Oct. 1995.
[Loubet97] G. Loubet, V. Capellano, and R. Filipiak, "Underwater spread-spectrum communications," Oceans'97IEEE/MTS Conf. Proc, vol. 1, pp 574-579, Oct. 1997.
[Mackelburg81]G.R. Mackelburg, SJ. Watson, and A. Gordon, "Benthic 4800 bits/sec acoustic telemetry," Proc. Oceans'81, pp. 72-78,1981.
[Mackelburg91]G.R. Mackelburg, "Acoustic data links for UUVs," Proc. Oceans'91, vol. 3, pp. 1400- 1406, Oct. 1991.
[Matthews98] A. D. Matthews and R. L .Higginbotham, "Doppler tolerant link (DTL)," Proc. 16th Intl. Congress on Acoustics and 135th Mtg. oftheAcoust. Soc. Am., vol. 1, pp.317-318, June 1998.
[McDonald98a] V.K. McDonald, J.A. Rice, and C.L. Fletcher, "Telesonar testbed engineering and sea trials," Proc. MTS Ocean Community Conf. '98, vol. 2, pp. 1001-1006, Nov. 1998.
[McDonald98b]V.K. McDonald, J.A. Rice, and C.L. Fletcher, "An underwater communication testbed for telesonar RDT&E," Oceans'98 Conf. Proc, vol.2, pp. 639-643, Sept. 1998.
[McDonald99] V.K. McDonald and J.A. Rice, 'Telesonar testbed - advances in undersea wireless communications," Sea Technology, pp. 17-23, Feb. 1999.
[Merriam93] S. Merriam and D. Porta, "DSP-based acoustic telemetry modems," Sea Technology, pp. 24-30, May 1993.
[Mindell93] D.A. Mindell, D.R. Yoerger, L.E. Freitag, L.L. Whitcomb, and R.L. Eastwood, "JasonTalk: a standard ROV vehicle control system," Oceans'93 Proc, vol. 3, pp. 253- 258, 1993.
[Morgera79] S. D. Morgera, "High data rate acoustic telemetry," Proc. Oceans'79, pp. 130-136, Sept. 1979.
[Morgera80] S. D. Morgera, "Multiple terminal acoustic commuications system design," IEEE J. Oceanic Eng., vol. OE5, no. 3, pp. 199-204, July 1980.
[Morozov98] A.K. Morozov and V.A. Derevnin, "Oceanology controlled buoyancy buoys with digital acoustic communication," Proc. MTS Ocean Community Conf. '98, Nov. 1998.
131 Document Number 8346749 Rev. A
12 February 2001
[Murshid99] S.H. Murshid and F.M. Caimi, "Ocean acoustic impulse response measurement and characterization for ACOMMS performance predication," Oceans '99 MTS/IEEE Conf. Proc, vol. 2, pp. 601-604, Sept. 1999.
[Nation98] R. Nation, D. Herold, G. Edelson, and E. Will, "Implementation of real-time acoustic communications systems," Proc. 16th Intl. Congress on Acoustics and 135th Mtg. of the Acoust. Soc. Am., vol. 2, pp. 939-940, June 1998.
[Neasham96] J.A. Neasham, D. Thompson, A.D. Tweedy, M.A. Lawlor, O.R. Hinton, A.E. Adams, and B.S. Sharif, "Combined equalisation and beamforming to achieve 20 kbits/s acoustic telemetry for ROVs," Oceans'96 MTS/IEEE Conf. Proc, pp. 988-993, Sept. 1996.
[01iveira98] P. Oliveira, C. Silvestre, P. Aguiar, and A. Pascoal, "Guidance and control of the SIRENE underwater vehicle: from system design to tests at sea," Oceans'98 MTS/IEEE Conf. Proc, vol. 2, pp. 1043-1048, Sept. 1998.
[Owen94] R.H. Owen, B.V. Smith, and R.F.W. Coates, "An experimental study of rough surface scattering and its effects on communication coherence," Proc. 1994 IEEE Oceans Conf, vol. 3, pp. 483-485, Sept. 1994.
[Paglia96] J.G. Paglia and W.F. Wyman, "DARPA's autonomous minehunting and mapping technologies (AMMT) program, an overview," Oceans'96 MTS/IEEE Conf. Proc, pp. 794-799, Sept. 1996.
[Pappas91] G. Pappas, W. Shotts, M. O'Brien, and W. Wyman, 'The DARPA/Navy unmanned undersea vehicle program," Unmanned Systems, pp. 24-30, Spring 1991.
[Park86] J.H. Park, Jr., "LPI techniques in the underwater acoustic channel," Proc. IEEE Military Commun. Conf,pp. 10.5.1-10.5.5, 1986.
[Pietryka95] P. Pietryka and G.F. Chaplin, "Low cost link for acoustic telemetry," Proc. IEEE Fifth Working Conf. on Current Measurement, pp. 211-215, Feb. 1995.
[Pointer99] S.A. Pointer and J.J. Davies, "High data rate acoustic communications for doubly spread underwater acoustic channels," UDT Europe 99, June 1999.
[Porta98] D. Porta, "Underwater acoustic communications," Sea Technology, pp. 49-55, Feb. 1998.
[Powell95] D.G. Powell and A.G.J. Holt, "Hardware and software implementation of a hardware efficient beamformer for underwater acoustic communications," Int. J. Electronics, vol. 78, no. 1, pp. 77-100, Jan. 1995.
[Preisig95] J.C. Preisig, "Reduced complexity adaptive array processing for multi-user communications," Oceans'95 Conf. Proc, vol. 3., pp. 1392-1396, Oct. 1995.
[Preisig96] J. Preisig and D. Brady, "Adaptive equalization for underwater wireless communications," The 1996 International Conf. On Acoustics, Speech, and Signal Processing Conf Proc, pp. 1077-1080, May 1996.
132 Document Number 8346749 Rev. A
12 February 2001
[Preisig98] J.C. Preisig, "Adaptive array processing for acoustic communications through time- varying ocean channels," Proc. 16lh Intl. Congress on Acoutics and 135th Mtg. of the Acoust. Soc. Am., vol. 1, pp. 311-312, June 1998.
[PreisigOO] J.C. Preisig, "Incoherent techniques for underwater acoustic communications," Oceans 2000MTS/IEEE Conf. Proc, supplemental article, Sept. 2000.
[Proakis91a] J.G. Proakis, "Adaptive equalization for acoustic telemetry channels," IEEE J. Oceanic Eng., vol. 16, no. 1, pp. 21-31, Jan. 1991.
[Proakis91b] J.G. Proakis, "Coded modulation for digital communications over Rayleigh fading channels," IEEEJ. Oceanic Eng., vol. 16, no. 1, pp. 66-73, Jan. 1991.
[Proakis94] J.G. Proakis, M. Stojanovic, and J.A. Catipovic, "Adaptive equalization algorithms for high rate underwater acoustic communications," Proc. 1994 Symp. on Autonomous Underwater Vehicle Technology, pp. 157-164, July 1994.
[Proakis95] J.G. Proakis, Digital Communications, third edition, McGraw-Hill, Inc., New York, 1995.
[Proakis98] J.G. Proakis, M. Stojanovic, and J.A. Rice, "Design of a communication network for shallow water acoustic modems," Proc. MTS Ocean Community Conf. '98, vol. 2, pp. 1150-1159, Nov. 1998.
[Quazi82] A.H. Quazi and W.L. Konrad, "Underwater acoustic communications," IEEE Comm. Mag., vol. 20, no. 2, pp. 24-30, March 1982.
[Randell93] C.J. Randell and J.S. Collins, "Auto-alignment of acoustic transducers in a multipath environment," IEEE Pacific Rim Conf. on Communications, Computers and Signal Processing, vol. 2, pp. 714-717, May 1993.
[Regan96] R.A. Regan, "Autonomous minehunting and mapping technologies program autonomous maneuvering capabilities," Oceans'96 MTS/IEEE Conf. Proc, pp. 807-812, Sept. 1996.
[Rice96] J.A. Rice and K.E. Rogers, "Directions in littoral undersea wireless telemetry," TTCP Subgroup-G Symposium on Shallow-Water Undersea Warfare, Oct. 1996.
[Rice97] J.A. Rice, "Acoustic signal dispersion and distortion by shallow undersea transmission channels," High Frequency Acoustics in Shallow Water Proc. Conf, pp. 436-442, July 1997.
[Rice98a] J.A. Rice and D. Green, "Adaptive modulation for undersea acoustic modems," Proc MTS Ocean Community Conf '98, vol. 2, pp. 850-855, Nov. 1998.
[Rice98b] J.A. Rice and R.C. Shockley, "Battery-energy estimates for telesonar modems in a notional undersea network," Proc. MTS Ocean Community Conf. '98, vol. 2, pp. 1007- 1015, Nov. 1998.
[Rice99] J.A. Rice, V.K. McDonald, D. Green, and D. Porta, "Adaptive modulation for undersea acoustic telemetry," Sea Technology, vol. 40, no. 5, pp. 29-36, May 1999.
133 Document Number 8346749 Rev. A
12 February 2001
[Ritcey95] J.A. Ritcey and K.R. Griep, "Code shift keyed spread spectrum for ocean acoustic telemetry," Oceans'95MTS/1EEE Conf. Proc, pp. 1386-1391, Oct. 1995.
[Sanchez99] C. Sanchez, P. Koski, and D. Brady, "Sequence position modulation for surf-zone underwater acoustic communications," Proc. Of the 11th Symposium on Unmanned Untethered Submersible Technology, pp. 270-279, Aug. 1999.
[Scally84] D.R. Scally, D.E. Ryerson, and T.L. Towles, "Acoustic telemetry in an automated system for long-term ocean data in real time," Oceans'84 Conf. Record, vol. 2, pp.748-752, Sept. 1984.
[Schmidt96] H. Schmidt, J. Bellingham, M. Johnson, D. Herold, D. Farmer, and R. Pawlowicz, "Real- time frontal mapping with AUVs in a coastal environment," Oceans '96 MTS/1EEE Conf. Proc, pp. 1094-1098, Sept. 1996.
[Scussel97] K.E. Scussel, J.A. Rice, and S. Merriam, "A new MFSK acoustic modem for operation in adverse underwater channels," Oceans'97 MTS/1EEE Conf. Proc, vol. 1, pp. 247-254, Oct. 1997.
[Sharif97a] B.S. Sharif, J. Neasham, D. Thompson, O.R. Hinton, and A.E. Adams, "A blind multichannel combiner for long range underwater communications," Proc 1997 IEEE ICASSP, vol. 1, pp. 579-582, April 1997.
[Sharif97b] B.S. Sharif, O.R. Hinton, A.E. Adams, and J.A. Neasham, "Adaptive receiver structures for underwater acoustic communications," IEE Colloquium on Adapt. Sig. Proc. for Mobile Comm. Sys., pp. 11/1-6, Oct. 1997.
[Sharif99] B.S. Sharif, J. Neasham, O.R. Hinton, and A.E. Adams, "Doppler compensation for underwater acoustic communications," Oceans'99 MTS/1EEE Conf Proc, vol. 1, pp. 216-221, Sept. 1999.
[Singh96] H. Singh, J. Catipovic, R. Eastwood, L. Freitag, H. Henriksen, F. Hover, and D. Yoerger, "An integrated approach to multiple AUV communications, navigation and docking," Oceans'96MTS/IEEE Conference Proc, vol. 1, pp-59-64, Sept. 1996.
[Singh97] H. Singh, D. Yoerger, and A. Bradley, "Issues in AUV design and deployment for oceanographic research," Proc. of the 1997 IEEE Intl. Conf. on Robotics and Automation, vol. 3, pp. 1857-1862, April 1997.
[Smith91] J.T. Smith, "Adaptive diversity enhances undersea UUV communications," Sea Technology, vol. 32, no. 9, pp. 79-81, Sept. 1991.
[Smith93] B.G. Smith and F.J. Lazare, "Robust underwater acoustic telemetry," GEC Review, vol. 8, no. 2, pp. 110-117,1993.
[Smith94] S.M. Smith and S.E. Dunn, "The Ocean Voyager II: an AUV designed for coastal oceanography," Proc. 1994 Symp. on Autonomous Underwater Vehicle Technology, pp. 139-147, July 1994.
134 Document Number 8346749 Rev. A
12 February 2001
[Smith97] S.M. Smith, J.C. Park, and A. Neel "A peer-to-peer communication protocol for underwater acoustic communication," Oceans 97 MTS/IEEE Conf. Proc, vol. 1, pp. 268- 272, Oct. 1997.
[Solaiman88] B. Solaiman, A. Glavieux, and A. Hillion, "Performance of a slowly frequency hopping BFSK system using convolutional coding in underwater acoustic media," ICASSP'88 Proc, vol. 5, pp 2721-2724, 1988.
[Song96a] B-G. Song and J.A. Ritcey, "Spatial diversity equalization for MMO ocean acoustic communication channels," IEEEJ. Oceanic Eng., vol. 21, no. 4, pp. 505-512, Oct. 1996.
[Song96b] B-G. Song and J. A. Ritcey, "Overlaying multiple users in acoustic communications using MMO spatial diversity equalization," Conf. Record 29th Asilomar Conf. on Sigs., Systs., and Computers, pp. 280-284, Nov. 1996.
[Sozer99] E.M. Sozer, J.G. Proakis, M. Stojanovic, J.A. Rice, A. Benson, and M. Hatch, "Direct sequency spread spectrum based modem for under water acoustic communication and channel measurements," Oceans'99 MTS/IEEE Conf. Proc, vol. 1, pp. 228-233, Sept. 1999.
[SozerOO] E.M. Sozer, M. Stojanovic, and J.G. Proakis, "Underwater acoustic networks," IEEE J. Oceanic Eng., vol. 25, no. 1., pp. 72-83, Jan. 2000.
[Stojanovic92] M. Stojanovic, J. Catipovic, and J. G. Proakis, "A comparison of receiver design and performance for three types of underwater acoustic telemetry channels," J. Acoust. Soc. Am., vol. 92, no. 4, pt. 2, p. 2322, Oct. 1992.
[Stojanovic93a]M. Stojanovic, J.A. Catipovic, and J.G. Proakis, "Adaptive receivers for underwater communications: their relation to beamforming and diversity combining," Proc. COMCON 4, June 1993.
[Stojanovic93b]M. Stojanovic, J. Catipovic, and J.G. Proakis, "Adaptive multichannel combining and equalization for underwater acoustic communications," J. Acoust. Soc. Am., 94 (3), pp. 1621-1631, Sept. 1993.
[Stojanovic93c] M. Stojanovic, J.A. Catipovic, and J.G. Proakis, "Reduced-complexity simultaneous beamforming and equalization for underwater acoustic communications," Proc Oceans'93, vol. 3, pp. 426-431, Oct. 1993.
[Stojanovic94a] M. Stojanovic, J.A. Catipovic, and J.G. Proakis, "Phase-coherent digital communications for underwater acoustic channels," IEEEJ. Oceanic Eng., vol. 19, no. 1, pp. 100-111, Jan. 1994.
[Stojanovic94b]M. Stojanovic, Z. Zvonar, J.A. Catipovic, and J.G. Proakis, "Spatial processing of broadband underwater acoustic communication signals in the presence of co-channel interference," Oceans'94 Proc, vol. 1, pp. 286-291, Sept. 1994.
135 Document Number 8346749 Rev. A
12 February 2001
[Stojanovic94c] M. Stojanovic and Z. Zvonar, "Adaptive spatial/temporal multiuser receivers for time- varying channels with severe ISI," Proc. 2#h Annual Conf. On Inf. Sciences and Systems, pp. 127-133, March 1994.
[Stojanovic95a]M. Stojanovic, J.G. Proakis, and J.A. Catipovic, "Analysis of the impact of channel estimation errors on the performance of a decision-feedback equalizer in fading multipath channels," IEEE Trans. Comm., vol. 43, no. 2/3/4, pp. 877-886, Feb./Mar./Apr. 1995.
[Stojanovic95b]M. Stojanovic, "Underwater acoustic communications," Proc. IEEE Electro Int., pp. 435-440, June 1995.
[Stojanovic95c] M. Stojanovic, J.A. Catipovic, and J.G. Proakis, "Reduced-complexity spatial and temporal processing of underwater acoustic communication signals," /. Acoust. Soc. Am., vol. 98, no. 2, pp. 961-972, Aug. 1995.
[Stojanovic96a] M. Stojanovic, "Recent advances in high-speed underwater acoustic communications," IEEEJ. Oceanic Eng., vol. 21, no. 2, pp. 125-136, Apr. 1996.
[Stojanovic96b]M. Stojanovic and Z. Zvonar, "Multichannel processing of broad-band multiuser commmunication signals in shallow water acoustic channels," IEEEJ. Oceanic Eng., vol. 21, no. 2, pp. 156-166, Apr. 1996.
[Stojanovic96c]M. Stojanovic, J.G. Proakis, and J.A. Catipovic, "Performance of high-rate adaptive equalization on a shallow water acoustic channel," J. Acoust. Soc. Am., vol. 100, no. 4, pp. 2213-2219, Oct 1996.
[Stojanovic98] M. Stojanovic, J.G. Proakis, J.A. Rice, and M.D. Green, "Spread spectrum underwater acoustic telemetry," Oceans'98 Conf. Proc, vol. 2, pp. 650-654, Sept. 1998.
[Stojanovic99] M. Stojanovic, L. Freitag, and M. Johnson, "Channel-estimation-based adaptive equalization of underwater acoustic signals," Oceans'99 MTS/IEEE Conf. Proc, vol. 2, pp. 590-595, Sept. 1999.
[Storkersen98] N. Storkersen, J. Kristensen, A. Indreeide, J. Seim, and T. Glancy, "Hugin - UUV for seabed surveying," Sea Technology, pp. 99-104, Feb. 1998.
[Subramaniam98]L.V. Subramaniam, B.S. Rajan, and R. Bahl, "Trellis coded modulation schemes for underwater acoustic communications," Oceans'98 Conf. Proc, vol. 2, pp. 800-804, Sept. 1998.
[Talavage94] J.L. Talavage, T.E. Thiel, and D. Brady, "An efficient store-and-forward protocol for a shallow-water acoustic local area network," Oceans'94 Proc, vol. 1, pp. 883-888, Sept. 1994.
[Thomas97] H. Thomas and E. Petit, "From autonomous underwater vehicles (AUV's) to supervised underwater vehicles (SUV's)," Oceans'97MTS/IEEE Conf. Proc, pp. 875-887, Oct. 1997.
136 Document Number 8346749 Rev. A
12 February 2001
[Thompson96] D. Thompson, J. Neasham, B. S. Sharif, O. R. Hinton, A. E. Adams, A. D. Tweedy, and M. A. Lawlor, "Performance of coherent PSK receivers using adaptive combining, beamforming and equalisation in 50km underwater acoustic channels," Oceans'96 MTS/1EEE Conf. Proc, Sept. 1996.
[Thorleifson97] J.M. Thorleifson, T.C. Davies, M.R. Black, D.A. Hopkin, R.I. Verrall, A. Pope, I. Monteith, V. Den Hertog, and B. Butler, 'The Theseus autonomous underwater vehicle, a Canadian success story," Oceans'97 MTS/IEEE Conf. Proc, vol. 2, pp. 1001-1006, Oct. 1997.
[Travis94] J. Travis, "Dialing up undersea data - long distance," Science, vol. 263, pp. 1223-1224, March 1994.
[Tsimenidis99] C.C. Tsimenidis, O.R. Hinton, B.S. Sharif, and A.E. Adams, "Access (DS-CDMA) receiver for a shallow-water asynchronous multiuser network," Oceans'99 MTS/IEEE Conf. Proc, vol. 2, pp. 596-600, Sept. 1999.
[Tubridy98] L. Tubridy and B. Blumenthal, "Tactical oceanography in mine countermeasures," U.S. Navy J. of Underwater Acoustics, vol. 48, no. 3, pp. 529-538, July 1998.
[Turner94] E.H. Turner, S.G. Chappell, S.A. Valcourt, and MJ. Dempsey, "COLA: A language to support communication between multiple cooperating vehicles," Proc. of the 1994 Symp. on Autonomous Underwater Vehicle Technology, pp. 309-316, July 1994.
[vanGijzenOO] M.B. van Gijzen and P. A. van Walree, "Shallow-water acoustic communication with high bit rate BPSK signals," Oceans 2000 MTS/IEEE Conf. Proc, vol. 3, pp. 1621-1624, Sept. 2000.
[vonderHeydt98]K. von der Heydt, D. Frye, and M. Johnson, "A moored system for data telemetry and control of autonomous underwater vehicles," Proc. MTS Ocean Community Conf. '98, Nov. 1998.
[Vukadin91] P. Vukadin and G. Hudec, "Acoustic telemetry system for underwater control," IEEE J. Oceanic Eng., vol. 16, no. 1, pp. 142-145, Jan. 1991.
[WaldhorstOO] A. Waldhorst, R. Weber, and J. Böhme, "A blind receiver for digital communications in shallow water," Oceans 2000 MTS/IEEE Conf. Proc, vol. 3, pp. 1839-1846, Sept. 2000.
[Wei-Qing98] Z. Wei-Qing, W. Chang-Hong, P. Feng, Z. Min, W. Rui, Z. Xiang-Jun, and D. Yong- Mei, "Underwater acoustic communication system of AUV," Oceans'98 Conf. Proc, vol. 1, pp. 477-481, Sept. 1998.
[Wen92] Q. Wen and J.A. Ritcey, "Spatial diversity equalization for underwater acoustic communications," The Twenty-sixth Asilomar Conf. On signals, Systems and Computers, vol. 2, pp. 1132-1136,1992.
[Wen94] Q. Wen and J.A. Ritcey, "Spatial diversity equalization applied to underwater communications," IEEE Journal of Oceanic Engineering, vol. 19, no. 2, pp. 227-241, April 1994.
137 Document Number 8346749 Rev. A
[Widmer93]
[WÜI95]
[Woodward96]
[Yang98a]
[Yang98b]
[Yoon95]
[YuOO]
[Zheng96]
[Zielinski85]
12 February 2001
H.P. Widmer, E. Lev, and J.J. Costabile, "Demonstration of a low-frequency, long-range acoustic communications system," Johns Hopkins APL Tech. Digest, vol. 14, no. 2, pp. 174-180, 1993.
E.M. Will and G.S. Edelson, "High speed acoustic data communications (U)," Proc. Eighth Sub. Tech. Symp., May 1995 (Secret).
B. Woodward and H. Sari, "Digital underwater acoustic voice communications," IEEEJ. of Oceanic Eng., vol. 21, no. 2, pp. 181-191, Apr. 1996.
T.C. Yang and A. Al-Kurd, "Environmental impact on phase coherent underwater acoustic communications," Proc. 16lh Intl. Congr Acoust. Soc. Am., vol. 1, pp. 301-302, June 1998. acoustic communications," Proc. 16th Intl. Congress on Acoustics and 135th Mtg. of the
T.C. Yang and A. Al-Kurd, "Environmental impact on phase-coherent underwater acoustic communications: a physics-based approach," U.S. Navy Journal of Underwater Acoustics, vol. 48, no. 3, pp. 441-466, July 1998.
Y. Yoon and A. Zielinski, "Simulation of he equalizer for shallow water acoustic communication," Oceans'95 MTS/IEEE Conf. Proc, pp. 1197-1203, Oct. 1995.
X. Yu, "Wireline quality underwater wireless communication using high speed acoustic modems," Oceans 2000 MTS/IEEE Conf. Proc, vol. 1, pp. 417-422, Sept. 2000.
M. Zheng, R.F.W. Coates, L. Wang, and R. Stoner, "Underwater acoustic communication utilising parametric transduction with M-ary DPSK modulation," Oceans'96 MTS/IEEE Conf. Proc. Suppi, vol. 2, pp. 1-7, Sept. 1996.
A. Zielinski and M. Caldera, "Digital acoustic communication in multipath underwater channels," Ocean Engineering and the Environment Conf. Record, vol. 2, pp. 1296-1301, Nov. 1985.
[Zielinski93] A. Zielinski, R. Coates, L. Wang, and A. Saleh, "High rate shallow water acoustic communication," Proc. Oceans'93, vol. 3, pp. 432-437, Feb. 1993.
[Zielinski95] A. Zielinski, Y. Yoon, and L. Wu, "Performance analysis of digital acoustic communication in a shallow water channel," IEEE Journal of Oceanic Engineering, vol. 20, no. 4, pp. 293-299, Oct. 1995.
[Zvonar93] Z. Zvonar, D. Brady, and J. Catipovic, "Adaptive equalization techniques for interference suppression in shallow water acoustic telemetry channels," Proc. 27th
Asilomar Conference on Signals, Systems and Computers, vol. 2, pp. 1554-1558, Nov. 1993.
[Zvonar94] Z. Zvonar, D. Brady, and J. Catipovic, "An adaptive linear multiuser receiver for deep water acoustic local area networks," Proc ICASSP, vol. 2, pp. 389-392, Apr. 1994.
[Zvonar96] Z. Zvonar, D. Brady, and J. Catipovic, "Adaptive detection for shallow-water acoustic telemetry with cochannel interference," IEEE J. Oceanic Eng., vol. 21, no. 4, pp. 528- 536, Oct. 1996.
138 Document Number 8346749 Rev. A
12 February 2001
[Zvonar97] Z. Zvonar, D. Brady, and J. Catipovic, "An adaptive decentralized multiuser receiver for deep-water acoustic telemetry," J. Acoust. Soc. Am., vol. 101, no. 4, pp. 2384-2387, Apr. 1997.
139 Document Number 8346749 Rev. A
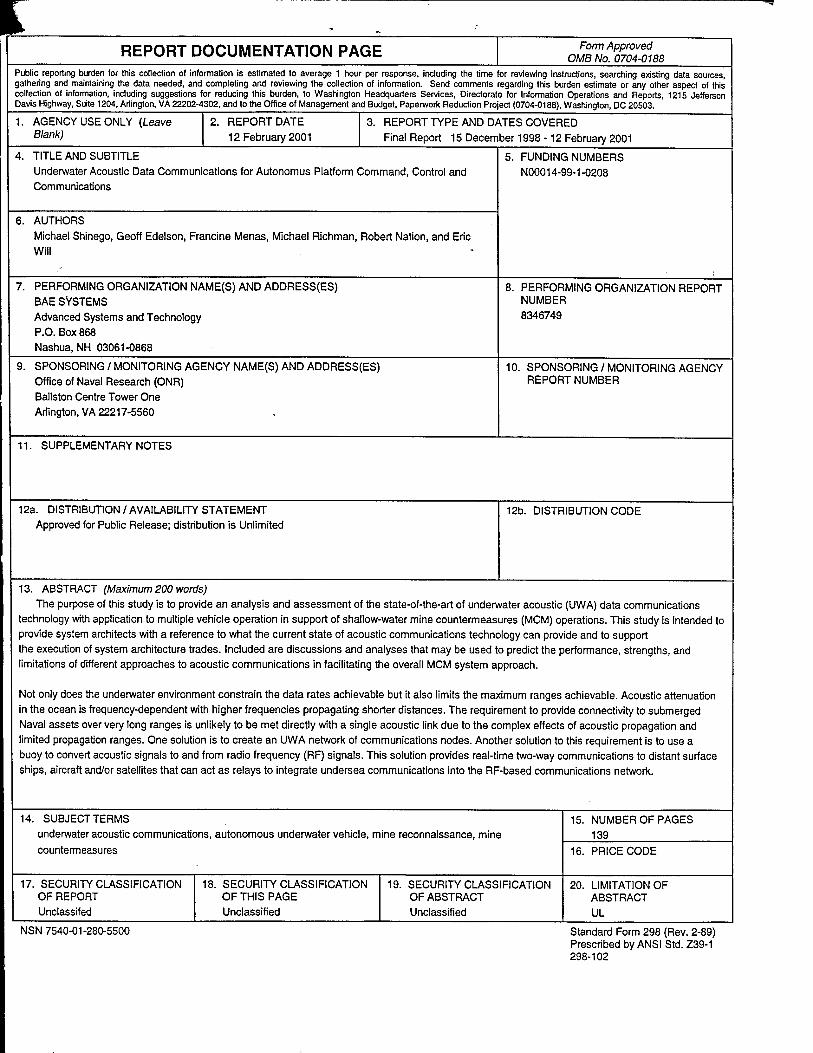
REPORT DOCUMENTATION PAGE Form Approved OMB No. 0704-0188
Public reporting burden for this collection of information is estimated to average 1 hour per response, including the time for reviewing instructions, searching existing data sources, gathering and maintaining the data needed, and completing and reviewing the collection of information. Send comments regarding this burden estimate or any other aspect of this collection of information, including suggestions for reducing this burden, to Washington Headquarters Services, Directorate for Information Operations and Reports, 1215 Jefferson Davis Highway, Suite 1204, Arlington, VA 22202-4302, and to the Office of Management and Budget, Paperwork Reduction Project (0704-0188), Washington, DC 20503.
1. AGENCY USE ONLY (Leave Blank)
REPORT DATE
12 February 2001 3. REPORT TYPE AND DATES COVERED
Final Report 15 December 1998 -12 February 2001
4. TITLE AND SUBTITLE
Underwater Acoustic Data Communications for Autonomus Platform Command, Control and Communications
6. AUTHORS
Michael Shinego, Geoff Edelson, Francine Menas, Michael Richman, Robert Nation, and Eric Will
5. FUNDING NUMBERS N00014-99-1-0208
7. PERFORMING ORGANIZATION NAME(S) AND ADDRESS(ES) BAE SYSTEMS Advanced Systems and Technology P.O. Box 868
Nashua, NH 03061-0868
8. PERFORMING ORGANIZATION REPORT NUMBER 8346749
9. SPONSORING / MONITORING AGENCY NAME(S) AND ADDRESS(ES) Office of Naval Research (ONR) Ballston Centre Tower One Arlington, VA 22217-5560
10. SPONSORING / MONITORING AGENCY REPORT NUMBER
11. SUPPLEMENTARY NOTES
12a. DISTRIBUTION / AVAILABILITY STATEMENT Approved for Public Release; distribution is Unlimited
12b. DISTRIBUTION CODE
13. ABSTRACT (Maximum 200 words) The purpose of this study is to provide an analysis and assessment of the state-of-the-art of underwater acoustic (UWA) data communications
technology with application to multiple vehicle operation in support of shallow-water mine countermeasures (MCM) operations. This study is intended to provide system architects with a reference to what the current state of acoustic communications technology can provide and to support the execution of system architecture trades. Included are discussions and analyses that may be used to predict the performance, strengths, and limitations of different approaches to acoustic communications in facilitating the overall MCM system approach.
Not only does the underwater environment constrain the data rates achievable but it also limits the maximum ranges achievable. Acoustic attenuation in the ocean is frequency-dependent with higher frequencies propagating shorter distances. The requirement to provide connectivity to submerged Naval assets over very long ranges is unlikely to be met directly with a single acoustic link due to the complex effects of acoustic propagation and limited propagation ranges. One solution is to create an UWA network of communications nodes. Another solution to this requirement is to use a buoy to convert acoustic signals to and from radio frequency (RF) signals. This solution provides real-time two-way communications to distant surface ships, aircraft and/or satellites that can act as relays to integrate undersea communications into the RF-based communications network.
14. SUBJECT TERMS underwater acoustic communications, autonomous underwater vehicle, mine reconnaissance, mine
countermeasures
15. NUMBER OF PAGES 139
16. PRICE CODE
17. SECURITY CLASSIFICATION OF REPORT Unclassifed
18. SECURITY CLASSIFICATION OF THIS PAGE Unclassified
19. SECURITY CLASSIFICATION OF ABSTRACT Unclassified
20. LIMITATION OF ABSTRACT UL
NSN 7540-01-280-5500 Standard Form 298 (Rev. 2-89) Prescribed by ANSI Std. Z39-1 298-102