Bacteriocin:Production and optimization by Lactobacillus species
13
Journal of Microbiology and Biotechnology Research Scholars Research Library J. Microbiol. Biotech. Res., 2013, 3 (6):64-76 (http://scholarsresearchlibrary.com/archive.html) ISSN : 2231 –3168 CODEN (USA) : JMBRB4 64 Available online at www.scholarsresearchlibrary.com Bacteriocin:Production and optimization by Lactobacillus species Khushboo Rawal 1 , Nirav Bhavsar 2* , Gopal Raol 2 , B.V. Raol 3 , J. D. Patel 4 1 BRD School of Bio Sciences, Sardarpatel University, V.V.NagarAnand, Gujarat, India 2 Department of Microbiology, Shri A.N.Patel P.G.Institute, Anand, Gujarat, India 3 Department of Microbiology Shri P.H.G Municipal Arts & Science Collage, Kalol. Gujarat 4 Department of Chemistry, Shri A.N.Patel P.G.Institute, Anand, Gujarat, India _____________________________________________________________________________________________ ABSTRACT The isolated species of Lactobacilli shows pronounced antibacterial activity between early logarithmic and early stationary phase. The maximum activity in composed medium was achieved at initial pH of 6, Incubation temperature 37˚C, and incubation period of 24h under static condition. Supplementation or replacement of nutrients demonstrated that larger quantities of bacteriocin could be produced by addition of Glucose (2%), using the alternative sugars like Lactose and maltose (2%), and NaCl (2-4%), while the addition of glycerol had no profound effect on production. Salting out and dialysis methods are efficient for the partial purification of bacteriocin since it showed the increase in the activity from 400AU/mL to 1200AU/mL. The compound produced by Lactobacilli was fully inactivated by some of the proteolytic enzymes, which confirms their proteinaceous nature. The antibacterial activity of cell-free culture was not affected by treatment with the α-amylase suggesting that the activity of the bacteriocin producing organism is not dependent on the glycosylation. The antibacterial compound shows wide range of thermo stability from 70˚C-121˚C for 15min. The well diffusion assay showed that the bacteriocin produced by the given Lactobacilli is inhibiting the growth of Staphylococcus aureus, Bacillus subtilis, Serratiamarsecens, Escherichia coli, Pseudomonas aeroginosaand Proteus vulgaris showing a broad spectrum of inhibition. The molecular weight of the peptide is 6 kDa by SDS-PAGE analysis. The antimicrobial activity of the proteinaceous compounds such as bacteriocins or bacteriocin-like inhibitory compounds produced by Lactobacilli isolated in this work are largely known and have been found to have potent antimicrobial activities towards closely related bacteria and undesirable harmful microorganisms. They are helpful in the field of food preservation or safety, health care, and pharmaceutical application. Key words: Bacteriocin, Food preservation, Antimicrobial _____________________________________________________________________________________________ INTRODUCTION In recent years bacterial antibiotic resistance has been considered a problem due to the extensive use of classical antibiotics in treatment of human and animal diseases [1, 2, and 3]. As a consequence, multiple resistant strains appeared and spread causing difficulties and the restricted use of antibiotics as growth promoters. So, the continued development of new classes of antimicrobial agents has become of increasing importance for medicine [4,5]. In order to control their abusive use in food and feed products, one plausible alternative is the application of some bacterial peptides as antimicrobial substances in place of antibiotics of human application. Among them, Bacteriocins produced by lactic acid bacteria have attracted increasing attention, since they are active in a nanomolar range and have no toxicity. Bacteriocins are ribosomally synthesized proteinaceous compound lethal to bacteria other than the producing strain. Bacteriocins are proteins or complexed proteins which are biologically active with
Transcript of Bacteriocin:Production and optimization by Lactobacillus species

Journal of Microbiology and Biotechnology Research
Scholars Research Library
J. Microbiol. Biotech. Res., 2013, 3 (6):64-76 (http://scholarsresearchlibrary.com/archive.html)
ISSN : 2231 –3168
CODEN (USA) : JMBRB4
64 Available online at www.scholarsresearchlibrary.com
Bacteriocin:Production and optimization by Lactobacillus species
Khushboo Rawal1, Nirav Bhavsar2*, Gopal Raol2, B.V. Raol3, J. D. Patel4
1BRD School of Bio Sciences, Sardarpatel University, V.V.NagarAnand, Gujarat, India
2Department of Microbiology, Shri A.N.Patel P.G.Institute, Anand, Gujarat, India 3 Department of Microbiology Shri P.H.G Municipal Arts & Science Collage, Kalol. Gujarat
4Department of Chemistry, Shri A.N.Patel P.G.Institute, Anand, Gujarat, India _____________________________________________________________________________________________
ABSTRACT The isolated species of Lactobacilli shows pronounced antibacterial activity between early logarithmic and early stationary phase. The maximum activity in composed medium was achieved at initial pH of 6, Incubation temperature 37˚C, and incubation period of 24h under static condition. Supplementation or replacement of nutrients demonstrated that larger quantities of bacteriocin could be produced by addition of Glucose (2%), using the alternative sugars like Lactose and maltose (2%), and NaCl (2-4%), while the addition of glycerol had no profound effect on production. Salting out and dialysis methods are efficient for the partial purification of bacteriocin since it showed the increase in the activity from 400AU/mL to 1200AU/mL. The compound produced by Lactobacilli was fully inactivated by some of the proteolytic enzymes, which confirms their proteinaceous nature. The antibacterial activity of cell-free culture was not affected by treatment with the α-amylase suggesting that the activity of the bacteriocin producing organism is not dependent on the glycosylation. The antibacterial compound shows wide range of thermo stability from 70˚C-121˚C for 15min. The well diffusion assay showed that the bacteriocin produced by the given Lactobacilli is inhibiting the growth of Staphylococcus aureus, Bacillus subtilis, Serratiamarsecens, Escherichia coli, Pseudomonas aeroginosaand Proteus vulgaris showing a broad spectrum of inhibition. The molecular weight of the peptide is 6 kDa by SDS-PAGE analysis. The antimicrobial activity of the proteinaceous compounds such as bacteriocins or bacteriocin-like inhibitory compounds produced by Lactobacilli isolated in this work are largely known and have been found to have potent antimicrobial activities towards closely related bacteria and undesirable harmful microorganisms. They are helpful in the field of food preservation or safety, health care, and pharmaceutical application. Key words: Bacteriocin, Food preservation, Antimicrobial _____________________________________________________________________________________________
INTRODUCTION
In recent years bacterial antibiotic resistance has been considered a problem due to the extensive use of classical antibiotics in treatment of human and animal diseases [1, 2, and 3]. As a consequence, multiple resistant strains appeared and spread causing difficulties and the restricted use of antibiotics as growth promoters. So, the continued development of new classes of antimicrobial agents has become of increasing importance for medicine [4,5]. In order to control their abusive use in food and feed products, one plausible alternative is the application of some bacterial peptides as antimicrobial substances in place of antibiotics of human application. Among them, Bacteriocins produced by lactic acid bacteria have attracted increasing attention, since they are active in a nanomolar range and have no toxicity. Bacteriocins are ribosomally synthesized proteinaceous compound lethal to bacteria other than the producing strain. Bacteriocins are proteins or complexed proteins which are biologically active with

Nirav Bhavsar et al J. Microbiol. Biotech. Res., 2013, 3 (6):64-76 ______________________________________________________________________________
65 Available online at www.scholarsresearchlibrary.com
antimicrobial action against other bacteria, principally closely related species. They are produced by bacteria and are normally not termed antibiotics in order to avoid confusion and concern with therapeutic antibiotics, which can potentially illicit allergic reactions in humans and other medical problems [6]Bacteriocins are commonly divided into four groups [7,8]. They are I) Lantibiotics; II) small hydrophobic heat-stable peptides (< 13,000 Da); III) large heat-labile proteins (> 30,000 Da) and IV) complex bacteriocins showing the complex molecule of protein with lipid and/or carbohydrate. Biopreservation systems such as bacteriocinogenic LAB cultures and/or their bacteriocin have received increasing attention, and new approaches to control pathogenic and spoilage microorganisms have been developed [9]. Some lactic acid bacteria (LAB) demonstrated antagonism towards pathogenic and spoilage organisms. Although bacteriocins are produced by many Gram-positive and Gram-negative species, those produced by LAB are of particular interest to the food industry, since these bacteria have generally been regarded as safe. Bacterial fermentation of perishable raw materials has been used for centuries to preserve the nutritive value of food and beverages over an extended shelf life. Despite the several methods other than bacteriocin are employed for the preservation of food/beverages, an increasingly, health conscious public may seek to avoid foods that have undergone extensive processing or which contain chemical preservatives. The production ofbacteriocin by LAB is advantageous for survival of the producing bacteria in a competitive ecological niche; therefore, they could be exploited by the food industry as a tool to control undesirable bacteria in a food-grade and natural manner, which is likely to be more acceptable to consumers. Among the lactic acid bacteria, a high diversity of bacteriocin is produced and several have been patented for their applications in foods. To date, the only commercially produced bacteriocins are the group of nisins produced by Lactoccocuslactis, and pediocin PA-1, produced by Pediococcusacidilactici. Minimally processed refrigerated foods have been gaining consumer acceptance in the last years due to their natural appeal. However, the microbiological safety of these foods is of concern due to the possible presence of non-proteolytic toxic strains of Clostridium botulinum, able to grow at 4ºC, and the post-processing contamination with psychrotrophic pathogens such as Listeria monocytogenes. Listeria monocytogenesis a pathogenic bacterium that has been involved in several food borne out breaks worldwide and causes special concern with regard to food safety due to its psycrotrophic and ubiquitous characteristics. To inhibit such organisms there are at least three ways in which bacteriocin can be incorporated into a food to improve its safety [10]. i.e., using a purified/semi-purified bacteriocin preparation as an ingredient in food, by incorporating an ingredient previously fermented with a bacteriocin-producing strain, or by using a bacteriocin producing culture to replace all or part of a starter culture in fermented foods to produce the bacteriocinin situ. Bacteriocins can be incorporated into foods as a concentrated, though not purified, preparation made with food-grade techniques. Bacteriocins are used as a biopreservative for dairy products, seafood products or they can also be applied in the packaging film [11].
MATERIALS AND METHODS
Isolation of Lactobacilli Lactobacillus was isolated from the different sample like idli barter, curd, cheese whey and sporolac probiotic tablet by streaking the culture on MRS (DeMannRogosa Sharpe) agar platesHiMedia Laboratories. MRS medium composed of Peptone, 5g; Meat extract, 8g;Yeast extract, 4g;D(+) Glucose, 20g;K2HPO4’ 2g; Sodium acetate.3H2O, 5g;Tri ammonium citrate, 2g;MgSO4.7H2O, 2g; MgSO4.4H2O, 0.05g; Agar, 30g and distilled water up to 1000mL. The pH of the medium was adjusted to 6.5.The plates were incubated for 24h at 37ºC and the pure culture was examined for the morphological and colony characteristics. Maintenance of indicator bacterial strain and test cultures The susceptible organisms included gram positive bacteria Staphylococcus aureus, Bacillus subtilis and gram negative bacteria like Pseudomonas aeruginosa, Escherichia coli, Serratiamarsecens, Proteus vulgaris were obtained from reliable sources and they were maintained on nutrient agar slants at 4ºC respectively also the pure culture of Lactobacillus was maintained on MRS agar slants at 4ºC and they were sub-cultured regularly. Screening for antimicrobial activity The antimicrobial activity of the isolates was determined by agar streak method and agar well diffusion assay. Inoculum preparation For the production of bacteriocin culture of Lactobacillus was used. For the preparation of inoculums the colony from the pure slant was inoculated into MRS broth and incubated at 37ºC for 24h in static condition to obtain active

Nirav Bhavsar et al J. Microbiol. Biotech. Res., 2013, 3 (6):64-76 ______________________________________________________________________________
66 Available online at www.scholarsresearchlibrary.com
culture and cell density was measured at 600nm using uninoculated MRS broth as blank. The optical density of the suspension was adjusted to 1.00 O.D. Fermentation Lactobacilli were propagated in the MRS broth by inoculating active inoculum culture at the rate of 10% and incubating for 24h in a static condition at 37ºC during this incubation the bacteriocin was secreted in to the external medium. MRS broth was composed of Peptone, 10g; Meat extract, 8g; Yeast extract, 4g; D(+)Glucose, 20g; Dipotassium hydrogen phosphate, 2g; Sodium acetate trihydrate, 5g; Triammonium citrate, 2g; magnesium sulphateheptahydrate, 0.2g; Magnesiunsulphatetetrahydrate, 0.05g; and distilled water up to 1000mL the pH was maintained at 6.2 and medium was sterilized by autoclaving at 121ºC for 15 min. Optimization of various parameter of the growth medium for the bacteriocin production Effect of pH To study the effect of different pH conditions on bacteriocin production the pH of the production medium was varied from 5 to 9 by using 1N HCl and 1N NaOH before autoclaving and then the culture was inoculated at the rate of 10% and the flask were incubated at 37ºC for 24h under static condition. Effect of Temperature Different temperature condition included 30ºC, 37ºC and room temperature and the rest of the fermentation conditions were kept constant. Effect of Inoculum size To establish the correlation between number of cells and kinetics of bacteriocin production the fermentation medium was inoculated with different number of cells i.e. inoculums size varying from 5%, 10%, 15% and 20%. Effect of Incubation time To decide the incubation time for the maximum bacteriocin production the fermentation medium was incubated for different time interval varying from 24h, 48h, 72h and 96h. Effect of different sugar concentration The original MRS medium was modified with respect to sugar concentration and it was varied from 2%, 4%, 6%, 8%, 10%. Effect of different sugar The glucose in the original MRS medium was replaced by Lactose, Maltose and Fructose to check its effect on the bacteriocin production. Effect of different Glycerol concentration The carbon source glucose was replaced by glycerol at different concentration of 1%, 2% and 3%. Effect of different NaCl concentration To check the effect of different curing agent on bacteriocin production by Lactobacilli the salt concentration was varied from 2%, 4% and 6%. Analytical method Estimation of total protein by Folin – Lowery method [12] Bacteriocin bioassay The antibacterial activity was determined by agar well diffusion assay. [13] Inhibition zone measurement: The zone of inhibition was measured by using zone measurement scale of HiMedia. Determination of inhibitory activity: The inhibitory activity was expressed in an arbitrary unit (AU/mL) by testing serial two-fold dilutions. The arbitrary unit (AU) was defined as the reciprocal of the highest dilution producing a clear zone of growth inhibition of the indicator strain. AU was calculated as (1000/10)D, where D was the dilution factor.[14]
Nirav Bhavsar et al J. Microbiol. Biotech. Res., 2013, 3 (6):64-76 ______________________________________________________________________________
67 Available online at www.scholarsresearchlibrary.com
Extraction of the Bacteriocin The Lactobacilli was grown in MRS broth at 37°C for 24h and cell free supernatant was obtained by centrifuging at 10,000 rpm for 20min at 4°C followed by filtration through whatman filter paper. Precipitation of bacteriocin Culture supernatant was treated with solid ammonium sulfate to 30% and 60% saturation. The mixtures were then stirred for 4h at 4°C and later centrifuged at 10,000 rpm for 30 min to precipitate the protein the inhibitory activity of the bacteriocin was checked at each stage of precipitation process. Salting out by dialysis The pellets obtained after ammonium sulphate precipitation was resuspended in 0.05M Potassium phosphate buffer pH 7 dialysis was carried out against same buffer for 24h in dialysis bag. Assay of the antimicrobial activity was determined. Stability of the Bacteriocin Action of various heat treatment and storage temperature. Samples of the crude bacteriocin were used for these tests. Aliquots of the semi-purified bacteriocin were exposed to heat treatments of 70°C,100°C and 121°C for 15min and its residual activity was checked by agar well diffusion assay. Also to check the stability of the bacteriocin on storage the cell free supernatant were stored for two months and its residual activity was checked by the same method. Effect of enzymatic treatments on bacteriocin activity. The CFS was treated with proteolytic enzyme like proteinase-K at the concentrations of 0.1mg/mL, 0.5mg/mL, 1mg/mL, 2mg/mL and with the α-amylase at the concentration of 1mg/mL, 2mg/mL, 3mg/mL, 4mg/mL and 5mg/mL. The reaction mixture was incubated at 37°C for 2hr. After incubation, the residual enzyme activity was finally stopped by boiling for 5min and the remaining bacteriocin activity was examined by agar well diffusion assay and control were also placed for the each enzyme and the results were compared with the control. Separation and determination of molecular weight of the bacteriocin by SDS-PAGE. The concentrated sample was electrophoresed on 10% SDS polyacrylamide gel.
Mobility =������ �� � �� ������(��)
�������� ������������(��)
RESULTS AND DISCUSSION
The bacteriocin produced by Lactobacilli exhibited various degrees of inhibitory activities against various gram positive and gram negative bacteria. Thus the given strain of Lactobacilli has broad spectrum of inhibition.
Table 1: Anti-microbial activity against various gram positive and gram negative organisms.
Name of the Organism Zone size in mm Bacillus subtilis 25 Staphylococcus aureus 27 Escherichia coli 24 Pseudomonas aeroginosa 27 Proteus vulgaris 27 Serratiamarsecens 30
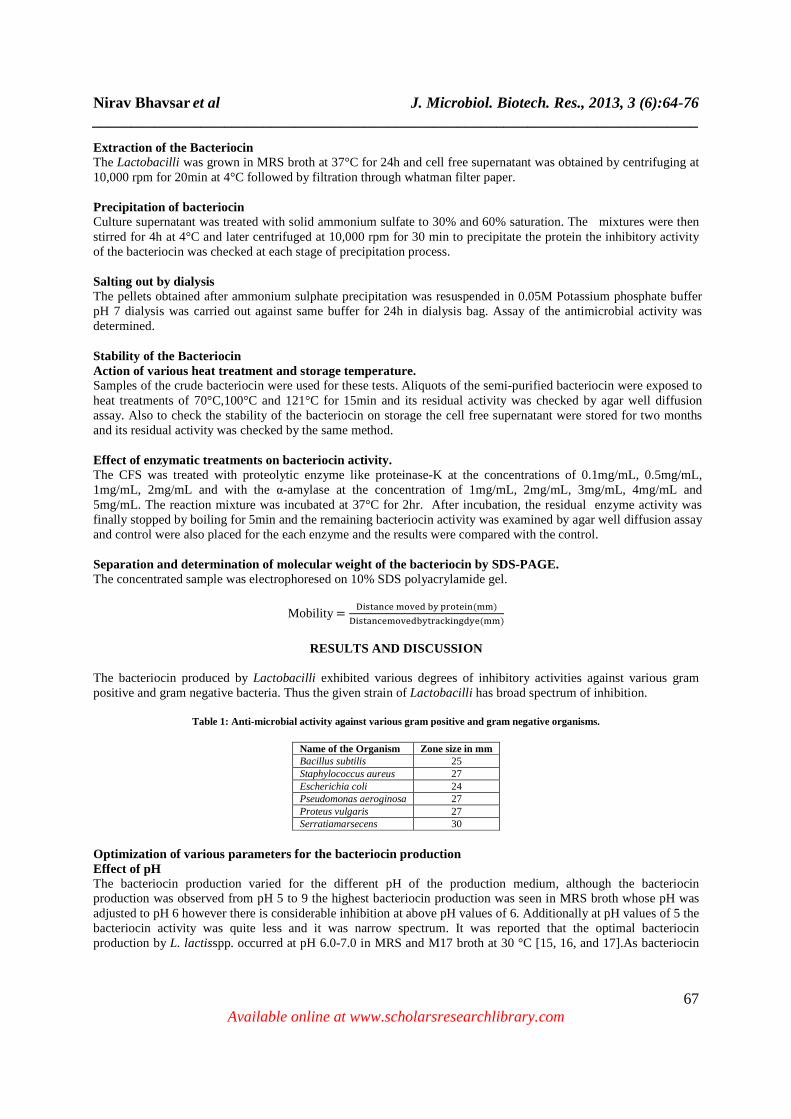
Optimization of various parameters for the bacteriocin production Effect of pH The bacteriocin production varied for the different pH of the production medium, although the bacteriocin production was observed from pH 5 to 9 the highest bacteriocin production was seen in MRS broth whose pH was adjusted to pH 6 however there is considerable inhibition at above pH values of 6. Additionally at pH values of 5 the bacteriocin activity was quite less and it was narrow spectrum. It was reported that the optimal bacteriocin production by L. lactisspp. occurred at pH 6.0-7.0 in MRS and M17 broth at 30 °C [15, 16, and 17].As bacteriocin
Nirav Bhavsar et al ______________________________________________________________________________
Available online at
production is linked to cell growth, it also depends on factors that affect cell grow[18].
The effect of different medium pH on bacteriocin production,the inhibitory activity against
Graph: 1 Effect of pH on bacteriocin production checked against different organisms.
Effect of temperature The effect of temperature on bacteriocin production by MRS and maintained at different temperatures (30°C, 37°C and RT). bacteriocin production. The optimum temperature for the production of bacteriocin was 37°C, thus the bacteriocin activity at this temperature was higher than that observed at 30°C and at room temperature. According to these results we can say that, the optimum temperature for productionelsewhere for lactocin A, enterocin 1146, lactocin S and nisin Z [important role on bacteriocin production.
0
5
10
15
20
25
zon
e s
ize
in
mm
J. Microbiol. Biotech. Res.______________________________________________________________________________
Available online at www.scholarsresearchlibrary.com
production is linked to cell growth, it also depends on factors that affect cell growth, such as pH and temperature
The effect of different medium pH on bacteriocin production,the inhibitory activity against
Effect of pH on bacteriocin production checked against different organisms.
The effect of temperature on bacteriocin production by Lactobacillus was tested in flasks cultures containing sterile MRS and maintained at different temperatures (30°C, 37°C and RT). Figureshows the effect of temperature on
imum temperature for the production of bacteriocin was 37°C, thus the bacteriocin activity at this temperature was higher than that observed at 30°C and at room temperature. According to these results we can say that, the optimum temperature for production and the one for growth are correlated, as observed
n 1146, lactocin S and nisin Z [19].So, growth temperature seems to play an important role on bacteriocin production.
5 6 7 8 9
pH
S. aureus
P. aeroginosa
E.coli
P. vulgaris
B. subtilis
S. marsecens
Res., 2013, 3 (6):64-76 ______________________________________________________________________________
68 www.scholarsresearchlibrary.com
th, such as pH and temperature
The effect of different medium pH on bacteriocin production,the inhibitory activity against S. aureus.
.
Effect of pH on bacteriocin production checked against different organisms.
was tested in flasks cultures containing sterile shows the effect of temperature on
imum temperature for the production of bacteriocin was 37°C, thus the bacteriocin activity at this temperature was higher than that observed at 30°C and at room temperature. According to these
and the one for growth are correlated, as observed .So, growth temperature seems to play an
P. aeroginosa
S. marsecens

Nirav Bhavsar et al ______________________________________________________________________________
Available online at
The effect of incubation temperature on bacterioaeroginosa.
Table 2.
Temperature Protein concentration in
(mg/mL) RT 2.910 30˚C 2.540
Graph
Table 3 : Effect of temperature checked against different
Temperature S. aureusRT 22
30˚C 2537˚C 27
Effect of incubation time The bacteriocin production was maximum at 24h of the incubation. There was no activity observed at 48h, 72h and 96h of incubation although there was increase in the number of cells. The maximum bacteriocin production occurs
100
200
300
400
500
600
J. Microbiol. Biotech. Res.______________________________________________________________________________
Available online at www.scholarsresearchlibrary.com
The effect of incubation temperature on bacteriocin production. The inhibitory activity against
Table 2. Effect of temperature on bacteriocin production.
37˚C 2.860 1.086 1.489 16.29 22.33
Protein concentration in OD at 600nm after 24h
OD at 600nm after 48h
No. of cells after 24h×108
0.090 0.263 1.35 0.238 0.696 3.57
Graph: 2 Effect of Temperature on Bacteriocin Production
3 : Effect of temperature checked against different organisms zone size in mm
S. aureus P. aeroginosa E.coli P. vulgaris B. subtilis S. marsecens
22 22 19 21 19 25 24 22 22 22 27 27 24 23 25
The bacteriocin production was maximum at 24h of the incubation. There was no activity observed at 48h, 72h and 96h of incubation although there was increase in the number of cells. The maximum bacteriocin production occurs
0
100
200
300
400
500
600
37 30 RT
27 24 22
514457
419
Temperature(˚C)
Zone Size(mm) AU/mL
Res., 2013, 3 (6):64-76 ______________________________________________________________________________
69 www.scholarsresearchlibrary.com
The inhibitory activity against Pseudomonas
No. of cells after No. of cells after 48h×108 3.945 10.44
.
organisms zone size in mm
S. marsecens 27 26 30
The bacteriocin production was maximum at 24h of the incubation. There was no activity observed at 48h, 72h and 96h of incubation although there was increase in the number of cells. The maximum bacteriocin production occurs
Nirav Bhavsar et al ______________________________________________________________________________
Available online at
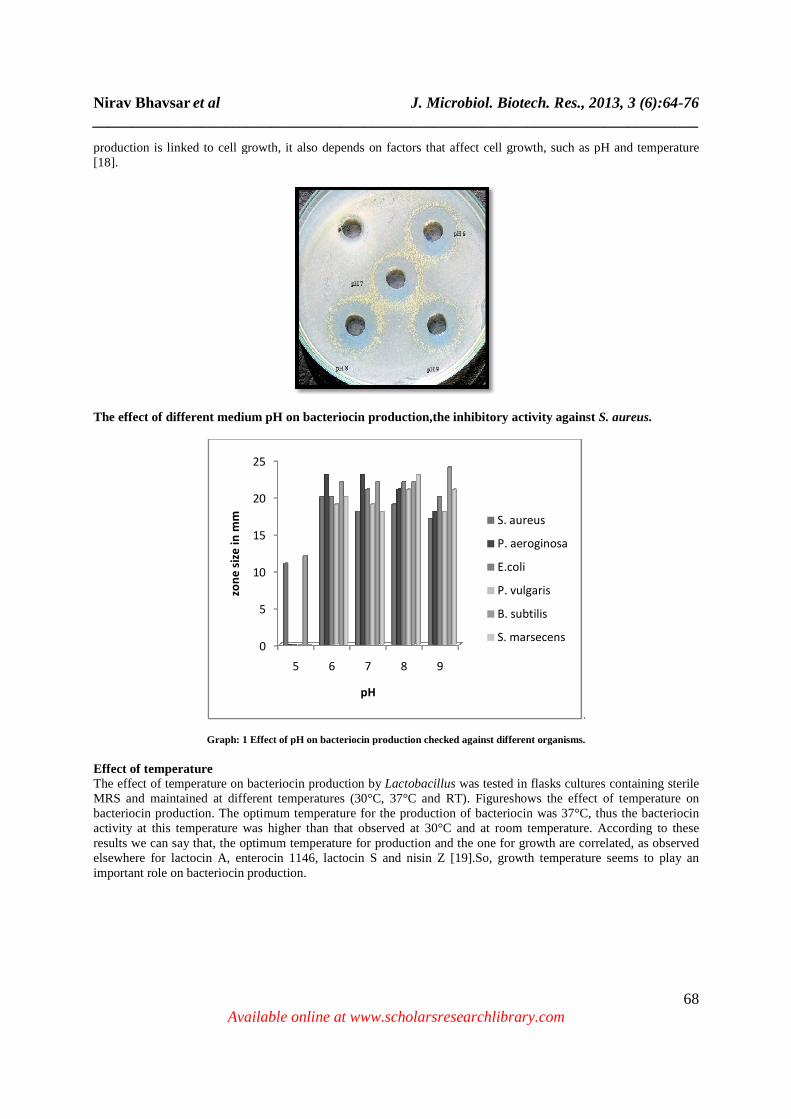
during early stationary phase. During extended stationary phase incubation the activity of bacteriocin decreased considerably. Loss of activity has been ascribed to proteolytic degradation by endogenous extracellular proteases induced during this growth phase, protein aggregation, and ad[20,21].
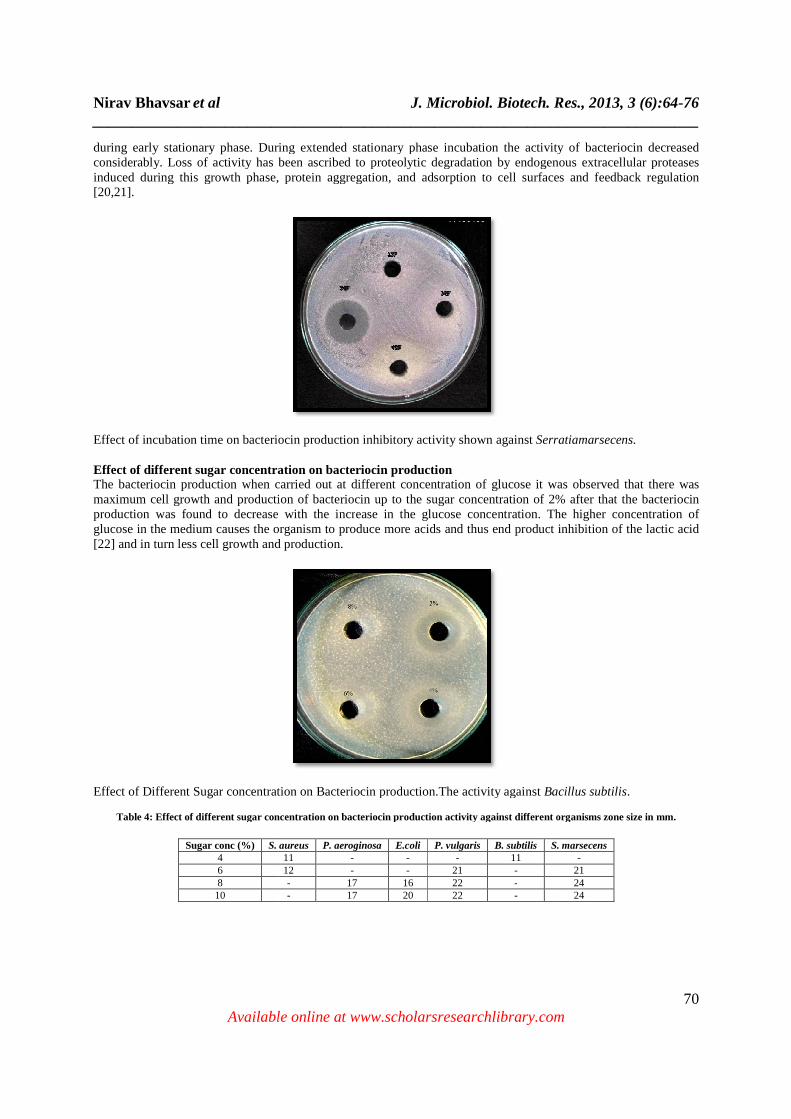
Effect of incubation time on bacteriocin production inhibitory activity Effect of different sugar concentration on bacteriocin productionThe bacteriocin production when carried out at different concentration of glucose it was observed that there was maximum cell growth and production of bacteriocin up to the sugar concentration of 2% after that the bacteriocin production was found to decrease with the incrglucose in the medium causes the organism to produce more acids and thus end product[22] and in turn less cell growth and production.
Effect of Different Sugar concentration on Bacteriocin production.The activity against
Table 4: Effect of different sugar concentration on bacteriocin production activity against different organisms zone size in
Sugar conc (%) S. aureus4 6 8 10
J. Microbiol. Biotech. Res.______________________________________________________________________________
Available online at www.scholarsresearchlibrary.com
uring extended stationary phase incubation the activity of bacteriocin decreased considerably. Loss of activity has been ascribed to proteolytic degradation by endogenous extracellular proteases induced during this growth phase, protein aggregation, and adsorption to cell surfaces and feedback regulation
Effect of incubation time on bacteriocin production inhibitory activity shown against Serratiamarsecens.
Effect of different sugar concentration on bacteriocin production production when carried out at different concentration of glucose it was observed that there was
maximum cell growth and production of bacteriocin up to the sugar concentration of 2% after that the bacteriocin production was found to decrease with the increase in the glucose concentration. The higher concentration of glucose in the medium causes the organism to produce more acids and thus end product
and in turn less cell growth and production.
r concentration on Bacteriocin production.The activity against Bacillus subtilis
Table 4: Effect of different sugar concentration on bacteriocin production activity against different organisms zone size in
S. aureus P. aeroginosa E.coli P. vulgaris B. subtilis S. marsecens11 - - - 11 12 - - 21 - - 17 16 22 - - 17 20 22 -
Res., 2013, 3 (6):64-76 ______________________________________________________________________________
70 www.scholarsresearchlibrary.com
uring extended stationary phase incubation the activity of bacteriocin decreased considerably. Loss of activity has been ascribed to proteolytic degradation by endogenous extracellular proteases
rfaces and feedback regulation
Serratiamarsecens.
production when carried out at different concentration of glucose it was observed that there was maximum cell growth and production of bacteriocin up to the sugar concentration of 2% after that the bacteriocin
ease in the glucose concentration. The higher concentration of inhibition of the lactic acid
Bacillus subtilis.
Table 4: Effect of different sugar concentration on bacteriocin production activity against different organisms zone size in mm.
S. marsecens -
21 24 24

Nirav Bhavsar et al ______________________________________________________________________________
Available online at
Graph: 3 Effect of Different Sugar Effect of different sugars on bacteriocin The bacteriocin production observed in the presence of 2% concentration of the sugar like glucose, lactose and maltose but not in the presence of fructose. Optimal bacteriocin production was recorded in the presence of 20 g/L of glucose, however in presence of 20g/L of lactose and 20g/L of maltose the bacteriocin production was reduced to 50% of that obtained with the glucose as the sole carbon source. From these results it can be concluded that glucose is only stimulating when present as a mono lactose. The effect of glucose on bacteriocin production h149[24].
Table 5: Effect of different sugar on bacteriocin production.
Sugar Protein concentration in (mg/mL)
OD at 600nm after 24h
Lactose 0.520 Maltose 0.313 Fructose 0.505
Effect of glycerol concentration on bacteriocin productionIn the presence of glycerol at a concentration of 1% and higher bacteriocin production was completely inhibited. Similar results were reported for the production of plantaricin ST31, when grown in the presence of 2g/L and higher glycerol concentrations, leading to decrease in activity [bacteriocin production may be due to changes in osmotic stress and merits further research. Effect of NaCl concentration on bacteriocin productionCell growth and bacteriocin activity in the presence of various salt concentrations were measured overtime. However, as the salt concentration increased, the cells grew more slowly and biomass production became less efficient and so does the bacteriocin production since ba[26]. The bacteriocin production was observed from 2 to 4% NaCl concentration but there was no bacteriocin activity observed when 6% NaCl concentration was used this is because the bacteria enter inearlier, thereby significantly reducing biomass production. Bacterial metabolism is sensitive to salt, because salt exhibits specific ionic and water binding properties [addition of salt to the fermentation liquor leads to a decrease in agrowth often result in a linear decrease of the growth rate [values below the optimum aw [28,29,30growth medium increased due to addition of NaCl. Also, for plantaricin S, the highest production was observed at a sodium chloride concentration of 2.5% (w/v) [
0
5
10
15
20
25
30
0
Zone
siz
e in
mm
Sugar Concentration in %
J. Microbiol. Biotech. Res.______________________________________________________________________________
Available online at www.scholarsresearchlibrary.com
Effect of Different Sugar concentrations on Bacteriocin Production.
Effect of different sugars on bacteriocin production The bacteriocin production observed in the presence of 2% concentration of the sugar like glucose, lactose and maltose but not in the presence of fructose. Optimal bacteriocin production was recorded in the presence of 20 g/L
in presence of 20g/L of lactose and 20g/L of maltose the bacteriocin production was reduced to 50% of that obtained with the glucose as the sole carbon source. From these results it can be concluded that glucose is only stimulating when present as a mono or disaccharide form and not when in combination with gluconate as in lactose. The effect of glucose on bacteriocin production has been reported for sakacin P [23] and plantaricin
Table 5: Effect of different sugar on bacteriocin production.
OD at 600nm after 24h OD at 600nm after 48h
No. of cells after 24h×108
1.322 1.603 19.83 0.961 0.840 14.415 1.098 1.160 16.47
Effect of glycerol concentration on bacteriocin production In the presence of glycerol at a concentration of 1% and higher bacteriocin production was completely inhibited. Similar results were reported for the production of plantaricin ST31, when grown in the presence of 2g/L and higher
to decrease in activity [25]. Glycerol is not used as carbon source. The decrease in bacteriocin production may be due to changes in osmotic stress and merits further research.
Effect of NaCl concentration on bacteriocin production acteriocin activity in the presence of various salt concentrations were measured overtime.
However, as the salt concentration increased, the cells grew more slowly and biomass production became less efficient and so does the bacteriocin production since bacteriocin production exhibits primary metabolite kinetics
. The bacteriocin production was observed from 2 to 4% NaCl concentration but there was no bacteriocin activity observed when 6% NaCl concentration was used this is because the bacteria enter inearlier, thereby significantly reducing biomass production. Bacterial metabolism is sensitive to salt, because salt
c and water binding properties [27]. The latter effect is of utmost importance because the dition of salt to the fermentation liquor leads to a decrease in aw. Decrease in aw below the optimum values for
ar decrease of the growth rate [28]. Indeed, the growth rate often decreases linearly at a28,29,30] reported an increased lacticin 481 production when the osmolarity of the
growth medium increased due to addition of NaCl. Also, for plantaricin S, the highest production was observed at a n of 2.5% (w/v) [31].
0
0.2
0.4
0.6
0.8
1
1.2
5 10
OD
at 6
00nm
Sugar Concentration in %
Zone size in mm
OD at 600nm
Res., 2013, 3 (6):64-76 ______________________________________________________________________________
71 www.scholarsresearchlibrary.com
.
on Bacteriocin Production.
The bacteriocin production observed in the presence of 2% concentration of the sugar like glucose, lactose and maltose but not in the presence of fructose. Optimal bacteriocin production was recorded in the presence of 20 g/L
in presence of 20g/L of lactose and 20g/L of maltose the bacteriocin production was reduced to 50% of that obtained with the glucose as the sole carbon source. From these results it can be concluded that glucose
or disaccharide form and not when in combination with gluconate as in as been reported for sakacin P [23] and plantaricin
No. of cells after 8
No. of cells after 48h×108
24.045 12.60 17.40
In the presence of glycerol at a concentration of 1% and higher bacteriocin production was completely inhibited. Similar results were reported for the production of plantaricin ST31, when grown in the presence of 2g/L and higher
. Glycerol is not used as carbon source. The decrease in bacteriocin production may be due to changes in osmotic stress and merits further research.
acteriocin activity in the presence of various salt concentrations were measured overtime. However, as the salt concentration increased, the cells grew more slowly and biomass production became less
ts primary metabolite kinetics . The bacteriocin production was observed from 2 to 4% NaCl concentration but there was no bacteriocin
activity observed when 6% NaCl concentration was used this is because the bacteria enter in to the stationary phase earlier, thereby significantly reducing biomass production. Bacterial metabolism is sensitive to salt, because salt
. The latter effect is of utmost importance because the below the optimum values for
. Indeed, the growth rate often decreases linearly at aw reported an increased lacticin 481 production when the osmolarity of the
growth medium increased due to addition of NaCl. Also, for plantaricin S, the highest production was observed at a
Zone size in mm

Nirav Bhavsar et al ______________________________________________________________________________
Available online at
Table 6: Effect of different salt concentr NaCl conc.
(%) Protein concentration in
(mg/mL) 2 3.220 4 4.050 6 3.690
Graph: 4 Bacteriocinactivity against different organisms Precipitation of bacteriocin There was maximum antimicrobial further salting out it by dialysis there was increase in the activity from 400 AU/mL to 1200AU/mL. The total protein concentration was determined by folinprecipitating bacteriocin. Protein concentration was determined by the folin Specific activity is the activity units divided by the protein concentration (AU/ Purification factor is the increase in the initial specific activity. Recovery percentage is the remaining protein Partial purification of bacteriocin and its activit y profile.Stability of Bacteriocins Effect of enzymatic treatment The antibacterial activity of cell-free culture was not affected by treatment with the the activity of the bacteriocin producing organism is not dependent on the glycosylation. However the activity was
0
5
10
15
20
25
Zon
e si
ze in
mm
Purification stages
Culture supernatant 30% Ammonium sulphate precipitation fraction30% dialysis fraction 60% Ammonium sulphate precipitation fraction60% dialysis fraction
J. Microbiol. Biotech. Res.______________________________________________________________________________
Available online at www.scholarsresearchlibrary.com
Table 6: Effect of different salt concentration on bacteriocin production
Protein concentration in OD at 600nm after 24h
OD at 600nm after 48h
No. of cells after 24h×10
1.013 1.475 15.1951.797 1.314 26.9550.332 0.251 4.98
Bacteriocinactivity against different organisms at different salt concentration
There was maximum antimicrobial activity observed at 60% ammonium sulphate precipitation fraction. After further salting out it by dialysis there was increase in the activity from 400 AU/mL to 1200AU/mL. The total protein concentration was determined by folin-lowery method and there was decrease in the total protein concentration after
was determined by the folin-lowery method.
Specific activity is the activity units divided by the protein concentration (AU/µg)
Purification factor is the increase in the initial specific activity.
Recovery percentage is the remaining protein concentration as a percentage of the initial protein concentration.
Partial purification of bacteriocin and its activit y profile.
free culture was not affected by treatment with the α-amylase. This suggested that the activity of the bacteriocin producing organism is not dependent on the glycosylation. However the activity was
2 4 6
Salt concentration(%)
S. aureus
P. aeroginosa
E.coli
P. vulgaris
B. subtilis
S. marsecens
Activity AU/mL
Protein µg/mL
Specific activity
Purification factor
400 4650 0.0860 1 precipitation fraction 200 3050 0.0655 0.761
600 2800 0.2142 3.27060% Ammonium sulphate precipitation fraction 400 4000 0.1 0.466
1200 1230 0.9756 9.756
Res., 2013, 3 (6):64-76 ______________________________________________________________________________
72 www.scholarsresearchlibrary.com
No. of cells after 24h×108
No. of cells after 48h×108
15.195 22.125 26.955 19.71
3.765
.
at different salt concentration
activity observed at 60% ammonium sulphate precipitation fraction. After further salting out it by dialysis there was increase in the activity from 400 AU/mL to 1200AU/mL. The total protein
decrease in the total protein concentration after
concentration as a percentage of the initial protein concentration.
amylase. This suggested that the activity of the bacteriocin producing organism is not dependent on the glycosylation. However the activity was
P. aeroginosa
S. marsecens
ification factor
Recovery (%) 100
0.761 65.59 3.270 60.21 0.466 86.02 9.756 26.45

Nirav Bhavsar et al ______________________________________________________________________________
Available online at
completely lost after the treatment with proteinase K suggesting the proteinecious nature of the bacteriocin. Similar results were found by many investigators regarding
Treatment with
Effect of temperature The inhibitory activity was unaffected by heating up to 70retained after autoclaving for 121°C for 15min and storing for two montin accord with several studies. [34biopreservative even in foods which are processed at higher temperature. The characterization data suggest that the given bacteriocin may belong to the class as group of small, heat-stable non lantibiotics which are antilisterial.
Table 7: Stability of bacteriocin after various heat treatment a
J. Microbiol. Biotech. Res.______________________________________________________________________________
Available online at www.scholarsresearchlibrary.com
he treatment with proteinase K suggesting the proteinecious nature of the bacteriocin. Similar results were found by many investigators regarding characterization of the bacteriocins [32
Treatment with α-amylase at different concentration.
Treatment with proteases at different concentration.
The inhibitory activity was unaffected by heating up to 70°C, 100°C for 15 min and considerable activity was retained after autoclaving for 121°C for 15min and storing for two months at low temperature(4°C). The results are
34;35]. This thermo stability behaviour of bacteriocins makes them suitable as biopreservative even in foods which are processed at higher temperature.
The characterization data suggest that the given bacteriocin may belong to the class IIbacteriocins which are defined stable non lantibiotics which are antilisterial.
Table 7: Stability of bacteriocin after various heat treatment and on storage.
Heat treatment Zone size in mm against S. aureus
Control 22 70˚C for 15min 22 100˚C for 15min 22 121˚C for 15min 15 4˚C for 2 months 22
Res., 2013, 3 (6):64-76 ______________________________________________________________________________
73 www.scholarsresearchlibrary.com
he treatment with proteinase K suggesting the proteinecious nature of the bacteriocin. Similar 32, 33].
°C, 100°C for 15 min and considerable activity was hs at low temperature(4°C). The results are
. This thermo stability behaviour of bacteriocins makes them suitable as
bacteriocins which are defined
nd on storage.

Nirav Bhavsar et al ______________________________________________________________________________
Available online at
Effect of Heat treatment on bacteriocin activity
Graph: 5
0
5
10
15
20
25
Zone
siz
e in
mm
J. Microbiol. Biotech. Res.______________________________________________________________________________
Available online at www.scholarsresearchlibrary.com
eatment on bacteriocin activity
Graph: 5 Stability of bacteriocin after various heat treatment.
Heat treatment
Zone size in mm against S. aureus
Res., 2013, 3 (6):64-76 ______________________________________________________________________________
74 www.scholarsresearchlibrary.com
.
Zone size in mm against S. aureus
Nirav Bhavsar et al J. Microbiol. Biotech. Res., 2013, 3 (6):64-76 ______________________________________________________________________________
75 Available online at www.scholarsresearchlibrary.com
Molecular weight determination by SDS-PAGE The SDS-PAGE analysis of partially purified sample confirmed the presence of unique band with antimicrobial activity. Its molecular weight was less than 6 kDa which is comparable with its thermostability and coincides with those of other others who reported that many bacteriocins of different LAB are relatively smaller molecules of simple structure. This bacteriocin can be called as lanthionine due to less than 10 kDa molecular weight [36, 37]. The bacteriocin was found to be thermostable after the heat treatment of 121˚C for 15min and enzymatic treatment with protease and amylase. Also the SDS-PAGE analysis shows that the given bacteriocin has a low molecular weight and hence it belongs to the class II bacteriocins which are small and thermostable.
CONCLUSION
Lactic acid bacteria have been recognized as safe, and bacteriocins produced by these microorganisms may be a good solution to the problem of resurgence of resistant strains to antibiotics. The explosion in bacteriocin research has been favoured by the recognition of the role that these producing bacteria may play in the hygienic quality assurance of food and as feed supplements. However, to date only few bacteriocins are used as biopreservatives. There is a need to attract consumer attention to the existence of natural substances that can protect against food-borne related illness. The acceptance of probiotics by the consumer was aided greatly when such bacteria were marketed as natural cultures that aid in digestion and health. In the same way, bacteriocins and bacteriocin-producing cultures should be attractive, especially as a consequence of consumer distrust of chemical preservatives. Since bacteriocins are considered natural products, they might have a good acceptance from costumers who start to demand more natural and safe food products.
REFERENCES
[1] Roy P. H. (1997), Med. Sci., 13, 927-933. [2] Lipsitch M.; Bergstrom C. T. and Levin B. R. (2000), Proc. Natl.Acad. Sci. USA, 97, 1938-1943. [3]Yoneyama H. and Katsumata R. (2006), Biosci.Biotechnol.Biochem.,70, 1060-1075. [4] Kumar A. and Schweiser H. P. (2005), Adv. Drug Deliv. Rev., 57, 1486-1513. [5] Fisher J. F., Meroueh S. O. and Mobashery S. (2005), Chem. Rev., 105, 395-424. [6]Deraz S. F., Karlsson E. N., Hedstrom M., Andersson M. M. and Mattiasson B. (2005), J. Biotechnol., 117, 343-354. [7]Ennahar S., Sashihara T., Sonomoto K. and Ishizaki A. (2000), FEMS Microbiol. Rev.,24, 85-106. [8] Oscáriz J.C. and A.G. Pisabarro. (2001), Int.Microbiol., 4, 13-19. [9] Ross R.P., Galvin M., McAuliffe O., Morgan S.M., Ryan M.P., Twomey D.P., Meaney W.J., Hill C.(1999), Antonie van Leeuwenhoek, 76, 337-46. [10]Schillinger U., Geisen R., Holzapfel W.H. (1996), Trends Food SciTechnol, 7, 158-64. [11]Appendini P., Hotchkiss J.H. (2002). Innov Food SciEmerg Technol.,3, 113-126. [12]Lowery,O.H., Rosenbrough N.J., Farr A.L. and Randall R.J. (1951), J. Riol. Chem., 193, 265-275. [13]Schillinger U., Kaya M., Lucke F.K. (1991), J ApplBacteriol, 70,473- 478. [14]Parente E., Giglio M.A., Ricciardi A., Clementi F. (1998). Int J Food Microbiol., 40,65-75. [15]Cheigh C.I., Choi Kim S.B., Pyun Y.R.(2000), J Appl Microbiol.,88, 563-571. [16]Yildirim Z., Johnson M.G. (1998), LettAppl Microbiol.,26, 297-304. [17]Svetoslav D., Todorov S.D., Danova S.T. (2006), J Basic Microbiol.,46, 226-238. [18]Galvez A., Abriouel H., Lopez R.L. (2007), Int J Food Microbiol.,120, 51-70. [19]Todorov S.D., Dicks L.M. (2004), J IndMicrobiol Biotechnol.,31, 323-329. [20] De Vuyst L., Callewaert R., Crabbe K. (1996), Microbiol.,142, 817-827. [21]Aasen I.M., Moreto T., Katla T., Axelsson L., Storro I. (2000), Appl. Microbiol. Biotechnol.,53,159–166. [22]Matsusaki H., Endo N., Sonomoto K., Ishizaki A. (1996), Appl. Microbiol. Biotechnol.,45, 36–40. [23]Aasen I.M., Moreto T., Katla T., Axelsson L., Storro I. (2000), Appl. Microbiol. Biotechnol.,53,159–166. [24] Kato T., Matsuda T., Ogawa E., Ogawa H., Kato H., Doi U., Nakamura R. (1994), J. Ferment. Bioeng.,77 ,277–282. [25]Todorov S., Gotcheva B., Dousset X., Onno B., Ivanova I. (2000), Biotechnol. Biotechnol. Eq.,14, 50–55. [26] Leroy F. and De Vuyst L. (1999a). Appl. Environ. Microbiol.,65, 974–981. [27]Korkeala H., Alanko T.T., Tiusanen T.(1992), Acta Vet. Scand.,33, 27–32.

Nirav Bhavsar et al J. Microbiol. Biotech. Res., 2013, 3 (6):64-76 ______________________________________________________________________________
76 Available online at www.scholarsresearchlibrary.com
[28]McMeekin T.A., Chandler R.E., Doe P.E., Garland C.D., Olley J., Putro S., Ratkowsky D.A., (1987), J. Appl. Bacteriol.,62, 543–550. [29]Passos F.V., Fleming H.P., Ollis D.F., Hassan H.M., Felder R.M., (1993), Appl. Microbiol. Biotechnol., 40, 143–150. [30]Uguen P., Hamelin J., Le Pennec J.P., Blanco C. (1999), Appl. Environ. Microbiol., 65, 291–293. [31] Leal-Sanchez M.V., Jimenez-Dia R., Maldonado- Barragan A., Garrido-Fernandez A., Ruiz-Lenski R.E., Riley M.A. (2002), Chemical warfare from an ecological perspective. ProcNatlAcadSci U S A,99, 556–558. [PubMed: 11805313] [32]Eijsink V.G., Skeie M., Middelhoven P.H., Brurberg M.B., Nes I.F. (1998), Appl. Environ. Microbiol., 64, 3275-3281. [33]Zamfir M., Callewaert R., Cormea P.C., De-Vuyst L. (2000), J. Appl. Microbiol.,87, 923-931. [34] Barefoot S.F., Klaenhammer T.R (1983), Appl. Environ. Microbiol., 45, 1808-1815 [35]Zamfir M., Callewaert R., Cormea P.C., De-Vuyst L. (2000), J. Appl. Microbiol.,87, 923-931. [36]Klaenhammer T.R. (1993). Biochimie., 70, 337-349. [37] Rattanachaikunsopon P. and Phumkhachorn P.(2010) Annals of Biological Research, 1 (4):218-228.