Bacterial communities reflect the spatial variation in pollutant levels in Brazilian mangrove...
16
1 23 Antonie van Leeuwenhoek Journal of Microbiology ISSN 0003-6072 Volume 99 Number 2 Antonie van Leeuwenhoek (2010) 99:341-354 DOI 10.1007/ s10482-010-9499-0 Bacterial communities reflect the spatial variation in pollutant levels in Brazilian mangrove sediment
-
Upload
independent -
Category
Documents
-
view
0 -
download
0
Transcript of Bacterial communities reflect the spatial variation in pollutant levels in Brazilian mangrove...
1 23
Antonie van LeeuwenhoekJournal of Microbiology ISSN 0003-6072Volume 99Number 2 Antonie van Leeuwenhoek(2010) 99:341-354DOI 10.1007/s10482-010-9499-0
Bacterial communities reflect the spatialvariation in pollutant levels in Brazilianmangrove sediment

1 23
Your article is protected by copyright and
all rights are held exclusively by Springer
Science+Business Media B.V.. This e-offprint
is for personal use only and shall not be self-
archived in electronic repositories. If you
wish to self-archive your work, please use the
accepted author’s version for posting to your
own website or your institution’s repository.
You may further deposit the accepted author’s
version on a funder’s repository at a funder’s
request, provided it is not made publicly
available until 12 months after publication.

ORIGINAL PAPER
Bacterial communities reflect the spatial variationin pollutant levels in Brazilian mangrove sediment
R. Peixoto • G. M. Chaer • F. L. Carmo •
F. V. Araujo • J. E. Paes • A. Volpon •
G. A. Santiago • A. S. Rosado
Received: 9 May 2010 / Accepted: 9 August 2010 / Published online: 29 August 2010
� Springer Science+Business Media B.V. 2010
Abstract The majority of oil from oceanic oil spills
converges on coastal ecosystems such as mangrove
forests. A major challenge to mangrove bioremedi-
ation is defining the mangrove’s pollution levels and
measuring its recuperation from pollution. Bioindi-
cators can provide a welcome tool for defining such
recovery. To determine if the microbial profiles
reflected variation in the pollutants, samples from
different locations within a single mangrove with a
history of exposure to oil were chemically character-
ised, and the microbial populations were evaluated by
a comprehensive range of conventional and molec-
ular methods. Multivariate ordination of denaturing
gradient gel electrophoresis (DGGE) microbial com-
munity fingerprints revealed a pronounced separation
between the sediment and rhizosphere samples for all
analysed bacterial communities (Bacteria, Betapro-
teobacteria, Alphaproteobacteria, Actinobacteria and
Pseudomonas). A Mantel test revealed significant
relationships between the sediment chemical fertility
and oil-derived pollutants, most of the bacterial
community fingerprints from sediment samples, and
the counts by different cultivation strategies. The
level of total petroleum hydrocarbons was signifi-
cantly associated with the Bacteria and Betaproteo-
bacteria fingerprints, whereas anthracene and the
total level of polycyclic aromatic hydrocarbons were
associated with the Actinobacteria. These results
show that microbial communities from the studied
mangrove reflect the spatial variation of the chemi-
cals in the sediment, demonstrating the specific
influences of oil-derived pollutants.
Keywords Mangrove � Microbial diversity � Oil �Bioindicators � NMS
Introduction
Mangroves grow in inter-tidal estuarine wetlands
along the coastlines of tropical and sub-tropical
regions; they are productive ecosystems (Kathiresan
and Binghan 2001) that provide various natural
functions of great ecological and economic
Electronic supplementary material The online version ofthis article (doi:10.1007/s10482-010-9499-0) containssupplementary material, which is available to authorized users.
R. Peixoto (&) � F. L. Carmo � A. S. Rosado
Laboratorio de Ecologia Microbiana Molecular, Instituto
de Microbiologia Paulo de Goes, Universidade Federal do
Rio de Janeiro, Rio de Janeiro 21941902, Brazil
e-mail: [email protected]
G. M. Chaer
Embrapa Agrobiologia, Seropedica, Rio de Janeiro, Brazil
F. V. Araujo
FFP-Faculdade de Formacao de Professores –
Universidade Estadual do Rio de Janeiro, Rio de Janeiro
24435000, Brazil
J. E. Paes � A. Volpon � G. A. Santiago
Petrobas, Rio de Janeiro 21941915, Brazil
123
Antonie van Leeuwenhoek (2011) 99:341–354
DOI 10.1007/s10482-010-9499-0
Author's personal copy
importance. Some of these functions include being an
important nursery for fish, crustaceans, molluscs,
reptiles and mammals, a habitat for bird nesting, a
site of carbon and nutrient accumulation, a location of
marine biomass renovation and a buffer that offers
protection against coastal erosion (Alongi 2002).
Generally, these unique environments are situated
in areas of high anthropogenic influence, and they are
often exposed to pollutants, such as those released by
oil spills (Burns et al. 1993; Li et al. 2007; Barbier et al.
2008). Thus, mangroves are at risk for extinction (Lee
et al. 2006; Duke et al. 2007), indicating an urgent need
to conserve, protect and restore these ecosystems
(Duke et al. 2007; Barbier et al. 2008). When properly
understood and managed, microorganisms provide a
wide range of ecosystem services, such as bioremedi-
ation, and are a promising alternative for the recovery
of impacted mangroves (Duke et al. 2000; Burns et al.
2000; Xu et al. 2003, 2005; Yun et al. 2008).
A major challenge for mangrove remediation is
defining the pollution levels in a mangrove and
measuring its recuperation. Typically, the chemical
parameters of the pollution levels, such as the level of
polycyclic aromatic hydrocarbons (PAH), are used to
determine the level of pollution; however, field
measurements of these parameters are extremely
variable (Santos et al. 2010a). Therefore, meaningful
mangrove monitoring strategies must be developed.
The microbial community structure likely serves as
an early indicator of ecosystem degradation or
improvement (Peixoto et al. 2006; Aboim et al.
2008; Santos et al. 2010b) because the soil/sediment
quality is strongly influenced by microbe-mediated
processes and can also have a strong influence on
microbial function and diversity.
Todos os Santos Bay is the largest Brazilian bay; it
is located in Bahia (BA) State (coordinates between
12�39’40’’S-13�S and 38�30’W-38�43’30’’W) and is
the second largest bay in the world. This bay is
affected by the presence of a large metropolitan area
and industrial activity, including an oil refinery
(Amado-Filho et al. 2008). The growth of urban
and industrial areas is responsible for the loss of
mangroves and other coastal wetlands due to the
impact of chemical pollutants, resulting in changes to
the hydrological and sedimentation regimes as well
as nutrient flow in these environments (Lee et al.
2006). Currently, only small regions with original
vegetation remain on Todos os Santos Bay; these are
in different stages of regeneration (Amado-Filho
et al. 2008).
Despite the economic and ecological importance of
the mangroves in Todos os Santos Bay, there are few
ecological reports about the impact of urbanisation on
this area (Venturini and Tommasi 2004; Martins et al.
2005; Amado-Filho et al. 2008). Furthermore, there
are no available studies on the microbial diversity of
Todos os Santos Bay mangroves that incorporate both
molecular and conventional methods, and there are
also no reports regarding the potential value of these
mangrove microbial communities for biotechnology
and bioremediation. Existing strategies for the mon-
itoring and recovery of this area are also poor.
We believe that different microbial population
profiles can indicate the impacts of different oil-
derived pollutants on mangroves. These microbial
markers could be used as indicators of environmental
changes in these ecosystems. The main goal of this
study was to determine whether there is a significant
correlation between mangrove microbial diversity
(using a comprehensive range of both dependent and
independent methods) and nutrients and oil-derived
pollutants and, additionally, to determine which
parameters influenced each bacterial group most
strongly. These results can be applied to identify
useful microbial groups for the biomonitoring of
petroleum-impacted mangroves.
Materials and methods
Sampling and physico-chemical analysis
of sediment
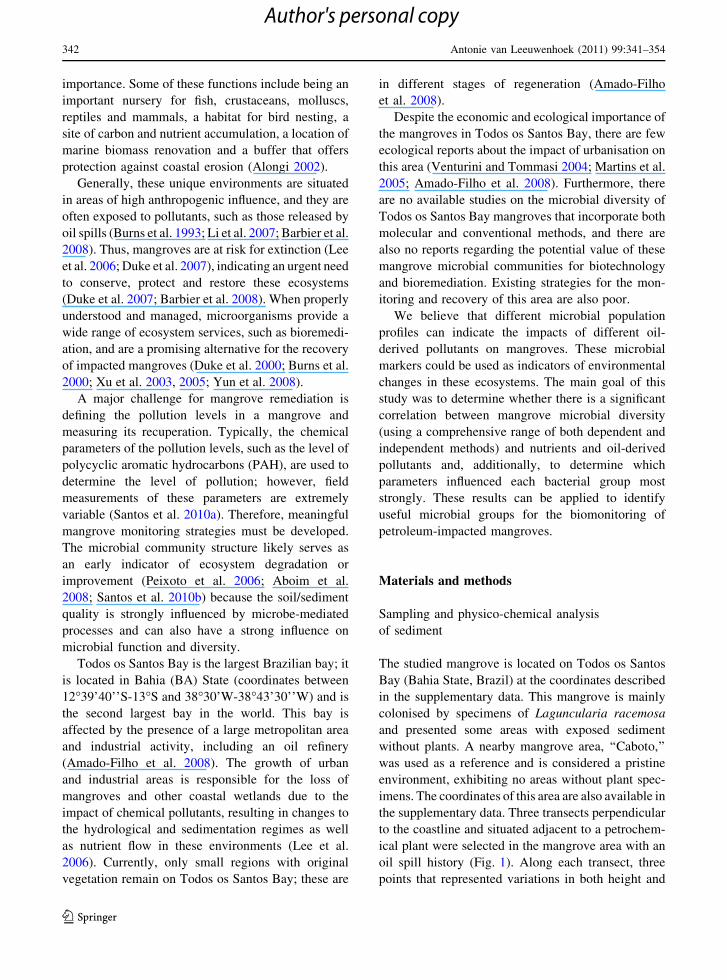
The studied mangrove is located on Todos os Santos
Bay (Bahia State, Brazil) at the coordinates described
in the supplementary data. This mangrove is mainly
colonised by specimens of Laguncularia racemosa
and presented some areas with exposed sediment
without plants. A nearby mangrove area, ‘‘Caboto,’’
was used as a reference and is considered a pristine
environment, exhibiting no areas without plant spec-
imens. The coordinates of this area are also available in
the supplementary data. Three transects perpendicular
to the coastline and situated adjacent to a petrochem-
ical plant were selected in the mangrove area with an
oil spill history (Fig. 1). Along each transect, three
points that represented variations in both height and
342 Antonie van Leeuwenhoek (2011) 99:341–354
123
Author's personal copy

vegetation density within the mangrove were chosen
for the collection of sediment and rhizosphere samples
in March of 2006. A total of nine points were sampled.
From each point, Laguncularia racemosa rhizosphere
samples and approximately 50 g of surface (0–5 cm)
sediment were collected in sterile plastic bags and
Falcon tubes, respectively, for microbial analysis.
Each sediment sample was composed of six sub-
samples collected near each corresponding rhizo-
sphere (within about 20 cm). Samples were stored at
–20�C. For PAH and THP measurement, 500 g of
collected sediment was transferred to a clean alumin-
ium container. For physico-chemical analysis, 500 g
of sediment was kept in a plastic bag and submitted to
an analysis of the sediment texture, pH, organic C and
macro- and micronutrients according to published
methodologies (Embrapa 1997). A global positioning
system (GPS) was used to determine the sampling
positions (see Table S1).
Sediment and rhizosphere samples from one
sampling point of the Caboto mangrove, which is
close to the Todos os Santos Bay but is located
farther (7 km) from the industrial plant, were col-
lected in triplicate and mixed to form a uniform
sample to serve as the outlier group in the molecular
and conventional analyses.
Sediment evaluation of total petroleum
hydrocarbon (TPH) and polycyclic aromatic
hydrocarbon (PAH) content
A 10-g aliquot of humid sediment (approximately 5 g
dry) from each sample was used for extraction with a
dichloromethane:acetone mixture (1:1) in a Soxhlet
extractor. Prior to the extraction, 100 ng of the
standard p-terfenil-d14 was added to the sample for
the aromatic fraction. The volume of the raw extract
was reduced in an evaporator via rotary flow of N2 to
yield a volume of 1 ml. Fraction separation was
accomplished by chromatography performed with
silica/alumina using a glass column. The aliphatic
hydrocarbon fraction (F1) (n-alkanes and isoprenoids)
was separated by elution with hexane. The fraction
containing PAH (F2) was eluted soon after the
addition of hexane:dichloromethane (1:1). The ali-
phatic fraction extract volume was reduced in a
rotating evaporator with a light flow of N2 and was
then adjusted to a volume of 1 ml. The internal
standard n-C24d was used for quantification. The US
EPA-8270D methodology (1998) was used for PAH
determination, with some modifications. The quanti-
fication was based on internal standardisation using a
mixture containing naphthalene-d8, acenaphthene-d10,
phenanthrene-d10, chrysene-d12 and perilene-d12.
The equipment was calibrated using nine solutions
(2, 5, 10, 20, 50, 100, 200, 400 and 1,000 ng/ml)
containing 16 PAH and internal standards in duplicate.
The PAH sum (16 compounds) and specific PAHs
(phenanthrene, naphthalene and anthracene) were
measured. For TPH determination, 200 ml of the
extract was collected from each fraction (aromatic and
aliphatic) into a single vial for injection into a gas
chromatography-mass spectrometry (GC–MS). TPH
quantification was accomplished by chromatography
of the gaseous phase with an ionisation detector. The
quantification limit for each PAH, when the extracted
dry sediment mass of approximately 5 g was consid-
ered, was approximately 4 ng/g.
Plating and counts
The sediment and rhizosphere samples were resus-
pended in 0.85% NaCl (1:10), shaken at 120 rpm for
60 min, and diluted from 10-1 to 10-7 in 0.85%
NaCl. The dilutions were inoculated on different
culture media (malt extract (Difco #211320), TSA
(Difco #236950) and marine agar (Difco #279110),
all from Difco, NJ, USA; King’s B prepared as
described by King et al. (1954); casein–starch
prepared as described by (Kuster and Williams
1964) and TY prepared as described by Holm and
Falsen (1967)). These media are semi-selective for
Sampling point 1
Composite sample C
Composite sample B
Composite sample A
Sea
Sampling point 2 Sampling point 3
Petrochemical Plant
Fig. 1 Sampling scheme showing the layout of the transects
in the mangrove adjacent to petrochemical plant
Antonie van Leeuwenhoek (2011) 99:341–354 343
123
Author's personal copy
different microbial groups, including Actinomycetes,
yeasts, heterotrophics, bacteria that are salt tolerant
and Pseudomonas. Samples were added to TY
medium both before and after the pasteurisation
process (80�C for 30 min). Pasteurisation of the
samples was performed to promote the selection of
spore-forming strains. The plates were incubated at
28�C, and the CFU counts were performed after 2 and
7 days. Colonies with different morphologies were
selected, isolated and then inoculated in solid Bush-
nell-Hass medium (BH medium [Difco #257820]
plus ultrapure agar; BBL, Difco, NJ, USA) with 1%
crude oil added to test the morphotype’s ability to
grow with oil as the only carbon source.
Hydrocarbon-degrading bacteria prepared in BH
medium were also analysed by the most probable
number (MPN) method. Microtiter plates were
prepared using 175 ll of BH medium and 100 ll of
each diluted sample per well in triplicate, followed by
the addition of 25 ll of oil. The growth results were
obtained by monitoring the last three dilutions that
presented positive growth and by searching in the
MPN table for a positive combination of tubes
according to the turbidity and degradation levels.
This value was corrected by the dilution factor and
expressed as MPN/100 ml. MPN analyses of anaer-
obic microorganisms were also performed, as
described by Drake et al. (1996).
We chose these media and strategies to include
many different bacterial groups, which is an impor-
tant aspect of obtaining a comprehensive picture of
the microbial diversity of this mangrove.
Total DNA extraction from environmental
samples
Samples of 0.5 g sediment and rhizosphere cell
pellets (obtained as described by Bakken and Lindahl
1995) were subjected to a direct DNA extraction
method using the BIO 101 DNA extraction kit (Q
Biogene, Carlsbad, USA) according to the manufac-
turer’s instructions.
Clone libraries
All nine individual samples of sediment from the
mangrove with an oil spill history were mixed to
make one unique and uniform sample to indicate the
general microbial diversity of this environment.
Bacterial 16S rRNA genes were amplified using the
U968-L1401 set of primers (13). The PCR mixture
(25 ll) contained 10.2 mM Tris buffer, 2.3 mM
MgCl2, 50 mM KCl, 2% DMSO, 0.05 lg BSA,
0.2 mM of each dNTP, 0.2 lM of each primer, 0.5 U
of Taq DNA polymerase and 20 ng DNA. PCR was
performed in the PerkinElmer GeneAmp PCR Sys-
tem 9700 (PerkinElmer Applied Biosystems, Nieu-
werkerk a/d IJsel, the Netherlands) using the
following program: 95�C for 5 min; 35 cycles of
94�C for 1 min, 57.5�C for 30 s, 72�C for 4 min and
a final elongation step of 72�C for 7 min.
The PCR product was inserted into the pGEM-T
easy vector (Promega, Madison, USA) according to
the manufacturer’s protocol. Electro-competent
Escherichia coli DH5-a cells were transformed by
this vector, and 400 clones were selected randomly.
The clones were sequenced after performing a
Miniprep procedure. Sequencing reactions were per-
formed on the plasmid material according to the PE
ABI Prism protocol (Applied Biosystems, Foster
City, USA), using primer 1401 to avoid vector
contamination. Sequence runs were performed on a
MEGABACE DNA sequencer (Applied Biosystems,
Foster City, USA).
All chromatograms were analysed for sequence
quality using Bioedit. Sequences containing ambigu-
ities were not analysed further. Sequences were
screened for vector contamination using NCBI’s
VecScreen (http://www.ncbi.nlm.nih.gov), and con-
taminated sequences were eliminated. The remaining
sequences were then classified using BlastN (http://
blast.ncbi.nlm.nih.gov/Blast.cgi).
PCR and denaturing gradient gel electrophoresis
(DGGE)
PCR for DGGE evaluation was performed with a
universal set of bacterial primers, U968f-GC1-L1401,
as previously described by Heuer and Smalla (1997),
and group-specific primers described by Costa and
colleagues (2006). DNA from each sample was
quantified using the Qubit fluorometer (Invitrogen)
and the same amount of DNA (20 ng) was added to
each PCR mixture.
DGGE of the amplified gene sequences was
performed using a DCode System (universal mutation
detection system; Bio-Rad). The GC-clamped ampli-
cons were applied to a polyacrylamide gel containing
344 Antonie van Leeuwenhoek (2011) 99:341–354
123
Author's personal copy

6% acrylamide with a gradient of 45–70% denaturant
(urea and formamide). All gels were loaded with
DNA markers in the first and last lanes, surrounding
the lanes with samples, to allow gel standardisation
according to the manufacturer’s instructions. The run
was performed in 1X Tris–acetate-EDTA buffer at
60�C at a constant voltage of 70 V for 17 h. The
DGGE gels were stained with Sybr Green and
visualised using a Storm 860 Imaging System (GE
Healthcare). The dendrograms were constructed after
the image capture and analysis by Pearson’s corre-
lation coefficients (r) and cluster analysis was
performed by the unweighted pair group method
with average linkages (UPGMA) using the BioNum-
erics software (Applied Maths, Ghent, Belgium).
Each band was identified and its intensity was
measured. This band intensity was then expressed
as a proportion of the total intensity of all bands
comprising a particular community profile.
Statistical analyses
Multivariate analyses were performed using the PC-
ORD statistical package V5 (B. McCune and M.J.
Mefford, PC-ORD for Windows: multivariate analy-
sis of ecological data, MjM Software, Gleneden
Beach, OR). A Mantel test (Douglas and Endler
1982), which evaluates the null hypothesis of no
relationship between two distance matrices, was used
to evaluate the association between the matrix of the
sediment chemical properties and the matrix of the
CFU counts from the different cultivation media. The
same strategy was used to evaluate the association
between the DGGE fingerprints from the sediment
and rhizosphere samples and the matrices of the
chemical properties and the CFU counts. All Mantel
analyses were run using Mantel’s asymptotic approx-
imation method and the Sørensen distance (Bray and
Curtis 1957).
The matrices were generated by Bionumerics
software (Applied Maths) according to the manufac-
turer’s instructions using bands with a quantitative
value (surface). Then, the matrices of the sediment
chemical properties and of the microbial community
fingerprints that were obtained by the DGGE analyses
of the sediment and rhizosphere samples were
ordinated using non-metric multidimensional scaling
(NMS) analysis (Kruskal 1964; Mather 1976) run
with the Sørensen distance matrices. NMS was
performed using a random starting configuration,
and the data matrix was analysed using 50 runs with
real data and compared to a Monte Carlo test with 50
runs on randomised data. The NMS solution was
constrained to two dimensions to simplify the data
analysis (stability criterion = 0.00001; iterations to
evaluate stability = 15; maximum number of itera-
tions = 250). The stability of the reduced-dimen-
sional ordination pattern was assessed by plotting the
values of stress versus the iteration number. For
ordinations, a secondary matrix was used to overlay
the major gradients of oil-derived pollutants, thus
allowing the direct assessment of the relationship
between each of these environmental variables and
the variations in the microbial profiles. All resulting
bi-dimensional ordinations were graphically dis-
played after being rotated to maximise the correlation
of the organic pollutants with axis 1.
Richness and diversity indices were calculated
based on the DGGE results using PC-ORD. Richness
(R) was defined as the total number of bands detected in
the DGGE for a given sample. The Shannon index (H’)
(Shannon and Weaver 1949) was calculated according
to the following equation: H’ = - RP log P, where Pis the proportion represented by each DGGE band
relative to the total number of bands. These indices
were also overlaid in the NMS ordinations.
Results
Physico-chemical characterisation of sediment
samples
The sediment texture of both the studied mangrove
and the reference mangrove was classified as silty
clay loam. Different concentrations of nutrients and
oil-derived chemical pollutants were found in the
nine transects and in the reference mangrove sedi-
ment sampling points (Table S1). The bi-dimensional
NMS ordination showed that the samples were
grouped according to their chemical properties
(Fig. 2). Ordination axis 1 (80% of the total data
variance) formed three groups, from left to right: (1)
Caboto mangrove samples, (2) transect 2 (S2A, S2B
and S2C) samples, and (3) transect 1 (S1A, S1B and
S1C) and 3 (S3A, S3B and S3C) samples. Transects 1
and 3 were characterised by higher levels of P, Zn
and most of the oil-derived pollutants evaluated. In
Antonie van Leeuwenhoek (2011) 99:341–354 345
123
Author's personal copy

contrast, the Caboto and transect 2 samples had lower
levels of these chemicals, as well as higher levels of
Cu and Mn. Transect 1 differed from transect 3 along
axis 2 (16% of the total variance) because transect 1
had lower levels of Na and higher levels of THP,
organic C, total N and P.
Plating and CFU counts
The CFU counts varied in accordance with the
culture medium, ranging from 106 to 108 cells/g of
sediment or rhizosphere (Fig. 3a, b). The highest
counts, approximately 105–106 cells/g, were obtained
in marine agar media and in the MPN of anaerobic
microorganisms from uniform sediment samples. The
lowest counts were detected in the TY medium that
was inoculated with samples after the pasteurisation
process and in the King’s B medium, which is semi-
selective for Pseudomonas spp. A Mantel test anal-
ysis revealed a significant association between the
distance matrix based on the CFU counts in the nine
culture strategies and the distance matrix based on the
sediment chemical properties, as shown in Table 1
(r = 0.32, P \ 0.01).
To determine the biotechnological potential of the
obtained isolates, a total of 364 different morpholog-
ical isolates (47 from King’s B, 36 from TY, 49 from
amido caseine, 60 from malt extract, 73 from marine
agar, and 99 from TSA) were tested for their
S cab
S1AS1B
S1C
S2A
S2B
S2C
S3A
S3B
S3C
TPH
16 PAH
Phe
Ant
Nap
P
C org
Zn
Cu
Mn
N
Na
Axis 1 (80%)
Axi
s 2
(16%
)
Sampling Point 2
2A, 2B, 2C
Sampling Point 1
1A, 1B, 1C
Sampling Point 3
3A, 3B, 3C
Fig. 2 NMS ordination of the sediment samples from the
Todos os Santos Bay mangroves in the chemical properties
space. The studied mangrove is represented by nine sampling
points that were collected on three transects perpendicular to
the coastline (1A, 1B and 1C; 2A, 2B and 2C; 3A, 3B and 3C),
and a reference mangrove is represented by ‘‘cab’’. The
fraction of the total variance that was accounted for by each
axis is indicated in parentheses. Statistically significant
gradients of soil chemical properties are overlaid (correlation
coefficient with axes 1 or 2 [ 0.63). TPH total petroleum
hydrocarbon, 16 PAH petroleum aromatic hydrocarbon, Phephenanthrene, Ant anthracene, Nap naphthalene, P available
phosphorous, N total nitrogen, C org organic carbon, Zn zinc,
Cu copper, Mn manganese
0 2 4 6 8
cells/g
0 2 4 6 8
cells/g
A
B
Fig. 3 CFU counts using different culture media (King’s B,
TY [samples were plated before and after the pasteurisation
process], malt extract, casein starch, TSA and marine agar) and
MPN results used to evaluate the microbial rates in individual
rhizosphere samples (a) or the composed (Comp) sediment
samples (b) of the studied and reference mangroves in Todos
os Santos Bay
346 Antonie van Leeuwenhoek (2011) 99:341–354
123
Author's personal copy
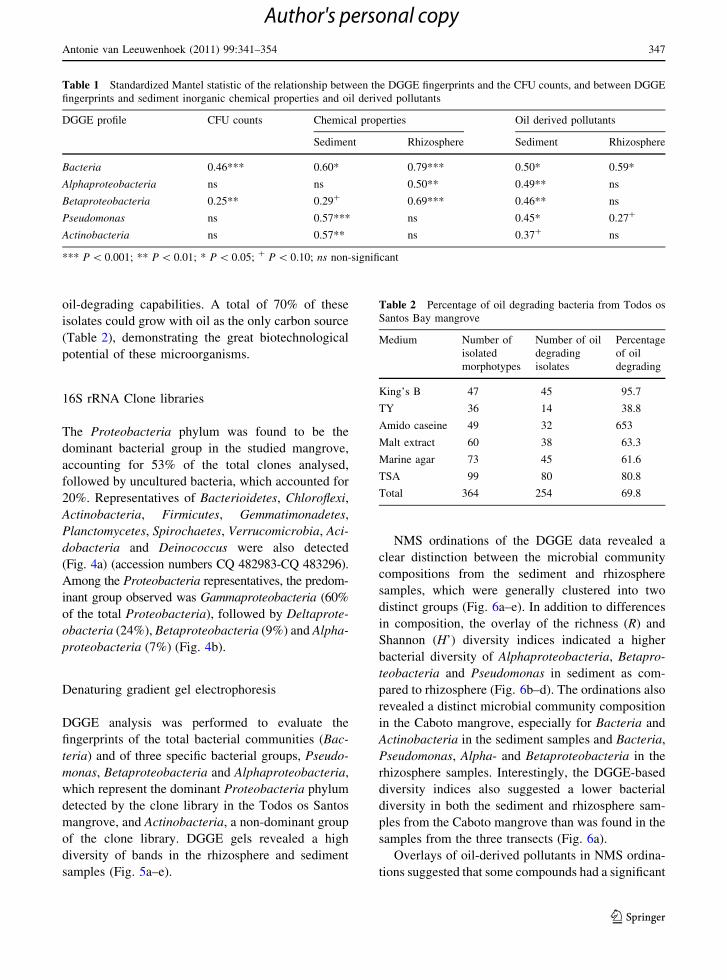
oil-degrading capabilities. A total of 70% of these
isolates could grow with oil as the only carbon source
(Table 2), demonstrating the great biotechnological
potential of these microorganisms.
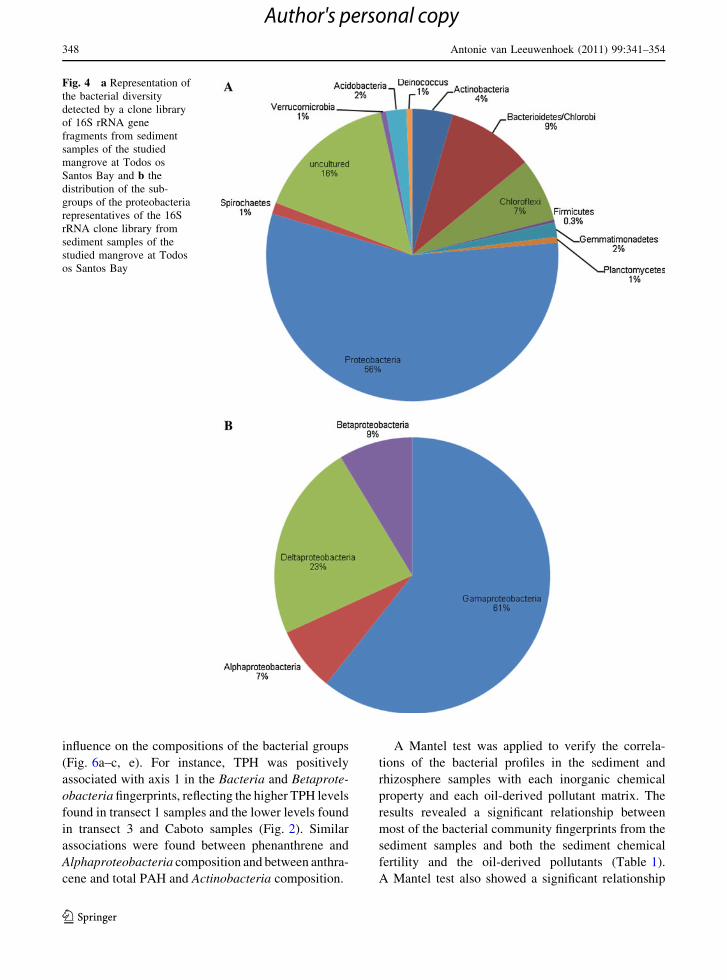
16S rRNA Clone libraries
The Proteobacteria phylum was found to be the
dominant bacterial group in the studied mangrove,
accounting for 53% of the total clones analysed,
followed by uncultured bacteria, which accounted for
20%. Representatives of Bacterioidetes, Chloroflexi,
Actinobacteria, Firmicutes, Gemmatimonadetes,
Planctomycetes, Spirochaetes, Verrucomicrobia, Aci-
dobacteria and Deinococcus were also detected
(Fig. 4a) (accession numbers CQ 482983-CQ 483296).
Among the Proteobacteria representatives, the predom-
inant group observed was Gammaproteobacteria (60%
of the total Proteobacteria), followed by Deltaprote-
obacteria (24%), Betaproteobacteria (9%) and Alpha-
proteobacteria (7%) (Fig. 4b).
Denaturing gradient gel electrophoresis
DGGE analysis was performed to evaluate the
fingerprints of the total bacterial communities (Bac-
teria) and of three specific bacterial groups, Pseudo-
monas, Betaproteobacteria and Alphaproteobacteria,
which represent the dominant Proteobacteria phylum
detected by the clone library in the Todos os Santos
mangrove, and Actinobacteria, a non-dominant group
of the clone library. DGGE gels revealed a high
diversity of bands in the rhizosphere and sediment
samples (Fig. 5a–e).
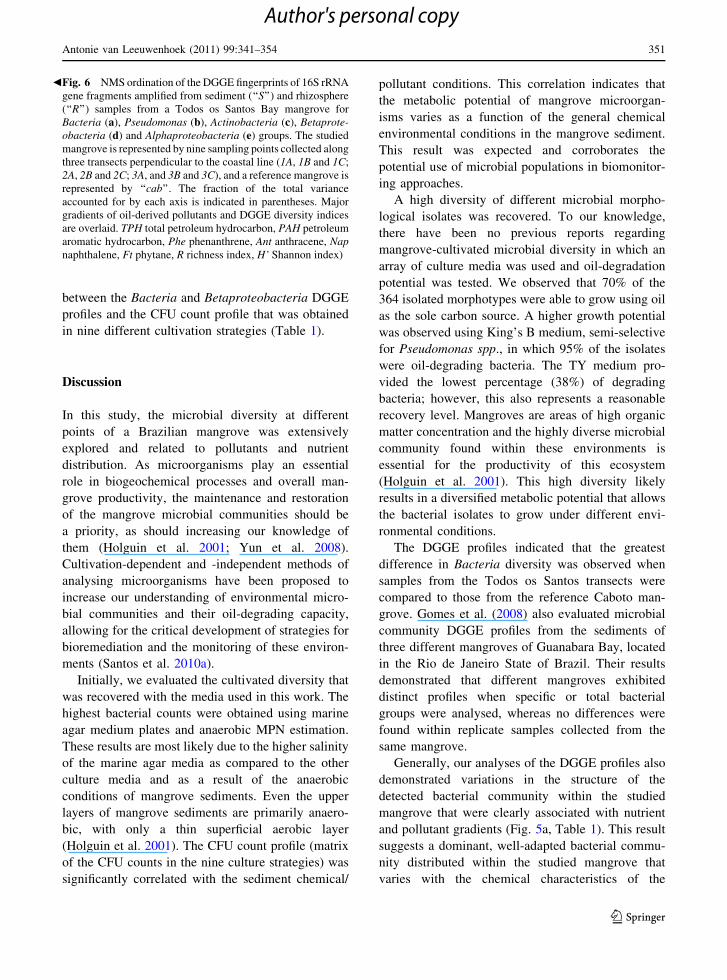
NMS ordinations of the DGGE data revealed a
clear distinction between the microbial community
compositions from the sediment and rhizosphere
samples, which were generally clustered into two
distinct groups (Fig. 6a–e). In addition to differences
in composition, the overlay of the richness (R) and
Shannon (H’) diversity indices indicated a higher
bacterial diversity of Alphaproteobacteria, Betapro-
teobacteria and Pseudomonas in sediment as com-
pared to rhizosphere (Fig. 6b–d). The ordinations also
revealed a distinct microbial community composition
in the Caboto mangrove, especially for Bacteria and
Actinobacteria in the sediment samples and Bacteria,
Pseudomonas, Alpha- and Betaproteobacteria in the
rhizosphere samples. Interestingly, the DGGE-based
diversity indices also suggested a lower bacterial
diversity in both the sediment and rhizosphere sam-
ples from the Caboto mangrove than was found in the
samples from the three transects (Fig. 6a).
Overlays of oil-derived pollutants in NMS ordina-
tions suggested that some compounds had a significant
Table 1 Standardized Mantel statistic of the relationship between the DGGE fingerprints and the CFU counts, and between DGGE
fingerprints and sediment inorganic chemical properties and oil derived pollutants
DGGE profile CFU counts Chemical properties Oil derived pollutants
Sediment Rhizosphere Sediment Rhizosphere
Bacteria 0.46*** 0.60* 0.79*** 0.50* 0.59*
Alphaproteobacteria ns ns 0.50** 0.49** ns
Betaproteobacteria 0.25** 0.29? 0.69*** 0.46** ns
Pseudomonas ns 0.57*** ns 0.45* 0.27?
Actinobacteria ns 0.57** ns 0.37? ns
*** P \ 0.001; ** P \ 0.01; * P \ 0.05; ? P \ 0.10; ns non-significant
Table 2 Percentage of oil degrading bacteria from Todos os
Santos Bay mangrove
Medium Number of
isolated
morphotypes
Number of oil
degrading
isolates
Percentage
of oil
degrading
King’s B 47 45 95.7
TY 36 14 38.8
Amido caseine 49 32 653
Malt extract 60 38 63.3
Marine agar 73 45 61.6
TSA 99 80 80.8
Total 364 254 69.8
Antonie van Leeuwenhoek (2011) 99:341–354 347
123
Author's personal copy
influence on the compositions of the bacterial groups
(Fig. 6a–c, e). For instance, TPH was positively
associated with axis 1 in the Bacteria and Betaprote-
obacteria fingerprints, reflecting the higher TPH levels
found in transect 1 samples and the lower levels found
in transect 3 and Caboto samples (Fig. 2). Similar
associations were found between phenanthrene and
Alphaproteobacteria composition and between anthra-
cene and total PAH and Actinobacteria composition.
A Mantel test was applied to verify the correla-
tions of the bacterial profiles in the sediment and
rhizosphere samples with each inorganic chemical
property and each oil-derived pollutant matrix. The
results revealed a significant relationship between
most of the bacterial community fingerprints from the
sediment samples and both the sediment chemical
fertility and the oil-derived pollutants (Table 1).
A Mantel test also showed a significant relationship
Fig. 4 a Representation of
the bacterial diversity
detected by a clone library
of 16S rRNA gene
fragments from sediment
samples of the studied
mangrove at Todos os
Santos Bay and b the
distribution of the sub-
groups of the proteobacteria
representatives of the 16S
rRNA clone library from
sediment samples of the
studied mangrove at Todos
os Santos Bay
348 Antonie van Leeuwenhoek (2011) 99:341–354
123
Author's personal copy

Fig. 5 DGGE fingerprints and sampling site comparison of
16S rRNA gene fragments amplified from sediment and
rhizosphere samples from the studied Todos os Santos Bay
mangrove for Bacteria (a), Alphaproteobacteria (b), Betapro-teobacteria (c), Pseudomonas (d) and Actinobacteria(e) groups. The studied mangrove is represented by nine
sampling points (1A, 1B, 1C, 2A, 2B, 2C, 3A, 3B and 3C), and
the reference mangrove is represented by ‘‘cab’’. ‘‘S’’ and ‘‘R’’
denote sediment and rhizosphere, respectively. Dendrograms
were generated by Bionumerics/Gel compare software cluster
analysis using Pearson’s coefficient index and UPGMA
Antonie van Leeuwenhoek (2011) 99:341–354 349
123
Author's personal copy

R cab
R1A
R1B
R1CR2A
R2B
R2C
R3AR3B
R3C
S cab
S1A
S1BS1C
S2AS2B
S2CS3A
S3B
S3C
R H
TPH
Axis 1 (44%)
Axi
s 2
(35%
)
R cab
R1A
R1B
R1C
R2AR2B
R2C
R3AR3BR3C
S cab
S1A
S1B
S1C
S2A
S2BS2C
S3AS3B
S3CRH
Phe
Axis 1 (36%)
Axi
s 2
(37%
)
R cab
R1A
R1BR1C
R2A
R2B
R2C
R3A
R3B
R3C
S cab
S1A
S1B
S1C
S2A
S2B
S2CS3A
S3B
S3C
RH
TPH
Axis 1 (31%)
Axi
s 2
(48%
)
R cab
R1A
R1B
R1C
R2A
R2B
R2C
R3A
R3B
R3C
S cab
S1A
S1B
S1C
S2A
S2BS2C S3A
S3BS3C
R
H
Axis 1 (15%)
Axi
s 2
(34%
)
Bacteria Alphaproteobacteria
Betaproteobacteria Pseudomonas
R cab
R1A
R1B
R1C
R2A
R2B
R2C
R3A
R3B
R3C
S cab
S1A
S1BS1CS2A
S2B
S2C
S3A
S3B
S3C
16 PAH
Ant
Axis 1 (32%)
Axi
s 2
(24%
)
Actinobacteria
A B
C D
E
350 Antonie van Leeuwenhoek (2011) 99:341–354
123
Author's personal copy
between the Bacteria and Betaproteobacteria DGGE
profiles and the CFU count profile that was obtained
in nine different cultivation strategies (Table 1).
Discussion
In this study, the microbial diversity at different
points of a Brazilian mangrove was extensively
explored and related to pollutants and nutrient
distribution. As microorganisms play an essential
role in biogeochemical processes and overall man-
grove productivity, the maintenance and restoration
of the mangrove microbial communities should be
a priority, as should increasing our knowledge of
them (Holguin et al. 2001; Yun et al. 2008).
Cultivation-dependent and -independent methods of
analysing microorganisms have been proposed to
increase our understanding of environmental micro-
bial communities and their oil-degrading capacity,
allowing for the critical development of strategies for
bioremediation and the monitoring of these environ-
ments (Santos et al. 2010a).
Initially, we evaluated the cultivated diversity that
was recovered with the media used in this work. The
highest bacterial counts were obtained using marine
agar medium plates and anaerobic MPN estimation.
These results are most likely due to the higher salinity
of the marine agar media as compared to the other
culture media and as a result of the anaerobic
conditions of mangrove sediments. Even the upper
layers of mangrove sediments are primarily anaero-
bic, with only a thin superficial aerobic layer
(Holguin et al. 2001). The CFU count profile (matrix
of the CFU counts in the nine culture strategies) was
significantly correlated with the sediment chemical/
pollutant conditions. This correlation indicates that
the metabolic potential of mangrove microorgan-
isms varies as a function of the general chemical
environmental conditions in the mangrove sediment.
This result was expected and corroborates the
potential use of microbial populations in biomonitor-
ing approaches.
A high diversity of different microbial morpho-
logical isolates was recovered. To our knowledge,
there have been no previous reports regarding
mangrove-cultivated microbial diversity in which an
array of culture media was used and oil-degradation
potential was tested. We observed that 70% of the
364 isolated morphotypes were able to grow using oil
as the sole carbon source. A higher growth potential
was observed using King’s B medium, semi-selective
for Pseudomonas spp., in which 95% of the isolates
were oil-degrading bacteria. The TY medium pro-
vided the lowest percentage (38%) of degrading
bacteria; however, this also represents a reasonable
recovery level. Mangroves are areas of high organic
matter concentration and the highly diverse microbial
community found within these environments is
essential for the productivity of this ecosystem
(Holguin et al. 2001). This high diversity likely
results in a diversified metabolic potential that allows
the bacterial isolates to grow under different envi-
ronmental conditions.
The DGGE profiles indicated that the greatest
difference in Bacteria diversity was observed when
samples from the Todos os Santos transects were
compared to those from the reference Caboto man-
grove. Gomes et al. (2008) also evaluated microbial
community DGGE profiles from the sediments of
three different mangroves of Guanabara Bay, located
in the Rio de Janeiro State of Brazil. Their results
demonstrated that different mangroves exhibited
distinct profiles when specific or total bacterial
groups were analysed, whereas no differences were
found within replicate samples collected from the
same mangrove.
Generally, our analyses of the DGGE profiles also
demonstrated variations in the structure of the
detected bacterial community within the studied
mangrove that were clearly associated with nutrient
and pollutant gradients (Fig. 5a, Table 1). This result
suggests a dominant, well-adapted bacterial commu-
nity distributed within the studied mangrove that
varies with the chemical characteristics of the
Fig. 6 NMS ordination of the DGGE fingerprints of 16S rRNA
gene fragments amplified from sediment (‘‘S’’) and rhizosphere
(‘‘R’’) samples from a Todos os Santos Bay mangrove for
Bacteria (a), Pseudomonas (b), Actinobacteria (c), Betaprote-obacteria (d) and Alphaproteobacteria (e) groups. The studied
mangrove is represented by nine sampling points collected along
three transects perpendicular to the coastal line (1A, 1B and 1C;
2A, 2B and 2C; 3A, and 3B and 3C), and a reference mangrove is
represented by ‘‘cab’’. The fraction of the total variance
accounted for by each axis is indicated in parentheses. Major
gradients of oil-derived pollutants and DGGE diversity indices
are overlaid. TPH total petroleum hydrocarbon, PAH petroleum
aromatic hydrocarbon, Phe phenanthrene, Ant anthracene, Napnaphthalene, Ft phytane, R richness index, H’ Shannon index)
b
Antonie van Leeuwenhoek (2011) 99:341–354 351
123
Author's personal copy
sediment. For instance, Bacteria profiles in the
rhizosphere and sediment from transect 1 were most
influenced by the expressive presence of TPH,
followed by samples from transects 2 and 3, and
finally samples from the Caboto mangrove. This
sequence corresponds to differences in the average
levels of TPH found in the sediment from the transect
and Caboto sampling points.
A significant correlation was also observed
between the Bacteria DGGE profile and the CFU
count profile (Table 1), indicating a correspondence
between the genetic structure and the metabolic
potential of the mangrove microorganisms. For
specific bacterial groups, with the exception of
Betaproteobacteria, no significant correlations were
detected. This result indicates a high relative amount
of Betaproteobacteria among the cultivated isolates.
With the intention to detect the dominant and non-
dominant groups observed within the studied man-
grove, a clone library was constructed. Sequencing
the DNA of the recovered clones revealed a high
prevalence of the Proteobacteria phylum (57% of
analysed sequences), with Gammaproteobacteria
being the most abundant group, followed by Delta-
proteobacteria, Betaproteobacteria and Alphaprote-
obacteria. Liao and colleagues (2007) also found a
dominance of Proteobacteria 16S rDNA sequences
in a clone library analysis of a Taiwanese estuary.
The clone library also demonstrated that 20% of the
community was comprised of unclassified represen-
tatives, which was expected because any environ-
mental sample can provide a site for uncultivated
bacteria. Additionally, mangroves are highly produc-
tive ecosystems (Holguin et al. 2001) and are
potential sources of previously uncultivated bacteria
for biotechnological exploration.
Based on our clone library results, and to elucidate
whether the distributions of other specific bacterial
groups were similar to the total Bacteria distribution,
the fingerprint profiles of both dominant, and likely
well-adapted, groups in this environment (Proteobac-
teria phylum) and less abundant groups (Actinobac-
teria phylum) were analysed. NMS ordination of the
DGGE profiles indicated that in all bacterial group
profiles, the influence of the rhizosphere was stronger
than that of the geographical location of samples, as
microbial communities from the rhizosphere and
sediment formed distinct groups in most of the
situations evaluated (Fig. 4a–d). The exception was
the Actinobacteria profile, in which samples were
more randomly ordinated. Because Actinobacteria
was not classified as a dominant bacterial represen-
tative in this environment by our clone library
analyses, this group could be more sensitive to small
variations in different niches that were not evaluated.
Interestingly, the richness (R) and Shannon (H’)
indices did not differ between the rhizosphere and
sediment samples for Actinobacteria, but they did
differ among Alphaproteobacteria, Betaproteobacte-
ria and Pseudomonas (Fig. 4b–e).
The rhizosphere is the portion of the soil that
forms the complex habitat of plant roots, and its
composition can be altered by root activity. An
important component of the rhizosphere is the
actively growing microbial population that feeds on
the organic nutrients in the root exudates (Bashan and
Holguin 1997, 2002). We hypothesise that the higher
levels of microbial diversity of some of the analysed
bacterial groups in the sediment as compared to the
rhizosphere might be the result of a stress state of the
mangrove plants in transects of the mangrove with an
oil spill history. Therefore, these stressed plants
might not be contributing a high amount or diversity
of exudates and consequently might not enrich the
rhizosphere soil with nutrients. This hypothesis is
corroborated by the higher microbial diversity that is
observed in the Caboto mangrove rhizosphere sam-
ples when compared to transect rhizospheres.
The detected differences in microbial diversity,
especially between sediment samples, indicate that
even on a small scale, when compared to variations
with other mangrove sites, abiotic factors or pollutant
distributions can generate niche variations that influ-
ence bacterial profile clusters within the same man-
grove area. Mangroves are complex and heterogeneous
environments that are influenced by plant diversity,
plant abundance, tidal variations and sediment niches,
which are factors that encompass variations in pollu-
tants and nutrient levels. The determination of the
microbial heterogeneity within a mangrove is critical
because microorganisms can be used as early indica-
tors of environmental changes (Peixoto et al. 2006;
Aboim et al. 2008). The association of molecular tools
with statistical tools could provide such information, as
uncultured organisms comprise the majority of the
microbial world (Nocker et al. 2007; Roesch et al.
2007). For instance, phenanthrene was more associated
with the composition of the Alphaproteobacteria taxa,
352 Antonie van Leeuwenhoek (2011) 99:341–354
123
Author's personal copy

whereas 16 PAH and specific anthracene PAH were
more associated with the Actinobacteria group. These
data are important for guiding the choice of potential
groups for further bioremediation or for approaches to
monitoring each type of pollutant in mangrove
ecosystems.
The conservation of mangroves and other related
ecosystems depends on studies that determine to what
extent pollutants can affect the different forms of life in
these areas and on the definitions of groups that can be
used in monitoring programs. We believe that the
results presented in this study represent a small but
important step in this direction, confirming the hypoth-
esis that microbial diversity profiles can be used as
indicators of the pollutant gradient in mangroves and
also indicating the specific oil-derived compounds
(phenanthrene or total 16 PAH and anthracene) that
most influenced certain bacterial groups (Alphaprote-
obacteria and Actinobacteria, respectively).
Acknowledgments This study was supported by a grant from
Petrobras. A.S. Rosado and R.S. Peixoto also greatly appreciate
the support of CNPq and FAPERJ. The authors would like to
thank RG Taketani, S Paim, EA dos Reis and B Fonseca for
technical assistance.
References
Aboim M, Peixoto RS, Coutinho HL, Barbosa J, Rosado AS
(2008) Soil bacterial community structure and soil quality
in a slash-and-burn cultivation system in Southeastern
Brazil. Appl Soil Ecol 38:100–108
Alongi DM (2002) Present state and future of the world’s
mangrove forests. Austral Inst Mar Sci 29:331–349
Amado-Filho GM, Salgado LT, Rebelo MF, Rezende CE,
Karez CS, Pfeiffer WC (2008) Heavy metals in benthic
organisms from Todos os Santos Bay, Brazil. Brazil J Biol
68(1):95–100
Bakken LR, Lindahl V (1995) Recovery of bacterial cells from
soil. In: Trevors JT, van Elsas JD (eds) Nucleic acids in
the environment methods and applications. Springer-
Verlag, Berlin, Germany, pp 9–27
Barbier EB, Koch EW, Siliman BR, Hacker SD, Wolanski E,
Primavera J et al (2008) Coastal ecosystem-based man-
agement with nonlinear ecological functions and values.
Science 318:321–323
Bashan Y, Holguin G (1997) Azospirillum plant relationships
environmental and physiological advances (1990–1996).
Can J Microbiol 43:103–121
Bashan Y, Holguin G (2002) Plant growth-promoting bacteria:
a potential tool for arid mangrove reforestation. Trees
16:159–166
Bray JR, Curtis JT (1957) An ordination of the upland forest
communities in southern Wisconsin. Ecol Monitor 27:
325–349
Burns KA, Levings S, Garrity S (1993) How many years before
mangrove ecosystem recover from catastrophic oil spills?
Mar Pollut Bull 26:239–248
Burns KA, Codi S, Duke NC (2000) Gladstone, Australia field
studies: weathering and degradation of hydrocarbons in
oiled mangrove and salt marsh sediments with and with-
out the application of an experimental bioremediation
protocol. Mar Pollut Bull 41:392–402
Costa R, Gotz M, Mrotzek N, Berg G, Lottmann J, Smalla K
(2006) Effects of site and plant species on rhizosphere
community structure as revealed by molecular analysis of
different microbial guilds. FEMS Microbiol Ecol 56:
236–249
Douglas ME, Endler JA (1982) Quantitative matrix compari-
sons in ecological and evolutionary investigations.
J Theor Biol 99:777–795
Drake HL, Aumen NG, Kuhner C, Wagner C, Grießhammer A,
Schmittroth M (1996) Anaerobic microflora of Everglades
sediments: effects of nutrients on population profiles and
activities. Appl Environ Microbiol 62:486–493
Duke NC, Burns KA, Swannell RPJ, Dalhaus O, Rupp R
(2000) Dispersant use and a bioremediation strategy as
alternate means of reducing impacts of large oil spills on
mangroves: the Gladstone field trials. Mar Pollut Bull
41:403–412
Duke NC, Meynecke JO, Dittmann S, Ellison AM, Anger K,
Berguer U et al (2007) A world without mangroves?
Science 317:41–42
Embrapa (1997) Manual de metodos de analise de solo. Centro
Nacional de Pesquisa em Solos, SNLCS, Rio de Janeiro,
pp 212
Gomes NCM, Borges LR, Paranhos R, Pinto FN, Mendonca-
Hagler LC, Smalla K (2008) Exploring the diversity of
bacterial communities in sediments of urban mangrove
forests. FEMS Microbiol Ecol 66(1):96–109
Heuer H, Smalla K (1997) Application of denaturing gradient
gel electrophoresis (DGGE) and temperature gradient gel
electrophoresis for studying soil microbial communities.
In: van Elsas JD, Trevors J, Wellington EMH (eds)
Modern soil microbiology. Marcel Dekker Inc., New
York, pp 353–373
Holguin G, Vazquez P, Bashan Y (2001) The role of sediment
microorganisms in the productivity, conservation, and
rehabilitation of mangrove ecosystems: an overview. Biol
Fert Soils 33:265–278
Holm SE, Falsen E (1967) An antigen free medium for culti-
vation of b-hemolytic streptococci. Acta Pathol Microbiol
Immunol Scand 69:264–276
Kathiresan K, Binghan BL (2001) Biology of mangroves and
mangrove ecosystems. Adv Mar Biol 40:81–251
King EO, Ward MK, Raney DE (1954) Two simple media for
the demonstration of pyocyanin and fluorescin. J Lab Clin
Med 44:301–307
Kruskal JB (1964) Nonmetric multidimensional scaling: a
numerical method. Psychometrika 29:115–129
Kuster E, Williams ST (1964) Selection of media for isolation
of streptomycetes. Nature 202:928–929
Antonie van Leeuwenhoek (2011) 99:341–354 353
123
Author's personal copy

Lee SY, Dunn RJK, Young RA, Connolly RM, Dale PER,
Dehayr R et al (2006) Impact of urbanization on coastal
wetland structure and function. Aust Ecol 31:149–163
Li H, Zhao Q, Boudfadel MC, Venosa A (2007) A universal
nutrient application strategy for the bioremediation of oil-
polluted beaches. Mar Pollut Bull 54:1146–1161
Liao PC, Huang BH, Huang S (2007) Microbial community
composition of the Danshui River Estuary of Northern
Taiwan and the practicality of the phylogenetic method in
microbial barcoding. Microbial Ecol 54:497–507
Martins LKP, Nascimento IA, Fillmann G, King R, Evangelista
AJA, Readman JW, Depledge MH (2005) Lysosomal
responses as a diagnostic tool for the detection of chronic
petroleum pollution at Todos os Santos Bay. Brazil
Environ Res 99:387–396
Mather PM (1976) Computational methods of multivariate
analysis in physical geography. J. Wiley & Sons, London
Nocker A, Sossa KE, Camper AK (2007) Molecular monitor-
ing of disinfection efficacy using propidium monoazide in
combination with quantitative PCR. J Microbiol Methods
70:252–260
Peixoto RS, Coutinho HLC, Madari B, Machado PLOA,
Rumjanek N, van Elsas JD, Seldin L, Rosado AS (2006)
Soil aggregation and bacterial community structure as
affected by tillage and cover cropping in the Brazilian
Cerrados. Soil Till Res 90:16–28
Roesch LF, Fulthorpe RR, Riva A, Casella G, Hadwing A,
Kent KM et al (2007) Pyrosequencing enumerates and
contrasts soil microbial diversity. ISME J 1:283–290
Santos HF, Carmo FL, Paes JE, Rosado AS, Peixoto RS
(2010a) Biorremediation of mangroves impacted by
petroleum. Water Air Soil Poll. doi:10.1007/s11270-010-
0536-4
Santos HF, Carmo FL, Cury JC, Rosado AS, Peixoto RS
(2010b) 18S rDNA sequences from microeukaryotes
reveal oil indicators in mangrove sediment. PLoS ONE.
http://dx.plos.org/10.1371/journal.pone.0012437
Shannon CE, Weaver W (1949) The mathematical theory of
communication. University of Dlinois Press, Champaign,
IL
US EPA 8270D (1998) Analysis of US EPA method 8270D –
semivolatile organic compounds by GC/MS. http://www.
epa.gov/osw/hazard/testmethods/sw846/pdfs/8270d.pdf.
Accessed 8 Jan 2010
Venturini N, Tommasi LR (2004) Polycyclic aromatic hydro-
carbons and changes in the trophic structure of polychaete
assemblages in sediments of Todos os Santos Bay,
Northeastern, Brazil. Mar Pollut Bull 48:97–107
Xu R, Obbard JP, Tay ETC (2003) Optimization of slow-
release fertilizer dosage for bioremediation of oil-con-
taminated beach sediment in a tropical environment.
World J Microbiol Biotechnol 19:719–725
Xu R, Lau ANL, Lim YG, Obbard JP (2005) Bioremediation of
oil-contaminated sediments on an inter-tidal shoreline
using a slow-release fertilizer and chitosan. Mar Pollut
Bull 51:1062–1070
Yun T, Yuan-Rong L, Tian-Ling Z, Li-Zhe C, Xiao-Xing C,
Chong-Ling Y (2008) Contamination and potential bio-
degradation of polycyclic aromatic hydrocarbons in an-
grove sediments of Xiamen, China. Mar Pollut Bull 56:
1184–1191
354 Antonie van Leeuwenhoek (2011) 99:341–354
123
Author's personal copy