mesin pengisi dan penutup botol tugas akhir - USD Repository
Upload
khangminh22Category
view
0download
0
BAB V
PENUTUP
5.1 Kesimpulan
Dari hasil penelitian yang berjudul, “Pengaruh ROE, Current Ratio dan
Struktur Modal terhadap Return Saham pada Perusahaan Food and Beverages yang
Go Public”, maka dapat ditarik beberapa kesimpulan sebagai berikut:
1. Hipotesis pertama yang menyatakan ROE mempunyai pengaruh secara
positif dan signifikan terhadap return saham, terbukti.
Hasil yang didapat adalah ROE berpengaruh positif secara parsial
terhadap return saham. ROE yang dihasilkan akan mempengaruhi secara
langsung return perusahaan. Semakin tinggi ROE yang dihasilkan, return
perusahaan juga akan mengalami peningkatan. Jika return perusahaan
tinggi, secara tidak langsung juga mempengaruhi kenaikan return saham
perusahaan. Return perusahaan tinggi digunakan untuk membayar bunga
hutang (diasumsikan tetap) dengan besar yang sama, dan menyebabkan
proporsi pembagian saham preferen dan saham biasa meningkat
2. Hipotesis kedua yang menyatakan current ratio mempunyai pengaruh
secara positif dan signifikan terhadap return saham, tidak terbukti.
Hasil yang didapat adalah current ratio tidak berpengaruh baik secara
positif maupun secara negatif terhadap return saham. Return saham lebih
banyak dipengaruhi oleh total asset dan kewajiban secara keseluruhan,
aktiva lancar dan hutang lancar yang merupakan komponen dari current
68

69
ratio, merupakan komponen kecil dari jumlah aset dan kewajiban yang
dimiliki oleh perusahaan.
3. Hipotesis ketiga yang menyatakan struktur modal mempunyai pengaruh
secara positif dan signifikan terhadap return saham, tidak terbukti.
Hasil yang didapat adalah struktur modal berpengaruh secara negatif
terhadap return saham. Semakin besar kewajiban dibandingkan dengan
total asset yang merupakan komponen dari struktur modal, semakin
sedikit return saham yang didapat. Kewajiban yang besar akan
menyebabkan perusahaan membayar bunga yang besar tiap periode, dan
secara langsung mengurangi return perusahaan yang didapat. Jika return
perusahaan yang didapat semakin sedikit, maka return saham yang
diperoleh juga semakin kecil.
4. Hipotesis keempat yang menyatakan ROE, current ratio, dan struktur
modal secara bersama-sama mempunyai pengaruh secara positif dan
signifikan terhadap return saham, terbukti
Hasil perhitungan adalah variabel-variabel bebas dalam penelitian ini
mempunyai pengaruh secara simultan terhadap return saham. Variabel
bebas yang terbukti berpengaruh adalah ROE dan struktur modal. Hal ini
disebabkan karena komposisi modal sendiri dalam perusahaan dan hutang
sebagai modal mempengaruhi besarnya return perusahaan tersebut,
apabila suatu perusahaan banyak menggunakan hutang sebagai modalnya
dibanding dengan modal sendiri maka return yang dihasilkan akan
banyak untuk membayar bunga hutang. Jika perusahaan dalam keadaan

70
ekonomi yang tidak baik dan banyak menggunakan hutang sebagai
modalnya, maka return yang didapat akan sangat kecil dan
kemungkinkan mengalami kerugian. Tetapi apabila pada keadaan
ekonomi yang tidak baik, perusahaan menggunakan modal sendiri
sebagai tambahan modal, maka return yang dihasilkan akan kembali ke
perusahaan untuk memperbaiki keadaan ekonomi dan tidak perlu
membayar bunga hutang, hal tersebut akan perlahan-lahan memperbaiki
keadaan ekonomi tanpa perlu menanggung beban bunga hutang yang
terlalu besar.
5.2 Saran
Adapun saran yang dapat diberikan sebagai bahan pertimbangan adalah
sebagai berikut:
a. Untuk Perusahaan
Sebaiknya perusahaan dalam menyusun komposisi modal memberikan bagian
modal sendiri lebih besar dibandingkan dengan modal yang berasal dari pihak
lain (hutang). Karena semakin besar hutang, maka return yang didapat tiap
periode akan banyak dialokasikan untuk membayar hutang yang
menyebabkan proporsi pembagian saham preferen dan saham biasa
berkurang, atau malah minus (mengalami kerugian). Apabila kondisi
perusahaan dalam keadaan baik (penjualan baik dan masih memiliki laba yang
cukup untuk membayar hutang dan membagi saham preferen dan saham
71
biasa) maka tidak apa-apa apabila mempunyai hutang yang lebih besar
daripada modal sendiri, karena perusahaan dinilai masih mampu untuk
berjalan dengan baik dan memenuhi kewajiban-kewajibannya.
b. Untuk investor
Disarankan untuk investor agar lebih mencermati informasi mengenai struktur
modal dan ROE dalam memutuskan untuk berinvestasi. Struktur modal dan ROE
dapat membantu investor untuk memprediksi bagaimana nantinya perusahaan
tersebut akan menghasilkan return yang menguntungkan. Struktur modal
mempunyai pengaruh yang cukup besar dalam kegiatan perekonomian
perusahaan. Dengan memilih perusahaan mana yang memiliki struktur modal
ideal yang membantu untuk mendatangkan return saham yang lebih besar.
c. Untuk penelitian selanjutnya
Penelitian yang selanjutnya dilakukan diharapkan dapat menentukan lebih
banyak variabel-variabel lain yang mempengaruhi return saham. Hal ini agar
dapat mengetahui lebih detail mengenai apa saja yang mempengaruhi variabel
terikat tersebut, sehingga nantinya informasi yang ada dapat lebih membantu
kegiatan berinvestasi.

DAFTAR PUSTAKA
Fauzan, Agung. 2006. Analisa Pengaruh Penilaian Kinerja terhadap Rate of Return pada Perusahaan yang Tergabung dalam LQ45. Skripsi. Yogyakarta: Universitas Islam Indonesia.
Ghozali, Imam. 2007. Teori Akuntansi. Edisi Ketiga. Semarang. Badan Penerbitan Universitas Diponegoro.
Harahap, Sofyan Syafri. 2007. Teori Akuntansi. Jakarta: PT Raja Grafindo Persada.
Hery. 2009. Akuntansi Keuangan Menengah I. Jakarta. Bumi Aksara.
Horngren, Charles T and Walter T. Harrison Jr. Akuntansi. Terjemahan Danti Pujianti. 2007. Jakarta: PT Gelora Aksara Pratama
. 2009. Teori Akuntansi. Jakarta: Kencana.
http://ekonomi.kabo.biz/2011/02/pengertian-struktur-modal.html
http://harahapinhere.blogspot.com/2010/06/jenis-jenis-modal.html
Ikatan Akutansi Indonesia. 2009. Standart Akutansi Keuangan (SAK). Jakarta: Salemba Empat.
Indriani, Astiwi. 2009. Analisis Pengaruh Current Ratio, Sales Growth, Return on Asset, Retained Earning dan Size terhadap Debt to Equity Ratio. Skripsi. Semarang: Universitas Diponegoro.
jurnal-sdm.blogspot.com/2009/06/teori-struktur-modal.html
Kieso, Donald E, Jerry J. Weygandt, and Terry D. Warfield. 2007. Akuntansi Intermediate. Edisi 13 Jilid 3. Jakarta: Erlangga.
Margaretha, Farah. 2010. Faktor-Faktor yang Mempengaruhi Struktur Modal pada Industri Manufaktur di Bursa Efek Indonesia. Jurnal Bisnis dan Akuntansi. Vol12, No.2, Agustus (119-130).
Mulia, Nadya Tikanitha.2007. Leverage Keuangan terhadap ROE Perusahaan Tekstil di Indonesia. Jurnal Keuangan dan Perbankan. STIE Indonesia. Vol 12, No.2 Mei 2008 (229-239)
nila.lecture.ub.ac.id/files/2010/06/Struktur-Modal.pdf
Pengertian Saham. (http://id.wikipedia.ord/wiki/saham).
74 Indonesian Capital Market Directory 2007
Head Office
Perkatoran Hijau Arkadia
Tower C 15th Floor
Jl. TB. Simatupang Kav. 88
Jakarta 12520
Phone (021) 2754-5000
Fax (021) 7884-5549
2004
(million rupiah)2005
2006
Total Assets
106,554
210,052
233,253
25,616 60,794 50,039
of which Jawa Barat
Phone (021) 875-3054, 875-3055 Cash and cash equivalents 2,061 1,670 490
Trade receivables 11,497 22,341 21,017 Fax (021) 875-2970 Inventories 7,775 21,883 11,602
- Jl. Raya Pudak Payung No. 1 Non-Current Assets 80,938 149,258 183,214
Semarang Selatan, Jawa Tengah of which Phone (024) 475-062, Fixed Assets-Net 79,536 147,330 180,112
475-068, 475-054 Deffered Tax Assets 1,402 1,258 2,106
Fax (024) 475-074 - Desa Namo Riam,
Liabilities 75,198 297,953 449,948
Kecamatan Pancur Batu Current Liabilities 60,682 278,891 427,199
of which
Sumatera Utara Bank loans 20,244 225,895 381,089
Beverages (Bottled Mineral Water) Trade payables 15,035 6,130 6,214
Business
Company Status PMDN Non-Current Liabilities 14,516 19,062 22,749
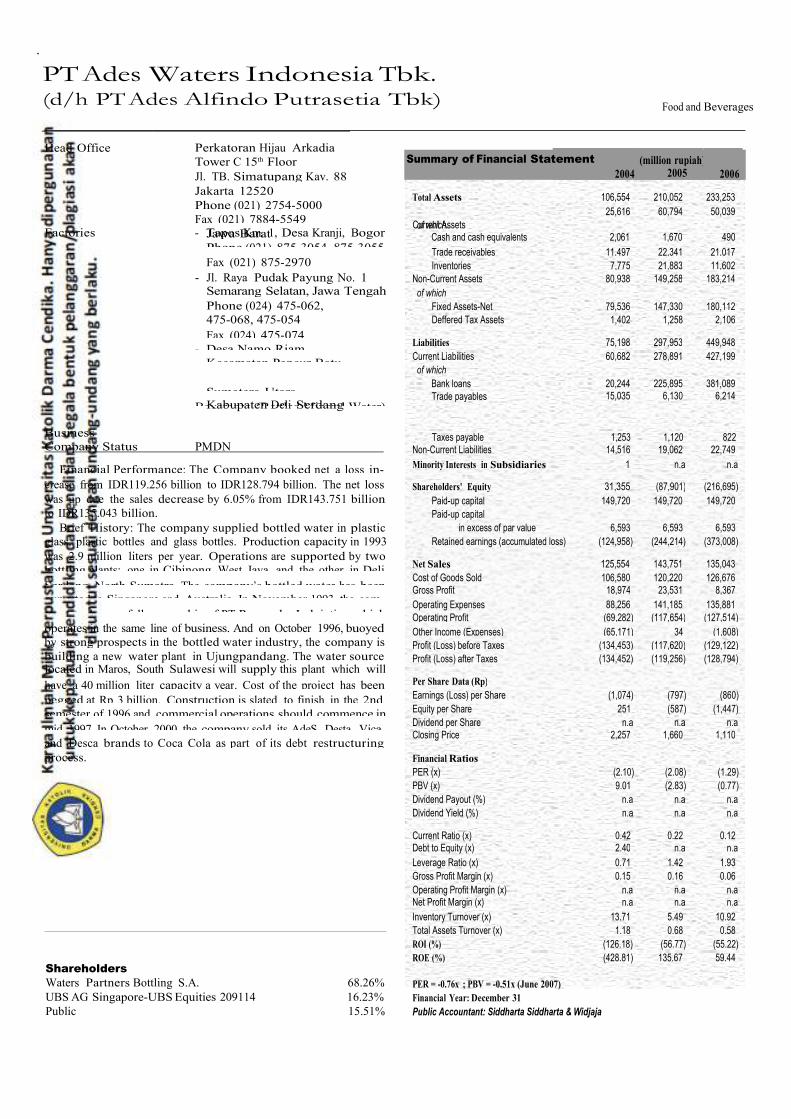
Financial Performance: The Company booked net a loss in- Minority Interests in Subsidiaries 1 n.a n.a
crease from IDR119.256 billion to IDR128.794 billion. The net loss
Shareholders' Equity 31,355
(87,901)
(216,695)
was up due the sales decrease by 6.05% from IDR143.751 billion
to IDR135.043 billion.
Brief History: The company supplied bottled water in plastic
Paid-up capital 149,720
Paid-up capital
in excess of par value 6,593
149,720
6,593
149,720
6,593
glass, plastic bottles and glass bottles. Production capacity in 1993 Retained earnings (accumulated loss) (124,958) (244,214) (373,008)
was 2.9 million liters per year. Operations are supported by two bottling plants: one in Cibinong, West Java, and the other in Deli
Net Sales 125,554
143,751
135,043
Serdang, North Sumatra. The company’s bottled water has been Cost of Goods Sold 106,580 120,220 126,676
exported to Singapore and Australia. In November 1993, the com- Gross Profit 18,974 23,531 8,367
pany took over full ownership of PT Pamargha Indojatim, which Operating Expenses 88,256 141,185 135,881
Operating Profit (69,282) (117,654) (127,514) operates in the same line of business. And on October 1996, buoyed Other Income (Expenses) (65,171) 34 (1,608) by strong prospects in the bottled water industry, the company is Profit (Loss) before Taxes (134,453) (117,620) (129,122) building a new water plant in Ujungpandang. The water source located in Maros, South Sulawesi will supply this plant which will
Profit (Loss) after Taxes (134,452) (119,256) (128,794)
have a 40 million liter capacity a year. Cost of the project has been Per Share Data (Rp)
pegged at Rp 3 billion. Construction is slated to finish in the 2nd Earnings (Loss) per Share (1,074) (797) (860)
semester of 1996 and commercial operations should commence in Equity per Share 251 (587) (1,447)
mid 1997. In October 2000, the company sold its AdeS, Desta, Vica, Dividend per Share n.a n.a n.a
and Desca brands to Coca Cola as part of its debt restructuring Closing Price 2,257 1,660 1,110
process. Financial Ratios
PER (x) (2.10) (2.08) (1.29)
PBV (x) 9.01 (2.83) (0.77)
Dividend Payout (%) n.a n.a n.a
Dividend Yield (%) n.a n.a n.a
Current Ratio (x) 0.42 0.22 0.12
Debt to Equity (x) 2.40 n.a n.a
Leverage Ratio (x) 0.71 1.42 1.93
Gross Profit Margin (x) 0.15 0.16 0.06
Operating Profit Margin (x) n.a n.a n.a
Net Profit Margin (x) n.a n.a n.a
Inventory Turnover (x) 13.71 5.49 10.92
Total Assets Turnover (x) 1.18 0.68 0.58
ROI (%) (126.18) (56.77) (55.22)
ROE (%) (428.81) 135.67 59.44 Shareholders Waters Partners Bottling S.A. 68.26% PER = -0.76x ; PBV = -0.51x (June 2007) UBS AG Singapore-UBS Equities 209114 16.23% Financial Year: December 31 Public 15.51% Public Accountant: Siddharta Siddharta & Widjaja
PT Ades Waters Indonesia Tbk. (d/h PT Ades Alfindo Putrasetia Tbk)
Food and Beverages
Summary of Financial Statement
Factories - Tapos Km. 1, Desa Kranji, Bogor Current Assets
Kabupaten Deli Serdang
Taxes payable 1,253 1,120 822

106 Indonesian Capital Market Directory 2007
Public 8.09%
PT Tiga Pilar Sejahtera Food Tbk. (d/h PT Asia Intiselera Tbk)
Food and Beverages
Head Office Alun Graha 1st Floor Jl. Prof. DR. Supomo No. 233
Jakarta Selatan
Phone (021) 831-8775, 522-7488
Fax (021) 835-1215
Summary of Financial Statement
(million rupiah)
2004 2005 2006
Website: www.tigapilar.com
Factory Jl. Raya Bogor Km. 33 Cisalak
Cimanggis, Bogor, Jawa Barat
Phone (021) 874-0075
Fax (021) 874-0078 Business Noodle
Company Status PMDN
Financial Performance: The Company booked net profit of
IDR129.866 million in 2006, increase by 275.63% from IDR34.573
million in 2005. The net profit increased after the sales rose by
31.03% from IDR229.973 billion to IDR333.455 billion.
Brief History: The company produces three kinds of noodle,
namely: instant noodle of Mikita, Ha Ha and Bossmie brand, dry
noodle of Ayam 2 Telor, Tanah Air, Manggis and Hula Hula marks,
and snack noodle of Anak Kita Brand. The company was estab-
lished by Kang family in 1953.
Total Assets 342,438 357,786 363,933
Current Assets 106,355 142,050 170,645
of which
Cash and cash equivalents 12,240 13,886 13,999
Trade receivables 36,563 56,874 60,813
Inventories 43,809 51,093 74,615
Non-Current Assets 236,083 215,735 193,288
of which
Fixed Assets-Net 226,812 207,028 186,448
Investments 20 20 22
Deffered Tax Assets 890 1,131 1,150
Liabilities 247,310 262,621 268,636
Current Liabilities 134,508 173,794 157,840
of which
Bank loans 63,940 95,226 112,886
Trade payables 39,598 34,029 33,811
Current maturities of
long-term debt 22,800 40,188 5,412
Non-Current Liabilities 112,802 88,828 110,796
Minority Interests in Subsidiaries 108 109 111
Shareholders' Equity 95,021 95,055 95,185
Paid-up capital 249,500 249,500 249,500
Paid-up capital
in excess of par value 20,250 20,250 20,250
Retained earnings (accumulated loss) (174,729) (174,695) (174,565)
Net Sales 228,437 229,973 333,455
Cost of Goods Sold 178,856 190,297 290,509
Gross Profit (Loss) 49,581 39,676 42,946
Operating Expenses 24,219 12,530 15,657
Operating Profit (Loss) 25,362 27,146 27,289
Other Income (Expenses) (25,223) (27,271) (26,094)
Profit (Loss) before Taxes 139 (125) 1,195
Profit (Loss) after Taxes 90 35 130
Per Share Data (Rp) Earnings (Loss) per Share 0.09 0.03 0.12
Equity per Share 91.02 91.05 91.18
Dividend per Share n.a n.a n.a
Closing Price 210 215 175
Financial Ratios PER (x) 2,446.83 6,491.88 1,406.75
PBV (x) 2.31 2.36 1.92
Dividend Payout (%) n.a n.a n.a
Dividend Yield (%) n.a n.a n.a
Current Ratio (x) 0.79 0.82 1.08
Debt to Equity (x) 2.60 2.76 2.82
Leverage Ratio (x) 0.72 0.73 0.74
Gross Profit Margin (x) 0.22 0.17 0.13
Operating Profit Margin (x) 11.10 11.80 8.18
Net Profit Margin (x) n.a n.a n.a
Inventory Turnover (x) 4.08 3.72 3.89
Total Assets Turnover (x) 0.67 0.64 0.92
ROI (%) 0.03 0.01 0.04
Shareholders
PT Tiga Pilar Sekuritas
38.51%
ROE (%) 0.09 0.04 0.14
PT Permata Hendrawira Sakti 33.97% PER = 235.13x ; PBV = 1.98x (June 2007) Basinale Investments Ltd. 13.04% Financial Year: December 31
PT Sapta Kencana Asiaprima 6.39% Public Accountant: Aryanto Amir Jusuf & Mawar

PT Cahaya Kalbar Tbk.
Food and Beverages
Head OfÞce/Factory Jl. Industri Selatan 3 Blok GG No. 1
Kawasan Industri Jababeka II, Cikarang,
Bekasi 17550
Summary of Financial Statement
(Million Rupiah)
Phone (021) 8983-0003, 8983-0004
Fax (021) 893-7143
Website: www.cahayakalbar.com Marketing OfÞce The City Tower 16th Floor
Jl. MH. Tahmrin No. 81
Jakarta 10310
Phone (021) 3199-6280
Fax (021) 3199-6283
Business Edible Oil Producer
Company Status PMA
Financial Performance: The Company booked net income
amounted IDR49.493 billion in 2009, higher than last year in-
come worth IDR27.867 billion.
Brief History: PT. CAHAYA KALBAR was established in
1968. In 1996, the company was public listed at Jakarta Stock
Exchange under the trading code “CEKA”. We are a well
known producer of various ingredients for entire range of food
products :
• for chocolate and cocoa confectionary industries, ic- ing coating, confectionary Þlling.
• Aloe Vera concentrates and powder for functional
food, cosmetics and pharmaceutical industry.
We also produce and supply ingredients to the restaurant
/ hotel industry, cake and bakery industry and later we enter
the retail / wholesale market with the functional beverage drink
products. Under the trademark : ALOEFIT.
2007 2008 2009
Total Assets 613,680 605,545 568,363
Current Assets 456,316 406,965 374,368
of which
Cash and cash equivalents 12,869 6,146 5,776
Trade receivables 33,402 132,212 66,303
Inventories 273,267 115,624 114,749
Non-Current Assets 157,363 198,580 193,995
of which
Fixed Assets-Net 148,612 185,988 187,967
Deffered Tax Assets 1,096 1,819 187,967 Liabilities 394,642 370,520 266,860
Current Liabilities 335,769 55,393 76,488
of which
Bank loans 160,123 n.a n.a
Trade payables 26,917 42,545 67,203
Accrued expenses 3,975 4,527 3,762
Non-Current Liabilities 58,873 315,127 190,372
Minority Interests in Subsidiaries n.a n.a n.a Shareholders' Equity 219,037 235,025 301,503
Paid-up capital 148,750 148,750 148,750
Paid-up capital
in excess of par value 104,848 104,848 104,848
Retained earnings (accumulated loss) (34,560) (18,573) 47,905 Net Sales 812,635 1,963,638 1,194,544
Cost of Goods Sold 723,171 1,728,731 1,055,969
Gross Profit 89,465 234,906 138,574
Operating Expenses 46,741 135,270 45,114
Operating Profit 42,723 99,636 93,460
Other Income (Expenses) (6,583) (57,190) (23,371)
Profit (Loss) before Taxes 36,140 42,446 70,089
Profit (Loss) after Taxes 24,676 27,868 49,493 Per Share Data (Rp)
Earnings (Loss) per Share 83 94 166
Equity per Share 736 790 1,013
Dividend per Share n.a n.a n.a
Closing Price 800 700 1,490 Financial Ratios
PER (x) 9.64 7.47 8.96
PBV (x) 1.09 0.89 1.47
Dividend Payout (%) n.a n.a n.a
Dividend Yield (%) n.a n.a n.a Current Ratio (x) 1.36 7.35 4.89
Debt to Equity (x) 1.80 1.58 0.89
Leverage Ratio (x) 0.64 0.61 0.47
Gross Profit Margin (x) 0.11 0.12 0.12
Operating Profit Margin (x) 0.05 0.05 0.08
Net Profit Margin (x) 0.03 0.01 0.04
Inventory Turnover (x) 2.65 14.95 9.20
Total Assets Turnover (x) 1.32 3.24 2.10
ROI (%) 4.02 4.60 8.71
ROE (%) 11.27 11.86 16.42
PER =7.06x ; PBV = 1.00x (June 2010)
Financial Year: December 31
Public Accountant: Purwantono, Sarwoko & Sandjaja
(million rupiah)
2010
June
2009
June
Total Assets
755,108
624,557
Current Assets 564,751 429,489
Non-Current Assets 190,356 195,068
Liabilities 432,828 352,275
Shareholders' Equity 322,280 272,282
Net Sales 335,911 877,994
Profit after Taxes 20,776 36,922
Shareholders Tradesound Investments Limited 87.02% ROI (%) 2.75 5.91
Public 12.98% ROE (%) 6.45 13.56
112 Indonesian Capital Market Directory 2010
PT Cahaya Kalbar Tbk.
Head Office Jl. Industri Selatan 3
Blok GG No. 1
Kawasan Industri Jababeka,
Bekasi 17550
Phone (021) 8983-0003, 8983-0004
Summary of Financial Statement
Food and Beverages
(million rupiah)
2004 2005 2006
Fax (021) 893-7143 Website: www.cahayakalbar.com
Factory Jl. Industri Selatan 3
Blok GG No. 1
Kawasan Industri Jababeka,
Bekasi 17550
Phone (021) 8983-0003, 8983-0004 Fax (021) 893-7143
Website: www.cahayakalbar.com
Business Edible Oil Producer
Company Status PMDN
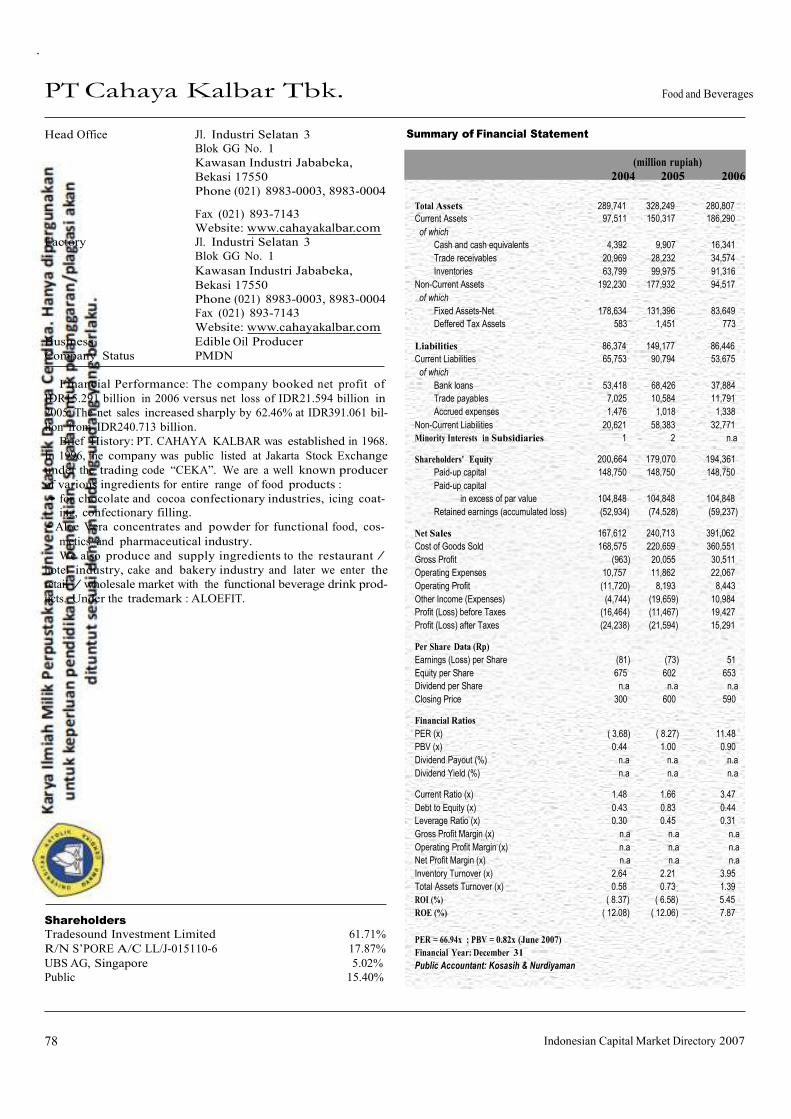
Financial Performance: The company booked net profit of
IDR15.291 billion in 2006 versus net loss of IDR21.594 billion in
2005. The net sales increased sharply by 62.46% at IDR391.061 bil-
lion from IDR240.713 billion.
Brief History: PT. CAHAYA KALBAR was established in 1968.
In 1996, the company was public listed at Jakarta Stock Exchange
under the trading code “CEKA”. We are a well known producer
of various ingredients for entire range of food products :
• for chocolate and cocoa confectionary industries, icing coat- ing, confectionary filling.
• Aloe Vera concentrates and powder for functional food, cos-
metics and pharmaceutical industry.
We also produce and supply ingredients to the restaurant /
hotel industry, cake and bakery industry and later we enter the
retail / wholesale market with the functional beverage drink prod-
ucts. Under the trademark : ALOEFIT.
Shareholders
Tradesound Investment Limited 61.71%
R/N S’PORE A/C LL/J-015110-6 17.87%
UBS AG, Singapore 5.02%
Public 15.40%
Total Assets 289,741 328,249 280,807
Current Assets 97,511 150,317 186,290
of which
Cash and cash equivalents 4,392 9,907 16,341
Trade receivables 20,969 28,232 34,574
Inventories 63,799 99,975 91,316
Non-Current Assets 192,230 177,932 94,517
of which
Fixed Assets-Net 178,634 131,396 83,649
Deffered Tax Assets 583 1,451 773 Liabilities 86,374 149,177 86,446
Current Liabilities 65,753 90,794 53,675
of which
Bank loans 53,418 68,426 37,884
Trade payables 7,025 10,584 11,791
Accrued expenses 1,476 1,018 1,338
Non-Current Liabilities 20,621 58,383 32,771
Minority Interests in Subsidiaries 1 2 n.a Shareholders' Equity 200,664 179,070 194,361
Paid-up capital 148,750 148,750 148,750
Paid-up capital
in excess of par value 104,848 104,848 104,848
Retained earnings (accumulated loss) (52,934) (74,528) (59,237) Net Sales 167,612 240,713 391,062
Cost of Goods Sold 168,575 220,659 360,551
Gross Profit (963) 20,055 30,511
Operating Expenses 10,757 11,862 22,067
Operating Profit (11,720) 8,193 8,443
Other Income (Expenses) (4,744) (19,659) 10,984
Profit (Loss) before Taxes (16,464) (11,467) 19,427
Profit (Loss) after Taxes (24,238) (21,594) 15,291 Per Share Data (Rp)
Earnings (Loss) per Share (81) (73) 51
Equity per Share 675 602 653
Dividend per Share n.a n.a n.a
Closing Price 300 600 590 Financial Ratios
PER (x) ( 3.68) ( 8.27) 11.48
PBV (x) 0.44 1.00 0.90
Dividend Payout (%) n.a n.a n.a
Dividend Yield (%) n.a n.a n.a Current Ratio (x) 1.48 1.66 3.47
Debt to Equity (x) 0.43 0.83 0.44
Leverage Ratio (x) 0.30 0.45 0.31
Gross Profit Margin (x) n.a n.a n.a
Operating Profit Margin (x) n.a n.a n.a
Net Profit Margin (x) n.a n.a n.a
Inventory Turnover (x) 2.64 2.21 3.95
Total Assets Turnover (x) 0.58 0.73 1.39
ROI (%) ( 8.37) ( 6.58) 5.45
ROE (%) ( 12.08) ( 12.06) 7.87
PER = 66.94x ; PBV = 0.82x (June 2007)
Financial Year: December 31
Public Accountant: Kosasih & Nurdiyaman
78 Indonesian Capital Market Directory 2007

PT Davomas Abadi Tbk.
Food and Beverages
Head OfÞce Jl. Pangeran Jayakarta 117 Blok B/35-39
Jakarta 10730
Phone (021) 600-9709, 626-6477
Summary of Financial Statement
(Million Rupiah)
Fax (021) 600-9708, 626-4390 Investor Relation OfÞce Plaza BII Menara III 9th Floor
Jl. MH. Thamrin No. 51
Jakarta 10350
Phone (021) 3983-4512
Fax (021) 3983-4513
Factory Jl. Industri Raya III Blok AB No. 1A
Tangerang, Banten 15710
Phone (082) 140-269
Business Cocoa
Company Status PMDN
Financial Performance: The Company has suffered net
loss at IDR226.7 billion in 2009, down from IDR510.6 billion
net loss suffered in 2008.
Brief History: The Company was established in 1990. Its
production facility is located in Tangerang, Banten. The Com-
pany currently has a production capacity of 100,800 metric tons
per annum (tpa); a further 40,320 tpa of capacity will come
on-stream before mid year of 2007. Davomas is listed on the
Jakarta Stock Exchange since 1994. The Company) is Indone-
sia’s largest producer and exporter of cocoa butter and cocoa
powder (collectively referred to as cocoa products).
2007 2008 2009
Total Assets 3,868,528 3,620,074 2,806,017
Current Assets 1,339,276 1,259,152 730,511
of which
Cash and cash equivalents 582,505 290,242 587,390
Trade receivables 244,626 106,127 n.a
Inventories 312,375 781,179 141,697
Non-Current Assets 2,529,252 2,360,922 2,075,506
of which
Fixed Assets-Net 2,432,157 2,360,667 2,075,251 Liabilities 2,684,121 2,946,319 2,359,073
Current Liabilities 144,551 45,794 6,424
of which
Taxes payable 753 141 80
Accrued expenses 3,132 2,850 265
Long-term Liabilities 2,539,570 2,900,525 2,352,648 Shareholders' Equity 1,184,407 673,755 446,944
Paid-up capital 620,186 620,186 620,186
Paid-up capital
in excess of par value 1,895 1,895 1,895
Retained earnings (accumulated loss) 562,326 51,675 (175,137) Net Sales 2,800,084 3,392,847 406,063
Cost of Goods Sold 2,241,357 3,257,735 1,058,337
Gross Profit 558,728 135,112
(652,274) Operating Expenses 19,358 22,020
405,633
Operating Profit 539,369 113,092
(1,057,907) Other Income (Expenses) (240,487) (577,295)
133,319
Profit (Loss) before Taxes 298,882 (464,203) (924,588)
Profit (Loss) after Taxes 208,456 (510,652) (226,749)
Per Share Data (Rp)
Earnings (Loss) per Share 17 (41) (18)
Equity per Share 95 54 36
Dividend per Share n.a n.a n.a
Closing Price 250 58 50 Financial Ratios
PER (x) 14.88 ( 1.41) ( 2.74)
PBV (x) 2.62 1.07 1.39
Dividend Payout (%) n.a n.a n.a
Dividend Yield (%) n.a n.a n.a Current Ratio (x) 9.27 27.50 113.71
Debt to Equity (x) 2.27 4.37 5.28
Leverage Ratio (x) 0.69 0.81 0.84
Gross Profit Margin (x) 0.20 0.04 n.a
Operating Profit Margin (x) 0.19 0.03 n.a
Net Profit Margin (x) 0.07 n.a n.a
Inventory Turnover (x) 7.18 4.17 7.47
Total Assets Turnover (x) 0.72 0.94 0.14
ROI (%) 5.39 ( 14.11) ( 8.08)
ROE (%) 17.60 ( 75.79) ( 50.73)
PER = -9.79x ; PBV = 2.71x (June 2009)
Financial Year: December 31
Public Accountant: Albert Silalahi & Co. (2008); Tanubrata Sutanto & Co. (2009)
(million rupiah)
2010 2009
June June
Total Assets 2,786,124 957,961
Current Assets 872,380 714,331
Shareholders
Hassock Enterprises Ltd.
23.17%
Non-Current Assets 1,913,744 243,630
Liabilities 2,406,348 2,932,147
PT Citi Pacific Securities 20.27% Shareholders' Equity 379,776 25,814
Caterpillar Associates Ltd 11.46% Net Sales 692,825 364,584
Lehman Brothers Investments Ptd., Ltd S/A S.A 11.11% Profit after Taxes 8,233 (647,928)
Krigler Holding Ltd 7.75%
Polar Cap Investments Ltd 6.09% ROI (%) 0.30 (67.64)
Public 20.17% ROE (%) 2.17 (2,509.95)
114
Indonesian Capital Market Directory 2010

PT Davomas Abadi Tbk.
Head Office Jl. Pangeran Jayakarta 117 Blok B/35-39 Jakarta 10730
Phone (021) 600-9709, 626-6477
Fax (021) 600-9708, 626-4390
Summary of Financial Statement
Food and Beverages
(million rupiah)
2004 2005 2005
Investor Relation Office Plaza BII Menara III 9th Floor Jl. MH. Thamrin No. 51
Jakarta 10350
Phone (021) 3983-4512
Fax (021) 3983-4513
Factory Jl. Industri Raya III Blok AB No. 1A
Tangerang, Banten 15710
Phone (082) 140-269
Business Cocoa
Company Status PMDN
Company News : PT Davomas Abadi Tbk has started operat-
ing the company’s two new production lines which have a total
capacity of 40,000 tones per year.
Financial Performance: In 2006, the Company booked net profit
at IDR196.277 billion, or increase significantly from IDR90.069 bil-
lion in 2005. The higher net profit was partly supported by the
increase in net sales from IDR1.120 trillion to IDR1.656 trillion.
Brief History: In 1994, production capacity stood at 20,160 tons,
comprising 10,080 tons of cocoa butter and 10,080 tons of cocoa
powder. In 1995 the company production capacity reached 40,320
tons, comprising 20,160 tons of cocoa butter and 20,160 tons of
cocoa powder. The company’s factory has 0.8 hectares of building
space, standing on 3.7 hectares of land in Tangerang, West Java.
At the end of 1997, the company sealed a 10-year long term sales
contract to supply an average of 40,000 tons cocoa flour and cocoa
butter annually to its overseas trading partners. To boost produc-
tion capacity in line with increased demand, in 1997 Davomas
purchased an additional cocoa bean processor. With an investment
of US$ 20 million, this machine has an annual production capac-
ity of 20,000 tons.
Shareholders
Hassock Enterprises Ltd 23.17%
PT Multiprima Perkasa 19.59%
Caterpillar Associates Ltd 11.46%
PT Citi Pacific Securities 11.02%
Krigler Holding Ltd 7.75%
Polar Cap Investments Ltd 6.09%
PT Sheriutama Raya 6.03%
Catnera International Ltd 5.53%
Public 9.36%
Total Assets 1,577,951 1,746,895 2,707,801
Current Assets 383,640 637,403 1,032,260
of which
Cash and cash equivalents 166,643 427,505 515,458
Trade receivables 93,272 92,290 142,002
Inventories 86,933 83,031 287,505
Non-Current Assets 1,194,310 1,109,491 1,675,541
of which
Fixed Assets-Net 1,194,061 1,109,255 1,592,619 Liabilities 888,346 967,221 1,731,850
Current Liabilities 688 26,120 172,484
of which
Taxes payable 18 63 650
Accrued expenses 670 770 4,536
Long-term Liabilities 887,658 941,101 1,559,366 Shareholders' Equity 689,605 779,674 975,951
Paid-up capital 620,186 620,186 620,186
Paid-up capital
in excess of par value 1,895 1,895 1,895
Retained earnings (accumulated loss) 67,524 157,593 353,870 Net Sales 1,032,178 1,120,893 1,656,584
Cost of Goods Sold 851,108 944,198 1,359,471
Gross Profit 181,070 176,695 297,114
Operating Expenses 8,592 14,583 17,310
Operating Profit 172,478 162,112 279,804
Other Income (Expenses) (29,188) (43,223) (29,884)
Profit (Loss) before Taxes 143,290 118,889 249,919
Profit (Loss) after Taxes 98,958 90,069 196,277 Per Share Data (Rp)
Earnings (Loss) per Share 16 15 32
Equity per Share 111 126 157
Dividend per Share n.a n.a n.a
Closing Price 200 80 590 Financial Ratios
PER (x) 12.53 5.51 18.64
PBV (x) 1.80 0.64 3.75
Dividend Payout (%) n.a n.a n.a
Dividend Yield (%) n.a n.a n.a Current Ratio (x) 557.47 24.40 5.98
Debt to Equity (x) 1.29 1.24 1.77
Leverage Ratio (x) 0.56 0.55 0.64
Gross Profit Margin (x) 0.18 0.16 0.18
Operating Profit Margin (x) 0.17 0.14 0.17
Net Profit Margin (x) 0.10 0.08 0.12
Inventory Turnover (x) 9.79 11.37 4.73
Total Assets Turnover (x) 0.65 0.64 0.61
ROI (%) 6.27 5.16 7.25
ROE (%) 14.35 11.55 20.11
PER = 25.20x ; PBV = 3.20x (June 2007)
Financial Year: December 31
Public Accountant: BDO Tanubrata, Sutanto, Sibarani
80 Indonesian Capital Market Directory 2007

PT Delta Djakarta Tbk. Food and Beverages
Head OfÞce/Factory Jl. Inspeksi Tarum Barat
Desa Setia Darma
Tambun, Bekasi Timur 17510
Summary of Financial Statement
(Million Rupiah)
Phone (021) 882-2520, 880-0511 2007 2008 2009
Fax (021) 881-9423, 880-0513
Total Assets
592,359
698,297
760,426
Po.Box. 180, Bekasi 17018 Current Assets 432,547 544,237 612,987
E-mail : [email protected]
Website: www.deltajkt.co.id
Business Beverages Industry
Company Status PMA
Financial Performance: The Company booked net income
at IDR126.5 billion in 2009, or increase from IDR83.754 billion
in 2008. Net sale increased to IDR1.264 trillion from IDR1.177
trillion.
Brief History: PT Delta Djakarta is the manufacturer and
distributor of some of the best beer brands in the world under
the Anker, Carlsberg, San Miguel, and Kuda Putih trademarks. The company is also a key Þgure in the country’s non-alcoholic
beverages market; with brands Sodaku and Soda Ice among In-
donesia’s top-sellers. Since its founding in 1932 by German Þrm Archipel Brou-
werij NV, leadership of PT Delta Djakarta has changed hands
many times. In World War II, control of the company was turned over to a Dutch Þrm before being passed on to a Japa-
nese company in 1942. Three years later, the Dutch regained
control.
In 1970, the company took the name PT Delta Djakarta; and in 1984 was part of the Þrst-generation of companies in In-
donesia to go public and sell shares at the Jakarta and Surabaya
Stock Exchanges. To date, PT Delta Djakarta’s major share-
holders include the Municipal Government of Jakarta and San
Miguel Malaysia (L) Private Limited. Its breweries are located in
Jalan Inspeksi Tarum Barat, East Bekasi and West Java.
of which
Cash and cash equivalents 164,550 289,951 386,105
Trade receivables 172,427 109,380 110,186
Inventories 28,758 73,810 66,545
Non-Current Assets 159,812 154,060 147,439
of which
Fixed Assets-Net 133,230 124,629 119,291
Deffered Tax Assets 3,631 6,006 6,200
Other Assets 157 157 191 Liabilities 131,545 174,316 160,808
Current Liabilities 103,664 143,621 130,322
of which
Trade payables 24,436 32,011 21,954
Taxes and excise payable 50,577 78,407 75,617
Accrued expenses 19,420 20,548 17,776
Non-Current Liabilities 27,881 30,694 30,486
Minority Interests in Subsidiaries 2,382 4,213 9,391 Shareholders' Equity 458,432 519,768 590,226
Paid-up capital 16,013 16,013 16,013
Paid-up capital
in excess of par value 19,016 19,016 19,016
Retained earnings 423,404 484,739 555,197
Net Sales 439,823 673,770 740,681
Cost of Goods Sold 242,305 389,438 401,524
Gross Profit 197,518 284,332 339,156
Operating Expenses 136,906 184,293 178,528
Operating Profit 60,612 100,039 160,629
Other Income (Expenses) 6,010 17,699 17,376
Profit (Loss) before Taxes 66,622 117,738 178,005
Profit (Loss) after Taxes 47,331 83,754 126,504 Per Share Data (Rp)
Earnings (Loss) per Share 2,956 5,230 7,900
Equity per Share 28,628 32,459 36,859
Dividend per Share n.a n.a 9,500
Closing Price 16,000 20,000 62,000 Financial Ratios
PER (x) 5.41 3.82 7.85
PBV (x) 0.56 0.62 1.68
Dividend Payout (%) n.a n.a 120
Dividend Yield (%) n.a n.a 26 Current Ratio (x) 4.17 3.79 4.70
Debt to Equity (x) 0.29 0.34 0.27
Leverage Ratio (x) 0.22 0.25 0.21
Gross Profit Margin (x) 0.45 0.42 0.46
Operating Profit Margin (x) 0.14 0.15 0.22
Net Profit Margin (x) 0.11 0.12 0.17
Inventory Turnover (x) 8.43 5.28 6.03
Total Assets Turnover (x) 0.74 0.96 0.97
ROI (%) 7.99 11.99 16.64
ROE (%) 10.32 16.11 21.43
PER = 9.62x ; PBV = 2.54x (June
2010) Financial Year: December 31
Public Accountant: Osman Bing Satrio & Co.
(million rupiah)
2010
June
2009
June

Total Assets 717,100 697,220
Current Assets 570,906 543,378
Non-Current Assets 146,194 153,843
Liabilities 194,771 177,253
Shareholders' Equity 509,683 514,260
Net Sales 291,982 342,283
Shareholders Profit after Taxes 71,582 50,613
San Miguel Malaysia (L) 58.30% Municipal Government of Jakarta 26.30% ROI (%) 9.98 7.26
Public 15.40% ROE (%) 14.04 9.84
116 Indonesian Capital Market Directory 2010

Per Share Data (Rp)
Earnings (Loss) per Share
2,417
3,522
2,703
Equity per Share 22,185 25,357 27,358
Dividend per Share 350 700 n.a
Closing Price 14,500 36,000 22,800
Financial Ratios PER (x) 6.00 10.22 8.43
PBV (x) 0.65 1.42 0.83
Dividend Payout (%) 14.48 19.87 n.a
Dividend Yield (%) 2.41 1.94 n.a
Current Ratio (x) 4.14 3.69 3.80
Debt to Equity (x) 0.28 0.32 0.31
Leverage Ratio (x) 0.22 0.24 0.24
Gross Profit Margin (x) 0.46 0.48 0.48
Operating Profit Margin (x) 0.16 0.17 0.13
Net Profit Margin (x) 0.11 0.13 0.11
Inventory Turnover (x) 4.75 4.82 4.52
Total Assets Turnover (x) 0.78 0.80 0.69
ROI (%) 8.50 10.49 7.50
ROE (%) 10.90 13.89 9.88
Shareholders
San Miguel Malaysia (L)
58.30%
PER = 12.51x ; PBV = 0.90x (June 2007)
Financial Year: December 31
Municipal Government of Jakarta 26.30% Public Accountant: Osman Ramli Satrio & Co. Public 15.40%
PT Delta Djakarta Tbk.
Head Office Jl. Inspeksi Tarum Barat
Desa Setia Darma Tambun, Bekasi Timur 17510
Phone (021) 882-2520, 880-0511
Fax (021) 881-9423, 880-0513
Summary of Financial Statement
Food and Beverages
(million rupiah)
2004 2005 2006
Po.Box. 180, Bekasi 17018
E-mail:
Factory Jl. Inspeksi Tarum Barat
Desa Setia Darma
Tambun, Bekasi Timur 17510
Phone (021) 882-2520, 880-0511 Fax (021) 881-9423, 880-0513
Po.Box. 180, Bekasi 17018
E-mail :
Business Beverages Industry
Company Status PMA
Financial Performance: The Company booked net profit of
IDR43.284 billion in 2006, falling by 23.26% from IDR56.405 bil-
lion in 2005. The net profit decline was due to decrease in net sales
from IDR432.729 billion to IDR396.733 billion.
Brief History: The company main product is pilsner beer and
is marketed under the Anker Bir trade mark and controls 40% of
the national pilsner beer market in Indonesia. Other production
are Anker Stout and Shanta Super Shandy. It has a cooperation
agreement with allied Breweries Nederland BV, covering tech-
nological development, marketing and general management. Delta
Jakarta also produces licensed product from Carlsberg Interna-
tional A/S, Denmark under the trade mark of Carlsberg Beer. On
August 1995, the company relocated its brewery from North
Jakarta to Tambun, Bekasi, West Java. This brewery was con-
structed on a 15 ha site. The relocation is expected to increase pro-
duction capacity by 50% to 900,000 hl. The company also produc-
ing San Miguel beer, following the entry of San Miguel Corpora-
tion of the Philippines into the company as shareholder.
Total Assets 455,244 537,785 577,411
Current Assets 299,334 382,805 419,204
of which
Cash and cash equivalents 119,116 135,172 117,968
Trade receivables 120,894 168,680 203,058
Inventories 40,032 46,751 46,090
Non-Current Assets 155,910 154,979 158,208
of which
Fixed Assets-Net 131,377 129,736 121,275
Deffered Tax Assets 2,027 2,731 2,863
Other Assets 188 152 154 Liabilities 99,357 130,911 137,928
Current Liabilities 72,389 103,623 110,184
of which
Trade payables 13,725 21,820 11,458
Taxes and excise payable 37,243 51,214 62,300
Accrued expenses 12,887 20,312 28,135
Non-Current Liabilities 26,968 27,288 27,744
Minority Interests in Subsidiaries 635 821 1,397 Shareholders' Equity 355,251 406,052 438,087
Paid-up capital 16,013 16,013 16,013
Paid-up capital
in excess of par value 19,016 19,016 19,016
Retained earnings 320,223 371,023 403,058 Net Sales 353,481 432,729 396,733
Cost of Goods Sold 190,353 225,420 208,099
Gross Profit 163,127 207,309 188,634
Operating Expenses 104,923 133,874 136,952
Operating Profit 58,204 73,435 51,682
Other Income (Expenses) (836) 5,636 9,075
Profit (Loss) before Taxes 57,368 79,071 60,756
Profit (Loss) after Taxes 38,708 56,405 43,284
82 Indonesian Capital Market Directory 2007
PT Fast Food Indonesia Tbk. Food and Beverages
Head OfÞce Gedung Gelael, 4th Floor
Jl. MT. Haryono Kav. 7
Jakarta 12810
Summary of Financial Statement
(Million Rupiah)
Phone (021) 830-1133, 831-3368
Fax (021) 830-9384,830-0569
Telex 48725 Gelael IA
Website: www.kfcindonesia.com
Business Food and Restaurant
Company Status PMDN
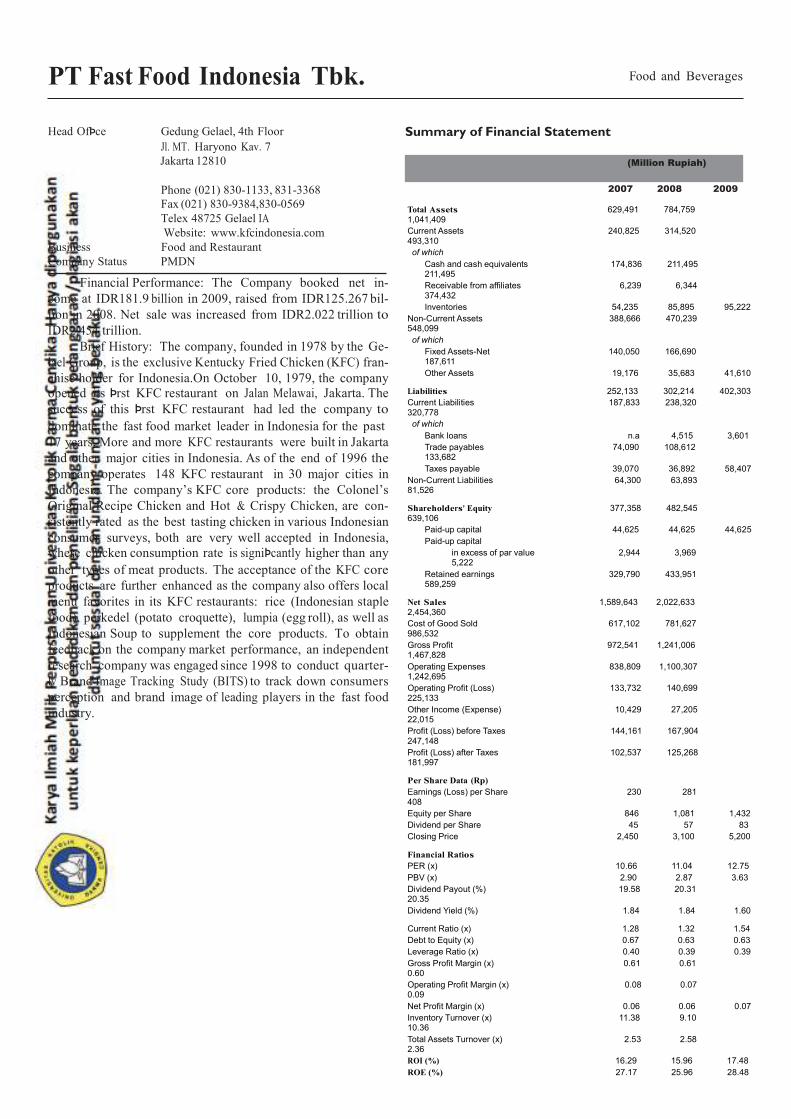
Financial Performance: The Company booked net in-
come at IDR181.9 billion in 2009, raised from IDR125.267 bil-
lion in 2008. Net sale was increased from IDR2.022 trillion to
IDR2.454 trillion.
Brief History: The company, founded in 1978 by the Ge-
lael Group, is the exclusive Kentucky Fried Chicken (KFC) fran-
chise holder for Indonesia.On October 10, 1979, the company opened its Þrst KFC restaurant on Jalan Melawai, Jakarta. The
success of this Þrst KFC restaurant had led the company to
dominate the fast food market leader in Indonesia for the past
17 years. More and more KFC restaurants were built in Jakarta
and other major cities in Indonesia. As of the end of 1996 the
company operates 148 KFC restaurant in 30 major cities in
Indonesia. The company’s KFC core products: the Colonel’s
Original Recipe Chicken and Hot & Crispy Chicken, are con-
sistently rated as the best tasting chicken in various Indonesian
consumer surveys, both are very well accepted in Indonesia, where chicken consumption rate is signiÞcantly higher than any
other types of meat products. The acceptance of the KFC core
products are further enhanced as the company also offers local
menu favorites in its KFC restaurants: rice (Indonesian staple
food), perkedel (potato croquette), lumpia (egg roll), as well as
Indonesian Soup to supplement the core products. To obtain
feedback on the company market performance, an independent
research company was engaged since 1998 to conduct quarter-
ly Brand Image Tracking Study (BITS) to track down consumers
perception and brand image of leading players in the fast food
industry.
2007 2008 2009 Total Assets 629,491 784,759 1,041,409
Current Assets 240,825 314,520 493,310
of which
Cash and cash equivalents 174,836 211,495 211,495
Receivable from affiliates 6,239 6,344 374,432
Inventories 54,235 85,895 95,222
Non-Current Assets 388,666 470,239 548,099
of which
Fixed Assets-Net 140,050 166,690 187,611
Other Assets 19,176 35,683 41,610 Liabilities 252,133 302,214 402,303
Current Liabilities 187,833 238,320 320,778
of which
Bank loans n.a 4,515 3,601
Trade payables 74,090 108,612 133,682
Taxes payable 39,070 36,892 58,407
Non-Current Liabilities 64,300 63,893 81,526 Shareholders' Equity 377,358 482,545 639,106
Paid-up capital 44,625 44,625 44,625
Paid-up capital
in excess of par value 2,944 3,969 5,222
Retained earnings 329,790 433,951 589,259
Net Sales 1,589,643 2,022,633 2,454,360
Cost of Good Sold 617,102 781,627 986,532
Gross Profit 972,541 1,241,006 1,467,828
Operating Expenses 838,809 1,100,307 1,242,695
Operating Profit (Loss) 133,732 140,699 225,133
Other Income (Expense) 10,429 27,205 22,015
Profit (Loss) before Taxes 144,161 167,904 247,148
Profit (Loss) after Taxes 102,537 125,268 181,997 Per Share Data (Rp)
Earnings (Loss) per Share 230 281 408
Equity per Share 846 1,081 1,432
Dividend per Share 45 57 83
Closing Price 2,450 3,100 5,200 Financial Ratios
PER (x) 10.66 11.04 12.75
PBV (x) 2.90 2.87 3.63
Dividend Payout (%) 19.58 20.31 20.35
Dividend Yield (%) 1.84 1.84 1.60 Current Ratio (x) 1.28 1.32 1.54
Debt to Equity (x) 0.67 0.63 0.63
Leverage Ratio (x) 0.40 0.39 0.39
Gross Profit Margin (x) 0.61 0.61 0.60
Operating Profit Margin (x) 0.08 0.07 0.09
Net Profit Margin (x) 0.06 0.06 0.07
Inventory Turnover (x) 11.38 9.10 10.36
Total Assets Turnover (x) 2.53 2.58 2.36
ROI (%) 16.29 15.96 17.48
ROE (%) 27.17 25.96 28.48

PER = 18.19x ; PBV = 4.39x (June
2010) Financial Year: December 31
Public Accountant: Purwantono, Sarwoko & Sandjaja
(million rupiah)
2010 2009
June June
Shareholders
PT Gelael Pratama 43.84%
PT Megah Eraraharja 35.84%
HSBC Fund Services Clients A/C 500 9.74%
Public 10.58%
Total Assets 1,120,399 860,323
Current Assets 518,284 369,694
Non-Current Assets 602,115 490,629
Liabilities 398,124 311,374
Shareholders' Equity 722,275 548,949
Net Sales 1,388,229 1,084,108
Profit after Taxes 83,169 66,404
ROI (%) 7.42 7.72
ROE (%) 11.51 12.10
118 Indonesian Capital Market Directory 2010

from IDR1.028 trillion to IDR1.276 trillion.
Brief History: The company, founded in 1978 by the Gelael
Fixed Assets-Net Other Assets
78,856 7,102
86,949 8,953
112,205 14,259
Group, is the exclusive Kentucky Fried Chicken (KFC) franchise Liabilities 127,038 149,701 195,366
holder for Indonesia.On October 10, 1979, the company opened its first KFC restaurant on Jalan Melawai, Jakarta. The success of
Current Liabilities
of which
94,829 110,742 148,045
this first KFC restaurant had led the company to dominate the Bank loans n.a n.a n.a
fast food market leader in Indonesia for the past 17 years. More Trade payables 41,525 44,635 61,491
and more KFC restaurants were built in Jakarta and other major Taxes payable 16,771 15,734 28,790
cities in Indonesia. As of the end of 1996 the company operates Non-Current Liabilities 32,208 38,958 47,322
148 KFC restaurant in 30 major cities in Indonesia. The company’s Shareholders' Equity 194,946 228,205 288,209
KFC core products: the Colonel’s Original Recipe Chicken and Paid-up capital 44,625 44,625 44,625
Hot & Crispy Chicken, are consistently rated as the best tasting Paid-up capital chicken in various Indonesian consumer surveys, both are very in excess of par value 1,483 1,841 2,254
well accepted in Indonesia, where chicken consumption rate is Retained earnings 148,838 181,738 241,329
significantly higher than any other types of meat products. The Net Sales 889,423 1,028,393 1,276,416 acceptance of the KFC core products are further enhanced as the Cost of Good Sold 353,017 418,007 491,546 company also offers local menu favorites in its KFC restaurants: Gross Profit 536,406 610,386 784,870 rice (Indonesian staple food), perkedel (potato croquette), lumpia Operating Expenses 488,449 557,707 694,999 (egg roll), as well as Indonesian Soup to supplement the core prod- Operating Profit (Loss) 47,957 52,679 89,872
ucts. To obtain feedback on the company market performance, an Other Income (Expense) 4,261 5,192 6,095
independent research company was engaged since 1998 to con- Profit (Loss) before Taxes 52,218 57,871 95,967
duct quarterly Brand Image Tracking Study (BITS) to track down Profit (Loss) after Taxes 37,316 41,291 68,926
consumers perception and brand image of leading players in the
fast food industry. Year 2000 results consistenly showed that KFC Per Share Data (Rp)
is highest in ‘Top of Mind Awareness’ compared to other leading Earnings (Loss) per Share 84 93 154
brands. Equity per Share 437 511 646
Dividend per Share 18 20 20
Closing Price 1,050 1,200 1,820
Financial Ratios
PER (x) 12.56 12.97 11.78
PBV (x) 2.40 2.35 2.82
Dividend Payout (%) 21.53 21.61 12.95
Dividend Yield (%) 1.71 1.67 1.10
Current Ratio (x) 1.28 1.14 1.07
Debt to Equity (x) 0.65 0.66 0.68
Leverage Ratio (x) 0.39 0.40 0.40
Gross Profit Margin (x) 0.60 0.59 0.61
Operating Profit Margin (x) 0.05 0.05 0.07
Net Profit Margin (x) 0.04 0.04 0.05
Inventory Turnover (x) 12.50 12.14 10.60
Total Assets Turnover (x) 2.76 2.72 2.64
ROI (%) 11.59 10.93 14.25
ROE (%) 19.14 18.09 23.92
Shareholders PT Gelael Pratama 43.77%
PT Megah Eraraharja 35.77%
Cooperative 0.46%
Public 20.00%
PT Fast Food Indonesia Tbk.
Food and Beverages
Head Office Gedung Gelael, 4th Floor Jl. MT. Haryono Kav. 7
Jakarta 12810 Phone (021) 829-8390, 830-9382
Summary of Financial Statement
(million rupiah) 2004 2005 2006
Fax (021) 829-8387, 830-0569 Telex 48725 Gelael IA
Business Manufacturer and Distributor of
Food and Beverages
Company Status PMDN
Financial Performance: The Company booked net profit at IDR68.928 billion in 2006, rising by 66.93% at IDR41.291 billion in 2005. The net sales hike supported the net profit rose by 24.12%
Total Assets 321,984 377,905 483,575
Current Assets 121,330 125,833 158,552
of which
Cash and cash equivalents 85,008 82,698 103,636
Receivable from affiliates 2,376 2,953 3,522
Inventories 28,247 34,436 46,351
Non-Current Assets 200,654 252,072 325,023
of which
PER = 12.17x ; PBV = 2.55x (June 2006)
Financial Year: December 31
Public Accountant: Purwantono, Sarwoko & Sandjaja
84 Indonesian Capital Market Directory 2007

Head OfÞce
Sudirman Plaza, Indofood Tower 27th Floor
Jl. Jend. Sudirman Kav. 76-78, Jakarta 12910
Phone (021) 5795-8822; Fax (021) 5793-5960
www.indofood.co.id Factories - Jl. Ancol I No. 4-5, Ancol Barat, Jakarta 14
Phone (021) 690-7141-45, Fax (021) 690-5- Jl. Kampung Jarakosta, Desa Suka Danau
Liabilities 25,786,846 26,640,979
Shareholders' Equity 10,743,420 8,814,386
Net Sales 18,122,582 18,077,450
Profit after Taxes 1,410,508 799,735
ROI (%)
3.35
1.98
ROE (%) 13.13 9.07
PT Indofood Sukses Makmur Tbk.
Food and Beverages
Summary of Financial Statement
Cibitung, Bekasi 17520, Jawa Barat Phone (021) 890-4169, Fax (021) 890-1187, 890-4184
- Jl. Tambak Aji II No. 8 Ngalian, Semarang 50158, Jawa Tengah
430 435
(Million Rupiah) 2007 2008 2009
Total Assets 29,706,895 39,591,309 40,382,953
Current Assets 11,809,129 14,323,261 12,954,813
of which
Cash and cash equivalents 4,538,051 4,271,208 4,474,830
Trade receivables 2,136,401 2,260,082 1,956,166
Inventories 4,172,388 6,061,219 5,117,484
Non-Current Assets 17,897,766 25,268,048 27,428,140
of which
Phone (024) 866-3411, Fax (024) 866-5020 - Jl. Raya Beji Km. 32, Desa Cangkring Malang
Bangil, Pasuruan, Jawa Timur Phone (0343) 656-177, 656-178,Fax (0343) 656-179
- Jl. Raya Medan, Tanjung Morawa Km. 18,5 Tj. Morawa, Deli Serdang Phone (061) 794-1515, Fax (061) 794-1512
- Jl. Kaharudin Nasution Km. 12, Simpang Tiga Bukit Raya, Pekan Baru, 28284 Phone (0761) 71-883, Fax (0761) 71-338
- Jl. Desa Liang Anggang Km. 32 Bati-Bati, Tanah Laut, Banjarmasin 70852 Kalimantan Selatan Phone (0511) 568-29-30, Fax (0511) 568-46
- Jl. Kima X Km. A-3, Biringkanaya Kawasan Idustri Kima, Ujung Pandang Makassar, Sulawesi Selatan Phone (0411) 510-206-07 Fax (0411) 510-027
Business Food Processing Company Company Status PMDN
Financial Performance: The Company booked recorded
consolidated net sales of Rp37.14 trillion, which declined 4.3%
from Rp38.80 trillion in 2008, mainly due to the decline in CPO and ßour prices. The strength in the operational performance
is reßected in the increase of Core proÞt to Rp1.73 trillion in
2009 from Rp1.45 trillion in 2008.
Brief History: The Company is incorporated as PT Pan-
ganjaya Intikusuma in 1990. In 1994, The name of the Company
is changed to PT Indofood Sukses Makmur, the same year the
Company lists on the Indonesia Stock Exchange (763 million
shares, Rp1,000 par value per share). In 1995, The Company acquires ßour miller Bogasari, beginning the creation of a ver-
tically integrated food company. The Company is a leading
processed food company in Indonesia. Indofood provides to-
tal food solutions through its four strategic business groups: consumer branded products (CBP), Bogasari (ßour producer),
agribusiness, and distribution. Indofood’s strongest legacy today
is the strength of its brands, many of which have been compan-
ions to the people of Indonesia for nearly two decades. These
include a variety of brands of instant noodles (Indomie, Supermi and Sarimi), wheat ßour (Segitiga Biru, Kunci Biru and Cakra
Kembar), cooking oils (Bimoli), margarine (Simas Palmia) and
shortenings (Palmia). The acquisition of Indolakto, one of the
leading processed milk producers (Indomilk) has positioned In-
dofood as the Progressive Total Food Solutions company. Indo- food brands continue to be the market leaders in their speciÞc
segments with a reputation for quality and value for money that
remains unrivalled.
Fixed Assets-Net 8,166,816 9,586,545 10,808,449
Deffered Tax Assets-Net 167,299 229,515 348,599
Investments 20,219 164,864 31,640
Other Assets 900,761 1,673,000 2,044,473 Liabilities 18,794,518 26,432,369 24,886,781
Current Liabilities 12,888,677 16,262,161 11,158,962
of which
Bank loans 5,734,104 7,634,711 5,017,603
Trade payables 1,835,266 2,514,689 1,686,618
Accrued expenses 1,190,093 1,103,395 1,326,468
Non-Current Liabilities 5,905,841 10,170,208 13,727,819
Minority Interests in Subsidiaries 3,721,828 4,587,407 5,340,677 Shareholders' Equity 7,190,549 8,571,533 10,155,495
Paid-up capital 944,419 878,043 878,043
Paid-up capital
in excess of par value 1,182,046 1,497,733 1,497,733
Retained earnings 5,064,084 6,195,757 7,779,719 Net Sales 27,858,304 38,799,279 37,140,830
Cost of Goods Sold 21,232,761 29,822,362 27,018,884
Gross Profit 6,625,543 8,976,917 10,121,946
Operating Expenses 3,749,103 4,635,441 5,117,737
Operating Profit 2,876,440 4,341,476 5,004,209
Other Income (Expenses) (835,031) (1,741,653)
(940,396) Profit before Taxes 2,041,409 2,599,823
4,063,813
Profit after Taxes 980,357 1,034,389 2,075,861 Per Share Data (Rp)
Earnings per Share 104 118 236
Equity per Share 761 976 1,157
Dividend per Share n.a n.a 93
Closing Price 2,575 930 3,550 Financial Ratios
PER (x) 24.81 7.89 15.02
PBV (x) 3.38 0.95 3.07
Dividend Payout (%) n.a n.a 39.34
Dividend Yield (%) n.a n.a 2.62 Current Ratio (x) 0.92 0.88 1.16
Debt to Equity (x) 2.61 3.08 2.45
Leverage Ratio (x) 0.63 0.67 0.62
Gross Profit Margin (x) 0.24 0.23 0.27
Operating Profit Margin (x) 0.10 0.11 0.13
Net Profit Margin (x) 0.04 0.03 0.06
Inventory Turnover (x) 5.09 4.92 5.28
Total Assets Turnover (x) 0.94 0.98 0.92
ROI (%) 3.30 2.61 5.14
ROE (%) 13.63 12.07 20.44
PER = 14.88x ; PBV = 3.39x (June 2010)
Financial Year: December 31
(million rupiah)
2010 2009
June June
Total Assets 42,072,894 40,324,780
Current Assets 14,873,999 14,040,719
Non-Current Assets 27,198,895 26,284,061
Shareholders
CAB Holdings Limited, Seychelles 50.05%
Public 49.95%
120 Indonesian Capital Market Directory 2010

Shareholders CAB Holdings Ltd. 51.53%
Public 48.47%
PT Indofood Sukses Makmur Tbk. Food and Beverages
Head Office Gedung Ariobimo Central, 12th Floor Jl. H.R Rasuna Said X-2 Kav. 5, Jakarta 12950 Phone (021) 522-8822, 526-8768
Fax (021) 522-6014, 522-5960 www.indofood.co.id
Factories - Jl. Ancol I No. 4-5, Ancol Barat
Summary of Financial Statement
(million rupiah)
2004 2005 2006
Jakarta 14430 Phone (021) 690-7141-45, Fax (021) 690-5435
- Jl. Kampung Jarakosta, Desa Suka Danau Cibitung, Bekasi 17520, Jawa Barat Phone (021) 890-4169, Fax (021) 890-1187, 890-4184
- Jl. Tambak Aji II No. 8 Ngalian, Semarang 50158, Jawa Tengah Phone (024) 866-3411, Fax (024) 866-5020
- Jl. Raya Beji Km. 32, Desa Cangkring Malang
Bangil, Pasuruan, Jawa Timur Phone (0343) 656-177, 656-178, Fax (0343) 656-179
- Jl. Raya Medan, Tanjung Morawa Km. 18,5 Tj. Morawa, Deli Serdang Phone (061) 794-1515, Fax (061) 794-1512
- Jl. Kaharudin Nasution Km. 12, Simpang Tiga Bukit Raya, Pekan Baru, 28284 Phone (0761) 71-883, Fax (0761) 71-338
- Jl. Desa Liang Anggang Km. 32 Bati-Bati, Tanah Laut, Banjarmasin 70852 Kalimantan Selatan Phone (0511) 568-29-30, Fax (0511) 568-46
- Jl. Kima X Km. A-3, Biringkanaya Kawasan Idustri Kima, Ujung Pandang Makassar, Sulawesi Selatan Phone (0411) 510-206-07 Fax (0411) 510-027
Business Food Processing Company Company Status PMDN
Financial Performance: The Company booked net profit of
IDR661.21 billion in 2006, rising sharply by 433% from IDR124.02
billion in 2005. Operating profit rose to IDR1.98 trillion, rising by
18.8% from IDR1.66 trillion.
Brief History: The company products are marketed under the
Indomie, Sarimi, Supermi, Pop Mie and Top Mie brands, and con-
trol 90% of the instant noodle market in Indonesia. The company
also produces Indofood seasonings, and soy sauce under the
Indofood and Piring Lombok brands. Other product lines includ-
ing Chiki, Chitato, Cheetos and Jetz snack foods, SUN baby foods,
Tugu Luwak and Cafela coffee. In April 1994, Global Mark Interna-
tional Limited, one of the shareholders, floated US$ 500 million
worth of 3-year Mandatory Exchangeable Bonds (MEB) on the Lux-
embourg Stock Exchange. The MEBs are bonds exchangeable for
139 million Global Mark shares. After all bonds are exchanged, the
Global Mark shares will be reduced to 215 million, or 28% of total
equity in the company. The company has 12 subsidiaries: PT
Ciptakemas Abadi, PT Gizindo Primanusantara, PT Prima
Intipangan Sejati, PT Intranusa Cipta, PT Tristara Makmur (all 100%
owned), PT Indosentra Pelangi (70% owned), PT Arthanugraha
Mandiri (51%), PT Suryapangan Indonesia (50%), PT Cemako
Mandiri Corp. (50%) and PT Putri Usahatama (50% owned). On
April 1995 the company with 51% shares and Said Bawasir Trading
Corporation 49% set a noodle instant fabric in Jeddah, Arab Saudi.
On April 1997 the extraordinary general meeting of the company
approved management plans to acquire six affiliated companies.
The company is a member of the Salim Group. The company gar-
nered an Environmental Marketing Award (EMI) from the Indone-
sian Marketing Association for its performance in developing an
environmental marketing system. In May 2001, Indofood acquired
Asia Food Property from Singapore-listed Golden Agri Resources.
This acquisition is expected to strengthen the core business of the
company.
Total Assets 15,673,356 14,786,084 16,112,493
Current Assets 6,415,060 6,471,590 7,457,559
of which
Cash and cash equivalents 1,394,075 970,911 1,794,451
Trade receivables 1,328,973 1,527,361 1,448,172
Inventories 2,284,332 2,691,672 2,975,274
Non-Current Assets 9,258,296 8,314,494 8,654,934
of which
Fixed Assets-Net 6,013,390 6,041,763 6,440,524
Deffered Tax Assets-Net 53,870 108,768 113,587
Investments 364,002 230,080 23,103
Other Assets 743,016 774,098 747,886
Liabilities 10,727,582 10,042,582 10,523,697
Current Liabilities 4,337,508 4,402,870 6,273,098
of which
Bank loans 511,585 1,447,091 2,039,664
Trade payables 1,201,105 1,584,472 1,177,620
Accrued expenses 276,983 344,998 558,972
Non-Current Liabilities 6,390,075 5,639,712 4,250,599
Minority Interests in Subsidiaries 755,857 435,053 657,710
Shareholders' Equity 4,189,916 4,308,449 4,931,086
Paid-up capital 944,419 944,419 944,419
Paid-up capital
in excess of par value 1,182,046 1,182,046 1,182,046
Retained earnings 2,063,452 2,181,984 2,804,621
Net Sales 17,918,528 18,764,650 21,941,558
Cost of Goods Sold 13,313,099 14,341,545 16,760,382
Gross Profit 4,605,430 4,423,105 5,181,176
Operating Expenses 2,507,098 2,760,608 3,205,467
Operating Profit 2,098,331 1,662,497 1,975,709
Other Income (Expenses) (1,235,010) (1,236,736) (750,485)
Profit before Taxes 863,321 425,761 1,225,224
Profit after Taxes 386,919 124,018 661,210
Per Share Data (Rp)
Earnings per Share 41 13 70
Equity per Share 444 456 522
Dividend per Share 18 5 35
Closing Price 800 910 1,350
Financial Ratios
PER (x) 19.53 69.30 19.28
PBV (x) 1.80 1.99 2.59
Dividend Payout (%) 43.94 38.08 49.99
Dividend Yield (%) 2.25 0.55 2.59
Current Ratio (x) 1.48 1.47 1.19
Debt to Equity (x) 2.56 2.33 2.13
Leverage Ratio (x) 0.68 0.68 0.65
Gross Profit Margin (x) 0.26 0.24 0.24
Operating Profit Margin (x) 0.12 0.09 0.09
Net Profit Margin (x) 0.02 0.01 0.03
Inventory Turnover (x) 5.83 5.33 5.63
Total Assets Turnover (x) 1.14 1.27 1.36
ROI (%) 2.47 0.84 4.10
ROE (%) 9.23 2.88 13.41
PER = 27.01x ; PBV = 3.04x (June 2007)
Financial Year: December 31
Public Accountant: Prasetio, Sarwoko & Sandjaja (2005);
Purwantono, Sarwoko & Sandjaja (2006)
86 Indonesian Capital Market Directory 2007

Total Assets 860,509 786,009
Current Assets 425,874 341,490
Non-Current Assets 434,635 444,519
Liabilities 611,370 593,408
Shareholders' Equity 249,049 192,524
PT Multi Bintang Indonesia Tbk.
Food and Beverages
Head OfÞce Talavera OfÞce Park 20th Floor
Jl. Let. Jend. TB. Simatupang Kav. 22-26
Jakarta 12430
Summary of Financial Statement
(Million Rupiah)
Phone (021) 7592-46117 Fax (021) 7592-4617
Factories - Jl. Raya Mojosari-Pacet Km. 50
Sampang Agung, Jawa Timur
- Jl. Daan Mogot Km. 19 PO Bag 3264
Jakarta 15122
Phone (021) 619-0108 (Hunting)
545-0750
Fax (021) 619-4835, 619-0190
Telex 43426 JAKBIR IA
Business Beverages
Company Status PMA
Financial Performance: The Company booked net income
amounted IDR340 billion in 2009, higher than last year income
worth IDR222 billion.
Brief History: The company began its operation in 1931
under the name of NV Nederlandsch Indische Bierbrouwerijen.
Since 1936, the company has been under a Dutch company,
Heineken International Beheer BV. The main products of the
company are beer and stout, marketed under the brands of
Bir Bintang and Guinness. Bir Bintang controls over 60% share
of the beer market. The company has technical assistance co-
operation with Heineken Technische Beheer and Guinness
Overseas Ltd. After selling the softdrink plant in Medan in April
1994, the company now run breweries in Mojosari, East Java
and Tangerang, West Java. At the end of 1994 the company’s head ofÞce was relocated to the Tangerang brewery. The com-
pany is relocating its brewery in Ngagel, Surabaya to Sampanga-
gung, Mojokerto to increase production capacity from 300.000
to 800.000 hecto liters. This total of 60 million liters per annum
will cost around Rp. 150 billion. On October 13, 1997, the
company started to export beer to Japan and North Australia.
2007 2008 2009
Total Assets 621,835 941,389 993,465
Current Assets 228,688 524,813 561,482
of which
Cash and cash equivalents 44,207 276,849 337,162
Trade receivables 110,490 103,515 91,685
Inventories 64,747 103,212 110,497
Non-Current Assets 393,147 416,576 431,983
of which
Fixed Assets-Net 362,811 403,172 420,864
Other Assets 4,637 4,889 4,615 Liabilities 424,028 597,123 888,122
Current Liabilities 386,816 561,144 852,194
of which
Trade payables 43,490 49,590 49,884
Accrued expenses 69,306 93,250 94,386
Taxes payable 110,511 171,258 191,544
Non-Current Liabilities 37,212 35,979 35,928
Minority Interests in Subsidiaries 84 88 132 Shareholders' Equity 197,723 344,178 105,211
Paid-up capital 21,070 21,070 21,070
Paid up capital
in excess of par value 1,802 1,802 1,802
Retained earnings 174,851 321,306 82,339 Net Sales 978,600 1,325,661 1,616,264
Cost of Goods Sold 536,028 686,556 766,918
Gross Profit 442,572 639,105 849,346
Operating Expenses 309,419 352,819 335,962
Operating Profit 133,153 286,286 513,384
Other Income (Expenses) (2,002) 27,690
(40,893) Profit before Taxes 131,151 313,976
472,491
Profit after Taxes 84,385 222,307 340,458 Per Share Data (Rp)
Earnings per Share 4,005 10,551 16,158
Equity per Share 9,384 16,335 4,993
Dividend per Share 3,600 15,000 3,650
Closing Price 55,000 49,500 177,000 Financial Ratios
PER (x) 13.73 4.69 10.95
PBV (x) 5.86 3.03 35.45
Dividend Payout (%) 89.89 142.17 22.59
Dividend Yield (%) 6.55 30.30 2.06 Current Ratio (x) 0.59 0.94 0.66
Debt to Equity (x) 2.14 1.73 8.44
Gross Profit Margin (x) 0.45 0.48 0.53
Net Profit Margin (x) 0.09 0.17 0.21
Inventory Turnover (x) 8.28 6.65 6.94
Total Assets Turnover (x) 1.57 1.41 1.63
ROI (%) 13.57 23.61 34.27
ROE (%) 42.68 64.59 323.59
PER = 9.16x ; PBV = 14.38x (June
2010) Financial Year: December 31
Public Accountant: Siddharta Siddharta & Widjaja (2008); Siddharta & Widjaja (2009)
(million rupiah)
2010 2009
June June
Shareholders
Asia Pacific Breweries Limited 75.00%
Hollandsch Administratiekantoor B.V. 7.00%
Public 18.00%
Net Sales 868,794 755,595
Profit after Taxes 220,743 164,396
ROI (%) 25.65 20.92
ROE (%) 88.63 85.39
124 Indonesian Capital Market Directory 2010

- Jl. Daan Mogot Km. 19
PO Bag 3264
Jakarta 15122 Phone (021) 619-0108 (
545-0750 (Hunting)
Fax (021) 619-4835
of which
Cash and cash equivalents 75,485 10,514 4,759
Trade receivables 95,658 113,431 99,757
Hunting) Inventories 72,001 71,057 76,459
Non-Current Assets 284,870 361,439 411,791
of which Fixed Assets-Net 277,696 340,460 376,774
Telex 43426 JAKBIR IA Other Assets 7,174 5,428 4,789 Beverages
Beheer B.V 75.94%
Hollandsch Administratiekantoor B.V. 7.43%
Public 16.63%
PT Multi Bintang Indonesia Tbk. Food and Beverages
Head Office
Ratu Plaza Building 21st Floor
Jl. Jend. Sudirman Kav. 9
Summary of Financial Statement
Jakarta 10270 (million rupiah)
Phone (021) 720-7511
Fax (021) 720-7864 2004 2005 2006
Factories - Jl. Raya Mojosari-Pacet Km. 50 Total Assets 553,081 575,385 610,437
Sampang Agung, Jawa Timur Current Assets 268,211 213,946 198,646
Business
Company Status PMA
Financial Performance: The Company booked net profit of
IDR73.581 billion in 2006, down by 15.44% from IDR87.014 billion
in 2005. The net profit decrease was due to decline in other net
expenses of IDR20.047 billion versus other net revenues of
IDR1.773 billion.
Brief History: The company began its operation in 1931 under
the name of NV Nederlandsch Indische Bierbrouwerijen. Since
1936, the company has been under a Dutch company, Heineken
International Beheer BV. The main products of the company are
beer and stout, marketed under the brands of Bir Bintang and
Guinness. Bir Bintang controls over 60% share of the beer market.
The company has technical assistance cooperation with Heineken
Technische Beheer and Guinness Overseas Ltd. After selling the
softdrink plant in Medan in April 1994, the company now run
breweries in Mojosari, East Java and Tangerang, West Java. At the
end of 1994 the company’s head office was relocated to the
Tangerang brewery. The company is relocating its brewery in
Ngagel, Surabaya to Sampangagung, Mojokerto to increase pro-
duction capacity from 300.000 to 800.000 hecto liters. This total of
60 million liters per annum will cost around Rp. 150 billion. On
October 13, 1997, the company started to export beer to Japan and
North Australia.
Shareholders
Heineken International
Liabilities 303,532 347,434 411,907
Current Liabilities 272,933 314,409 375,933
of which
Trade payables 46,637 56,931 43,558
Accrued expenses 22,276 40,658 48,360
Taxes payable 65,631 74,662 92,285
Non-Current Liabilities 30,599 33,025 35,974
Minority Interests in Subsidiaries 14 39 69 Shareholders' Equity 249,535 227,912 198,461
Paid-up capital 21,070 21,070 21,070
Paid up capital
in excess of par value 1,802 1,802 1,802
Retained earnings 226,663 205,040 175,589 Net Sales 710,911 852,613 891,001
Cost of Goods Sold 402,109 477,940 466,684
Gross Profit 308,802 374,673 424,317
Operating Expenses 203,828 247,857 293,209
Operating Profit 104,974 126,816 131,108
Other Income (Expenses) 25,345 1,773 (20,047)
Profit before Taxes 130,319 128,589 111,061
Profit after Taxes 87,313 87,014 73,581 Per Share Data (Rp)
Earnings per Share 4,144 4,130 3,492
Equity per Share 11,843 10,817 9,419
Dividend per Share 3,000 3,165 2,640
Closing Price 42,500 50,000 55,000 Financial Ratios
PER (x) 10.26 12.11 15.75
PBV (x) 3.59 4.62 5.84
Dividend Payout (%) 72.39 76.64 75.60
Dividend Yield (%) 7.06 6.33 4.80 Current Ratio (x) 0.98 0.68 0.53
Debt to Equity (x) 1.22 1.52 2.08
Gross Profit Margin (x) 0.43 0.44 0.48
Net Profit Margin (x) 0.12 0.10 0.08
Inventory Turnover (x) 5.58 6.73 6.10
Total Assets Turnover (x) 1.29 1.48 1.46
ROI (%) 15.79 15.12 12.05
ROE (%) 34.99 38.18 37.08
PER = 14.14x ; PBV = 4.95x (June 2007)
Financial Year: December 31
Public Accountant: Siddharta Siddharta & Widjaja
90 Indonesian Capital Market Directory 2007

Current Assets 1,998,030 1,634,348
Non-Current Assets 1,621,169 1,463,651 Shareholders
Liabilities 1,775,469 1,653,614
PT Unita Branindo 32.93% Shareholders' Equity 1,793,963 1,409,348
Koperasi Karyawan PT Mayora Indah Group 0.11% Net Sales 3,312,862 2,401,181
Profit after Taxes 211,459 163,404
Koperasi TNI Angkatan Darat 0.03%
ROI (%) 5.84 5.27
Public 66.93% ROE (%) 11.79 11.59
PT Mayora Indah Tbk. Food and Beverages
Head OfÞce Mayora Building
Jl. Tomang Raya 21-23
Jakarta 11440
Summary of Financial Statement
(Million Rupiah)
Phone (021) 565-5320-22 Fax (021) 565-5323
Telex 45864 BISCO IA
E-mail: [email protected]
Factories - Jl. Merdeka Km.7,8, Tangerang
- Jl. Daan Mogot Km. 18, Jakarta Barat
Business Confectionery
Company Status PMDN
Financial Performance: The Company booked net proÞt
at IDR372 billion in 2009, soaring from IDR196 billion booked
in 2008. Brief History: Since Þrst established in 1977, PT Mayora
Indah Tbk has been one of Indonesia’s important food indus-
tries. As a result of the country’s growth in economy and the
shift of social consumptive pattern towards more practical
products, PT Mayora boasts a rapid growth over the years.
Today, PT Mayora Indah Tbk is divided into 6 business
divisions:
1. Biscuit: Roma, Better, Slai O Lai, and Danisa
2. Candy: Kopiko, Kis, Tamarin, and Plonk
3. Wafer: Beng Beng, Astor, and Roma
4. Chocolate: Choki Choki, and Danisa
5. Health Food: Energen
6. Coffee: Torabika
To meet the ever increasing market demands, PT May-
ora Indah Tbk went public through Initial Public Offering (IPO)
in 1990. A successful move that is evident in the materialization
of factories in Tangerang, Bekasi and Surabaya, which employ
5,300workers.
Supported with strong and wide distribution networks,
products of PT Mayora Indah Tbk are available throughout In-
donesia and some overseas countries such as Malaysia, Thai-
land, Philippines, Vietnam, Singapore, Hong Kong, Saudi Arabia,
Australia, Africa, America and Italy.
2007 2008 2009 Total Assets 1,893,175 2,922,998 3,246,498
Current Assets 1,043,843 1,684,853 1,750,424
of which
Cash and cash equivalents 120,002 316,331 321,583
Trade receivables 577,075 737,412 857,566
Inventories 266,716 534,329 458,603
Non-Current Assets 849,333 1,238,146 1,496,074
of which
Fixed Assets-Net 774,390 1,030,725 1,282,771
Deffered Tax Assets 8,123 4,995 5,106 Liabilities 785,034 1,646,934 1,623,443
Current Liabilities 555,773 769,800 764,230
of which
Trade payables 200,882 448,021 356,908
Current maturities
of long-term debt 269,650 60,000 50,000
Non-Current Liabilities 229,261 877,134 859,213
Minority Interests in Subsidiaries 25,596 30,955 41,300 Shareholders' Equity 1,081,795 1,245,109 1,581,755
Paid-up capital 383,292 383,292 383,292
Paid-up capital in excess of par value 64,212 64,212 64,212
Retained earnings 634,291 797,605 1,134,251 Net Sales 2,828,440 3,907,674 4,777,175
Cost of Goods Sold 2,199,880 3,153,751 3,643,390
Gross Profit 628,560 753,923 1,133,786
Operating Expenses 389,846 408,503 520,598 Operating Profit 238,713 345,420 613,187
Other Income (Expenses) (28,885) (71,351) (109,254)
Profit before Taxes 209,828 274,070
503,934
Profit after Taxes 141,589 196,230 372,158 Per Share Data (Rp)
Earnings per Share 185 256 485
Equity per Share 1,411 1,624 2,063
Dividend per Share 40 50 n.a
Closing Price 1,750 1,140 4,500 Financial Ratios
PER (x) 9.47 4.45 9.27
PBV (x) 1.24 0.70 2.18
Dividend Payout (%) 0.22 0.20 n.a
Dividend Yield (%) 0.02 0.04 n.a Current Ratio (x) 1.88 2.19 2.29
Debt to Equity (x) 0.73 1.32 1.03
Leverage Ratio (x) 0.41 0.56 0.50
Gross Profit Margin (x) 0.22 0.19 0.24
Operating Profit Margin (x) 0.08 0.09 0.13
Net Profit Margin (x) 0.05 0.05 0.08
Inventory Turnover (x) 8.25 5.90 7.94
Total Assets Turnover (x) 1.49 1.34 1.47
ROI (%) 7.48 6.71 11.46
ROE (%) 13.09 15.76 23.53
PER =13.40x ; PBV = 2.97x (June 2010)
Financial Year: December 31
Public Accountant: Mulyamin Sensi Suryanto
(million rupiah)
2010 2009
June June
Total Assets 3,619,199 3,097,999
Pusat Pendidikan Perbekalan Dan Angkutan Primer
122 Indonesian Capital Market Directory 2010

PT Mayora Indah Tbk.
Head Office Gedung Mayora
Jl. Tomang Raya 21-23 Jakarta 11440
Phone (021) 565-5320, 565-5322 Fax (021) 565-5336, 565-5323
Summary of Financial Statement
Food and Beverages
(million rupiah) 2004 2005 2006
Telex 45864 BISCO IA
E-mail: [email protected]
Factories - Jl. Merdeka Km.7,8, Tangerang
- Jl. Daan Mogot Km. 18,
Jakarta Barat
Business Confectionery
Company Status PMDN
Financial Performance: The Company booked net profit of
IDR93.576 billion in 2006, rising sharply by 104.63% from
IDR45.730 billion in 2005. The significant net profit increase was
partly due to the net sales that climbed up by 15.59% at IDR1.972
trillion from IDR1.706 trillion.
Brief History: Founded in 1977, it took over PT Unita Branindo
in 1990, a wafer and chocolate manufacturer also owned by the
company founder. Ever since the take over, the company has
owned two factories in Tangerang, West Java, on a site of 11.7 Ha
of land. The company has an agreement with Oka AG Ltd. for
chocolate production and with Danish Specialty Food Aps of Den-
mark for the production of Danish Cookies. PT Mayora Indah is a
subsidiary of the Inbisco Group, which has been active in the food
industry since 1948.
Shareholders
PT Unitra Branindo 32.93%
Koperasi PT Mayora Indah Group 0.11%
Public 66.96%
Total Assets 1,280,645 1,459,969 1,553,377
Current Assets 637,641 675,637 796,223
of which
Cash and cash equivalents 61,217 113,158 54,255
Trade receivables 326,797 337,806 448,640
Inventories 184,596 171,712 230,681
Non-Current Assets 643,004 784,332 757,154
of which
Fixed Assets-Net 610,503 732,053 738,125
Deffered Tax Assets 3,757 6,128 8,412 Liabilities 398,172 548,714 562,445
Current Liabilities 124,850 191,029 203,673
of which
Trade payables 107,938 134,613 130,168
Current maturities
of long-term debt n.a 20,000 20,000
Non-Current Liabilities 273,322 357,685 358,772
Minority Interests in Subsidiaries 13,231 16,234 20,567 Shareholders' Equity 869,242 895,021 969,476
Paid-up capital 383,292 383,292 383,292
Paid-up capital in excess of par value 64,212 64,212 64,212
Retained earnings 421,738 447,517 521,972 Net Sales 1,378,127 1,706,184 1,971,513
Cost of Goods Sold 1,035,628 1,329,238 1,464,582
Gross Profit 342,499 376,946 506,931
Operating Expenses 211,867 283,411 336,026
Operating Profit 130,632 93,536 170,905
Other Income (Expenses) (4,939) (25,955)
(29,161) Profit before Taxes 125,694 67,581
141,744
Profit after Taxes 85,107 45,730 93,576 Per Share Data (Rp)
Earnings per Share 111 60 122
Equity per Share 1,134 1,168 1,265
Dividend per Share 25 25 35
Closing Price 1,200 820 1,620 Financial Ratios
PER (x) 10.81 13.75 13.27
PBV (x) 1.06 0.70 1.28
Dividend Payout (%) 0.23 0.42 0.29
Dividend Yield (%) 0.02 0.03 0.02 Current Ratio (x) 5.11 3.54 3.91
Debt to Equity (x) 0.46 0.61 0.58
Leverage Ratio (x) 0.31 0.38 0.36
Gross Profit Margin (x) 0.25 0.22 0.26
Operating Profit Margin (x) 0.09 0.05 0.09
Net Profit Margin (x) 0.06 0.03 0.05
Inventory Turnover (x) 5.61 7.74 6.35
Total Assets Turnover (x) 1.08 1.17 1.27
ROI (%) 6.65 3.13 6.02
ROE (%) 9.79 5.11 9.65
PER = 9.53x ; PBV = 1.47x (June
2007) Financial Year: December 31
Public Accountant: Osman Ramli Satrio & Co. (2005);
Mulyamin Sensi Suryanto (2006)
88 Indonesian Capital Market Directory 2007

PT Prasidha Aneka Niaga Tbk.
Food and Beverages
Head OfÞce Jl. Ki Kemas Rindho, Kertapati Palembang 30258 Phone (0711) 513-358, 511-168
Summary of Financial Statement
(Million Rupiah)
Fax (0711) 510-654 Telex 27224 PAN PG IA
Management OfÞce Plaza Sentral 20th Floor Jl. Jend. Sudirman Kav. 47, Jakarta 12930 Phone (021) 5790-4478, 5790-4488 Fax (021) 527-4948, 252-3428
Factory Jl. Ki Kemas Rindho, Kertapati Palembang 30258 Phone (0711) 513-358, 511-168 Fax (0711) 510-654 Telex 27224 PAN PG IA
Business Manufacturer of Coffee, Rubber, Chocolate and Vanilla
Company Status PMDN
Financial Performance: The Company booked net income at IDR32.449 billion in 2009, signiÞcantly increased compared to IDR9.448 billion booked in 2008.
Brief History: Prasidha Group was founded in 1984 by Mr. Oesman Soedargo, Mr. Mansjur Tandiono, the late Mr. Haji Mahmud Uding and late Mr. I Gede Subratha. The Group’s core business is agri- cultural commodities processing and exporting which is handle mainly by its operating member companies PT. Prasidha Aneka Niaga & its subsidiaries. It also has diversiÞcations in food , manufacturing, and plantation.
The main commodities processed and exported are: coffee, crumb rubber, tapioca chips and pellets, pepper, and cocoa.
At present, Prasidha through its subsidiary company PT. Aneka Coffee Industry has become one of the major coffee roaster and in- stant coffee producer in the region. It’s annual production capacity is 3600 tons of instant coffee and 2400 tons of ground coffee. The fac- tory utilizes modern machineries with advance processing technology from international reputable suppliers of equipments.
PT Aneka Coffee Industry has especially been known as a major reputable industrial supplier apart from being private labeling and in house branding supplier. Its market covering Japan, Europe, Asia Pa- ciÞc and the United States of America.
Prasidha has strong commitment in supporting government sug- gestion to promote the expansion of Indonesia specialty coffee in par- ticular Indonesia specialty Arabica type. Through its private plantation estates company, PT. Indoarabica Mangkuraja, Prasidha introducing a single estate Þne Sumatra Arabica Coffee beans grown in a charming coffee estate In Bengkulu, Sumatera Island.
The Plantation is situated at about 1.100 – 1.300 m above sea level up on the cool, western slopes of the Bukit Barisan mountains. Lush rain forest, rivers and spring are part of this beautiful estate.
The Mangkuraja Coffee has gained its charm among speciality Arabica Coffee connoisseurs, due to its uniquelly rich ßavour, which provides a delightful and memorable experience in coffee enjoyment.
2007 2008 2009
Total Assets 291,723 286,965 353,629
Current Assets 162,849 156,676 206,217
of which
Cash and cash equivalents 42,964 62,567 56,336
Trade receivables 47,498 17,991 36,367
Inventories 67,484 73,413 110,570
Non-Current Assets 128,874 130,289 147,412
of which
Fixed Assets-Net 120,264 117,341 117,206
Deffered Tax Assets-Net 1,533 2,075 2,324
Investments 630 630 630
Other Assets 5,755 5,821 4,231
Liabilities 178,414 151,922 180,642
Current Liabilities 73,224 56,299 131,964
of which
Short-term debt 43,208 14,235 84,600
Trade payables 3,786 2,586 6,417
Current maturities of
long-term debt 15,169 24,971 32,422
Non-Current Liabilities 105,190 95,623 48,678
Minority Interests in Subsidiaries 29,779 42,064 47,558
Shareholders' Equity 83,531 92,979 125,429
Paid-up capital 720,000 720,000 720,000
Paid-up capital
in excess of par value n.a n.a n.a
Revaluation of fixed assets 61,758 (430) (430)
Retained earnings (accumulated loss) (698,228) (626,591) (594,141)
Net Sales 600,060 713,114 592,358
Cost of Goods Sold 530,728 607,075 504,384
Gross Profit 69,332 106,039 87,975
Operating Expenses 41,543 43,537 44,843
Operating Profit (Loss) 27,789 62,502 43,132
Other Income (Expenses) (18,491) (20,451) 15,440
Profit (Loss) before Taxes 9,298 42,051 58,572
Profit (Loss) after Taxes (8,646) 9,448 32,450
Per Share Data (Rp)
Earnings (Loss) per Share (6) 7 23
Equity per Share 58 65 87
Dividend per Share n.a n.a n.a
Closing Price 51 100 110
Financial Ratios
PER (x) (8.49) 15.24 4.88
PBV (x) 0.88 1.55 1.26
Dividend Payout (%) n.a n.a n.a
Dividend Yield (%) n.a n.a n.a
Current Ratio (x) 2.22 2.78 1.56
Debt to Equity (x) 2.14 1.63 1.44
Leverage Ratio (x) 0.61 0.53 0.51
Gross Profit Margin (x) 0.12 0.15 0.15
Operating Profit Margin (x) 4.63 8.76 7.28
Net Profit Margin (x) n.a 0.01 0.05
Inventory Turnover (x) 7.86 8.27 4.56
Total Assets Turnover (x) 2.06 2.49 1.68
ROI (%) (2.96) 3.29 9.18
ROE (%) 10.35 (10.16) (25.87)
PER = 5.42x ; PBV = 1.14x (June 2010)
Financial Year: December 31
Public Accountant: Purwantono, Sarwoko & Sandjaja
Shareholders
Innovest Offshore Ventures Ltd. 46.93% (million rupiah)
Igianto Joe 15.54% 2010 2009
PT Aneka Bumi Prasidha 9.48% June June
PT Aneka Agroprasidha 7.92% Total Assets 369,936 334,951
Lion Best Holding Limited 7.77% Current Assets 219,303 188,933
ADM Maculus Fund L.P. 4.76% Non-Current Assets 150,634 146,018
H. Sjamsul Bachri 0.15% Liabilities 182,723 176,387
Didik Tandiono 0.04% Shareholders' Equity 138,409 112,956
Moenardji Soedargo 0.03% Net Sales 459,008 269,183
Jeffry Sanusi Soedargo 0.03% Profit after Taxes 12,980 19,977
Widyono Lianto 0.01%
Public 7.34%
ROI (%) 3.51 5.96
ROE (%) 9.38 17.69
130 Indonesian Capital Market Directory 2010
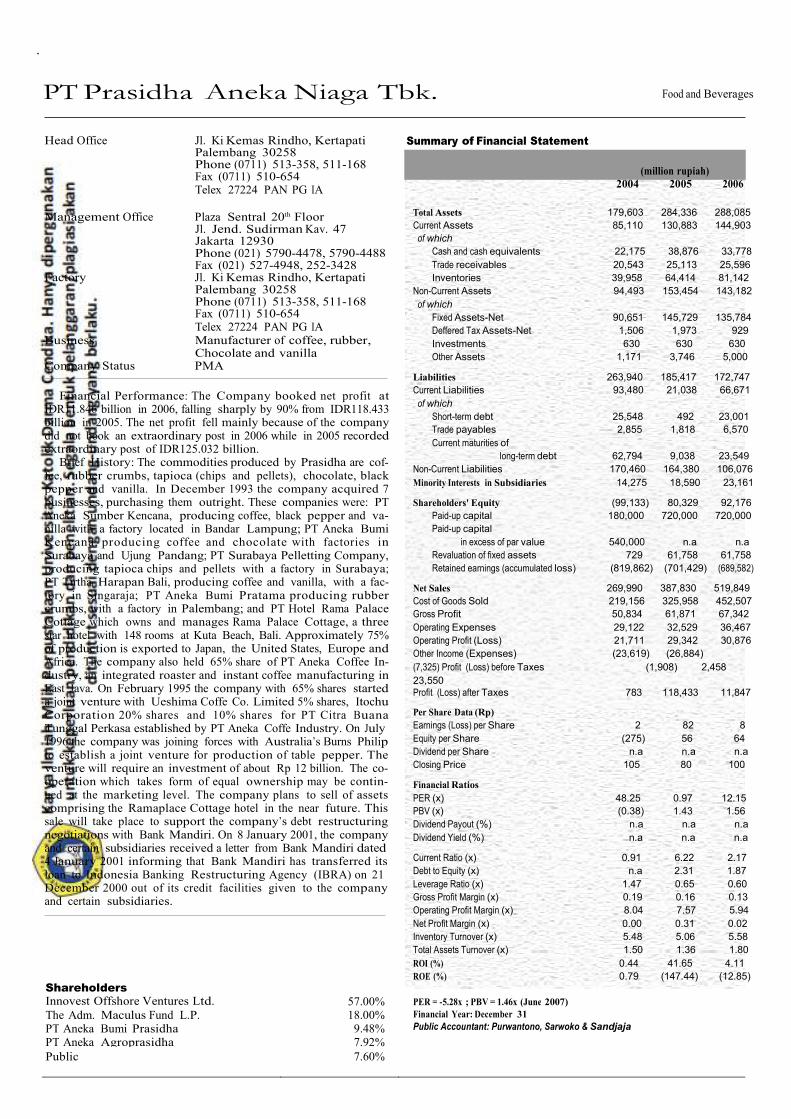
PT Prasidha Aneka Niaga Tbk.
Food and Beverages
Head Office Jl. Ki Kemas Rindho, Kertapati Palembang 30258 Phone (0711) 513-358, 511-168 Fax (0711) 510-654 Telex 27224 PAN PG IA
Summary of Financial Statement
(million rupiah) 2004 2005 2006
Management Office Plaza Sentral 20th Floor Jl. Jend. Sudirman Kav. 47 Jakarta 12930 Phone (021) 5790-4478, 5790-4488 Fax (021) 527-4948, 252-3428
Factory Jl. Ki Kemas Rindho, Kertapati Palembang 30258 Phone (0711) 513-358, 511-168 Fax (0711) 510-654 Telex 27224 PAN PG IA
Business Manufacturer of coffee, rubber, Chocolate and vanilla
Company Status PMA
Financial Performance: The Company booked net profit at
IDR11.846 billion in 2006, falling sharply by 90% from IDR118.433 billion in 2005. The net profit fell mainly because of the company did not book an extraordinary post in 2006 while in 2005 recorded extraordinary post of IDR125.032 billion.
Brief History: The commodities produced by Prasidha are cof- fee, rubber crumbs, tapioca (chips and pellets), chocolate, black pepper and vanilla. In December 1993 the company acquired 7 businesses, purchasing them outright. These companies were: PT Aneka Sumber Kencana, producing coffee, black pepper and va- nilla with a factory located in Bandar Lampung; PT Aneka Bumi Kencana, producing coffee and chocolate with factories in Surabaya and Ujung Pandang; PT Surabaya Pelletting Company, producing tapioca chips and pellets with a factory in Surabaya; PT Tirtha Harapan Bali, producing coffee and vanilla, with a fac- tory in Singaraja; PT Aneka Bumi Pratama producing rubber crumbs, with a factory in Palembang; and PT Hotel Rama Palace Cottage which owns and manages Rama Palace Cottage, a three star hotel with 148 rooms at Kuta Beach, Bali. Approximately 75% of production is exported to Japan, the United States, Europe and Africa. The company also held 65% share of PT Aneka Coffee In- dustry, an integrated roaster and instant coffee manufacturing in East Java. On February 1995 the company with 65% shares started a joint venture with Ueshima Coffe Co. Limited 5% shares, Itochu Corporation 20% shares and 10% shares for PT Citra Buana Tunggal Perkasa established by PT Aneka Coffe Industry. On July 1996 the company was joining forces with Australia’s Burns Philip to establish a joint venture for production of table pepper. The venture will require an investment of about Rp 12 billion. The co- operation which takes form of equal ownership may be contin- ued at the marketing level. The company plans to sell of assets comprising the Ramaplace Cottage hotel in the near future. This sale will take place to support the company’s debt restructuring negotiations with Bank Mandiri. On 8 January 2001, the company and certain subsidiaries received a letter from Bank Mandiri dated 4 January 2001 informing that Bank Mandiri has transferred its loan to Indonesia Banking Restructuring Agency (IBRA) on 21 December 2000 out of its credit facilities given to the company and certain subsidiaries.
Total Assets 179,603 284,336 288,085
Current Assets 85,110 130,883 144,903
of which
Cash and cash equivalents 22,175 38,876 33,778
Trade receivables 20,543 25,113 25,596
Inventories 39,958 64,414 81,142
Non-Current Assets 94,493 153,454 143,182
of which
Fixed Assets-Net 90,651 145,729 135,784
Deffered Tax Assets-Net 1,506 1,973 929
Investments 630 630 630
Other Assets 1,171 3,746 5,000
Liabilities 263,940 185,417 172,747
Current Liabilities 93,480 21,038 66,671
of which
Short-term debt 25,548 492 23,001
Trade payables 2,855 1,818 6,570
Current maturities of
long-term debt 62,794 9,038 23,549
Non-Current Liabilities 170,460 164,380 106,076
Minority Interests in Subsidiaries 14,275 18,590 23,161
Shareholders' Equity (99,133) 80,329 92,176
Paid-up capital 180,000 720,000 720,000
Paid-up capital
in excess of par value 540,000 n.a n.a
Revaluation of fixed assets 729 61,758 61,758
Retained earnings (accumulated loss) (819,862) (701,429) (689,582)
Net Sales 269,990 387,830 519,849
Cost of Goods Sold 219,156 325,958 452,507
Gross Profit 50,834 61,871 67,342
Operating Expenses 29,122 32,529 36,467
Operating Profit (Loss) 21,711 29,342 30,876
Other Income (Expenses) (23,619) (26,884)
(7,325) Profit (Loss) before Taxes (1,908) 2,458
23,550
Profit (Loss) after Taxes 783 118,433 11,847
Per Share Data (Rp)
Earnings (Loss) per Share 2 82 8
Equity per Share (275) 56 64
Dividend per Share n.a n.a n.a
Closing Price 105 80 100
Financial Ratios
PER (x) 48.25 0.97 12.15
PBV (x) (0.38) 1.43 1.56
Dividend Payout (%) n.a n.a n.a
Dividend Yield (%) n.a n.a n.a
Current Ratio (x) 0.91 6.22 2.17
Debt to Equity (x) n.a 2.31 1.87
Leverage Ratio (x) 1.47 0.65 0.60
Gross Profit Margin (x) 0.19 0.16 0.13
Operating Profit Margin (x) 8.04 7.57 5.94
Net Profit Margin (x) 0.00 0.31 0.02
Inventory Turnover (x) 5.48 5.06 5.58
Total Assets Turnover (x) 1.50 1.36 1.80
ROI (%) 0.44 41.65 4.11
ROE (%) 0.79 (147.44) (12.85)
Shareholders Innovest Offshore Ventures Ltd.
57.00%
PER = -5.28x ; PBV = 1.46x (June 2007)
The Adm. Maculus Fund L.P. 18.00% Financial Year: December 31
PT Aneka Bumi Prasidha 9.48% Public Accountant: Purwantono, Sarwoko & Sandjaja
PT Aneka Agroprasidha 7.92% Public 7.60%

94 Indonesian Capital Market Directory 2007

Fax (021) 719-3789, 719-3889 Website: www.sieradproduce.com
Factories - Jl. Raya Parung Km. 19 Desa Jabon Meka
Total Assets 1,294,773 1,384,992 1,641,295
Current Assets 650,885 752,241 859,538
r of which Kec. Parung, Bogor, Jawa Barat
Cash and cash equivalents
Trade receivables
9,052
202,598
46,047
244,167
20,064
341,717
Phone (0251) 611-862 Inventories 312,631 292,499 333,017
Non-Current Assets 643,888 632,751 781,757
of which - Jl. Raya Serang Km. 31, Balaraja Fixed Assets-
Net 485,504 479,497 647,320
Deffered Tax
Assets 74,664 58,144 39,942
Phone (021) 595-3888 Investments
Liabilities
n.a
288,737
n.a
351,703
n.a
462,451
Business Fax (021) 595-0150
Animal Feed Current Liabilities
of which
270,544 329,378 425,313
Company Status PMDN Trade payables
Taxes
150,708
9,607
86,974
10,521
117,711
7,518
PT Sierad Produce Tbk. Animal Feed and Husbandry
Head OfÞce Plaza City View Building 1st Floor
Jl. Kemang Timur No. 22
Jakarta 12510
Summary of Financial Statement
(Million Rupiah)
Phone (021) 719-3888 2007 2008 2009
Fax (0251) 611-079
Tangerang-Banten
Financial Performance: The Company booked net income
amounted IDR37.215 billion in 2009, higher than last year in-
come worth IDR27.254 billion.
Brief History: With four subsidiaries operating in the
same line of business, the company has developed into an
integrated chicken enterprise with operations ranging from
commercial chicken farming to fastfood restaurants. The four
subsidiaries are all majority owned by the company. Sierad
Feedmill, which is 99.99% owned by the company, operates a
feedmill in Balaraja, West Java, Dwipa Mina, 99% owned, pro- duces Þsh ßour for raw material in feedmill operations, Sierad
Biotek, in which the company holds a 98% stake, produces vet-
erinary medicines, and Sierad Pangan, 99% owned, operates a
fast food chain. Sierad Pangan in turn owns several subsidiar-
ies operating fast food chains in Indonesia and other countries,
including Wendi Citarasa in Indonesia and Coyden Food Asia
Pte Ltd in Singapore. The Sierad Group supplies chicken to the
Wendy chain, Kentucky Fried Chicken, California Fried Chick-
en, and Arby. In 1997, the company sold 11,859 tons of live
chickens, 4,313 tons of processed chicken, and 361,040 tons
of chicken feed. The Sierad Group also operates a commer-
cial farm in Cikujang, Sukabumi, producing 20 thousand day old
chickens (DOCs) per annum. Marketing and distribution of Si-
erad Group products are handled by Sierad Corporation, also
a member of the group. On February 22, 1998 the warehouse
owned by PT Sierad Feedmill, a subsidiary of the company, was razed by Þre. The burned warehouse had a measurement of
1,500 square meters and was located on a land of 6 hectares in
Balaraja, Tangerang.
Current maturities
of long term debt 84,947 213,424 289,088
Non-urrent Liabilities 18,192 22,325 37,138
Minority Interests in Subsidiaries 225 225 184 Shareholders' Equity 1,005,811 1,033,064 1,178,661
Paid-up capital 3,184,292 3,184,292 3,184,292
Paid-up capital
in excess of par value 237,474 237,474 1
Retained earnings (accumulated loss) ( 2,415,955) ( 2,388,702) ( 2,005,632)
Net Sales 1,632,454 2,331,686 3,242,551
Cost of Goods Sold 1,473,864 2,115,924 3,011,766
Gross Profit 158,590 215,762 230,785
Operating Expenses 109,673 141,309 158,102
Operating Profit 48,917 74,453 72,683
Other Income (Expenses) ( 2,086) ( 30,394) (
11,434) Profit (Loss) before Taxes 46,831 44,059
61,249
Profit (Loss) after Taxes 21,196 27,254 37,215 Per Share Data (Rp)
Earnings (Loss) per Share 2 3 4
Equity per Share 107 110 126
Dividend per Share n.a n.a n.a
Closing Price 67 50 50 Financial Ratios
PER (x) 29.60 17.18 12.58
PBV (x) 0.62 0.45 0.40
Dividend Payout (%) n.a n.a n.a
Dividend Yield (%) n.a n.a n.a Current Ratio (x) 2.41 2.28 2.02
Debt to Equity (x) 0.29 0.34 0.39
Leverage Ratio (x) 0.22 0.25 0.28
Gross Profit Margin (x) 0.10 0.09 0.07
Operating Profit Margin (x) 3.00 3.19 2.24
Net Profit Margin (x) 1.30 1.17 1.15
Inventory Turnover (x) 4.71 7.23 9.04
Total Assets Turnover (x) 1.26 1.68 1.98
ROI (%) 1.64 1.97 2.27
ROE (%) 2.11 2.64 3.16
PER = 13.91x ; PBV = 0.39x (June
2010) Financial Year: December 31
Public Accountant: Aryanto Amir Yusuf & Mawar
(2008); RSM Aryanto, Amir Jusuf, Mawar & Saptoto
(2009)
(million rupiah)
2010
June
2009
June
Total Assets
1,803,099
1,607,715
Current Assets 979,097 849,390
Non-Current Assets 824,002 758,325
Liabilities 609,094 455,039
Shareholders Shareholders' Equity 1,193,806 1,152,629
Jade Field Assets Limited 15.56% Net Sales 1,703,012 1,529,119
Harvest Agents Limited 14.33% Profit after Taxes 15,145 11,182
Kingdom Industrial Limited 11.34% ROI (%) 173.94 180.03
Public 58.77% ROE (%) 279.60 336.04

38
Indonesian Capital Market Directory 2010

Factory
Jl. Raya Parung Km. 19
Desa Jabon Mekar
Total Assets
Current Assets
of which
1,254,009
450,655
1,157,773
393,050
1,113,796
436,225
Kec. Parung, Bogor, Jawa Barat Cash and cash equivalents 12,823 8,082 16,679
Phone (0251) 611-862 Trade receivables 157,542 164,845 169,482
Fax (0251) 611-079 Inventories 178,808 102,913 150,153
Business
Integrated poultry, fast food and Non-Current Assets 803,354 764,723 677,571
Restaurant franchising
Fixed Assets-Net
579,419
548,958
447,080
Company Status PMDN Deffered Tax Assets 136,029 132,890 100,296
Financial Performance: The Company booked net profit of Investments n.a n.a n.a
IDR40.953 billion in 2006 versus net loss of IDR122.479 billion in Liabilities 1,201,777 213,911 128,990
2005. The cost of goods sold dropped from IDR1.396 trillion to IDR938.642 billion.
Current Liabilities
of which
173,121 199,383 115,042
Brief History: With four subsidiaries operating in the same line Trade payables 128,937 121,814 81,250
of business, the company has developed into an integrated chicken Taxes payable 13,736 18,837 8,772
enterprise with operations ranging from commercial chicken farm-
of long term debt
411
609
520
ing to fastfood restaurants. The four subsidiaries are all majority Non-urrent Liabilities 1,028,656 14,528 13,948
owned by the company. Sierad Feedmill, which is 99.99% owned Minority Interests in Subsidiaries 202 236 226
PT Sierad Produce Tbk.
Head Office Plaza City View Building
Jl. Kemang Timur No. 22 Jakarta 12510
Phone (021) 719-3888
Fax (021) 719-3889, 719-3789
Summary of Financial Statement
Food and Beverages
(million rupiah) 2004 2005 2006
Current maturities
by the company, operates a feedmill in Balaraja, West Java, Dwipa
Mina, 99% owned, produces fish flour for raw material in feedmill
operations, Sierad Biotek, in which the company holds a 98% stake,
produces veterinary medicines, and Sierad Pangan, 99% owned,
operates a fast food chain. Sierad Pangan in turn owns several
subsidiaries operating fast food chains in Indonesia and other
countries, including Wendi Citarasa in Indonesia and Coyden Food
Asia Pte Ltd in Singapore. The Sierad Group supplies chicken to
the Wendy chain, Kentucky Fried Chicken, California Fried
Chicken, and Arby. In 1997, the company sold 11,859 tons of live
chickens, 4,313 tons of processed chicken, and 361,040 tons of
chicken feed. The Sierad Group also operates a commercial farm
in Cikujang, Sukabumi, producing 20 thousand day old chickens
(DOCs) per annum. Marketing and distribution of Sierad Group
products are handled by Sierad Corporation, also a member of
the group. On February 22, 1998 the warehouse owned by PT
Sierad Feedmill, a subsidiary of the company, was razed by fire.
The burned warehouse had a measurement of 1,500 square meters
and was located on a land of 6 hectares in Balaraja, Tangerang.
Shareholders
PT Sietek Nusantara Finance 3.14% Public 96.86%
Shareholders' Equity 52,209 943,626 984,580
Paid-up capital 2,317,559 3,184,292 3,184,292
Paid-up capital
in excess of par value 90,130 237,474 237,474
Retained earnings (accumulated loss) ( 2,355,480) ( 2,478,140) ( 2,437,186)
Net Sales 1,353,621 1,425,223 1,111,242
Cost of Goods Sold 1,303,750 1,396,412 938,642
Gross Profit 49,871 28,811 172,600
Operating Expenses 118,930 113,675 104,342
Operating Profit ( 69,058) ( 84,864) 68,258
Other Income (Expenses) ( 117,773) ( 33,756) 1,673
Profit (Loss) before Taxes ( 186,831) ( 118,620) 69,931
Profit (Loss) after Taxes ( 154,346) ( 122,480) 40,954 Per Share Data (Rp)
Earnings (Loss) per Share (21) (13) 4
Equity per Share 7 101 105
Dividend per Share n.a n.a n.a
Closing Price 105 90 50 Financial Ratios
PER (x) ( 4.93) ( 6.88) 11.43
PBV (x) 14.57 0.89 0.48
Dividend Payout (%) n.a n.a n.a
Dividend Yield (%) n.a n.a n.a
Current Ratio (x) 2.60 1.97 3.79
Debt to Equity (x) 23.02 0.23 0.13
Leverage Ratio (x) 0.96 0.18 0.12
Gross Profit Margin (x) 0.04 0.02 0.16
Operating Profit Margin (x) n.a n.a 6.14
Net Profit Margin (x) n.a n.a 3.69
Inventory Turnover (x) 7.29 13.57 6.25
Total Assets Turnover (x) 1.08 1.23 1.00
ROI (%) ( 12.31) ( 10.58) 3.68
ROE (%) ( 295.63) ( 12.98) 4.16
PER = 27.50x ; PBV = 0.78x (June
2007) Financial Year: December 31
Public Accountant: Aryanto Amir Yusuf & Mawar
100 Indonesian Capital Market Directory 2007

Net Sales 167,172 137,765
Profit after Taxes 5,285 9,476
PT Sekar Laut Tbk.
Food and Beverages
Head OfÞce Jl. Raya Darmo No. 23-25 Surabaya 60265, East Java Phone (031) 567-1371, 567-6538, 567-7872
Summary of Financial Statement
(Million Rupiah)
Fax (031) 567-2318, 567-6240 Website: www.sekar.co.id
Factory Jl. Jenggolo II/17, Sidoarjo 61219, East Java Phone (031) 892-1605, 892-1036 Fax (031) 894-1244 E-mail: [email protected]
Representative OfÞce Wisma Nugraha Santana 9th Floor (916) Jl. Jenderal Sudirman Kav. 7-8, Jakarta Phone (021) 570-4988, Fax (021) 570-4989
Business Confectionery Company Status PMDN
Financial Performance: The Company booked net income at
2007 2008 2009 Total Assets 182,697 201,003 196,186
Current Assets 81,985 100,654 87,916
of which
Cash and cash equivalents 7,095 12,852 10,025
Trade receivables 43,253 35,615 37,888
Inventories 28,283 43,549 45,384
Non-Current Assets 100,712 100,349 108,270
of which
Fixed Assets-Net 90,511 91,598 99,534
Deffered Tax Assets 6,446 3,350 3,825
Other Assets 3,755 n.a n.a Liabilities 86,300 100,335 82,715
Current Liabilities 53,552 59,029 46,512
of which
IDR12.802 billion in 2009, increased from IDR4.271 billion in 2008. Bank loans
Trade payables
3,095
34,738
3,769
37,888
12,931
24,286
The company has gained on exchange rate at IDR3.615 billion, while Taxes payable 5,205 4,068 931
last year booked loss at IDR4.545 billion.
Brief History: The history of PT. Sekar Laut, Tbk. began
from a marine products trading in the city of Sidoarjo, East Java in
1966. The business then developed to a traditional shrimp crack-
er production. With hard work and perseverance, the business
grew rapidly from a home industry to a well established company.
PT. Sekar Laut, Tbk. established in July 19, 1976 in the form of Limited
Liability Company and then legally enlisted as legal corporate body in
the justice department on March 1, 1978.
Diverse plants and animal live in the gracious, prosper-
ous land, which is also rich in cultures. The fertile Indonesian land
provides the best vegetables and fruits. The Indonesian sea is also known for its variously rich Þsheries and other sea product.
PT. Sekar Laut, Tbk. respect the natural treasure of Indonesia by pro-
cessing it as wise as can be to provide quality food products and to
care for natural resources for raw material continuity. All of the foods
that we produce are 100% made from natural ingredients and pro-
cessed hygienically hence become a delicious food, safely consumed,
healthy and able to be enjoyed by people in Indonesia and around the
world.
“Krupuk” is a well-known Indonesia specialty food. Shrimp
krupuk or shrimp crackers is by far its most popular kind that origi-
nated from Sidoarjo, home and activity centre of PT. Sekar Laut, Tbk.
Today, krupuk has transformed into a healthy and nutritious snack that
is widely-known worldwide. Thanks to the persistent entrepreneurial
effort, innovation and continuous quality control that has been done by
the company throughout the years. Beside krupuk, PT. Sekar Laut, Tbk.
has also develop other food productions such as tomato sauce, chili sauce, instant cooking spices, seasoned ßour and others. To face the
challenge of new millennium, the management team has decided to enter
the snack market with new product variation; which is the fried product.
Company product line :
* PT. Sekar Laut, Tbk. “FINNA”: Crackers, Chips, Seasoning ßour, Tomato sauce, Chili sauce, Instant cooking spices.
* “BUMIFOOD” : Meatball, Dumpling, Spring roll, Breaded/
Nugget, Puff/Dumpling, Shoestring, Frozen meat. Cashew
nut, Chips.
Non-Current Liabilities 32,748 41,306 36,203
Minority Interests in Subsidiaries 3 3 3 Shareholders' Equity 96,394 100,665 113,468
Paid-up capital 69,074 69,074 69,074
Paid-up capital
in excess of par value 21,579 21,579 21,579
Retained earnings (accumulated loss) 5,742 10,013 22,815 Net Sales 237,050 313,125 276,312
Cost of Goods Sold 195,974 256,226 223,898
Gross Profit 41,076 56,900 52,414
Operating Expenses 42,209 49,809 50,706
Operating Profit (1,133) 7,091 1,707
Other Income (Expenses) 3,199 277 10,703
Profit (Loss) before Taxes 2,066 7,367 12,411
Profit (Loss) after Taxes 5,742 4,271 12,803 Per Share Data (Rp)
Earnings (Loss) per Share 8 6 19
Equity per Share 140 146 164
Dividend per Share n.a n.a n.a
Closing Price 75 90 150 Financial Ratios
PER (x) 9.02 14.56 8.09
PBV (x) 0.54 0.62 0.91
Dividend Payout (%) n.a n.a n.a
Dividend Yield (%) n.a n.a n.a Current Ratio (x) 1.53 1.71 1.89
Debt to Equity (x) 0.90 1.00 0.73
Leverage Ratio (x) 0.47 0.50 0.42
Gross Profit Margin (x) 0.17 0.18 0.19
Operating Profit Margin (x) (0.00) 0.02 0.01
Net Profit Margin (x) 0.02 0.01 0.05
Inventory Turnover (x) 6.93 5.88 4.93
Total Assets Turnover (x) 1.30 1.56 1.41
ROI (%) 3.14 2.12 6.53
ROE (%) (5.96) (4.24) (11.28)
PER = 7.68x ; PBV = 0.76x (June 2010)
Financial Year: December 31
Public Accountant: Paul Hadinata, Hidajat, Arsono & Co.
(million rupiah)
2010 2009
June June
Total Assets 192,671 204,239
Current Assets 88,258 99,211
Non-Current Assets 104,413 105,028
Liabilities 73,914 94,059
Shareholders' Equity 118,753 110,141
Shareholders
Omnistar Inv. H. Ltd. 26.78% PT Alamiah Sari 26.16% Malvina Inv. Ltd. 17.22% ROI (%) 2.74 4.64
Shadforth A. Ltd. 13.39% ROE (%) 4.45 8.60
Bank Negara Indonesia (Persero) Tbk 12.54% Public 3.91% In June
132
Indonesian Capital Market Directory 2010

Phone (021) 570-4988, Liabilities 490,502 76,805 71,225
Business
Fax (021) 570-4989
Confectionery Current Liabilities
of which
215,428 41,205 36,920
Company Status PMDN Bank loans 31,364 n.a. n.a.
PT Sekar Laut Tbk.
Head Office Jl. Raya Darmo 23-25
Surabaya 60265, East Java Phone (031) 567-1371,
Summary of Financial Statement
Food and Beverages
(million rupiah)
567-6538, 567-7872 2004 2005 2006
Total Assets 112,336 94,436 94,770
Current Assets 53,743 58,401 64,303
Fax (031) 567-2318, 567-6240
Website: www.sekar.co.id
Factory Jl. Jenggolo II/17
Sidoarjo 61219, East Java
Cash and cash equivalents
6,444
6,064
6,764
Phone (031) 892-1605, 892-1036 Trade receivables 26,830 28,060 27,998
Fax (031) 894-1244 Inventories 16,465 19,163 24,916
E-mail: [email protected] Non-Current Assets 58,593 36,035 30,467
Representative Office Wisma Nugraha Santana 9th Floor of which (916) Fixed Assets-Net 34,810 28,580 25,853
Jl. Jenderal Sudirman Kav. 7-8 Deffered Tax Assets 5,975 5,446 3,189
Jakarta Other Assets 2,408 2,009 1,425
Financial Performance: The Company booked net profit of
IDR4.637 billion in 2006, falling by 94.93% from IDR91.549 billion
in 2005. The net profit was down because of significant decrease
in the total revenue from IDR100.043 billion to IDR2.338 billion.
Brief History: The main raw materials for the company’s pro-
duction are shrimp and tapioca which are supplied by a number
of shrimp farming areas in Indonesia, including East, Central and
West Java, South Sulawesi and Kalimantan, while tapioca flour is
purchased from farmers in the vicinity of the factory. The com-
pany has an installed capacity of 7.5 tons per year and markets a
range of krupuk products under the Finna brand name: shrimp
flavored emping crackers made from melinjo nuts, cassava chips
and corn chips. Domestic marketing is performed by wholly-
owned distributor, PT Pangan Lestari. On September 1996 the
company has received a US$ 30 million syndicated loan from a
number of foreign and joint venture banks. The loan will take 2
form. A loan of US$ 27.5 million for increasing working capital
will carry interest rates at 1.75% above SIBOR with a term of 4.5
year and an option for 3 year. The remainder of the loan is for
factory construction and will carry interest rates at 2% above SIBOR
with term of 5 year and grace period of 1 year. The lead arrangers
in this syndication are Dai-Ichi Kangyo Bank and Fuji Bank Inter-
national. The company is a member of the Sekar Group.
Shareholders
Omnistar Inv. H. Ltd. 26.78%
PT Alamiah Sari 26.16%
Malvina Inv. Ltd. 17.22%
Shadforth A. Ltd. 13.39%
Bank Negara Indonesia (Persero) Tbk 12.54%
Harry Susilo 0.58%
Harry Sunogo 0.06%
Loddy Gunadi 0.06%
Harry Lukmito 0.04%
Harry Fong Jaya 0.04%
Public 3.13%
Trade payables 20,740 23,773 24,707
Taxes payable 2,955 5,401 4,261
Non-Current Liabilities 275,074 35,601 34,306
Minority Interests in Subsidiaries 355 359 185 Shareholders' Equity (378,521) 17,272 23,544
Paid-up capital 37,800 345,370 345,370
Paid-up capital
in excess of par value 3,000 3,000 3,000
Retained earnings (accumulated loss) (419,321) (331,098) (324,826) Net Sales 137,754 167,282 193,928
Cost of Goods Sold 113,735 137,473 154,849
Gross Profit 24,019 29,809 39,079
Operating Expenses 31,556 37,937 36,671
Operating Profit (7,537) (8,128) 2,409
Other Income (Expenses) (36,395) 100,043 2,338
Profit (Loss) before Taxes (43,931) 91,915 4,747
Profit (Loss) after Taxes (42,607) 91,549 4,637 Per Share Data (Rp)
Earnings (Loss) per Share (564) 133 7
Equity per Share (5,007) 25 34
Dividend per Share n.a n.a n.a
Closing Price 450 400 285 Financial Ratios
PER (x) (0.80) 3.02 42.45
PBV (x) (0.09) 16.00 8.36
Dividend Payout (%) n.a n.a n.a
Dividend Yield (%) n.a n.a n.a Current Ratio (x) 0.25 1.42 1.74
Debt to Equity (x) n.a 4.45 3.03
Leverage Ratio (x) 4.37 0.81 0.75
Gross Profit Margin (x) 0.17 0.18 0.20
Operating Profit Margin (x) n.a n.a 0.01
Net Profit Margin (x) (0.31) 0.55 0.02
Inventory Turnover (x) 6.91 7.17 6.21
Total Assets Turnover (x) 1.23 1.77 2.05
ROI (%) (37.93) 96.94 4.89
ROE (%) (11.26) (530.05) (19.70)
PER = 18.30x ; PBV = 2.93x (June 2007)
Financial Year: December 31
Public Accountant: Santoso & Co.
96 Indonesian Capital Market Directory 2007

Total Assets 8,063,169 10,025,916 10,210,595
Current Assets
of which
3,766,818 4,709,462 4,351,305
Current Assets 4,709,375 5,095,705
Non-Current Assets 5,975,785 5,474,996
abilities 5,370,221 5,767,486
hareholders' Equity 5,311,299 4,799,190
et Sales 8,316,910 6,897,659
ofit after Taxes 523,711 208,887
PT Sinar Mas Agro Resources And Technology (SMART) Tbk. Food and Beverages
Head OfÞce Plaza BII Menara II 30th Floor
Jl. MH. Thamrin Kav. 22 No. 51
Jakarta 10350
Summary of Financial Statement
(Million Rupiah)
Phone (021) 318-1388 (Hunting) Fax (021) 318-1389
E-mail: [email protected]
http://www.smart-tbk.com
Factory Jl. Rungkut Industri No. 20
Surabaya, Jawa Timur
Phone (031) 843-9861
Fax (031) 843-8476
Telex 33139, 33119 MURO IA
Business Cook Oil and Margarine
Company Status PMDN
Financial Performance: Net income tumbled down to IDR
748 billion in 2009 from IDR1.046 trillion booked in 2008. Net
revenue down to IDR14.201 trillion from IDR16.101 trillion.
Brief History: PT Smart Tbk is one of the largest, pub-
licly-listed, integrated palm-based consumer companies in
Indonesia. SMART primary activities are cultivating and har-
vesting of palm trees, processing of fresh fruit bunches into crude palm oil and palm kernel oil, and reÞning CPO into value-
added products such as cooking oil, margarine and shortening.
Founded by Sinar Mas Group in 1962, SMART cur-
rently has palm plantation with total coverage area
of about 110,000 hectares. SMART also operates 12 CPO mills, 2 kernel crushing plants and 2 reÞneries.
Besides bulk and industrial oil, SMART’s reÞned prod-
ucts also marketed under several brands such as Filma and
Kunci Mas. Today, those brands have been recognized for their high quality, presently command signiÞcant mar-
ket share and their respective segmentation in Indonesia.
SMART is a subsidiary of Golden Agri-Resources Limited
(GAR), one of the largest oil palm-based private company in the world which is listed in Singapore. This relationship beneÞts
SMART with its economic of scale in research and develop-
ment, sourcing of raw material, and access to a wide domestic
and international marketing network.
2007 2008 2009
Cash and cash equivalents 329,623 480,277 497,577
Trade receivables 909,693 820,389 1,065,315
Inventories 1,460,037 1,340,574 2,139,125
Non-Current Assets 4,296,351 5,316,454 5,859,290
of which
Fixed Assets-Net 2,005,716 2,862,571 3,389,877
Deffered Tax Assets-Net 1,317 215 1,340
Investments 155,196 19,614 20,426
Other Assets 702,060 900,776 746,134 Liabilities 4,534,913 5,406,234 5,410,943
Current Liabilities 2,189,600 2,734,320 2,754,439
of which
Short-term debt 1,040,502 1,703,090 976,800
Trade payables 696,229 510,466 1,172,646
Current maturities of
long-term debt 43,382 51,698 214,171
Non-Current Liabilities 2,345,313 2,671,915 2,656,503
Minority Interests in Subsidiaries 10 4,477 3,774 Shareholders' Equity 3,528,246 4,615,204 4,795,878
Paid-up capital 574,439 574,439 574,439
Paid-up capital
in excess of par value 1,662,472 1,662,472 1,662,472
Retained earnings (accumulated loss) 1,291,335 2,378,293 2,558,967 Net Sales 8,079,714 16,101,565 14,201,230
Cost of Good Sold 5,854,466 12,338,649 12,484,606
Gross Profit 2,225,248 3,762,916 1,716,625
Operating Expenses 562,006 1,622,405 606,419
Operating Profit 1,663,242 2,140,511 1,110,206
Other Income (Expenses) (150,918) (661,583) (117,484)
Profit (Loss) before Taxes 1,512,324 1,478,928 992,722
Profit (Loss) after Taxes 988,944 1,046,389 748,495 Per Share Data (Rp)
Earnings (Loss) per Share 344 364 261
Equity per Share 1,228 1,607 1,670
Dividend per Share 5 180 75
Closing Price 6,000 1,700 2,550 Financial Ratios
PER (x) 17.43 4.67 9.79
PBV (x) 4.88 1.06 1.53
Dividend Payout (%) 0.01 0.49 0.29
Dividend Yield (%) 0.00 0.11 0.03 Current Ratio (x) 1.72 1.72 1.58
Debt to Equity (x) 1.29 1.17 1.13
Leverage Ratio (x) 0.56 0.54 0.53
Gross Profit Margin (x) 0.28 0.23 0.12
Operating Profit Margin (x) 0.21 0.13 0.08
Net Profit Margin (x) 0.12 0.06 0.05
Inventory Turnover (x) 4.01 9.20 5.84
Total Assets Turnover (x) 1.00 1.61 1.39
ROI (%) 12.26 10.44 7.33
ROE (%) 28.03 22.67 15.61
PER = 11.20x ; PBV = 1.89x (June 2010)
Financial Year: December 31
Public Accountant: Mulyamin Sensi Suryanto
(million rupiah)
2010 2009
June June
Total Assets 10,685,159 10,570,701
Shareholders
PT Purimas Sasmita 95.21%
Public 4.79%
Li
S
N
Pr
ROI (%) 4.90 1.98
ROE (%) 9.86 4.35
136 Indonesian Capital Market Directory 2010

PT SMART Tbk.
Head Office Plaza BII Menara II 30th Floor
Jl. MH. Thamrin Kav. 22 No. 51 Jakarta 10350
Phone (021) 318-1388 (Hunting),
392-5777
Summary of Financial Statement
Food and Beverages
(million rupiah)
2004 2005 2006
Fax (021) 318-1389, 392-5778-81
E-mail: [email protected]
http://www.smart-tbk.com
Factory Jl. Rungkut Industri Raya No. 19
Surabaya
Phone (031) 843-9861 Fax (031) 843-8476
Telex 33139, 33119 MURO IA
Business Cook Oil and Margarine, Estates
Company Status PMDN
Financial Performance: The Company booked net profit of
IDR628.01 billion in 2006, jumping sharply by 106.45% from
IDR304.20 billion in 2005. The operating profit increased 45.21%
at IDR424.97 billion from IDR617.08 billion.
Brief History: The company began its business under the name
of PT Maskapai Perkebunan Sumcama Padang Halaban in 1962.
In 1970, the company was returned to the foreign party and con-
verted its status to PMA. Further in 1985, the status of the com-
pany was converted to PMDN. The company then in 1991 changed
its name to PT Sinar Mas Agro Resources and Technology Corpo-
ration or abbreviated PT SMART Corporation. In 1989, the com-
pany acquired 100% shares of 2 oil palm plantations; PT Maskapai
Perkebunan Leidong West Indonesia and PT Perusahaan
Perkebunan Panigoran. The company then also acquired 100%
shares of PT Maskapai Perkebunan Indorub Sumber Daung, a
1,502 ha tea plantation which located in West Java. In 1991, the
company took over 100% shares of PT Nirmala Agung, 19% shares
of PT Global Agronusa Indonesia, merged with PT Mulyorejo In-
dustrial company, and acquired 25% stake in PT Grahamas
Indojaya, a transportation company. Prior to the public offering
in 1992, the company took over 100% shares of PT Kunci Mas
Wijaya, 49% shares of PT Inti Gerakmaju, and 49% shares of PT
Tapian Nadenggan. The company then acquired 50% shares of PT
Sinar Meadow International Indonesia, and 50% PT Sinar Pure
Foods International. The company signed a joint venture agree-
ment with Goodman Fielder Overseas Holding Pte. Ltd., through
its sub-holding company, PT Smartindo Utama, in early 1995. In
June 1997, SMART acquired 100% shares of 2 new undeveloped
land banks in East Kalimantan, PT Sangatta Andalan Utama and
PT Matrasawit Sarana Sejahtera. The company also engaged in a
joint venture with Super Air from New Zealand in area manur-
ing. In December 1997, the company divested its shares in PT
Intersmart Corporation, a soft drink company. Early in 2002, the
company sold two of its subsidiaries, PT Maskapai Perkebunan
Indorub Sumber Wadung and PT Perkebunan dan Perindustrian
Nirwala Agung to PT Sariwangi Agricultural Agency for US$ 87
million.
Shareholders
PT Purimas Sasmita 72.19% Public 27.81%
Total Assets 3,972,684 4,597,227 5,311,931
Current Assets 1,051,368 1,490,234 1,657,616
of which
Cash and cash equivalents 221,232 383,354 323,764
Trade receivables 195,361 270,217 285,894
Inventories 506,080 636,461 710,275
Non-Current Assets 2,921,316 3,106,993 3,654,315
of which
Fixed Assets-Net 1,098,796 1,335,673 1,642,346
Deffered Tax Assets-Net 16,836 20,670 46,851
Investments 413,136 447,900 339,444
Other Assets 359,820 180,586 428,518 Liabilities 4,321,273 2,668,647 2,734,706
Current Liabilities 725,434 1,030,549 1,089,633
of which
Short-term debt n.a 253,614 232,716
Trade payables 383,205 431,867 439,814
Current maturities of
long-term debt 96,484 172,486 267,650
Non-Current Liabilities 3,595,839 1,638,098 1,645,073
Minority Interests in Subsidiaries 10 10 10 Shareholders' Equity (348,598) 1,928,570 2,577,215
Paid-up capital 297,360 574,439 574,439
Paid-up capital
in excess of par value n.a 1,662,472 1,662,472
Retained earnings (accumulated loss) (645,958) (308,341) 340,304 Net Sales 4,274,569 4,656,674 4,708,250
Cost of Good Sold 3,658,560 3,934,353 3,853,588
Gross Profit 616,009 722,321 854,662
Operating Expenses 332,614 297,351 237,578
Operating Profit 283,395 424,970 617,084
Other Income (Expenses) (348,221) (187,283) 13,674
Profit (Loss) before Taxes (64,826) 237,687 630,758
Profit (Loss) after Taxes (107,960) 304,203 628,005 Per Share Data (Rp)
Earnings (Loss) per Share (73) 106 219
Equity per Share (234) 671 897
Dividend per Share n.a n.a 46
Closing Price 3,100 950 3,650 Financial Ratios
PER (x) (42.69) 8.97 16.69
PBV (x) (13.22) 1.41 4.07
Dividend Payout (%) n.a n.a 0.21
Dividend Yield (%) n.a n.a 0.01 Current Ratio (x) 1.45 1.45 1.52
Debt to Equity (x) n.a 1.38 1.06
Leverage Ratio (x) 1.09 0.58 0.51
Gross Profit Margin (x) 0.14 0.16 0.18
Operating Profit Margin (x) 0.07 0.09 0.13
Net Profit Margin (x) n.a 0.07 0.13
Inventory Turnover (x) 7.23 6.18 5.43
Total Assets Turnover (x) 1.08 1.01 0.89
ROI (%) (2.72) 6.62 11.82
ROE (%) (30.97) (15.77) (24.37)
PER = 9.29x ; PBV = 3.11x (June 2007)
Financial Year: December 31
Public Accountant: Dedy Muliadi & Co. (2005); Mulyamin Sensi Suryanto (2006)
102 Indonesian Capital Market Directory 2007

Fixed Assets-Net 302,176 325,177 325,884
Taxes receivables n.a 4,399 4,399
PT Siantar Top Tbk. Food and Beverages
Head OfÞce Jl. Tambak Sawah No. 21-23
Waru, Sidoarjo 61256, Surabaya, Jawa Timur
Phone (031) 866-7382
Summary of Financial Statement
(Million Rupiah)
Fax (031) 866-7380
E-mail: [email protected]
Factory Jl. Tambak Sawah No. 21-23
Waru, Sidoarjo 61256, Surabaya, Jawa Timur
2007 2008 2009 Total Assets 517,448 626,750 548,720
Current Assets 204,499 271,633 185,735
of which
Phone (031) 866-7382 (5lines hunting)
Fax (031) 866-7380
Cash and cash equivalents 7,296 5,138 7,678
Trade receivables 57,928 69,304 61,406
Inventories 111,510 177,039 112,157
Business
E-mail: [email protected] Snack noodle, crackers and candy
Non-Current Assets
of which
312,949 355,117 362,986
Company Status PMDN
Financial Performance: The Company booked net income
at IDR41.072 billion in 2009, stood from IDR4.816 billion in
2008.
Brief History: In 1972, Shindo Sumidomo started his op-
in Sidoarjo. At the present time, the Company grows to be-
come PT Siantar Top, Tbk, one of the leading and national scale
food and beverage industries in Indonesia. First site location
was built in 1987. The Company has continuously evolved and
listed its shares in Jakarta Stock Exchange (now Indonesia Stock
Exchange) in 1996. To fulÞll high demand of local market, PT Siantar Top,
Tbk has expanded its site location in Medan in 1997, Bekasi in
2002. Besides developing domestic market, the company is also
burgeneoning its international markets to Asia, Middle East, Eu-
rope and USA.
PT Siantar Top, Tbk has developed food and beverages at the best quality by focusing on the Þnest taste. High commit-
ment and dedication are delivered for consumers by presenting
healthy food products including biscuit and wafers in 2008.
Liabilities 158,828 263,313 144,211
Current Liabilities 115,605 221,491 110,001
of which
Bank loans 45,259 114,031 32,574
Trade payables 63,820 58,733 41,138
Taxes payable 3,055 4,243 2,443
Shareholders' Equity 358,620 363,437 404,509
Paid-up capital 131,000 131,000 131,000
Paid-up capital
in excess of par value 300 300 300
Retained earnings 227,320 232,137 273,209 Net Sales 600,330 624,401 627,115
Cost of Goods Sold 516,168 533,772 525,050
Gross Profit 84,163 90,629 102,065
Operating Expenses 57,015 61,459 62,359
Operating Profit 27,147 29,169 39,706
Other Income (Expenses) (3,890) (25,492) 130
Profit before Taxes 23,257 3,678 39,836
Profit after Taxes 15,595 4,816 41,072 Per Share Data (Rp)
Earnings per Share 12 4 31
Equity per Share 274 277 309
Dividend per Share n.a n.a n.a
Closing Price 370 150 250 Financial Ratios
PER (x) 31.08 40.80 7.97
PBV (x) 1.35 0.54 0.81
Dividend Payout (%) n.a n.a n.a
Dividend Yield (%) n.a n.a n.a Current Ratio (x) 1.77 1.23 1.69
Debt to Equity (x) 0.44 0.72 0.36
Leverage Ratio (x) 0.31 0.42 0.26
Gross Profit Margin (x) 0.14 0.15 0.16
Operating Profit Margin (x) 0.05 0.05 0.06
Net Profit Margin (x) 0.03 0.01 0.07
Inventory Turnover (x) 4.63 3.01 4.68
Total Assets Turnover (x) 1.16 1.00 1.14
ROI (%) 3.01 0.77 7.49
ROE (%) 4.35 1.33 10.15
PER = 12.48x ; PBV = 0.84x (June 2010)
Financial Year: December 31
Public Accountant: Adi, Jimmy & Arthawan (2008); RSM AAJ Associates (2009)
(million rupiah)
2010 2009
June June
Shareholders
PT Shindo Tiara Tunggal 56.76%
Kasim Gunawan 4.30%
Shindo Sumidomo 3.10%
Public 35.84%
Total Assets 585,118 550,341
Current Assets 235,874 199,893
Non-Current Assets 349,244 350,448
Liabilities 173,332 173,265
Shareholders' Equity 411,786 377,076
Net Sales 312,690 301,785
Profit after Taxes 7,277 13,639
ROI (%) 1.24 2.48
ROE (%) 1.77 3.62

134 Indonesian Capital Market Directory 2010

PT Siantar Top Tbk. Food and Beverages
Head Office Jl. Tambak Sawah No. 21-23
Waru, Sidoarjo 61256, Surabaya,
Jawa Timur
Phone (031) 866-7382 Fax (031) 866-7380
Summary of Financial Statement
(million
rupiah) 2004 2005
2006
E-mail: [email protected]
Factory Jl. Tambak Sawah No. 21-23
Waru, Sidoarjo 61256, Surabaya,
Jawa Timur
Phone (031) 866-7382
(5lines hunting)
Fax (031) 866-7380 E-mail: [email protected]
Business Snack
Company Status PMDN
Financial Performance: The Company recorded net profit at
IDR14.426 billions in 2006, or increase by 35.6% from last year.
The Company booked gain in foreign exchange at IDR3.793 bil-
lions, while last year booked net loss at IDR3.835 billions.
Brief History: The company products are sold under the Fuji
Mie, Mie Goreng, Boyki, and Mie Goreng Ayam Panggang brand
names, while crackers can be found on the market under the names
of Potato Tube BBQ, UFO Snack, PTB Yakitori, Twistko, Ikan, Wilco
and Sayur. Candies are sold under the Es Teller, Balico, Kelapa,
Asam Manis, Es Kopyor, and Kopi names. Raw materials, com-
prising mainly flour, sugar, and cooking oil, are sourced domesti-
cally, with some seasonings and flavoring supplied by PT Saribumi
Alam Indonesia, an affiliated company. At June 1996, installed
capacity was 3,750 tons of noodles, 1,550 tons of crackers, and 1,350
tons of candies per year. Most of the production is sold on the
domestic market, though some has also been exported since 1991.
Domestic marketing takes place through PT Semestanustra
Distrindo (an affiliate), PT Panamas, PT Wicaksana Overseas, PT
Alfa Retailindo, PT Enseval Trading, and the company’s repre-
sentative offices in Bandung, Semarang, and Surabaya. Overseas
market is also conducted by trading houses in Hong Kong,
Singapore, and Saudi Arabia. In mid-1996, exports represented
only 2.7% of total sales.
Shareholders
PT Shindo Tiara Tunggal 60.39%
Shindo Sumidomo 6.51%
PT Kim Eng Securities 5.71%
Public 27.39%
Total Assets 470,177 477,443 467,491
Current Assets 218,834 230,897 221,725
of which
Cash and cash equivalents 18,537 14,762 4,251
Trade receivables 96,179 82,546 81,726
Inventories 94,850 95,589 97,006
Non-Current Assets 251,343 246,546 245,766
of which
Fixed Assets-Net 250,677 240,075 239,295
Taxes receivables n.a 6,471 6,471 Liabilities 152,214 148,844 124,466
Current Liabilities 110,296 107,295 82,350
of which
Bank loans 20,000 22,075 n.a
Trade payables 77,988 72,896 67,321
Taxes payable 5,838 6,649 9,450
Non-Current Liabilities 41,918 41,549 42,116 Shareholders' Equity 317,963 328,599 343,025
Paid-up capital 131,000 131,000 131,000
Paid-up capital
in excess of par value 300 300 300
Retained earnings 186,663 197,299 211,725 Net Sales 712,558 641,698 555,208
Cost of Goods Sold 591,216 553,528 468,373
Gross Profit 121,342 88,170 86,835
Operating Expenses 73,471 67,343 72,040
Operating Profit 47,872 20,827 14,795
Other Income (Expenses) (6,991) (5,763) 6,214
Profit before Taxes 40,880 15,064 21,009
Profit after Taxes 28,599 10,637 14,426 Per Share Data (Rp)
Earnings per Share 22 8 11
Equity per Share 243 251 262
Dividend per Share n.a n.a n.a
Closing Price 180 150 210 Financial Ratios
PER (x) 8.24 18.47 19.07
PBV (x) 0.74 0.60 0.80
Dividend Payout (%) n.a n.a n.a
Dividend Yield (%) n.a n.a n.a Current Ratio (x) 1.98 2.15 2.69
Debt to Equity (x) 0.48 0.45 0.36
Leverage Ratio (x) 0.32 0.31 0.27
Gross Profit Margin (x) 0.17 0.14 0.16
Operating Profit Margin (x) 0.07 0.03 0.03
Net Profit Margin (x) 0.04 0.02 0.03
Inventory Turnover (x) 6.23 5.79 4.83
Total Assets Turnover (x) 1.52 1.34 1.19
ROI (%) 6.08 2.23 3.09
ROE (%) 8.99 3.24 4.21
PER = 34.80x ; PBV = 1.59x (June
2007) Financial Year: December 31
Public Accountant: Adi, Jimmy & Arthawan
98 Indonesian Capital Market Directory 2007

Bank loans 93,933 180,762 387,042 Company Status PMDN Trade payables 85,534 105,835 120,676
Accrued expenses 12,959 13,627 14,657
Financial Performance: In 2009, the Company booked net Current maturities of income amounted IDR138 billion, soaring from IDR63 billion
long-term debt Non-Current Liabilities
308,497 976,208
698,482 894,126
319,412 908,006
recorded last year. Minority Interests in Subsidiaries 3,941 4,797 5,054
Brief History: Established in 1973, PT Tunas Baru Lam- Shareholders' Equity 934,960 888,773 993,648
Paid-up capital 520,397 521,258 521,258
Paid-up capital was founded in 1947 and is a pioneer in Indonesia’s agricul- in excess of par value 173,453 156,947 156,701
PT Tunas Baru Lampung Tbk. Food and Beverages
Head OfÞce Wisma Budi 8th-9th Floor
Jl. HR. Rasuna Said Kav. C-6
Jakarta 12940
Summary of Financial Statement
(Million Rupiah)
Phone (021) 521-3383 (Hunting) Fax (021) 521-3392, 521-3332, 520-5829
Email: [email protected]
Homepage: http://www.tunasbarulampung.com
Factory Jl. Yos Sudarso No. 29
Waylunik Panjang
Bandar Lampung Branch OfÞce Jl. Ikan Kakap No. 9
Bandar Lampung
Phone (0721) 486-122,
Fax (0721) 486-754, 482-683
Business Fully Integrated of Vegetables Cooking Oil
And Other Vegetables Oil Derivatives
2007 2008 2009 Total Assets 2,457,120 2,802,497 2,786,340
Current Assets 981,997 1,119,783 985,163
of which
Cash and cash equivalents 220,400 357,902 127,332
Trade receivables 172,597 187,404 167,645
Inventories 436,850 258,873 247,071
Non-Current Assets 1,475,123 1,682,714 1,801,177
of which
Fixed Assets-Net 834,620 955,460 1,020,909
Deffered Tax Assets 1,848 2,954 3,444
Investments 49,585 34,988 34,988
Other Assets 7,066 12,357 12,357 Liabilities 1,518,219 1,908,928 1,787,639
Current Liabilities 542,011 1,014,802 879,633
of which
pung is a member company of Sungai Budi Group which
tural industry. Such involvement stems from a desire to as-
sist in the country’s development and to capitalism on In-
donesia’s competitive advantage in agriculture. Today, the
Sungai Budi Group is one of Indonesia’s largest manufactur-
ers and distributors of agricultural based consumer products.
Another member company of the Sungai Budi Group is the
publicly listed PT Budi Acid Jaya Tbk., the largest and most
fully integrated tapioca starch manufacturer in Indonesia.
Since PT Tunas Baru Lampung began its operations in Lam-
pung in the early 1970s, we have grown to become one of
the largest and lowest cost vegetable cooking oil producers.
PT Tunas Baru Lampung was publicly listed in Jakarta Stock
Exchange in 14 Feb 2000.
Retained earnings 241,109 210,567 315,688 Net Sales 1,844,207 3,955,846 2,783,573
Cost of Good Sold 1,401,540 3,143,164 2,336,336
Gross Profit 442,667 812,682 447,237
Operating Expenses 190,209 444,525 165,769
Operating Profit 252,458 368,157 281,468
Other Income (Expenses) (113,810) (301,111) (73,120)
Profit (Loss) before Taxes 138,648 67,046 208,347
Profit (Loss) after Taxes 97,227 63,337 138,245 Per Share Data (Rp)
Earnings (Loss) per Share 23 15 33
Equity per Share 225 213 238
Dividend per Share n.a n.a 2
Closing Price 630 190 340 Financial Ratios
PER (x) 26.98 12.51 10.26
PBV (x) 2.81 0.89 1.43
Dividend Payout (%) n.a n.a 5.88
Dividend Yield (%) n.a n.a 0.57 Current Ratio (x) 1.81 1.10 1.12
Debt to Equity (x) 1.62 2.15 1.80
Leverage Ratio (x) 0.62 0.68 0.64
Operating Profit Margin (x) 0.14 0.09 0.10
Net Profit Margin (x) 0.05 0.02 0.05
Inventory Turnover (x) 0.44 1.72 0.67
Total Assets Turnover (x) 0.75 1.41 1.00
ROI (%) 3.96 2.26 4.96
ROE (%) 10.40 7.13 13.91
PER = 9.65x ; PBV = 1.38x (June 2010)
Financial Year: December 31
Public Accountant: Mulyamin Sensi Suryanto
(million rupiah)
2010 2009
June June
Total Assets 2,939,931 2,773,885
Shareholders Current Assets 1,075,540 1,045,956
Non-Current Assets 1,864,391 1,727,929
PT Budi Delta Swakarya 28.18% Liabilities 1,846,163 1,770,502
PT Sungai Budi 26.06% Shareholders' Equity 1,087,740 997,600
PT Budi Acid Jaya Tbk 0.67% Net Sales 1,208,855 1,431,524
Widarto 0.05% Profit after Taxes 86,482 109,480
Santoso Winata 0.05%
Public 44.99%
ROI (%) 2.94 3.95
ROE (%) 7.95 10.97
140 Indonesian Capital Market Directory 2010

Widarto 0.05%
Santoso Winata 0.05%
Public 40.33%
PT Tunas Baru Lampung Tbk. Food and Beverages
Head Office Wisma Budi 8th-9th Floor
Jl. HR. Rasuna Said Kav. C-6,
Jakarta 12940
Phone (021) 521-3383
Summary of Financial Statement
(million rupiah)
2004 2005 2006
Fax (021) 521-3392/521-3282 Email: [email protected]
Homepage:
http://www.tunasbarulampung.com
Factory Jl. Raya Lintas Sumatera Km. 75 Terbanggi Besar, Lampung Tengah
Phone (0725) 527-975 Fax (0725) 25010
Business Fully Integrated of Vegetables
Cooking Oil And Other Vegetables
Oil Derivatives
Company Status PMDN
Financial Performance: The Company booked net profit of
IDR52.884 billion in 2006, jump sharply by 750.5% from IDR6.218
billion in 2005. The net profit rose significantly mainly because of
foreign-exchange gain that reached IDR36.214 billion versus forex
loss of IDR15.087 billion.
Brief History: Established in 1973, PT Tunas Baru Lampung is a member company of Sungai Budi Group which was founded in
1947 and is a pioneer in Indonesia’s agricultural industry. Such
involvement stems from a desire to assist in the country’s devel-
opment and to capitalise on Indonesia’s competitive advantage
in agriculture. Today, the Sungai Budi Group is one of indonesia’s
largest manufacturers and distributors of agricultural based con-
sumer products. Another member company of the Sungai Budi
Group is the publicly listed PT Budi Acid Jaya Tbk, the largest
and most fully integrated tapioca starch manufacturer in Indone-
sia. Since PT. Tunas Baru Lampung began is operations in
Lampung in the early 1970s, we have grown to become one of the
largest and lowest cost vegetable cooking oil producers.
Shareholders
PT Sungai Budi 19.62%
PT Budi Sulfat Jaya 14.99%
PT Sungai Budi Perkasa 14.55%
PT Budi Alam Kencana 9.70%
PT Budi Acid Jaya Tbk 0.71%
Total Assets 1,352,092 1,451,439 2,049,163
Current Assets 397,888 352,676 662,858
of which
Cash and cash equivalents 13,385 17,940 151,592
Trade receivables 194,373 103,952 142,153
Inventories 129,297 146,246 131,011
Non-Current Assets 954,204 1,098,763 1,386,305
of which
Fixed Assets-Net 494,964 570,501 787,451
Deffered Tax Assets 3,406 3,402 1,909
Investments 43,029 71,838 82,537
Other Assets 3,785 5,311 4,710
Liabilities 840,285 938,257 1,183,409
Current Liabilities 279,299 335,537 448,132
of which
Bank loans 29,318 95,953 110,404
Trade payables 44,788 40,097 42,137
Accrued expenses 4,787 6,371 10,757
Current maturities of
long-term debt 73,814 88,561 111,724
Non-Current Liabilities 560,987 602,720 735,278
Minority Interests in Subsidiaries 1,219 1,221 1,313 Shareholders' Equity 510,588 511,960 864,441
Paid-up capital 201,923 201,923 515,526
Paid-up capital
in excess of par value 184,201 184,201 173,453
Retained earnings 124,463 125,836 175,462
Net Sales 1,191,010 1,220,636 1,193,999
Cost of Good Sold 962,428 989,612 931,578
Gross Profit 228,582 231,023 262,420
Operating Expenses 94,446 109,492 127,636
Operating Profit 134,135 121,531 134,784
Other Income (Expenses) (104,729) (103,016)
(55,633) Profit (Loss) before Taxes 29,407 18,515
79,152
Profit (Loss) after Taxes 16,455 6,219 52,884
Per Share Data (Rp)
Earnings (Loss) per Share 10 4 13
Equity per Share 316 317 210
Dividend per Share 3 n.a n.a
Closing Price 230 200 240
Financial Ratios
PER (x) 22.58 51.95 18.72
PBV (x) 0.73 0.63 1.15
Dividend Payout (%) 0.29 n.a n.a
Dividend Yield (%) 0.01 n.a n.a
Current Ratio (x) 1.42 1.05 1.48
Debt to Equity (x) 1.65 1.83 1.37
Leverage Ratio (x) 0.62 0.65 0.58
Operating Profit Margin (x) 0.11 0.10 0.11
Net Profit Margin (x) 0.01 0.01 0.04
Inventory Turnover (x) 0.73 0.75 0.97
Total Assets Turnover (x) 0.88 0.84 0.58
ROI (%) 1.22 0.43 2.58
ROE (%) 3.22 1.21 6.12
PER =295.69x ; PBV = 2.73x (June
2007) Financial Year: December 31
Public Accountant: Deddi Muliadi & Co. (2005); Mulyamin Sensi Suryanto (2006)

108 Indonesian Capital Market Directory 2007

PT Ultrajaya Milk Industry & Trading Company Tbk.
Food and Beverages
Head OfÞce Jl. Raya Cimareme No. 131
Padalarang 40552
Kab. Bandung 40552, Jawa Barat
Summary of Financial Statement
(Million Rupiah)
Phone (022) 8670-0700, (Hunting) Fax (022) 665-4612, 8670-0777
Factory Jl. Raya Cimareme No. 131
Padalarang 40552
Kabupaten Bandung, Jawa Barat
Business Milk and Juice
Company Status PMDN
Financial Performance: The Company booked consoli-
dated net income at IDR61.152 billion in 2009, or tumble down
from IDR303.711 billion booked in 2008.
Brief History: The company began its production in 1975
with the manufacturing of sterilized milk using the process
known as Ultra High Temperature (UHT). In 1981, the com- pany diversiÞed into new ranges of products such as fruit juices
and tea in cartons.
Under license from Kraft Inc. USA, the company began
the production of Kraft brand cheeses in 1985. Then under
license from Corman of Belgium, the company started manu-
facturing butter in 1987. Besides these licensee agreements, the
company also established relationships with Nestle Mead, John-
son Bristol Myers of the USA and with Pripps Inc. of Sweden
for the manufacturing and marketing of a sports energy drink
under the Pripps trademark.
2007 2008 2009
Total Assets 1,362,830 1,718,997 1,732,702
Current Assets 551,947 804,961 813,390
of which
Cash and cash equivalents 39,992 162,870 214,880
Trade receivables 161,475 150,323 177,153
Inventories 291,483 284,293 383,589
Non-Current Assets 810,883 914,037 919,312
of which
Fixed Assets-Net 765,807 766,345 808,903
Deffered Tax Assets-Net na. 43,096 24,196
Investments 42,230 46,525 40,913
Other Assets 2,845 58,071 35,410
Liabilities 530,492 603,996 599,688
Current Liabilities 232,731 445,866 445,866
of which
Bank loans 49,580 47,435 41,732
Trade payables 96,760 233,940 219,906
Current maturities of long-term debt 76,183 126,345 90,821
Non-Current Liabilities 297,761 158,130 153,822
Minority Interests in Subsidiaries 1,181 1,327 2,955
Shareholders' Equity 831,157 1,135,324 1,191,583
Paid-up capital 577,676 577,676 577,676
Paid-up capital
in excess of par value 51,130 51,130 51,130
Retained earnings 202,350 506,517 562,776
Net Sales 1,126,800 1,362,607 1,613,928
Cost of Goods Sold 804,228 1,101,876 1,192,033
Gross Profit 322,572 260,731 421,895
Operating Expenses 248,830 327,743 294,945
Operating Profit 73,742 (67,012) 126,949
Other Income (Expenses) (34,638) 335,794 (28,671)
Profit before Taxes 39,103 268,782 98,279
Profit after Taxes 30,317 303,712 61,153
Per Share Data (Rp)
Earnings per Share 10 105 21
Equity per Share 288 393 413
Dividend per Share n.a n.a n.a
Closing Price 650 800 580
Financial Ratios
PER (x) 61.93 7.61 27.39
PBV (x) 2.26 2.04 1.41
Dividend Payout (%) n.a n.a n.a
Dividend Yield (%) n.a n.a n.a
Current Ratio (x) 2.37 1.81 1.82
Debt to Equity (x) 0.64 0.53 0.50
Leverage Ratio (x) 0.39 0.35 0.35
Gross Profit Margin (x) 0.29 0.19 0.26
Operating Profit Margin (x) 0.07 n.a 0.08
Net Profit Margin (x) 0.03 0.22 0.04
Inventory Turnover (x) 2.76 3.88 3.11
Total Assets Turnover (x) 0.83 0.79 0.93
ROI (%) 2.22 17.67 3.53
ROE (%) 3.65 26.75 5.13
PER = 19.89x ; PBV = 1.56x (June 2010)
Financial Year: December 31
Public Accountant: Koesbandijah, Beddy Samsi & Setiasih
(million rupiah)
2010 2009
June June
Shareholders
PT Prawirawidjaja Prakarsa 21.40%
Sabana Prawirawidjaja 14.73%
UBS AG Singapore Non-Treaty Omnibus Acco 9.50%
PT Indolife Pensiontama 8.24%
PT AJ Central Asia Raya 7.68%
Public 38.45%
Total Assets 1,895,964 1,731,089
Current Assets 915,600 786,694
Non-Current Assets 980,364 944,395
Liabilities 633,568 569,786
Shareholders' Equity 1,259,738 1,157,593
Net Sales 912,355 743,018
Profit after Taxes 68,155 27,162
ROI (%) 3.59 1.57
ROE (%) 5.41 2.35
142 Indonesian Capital Market Directory 2010

the manufacturing of sterilized milk using the process known as
Ultra High Temperature (UHT). In 1981, the company diversified
Liabilities
Current Liabilities
of which
490,302 439,122 433,177
89,623 262,802 355,876
into new ranges of products such as fruit juices and tea in cartons. Bank loans 22,503 4,103 56,613
Under license from Kraft Inc. USA, the company began the pro- Trade payables 31,059 42,139 55,192
duction of Kraft brand cheeses in 1985. Then under license from Current maturities of long-term debt 25,000,000 204,268 228,704
Corman of Belgium, the company started manufacturing butter Non-Current Liabilities 400,678 176,319 77,301
in 1987. Besides these licensee agreements, the company also es- Minority Interests in Subsidiaries n.a. 857 1,104
of the USA and with Pripps Inc. of Sweden for the manufacturing
and marketing of a sports energy drink under the Pripps trade-
mark.
Shareholders' Equity
Paid-up capital
Paid-up capital
in excess of par value
809,938
577,676
51,130
814,466
577,676
51,130
814,799
577,676
51,130
Retained earnings 181,131 185,659 185,992
Net Sales 546,325 711,732 835,230
Cost of Goods Sold 371,960 495,807 583,343
Gross Profit 174,365 215,925 251,887
Operating Expenses 87,912 154,794 185,810
Operating Profit 86,453 61,132 66,077
Other Income (Expenses) (85,546) (56,324) (40,263)
Profit before Taxes 907 4,808 25,814
Profit after Taxes 4,412 4,528 14,732
Per Share Data (Rp)
Earnings per Share 2 2 5
Equity per Share 280 282 282
Dividend per Share n.a 5 n.a
Closing Price 425 310 435
Financial Ratios
PER (x) 278.22 197.76 85.29
PBV (x) 1.52 1.10 1.54
Dividend Payout (%) n.a 319 n.a
Dividend Yield (%) n.a 2 n.a
Current Ratio (x) 4.82 1.58 1.18
Debt to Equity (x) 0.61 0.54 0.53
Leverage Ratio (x) 0.38 0.35 0.35
Gross Profit Margin (x) 0.32 0.30 0.30
Operating Profit Margin (x) 0.16 0.09 0.08
Net Profit Margin (x) 0.01 0.01 0.02
Inventory Turnover (x) 2.48 2.93 3.95
Total Assets Turnover (x) 0.42 0.57 0.67
ROI (%) 0.34 0.36 1.18
ROE (%) 0.54 0.56 1.81
Shareholders
PT Prawirawidjaja Prakarsa 21.40%
Public 78.60%
PT Ultrajaya Milk Tbk.
Head Office Jl. Raya Cimareme No. 131 Padalarang 40552
Kabupaten Bandung 40552
Jawa Barat Phone (022) 665-4610, 665-4611
Summary of Financial Statement
Food and Beverages
(million rupiah)
2004 2005 2006
Fax (022) 665-4612
Factory Jl. Raya Cimareme No. 131 Padalarang 40552
Kabupaten Bandung, Jawa Barat
Business Milk and Juice
Company Status PMDN
Financial Performance: The company booked net profit of
IDR14.731 billion in 2006, increase sharply by 225.4% from
IDR4.527 billion in 2005. Net sales stepped up 17.35% at IDR835.229
billion from IDR711.731 billion.
Brief History: The company began its production in 1975 with
Total Assets 1,300,240 1,254,444 1,249,080
Current Assets 431,789 416,428 421,543
of which
Cash and cash equivalents 161,136 46,784 75,214
Trade receivables 100,189 118,630 122,993
Inventories 150,020 169,391 147,845
Non-Current Assets 868,451 838,016 827,537
of which
Fixed Assets-Net 780,339 786,798 790,208
Deffered Tax Assets-Net 4,424 4,037 na.
Investments 27,147 27,132 34,933
Other Assets 22,234 4,050 2,396
tablished relationships with Nestle Mead, Johnson Bristol Myers
PER = 58.50x ; PBV = 2.00x (June 2007)
Financial Year: December 31
Public Accountant: Koesbandijah, Beddy Samsi & Setiasih
110 Indonesian Capital Market Directory 2007
DAFTAR PUSTAKA
Fauzan, Agung. 2006. Analisa Pengaruh Penilaian Kinerja terhadap Rate of Return pada Perusahaan yang Tergabung dalam LQ45. Skripsi. Yogyakarta: Universitas Islam Indonesia.
Ghozali, Imam. 2007. Teori Akuntansi. Edisi Ketiga. Semarang. Badan Penerbitan Universitas Diponegoro.
Harahap, Sofyan Syafri. 2007. Teori Akuntansi. Jakarta: PT Raja Grafindo Persada.
Hery. 2009. Akuntansi Keuangan Menengah I. Jakarta. Bumi Aksara.
Horngren, Charles T and Walter T. Harrison Jr. Akuntansi. Terjemahan Danti Pujianti. 2007. Jakarta: PT Gelora Aksara Pratama
. 2009. Teori Akuntansi. Jakarta: Kencana.
http://ekonomi.kabo.biz/2011/02/pengertian-struktur-modal.html
http://harahapinhere.blogspot.com/2010/06/jenis-jenis-modal.html
Ikatan Akutansi Indonesia. 2009. Standart Akutansi Keuangan (SAK). Jakarta: Salemba Empat.
Indriani, Astiwi. 2009. Analisis Pengaruh Current Ratio, Sales Growth, Return on Asset, Retained Earning dan Size terhadap Debt to Equity Ratio. Skripsi. Semarang: Universitas Diponegoro.
jurnal-sdm.blogspot.com/2009/06/teori-struktur-modal.html
Kieso, Donald E, Jerry J. Weygandt, and Terry D. Warfield. 2007. Akuntansi Intermediate. Edisi 13 Jilid 3. Jakarta: Erlangga.
Margaretha, Farah. 2010. Faktor-Faktor yang Mempengaruhi Struktur Modal pada Industri Manufaktur di Bursa Efek Indonesia. Jurnal Bisnis dan Akuntansi. Vol12, No.2, Agustus (119-130).
Mulia, Nadya Tikanitha.2007. Leverage Keuangan terhadap ROE Perusahaan Tekstil di Indonesia. Jurnal Keuangan dan Perbankan. STIE Indonesia. Vol 12, No.2 Mei 2008 (229-239)
nila.lecture.ub.ac.id/files/2010/06/Struktur-Modal.pdf
Pengertian Saham. (http://id.wikipedia.ord/wiki/saham).

74 Indonesian Capital Market Directory 2007
Head Office
Perkatoran Hijau Arkadia
Tower C 15th Floor
Jl. TB. Simatupang Kav. 88
Jakarta 12520
Phone (021) 2754-5000
Fax (021) 7884-5549
2004
(million rupiah)2005
2006
Total Assets
106,554
210,052
233,253
25,616 60,794 50,039
of which Jawa Barat
Phone (021) 875-3054, 875-3055 Cash and cash equivalents 2,061 1,670 490
Trade receivables 11,497 22,341 21,017 Fax (021) 875-2970 Inventories 7,775 21,883 11,602
- Jl. Raya Pudak Payung No. 1 Non-Current Assets 80,938 149,258 183,214
Semarang Selatan, Jawa Tengah of which Phone (024) 475-062, Fixed Assets-Net 79,536 147,330 180,112
475-068, 475-054 Deffered Tax Assets 1,402 1,258 2,106
Fax (024) 475-074 - Desa Namo Riam,
Liabilities 75,198 297,953 449,948
Kecamatan Pancur Batu Current Liabilities 60,682 278,891 427,199
of which
Sumatera Utara Bank loans 20,244 225,895 381,089
Beverages (Bottled Mineral Water) Trade payables 15,035 6,130 6,214
Business
Company Status PMDN Non-Current Liabilities 14,516 19,062 22,749
Financial Performance: The Company booked net a loss in- Minority Interests in Subsidiaries 1 n.a n.a
crease from IDR119.256 billion to IDR128.794 billion. The net loss
Shareholders' Equity 31,355
(87,901)
(216,695)
was up due the sales decrease by 6.05% from IDR143.751 billion
to IDR135.043 billion.
Brief History: The company supplied bottled water in plastic
Paid-up capital 149,720
Paid-up capital
in excess of par value 6,593
149,720
6,593
149,720
6,593
glass, plastic bottles and glass bottles. Production capacity in 1993 Retained earnings (accumulated loss) (124,958) (244,214) (373,008)
was 2.9 million liters per year. Operations are supported by two bottling plants: one in Cibinong, West Java, and the other in Deli
Net Sales 125,554
143,751
135,043
Serdang, North Sumatra. The company’s bottled water has been Cost of Goods Sold 106,580 120,220 126,676
exported to Singapore and Australia. In November 1993, the com- Gross Profit 18,974 23,531 8,367
pany took over full ownership of PT Pamargha Indojatim, which Operating Expenses 88,256 141,185 135,881
Operating Profit (69,282) (117,654) (127,514) operates in the same line of business. And on October 1996, buoyed Other Income (Expenses) (65,171) 34 (1,608) by strong prospects in the bottled water industry, the company is Profit (Loss) before Taxes (134,453) (117,620) (129,122) building a new water plant in Ujungpandang. The water source located in Maros, South Sulawesi will supply this plant which will
Profit (Loss) after Taxes (134,452) (119,256) (128,794)
have a 40 million liter capacity a year. Cost of the project has been Per Share Data (Rp)
pegged at Rp 3 billion. Construction is slated to finish in the 2nd Earnings (Loss) per Share (1,074) (797) (860)
semester of 1996 and commercial operations should commence in Equity per Share 251 (587) (1,447)
mid 1997. In October 2000, the company sold its AdeS, Desta, Vica, Dividend per Share n.a n.a n.a
and Desca brands to Coca Cola as part of its debt restructuring Closing Price 2,257 1,660 1,110
process. Financial Ratios
PER (x) (2.10) (2.08) (1.29)
PBV (x) 9.01 (2.83) (0.77)
Dividend Payout (%) n.a n.a n.a
Dividend Yield (%) n.a n.a n.a
Current Ratio (x) 0.42 0.22 0.12
Debt to Equity (x) 2.40 n.a n.a
Leverage Ratio (x) 0.71 1.42 1.93
Gross Profit Margin (x) 0.15 0.16 0.06
Operating Profit Margin (x) n.a n.a n.a
Net Profit Margin (x) n.a n.a n.a
Inventory Turnover (x) 13.71 5.49 10.92
Total Assets Turnover (x) 1.18 0.68 0.58
ROI (%) (126.18) (56.77) (55.22)
ROE (%) (428.81) 135.67 59.44 Shareholders Waters Partners Bottling S.A. 68.26% PER = -0.76x ; PBV = -0.51x (June 2007) UBS AG Singapore-UBS Equities 209114 16.23% Financial Year: December 31 Public 15.51% Public Accountant: Siddharta Siddharta & Widjaja
PT Ades Waters Indonesia Tbk. (d/h PT Ades Alfindo Putrasetia Tbk)
Food and Beverages
Summary of Financial Statement
Factories - Tapos Km. 1, Desa Kranji, Bogor Current Assets
Kabupaten Deli Serdang
Taxes payable 1,253 1,120 822

106 Indonesian Capital Market Directory 2007
Public 8.09%
PT Tiga Pilar Sejahtera Food Tbk. (d/h PT Asia Intiselera Tbk)
Food and Beverages
Head Office Alun Graha 1st Floor Jl. Prof. DR. Supomo No. 233
Jakarta Selatan
Phone (021) 831-8775, 522-7488
Fax (021) 835-1215
Summary of Financial Statement
(million rupiah)
2004 2005 2006
Website: www.tigapilar.com
Factory Jl. Raya Bogor Km. 33 Cisalak
Cimanggis, Bogor, Jawa Barat
Phone (021) 874-0075
Fax (021) 874-0078 Business Noodle
Company Status PMDN
Financial Performance: The Company booked net profit of
IDR129.866 million in 2006, increase by 275.63% from IDR34.573
million in 2005. The net profit increased after the sales rose by
31.03% from IDR229.973 billion to IDR333.455 billion.
Brief History: The company produces three kinds of noodle,
namely: instant noodle of Mikita, Ha Ha and Bossmie brand, dry
noodle of Ayam 2 Telor, Tanah Air, Manggis and Hula Hula marks,
and snack noodle of Anak Kita Brand. The company was estab-
lished by Kang family in 1953.
Total Assets 342,438 357,786 363,933
Current Assets 106,355 142,050 170,645
of which
Cash and cash equivalents 12,240 13,886 13,999
Trade receivables 36,563 56,874 60,813
Inventories 43,809 51,093 74,615
Non-Current Assets 236,083 215,735 193,288
of which
Fixed Assets-Net 226,812 207,028 186,448
Investments 20 20 22
Deffered Tax Assets 890 1,131 1,150
Liabilities 247,310 262,621 268,636
Current Liabilities 134,508 173,794 157,840
of which
Bank loans 63,940 95,226 112,886
Trade payables 39,598 34,029 33,811
Current maturities of
long-term debt 22,800 40,188 5,412
Non-Current Liabilities 112,802 88,828 110,796
Minority Interests in Subsidiaries 108 109 111
Shareholders' Equity 95,021 95,055 95,185
Paid-up capital 249,500 249,500 249,500
Paid-up capital
in excess of par value 20,250 20,250 20,250
Retained earnings (accumulated loss) (174,729) (174,695) (174,565)
Net Sales 228,437 229,973 333,455
Cost of Goods Sold 178,856 190,297 290,509
Gross Profit (Loss) 49,581 39,676 42,946
Operating Expenses 24,219 12,530 15,657
Operating Profit (Loss) 25,362 27,146 27,289
Other Income (Expenses) (25,223) (27,271) (26,094)
Profit (Loss) before Taxes 139 (125) 1,195
Profit (Loss) after Taxes 90 35 130
Per Share Data (Rp) Earnings (Loss) per Share 0.09 0.03 0.12
Equity per Share 91.02 91.05 91.18
Dividend per Share n.a n.a n.a
Closing Price 210 215 175
Financial Ratios PER (x) 2,446.83 6,491.88 1,406.75
PBV (x) 2.31 2.36 1.92
Dividend Payout (%) n.a n.a n.a
Dividend Yield (%) n.a n.a n.a
Current Ratio (x) 0.79 0.82 1.08
Debt to Equity (x) 2.60 2.76 2.82
Leverage Ratio (x) 0.72 0.73 0.74
Gross Profit Margin (x) 0.22 0.17 0.13
Operating Profit Margin (x) 11.10 11.80 8.18
Net Profit Margin (x) n.a n.a n.a
Inventory Turnover (x) 4.08 3.72 3.89
Total Assets Turnover (x) 0.67 0.64 0.92
ROI (%) 0.03 0.01 0.04
Shareholders
PT Tiga Pilar Sekuritas
38.51%
ROE (%) 0.09 0.04 0.14
PT Permata Hendrawira Sakti 33.97% PER = 235.13x ; PBV = 1.98x (June 2007) Basinale Investments Ltd. 13.04% Financial Year: December 31
PT Sapta Kencana Asiaprima 6.39% Public Accountant: Aryanto Amir Jusuf & Mawar

PT Cahaya Kalbar Tbk.
Food and Beverages
Head OfÞce/Factory Jl. Industri Selatan 3 Blok GG No. 1
Kawasan Industri Jababeka II, Cikarang,
Bekasi 17550
Summary of Financial Statement
(Million Rupiah)
Phone (021) 8983-0003, 8983-0004
Fax (021) 893-7143
Website: www.cahayakalbar.com Marketing OfÞce The City Tower 16th Floor
Jl. MH. Tahmrin No. 81
Jakarta 10310
Phone (021) 3199-6280
Fax (021) 3199-6283
Business Edible Oil Producer
Company Status PMA
Financial Performance: The Company booked net income
amounted IDR49.493 billion in 2009, higher than last year in-
come worth IDR27.867 billion.
Brief History: PT. CAHAYA KALBAR was established in
1968. In 1996, the company was public listed at Jakarta Stock
Exchange under the trading code “CEKA”. We are a well
known producer of various ingredients for entire range of food
products :
• for chocolate and cocoa confectionary industries, ic- ing coating, confectionary Þlling.
• Aloe Vera concentrates and powder for functional
food, cosmetics and pharmaceutical industry.
We also produce and supply ingredients to the restaurant
/ hotel industry, cake and bakery industry and later we enter
the retail / wholesale market with the functional beverage drink
products. Under the trademark : ALOEFIT.
2007 2008 2009
Total Assets 613,680 605,545 568,363
Current Assets 456,316 406,965 374,368
of which
Cash and cash equivalents 12,869 6,146 5,776
Trade receivables 33,402 132,212 66,303
Inventories 273,267 115,624 114,749
Non-Current Assets 157,363 198,580 193,995
of which
Fixed Assets-Net 148,612 185,988 187,967
Deffered Tax Assets 1,096 1,819 187,967 Liabilities 394,642 370,520 266,860
Current Liabilities 335,769 55,393 76,488
of which
Bank loans 160,123 n.a n.a
Trade payables 26,917 42,545 67,203
Accrued expenses 3,975 4,527 3,762
Non-Current Liabilities 58,873 315,127 190,372
Minority Interests in Subsidiaries n.a n.a n.a Shareholders' Equity 219,037 235,025 301,503
Paid-up capital 148,750 148,750 148,750
Paid-up capital
in excess of par value 104,848 104,848 104,848
Retained earnings (accumulated loss) (34,560) (18,573) 47,905 Net Sales 812,635 1,963,638 1,194,544
Cost of Goods Sold 723,171 1,728,731 1,055,969
Gross Profit 89,465 234,906 138,574
Operating Expenses 46,741 135,270 45,114
Operating Profit 42,723 99,636 93,460
Other Income (Expenses) (6,583) (57,190) (23,371)
Profit (Loss) before Taxes 36,140 42,446 70,089
Profit (Loss) after Taxes 24,676 27,868 49,493 Per Share Data (Rp)
Earnings (Loss) per Share 83 94 166
Equity per Share 736 790 1,013
Dividend per Share n.a n.a n.a
Closing Price 800 700 1,490 Financial Ratios
PER (x) 9.64 7.47 8.96
PBV (x) 1.09 0.89 1.47
Dividend Payout (%) n.a n.a n.a
Dividend Yield (%) n.a n.a n.a Current Ratio (x) 1.36 7.35 4.89
Debt to Equity (x) 1.80 1.58 0.89
Leverage Ratio (x) 0.64 0.61 0.47
Gross Profit Margin (x) 0.11 0.12 0.12
Operating Profit Margin (x) 0.05 0.05 0.08
Net Profit Margin (x) 0.03 0.01 0.04
Inventory Turnover (x) 2.65 14.95 9.20
Total Assets Turnover (x) 1.32 3.24 2.10
ROI (%) 4.02 4.60 8.71
ROE (%) 11.27 11.86 16.42
PER =7.06x ; PBV = 1.00x (June 2010)
Financial Year: December 31
Public Accountant: Purwantono, Sarwoko & Sandjaja
(million rupiah)
2010
June
2009
June
Total Assets
755,108
624,557
Current Assets 564,751 429,489
Non-Current Assets 190,356 195,068
Liabilities 432,828 352,275
Shareholders' Equity 322,280 272,282
Net Sales 335,911 877,994
Profit after Taxes 20,776 36,922
Shareholders Tradesound Investments Limited 87.02% ROI (%) 2.75 5.91
Public 12.98% ROE (%) 6.45 13.56
112 Indonesian Capital Market Directory 2010

PT Cahaya Kalbar Tbk.
Head Office Jl. Industri Selatan 3
Blok GG No. 1
Kawasan Industri Jababeka,
Bekasi 17550
Phone (021) 8983-0003, 8983-0004
Summary of Financial Statement
Food and Beverages
(million rupiah)
2004 2005 2006
Fax (021) 893-7143 Website: www.cahayakalbar.com
Factory Jl. Industri Selatan 3
Blok GG No. 1
Kawasan Industri Jababeka,
Bekasi 17550
Phone (021) 8983-0003, 8983-0004 Fax (021) 893-7143
Website: www.cahayakalbar.com
Business Edible Oil Producer
Company Status PMDN
Financial Performance: The company booked net profit of
IDR15.291 billion in 2006 versus net loss of IDR21.594 billion in
2005. The net sales increased sharply by 62.46% at IDR391.061 bil-
lion from IDR240.713 billion.
Brief History: PT. CAHAYA KALBAR was established in 1968.
In 1996, the company was public listed at Jakarta Stock Exchange
under the trading code “CEKA”. We are a well known producer
of various ingredients for entire range of food products :
• for chocolate and cocoa confectionary industries, icing coat- ing, confectionary filling.
• Aloe Vera concentrates and powder for functional food, cos-
metics and pharmaceutical industry.
We also produce and supply ingredients to the restaurant /
hotel industry, cake and bakery industry and later we enter the
retail / wholesale market with the functional beverage drink prod-
ucts. Under the trademark : ALOEFIT.
Shareholders
Tradesound Investment Limited 61.71%
R/N S’PORE A/C LL/J-015110-6 17.87%
UBS AG, Singapore 5.02%
Public 15.40%
Total Assets 289,741 328,249 280,807
Current Assets 97,511 150,317 186,290
of which
Cash and cash equivalents 4,392 9,907 16,341
Trade receivables 20,969 28,232 34,574
Inventories 63,799 99,975 91,316
Non-Current Assets 192,230 177,932 94,517
of which
Fixed Assets-Net 178,634 131,396 83,649
Deffered Tax Assets 583 1,451 773 Liabilities 86,374 149,177 86,446
Current Liabilities 65,753 90,794 53,675
of which
Bank loans 53,418 68,426 37,884
Trade payables 7,025 10,584 11,791
Accrued expenses 1,476 1,018 1,338
Non-Current Liabilities 20,621 58,383 32,771
Minority Interests in Subsidiaries 1 2 n.a Shareholders' Equity 200,664 179,070 194,361
Paid-up capital 148,750 148,750 148,750
Paid-up capital
in excess of par value 104,848 104,848 104,848
Retained earnings (accumulated loss) (52,934) (74,528) (59,237) Net Sales 167,612 240,713 391,062
Cost of Goods Sold 168,575 220,659 360,551
Gross Profit (963) 20,055 30,511
Operating Expenses 10,757 11,862 22,067
Operating Profit (11,720) 8,193 8,443
Other Income (Expenses) (4,744) (19,659) 10,984
Profit (Loss) before Taxes (16,464) (11,467) 19,427
Profit (Loss) after Taxes (24,238) (21,594) 15,291 Per Share Data (Rp)
Earnings (Loss) per Share (81) (73) 51
Equity per Share 675 602 653
Dividend per Share n.a n.a n.a
Closing Price 300 600 590 Financial Ratios
PER (x) ( 3.68) ( 8.27) 11.48
PBV (x) 0.44 1.00 0.90
Dividend Payout (%) n.a n.a n.a
Dividend Yield (%) n.a n.a n.a Current Ratio (x) 1.48 1.66 3.47
Debt to Equity (x) 0.43 0.83 0.44
Leverage Ratio (x) 0.30 0.45 0.31
Gross Profit Margin (x) n.a n.a n.a
Operating Profit Margin (x) n.a n.a n.a
Net Profit Margin (x) n.a n.a n.a
Inventory Turnover (x) 2.64 2.21 3.95
Total Assets Turnover (x) 0.58 0.73 1.39
ROI (%) ( 8.37) ( 6.58) 5.45
ROE (%) ( 12.08) ( 12.06) 7.87
PER = 66.94x ; PBV = 0.82x (June 2007)
Financial Year: December 31
Public Accountant: Kosasih & Nurdiyaman
78 Indonesian Capital Market Directory 2007

PT Davomas Abadi Tbk.
Food and Beverages
Head OfÞce Jl. Pangeran Jayakarta 117 Blok B/35-39
Jakarta 10730
Phone (021) 600-9709, 626-6477
Summary of Financial Statement
(Million Rupiah)
Fax (021) 600-9708, 626-4390 Investor Relation OfÞce Plaza BII Menara III 9th Floor
Jl. MH. Thamrin No. 51
Jakarta 10350
Phone (021) 3983-4512
Fax (021) 3983-4513
Factory Jl. Industri Raya III Blok AB No. 1A
Tangerang, Banten 15710
Phone (082) 140-269
Business Cocoa
Company Status PMDN
Financial Performance: The Company has suffered net
loss at IDR226.7 billion in 2009, down from IDR510.6 billion
net loss suffered in 2008.
Brief History: The Company was established in 1990. Its
production facility is located in Tangerang, Banten. The Com-
pany currently has a production capacity of 100,800 metric tons
per annum (tpa); a further 40,320 tpa of capacity will come
on-stream before mid year of 2007. Davomas is listed on the
Jakarta Stock Exchange since 1994. The Company) is Indone-
sia’s largest producer and exporter of cocoa butter and cocoa
powder (collectively referred to as cocoa products).
2007 2008 2009
Total Assets 3,868,528 3,620,074 2,806,017
Current Assets 1,339,276 1,259,152 730,511
of which
Cash and cash equivalents 582,505 290,242 587,390
Trade receivables 244,626 106,127 n.a
Inventories 312,375 781,179 141,697
Non-Current Assets 2,529,252 2,360,922 2,075,506
of which
Fixed Assets-Net 2,432,157 2,360,667 2,075,251 Liabilities 2,684,121 2,946,319 2,359,073
Current Liabilities 144,551 45,794 6,424
of which
Taxes payable 753 141 80
Accrued expenses 3,132 2,850 265
Long-term Liabilities 2,539,570 2,900,525 2,352,648 Shareholders' Equity 1,184,407 673,755 446,944
Paid-up capital 620,186 620,186 620,186
Paid-up capital
in excess of par value 1,895 1,895 1,895
Retained earnings (accumulated loss) 562,326 51,675 (175,137) Net Sales 2,800,084 3,392,847 406,063
Cost of Goods Sold 2,241,357 3,257,735 1,058,337
Gross Profit 558,728 135,112
(652,274) Operating Expenses 19,358 22,020
405,633
Operating Profit 539,369 113,092
(1,057,907) Other Income (Expenses) (240,487) (577,295)
133,319
Profit (Loss) before Taxes 298,882 (464,203) (924,588)
Profit (Loss) after Taxes 208,456 (510,652) (226,749)
Per Share Data (Rp)
Earnings (Loss) per Share 17 (41) (18)
Equity per Share 95 54 36
Dividend per Share n.a n.a n.a
Closing Price 250 58 50 Financial Ratios
PER (x) 14.88 ( 1.41) ( 2.74)
PBV (x) 2.62 1.07 1.39
Dividend Payout (%) n.a n.a n.a
Dividend Yield (%) n.a n.a n.a Current Ratio (x) 9.27 27.50 113.71
Debt to Equity (x) 2.27 4.37 5.28
Leverage Ratio (x) 0.69 0.81 0.84
Gross Profit Margin (x) 0.20 0.04 n.a
Operating Profit Margin (x) 0.19 0.03 n.a
Net Profit Margin (x) 0.07 n.a n.a
Inventory Turnover (x) 7.18 4.17 7.47
Total Assets Turnover (x) 0.72 0.94 0.14
ROI (%) 5.39 ( 14.11) ( 8.08)
ROE (%) 17.60 ( 75.79) ( 50.73)
PER = -9.79x ; PBV = 2.71x (June 2009)
Financial Year: December 31
Public Accountant: Albert Silalahi & Co. (2008); Tanubrata Sutanto & Co. (2009)
(million rupiah)
2010 2009
June June
Total Assets 2,786,124 957,961
Current Assets 872,380 714,331
Shareholders
Hassock Enterprises Ltd.
23.17%
Non-Current Assets 1,913,744 243,630
Liabilities 2,406,348 2,932,147
PT Citi Pacific Securities 20.27% Shareholders' Equity 379,776 25,814
Caterpillar Associates Ltd 11.46% Net Sales 692,825 364,584
Lehman Brothers Investments Ptd., Ltd S/A S.A 11.11% Profit after Taxes 8,233 (647,928)
Krigler Holding Ltd 7.75%
Polar Cap Investments Ltd 6.09% ROI (%) 0.30 (67.64)
Public 20.17% ROE (%) 2.17 (2,509.95)
114
Indonesian Capital Market Directory 2010

PT Davomas Abadi Tbk.
Head Office Jl. Pangeran Jayakarta 117 Blok B/35-39 Jakarta 10730
Phone (021) 600-9709, 626-6477
Fax (021) 600-9708, 626-4390
Summary of Financial Statement
Food and Beverages
(million rupiah)
2004 2005 2005
Investor Relation Office Plaza BII Menara III 9th Floor Jl. MH. Thamrin No. 51
Jakarta 10350
Phone (021) 3983-4512
Fax (021) 3983-4513
Factory Jl. Industri Raya III Blok AB No. 1A
Tangerang, Banten 15710
Phone (082) 140-269
Business Cocoa
Company Status PMDN
Company News : PT Davomas Abadi Tbk has started operat-
ing the company’s two new production lines which have a total
capacity of 40,000 tones per year.
Financial Performance: In 2006, the Company booked net profit
at IDR196.277 billion, or increase significantly from IDR90.069 bil-
lion in 2005. The higher net profit was partly supported by the
increase in net sales from IDR1.120 trillion to IDR1.656 trillion.
Brief History: In 1994, production capacity stood at 20,160 tons,
comprising 10,080 tons of cocoa butter and 10,080 tons of cocoa
powder. In 1995 the company production capacity reached 40,320
tons, comprising 20,160 tons of cocoa butter and 20,160 tons of
cocoa powder. The company’s factory has 0.8 hectares of building
space, standing on 3.7 hectares of land in Tangerang, West Java.
At the end of 1997, the company sealed a 10-year long term sales
contract to supply an average of 40,000 tons cocoa flour and cocoa
butter annually to its overseas trading partners. To boost produc-
tion capacity in line with increased demand, in 1997 Davomas
purchased an additional cocoa bean processor. With an investment
of US$ 20 million, this machine has an annual production capac-
ity of 20,000 tons.
Shareholders
Hassock Enterprises Ltd 23.17%
PT Multiprima Perkasa 19.59%
Caterpillar Associates Ltd 11.46%
PT Citi Pacific Securities 11.02%
Krigler Holding Ltd 7.75%
Polar Cap Investments Ltd 6.09%
PT Sheriutama Raya 6.03%
Catnera International Ltd 5.53%
Public 9.36%
Total Assets 1,577,951 1,746,895 2,707,801
Current Assets 383,640 637,403 1,032,260
of which
Cash and cash equivalents 166,643 427,505 515,458
Trade receivables 93,272 92,290 142,002
Inventories 86,933 83,031 287,505
Non-Current Assets 1,194,310 1,109,491 1,675,541
of which
Fixed Assets-Net 1,194,061 1,109,255 1,592,619 Liabilities 888,346 967,221 1,731,850
Current Liabilities 688 26,120 172,484
of which
Taxes payable 18 63 650
Accrued expenses 670 770 4,536
Long-term Liabilities 887,658 941,101 1,559,366 Shareholders' Equity 689,605 779,674 975,951
Paid-up capital 620,186 620,186 620,186
Paid-up capital
in excess of par value 1,895 1,895 1,895
Retained earnings (accumulated loss) 67,524 157,593 353,870 Net Sales 1,032,178 1,120,893 1,656,584
Cost of Goods Sold 851,108 944,198 1,359,471
Gross Profit 181,070 176,695 297,114
Operating Expenses 8,592 14,583 17,310
Operating Profit 172,478 162,112 279,804
Other Income (Expenses) (29,188) (43,223) (29,884)
Profit (Loss) before Taxes 143,290 118,889 249,919
Profit (Loss) after Taxes 98,958 90,069 196,277 Per Share Data (Rp)
Earnings (Loss) per Share 16 15 32
Equity per Share 111 126 157
Dividend per Share n.a n.a n.a
Closing Price 200 80 590 Financial Ratios
PER (x) 12.53 5.51 18.64
PBV (x) 1.80 0.64 3.75
Dividend Payout (%) n.a n.a n.a
Dividend Yield (%) n.a n.a n.a Current Ratio (x) 557.47 24.40 5.98
Debt to Equity (x) 1.29 1.24 1.77
Leverage Ratio (x) 0.56 0.55 0.64
Gross Profit Margin (x) 0.18 0.16 0.18
Operating Profit Margin (x) 0.17 0.14 0.17
Net Profit Margin (x) 0.10 0.08 0.12
Inventory Turnover (x) 9.79 11.37 4.73
Total Assets Turnover (x) 0.65 0.64 0.61
ROI (%) 6.27 5.16 7.25
ROE (%) 14.35 11.55 20.11
PER = 25.20x ; PBV = 3.20x (June 2007)
Financial Year: December 31
Public Accountant: BDO Tanubrata, Sutanto, Sibarani
80 Indonesian Capital Market Directory 2007

PT Delta Djakarta Tbk. Food and Beverages
Head OfÞce/Factory Jl. Inspeksi Tarum Barat
Desa Setia Darma
Tambun, Bekasi Timur 17510
Summary of Financial Statement
(Million Rupiah)
Phone (021) 882-2520, 880-0511 2007 2008 2009
Fax (021) 881-9423, 880-0513
Total Assets
592,359
698,297
760,426
Po.Box. 180, Bekasi 17018 Current Assets 432,547 544,237 612,987
E-mail : [email protected]
Website: www.deltajkt.co.id
Business Beverages Industry
Company Status PMA
Financial Performance: The Company booked net income
at IDR126.5 billion in 2009, or increase from IDR83.754 billion
in 2008. Net sale increased to IDR1.264 trillion from IDR1.177
trillion.
Brief History: PT Delta Djakarta is the manufacturer and
distributor of some of the best beer brands in the world under
the Anker, Carlsberg, San Miguel, and Kuda Putih trademarks. The company is also a key Þgure in the country’s non-alcoholic
beverages market; with brands Sodaku and Soda Ice among In-
donesia’s top-sellers. Since its founding in 1932 by German Þrm Archipel Brou-
werij NV, leadership of PT Delta Djakarta has changed hands
many times. In World War II, control of the company was turned over to a Dutch Þrm before being passed on to a Japa-
nese company in 1942. Three years later, the Dutch regained
control.
In 1970, the company took the name PT Delta Djakarta; and in 1984 was part of the Þrst-generation of companies in In-
donesia to go public and sell shares at the Jakarta and Surabaya
Stock Exchanges. To date, PT Delta Djakarta’s major share-
holders include the Municipal Government of Jakarta and San
Miguel Malaysia (L) Private Limited. Its breweries are located in
Jalan Inspeksi Tarum Barat, East Bekasi and West Java.
of which
Cash and cash equivalents 164,550 289,951 386,105
Trade receivables 172,427 109,380 110,186
Inventories 28,758 73,810 66,545
Non-Current Assets 159,812 154,060 147,439
of which
Fixed Assets-Net 133,230 124,629 119,291
Deffered Tax Assets 3,631 6,006 6,200
Other Assets 157 157 191 Liabilities 131,545 174,316 160,808
Current Liabilities 103,664 143,621 130,322
of which
Trade payables 24,436 32,011 21,954
Taxes and excise payable 50,577 78,407 75,617
Accrued expenses 19,420 20,548 17,776
Non-Current Liabilities 27,881 30,694 30,486
Minority Interests in Subsidiaries 2,382 4,213 9,391 Shareholders' Equity 458,432 519,768 590,226
Paid-up capital 16,013 16,013 16,013
Paid-up capital
in excess of par value 19,016 19,016 19,016
Retained earnings 423,404 484,739 555,197
Net Sales 439,823 673,770 740,681
Cost of Goods Sold 242,305 389,438 401,524
Gross Profit 197,518 284,332 339,156
Operating Expenses 136,906 184,293 178,528
Operating Profit 60,612 100,039 160,629
Other Income (Expenses) 6,010 17,699 17,376
Profit (Loss) before Taxes 66,622 117,738 178,005
Profit (Loss) after Taxes 47,331 83,754 126,504 Per Share Data (Rp)
Earnings (Loss) per Share 2,956 5,230 7,900
Equity per Share 28,628 32,459 36,859
Dividend per Share n.a n.a 9,500
Closing Price 16,000 20,000 62,000 Financial Ratios
PER (x) 5.41 3.82 7.85
PBV (x) 0.56 0.62 1.68
Dividend Payout (%) n.a n.a 120
Dividend Yield (%) n.a n.a 26 Current Ratio (x) 4.17 3.79 4.70
Debt to Equity (x) 0.29 0.34 0.27
Leverage Ratio (x) 0.22 0.25 0.21
Gross Profit Margin (x) 0.45 0.42 0.46
Operating Profit Margin (x) 0.14 0.15 0.22
Net Profit Margin (x) 0.11 0.12 0.17
Inventory Turnover (x) 8.43 5.28 6.03
Total Assets Turnover (x) 0.74 0.96 0.97
ROI (%) 7.99 11.99 16.64
ROE (%) 10.32 16.11 21.43
PER = 9.62x ; PBV = 2.54x (June
2010) Financial Year: December 31
Public Accountant: Osman Bing Satrio & Co.
(million rupiah)
2010
June
2009
June

Total Assets 717,100 697,220
Current Assets 570,906 543,378
Non-Current Assets 146,194 153,843
Liabilities 194,771 177,253
Shareholders' Equity 509,683 514,260
Net Sales 291,982 342,283
Shareholders Profit after Taxes 71,582 50,613
San Miguel Malaysia (L) 58.30% Municipal Government of Jakarta 26.30% ROI (%) 9.98 7.26
Public 15.40% ROE (%) 14.04 9.84
116 Indonesian Capital Market Directory 2010

Per Share Data (Rp)
Earnings (Loss) per Share
2,417
3,522
2,703
Equity per Share 22,185 25,357 27,358
Dividend per Share 350 700 n.a
Closing Price 14,500 36,000 22,800
Financial Ratios PER (x) 6.00 10.22 8.43
PBV (x) 0.65 1.42 0.83
Dividend Payout (%) 14.48 19.87 n.a
Dividend Yield (%) 2.41 1.94 n.a
Current Ratio (x) 4.14 3.69 3.80
Debt to Equity (x) 0.28 0.32 0.31
Leverage Ratio (x) 0.22 0.24 0.24
Gross Profit Margin (x) 0.46 0.48 0.48
Operating Profit Margin (x) 0.16 0.17 0.13
Net Profit Margin (x) 0.11 0.13 0.11
Inventory Turnover (x) 4.75 4.82 4.52
Total Assets Turnover (x) 0.78 0.80 0.69
ROI (%) 8.50 10.49 7.50
ROE (%) 10.90 13.89 9.88
Shareholders
San Miguel Malaysia (L)
58.30%
PER = 12.51x ; PBV = 0.90x (June 2007)
Financial Year: December 31
Municipal Government of Jakarta 26.30% Public Accountant: Osman Ramli Satrio & Co. Public 15.40%
PT Delta Djakarta Tbk.
Head Office Jl. Inspeksi Tarum Barat
Desa Setia Darma Tambun, Bekasi Timur 17510
Phone (021) 882-2520, 880-0511
Fax (021) 881-9423, 880-0513
Summary of Financial Statement
Food and Beverages
(million rupiah)
2004 2005 2006
Po.Box. 180, Bekasi 17018
E-mail:
Factory Jl. Inspeksi Tarum Barat
Desa Setia Darma
Tambun, Bekasi Timur 17510
Phone (021) 882-2520, 880-0511 Fax (021) 881-9423, 880-0513
Po.Box. 180, Bekasi 17018
E-mail :
Business Beverages Industry
Company Status PMA
Financial Performance: The Company booked net profit of
IDR43.284 billion in 2006, falling by 23.26% from IDR56.405 bil-
lion in 2005. The net profit decline was due to decrease in net sales
from IDR432.729 billion to IDR396.733 billion.
Brief History: The company main product is pilsner beer and
is marketed under the Anker Bir trade mark and controls 40% of
the national pilsner beer market in Indonesia. Other production
are Anker Stout and Shanta Super Shandy. It has a cooperation
agreement with allied Breweries Nederland BV, covering tech-
nological development, marketing and general management. Delta
Jakarta also produces licensed product from Carlsberg Interna-
tional A/S, Denmark under the trade mark of Carlsberg Beer. On
August 1995, the company relocated its brewery from North
Jakarta to Tambun, Bekasi, West Java. This brewery was con-
structed on a 15 ha site. The relocation is expected to increase pro-
duction capacity by 50% to 900,000 hl. The company also produc-
ing San Miguel beer, following the entry of San Miguel Corpora-
tion of the Philippines into the company as shareholder.
Total Assets 455,244 537,785 577,411
Current Assets 299,334 382,805 419,204
of which
Cash and cash equivalents 119,116 135,172 117,968
Trade receivables 120,894 168,680 203,058
Inventories 40,032 46,751 46,090
Non-Current Assets 155,910 154,979 158,208
of which
Fixed Assets-Net 131,377 129,736 121,275
Deffered Tax Assets 2,027 2,731 2,863
Other Assets 188 152 154 Liabilities 99,357 130,911 137,928
Current Liabilities 72,389 103,623 110,184
of which
Trade payables 13,725 21,820 11,458
Taxes and excise payable 37,243 51,214 62,300
Accrued expenses 12,887 20,312 28,135
Non-Current Liabilities 26,968 27,288 27,744
Minority Interests in Subsidiaries 635 821 1,397 Shareholders' Equity 355,251 406,052 438,087
Paid-up capital 16,013 16,013 16,013
Paid-up capital
in excess of par value 19,016 19,016 19,016
Retained earnings 320,223 371,023 403,058 Net Sales 353,481 432,729 396,733
Cost of Goods Sold 190,353 225,420 208,099
Gross Profit 163,127 207,309 188,634
Operating Expenses 104,923 133,874 136,952
Operating Profit 58,204 73,435 51,682
Other Income (Expenses) (836) 5,636 9,075
Profit (Loss) before Taxes 57,368 79,071 60,756
Profit (Loss) after Taxes 38,708 56,405 43,284
82 Indonesian Capital Market Directory 2007

PT Fast Food Indonesia Tbk. Food and Beverages
Head OfÞce Gedung Gelael, 4th Floor
Jl. MT. Haryono Kav. 7
Jakarta 12810
Summary of Financial Statement
(Million Rupiah)
Phone (021) 830-1133, 831-3368
Fax (021) 830-9384,830-0569
Telex 48725 Gelael IA
Website: www.kfcindonesia.com
Business Food and Restaurant
Company Status PMDN
Financial Performance: The Company booked net in-
come at IDR181.9 billion in 2009, raised from IDR125.267 bil-
lion in 2008. Net sale was increased from IDR2.022 trillion to
IDR2.454 trillion.
Brief History: The company, founded in 1978 by the Ge-
lael Group, is the exclusive Kentucky Fried Chicken (KFC) fran-
chise holder for Indonesia.On October 10, 1979, the company opened its Þrst KFC restaurant on Jalan Melawai, Jakarta. The
success of this Þrst KFC restaurant had led the company to
dominate the fast food market leader in Indonesia for the past
17 years. More and more KFC restaurants were built in Jakarta
and other major cities in Indonesia. As of the end of 1996 the
company operates 148 KFC restaurant in 30 major cities in
Indonesia. The company’s KFC core products: the Colonel’s
Original Recipe Chicken and Hot & Crispy Chicken, are con-
sistently rated as the best tasting chicken in various Indonesian
consumer surveys, both are very well accepted in Indonesia, where chicken consumption rate is signiÞcantly higher than any
other types of meat products. The acceptance of the KFC core
products are further enhanced as the company also offers local
menu favorites in its KFC restaurants: rice (Indonesian staple
food), perkedel (potato croquette), lumpia (egg roll), as well as
Indonesian Soup to supplement the core products. To obtain
feedback on the company market performance, an independent
research company was engaged since 1998 to conduct quarter-
ly Brand Image Tracking Study (BITS) to track down consumers
perception and brand image of leading players in the fast food
industry.
2007 2008 2009 Total Assets 629,491 784,759 1,041,409
Current Assets 240,825 314,520 493,310
of which
Cash and cash equivalents 174,836 211,495 211,495
Receivable from affiliates 6,239 6,344 374,432
Inventories 54,235 85,895 95,222
Non-Current Assets 388,666 470,239 548,099
of which
Fixed Assets-Net 140,050 166,690 187,611
Other Assets 19,176 35,683 41,610 Liabilities 252,133 302,214 402,303
Current Liabilities 187,833 238,320 320,778
of which
Bank loans n.a 4,515 3,601
Trade payables 74,090 108,612 133,682
Taxes payable 39,070 36,892 58,407
Non-Current Liabilities 64,300 63,893 81,526 Shareholders' Equity 377,358 482,545 639,106
Paid-up capital 44,625 44,625 44,625
Paid-up capital
in excess of par value 2,944 3,969 5,222
Retained earnings 329,790 433,951 589,259
Net Sales 1,589,643 2,022,633 2,454,360
Cost of Good Sold 617,102 781,627 986,532
Gross Profit 972,541 1,241,006 1,467,828
Operating Expenses 838,809 1,100,307 1,242,695
Operating Profit (Loss) 133,732 140,699 225,133
Other Income (Expense) 10,429 27,205 22,015
Profit (Loss) before Taxes 144,161 167,904 247,148
Profit (Loss) after Taxes 102,537 125,268 181,997 Per Share Data (Rp)
Earnings (Loss) per Share 230 281 408
Equity per Share 846 1,081 1,432
Dividend per Share 45 57 83
Closing Price 2,450 3,100 5,200 Financial Ratios
PER (x) 10.66 11.04 12.75
PBV (x) 2.90 2.87 3.63
Dividend Payout (%) 19.58 20.31 20.35
Dividend Yield (%) 1.84 1.84 1.60 Current Ratio (x) 1.28 1.32 1.54
Debt to Equity (x) 0.67 0.63 0.63
Leverage Ratio (x) 0.40 0.39 0.39
Gross Profit Margin (x) 0.61 0.61 0.60
Operating Profit Margin (x) 0.08 0.07 0.09
Net Profit Margin (x) 0.06 0.06 0.07
Inventory Turnover (x) 11.38 9.10 10.36
Total Assets Turnover (x) 2.53 2.58 2.36
ROI (%) 16.29 15.96 17.48
ROE (%) 27.17 25.96 28.48

PER = 18.19x ; PBV = 4.39x (June
2010) Financial Year: December 31
Public Accountant: Purwantono, Sarwoko & Sandjaja
(million rupiah)
2010 2009
June June
Shareholders
PT Gelael Pratama 43.84%
PT Megah Eraraharja 35.84%
HSBC Fund Services Clients A/C 500 9.74%
Public 10.58%
Total Assets 1,120,399 860,323
Current Assets 518,284 369,694
Non-Current Assets 602,115 490,629
Liabilities 398,124 311,374
Shareholders' Equity 722,275 548,949
Net Sales 1,388,229 1,084,108
Profit after Taxes 83,169 66,404
ROI (%) 7.42 7.72
ROE (%) 11.51 12.10
118 Indonesian Capital Market Directory 2010

from IDR1.028 trillion to IDR1.276 trillion.
Brief History: The company, founded in 1978 by the Gelael
Fixed Assets-Net Other Assets
78,856 7,102
86,949 8,953
112,205 14,259
Group, is the exclusive Kentucky Fried Chicken (KFC) franchise Liabilities 127,038 149,701 195,366
holder for Indonesia.On October 10, 1979, the company opened its first KFC restaurant on Jalan Melawai, Jakarta. The success of
Current Liabilities
of which
94,829 110,742 148,045
this first KFC restaurant had led the company to dominate the Bank loans n.a n.a n.a
fast food market leader in Indonesia for the past 17 years. More Trade payables 41,525 44,635 61,491
and more KFC restaurants were built in Jakarta and other major Taxes payable 16,771 15,734 28,790
cities in Indonesia. As of the end of 1996 the company operates Non-Current Liabilities 32,208 38,958 47,322
148 KFC restaurant in 30 major cities in Indonesia. The company’s Shareholders' Equity 194,946 228,205 288,209
KFC core products: the Colonel’s Original Recipe Chicken and Paid-up capital 44,625 44,625 44,625
Hot & Crispy Chicken, are consistently rated as the best tasting Paid-up capital chicken in various Indonesian consumer surveys, both are very in excess of par value 1,483 1,841 2,254
well accepted in Indonesia, where chicken consumption rate is Retained earnings 148,838 181,738 241,329
significantly higher than any other types of meat products. The Net Sales 889,423 1,028,393 1,276,416 acceptance of the KFC core products are further enhanced as the Cost of Good Sold 353,017 418,007 491,546 company also offers local menu favorites in its KFC restaurants: Gross Profit 536,406 610,386 784,870 rice (Indonesian staple food), perkedel (potato croquette), lumpia Operating Expenses 488,449 557,707 694,999 (egg roll), as well as Indonesian Soup to supplement the core prod- Operating Profit (Loss) 47,957 52,679 89,872
ucts. To obtain feedback on the company market performance, an Other Income (Expense) 4,261 5,192 6,095
independent research company was engaged since 1998 to con- Profit (Loss) before Taxes 52,218 57,871 95,967
duct quarterly Brand Image Tracking Study (BITS) to track down Profit (Loss) after Taxes 37,316 41,291 68,926
consumers perception and brand image of leading players in the
fast food industry. Year 2000 results consistenly showed that KFC Per Share Data (Rp)
is highest in ‘Top of Mind Awareness’ compared to other leading Earnings (Loss) per Share 84 93 154
brands. Equity per Share 437 511 646
Dividend per Share 18 20 20
Closing Price 1,050 1,200 1,820
Financial Ratios
PER (x) 12.56 12.97 11.78
PBV (x) 2.40 2.35 2.82
Dividend Payout (%) 21.53 21.61 12.95
Dividend Yield (%) 1.71 1.67 1.10
Current Ratio (x) 1.28 1.14 1.07
Debt to Equity (x) 0.65 0.66 0.68
Leverage Ratio (x) 0.39 0.40 0.40
Gross Profit Margin (x) 0.60 0.59 0.61
Operating Profit Margin (x) 0.05 0.05 0.07
Net Profit Margin (x) 0.04 0.04 0.05
Inventory Turnover (x) 12.50 12.14 10.60
Total Assets Turnover (x) 2.76 2.72 2.64
ROI (%) 11.59 10.93 14.25
ROE (%) 19.14 18.09 23.92
Shareholders PT Gelael Pratama 43.77%
PT Megah Eraraharja 35.77%
Cooperative 0.46%
Public 20.00%
PT Fast Food Indonesia Tbk.
Food and Beverages
Head Office Gedung Gelael, 4th Floor Jl. MT. Haryono Kav. 7
Jakarta 12810 Phone (021) 829-8390, 830-9382
Summary of Financial Statement
(million rupiah) 2004 2005 2006
Fax (021) 829-8387, 830-0569 Telex 48725 Gelael IA
Business Manufacturer and Distributor of
Food and Beverages
Company Status PMDN
Financial Performance: The Company booked net profit at IDR68.928 billion in 2006, rising by 66.93% at IDR41.291 billion in 2005. The net sales hike supported the net profit rose by 24.12%
Total Assets 321,984 377,905 483,575
Current Assets 121,330 125,833 158,552
of which
Cash and cash equivalents 85,008 82,698 103,636
Receivable from affiliates 2,376 2,953 3,522
Inventories 28,247 34,436 46,351
Non-Current Assets 200,654 252,072 325,023
of which
PER = 12.17x ; PBV = 2.55x (June 2006)
Financial Year: December 31
Public Accountant: Purwantono, Sarwoko & Sandjaja
84 Indonesian Capital Market Directory 2007

Head OfÞce
Sudirman Plaza, Indofood Tower 27th Floor
Jl. Jend. Sudirman Kav. 76-78, Jakarta 12910
Phone (021) 5795-8822; Fax (021) 5793-5960
www.indofood.co.id Factories - Jl. Ancol I No. 4-5, Ancol Barat, Jakarta 14
Phone (021) 690-7141-45, Fax (021) 690-5- Jl. Kampung Jarakosta, Desa Suka Danau
Liabilities 25,786,846 26,640,979
Shareholders' Equity 10,743,420 8,814,386
Net Sales 18,122,582 18,077,450
Profit after Taxes 1,410,508 799,735
ROI (%)
3.35
1.98
ROE (%) 13.13 9.07
PT Indofood Sukses Makmur Tbk.
Food and Beverages
Summary of Financial Statement
Cibitung, Bekasi 17520, Jawa Barat Phone (021) 890-4169, Fax (021) 890-1187, 890-4184
- Jl. Tambak Aji II No. 8 Ngalian, Semarang 50158, Jawa Tengah
430 435
(Million Rupiah) 2007 2008 2009
Total Assets 29,706,895 39,591,309 40,382,953
Current Assets 11,809,129 14,323,261 12,954,813
of which
Cash and cash equivalents 4,538,051 4,271,208 4,474,830
Trade receivables 2,136,401 2,260,082 1,956,166
Inventories 4,172,388 6,061,219 5,117,484
Non-Current Assets 17,897,766 25,268,048 27,428,140
of which
Phone (024) 866-3411, Fax (024) 866-5020 - Jl. Raya Beji Km. 32, Desa Cangkring Malang
Bangil, Pasuruan, Jawa Timur Phone (0343) 656-177, 656-178,Fax (0343) 656-179
- Jl. Raya Medan, Tanjung Morawa Km. 18,5 Tj. Morawa, Deli Serdang Phone (061) 794-1515, Fax (061) 794-1512
- Jl. Kaharudin Nasution Km. 12, Simpang Tiga Bukit Raya, Pekan Baru, 28284 Phone (0761) 71-883, Fax (0761) 71-338
- Jl. Desa Liang Anggang Km. 32 Bati-Bati, Tanah Laut, Banjarmasin 70852 Kalimantan Selatan Phone (0511) 568-29-30, Fax (0511) 568-46
- Jl. Kima X Km. A-3, Biringkanaya Kawasan Idustri Kima, Ujung Pandang Makassar, Sulawesi Selatan Phone (0411) 510-206-07 Fax (0411) 510-027
Business Food Processing Company Company Status PMDN
Financial Performance: The Company booked recorded
consolidated net sales of Rp37.14 trillion, which declined 4.3%
from Rp38.80 trillion in 2008, mainly due to the decline in CPO and ßour prices. The strength in the operational performance
is reßected in the increase of Core proÞt to Rp1.73 trillion in
2009 from Rp1.45 trillion in 2008.
Brief History: The Company is incorporated as PT Pan-
ganjaya Intikusuma in 1990. In 1994, The name of the Company
is changed to PT Indofood Sukses Makmur, the same year the
Company lists on the Indonesia Stock Exchange (763 million
shares, Rp1,000 par value per share). In 1995, The Company acquires ßour miller Bogasari, beginning the creation of a ver-
tically integrated food company. The Company is a leading
processed food company in Indonesia. Indofood provides to-
tal food solutions through its four strategic business groups: consumer branded products (CBP), Bogasari (ßour producer),
agribusiness, and distribution. Indofood’s strongest legacy today
is the strength of its brands, many of which have been compan-
ions to the people of Indonesia for nearly two decades. These
include a variety of brands of instant noodles (Indomie, Supermi and Sarimi), wheat ßour (Segitiga Biru, Kunci Biru and Cakra
Kembar), cooking oils (Bimoli), margarine (Simas Palmia) and
shortenings (Palmia). The acquisition of Indolakto, one of the
leading processed milk producers (Indomilk) has positioned In-
dofood as the Progressive Total Food Solutions company. Indo- food brands continue to be the market leaders in their speciÞc
segments with a reputation for quality and value for money that
remains unrivalled.
Fixed Assets-Net 8,166,816 9,586,545 10,808,449
Deffered Tax Assets-Net 167,299 229,515 348,599
Investments 20,219 164,864 31,640
Other Assets 900,761 1,673,000 2,044,473 Liabilities 18,794,518 26,432,369 24,886,781
Current Liabilities 12,888,677 16,262,161 11,158,962
of which
Bank loans 5,734,104 7,634,711 5,017,603
Trade payables 1,835,266 2,514,689 1,686,618
Accrued expenses 1,190,093 1,103,395 1,326,468
Non-Current Liabilities 5,905,841 10,170,208 13,727,819
Minority Interests in Subsidiaries 3,721,828 4,587,407 5,340,677 Shareholders' Equity 7,190,549 8,571,533 10,155,495
Paid-up capital 944,419 878,043 878,043
Paid-up capital
in excess of par value 1,182,046 1,497,733 1,497,733
Retained earnings 5,064,084 6,195,757 7,779,719 Net Sales 27,858,304 38,799,279 37,140,830
Cost of Goods Sold 21,232,761 29,822,362 27,018,884
Gross Profit 6,625,543 8,976,917 10,121,946
Operating Expenses 3,749,103 4,635,441 5,117,737
Operating Profit 2,876,440 4,341,476 5,004,209
Other Income (Expenses) (835,031) (1,741,653)
(940,396) Profit before Taxes 2,041,409 2,599,823
4,063,813
Profit after Taxes 980,357 1,034,389 2,075,861 Per Share Data (Rp)
Earnings per Share 104 118 236
Equity per Share 761 976 1,157
Dividend per Share n.a n.a 93
Closing Price 2,575 930 3,550 Financial Ratios
PER (x) 24.81 7.89 15.02
PBV (x) 3.38 0.95 3.07
Dividend Payout (%) n.a n.a 39.34
Dividend Yield (%) n.a n.a 2.62 Current Ratio (x) 0.92 0.88 1.16
Debt to Equity (x) 2.61 3.08 2.45
Leverage Ratio (x) 0.63 0.67 0.62
Gross Profit Margin (x) 0.24 0.23 0.27
Operating Profit Margin (x) 0.10 0.11 0.13
Net Profit Margin (x) 0.04 0.03 0.06
Inventory Turnover (x) 5.09 4.92 5.28
Total Assets Turnover (x) 0.94 0.98 0.92
ROI (%) 3.30 2.61 5.14
ROE (%) 13.63 12.07 20.44
PER = 14.88x ; PBV = 3.39x (June 2010)
Financial Year: December 31
(million rupiah)
2010 2009
June June
Total Assets 42,072,894 40,324,780
Current Assets 14,873,999 14,040,719
Non-Current Assets 27,198,895 26,284,061
Shareholders
CAB Holdings Limited, Seychelles 50.05%
Public 49.95%
120 Indonesian Capital Market Directory 2010
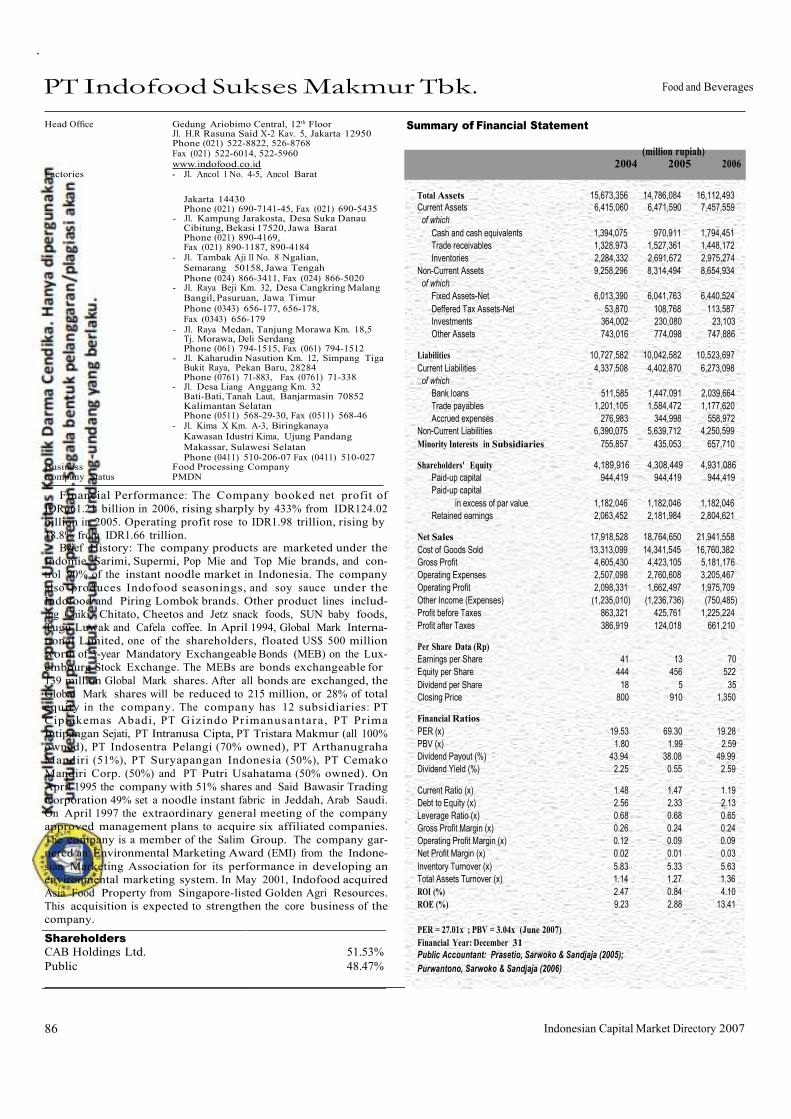
Shareholders CAB Holdings Ltd. 51.53%
Public 48.47%
PT Indofood Sukses Makmur Tbk. Food and Beverages
Head Office Gedung Ariobimo Central, 12th Floor Jl. H.R Rasuna Said X-2 Kav. 5, Jakarta 12950 Phone (021) 522-8822, 526-8768
Fax (021) 522-6014, 522-5960 www.indofood.co.id
Factories - Jl. Ancol I No. 4-5, Ancol Barat
Summary of Financial Statement
(million rupiah)
2004 2005 2006
Jakarta 14430 Phone (021) 690-7141-45, Fax (021) 690-5435
- Jl. Kampung Jarakosta, Desa Suka Danau Cibitung, Bekasi 17520, Jawa Barat Phone (021) 890-4169, Fax (021) 890-1187, 890-4184
- Jl. Tambak Aji II No. 8 Ngalian, Semarang 50158, Jawa Tengah Phone (024) 866-3411, Fax (024) 866-5020
- Jl. Raya Beji Km. 32, Desa Cangkring Malang
Bangil, Pasuruan, Jawa Timur Phone (0343) 656-177, 656-178, Fax (0343) 656-179
- Jl. Raya Medan, Tanjung Morawa Km. 18,5 Tj. Morawa, Deli Serdang Phone (061) 794-1515, Fax (061) 794-1512
- Jl. Kaharudin Nasution Km. 12, Simpang Tiga Bukit Raya, Pekan Baru, 28284 Phone (0761) 71-883, Fax (0761) 71-338
- Jl. Desa Liang Anggang Km. 32 Bati-Bati, Tanah Laut, Banjarmasin 70852 Kalimantan Selatan Phone (0511) 568-29-30, Fax (0511) 568-46
- Jl. Kima X Km. A-3, Biringkanaya Kawasan Idustri Kima, Ujung Pandang Makassar, Sulawesi Selatan Phone (0411) 510-206-07 Fax (0411) 510-027
Business Food Processing Company Company Status PMDN
Financial Performance: The Company booked net profit of
IDR661.21 billion in 2006, rising sharply by 433% from IDR124.02
billion in 2005. Operating profit rose to IDR1.98 trillion, rising by
18.8% from IDR1.66 trillion.
Brief History: The company products are marketed under the
Indomie, Sarimi, Supermi, Pop Mie and Top Mie brands, and con-
trol 90% of the instant noodle market in Indonesia. The company
also produces Indofood seasonings, and soy sauce under the
Indofood and Piring Lombok brands. Other product lines includ-
ing Chiki, Chitato, Cheetos and Jetz snack foods, SUN baby foods,
Tugu Luwak and Cafela coffee. In April 1994, Global Mark Interna-
tional Limited, one of the shareholders, floated US$ 500 million
worth of 3-year Mandatory Exchangeable Bonds (MEB) on the Lux-
embourg Stock Exchange. The MEBs are bonds exchangeable for
139 million Global Mark shares. After all bonds are exchanged, the
Global Mark shares will be reduced to 215 million, or 28% of total
equity in the company. The company has 12 subsidiaries: PT
Ciptakemas Abadi, PT Gizindo Primanusantara, PT Prima
Intipangan Sejati, PT Intranusa Cipta, PT Tristara Makmur (all 100%
owned), PT Indosentra Pelangi (70% owned), PT Arthanugraha
Mandiri (51%), PT Suryapangan Indonesia (50%), PT Cemako
Mandiri Corp. (50%) and PT Putri Usahatama (50% owned). On
April 1995 the company with 51% shares and Said Bawasir Trading
Corporation 49% set a noodle instant fabric in Jeddah, Arab Saudi.
On April 1997 the extraordinary general meeting of the company
approved management plans to acquire six affiliated companies.
The company is a member of the Salim Group. The company gar-
nered an Environmental Marketing Award (EMI) from the Indone-
sian Marketing Association for its performance in developing an
environmental marketing system. In May 2001, Indofood acquired
Asia Food Property from Singapore-listed Golden Agri Resources.
This acquisition is expected to strengthen the core business of the
company.
Total Assets 15,673,356 14,786,084 16,112,493
Current Assets 6,415,060 6,471,590 7,457,559
of which
Cash and cash equivalents 1,394,075 970,911 1,794,451
Trade receivables 1,328,973 1,527,361 1,448,172
Inventories 2,284,332 2,691,672 2,975,274
Non-Current Assets 9,258,296 8,314,494 8,654,934
of which
Fixed Assets-Net 6,013,390 6,041,763 6,440,524
Deffered Tax Assets-Net 53,870 108,768 113,587
Investments 364,002 230,080 23,103
Other Assets 743,016 774,098 747,886
Liabilities 10,727,582 10,042,582 10,523,697
Current Liabilities 4,337,508 4,402,870 6,273,098
of which
Bank loans 511,585 1,447,091 2,039,664
Trade payables 1,201,105 1,584,472 1,177,620
Accrued expenses 276,983 344,998 558,972
Non-Current Liabilities 6,390,075 5,639,712 4,250,599
Minority Interests in Subsidiaries 755,857 435,053 657,710
Shareholders' Equity 4,189,916 4,308,449 4,931,086
Paid-up capital 944,419 944,419 944,419
Paid-up capital
in excess of par value 1,182,046 1,182,046 1,182,046
Retained earnings 2,063,452 2,181,984 2,804,621
Net Sales 17,918,528 18,764,650 21,941,558
Cost of Goods Sold 13,313,099 14,341,545 16,760,382
Gross Profit 4,605,430 4,423,105 5,181,176
Operating Expenses 2,507,098 2,760,608 3,205,467
Operating Profit 2,098,331 1,662,497 1,975,709
Other Income (Expenses) (1,235,010) (1,236,736) (750,485)
Profit before Taxes 863,321 425,761 1,225,224
Profit after Taxes 386,919 124,018 661,210
Per Share Data (Rp)
Earnings per Share 41 13 70
Equity per Share 444 456 522
Dividend per Share 18 5 35
Closing Price 800 910 1,350
Financial Ratios
PER (x) 19.53 69.30 19.28
PBV (x) 1.80 1.99 2.59
Dividend Payout (%) 43.94 38.08 49.99
Dividend Yield (%) 2.25 0.55 2.59
Current Ratio (x) 1.48 1.47 1.19
Debt to Equity (x) 2.56 2.33 2.13
Leverage Ratio (x) 0.68 0.68 0.65
Gross Profit Margin (x) 0.26 0.24 0.24
Operating Profit Margin (x) 0.12 0.09 0.09
Net Profit Margin (x) 0.02 0.01 0.03
Inventory Turnover (x) 5.83 5.33 5.63
Total Assets Turnover (x) 1.14 1.27 1.36
ROI (%) 2.47 0.84 4.10
ROE (%) 9.23 2.88 13.41
PER = 27.01x ; PBV = 3.04x (June 2007)
Financial Year: December 31
Public Accountant: Prasetio, Sarwoko & Sandjaja (2005);
Purwantono, Sarwoko & Sandjaja (2006)
86 Indonesian Capital Market Directory 2007

Total Assets 860,509 786,009
Current Assets 425,874 341,490
Non-Current Assets 434,635 444,519
Liabilities 611,370 593,408
Shareholders' Equity 249,049 192,524
PT Multi Bintang Indonesia Tbk.
Food and Beverages
Head OfÞce Talavera OfÞce Park 20th Floor
Jl. Let. Jend. TB. Simatupang Kav. 22-26
Jakarta 12430
Summary of Financial Statement
(Million Rupiah)
Phone (021) 7592-46117 Fax (021) 7592-4617
Factories - Jl. Raya Mojosari-Pacet Km. 50
Sampang Agung, Jawa Timur
- Jl. Daan Mogot Km. 19 PO Bag 3264
Jakarta 15122
Phone (021) 619-0108 (Hunting)
545-0750
Fax (021) 619-4835, 619-0190
Telex 43426 JAKBIR IA
Business Beverages
Company Status PMA
Financial Performance: The Company booked net income
amounted IDR340 billion in 2009, higher than last year income
worth IDR222 billion.
Brief History: The company began its operation in 1931
under the name of NV Nederlandsch Indische Bierbrouwerijen.
Since 1936, the company has been under a Dutch company,
Heineken International Beheer BV. The main products of the
company are beer and stout, marketed under the brands of
Bir Bintang and Guinness. Bir Bintang controls over 60% share
of the beer market. The company has technical assistance co-
operation with Heineken Technische Beheer and Guinness
Overseas Ltd. After selling the softdrink plant in Medan in April
1994, the company now run breweries in Mojosari, East Java
and Tangerang, West Java. At the end of 1994 the company’s head ofÞce was relocated to the Tangerang brewery. The com-
pany is relocating its brewery in Ngagel, Surabaya to Sampanga-
gung, Mojokerto to increase production capacity from 300.000
to 800.000 hecto liters. This total of 60 million liters per annum
will cost around Rp. 150 billion. On October 13, 1997, the
company started to export beer to Japan and North Australia.
2007 2008 2009
Total Assets 621,835 941,389 993,465
Current Assets 228,688 524,813 561,482
of which
Cash and cash equivalents 44,207 276,849 337,162
Trade receivables 110,490 103,515 91,685
Inventories 64,747 103,212 110,497
Non-Current Assets 393,147 416,576 431,983
of which
Fixed Assets-Net 362,811 403,172 420,864
Other Assets 4,637 4,889 4,615 Liabilities 424,028 597,123 888,122
Current Liabilities 386,816 561,144 852,194
of which
Trade payables 43,490 49,590 49,884
Accrued expenses 69,306 93,250 94,386
Taxes payable 110,511 171,258 191,544
Non-Current Liabilities 37,212 35,979 35,928
Minority Interests in Subsidiaries 84 88 132 Shareholders' Equity 197,723 344,178 105,211
Paid-up capital 21,070 21,070 21,070
Paid up capital
in excess of par value 1,802 1,802 1,802
Retained earnings 174,851 321,306 82,339 Net Sales 978,600 1,325,661 1,616,264
Cost of Goods Sold 536,028 686,556 766,918
Gross Profit 442,572 639,105 849,346
Operating Expenses 309,419 352,819 335,962
Operating Profit 133,153 286,286 513,384
Other Income (Expenses) (2,002) 27,690
(40,893) Profit before Taxes 131,151 313,976
472,491
Profit after Taxes 84,385 222,307 340,458 Per Share Data (Rp)
Earnings per Share 4,005 10,551 16,158
Equity per Share 9,384 16,335 4,993
Dividend per Share 3,600 15,000 3,650
Closing Price 55,000 49,500 177,000 Financial Ratios
PER (x) 13.73 4.69 10.95
PBV (x) 5.86 3.03 35.45
Dividend Payout (%) 89.89 142.17 22.59
Dividend Yield (%) 6.55 30.30 2.06 Current Ratio (x) 0.59 0.94 0.66
Debt to Equity (x) 2.14 1.73 8.44
Gross Profit Margin (x) 0.45 0.48 0.53
Net Profit Margin (x) 0.09 0.17 0.21
Inventory Turnover (x) 8.28 6.65 6.94
Total Assets Turnover (x) 1.57 1.41 1.63
ROI (%) 13.57 23.61 34.27
ROE (%) 42.68 64.59 323.59
PER = 9.16x ; PBV = 14.38x (June
2010) Financial Year: December 31
Public Accountant: Siddharta Siddharta & Widjaja (2008); Siddharta & Widjaja (2009)
(million rupiah)
2010 2009
June June
Shareholders
Asia Pacific Breweries Limited 75.00%
Hollandsch Administratiekantoor B.V. 7.00%
Public 18.00%
Net Sales 868,794 755,595
Profit after Taxes 220,743 164,396
ROI (%) 25.65 20.92
ROE (%) 88.63 85.39

124 Indonesian Capital Market Directory 2010

- Jl. Daan Mogot Km. 19
PO Bag 3264
Jakarta 15122 Phone (021) 619-0108 (
545-0750 (Hunting)
Fax (021) 619-4835
of which
Cash and cash equivalents 75,485 10,514 4,759
Trade receivables 95,658 113,431 99,757
Hunting) Inventories 72,001 71,057 76,459
Non-Current Assets 284,870 361,439 411,791
of which Fixed Assets-Net 277,696 340,460 376,774
Telex 43426 JAKBIR IA Other Assets 7,174 5,428 4,789 Beverages
Beheer B.V 75.94%
Hollandsch Administratiekantoor B.V. 7.43%
Public 16.63%
PT Multi Bintang Indonesia Tbk. Food and Beverages
Head Office
Ratu Plaza Building 21st Floor
Jl. Jend. Sudirman Kav. 9
Summary of Financial Statement
Jakarta 10270 (million rupiah)
Phone (021) 720-7511
Fax (021) 720-7864 2004 2005 2006
Factories - Jl. Raya Mojosari-Pacet Km. 50 Total Assets 553,081 575,385 610,437
Sampang Agung, Jawa Timur Current Assets 268,211 213,946 198,646
Business
Company Status PMA
Financial Performance: The Company booked net profit of
IDR73.581 billion in 2006, down by 15.44% from IDR87.014 billion
in 2005. The net profit decrease was due to decline in other net
expenses of IDR20.047 billion versus other net revenues of
IDR1.773 billion.
Brief History: The company began its operation in 1931 under
the name of NV Nederlandsch Indische Bierbrouwerijen. Since
1936, the company has been under a Dutch company, Heineken
International Beheer BV. The main products of the company are
beer and stout, marketed under the brands of Bir Bintang and
Guinness. Bir Bintang controls over 60% share of the beer market.
The company has technical assistance cooperation with Heineken
Technische Beheer and Guinness Overseas Ltd. After selling the
softdrink plant in Medan in April 1994, the company now run
breweries in Mojosari, East Java and Tangerang, West Java. At the
end of 1994 the company’s head office was relocated to the
Tangerang brewery. The company is relocating its brewery in
Ngagel, Surabaya to Sampangagung, Mojokerto to increase pro-
duction capacity from 300.000 to 800.000 hecto liters. This total of
60 million liters per annum will cost around Rp. 150 billion. On
October 13, 1997, the company started to export beer to Japan and
North Australia.
Shareholders
Heineken International
Liabilities 303,532 347,434 411,907
Current Liabilities 272,933 314,409 375,933
of which
Trade payables 46,637 56,931 43,558
Accrued expenses 22,276 40,658 48,360
Taxes payable 65,631 74,662 92,285
Non-Current Liabilities 30,599 33,025 35,974
Minority Interests in Subsidiaries 14 39 69 Shareholders' Equity 249,535 227,912 198,461
Paid-up capital 21,070 21,070 21,070
Paid up capital
in excess of par value 1,802 1,802 1,802
Retained earnings 226,663 205,040 175,589 Net Sales 710,911 852,613 891,001
Cost of Goods Sold 402,109 477,940 466,684
Gross Profit 308,802 374,673 424,317
Operating Expenses 203,828 247,857 293,209
Operating Profit 104,974 126,816 131,108
Other Income (Expenses) 25,345 1,773 (20,047)
Profit before Taxes 130,319 128,589 111,061
Profit after Taxes 87,313 87,014 73,581 Per Share Data (Rp)
Earnings per Share 4,144 4,130 3,492
Equity per Share 11,843 10,817 9,419
Dividend per Share 3,000 3,165 2,640
Closing Price 42,500 50,000 55,000 Financial Ratios
PER (x) 10.26 12.11 15.75
PBV (x) 3.59 4.62 5.84
Dividend Payout (%) 72.39 76.64 75.60
Dividend Yield (%) 7.06 6.33 4.80 Current Ratio (x) 0.98 0.68 0.53
Debt to Equity (x) 1.22 1.52 2.08
Gross Profit Margin (x) 0.43 0.44 0.48
Net Profit Margin (x) 0.12 0.10 0.08
Inventory Turnover (x) 5.58 6.73 6.10
Total Assets Turnover (x) 1.29 1.48 1.46
ROI (%) 15.79 15.12 12.05
ROE (%) 34.99 38.18 37.08
PER = 14.14x ; PBV = 4.95x (June 2007)
Financial Year: December 31
Public Accountant: Siddharta Siddharta & Widjaja
90 Indonesian Capital Market Directory 2007

Current Assets 1,998,030 1,634,348
Non-Current Assets 1,621,169 1,463,651 Shareholders
Liabilities 1,775,469 1,653,614
PT Unita Branindo 32.93% Shareholders' Equity 1,793,963 1,409,348
Koperasi Karyawan PT Mayora Indah Group 0.11% Net Sales 3,312,862 2,401,181
Profit after Taxes 211,459 163,404
Koperasi TNI Angkatan Darat 0.03%
ROI (%) 5.84 5.27
Public 66.93% ROE (%) 11.79 11.59
PT Mayora Indah Tbk. Food and Beverages
Head OfÞce Mayora Building
Jl. Tomang Raya 21-23
Jakarta 11440
Summary of Financial Statement
(Million Rupiah)
Phone (021) 565-5320-22 Fax (021) 565-5323
Telex 45864 BISCO IA
E-mail: [email protected]
Factories - Jl. Merdeka Km.7,8, Tangerang
- Jl. Daan Mogot Km. 18, Jakarta Barat
Business Confectionery
Company Status PMDN
Financial Performance: The Company booked net proÞt
at IDR372 billion in 2009, soaring from IDR196 billion booked
in 2008. Brief History: Since Þrst established in 1977, PT Mayora
Indah Tbk has been one of Indonesia’s important food indus-
tries. As a result of the country’s growth in economy and the
shift of social consumptive pattern towards more practical
products, PT Mayora boasts a rapid growth over the years.
Today, PT Mayora Indah Tbk is divided into 6 business
divisions:
1. Biscuit: Roma, Better, Slai O Lai, and Danisa
2. Candy: Kopiko, Kis, Tamarin, and Plonk
3. Wafer: Beng Beng, Astor, and Roma
4. Chocolate: Choki Choki, and Danisa
5. Health Food: Energen
6. Coffee: Torabika
To meet the ever increasing market demands, PT May-
ora Indah Tbk went public through Initial Public Offering (IPO)
in 1990. A successful move that is evident in the materialization
of factories in Tangerang, Bekasi and Surabaya, which employ
5,300workers.
Supported with strong and wide distribution networks,
products of PT Mayora Indah Tbk are available throughout In-
donesia and some overseas countries such as Malaysia, Thai-
land, Philippines, Vietnam, Singapore, Hong Kong, Saudi Arabia,
Australia, Africa, America and Italy.
2007 2008 2009 Total Assets 1,893,175 2,922,998 3,246,498
Current Assets 1,043,843 1,684,853 1,750,424
of which
Cash and cash equivalents 120,002 316,331 321,583
Trade receivables 577,075 737,412 857,566
Inventories 266,716 534,329 458,603
Non-Current Assets 849,333 1,238,146 1,496,074
of which
Fixed Assets-Net 774,390 1,030,725 1,282,771
Deffered Tax Assets 8,123 4,995 5,106 Liabilities 785,034 1,646,934 1,623,443
Current Liabilities 555,773 769,800 764,230
of which
Trade payables 200,882 448,021 356,908
Current maturities
of long-term debt 269,650 60,000 50,000
Non-Current Liabilities 229,261 877,134 859,213
Minority Interests in Subsidiaries 25,596 30,955 41,300 Shareholders' Equity 1,081,795 1,245,109 1,581,755
Paid-up capital 383,292 383,292 383,292
Paid-up capital in excess of par value 64,212 64,212 64,212
Retained earnings 634,291 797,605 1,134,251 Net Sales 2,828,440 3,907,674 4,777,175
Cost of Goods Sold 2,199,880 3,153,751 3,643,390
Gross Profit 628,560 753,923 1,133,786
Operating Expenses 389,846 408,503 520,598 Operating Profit 238,713 345,420 613,187
Other Income (Expenses) (28,885) (71,351) (109,254)
Profit before Taxes 209,828 274,070
503,934
Profit after Taxes 141,589 196,230 372,158 Per Share Data (Rp)
Earnings per Share 185 256 485
Equity per Share 1,411 1,624 2,063
Dividend per Share 40 50 n.a
Closing Price 1,750 1,140 4,500 Financial Ratios
PER (x) 9.47 4.45 9.27
PBV (x) 1.24 0.70 2.18
Dividend Payout (%) 0.22 0.20 n.a
Dividend Yield (%) 0.02 0.04 n.a Current Ratio (x) 1.88 2.19 2.29
Debt to Equity (x) 0.73 1.32 1.03
Leverage Ratio (x) 0.41 0.56 0.50
Gross Profit Margin (x) 0.22 0.19 0.24
Operating Profit Margin (x) 0.08 0.09 0.13
Net Profit Margin (x) 0.05 0.05 0.08
Inventory Turnover (x) 8.25 5.90 7.94
Total Assets Turnover (x) 1.49 1.34 1.47
ROI (%) 7.48 6.71 11.46
ROE (%) 13.09 15.76 23.53
PER =13.40x ; PBV = 2.97x (June 2010)
Financial Year: December 31
Public Accountant: Mulyamin Sensi Suryanto
(million rupiah)
2010 2009
June June
Total Assets 3,619,199 3,097,999
Pusat Pendidikan Perbekalan Dan Angkutan Primer
122 Indonesian Capital Market Directory 2010

PT Mayora Indah Tbk.
Head Office Gedung Mayora
Jl. Tomang Raya 21-23 Jakarta 11440
Phone (021) 565-5320, 565-5322 Fax (021) 565-5336, 565-5323
Summary of Financial Statement
Food and Beverages
(million rupiah) 2004 2005 2006
Telex 45864 BISCO IA
E-mail: [email protected]
Factories - Jl. Merdeka Km.7,8, Tangerang
- Jl. Daan Mogot Km. 18,
Jakarta Barat
Business Confectionery
Company Status PMDN
Financial Performance: The Company booked net profit of
IDR93.576 billion in 2006, rising sharply by 104.63% from
IDR45.730 billion in 2005. The significant net profit increase was
partly due to the net sales that climbed up by 15.59% at IDR1.972
trillion from IDR1.706 trillion.
Brief History: Founded in 1977, it took over PT Unita Branindo
in 1990, a wafer and chocolate manufacturer also owned by the
company founder. Ever since the take over, the company has
owned two factories in Tangerang, West Java, on a site of 11.7 Ha
of land. The company has an agreement with Oka AG Ltd. for
chocolate production and with Danish Specialty Food Aps of Den-
mark for the production of Danish Cookies. PT Mayora Indah is a
subsidiary of the Inbisco Group, which has been active in the food
industry since 1948.
Shareholders
PT Unitra Branindo 32.93%
Koperasi PT Mayora Indah Group 0.11%
Public 66.96%
Total Assets 1,280,645 1,459,969 1,553,377
Current Assets 637,641 675,637 796,223
of which
Cash and cash equivalents 61,217 113,158 54,255
Trade receivables 326,797 337,806 448,640
Inventories 184,596 171,712 230,681
Non-Current Assets 643,004 784,332 757,154
of which
Fixed Assets-Net 610,503 732,053 738,125
Deffered Tax Assets 3,757 6,128 8,412 Liabilities 398,172 548,714 562,445
Current Liabilities 124,850 191,029 203,673
of which
Trade payables 107,938 134,613 130,168
Current maturities
of long-term debt n.a 20,000 20,000
Non-Current Liabilities 273,322 357,685 358,772
Minority Interests in Subsidiaries 13,231 16,234 20,567 Shareholders' Equity 869,242 895,021 969,476
Paid-up capital 383,292 383,292 383,292
Paid-up capital in excess of par value 64,212 64,212 64,212
Retained earnings 421,738 447,517 521,972 Net Sales 1,378,127 1,706,184 1,971,513
Cost of Goods Sold 1,035,628 1,329,238 1,464,582
Gross Profit 342,499 376,946 506,931
Operating Expenses 211,867 283,411 336,026
Operating Profit 130,632 93,536 170,905
Other Income (Expenses) (4,939) (25,955)
(29,161) Profit before Taxes 125,694 67,581
141,744
Profit after Taxes 85,107 45,730 93,576 Per Share Data (Rp)
Earnings per Share 111 60 122
Equity per Share 1,134 1,168 1,265
Dividend per Share 25 25 35
Closing Price 1,200 820 1,620 Financial Ratios
PER (x) 10.81 13.75 13.27
PBV (x) 1.06 0.70 1.28
Dividend Payout (%) 0.23 0.42 0.29
Dividend Yield (%) 0.02 0.03 0.02 Current Ratio (x) 5.11 3.54 3.91
Debt to Equity (x) 0.46 0.61 0.58
Leverage Ratio (x) 0.31 0.38 0.36
Gross Profit Margin (x) 0.25 0.22 0.26
Operating Profit Margin (x) 0.09 0.05 0.09
Net Profit Margin (x) 0.06 0.03 0.05
Inventory Turnover (x) 5.61 7.74 6.35
Total Assets Turnover (x) 1.08 1.17 1.27
ROI (%) 6.65 3.13 6.02
ROE (%) 9.79 5.11 9.65
PER = 9.53x ; PBV = 1.47x (June
2007) Financial Year: December 31
Public Accountant: Osman Ramli Satrio & Co. (2005);
Mulyamin Sensi Suryanto (2006)
88 Indonesian Capital Market Directory 2007
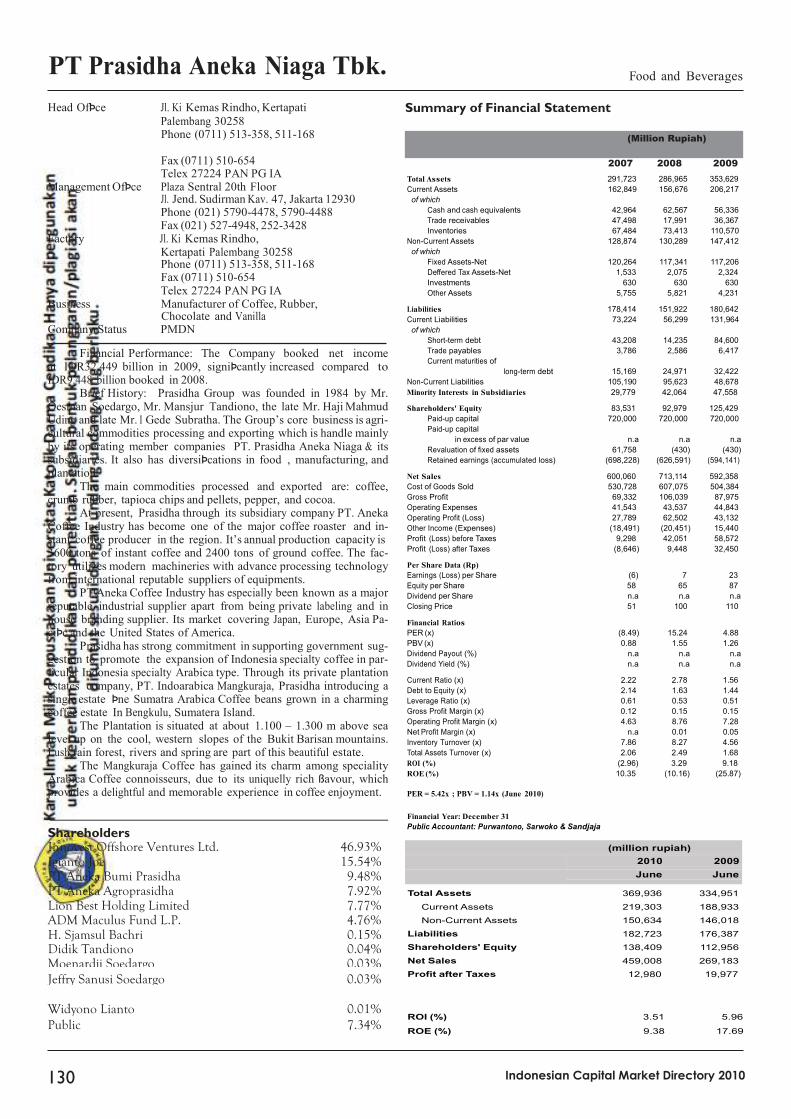
PT Prasidha Aneka Niaga Tbk.
Food and Beverages
Head OfÞce Jl. Ki Kemas Rindho, Kertapati Palembang 30258 Phone (0711) 513-358, 511-168
Summary of Financial Statement
(Million Rupiah)
Fax (0711) 510-654 Telex 27224 PAN PG IA
Management OfÞce Plaza Sentral 20th Floor Jl. Jend. Sudirman Kav. 47, Jakarta 12930 Phone (021) 5790-4478, 5790-4488 Fax (021) 527-4948, 252-3428
Factory Jl. Ki Kemas Rindho, Kertapati Palembang 30258 Phone (0711) 513-358, 511-168 Fax (0711) 510-654 Telex 27224 PAN PG IA
Business Manufacturer of Coffee, Rubber, Chocolate and Vanilla
Company Status PMDN
Financial Performance: The Company booked net income at IDR32.449 billion in 2009, signiÞcantly increased compared to IDR9.448 billion booked in 2008.
Brief History: Prasidha Group was founded in 1984 by Mr. Oesman Soedargo, Mr. Mansjur Tandiono, the late Mr. Haji Mahmud Uding and late Mr. I Gede Subratha. The Group’s core business is agri- cultural commodities processing and exporting which is handle mainly by its operating member companies PT. Prasidha Aneka Niaga & its subsidiaries. It also has diversiÞcations in food , manufacturing, and plantation.
The main commodities processed and exported are: coffee, crumb rubber, tapioca chips and pellets, pepper, and cocoa.
At present, Prasidha through its subsidiary company PT. Aneka Coffee Industry has become one of the major coffee roaster and in- stant coffee producer in the region. It’s annual production capacity is 3600 tons of instant coffee and 2400 tons of ground coffee. The fac- tory utilizes modern machineries with advance processing technology from international reputable suppliers of equipments.
PT Aneka Coffee Industry has especially been known as a major reputable industrial supplier apart from being private labeling and in house branding supplier. Its market covering Japan, Europe, Asia Pa- ciÞc and the United States of America.
Prasidha has strong commitment in supporting government sug- gestion to promote the expansion of Indonesia specialty coffee in par- ticular Indonesia specialty Arabica type. Through its private plantation estates company, PT. Indoarabica Mangkuraja, Prasidha introducing a single estate Þne Sumatra Arabica Coffee beans grown in a charming coffee estate In Bengkulu, Sumatera Island.
The Plantation is situated at about 1.100 – 1.300 m above sea level up on the cool, western slopes of the Bukit Barisan mountains. Lush rain forest, rivers and spring are part of this beautiful estate.
The Mangkuraja Coffee has gained its charm among speciality Arabica Coffee connoisseurs, due to its uniquelly rich ßavour, which provides a delightful and memorable experience in coffee enjoyment.
2007 2008 2009
Total Assets 291,723 286,965 353,629
Current Assets 162,849 156,676 206,217
of which
Cash and cash equivalents 42,964 62,567 56,336
Trade receivables 47,498 17,991 36,367
Inventories 67,484 73,413 110,570
Non-Current Assets 128,874 130,289 147,412
of which
Fixed Assets-Net 120,264 117,341 117,206
Deffered Tax Assets-Net 1,533 2,075 2,324
Investments 630 630 630
Other Assets 5,755 5,821 4,231
Liabilities 178,414 151,922 180,642
Current Liabilities 73,224 56,299 131,964
of which
Short-term debt 43,208 14,235 84,600
Trade payables 3,786 2,586 6,417
Current maturities of
long-term debt 15,169 24,971 32,422
Non-Current Liabilities 105,190 95,623 48,678
Minority Interests in Subsidiaries 29,779 42,064 47,558
Shareholders' Equity 83,531 92,979 125,429
Paid-up capital 720,000 720,000 720,000
Paid-up capital
in excess of par value n.a n.a n.a
Revaluation of fixed assets 61,758 (430) (430)
Retained earnings (accumulated loss) (698,228) (626,591) (594,141)
Net Sales 600,060 713,114 592,358
Cost of Goods Sold 530,728 607,075 504,384
Gross Profit 69,332 106,039 87,975
Operating Expenses 41,543 43,537 44,843
Operating Profit (Loss) 27,789 62,502 43,132
Other Income (Expenses) (18,491) (20,451) 15,440
Profit (Loss) before Taxes 9,298 42,051 58,572
Profit (Loss) after Taxes (8,646) 9,448 32,450
Per Share Data (Rp)
Earnings (Loss) per Share (6) 7 23
Equity per Share 58 65 87
Dividend per Share n.a n.a n.a
Closing Price 51 100 110
Financial Ratios
PER (x) (8.49) 15.24 4.88
PBV (x) 0.88 1.55 1.26
Dividend Payout (%) n.a n.a n.a
Dividend Yield (%) n.a n.a n.a
Current Ratio (x) 2.22 2.78 1.56
Debt to Equity (x) 2.14 1.63 1.44
Leverage Ratio (x) 0.61 0.53 0.51
Gross Profit Margin (x) 0.12 0.15 0.15
Operating Profit Margin (x) 4.63 8.76 7.28
Net Profit Margin (x) n.a 0.01 0.05
Inventory Turnover (x) 7.86 8.27 4.56
Total Assets Turnover (x) 2.06 2.49 1.68
ROI (%) (2.96) 3.29 9.18
ROE (%) 10.35 (10.16) (25.87)
PER = 5.42x ; PBV = 1.14x (June 2010)
Financial Year: December 31
Public Accountant: Purwantono, Sarwoko & Sandjaja
Shareholders
Innovest Offshore Ventures Ltd. 46.93% (million rupiah)
Igianto Joe 15.54% 2010 2009
PT Aneka Bumi Prasidha 9.48% June June
PT Aneka Agroprasidha 7.92% Total Assets 369,936 334,951
Lion Best Holding Limited 7.77% Current Assets 219,303 188,933
ADM Maculus Fund L.P. 4.76% Non-Current Assets 150,634 146,018
H. Sjamsul Bachri 0.15% Liabilities 182,723 176,387
Didik Tandiono 0.04% Shareholders' Equity 138,409 112,956
Moenardji Soedargo 0.03% Net Sales 459,008 269,183
Jeffry Sanusi Soedargo 0.03% Profit after Taxes 12,980 19,977
Widyono Lianto 0.01%
Public 7.34%
ROI (%) 3.51 5.96
ROE (%) 9.38 17.69
130 Indonesian Capital Market Directory 2010

PT Prasidha Aneka Niaga Tbk.
Food and Beverages
Head Office Jl. Ki Kemas Rindho, Kertapati Palembang 30258 Phone (0711) 513-358, 511-168 Fax (0711) 510-654 Telex 27224 PAN PG IA
Summary of Financial Statement
(million rupiah) 2004 2005 2006
Management Office Plaza Sentral 20th Floor Jl. Jend. Sudirman Kav. 47 Jakarta 12930 Phone (021) 5790-4478, 5790-4488 Fax (021) 527-4948, 252-3428
Factory Jl. Ki Kemas Rindho, Kertapati Palembang 30258 Phone (0711) 513-358, 511-168 Fax (0711) 510-654 Telex 27224 PAN PG IA
Business Manufacturer of coffee, rubber, Chocolate and vanilla
Company Status PMA
Financial Performance: The Company booked net profit at
IDR11.846 billion in 2006, falling sharply by 90% from IDR118.433 billion in 2005. The net profit fell mainly because of the company did not book an extraordinary post in 2006 while in 2005 recorded extraordinary post of IDR125.032 billion.
Brief History: The commodities produced by Prasidha are cof- fee, rubber crumbs, tapioca (chips and pellets), chocolate, black pepper and vanilla. In December 1993 the company acquired 7 businesses, purchasing them outright. These companies were: PT Aneka Sumber Kencana, producing coffee, black pepper and va- nilla with a factory located in Bandar Lampung; PT Aneka Bumi Kencana, producing coffee and chocolate with factories in Surabaya and Ujung Pandang; PT Surabaya Pelletting Company, producing tapioca chips and pellets with a factory in Surabaya; PT Tirtha Harapan Bali, producing coffee and vanilla, with a fac- tory in Singaraja; PT Aneka Bumi Pratama producing rubber crumbs, with a factory in Palembang; and PT Hotel Rama Palace Cottage which owns and manages Rama Palace Cottage, a three star hotel with 148 rooms at Kuta Beach, Bali. Approximately 75% of production is exported to Japan, the United States, Europe and Africa. The company also held 65% share of PT Aneka Coffee In- dustry, an integrated roaster and instant coffee manufacturing in East Java. On February 1995 the company with 65% shares started a joint venture with Ueshima Coffe Co. Limited 5% shares, Itochu Corporation 20% shares and 10% shares for PT Citra Buana Tunggal Perkasa established by PT Aneka Coffe Industry. On July 1996 the company was joining forces with Australia’s Burns Philip to establish a joint venture for production of table pepper. The venture will require an investment of about Rp 12 billion. The co- operation which takes form of equal ownership may be contin- ued at the marketing level. The company plans to sell of assets comprising the Ramaplace Cottage hotel in the near future. This sale will take place to support the company’s debt restructuring negotiations with Bank Mandiri. On 8 January 2001, the company and certain subsidiaries received a letter from Bank Mandiri dated 4 January 2001 informing that Bank Mandiri has transferred its loan to Indonesia Banking Restructuring Agency (IBRA) on 21 December 2000 out of its credit facilities given to the company and certain subsidiaries.
Total Assets 179,603 284,336 288,085
Current Assets 85,110 130,883 144,903
of which
Cash and cash equivalents 22,175 38,876 33,778
Trade receivables 20,543 25,113 25,596
Inventories 39,958 64,414 81,142
Non-Current Assets 94,493 153,454 143,182
of which
Fixed Assets-Net 90,651 145,729 135,784
Deffered Tax Assets-Net 1,506 1,973 929
Investments 630 630 630
Other Assets 1,171 3,746 5,000
Liabilities 263,940 185,417 172,747
Current Liabilities 93,480 21,038 66,671
of which
Short-term debt 25,548 492 23,001
Trade payables 2,855 1,818 6,570
Current maturities of
long-term debt 62,794 9,038 23,549
Non-Current Liabilities 170,460 164,380 106,076
Minority Interests in Subsidiaries 14,275 18,590 23,161
Shareholders' Equity (99,133) 80,329 92,176
Paid-up capital 180,000 720,000 720,000
Paid-up capital
in excess of par value 540,000 n.a n.a
Revaluation of fixed assets 729 61,758 61,758
Retained earnings (accumulated loss) (819,862) (701,429) (689,582)
Net Sales 269,990 387,830 519,849
Cost of Goods Sold 219,156 325,958 452,507
Gross Profit 50,834 61,871 67,342
Operating Expenses 29,122 32,529 36,467
Operating Profit (Loss) 21,711 29,342 30,876
Other Income (Expenses) (23,619) (26,884)
(7,325) Profit (Loss) before Taxes (1,908) 2,458
23,550
Profit (Loss) after Taxes 783 118,433 11,847
Per Share Data (Rp)
Earnings (Loss) per Share 2 82 8
Equity per Share (275) 56 64
Dividend per Share n.a n.a n.a
Closing Price 105 80 100
Financial Ratios
PER (x) 48.25 0.97 12.15
PBV (x) (0.38) 1.43 1.56
Dividend Payout (%) n.a n.a n.a
Dividend Yield (%) n.a n.a n.a
Current Ratio (x) 0.91 6.22 2.17
Debt to Equity (x) n.a 2.31 1.87
Leverage Ratio (x) 1.47 0.65 0.60
Gross Profit Margin (x) 0.19 0.16 0.13
Operating Profit Margin (x) 8.04 7.57 5.94
Net Profit Margin (x) 0.00 0.31 0.02
Inventory Turnover (x) 5.48 5.06 5.58
Total Assets Turnover (x) 1.50 1.36 1.80
ROI (%) 0.44 41.65 4.11
ROE (%) 0.79 (147.44) (12.85)
Shareholders Innovest Offshore Ventures Ltd.
57.00%
PER = -5.28x ; PBV = 1.46x (June 2007)
The Adm. Maculus Fund L.P. 18.00% Financial Year: December 31
PT Aneka Bumi Prasidha 9.48% Public Accountant: Purwantono, Sarwoko & Sandjaja
PT Aneka Agroprasidha 7.92% Public 7.60%

94 Indonesian Capital Market Directory 2007

Fax (021) 719-3789, 719-3889 Website: www.sieradproduce.com
Factories - Jl. Raya Parung Km. 19 Desa Jabon Meka
Total Assets 1,294,773 1,384,992 1,641,295
Current Assets 650,885 752,241 859,538
r of which Kec. Parung, Bogor, Jawa Barat
Cash and cash equivalents
Trade receivables
9,052
202,598
46,047
244,167
20,064
341,717
Phone (0251) 611-862 Inventories 312,631 292,499 333,017
Non-Current Assets 643,888 632,751 781,757
of which - Jl. Raya Serang Km. 31, Balaraja Fixed Assets-
Net 485,504 479,497 647,320
Deffered Tax
Assets 74,664 58,144 39,942
Phone (021) 595-3888 Investments
Liabilities
n.a
288,737
n.a
351,703
n.a
462,451
Business Fax (021) 595-0150
Animal Feed Current Liabilities
of which
270,544 329,378 425,313
Company Status PMDN Trade payables
Taxes
150,708
9,607
86,974
10,521
117,711
7,518
PT Sierad Produce Tbk. Animal Feed and Husbandry
Head OfÞce Plaza City View Building 1st Floor
Jl. Kemang Timur No. 22
Jakarta 12510
Summary of Financial Statement
(Million Rupiah)
Phone (021) 719-3888 2007 2008 2009
Fax (0251) 611-079
Tangerang-Banten
Financial Performance: The Company booked net income
amounted IDR37.215 billion in 2009, higher than last year in-
come worth IDR27.254 billion.
Brief History: With four subsidiaries operating in the
same line of business, the company has developed into an
integrated chicken enterprise with operations ranging from
commercial chicken farming to fastfood restaurants. The four
subsidiaries are all majority owned by the company. Sierad
Feedmill, which is 99.99% owned by the company, operates a
feedmill in Balaraja, West Java, Dwipa Mina, 99% owned, pro- duces Þsh ßour for raw material in feedmill operations, Sierad
Biotek, in which the company holds a 98% stake, produces vet-
erinary medicines, and Sierad Pangan, 99% owned, operates a
fast food chain. Sierad Pangan in turn owns several subsidiar-
ies operating fast food chains in Indonesia and other countries,
including Wendi Citarasa in Indonesia and Coyden Food Asia
Pte Ltd in Singapore. The Sierad Group supplies chicken to the
Wendy chain, Kentucky Fried Chicken, California Fried Chick-
en, and Arby. In 1997, the company sold 11,859 tons of live
chickens, 4,313 tons of processed chicken, and 361,040 tons
of chicken feed. The Sierad Group also operates a commer-
cial farm in Cikujang, Sukabumi, producing 20 thousand day old
chickens (DOCs) per annum. Marketing and distribution of Si-
erad Group products are handled by Sierad Corporation, also
a member of the group. On February 22, 1998 the warehouse
owned by PT Sierad Feedmill, a subsidiary of the company, was razed by Þre. The burned warehouse had a measurement of
1,500 square meters and was located on a land of 6 hectares in
Balaraja, Tangerang.
Current maturities
of long term debt 84,947 213,424 289,088
Non-urrent Liabilities 18,192 22,325 37,138
Minority Interests in Subsidiaries 225 225 184 Shareholders' Equity 1,005,811 1,033,064 1,178,661
Paid-up capital 3,184,292 3,184,292 3,184,292
Paid-up capital
in excess of par value 237,474 237,474 1
Retained earnings (accumulated loss) ( 2,415,955) ( 2,388,702) ( 2,005,632)
Net Sales 1,632,454 2,331,686 3,242,551
Cost of Goods Sold 1,473,864 2,115,924 3,011,766
Gross Profit 158,590 215,762 230,785
Operating Expenses 109,673 141,309 158,102
Operating Profit 48,917 74,453 72,683
Other Income (Expenses) ( 2,086) ( 30,394) (
11,434) Profit (Loss) before Taxes 46,831 44,059
61,249
Profit (Loss) after Taxes 21,196 27,254 37,215 Per Share Data (Rp)
Earnings (Loss) per Share 2 3 4
Equity per Share 107 110 126
Dividend per Share n.a n.a n.a
Closing Price 67 50 50 Financial Ratios
PER (x) 29.60 17.18 12.58
PBV (x) 0.62 0.45 0.40
Dividend Payout (%) n.a n.a n.a
Dividend Yield (%) n.a n.a n.a Current Ratio (x) 2.41 2.28 2.02
Debt to Equity (x) 0.29 0.34 0.39
Leverage Ratio (x) 0.22 0.25 0.28
Gross Profit Margin (x) 0.10 0.09 0.07
Operating Profit Margin (x) 3.00 3.19 2.24
Net Profit Margin (x) 1.30 1.17 1.15
Inventory Turnover (x) 4.71 7.23 9.04
Total Assets Turnover (x) 1.26 1.68 1.98
ROI (%) 1.64 1.97 2.27
ROE (%) 2.11 2.64 3.16
PER = 13.91x ; PBV = 0.39x (June
2010) Financial Year: December 31
Public Accountant: Aryanto Amir Yusuf & Mawar
(2008); RSM Aryanto, Amir Jusuf, Mawar & Saptoto
(2009)
(million rupiah)
2010
June
2009
June
Total Assets
1,803,099
1,607,715
Current Assets 979,097 849,390
Non-Current Assets 824,002 758,325
Liabilities 609,094 455,039
Shareholders Shareholders' Equity 1,193,806 1,152,629
Jade Field Assets Limited 15.56% Net Sales 1,703,012 1,529,119
Harvest Agents Limited 14.33% Profit after Taxes 15,145 11,182
Kingdom Industrial Limited 11.34% ROI (%) 173.94 180.03
Public 58.77% ROE (%) 279.60 336.04

38
Indonesian Capital Market Directory 2010

Factory
Jl. Raya Parung Km. 19
Desa Jabon Mekar
Total Assets
Current Assets
of which
1,254,009
450,655
1,157,773
393,050
1,113,796
436,225
Kec. Parung, Bogor, Jawa Barat Cash and cash equivalents 12,823 8,082 16,679
Phone (0251) 611-862 Trade receivables 157,542 164,845 169,482
Fax (0251) 611-079 Inventories 178,808 102,913 150,153
Business
Integrated poultry, fast food and Non-Current Assets 803,354 764,723 677,571
Restaurant franchising
Fixed Assets-Net
579,419
548,958
447,080
Company Status PMDN Deffered Tax Assets 136,029 132,890 100,296
Financial Performance: The Company booked net profit of Investments n.a n.a n.a
IDR40.953 billion in 2006 versus net loss of IDR122.479 billion in Liabilities 1,201,777 213,911 128,990
2005. The cost of goods sold dropped from IDR1.396 trillion to IDR938.642 billion.
Current Liabilities
of which
173,121 199,383 115,042
Brief History: With four subsidiaries operating in the same line Trade payables 128,937 121,814 81,250
of business, the company has developed into an integrated chicken Taxes payable 13,736 18,837 8,772
enterprise with operations ranging from commercial chicken farm-
of long term debt
411
609
520
ing to fastfood restaurants. The four subsidiaries are all majority Non-urrent Liabilities 1,028,656 14,528 13,948
owned by the company. Sierad Feedmill, which is 99.99% owned Minority Interests in Subsidiaries 202 236 226
PT Sierad Produce Tbk.
Head Office Plaza City View Building
Jl. Kemang Timur No. 22 Jakarta 12510
Phone (021) 719-3888
Fax (021) 719-3889, 719-3789
Summary of Financial Statement
Food and Beverages
(million rupiah) 2004 2005 2006
Current maturities
by the company, operates a feedmill in Balaraja, West Java, Dwipa
Mina, 99% owned, produces fish flour for raw material in feedmill
operations, Sierad Biotek, in which the company holds a 98% stake,
produces veterinary medicines, and Sierad Pangan, 99% owned,
operates a fast food chain. Sierad Pangan in turn owns several
subsidiaries operating fast food chains in Indonesia and other
countries, including Wendi Citarasa in Indonesia and Coyden Food
Asia Pte Ltd in Singapore. The Sierad Group supplies chicken to
the Wendy chain, Kentucky Fried Chicken, California Fried
Chicken, and Arby. In 1997, the company sold 11,859 tons of live
chickens, 4,313 tons of processed chicken, and 361,040 tons of
chicken feed. The Sierad Group also operates a commercial farm
in Cikujang, Sukabumi, producing 20 thousand day old chickens
(DOCs) per annum. Marketing and distribution of Sierad Group
products are handled by Sierad Corporation, also a member of
the group. On February 22, 1998 the warehouse owned by PT
Sierad Feedmill, a subsidiary of the company, was razed by fire.
The burned warehouse had a measurement of 1,500 square meters
and was located on a land of 6 hectares in Balaraja, Tangerang.
Shareholders
PT Sietek Nusantara Finance 3.14% Public 96.86%
Shareholders' Equity 52,209 943,626 984,580
Paid-up capital 2,317,559 3,184,292 3,184,292
Paid-up capital
in excess of par value 90,130 237,474 237,474
Retained earnings (accumulated loss) ( 2,355,480) ( 2,478,140) ( 2,437,186)
Net Sales 1,353,621 1,425,223 1,111,242
Cost of Goods Sold 1,303,750 1,396,412 938,642
Gross Profit 49,871 28,811 172,600
Operating Expenses 118,930 113,675 104,342
Operating Profit ( 69,058) ( 84,864) 68,258
Other Income (Expenses) ( 117,773) ( 33,756) 1,673
Profit (Loss) before Taxes ( 186,831) ( 118,620) 69,931
Profit (Loss) after Taxes ( 154,346) ( 122,480) 40,954 Per Share Data (Rp)
Earnings (Loss) per Share (21) (13) 4
Equity per Share 7 101 105
Dividend per Share n.a n.a n.a
Closing Price 105 90 50 Financial Ratios
PER (x) ( 4.93) ( 6.88) 11.43
PBV (x) 14.57 0.89 0.48
Dividend Payout (%) n.a n.a n.a
Dividend Yield (%) n.a n.a n.a
Current Ratio (x) 2.60 1.97 3.79
Debt to Equity (x) 23.02 0.23 0.13
Leverage Ratio (x) 0.96 0.18 0.12
Gross Profit Margin (x) 0.04 0.02 0.16
Operating Profit Margin (x) n.a n.a 6.14
Net Profit Margin (x) n.a n.a 3.69
Inventory Turnover (x) 7.29 13.57 6.25
Total Assets Turnover (x) 1.08 1.23 1.00
ROI (%) ( 12.31) ( 10.58) 3.68
ROE (%) ( 295.63) ( 12.98) 4.16
PER = 27.50x ; PBV = 0.78x (June
2007) Financial Year: December 31
Public Accountant: Aryanto Amir Yusuf & Mawar
100 Indonesian Capital Market Directory 2007
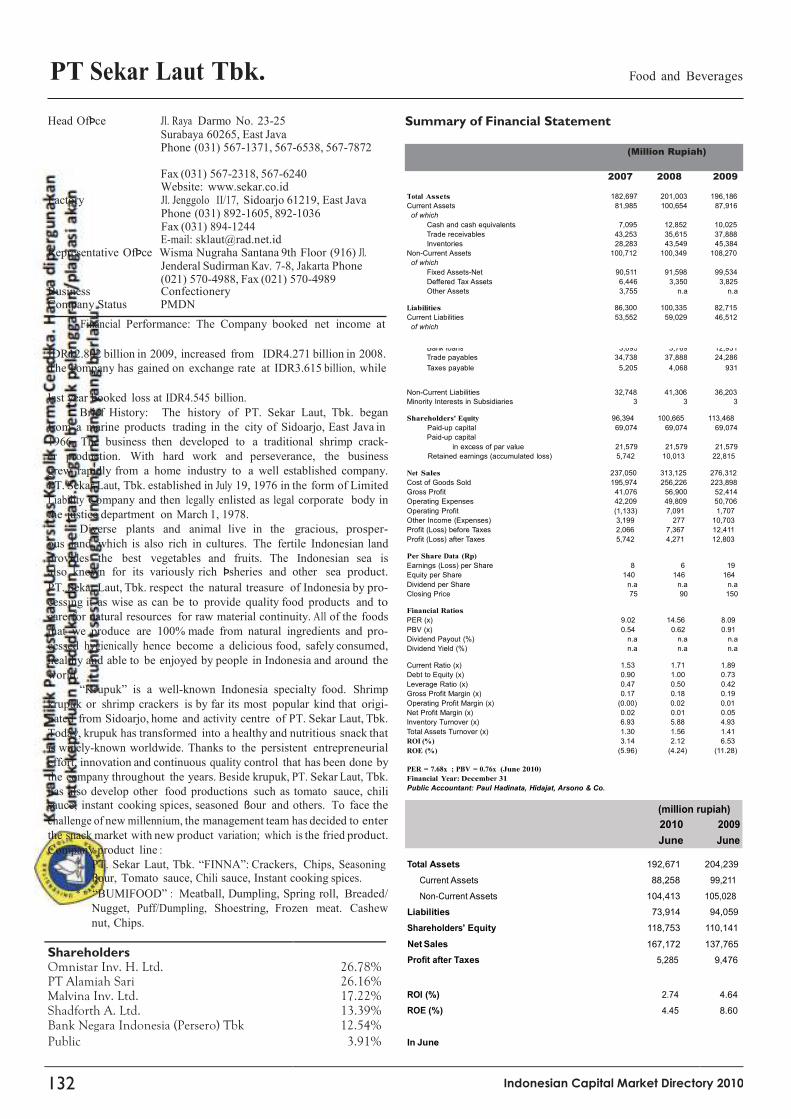
Net Sales 167,172 137,765
Profit after Taxes 5,285 9,476
PT Sekar Laut Tbk.
Food and Beverages
Head OfÞce Jl. Raya Darmo No. 23-25 Surabaya 60265, East Java Phone (031) 567-1371, 567-6538, 567-7872
Summary of Financial Statement
(Million Rupiah)
Fax (031) 567-2318, 567-6240 Website: www.sekar.co.id
Factory Jl. Jenggolo II/17, Sidoarjo 61219, East Java Phone (031) 892-1605, 892-1036 Fax (031) 894-1244 E-mail: [email protected]
Representative OfÞce Wisma Nugraha Santana 9th Floor (916) Jl. Jenderal Sudirman Kav. 7-8, Jakarta Phone (021) 570-4988, Fax (021) 570-4989
Business Confectionery Company Status PMDN
Financial Performance: The Company booked net income at
2007 2008 2009 Total Assets 182,697 201,003 196,186
Current Assets 81,985 100,654 87,916
of which
Cash and cash equivalents 7,095 12,852 10,025
Trade receivables 43,253 35,615 37,888
Inventories 28,283 43,549 45,384
Non-Current Assets 100,712 100,349 108,270
of which
Fixed Assets-Net 90,511 91,598 99,534
Deffered Tax Assets 6,446 3,350 3,825
Other Assets 3,755 n.a n.a Liabilities 86,300 100,335 82,715
Current Liabilities 53,552 59,029 46,512
of which
IDR12.802 billion in 2009, increased from IDR4.271 billion in 2008. Bank loans
Trade payables
3,095
34,738
3,769
37,888
12,931
24,286
The company has gained on exchange rate at IDR3.615 billion, while Taxes payable 5,205 4,068 931
last year booked loss at IDR4.545 billion.
Brief History: The history of PT. Sekar Laut, Tbk. began
from a marine products trading in the city of Sidoarjo, East Java in
1966. The business then developed to a traditional shrimp crack-
er production. With hard work and perseverance, the business
grew rapidly from a home industry to a well established company.
PT. Sekar Laut, Tbk. established in July 19, 1976 in the form of Limited
Liability Company and then legally enlisted as legal corporate body in
the justice department on March 1, 1978.
Diverse plants and animal live in the gracious, prosper-
ous land, which is also rich in cultures. The fertile Indonesian land
provides the best vegetables and fruits. The Indonesian sea is also known for its variously rich Þsheries and other sea product.
PT. Sekar Laut, Tbk. respect the natural treasure of Indonesia by pro-
cessing it as wise as can be to provide quality food products and to
care for natural resources for raw material continuity. All of the foods
that we produce are 100% made from natural ingredients and pro-
cessed hygienically hence become a delicious food, safely consumed,
healthy and able to be enjoyed by people in Indonesia and around the
world.
“Krupuk” is a well-known Indonesia specialty food. Shrimp
krupuk or shrimp crackers is by far its most popular kind that origi-
nated from Sidoarjo, home and activity centre of PT. Sekar Laut, Tbk.
Today, krupuk has transformed into a healthy and nutritious snack that
is widely-known worldwide. Thanks to the persistent entrepreneurial
effort, innovation and continuous quality control that has been done by
the company throughout the years. Beside krupuk, PT. Sekar Laut, Tbk.
has also develop other food productions such as tomato sauce, chili sauce, instant cooking spices, seasoned ßour and others. To face the
challenge of new millennium, the management team has decided to enter
the snack market with new product variation; which is the fried product.
Company product line :
* PT. Sekar Laut, Tbk. “FINNA”: Crackers, Chips, Seasoning ßour, Tomato sauce, Chili sauce, Instant cooking spices.
* “BUMIFOOD” : Meatball, Dumpling, Spring roll, Breaded/
Nugget, Puff/Dumpling, Shoestring, Frozen meat. Cashew
nut, Chips.
Non-Current Liabilities 32,748 41,306 36,203
Minority Interests in Subsidiaries 3 3 3 Shareholders' Equity 96,394 100,665 113,468
Paid-up capital 69,074 69,074 69,074
Paid-up capital
in excess of par value 21,579 21,579 21,579
Retained earnings (accumulated loss) 5,742 10,013 22,815 Net Sales 237,050 313,125 276,312
Cost of Goods Sold 195,974 256,226 223,898
Gross Profit 41,076 56,900 52,414
Operating Expenses 42,209 49,809 50,706
Operating Profit (1,133) 7,091 1,707
Other Income (Expenses) 3,199 277 10,703
Profit (Loss) before Taxes 2,066 7,367 12,411
Profit (Loss) after Taxes 5,742 4,271 12,803 Per Share Data (Rp)
Earnings (Loss) per Share 8 6 19
Equity per Share 140 146 164
Dividend per Share n.a n.a n.a
Closing Price 75 90 150 Financial Ratios
PER (x) 9.02 14.56 8.09
PBV (x) 0.54 0.62 0.91
Dividend Payout (%) n.a n.a n.a
Dividend Yield (%) n.a n.a n.a Current Ratio (x) 1.53 1.71 1.89
Debt to Equity (x) 0.90 1.00 0.73
Leverage Ratio (x) 0.47 0.50 0.42
Gross Profit Margin (x) 0.17 0.18 0.19
Operating Profit Margin (x) (0.00) 0.02 0.01
Net Profit Margin (x) 0.02 0.01 0.05
Inventory Turnover (x) 6.93 5.88 4.93
Total Assets Turnover (x) 1.30 1.56 1.41
ROI (%) 3.14 2.12 6.53
ROE (%) (5.96) (4.24) (11.28)
PER = 7.68x ; PBV = 0.76x (June 2010)
Financial Year: December 31
Public Accountant: Paul Hadinata, Hidajat, Arsono & Co.
(million rupiah)
2010 2009
June June
Total Assets 192,671 204,239
Current Assets 88,258 99,211
Non-Current Assets 104,413 105,028
Liabilities 73,914 94,059
Shareholders' Equity 118,753 110,141
Shareholders
Omnistar Inv. H. Ltd. 26.78% PT Alamiah Sari 26.16% Malvina Inv. Ltd. 17.22% ROI (%) 2.74 4.64
Shadforth A. Ltd. 13.39% ROE (%) 4.45 8.60
Bank Negara Indonesia (Persero) Tbk 12.54% Public 3.91% In June
132
Indonesian Capital Market Directory 2010

Phone (021) 570-4988, Liabilities 490,502 76,805 71,225
Business
Fax (021) 570-4989
Confectionery Current Liabilities
of which
215,428 41,205 36,920
Company Status PMDN Bank loans 31,364 n.a. n.a.
PT Sekar Laut Tbk.
Head Office Jl. Raya Darmo 23-25
Surabaya 60265, East Java Phone (031) 567-1371,
Summary of Financial Statement
Food and Beverages
(million rupiah)
567-6538, 567-7872 2004 2005 2006
Total Assets 112,336 94,436 94,770
Current Assets 53,743 58,401 64,303
Fax (031) 567-2318, 567-6240
Website: www.sekar.co.id
Factory Jl. Jenggolo II/17
Sidoarjo 61219, East Java
Cash and cash equivalents
6,444
6,064
6,764
Phone (031) 892-1605, 892-1036 Trade receivables 26,830 28,060 27,998
Fax (031) 894-1244 Inventories 16,465 19,163 24,916
E-mail: [email protected] Non-Current Assets 58,593 36,035 30,467
Representative Office Wisma Nugraha Santana 9th Floor of which (916) Fixed Assets-Net 34,810 28,580 25,853
Jl. Jenderal Sudirman Kav. 7-8 Deffered Tax Assets 5,975 5,446 3,189
Jakarta Other Assets 2,408 2,009 1,425
Financial Performance: The Company booked net profit of
IDR4.637 billion in 2006, falling by 94.93% from IDR91.549 billion
in 2005. The net profit was down because of significant decrease
in the total revenue from IDR100.043 billion to IDR2.338 billion.
Brief History: The main raw materials for the company’s pro-
duction are shrimp and tapioca which are supplied by a number
of shrimp farming areas in Indonesia, including East, Central and
West Java, South Sulawesi and Kalimantan, while tapioca flour is
purchased from farmers in the vicinity of the factory. The com-
pany has an installed capacity of 7.5 tons per year and markets a
range of krupuk products under the Finna brand name: shrimp
flavored emping crackers made from melinjo nuts, cassava chips
and corn chips. Domestic marketing is performed by wholly-
owned distributor, PT Pangan Lestari. On September 1996 the
company has received a US$ 30 million syndicated loan from a
number of foreign and joint venture banks. The loan will take 2
form. A loan of US$ 27.5 million for increasing working capital
will carry interest rates at 1.75% above SIBOR with a term of 4.5
year and an option for 3 year. The remainder of the loan is for
factory construction and will carry interest rates at 2% above SIBOR
with term of 5 year and grace period of 1 year. The lead arrangers
in this syndication are Dai-Ichi Kangyo Bank and Fuji Bank Inter-
national. The company is a member of the Sekar Group.
Shareholders
Omnistar Inv. H. Ltd. 26.78%
PT Alamiah Sari 26.16%
Malvina Inv. Ltd. 17.22%
Shadforth A. Ltd. 13.39%
Bank Negara Indonesia (Persero) Tbk 12.54%
Harry Susilo 0.58%
Harry Sunogo 0.06%
Loddy Gunadi 0.06%
Harry Lukmito 0.04%
Harry Fong Jaya 0.04%
Public 3.13%
Trade payables 20,740 23,773 24,707
Taxes payable 2,955 5,401 4,261
Non-Current Liabilities 275,074 35,601 34,306
Minority Interests in Subsidiaries 355 359 185 Shareholders' Equity (378,521) 17,272 23,544
Paid-up capital 37,800 345,370 345,370
Paid-up capital
in excess of par value 3,000 3,000 3,000
Retained earnings (accumulated loss) (419,321) (331,098) (324,826) Net Sales 137,754 167,282 193,928
Cost of Goods Sold 113,735 137,473 154,849
Gross Profit 24,019 29,809 39,079
Operating Expenses 31,556 37,937 36,671
Operating Profit (7,537) (8,128) 2,409
Other Income (Expenses) (36,395) 100,043 2,338
Profit (Loss) before Taxes (43,931) 91,915 4,747
Profit (Loss) after Taxes (42,607) 91,549 4,637 Per Share Data (Rp)
Earnings (Loss) per Share (564) 133 7
Equity per Share (5,007) 25 34
Dividend per Share n.a n.a n.a
Closing Price 450 400 285 Financial Ratios
PER (x) (0.80) 3.02 42.45
PBV (x) (0.09) 16.00 8.36
Dividend Payout (%) n.a n.a n.a
Dividend Yield (%) n.a n.a n.a Current Ratio (x) 0.25 1.42 1.74
Debt to Equity (x) n.a 4.45 3.03
Leverage Ratio (x) 4.37 0.81 0.75
Gross Profit Margin (x) 0.17 0.18 0.20
Operating Profit Margin (x) n.a n.a 0.01
Net Profit Margin (x) (0.31) 0.55 0.02
Inventory Turnover (x) 6.91 7.17 6.21
Total Assets Turnover (x) 1.23 1.77 2.05
ROI (%) (37.93) 96.94 4.89
ROE (%) (11.26) (530.05) (19.70)
PER = 18.30x ; PBV = 2.93x (June 2007)
Financial Year: December 31
Public Accountant: Santoso & Co.
96 Indonesian Capital Market Directory 2007

Total Assets 8,063,169 10,025,916 10,210,595
Current Assets
of which
3,766,818 4,709,462 4,351,305
Current Assets 4,709,375 5,095,705
Non-Current Assets 5,975,785 5,474,996
abilities 5,370,221 5,767,486
hareholders' Equity 5,311,299 4,799,190
et Sales 8,316,910 6,897,659
ofit after Taxes 523,711 208,887
PT Sinar Mas Agro Resources And Technology (SMART) Tbk. Food and Beverages
Head OfÞce Plaza BII Menara II 30th Floor
Jl. MH. Thamrin Kav. 22 No. 51
Jakarta 10350
Summary of Financial Statement
(Million Rupiah)
Phone (021) 318-1388 (Hunting) Fax (021) 318-1389
E-mail: [email protected]
http://www.smart-tbk.com
Factory Jl. Rungkut Industri No. 20
Surabaya, Jawa Timur
Phone (031) 843-9861
Fax (031) 843-8476
Telex 33139, 33119 MURO IA
Business Cook Oil and Margarine
Company Status PMDN
Financial Performance: Net income tumbled down to IDR
748 billion in 2009 from IDR1.046 trillion booked in 2008. Net
revenue down to IDR14.201 trillion from IDR16.101 trillion.
Brief History: PT Smart Tbk is one of the largest, pub-
licly-listed, integrated palm-based consumer companies in
Indonesia. SMART primary activities are cultivating and har-
vesting of palm trees, processing of fresh fruit bunches into crude palm oil and palm kernel oil, and reÞning CPO into value-
added products such as cooking oil, margarine and shortening.
Founded by Sinar Mas Group in 1962, SMART cur-
rently has palm plantation with total coverage area
of about 110,000 hectares. SMART also operates 12 CPO mills, 2 kernel crushing plants and 2 reÞneries.
Besides bulk and industrial oil, SMART’s reÞned prod-
ucts also marketed under several brands such as Filma and
Kunci Mas. Today, those brands have been recognized for their high quality, presently command signiÞcant mar-
ket share and their respective segmentation in Indonesia.
SMART is a subsidiary of Golden Agri-Resources Limited
(GAR), one of the largest oil palm-based private company in the world which is listed in Singapore. This relationship beneÞts
SMART with its economic of scale in research and develop-
ment, sourcing of raw material, and access to a wide domestic
and international marketing network.
2007 2008 2009
Cash and cash equivalents 329,623 480,277 497,577
Trade receivables 909,693 820,389 1,065,315
Inventories 1,460,037 1,340,574 2,139,125
Non-Current Assets 4,296,351 5,316,454 5,859,290
of which
Fixed Assets-Net 2,005,716 2,862,571 3,389,877
Deffered Tax Assets-Net 1,317 215 1,340
Investments 155,196 19,614 20,426
Other Assets 702,060 900,776 746,134 Liabilities 4,534,913 5,406,234 5,410,943
Current Liabilities 2,189,600 2,734,320 2,754,439
of which
Short-term debt 1,040,502 1,703,090 976,800
Trade payables 696,229 510,466 1,172,646
Current maturities of
long-term debt 43,382 51,698 214,171
Non-Current Liabilities 2,345,313 2,671,915 2,656,503
Minority Interests in Subsidiaries 10 4,477 3,774 Shareholders' Equity 3,528,246 4,615,204 4,795,878
Paid-up capital 574,439 574,439 574,439
Paid-up capital
in excess of par value 1,662,472 1,662,472 1,662,472
Retained earnings (accumulated loss) 1,291,335 2,378,293 2,558,967 Net Sales 8,079,714 16,101,565 14,201,230
Cost of Good Sold 5,854,466 12,338,649 12,484,606
Gross Profit 2,225,248 3,762,916 1,716,625
Operating Expenses 562,006 1,622,405 606,419
Operating Profit 1,663,242 2,140,511 1,110,206
Other Income (Expenses) (150,918) (661,583) (117,484)
Profit (Loss) before Taxes 1,512,324 1,478,928 992,722
Profit (Loss) after Taxes 988,944 1,046,389 748,495 Per Share Data (Rp)
Earnings (Loss) per Share 344 364 261
Equity per Share 1,228 1,607 1,670
Dividend per Share 5 180 75
Closing Price 6,000 1,700 2,550 Financial Ratios
PER (x) 17.43 4.67 9.79
PBV (x) 4.88 1.06 1.53
Dividend Payout (%) 0.01 0.49 0.29
Dividend Yield (%) 0.00 0.11 0.03 Current Ratio (x) 1.72 1.72 1.58
Debt to Equity (x) 1.29 1.17 1.13
Leverage Ratio (x) 0.56 0.54 0.53
Gross Profit Margin (x) 0.28 0.23 0.12
Operating Profit Margin (x) 0.21 0.13 0.08
Net Profit Margin (x) 0.12 0.06 0.05
Inventory Turnover (x) 4.01 9.20 5.84
Total Assets Turnover (x) 1.00 1.61 1.39
ROI (%) 12.26 10.44 7.33
ROE (%) 28.03 22.67 15.61
PER = 11.20x ; PBV = 1.89x (June 2010)
Financial Year: December 31
Public Accountant: Mulyamin Sensi Suryanto
(million rupiah)
2010 2009
June June
Total Assets 10,685,159 10,570,701
Shareholders
PT Purimas Sasmita 95.21%
Public 4.79%
Li
S
N
Pr
ROI (%) 4.90 1.98
ROE (%) 9.86 4.35
136 Indonesian Capital Market Directory 2010

PT SMART Tbk.
Head Office Plaza BII Menara II 30th Floor
Jl. MH. Thamrin Kav. 22 No. 51 Jakarta 10350
Phone (021) 318-1388 (Hunting),
392-5777
Summary of Financial Statement
Food and Beverages
(million rupiah)
2004 2005 2006
Fax (021) 318-1389, 392-5778-81
E-mail: [email protected]
http://www.smart-tbk.com
Factory Jl. Rungkut Industri Raya No. 19
Surabaya
Phone (031) 843-9861 Fax (031) 843-8476
Telex 33139, 33119 MURO IA
Business Cook Oil and Margarine, Estates
Company Status PMDN
Financial Performance: The Company booked net profit of
IDR628.01 billion in 2006, jumping sharply by 106.45% from
IDR304.20 billion in 2005. The operating profit increased 45.21%
at IDR424.97 billion from IDR617.08 billion.
Brief History: The company began its business under the name
of PT Maskapai Perkebunan Sumcama Padang Halaban in 1962.
In 1970, the company was returned to the foreign party and con-
verted its status to PMA. Further in 1985, the status of the com-
pany was converted to PMDN. The company then in 1991 changed
its name to PT Sinar Mas Agro Resources and Technology Corpo-
ration or abbreviated PT SMART Corporation. In 1989, the com-
pany acquired 100% shares of 2 oil palm plantations; PT Maskapai
Perkebunan Leidong West Indonesia and PT Perusahaan
Perkebunan Panigoran. The company then also acquired 100%
shares of PT Maskapai Perkebunan Indorub Sumber Daung, a
1,502 ha tea plantation which located in West Java. In 1991, the
company took over 100% shares of PT Nirmala Agung, 19% shares
of PT Global Agronusa Indonesia, merged with PT Mulyorejo In-
dustrial company, and acquired 25% stake in PT Grahamas
Indojaya, a transportation company. Prior to the public offering
in 1992, the company took over 100% shares of PT Kunci Mas
Wijaya, 49% shares of PT Inti Gerakmaju, and 49% shares of PT
Tapian Nadenggan. The company then acquired 50% shares of PT
Sinar Meadow International Indonesia, and 50% PT Sinar Pure
Foods International. The company signed a joint venture agree-
ment with Goodman Fielder Overseas Holding Pte. Ltd., through
its sub-holding company, PT Smartindo Utama, in early 1995. In
June 1997, SMART acquired 100% shares of 2 new undeveloped
land banks in East Kalimantan, PT Sangatta Andalan Utama and
PT Matrasawit Sarana Sejahtera. The company also engaged in a
joint venture with Super Air from New Zealand in area manur-
ing. In December 1997, the company divested its shares in PT
Intersmart Corporation, a soft drink company. Early in 2002, the
company sold two of its subsidiaries, PT Maskapai Perkebunan
Indorub Sumber Wadung and PT Perkebunan dan Perindustrian
Nirwala Agung to PT Sariwangi Agricultural Agency for US$ 87
million.
Shareholders
PT Purimas Sasmita 72.19% Public 27.81%
Total Assets 3,972,684 4,597,227 5,311,931
Current Assets 1,051,368 1,490,234 1,657,616
of which
Cash and cash equivalents 221,232 383,354 323,764
Trade receivables 195,361 270,217 285,894
Inventories 506,080 636,461 710,275
Non-Current Assets 2,921,316 3,106,993 3,654,315
of which
Fixed Assets-Net 1,098,796 1,335,673 1,642,346
Deffered Tax Assets-Net 16,836 20,670 46,851
Investments 413,136 447,900 339,444
Other Assets 359,820 180,586 428,518 Liabilities 4,321,273 2,668,647 2,734,706
Current Liabilities 725,434 1,030,549 1,089,633
of which
Short-term debt n.a 253,614 232,716
Trade payables 383,205 431,867 439,814
Current maturities of
long-term debt 96,484 172,486 267,650
Non-Current Liabilities 3,595,839 1,638,098 1,645,073
Minority Interests in Subsidiaries 10 10 10 Shareholders' Equity (348,598) 1,928,570 2,577,215
Paid-up capital 297,360 574,439 574,439
Paid-up capital
in excess of par value n.a 1,662,472 1,662,472
Retained earnings (accumulated loss) (645,958) (308,341) 340,304 Net Sales 4,274,569 4,656,674 4,708,250
Cost of Good Sold 3,658,560 3,934,353 3,853,588
Gross Profit 616,009 722,321 854,662
Operating Expenses 332,614 297,351 237,578
Operating Profit 283,395 424,970 617,084
Other Income (Expenses) (348,221) (187,283) 13,674
Profit (Loss) before Taxes (64,826) 237,687 630,758
Profit (Loss) after Taxes (107,960) 304,203 628,005 Per Share Data (Rp)
Earnings (Loss) per Share (73) 106 219
Equity per Share (234) 671 897
Dividend per Share n.a n.a 46
Closing Price 3,100 950 3,650 Financial Ratios
PER (x) (42.69) 8.97 16.69
PBV (x) (13.22) 1.41 4.07
Dividend Payout (%) n.a n.a 0.21
Dividend Yield (%) n.a n.a 0.01 Current Ratio (x) 1.45 1.45 1.52
Debt to Equity (x) n.a 1.38 1.06
Leverage Ratio (x) 1.09 0.58 0.51
Gross Profit Margin (x) 0.14 0.16 0.18
Operating Profit Margin (x) 0.07 0.09 0.13
Net Profit Margin (x) n.a 0.07 0.13
Inventory Turnover (x) 7.23 6.18 5.43
Total Assets Turnover (x) 1.08 1.01 0.89
ROI (%) (2.72) 6.62 11.82
ROE (%) (30.97) (15.77) (24.37)
PER = 9.29x ; PBV = 3.11x (June 2007)
Financial Year: December 31
Public Accountant: Dedy Muliadi & Co. (2005); Mulyamin Sensi Suryanto (2006)
102 Indonesian Capital Market Directory 2007
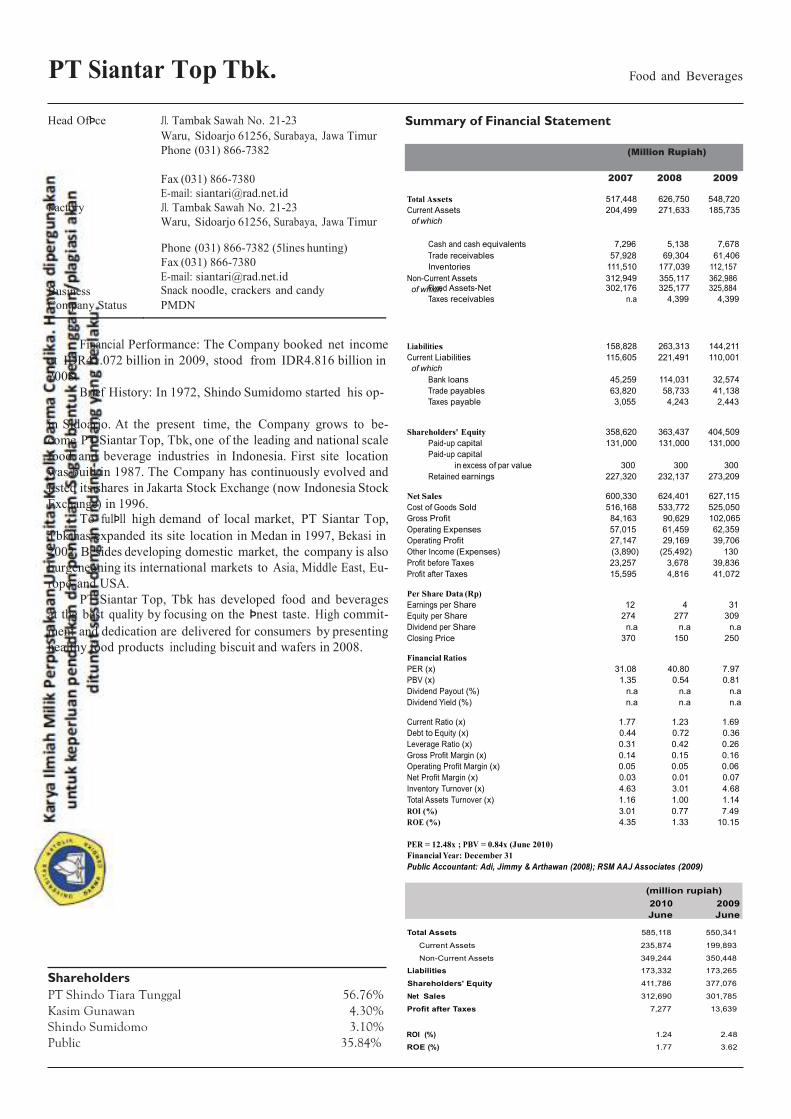
Fixed Assets-Net 302,176 325,177 325,884
Taxes receivables n.a 4,399 4,399
PT Siantar Top Tbk. Food and Beverages
Head OfÞce Jl. Tambak Sawah No. 21-23
Waru, Sidoarjo 61256, Surabaya, Jawa Timur
Phone (031) 866-7382
Summary of Financial Statement
(Million Rupiah)
Fax (031) 866-7380
E-mail: [email protected]
Factory Jl. Tambak Sawah No. 21-23
Waru, Sidoarjo 61256, Surabaya, Jawa Timur
2007 2008 2009 Total Assets 517,448 626,750 548,720
Current Assets 204,499 271,633 185,735
of which
Phone (031) 866-7382 (5lines hunting)
Fax (031) 866-7380
Cash and cash equivalents 7,296 5,138 7,678
Trade receivables 57,928 69,304 61,406
Inventories 111,510 177,039 112,157
Business
E-mail: [email protected] Snack noodle, crackers and candy
Non-Current Assets
of which
312,949 355,117 362,986
Company Status PMDN
Financial Performance: The Company booked net income
at IDR41.072 billion in 2009, stood from IDR4.816 billion in
2008.
Brief History: In 1972, Shindo Sumidomo started his op-
in Sidoarjo. At the present time, the Company grows to be-
come PT Siantar Top, Tbk, one of the leading and national scale
food and beverage industries in Indonesia. First site location
was built in 1987. The Company has continuously evolved and
listed its shares in Jakarta Stock Exchange (now Indonesia Stock
Exchange) in 1996. To fulÞll high demand of local market, PT Siantar Top,
Tbk has expanded its site location in Medan in 1997, Bekasi in
2002. Besides developing domestic market, the company is also
burgeneoning its international markets to Asia, Middle East, Eu-
rope and USA.
PT Siantar Top, Tbk has developed food and beverages at the best quality by focusing on the Þnest taste. High commit-
ment and dedication are delivered for consumers by presenting
healthy food products including biscuit and wafers in 2008.
Liabilities 158,828 263,313 144,211
Current Liabilities 115,605 221,491 110,001
of which
Bank loans 45,259 114,031 32,574
Trade payables 63,820 58,733 41,138
Taxes payable 3,055 4,243 2,443
Shareholders' Equity 358,620 363,437 404,509
Paid-up capital 131,000 131,000 131,000
Paid-up capital
in excess of par value 300 300 300
Retained earnings 227,320 232,137 273,209 Net Sales 600,330 624,401 627,115
Cost of Goods Sold 516,168 533,772 525,050
Gross Profit 84,163 90,629 102,065
Operating Expenses 57,015 61,459 62,359
Operating Profit 27,147 29,169 39,706
Other Income (Expenses) (3,890) (25,492) 130
Profit before Taxes 23,257 3,678 39,836
Profit after Taxes 15,595 4,816 41,072 Per Share Data (Rp)
Earnings per Share 12 4 31
Equity per Share 274 277 309
Dividend per Share n.a n.a n.a
Closing Price 370 150 250 Financial Ratios
PER (x) 31.08 40.80 7.97
PBV (x) 1.35 0.54 0.81
Dividend Payout (%) n.a n.a n.a
Dividend Yield (%) n.a n.a n.a Current Ratio (x) 1.77 1.23 1.69
Debt to Equity (x) 0.44 0.72 0.36
Leverage Ratio (x) 0.31 0.42 0.26
Gross Profit Margin (x) 0.14 0.15 0.16
Operating Profit Margin (x) 0.05 0.05 0.06
Net Profit Margin (x) 0.03 0.01 0.07
Inventory Turnover (x) 4.63 3.01 4.68
Total Assets Turnover (x) 1.16 1.00 1.14
ROI (%) 3.01 0.77 7.49
ROE (%) 4.35 1.33 10.15
PER = 12.48x ; PBV = 0.84x (June 2010)
Financial Year: December 31
Public Accountant: Adi, Jimmy & Arthawan (2008); RSM AAJ Associates (2009)
(million rupiah)
2010 2009
June June
Shareholders
PT Shindo Tiara Tunggal 56.76%
Kasim Gunawan 4.30%
Shindo Sumidomo 3.10%
Public 35.84%
Total Assets 585,118 550,341
Current Assets 235,874 199,893
Non-Current Assets 349,244 350,448
Liabilities 173,332 173,265
Shareholders' Equity 411,786 377,076
Net Sales 312,690 301,785
Profit after Taxes 7,277 13,639
ROI (%) 1.24 2.48
ROE (%) 1.77 3.62

134 Indonesian Capital Market Directory 2010
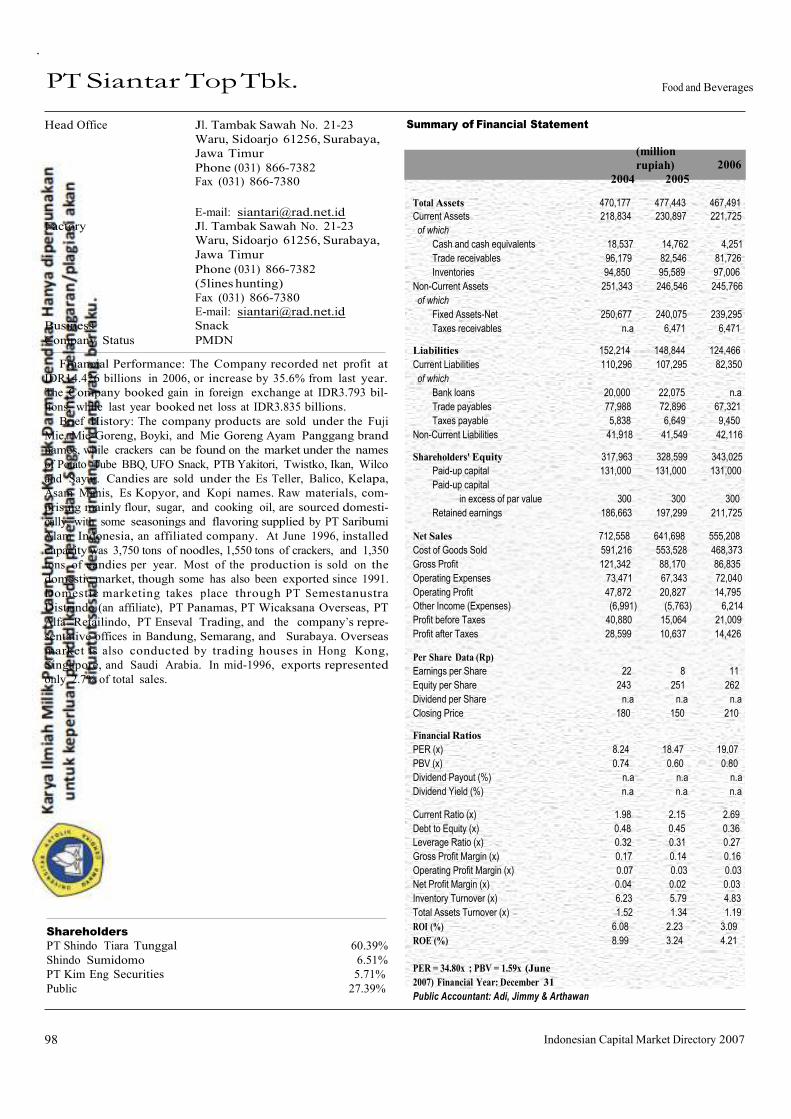
PT Siantar Top Tbk. Food and Beverages
Head Office Jl. Tambak Sawah No. 21-23
Waru, Sidoarjo 61256, Surabaya,
Jawa Timur
Phone (031) 866-7382 Fax (031) 866-7380
Summary of Financial Statement
(million
rupiah) 2004 2005
2006
E-mail: [email protected]
Factory Jl. Tambak Sawah No. 21-23
Waru, Sidoarjo 61256, Surabaya,
Jawa Timur
Phone (031) 866-7382
(5lines hunting)
Fax (031) 866-7380 E-mail: [email protected]
Business Snack
Company Status PMDN
Financial Performance: The Company recorded net profit at
IDR14.426 billions in 2006, or increase by 35.6% from last year.
The Company booked gain in foreign exchange at IDR3.793 bil-
lions, while last year booked net loss at IDR3.835 billions.
Brief History: The company products are sold under the Fuji
Mie, Mie Goreng, Boyki, and Mie Goreng Ayam Panggang brand
names, while crackers can be found on the market under the names
of Potato Tube BBQ, UFO Snack, PTB Yakitori, Twistko, Ikan, Wilco
and Sayur. Candies are sold under the Es Teller, Balico, Kelapa,
Asam Manis, Es Kopyor, and Kopi names. Raw materials, com-
prising mainly flour, sugar, and cooking oil, are sourced domesti-
cally, with some seasonings and flavoring supplied by PT Saribumi
Alam Indonesia, an affiliated company. At June 1996, installed
capacity was 3,750 tons of noodles, 1,550 tons of crackers, and 1,350
tons of candies per year. Most of the production is sold on the
domestic market, though some has also been exported since 1991.
Domestic marketing takes place through PT Semestanustra
Distrindo (an affiliate), PT Panamas, PT Wicaksana Overseas, PT
Alfa Retailindo, PT Enseval Trading, and the company’s repre-
sentative offices in Bandung, Semarang, and Surabaya. Overseas
market is also conducted by trading houses in Hong Kong,
Singapore, and Saudi Arabia. In mid-1996, exports represented
only 2.7% of total sales.
Shareholders
PT Shindo Tiara Tunggal 60.39%
Shindo Sumidomo 6.51%
PT Kim Eng Securities 5.71%
Public 27.39%
Total Assets 470,177 477,443 467,491
Current Assets 218,834 230,897 221,725
of which
Cash and cash equivalents 18,537 14,762 4,251
Trade receivables 96,179 82,546 81,726
Inventories 94,850 95,589 97,006
Non-Current Assets 251,343 246,546 245,766
of which
Fixed Assets-Net 250,677 240,075 239,295
Taxes receivables n.a 6,471 6,471 Liabilities 152,214 148,844 124,466
Current Liabilities 110,296 107,295 82,350
of which
Bank loans 20,000 22,075 n.a
Trade payables 77,988 72,896 67,321
Taxes payable 5,838 6,649 9,450
Non-Current Liabilities 41,918 41,549 42,116 Shareholders' Equity 317,963 328,599 343,025
Paid-up capital 131,000 131,000 131,000
Paid-up capital
in excess of par value 300 300 300
Retained earnings 186,663 197,299 211,725 Net Sales 712,558 641,698 555,208
Cost of Goods Sold 591,216 553,528 468,373
Gross Profit 121,342 88,170 86,835
Operating Expenses 73,471 67,343 72,040
Operating Profit 47,872 20,827 14,795
Other Income (Expenses) (6,991) (5,763) 6,214
Profit before Taxes 40,880 15,064 21,009
Profit after Taxes 28,599 10,637 14,426 Per Share Data (Rp)
Earnings per Share 22 8 11
Equity per Share 243 251 262
Dividend per Share n.a n.a n.a
Closing Price 180 150 210 Financial Ratios
PER (x) 8.24 18.47 19.07
PBV (x) 0.74 0.60 0.80
Dividend Payout (%) n.a n.a n.a
Dividend Yield (%) n.a n.a n.a Current Ratio (x) 1.98 2.15 2.69
Debt to Equity (x) 0.48 0.45 0.36
Leverage Ratio (x) 0.32 0.31 0.27
Gross Profit Margin (x) 0.17 0.14 0.16
Operating Profit Margin (x) 0.07 0.03 0.03
Net Profit Margin (x) 0.04 0.02 0.03
Inventory Turnover (x) 6.23 5.79 4.83
Total Assets Turnover (x) 1.52 1.34 1.19
ROI (%) 6.08 2.23 3.09
ROE (%) 8.99 3.24 4.21
PER = 34.80x ; PBV = 1.59x (June
2007) Financial Year: December 31
Public Accountant: Adi, Jimmy & Arthawan
98 Indonesian Capital Market Directory 2007

Bank loans 93,933 180,762 387,042 Company Status PMDN Trade payables 85,534 105,835 120,676
Accrued expenses 12,959 13,627 14,657
Financial Performance: In 2009, the Company booked net Current maturities of income amounted IDR138 billion, soaring from IDR63 billion
long-term debt Non-Current Liabilities
308,497 976,208
698,482 894,126
319,412 908,006
recorded last year. Minority Interests in Subsidiaries 3,941 4,797 5,054
Brief History: Established in 1973, PT Tunas Baru Lam- Shareholders' Equity 934,960 888,773 993,648
Paid-up capital 520,397 521,258 521,258
Paid-up capital was founded in 1947 and is a pioneer in Indonesia’s agricul- in excess of par value 173,453 156,947 156,701
PT Tunas Baru Lampung Tbk. Food and Beverages
Head OfÞce Wisma Budi 8th-9th Floor
Jl. HR. Rasuna Said Kav. C-6
Jakarta 12940
Summary of Financial Statement
(Million Rupiah)
Phone (021) 521-3383 (Hunting) Fax (021) 521-3392, 521-3332, 520-5829
Email: [email protected]
Homepage: http://www.tunasbarulampung.com
Factory Jl. Yos Sudarso No. 29
Waylunik Panjang
Bandar Lampung Branch OfÞce Jl. Ikan Kakap No. 9
Bandar Lampung
Phone (0721) 486-122,
Fax (0721) 486-754, 482-683
Business Fully Integrated of Vegetables Cooking Oil
And Other Vegetables Oil Derivatives
2007 2008 2009 Total Assets 2,457,120 2,802,497 2,786,340
Current Assets 981,997 1,119,783 985,163
of which
Cash and cash equivalents 220,400 357,902 127,332
Trade receivables 172,597 187,404 167,645
Inventories 436,850 258,873 247,071
Non-Current Assets 1,475,123 1,682,714 1,801,177
of which
Fixed Assets-Net 834,620 955,460 1,020,909
Deffered Tax Assets 1,848 2,954 3,444
Investments 49,585 34,988 34,988
Other Assets 7,066 12,357 12,357 Liabilities 1,518,219 1,908,928 1,787,639
Current Liabilities 542,011 1,014,802 879,633
of which
pung is a member company of Sungai Budi Group which
tural industry. Such involvement stems from a desire to as-
sist in the country’s development and to capitalism on In-
donesia’s competitive advantage in agriculture. Today, the
Sungai Budi Group is one of Indonesia’s largest manufactur-
ers and distributors of agricultural based consumer products.
Another member company of the Sungai Budi Group is the
publicly listed PT Budi Acid Jaya Tbk., the largest and most
fully integrated tapioca starch manufacturer in Indonesia.
Since PT Tunas Baru Lampung began its operations in Lam-
pung in the early 1970s, we have grown to become one of
the largest and lowest cost vegetable cooking oil producers.
PT Tunas Baru Lampung was publicly listed in Jakarta Stock
Exchange in 14 Feb 2000.
Retained earnings 241,109 210,567 315,688 Net Sales 1,844,207 3,955,846 2,783,573
Cost of Good Sold 1,401,540 3,143,164 2,336,336
Gross Profit 442,667 812,682 447,237
Operating Expenses 190,209 444,525 165,769
Operating Profit 252,458 368,157 281,468
Other Income (Expenses) (113,810) (301,111) (73,120)
Profit (Loss) before Taxes 138,648 67,046 208,347
Profit (Loss) after Taxes 97,227 63,337 138,245 Per Share Data (Rp)
Earnings (Loss) per Share 23 15 33
Equity per Share 225 213 238
Dividend per Share n.a n.a 2
Closing Price 630 190 340 Financial Ratios
PER (x) 26.98 12.51 10.26
PBV (x) 2.81 0.89 1.43
Dividend Payout (%) n.a n.a 5.88
Dividend Yield (%) n.a n.a 0.57 Current Ratio (x) 1.81 1.10 1.12
Debt to Equity (x) 1.62 2.15 1.80
Leverage Ratio (x) 0.62 0.68 0.64
Operating Profit Margin (x) 0.14 0.09 0.10
Net Profit Margin (x) 0.05 0.02 0.05
Inventory Turnover (x) 0.44 1.72 0.67
Total Assets Turnover (x) 0.75 1.41 1.00
ROI (%) 3.96 2.26 4.96
ROE (%) 10.40 7.13 13.91
PER = 9.65x ; PBV = 1.38x (June 2010)
Financial Year: December 31
Public Accountant: Mulyamin Sensi Suryanto
(million rupiah)
2010 2009
June June
Total Assets 2,939,931 2,773,885
Shareholders Current Assets 1,075,540 1,045,956
Non-Current Assets 1,864,391 1,727,929
PT Budi Delta Swakarya 28.18% Liabilities 1,846,163 1,770,502
PT Sungai Budi 26.06% Shareholders' Equity 1,087,740 997,600
PT Budi Acid Jaya Tbk 0.67% Net Sales 1,208,855 1,431,524
Widarto 0.05% Profit after Taxes 86,482 109,480
Santoso Winata 0.05%
Public 44.99%
ROI (%) 2.94 3.95
ROE (%) 7.95 10.97
140 Indonesian Capital Market Directory 2010

Widarto 0.05%
Santoso Winata 0.05%
Public 40.33%
PT Tunas Baru Lampung Tbk. Food and Beverages
Head Office Wisma Budi 8th-9th Floor
Jl. HR. Rasuna Said Kav. C-6,
Jakarta 12940
Phone (021) 521-3383
Summary of Financial Statement
(million rupiah)
2004 2005 2006
Fax (021) 521-3392/521-3282 Email: [email protected]
Homepage:
http://www.tunasbarulampung.com
Factory Jl. Raya Lintas Sumatera Km. 75 Terbanggi Besar, Lampung Tengah
Phone (0725) 527-975 Fax (0725) 25010
Business Fully Integrated of Vegetables
Cooking Oil And Other Vegetables
Oil Derivatives
Company Status PMDN
Financial Performance: The Company booked net profit of
IDR52.884 billion in 2006, jump sharply by 750.5% from IDR6.218
billion in 2005. The net profit rose significantly mainly because of
foreign-exchange gain that reached IDR36.214 billion versus forex
loss of IDR15.087 billion.
Brief History: Established in 1973, PT Tunas Baru Lampung is a member company of Sungai Budi Group which was founded in
1947 and is a pioneer in Indonesia’s agricultural industry. Such
involvement stems from a desire to assist in the country’s devel-
opment and to capitalise on Indonesia’s competitive advantage
in agriculture. Today, the Sungai Budi Group is one of indonesia’s
largest manufacturers and distributors of agricultural based con-
sumer products. Another member company of the Sungai Budi
Group is the publicly listed PT Budi Acid Jaya Tbk, the largest
and most fully integrated tapioca starch manufacturer in Indone-
sia. Since PT. Tunas Baru Lampung began is operations in
Lampung in the early 1970s, we have grown to become one of the
largest and lowest cost vegetable cooking oil producers.
Shareholders
PT Sungai Budi 19.62%
PT Budi Sulfat Jaya 14.99%
PT Sungai Budi Perkasa 14.55%
PT Budi Alam Kencana 9.70%
PT Budi Acid Jaya Tbk 0.71%
Total Assets 1,352,092 1,451,439 2,049,163
Current Assets 397,888 352,676 662,858
of which
Cash and cash equivalents 13,385 17,940 151,592
Trade receivables 194,373 103,952 142,153
Inventories 129,297 146,246 131,011
Non-Current Assets 954,204 1,098,763 1,386,305
of which
Fixed Assets-Net 494,964 570,501 787,451
Deffered Tax Assets 3,406 3,402 1,909
Investments 43,029 71,838 82,537
Other Assets 3,785 5,311 4,710
Liabilities 840,285 938,257 1,183,409
Current Liabilities 279,299 335,537 448,132
of which
Bank loans 29,318 95,953 110,404
Trade payables 44,788 40,097 42,137
Accrued expenses 4,787 6,371 10,757
Current maturities of
long-term debt 73,814 88,561 111,724
Non-Current Liabilities 560,987 602,720 735,278
Minority Interests in Subsidiaries 1,219 1,221 1,313 Shareholders' Equity 510,588 511,960 864,441
Paid-up capital 201,923 201,923 515,526
Paid-up capital
in excess of par value 184,201 184,201 173,453
Retained earnings 124,463 125,836 175,462
Net Sales 1,191,010 1,220,636 1,193,999
Cost of Good Sold 962,428 989,612 931,578
Gross Profit 228,582 231,023 262,420
Operating Expenses 94,446 109,492 127,636
Operating Profit 134,135 121,531 134,784
Other Income (Expenses) (104,729) (103,016)
(55,633) Profit (Loss) before Taxes 29,407 18,515
79,152
Profit (Loss) after Taxes 16,455 6,219 52,884
Per Share Data (Rp)
Earnings (Loss) per Share 10 4 13
Equity per Share 316 317 210
Dividend per Share 3 n.a n.a
Closing Price 230 200 240
Financial Ratios
PER (x) 22.58 51.95 18.72
PBV (x) 0.73 0.63 1.15
Dividend Payout (%) 0.29 n.a n.a
Dividend Yield (%) 0.01 n.a n.a
Current Ratio (x) 1.42 1.05 1.48
Debt to Equity (x) 1.65 1.83 1.37
Leverage Ratio (x) 0.62 0.65 0.58
Operating Profit Margin (x) 0.11 0.10 0.11
Net Profit Margin (x) 0.01 0.01 0.04
Inventory Turnover (x) 0.73 0.75 0.97
Total Assets Turnover (x) 0.88 0.84 0.58
ROI (%) 1.22 0.43 2.58
ROE (%) 3.22 1.21 6.12
PER =295.69x ; PBV = 2.73x (June
2007) Financial Year: December 31
Public Accountant: Deddi Muliadi & Co. (2005); Mulyamin Sensi Suryanto (2006)

108 Indonesian Capital Market Directory 2007
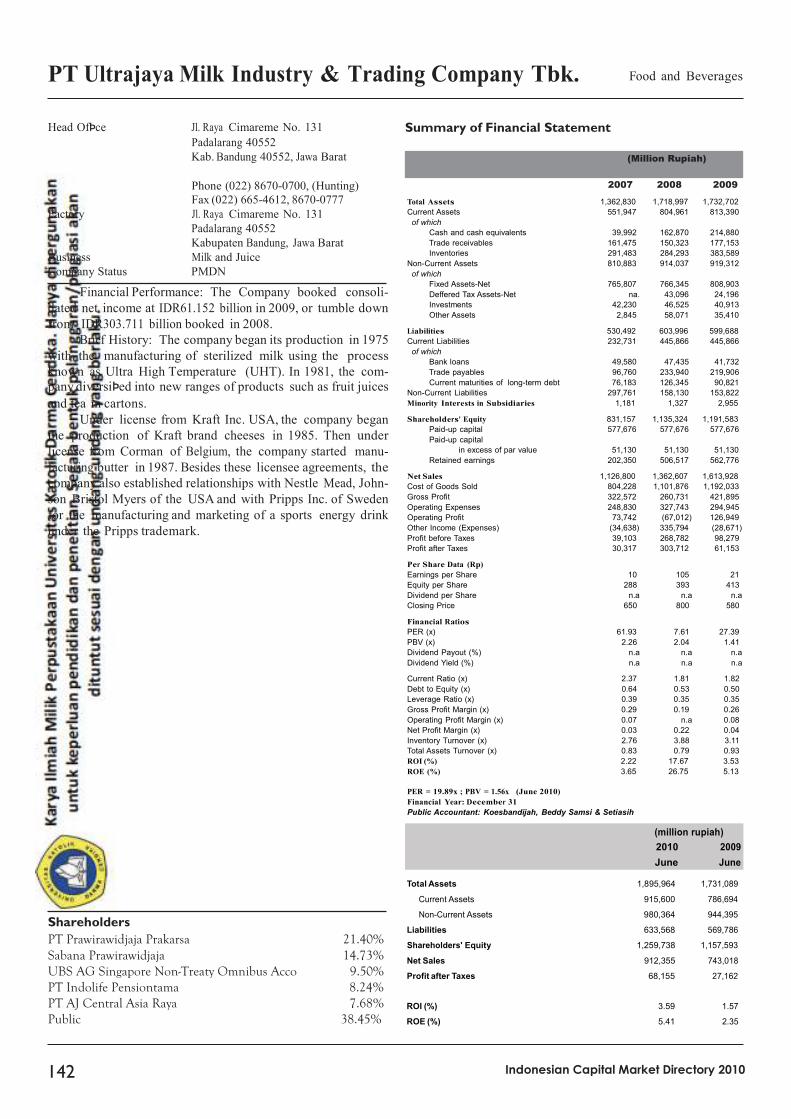
PT Ultrajaya Milk Industry & Trading Company Tbk.
Food and Beverages
Head OfÞce Jl. Raya Cimareme No. 131
Padalarang 40552
Kab. Bandung 40552, Jawa Barat
Summary of Financial Statement
(Million Rupiah)
Phone (022) 8670-0700, (Hunting) Fax (022) 665-4612, 8670-0777
Factory Jl. Raya Cimareme No. 131
Padalarang 40552
Kabupaten Bandung, Jawa Barat
Business Milk and Juice
Company Status PMDN
Financial Performance: The Company booked consoli-
dated net income at IDR61.152 billion in 2009, or tumble down
from IDR303.711 billion booked in 2008.
Brief History: The company began its production in 1975
with the manufacturing of sterilized milk using the process
known as Ultra High Temperature (UHT). In 1981, the com- pany diversiÞed into new ranges of products such as fruit juices
and tea in cartons.
Under license from Kraft Inc. USA, the company began
the production of Kraft brand cheeses in 1985. Then under
license from Corman of Belgium, the company started manu-
facturing butter in 1987. Besides these licensee agreements, the
company also established relationships with Nestle Mead, John-
son Bristol Myers of the USA and with Pripps Inc. of Sweden
for the manufacturing and marketing of a sports energy drink
under the Pripps trademark.
2007 2008 2009
Total Assets 1,362,830 1,718,997 1,732,702
Current Assets 551,947 804,961 813,390
of which
Cash and cash equivalents 39,992 162,870 214,880
Trade receivables 161,475 150,323 177,153
Inventories 291,483 284,293 383,589
Non-Current Assets 810,883 914,037 919,312
of which
Fixed Assets-Net 765,807 766,345 808,903
Deffered Tax Assets-Net na. 43,096 24,196
Investments 42,230 46,525 40,913
Other Assets 2,845 58,071 35,410
Liabilities 530,492 603,996 599,688
Current Liabilities 232,731 445,866 445,866
of which
Bank loans 49,580 47,435 41,732
Trade payables 96,760 233,940 219,906
Current maturities of long-term debt 76,183 126,345 90,821
Non-Current Liabilities 297,761 158,130 153,822
Minority Interests in Subsidiaries 1,181 1,327 2,955
Shareholders' Equity 831,157 1,135,324 1,191,583
Paid-up capital 577,676 577,676 577,676
Paid-up capital
in excess of par value 51,130 51,130 51,130
Retained earnings 202,350 506,517 562,776
Net Sales 1,126,800 1,362,607 1,613,928
Cost of Goods Sold 804,228 1,101,876 1,192,033
Gross Profit 322,572 260,731 421,895
Operating Expenses 248,830 327,743 294,945
Operating Profit 73,742 (67,012) 126,949
Other Income (Expenses) (34,638) 335,794 (28,671)
Profit before Taxes 39,103 268,782 98,279
Profit after Taxes 30,317 303,712 61,153
Per Share Data (Rp)
Earnings per Share 10 105 21
Equity per Share 288 393 413
Dividend per Share n.a n.a n.a
Closing Price 650 800 580
Financial Ratios
PER (x) 61.93 7.61 27.39
PBV (x) 2.26 2.04 1.41
Dividend Payout (%) n.a n.a n.a
Dividend Yield (%) n.a n.a n.a
Current Ratio (x) 2.37 1.81 1.82
Debt to Equity (x) 0.64 0.53 0.50
Leverage Ratio (x) 0.39 0.35 0.35
Gross Profit Margin (x) 0.29 0.19 0.26
Operating Profit Margin (x) 0.07 n.a 0.08
Net Profit Margin (x) 0.03 0.22 0.04
Inventory Turnover (x) 2.76 3.88 3.11
Total Assets Turnover (x) 0.83 0.79 0.93
ROI (%) 2.22 17.67 3.53
ROE (%) 3.65 26.75 5.13
PER = 19.89x ; PBV = 1.56x (June 2010)
Financial Year: December 31
Public Accountant: Koesbandijah, Beddy Samsi & Setiasih
(million rupiah)
2010 2009
June June
Shareholders
PT Prawirawidjaja Prakarsa 21.40%
Sabana Prawirawidjaja 14.73%
UBS AG Singapore Non-Treaty Omnibus Acco 9.50%
PT Indolife Pensiontama 8.24%
PT AJ Central Asia Raya 7.68%
Public 38.45%
Total Assets 1,895,964 1,731,089
Current Assets 915,600 786,694
Non-Current Assets 980,364 944,395
Liabilities 633,568 569,786
Shareholders' Equity 1,259,738 1,157,593
Net Sales 912,355 743,018
Profit after Taxes 68,155 27,162
ROI (%) 3.59 1.57
ROE (%) 5.41 2.35
142 Indonesian Capital Market Directory 2010

the manufacturing of sterilized milk using the process known as
Ultra High Temperature (UHT). In 1981, the company diversified
Liabilities
Current Liabilities
of which
490,302 439,122 433,177
89,623 262,802 355,876
into new ranges of products such as fruit juices and tea in cartons. Bank loans 22,503 4,103 56,613
Under license from Kraft Inc. USA, the company began the pro- Trade payables 31,059 42,139 55,192
duction of Kraft brand cheeses in 1985. Then under license from Current maturities of long-term debt 25,000,000 204,268 228,704
Corman of Belgium, the company started manufacturing butter Non-Current Liabilities 400,678 176,319 77,301
in 1987. Besides these licensee agreements, the company also es- Minority Interests in Subsidiaries n.a. 857 1,104
of the USA and with Pripps Inc. of Sweden for the manufacturing
and marketing of a sports energy drink under the Pripps trade-
mark.
Shareholders' Equity
Paid-up capital
Paid-up capital
in excess of par value
809,938
577,676
51,130
814,466
577,676
51,130
814,799
577,676
51,130
Retained earnings 181,131 185,659 185,992
Net Sales 546,325 711,732 835,230
Cost of Goods Sold 371,960 495,807 583,343
Gross Profit 174,365 215,925 251,887
Operating Expenses 87,912 154,794 185,810
Operating Profit 86,453 61,132 66,077
Other Income (Expenses) (85,546) (56,324) (40,263)
Profit before Taxes 907 4,808 25,814
Profit after Taxes 4,412 4,528 14,732
Per Share Data (Rp)
Earnings per Share 2 2 5
Equity per Share 280 282 282
Dividend per Share n.a 5 n.a
Closing Price 425 310 435
Financial Ratios
PER (x) 278.22 197.76 85.29
PBV (x) 1.52 1.10 1.54
Dividend Payout (%) n.a 319 n.a
Dividend Yield (%) n.a 2 n.a
Current Ratio (x) 4.82 1.58 1.18
Debt to Equity (x) 0.61 0.54 0.53
Leverage Ratio (x) 0.38 0.35 0.35
Gross Profit Margin (x) 0.32 0.30 0.30
Operating Profit Margin (x) 0.16 0.09 0.08
Net Profit Margin (x) 0.01 0.01 0.02
Inventory Turnover (x) 2.48 2.93 3.95
Total Assets Turnover (x) 0.42 0.57 0.67
ROI (%) 0.34 0.36 1.18
ROE (%) 0.54 0.56 1.81
Shareholders
PT Prawirawidjaja Prakarsa 21.40%
Public 78.60%
PT Ultrajaya Milk Tbk.
Head Office Jl. Raya Cimareme No. 131 Padalarang 40552
Kabupaten Bandung 40552
Jawa Barat Phone (022) 665-4610, 665-4611
Summary of Financial Statement
Food and Beverages
(million rupiah)
2004 2005 2006
Fax (022) 665-4612
Factory Jl. Raya Cimareme No. 131 Padalarang 40552
Kabupaten Bandung, Jawa Barat
Business Milk and Juice
Company Status PMDN
Financial Performance: The company booked net profit of
IDR14.731 billion in 2006, increase sharply by 225.4% from
IDR4.527 billion in 2005. Net sales stepped up 17.35% at IDR835.229
billion from IDR711.731 billion.
Brief History: The company began its production in 1975 with
Total Assets 1,300,240 1,254,444 1,249,080
Current Assets 431,789 416,428 421,543
of which
Cash and cash equivalents 161,136 46,784 75,214
Trade receivables 100,189 118,630 122,993
Inventories 150,020 169,391 147,845
Non-Current Assets 868,451 838,016 827,537
of which
Fixed Assets-Net 780,339 786,798 790,208
Deffered Tax Assets-Net 4,424 4,037 na.
Investments 27,147 27,132 34,933
Other Assets 22,234 4,050 2,396
tablished relationships with Nestle Mead, Johnson Bristol Myers
PER = 58.50x ; PBV = 2.00x (June 2007)
Financial Year: December 31
Public Accountant: Koesbandijah, Beddy Samsi & Setiasih
110 Indonesian Capital Market Directory 2007
Copyright © 2022 FDOKUMEN