Axial compression of metallic spherical shells between rigid plates
21
Thin-Walled Structures 34 (1999) 21–41 www.elsevier.com/locate/tws Axial compression of metallic spherical shells between rigid plates N.K. Gupta * , G.L. Easwara Prasad, S.K. Gupta Applied Mechanics Department, Indian Institute of Technology, Delhi, New Delhi 110016, India Abstract Aluminium spherical shells of R/t values between 15 and 240, were axially compressed in an INSTRON machine between flat plates. The modes of their collapse, load-compression and energy-compression curves, and mean collapse loads are presented. A simple analytical model has been developed for the prediction of load-compression and energy-compression curves for the metallic spherical shells, by using the concepts of stationary and rolling plastic hinges. The results thus obtained match well with the experimental results. These results have also been compared with the solutions proposed in earlier studies. Behaviour of these shells is compared with the response of spherical shells (aluminium, mild steel and galvanised steel) of shallow depth, which were also subjected to axial compression between rigid plates. Their load-deformation curves are presented, and their energy-compression behaviour and mean col- lapse loads are discussed. 1999 Elsevier Science Ltd. All rights reserved. Keywords: Spherical shells; Plastic hinges; Axial collapse; Energy absorption Nomenclature R Mean radius of the spherical shell L Span of the spherical shell Z Depth of the spherical shell T Thickness of the spherical shell along a parallel circle at contact with top plate * Corresponding author. Tel: 1 91-11-686-19977; fax: 1 91-11-686-2037; e-mail: [email protected] d.ernet.in 0263-8231/99/$ - see front matter 1999 Elsevier Science Ltd. All rights reserved. PII:S0263-8231(98)00049-4
-
Upload
independent -
Category
Documents
-
view
1 -
download
0
Transcript of Axial compression of metallic spherical shells between rigid plates

Thin-Walled Structures 34 (1999) 21–41www.elsevier.com/locate/tws
Axial compression of metallic spherical shellsbetween rigid plates
N.K. Gupta*, G.L. Easwara Prasad, S.K. GuptaApplied Mechanics Department, Indian Institute of Technology, Delhi, New Delhi 110016, India
Abstract
Aluminium spherical shells ofR/t values between 15 and 240, were axially compressed inan INSTRON machine between flat plates. The modes of their collapse, load-compression andenergy-compression curves, and mean collapse loads are presented. A simple analytical modelhas been developed for the prediction of load-compression and energy-compression curves forthe metallic spherical shells, by using the concepts of stationary and rolling plastic hinges.The results thus obtained match well with the experimental results. These results have alsobeen compared with the solutions proposed in earlier studies. Behaviour of these shells iscompared with the response of spherical shells (aluminium, mild steel and galvanised steel)of shallow depth, which were also subjected to axial compression between rigid plates. Theirload-deformation curves are presented, and their energy-compression behaviour and mean col-lapse loads are discussed. 1999 Elsevier Science Ltd. All rights reserved.
Keywords:Spherical shells; Plastic hinges; Axial collapse; Energy absorption
Nomenclature
R Mean radius of the spherical shellL Span of the spherical shellZ Depth of the spherical shellT Thickness of the spherical shell along a parallel circle at contact with
top plate
* Corresponding author. Tel:1 91-11-686-19977; fax:1 91-11-686-2037; e-mail: [email protected]
0263-8231/99/$ - see front matter 1999 Elsevier Science Ltd. All rights reserved.PII: S0263 -8231(98)00049-4

22 N.K. Gupta et al. /Thin-Walled Structures 34 (1999) 21–41
r Mean radius of the parallel circle at any point consideredrp Radius of the rolling or travelling plastic hingeh Total axial compression of the spherical shell at any stage of
compressiondhi Incremental axial compression of the spherical shellN Number of stationary plastic hingesl length of the stationary plastic hinges induced during a compression
of dhi
P Load on the spherical shell at any stage of compressionMp Plastic momentdl Incremental length of spherical shell along the meridian covered in an
incremental stage of compression “dhi”df Angle subtended at centre over the incremental length “dl”t1 Thickness of the spherical shell at apext2 Thickness of the spherical shell near the rim or baselmt Total meridional length of assumed hemispherical shell from apex to
rim or baselmp Total meridional length of spherical shell from apex to point at the
contact of top plate
1. Introduction
The energy absorption characteristics and collapse behaviour of structural compo-nents under impact loads are required for the design for crash worthiness of varioustransport vehicles like air craft and automobiles. The load-deformation characteristicsof energy absorbing devices is a measure of their energy absorption capacity. Itdiffers from one component to the other, and depends on the mode of deformationinvolved and the material used. The important factors which are used as a measureof the efficiency of performance of energy absorbers and their selection criteria isdiscussed in detail by Ezra and Fay [1].
The behaviour of thin walled tubes of circular or non circular sections under staticand/or dynamic loading conditions has been studied and reported by variousresearchers [2]. Attention has also been given to the study of failure mechanisms andenergy absorbing capabilities of rotationally symmetric conical or spherical shells. Inthe present work, we have considered the collapse mechanisms and energy absorbingcharacteristics of metallic spherical shells, when subjected to axial loading.
The large deformation of a rigid-plastic spherical shell compressed between rigidplates was first studied by Updike [3]. An expression (Eq. (1)) relating the axialcrushing force on the spherical shell to its deformation was proposed, predictions ofwhich are restricted to overall compression of a few thicknesses to about one tenthof the shell radius. The load-deformation behaviour in this analysis is shown to beindependent of the radius of the spherical shell.
h 5T48 F P
2pMpG2
(1)

23N.K. Gupta et al. /Thin-Walled Structures 34 (1999) 21–41
The quasi-static loading of a hemispherical shell along its axis of symmetry wasstudied, with particular reference to large deformations and buckling, by Kitchinget al. [4]. Deformation patterns which are symmetric and non-symmetric about theaxis were studied analytically and experimentally for spherical shells ofR/t rangingbetween 36 and 460. Three stages of deformation were considered. Stage I defor-mations were considered elastic, wherein a local flattening of the shell in contactwith the plate took place. In stage II axi-symmetric inward dimple was assumed toform. In stage III non-axisymmetric integral number of lobes were considered to beformed. In stages II and III, the load-deformation relationship given by Eq. (1) wasused for analytical prediction of load-deformation behaviour for a perfectly plasticmaterial.
The quasi-static crushing of a spherical shell between rigid plates was also ana-lyzed by De Oliveira and Wierzbicki [5] as part of their studies on the crushinganalysis of rotationally symmetric plastic shells. They compared the results (Eq. (2))for load versus deformation with those of Updike [3]. They concluded that theirsolution would be valid for large deformation until the crush distance reached thespherical shell radius, even though there is only a marginal difference in their solutionand the solutions of Updike [3]. It may be observed that the load-deformation relation[5] given by Eq. (2), is also independent of the radius of the spherical shell. Theyhave also given an expression (Eq. (3)) for determining the radius of the rollingplastic hinge in contact with plate, viz,
h 5T43 F P
2pMp1 2G2
23T32 F P
2pMpG (2)
rp 5√3TR
2 sinf(3)
An analysis and quasi-static testing of spherical shells has been carried out byKinkead et al. [6] on hemispherical shells ofR/t ranging between 8 to 32. Theyassumed the deformations to occur in two phases. In the first phase a local flatteningof the shell in contact with the rigid plate occurs, while in the second, an axi-sym-metric inward dimpling of the previously flattened portion takes place. In the analyti-cal solution proposed for the load-deformation prediction, cusps are formed at theintersection of solutions proposed for the two phases of deformations. These cuspsare not borne out in the experimental data. In their static analysis the strain hardeningis also considered. They have compared the analytical solutions obtained for load-deformations with the solutions proposed by the other authors [3,5], and a largedifference is reported. They have also mentioned that the analytical solution proposedby them is somewhat lengthy and cumbersome and is applicable only for the spheri-cal shells of lowR/t values.
Here we consider the axial compression of aluminium spherical shells to studytheir collapse mechanisms and energy absorbing capabilities under quasi-static load-ing. R/t values of these shells are 15 to 240. It is seen that actual spun specimens
24 N.K. Gupta et al. /Thin-Walled Structures 34 (1999) 21–41
Fig. 1. Schematic diagram of the spherical shell.
have variation in wall thickness, which need to be considered in the analysis. Indeveloping the analytical model to predict the load-deformation behaviour, the con-cepts of stationary and rolling plastic hinges are used and variation in wall thicknessis considered. The results thus obtained compare with experiments very well.
2. Experimental work
A detailed experimental investigation has been carried out on the axial crushingof spherical shells between rigid plates under quasi-static loading in an INSTRONmachine (model 1197) of 50 T capacity. The aluminium spherical shells withR/tvalues ranging from 15 to 240, and the spherical shell specimens of shallow depthmade of aluminium, mild steel and galvanised steel were tested. The specimens werecompressed up to 50% of their depth with a cross head speed of 2 mm/min. Their
Table 1Yield stresses of the spherical shell materials
Sl. No. Material Heat treatment Thicknesst (mm) Yield Stress (Mpa)
1 Aluminium A 0.50 74.62 Aluminium A 0.74 75.03 Aluminium A 1.03 78.24 Aluminium A 1.29 80.65 Aluminium A 1.50 91.46 Aluminium A 2.00 92.27 Aluminium A 2.50 98.58 Aluminium A 3.00 116.39 Mild Steel AR 0.81 307.110 Mild Steel A 0.92 185.011 Galvanised Steel AR 0.75 330.612 Galvanised Steel A 0.78 179.0
A: Annealed, AR: As received

25N.K. Gupta et al. /Thin-Walled Structures 34 (1999) 21–41
Table 2Dimensions of aluminium spherical shells with variation inR/t values
Sp. No. RadiusR DepthZ t1 (mm) t2 (mm) t (mm) R/t(mm) (mm)
A1 42.83 34.04 2.80 2.80 2.80 15.3A2 39.30 35.10 2.05 1.75 1.90 20.7A3 78.40 69.68 3.00 2.62 2.81 27.9A4 52.41 45.14 2.05 1.56 1.81 29.2A5 78.00 70.27 2.50 2.18 2.34 33.4A6 78.20 72.22 2.00 1.58 1.79 43.7
39.11 35.74 1.03 0.73 0.88 44.4A7 56.42 47.75 1.29 0.98 1.14 49.5A8 78.10 70.42 1.50 1.22 1.36 57.4
51.33 47.28 1.03 0.73 0.88 58.3A9 39.38 33.90 0.74 0.52 0.63 61.5A10 75.81 71.80 1.29 0.93 1.11 68.3A11 62.70 59.68 1.03 0.78 0.91 69.3A12 51.20 45.75 0.74 0.55 0.65 78.8A13 78.00 72.80 1.03 0.78 0.91 85.7A14 100.35 92.00 1.29 0.93 1.11 90.4A15 125.10 110.50 1.29 0.98 1.14 109.7A16 102.30 93.34 1.03 0.79 0.91 112.5A17 126.80 107.85 1.03 0.75 0.89 143.5A18 77.41 73.68 0.50 0.36 0.42 184.3A19 103.60 93.44 0.50 0.36 0.43 240.9
load-compression curves were obtained on the machine chart recorder. Repeatabilityof the results was ensured by repeating the experiments on at least three identicalspecimens. The schematic diagram of the spherical shell is shown in Fig. 1.
2.1. Specimens
The aluminium sheets of standard thicknesses i.e., 0.5 mm, 1 mm, 1.5 mm, 2 mm,2.5 mm, and 3 mm were obtained commercially and then the spherical shell speci-mens used in the experiments were obtained by spinning process. These shells were
Table 3Dimensions of aluminium spherical shells of same radius and thickness, and of different depths
Sp. No. SpanL DepthZ RadiusR t1 (mm) t2 (mm) t (mm) R/t(mm) (mm) (mm)
B1 127.50 30.30 78.20 1.03 0.93 0.98 89.8B2 141.92 46.67 77.30 1.03 0.71 0.87 88.8B3 152.40 67.31 76.80 1.03 0.77 0.90 85.3B4 154.56 72.80 78.00 1.03 0.78 0.91 85.7

26 N.K. Gupta et al. /Thin-Walled Structures 34 (1999) 21–41
Table 4Dimensions of Spherical shells of shallow depths
Sp. No. Material SpanL (mm) DepthZ (mm) RadiusR (mm) t (mm) R/t
Specimens tested as received (without annealing)C1 M S 146.98 50.36 78.80 0.81 96.9C2 G I 143.82 47.29 78.32 0.73 107.3C3 G I 124.76 37.28 70.83 0.97 70.8C4 G I 103.90 32.56 57.72 0.74 78.0Specimens tested after annealingC5 M S 148.42 51.14 79.41 0.92 86.3C6 G I 147.12 47.29 80.56 0.78 103.7C7 G I 122.06 37.71 68.24 0.96 71.1C8 G I 104.98 30.90 60.03 0.78 77.0C9 Alu. 141.92 46.67 77.30 0.87 88.8C10 Alu. 127.50 30.30 78.20 0.98 89.8
M S: Mild Steel, G I: Galvanised Steel, Alu.: Aluminium
annealed before testing. To get the yield stress of the material, the tension specimenswere cut from the same sheets and annealed along with the respective shell specimensbefore testing. Table 1 shows the yield stress of the material of the shell specimens.Table 2 gives the dimensions of the aluminium spherical shells withR/t values rang-ing from 15 to 240. Table 3 shows the dimensions of the shells which are of sameradius and of different depths. Table 4 gives the details of the shells of shallow depthand made of different materials.
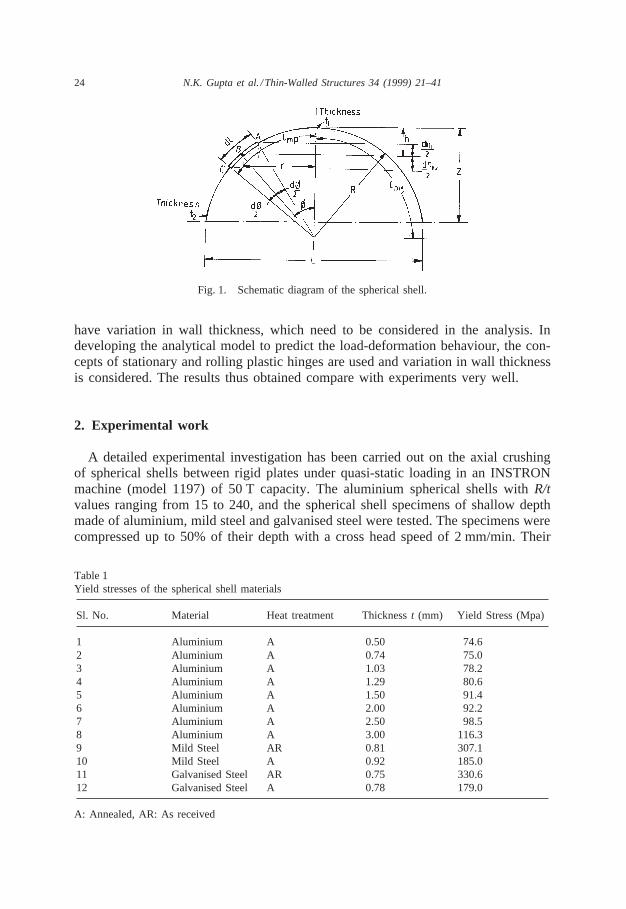
The spherical shells obtained from the process of spinning show a variation intheir wall thickness in the meridian direction. The specimens tested under axial com-pression were cut into two equal halves, see Fig. 2(a) and the thickness was measuredalong the meridians. The trend in the variation of wall thickness along the meridiandirection of a spun spherical shell is found to match with that reported by Blachutand Galletly [7], and a typical variation is shown in the Fig. 2(b). It is observed thatthe thickness is constant along the meridian over a short length near the apex. Furtherup to about 50% of the meridional length the thickness is found to vary almostlinearly. For the remaining 50% of the meridional length thickness is again constant.This variation in wall thickness has been considered in the present analysis. Forcalculations ofR/t values of the shells,t is taken as the average oft1 and t2, seeFig. 1.
2.2. Modes of collapse
It is observed that in the initial stage of compression the spherical shells deformedwith a flat contact region against the rigid plate. This is called stage I deformations.This deformation mode is clearly observed in spherical shells of lowR/t values [6].As the R/t value increases, the range of compression over which the stage I defor-mations occur decreases.
With the progress of deformations the spherical shells show an axi-symmetric
27N.K. Gupta et al. /Thin-Walled Structures 34 (1999) 21–41
Fig. 2. (a) Sectional view of the tested spherical shell (A2); (b) Typical variation of shell thicknessalong meridian.
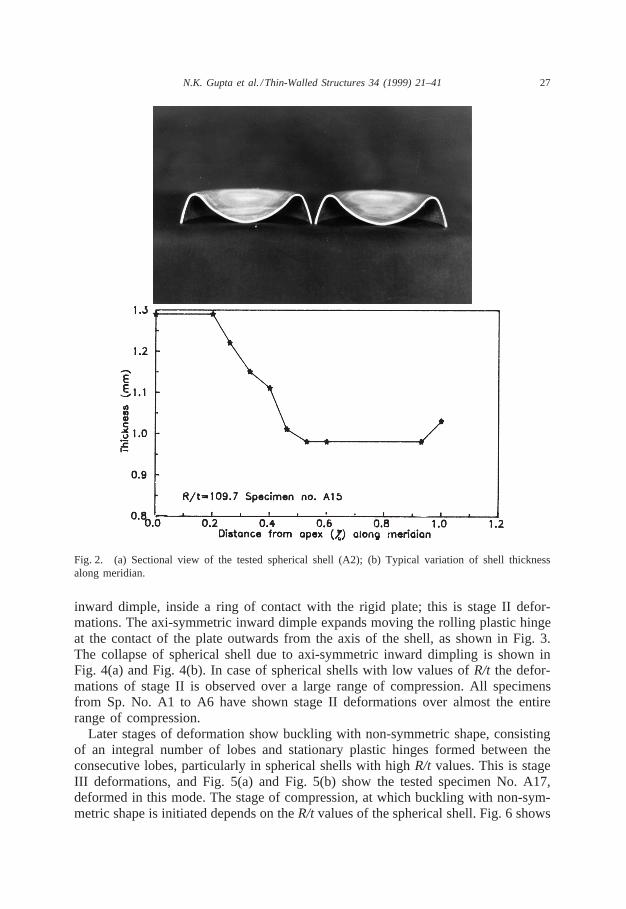
inward dimple, inside a ring of contact with the rigid plate; this is stage II defor-mations. The axi-symmetric inward dimple expands moving the rolling plastic hingeat the contact of the plate outwards from the axis of the shell, as shown in Fig. 3.The collapse of spherical shell due to axi-symmetric inward dimpling is shown inFig. 4(a) and Fig. 4(b). In case of spherical shells with low values ofR/t the defor-mations of stage II is observed over a large range of compression. All specimensfrom Sp. No. A1 to A6 have shown stage II deformations over almost the entirerange of compression.
Later stages of deformation show buckling with non-symmetric shape, consistingof an integral number of lobes and stationary plastic hinges formed between theconsecutive lobes, particularly in spherical shells with highR/t values. This is stageIII deformations, and Fig. 5(a) and Fig. 5(b) show the tested specimen No. A17,deformed in this mode. The stage of compression, at which buckling with non-sym-metric shape is initiated depends on theR/t values of the spherical shell. Fig. 6 shows
28 N.K. Gupta et al. /Thin-Walled Structures 34 (1999) 21–41
Fig. 3. The movement of rolling plastic hinge with the progress of axial compression (schematicdiagram).
the tested specimens No. A7, A10, A14 and A15. For the spherical shell specimensshown in Fig. 6 the stage of compression at which the stage III deformations areinitiated is shown in Table 5. It is found that generally 5 to 8 stationary hinges areinduced with an equal number of integral lobes. At the instance of initiation ofstationary hinges, all the hinges are not initiated at the same time, but with theprogress of compression they reach the maximum number. In the same way eventhe rotation of the stationary hinges reach the maximum with progress of com-pression, from its zero value at the instance of initiation of stationary hinges, seeFig. 6. From Table 5 it can be noticed that the stage III deformation is initiated atan early stage of compression and it occurs over a large range of compression, inthe case of spherical shells of highR/t values.
2.3. Rolling plastic hinge
As discussed in Section 2.2, at some stage of compression, the axi-symmetricinward dimple expands outwards from the axis of the shell due to the rolling of theplastic hinge at the contact with the top plate. It is observed that the radius of therolling plastic hingerp at the contact of the plate varies with the progress of com-pression. The typical variation ofrp with deformation is shown in Fig. 7. The values

29N.K. Gupta et al. /Thin-Walled Structures 34 (1999) 21–41
Fig. 4. Axi-symmetric inward dimpling mode of collapse of specimen no. A5; top view (a), and bottomview (b).
of rp were measured at different stages of compression by interrupting the axialcompression of specimens in INSTRON machine. An equation for computingrp atany stage of deformation is obtained as:
rp 5Khc (4)
HereK andc are the constants obtained from the experimental data. Results of Eq.(4) are shown in Fig. 7 along with the results obtained from Eq. (3) for comparison.
2.4. Results from experiments
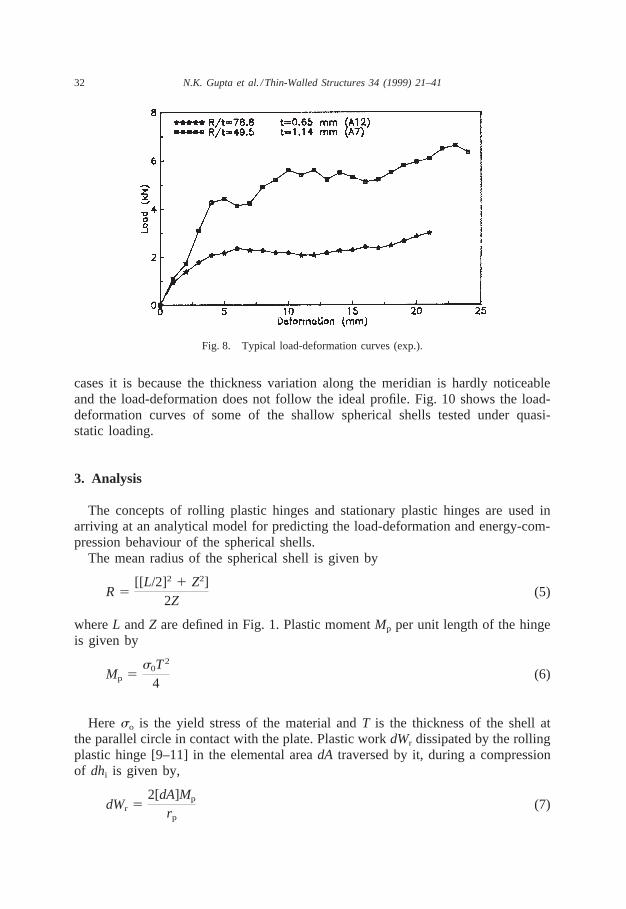
The typical load-deformation curves of spherical shell specimens obtained fromthe chart recorder of INSTRON machine are shown in Fig. 8. The shape of the load-

30 N.K. Gupta et al. /Thin-Walled Structures 34 (1999) 21–41
Fig. 5. Buckling of specimen no. A17 showing integral number of lobes and stationary hinges; top view(a), and bottom view (b).
deformation curve is an important characteristic for an energy absorber, as it is ameasure of the effectiveness of the structure in absorbing energy. An ideal energyabsorber has a square load-deformation curve, i.e., once the crush mode starts, (atpeak load) the collapse continues under the same load until the absorber is entirelyconsumed [1,2,8]. From Fig. 8 it can be observed that the load-deformation curvesresemble that of an ideal energy absorber, with negligible serrations. In case ofspherical shells of large thicknesses (A3, A4, A5) the load-deformation behaviourdeviates from an ideal profile (see Fig. 9(b)). The linear variation of thickness ofspherical shells along the meridian direction is responsible for the ideal load-defor-mation profile of the spherical shells. The load-deformation curves of a group ofspherical shells with different radii and constant thickness and vice versa obtainedfrom the experiments are shown in Fig. 9(a) and Fig. 9(b).
The load-deformation profiles obtained for the spherical shells of shallow depthshow clear variations from those of the spherical shells listed in Table 2. In these

31N.K. Gupta et al. /Thin-Walled Structures 34 (1999) 21–41
Fig. 6. Tested spherical shell specimens A7, A10, A14 and A15 showing stage III deformations.
Table 5Compression at which stationary hinges are initiated
Sp. No. R/t DepthZ (mm) h (mm) Z9%
A7 49.5 47.75 22.0 46.1A10 68.3 71.80 18.0 25.1A14 90.4 92.00 16.0 17.4A15 109.7 110.5 12 10.9
Z9 Deformation of shell as a percentage of total depth (Z) at which stationary hinges are initiated
Fig. 7. Typical variation of radius of rolling plastic hinge.
32 N.K. Gupta et al. /Thin-Walled Structures 34 (1999) 21–41
Fig. 8. Typical load-deformation curves (exp.).
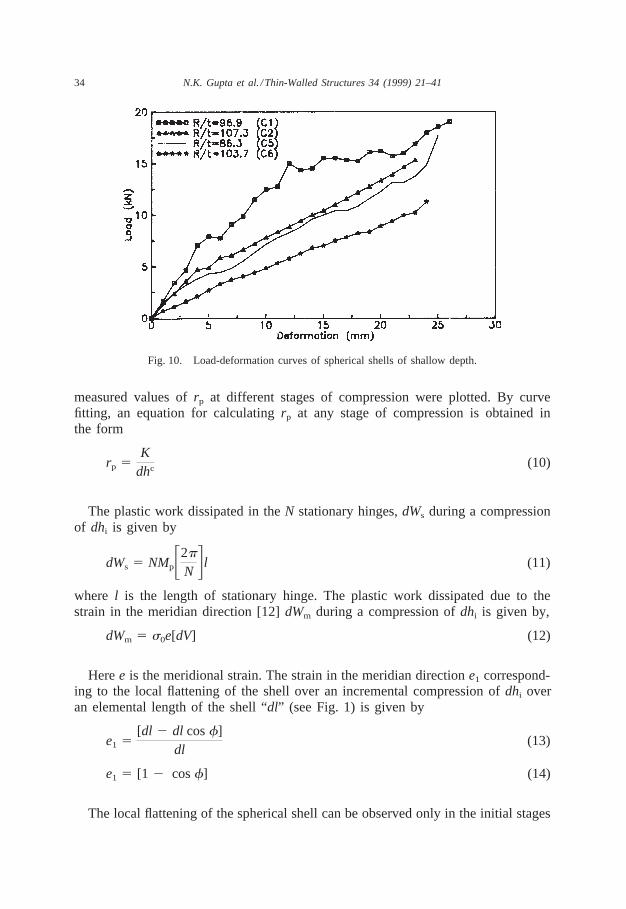
cases it is because the thickness variation along the meridian is hardly noticeableand the load-deformation does not follow the ideal profile. Fig. 10 shows the load-deformation curves of some of the shallow spherical shells tested under quasi-static loading.
3. Analysis
The concepts of rolling plastic hinges and stationary plastic hinges are used inarriving at an analytical model for predicting the load-deformation and energy-com-pression behaviour of the spherical shells.
The mean radius of the spherical shell is given by
R 5[[L/2]2 1 Z2]
2Z(5)
whereL andZ are defined in Fig. 1. Plastic momentMp per unit length of the hingeis given by
Mp 5s0T2
4(6)
Here so is the yield stress of the material andT is the thickness of the shell atthe parallel circle in contact with the plate. Plastic workdWr dissipated by the rollingplastic hinge [9–11] in the elemental areadA traversed by it, during a compressionof dhi is given by,
dWr 52[dA]Mp
rp(7)

33N.K. Gupta et al. /Thin-Walled Structures 34 (1999) 21–41
Fig. 9. Load-deformation curves of shells; (a) different radii and constant thickness, (b) different thick-nesses and constant radius.
whererp is the radius of the rolling plastic hinge. The mean radius “r” of the parallelcircle in contact with the plate for a compressionh, is given by
r 5 √h[2R 2 h] (8)
By calculating the value ofr at any stage of compression from Eq. (8), it ispossible to get the value ofdA for an incremental compression ofdhi, as:
dA 5 [2pr]R[df] (9)
Further to get the value ofrp at any stage of compression, the experimentally
34 N.K. Gupta et al. /Thin-Walled Structures 34 (1999) 21–41
Fig. 10. Load-deformation curves of spherical shells of shallow depth.
measured values ofrp at different stages of compression were plotted. By curvefitting, an equation for calculatingrp at any stage of compression is obtained inthe form
rp 5K
dhc (10)
The plastic work dissipated in theN stationary hinges,dWs during a compressionof dhi is given by
dWs 5 NMpF2p
N Gl (11)
where l is the length of stationary hinge. The plastic work dissipated due to thestrain in the meridian direction [12]dWm during a compression ofdhi is given by,
dWm 5 s0e[dV] (12)
Heree is the meridional strain. The strain in the meridian directione1 correspond-ing to the local flattening of the shell over an incremental compression ofdhi overan elemental length of the shell “dl” (see Fig. 1) is given by
e1 5[dl 2 dl cosf]
dl(13)
e1 5 [1 2 cosf] (14)
The local flattening of the spherical shell can be observed only in the initial stages
35N.K. Gupta et al. /Thin-Walled Structures 34 (1999) 21–41
of compression, and occurs only over a shallow range of compression. Further, asthe R/t value of the spherical shell increases, the range of compression over whichthe stage I deformation is observed, decreases. When once the deformation changesover to stage II, i.e., axi-symmetric inward dimpling, then the meridional strain willbe lesser than that given by Eq. (14). As such it is assumed that the meridional strainwill vary linearly with deformation. Based on this, it is assumed that the meridionalstrain will be maximum at the initiation of compression of the shell, and it is zeroat maximum compression equal to the radius of the spherical shell, i.e.,
e 5 e1F1 21mp
1mtG (15)
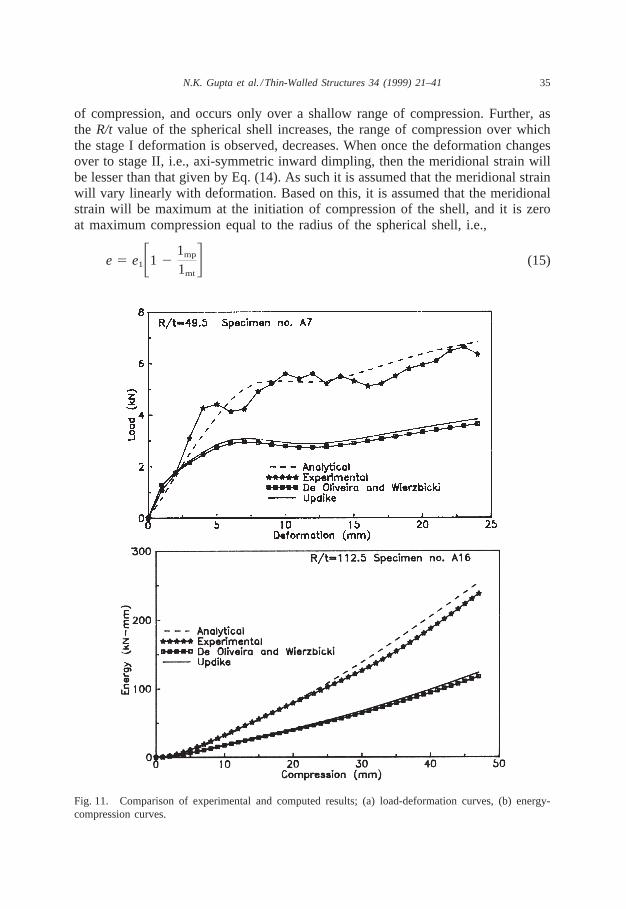
Fig. 11. Comparison of experimental and computed results; (a) load-deformation curves, (b) energy-compression curves.
36 N.K. Gupta et al. /Thin-Walled Structures 34 (1999) 21–41
Fig. 12. Experimental and computed load-deformation curves of spherical shell of shallow depth.
The load on the spherical shell at any stage of compression is given by
p 5[dWr 1 dWs 1 dWm]
dhi(16)
Thus the load-deformation curve is obtained from the above, and the energy-com-
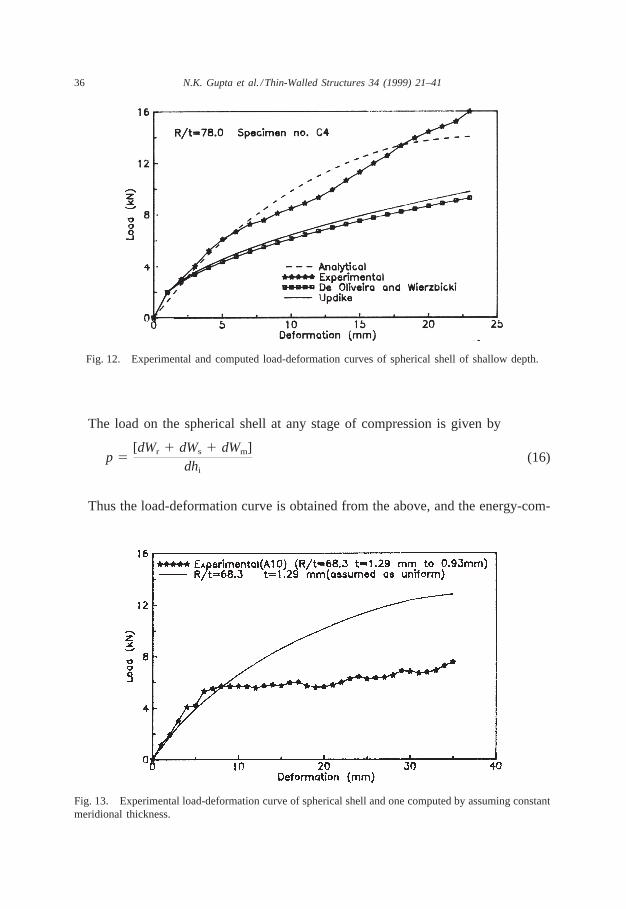
Fig. 13. Experimental load-deformation curve of spherical shell and one computed by assuming constantmeridional thickness.
37N.K. Gupta et al. /Thin-Walled Structures 34 (1999) 21–41
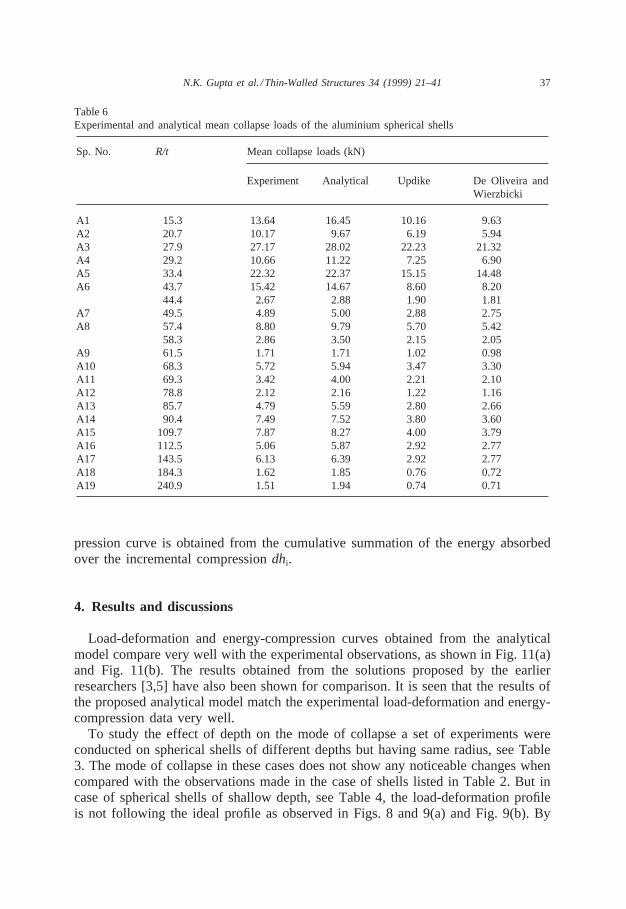
Table 6Experimental and analytical mean collapse loads of the aluminium spherical shells
Sp. No. R/t Mean collapse loads (kN)
Experiment Analytical Updike De Oliveira andWierzbicki
A1 15.3 13.64 16.45 10.16 9.63A2 20.7 10.17 9.67 6.19 5.94A3 27.9 27.17 28.02 22.23 21.32A4 29.2 10.66 11.22 7.25 6.90A5 33.4 22.32 22.37 15.15 14.48A6 43.7 15.42 14.67 8.60 8.20
44.4 2.67 2.88 1.90 1.81A7 49.5 4.89 5.00 2.88 2.75A8 57.4 8.80 9.79 5.70 5.42
58.3 2.86 3.50 2.15 2.05A9 61.5 1.71 1.71 1.02 0.98A10 68.3 5.72 5.94 3.47 3.30A11 69.3 3.42 4.00 2.21 2.10A12 78.8 2.12 2.16 1.22 1.16A13 85.7 4.79 5.59 2.80 2.66A14 90.4 7.49 7.52 3.80 3.60A15 109.7 7.87 8.27 4.00 3.79A16 112.5 5.06 5.87 2.92 2.77A17 143.5 6.13 6.39 2.92 2.77A18 184.3 1.62 1.85 0.76 0.72A19 240.9 1.51 1.94 0.74 0.71
pression curve is obtained from the cumulative summation of the energy absorbedover the incremental compressiondhi.
4. Results and discussions
Load-deformation and energy-compression curves obtained from the analyticalmodel compare very well with the experimental observations, as shown in Fig. 11(a)and Fig. 11(b). The results obtained from the solutions proposed by the earlierresearchers [3,5] have also been shown for comparison. It is seen that the results ofthe proposed analytical model match the experimental load-deformation and energy-compression data very well.
To study the effect of depth on the mode of collapse a set of experiments wereconducted on spherical shells of different depths but having same radius, see Table3. The mode of collapse in these cases does not show any noticeable changes whencompared with the observations made in the case of shells listed in Table 2. But incase of spherical shells of shallow depth, see Table 4, the load-deformation profileis not following the ideal profile as observed in Figs. 8 and 9(a) and Fig. 9(b). By

38 N.K. Gupta et al. /Thin-Walled Structures 34 (1999) 21–41
Table 7Experimental and analytical mean collapse loads of aluminium spherical shells with same radius, thick-ness, and different depths
Sp. No. SpanL DepthZ RadiusR t (mm) R/t Mean collapse load(mm) (mm) (mm) (kN)
Exp. Ana.
B1 127.50 30.30 78.20 0.98 89.8 3.26 3.02B2 141.92 46.67 77.30 0.87 88.8 3.72 3.29B3 152.40 67.31 76.80 0.90 85.3 4.36 4.75B4 154.56 72.80 78.00 0.91 85.7 4.79 5.59
Table 8Experimental and analytical mean collapse loads of spherical shells of shallow depths
Sp. No. Mat. DepthZ RadiusR t (mm) R/t Mean collapse load(mm) (mm) (kN)
Exp. Ana.
Specimens tested as received (without annealing)C1 M S 50.36 78.80 0.81 96.9 12.32 13.97C2 G I 47.29 78.32 0.73 107.3 9.24 9.83C3 G I 37.28 70.83 0.97 70.8 11.81 11.84C4 G I 32.56 57.72 0.74 78.0 6.83 7.73Specimens tested after annealingC5 M S 51.14 79.41 0.92 86.3 8.29 9.88C6 G I 47.29 80.56 0.78 103.7 7.27 7.18C7 G I 37.71 68.24 0.96 71.1 7.17 7.45C8 G I 30.90 60.03 0.78 77.0 4.04 4.86C9 Alu. 46.67 77.30 0.87 88.8 3.72 3.29C10 Alu. 30.30 78.20 0.98 89.8 3.26 3.02
Mat.: Material, M S: Mild Steel, G I: Galvanised Steel, Alu.: Aluminium Exp.: Experimental Ana.: Ana-lytical
keeping the thickness constant the analytical model described above can be used forthe prediction of the load-deformation as well as the energy-compression curves ofthe spherical shells of the shallow depth (see Fig. 12). From Fig. 11 it can be seenthat the analytical predictions match well with the experimental observations. Fig. 13shows the difference in the load-deformation behaviour due to the assumed uniformthickness and varying thickness of the shell.
The mean collapse loads for the spherical shells have been calculated both fromthe experimental observations and from the analytical model. Tables 6–8 give themean collapse loads as obtained actually from the experiments and from the analyti-cal model. The yield stress values of different aluminium sheets show considerablevariation, see Table 1. To carry out the comparative study, the mean collapse loads

39N.K. Gupta et al. /Thin-Walled Structures 34 (1999) 21–41
were normalised for an yield stress of 75 MPa, in case of aluminium spherical shells.Fig. 14(a) and Fig. 14(b) show the variation of mean collapse load with differentradii and constant thickness, and vice versa. From Fig. 9(a), Fig. 9(b) and Fig. 14(a),Fig. 14(b) it can be seen that the thickness of the spherical shell influences the modeof collapse as well as on the load-deformation curve. Fig. 15(a) and Fig. 15(b) showthe energy-compression curves of aluminium spherical shells.
5. Conclusions
Aluminium spherical shells ofR/t values ranging from 15 to 240 and a few spheri-cal shells of shallow depth were tested for axial compression in an INSTRON
Fig. 14. Variation of mean collapse load withR/t values of the spherical shells; (a) different radii andconstant thickness, (b) different thicknesses and constant radius.

40 N.K. Gupta et al. /Thin-Walled Structures 34 (1999) 21–41
Fig. 15. Energy-compression curves of shells; (a) different radii and constant thickness, (b) differentthicknesses and constant radius.
machine. Their typical modes of collapse and load-deformation curves are presented.A simple analytical model is also presented to predict the load-deformation andenergy-compression behaviour. From Fig. 11(a) and Fig. 11(b) one can observematching between experimental results and results predicted from analytical model.Further it can be seen from Fig. 8 and Fig. 9(a) and Fig. 9(b) that the load-defor-mation profiles of spherical shells resemble a square wave profile and as such thespherical shells can be ideal energy absorbers. From Fig. 13 we can see that thethickness variation in the meridian direction contributes to making the curve flat.
The mode of deformation of a spherical shell is highly dependent onR/t of theshell. For its high values (greater than 50)mode III deformations prevails over a large

41N.K. Gupta et al. /Thin-Walled Structures 34 (1999) 21–41
range. For intermediateR/t values (greater than 10 up to 50)mode II deformationsare predominant.
The mean collapse loads for the spherical shells tested have been calculated fromthe load-deformation curves. The analytical and experimental mean collapse loadvalues for spherical shells tested, match well, as seen in Tables 6–8.
References
[1] Arthur A, Ezra, Fay RJ. An assessment of energy absorbing devices for prospective use in aircraftimpact situations. In: Herrmann G, Perrone N, editors. Dynamic response of structures. 1972:225–246. Poc. of a symposium held at Stanford University, California, June 28 and 29, 1971.
[2] Johnson W, Reid SR. Metallic energy dissipating systems. Applied Mechanics Reviews1978;31:277–88.
[3] Updike DP. On the large deformation of a rigid-plastic spherical shell compressed by a rigid plate.J. of Engineering for Industry 1972;94:949–955.
[4] Kitching R, Houlston R, Johnson W. A theoretical and experimental study of hemispherical shellssubjected to axial loads between flat plates. Int. J. of Mech. Sci 1975;17:693–703.
[5] De Oliveira JG, Wierzbicki T. Crushing analysis of rotationally symmetric plastic shells. J. of StrainAnalysis 1982;17:229–36.
[6] Kinead AN, Jennings A, Newell J, Leinster JC. Spherical shells in inelastic collision with a rigidwall-Tentative analysis and recent quasi-static testing. J. of Strain Analysis 1994;29:17–41.
[7] Blachut J, Galletly GD. Buckling strength of imperfect steel hemispheres. Thin Walled Structures1995;23:1–20.
[8] Thornton PH, Edwards PJ. Energy absorption in composite tubes. J. of Compos. Mat1982;16:521–45.
[9] Gupta NK, Atul K. Lateral crushing of square and rectangular tubes by non-orthogonally placednarrow width indentors. Int. J. of Mech. Sci 1995;37:31–50.
[10] Gupta NK, Sinha SK. Collapse of a laterally compressed square tube resting on a flat base. Int. J.of Sol. Struct 1990;26(5/6):601–15.
[11] Meng Q, Al-Hassani STS, Soden PD. Axial crushing of square tubes. Int. J. of Mech. Sci1983;25:747–73.
[12] Gupta NK, Velmurugan R, Gupta SK, An analysis of axial crushing of composite tubes. J. of Com-pos. Mat. 1997. (Accepted for publication).