AV45 Uptake in the Double Transgenic TASTPM Mouse Model
12
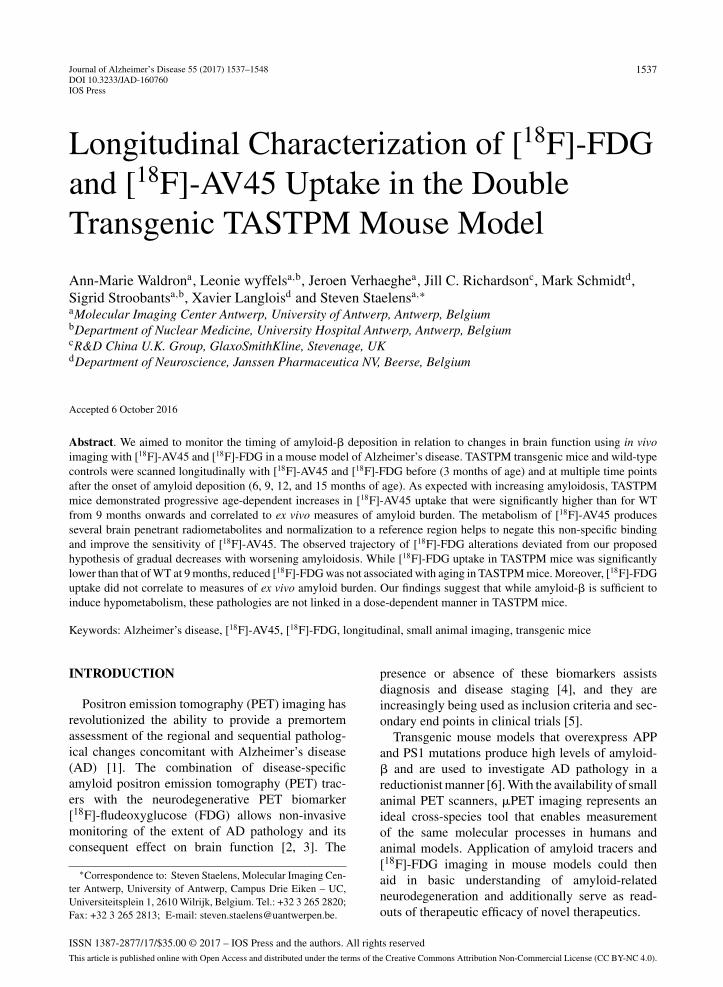
Journal of Alzheimer’s Disease 55 (2017) 1537–1548 DOI 10.3233/JAD-160760 IOS Press 1537 Longitudinal Characterization of [ 18 F]-FDG and [ 18 F]-AV45 Uptake in the Double Transgenic TASTPM Mouse Model Ann-Marie Waldron a , Leonie wyffels a,b , Jeroen Verhaeghe a , Jill C. Richardson c , Mark Schmidt d , Sigrid Stroobants a,b , Xavier Langlois d and Steven Staelens a,∗ a Molecular Imaging Center Antwerp, University of Antwerp, Antwerp, Belgium b Department of Nuclear Medicine, University Hospital Antwerp, Antwerp, Belgium c R&D China U.K. Group, GlaxoSmithKline, Stevenage, UK d Department of Neuroscience, Janssen Pharmaceutica NV, Beerse, Belgium Accepted 6 October 2016 Abstract. We aimed to monitor the timing of amyloid- deposition in relation to changes in brain function using in vivo imaging with [ 18 F]-AV45 and [ 18 F]-FDG in a mouse model of Alzheimer’s disease. TASTPM transgenic mice and wild-type controls were scanned longitudinally with [ 18 F]-AV45 and [ 18 F]-FDG before (3 months of age) and at multiple time points after the onset of amyloid deposition (6, 9, 12, and 15 months of age). As expected with increasing amyloidosis, TASTPM mice demonstrated progressive age-dependent increases in [ 18 F]-AV45 uptake that were significantly higher than for WT from 9 months onwards and correlated to ex vivo measures of amyloid burden. The metabolism of [ 18 F]-AV45 produces several brain penetrant radiometabolites and normalization to a reference region helps to negate this non-specific binding and improve the sensitivity of [ 18 F]-AV45. The observed trajectory of [ 18 F]-FDG alterations deviated from our proposed hypothesis of gradual decreases with worsening amyloidosis. While [ 18 F]-FDG uptake in TASTPM mice was significantly lower than that of WT at 9 months, reduced [ 18 F]-FDG was not associated with aging in TASTPM mice. Moreover, [ 18 F]-FDG uptake did not correlate to measures of ex vivo amyloid burden. Our findings suggest that while amyloid- is sufficient to induce hypometabolism, these pathologies are not linked in a dose-dependent manner in TASTPM mice. Keywords: Alzheimer’s disease, [ 18 F]-AV45, [ 18 F]-FDG, longitudinal, small animal imaging, transgenic mice INTRODUCTION Positron emission tomography (PET) imaging has revolutionized the ability to provide a premortem assessment of the regional and sequential patholog- ical changes concomitant with Alzheimer’s disease (AD) [1]. The combination of disease-specific amyloid positron emission tomography (PET) trac- ers with the neurodegenerative PET biomarker [ 18 F]-fludeoxyglucose (FDG) allows non-invasive monitoring of the extent of AD pathology and its consequent effect on brain function [2, 3]. The ∗ Correspondence to: Steven Staelens, Molecular Imaging Cen- ter Antwerp, University of Antwerp, Campus Drie Eiken – UC, Universiteitsplein 1, 2610 Wilrijk, Belgium. Tel.: +32 3 265 2820; Fax: +32 3 265 2813; E-mail: [email protected]. presence or absence of these biomarkers assists diagnosis and disease staging [4], and they are increasingly being used as inclusion criteria and sec- ondary end points in clinical trials [5]. Transgenic mouse models that overexpress APP and PS1 mutations produce high levels of amyloid- and are used to investigate AD pathology in a reductionist manner [6]. With the availability of small animal PET scanners, PET imaging represents an ideal cross-species tool that enables measurement of the same molecular processes in humans and animal models. Application of amyloid tracers and [ 18 F]-FDG imaging in mouse models could then aid in basic understanding of amyloid-related neurodegeneration and additionally serve as read- outs of therapeutic efficacy of novel therapeutics. ISSN 1387-2877/17/$35.00 © 2017 – IOS Press and the authors. All rights reserved This article is published online with Open Access and distributed under the terms of the Creative Commons Attribution Non-Commercial License (CC BY-NC 4.0).
-
Upload
khangminh22 -
Category
Documents
-
view
1 -
download
0
Transcript of AV45 Uptake in the Double Transgenic TASTPM Mouse Model
Journal of Alzheimer’s Disease 55 (2017) 1537–1548DOI 10.3233/JAD-160760IOS Press
1537
Longitudinal Characterization of [18F]-FDGand [18F]-AV45 Uptake in the DoubleTransgenic TASTPM Mouse Model
Ann-Marie Waldrona, Leonie wyffelsa,b, Jeroen Verhaeghea, Jill C. Richardsonc, Mark Schmidtd,Sigrid Stroobantsa,b, Xavier Langloisd and Steven Staelensa,∗aMolecular Imaging Center Antwerp, University of Antwerp, Antwerp, BelgiumbDepartment of Nuclear Medicine, University Hospital Antwerp, Antwerp, BelgiumcR&D China U.K. Group, GlaxoSmithKline, Stevenage, UKdDepartment of Neuroscience, Janssen Pharmaceutica NV, Beerse, Belgium
Accepted 6 October 2016
Abstract. We aimed to monitor the timing of amyloid-� deposition in relation to changes in brain function using in vivoimaging with [18F]-AV45 and [18F]-FDG in a mouse model of Alzheimer’s disease. TASTPM transgenic mice and wild-typecontrols were scanned longitudinally with [18F]-AV45 and [18F]-FDG before (3 months of age) and at multiple time pointsafter the onset of amyloid deposition (6, 9, 12, and 15 months of age). As expected with increasing amyloidosis, TASTPMmice demonstrated progressive age-dependent increases in [18F]-AV45 uptake that were significantly higher than for WTfrom 9 months onwards and correlated to ex vivo measures of amyloid burden. The metabolism of [18F]-AV45 producesseveral brain penetrant radiometabolites and normalization to a reference region helps to negate this non-specific bindingand improve the sensitivity of [18F]-AV45. The observed trajectory of [18F]-FDG alterations deviated from our proposedhypothesis of gradual decreases with worsening amyloidosis. While [18F]-FDG uptake in TASTPM mice was significantlylower than that of WT at 9 months, reduced [18F]-FDG was not associated with aging in TASTPM mice. Moreover, [18F]-FDGuptake did not correlate to measures of ex vivo amyloid burden. Our findings suggest that while amyloid-� is sufficient toinduce hypometabolism, these pathologies are not linked in a dose-dependent manner in TASTPM mice.
Keywords: Alzheimer’s disease, [18F]-AV45, [18F]-FDG, longitudinal, small animal imaging, transgenic mice
INTRODUCTION
Positron emission tomography (PET) imaging hasrevolutionized the ability to provide a premortemassessment of the regional and sequential patholog-ical changes concomitant with Alzheimer’s disease(AD) [1]. The combination of disease-specificamyloid positron emission tomography (PET) trac-ers with the neurodegenerative PET biomarker[18F]-fludeoxyglucose (FDG) allows non-invasivemonitoring of the extent of AD pathology and itsconsequent effect on brain function [2, 3]. The
∗Correspondence to: Steven Staelens, Molecular Imaging Cen-ter Antwerp, University of Antwerp, Campus Drie Eiken – UC,Universiteitsplein 1, 2610 Wilrijk, Belgium. Tel.: +32 3 265 2820;Fax: +32 3 265 2813; E-mail: [email protected].
presence or absence of these biomarkers assistsdiagnosis and disease staging [4], and they areincreasingly being used as inclusion criteria and sec-ondary end points in clinical trials [5].
Transgenic mouse models that overexpress APPand PS1 mutations produce high levels of amyloid-� and are used to investigate AD pathology in areductionist manner [6]. With the availability of smallanimal PET scanners, �PET imaging represents anideal cross-species tool that enables measurementof the same molecular processes in humans andanimal models. Application of amyloid tracers and[18F]-FDG imaging in mouse models could thenaid in basic understanding of amyloid-relatedneurodegeneration and additionally serve as read-outs of therapeutic efficacy of novel therapeutics.
ISSN 1387-2877/17/$35.00 © 2017 – IOS Press and the authors. All rights reservedThis article is published online with Open Access and distributed under the terms of the Creative Commons Attribution Non-Commercial License (CC BY-NC 4.0).
1538 A.-M. Waldron et al. / Longitudinal Imaging of TASTPM Mice
With this prospect of improving translation frombasic to clinical research, �PET imaging has becomea thriving field in AD. Notwithstanding some initialnegative findings [7–9], amyloid imaging has beensuccessfully back-translated in a number of mousemodels [10–13]. Similar to the clinical situation,research has now moved from validating to improv-ing this technology. We, and others, have previouslydescribed discrepancies between in vivo uptake ofamyloid tracers and gold standard ex vivo autoradio-graphy [10, 11] and histology [14–16] hypothesizedto derive from two main factors. The first relates topartial volume and spill over effects (PVE). While�PET systems have superior resolution to their clin-ical counterparts, it is insufficient in relation to thesmall size of mouse brain structures resulting in dif-ficulties with accurate radioactivity measurements[17]. A second and related issue is that of highnon-specific white matter uptake of amyloid tracers[18], especially in the case of [18F]-florbetaben and[18F]-AV45 whose metabolism is known to result inbrain penetrant radiometabolites [19, 20]. Methods tocounteract these effects are required so that preclini-cal amyloid imaging can sensitively monitor changesin amyloid burden in relation to disease progressionand therapeutic response.
While small animal amyloid imaging has madeconsiderable progression, the utility of [18F]-FDGas a preclinical biomarker is disputed. Although theclinical phenotype of decreased [18F]-FDG uptakehas been reported in mouse models of AD [15, 16,21, 22], an equal proportion of studies have reportedincreased [18F]-FDG uptake [23–26]. Associationstudies of amyloid and hypometabolism in patientsare complicated by the heterogenity of [18F]-FDGuptake, which is influenced by factors such as age,genetics, comorbidities, and education levels. In thiscontext, animal models have a clear advantage interms of standardization of genetic and environmen-tal backgrounds. Moreover, a number of therapiesthat reduced amyloid failed to demonstrate a benefiton cognition [27, 28]. Thus while amyloid imag-ing can provide a measure of target engagement foranti-amyloid treatments, [18F]-FDG would provideinsight into preservation of brain function, a moremeaningful correlate to cognitive improvement.
To better formulate the strengths and limitationsof amyloid tracers and [18F]-FDG as translationalbiomarkers,wehereinconducteda longitudinal�PETstudy in TASTPM mice. We have previously foundthat TASTPM mice demonstrate increased [18F]-AV45 retention and decreased [18F]-FDG at old
age [15] and thus present a suitable model forour purposes. TASTPM mice and wild-type (WT)controls were scanned at multiple time points tocover the pathological spectrum. We hypothesizedthat TASTPM mice would demonstrate an age-related increase in [18F]-AV45 uptake and progressivedecreases in [18F]-FDG uptake due to worseningdisease. In relation to [18F]-AV45 we conjointlyprobed a number of issues related to sensitivity. Theseincluded a metabolite study to quantify the con-tribution of radiometabolites to brain imaging andadditionallyanassessmentof theabilityofcorrectionsfor PVE (PVEC) and reference region normalizationto improve early detection of amyloid pathology.
MATERIALS AND METHODS
Animals
TASTPM mice and their WT controls (C57BL/6J)were received in kind from GlaxoSmithKline (Steve-nage, UK) through the PharmaCog consortium.TASTPM mice express human mutant amyloidprecursor protein (hAPP695swe) and presenilin-1(M146V) under the control of the neuron specificThy-1 promoter on a C57BL/6J background anddevelop insoluble amyloid-� deposition as of 4months of age [29]. A total of 44 male mice (22WT and 22 TASTPM) were included in the imag-ing experiment. Male mice were chosen due to theirlower mortality rate than females. During the courseof the imaging study, 5 transgenic mice died prema-turely. Additionally, at every time point an n = 3 foreach genotype were sacrificed for histology (animalschosen at random). Table 1 displays the number ofanimals scanned at each time point and the averageweight per genotype.
The metabolite study was performed using 3-month-old male C57BL/6J mice (n = 11, HarlanLaboratories, The Netherlands) and a separate agedcohort of 15-month-old WT and TASTPM mice (bothn = 11). All animal work was performed in accor-dance with the European Ethics Committee (decree86/609/CEE). The study protocol was approved bythe local Animal Experimental Ethical Committee ofthe University of Antwerp, Belgium (2012-25).
Tracer radiosynthesis
[18F]-AV45 was synthesized from the tosy-loxy precursor AV-105 by modification of themethod described by Yao and coworkers [30] on a
A.-M. Waldron et al. / Longitudinal Imaging of TASTPM Mice 1539
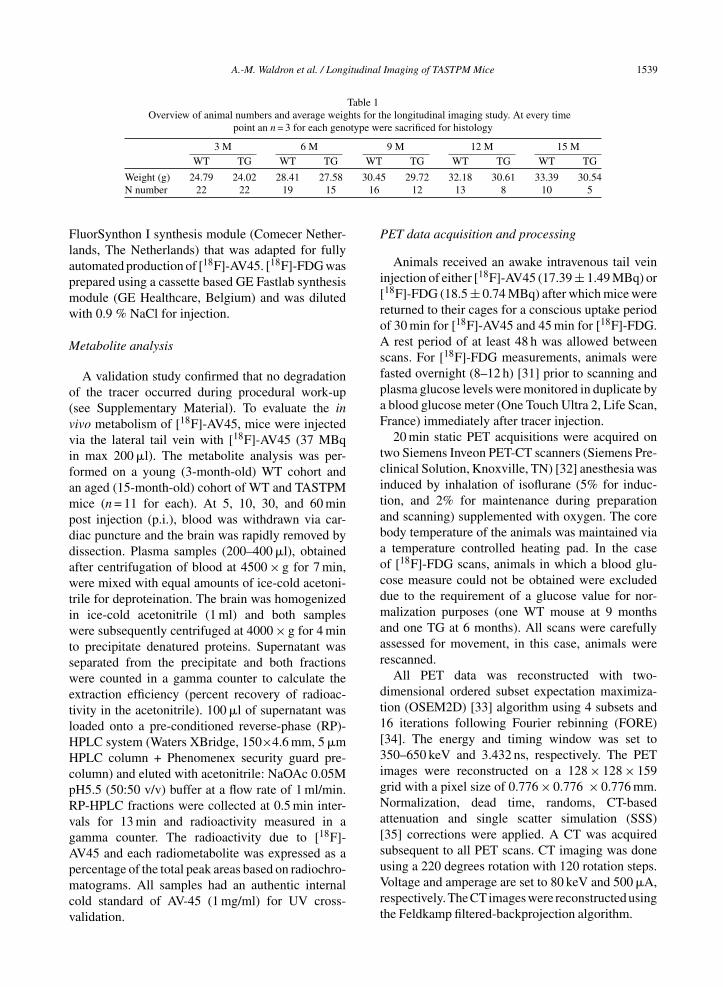
Table 1Overview of animal numbers and average weights for the longitudinal imaging study. At every time
point an n = 3 for each genotype were sacrificed for histology
3 M 6 M 9 M 12 M 15 MWT TG WT TG WT TG WT TG WT TG
Weight (g) 24.79 24.02 28.41 27.58 30.45 29.72 32.18 30.61 33.39 30.54N number 22 22 19 15 16 12 13 8 10 5
FluorSynthon I synthesis module (Comecer Nether-lands, The Netherlands) that was adapted for fullyautomated production of [18F]-AV45. [18F]-FDG wasprepared using a cassette based GE Fastlab synthesismodule (GE Healthcare, Belgium) and was dilutedwith 0.9 % NaCl for injection.
Metabolite analysis
A validation study confirmed that no degradationof the tracer occurred during procedural work-up(see Supplementary Material). To evaluate the invivo metabolism of [18F]-AV45, mice were injectedvia the lateral tail vein with [18F]-AV45 (37 MBqin max 200 �l). The metabolite analysis was per-formed on a young (3-month-old) WT cohort andan aged (15-month-old) cohort of WT and TASTPMmice (n = 11 for each). At 5, 10, 30, and 60 minpost injection (p.i.), blood was withdrawn via car-diac puncture and the brain was rapidly removed bydissection. Plasma samples (200–400 �l), obtainedafter centrifugation of blood at 4500 × g for 7 min,were mixed with equal amounts of ice-cold acetoni-trile for deproteination. The brain was homogenizedin ice-cold acetonitrile (1 ml) and both sampleswere subsequently centrifuged at 4000 × g for 4 minto precipitate denatured proteins. Supernatant wasseparated from the precipitate and both fractionswere counted in a gamma counter to calculate theextraction efficiency (percent recovery of radioac-tivity in the acetonitrile). 100 �l of supernatant wasloaded onto a pre-conditioned reverse-phase (RP)-HPLC system (Waters XBridge, 150×4.6 mm, 5 �mHPLC column + Phenomenex security guard pre-column) and eluted with acetonitrile: NaOAc 0.05MpH5.5 (50:50 v/v) buffer at a flow rate of 1 ml/min.RP-HPLC fractions were collected at 0.5 min inter-vals for 13 min and radioactivity measured in agamma counter. The radioactivity due to [18F]-AV45 and each radiometabolite was expressed as apercentage of the total peak areas based on radiochro-matograms. All samples had an authentic internalcold standard of AV-45 (1 mg/ml) for UV cross-validation.
PET data acquisition and processing
Animals received an awake intravenous tail veininjection of either [18F]-AV45 (17.39 ± 1.49 MBq) or[18F]-FDG (18.5 ± 0.74 MBq) after which mice werereturned to their cages for a conscious uptake periodof 30 min for [18F]-AV45 and 45 min for [18F]-FDG.A rest period of at least 48 h was allowed betweenscans. For [18F]-FDG measurements, animals werefasted overnight (8–12 h) [31] prior to scanning andplasma glucose levels were monitored in duplicate bya blood glucose meter (One Touch Ultra 2, Life Scan,France) immediately after tracer injection.
20 min static PET acquisitions were acquired ontwo Siemens Inveon PET-CT scanners (Siemens Pre-clinical Solution, Knoxville, TN) [32] anesthesia wasinduced by inhalation of isoflurane (5% for induc-tion, and 2% for maintenance during preparationand scanning) supplemented with oxygen. The corebody temperature of the animals was maintained viaa temperature controlled heating pad. In the caseof [18F]-FDG scans, animals in which a blood glu-cose measure could not be obtained were excludeddue to the requirement of a glucose value for nor-malization purposes (one WT mouse at 9 monthsand one TG at 6 months). All scans were carefullyassessed for movement, in this case, animals wererescanned.
All PET data was reconstructed with two-dimensional ordered subset expectation maximiza-tion (OSEM2D) [33] algorithm using 4 subsets and16 iterations following Fourier rebinning (FORE)[34]. The energy and timing window was set to350–650 keV and 3.432 ns, respectively. The PETimages were reconstructed on a 128 × 128 × 159grid with a pixel size of 0.776 × 0.776 × 0.776 mm.Normalization, dead time, randoms, CT-basedattenuation and single scatter simulation (SSS)[35] corrections were applied. A CT was acquiredsubsequent to all PET scans. CT imaging was doneusing a 220 degrees rotation with 120 rotation steps.Voltage and amperage are set to 80 keV and 500 �A,respectively. The CT images were reconstructed usingthe Feldkamp filtered-backprojection algorithm.
1540 A.-M. Waldron et al. / Longitudinal Imaging of TASTPM Mice
Image processing was performed in PMOD v3.3(PMOD technologies, Switzerland). Individual PETimages were spatially normalized into the space ofa predefined mouse brain template [36] by matchingthe individual animal specific CT to the CT templatethrough rigid and elastic transformations and apply-ing the same transform to the PET which is by defaultmatched to its CT via the PET/CT scanner hardware.Processed images were subsequently co-registeredwith a predefined mouse brain volume-of-interest(VOI) template aligned with the aforementioned Mir-rione CT/MRI atlas and tracer uptake values wereextracted for each delineated VOI.
VOI-based partial volume effect correction wasperformed using the built-in function in PMOD[37] with the Mirrione mouse brain template.PVEC was performed using a spatial resolution of1.5 mm × 1.5 mm × 1.5 mm isotropically and spa-tially invariant in PET space. Therefore, the VOItemplate is transformed back using the non-rigidinverse transform of the previous matching for theindividual CT scan to the template. A comparison ofanalysis methods for quantifying [18F]-AV45 uptakecan be found in the Supplementary Material.
[18F]AV45 uptake was quantified as i) the per-cent injected dose (tissue uptake[kBq/cc]/injecteddose[kBq] ∗ 100) and ii) additionally by cerebel-lar normalization. [18F]-FDG uptake was quantifiedas glucose-corrected SUV (tissue uptake[kBq/cc]* blood glucose[mg/dl]/injected dose[kBq] ∗ bodyweight[g]), albeit not normalized as the cerebellumis not a reliable reference region for [18F]-FDG brain�PET [38].
Immunohistochemistry
Animals were sacrificed and brain tissue wasfixed, paraffin-embedded and cut into 5 �m coro-nal sections. Sections were de-waxed with xyleneand rehydrated by submerging in a graded seriesof ethanol with decreasing concentrations. First sec-tions were bleached with potassium permanganate(3 min), rinsed in water (1 min), decolorized in oxalicacid (1 min) and rinsed again (1 min). Thereafter anti-gen retrieval was performed at room temperatureby immersion in formic acid (10 min). Endogenousperoxidase activity was quenched by rinsing in per-oxidase blocking solution (DAKO S2023) (5 min).Sections were then incubated with 4G8 primaryantibody (Eurogentec SIG-39200, 1/20, 000) for30 min (2 cycles of 15 min with rinse between incu-bations). Following this, sections were thoroughly
rinsed in wash buffer and subsequently incubated inperoxidase coupled secondary antibody (30 min)(Envision Mouse). Sections were washed in bufferand immunodetection was performed by treatmentwith the chromogenic 3-3 diaminobenzidine (DAB)solution. Finally sections were counterstained withhematoxylin, dehydrated by submerging in a series ofethanol, fixed in xylene, mounted, and coverslipped.For sections stained for amyloid-�, virtual imageswere acquired using a Mirax Digital Slide Scanner(Carl Zeiss) and image analysis was performed usingthe Definiens analysis software package v1.5.
Statistics
Statistical analysis was conducted in JMP pro Ver-sion12(SASInstitute Inc.,USA)andGraphPadPrismv6 (GraphPad Software, USA). To assess quantifica-tion methods of [18F]-AV45 we compared the meandifference between WT and TASTPM uptake and thencalculated the percentage difference between meth-ods as (New data – original data)/(New data + originaldata)/2*100.The“originaldata” refers to [18F]-AV45quantified as %ID/g and “new data” refers to PVEcorrected or PVE corrected and cerebellar normal-ized data. For the longitudinal study, we fitted a linearmixed model to investigate the relationship betweentracer uptake ([18F]-FDG or [18F]-AV45), age andgenotype. This method was chosen as it accounts formissing data, unbalanced designs and repeated obser-vations within the same individual. Age and genotypewere entered as “fixed effects” and mouse ID wasincorporated as a random intercept (“random effect”)to model subject specific responses. We addition-ally tested for age*genotype interactions within thismodel. Pairwise differences in tracer uptake betweengenotypes at each time point were investigated usingmultiple unpaired t-tests (with Sidak-Bonferroni cor-rection). The correlation of �PET data to ex vivohistology was expressed using Pearson’s correlationcoefficient. Assumptions for the use of parametrict-tests and Pearson’s correlation were met. Signifi-cance levels are given to four decimal points.
RESULTS
[18F]-AV45 undergoes rapid peripheralmetabolism with production of severalbrain penetrant metabolites
Four main radiometabolite peaks were detectedin both the brain and plasma eluting with retention

A.-M. Waldron et al. / Longitudinal Imaging of TASTPM Mice 1541
Fig. 1. [18F]-AV45 is rapidly metabolized with production of sev-eral radiometabolites. Young WT mice were injected with 37 Mbqi.v of [18F]AV45 and sacrificed at multiple time points p.i. Thegraphs show the average percentage of intact [18F]-AV45 andradiometabolites in (A) the plasma and (B) the brain as a func-tion of time. Data is presented as % peak area (mean) in theradiochromatogram. Data is presented as the mean.
times (Rt) of 1.6 min (M1), 1.85 min (M2), 3 min(M3), and 3.8 min (M4). An additional radiometabo-lite was observed in the brain eluting at 6.4 min(M5) very close to the intact tracer. Representa-tive radiochromatograms for plasma and brain at30 min p.i. are shown in Supplementary Figure 2.Figure 1A depicts the detection of [18F]-AV45 andradiometabolites in plasma of healthy young WTmice. Intact [18F]-AV45 accounted for 27.1 ± 7.3%of total radioactivity at 5 min p.i. decreasing rapidlyto 7.9 ± 0.73% at 10 min p.i., 4.5 ± 1.8% (n = 2)and 5.21% (n = 1) at 30 and 60 min p.i., respec-tively. The most polar radiometabolite M1 accountedfor the majority of plasma radioactivity at all timepoints increasing from 33.4 ± 11.3% at 5 min p.i. to60.4 ± 7.4% at 60 min p.i.
Figure 1B illustrates the uptake of [18F]-AV45and radiometabolites in the brain of young WTmice. At 5 min p.i. levels of intact tracer in thebrain were comparable to that detected in the plasma(28.6 ± 1.9% and 27.1 ± 7.3%, respectively). At alllater time points, intact tracer levels were higherin the brain representing 24.6 ± 7.6%, 10.6 ± 4.3%,and 11.0 ± 1.4% of total radioactivity at 10, 30,and 60 min p.i., respectively. M3 was the dominantmetabolite in the brain with highest levels at 10 and30 min pi (35.6 ± 3.6% and 37.7 ± 3.2%) then declin-ing to 26.6 ± 1.7% at 60 min p.i. The most polarmetabolite M1 accumulated appreciably over timerepresenting 23.61 ± 2.2% of total brain radioactiv-
Fig. 2. Longitudinal imaging of [18F]-AV45 uptake in WT and TASTPM mice. Average �PET images of [18F]-AV45 uptake in WT andTASTPM mice at each time point. [18F]-AV45 uptake was corrected for injected dose and normalized to the cerebellum. �PET images areoverlaid on a T2-weighted MRI template for anatomic localization. 3 months (TASTPM = 22, WT = 22), 6 months (TASTPM = 15, WT = 19),9 months (TASTPM = 12, WT = 16), 12 months (TASTPM = 8, WT = 13), 15 months (TASTPM = 5, WT = 10).
1542 A.-M. Waldron et al. / Longitudinal Imaging of TASTPM Mice
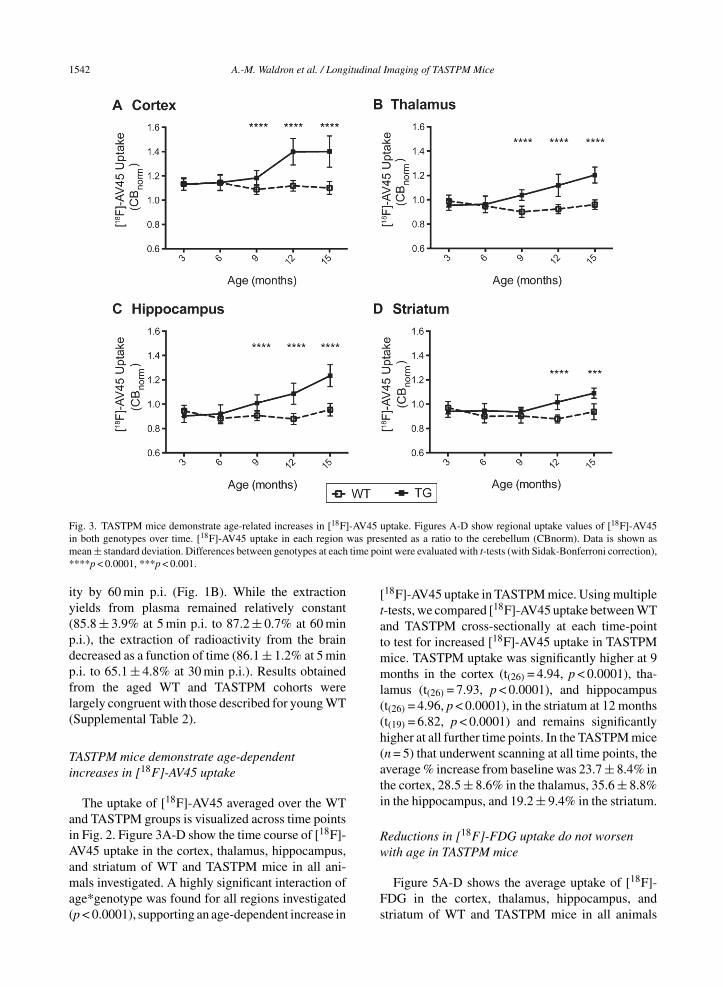
Fig. 3. TASTPM mice demonstrate age-related increases in [18F]-AV45 uptake. Figures A-D show regional uptake values of [18F]-AV45in both genotypes over time. [18F]-AV45 uptake in each region was presented as a ratio to the cerebellum (CBnorm). Data is shown asmean ± standard deviation. Differences between genotypes at each time point were evaluated with t-tests (with Sidak-Bonferroni correction),****p < 0.0001, ***p < 0.001.
ity by 60 min p.i. (Fig. 1B). While the extractionyields from plasma remained relatively constant(85.8 ± 3.9% at 5 min p.i. to 87.2 ± 0.7% at 60 minp.i.), the extraction of radioactivity from the braindecreased as a function of time (86.1 ± 1.2% at 5 minp.i. to 65.1 ± 4.8% at 30 min p.i.). Results obtainedfrom the aged WT and TASTPM cohorts werelargely congruent with those described for young WT(Supplemental Table 2).
TASTPM mice demonstrate age-dependentincreases in [18F]-AV45 uptake
The uptake of [18F]-AV45 averaged over the WTand TASTPM groups is visualized across time pointsin Fig. 2. Figure 3A-D show the time course of [18F]-AV45 uptake in the cortex, thalamus, hippocampus,and striatum of WT and TASTPM mice in all ani-mals investigated. A highly significant interaction ofage*genotype was found for all regions investigated(p < 0.0001), supporting an age-dependent increase in
[18F]-AV45 uptake in TASTPM mice. Using multiplet-tests, we compared [18F]-AV45 uptake between WTand TASTPM cross-sectionally at each time-pointto test for increased [18F]-AV45 uptake in TASTPMmice. TASTPM uptake was significantly higher at 9months in the cortex (t(26) = 4.94, p < 0.0001), tha-lamus (t(26) = 7.93, p < 0.0001), and hippocampus(t(26) = 4.96, p < 0.0001), in the striatum at 12 months(t(19) = 6.82, p < 0.0001) and remains significantlyhigher at all further time points. In the TASTPM mice(n = 5) that underwent scanning at all time points, theaverage % increase from baseline was 23.7 ± 8.4% inthe cortex, 28.5 ± 8.6% in the thalamus, 35.6 ± 8.8%in the hippocampus, and 19.2 ± 9.4% in the striatum.
Reductions in [18F]-FDG uptake do not worsenwith age in TASTPM mice
Figure 5A-D shows the average uptake of [18F]-FDG in the cortex, thalamus, hippocampus, andstriatum of WT and TASTPM mice in all animals
A.-M. Waldron et al. / Longitudinal Imaging of TASTPM Mice 1543
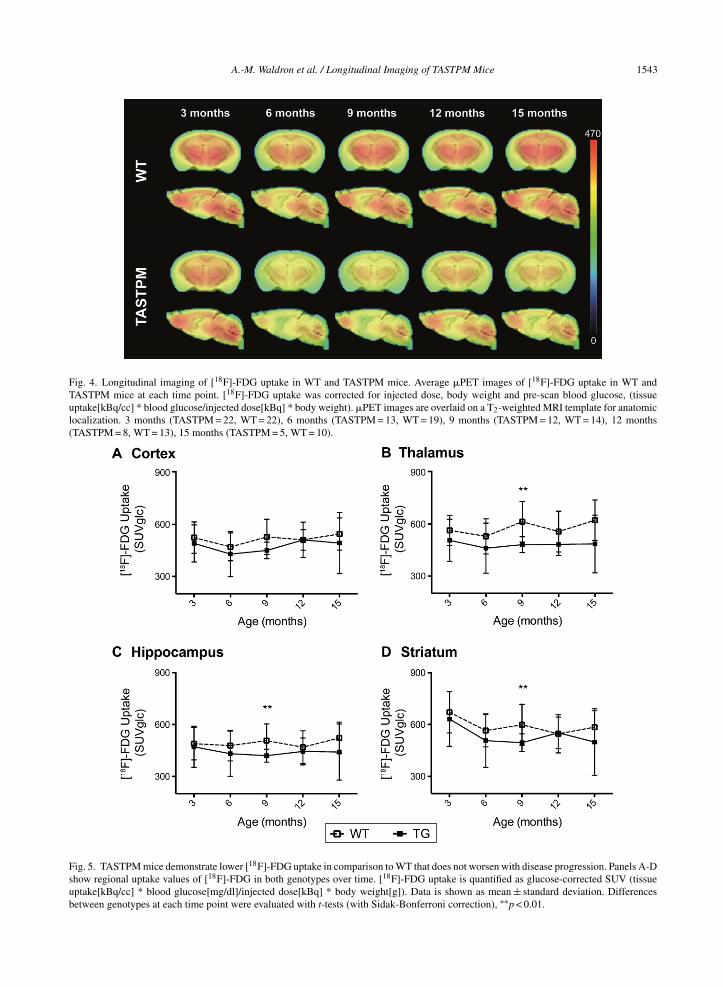
Fig. 4. Longitudinal imaging of [18F]-FDG uptake in WT and TASTPM mice. Average �PET images of [18F]-FDG uptake in WT andTASTPM mice at each time point. [18F]-FDG uptake was corrected for injected dose, body weight and pre-scan blood glucose, (tissueuptake[kBq/cc] * blood glucose/injected dose[kBq] * body weight). �PET images are overlaid on a T2-weighted MRI template for anatomiclocalization. 3 months (TASTPM = 22, WT = 22), 6 months (TASTPM = 13, WT = 19), 9 months (TASTPM = 12, WT = 14), 12 months(TASTPM = 8, WT = 13), 15 months (TASTPM = 5, WT = 10).
Fig. 5. TASTPM mice demonstrate lower [18F]-FDG uptake in comparison to WT that does not worsen with disease progression. Panels A-Dshow regional uptake values of [18F]-FDG in both genotypes over time. [18F]-FDG uptake is quantified as glucose-corrected SUV (tissueuptake[kBq/cc] * blood glucose[mg/dl]/injected dose[kBq] * body weight[g]). Data is shown as mean ± standard deviation. Differencesbetween genotypes at each time point were evaluated with t-tests (with Sidak-Bonferroni correction), ∗∗p < 0.01.
1544 A.-M. Waldron et al. / Longitudinal Imaging of TASTPM Mice
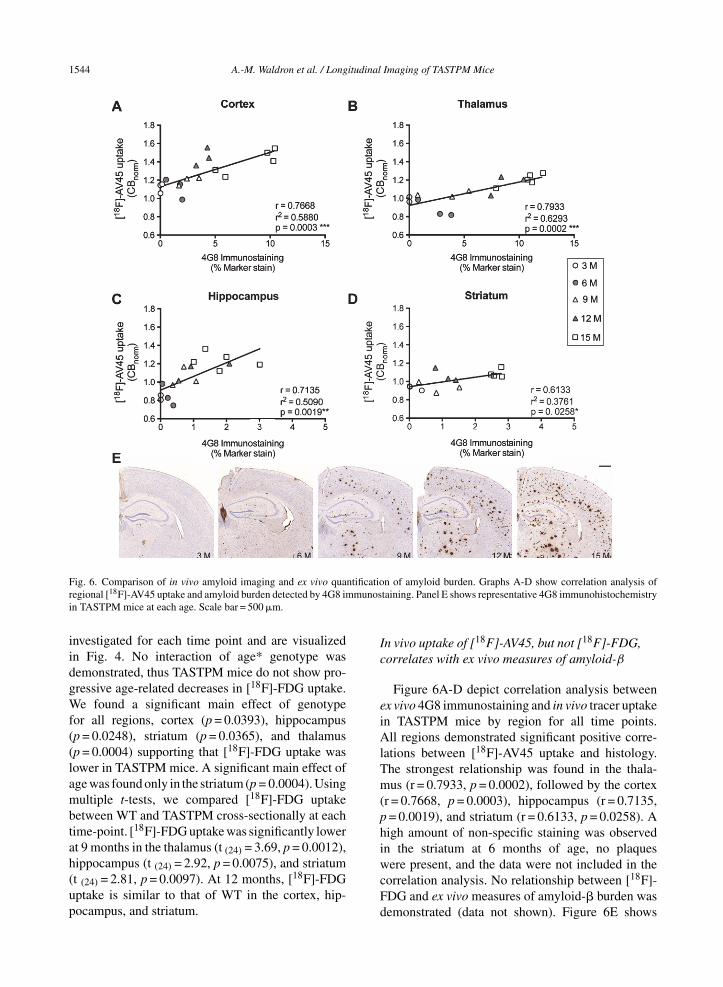
Fig. 6. Comparison of in vivo amyloid imaging and ex vivo quantification of amyloid burden. Graphs A-D show correlation analysis ofregional [18F]-AV45 uptake and amyloid burden detected by 4G8 immunostaining. Panel E shows representative 4G8 immunohistochemistryin TASTPM mice at each age. Scale bar = 500 �m.
investigated for each time point and are visualizedin Fig. 4. No interaction of age* genotype wasdemonstrated, thus TASTPM mice do not show pro-gressive age-related decreases in [18F]-FDG uptake.We found a significant main effect of genotypefor all regions, cortex (p = 0.0393), hippocampus(p = 0.0248), striatum (p = 0.0365), and thalamus(p = 0.0004) supporting that [18F]-FDG uptake waslower in TASTPM mice. A significant main effect ofage was found only in the striatum (p = 0.0004). Usingmultiple t-tests, we compared [18F]-FDG uptakebetween WT and TASTPM cross-sectionally at eachtime-point. [18F]-FDG uptake was significantly lowerat 9 months in the thalamus (t (24) = 3.69, p = 0.0012),hippocampus (t (24) = 2.92, p = 0.0075), and striatum(t (24) = 2.81, p = 0.0097). At 12 months, [18F]-FDGuptake is similar to that of WT in the cortex, hip-pocampus, and striatum.
In vivo uptake of [18F]-AV45, but not [18F]-FDG,correlates with ex vivo measures of amyloid-β
Figure 6A-D depict correlation analysis betweenex vivo 4G8 immunostaining and in vivo tracer uptakein TASTPM mice by region for all time points.All regions demonstrated significant positive corre-lations between [18F]-AV45 uptake and histology.The strongest relationship was found in the thala-mus (r = 0.7933, p = 0.0002), followed by the cortex(r = 0.7668, p = 0.0003), hippocampus (r = 0.7135,p = 0.0019), and striatum (r = 0.6133, p = 0.0258). Ahigh amount of non-specific staining was observedin the striatum at 6 months of age, no plaqueswere present, and the data were not included in thecorrelation analysis. No relationship between [18F]-FDG and ex vivo measures of amyloid-� burden wasdemonstrated (data not shown). Figure 6E shows
A.-M. Waldron et al. / Longitudinal Imaging of TASTPM Mice 1545
representative images from immunostained brainslices of TASTPM mice at each age. Plaque pathol-ogy was absent in the cerebellum of TASTPM mice(Supplementary Figure 3) and in the brains of WTmice.
DISCUSSION
Translation of basic research findings into clin-ical drug development depends largely on animalmodels as a means to uncover pathomechanisms andto predict therapeutic efficacy. A lack of appropri-ate biomarkers that transfer from animal models tohuman is widely acknowledged as a rate-limiting stepin translational research [39]. �PET imaging is par-ticularly attractive for animal model-based researchand represents a translational tool that would allowfor greater conformity between human and animalstudies. We herein investigated the potential of [18F]-AV45 and [18F]-FDG as translational biomarkers indouble transgenic TASTPM mice.
[18F]-AV45 is gaining wide application in clini-cal and preclinical research as a non-invasive markerof disease progression. Excellent brain penetrance,rapid washout kinetics and a high affinity againstamyloid-� are among the qualities that recom-mend [18F]-AV45 as a suitable imaging agent [20,40]. Being fluorinated, it has the added benefitsof increased availability in comparison to its pre-decessor, [11C]-PiB. However, one disadvantage of[18F]-AV45 is its notably lower dynamic range dueto high non-specific white matter binding [41], whichwe have previously shown to result in smaller dif-ferences between WT and transgenic mice [16].Herein, as part of our investigations into the sensitiv-ity of [18F]-AV45, we aimed to assess the productionand brain uptake of radiometabolites. While fastmetabolism and brain penetrant radiometabolites of[18F]-AV45 have been reported [20], we believe thatboth the extent of plasma clearance and contributionof radiometabolites to brain imaging has been under-estimated. In contrast to a previous report of a plasmahalf-life of <30 min [20], we herein found a half-life of <5 min. The contribution of radiometabolitesto brain imaging is substantial with radiometabo-lites comprising 70% of brain radioactivity alreadyat 5–10 min. Moreover, these radiometabolites bindand are retained in the brain as shown by the decreas-ing extraction efficiency from brain tissue (from86.1% at 5 min p.i. to 65.1% at 30 min p.i.). Thishigh amount of non-specific binding dilutes signal
specificity thus limiting the sensitivity of [18F]-AV45.The use of PVEC and cerebellar normalized dataproduced the expected progressive increases in [18F]-AV45 uptake in TASTPM and this in vivo uptakecorrelated strongly to histology. Overall, the age-dependent increases in [18F]-AV45 uptake are inagreement with the growing body of data supportingamyloid imaging in mouse models.
The utility of [18F]-FDG as a translationalbiomarker is more complicated. While the signifi-cant main effect of genotype supports a pathologicalreduction of [18F]-FDG uptake in TASTPM mice,the lack of an interaction with age implies thathypometabolism is not associated with aging, and byextension, also not with worsening pathology. Thispresents clear differences to the human situation. Inprevious studies, lack of [18F]-FDG reductions inmouse models of AD were hypothesized to arise fromglial uptake of [18F]-FDG in response to increasedenergetic demands during neuroinflammation. Age-dependent increases in activated glial cells have beenreported in TASTPM mice [42, 43] and thus sucha mechanism could account for the absence of age-related decreases in [18F]-FDG uptake. However, inour previous study of TASTPM mice at 13.5 months,we detected significant reductions in [18F]-FDGuptake despite immunohistochemistry demonstratingan increased number of microglia and astrocytes [15].In this former study, we found the thalamus to demon-strate the most pronounced reductions in [18F]-FDGand herein the thalamus also demonstrated the great-est reductions in [18F]-FDG uptake, albeit at 9 M. Thereduced statistical power at 12 and 15 months due tothe lower sample size may have limited the ability todetermine changes in [18F]-FDG uptake at these agesand could account for differences to our findings in13.5 month TASTPM mice.
Amyloidosis models do not recapitulate the entiredisease spectrum of AD and are devoid of tau tanglepathology and overt neuronal loss [44]. The absenceof these pathological hallmarks likely underlies theinability of [18F]-FDG imaging to wholly mimic clin-ical observations. Although fewer investigations of[18F]-FDG have been performed in tau transgenicmodels, these studies have demonstrated decreas-ing [18F]-FDG uptake in relation to increasing taupathology with age [45] (Deleye et al., unpublisheddata). Moreover, while we have found no correla-tion between [18F]-FDG decreases and amyloid-�pathology in amyloidosis models, a relationshipbetween tau pathology and hypometabolism hasbeen demonstrated in these tauopathy models [45]

1546 A.-M. Waldron et al. / Longitudinal Imaging of TASTPM Mice
(Deleye et al., unpublished data). The present resultssuggest a complex relationship between amyloid-� and hypometabolism. Further information on theconnection between amyloid-� and hypometabolismcould be gleaned from manipulating amyloid levels,for instance by a treatment, to investigate the resul-tant effect on brain metabolism. Such an investigationwould furthermore serve as a continued evaluation ofthe utility of [18F]-FDG as a preclinical biomarker.
ACKNOWLEDGMENTS
This work was funded by Antwerp University andits University Hospital, Antwerp, Belgium throughan assistant professor position for L.w. and J.V;an associate professor position for St.S and a fullprofessor position for Si. St. AMW is supportedthrough an IWT scholarship (Agency for Innovationby Science and Technology). XL and MS are withJanssen Pharmaceutica, Beerse, Belgium holding acontract research program with the Molecular Imag-ing Center Antwerp. JR is with GSK. The authors arethankful to Philippe Joye (Molecular Imaging Cen-ter Antwerp) for support with in vivo experiments.We would also like to thank Dr. Jose Ignacio Andres(Janssen Research and Development, Toledo, Spain)for preparation of AV-105 and cold reference andDr. An Torremans and Hilde Vermeirsch from Histo-genex for ex vivo validation processing. The authorsare additionally thankful to Erik Franssen for sta-tistical assistance. This research was performed inconjunction with the European Community’s Sev-enth Framework Program (FP7/2007-2013) for theInnovative Medicine Initiative under the PharmaCogGrant Agreement n◦115009.
Authors’ disclosures available online (http://j-alz.com/manuscript-disclosures/16-0760r1).
SUPPLEMENTARY MATERIAL
The supplementary material is available in theelectronic version of this article: http://dx.doi.org/10.3233/JAD-160760.
REFERENCES
[1] Barthel H, Seibyl J, Sabri O (2015) The role ofpositron emission tomography imaging in understandingAlzheimer’sdisease. Expert Rev Neurother 15, 395-406.
[2] Mosconi L, Berti V, Glodzik L, Pupi A, De Santi S,De Leon MJ (2009) Pre-clinical detection of Alzheimer’s
disease using FDG-PET, with or without amyloid imaging.J Alzheimers Dis 20, 843-854.
[3] Mosconi L, McHugh PF (2011) FDG- and amyloid-PET inAlzheimer’s disease: Is the whole greater than the sum ofthe parts? Q J Nucl Med Mol Imaging 55, 250-264.
[4] Mormino EC, Betensky RA, Hedden T, Schultz AP,Amariglio RE, Rentz DM, Johnson KA, Sperling RA (2014)Synergistic effect of �-amyloid and neurodegeneration oncognitive decline in clinically normal individuals. JAMANeurol 71, 1379.
[5] Mattsson N, Carrillo MC, Dean RA, Devous MD Sr,Nikolcheva T, Pesini P, Salter H, Potter WZ, SperlingRS, Bateman RJ, Bain LJ, Liu E (2015) RevolutionizingAlzheimer’s disease and clinical trials through biomarkers.Alzheimers Dement (Amst) 1, 412-419.
[6] Gotz J, Ittner LM (2008) Animal models of Alzheimer’sdisease and frontotemporal dementia. Nat Rev Neurosci 9,532-544.
[7] Kuntner C, Kesner AL, Bauer M, Kremslehner R, Wanek T,Mandler M, Karch R, Stanek J, Wolf T, Muller M, LangerO (2009) Limitations of small animal PET imaging with[18F]FDDNP and FDG for quantitative studies in a trans-genic mouse model of Alzheimer’s disease. Mol ImagingBiol 11, 236-240.
[8] Toyama H, Ye D, Ichise M, Liow J-S, Cai L, JacobowitzD, Musachio JL, Hong J, Crescenzo M, Tipre D, Lu J-Q,Zoghbi S, Vines DC, Seidel J, Katada K, Green MV, PikeVW, Cohen RM, Innis RB (2005) PET imaging of brain withthe beta-amyloid probe, [11C]6-OH-BTA-1, in a transgenicmouse model of Alzheimer’s disease. Eur J Nucl Med MolImaging 32, 593-600.
[9] Klunk WE, Lopresti BJ, Ikonomovic MD, Lefterov IM,Koldamova RP, Abrahamson EE, Debnath ML, Holt DP,Huang G-F, Shao L, DeKosky ST, Price JC, Mathis CA(2005) Binding of the positron emission tomography tracerPittsburgh compound-B reflects the amount of amyloid-betain Alzheimer’s disease brain but not in transgenic mousebrain. J Neurosci 25, 10598-10606.
[10] Poisnel G, Dhilly M, Moustie O, Delamare J, Abbas A, Guil-loteau D, Barre L (2012) PET imaging with [18F]AV-45 inan APP/PS1-21 murine model of amyloid plaque deposition.Neurobiol Aging 33, 2561-2571.
[11] Rominger A, Brendel M, Burgold S, Keppler K, Bau-mann K, Xiong G, Mille E, Gildehaus FJ, Carlsen J,Schlichtiger J, Niedermoser S, Wangler B, Cumming P,Steiner H, Herms J, Haass C, Bartenstein P (2013) Lon-gitudinal assessment of cerebral �-amyloid deposition inmice overexpressing Swedish mutant �-amyloid precur-sor protein using 18F-florbetaben PET. J Nucl Med 54,1127-1134.
[12] Snellman A, Lopez-Picon FR, Rokka J, Salmona M, ForloniG, Scheinin M, Solin O, Rinne JO, Haaparanta-Solin M(2013) Longitudinal amyloid imaging in mouse brain with11C-PIB: Comparison of APP23, Tg2576, and APPswe-PS1dE9 mouse models of Alzheimer disease. J Nucl Med54, 1434-1441.
[13] Serriere S, Tauber C, Vercouillie J, Mothes C, Pruckner C,Guilloteau D, Kassiou M, Domene A, Garreau L, Page G,Chalon S (2015) Amyloid load and translocator protein 18kDa in APPswePS1-dE9 mice: A longitudinal study. Neu-robiol Aging 36, 1639-1652.
[14] Waldron A-M, Verhaeghe J, wyffels L, Schmidt M, Lan-glois X, Van der Linden A, Stroobants S, Staelens S (2015)Preclinical comparison of the amyloid-� radioligands[(11)C]Pittsburgh compound B and [(18)F]florbetaben in
A.-M. Waldron et al. / Longitudinal Imaging of TASTPM Mice 1547
aged APPPS1-21 and BRI1-42 mouse models of cerebralamyloidosis. Mol Imaging Biol 17, 688-696.
[15] Waldron A, Wyffels L, Verhaeghe J, Bottelbergs A, Richard-son J, Kelley J, Schmidt M, Stroobants S, Langlois X,Staelens S (2015) Quantitative muPET imaging of cerebralglucose metabolism and amyloidosis in the TASTPM dou-ble transgenic mouse model of Alzheimer’s disease. CurrAlzheimer Res 12, 694-703.
[16] Waldron A-M, Wintmolders C, Bottelbergs A, Kelley JB,Schmidt ME, Stroobants S, Langlois X, Staelens S (2015) Invivo molecular neuroimaging of glucose utilization and itsassociation with fibrillar amyloid-� load in aged APPPS1-21 mice. Alzheimers Res Ther 7, 76.
[17] Lehnert W, Gregoire M-C, Reilhac A, Meikle SR (2012)Characterisation of partial volume effect and region-basedcorrection in small animal positron emission tomography(PET) of the rat brain. Neuroimage 60, 2144-2157.
[18] Fodero-Tavoletti MT, Rowe CC, McLean CA, Leone L, LiQ-X, Masters CL, Cappai R, Villemagne VL (2009) Char-acterization of PiB binding to white matter in Alzheimerdisease and other dementias. J Nucl Med 50, 198-204.
[19] Patt M, Schildan A, Barthel H, Becker G, Schultze-MosgauMH, Rohde B, Reininger C, Sabri O (2010) Metaboliteanalysis of [18F]Florbetaben (BAY 94-9172) in human sub-jects: A substudy within a proof of mechanism clinical trial.J Radioanal Nucl Chem 284, 557-562.
[20] Choi SR, Golding G, Zhuang Z, Zhang W, Lim N, HeftiF, Benedum TE, Kilbourn MR, Skovronsky D, Kung HF(2009) Preclinical properties of 18F-AV-45: A PET agentfor Abeta plaques in the brain. J Nucl Med 50, 1887-1894.
[21] Platt B, Drever B, Koss D, Stoppelkamp S, Jyoti A, PlanoA, Utan A, Merrick G, Ryan D, Melis V, Wan H, MingarelliM, Porcu E, Scrocchi L, Welch A, Riedel G (2011) Abnor-mal cognition, sleep, EEG and brain metabolism in a novelknock-in Alzheimer mouse, PLB1. PLoS One 6, e27068.
[22] Macdonald IR, Debay DR, Reid GA, O’Leary TP, JollymoreCT, Mawko G, Burrell S, Martin E, Bowen CV, Brown RE,Darvesh S (2014) Early detection of cerebral glucose uptakechanges in the 5XFAD mouse. Curr Alzheimer Res 11, 450-460.
[23] Brendel M, Probst F, Jaworska A, Overhoff F, Korzhova V,Albert N, Beck R, Lindner S, Gildehaus FJ, Baumann K,Bartenstein P, Kleinberger G, Haass C, Herms J, RomingerA (2016) Glial activation and glucose metabolism in a trans-genic amyloid mouse model: A triple tracer PET study.J Nucl Med 57, 954-960.
[24] Poisnel G, Herard A-S, Tannir El Tayara El N, BourrinE, Volk A, Kober F, Delatour B, Delzescaux T, DebeirT, Rooney T, Benavides J, Hantraye P, Dhenain M (2012)Increased regional cerebral glucose uptake in an APP/PS1model of Alzheimer’s disease. Neurobiol Aging 33, 1995-2005.
[25] Luo F, Rustay NR, Ebert U, Hradil VP, Cole TB, Llano DA,Mudd SR, Zhang Y, Fox GB, Day M (2012) Characteriza-tion of 7- and 19-month-old Tg2576 mice using multimodalin vivo imaging: Limitations as a translatable model ofAlzheimer’s disease. Neurobiol Aging 33, 933-944.
[26] Rojas S, Herance JR, Gispert JD, Abad S, Torrent E, JimenezX, Pareto D, Perpina U, Sarroca S, Rodrıguez E, Ortega-Aznar A, Sanfeliu C (2013) In vivo evaluation of amyloiddeposition and brain glucose metabolism of 5XFAD miceusing positron emission tomography. Neurobiol Aging 34,1790-1798.
[27] Salloway S, Sperling R, Fox NC, Blennow K, KlunkW, Raskind M, Sabbagh M, Honig LS, Porsteinsson AP,
Ferris S, Reichert M, Ketter N, Nejadnik B, Guenzler V,Miloslavsky M, Wang D, Lu Y, Lull J, Tudor IC, LiuE, Grundman M, Yuen E, Black R, Brashear HR (2014)Two Phase 3 trials of bapineuzumab in mild-to-moderateAlzheimer’s disease. N Engl J Med 370, 322-333.
[28] Lobello K, Ryan JM, Liu E, Rippon G, Black R (2012)Targeting beta amyloid: A clinical review of immunothera-peutic approaches in Alzheimer’s disease. Int J AlzheimersDis 2012, 1-14.
[29] Howlett DR, Richardson JC, Austin A, Parsons AA, BateST, Davies DC, Gonzalez MI (2004) Cognitive correlates ofAbeta deposition in male and female mice bearing amyloidprecursor protein and presenilin-1 mutant transgenes. BrainRes 1017, 130-136.
[30] Yao C-H, Lin W-L, Weng C-C, Hsiao I-T, Ting Y-S,Yen T-C, Jan T-R, Skovronsky D, Kung M-P, Wey S-P(2010) GMP-compliant automated synthesis of [(18)F]AV-45 (Florbetapir F 18) for imaging beta-amyloid plaques inhuman brain. Appl Radiat Isot 68, 2293-2297.
[31] Wong KP, Sha W, Zhang X, Huang SC (2011) Effects ofAdministration route, dietary condition, and blood glucoselevel on kinetics and uptake of 18F-FDG in mice. J NuclMed 52, 800-807.
[32] Kemp BJ, Hruska CB, McFarland AR, Lenox MW, LoweVJ (2009) NEMA NU 2-2007 performance measurementsof the Siemens Inveon preclinical small animal PET system.Phys Med Biol 54, 2359-2376.
[33] Hudson HM, Larkin RS (1993) Accelerated image recon-struction using ordered subsets of projection data. IEEETrans Med Imaging 13, 601-609.
[34] Defrise M, Kinahan PE, Townsend DW, Michel C, Sibo-mana M, Newport DF (1997) Exact and approximaterebinning algorithms for 3-D PET data. IEEE Trans MedImaging 16, 145-158.
[35] Watson CC (2000) New, faster, image-based scatter correc-tion for 3D PET. IEEE Trans Nucl Sci 47, 1587-1594.
[36] Mirrione MM, Schiffer WK, Fowler JS, Alexoff DL, DeweySL, Tsirka SE (2007) A novel approach for imaging brain-behavior relationships in mice reveals unexpected metabolicpatterns during seizures in the absence of tissue plasminogenactivator. Neuroimage 38, 34-42.
[37] Rousset OG, Ma YL, Evans AC (1998) Correction for partialvolume effects in PET: Principle and validation. J Nucl Med39, 904-911.
[38] Deleye S, Waldron A-M, Richardson JC, Schmidt M,Langlois X, Stroobants S, Staelens S (2016) The effectsof physiological and methodological determinants on18F-FDG mouse brain imaging exemplified in a dou-ble transgenic Alzheimer model. Mol Imaging 15, doi:10.1177/1536012115624919.
[39] Shineman DW, Basi GS, Bizon JL, Colton CA, GreenbergBD, Hollister BA, Lincecum J, Leblanc GG, Lee LBH, LuoF, Morgan D, Morse I, Refolo LM, Riddell DR, Scearce-Levie K, Sweeney P, Yrjanheikki J, Fillit HM (2010)Accelerating drug discovery for Alzheimer’s disease: Bestpractices for preclinical animal studies. Alzheimers Res Ther3, 28.
[40] Clark CM, Pontecorvo MJ, Beach TG, Bedell BJ, ColemanRE, Doraiswamy PM, Fleisher AS, Reiman EM, SabbaghMN, Sadowsky CH, Schneider JA, Arora A, Carpenter AP,Flitter ML, Joshi AD, Krautkramer MJ, Lu M, MintunMA, Skovronsky DM (2012) Cerebral PET with florbe-tapir compared with neuropathology at autopsy for detectionof neuritic amyloid-� plaques: A prospective cohort study.Lancet Neurol 11, 669-678.

1548 A.-M. Waldron et al. / Longitudinal Imaging of TASTPM Mice
[41] Landau SM, Thomas BA, Thurfjell L, Schmidt M, Mar-golin R, Mintun M, Pontecorvo M, Baker SL, Jagust WJ,Alzheimer’s Disease Neuroimaging Initiative (2014) Amy-loid PET imaging in Alzheimer’s disease: A comparisonof three radiotracers. Eur J Nucl Med Mol Imaging 41,1398-1407.
[42] Howlett DR, Bowler K, Soden PE, Riddell D, Davis JB,richardson JC, Burbidge SA, Gonzalez MI, Irving EA, Law-man A, Miglio G, Dawson EL, Howlett ER, Hussain I(2008) Abeta deposition and related pathology in an APP xPS1 transgenic mouse model of Alzheimer’s disease. HistolHistopathol 23, 67-76.
[43] Roberts JC, Friel SL, Roman S, Perren M, Hardy J, Davis JB,Richardson JC, Virley D, Medhurst AD (2009) Autoradio-graphical imaging of PPAR� agonist effects on PBR/TSPObinding in TASTPM mice. Exp Neurol 216, 459-470.
[44] LaFerla FM, Green KN (2012) Animal models of Alzheimerdisease. Cold Spring Harb Perspect Med 2, a006320.
[45] de Cristobal J, Garcıa-Garcıa L, Delgado M, Perez M, PozoMA, Medina M (2014) Longitudinal assessment of a trans-genic animal model of tauopathy by FDG-PET imaging.J Alzheimers Dis 40(Suppl 1), S79-S89.