
Automated de novo sequencing of proteins using the differential scanning technique
15
Sandrine Uttenweiler-Joseph 1 * Gitte Neubauer 1 Savvas Christoforidis 2 Marino Zerial 2 Matthias Wilm 1 1 European Molecular Biology Laboratory, Heidelberg, Germany 2 Max Planck Institute for Molecular Cell Biology and Genetics, Dresden, Germany Automated de novo sequencing of proteins using the differential scanning technique Despite the progress in genomic DNA sequencing de novo sequencing of peptides is still required in a biological research environment since many experiments are done in organisms whose genomes are not sequenced. A way to unambiguously retrieve a peptide sequence from a tandem mass spectrum is to assign the correct ion type to the fragments. Here we describe a method which improves the specificity in y-ion assignment throughout the spectrum. The differential scanning technique requires that the peptides are partially 18 O labelled at their C-terminus and that two fragment spectra are acquired for each peptide, one selecting the 16 O/ 18 O isotopic cluster and a second fragmenting only the 18 O labelled ions. When the spectra are acquired with a quadrupole time of flight mass spectrometer y-ions can be very specifically filtered from the spectrum using a computer algorithm. Partial or complete peptide sequences can be assigned automatically simply by finding the most abundant series of frag- ments spaced by amino acid residue masses. This method was used extensively in a project investigating vesicular transport in bovine brain cells. Human or mouse homo- logues to the bovine proteins were found in EST databases facilitating rapid cloning of the human homologues. Keywords: Protein de novo sequencing / Mass spectrometry / Isotopic labelling / 18 O PRO 0052 1 Introduction Mass spectrometry is the preferred tool to identify pro- teins in databases [1–5]. Protein de novo sequencing with MS is a more difficult but still required task. Biological experiments are often conducted in organisms which enable the intended research by some specific properties. The genome of many of these model organisms are not sequenced and are not expected to be sequenced in the near future. Reading sequences from fragment spectra of peptides in a reliable way, without confirmation from existing databases, is a difficult task. The overall fragmentation pattern of a peptide depends on its primary structure. Some peptides produce long consistent y- or b-ion series while others fragment only in limited regions of their sequence. This behaviour is not readily recognis- able when inspecting a tandem mass spectrum and can lead to false interpretations. Any method developed for de novo sequencing should take into account that the sequence of a given peptide may not be completely reflected in its fragment spectrum. There are different approaches to sequence peptides de novo using MS/MS. Some software algorithms try to pre- dict the amino acid sequence of peptides from their native fragment spectrum [6–8]. However, these algorithms tend to require that the entire sequence can be deduced from the fragmentation pattern of the peptide. They use for instance the molecular mass of the peptide and generate a sequence which corresponds to the complete mass. They do not consider sufficiently well that stable regions of the peptide may not have been fragmented so that their sequence information is not contained in the spectrum. Because no additional, chemically encoded information about the ion type is available, it is difficult to recognize whether the fragment spectrum under investigation belongs to a peptide which fragments according to the fragmentation rules used to build the interpretation algo- rithm, or to a peptide which produced an uncommon frag- mentation pattern. Since no additional information about the overall fragmentation behaviour of an unmodified peptide can be obtained from its fragmentation pattern these algorithms cannot differentiate between spectra which they can interpret successfully and those they can- not. This can lead to wrong sequence interpretations. To change the fragmentation behaviour Pappin [9, 10] proposes to introduce a basic group at the N-terminus of all the peptides. B-ions are more favored and the y-ion Correspondence: Matthias Wilm, EMBL, Meyerhofstrasse 1, 69117 Heidelberg, Germany E-mail: [email protected] Fax: +49-0-6221-387-306 Abbreviations: nrdb, Nonredundant database; Q-TOF , Quadru- pole-time of flight; SNARE, Soluble N-ethyl-maleimide-sensitive factor attachement protein receptor * Current address: Sanofi-Synthélabo, Labège Innopole, Voie 1, BP 131, 31616 Labege Cedex, France 668 Proteomics 2001, 1, 668–682 WILEY-VCH Verlag GmbH, 69451 Weinheim, 2001 1615-9853/01/0505–668 $17.50+.50/0
Transcript of Automated de novo sequencing of proteins using the differential scanning technique
Sandrine Uttenweiler-Joseph1*Gitte Neubauer1
Savvas Christoforidis2
Marino Zerial2
Matthias Wilm1
1European MolecularBiology Laboratory,Heidelberg, Germany
2Max Planck Institutefor Molecular CellBiology and Genetics,Dresden, Germany
Automated de novo sequencing of proteins usingthe differential scanning technique
Despite the progress in genomic DNA sequencing de novo sequencing of peptides isstill required in a biological research environment since many experiments are done inorganisms whose genomes are not sequenced. A way to unambiguously retrieve apeptide sequence from a tandem mass spectrum is to assign the correct ion type tothe fragments. Here we describe a method which improves the specificity in y-ionassignment throughout the spectrum. The differential scanning technique requiresthat the peptides are partially 18O labelled at their C-terminus and that two fragmentspectra are acquired for each peptide, one selecting the 16O/18O isotopic cluster and asecond fragmenting only the 18O labelled ions. When the spectra are acquired with aquadrupole time of flight mass spectrometer y-ions can be very specifically filteredfrom the spectrum using a computer algorithm. Partial or complete peptide sequencescan be assigned automatically simply by finding the most abundant series of frag-ments spaced by amino acid residue masses. This method was used extensively in aproject investigating vesicular transport in bovine brain cells. Human or mouse homo-logues to the bovine proteins were found in EST databases facilitating rapid cloning ofthe human homologues.
Keywords: Protein de novo sequencing / Mass spectrometry / Isotopic labelling / 18O PRO 0052
1 Introduction
Mass spectrometry is the preferred tool to identify pro-teins in databases [1–5]. Protein de novo sequencing withMS is a more difficult but still required task. Biologicalexperiments are often conducted in organisms whichenable the intended research by some specific properties.The genome of many of these model organisms are notsequenced and are not expected to be sequenced inthe near future. Reading sequences from fragmentspectra of peptides in a reliable way, without confirmationfrom existing databases, is a difficult task. The overallfragmentation pattern of a peptide depends on its primarystructure. Some peptides produce long consistent y- orb-ion series while others fragment only in limited regionsof their sequence. This behaviour is not readily recognis-able when inspecting a tandem mass spectrum and canlead to false interpretations. Any method developed forde novo sequencing should take into account that thesequence of a given peptide may not be completelyreflected in its fragment spectrum.
There are different approaches to sequence peptides denovo using MS/MS. Some software algorithms try to pre-dict the amino acid sequence of peptides from their nativefragment spectrum [6–8]. However, these algorithms tendto require that the entire sequence can be deduced fromthe fragmentation pattern of the peptide. They use forinstance the molecular mass of the peptide and generatea sequence which corresponds to the complete mass.They do not consider sufficiently well that stable regionsof the peptide may not have been fragmented so that theirsequence information is not contained in the spectrum.Because no additional, chemically encoded informationabout the ion type is available, it is difficult to recognizewhether the fragment spectrum under investigationbelongs to a peptide which fragments according to thefragmentation rules used to build the interpretation algo-rithm, or to a peptide which produced an uncommon frag-mentation pattern. Since no additional information aboutthe overall fragmentation behaviour of an unmodifiedpeptide can be obtained from its fragmentation patternthese algorithms cannot differentiate between spectrawhich they can interpret successfully and those they can-not. This can lead to wrong sequence interpretations.
To change the fragmentation behaviour Pappin [9, 10]proposes to introduce a basic group at the N-terminusof all the peptides. B-ions are more favored and the y-ion
Correspondence: Matthias Wilm, EMBL, Meyerhofstrasse 1,69117 Heidelberg, GermanyE-mail: [email protected]: +49-0-6221-387-306
Abbreviations: nrdb, Nonredundant database; Q-TOF, Quadru-pole-time of flight; SNARE, Soluble N-ethyl-maleimide-sensitivefactor attachement protein receptor
* Current address: Sanofi-Synthélabo, Labège Innopole, Voie 1,BP 131, 31616 Labege Cedex, France
668 Proteomics 2001, 1, 668–682
WILEY-VCH Verlag GmbH, 69451 Weinheim, 2001 1615-9853/01/0505–668 $17.50+.50/0
series is longer as for the native peptide. The simulta-neous appearance of b- and y-ions helps in the interpre-tation of the spectrum.
A third approach is to chemically modify the peptides toidentify some fragment ion types by the associated massshifts. This was first achieved by esterification of all acidicgroups including the C-terminus of a peptide and later byintroducing an end-standing 18O isotope upon digestion[11–13]. For the 18O labelling the protein is digested in50% 18O water so that all cleaved peptides appear as iso-topic doublets, 50% with a 16O isotope and 50% with an18O isotope at their C-termini. When the 16O/18O isotopicdoublet is selected for fragmentation all C-terminal frag-ment ions are represented by the same 16O/18O isotopicpattern in contrast to all other fragment ions. This isotopicpattern identifies the y-ions and can be sufficient to calla partial or even a complete peptide sequence from thespectrum [13]. However, it is often not possible to identifyall y-ions due to overlapping chemical noise ions inthe spectrum. The differential scanning method is anextension to the partial isotopic labelling approach andimproves the y-ion recognition. The method has beenused on a routine basis in our laboratory to sequencebovine proteins involved in vesicular transport. Mouseor human homologues in EST or protein databases werefound with these peptides.
2 Materials and methods
Chemicals were of HPLC grade. 18O water was pur-chased from Phychem (Düren, Germany) and purified bydistillation before use. Trypsin was unmodified bovinetrypsin from Boehringer (Mannheim, Germany).
2.1 Protein purification
Glutathione-S-transferase (GST)-Rab5 affinity chroma-tography was performed as described [14].
2.2 Sample preparation
All proteins were separated on 1-D SDS gels and stainedwith Coomassie blue or silver [15]. Bands were cut out,reduced, alkylated and in-gel digested using trypsin (15].The digestion buffer contained 33% or 50% 18O water tolabel the peptides with 18O at the C-terminus. Under theconditions chosen no double incorporation of 18O atomsin peptides was observed (< 5%) (13]. Double incorpora-tion of 18O atoms occurs in peptides ending in an arginineif the digestion is performed in 100% 18O water (un-published results). The degree of incorporation of 18Ointo peptides as measured from their tandem massspectra varied between 33% and 50% depending on
the amount of 18O water taken during the digest andthe purity of the 18O water. Peptides were extracted anddried down. For analysis the peptide mixture wasdissolved in 1 �L 80% formic acid and rapidly dilutedwith 9 �L water. The peptide mixture was desalted onself assembled Poros R2 and R3 columns and elutedtwice using 0.5 �L 60% methanol, 5% formic acid directlyinto a nano-electrospray needle [15, 16]. The nano-electrospray needle was mounted on a Q-TOF1 instru-ment (Micromass, Manchester, UK) and different peptideswere investigated in a sequential manner.
2.3 Mass spectrometry
All peptides were analyzed with the Q-TOF1 mass spec-trometer equipped with the nano-electrospray ion source(Micromass). To avoid fast evaporation of the sample fromthe nano-electrospray needle the interface temperaturewas reduced to 50�C. The collision energy was adjustedindividually for each peptide. For every MS/MS analysisthe transmission window was adjusted to select thedesired isotopic pattern by measuring the transmittedisotopes with the collision energy switched off. Two frag-ment spectra were acquired per peptide, one transmittingthe entire 16O/18O isotopic pattern into the collision zoneand a second with only the 18O isotopes selected. Toachieve this the selection for the precursor was shifted tothe appropriate higher m/z value. Depending on the totalmass of the peptide this was either the ion correspondingto the (m+2), the (m+3) or the (m+4) ion with m the mono-isotopic mass of the peptide. A shift in ion transmissionof more than 2 Da was required for peptides larger than1600 Da to exclude 16O labelled ions which contain 13Cor 15N isotopes.
2.4 Data processing
The y-ions scoring filter was programmed using IGOR Pro(Wavemetrics, Lake Oswego, USA). Spectra are exportedfrom MassLynx (Micromass) in ASCII format, processedand reimported. Every peak in the 16O/18O spectrum isscored for the likelihood that it is the first isotope of a16O/18O labelled fragment. Two criteria are evaluated:whether the following isotopes correspond to theexpected intensities of a 16O/18O labelled peptide of thesame mass and whether the 16O isotope is suppressedin the second fragment spectrum. After evaluation ofevery peak the 16O/18O spectrum is multiplied with thetwo scoring functions to generate a y-ion filtered spec-trum. The y-ion filtered spectrum is used to read out theamino acid sequence automatically. To display a scoredspectrum the dynamic range of the scored spectrum isreduced to about 1000. The displayed intensity Id is calcu-
Proteomics 2001, 1, 668–682 Protein de novo sequencing with the differential scanning technique 669
lated from the scored intensity Is using the followingformula:
Id � �Is � 1�
�����
log �1000�
log
��ymax
ymin
��
�����
� 1 (1)
Ymax is the maximal intensity of the scored spectrum, Ymin
is the minimal intensity which is above the noise level. They-ion scored spectrum can be reimported into MassLynx.
2.5 Sequence determination
The sequences are determined automatically from they-ion scored spectrum. In the first step of the interpreta-tion the most abundant ion is detected and considered ay-ion. The second most abundant ion is taken as anothery-ion if it can be embedded into one series of ions spacedby amino acid residue masses with the most abundantion. This process continues until a fragment ion is detectedwhich cannot be aligned with the already selected ions.At this point the selection routine has reached an intensitylevel where the y-ions in the spectrum are so weak thattheir positive score could not enhance them enough toget a bigger intensity than other more intense fragmentions which partially fulfil the scoring criteria. The so called“obvious y-ions” are selected. These ions will be part ofevery sequence proposal generated by the programmeat the end. In a second step of the sequence determina-tion algorithm, the remaining mass distances betweenselected y-ions are filled with sequence proposals bytesting all possible amino acid combinations whichbreech the gap. Extra care is invested to make certainthat the gaps are not bigger than nine amino acids inlength. The scoring value of every sequence is the sumof all the scored ion intensities. Finally, the 200 bestscored sequences are edited to evaluate the positioningof prolines and to test whether two adjacent amino acidsshould, in fact, be considered to be the amino acid withthe combined mass. In a last step the flow of the intensi-ties of the y-ions in the scored spectrum is evaluated. Ifthe intensities suddenly collapse without the presence ofa proline or an acidic residue and do not recover immedi-ately, the sequence is marked as uncertain.
3 Results and discussion
3.1 The differential scanning method
De novo peptide sequencing is still required on a dailybasis in a biological research environment. Specific bio-logical systems are often studied in dedicated organismswhose genome is not sequenced. The protein sequencesfrom these organisms are sufficiently different fromgenomically sequenced organisms, so that identificationtools fail in many instances [17, 18]. In these cases a de
novo sequencing approach is required. When the frag-mentation behaviour of a peptide is not changed by mod-ifying its primary structure a single tandem mass spec-trum of an unlabelled peptide often does not containsufficient information to deduce its sequence in an unam-biguous way. There is no software tool able to recogniszeto a satisfactory degree which fragment spectrum can bereliably interpreted for de novo sequencing and whichcannot. Therefore, we adopted methods that supply theinvestigator with additional primary structure based infor-mation to read out the peptide sequence from its frag-ment spectrum.
When using partial 18O C-terminal labelling y-ion recogni-tion is based on its specific 16O/18O isotopic pattern [13].However partial 18O labelling has limitations. Particularly inthem/z range below the precursor ion the 16O/18O isotopicpattern is often very difficult to recognise. Y-ions can havesuch a low abundance that peaks may consist of only afew ions. This limits the faithful representation of isotopicdistributions so that the 16O and 18O isotopes may berepresented unequally. Additionally, this part of thespectrum is often densely populated by fragment andchemical noise ions. They can overlap with y-ions anddistort the 16O/18O isotopic pattern or they can mimictheir isotopic distribution and the correct y-ion cannotbe found (Fig. 1).
In these cases the differential scanning approach cansupply additional information which allows unambiguousidentification of the y-ions in the spectrum and calladditional sequence. The basic principle of the methodis that two fragment spectra are acquired from the samepeptide, one selecting the entire 16O/18O isotopic envel-ope and the second selecting only the 18O labelled pep-tide ions. Y-ions are represented in a different way in thetwo spectra; in the first as an 16O/18O cluster and in thesecond only as an 18O ion. A similar method was used byTakao et al. [19]. They selected individual isotopes ofpartially 18O labelled peptides for the generation of frag-ment spectra using a sector field instrument. Y-ions wereidentified by their different isotopic representation inboth fragment spectra. The advantage of using a Q-TOFinstrument and selecting isotopic clusters instead ofsingle isotopes is that the ion transmission is much higher.The higher sensitivity makes the method applicable tostandard biological experiments where only low amountsof separated proteins are available (1 pmol or less ofprotein purified on SDS-PAGE).
The exclusive selection of the 18O isotopes of the peptidecan be done by simply shifting the precursor ion selectionto a higherm/z value (Fig. 2). The interesting observation isthat a 18O only fragment spectrum can be acquired withoutincreasing the resolution of the selecting quadrupole.
670 S. Uttenweiler-Joseph et al. Proteomics 2001, 1, 668–682
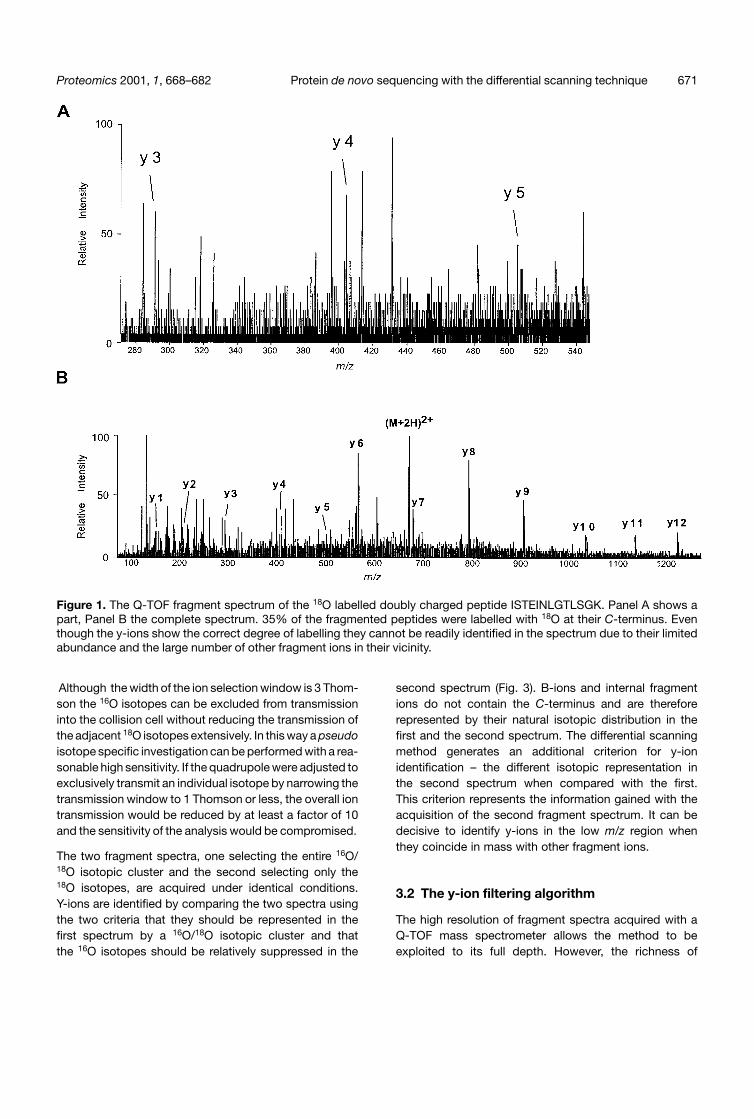
Figure 1. The Q-TOF fragment spectrum of the 18O labelled doubly charged peptide ISTEINLGTLSGK. Panel A shows apart, Panel B the complete spectrum. 35% of the fragmented peptides were labelled with 18O at their C-terminus. Eventhough the y-ions show the correct degree of labelling they cannot be readily identified in the spectrum due to their limitedabundance and the large number of other fragment ions in their vicinity.
Although the width of the ion selection window is 3 Thom-son the 16O isotopes can be excluded from transmissioninto the collision cell without reducing the transmission ofthe adjacent 18O isotopes extensively. In this way apseudoisotope specific investigation can be performed with a rea-sonable high sensitivity. If the quadrupole were adjusted toexclusively transmit an individual isotope by narrowing thetransmission window to 1 Thomson or less, the overall iontransmission would be reduced by at least a factor of 10and the sensitivity of the analysis would be compromised.
The two fragment spectra, one selecting the entire 16O/18O isotopic cluster and the second selecting only the18O isotopes, are acquired under identical conditions.Y-ions are identified by comparing the two spectra usingthe two criteria that they should be represented in thefirst spectrum by a 16O/18O isotopic cluster and thatthe 16O isotopes should be relatively suppressed in the
second spectrum (Fig. 3). B-ions and internal fragmentions do not contain the C-terminus and are thereforerepresented by their natural isotopic distribution in thefirst and the second spectrum. The differential scanningmethod generates an additional criterion for y-ionidentification – the different isotopic representation inthe second spectrum when compared with the first.This criterion represents the information gained with theacquisition of the second fragment spectrum. It can bedecisive to identify y-ions in the low m/z region whenthey coincide in mass with other fragment ions.
3.2 The y-ion filtering algorithm
The high resolution of fragment spectra acquired with aQ-TOF mass spectrometer allows the method to beexploited to its full depth. However, the richness of
Proteomics 2001, 1, 668–682 Protein de novo sequencing with the differential scanning technique 671
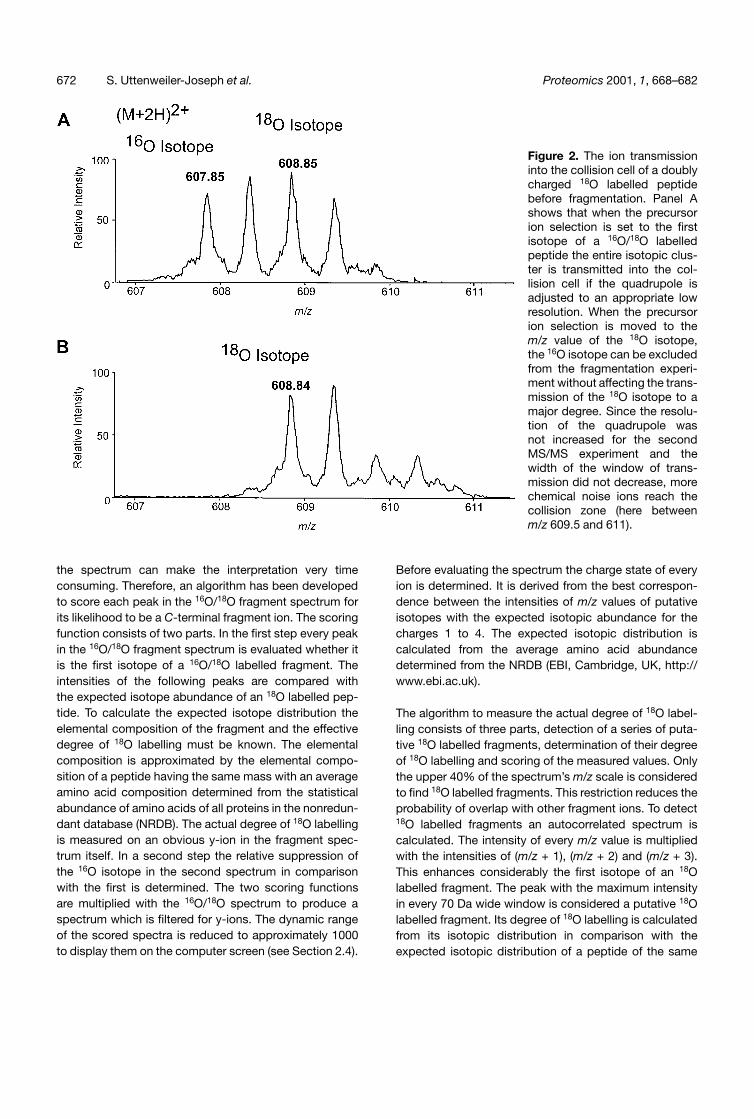
Figure 2. The ion transmissioninto the collision cell of a doublycharged 18O labelled peptidebefore fragmentation. Panel Ashows that when the precursorion selection is set to the firstisotope of a 16O/18O labelledpeptide the entire isotopic clus-ter is transmitted into the col-lision cell if the quadrupole isadjusted to an appropriate lowresolution. When the precursorion selection is moved to them/z value of the 18O isotope,the 16O isotope can be excludedfrom the fragmentation experi-ment without affecting the trans-mission of the 18O isotope to amajor degree. Since the resolu-tion of the quadrupole wasnot increased for the secondMS/MS experiment and thewidth of the window of trans-mission did not decrease, morechemical noise ions reach thecollision zone (here betweenm/z 609.5 and 611).
the spectrum can make the interpretation very timeconsuming. Therefore, an algorithm has been developedto score each peak in the 16O/18O fragment spectrum forits likelihood to be a C-terminal fragment ion. The scoringfunction consists of two parts. In the first step every peakin the 16O/18O fragment spectrum is evaluated whether itis the first isotope of a 16O/18O labelled fragment. Theintensities of the following peaks are compared withthe expected isotope abundance of an 18O labelled pep-tide. To calculate the expected isotope distribution theelemental composition of the fragment and the effectivedegree of 18O labelling must be known. The elementalcomposition is approximated by the elemental compo-sition of a peptide having the same mass with an averageamino acid composition determined from the statisticalabundance of amino acids of all proteins in the nonredun-dant database (NRDB). The actual degree of 18O labellingis measured on an obvious y-ion in the fragment spec-trum itself. In a second step the relative suppression ofthe 16O isotope in the second spectrum in comparisonwith the first is determined. The two scoring functionsare multiplied with the 16O/18O spectrum to produce aspectrum which is filtered for y-ions. The dynamic rangeof the scored spectra is reduced to approximately 1000to display them on the computer screen (see Section 2.4).
Before evaluating the spectrum the charge state of everyion is determined. It is derived from the best correspon-dence between the intensities of m/z values of putativeisotopes with the expected isotopic abundance for thecharges 1 to 4. The expected isotopic distribution iscalculated from the average amino acid abundancedetermined from the NRDB (EBI, Cambridge, UK, http://www.ebi.ac.uk).
The algorithm to measure the actual degree of 18O label-ling consists of three parts, detection of a series of puta-tive 18O labelled fragments, determination of their degreeof 18O labelling and scoring of the measured values. Onlythe upper 40% of the spectrum’s m/z scale is consideredto find 18O labelled fragments. This restriction reduces theprobability of overlap with other fragment ions. To detect18O labelled fragments an autocorrelated spectrum iscalculated. The intensity of every m/z value is multipliedwith the intensities of (m/z + 1), (m/z + 2) and (m/z + 3).This enhances considerably the first isotope of an 18Olabelled fragment. The peak with the maximum intensityin every 70 Da wide window is considered a putative 18Olabelled fragment. Its degree of 18O labelling is calculatedfrom its isotopic distribution in comparison with theexpected isotopic distribution of a peptide of the same
672 S. Uttenweiler-Joseph et al. Proteomics 2001, 1, 668–682
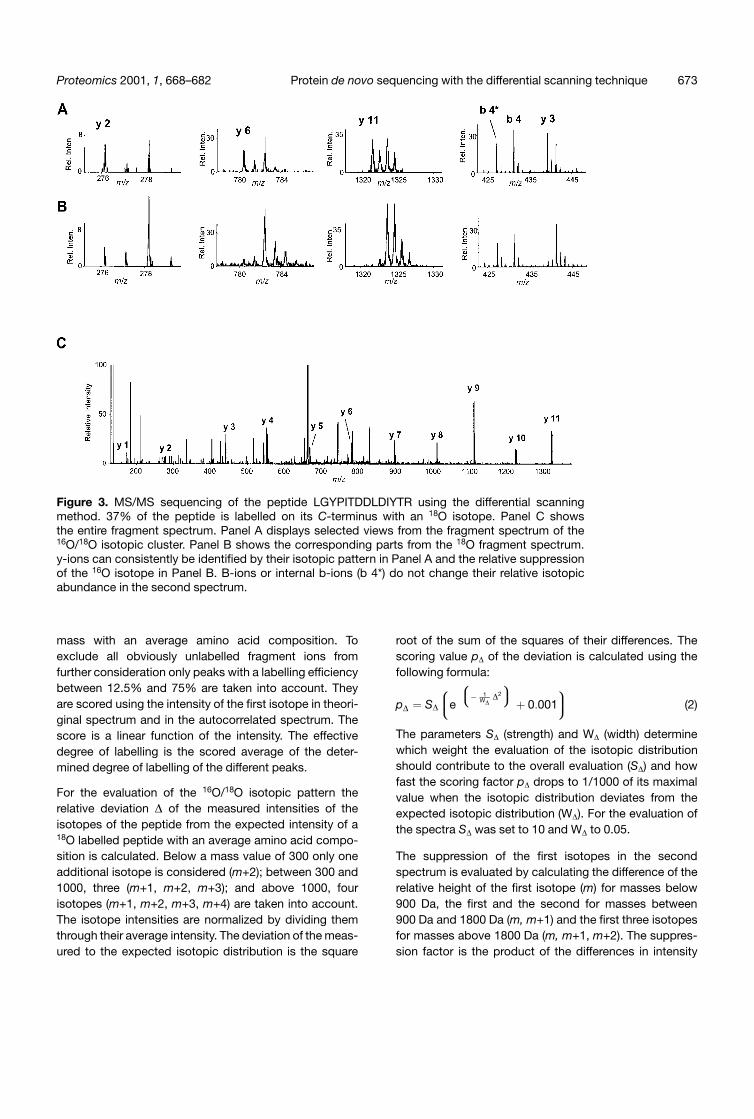
Figure 3. MS/MS sequencing of the peptide LGYPITDDLDIYTR using the differential scanningmethod. 37% of the peptide is labelled on its C-terminus with an 18O isotope. Panel C showsthe entire fragment spectrum. Panel A displays selected views from the fragment spectrum of the16O/18O isotopic cluster. Panel B shows the corresponding parts from the 18O fragment spectrum.y-ions can consistently be identified by their isotopic pattern in Panel A and the relative suppressionof the 16O isotope in Panel B. B-ions or internal b-ions (b 4*) do not change their relative isotopicabundance in the second spectrum.
mass with an average amino acid composition. Toexclude all obviously unlabelled fragment ions fromfurther consideration only peaks with a labelling efficiencybetween 12.5% and 75% are taken into account. Theyare scored using the intensity of the first isotope in theori-ginal spectrum and in the autocorrelated spectrum. Thescore is a linear function of the intensity. The effectivedegree of labelling is the scored average of the deter-mined degree of labelling of the different peaks.
For the evaluation of the 16O/18O isotopic pattern therelative deviation � of the measured intensities of theisotopes of the peptide from the expected intensity of a18O labelled peptide with an average amino acid compo-sition is calculated. Below a mass value of 300 only oneadditional isotope is considered (m+2); between 300 and1000, three (m+1, m+2, m+3); and above 1000, fourisotopes (m+1, m+2, m+3, m+4) are taken into account.The isotope intensities are normalized by dividing themthrough their average intensity. The deviation of the meas-ured to the expected isotopic distribution is the square
root of the sum of the squares of their differences. Thescoring value p� of the deviation is calculated using thefollowing formula:
p� � S�
����e
��� 1
W��2
��
� 0�001���� (2)
The parameters S� (strength) and W� (width) determinewhich weight the evaluation of the isotopic distributionshould contribute to the overall evaluation (S�) and howfast the scoring factor p� drops to 1/1000 of its maximalvalue when the isotopic distribution deviates from theexpected isotopic distribution (W�). For the evaluation ofthe spectra S� was set to 10 and W� to 0.05.
The suppression of the first isotopes in the secondspectrum is evaluated by calculating the difference of therelative height of the first isotope (m) for masses below900 Da, the first and the second for masses between900 Da and 1800 Da (m, m+1) and the first three isotopesfor masses above 1800 Da (m, m+1, m+2). The suppres-sion factor is the product of the differences in intensity
Proteomics 2001, 1, 668–682 Protein de novo sequencing with the differential scanning technique 673
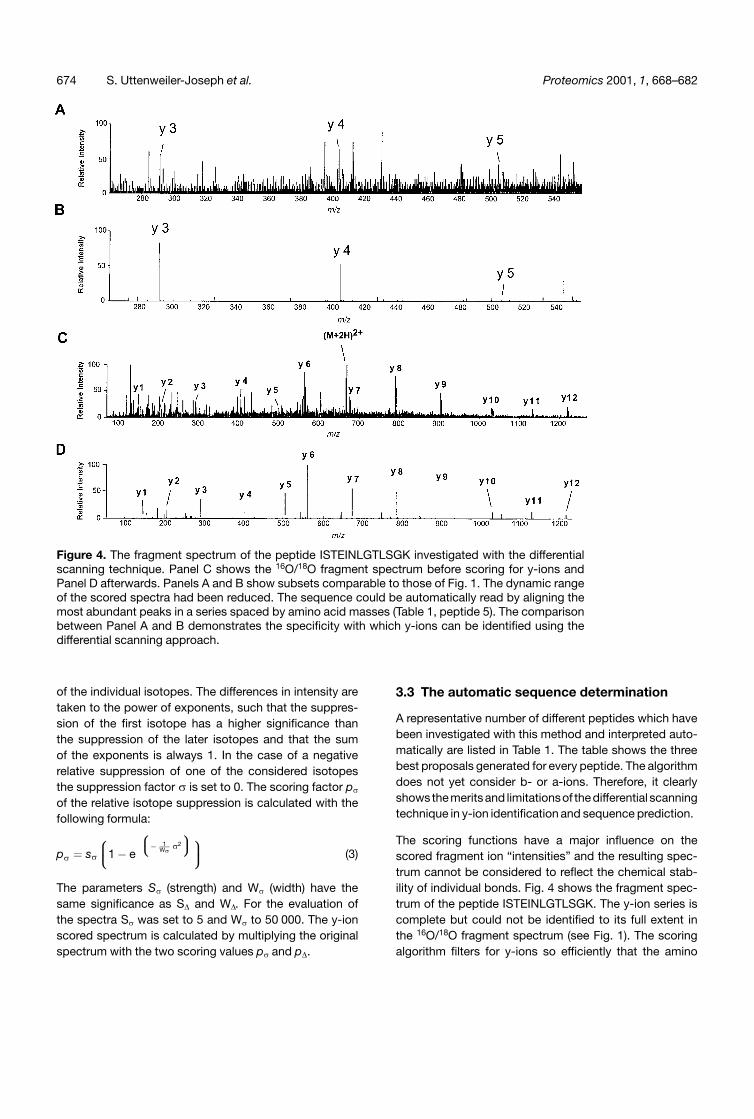
Figure 4. The fragment spectrum of the peptide ISTEINLGTLSGK investigated with the differentialscanning technique. Panel C shows the 16O/18O fragment spectrum before scoring for y-ions andPanel D afterwards. Panels A and B show subsets comparable to those of Fig. 1. The dynamic rangeof the scored spectra had been reduced. The sequence could be automatically read by aligning themost abundant peaks in a series spaced by amino acid masses (Table 1, peptide 5). The comparisonbetween Panel A and B demonstrates the specificity with which y-ions can be identified using thedifferential scanning approach.
of the individual isotopes. The differences in intensity aretaken to the power of exponents, such that the suppres-sion of the first isotope has a higher significance thanthe suppression of the later isotopes and that the sumof the exponents is always 1. In the case of a negativerelative suppression of one of the considered isotopesthe suppression factor � is set to 0. The scoring factor p�
of the relative isotope suppression is calculated with thefollowing formula:
p� � s�
����1 � e
��� 1
W��2
������ (3)
The parameters S� (strength) and W� (width) have thesame significance as S� and W�. For the evaluation ofthe spectra S� was set to 5 and W� to 50 000. The y-ionscored spectrum is calculated by multiplying the originalspectrum with the two scoring values p� and p�.
3.3 The automatic sequence determination
A representative number of different peptides which havebeen investigated with this method and interpreted auto-matically are listed in Table 1. The table shows the threebest proposals generated for every peptide. The algorithmdoes not yet consider b- or a-ions. Therefore, it clearlyshows the meritsand limitationsof the differential scanningtechnique in y-ion identification and sequence prediction.
The scoring functions have a major influence on thescored fragment ion “intensities” and the resulting spec-trum cannot be considered to reflect the chemical stab-ility of individual bonds. Fig. 4 shows the fragment spec-trum of the peptide ISTEINLGTLSGK. The y-ion series iscomplete but could not be identified to its full extent inthe 16O/18O fragment spectrum (see Fig. 1). The scoringalgorithm filters for y-ions so efficiently that the amino
674 S. Uttenweiler-Joseph et al. Proteomics 2001, 1, 668–682
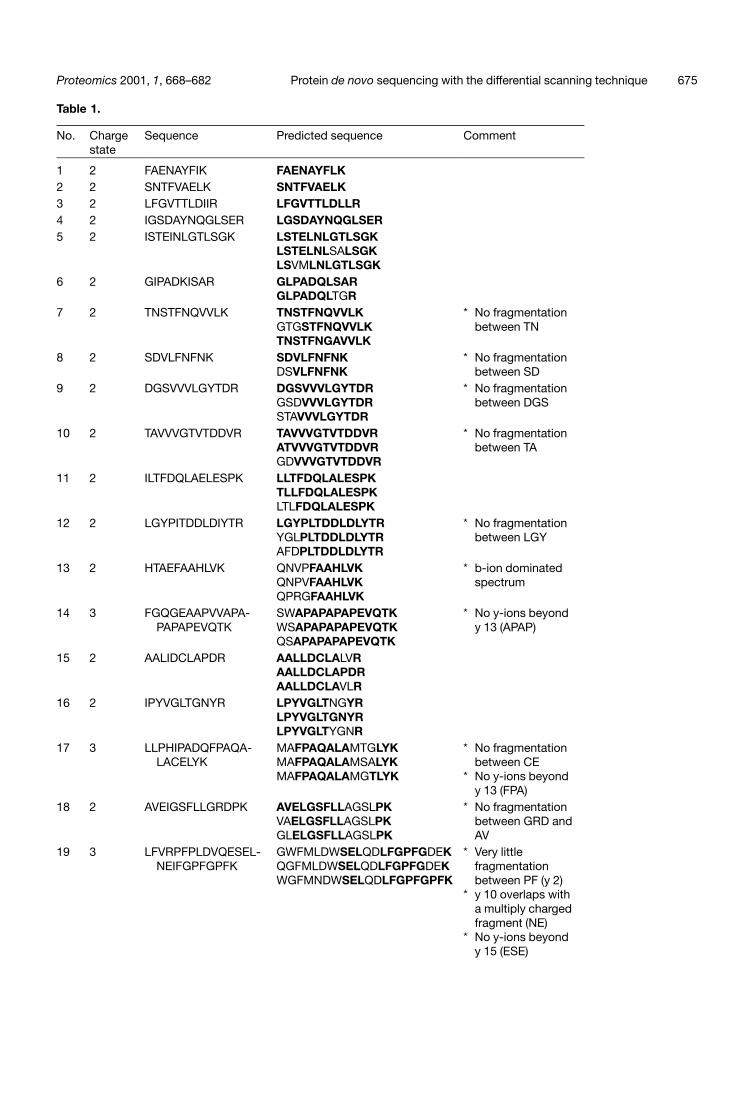
Table 1.
No. Chargestate
Sequence Predicted sequence Comment
1 2 FAENAYFIK FAENAYFLK2 2 SNTFVAELK SNTFVAELK3 2 LFGVTTLDIIR LFGVTTLDLLR4 2 IGSDAYNQGLSER LGSDAYNQGLSER5 2 ISTEINLGTLSGK LSTELNLGTLSGK
LSTELNLSALSGKLSVMLNLGTLSGK
6 2 GIPADKISAR GLPADQLSARGLPADQLTGR
7 2 TNSTFNQVVLK TNSTFNQVVLKGTGSTFNQVVLKTNSTFNGAVVLK
* No fragmentationbetween TN
8 2 SDVLFNFNK SDVLFNFNKDSVLFNFNK
* No fragmentationbetween SD
9 2 DGSVVVLGYTDR DGSVVVLGYTDRGSDVVVLGYTDRSTAVVVLGYTDR
* No fragmentationbetween DGS
10 2 TAVVVGTVTDDVR TAVVVGTVTDDVRATVVVGTVTDDVRGDVVVGTVTDDVR
* No fragmentationbetween TA
11 2 ILTFDQLAELESPK LLTFDQLALESPKTLLFDQLALESPKLTLFDQLALESPK
12 2 LGYPITDDLDIYTR LGYPLTDDLDLYTRYGLPLTDDLDLYTRAFDPLTDDLDLYTR
* No fragmentationbetween LGY
13 2 HTAEFAAHLVK QNVPFAAHLVKQNPVFAAHLVKQPRGFAAHLVK
* b-ion dominatedspectrum
14 3 FGQGEAAPVVAPA-PAPAPEVQTK
SWAPAPAPAPEVQTKWSAPAPAPAPEVQTKQSAPAPAPAPEVQTK
* No y-ions beyondy 13 (APAP)
15 2 AALIDCLAPDR AALLDCLALVRAALLDCLAPDRAALLDCLAVLR
16 2 IPYVGLTGNYR LPYVGLTNGYRLPYVGLTGNYRLPYVGLTYGNR
17 3 LLPHIPADQFPAQA-LACELYK
MAFPAQALAMTGLYKMAFPAQALAMSALYKMAFPAQALAMGTLYK
* No fragmentationbetween CE
* No y-ions beyondy 13 (FPA)
18 2 AVEIGSFLLGRDPK AVELGSFLLAGSLPKVAELGSFLLAGSLPKGLELGSFLLAGSLPK
* No fragmentationbetween GRD andAV
19 3 LFVRPFPLDVQESEL-NEIFGPFGPFK
GWFMLDWSELQDLFGPFGDEKQGFMLDWSELQDLFGPFGDEKWGFMNDWSELQDLFGPFGPFK
* Very littlefragmentationbetween PF (y 2)
* y 10 overlaps witha multiply chargedfragment (NE)
* No y-ions beyondy 15 (ESE)
Proteomics 2001, 1, 668–682 Protein de novo sequencing with the differential scanning technique 675
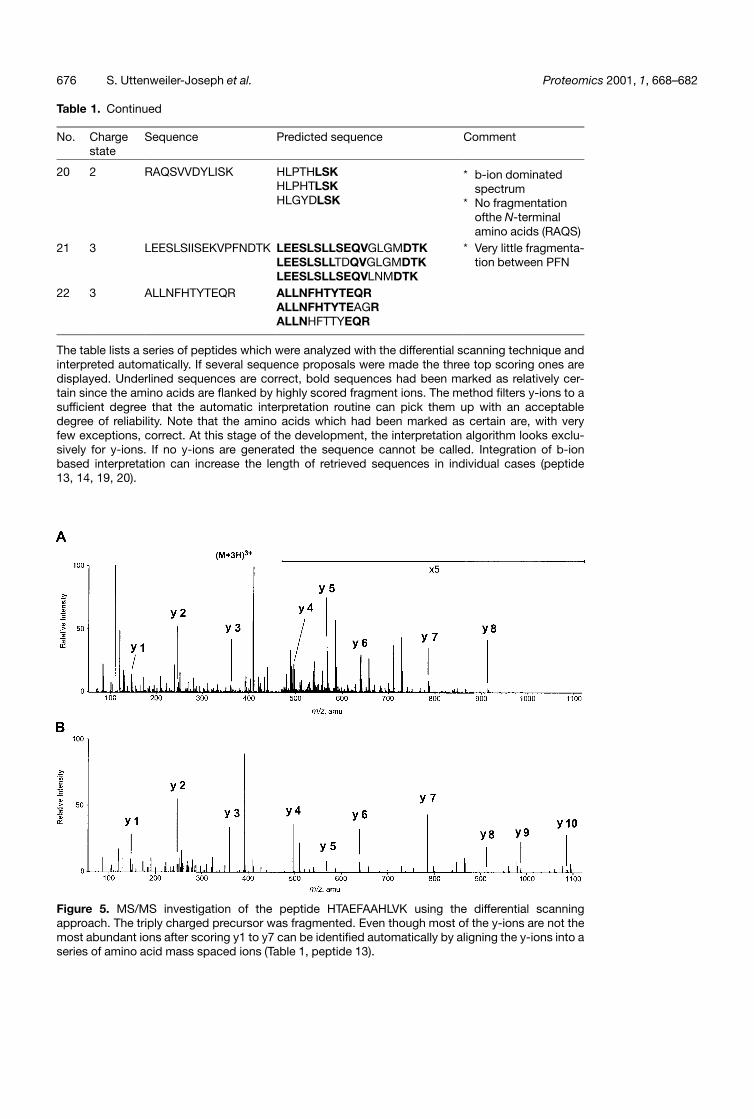
Table 1. Continued
No. Chargestate
Sequence Predicted sequence Comment
20 2 RAQSVVDYLISK HLPTHLSKHLPHTLSKHLGYDLSK
* b-ion dominatedspectrum
* No fragmentationofthe N-terminalamino acids (RAQS)
21 3 LEESLSIISEKVPFNDTK LEESLSLLSEQVGLGMDTKLEESLSLLTDQVGLGMDTKLEESLSLLSEQVLNMDTK
* Very little fragmenta-tion between PFN
22 3 ALLNFHTYTEQR ALLNFHTYTEQRALLNFHTYTEAGRALLNHFTTYEQR
The table lists a series of peptides which were analyzed with the differential scanning technique andinterpreted automatically. If several sequence proposals were made the three top scoring ones aredisplayed. Underlined sequences are correct, bold sequences had been marked as relatively cer-tain since the amino acids are flanked by highly scored fragment ions. The method filters y-ions to asufficient degree that the automatic interpretation routine can pick them up with an acceptabledegree of reliability. Note that the amino acids which had been marked as certain are, with veryfew exceptions, correct. At this stage of the development, the interpretation algorithm looks exclu-sively for y-ions. If no y-ions are generated the sequence cannot be called. Integration of b-ionbased interpretation can increase the length of retrieved sequences in individual cases (peptide13, 14, 19, 20).
Figure 5. MS/MS investigation of the peptide HTAEFAAHLVK using the differential scanningapproach. The triply charged precursor was fragmented. Even though most of the y-ions are not themost abundant ions after scoring y1 to y7 can be identified automatically by aligning the y-ions into aseries of amino acid mass spaced ions (Table 1, peptide 13).
676 S. Uttenweiler-Joseph et al. Proteomics 2001, 1, 668–682
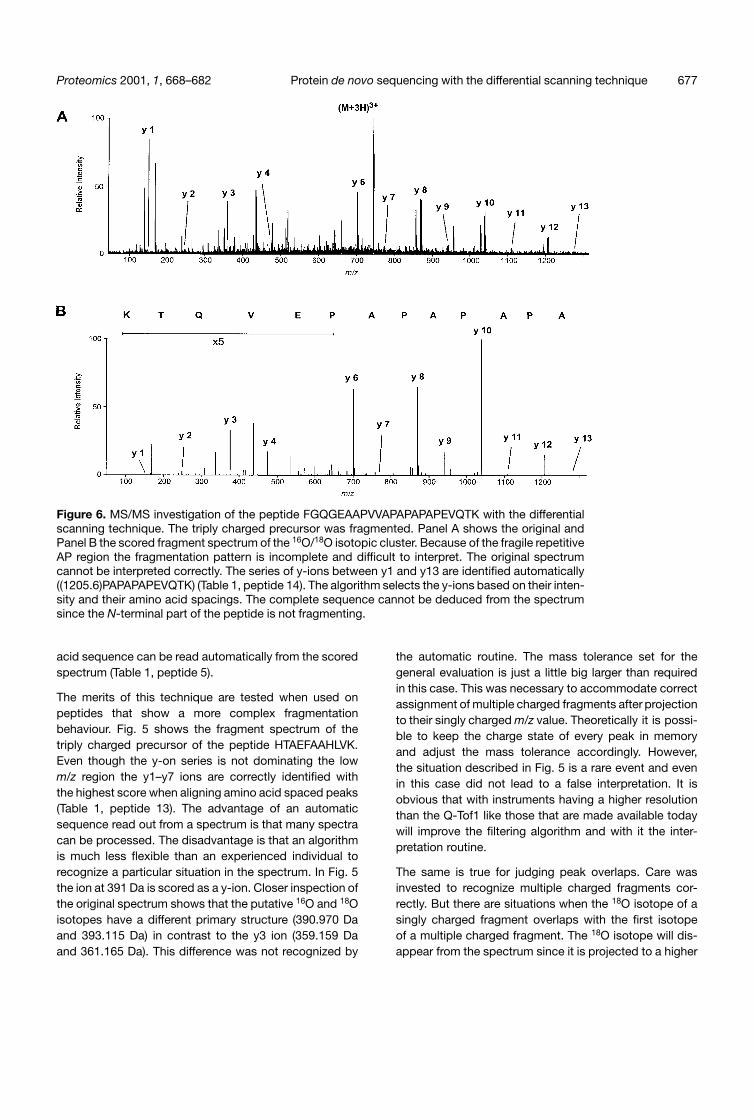
Figure 6. MS/MS investigation of the peptide FGQGEAAPVVAPAPAPAPEVQTK with the differentialscanning technique. The triply charged precursor was fragmented. Panel A shows the original andPanel B the scored fragment spectrum of the 16O/18O isotopic cluster. Because of the fragile repetitiveAP region the fragmentation pattern is incomplete and difficult to interpret. The original spectrumcannot be interpreted correctly. The series of y-ions between y1 and y13 are identified automatically((1205.6)PAPAPAPEVQTK) (Table 1, peptide 14). The algorithm selects the y-ions based on their inten-sity and their amino acid spacings. The complete sequence cannot be deduced from the spectrumsince the N-terminal part of the peptide is not fragmenting.
acid sequence can be read automatically from the scoredspectrum (Table 1, peptide 5).
The merits of this technique are tested when used onpeptides that show a more complex fragmentationbehaviour. Fig. 5 shows the fragment spectrum of thetriply charged precursor of the peptide HTAEFAAHLVK.Even though the y-on series is not dominating the lowm/z region the y1–y7 ions are correctly identified withthe highest score when aligning amino acid spaced peaks(Table 1, peptide 13). The advantage of an automaticsequence read out from a spectrum is that many spectracan be processed. The disadvantage is that an algorithmis much less flexible than an experienced individual torecognize a particular situation in the spectrum. In Fig. 5the ion at 391 Da is scored as a y-ion. Closer inspection ofthe original spectrum shows that the putative 16O and 18Oisotopes have a different primary structure (390.970 Daand 393.115 Da) in contrast to the y3 ion (359.159 Daand 361.165 Da). This difference was not recognized by
the automatic routine. The mass tolerance set for thegeneral evaluation is just a little big larger than requiredin this case. This was necessary to accommodate correctassignment of multiple charged fragments after projectionto their singly charged m/z value. Theoretically it is possi-ble to keep the charge state of every peak in memoryand adjust the mass tolerance accordingly. However,the situation described in Fig. 5 is a rare event and evenin this case did not lead to a false interpretation. It isobvious that with instruments having a higher resolutionthan the Q-Tof1 like those that are made available todaywill improve the filtering algorithm and with it the inter-pretation routine.
The same is true for judging peak overlaps. Care wasinvested to recognize multiple charged fragments cor-rectly. But there are situations when the 18O isotope of asingly charged fragment overlaps with the first isotopeof a multiple charged fragment. The 18O isotope will dis-appear from the spectrum since it is projected to a higher
Proteomics 2001, 1, 668–682 Protein de novo sequencing with the differential scanning technique 677
m/z value as part of a multiple charged fragment. Ifthe spectrum would perfectly well represent the relativeabundance of ions this could be recognised as such bythe computer programme. However, this is not the case,particularly for very small peaks which consist only of 10ions or less. For the overall result it is important to allowthe algorithm to interpret very small peaks. For this highsensitivity the requirement of a very precise quantitativerepresentation of every peak was sacrificed.
Fig. 6 gives an even more complex example. The triplycharged precursor of the peptide FGQGEAAPWAPAPA-PAPEVQTK was fragmented. Since the N-terminal bondof a proline is labile the peptide has a fragile region inthe repetitive AP sequence. Because the C-terminalbond of a proline is very stable the fragment spectrum isdominated by abundant fragments followed by very smallions. This renders the interpretation of the original datavery difficult and error prone. The automatic interpretationroutine determines the C-terminal 13 amino acids cor-rectly, they are marked as being relatively certain and itis realized that there are no more sufficiently good frag-mentation data available to support a much longersequence proposal (Table 1, peptide 14). There areseveral doubly charged y-ions which are recognized assuch and the y13 ion is nearly exclusively based on adoubly charged fragment ion. It should be noted that thesequence of the C-terminal 12 amino acids can only bepartially confirmed by b-ions. It is not possible to deter-mine the entire sequence of the peptide from the spec-trum because the N-terminal region does not fragmentto a sufficient degree.
Figs. 5 and 6 demonstrate that the scoring mechanismdoes not generate spectra which consist only of y-ions.The existing y-ions may not represent the peaks with thehighest intensity in every region of the scored spectrum.The mathematical reduction of the dynamic range of thespectra exaggerates the impression that there are manyother ions of similar intensity still in the scored spectrumsince the relative differences between the peaks arereduced. But it is the case that existing y-ions are notalways receiving the highest scores. This is due to the highsensitivity in picking up y-ions which is required to optimizethe automatic sequence read out. Fig. 7 shows extractsfrom the original fragment spectra and the scored spec-trum of the peptide FGQGEAAPVVAPAPAPAPEVQTK.Each isotope of the y2 ion which was correctly assignedconsists of less than 10 ions. The scoring functions allowenough tolerance so that these peaks still receive a posi-tive score. But the same tolerance renders the spectrummore noisy. In contrast to y2 the isotopes of y12 contain20 isotopes or more per peak. This ion is recognized asan “obvious y-ion” by the interpretation routine and istherefore part of every possible sequence proposal.
It may be mentioned that from the two criteria to identifyy-ions using the differential scanning method, the 16O/18Oisotopic labelling in the first spectrum and the relativesuppression of the 16O isotope in the second, none ofthe two is a sufficient criterion by itself to pick up y-ionsunambiguously. The 16O/18O isotopic distribution can bemimicked or distorted by other fragment ions particularlyin the low m/z region. On the other hand, the suppressionof the 16O isotope is observed for all fragment ions inthe high m/z region when a peptide with a mass above1800 Da is analyzed. Fig. 8 shows the contribution ofions labelled with 16O and 18O to the overall isotopic dis-tribution of a large peptide. To exclude sufficiently well the16O labelled ions from the second experiment the (m+2)ion must be completely excluded from the MS/MS inves-tigation. Ions with the mass of (m+2) are 18O labelled ionsbut as well 16O labelled ions which contain somewhere inthe peptide two heavier isotopes like 13C or 15N. If the(m+2) ions are excluded from the second experimentsome 18O labelled peptide ions are excluded as well.These are precisely those which contain beside the 18Oat their C-terminus no other heavier isotope (so called12C-only ions). A specific subgroup of all 18O labelled pep-tide ions are excluded from the second experiment. Thiswill be visible when this specific subgroup contributes alarge proportion to a particular isotope. This is the casefor the first isotope of any large fragment. For small frag-ments the first isotope is coming from two groups of ions,the 12C-only ions and other ions of the peptide whose 13Cor 15N isotopes are located in the other part of the pep-tide. This second group for generating the first isotope ofa fragment is getting rapidly smaller when the fragmentsize increases. This is so because the size of the otherpart of the peptide where the 13C and 15N isotopes areto be located decreases. Therefore, the 12C-only ions ofthe peptide contribute considerably to the first isotope ofany large fragment. If these ions are excluded from thesecond experiment the first isotope of all larger fragmentswill be suppressed (Fig. 9). The criterion that the first iso-tope for y-ions is suppressed is not sufficient to filter themout unambiguously. In this region only the combination ofthe two criteria, 18O labelling and suppression, is specificfor y-ions. Luckily, this region of the spectrum is generallynot populated with too many fragment ions so that thetrue isotopic ratios of the peaks are often conserved.
3.4 Characterization of proteins involvedin vesicular targeting and fusion
Endocytosis, the incorporation of a small vesicle formedfrom the outer cellular membrane, is the main mechanismby which cells transport material from the outside of thecell to their interior. The opposite process, the meltingof an internally generated vesicle with the outer cell
678 S. Uttenweiler-Joseph et al. Proteomics 2001, 1, 668–682
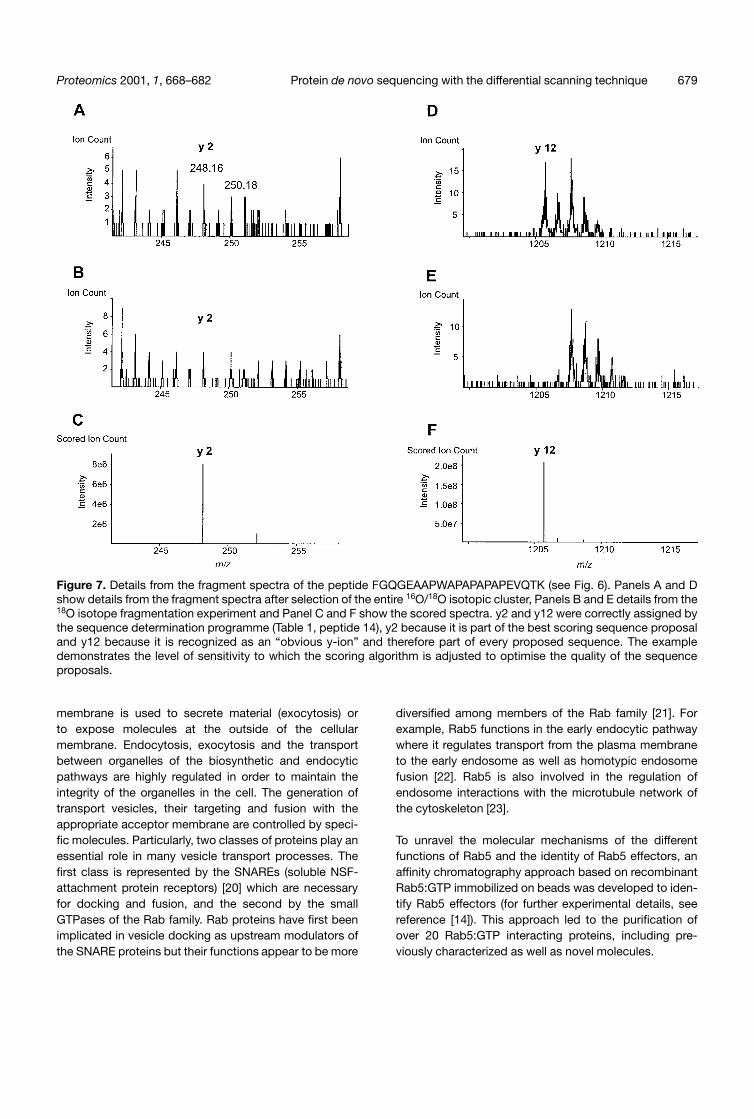
Figure 7. Details from the fragment spectra of the peptide FGQGEAAPWAPAPAPAPEVQTK (see Fig. 6). Panels A and Dshow details from the fragment spectra after selection of the entire 16O/18O isotopic cluster, Panels B and E details from the18O isotope fragmentation experiment and Panel C and F show the scored spectra. y2 and y12 were correctly assigned bythe sequence determination programme (Table 1, peptide 14), y2 because it is part of the best scoring sequence proposaland y12 because it is recognized as an “obvious y-ion” and therefore part of every proposed sequence. The exampledemonstrates the level of sensitivity to which the scoring algorithm is adjusted to optimise the quality of the sequenceproposals.
membrane is used to secrete material (exocytosis) orto expose molecules at the outside of the cellularmembrane. Endocytosis, exocytosis and the transportbetween organelles of the biosynthetic and endocyticpathways are highly regulated in order to maintain theintegrity of the organelles in the cell. The generation oftransport vesicles, their targeting and fusion with theappropriate acceptor membrane are controlled by speci-fic molecules. Particularly, two classes of proteins play anessential role in many vesicle transport processes. Thefirst class is represented by the SNAREs (soluble NSF-attachment protein receptors) [20] which are necessaryfor docking and fusion, and the second by the smallGTPases of the Rab family. Rab proteins have first beenimplicated in vesicle docking as upstream modulators ofthe SNARE proteins but their functions appear to be more
diversified among members of the Rab family [21]. Forexample, Rab5 functions in the early endocytic pathwaywhere it regulates transport from the plasma membraneto the early endosome as well as homotypic endosomefusion [22]. Rab5 is also involved in the regulation ofendosome interactions with the microtubule network ofthe cytoskeleton [23].
To unravel the molecular mechanisms of the differentfunctions of Rab5 and the identity of Rab5 effectors, anaffinity chromatography approach based on recombinantRab5:GTP immobilized on beads was developed to iden-tify Rab5 effectors (for further experimental details, seereference [14]). This approach led to the purification ofover 20 Rab5:GTP interacting proteins, including pre-viously characterized as well as novel molecules.
Proteomics 2001, 1, 668–682 Protein de novo sequencing with the differential scanning technique 679
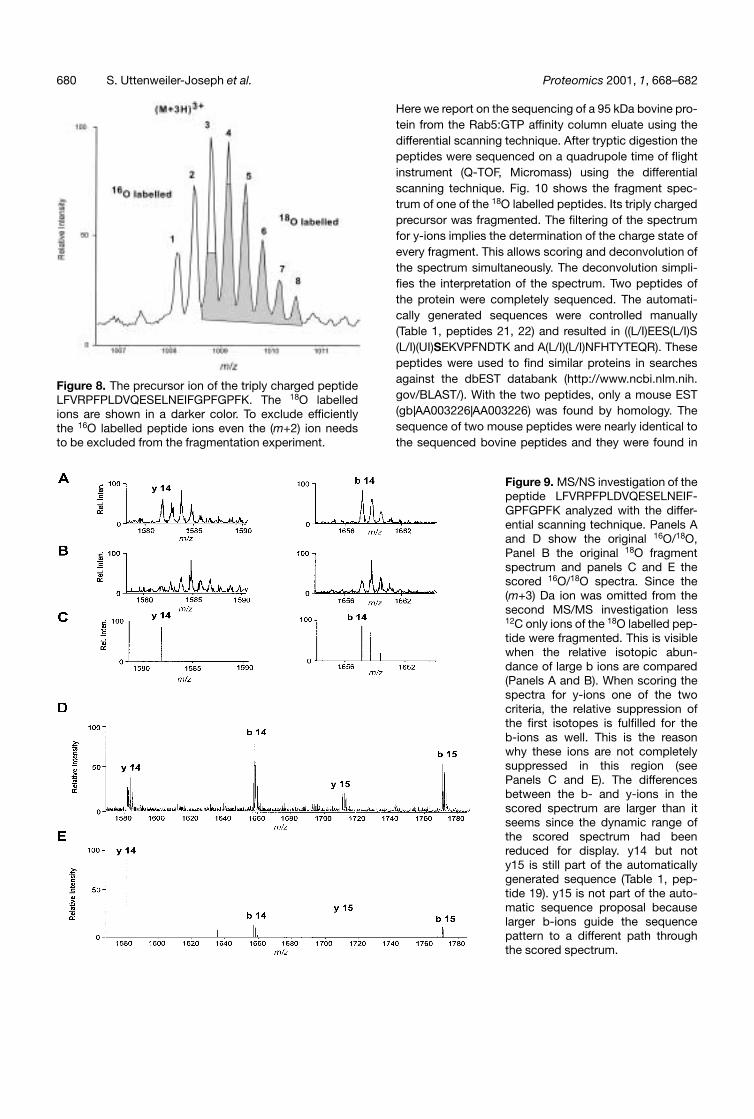
Figure 8. The precursor ion of the triply charged peptideLFVRPFPLDVQESELNEIFGPFGPFK. The 18O labelledions are shown in a darker color. To exclude efficientlythe 16O labelled peptide ions even the (m+2) ion needsto be excluded from the fragmentation experiment.
Here we report on the sequencing of a 95 kDa bovine pro-tein from the Rab5:GTP affinity column eluate using thedifferential scanning technique. After tryptic digestion thepeptides were sequenced on a quadrupole time of flightinstrument (Q-TOF, Micromass) using the differentialscanning technique. Fig. 10 shows the fragment spec-trum of one of the 18O labelled peptides. Its triply chargedprecursor was fragmented. The filtering of the spectrumfor y-ions implies the determination of the charge state ofevery fragment. This allows scoring and deconvolution ofthe spectrum simultaneously. The deconvolution simpli-fies the interpretation of the spectrum. Two peptides ofthe protein were completely sequenced. The automati-cally generated sequences were controlled manually(Table 1, peptides 21, 22) and resulted in ((L/I)EES(L/I)S(L/I)(UI)SEKVPFNDTK and A(L/I)(L/I)NFHTYTEQR). Thesepeptides were used to find similar proteins in searchesagainst the dbEST databank (http://www.ncbi.nlm.nih.gov/BLAST/). With the two peptides, only a mouse EST(gb|AA003226|AA003226) was found by homology. Thesequence of two mouse peptides were nearly identical tothe sequenced bovine peptides and they were found in
Figure 9. MS/NS investigation of thepeptide LFVRPFPLDVQESELNEIF-GPFGPFK analyzed with the differ-ential scanning technique. Panels Aand D show the original 16O/18O,Panel B the original 18O fragmentspectrum and panels C and E thescored 16O/18O spectra. Since the(m+3) Da ion was omitted from thesecond MS/MS investigation less12C only ions of the 18O labelled pep-tide were fragmented. This is visiblewhen the relative isotopic abun-dance of large b ions are compared(Panels A and B). When scoring thespectra for y-ions one of the twocriteria, the relative suppression ofthe first isotopes is fulfilled for theb-ions as well. This is the reasonwhy these ions are not completelysuppressed in this region (seePanels C and E). The differencesbetween the b- and y-ions in thescored spectrum are larger than itseems since the dynamic range ofthe scored spectrum had beenreduced for display. y14 but noty15 is still part of the automaticallygenerated sequence (Table 1, pep-tide 19). y15 is not part of the auto-matic sequence proposal becauselarger b-ions guide the sequencepattern to a different path throughthe scored spectrum.
680 S. Uttenweiler-Joseph et al. Proteomics 2001, 1, 668–682
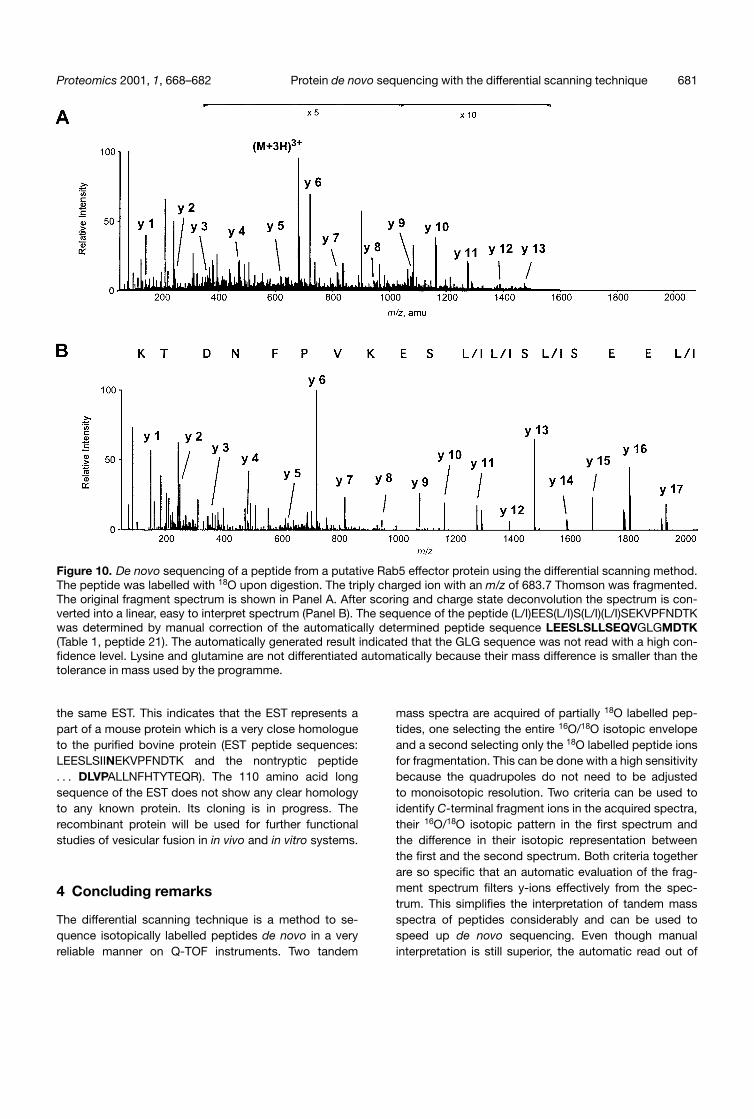
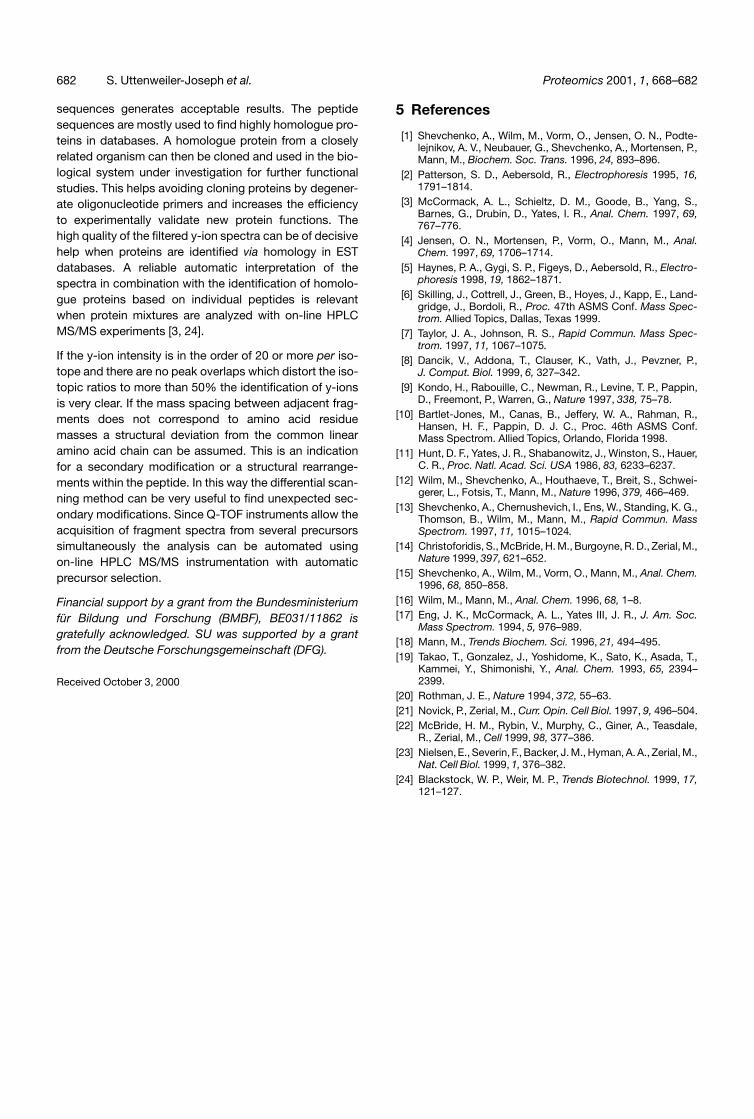
Figure 10. De novo sequencing of a peptide from a putative Rab5 effector protein using the differential scanning method.The peptide was labelled with 18O upon digestion. The triply charged ion with an m/z of 683.7 Thomson was fragmented.The original fragment spectrum is shown in Panel A. After scoring and charge state deconvolution the spectrum is con-verted into a linear, easy to interpret spectrum (Panel B). The sequence of the peptide (L/I)EES(L/I)S(L/I)(L/I)SEKVPFNDTKwas determined by manual correction of the automatically determined peptide sequence LEESLSLLSEQVGLGMDTK(Table 1, peptide 21). The automatically generated result indicated that the GLG sequence was not read with a high con-fidence level. Lysine and glutamine are not differentiated automatically because their mass difference is smaller than thetolerance in mass used by the programme.
the same EST. This indicates that the EST represents apart of a mouse protein which is a very close homologueto the purified bovine protein (EST peptide sequences:LEESLSIINEKVPFNDTK and the nontryptic peptide. . . DLVPALLNFHTYTEQR). The 110 amino acid longsequence of the EST does not show any clear homologyto any known protein. Its cloning is in progress. Therecombinant protein will be used for further functionalstudies of vesicular fusion in in vivo and in vitro systems.
4 Concluding remarks
The differential scanning technique is a method to se-quence isotopically labelled peptides de novo in a veryreliable manner on Q-TOF instruments. Two tandem
mass spectra are acquired of partially 18O labelled pep-tides, one selecting the entire 16O/18O isotopic envelopeand a second selecting only the 18O labelled peptide ionsfor fragmentation. This can be done with a high sensitivitybecause the quadrupoles do not need to be adjustedto monoisotopic resolution. Two criteria can be used toidentify C-terminal fragment ions in the acquired spectra,their 16O/18O isotopic pattern in the first spectrum andthe difference in their isotopic representation betweenthe first and the second spectrum. Both criteria togetherare so specific that an automatic evaluation of the frag-ment spectrum filters y-ions effectively from the spec-trum. This simplifies the interpretation of tandem massspectra of peptides considerably and can be used tospeed up de novo sequencing. Even though manualinterpretation is still superior, the automatic read out of
Proteomics 2001, 1, 668–682 Protein de novo sequencing with the differential scanning technique 681
sequences generates acceptable results. The peptidesequences are mostly used to find highly homologue pro-teins in databases. A homologue protein from a closelyrelated organism can then be cloned and used in the bio-logical system under investigation for further functionalstudies. This helps avoiding cloning proteins by degener-ate oligonucleotide primers and increases the efficiencyto experimentally validate new protein functions. Thehigh quality of the filtered y-ion spectra can be of decisivehelp when proteins are identified via homology in ESTdatabases. A reliable automatic interpretation of thespectra in combination with the identification of homolo-gue proteins based on individual peptides is relevantwhen protein mixtures are analyzed with on-line HPLCMS/MS experiments [3, 24].
If the y-ion intensity is in the order of 20 or more per iso-tope and there are no peak overlaps which distort the iso-topic ratios to more than 50% the identification of y-ionsis very clear. If the mass spacing between adjacent frag-ments does not correspond to amino acid residuemasses a structural deviation from the common linearamino acid chain can be assumed. This is an indicationfor a secondary modification or a structural rearrange-ments within the peptide. In this way the differential scan-ning method can be very useful to find unexpected sec-ondary modifications. Since Q-TOF instruments allow theacquisition of fragment spectra from several precursorssimultaneously the analysis can be automated usingon-line HPLC MS/MS instrumentation with automaticprecursor selection.
Financial support by a grant from the Bundesministeriumfür Bildung und Forschung (BMBF), BE031/11862 isgratefully acknowledged. SU was supported by a grantfrom the Deutsche Forschungsgemeinschaft (DFG).
Received October 3, 2000
5 References
[1] Shevchenko, A., Wilm, M., Vorm, O., Jensen, O. N., Podte-lejnikov, A. V., Neubauer, G., Shevchenko, A., Mortensen, P.,Mann, M., Biochem. Soc. Trans. 1996, 24, 893–896.
[2] Patterson, S. D., Aebersold, R., Electrophoresis 1995, 16,1791–1814.
[3] McCormack, A. L., Schieltz, D. M., Goode, B., Yang, S.,Barnes, G., Drubin, D., Yates, I. R., Anal. Chem. 1997, 69,767–776.
[4] Jensen, O. N., Mortensen, P., Vorm, O., Mann, M., Anal.Chem. 1997, 69, 1706–1714.
[5] Haynes, P. A., Gygi, S. P., Figeys, D., Aebersold, R., Electro-phoresis 1998, 19, 1862–1871.
[6] Skilling, J., Cottrell, J., Green, B., Hoyes, J., Kapp, E., Land-gridge, J., Bordoli, R., Proc. 47th ASMS Conf. Mass Spec-trom. Allied Topics, Dallas, Texas 1999.
[7] Taylor, J. A., Johnson, R. S., Rapid Commun. Mass Spec-trom. 1997, 11, 1067–1075.
[8] Dancik, V., Addona, T., Clauser, K., Vath, J., Pevzner, P.,J. Comput. Biol. 1999, 6, 327–342.
[9] Kondo, H., Rabouille, C., Newman, R., Levine, T. P., Pappin,D., Freemont, P., Warren, G., Nature 1997, 338, 75–78.
[10] Bartlet-Jones, M., Canas, B., Jeffery, W. A., Rahman, R.,Hansen, H. F., Pappin, D. J. C., Proc. 46th ASMS Conf.Mass Spectrom. Allied Topics, Orlando, Florida 1998.
[11] Hunt, D. F., Yates, J. R., Shabanowitz, J., Winston, S., Hauer,C. R., Proc. Natl. Acad. Sci. USA 1986, 83, 6233–6237.
[12] Wilm, M., Shevchenko, A., Houthaeve, T., Breit, S., Schwei-gerer, L., Fotsis, T., Mann, M., Nature 1996, 379, 466–469.
[13] Shevchenko, A., Chernushevich, I., Ens, W., Standing, K. G.,Thomson, B., Wilm, M., Mann, M., Rapid Commun. MassSpectrom. 1997, 11, 1015–1024.
[14] Christoforidis, S., McBride, H. M., Burgoyne, R. D., Zerial, M.,Nature 1999, 397, 621–652.
[15] Shevchenko, A., Wilm, M., Vorm, O., Mann, M., Anal. Chem.1996, 68, 850–858.
[16] Wilm, M., Mann, M., Anal. Chem. 1996, 68, 1–8.[17] Eng, J. K., McCormack, A. L., Yates III, J. R., J. Am. Soc.
Mass Spectrom. 1994, 5, 976–989.[18] Mann, M., Trends Biochem. Sci. 1996, 21, 494–495.[19] Takao, T., Gonzalez, J., Yoshidome, K., Sato, K., Asada, T.,
Kammei, Y., Shimonishi, Y., Anal. Chem. 1993, 65, 2394–2399.
[20] Rothman, J. E., Nature 1994, 372, 55–63.[21] Novick, P., Zerial, M., Curr. Opin. Cell Biol. 1997, 9, 496–504.[22] McBride, H. M., Rybin, V., Murphy, C., Giner, A., Teasdale,
R., Zerial, M., Cell 1999, 98, 377–386.[23] Nielsen,E., Severin, F., Backer, J. M., Hyman, A. A., Zerial, M.,
Nat. Cell Biol. 1999, 1, 376–382.[24] Blackstock, W. P., Weir, M. P., Trends Biotechnol. 1999, 17,
121–127.
682 S. Uttenweiler-Joseph et al. Proteomics 2001, 1, 668–682