Miniature Neurotransmission Regulates Drosophila Synaptic Structural Maturation

Autocatalytic maturation, physical/chemical properties, and crystal structureof Group N HIV-1 protease: Relevance todrug resistance
Jane M. Sayer,1 Johnson Agniswamy,2 Irene T. Weber,2 and John M. Louis1*
1Laboratory of Chemical Physics, National Institute of Diabetes and Digestive and Kidney Diseases, National Institutes of
Health, DHHS, Bethesda, Maryland 20892-05202Department of Biology, Molecular Basis of Disease Program, Georgia State University, Atlanta, Georgia 30303
Received 6 July 2010; Revised 16 August 2010; Accepted 16 August 2010DOI: 10.1002/pro.486Published online 24 August 2010 proteinscience.org
Abstract: The mature protease from Group N human immunodeficiency virus Type 1 (HIV-1) (PR1N)
differs in 20 amino acids from the extensively studied Group M protease (PR1M) at positions
corresponding to minor drug-resistance mutations (DRMs). The first crystal structure (1.09 Aresolution) of PR1N with the clinical inhibitor darunavir (DRV) reveals the same overall structure as
PR1M, but with a slightly larger inhibitor-binding cavity. Changes in the 10s loop and the flap hinge
propagate to shift one flap away from the inhibitor, whereas L89F and substitutions in the 60s loopperturb inhibitor-binding residues 29–32. However, kinetic parameters of PR1N closely resemble
those of PR1M, and calorimetric results are consistent with similar binding affinities for DRV and
two other clinical PIs, suggesting that minor DRMs coevolve to compensate for the detrimentaleffects of drug-specific major DRMs. A miniprecursor (TFR1–61-PR1N) comprising the transframe
region (TFR) fused to the N-terminus of PR1N undergoes autocatalytic cleavage at the TFR/PR1Nsite concomitant with the appearance of catalytic activity characteristic of the dimeric, matureenzyme. This cleavage is inhibited at an equimolar ratio of precursor to DRV (~6 lM), which
partially stabilizes the precursor dimer from a monomer. However, cleavage at L34/W35 within the
TFR, which precedes the TFR1–61/PR1N cleavage at pH � 5, is only partially inhibited. Favorableproperties of PR1N relative to PR1M include its suitability for column fractionation by size under
native conditions and >10-fold higher dimer dissociation constant (150 nM). Exploiting these
properties may facilitate testing of potential dimerization inhibitors that perturb early precursorprocessing steps.
Keywords: HIV/AIDS; retroviral protease; dimer dissociation; enzyme kinetics; calorimetry; crystal
structure; polyprotein processing
Abbreviations: ATV, atazanavir; DRMs, drug-resistance mutations; DRV, darunavir; DSC, differential scanning calorimetry; ESI-MS,electrospray ionization-mass spectrometry; HAART, highly active antiretroviral therapy; HIV-1, human immunodeficiency virus type 1;ITC, isothermal titration calorimetry; PI, clinical inhibitor of PR1M; PR1, mature HIV-1 protease; PR1M, mature HIV-1 protease fromGroup M; PR1N, mature HIV-1 protease from Group N; PR2, mature HIV-2 protease; SMR, size exclusion chromatography coupledwith multiangle light scattering and refractive index measurements; SQV, saquinavir; TFR, transframe region.
Jane M. Sayer, Johnson Agniswamy, Irene T. Weber, and John M. Louis contributed equally to this work
Grant sponsor: NIH; Grant number: GM062920; Grant sponsors: Intramural Research Program of the NIDDK, Intramural AIDS-Targeted Antiviral Program of the Office of the Director, NIH.
*Correspondence to: John M. Louis, Building 5, Room B2-29, LCP, NIDDK, NIH, Bethesda, MD 20892-0520. E-mail: [email protected]
Published by Wiley-Blackwell. VC 2010 The Protein Society PROTEIN SCIENCE 2010 VOL 19:2055—2072 2055

Introduction
To date, four genetically distinct groups have been
identified for human immunodeficiency virus Type 1
(HIV-1), the predominant virus that causes AIDS.
Groups M (Major), N (Non-M non-O),1 and O (Out-
lier)2 derive from SIV strains that infect chimpan-
zees, whereas a fourth group, first identified in 2009
and designated as Group P, likely arose from a dif-
ferent strain of SIV harbored by gorillas.3 In distinct
contrast to Group M, which is responsible for the
vast majority of AIDS infections worldwide, fewer
than 20 instances of Group N infections have been
identified to date, all in Cameroon.4 Despite its
apparent rarity at present, HIV-1 Group N is trans-
missible among humans and is capable of causing
AIDS.5
All HIV-1 variants contain a similar organiza-
tion of the Gag and Gag-Pol polyproteins and code
for one subunit of an aspartyl protease.6,7 The
active protease consists of two identical 99-amino
acid subunits, each of which contributes one of the
two active-site Asp25 residues necessary for cataly-
sis.7,8 The protease plays an essential role in the
viral life cycle by cleaving the Gag and Gag-Pol
polyproteins at multiple sites to release the mature
structural and functional proteins, including itself,
required for viral assembly.7,8 Thus, the protease is
released in its active mature form from the Pol do-
main of the Gag-Pol polyprotein by an autocatalytic
process8 involving cleavages at its termini (Fig. 1).
Cleavage at the N-terminus of the protease, which
precedes the C-terminal cleavage, is concomitant
with a dramatic lowering of the monomer–dimer
equilibrium constant (Kd < 10 nM) giving rise to
the fully active dimeric protease with a stable terti-
ary fold.8,10,11
The mature protease of the most prevalent HIV-
1 Group M (PR1M) has been exhaustively studied for
almost 2 decades and is a major target for structure-
based design of clinical protease inhibitors (PIs).12
However, retaining an effective treatment of
patients with PIs has been hampered by the inher-
ent genetic variability of the virus, leading to the
selection of variants that propagate in the presence
of the drugs. This drug resistance has been a major
hurdle even for the regimen involving highly active
antiretroviral therapy (HAART).12,13 PIs in current
use are designed with very tight binding (low nM–
pM) to the preformed active site of the mature
protease.14 However, to our knowledge, it is not thor-
oughly understood to what extent these PIs may
also interfere with steps preceding release of the
mature protease. Alternative methods of targeting
the protease, such as by perturbing the transient
folding and dimerization of the precursor that per-
mits the crucial intramolecular cleavage at the N-
terminus of the protease, may be advantageous for
prolonged treatments of HIV infection.11,15
We envision that studies of the mature protease
with polymorphisms arising by natural selection as
observed in distinct HIV-1 groups will complement
the existing efforts to examine proteases bearing
multiple mutations selected during drug pressure in
long-term AIDS therapy. At the same time, under-
standing the precursors and mature proteases of
these yet unexplored groups of HIV may have cer-
tain advantages for studies targeting protease
dimerization. We have undertaken one such study
using the mature protease derived from HIV-1
Group N (PR1N) as well as its precursor consisting
of the protease fused to the full-length N-terminal
transframe region (TFR).
Sequence alignments of the TFR and PR1
regions of the Gag-Pol of Groups M (GenBank acces-
sion number K0345516) and N (GenBank accession
number AY5326351) are shown in Figure 1. The
Group N TFR is five amino acids longer than its
Group M counterpart and there is little identity
between the M and N sequences. In contrast, in the
protease domains of Groups M and N, the N-termi-
nal dimer interface, the active site and flap regions,
and the C-terminal residues 70–99 comprising loop
and helix motifs as well as the C-terminal dimer
interface are highly conserved.17 Sequence variabili-
ty is restricted to regions comprising residues 10–20,
36–39, and 61–69 accounting for a total of 20 substi-
tutions (Fig. 1) in PR1N.
We have expressed and purified the mature
protease (PR1N) and its precursor TFR-PR1N and
characterized PR1N by enzyme kinetics, thermal
and chemical denaturation profiles, and interaction
with several PIs. PR1N provided insights into the
potential role of amino acid polymorphisms in drug
resistance from analysis of its atomic resolution
crystal structure in complex with the potent PI,
darunavir (DRV), and comparison with the corre-
sponding PR1M/DRV complex. In addition, the auto-
catalytic maturation of PR1N, its inhibition, and
the molecular status of the precursor as monomers
or dimers were investigated. Desirable properties of
PR1N that may aid in developing systems to evalu-
ate inhibition of dimerization of the protease pre-
cursor and the mature protease have been
highlighted.
Results and Discussion
Expression and purification of mature PR1Nand its precursor
PR1N was expressed as a fusion protein, flanked at
its N-terminus by its full-length TFR (Fig. 1). How-
ever, upon expression in E. coli, a large fraction of
the TFR-PR1N precursor undergoes autocatalytic
cleavage at the N-terminus of PR1N (TFR/PR1N site)
to release the mature PR1N that accumulates in the
2056 PROTEINSCIENCE.ORG Characterization of Group N HIV-1 Protease

insoluble fraction (Fig. 2). Thus, accumulation of
PR1N and a very small fraction of TFR-PR1N in the
insoluble fraction permitted isolation of these two
proteins using a combination of three steps, that is,
isolation of inclusion bodies followed by fractionation
of the protein by size-exclusion chromatography and
reverse-phase HPLC. The purity of the proteins is
greater than 95% with a yield of �10 mg of mature
PR1N (Fig. 2, lane P) from a 1-L culture. Because of
the miniscule amount of precursor (Fig. 2, lane 3)
Figure 1. A: Structural organization of Gag-Pol polyprotein in HIV-1. Arrows indicate the specific sites of cleavage by the
viral protease. The protease is flanked at its N- and C-termini by the transframe region (TFR) and the reverse transcriptase,
respectively. Nomenclature of HIV-1 proteins is according to Leis et al.9; MA, matrix; CA, capsid; PR, protease; NC,
nucleocapsid; RT, reverse transcriptase; RN, Rnase H; IN, integrase. For clarity, we denote mature proteases
corresponding to Groups M and N as PR1M and PR1N. FS denotes the location of the frameshift site required for
producing Gag-Pol.6 B: Sequence alignment of TFR-PR1 domains derived from the Gag-Pol polyprotein of Groups M and
N of HIV-1. The numbering system is relative to the N-terminus of TFR and the mature protease. The complete sequence
for Group M is shown for reference, with dashes representing residues absent in TFR of Group M but present in the longer
TFR of Group N. Dots (and colons at cleavage sites) indicate amino acids that are identical in the Group M and N
sequences. Residues shown in red are major cleavage sites for TFR-PR1 autoprocessing (within TFR), and for the
autoproteolysis of the mature PR (within PR), observed upon its release from the precursor. C: Sites of polymorphic
substitutions mapped on the PR1N dimer described in this study. PR1N is shown as a green cartoon representation bound
to inhibitor DRV, shown in blue sticks. The polymorphic substitutions are colored as red spheres on both the monomers
and residue positions are labeled in white. Black arrows indicate the locations of the autoproteolytic sites shown in B. An
interactive view is available in the electronic version of this article.
Sayer et al. PROTEIN SCIENCE VOL 19:2055—2072 2057

trapped in the insoluble fraction, it is possible to
purify only low microgram quantities of TFR-PR1N,
sufficient to assess qualitatively the autoprocessing
reaction in vitro.
A single Cys95Ala mutation was introduced in
PR1N to prevent cysteine-thiol oxidation leading to
possible protein aggregation during in vitro studies.
The purified proteins were verified by mass spec-
trometry to match the sequence reported under the
GenBank accession number AY532635 with masses
of 17,910 (calculated 17,910, includes N-terminal
Met and C95A) and 10,869 (calculated 10,869,
includes C95A) for the precursor TFR-PR1N and the
mature protease PR1N, respectively. PR1N can be
maintained stably in 12 mM HCl, presumably as an
unfolded protein, for prolonged periods at 4�C. Full
enzymatic activity is observed when one part of pro-
tein in HCl is diluted in 5.6 parts of buffer between
pH values of 4 and 6.5, or as described previously
for PR1M (quench protocol of protein folding18). How-
ever, on storage at optimal conditions for activity
between pH 4 and 6.5, PR1N exhibits autoproteoly-
sis, consistent with cleavage sites that map between
L5/W6, L23/L24, Q37/L38, T63/I64 and F89/L90
[Fig. 1(B), sites indicated in red] as determined by
electrospray ionization-mass spectrometry (ESI-MS).
Masses of 2122, 2935, and 2735 were easily observed
corresponding to fragments 6–23, 38–63, and 64–89,
respectively. The locations of sites 1, 3, and 4 [Fig.
1(B)] in PR1N are relatively conserved among PR1M
and PR1N.19 Site 3 is slightly shifted toward the sole
major site reported for HIV-2 protease (PR2) at G35/
I36 and HTLV-1 at L40/P41.19,20 This shift could be
due to the polymorphic mutation L33I in PR1N,
which was shown to retard this cleavage in PR1M,21
and substitutions in positions 36, 37, and 39 that
promote cleavage between Q37/L38. The two sites [2
and 5, Fig. 1(B)] in PR1N that map between L23/L24
and F89/L90 were also identified as cleavage sites in
PR2.19 It is possible that these five sites [Fig. 1(C),
black arrows] are accessible for cleavage in the
monomeric PR1N rather than the dimer. The higher
Kd (see below) observed for PR1N may facilitate an
enhanced rate of autproteolysis when compared with
PR1M, which has a Kd < 10 nM.11
The ability to fractionate PR1N by size-exclusion
chromatography under native conditions clearly dis-
tinguishes it from PR1M and its many variants and
mutants (including drug-resistant mutants) that we
have studied so far, which interact nonspecifically
with most column matrices. In spite of similar iso-
electric points exhibited by both proteases, PR1N is
a unique example of a PR1 variant which can be
readily analyzed by size-exclusion chromatography
under native conditions, similar to PR2.19 This fea-
ture of PR1N is an important advantage because it
permits the use of physical techniques that are in-
compatible with PR1M. In the future, redesigning
PR1M with substitutions of residues from PR1N in
certain positions to enhance its solubility and chro-
matographic characteristics may be possible.
Dimer dissociation and kinetics
Preliminary experiments (not shown) indicated that
PR1N efficiently catalyzes the hydrolysis of substrate
IV over a relatively broad range between pH 4 and
6. Michaelis–Menten kinetics [Fig. 3(A)] for hydroly-
sis of substrate IV catalyzed by 0.36 lM PR1N at pH
5, in the presence of 250 mM NaCl, gave Km ¼ 25 6
3 lM, kcat ¼ 2.83 6 0.06 s�1, and kcat/Km ¼ 113
mM�1 s�1. Under these conditions, > 70% of the
enzyme is estimated to be dimeric in the presence of
a saturating substrate concentration [see below and
Fig. 3(B)]. The values of Km and kcat are comparable
to those of 48 lM and 2.9 s�1 previously observed
with PR1M under the same conditions.22
In contrast to the very low dimer dissociation
constant, Kd, for PR1M, the Kd can be conveniently
measured for PR1N [Fig. 3(B)]. Under the above ki-
netic conditions, the dependence on enzyme concen-
tration of the observed rate for hydrolysis of a satu-
rating (430 lM) concentration of substrate IV gave a
Kd of 0.15 6 0.06 lM that is at least 10-fold larger
than that observed for PR1M (< 10 nM).11 Consistent
Figure 2. Expression and purification of TFR-PR1N and
PR1N. Left: SDS-PAGE to monitor the expression and
autoprocessing of TFR-PR1N construct in E. coli. Lanes 1
and 2 represent the total lysates derived from uninduced
and induced cells, respectively. Lane 3, insoluble pellet
derived from washing the initial insoluble fraction (post cell
lysis) with 1M urea and 0.5% Triton X-100. The presence of
a major band of PR1N and a faint band of TFR- PR1N in
lane 3 indicates that (1) majority of the precursor undergoes
autoprocessing upon its expression to release the mature
PR1N and (2) both TFR-PR1N and PR1N accumulate in the
insoluble fraction and are retained in this fraction even after
washing with 1M urea. Right: SDS-PAGE of purified PR1N.
Lanes denoted by P represent purified PR1N, used for
the various physicochemical and structural analyses
described in this article, and M, the molecular weight
standards in kDa.
2058 PROTEINSCIENCE.ORG Characterization of Group N HIV-1 Protease

with the higher value of Kd, denaturation of PR1N at
pH 5 occurs at a lower urea concentration than for
PR1M [Fig. 3(C)], with a midpoint at �1.25M urea in
the presence of 250 mM NaCl (which is expected to
increase the stability of the dimer fold23) when com-
pared with �1.8M for PR1M10 and 1.8–1.9M for PR2
and its E37K mutant19 in the absence of added salt.
Urea does not affect the binding of substrate to
PR1N as shown by a Km of 25.4 lM at 1.25M urea
(data not shown). Thus, the loss in catalytic activity
with increasing urea concentrations is truly a reflec-
tion of the unfolding process rather than an appa-
rent effect of the decreased binding of the substrate
as seen for PR2.19
Calorimetric analysis of inhibitor bindingThe increase in thermal denaturation temperature
(DTm) as measured by differential scanning calorime-
try (DSC) on binding of inhibitors to PR1 provides a
convenient qualitative assessment of the relative
strength of inhibitor binding.24,25 Unliganded PR1N
gave a Tm of 64.3�C at pH 4.6 in 4–5 mM acetate
buffer [Fig. 4(A)], which is slightly lower than that of
65.7�C observed for PR1M under similar conditions.24
In the presence of a twofold molar excess of DRV, the
Tm increases to 89.3�C. The DTm of 25�C for PR1N in
the presence of DRV is comparable to that of 22.4�C
for PR1M24 and is consistent with tight binding of
DRV to PR1N. Isothermal titration calorimetry (ITC,
see below) confirmed this result, although only an
upper limit for the inhibitor dissociation constant
could be determined. Similarly, PR1N exhibited large
DTm values of 20.7, 20.6, and 16.8�C, respectively, on
binding to the clinical inhibitors atazanavir (ATV),
saquinavir (SQV), and the symmetrical inhibitor
DMP32326 [Fig. 4(B)]. These DTm values are very
similar to DTms of 20.8, 19.3, and 15.3�C observed
for PR1M with the same inhibitors.25 Thus, both
these mature proteases bind inhibitors with compa-
rable, high affinities, and consequently PR1N cannot
be classified as a drug-resistant variant despite the
many residues in common with minor drug-resist-
ance mutations (DRMs) of PR1M.
The binding constant for DRV was too large for
ITC measurement by displacement titration27 of the
weakly binding inhibitor acetyl pepstatin; a lower
limit for the binding constant was estimated to be
�8 � 109M�1 [Fig. 4(B,C)]. This corresponds to a
ligand dissociation constant (KL) � 120 pM; thus, for
PR1N this dissociation constant may be within an
order of magnitude or less of the 5–10 pM14,28
reported for the PR1M/DRV complex. The inability to
obtain sufficient data for accurate estimation of KL
for DRV by displacement titration results in part
from the lower affinity of PR1N for acetyl pepstatin
under the present conditions at pH 7 (KL ¼ 1.8 lM),
relative to PR1M (KL ¼ 0.25 lM at pH 527), such
that at 100–500 lM concentrations it does not
adequately compete with the strongly binding DRV.
PR1N sequence analysisThe polymorphic sites of PR1N are mapped onto
the structure of the protease dimer shown in Fig-
ure 1, and positions of major and minor DRMs and
natural variations observed in PR1M are indicated
(Fig. 5). The polymorphisms do not alter residues
in the active-site cavity or flexible flaps. Most of
them are located at distal regions, except for M36I,
S37Q, P39E, and R41K at the hinge of the flaps,
whereas H69R is the only substitution at the inter-
subunit interface. None of the polymorphic substi-
tutions in PR1N are selected as major DRMs as
Figure 3. Measurement of kinetic parameters, dimer
dissociation, and urea-induced denaturation for mature
PR1N in 50 mM sodium acetate buffer, pH 5, containing
250 mM NaCl. A: Michaelis–Menten and Lineweaver–Burk
(inset) plots for hydrolysis of substrate IV by 0.36 lM PR1N.
Values are Km ¼ 25 6 3 lM and kcat ¼ 2.83 6 0.06 s�1. B:
Kinetic determination of the dimer dissociation constant,
Kd, of PR1N from the dependence of the rate for hydrolysis
of substrate IV on enzyme concentration. The Kd of 0.15 6
0.06 lM is indicated by the dashed line at 50% of the
maximal activity. C: A plot of the protease activity as a
function of increasing concentration of urea indicates a
transition midpoint of �1.25M.
Sayer et al. PROTEIN SCIENCE VOL 19:2055—2072 2059

defined by the Stanford University HIV Drug Re-
sistance Database (http://hivdb.stanford.edu/) and
the International AIDS Society-US panel for antire-
troviral resistance.13
All of the substitutions in PR1N occur in the
regions where natural variations occur among the pro-
teases (Fig. 5).11 However, these polymorphisms
include changes at sites of minor resistance mutations,
Figure 4. Calorimetric characterization of interaction of PR1N with inhibitors. A: DSC thermograms of mature PR1N in the
absence of inhibitor and in the presence of approximately twofold molar excess of DRV. The weak thermal transition (small
apparent DH) in the absence of inhibitor was explained by autoproteolysis during the course of the DSC experiment. B: DSC
thermograms of mature PR1N in the presence of approximately twofold molar excess of the clinical inhibitors ATV (solid line)
and SQV (dashed line) and the symmetrical inhibitor DMP323 (dotted line). Tm values (�C) are in parentheses. C: Isothermal
titration calorimetry of PR1N (4.4 lM) in 25 mM Tris buffer, pH 7.0, containing 50 mM NaCl, at 28�C with 40 lM acetyl
pepstatin. The KA determined for acetyl pepstatin is (5.6 6 1.8) � 105M�1. D: Displacement titration of the PR1N-acetyl
pepstatin complex with 40 lM DRV in the presence of 150 lM acetyl pepstatin gives an apparent binding constant � 1.0 �108M�1 for DRV, from which the KA for DRV in the absence of acetyl pepstatin is estimated to be � 8 � 109M�1 (see text).
Figure 5. The wild-type PR1M sequence is aligned with PR1N. Only the amino acid differences relative to PR1M are indicated
in PR1N. The red and gray lines on top indicate Stanford database DRM hot spots (major DRMs shown in red letters) and
areas of greatest variability among the sequences, respectively. Note there is very little overlap between the natural variability
and major DRM sites. Natural variations are suggested to coselect with major DRMs upon drug pressure to offset the
detrimental effect of major DRMs alone.12,13 V lists all the natural variants and DRMs selected under drug pressure in PR1M
(extracted from Ref. 11) for the 20 positions which vary in PR1N. Natural variations in PR1M are listed alphabetically, selected
DRMs are indicated in cyan, and residues common to both are underlined.
2060 PROTEINSCIENCE.ORG Characterization of Group N HIV-1 Protease

which likely arise as a result of natural selection to-
gether with the major DRMs rather than direct selec-
tion by drug pressure.12,13 These minor DRMs persist
in the drug-resistant strains because they provide a
survival advantage by compensating for the reduced
fitness of the enzyme (catalytic competence to undergo
autoprocessing and process the polyproteins essential
for proper virus assembly) arising from the selection of
major DRMs. L10V appears as a minor mutation in
PR1M for the drug ATV. K20R is observed as a minor
mutation in PR1M for ritonavir-boosted ATV, indina-
vir, lopinavir, and tipranavir. Similarly, the M36I
mutation is observed in isolates from patients treated
with ATV, indinavir, nelfinavir, and tipranavir. The
K20R mutation in protease occurs rarely in the ab-
sence of the M36I mutation, whereas M36I is found in
the absence of K20R; this implies that the M36I muta-
tion generally precedes K20R,29 and the two substitu-
tions may act synergistically during the selection of
major DRMs. Also, the I62V mutation is implicated in
resistance to ATVand SQV. Mutations at 13 and 69 are
suggested to be associated with resistance to tip-
ranavir, whereas mutations at residues 63 and 89
are observed when using lopinavir and DRV,
respectively.12,13
Overall structural comparison of DRV-bound
PR1N and PR1MPR1N was crystallized in complex with the PI DRV
in the orthorhombic space group P212121 with one
protease dimer in the asymmetric unit. The crystal-
lographic data and refinement statistics are sum-
marized in Table I. The atomic resolution (1.09 A)
structure showed excellent electron density for all
the protease residues, which enabled unambiguous
modeling of all the polymorphic substitutions in
PR1N. A representative electron density map for
L890F in monomer B is shown in Figure 6(A). The
mean B-factor for the main-chain atoms of the pro-
tein is 12.1 A2. The average B-factors for the bound
DRV inhibitor and the solvent molecules are 10.5
and 27.7 A2, respectively. In total, 35 alternate con-
formations were modeled for residues in the crystal
structure with monomer A containing 21 alternate
conformations in comparison to 14 in monomer B.
The main-chain atoms of Ile50, Gly51, Ile500, and
Gly 510 in the two subunits exhibited two alternate
conformations with relative occupancies of 0.6 and
0.4. The carbonyl groups of Ile50 and Ile500 can flip
180� and retain a hydrogen bond with the amide
groups of Gly510 and Gly51 linking the tips of the
two flaps.
PR1N and PR1M share essentially the same
overall structure, although the crystal structures
were determined in different unit cells. The catalytic
dimer of the PR1N/DRV complex can be superim-
posed with that of PR1M/DRV (2IEN) with RMSD of
0.86 A for 198 topologically equivalent Ca atoms.
This RMSD is larger than the average value of 0.56
A reported for 73 PR1M dimers complexed with dif-
ferent inhibitors in a variety of lattices,30 and the
RMSD of < 0.6 A observed in comparisons of PR1M
from subtypes B, C, and F,31,32 consistent with a sig-
nificant effect arising from the 20 amino acid substi-
tutions in PR1N. Within the dimer, monomer A of
PR1N/DRV is more similar to the monomer A of
PR1M/DRV with RMSD of 0.67 A, whereas the B
monomers show a larger RMSD of 0.84 A for 99
equivalent Ca atoms. The largest deviations of more
than 2.5 A occur in the 10s and 60s loops [Fig.
6(B,C)], whereas another large deviation of more
than 1.5 A is seen for the flap hinge region (residues
36–41). Interestingly, the 10s loop is sandwiched
between the 60s loop and the flap hinge permitting
correlated structural perturbations due to the poly-
morphic substitutions that are all located in these
neighboring loops. These deviations in the loops,
flap hinge, and the flap itself are more pronounced
in monomer B than in monomer A [Fig. 6(C)]. We
cannot, however, rule out the possibility that these
deviations may result from crystal packing effects.
The effect of M36I and K20R substitutionsChanges in the 10s loop and the flap hinge propa-
gate to shift the flap in monomer B away from the
inhibitor. Polymorphisms in residue 36 in the hinge
region of the flaps are associated with minor drug
resistance, and M36I is the most frequently observed
Table I. Crystallographic Data Collection andRefinement Statistics
PR1N
Space group P212121
a (A) 45.94b (A) 53.37c (A) 66.09Resolution range 50–1.09Total observations 233,527Unique reflections 64,819Completeness 93.0 (57.6)a
<I/r(I)> 14.1 (2.2)Rsym (%)b 9.6 (33.6)Refinement resolution range 10–1.09R (%)c 16.48Rfree (%)d 21.68Number of solvent 146.3Mean B-factor (A2)Main chain 12.2Side chain 19.2Inhibitor 10.5Solvent 27.3RMS deviations from ideality
Bond length (A) 0.013Angle distance (A) 0.035
a Values in parentheses are given for the highest resolutionshell (1.11–1.09).b Rsym ¼ Rhkl|Ihkl � hIhkli|/RhklIhkl.c R ¼ R||Fobs| � |Fcal||/R|Fobs|.d Rfree ¼ Rtest||Fobs| � |Fcal||/Rtest|Fobs|.
Sayer et al. PROTEIN SCIENCE VOL 19:2055—2072 2061

substitution in PR1M non subtype B.33,34 Molecular
dynamics studies indicate that mutation at residue
36 can alter the volume of the inhibitor-binding
cavity.35 Substitution of the shorter Ile36 in the
PR1N/DRV structure causes part of the hinge loop to
buckle inward to maintain all the interactions
Figure 6. A: 2Fo � Fc electron density map contoured at 1.5r for L890F polymorphic substitution in monomer B of PR1N/DRV
complex. The shortened CH. . .O interaction with Thr310 is indicated by the broken line. B: Superposition of PR1N dimer in red
against PR1M dimer in blue. The core of the PR1N structure including the active site shows excellent agreement with the
PR1M structure. The two structures deviate in the 10s loop, 60s loop, and the flap hinge regions where the majority of
polymorphic substitutions map. The flap of monomer A agrees well with that of PR1M structure, but the flap of monomer B
deviates by �1 A. C: The RMS deviations (A) per residue when compared with those of PR1M are plotted for the Ca atoms of
PR1N. The two monomers are numbered 1–99 and 101–199. The deviations corresponding to 10s, 60s, and hinge loops for
both the monomers and the flap of monomer B are indicated. An interactive view is available in the electronic version of the
article.
2062 PROTEINSCIENCE.ORG Characterization of Group N HIV-1 Protease

formed by Met36 in the PR1M/DRV complex [Fig.
7(A,B)]. This buckled loop is anchored by the K20R
substitution in PR1N, which forms two hydrogen-
bond interactions with the main-chain carbonyls of
Glu34 and Glu35 and new van der Waals interac-
tions with Ile36. The side chains of Arg20 and Glu35
exhibit alternate conformations in monomer A [Fig.
7(A)]. In monomer B, these residues show a single
conformation, and the side chain of Gln370 is flipped
out in comparison with its conformation in monomer
A, whereas Glu180 forms an ion pair with Arg200, a
water-mediated hydrogen bond with the main-chain
amide of Gln370 [Fig. 7(B)], and van der Waals inter-
actions with Ile360 and the main-chain carbonyl of
Gln370. The hinge shows similar shifts when M36I is
present in the crystal structures of PR1M subtypes F
and B with different inhibitors, suggesting that the
changes are independent of the type of inhibitor or
space group.31,36 In the case of monomer A, the
hinge shift tapers off at residue Lys41 leaving the
flap in an equivalent position in PR1N/DRV and
PR1M/DRV. However, in monomer B, the shift propa-
gates through the entire flap excluding the residues
490–520 at the tip, such that the flap residues are
Figure 7. Atomic descriptions of regions in the PR1N/DRV complex showing significant changes from the PR1M/DRV
complex. The PR1N residues are colored by element type, whereas PR1M residues are colored green. The hydrogen bond
and ion pair interactions are shown as broken lines. The PR1N residue positions are labeled in black, and the polymorphic
differences in PR1M are labeled in green. A: Key deviations at the site of M36I substitution in the monomer A of PR1N/DRV
complex. The M36I substitution causes part of the hinge loop to buckle inward, which is anchored by another polymorphic
substitution K20R. Flexibility of monomer A is indicated by the alternate conformations of Arg20 and Glu35. B: The effect of
M36I substitution in monomer B of PR1N/DRV. All the residues show single conformations, and the hinge loop is more tightly
held in place by polymorphic substitution Glu180, which forms an ion pair with Arg200 and water-mediated hydrogen bond
with the main-chain amide of Gln370. Glu180 also forms a total of six van der Waals interactions with Ile360 and the main-chain
carbonyl of Gln370. C: The buckling of the hinge loop shifts Ile15 resulting in downward movement of the 10s loop. The
carbonyl of Gly16 at the tip of the loop is flipped by 180�. D: Superposition of PR1N/DRV and PR1M/DRV structures at the
site of L890F substitution in monomer B. The L890F substitution results in a shortened CH. . .O interaction with Thr310 that
induces a shift of �0.5 A in the position of inhibitor-interacting residues Asp290, Asp300, and Val320. E: Superposition of the
60s loops of PR1N/DRV and PR1M/DRV structures in monomer B. L890F substitution in PR1N makes van der Waals
interactions with Ile640. The residues C-terminal to Ile 640 in the 60s loop exhibit large deviations when compared with those
of the PR1M/DRV structure. The other end of the loop is fixed by the extensive new interactions between Phe890 and the
main-chain atoms of Val720 and Gly730 and the carbonyl of Thr740. The side chains of residues 650–700 are omitted for clarity.
The van der Waals interactions are indicated by an arc. F: In addition to L890F, the H690R substitution is also responsible for
the large deviations seen in the 60s loop. The H690R is the only substitution with intersubunit interactions in PR1N and sits
close to the tip of the loop. H690R in monomer B forms ionic and van der Waals interactions with the C-terminal residue
Phe99 in monomer A of PR1N/DRV complex.
Sayer et al. PROTEIN SCIENCE VOL 19:2055—2072 2063

shifted more than 1 A away from the bound inhibi-
tor; however, only minor changes in the affinity for
substrate and inhibitor were observed for PR1N rela-
tive to PR1M.
Changes in the 10s and 30s loops are intercon-
nected and result in deviations of residues 15–20 in
comparison with PR1M. The buckled M36I in the
hinge of the flaps pushes down Ile15 and the rest of
the 10s loop of both the monomers in PR1N/DRV,
and thus Ile15 exhibits two alternate conformations
in monomer A of PR1N/DRV, while the carbonyl of
Gly16 at the tip of the loop is flipped by 180� [Fig.
7(C)]. The amide nitrogen of the G17K polymorphic
residue in PR1N forms a water-mediated hydrogen
bond with the carbonyl of the S37Q substitution in
the flap hinge. The Lys17 side chain forms a hydro-
gen bond with the carbonyl of Gln37 in PR1N. In
monomer B, the interaction of Glu180 with Arg200
and Ile360 described in the previous paragraph pre-
vents the contact between Gln370 and the 10s loop.
Significance of L89F and H69R substitutions
Substitutions in the 60s loop and L89F propagate to
perturb residues 29–32 that interact with inhibitor.
Accessory mutations at the internal residue Leu89
are associated with DRV treatment. In the analysis
of the crystal structure of HIV-1 protease subtype F,
it was proposed that the substitution L89M of the
longer methionine side chain pushes the Leu90 side
chain toward the catalytic Asp25 as observed in the
PR1M structure with major DRM L90M.31,37–39 How-
ever, in the PR1N/DRV structure, the Leu90 side
chain adjacent to L89F is in an identical conforma-
tion to that seen in PR1M/DRV. Instead, the bulkier
Phe89 side chain results in a shortened CH. . .O
interaction with the side-chain hydroxyl of Thr31,
which lies between residues Asp30 and Val32 in the
inhibitor-binding cavity [shown for monomer B in
Fig. 7(D)]. The substitution of L89F shifts the main-
chain atoms of residues 29–32 by �0.4–0.5 A,
thereby perturbing the inhibitor-binding site.
Additionally, the Phe89 side chain in PR1N
makes extensive new interactions with residues 62,
64, and 71–74 resulting in dramatic shifts of the 60s
loop by �0.7 and �1.3 A at Ile64 in monomers A
and B, respectively [Fig. 7(E)]. Phe89 forms 17 van
der Waals interactions with the two conformations of
Ile64 in monomer A of PR1N/DRV compared with
only one in the PR1M/DRV structure, and Phe890
has seven van der Waals interactions with the single
conformation of Ile640 in monomer B. Also, Phe890
forms new CH. . .O interactions with the main-chain
carbonyl of Val620 [Fig. 7(E)]. The other end of the
60s loop is fixed by multiple interactions of Phe890
with the main-chain atoms of Val720 and Gly730 as
well as new CH. . .O interactions with the carbonyl
of Ala710 and Thr740. Six of the polymorphic substi-
tutions are present in this loop (residues 62–72).
H69R, which lies at the tip of the 60s loop, is the
only substitution forming intersubunit interactions
in the PR1N dimer. In the PR1M/DRV complex,
His69 forms an ionic interaction with the C-terminal
carboxylate and five van der Waals interactions with
the side chain of the C-terminal residue Phe990. In
the PR1N/DRV complex, Arg69 forms ionic interac-
tions and eight van der Waals interactions with the
C-terminal Phe99 of the other subunit [Fig. 7(F)].
Rearrangements at the tip of the 60s loop in PR1N/
DRV allow the long Arg69 side chain to form a
hydrogen bond with the main-chain carbonyl of
Gln67.
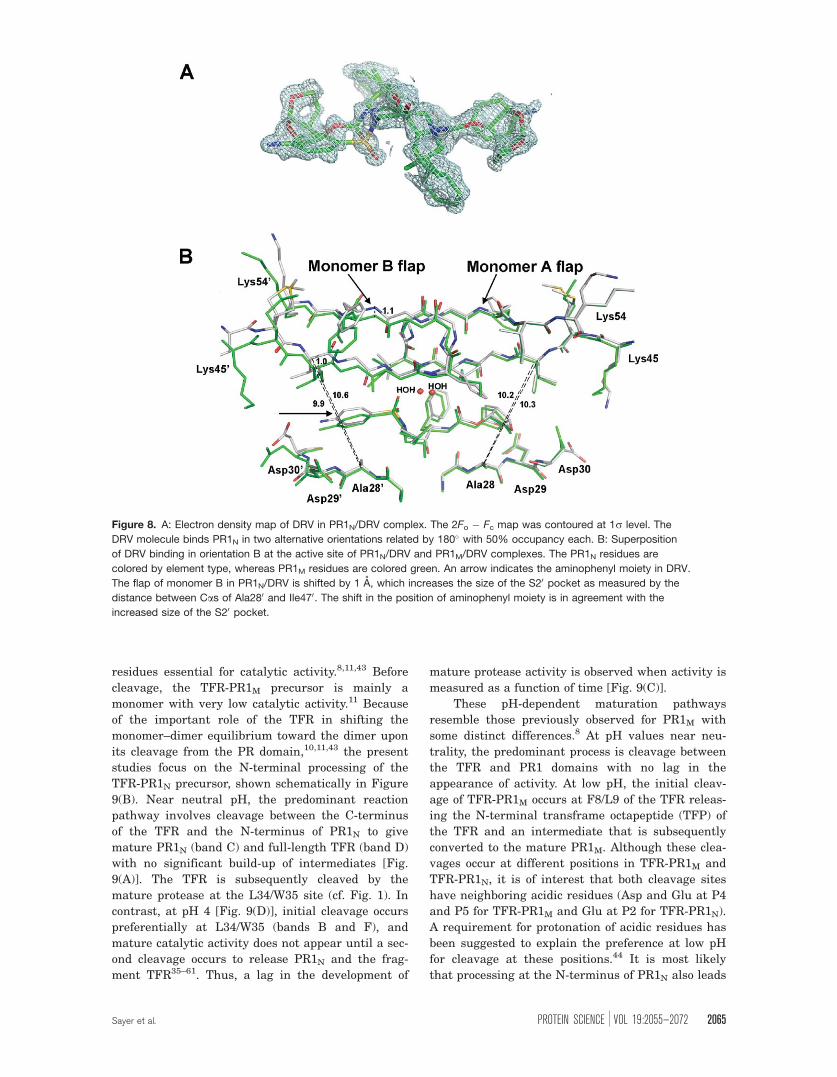
PR1N interactions with DRV
The DRV molecule binds PR1N in two alternative
conformations related by 180� with 50% occupancy
each [Fig. 8(A)]. The conformation in which the bis-
THF group of DRV interacts with Asp290 and Asp300
is designated as orientation A, and the other is
defined as orientation B for the sake of description.
The conserved water molecule that normally
anchors the inhibitor and the two flaps is well
resolved into two positions separated by �1 A with
each position interacting with one inhibitor orienta-
tion. Several residues contributing to the inhibitor-
binding site exhibit alternate conformations as
reported for the PR1M/DRV complex.40 DRV was
designed to form hydrogen bonds with the conserved
region of PR1M to overcome drug resistance.40,41 All
the protease-inhibitor hydrogen-bond interactions
observed in the PR1M/DRV structure are conserved
in orientation A of the PR1N/DRV complex. How-
ever, in orientation B, the P20 aminophenyl moiety
of DRV is rotated as well as shifted from the corre-
sponding position in the PR1M/DRV complex [Fig.
8(B)], which weakens its hydrogen bonds with the
main-chain amide and carbonyl oxygen group of
Asp30, although the interaction with the side chain
of Asp30 is maintained. A similar rotation of the
aminophenyl moiety that weakens DRV binding to
the main chain of Asp30 has been reported for
PR1M structures with single mutations of I50V,
I54M, and V82A.38,40,42 The size of the S20 binding
pocket of orientation B in the PR1N/DRV structure
is increased over that in PR1M/DRV as shown by an
�0.7 A increase in the distance between Cas of
Ala280 and Ile470 [Fig. 8(B)] because of the shift of
the monomer B flap, whereas no significant differ-
ence is seen in monomer A.
In vitro precursor processing
Extensive studies of the maturation of PR1M using
various precursor analogs8,11 have shown that the
mature protease is cleaved from the Gag-Pol poly-
protein by an ordered, stepwise, autocatalytic pro-
cess likely requiring the initial, transient formation
of a dimeric intermediate containing the two Asp
2064 PROTEINSCIENCE.ORG Characterization of Group N HIV-1 Protease
residues essential for catalytic activity.8,11,43 Before
cleavage, the TFR-PR1M precursor is mainly a
monomer with very low catalytic activity.11 Because
of the important role of the TFR in shifting the
monomer–dimer equilibrium toward the dimer upon
its cleavage from the PR domain,10,11,43 the present
studies focus on the N-terminal processing of the
TFR-PR1N precursor, shown schematically in Figure
9(B). Near neutral pH, the predominant reaction
pathway involves cleavage between the C-terminus
of the TFR and the N-terminus of PR1N to give
mature PR1N (band C) and full-length TFR (band D)
with no significant build-up of intermediates [Fig.
9(A)]. The TFR is subsequently cleaved by the
mature protease at the L34/W35 site (cf. Fig. 1). In
contrast, at pH 4 [Fig. 9(D)], initial cleavage occurs
preferentially at L34/W35 (bands B and F), and
mature catalytic activity does not appear until a sec-
ond cleavage occurs to release PR1N and the frag-
ment TFR35–61. Thus, a lag in the development of
mature protease activity is observed when activity is
measured as a function of time [Fig. 9(C)].
These pH-dependent maturation pathways
resemble those previously observed for PR1M with
some distinct differences.8 At pH values near neu-
trality, the predominant process is cleavage between
the TFR and PR1 domains with no lag in the
appearance of activity. At low pH, the initial cleav-
age of TFR-PR1M occurs at F8/L9 of the TFR releas-
ing the N-terminal transframe octapeptide (TFP) of
the TFR and an intermediate that is subsequently
converted to the mature PR1M. Although these clea-
vages occur at different positions in TFR-PR1M and
TFR-PR1N, it is of interest that both cleavage sites
have neighboring acidic residues (Asp and Glu at P4
and P5 for TFR-PR1M and Glu at P2 for TFR-PR1N).
A requirement for protonation of acidic residues has
been suggested to explain the preference at low pH
for cleavage at these positions.44 It is most likely
that processing at the N-terminus of PR1N also leads
Figure 8. A: Electron density map of DRV in PR1N/DRV complex. The 2Fo � Fc map was contoured at 1r level. The
DRV molecule binds PR1N in two alternative orientations related by 180� with 50% occupancy each. B: Superposition
of DRV binding in orientation B at the active site of PR1N/DRV and PR1M/DRV complexes. The PR1N residues are
colored by element type, whereas PR1M residues are colored green. An arrow indicates the aminophenyl moiety in DRV.
The flap of monomer B in PR1N/DRV is shifted by 1 A, which increases the size of the S20 pocket as measured by the
distance between Cas of Ala280 and Ile470. The shift in the position of aminophenyl moiety is in agreement with the
increased size of the S20 pocket.
Sayer et al. PROTEIN SCIENCE VOL 19:2055—2072 2065

to a drastic decrease in the Kd, consistent with the
appearance of mature-like protease activity as
shown for both PR1M and PR1N autoprocessing, and
the appearance of a stable tertiary fold of the
mature dimer, as shown by NMR for PR1M
autoprocessing.10
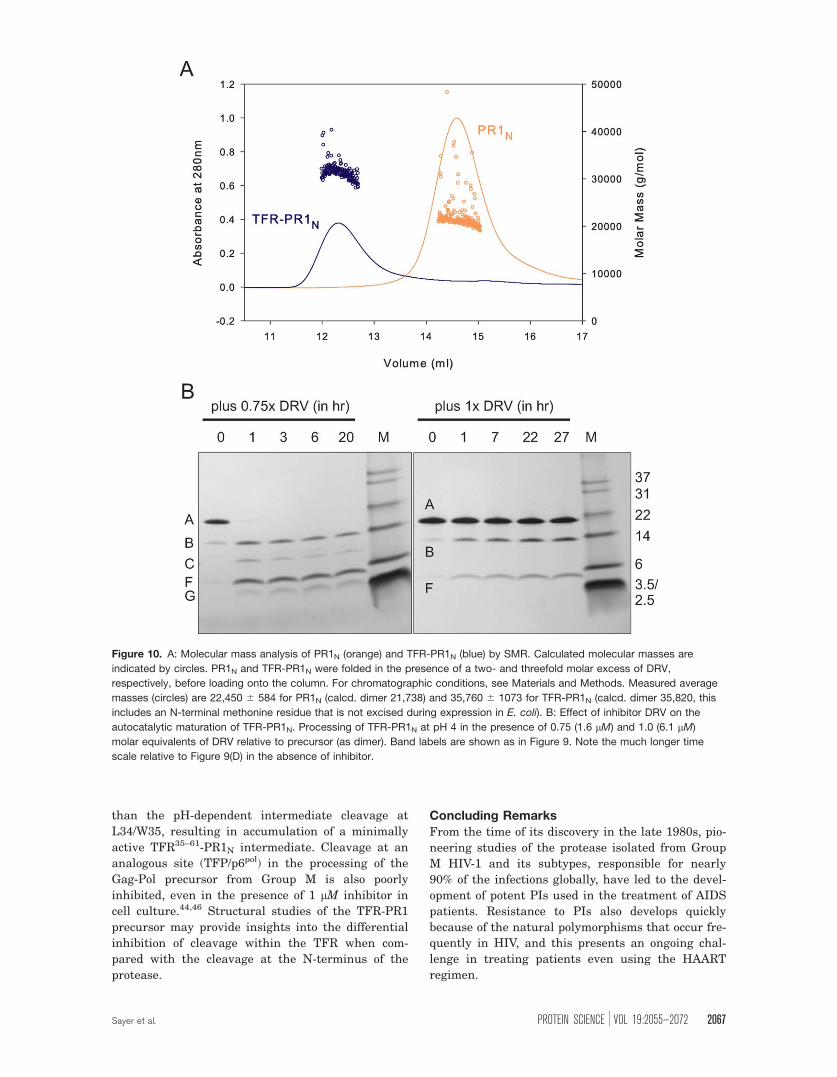
Molecular mass analysis of PR1N and itsprecursor
Unlike PR1M, both PR1N and its precursor can be an-
alyzed by size-exclusion chromatography under
native conditions. Thus, it was possible to take
advantage of this property to determine the molecu-
lar masses of these proteins by size-exclusion chro-
matography coupled with multiangle light scattering
and refractive index measurements (SMR). Although
it is not possible to conduct these measurements with
TFR-PR1N in the absence of an inhibitor because of
the intrinsic rapid autoprocessing of TFR-PR1N,
addition of excess DRV to inhibit autoprocessing dur-
ing folding enabled its mass analysis and comparison
with the mature protein [Fig. 10(A)]. A retention vol-
ume of �15 mL for PR1N on a Superdex-75 column (1
cm � 30 cm) is similar to that observed for PR2
dimer under similar conditions, whereas the larger
TFR-PR1N is less retained as expected. Both folded
proteins form dimers in the presence of the inhibitor.
This represents the first direct demonstration that a
PI shifts the equilibrium of the PR precursor from a
monomer to a dimer. This result appears inconsistent
with the suggestion based on FRET data using chi-
meric constructs that DRV may act as a dimerization
inhibitor at the precursor stage.45
Inhibition of precursor processing by DRVBecause DRV can bind to the precursor to induce
dimerization, it was of interest to assess if DRV,
which exhibits a sub-nM affinity to the active site of
mature PR1N, completely blocks the processing of
TFR-PR1N. At pH 4, processing of TFR-PR1N is
nearly complete within less than an hour in the ab-
sence of inhibitors [Fig. 9(C,D)]. In the presence of
0.75 molar equivalent of DRV, TFR-PR1N undergoes
initial cleavage between Leu34 and Trp35 of the
TFR, and the full-length precursor almost com-
pletely disappears within the first hour [Fig. 10(B),
left, bands B and F]. However, further processing to
mature PR1N is significantly slowed, although some
formation of the mature enzyme can be inferred by
the diminished intensity of the TFR35–61-PR1N band
over time as well as the appearance of a weak band
corresponding to the mature protease (band C, most
apparent at 1 h). At a 1:1 molar ratio of inhibitor to
precursor dimers, the full-length precursor is still
present even after 27 h [Fig. 10(B), right]. Cleavage
proceeds at the L34/W35 site, but no mature PR1N
is observed. Thus, cleavage at the N-terminus of the
protease domain is inhibited much more strongly
Figure 9. Pathways for the autocatalytic maturation of
TFR-PR1N at pH 4 and 6.7. For experimental details, see
text. A: Time course of the autoprocessing reaction at pH
6.7 showing a single major cleavage between the TFR1–61
(band D) and the N-terminus of the protease domain (band
C, PR1N). Subsequent cleavage of the TFR1–61 occurs
between residues 9/10 and 34–35 (band E, TFR10–61 and
band F, TFR1–34). B: Schematic representation of the sites
of sequential cleavages at pH 4 (downward arrows) and the
predominant cleavage at pH 6.7 (upward arrow). Letter
designations shown for the intermediates and products
correspond to the band labels in Figure 9(A,D). C: Time
course of appearance of mature protease activity at pH 4.0
measured by kinetic assays of samples taken at the times
indicated in minutes. The lag (arrow) is due to the formation
of intermediate B, which exhibits the same low activity as
that of the full-length TFR-PR1N. Cleavage at the N-
terminus of the protease is concomitant with the
appearance of the mature protease (band C) and mature-
like catalytic activity. D: Time course of processing at pH 4
showing initial cleavages at L34/W35 of the TFR (to give B
and F) followed by cleavage of the resultant intermediate B
to release the TFR35–61 (G) and the mature protease (C).
2066 PROTEINSCIENCE.ORG Characterization of Group N HIV-1 Protease
than the pH-dependent intermediate cleavage at
L34/W35, resulting in accumulation of a minimally
active TFR35–61-PR1N intermediate. Cleavage at an
analogous site (TFP/p6pol) in the processing of the
Gag-Pol precursor from Group M is also poorly
inhibited, even in the presence of 1 lM inhibitor in
cell culture.44,46 Structural studies of the TFR-PR1
precursor may provide insights into the differential
inhibition of cleavage within the TFR when com-
pared with the cleavage at the N-terminus of the
protease.
Concluding RemarksFrom the time of its discovery in the late 1980s, pio-
neering studies of the protease isolated from Group
M HIV-1 and its subtypes, responsible for nearly
90% of the infections globally, have led to the devel-
opment of potent PIs used in the treatment of AIDS
patients. Resistance to PIs also develops quickly
because of the natural polymorphisms that occur fre-
quently in HIV, and this presents an ongoing chal-
lenge in treating patients even using the HAART
regimen.
Figure 10. A: Molecular mass analysis of PR1N (orange) and TFR-PR1N (blue) by SMR. Calculated molecular masses are
indicated by circles. PR1N and TFR-PR1N were folded in the presence of a two- and threefold molar excess of DRV,
respectively, before loading onto the column. For chromatographic conditions, see Materials and Methods. Measured average
masses (circles) are 22,450 6 584 for PR1N (calcd. dimer 21,738) and 35,760 6 1073 for TFR-PR1N (calcd. dimer 35,820, this
includes an N-terminal methonine residue that is not excised during expression in E. coli). B: Effect of inhibitor DRV on the
autocatalytic maturation of TFR-PR1N. Processing of TFR-PR1N at pH 4 in the presence of 0.75 (1.6 lM) and 1.0 (6.1 lM)
molar equivalents of DRV relative to precursor (as dimer). Band labels are shown as in Figure 9. Note the much longer time
scale relative to Figure 9(D) in the absence of inhibitor.
Sayer et al. PROTEIN SCIENCE VOL 19:2055—2072 2067

The appearance of mature-like catalytic activity
of PR1N is concomitant with the cleavage at the N-
terminus of the TFR-PR1N precursor, consistent
with observations for TFR-PR1M autoprocessing.
PR1N, in spite of having 20 substitutions in natu-
rally variable residues and many small but cumula-
tive structural changes in the 10s and 60s loops and
flap hinge region that propagate to slightly enlarge
the inhibitor-binding cavity, is comparable in its cat-
alytic properties with PR1M. Although a number of
these substitutions correspond to minor DRMs in
PR1M, this study indicates that several inhibitors
designed for PR1M bind to PR1N with similar affin-
ities. This result is consistent with the sugges-
tion12,13 that these polymorphic mutations, or so-
called minor DRMs, do not confer resistance to PIs
on their own but may contribute to resistance in
conjunction with major DRMs. Thus, it is possible
that high levels of viral drug resistance may develop
quickly in patients with Group N HIV-1 infection by
selection for one or more of the major DRMs.
Apart from these similarities, PR1N bears some
striking differences from PR1M. Unlike PR1M or its
variants, PR1N has enhanced solubility at pH values
above 5.8 and can be fractionated in its native form
by size-exclusion column chromatography in simple
buffers as reported recently for PR2.19 This property
permits easy assessment of the molecular masses of
the species eluting from the column by SMR. Fur-
thermore, the dimer dissociation constant (Kd) of
PR1N is > 15-fold higher than for PR1M facilitating
measurement of its Kd by a straightforward kinetic
assay. The step-wise cleavage (L34/W35 site in TFR)
occurring before the cleavage at the N-terminus of
PR1N to produce a native-like active protease also
differs in its location from that of the PR1M
precursor.
Numerous rational approaches to inhibition of
mature PR dimerization for the past decade or lon-
ger11 have not reached fruition partly because (1)
the mature PR1M forms a very tight dimer (Kd < 10
nM), requiring the putative inhibitors to have a
higher affinity for effective dissociation and (2) it
exhibits poor solubility and chromatographic proper-
ties, precluding use of a whole complement of bio-
physical and structural studies to investigate dimeri-
zation inhibition. PR1N demonstrates specific
properties that may help to circumvent these diffi-
culties in the screening and validation of potential
dimerization inhibitors,47,48 namely the higher Kd in
conjunction with mass analysis by SMR under
native conditions. Furthermore, it will be advanta-
geous to develop reliable and simple approaches to-
ward the inhibition of the protease at the level of its
folding and dimerization before its autoprocessing.
The observation that DRV, a sub-nM inhibitor of the
mature PR, only partially inhibits the autoprocess-
ing of TFR-PR1N at the L34/W35 site in TFR even
at 6 lM DRV [Fig. 10(B)] suggests that the interac-
tions of PIs with the active site of the protease pre-
cursor may differ from those with the mature prote-
ase. It is essential to develop methods to isolate
sufficient quantities of the active precursor to vali-
date the inhibition of its autoprocessing by PIs other
than DRV. In addition, future studies possibly
describing the structure of the protease precursor
bound to a PI may reveal structural differences aid-
ing the design of specific inhibitors of autoprocess-
ing. Such inhibitors, by targeting an early event in
polyprotein processing, may have the advantage of
curtailing the occurrence of drug resistance with
HAART.
Materials and Methods
Expression and purification
A synthetic gene encoding 160 amino acids of the
TFR and the protease derived from the genomic
sequence of HIV-1 Group N (GenBank accession
number AY5326351) and optimized for expression in
E. coli, termed TFR-PR1N, was cloned between the
Nde1 and BamH1 sites of pET11a vector (Novagen,
San Diego, CA) and transformed into E. coli BL-21
(DE3; Agilent Technologies, Santa Clara, CA). Cells
were grown in Luria-Bertani medium, and expres-
sion was induced at 0.7 OD600nm with a final concen-
tration of 2 mM IPTG for a period of 2 h. Cells
derived from 1 L of culture were suspended in 80
mL of buffer A [50 mM Tris-HCl, pH 8, 10 mM eth-
ylenediaminetetraacetic acid (EDTA) and 10 mM di-
thiothreitol (DTT)], followed by the addition of lyso-
zyme (100 lg mL�1) and sonicated at 4�C. The
insoluble recombinant protein was washed by resus-
pension in 70 mL of buffer containing 50 mM Tris-
HCl, pH 8, 10 mM EDTA, 10 mM DTT, 2M urea,
and 1% Triton X-100 and subsequently in buffer A.
In all cases, the insoluble fraction was pelleted by
centrifugation at 20,000g for 30 min at 4�C. The
final pellet was solubilized in 50 mM Tris-HCl, pH
8.0, 7.5M guanidine hydrochloride (GnHCl), 5 mM
EDTA, and 10 mM DTT to yield a concentration of
�20 mg mL�1. A maximum of 30 mg of protein was
applied on a Superdex-75 column (HiLoad 2.6 cm �60 cm, GE HealthCare, Piscataway, NJ) equilibrated
in 50 mM Tris-HCl, pH 8, 4M GnHCl, 5 mM EDTA,
and 1 mM DTT at a flow rate of 3 mL min�1 at am-
bient temperature. Peak fractions were pooled and
subjected to reverse-phase HPLC on POROS 20 R2
resin (PerSeptive Biosystems, Framington, MA) and
eluted using a linear gradient from 99.95% water (v/
v) and 0.05% TFA to 60% acetonitrile (v/v), 0.05%
TFA (v/v), and 39.95% water (v/v) over a period of 16
min at a flow rate of 4 mL min�1. Peak fractions,
eluting in an unusually broad peak, were combined,
estimated for protein content at 280 nm, and stored
at �70�C. A fraction of the protein was dialyzed
2068 PROTEINSCIENCE.ORG Characterization of Group N HIV-1 Protease

against 12 mM HCl, concentrated to �2 mg mL�1,
and stored at 4�C. The protein was folded according
to the protocols described before.18
Microgram quantities of the full-length TFR-
PR1N precursor were purified from residual precur-
sor that is trapped in the insoluble fraction without
undergoing processing during expression using the
same methodology as described above for PR1N.
TFR-PR1N eluted as a distinct peak earlier than
PR1N in the S-75 column under denaturing condi-
tions, as described above, and was then subjected to
reverse-phase HPLC. This allowed monitoring the
autocatalytic maturation reaction of TFR-PR1N and
its inhibition in vitro by enzyme assays and SDS-
PAGE.
Enzyme assaysFor determination of kinetic parameters, initial
rates of enzymatic hydrolysis of the chromogenic
peptide substrate IV [Lys-Ala-Arg-Val-Nle-(4-nitro-
phenylalanine)-Glu-Ala-Nle-NH2, California Peptide
Research, Napa, CA] were measured by following
the absorbance change at 310 nm in 50 mM sodium
acetate buffer, pH 5, containing 250 mM sodium
chloride, at 28�C. For each assay, 5 lL of a 0.19 mg
mL�1 (8.74 lM) stock solution of the enzyme in 12
mM HCl was folded18 by addition of 45 lL of 5 mM
sodium acetate buffer, pH 6 (buffer A), immediately
followed by 60 lL of 100 mM sodium acetate buffer,
pH 5, containing 500 mM sodium chloride (buffer B).
Reactions were initiated by adding varying amounts
of water and substrate to give final substrate con-
centrations of 18–366 lM and a final enzyme con-
centration of 0.36 lM in a final volume of 120 lL.
Observed initial rates (vi) of absorbance change were
converted to M�1 s�1 by use of De310 ¼ 1797 M�1
cm�1 for hydrolysis of the substrate, and the data
were analyzed by use of the enzyme kinetics module
of SigmaPlot 10 (Systat Software, Richmond, CA).
The effect of urea on enzymatic activity was
determined by analogous kinetic measurements in
the presence of urea at concentrations ranging from
0 to 4M. Dilutions of an 8M urea solution in buffer
B with the same buffer containing no urea were
used as the second buffer in the quench protocol
described above. After protein folding, each enzyme
solution was allowed to stand for 10 min at room
temperature before assaying for activity by addition
of substrate IV.
Evaluation of the dissociation constant
The above kinetic method was also used for determi-
nation of the dimer dissociation constant, Kd, from
the dependence of the rate of hydrolysis of 430 lMsubstrate IV on enzyme concentrations from 40 to
250 nM in buffer solutions with the same composi-
tion and pH as above. The enzyme activity measured
at each concentration was expressed as vi/[PR],
where [PR] is the enzyme concentration as mono-
mers. Even at the highest enzyme concentration
used, a small fraction of monomers remains in equi-
librium with the predominant dimers, and hence the
maximum value of vi/[PR] (100% activity) was ex-
trapolated and Kd was calculated as follows. The
fraction (fu) of PR present as unfolded monomer49 at
a given total PR concentration (expressed as mono-
mer units) is given by
fu ¼
ffiffiffiffiffiffiffiffiffiKd
2 PR½ �
q�
ffiffiffiffiffiffiffiffiffiffiffiffiffiffiffiffiffiffiffiffiffiffiffiffiffiffiKd
2 PR½ � þ 48: 9;
r�
ffiffiffiffiffiffiffiffiffiKd
2 PR½ �
q� �
2
The fraction as dimer at a given PR concentration,
fd ¼ (1 � fu), is equal to Vx/Vmax, where Vx and Vmax
are the values of vi/[PR] at each experimental PR
concentration and at the maximum value of vi/[PR]
where all the PR is dimeric. Thus,
Vx ¼ Vmax 1 � fuf g
and combining these relationships gives Eq. (1):
Vx ¼ Vmax 1 �
ffiffiffiffiffiffiffiffiffiKd
2 PR½ �
q�
ffiffiffiffiffiffiffiffiffiffiffiffiffiffiffiffiffiffiffiffiffiffiffiKd
2 PR½ � þ 4� �r
�ffiffiffiffiffiffiffiffiffiKd
2 PR½ �
q� �
2
8>><>>:
9>>=>>;
(1)
The parameters Kd and Vmax were estimated from
nonlinear curve fitting of Eq. (1) to the experimental
data; observed rates were converted to percentages
of the extrapolated Vmax as shown in Figure 3(B).
Differential scanning calorimetry
Measurements were performed using a MicroCal
VP-DSC microcalorimeter. Mature PR1N was folded
in the presence or absence of inhibitors by addition
of 5.66 vol of 5 mM sodium acetate, pH 5.3, to 1 vol
of PR1N (67 lM) in 12 mM HCl or by addition of
2.33 vol of 5 mM sodium acetate, pH 6 (with or with-
out inhibitor), followed by 3.33 vol of 100 mM so-
dium acetate buffer, pH 5, to give a final protein
concentration of �10 lM and a final pH of 4.5–5.0.
For experiments in the presence of the PIs DRV,
ATV, SQV, and the symmetrical inhibitor DMP323,26
the final concentration of inhibitor was approxi-
mately twice that of PR1N (as dimer) after mixing.
Thermal denaturation scans were begun at 20�C
and run at a rate of 90�C h�1. The final temperature
ranged from 85 to 100�C, depending on the observed
Tm. Data were processed as described previously.24
Values of the Tm were determined from the maxima
of the transitions. In the absence of inhibitor, the
apparent DH (integrated area under the transition
peak) for PR1N was low [cf. Fig. 4(C)]. SDS-PAGE
and ESI-MS of the sample after DSC (data not
Sayer et al. PROTEIN SCIENCE VOL 19:2055—2072 2069

shown) showed that extensive autoproteolysis had
occurred during the course of the DSC experiment
giving rise to a major fragment (W38-F99) with a
mass of 6711 Da, along with several smaller
fragments.
Isothermal titration calorimetry
Measurements were performed at 28�C using a
MicroCal high-precision iTC200 titration calorimeter.
PR1N at a concentration of 4.4 lM (estimated from
the titration endpoint with DRV) in 25 mM Tris
buffer, pH 7, containing 50 mM NaCl, was titrated
with 11 3.85-lL injections of 40 lM acetyl pepstatin
in the same buffer, and the binding constant for ace-
tyl pepstatin was determined using the Origin soft-
ware provided with the instrument. Acetyl pepstatin
(8 mM in 8 mM NaOH) was added to the solution
recovered after titration to give a final concentration
of 150 lM and a final DMSO concentration of 0.07%.
The resultant solution was titrated as above with 40
lM DRV in the same buffer, containing 0.07%
DMSO. The titration curve obtained on displacement
of the weakly binding inhibitor, acetyl pepstatin, by
DRV exhibited too steep a transition to permit accu-
rate determination of the association constant KDRVA
[see Fig. 4(B)]. A lower limit for KDRVA was estimated
from the apparent binding constant (KDRVapp ) in the
presence of acetyl pepstatin by use of the equation
KDRVA ¼ KDRV
app (1 þ KAcPepA [AcPep]), where KAcPep
A is the
KA for acetyl pepstatin as determined in the first
titration.27
Crystallization, X-ray data collection, and
structure determination
PR1N was prepared according to the dialysis protocol
of protein folding18 in the presence of DRV and con-
centrated. Crystals of the PR1N/DRV complex were
grown in hanging drops at room temperature by
mixing 1 lL of protein solution (6 mg mL�1 of pro-
tein) and 1 lL of reservoir solution (1.7M sodium
chloride and 0.1M sodium acetate buffer at pH 4.4).
The crystals were cryoprotected with 1.7M sodium
chloride and 0.1M sodium acetate buffer at pH 4.4
and 30% glycerol. Diffraction data were collected at
100 K on beamline 22-ID (SER-CAT) at the
Advanced Photon Source, Argonne National Labora-
tory. The data were integrated and scaled with
HKL2000.50
The crystal structure was solved by molecular
replacement with the published structure of PR1M
in complex with DRV (2IEN40) as the initial model
using PHASER.51,52 The inhibitor was fitted into
unambiguous electron density. The model was sub-
jected to several rounds of refinement in Shelx53 and
model building with Coot.54 Solvent molecules were
inserted at stereochemically reasonable positions
using 2Fo � Fc and Fo � Fc maps at 1 and 3 sigma
levels, respectively. The final refined model has good
protein geometry with no disallowed f/w values on
the Ramachandran plot. Molecular figures were pre-
pared with Molscript, Raster3D, and PyMOL (http://
www.pymol.org).
In vitro precursor processing
TFR-PR1N in 12 mM HCl was folded by addition of
4 vol of buffer A (5 mM sodium acetate, pH 6), fol-
lowed immediately by 5 vol of buffer B (100 mM
Tris, pH 7, containing 100 mM NaCl, final pH 6.7,
or 50–100 mM sodium formate, pH 4, containing 50–
100 mM sodium chloride, final pH 4.1) to give a final
concentration of 0.18 mg mL�1 TFR-PR1N (5 lM as
dimer) and final buffer concentrations of 25–50 mM
buffer, 25–50 mM sodium chloride. Processing in the
presence of varying amounts of the inhibitor DRV
used a similar protocol with a final concentration of
0.075–0.22 mg mL�1 TFR-PR1N (2.05–6 lM as
dimer) at pH 4. Samples (15 lL) were removed at
selected times, mixed with 6 lL SDS-PAGE sample
buffer, and frozen immediately. Samples were ana-
lyzed on 10–20% gradient Tris-Tricine gels (Invitro-
gen, Carlsbad, CA) and Coomassie stained. Identity
of intermediates and products from TFR-PR1N was
confirmed by ESI-MS of samples that were removed
at specific time points, diluted in 5% acetic acid, and
frozen. The appearance of mature protease activity
with time was also followed by kinetic assays. For
each time point, the TFR-PR1N (2 lL of a 0.5 mg
mL�1 solution in 12 mM HCl) was folded as above
by addition of 48 lL of buffer A and 60 lL of 100
mM sodium formate buffer, pH 4, containing 100
mM NaCl. Processing was allowed to proceed for the
desired times, and assays (see above) were initiated
by addition of 10 lL of substrate IV to give a final
concentration of �360 lM substrate and �0.25 lMTFR-PR1N (as dimer).
Assessment of the monomer–dimer status ofPR1N and its precursor by SMR
Size-exclusion chromatography with detection by
multiangle light scattering (DAWN EOS, Wyatt
Technology, Santa Barbara, CA) and refractive index
(OPTILAB DSP, Wyatt Technology) (SMR) was used
for mass analysis of PR1N and TFR-PR1N in the
presence of excess DRV. A solution (75 lL) contain-
ing 150 lg of PR1N or TFR-PR1N was folded by addi-
tion of 2.3 vol of 5 mM sodium acetate buffer, pH 6,
containing a two- or threefold molar excess of DRV,
followed by 3.3 vol of 0.5M ammonium acetate, pH
5.4. The sample (500 lL) was injected onto a Super-
dex-75 column (1.0 cm � 30 cm) pre-equilibrated
with the same ammonium acetate buffer and eluted
at a flow rate of 0.5 mL min�1 at room temperature.
Molecular masses were calculated using the Astra
software provided with the instrument.
2070 PROTEINSCIENCE.ORG Characterization of Group N HIV-1 Protease

Accession numbersCoordinates and structure factors have been depos-
ited in the Protein Data Bank with accession num-
ber 3MWS.
Acknowledgments
This research was authored, in whole or in part, by
National Institutes of Health staff. The authors thank
Annie Aniana for technical assistance and the staff at
the Southeast Regional-Collaborative Access Team
(SER-CAT) at the Advanced Photon Source, Argonne
National Laboratory, for assistance during X-ray data
collection. Use of the Advanced Photon Source was
supported by the U. S. Department of Energy, Office of
Science, Office of Basic Energy Sciences, under Con-
tract No. W-31-109-Eng-38. DRV, ATV, and SQV were
obtained through the NIH AIDS Research and Refer-
ence Reagent Program, Division of AIDS, NIAID, NIH
and DMP323 from DuPont Pharmaceuticals.
References
1. Bodelle P, Vallari A, Coffey R, McArthur CP, BeyemeM, Devare SG, Schochetman G, Brennan CA (2004)Identification and genomic sequence of an HIV type 1group N isolate from Cameroon. AIDS Res Hum Retro-viruses 20:902–908.
2. Kane CT, Montavon C, Toure MA, Faye MA, NdiayeAG, Diallo AG, Ndoye I, Liegeois F, Delaporte E,Mboup S, Peeters M (2001) Full-length genomesequencing of HIV type 1 group O viruses isolated froma heterosexual transmission cluster in Senegal. AIDSRes Hum Retroviruses 17:1211–1216.
3. Plantier JC, Leoz M, Dickerson JE, De OF, CordonnierF, Lemee V, Damond F, Robertson DL, Simon F (2009)A new human immunodeficiency virus derived fromgorillas. Nat Med 15:871–872.
4. Vallari A, Bodelle P, Ngansop C, Makamche F, NdembiN, Mbanya D, Kaptue L, Gurtler LG, McArthur CP,Devare SG, Brennan CA (2010) Four new HIV-1 groupN isolates from Cameroon: prevalence continues to below. AIDS Res Hum Retroviruses 26:109–115.
5. Yamaguchi J, Coffey R, Vallari A, Ngansop C, MbanyaD, Ndembi N, Kaptue L, Gurtler LG, Bodelle P, Scho-chetman G, Devare SG, Brennan CA (2006) Identifica-tion of HIV type 1 group N infections in a husband andwife in Cameroon: viral genome sequences provide evi-dence for horizontal transmission. AIDS Res Hum Ret-roviruses 22:83–92.
6. Hatfield DL, Levin JG, Rein A, Oroszlan S (1992)Translational suppression in retroviral gene expres-sion. Adv Virus Res 41:193–239.
7. Oroszlan S, Luftig RB (1990) Retroviral proteinases.Curr Top Microbiol Immunol 157:153–185.
8. Louis JM, Weber IT, Tozser J, Clore GM, GronenbornAM (2000) HIV-1 protease: maturation, enzyme speci-ficity, and drug resistance. Adv Pharmacol 49:111–146.
9. Leis J, Baltimore D, Bishop JM, Coffin J, Fleissner E,Goff SP, Oroszlan S, Robinson H, Skalka AM, TeminHM (1988) Standardized and simplified nomenclaturefor proteins common to all retroviruses. J Virol 62:1808–1809.
10. Louis JM, Clore GM, Gronenborn AM (1999) Autopro-cessing of HIV-1 protease is tightly coupled to proteinfolding. Nat Struct Biol 6:868–875.
11. Louis JM, Ishima R, Torchia DA, Weber IT (2007) HIV-1 protease: structure, dynamics, and inhibition. AdvPharmacol 55:261–298.
12. Wensing AM, van Maarseveen NM, Nijhuis M (2010)Fifteen years of HIV protease inhibitors: raising thebarrier to resistance. Antiviral Res 85:59–74.
13. Johnson VA, Brun-Vezinet F, Clotet B, Gunthard HF,Kuritzkes DR, Pillay D, Schapiro JM, Richman DD(2008) Update of the drug resistance mutations in HIV-1. Top HIV Med 16:138–145.
14. Brower ET, Bacha UM, Kawasaki Y, Freire E (2008)Inhibition of HIV-2 protease by HIV-1 protease inhibi-tors in clinical use. Chem Biol Drug Des 71:298–305.
15. Levy Y, Caflisch A, Onuchic JN, Wolynes PG (2004)The folding and dimerization of HIV-1 protease: evi-dence for a stable monomer from simulations. J MolBiol 340:67–79.
16. Ratner L, Haseltine W, Patarca R, Livak KJ, StarcichB, Josephs SF, Doran ER, Rafalski JA, Whitehorn EA,Baumeister K (1985) Complete nucleotide sequence ofthe AIDS virus, HTLV-III. Nature 313:277–284.
17. Ceccherini-Silberstein F, Erba F, Gago F, Bertoli A,Forbici F, Bellocchi MC, Gori C, D’Arrigo R, Marcon L,Balotta C, Antinori A, Monforte AD, Perno CF (2004)Identification of the minimal conserved structure ofHIV-1 protease in the presence and absence of drugpressure. AIDS 18:F11–F19.
18. Ishima R, Torchia DA, Louis JM (2007) Mutational andstructural studies aimed at characterizing the mono-mer of HIV-1 protease and its precursor. J Biol Chem282:17190–17199.
19. Louis JM, Ishima R, Aniana A, Sayer JM (2009)Revealing the dimer dissociation and existence of afolded monomer of the mature HIV-2 protease. ProteinSci 18:2442–2453.
20. Louis JM, Oroszlan S, Tozser J (1999) Stabilizationfrom autoproteolysis and kinetic characterization of thehuman T-cell leukemia virus type 1 proteinase. J BiolChem 274:6660–6666.
21. Mildner AM, Rothrock DJ, Leone JW, Bannow CA, LullJM, Reardon IM, Sarcich JL, Howe WJ, Tomich CS,Smith CW (1994) The HIV-1 protease as enzyme andsubstrate: mutagenesis of autolysis sites and genera-tion of a stable mutant with retained kinetic proper-ties. Biochemistry 33:9405–9413.
22. Ishima R, Torchia DA, Lynch SM, Gronenborn AM,Louis JM (2003) Solution structure of the mature HIV-1 protease monomer: insight into the tertiary fold andstability of a precursor. J Biol Chem 278:43311–43319.
23. Szeltner Z, Polgar L (1996) Conformational stabilityand catalytic activity of HIV-1 protease are bothenhanced at high salt concentration. J Biol Chem 271:5458–5463.
24. Sayer JM, Liu F, Ishima R, Weber IT, Louis JM (2008)Effect of the active-site D25N mutation on the struc-ture, stability and ligand binding of the mature HIV-1protease. J Biol Chem 283:13459–13470.
25. Sayer JM, Louis JM (2008) Interactions of differentinhibitors with active-site aspartyl residues of HIV-1protease and possible relevance to pepsin. Proteins 75:556–568.
26. Lam PY, Jadhav PK, Eyermann CJ, Hodge CN, Ru Y,Bacheler LT, Meek JL, Otto MJ, Rayner MM, WongYN (1994) Rational design of potent, bioavailable, non-peptide cyclic ureas as HIV protease inhibitors. Science263:380–384.
27. Velazquez-Campoy A, Freire E (2006) Isothermal titra-tion calorimetry to determine association constants forhigh-affinity ligands. Nat Protoc 1:186–191.
Sayer et al. PROTEIN SCIENCE VOL 19:2055—2072 2071

28. King NM, Prabu-Jeyabalan M, Nalivaika EA, Wiger-inck P, de Bethune MP, Schiffer CA (2004) Structuraland thermodynamic basis for the binding of TMC114, anext-generation human immunodeficiency virus type 1protease inhibitor. J Virol 78:12012–12021.
29. Hoffman NG, Schiffer CA, Swanstrom R (2003) Cova-riation of amino acid positions in HIV-1 protease. Virol-ogy 314:536–548.
30. Zoete V, Michielin O, Karplus M (2002) Relationbetween sequence and structure of HIV-1 protease in-hibitor complexes: a model system for the analysis ofprotein flexibility. J Mol Biol 315:21–52.
31. Sanches M, Krauchenco S, Martins NH, Gustchina A,Wlodawer A, Polikarpov I (2007) Structural characteri-zation of B and non-B subtypes of HIV-protease:insights into the natural susceptibility to drug resist-ance development. J Mol Biol 369:1029–1040.
32. Coman RM, Robbins AH, Fernandez MA, Gilliland CT,Sochet AA, Goodenow MM, McKenna R, Dunn BM(2008) The contribution of naturally occurring polymor-phisms in altering the biochemical and structural char-acteristics of HIV-1 subtype C protease. Biochemistry47:731–743.
33. Kantor R, Katzenstein DA, Efron B, Carvalho AP, Wyn-hoven B, Cane P, Clarke J, Sirivichayakul S, SoaresMA, Snoeck J, Pillay C, Rudich H, Rodrigues R, Hol-guin A, Ariyoshi K, Bouzas MB, Cahn P, Sugiura W,Soriano V, Brigido LF, Grossman Z, Morris L, Van-damme AM, Tanuri A, Phanuphak P, Weber JN, PillayD, Harrigan PR, Camacho R, Schapiro JM, Shafer RW(2005) Impact of HIV-1 subtype and antiretroviral ther-apy on protease and reverse transcriptase genotype:results of a global collaboration. PLoS Med 2:325–337.
34. Kantor R, Katzenstein D (2003) Polymorphism in HIV-1 non-subtype B protease and reverse transcriptaseand its potential impact on drug susceptibility anddrug resistance evolution. AIDS Rev 5:25–35.
35. Ode H, Matsuyama S, Hata M, Neya S, Kakizawa J,Sugiura W, Hoshino T (2007) Computational character-ization of structural role of the non-active site mutationM36I of human immunodeficiency virus type 1 prote-ase. J Mol Biol 370:598–607.
36. Clemente JC, Moose RE, Hemrajani R, Whitford LR,Govindasamy L, Reutzel R, McKenna R, Agbandje-McKenna M, Goodenow MM, Dunn BM (2004) Compar-ing the accumulation of active- and nonactive-sitemutations in the HIV-1 protease. Biochemistry 43:12141–12151.
37. Hong L, Zhang XC, Hartsuck JA, Tang J (2000) Crystalstructure of an in vivo HIV-1 protease mutant in com-plex with saquinavir: insights into the mechanisms ofdrug resistance. Protein Sci 9:1898–1904.
38. Kovalevsky AY, Tie Y, Liu F, Boross PI, Wang YF, Lesh-chenko S, Ghosh AK, Harrison RW, Weber IT (2006)Effectiveness of nonpeptide clinical inhibitor TMC-114on HIV-1 protease with highly drug resistant muta-tions D30N, I50V, and L90M. J Med Chem 49:1379–1387.
39. Agniswamy J, Weber IT (2009) HIV-1 protease: struc-tural perspectives on drug resistance. Viruses 1:1110–1136.
40. Tie Y, Boross PI, Wang YF, Gaddis L, Hussain AK,Leshchenko S, Ghosh AK, Louis JM, Harrison RW,Weber IT (2004) High resolution crystal structures ofHIV-1 protease with a potent non-peptide inhibitor(UIC-94017) active against multi-drug-resistant clinicalstrains. J Mol Biol 338:341–352.
41. Koh Y, Nakata H, Maeda K, Ogata H, Bilcer G, Deva-samudram T, Kincaid JF, Boross P, Wang YF, Tie Y,Volarath P, Gaddis L, Harrison RW, Weber IT, GhoshAK, Mitsuya H (2003) Novel bis-tetrahydrofuranylur-ethane-containing nonpeptidic protease inhibitor (PI)UIC-94017 (TMC114) with potent activity againstmulti-PI-resistant human immunodeficiency virus invitro. Antimicrob Agents Chemother 47:3123–3129.
42. Liu F, Kovalevsky AY, Tie Y, Ghosh AK, Harrison RW,Weber IT (2008) Effect of flap mutations on structureof HIV-1 protease and inhibition by saquinavir and dar-unavir. J Mol Biol 381:102–115.
43. Tang C, Louis JM, Aniana A, Suh JY, Clore GM (2008)Visualizing transient events in amino-terminal auto-processing of HIV-1 protease. Nature 455:693–696.
44. Louis JM, Dyda F, Nashed NT, Kimmel AR, Davies DR(1998) Hydrophilic peptides derived from the trans-frame region of Gag-Pol inhibit the HIV-1 protease.Biochemistry 37:2105–2110.
45. Koh Y, Matsumi S, Das D, Amano M, Davis DA, Li J,Leschenko S, Baldridge A, Shioda T, Yarchoan R,Ghosh AK, Mitsuya H (2007) Potent inhibition of HIV-1 replication by novel non-peptidyl small moleculeinhibitors of protease dimerization. J Biol Chem 282:28709–28720.
46. Lindhofer H, von der Helm K, Nitschko H (1995) Invivo processing of Pr160gag-pol from human immuno-deficiency virus type 1 (HIV) in acutely infected, cul-tured human T-lymphocytes. Virology 214:624–627.
47. Sluis-Cremer N, Tachedjian G (2002) Modulation of theoligomeric structures of HIV-1 retroviral enzymes bysynthetic peptides and small molecules. Eur J Biochem269:5103–5111.
48. Uhlikova T, Konvalinka J, Pichova I, Soucek M, Kraus-slich HG, Vondrasek J (1996) A modular approach toHIV-1 proteinase inhibitor design. Biochem BiophysRes Commun 222:38–43.
49. Todd MJ, Semo N, Freire E (1998) The structural sta-bility of the HIV-1 protease. J Mol Biol 283:475–488.
50. Otwinowski Z, Minor W (1997) Processing of X-ray dif-fraction data in oscillation mode. Methods Enzymol276:307–326.
51. McCoy AJ, Grosse-Kunstleve RW, Storoni LC, Read RJ(2005) Likelihood-enhanced fast translation functions.Acta Crystallogr D Biol Crystallogr 61:458–464.
52. Storoni LC, McCoy AJ, Read RJ (2004) Likelihood-enhanced fast rotation functions. Acta Crystallogr DBiol Crystallogr 60:432–438.
53. Sheldrick GM, Schneider TR (1997) High resolutionrefinement. Methods Enzymol 277:319–343.
54. Emsley P, Cowtan K (2004) Coot: model-building toolsfor molecular graphics. Acta Crystallogr D Biol Crystal-logr 60:2126–2132.
2072 PROTEINSCIENCE.ORG Characterization of Group N HIV-1 Protease
Copyright © 2022 FDOKUMEN