Lawton, William H. An Autocatalytic Model for ,Ale Diffusion of ...
54
C ED 117 819 , DpICUMENT RESUME EA 007 875 AUTHOR Lawton, Stephen B.; Lawton, William H. TZTLE ' An Autocatalytic Model for ,Ale Diffusion of Educational Innovations. DST -Jan 76 _________ _ NOTE 54p. EDRS PRICE MF-$0.8341C-$3.50 Plus Post-age 11,W:411-,1191MANNI Ir .31 NO MAIO' 16-- L IDENTIFIERS 4 ABSTRACT T_ ittusin c i6nu1 rhaaz s_;_ *Educational Innovation; Graphs; Information Dissemination; Literature-Reviews; *Models; *Prediction; Tables (Data) *Autocatalytit Diffusion Model This paper reviews a number of past studies inethe field of diffusion research, describing the major features of each diffusion,thodel and discussing its value for predicting the spread of educational innovations. Following thi's,reviei, the authbr presents a new autocatalytic diffusion model baseoron the mathematical models of epidemiologists and chemists.- This autocatalytic model is adapted to the study of educational innovations, and then the model is applied to historical ata avl used to predict the life cycle of six different educ tional innovations. The predicted life cycl s matched the actual hi's, 4cal to very well in five_of the six cases. The author also uses odel to project the future adoption life cycle of the semester system in Ontario secondary schools, an innovation that is still in the process of adoption. (JG) ***************** **********************************************4.****** Documents acquired by ERIC include many informal Unpublished, * * materials not.available from other 'sources. ERIC maksg every effort * * to obtain the best copy available. Nevertheless, items of marginal * * reproducibility are often encountered and this affects the quality * * of the microfichevand hardcopy reproductions EPIC makes available * * via the ERIC Document R'eproductio Service (EDES): EDRS is not * responsible for the quality of the original 'aocument..Eeproductic,ns * * supplied by EDRS are the best that can be made from the original. ***********************************************************************
-
Upload
khangminh22 -
Category
Documents
-
view
0 -
download
0
Transcript of Lawton, William H. An Autocatalytic Model for ,Ale Diffusion of ...

C
ED 117 819
, DpICUMENT RESUME
EA 007 875
AUTHOR Lawton, Stephen B.; Lawton, William H.TZTLE ' An Autocatalytic Model for ,Ale Diffusion of
Educational Innovations.DST -Jan 76 _________ _
NOTE 54p.
EDRS PRICE MF-$0.8341C-$3.50 Plus Post-age11,W:411-,1191MANNI Ir .31 NO MAIO' 16--
LIDENTIFIERS
4
ABSTRACT
T_ ittusin c i6nu1 rhaaz s_;_*Educational Innovation; Graphs; InformationDissemination; Literature-Reviews; *Models;*Prediction; Tables (Data)*Autocatalytit Diffusion Model
This paper reviews a number of past studies inethefield of diffusion research, describing the major features of eachdiffusion,thodel and discussing its value for predicting the spread ofeducational innovations. Following thi's,reviei, the authbr presents anew autocatalytic diffusion model baseoron the mathematical models ofepidemiologists and chemists.- This autocatalytic model is adapted tothe study of educational innovations, and then the model is appliedto historical ata avl used to predict the life cycle of sixdifferent educ tional innovations. The predicted life cycl s matchedthe actual hi's, 4cal to very well in five_of the six cases. Theauthor also uses odel to project the future adoption life cycleof the semester system in Ontario secondary schools, an innovationthat is still in the process of adoption. (JG)
***************** **********************************************4.******Documents acquired by ERIC include many informal Unpublished, *
* materials not.available from other 'sources. ERIC maksg every effort ** to obtain the best copy available. Nevertheless, items of marginal *
* reproducibility are often encountered and this affects the quality *
* of the microfichevand hardcopy reproductions EPIC makes available *
* via the ERIC Document R'eproductio Service (EDES): EDRS is not* responsible for the quality of the original 'aocument..Eeproductic,ns ** supplied by EDRS are the best that can be made from the original.***********************************************************************

so
i
U S DEPARTMENT Of HEALTH,EDUCATION & WELFARENATIONAL INSTITUTE Of
, EDUCATIONTHIS DOCUMENT POO BEEN REPRODUCED EXACTLY AS RECEIVED FROMTHE PERSON OR ORGANIZATION ORIGATING IT POINTS OF VIEW OR OPINIONSSTATE* DO NOT NECESSARILY REPRESENT OFFICIAL NATIONAL INSTITUTE OFEDUCATION POSITION OR POLICY
/
1
Y.
)
v..
t I
/
1
. 'AN AUTOCATALYTIC MODEL FOR.
1HE DIFFUSION OF EDUCATIONAL INNOVATIONS
STEPHEN B. LAWTON
THE ONTARIO INSTITUTE FOR STUDIES IN EDUCATION
WILLIAM H. LAWTON
EASTMAN KODAK COMPANY
JANUARY, 1976
:
2
I
0
t o"
P
..,
. .
t
r
I;

r)' 4
AN AUTOCATALYXICMODEL FOR THE
DIFFUSION'OF EDUCATIONAL INNOVATIONS
P -The spread of educational innovations is a topic that has been investi-.
multi.tude of complementary viewpoints. SOme individuals have
been interested in dissemination of particular practtces or products; others
have studied the diffusion process itself; still others have focused on the
adopters, theii characteristics and motivations;, and most recently, investi-
gatorshave concentrated on the problems of implementation of innovations.
This paper is in the tradition pf diffusion research,, but is an outgrowth
of recent developments in a quantitatiL approach that has emerged in the
field of marketing that, in turn, has its roots in the mathematical models
of epidemiologists studying the spread of diseases and chemists investigating
the nature of chemical reactions. In particular, a new model to describe the
diffusion of new p =ctic= and products is presented, similar to that proposed
by Bass (1969), The mod =1 is then aliplied to a numberof educational and
business' innovations. The findings are related to the literary tradition
of diffusion research (Rogers, 1962, 19 ) and to several concerns about the
nature of change in education (Hous4 1974, 1976):
Background
The tradition of research on the diffusion of educational innovations is
associated with the work of Paul R. Mort at the Institute for Administrative
Studies, where over 150 studies were completed over a -period of forty years,
Insummariaing the overarching. findings,, ort (1964) concluded, in part,
1) a, long time elapses between recognition of a need and creation of
an acceptable solution;1
2) the spread of an educational innovation proceeds at a slow pace,
requiriegdecadea to complete;
3

3)
,
-2-
U-
rate of diffusion for complex innovations is the same as for
-simple -aftet;-"thougexdiitYNeiflE6Vitions prooeed_morq slowly_than_inexpensive
ones;
) during the early stages of its introduction, an innovation is usually
"invisib , but its spread is relatively rapid after its re'cognition;
5) communities vary in the degree to which they take on to new practices.
The Mort studies also discovered, as suggested by point four, that inno-
vations etch out an S-curve when plotted cumulatively through time (Rogers,
1971), and a bell-shaped curve if plotted annually. It is the mathematics
modelling of these curves that'is the focus of this paper.
Rogers brought the strands of diffusion research in rural sociology,
education, anthropology, sociology, medical sociology, andlindustrial history,
economics and engineering together in Diffusion of Innovations (1962). The
universi'y of the S- and bell-shaped curves describing the life cycle of the
adoption of an innovative practice or product was established beyond doubt,4
though attempts at their quantitative description were rather unsuccessful.
At the same time, various conceptg were presented idlich give useful meanings
to more comolex*mathematital formulations:
Interaction effect - "the process through which individuals in a social
system who have.4poted an innovation,influence,those who have not yet adopted....\
If the first adopter of the innovation discusses it with two, other members of
the social system, and these two adopters each pass the new idea along to two
peers, the resulting distribution follows a binomial expansion. This mathe-
matical function follows a normal shape when plotted (1962, p. 154)."
Adopter categories - Adopters can be grouped into innovators, early
adopters, early majority, late majority and laggards.
-3-
I
Combining the mechatism iuggegted in his definition of the interaction. .*
effect-vith._theL----i-dea-r:eadoptiow-44,3-11ractice spreading, from a group of
--spe,c-tant--44;aevat-e-rete--the--remein-litg--stembeme -a-gepul-a-t--tee-,Regg.
4 two -step flow:
"Most individuals become aware of inndvations from Mass media and
then proceed to discuss these innovations with peers as they evaluate
the idea,,,, Essential to the idea of a two-step flow is a distinctionk
.
between opinion leaders and their followers...4. 214)"
#
In other words, when earlier adopters talk to later adopters
about 4 new idea, the rate of adoption proceeds more quickly than.
when this communication does not occur,
The interaction effect 4.5 gene.rally' similar to the process by.
which an infectious disease such as scarlet fever,.diphtheria, or
measles spreads through'a social system, Bailey (1957, pp. 15.22)
analyses the infection process in terms of "infectivea" (similar to
active adopters of a .new idea), "ausceptibles" (these who are-not yet
infeCted), "removals" by death or isolation (similar to ,Pasaive adopters),A
and the "incubation period" (similar to the adoption period).... There
4.4 close 'theoretical similarity of the infection process, to the diffu-
sion process, Perhaps some of the complea mathematiCal equations-
obtained for diffefent types of epidemics by Bailey (1957) might be
fitted to the diffus'ionof innovations (p,'217)"
' -Ironically, Rogers !Ingestion to apply the Mathematics of epidemiPlegY
to diffusion research was taken up by the one tradition he had omitted:.
marketing. At the time, he had noted, "Katz and i.eviii1(1959) if* of
traditions includes marketing research which the present list does not.
\A
r
,
a
,
-4-
'There'Ate relatively few research studies svallable in the field.' It is
probably-true, however, thAt 1... mUch-Of-interast in the field'ofmarketimvA
may be in OA files of private agenties....' - (Rata and Levin, 1959)."
B484 (1969) developed a growth model for (Wee of new produets relatedV
to.the mathematical.theory,underlaying contagion models applied in the .
,
field of epidemiolgy, B444 notes, 'Behaviorly", the assumptions are eimpar4
in certain respects to the theoretical concepts emerging in the literature
on new product adoption And diffusion.".. The model differs from models'
based on the log-normAl dietribetqgn (e.g., Mansfield, 1961) and other
arowrh models , in that the behavioral assumptions are, expliot4 (1). 2'15),"
It g44 also be noted that the normal distribution csedto describe the
distribution Of adOptere by year, which Rogers (1962)advocates, is
necessarily rejected by 'the Bass apprOach pines; 1) there is no behavioral
rationale for use of the normel or Gaussian distribution for the purpose,
and a) the Bass model does not reduce ko a normal distribution.
The Bass model is concisely summarised in Nevera (197,2) and Dodds (1973),
And the letter'notea the model's success not only in modeling past behavior
1)01 in predicting future behavior: "One of the_advatages of the Bess model
is that it permits a forecast of thq timing of a turndwa n sales during
a period La which sales SVC growing rapidly, ware naive forecasting modelsa
tend Co project'indefinite sales growth at rapid rates. Thus.Bass :in 1966
accurately predicted that a sales peak would occur in 1968, or color
vision set sales at 6.7 million units, while the industry was building plant
capacity for 14 million picture tubes. The overly optimistic industry prom
jections resulted in rather oeverd economic dislocation which might have been
avoided (Dodds, 1973, p. 308)." In addition to the "adoption" of new color
$
television sets, Bass applied his model tb'Anumber of other consumer items,
___Nevers 1972- extended the Bass tel to the retail service a riculture
and industrial technology sectors, in addition to at of consumer durables,
evaluating his results using multiple regression. For, the first, ha/notes,
results are good both in terms of estimated time and magnitude of sales
peak. A ten year Prediop.on for McDonald's franchises (1955 to 1965) "over
,which an actual sales peak was realized, yielded very good results (15. 87),"
4For industrial technology and agricultural sectors,, results were reasonably
good, though the short period to peak adoption -cast some doubt on .rhe
significance of predicted times (p, 147)." For the consumer sector, results
were encellent for boat trailers, and within four Percent of the magnitude
of peak year sales for colour televiiiten sets, though peak sales were pre-.
icted one year earlier than they actually4occurred. See Table 1.
Dodds (1973) improved on the methods used by Bass (1969) and4/evers (1972)
to estimate adoption curves and parameters by using non-lineir estimation
techniques in place of their use of linear regression.
4
I
IN T- TABLE -1 ABOUT HERE

-6-
Following Nevers' lead. it wouldloo possible to test the Bass model .
with educational data. How well would it fit, qay, the data reported by
Carlsod (1965) for the adoption of Modern Math to Allegheny _County,__Pennsylvania, and the State of West Virginia? In what year would it
. predict the peak number of adoptions of the semester system in secondary
schools of Ontario, Canada, given the numbers Nhving adopted semestering
in the past five Years?
These questions are answered in this paper, but using a model deinloped
independently of Bas; by' Lawton (1974). In many respect, this model is
similar to Bass's in that it uses formulations developed in epidemiology
and, incidentally, chemistry., Terminology from the latter field is used
to describe the model: an autocatalytic model for adoption of innovations.
In chemistry, a reaction in which the molecules of a substance formed as
the reaction proceeds acts as a catalyst to hasten the formation of addi-
tional molecules is termed 'autocatalytic." This terminology is particularly
appropriate to the adoption of innovations since this type of reaction is
analogous to Roger's interaction effect, described previously, which recounts
the influence of one adopter on others who have not yet adopted a new idea,
practice or product.
The autocatalytic model described below has at least 640 notable
4
differencei from the Bass model. First, there is a single rate constant
p for all Adopters, rather than two rates--one for innovators and one for7
immitators--as proposed by Bass. The concept of a rate constant which is
determined experimentally is fundamental to the study of the velocity of
chemical reactions (Sienko and Plane, 1961). Typically, the rapidity wiih'
which two chemicals react Is proportional co their concentration and Chemical
nature, to temperature, and to the presence of a catalyst. Any automobile
owner living in an area of severe winters or in an oceanside community is
81

-7-
well aware that iron rusts more quickly in humid weather than dry (i.e., it
depends on the amount of moisture in the air) and that his reaction is s
r
ti
e a car in Pj eonix might take 30- years
to rust, the same damage might occur in Toronto in just 3 year's; that is.,
rusting might occur 10 times as fast in the latter city. In theory, the rate
formula for this reaction might look something like this:
'Rate la p (concentration of moisture, salt, iron)"where p is the so-called
"rate constant," which must be determined by experiment. Clearly, if stain-
less steel were substituted for iron in the same equation, p-would be much
smaller since the rate of corrosion would be much less. This concept of the
rate constant can be developed using the disease analogy, as well: a highly
contagious disease has a far larger constant than one which is not easily4
spread. In.both cases, the rate constant does not depend on the extent of
the materials or populations involved Hence, rates for adoption of a
,given innovation .in different juri' lotions can be compared directly, as can
. 7,I
rates-computed from either raw data or percentage distributions. In addition,
th tate constant for the autocateiitic model differs from that defined by
Rogers (1962, p. 139). The ratter gives a dipfstinct value from year to year,
making Fomparisons even between the same innovation at different times and
different places impossible. ,Similar limitations apply-to the use of rates'
for different innovations using Rogers' definition??The second important
departuie ftlem Ba (1969) is the use of the notion of a "seed" which starts-
the adopti process, touch as a seed sets off a chemical reaction. Using
th, iseise analogy, this seed is .a group of "carrier's" that introduce a
disease to a new population of "susceptibles", thus starting an epidemic,.
-8.
Whereas Bass and Lawton have, in essence, proceeded from Rogers'
_... concept of interaction to the macroscopic, Carlson (1965) proceeded. to
the microscopic in Adoption of Educat-ional-Inuovations,His-Analysie-ef--,-
social interaction (p. 19) suggesta t e Internal-protesses-of-an-a
catalytic reaction, which the mathet tical models describe only in terms
of cumulative effects, Carlson- doeS present cumulative data 'for six
educational innovations (Modern Math, Language Laboratories, Team Teaching,
Programmed Instruction, Accelerated Programs, and Foreign Language in
elementary schools), and he relates rate of diffusion;- defined as the
'area under the histogram which gives the percentage of adoptions over
with characteristics of iftdividual innovations. As an empirical definition
of rate of diffusion, Carlson's choice may be sound if an innovation's
'period of,adoption is over, However, the definition is useless if one
wishes to predict the course of adoption of A new,practice, such ai s master
ing, when-t4'spread has just begun,. Of most relevance to this Study is the
data Carlon presents; its reanalysis using the sutocatalytic model appears.
later,
More recently, House's The Politics of Educational Innovates (1974). .
haq elaborated on the social Procesa pf implementing innovative changes in
education, Much ofAie analysis con rne the distinction between °innovations
adopted by two different types entities.-the individual for whist he'terms
"household innovations," p the organization for what he terms "entrepreneurial.
innovations" which are meant, in the end' to affect people other than those
directly involved in the adopting agency, Examples of the first are television
seta and antemobileal, exAmples of the latter are computer assisted instruction
and McDonalds' franchises,
1
-9.
In general, Rouse is critical of diffusion models, such as the informa-
tion flow model propoadd by Pederson (1970), because_they tend to-Atm-all
adooters-an-eqnati-equiatv-owareand-equally likely to adopt. Hoesp norps
---this-Apsumption joai7and-emphaaiaee that social structure-is the--
dominating force, particularly in the case of Atrpreneurial innovations.
This latter paint is graphically illudtrated by points plotted on maps of
illinoia showing the state -wide spread of.orbgrams . 4 the, educationally
gifted, Clearly, urban centres located along major highways adopted first,
while small, remote rural communities adopted last.
In feet,' however, 11onse has not actually rejected diffusion models;'
he has imply refinld the target population info ever smaller groups on
the basis of various factors affecting the likelihood of adoption. In,
marketing terminology, he has segmented the market according to size and
,geographic pcokimity to transportation corridors. Since in practice
diffusion models generally assume the similarity of adopting units,
market segmentation ,clearly makes them more applicable by making the-
nopnkationa to which they are applied more homogeneous in fact, Recognition
that detailed analysis of both population structures and the adoption/
/implementation process is possible, and indeed necessary, does noecontra.
diet the validity of macroscopic modeling of the diffusion process, The. .
situatiod is not unlike that which occurs in chemistrys
"For most reactions', it is only the disappearance of starting materials
and the Appearance of finaliroducta that can be,detected; i.e., only the
net reaction in °beer able. In general, however, the net reaction is not
the whole story but ai ply represents A summation of all the changea,that
occur, The net change may actually consist of several consecutive reactions,
each of which copatituten a stop in the formation of final products....
t
-10- ,,,
.
It is important to keep clear the distinction between net reaction and
one step in that reaction (6ienko and Plane, 1961, ,,217)."' .11
- .*---- _.
, .
o, too, macroscopic diffusion models such -as that presentea-here
.facus_on_net-effecta, Study of_indivistual, steps,in Clineat
and non-linear) complexity and with their host of intermediate results,
is an important complementary area of investigation. 1
, Overview of the Autocatalytic Model
Immediately after the-appearance of a new practice, product or idea
in the educational arena, its adoption by educators, schools Oir, sdhool
boards unfolds yea'' by Year. A plot.of the adoption of such an ".innova-
tion" against time yields a graph like that in Figure 1 fpr..NEWSTYLE
teaching.. This plot of adopting un (in this ease teachers)* as a
function of time is called the life cycle of the innovation.
Insert :Figure 1 aboutjtere
The life cycle function contains.some of the essential information
needed for planning and dissemination deltilli9W. The sum of,all the
numbers of adopters for-each year (the area under the "curve") represents
the total population of.adopters for the innovation to wheTWOrmation
must be' disseminated or trailing provided; the peak height provides inform.
tion about the capacity of t e training or disseminating unit (if any); and
the width of the curve gives time elapsedthetween first acceptance by inno-
vators and late acceptance by laggards and, hence; the date at which support
12
services can end,
If. this life cycle curve were known prior to the emergence of an
innovation, then the planning and dissemination decisions concerning the
innovation would be greatly simplified, Of course, the exact life cycle
cannot be known until after the and of the cycle, todLlate to be of
assistance in planning and dissemination decisions.
The difficulty of making reasonable predictions about life cycles is
perhaps most severe when one is dealing with truly "new" ideas, practices,
and products which are datrMally,different from those that preceded.
Op" sil plan schools, programmed instruction, semestered high schools
(radically different for Ontario, at least), and two-tiered metropolitan
governance of schools are but a few examples. Thus, the potential value
of applying some of the results of studies which have focussed on.the time
evolution{ of adoption of new prodticts (e.g., Base, 1969) is obvious.
Most of the models that have been developed are ailtied at a broad
range of distinctive "new" practices and products, as opposed to minor
changes.in those currently in ult which have the characteristics that
the innovation can be adopted but once during its life cycle. Hence, if
a school has adopted programmed instruction for matheMatics and_later
replaces worn programmed texts, only the first adoption is counted.
Further, the model ignores ceedingly important possibility that
the innovation might a dropped later, as would occur if prograMmed texts
were replaced by Computer Assisted Instruction for teaching matMaticS.
Both the Bass(1969) and Lawton (1974) models put forth the theory
that the timing of an individual'Initial adoption of an innovation is
strongly related to the number of previous adopters of that innovation.
Essentially, Rogers' interaction effect, characterised by increased
miliarity with the innovation as it is being applied in the field,/
L

-12-
and the desire to emulate opinion leaders in high status positions (or in
layman's terms, the desire to "keep up with the Jones") are thought tolor
provide, in terms of social dynamics, the autocatalytic force.
Other possible factors, advanced by House (1974) include economic moti-
vation for profit and career advancement, might be of particular importance
1
in the caseof entrepreneurial innovations.
Ultimately, the thorough understanding of this autocatalytic force
and the factors involved in its creation isof critical importance, As
House (1974) notes, the "tempo of economic development depends on the speed
of the innovation's diffusion and implementation (p. 259)." Certainly,
control okeconomic development is a critical factor in all societies.
Nevertheless, a thorough understanding of the drive behind adoption of
innovations is not necessary for applying the autocatalytic model if one
can assume that, for a given population at a given time, the net force
is set. That is; one must assume that among school administrators in
given jurisdiction, the force would not change during an innovation's
adoption life cycle.
hough-this assumtion limits the validity of the model in theory, it
ay be reasonable in practice. Only extreme changes in external factors
are likely to effect the process of adoption, judging from results reported
later, amOdhen these occur, they arttplikely to pass unobserved. Indeed,
a quasi-expeMental situation is created when proje'cting the future, ath
of adoption for an innovation which facilitates the identification of
vatiables'aftecting the innovation process. By analogy, the spread of an
epidemic can be projected early in its course, even ifsthe mechanism by
which it 'is spread is unknown. Further, a sudden cessation of, the epidemic
6 might provide a clue which would lead to understanding the mechanism. In
14
-13-
short, modeling the macroscopic is not dependent on understanding the
microOroceaaes.
Mathematical models, such as that presented here, cannot be ttusted
or considered useful until they can be shown consistent with, and provide
an explanation for, a large portion of actual life cycles of innovations.
As noted previouSlY, the Bass model has proven quite successful; so top
has the autocatalytic model for the adoption of innovations. It has been
applied to more than thirty sets of data, and given consistently good
results. In particular., its predictions for the titling of and number of
adoptions in the peak year of the life cycle when applied to historical
data are excellent for Oe following. A detailed examination will be
provided for the educational innovations in a later section.
Education ,Consumer Products
Modern Math
Foreign - Language (elementary)
Accelerated ProgramstOr
Programmed Instruction
Language Laboratories
Semestering
Retail Service
McDenald's franchises
Industrial Technology
Rapid Bleach Prociss licenses
Power Lawnmowers
Boat TrailerS
-Television Sets
Clothes Dryers
Air Conditioner
Freezers
Record Players
Tape Recorders
Cable TV Subscribers
The autocatalytig model describes the'entire life cycle for an inno-
vative idea, practice or productlin terms of three simple nuiberst the
414e of the population of adopters,, denoted-by N, which is the total
number'of -unite that would adopt the innovation if no other innovations
c.)
1 1'5
w
-14-
or disturbancea occurred; the number tt.,y11ar /Wolters, deaOted by.,
a ; and the rate constant, denoted by pi which ie a-measure of her fast
the innovation spreads through the'population of adopters. As4s the case
in chemistry, the rate constant for a given innovation or clasit of inno-
vations must be determined by examining historiCal data which; in essence,
represents previous "experiments."
The examination of some thirty sets of historical data led to the
surprising conclueibm that p is relatively stable for consumer products,
(iO3,1 House's "household innovations") and may be stable though somewhat
larger in magnitude for commercial and educational innovationS, (i.e.,
House's "entrepreneurial innovations)." I"discovery" is true, them one
needs only two parameters to estimate the total life cycle of an innovation:
the site of the population of adopters N and the number of 'first year
adopters sl'
The effects of differences in either the number of first
year adopters or the sizes of populatiOns of adopters on thesubsequent
evolution of the life cycle curve can easily be exeminia4
by use of the
model,
Use of the Autocatalytic Model
The model can be used in four distinctive ways: 1) analysis of
historical data, 2) extrapolation oflife cycle curve from early data
on the adoption of ap innovations 3) prediction of life cycle curve
before the introduction of an innovation, and 4) estimating the "value"
of s totally new innovation from early adoption data.
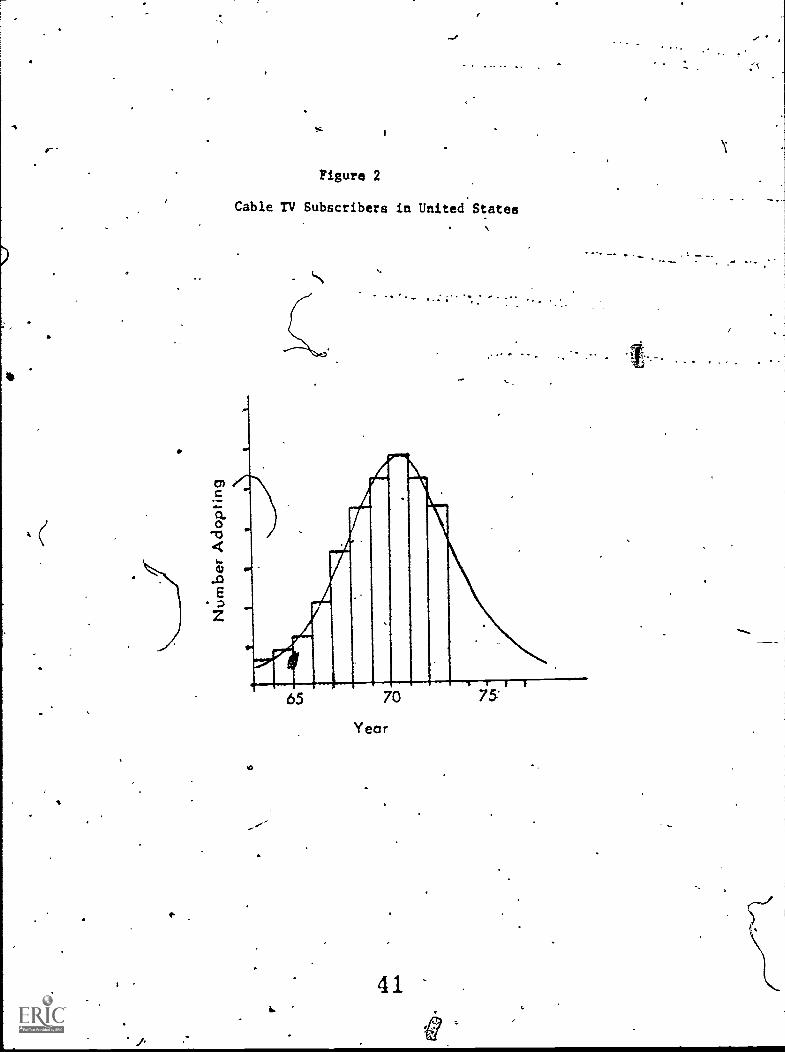
Anelysis of historical data using the eutocatalytic model amounts
to validating the model, Hsd the modal not been able to reproduce the
chavectetistice of actual life cycles, then it would' have been discarded.
In practice, the best fit of the model to an actual life cycle is deter-,
-15-
mined by computer analysis; using an apprdach similar to that of Dodds
(1973), An example of such an analysis is shown in Figure 2 for Cable TV
subscriber's,, a typical household innovation.
Insert Figure 2 about here
Analysis of historical data provided strong evidence that the
auto:catalytic model is Otte consistent with the time evolution actually
observed, Figure 2 bei4 a typical example. In all, over thirty life
acycles were reducedto the three basic parameters, N, si, and p. At this
point it WAS discovered that the rate constant p tended to take on values
'between 0.4 and 0.6 for consumer products, 0,6 and 0.7 for commercial
products, and 0.6 and 1,4 for educational innovations. Over the range
-from 0.4 to 0.6, differences in the parameter p have only a very minor
effect on the life cycle curve, From these "experimental" data, it would
anappear apriori estimate of p m 0.5 should be adequate for most analyses
A
of the Adoption of consumer products; of p 0.65 for commercial products;
and p 0,8 for educational innovations of an entrepreneurial kind. The
high value of the rate constant for educational innovations is particularly0
striking in view of Mort'a findinga that educational innovations were slow
ato spread; discussion of this finding appears in a lOter section.
Extrapolation or forecasting of future adoptions of an innovation
from early adoptions is a particularly pracfical use of the autocatalytic
model, As noted earlier, Sass correctly predicted the peak year of colour
television sales,. and DOdds (1973) demonstrated the capability of the Bass
model for extrapoating the life cycle of Cable TV operations. Using the
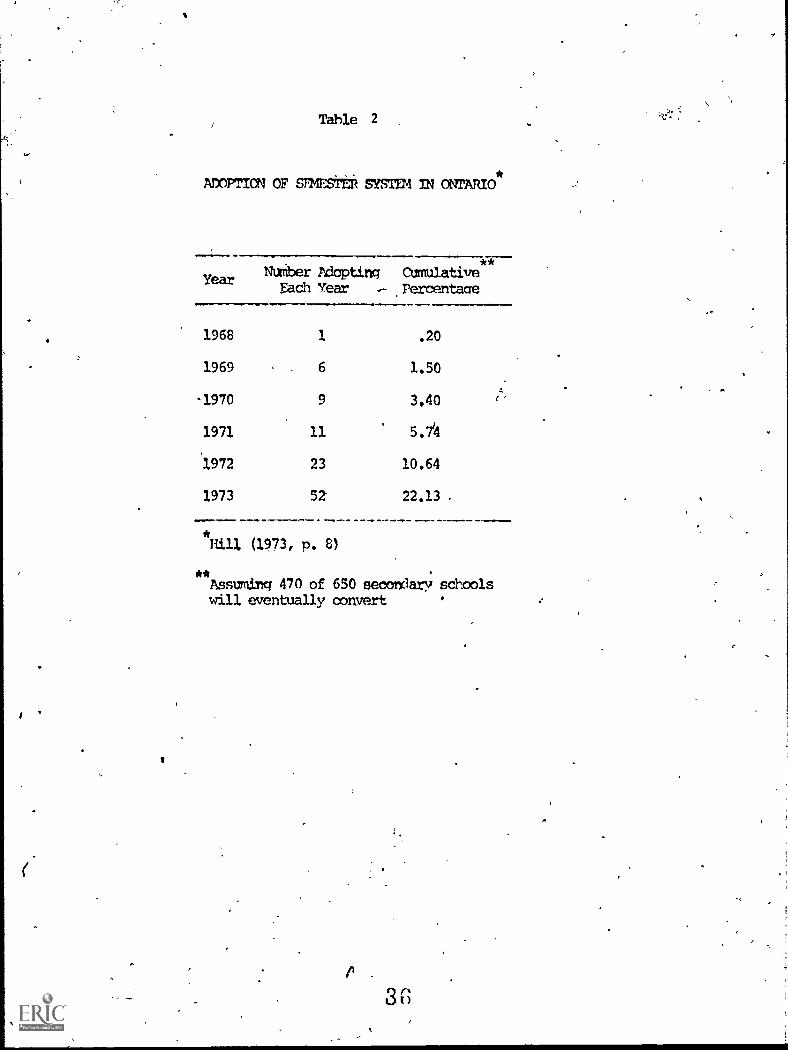
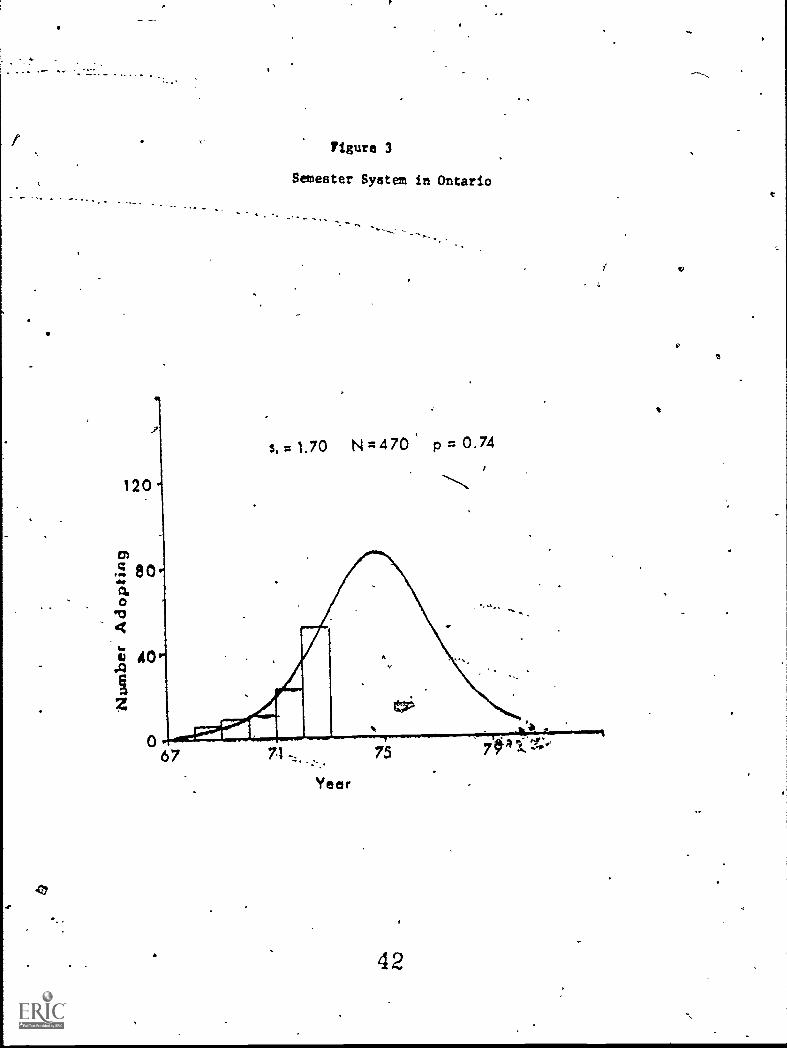
autocatalytic model to analyze data presented in Fable 2 on the conversion
17

-;16-4..
of Ontario secondary schools to the semester system of scheduling courses
(Hill, 1974). produces the results graphed in Figure 3, given the assumption
that all 470 high *schools responding in Hill's study eventually convert.
Note that 1974-75 and 1975-76 are predicted as peak years, with conversions
tapering off at the end of the decade.
Insert Table 2 and Figure 3 about here
If one 'assumes instead that the population of adopters for semestering
is only 250, then 1973-74 was the peak year for conversions, and that the
process will be completed by 1978-79. Regardless of which value of N is
used, p is quite large in comparison to consumer and commercial rate values,
equallAng .74 in the first case and .85 in the second. Note that from
historical data of a complete life cycle, all three parameters N, sl, and
p can be estimated statistically (in this case using a nonlinear estima-
tion procedure). In forecasting from very early data, however, it is
generally useful to fix N, based upon "outside" information. Otherwise, an
exponential curve would be calculated with N being infinite. In this
example, the fact N =I 470 yields a p with a smaller standard error than is
true for vs. .07) suggests that N = 470 is the more reasonable
t.
Foreca- ing the entire life cyclp of the adoption of an innovation is
perhaps the mo difficult, vet most important, use of the mbdel. In this
instance, opinion surveys might be used to estimate the potential number of
adopters (bq they boards, schools, or individual teachers) and the number
most likely to adopt the innovation in the first year. The rate constant
would normally' be taken as 0.8 for educational innovations, 0.65 for commer-
cial products, and 0.5 for consumer products, based on the historical data
18
-17--
noted earlier. One cannot expect perfect accuracy, of course, since fore-
casting is inherently difficult. If the size of the population of adonters
is grossly over- or-under- estimated, or the estimate of first year adopters
is very poOr, then 'the projected life cycle estimate will be very poor. In
education, sizes of adopter populations are in most cases reasonably easy
to estimate; e.g., there are about 650 high sChoola in Ontario, 100,000
teachers, etc. Admittedly', these are maximums which may be applicable in
some cases and not in others, but at least estimates can be made on some
basis. Perhaps the best approach is to use probability distributions for
I/population size, number of first yeai adopters, and p in order to produce,
a band of functions which contain the "true 'life cycle" with a certain
degree of probability.
. Using the autocatalytic model to study the "value" of an innovation
to the population of potential adopters is the final application that can
be made. If an innovation is so novel that the adopting population is
unable to appreciate its "true value", there will be no catalytic. forces/
to impelthe reaction. What would happen if demonstration projects were
initiated in a few schools, or if a concerted effort was made to publicize
those already having adopted the innovation? In essence, these steps
amount to increasing the number of first year adopters, sl, which is an
index of the perceived value of the innovation in the population as a
Awhole. Once one can Offect s
l'one can learn the effects on the life
cycle of doubling or tripling sl. In fact, It would be'seen that con-
siderable leverage is supplied by sl. If sasequent adoptions were below\s$.
that predicted on the basis of the artificially stimulated si, it would
be concluded the innovation was not highly valued by the adopting popu--11 /
lation.
19
-18-
Intuitive Development of the Autocatalltic Model
Underlying the autocatalytic model for adoption of innovatiqns is the.4
assumption that the innovations involved either provide an entirely new
function (e.g., public day-care for pre-school childrdn) or provide a
significantly altered method or capability with respect to established
functions (e.g., open-plan elementary schools). The basic problem under
consideration is the dynamic aspect of the adoption (or diffusion) process,
The process of unfolding adoptions may be viewed as the conversion'of a
population of ACt441 adopters., The nature and dynamics of this conversion
process determines the life cycle of an innovation.
Chemical kinetic,models are concerned with the conversion of-a popula-
tion of molecules of one type'into a population of molecules of another
type. !lased on some simple mechanistic assumptions, these kinetic models
predict the dynamic (i.e., time evolution), nature of the conversion process.
These same models have been adopted to the study of the dynamic behaviour
of animal populations and epidemiology.
Consider for the moment, that we have an experimental method for
teaching a subject,codename NEWSTYLE, that represents a radical departure
from previous methods (much as immersion French differs from the traditional,
grammatical, approach to language instruction). Given its cost, attractive-
ness, practidability, etc., there are some,numberts of teachers ,(or schools '
or boards, depending on, the appropriate 'unit of analysis) who( would ultimat'ely
adopt NEWSTYLE teaching if it were disseminated unchanged. This number, N,
is the population of adopters' and is generally unknown --and may in fact change
if, for example, a change in regulations make NEWSTYLE acceptable in another
jurisdiction,
At the instant NEWSTYLE teaching is announced to the educational community,
there are no adopters, only N potential adopters. However, with each passing
-19-
year, some number of these N potential.ad*ers decide to adopt...and are
thus converted into actual adopters. The time avolution,of thii conversion
generates ,the life cycle of NEWS1YLE teaching.
The nature of the conversion process, thoUgh not determined by the
model itself, is suggsted by the research of Carlson (1965), Rogers (1962;
1971) t_Eavelock (1970), Mort (1964), House (1974; 1976), and6thers. At
4
first, since there are no NEWSTYLE teachers, other teachers feel no pro-
feasional drive to adopt it. Alao, they have no opportunity to see other
teachers using it, no opportunity to discover it they "need" it. In this
situation, diffusioi will be inhibited by the lack of any social forces
encouraging its adoption. But then; a few innovittors, inddviduals who
1',have wide contacts and areAttracted toward new Methods, learn of NEWSTYLE,
decide to try it, and find it to their liking. AS more and more of their,
assoClates adopt NEWSTYLE, the inhibiting effect of isolation from NEWSTYLE
decreases a047ultimAtely vanishes. Thus, prieft adoptions catalyze (stimu'
late) later adoptions, Indeed, once the conversion procesi begins, it is
doubtful that it can be-stopped except by extreme action.
Although it is somewhat unflattering to edncati6nal innovators, the
analogy to the spread of A contagious disease, as suggested by Rogers, is
very helpful. Let adopting NEWSTYLE teaching be equated to catching Disease
X, In this framework, Nome number of people in Canada are "susceptible"
to disease X; let this number b= N, the number of adopters" of the disease.
The rest of the population is "immUne," for reasons that are themselves open
to investigation. Nothing occurs until some number of "carriers", denoted by
no, enter the population,' Thane carriers are not themselves 'victims"
(i.e.cadopters); they merely carry the disease and can communicate it to
"susceptibles" on ontict. In the educational community, these no carriers
represent_the effecte of dissemination by field agents, professors of

ed44ntion, Ministry personnel, leaders of profesaional'organitaiions,
salesmen, advertising, demonstrations, ete, They are not themselves reel
adoptions (i,e,iteachers using NEWT= in the classroom), but they do
provide social imutus by communicating the value of NEWSTYLE to the popu-
lation of potential adopters and by creating the appropriate imagery that
makes NWSTYLi appealing (e,g., NEWSTYLE teachers are leaders). ,That is,
they catalyze susceptibles into adopting NEWSTYLE.
If S(t) is used to denote the cumulative number of people who become
"ill" (adopt) by year t, then the number who become "ill",(adopt) in the-
first year ought to be some fraction of the N "susceptibles" who c46me into4
contact with the "carriers", If Oneassumegthat the likelihood of a
"susceptible" cony, ting.a carrier is proportional to the number of "carriers ",
then
S(1) = fx no;x N (1)
°where f is a proportibnality constant, no is the number of "carriers" and N
is the number of "susceptibles % Once,others'among the "susceptibles" have
become "ill" (addpt NEWSTYLE), they too paeommunicate the "disee" to
their fellow "susceptibles" (cause other teachers to adopt NEWSTYLE); once."ill", an individual becomes "immune" and cannot become "ill" (adopt) again.
/fence, the number becoming "ill" (adopting) during the second year alone,
p6q) - S(1), ought to be proportional to the number of remaining "susceptibles ",
N S(1), times the 4mber of effective "carriers", which now equals no + S(1)
since it includes thoi's catching the "disease" in the first year, That is,
#.
e. 5(2) z S(1) f x Eno + S(1)] x [N S('l)l (2)
Generalising to year t, the number who become "ill" (adopt) in year t should
be given by
- ,
S(t) S(t.l) = f is Cno+S(t-1): x [N-S(t-1)]
2?
(3)
'r-
-21-
In the limit, the difference equation in (3) corresponds to the differen-
tial equation fox a second' order autocatalytie reaction in chemistry. The
differential equation is
dS(t)/d(t) = fi.fno+S(W[N-S(0) (4)
. and it solution, whicgAndicates the number of people who will become "ill"
(adopt) by time t, i's,,) ,
S(t) = (N+no)/(1+(N/no)ePtj - no,
where p f*(N4no
) is defined to be the rate, constant. It can be shown.
( LdWton, 1974) that the number of "carriers" nocan be.determined from
the'size hf the population of adopters N, the rate copestplit p, and the
,number of first year adopters i(1) = sl. Intact,
vs
no = Ns1e-P/rN(1-eP)-s
1].
(5)
(6)
.Combining (2) and (3) yieldsa theoretical model foi cumulative adoptions
of any new innovation in which repeated adoption is not a significant' factori
or can be discounted. This model depends on the three basic parameters N,
s1
and'p. Given these three numbers, the entire unfolding of both cumulative
and annual adoptions can be computed.
The life cycle'for such an innovation is simply the derivative (rate
411
of change) of the cumulative number of'adopp.ons S(t). Thus, (2) and (3)e
provide a theoretical model for life cycles of innovations--the lapse between
introduction and total diffusion of an innovation. In particular, the life
cycle, or rate of adoption by "susceptibles", as a function of time, is
given by
S(t) = p(N+no)Q(t)/(1+Q(t)I2: (7)
where nois given by (6) and Q40- = (N/n )e-Pt. 1
23 ;

r rr
.-22-
Analysis Using the Autocata]ytic Model.
Next, the nature and,characteristics of the theoretical life cycle
model will be examined, followed by comparison of theoretical results with.,
those of actual life cycles.
First, consider the case of a Very innovative new practice. which will
eventually have a very large number of adopters (i.e., a very large N), but
which has only a very small number of adopters in the 'first year, relative
to the number of "susceptibles". That is, N. N. 'For example, N might be
50,000 and only y 500. In this case, the theoretical life cycle has the
bell-shaped curve shown in Figure 4. Doubling N simply doubles the height
of the curve without increasing its width, while doubling p simply halves
the width of the curve, making it more sharply peaked, thereby forcing all
adoptions to occur in half the time.
Insert Figure 4 about here
Next, consider the case where the number of first year adopters, sl,
is only about one-tenth the total number of adopters N (i.e., is an order
of magnitude less than N). This might occur, for example, when a new series
of learning kits is introduced by a publisher and a large number of the
company's regular clients order the first kit in the series. In such
cases,. one might have e000 kits adopted in the first year out of a total,
of 50,000 that would eventually be adopted. In this case, the theoretical
life cycle has the appearance'of a truncated bell-shaped curve.as seen
in Figure 5.
Insert -Figure 5 about here
24
4
S.
-0-
Doubling p still has the effect of halving, the length of the life cycle;
that is, it doubles the rate of adoption, with mite as many adopting in
a given year. Doubling the size Of N, however, is no longer a simple
doubling of,the height of the life cycle curve.
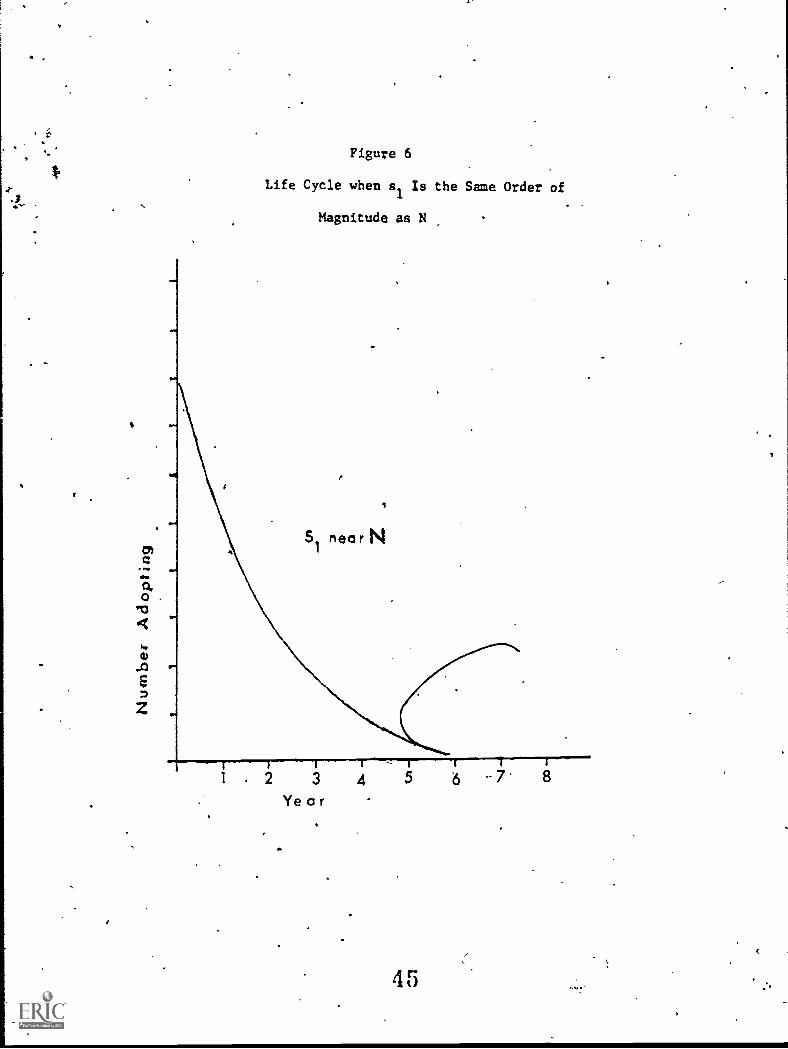
If si is lessthan an order of magnitude less than N (e.g., if,si is
only one-third of N the change in the life cycle curve is still more
striking. In this case, as seen in Figure 6, the life cycle takes on the
'r
chavacter of an exponential deca9 with the largest number of adopters in(1%. th2..
the first year. This situation might arise when the next issue.o.f...& series
of learning kits is introduced, and 20;000 kits are purchased by previous
users who are familiar with and pleased with the kits. Doubling p still /
has the effect of halving the life cycle, while doublipg N again simply
doubles the height of the curve.
Insert Figure.6 about here
It turns out, then, that the theoretical life cycle of an innovation
has the shape of a bell-shaped curve truncated from the left. The exponen-
tial life cycle in Figure 6 is just an extreme case in which only the right
tail of the bell-shaped curve remains. The degree of truncation depends
only on the numbet'of tint year adopters, al, relative to the total number
of eventual adopters N.
Besides the number of first year adoptions, there are two other promi-
. ,
neat features of an innovation's life cycle: 1) the time to reach max imum
111
,(peak) adoptions, and 2) the maximum number of annual adoptions. These two
properties of the life cycle are easily_ predicted from the three basic
parameters, N, sl and p. The relationships are derived in Lawton (1974),
and are summarized below.

-24-tt
TiMe to peak adoptions:
tmpA In(N/nO) --P(111(N) -.1n(n JA
Peak adoptions:
(8)
s(tm)em p(N4110)/4, . (9)
where no m Ns1e-P/ IN(1.4-P)vs 11
!
v
Application to Historical Datafi
As noted earlier, the autocatatytic life cycle model is only useful
since it displays the characteristics of actual historical life cycles
of the Adoption of innovations, This reasonable nature of the model has
baAn demonstrated in its 'application to gets of data selected from educe.
tioq, business and industry, Values of N, si and p were estimated using
nonlinear estimation techniques which gave values resulting in the closest
agreement between theorOttcal and historical life cycles. Presented
below are the life cycles for site educational innovations: that of a
seventh, aemestering in Ontario secondary schools, appears in Figure 3
presented earlier, In each case, actual data are plotted as a histogram
while the theoretical life cycle is given as A continuous curve.:-
The data for Figures 7 through Paare derived from Carlson (1965, p. 68)
using an Autorol curve Nader to obtain values from the graphical data he
presents,, The data, in percentages; are reported in Table 3: A cross
check using Modern Math data (Carlson, 1965, p. 1§) indicates any, errors
are negligible.
Insert Table 3 about here
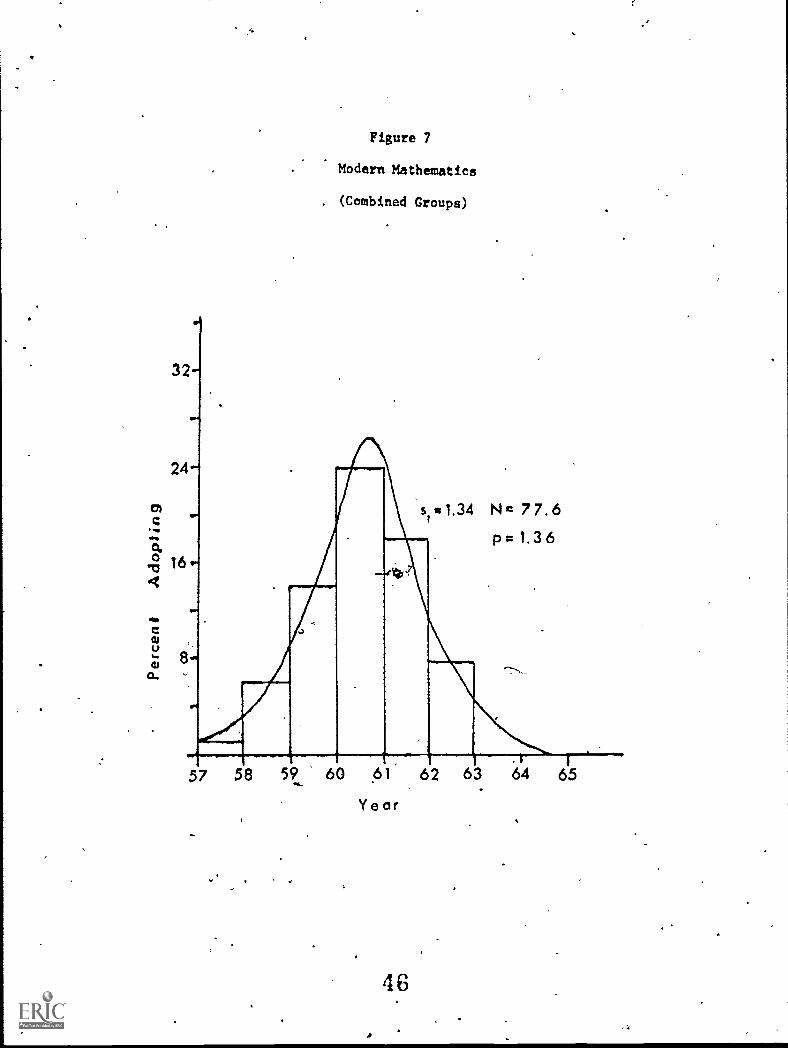
Figure 4 is concerned with the percentage of school boards adopting
o
Modern Mathematics in-Allegheny County, Pennsylvania, and the State of Meat
26

-25-
Virginia, Separate results from the two juriadiCtions are reported in
Figures 8 and 9, The rate constants for Allegheny County is considerably
larger than that for West Virginia, suggesting that there is A distribution
of rates under different "experimental ko1Tions". Discovery of the nature
of the differing conditions in the two contexts Affecting the rate ofl
diffusion is, at this point, a matter of speculation' In all caseat
there is an excellent fit between the historical data and theoretical model,
o
Insert Figures 7, 8, and 9about here
Restate for the teaching of Foreign Language in elementary schools
(Figure 10) are also excellent, as Are those for Accelerated Programa
(Figure 11), Programmed Instruction (Figure 12), and Language Laboratories
(Figure 13). Only the fit between the historical data for Team Teaching
f444.gbeliheoretical model for those in poor (Figure 14). Indeed, one
iremust conclude that,' in this one case, the autocatalytic model does not hold.
Whether failure of the model is due to the Setting, the particular innovation,
measurement error or whatever, cannot be determined. ,
11
Table 4 summarizes the estimates of parameters and their standard errors
fot six educational innovations, including Semestering but excluding Tea'
Teaching, Standard errors, shown in parentheses, are approximate but give
an inclination of how well'the Otrameters are determined. Since N was set
,for Semestering, its standard error was nbt estimated. In addition to the
perimeters And their errors, the table indicates the number of years to
peak adoption. Note that the shortest times--for modernmath and programmed
4exts--corresponds to the situations with the highest rate constants.
27
Th--"e4tes, Ps
-26-
for these educational innovations are plotted on a
continuous scale along side those for the business and industria1.sectors.
in Figure 15. 'The.cont:rast, to say the least, is startling. The educa-
tional innovations themselves fall into two groupings. Accelerated
Insert Table 4 about here
Insert Figures 10, 11, 12, 13,.14and 15 about here A
Program1p, Language Laboratories, Semestering,` gn Language for
elementary schools all have rates ranging from 0.7 much as do
industrial products. Programmed Instru n and Modern Mathematics,
on the other hand, have much higher rates, -ging about 1.3. . All.
educational rates are far higher,than thos umer products, and
:1 entrepreneurial innovations (which include.
'
f. the educational4-
examples reported here as well as those in the commercial sector), exceed
those for household innovations (limited to consumer products).
,,,,
Discussion /
Perhaps the most interesting insight the autocatalytic model gives
concerning the adoption of educational innovations is the variation in
rates of 'adoption for different innovations, the different rates for
sedifferent sectors outside education, and the different rates for household
and entrepreneurial innovations. Indeed, this ability to measure rates
meaningfully is perhaps its most useful feature for theoretical purposes,
though at this pofnt in time one can do little more than speculate about
the differing rates displayed in Figure 15. Answers are needed to the
28

1;
following questions.
-27-
Why.are educationpl rates of adoption so high in comparison to those
in other sectors? One possibility might'be the nature of the adopting
unit. In education, 118 in industry which also displayed higher rates, the
school or school board is often the unit studied. Rogers(1971) notes the
deed for study of "authority decisions" to adopt innovations within formal
organizations. Organizations are smaller in number than are individual
consumers, and presumably their members,' knociledge about innovations is-r
better, especially those individuals, whose job'it is to ensure that the
organization adapts to changes in the environment.
This view is supported by House's (1e4) classification of innovations
as entrepreneurial and household. With stronger social and economic -
factors affecting the entrepreneur located in,an organization, one would
expect rates for the formen to exceed those for-the latter. Though no dataP
for household innovations im education are reported here (i.e., those for
which the teacher alone is the appropriate adopting unit), one might surmise
such rates would be lower .than for those innovations adopted at the school
or board level. Of course,. iF the rewards accruing to teachers who innovate
are as low as House suggests, ex±nples of genuine household innovations in
education may be too rare for sufficient data to be collected to test the
hypothesis.
Yet; how is it that the Mort s udies concluded that innovations were
slow to be adopted in the schoOls? His finding is in direct contradiction
to our finding that rate constants are higher for schools than for any
consumer product, and-are higher than-. for most industrial innovations.
There are no clear answers to this.paradoX, but we would suggest three
explanations. First, the Mort studies were not comparative in nature.
29

-28f-
While they concluded innovation in education was slow to take hold,. they
may have ignored the fact it was slower elsewhere. Second, Mort tended to
concentrate on a national perspective, whereas the data analysed here are
for much smaller populations. Using the disease analogy, a virus does not_
spread within a given population until it has first invaded it--though it
may be ravaging other groups. Thus, the spread of a disease may be. much
slower within a whole nation, due to internal barriers, than)
in aAprovince'or county. So too might an innovation spread more slowly
from the national perspective. Finally, an explanation may be found In
the secular changes betwen the time when most of the Mort studies were
completed and the dates of the data studied here. The past fifteen years
have seen far greater. commitment of public funds to education than was true
between 1930 and 1960 -nd money tends to stimulate change and innovation
(House, 1976). Thus, 'delay in accepting new educational practices may
actually have decreased since the Mort studies began.
To many, this last interpretatioh might be encouraging since inno-
vation and change in-education have often been treated as "good" while
maintenance of traditional methods have been viewed as "bad". But, under-.
neath the sermons advocating neW'practices, has always been to spectre of
fsdism. Was Modern Mathematics a thoughtful reform of curriculum, or a fad
adopted to please critics? Is semestering in Ontario a fad which will die
out in a few years, or 4 genuine reform in the scheduling of classes and
courses? And what is more, 'does it really matter, one wav or the other?
Is.there a morality of innovation'
Tho rate constant of the autocatalytic model may prove'to be one
index useful in distinguishing fads-.or reforms adopted in fad-like fashion- -
from Mime substantial changes tntroducec after adequate planning. It is
our suspicion that any product, or practAce which is introduced With such
30
-29-
rapidity that its rate constant exceeds one can only be thought, of as a
fad. The,history of modern math and the difficulties that followed its
premature introduction into schools which lacked teachers trained in the
subject and adequately prepared pupils, tend to confirm this view, as does
the brief life of programmed texts in most schools. This is not to say
that neither of these two innovations has its merits; it merely suggests
that they were superficially adopted for their symbolicalue to prove
modernity, while the:changes their genuine use would require were ignored
o' left to be worked out, In a sense, they were "adopted" but not "imple-
mented ", The danger of such fadism is apparent, for it clearly endangers
. the reputation of valuabj,e innovations which may be discredited by too
hast/edoption for the wrong reasons. To be sure, some amount of imagery
is necessary in education; but education is too fundamental to society to
survive on imagery alone, Thus, introduction of new practices requires a
depth of preparation probably precludes extremely short life cycles--and
-*,-extremely large rate constants, "LT.Jhe vocational structure itself
becomes s major impediment to innovation," House (1974, p. 260) notes in
,
describing Junossey's (1966) analysis of the relationship between techno..
rlogical innovation and economic development.
dLT,,he vocational structure
changes by the training or retraining of those already in the vocation or
by entry of newcomers into it (House, 1974, p, 260)," But this is a slow
process, and may extract A heavy human toll by requiring retraining of
individus1S, The individual's "skills become increasingly obsolescent.,,.
The process of innovation requires that workers not use acquire_ d knowledRe
and skills, but continually Ieititiftel.; ones (II, 261)."
14 appears, then, that exceedingly high rate constants for innovations
reveal fads or superficial adoption of innovations. but fail to assist in
assessing the true worth, in educational terms, of the innovations involved.
31
-30-
Further, investigation of the same entrepreneurial innovation in different
settings would reveal a distribution of rate constants which, when'related
to various sociological, psychological and economic variables, might pro-
vide insight into the effect of contextual factors on the rate of adoption,
of educational innovations. Similarly, by studying the rates for different
innovations in the same setting, it may be possible to distinguish classes
of innovations, In Own, comparative analysis of rate constants may prOve'
a useful starting point for further investigations of the diffusion/
Adoption/implementation process itself, Finally, one must beware of the
"cult of moderiam" which tends to assume that all innovations are goods
one must look at the human costs and learn to weigh these, so that bene-
ficial change can be distinguished from changes made for the sake of change,
or for the advantage of those who are not directly affected,
32

REFERENCES
Bailey, Norman T. The Mathematical Theorj of Epidemics. New York:
Hefner, 1957.
Bass,'Frank M. "A New Product Growth Model for Consumer Durables,"
Management_Science, 15, 5, 1969, pp. 215-229.
Carlson, Richard O. Adoption of Educational innovations. Eugene,
Oregon: University of Oregon, 1965.
Dodds, Wellesley "An Application of the Bass Model in Long-Term
New Product Forecasting," Journal of Marketing Research,
August 1973, pp, 308-311.
Havelock, Ronald G. Planning for innovation through Dissemination and
Utilization of Knowledge. Ann Arbor: Institute for Social
Research, University of Michigan, 1970.
Hill, Peter L. "A Review of the Extent to which Schools Are Being
Organized on the Semester System in Ontario," Haiiiiton,
Ontario: 'McMaster University. Unpublished paper,, 1973.
"Semestering and Its Impact on Ontario," The OSSTF.--,
Bulletin, 54, 3, May 1974, pp. 199-203.
House, Ernest R. The Politics of Educational Innovation.
Berkeley: McCutchan, 1974.
"The Micropolitics of Innovation: Nine Propositions,"
Phi Delta Kapp an. 57(5) January, 1976; pp. 337-340
Janossy, Fernene The End of the Economic Miracle,
Whi e Plains, N.Y: 'international Arts and Science Press, 1966.
1
Katz, E., L in: M.L., and Hamilton, H. "Traditions of Researci on the
Diffusion of Innovations," American Sociological Review,
28, 2, 1963, pp. 237-252.' (Published version.of conference papers
by Katz and Levin, 1959).
33

-32-
Lawton, William H. "Notes on an Autocatalytic Model for the Adoption of
Innovative Practices and Products," Rochester, New York, 1974.
Unpublished notes:
Mansfield, Edwin "Technical Change And the Rate of Imitation,"
Econometrica, 29, pp. 741-766.
Mort, Paul R. "Studies in Educational Innovation from the Institute of
Administrative Research: An Overview." Chapter 13 in Miles
Miles, Mathew B. Innovation in Education. New York: Teachers
College, Columbia, 1964, pp. 317-341.
Nevers, John V. "Extensions of a New Product Growth Model," Sloan
Management Review, Winter 1972, pp. 77-91.
Pederson, Paul Ove. "innovation within and between National Urban Systems."
Geographical Analysis; 2, 3; July, 1970: pp 203-254.
Rogers, Ev Tett M. Diffusion of Innovations. New York: The Free Press, 1962.
, and Shoemaker, F. Floyd. Communication of Innovations. (2nd ed.)
New York: The Free fress, 1971. (Originally published as
Diffusion of Innovations).
Sienko, Michell J. and Plane, Robert A. Chemistry (2nd. ed.)
New York: McGraw-Hill, 1961.
34

Table 3.
PREDICTLV VERSUS ACTUAL TIME AND
-1411123DUDE OF SALES PEAK *
Product / Technology
PredictedTime of
Peak (no.of periods)
ActualTime of
Peak (nolof periods)
PredictedMagnitude
of Peak
ActualMagnitude
of Peak(Units) (Units)
Boat Trailers 9.8 10 205,240 206,000
Color TV, Retail 6.0 8 5,733,400 5,490,000
Color TV, Manuf. 5.8 7 6,637,800 5,981,000
,Holiday Inns 10.9 11 . 131.6 141
Howard Johnson Mot. 9.0 -11 38.6 48
Howard Johnson. Hol. 9.8 11 202.6 216Inn, & Ramada Inn
.
McDonald's '55-'65 6.1 6 119.7 113 iCont. Bleach Range 3.2 4 16.7 18
Rapid Bleach 4.1 4 7.2 7
Conversion, 70 percent 3.3 4 48.5 50
H202 delivery system
Hybrid Corn 3.1 4 24.5 23
*Never-s (1972, p. 88)
35
S
I
Table 2
ADOPTION OF SYSTEM IN ONTARIO
YearNumber Adopting
Each yearCumulative"Percentaae1/11.
1968 1 .20
1969 , 6 1.50
-1970 9 3.40
1971 11 5.74
1972 23 10.64
1973 52 22.13 .
11Hill (1973, P. 8)
**Assuming 470 of 650 seconlary schoolswill eventually convert
t

9
Table 3
CUMULATIVE PERCENT= ADOPT/ON OP /NNOVATIMS, -.0.11.1.........
Year ModernMath
ForeignLanguage
AcceleratedProgram
ProgrammedInstruction
LanguageLabs
TeamTeaching
4,./,^11,41111,p .... -argr..41952 1.25 .67
1953 ° 2,02 1,15
1954 2.88 3.26
1955 3.36 3,55
1956 4.70 6,14 1.06
1957 8.26 8.35, 1.82
1958 .77 11.62 25.15 1.92 2.78 2.88
1959 5.95 17.86 36.19 3.26 7.10 4,80
1960 20,54 23,81 50,59 12.29 18.14 6.43
1961 44.93 30,05 57,02 25.24 24.38 9,79
1962 65.66 34.94 63,17 42.82 36.19 18.05
1963 74.11 36.19 64,32 49.25 45.12 20.45
- 114....."..""-- Me.,11.Carlson (1965, p.68)
37

Table 4
ESTIMATES OF PARNAETERS AND STANDARD ERRORS npR
PI TICML flThD/ATION LIFE CYCLES
Innovation N S.E.(N) S.t.(07;, si* g S.E.(si ) Years toPeak
Modern !lath
rodern Math
77.6% 0.6 1.36 0.03, 1.34% 0.09 3.8
Virgnia) 17 0.33 1.02 0.06 1.231
0.10
Modern Math
(Allegheny) 39 0.34 , x, 1.31 0.04 1.23 0.05
Foreign
Language 39.4% - 0.64 0.04 0.30% 0.05 7.5
IAcceleratedProgram 65.0% 1.7 0.91 0.07 0.21% 0,07 6.7
ProgrammedInstruction 54.0% 2.6 1.25 0.13 0.86% ,0.26 4.0
LanguageLabs 56.3% ° 6.5 0.77 0.11 0.54% 0.09 6.2
SemesterSystem 470 0.74 0.04 1.70 0.29 7.7
.....Parameter estimates with nertentage signs (%) are reported in term of
the percentage Of the total possible adopters who would eventually adopt.
Other parametei values for N and are in actual frequencies.
3 8

Captions for Figures
Figure Number
1
2
3
Caption
Life Cycle of NEWSTYLE Teaching
Cable TV Subscribers in United States
Semester System in Ontario
4 Life Cycle when sl Is Several Orders:
than N
1 5 Lyfe Cycle when el Is Only an Order of
Magnitude Less than N
6 Life Cycle when sl Is the Same Order of
Magnitude as N
8
9
Modern Mathematics (Combined Groups)
Allegheny County Modern Mathematics
West Virgnia Modern-Mathematics
ro,
10 Foreign Language in Elementary Schools
11 Accelerated Program
12 Programmed Instruction
13 Language Laboratories
14 Team Teaching
15 Comparison of Rate Constants
39
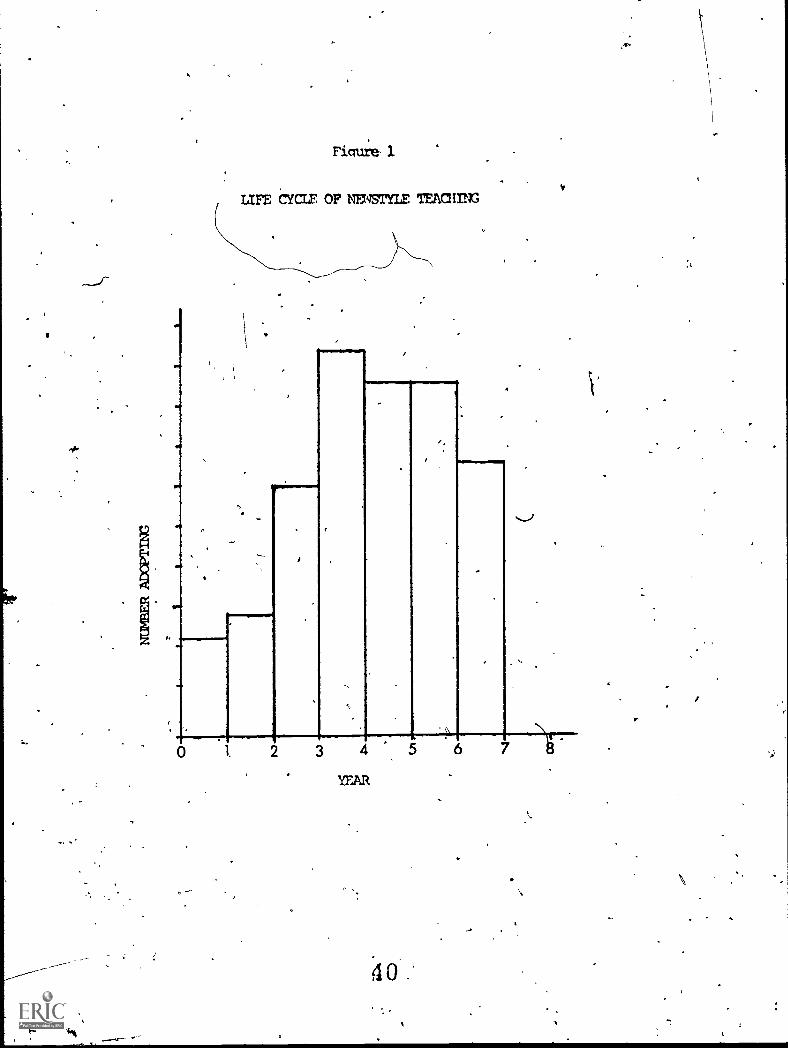
FicTure 1
LIFE CYCLE or NE STYLE 'maimi
Mb
11.
1111.1mW
1 2
4
4
YEAR
7
v
\
Y
/
':.
. 4 -
--
S
0-o<tii.0E
Z
Figure 2
Cable TV Subscribers in United States
S.
..."
e.
Year
120
Figure 3
Semester System in Ontario
51 1.70 N=470 p =0.74
rn
IF. 80
O
4
AO
z0
67
47,
7.1 75
Year

i
Figure 4
Life Cycle when al IA.
Several Orders of
Magnitude Less Than N
s1« N
1 2 3 4 5 6 7 8
Year
43
.r

Owl
to
4
.0
E
z
Figure 5
Life Cycle when 81 Is Only an Order of
Magnitude Less Than N
s N1
t I I1 2 3. 4 5 6 7 8
Y ear
44
1.1
cmc
.0
.04I,a)
.0EnZ
Figure 6
Life Cycle when si Is the Same Order of
Magnitude as N
s
S1
near N
1 I I - 1 I-
i 2 3 4 5 61
7Year
45
IP*
24^
Figure 7
Modern Mathematics
. (Combined Groups)
s 1,34 Nc 77.6p= 1.36
11W
57 58 59 60 61' 62 63 64 65
Year
6

Figure 8
Allegheny County Modern Mathematics
12
0-0 8
s=1.23 N:39.1 pr. 1.31
57 61 65- 69
Year
A
47
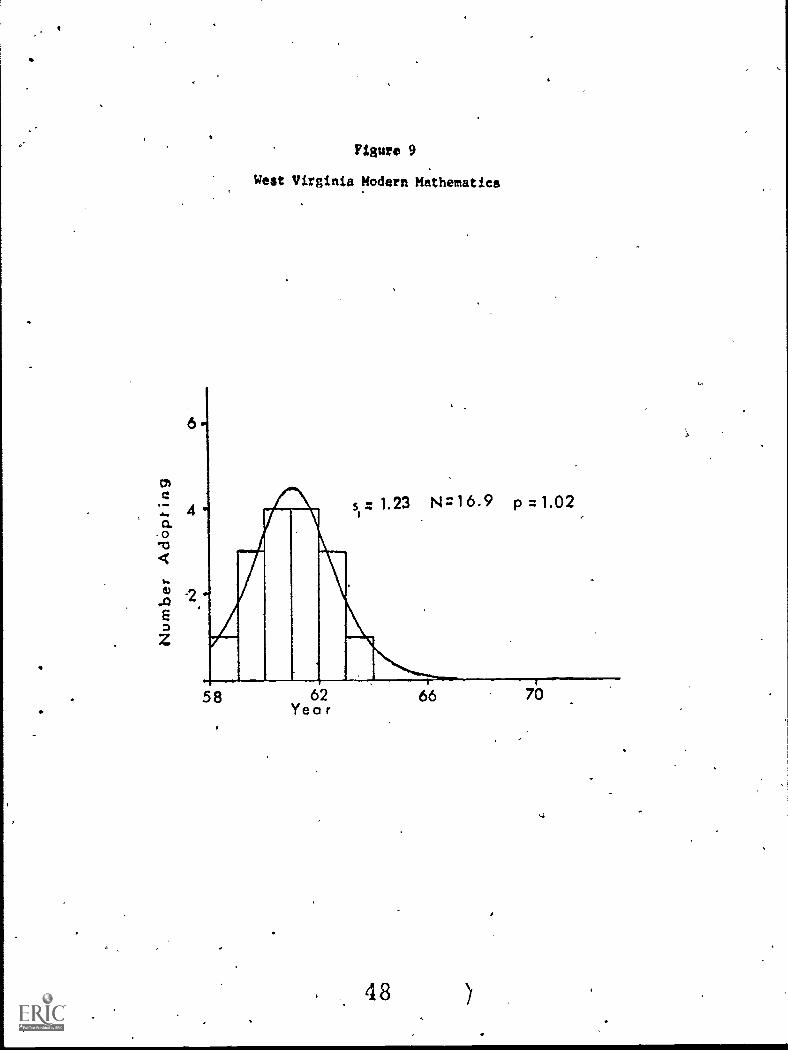
Fisure 9
West Virginia Modern Mathematics
y: 1.23 N:16.9 p :1.02
58 62Yearr
48
66
)
io

,$
8
6
Figure 10
Toreignanguage in Elementary Schools
/ss= .30 N =39.4 p = .64
. .52 60 68 76
Year
CA
49
,./

111.1.ms
16 -
Figure 11
Accelerated Pr4744
52 60
Year68 76

1
.,
r
Figure 12
Programmed Instruction
,
s1
r. , 86 Ni= 54.0 p.: 1,25
57 65
Year
73-/

, /
I
12
0
Figure 1.3
Language Laboratories
4s
WNW
s "I 54 N g 56.3 p:-..77
55 63
Year
71
52
79
r

4I
,,,
4
T 4'
a 09
Ow
qari.,...
.*
V.I.
/, 0 or, rs.r.
Figure IA
Team Teaching
.... ----",
s r. 1.66 N = 46.7 pq .45I
57 65 73 . 81
Year
,0:

14-.
00
.1.2
1.0
0.9
,. '0.7
4
ass
0.5
0.3
-
,Figure 15 .-4,
roPton'Tsrtt OF RATE rtItisrmrs
MobFrY.4 VIATIT".ATTcS
PTIMPAKIk Tr) rIsTitrryTi
ACCr.LFRA74 PRMR/Vr,
LArruAsr....TAPORNMPIT'SSE"..41:STFT SYSTEM..
FORT ICI*1 Tir.r;uAcrRapid Bleach Process Usitrs
Colour Television
Cable TV SubscribersReel Tape RecordersMcDonald's Franchises'Roam Air Conditiohers.
LP Record PlayersStereo Record PlayersBlack and white Television
Freezers ,T
...
Key
4111' rrlucational Innovations
Carrercial/industrkal
Oil relnstrrx Produc.t
-
. "
v
r
a.