Cognitive flexibility in autism spectrum disorder: Explaining the inconsistencies?
Upload
khangminh22Category
view
1download
0
Autism Spectrum Disorders in Tanzania: Awareness,
Diagnosis, Risk Factors and Endophenotypes
by
Kavita Ruparelia
Open University, UK
KEMRI-Wellcome Trust Research Programme, Kilifi, Kenya
Collaborating Establishment: Department of Paediatrics and Child Health,
Muhimbili University of Health and Allied Sciences, Dar-es-Salaam, Tanzania
Supervisors
Prof. Charles Newton (Director of Studies)
KEMRI-Wellcome Trust Collaborative Programme, Kilifi, Kenya and
Department of Psychiatry, University of Oxford, Oxford, United Kingdom
Prof. Amina Abubakar
KEMRI-Wellcome Trust Collaborative Programme, Kilifi, Kenya and
Institute for Human Development, The Aga Khan University, Nairobi, Kenya
Prof. Karim Manji
Department of Paediatrics and Child Health,
Muhimbili University of Health and Allied Sciences, Dar-es-Salaam, Tanzania
A thesis submitted for the degree of
Doctor of Philosophy in Psychology
May 2020

ii
Abstract
Autism Spectrum Disorder (ASD) is common worldwide, but little is known of the condition in sub-
Saharan Africa (SSA). I set out to study the lived experiences, identification, risk factors and
phenotypic expressions of ASD in Dar-es-Salaam, Tanzania.
I conducted a systematic review of the Broader Autism Phenotype (BAP) in biological parents of
ASD probands. I conducted a qualitative study using 7 focus group discussions and 13 in-depth
interviews to investigate the knowledge and lived experiences of 14 caregivers of children with ASD
and 37 key community informants. I screened 284 children (108 had ASD, 60 had other
neurodevelopmental disorders (NDD) and 116 were typically developing (TD)), and used these
groups of children to validate the Social Communication Questionnaire (SCQ), and for determining
risk factors for ASD. Psychometric properties were examined, and risk factors determined in
multivariable models. I further assessed BAP traits of 267 parents (of 103 children with ASD, 57
children with NDD and 107 TD children) exploring the psychometric properties of the Autism
Spectrum Quotient (AQ).
The systematic review identified social/communication deficits, rigid/aloof personality traits, and
pragmatic language difficulties as useful socio-behavioural endophenotype traits. The qualitative
study identified consistent emerging sub-themes: knowledge/awareness in the
identification/presentation of ASD, its‘ perceived causes, and the challenges experienced by
caregivers and community stakeholders. The Kiswahili SCQ showed between acceptable and
excellent reliability (Cronbach‘s (α)=0.65-0.92) and supports a 2-factor model of combined social
interaction and communication, and repetitive behaviours, recommended by DSM-5 criteria. Early-
life malaria was associated with the greatest independent risk for ASD, being more common among
the ASD (31%) than TD group (4%). The Kiswahili AQ had acceptable reliability (Cronbach‘s
α=0.84) for all items. The BAP in parents of children with ASD (53%) was higher than for those with
NDD (21%) or TD (16%), suggesting BAP are particularly characteristic of ASD.

iii
Om Shri Sai Nathay Namah
Om Sai Namo Namah, Shri Sai Namo Namah, Jay Jay Sai Namo Namah, Satguru Sai Namo Namah
Dedicated with Humble Pranams at the Divine Lotus Feet of my Dear Guru Sri Shirdi Sai Baba
May Sai and Lord Ganesha lead these army of words

iv
Acknowledgements
I am sincerely grateful for the support and guidance that I received from a number of people without
whom this dream would never have been accomplished.
I am especially grateful to my Supervisor and Director of Studies Prof. Charles Newton for giving me
this opportunity and for excellently scaffolding my learning process of academic writing, and for
encouraging my development as a researcher and independent thinker. Prof. Newton has been an
outstanding mentor and I thank him for his support and wisdom throughout the course of this PhD.
Special thanks go to Prof. Amina Abubakar for her supervision, training and for generously offering
her knowledge and solid advice on all aspects of the research process. I thank Prof. Karim Manji for
his supervision, support and his guidance with obtaining ethical approvals, and whose help greatly
eased the difficult recruitment process.
I am thankful to the many children, families and community representatives that took part in this
study for their time and invaluable contributions. I appreciate the field workers Ella Mgalla and
Rajabu Kashakiri for their invaluable help with data collection and administrative support. Further, I
would like to thank Muhimbili National Hospital, in particular Dr. Frank Masau and Mama Matowo
for their assistance with the recruitment process.
I gratefully acknowledge funding from The Scott Foundation that made my PhD work possible. I am
thankful to the Training Department at KEMRI-Wellcome Trust Research Programme (KWTRP), in
particular Dr. Francis Ndungu, Dr. Sam Kinyanjui, Liz Murabu and Dorcas Mbuvi for their
administrative support and for providing me opportunities for training throughout my registration. I
extend my gratitude and appreciation to the team at the Neuroscience Department at KWTRP, in
particular Dr. Joseph Gona for sharing his knowledge and experience of qualitative data collection,
Dr. Symon Kariuki for his availability for academic discussions during my time in Kilifi and his
sincere guidance with statistical analysis and structuring of my thesis, Paul Mwangi for his support
with statistical analysis, and Judy Tumaini for the logistical support during my trips to Kilifi. Special
thanks go to Prof. Petrus de Vries from the University of Cape Town, for the training in the
administration and coding of the revised Autism Diagnostic Observation Schedule (ADOS-2).
I am thankful to my amazing friends for their constant encouragement and positivity. I will be forever
grateful to my mum and dad for their unconditional support in all my pursuits and my brother Miral
for inspiring me through our shared love of science. I am sincerely grateful to my parents in law,
Mama Viju and Baba Gautam for their unwavering support throughout my PhD journey. I am deeply
thankful to my son Neel whose warmth, curiosity and larger than life character has inspired me to

v
keep going, and my sweet daughter Keya, who was born during this PhD, for being such a delightful
baby, and making it possible for me to complete what I started. I will always be grateful to my
husband Prem, for his unfaltering encouragement, faithful support and for his constant reminder: ―of
course you can do it!‖ … Thank you! I am blessed.

vi
Table of Contents
List of Publications .............................................................................................................................. xi
List of Tables ....................................................................................................................................... xii
List of Figures ..................................................................................................................................... xiv
Abbreviations ...................................................................................................................................... xv
Chapter 1: Introduction ......................................................................................................................... 1
1.1. Definition, prevalence and burden of ASD .................................................................................. 1
1.2. Review of current literature on ASD in SSA ............................................................................... 2
1.3. Screening for ASD ....................................................................................................................... 3
1.4. Risk factors associated with ASD ................................................................................................ 6
1.5. Endophenotypes of ASD ............................................................................................................ 11
1.6. Study rationale ........................................................................................................................... 11
1.7. Objectives................................................................................................................................... 12
1.8. Structure of the PhD thesis ......................................................................................................... 13
Chapter 2: Systematic review on ASD and endophenotypes .............................................................. 15
2.1. Background ................................................................................................................................ 15
2.2. Review methods ......................................................................................................................... 16
2.2.1. Data sources and search strategy ........................................................................................ 16
2.2.2. Data search criteria ............................................................................................................. 18
2.2.3. Data extraction .................................................................................................................... 19
2.2.4. Effect sizes .......................................................................................................................... 19
2.3. Results ........................................................................................................................................ 19
2.3.1. Search results ...................................................................................................................... 19
2.3.2. Results of literature extraction ............................................................................................ 20
2.3.3. Socio-behavioural domain .................................................................................................. 20
2.3.4. Cognitive domain ................................................................................................................ 26
2.3.5. Other psychiatric conditions domain .................................................................................. 33
2.4. Discussion .................................................................................................................................. 33
2.4.1. Summary of findings........................................................................................................... 37
2.4.2. Emerging themes ................................................................................................................ 41
2.4.3. Measure quality ................................................................................................................... 41
2.4.4. Methodological limitations of studies ................................................................................. 41
2.4.5. Limitations and future directions ........................................................................................ 42
2.4.6. Conclusions ......................................................................................................................... 43
Chapter 3: Study design and general methodology ............................................................................. 44
3.1. Study setting ............................................................................................................................... 44

vii
3.2. Study design ............................................................................................................................... 44
3.3. Sample size determination ......................................................................................................... 45
3.3.1. Validation of the SCQ study ............................................................................................... 45
3.3.2. Risk factor study ................................................................................................................. 45
3.3.3. BAP study ........................................................................................................................... 46
3.4. Assessment measures ................................................................................................................. 46
3.4.1. ASD screening meausres .................................................................................................... 46
3.4.2. Additional tools used to aid confirmation of the diagnosis of ASD in probands................ 46
3.4.3. BAP study ........................................................................................................................... 47
3.4.4. Socio-demographic questionnaire ....................................................................................... 47
3.4.5. Neuropsychological testing ................................................................................................. 48
3.5. Training ...................................................................................................................................... 49
3.5.1. Phase one: Qualitative study ............................................................................................... 49
3.5.2. Phase two: Main case-control studies ................................................................................. 49
3.6. Translation of measures ............................................................................................................. 49
3.7. Ethical considerations and informed consent ............................................................................. 50
3.8. Sampling and data collection procedures ................................................................................... 51
3.8.1. Phase one: Qualitative study ............................................................................................... 52
3.8.2. Phase two: Main case-control studies ................................................................................. 52
3.9. Data management and statistical analysis .................................................................................. 54
3.9.1. Phase one: Qualitative study ............................................................................................... 54
3.9.2. Phase two: Main case-control studies ................................................................................. 55
Chapter 4: Awareness and lived experiences of families of children with ASD and community
stakeholders in Dar-es-Salaam, Tanzania ............................................................................................. 57
4.1. Background ................................................................................................................................ 57
4.2. Methodology .............................................................................................................................. 58
4.2.1. Study sample ....................................................................................................................... 58
4.2.2. Procedures ........................................................................................................................... 59
4.2.3. Data management and analysis ........................................................................................... 60
4.3. Results ........................................................................................................................................ 60
4.3.1. Knowledge and awareness of ASD: Identification and presentation .................................. 63
4.3.2. Knowledge and awareness of ASD: Perceived causes ....................................................... 64
4.3.3. Challenges ........................................................................................................................... 66
4.3.4. Recommendations ............................................................................................................... 69
4.4. Discussion .................................................................................................................................. 70
Chapter 5: Evaluation of the psychometric properties of the Lifetime version of the Kiswahili SCQ in
Dar-es-Salaam, Tanzania ...................................................................................................................... 73

viii
5.1. Background ................................................................................................................................ 73
5.2. Methodology .............................................................................................................................. 77
5.2.1. Study sample ....................................................................................................................... 77
5.2.2. Assessment measures .......................................................................................................... 78
5.2.3. Translation of measures ...................................................................................................... 79
5.2.4. Procedures ........................................................................................................................... 80
5.2.5. Statistical analysis ............................................................................................................... 80
5.3. Results ........................................................................................................................................ 81
5.3.1. General sample description ................................................................................................. 81
5.3.2. Distribution of SCQ scores by group .................................................................................. 82
5.3.3. SCQ reliability .................................................................................................................... 88
5.3.4. SCQ validity ....................................................................................................................... 89
5.3.5. Diagnostic accuracy of the SCQ ......................................................................................... 90
5.4. Discussion .................................................................................................................................. 92
5.4.1. Discriminant validity .......................................................................................................... 92
5.4.2. Participant sex and respondent effects ................................................................................ 92
5.4.3. Reliability of the SCQ ......................................................................................................... 93
5.4.4. Validity of the SCQ ........................................................................................................... 93
5.4.5. Sensitivity and specificity of the SCQ ................................................................................ 94
5.4.6. Strengths and limitations .................................................................................................... 94
5.4.7. Conclusions ......................................................................................................................... 94
Chapter 6: Risk factors associated with ASD in Dar-es-Salaam, Tanzania ........................................ 96
6.1. Background ................................................................................................................................ 96
6.2. Methodology .............................................................................................................................. 98
6.2.1. Study sample ....................................................................................................................... 98
6.2.2. Procedures .......................................................................................................................... 98
6.2.3. Definition of investigated risk factors ................................................................................. 99
6.2.4. Statistical analysis ............................................................................................................. 101
6.3. Results ...................................................................................................................................... 101
6.3.1. ASD vs. TD groups ........................................................................................................... 107
6.3.2. ASD vs. NDD groups ....................................................................................................... 113
6.3.3. NDD vs. TD groups .......................................................................................................... 118
6.3.4. Combined ASD + NDD vs. TD groups ............................................................................ 125
6.4. Discussion ................................................................................................................................ 132
6.4.1. ASD vs. TD summary of findings .................................................................................... 132
6.4.2. ASD vs. NDD summary of findings ................................................................................. 135
6.4.3. Strengths and limitations................................................................................................... 136

ix
6.4.4. Conclusions ...................................................................................................................... 137
Chapter 7: Assessing the BAP: Cross-cultural validation of the Kiswahili AQ in a Tanzanian parent
sample ................................................................................................................................................. 138
7.1. Background .............................................................................................................................. 138
7.2. Methodology ............................................................................................................................ 142
7.2.1. Study sample ..................................................................................................................... 142
7.2.2. BAP measure .................................................................................................................... 142
7.2.3. Translation of the AQ ....................................................................................................... 143
7.2.4. Procedures ......................................................................................................................... 143
7.2.5. Statistical analysis ............................................................................................................. 143
7.3. Results ...................................................................................................................................... 144
7.3.1. General sample description ............................................................................................... 144
7.3.2. Distribution of AQ scores by group .................................................................................. 145
7.3.3. AQ reliability .................................................................................................................... 153
7.3.4. AQ factorial structure ....................................................................................................... 154
7.3.5. Proportion of parents with BAP, MAP and NAP ............................................................. 154
7.4. Discussion ................................................................................................................................ 155
7.4.1. Discriminant validity of the AQ ....................................................................................... 155
7.4.2. Reliability of the AQ ........................................................................................................ 156
7.4.3. Factorial analysis of the AQ ............................................................................................. 156
7.4.4. Proportion of parents with BAP, MAP and NAP ............................................................. 156
7.4.5. Strengths and limitations .................................................................................................. 157
7.4.6. Conclusions ....................................................................................................................... 157
Chapter 8: Synthesized discussion .................................................................................................... 158
8.1. Background .............................................................................................................................. 158
8.2. Overview and interpretation of findings .................................................................................. 159
8.2.1. Systematic review ............................................................................................................. 159
8.2.2. Awareness and lived experiences of ASD ........................................................................ 160
8.2.3. Psychometric properties of the SCQ ................................................................................. 161
8.2.4. Risk factors associated with ASD ..................................................................................... 162
8.2.5. Psychometric properties of the AQ .................................................................................. 164
8.3. Public health significance of the findings ................................................................................ 165
8.4. Study strengths and limitations ................................................................................................ 165
8.5. Directions for future research................................................................................................... 167
8.6. Conclusions .............................................................................................................................. 167
List of References .............................................................................................................................. 169
Appendices ......................................................................................................................................... 193

x
Appendix 1: Published systematic review ...................................................................................... 193
Appendix 2: Socio-behavioural endophenotype matrix - Review of studies of parents of autistic
probands .......................................................................................................................................... 211
Appendix 3: Cognitive endophenotype matrix - Review of studies of parents of autistic probands
......................................................................................................................................................... 226
Appendix 4: Other psychiatric conditions endophenotype matrix - Review of studies of parents of
autistic probands ............................................................................................................................. 254
Appendix 5: DSM - 5 Checklist ...................................................................................................... 257
Appendix 6: Socio-demographic questionnaire (English) .............................................................. 259
Appendix 7: Kiswahili version of the Social Communication Questionnaire (SCQ) ..................... 264
Appendix 8: Kiswahili version of the Autism Spectrum Quotient (AQ) ........................................ 268
Appendix 9: Consent forms for qualitative study (English) ........................................................... 275
Appendix 10: Consent forms for main case-control studies (English) ........................................... 278
Appendix 11: Kiswahili version of the Autism Spectrum Quotient (AQ) 5-Factor Model using
Confirmatory Factor Analysis (CFA) ............................................................................................. 282
Appendix 12: Principal Components Analysis (PCA) for the Kiswahili version of the Autism
Spectrum Quotient (AQ) using Varimax rotation ........................................................................... 284

xi
List of Publications
Ruparelia, K., Abubakar, A., Badoe, E., Bakare, M., Visser, K., Chugani, D. C., ... & Newton, C. R.
(2016). Autism Spectrum Disorders in Africa: Current challenges in identification, assessment, and
treatment: A report on the International Child Neurology Association Meeting on ASD in Africa,
Ghana, April 3-5, 2014. Journal of Child Neurology, 31(8), 1018–1026.
https://doi.org/10.1177/0883073816635748
Ruparelia, K., Manji, K., Abubakar, A., & Newton, C. R. (2017). Investigating the evidence of
behavioral, cognitive, and psychiatric endophenotypes in autism: a systematic review. Autism
Research and Treatment, 2017. https://doi.org/10.1155/2017/6346912
Abubakar, A., Ruparelia, K., Gona, J. K., Rimba, K., Mapenzi, R., de Vries, P. J., … & Newton, C.
R. (In Press). Potential challenges of importing Autism Spectrum Disorder screening and diagnostic
tools from high-income countries to resource-poor settings. In Chawarska & Volkmar (Eds.), Autism
Spectrum Disorders in the first years of life. New York: Guildford.
xii
List of Tables
Table 1.1: ASD Specific screening tools that can be administered by a parent or caregiver ................. 5
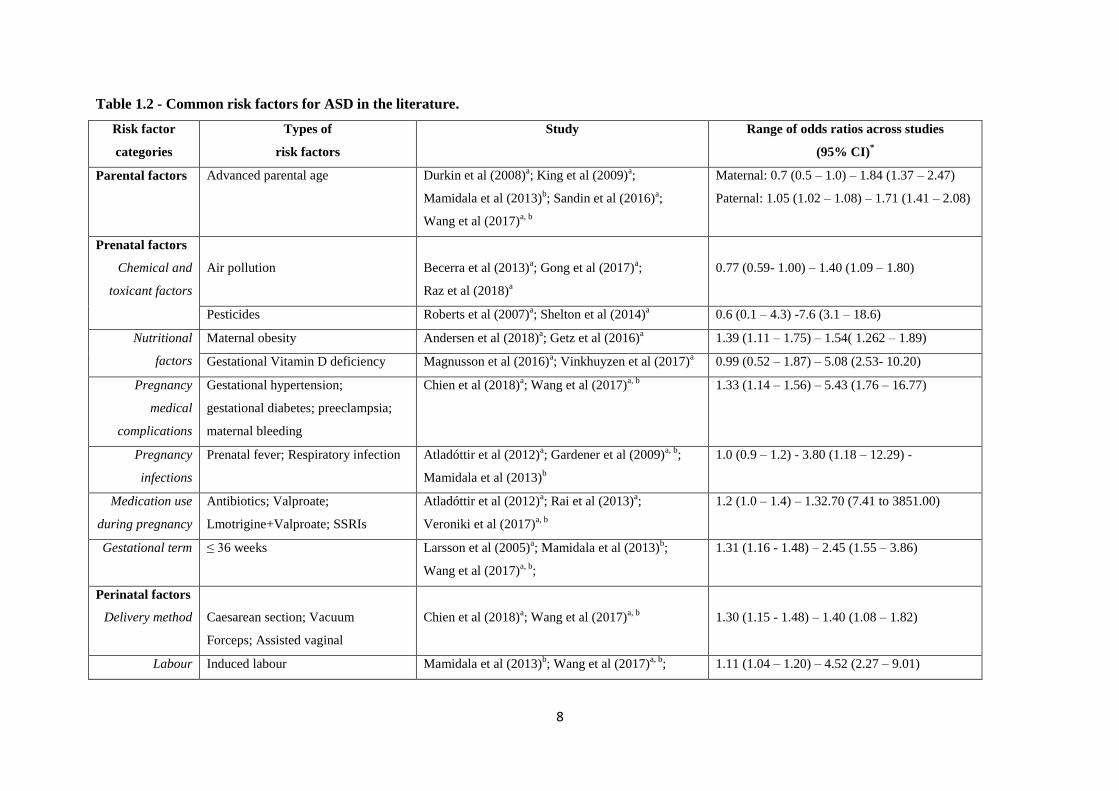
Table 1.2: Common risk factors for ASD in the literature ..................................................................... 8
Table 2.1: Description of search strategy ............................................................................................. 17
Table 2.2: Summary of the frequency of all measures used by studies meeting our search criteria and
effect size ranges for each domain ........................................................................................................ 34
Table 4.1: Description and composition of Focus Group Discussions and In-Depth Interviews......... 59
Table 4.2: Interview Schedule for Caregivers ...................................................................................... 60
Table 5.1: Review of SCQ cross-cultural validation studies ................................................................ 76
Table 5.2: Distribution of participant characteristics between ASD, NDD and TD groups enrolled in
this study ............................................................................................................................................... 81
Table 5.3: Item positive response frequency for ASD vs. TD groups and ASD vs. NDD groups ....... 82
Table 5.4: Discriminant validity for ASD vs. TD groups and ASD vs. NDD groups .......................... 84
Table 5.5: Differences in SCQ total scores and the 3 domains between male and female participants
for each group ....................................................................................................................................... 86
Table 5.6: Differences in SCQ total scores and the 3 domains between mother and father respondents
and mother and caregiver respondents for each group.......................................................................... 87
Table 5.7: Internal consistency of the SCQ for all items and all 3 domains for individual groups and
the whole group..................................................................................................................................... 88
Table 5.8: Test-retest reliability of the SCQ for the total score and all 3 domains .............................. 89
Table 5.9: Factor loadings of the SCQ based on a 2-factor model of confirmatory factor analysis .... 89
Table 5.10: Sensitivity, specificity and ROC analysis (AUC) ............................................................. 91
Table 6.1: Definition of investigated risk factors ................................................................................. 99
Table 6.2: Distribution of characteristics, socio-demographic and family history data between ASD,
TD, NDD and combined ASD+NDD groups enrolled in this study ................................................... 102
Table 6.3: Univariable analysis of relevant parental, perinatal and neonatal factors associated with
ASD compared to TD children ........................................................................................................... 108
Table 6.4: Multivariable analysis of relevant parental, perinatal and neonatal factors associated with
ASD compared to typically developing children adjusted for parental socio-demographic and
economic status ................................................................................................................................... 112
Table 6.5: Univariable analysis of relevant parental, perinatal and neonatal factors associated with
ASD compared to children with NDD ................................................................................................ 114
Table 6.6: Multivariable analysis of relevant parental, perinatal and neonatal factors associated with
ASD compared to children with NDD adjusted for parental socio-demographic and economic status
............................................................................................................................................................ 117

xiii
Table 6.7: Univariable analysis of relevant parental, perinatal and neonatal factors associated with
NDD compared to typically developing children ............................................................................... 120
Table 6.8: Multivariable analysis of relevant parental, perinatal and neonatal factors associated with
NDD compared to typically developing children adjusted for parental socio-demographic and
economic status ................................................................................................................................... 124
Table 6.9: Univariable analysis of relevant parental, perinatal and neonatal factors associated with
ASD+NDD compared to typically developing children ..................................................................... 127
Table 6.10: Multivariable analysis of relevant parental, perinatal and neonatal factors associated with
ASD compared to typically developing children adjusted for parental socio-demographic and
economic status ................................................................................................................................... 131
Table 7.1: Review of AQ cross-cultural validation studies using parent samples ............................. 141
Table 7.2: Distribution of participant baseline characteristics between ASD, NDD and TD groups
enrolled in this study ........................................................................................................................... 145
Table 7.3: Item positive response frequency for ASD vs. TD groups and ASD vs. NDD groups ..... 146
Table 7.4: Discriminant validity for AQ for all parents, mothers and fathers in ASD vs. TD groups
and ASD vs. NDD groups for AQ total score and sub-subscales ....................................................... 151
Table 7.5: Discriminant validity for AQ for all parents, mothers and fathers across all groups (ASD,
TD and NDD) for AQ total score and sub-subscales .......................................................................... 152
Table 7.6: Internal consistency of the AQ for all items and all 5 sub-subscales for individual groups
and the whole group ............................................................................................................................ 153
Table 7.7: Test-retest reliability of the AQ for the total score and all 5 sub-subscales ...................... 154
Table 7.8: Proportion of parents with BAP, MAP and NAP in each group ....................................... 154

xiv
List of Figures
Figure 2.1: Flow chart of study selection ............................................................................................. 18
Figure 2.2: Boxplot reflecting effect size ranges for the socio-behavioural and cognitive domains ... 40
Figure 3.1: Map of Dar-es-Salaam, Tanzania, including ASD registered schools and organizations . 44
Figure 3.2: Flow chart showing participant enrolment ........................................................................ 53
Figure 4.1: Thematic model of lived experiences ................................................................................ 62
Figure 5.1: Group comparison boxplots ............................................................................................... 85
Figure 5.2: Area under the curve (AUC) for all groups ....................................................................... 91
Figure 5.3: Area under the curve (AUC) for ASD vs. TD ................................................................... 91
Figure 5.4: Area under the curve (AUC) for ASD vs. NDD ................................................................ 92

xv
Abbreviations
3Di: Developmental, Dimensional and Diagnostic Interview
ABC: Autism Behaviour Checklist
ACT: Auditory Consonant Trigram
ADHD: Attention Deficit Hyperactive Disorder
ADI-R: Autism Diagnostic Interview - Revised
ADOS: Autism Diagnostic Observation Schedule
ADOS-2: Autism Diagnostic Observation Schedule - 2nd
Edition
ARC: Autism Research Centre
AS: Asperger Syndrome
ASD: Autism Spectrum Disorder
AQ: Autism Spectrum Quotient
AUC: Area Under the Curve
BAPQ: Broader Autism Phenotype Questionnaire
BDI: Beck Depression Inventory
BPASS: Broader Phenotype Autism Symptom Scale
BPRS: Brief Psychiatric Rating Scale
BVAQ-B: Bermond-Vorst Alexithymia Questionnaire - B
CARS-2: Childhood Autism Rating Scale - 2nd
Edition
CCA: Communication Checklist - Adult
CESD: Centre for Epidemiological Studies - Depression Scales
CFA: Confirmatory Factor Analysis
CI: Confidence Interval
CFI: Comparative Fit Index
COSTECH: Tanzania Commission for Science and Technology
CPM: Coloured Progressive Matrices
CTOPP: Comprehensive Test of Phonological Processing
DISCO: Diagnostic Interview for Social and Communication Disorders
DK-EFS: Delis Kaplan Executive Function System
DSM-III: Diagnostic and Statistical Manual for Mental Disorders - 3rd
Edition
DSM-IV: Diagnostic and Statistical Manual for Mental Disorders - 4th Edition
DSM-5: Diagnostic and Statistical Manual for Mental Disorders - 5th Edition
EEG: Electroencephalogram/Electroencephalography
EFT: Embedded Figures Test
ELRCD: Early Language Related Cognitive Difficulties
ERT: Edinburgh Reading Test
xvi
ES: Effect Size
EQ: Empathy Quotient
ER40: Penn Emotion Recognition Test
EVT: Expressive Vocabulary Test
FAQ: French Autism Spectrum Quotient
FGD: Focus Group Discussion
FHI: Family History Interview
FHS: Family History Schedule
FI: Friendship Interview
FSIQ: Full Scale IQ
GFI: Goodness of Fit Index
GORT: Gray Oral Reading Test
HFA: High Functioning Autism
HIC: High-income Countries
ICC: Intraclass Correlation Coefficient
ID: Intellectual Disability
IDED: Intradimensional / Extradimensional Set-Shifting
IDI: In-Depth Interviews
IQ: Intelligence Quotient
IQR: Interquartile Range
KDEF: Karolinska Directed Emotional Faces
KEMRI: Kenya Medical Research Institute
KWTRP: KEMRI-Wellcome Trust Research Programme
LAMIC: Low and Middle Income Countries
LRT: Likelihood Ratio Tests
MAP: Medium Autism Phenotype
M-CHAT: Modified Checklist for Autism in Toddlers
MNH: Muhimbili National Hospital
MPAS: Modified Personality Assessment Schedule
MPAS-R: Modified Personality Assessment Schedule - Revised
MPX: Multiple Incidence Autism Families
MUHAS: Muhimbili University of Health and Allied Sciences
NAP: Narrow Autism Phenotype
NAPA-T: National Association for People with Autism - Tanzania
NART: National Adult Reading Test
NDD: Neurodevelopmental Disorders
NEO-PI: NEO Personality Inventory
xvii
NEPSY: A Developmental Neuropsychological Assessment
NIMR: National Institute for Medical Research
NVIQ: Nonverbal IQ
OR: Odds Ratio
PAS: Physical Anhedonia Scale
PCA: Principal Component Analysis
PDD: Pervasive Developmental Disorders
PDD-NOS: Pervasive Developmental Disorders - Not Otherwise Specified
PIQ: Performance IQ
PPVT: Peabody Picture Vocabulary Test
PPVT-III: Peabody Picture Vocabulary Test - 3rd
Edition
PRS: Pragmatic Rating Scale
PRS-M: Pragmatic Rating Scale - Modified
PSSI: Personality Style and Disorder Inventory
RAN: Rapid Automized Naming
RHQ: Reading History Questionnaire
RIL: Response to Inhibition and Load
RMSEA: Root Mean Square Error of Approximation
ROC: Receiver Operating Characteristic
RPM: Raven‘s Progressive Matrices
SADS-L: Schedule for Affective Disorders and Schizophrenia - Lifetime Version
SADS-LA-R: Schedule for Affective Disorders and Schizophrenia - Lifetime Version - Modified for
the Study of Anxiety Disorders - Revised
SAS: Social Anhedonia Scale
SCL-90-R: Symptom Checklist - 90 Revised
SCQ: Social Communications Questionnaire
SD: Standard Deviation
SPX: Single Incidence Autism Families
SRS: Social Responsiveness Scale
SSA: Sub-Saharan Africa
SST: Schonell Spelling Test
STAI-Y: State-Trait Anxiety Inventory Form Y
TAS-20: Toronto Alexithymia Scale
TD: Typically developing
TLI: Tucker Lewis Index
TMT: Trail Making Test
ToH: Tower of Hanoi
xviii
ToL: Tower of London
TOLC-E: Test of Language Competence - Expanded Edition
TQQ: Ten Questions Questionnaire
TROG-2: Test for Reception of Grammar - 2
UOT: Unexpected Outcomes Test
VIQ: Verbal IQ
WCST: Wisconsin Card Sorting Test
WJ-R: Woodcock-Johnson Psycho-Educational Battery - Revised
WPS: Western Psychological Services

1
Chapter 1
Introduction
1.1. Definition, prevalence and burden of Autism Spectrum Disorders (ASD)
Neurodevelopmental disorders (NDD) are a group of conditions with onset in the early developmental
period and are characterized by deficits that produce impairments of personal, social, academic, or
occupational functioning (DSM-5, APA 2013). NDD include disorders such as attention deficit
hyperactivity disorder (ADHD), intellectual disability, motor disorders, language disorders and autism
spectrum disorders (ASD), among others. Of these NDDs, ASD are the most complex and are
characterised by impairments in social communication and interaction and restricted and repetitive
patterns of behaviour, interests or activities. Since the publication of the latest revision of Diagnostic
and Statistical Manual of Mental Disorders - Fifth edition (DSM-5; APA 2013), children receive a
diagnosis of ASD, rather than previous Fourth edition of the Diagnostic and Statistical Manual (DSM-
IV; APA 1994) sub-classifications of the spectrum such as autistic disorder, Asperger syndrome, or
pervasive developmental disorder - not otherwise specified (PDD-NOS).
The minimum pooled prevalence for all NDDs in low and middle-income countries (LAMIC), based
on available literature, is reported to be 7.6 (95% CI: 7.5 - 7.7) per 1,000 suggesting a considerable
underestimate of the burden (Bitta et al., 2017), given that prevalence of some neurological disorders
in rural Africa may be as high as 6.1% (Mung‘ala-Odera et al., 2006). The prevalence estimates for
ASD based on available literature, however, is reported to be 0.6 (95% CI: 0.5 - 0.6) per 1,000 (Bitta
et al., 2017). However, these estimates are likely to be a gross underestimation of the true burden due
to a paucity of studies, logistical expert challenges in assessment, and methodological biases in
LAMIC (Abubakar et al., 2016a). Checklists of mental health problems shows that pervasive
developmental disorders (PDD) are fairly common in preschool children from Africa (Kariuki et al.,
2017a), suggesting ASD may be common in these settings. In high-income countries (HIC) there is
evidence that one in every 132 (0.8%) to one in every 68 (1.5%) individuals suffer from ASD (Baxter
et al., 2015; Wingate et al., 2014) and according to the latest report, the global prevalence of ASD was
estimated to be at 0.62% (Elsabbagh et al., 2012), although there is little contribution by studies from
LAMIC, particularly sub-Saharan Africa (SSA).
This thesis aims to contribute studies on ASD conducted in Dar-es-Salaam, Tanzania, with particular
interest and emphasis on the awareness, diagnosis, endophenotypes, and risk factors of ASD in this
region.

2
1.2. Review of current literature on ASD in SSA
ASD was previously perceived to occur only in the well-resourced countries with high technological
development. A few decades ago, Sanua (1983) questioned the universality of ASD, however many
recent studies have dispelled this idea that ASD may not be universal. There has since been evidence
of an increase in the prevalence of ASD and knowledge about the disorder in other parts of the world.
Some researchers believe the increase in burden of ASD could reflect the true burden relating to the
epidemiological transition of the risk factors such as neurotoxins from urbanization etc. Others
believe this is due to the improved and increased awareness of ASD over the years and many of such
cases went undetected before. However, it is worth noting that some of the increasing burden may be
due to false positives particularly in LAMIC where there are few experts for diagnosing the condition
and healthcare systems are weak.
The first literature review of ASD in Africa (Bakare and Munir (2011a)) found 12 relevant articles, 2
of which reported epidemiological data. These were publications of ASD including reports of African
immigrants in Sweden (Barnevik-Olsson et al., 2008; Barnevik-Olsson et al., 2010) and of 9 Arabic
speaking countries, for example Tunisia and Egypt (Seif Eldin et al., 2008). Children with ASD in
Africa were diagnosed relatively late (from 8 years through to adolescence) compared to those in HIC
(Bakare and Munir (2011b). Two of these studies revealed that over half of children with ASD in their
cohorts did not have any expressive language and/or had severe intellectual disability (Belhadj et al.,
2006; Mankoski et al., 2006); it is possible that more impaired cases were identified and that onset of
ASD was before the milestones for speech and language were achieved. This delay in diagnosis may
delay acquisition or accelerate deterioration of language skills in many of the children with ASD, in
part because they did not have access to early interventions. Identifying children with ASD in Africa
is problematic because of the lack of appropriate services, expertise and inadequate standard of
available educational and medical infrastructure (Ruparelia et al., 2016).
Awareness of ASD was not only wanting in the general population in Africa, but also among the
medical community (Bakare et al., 2009a), many regarding ASD to have supernatural causes. They
reported that it is a common practice in Africa for children with an NDD to be taken first to a
traditional healer, before a parent seeks biomedical assistance. This potential delay in seeking medical
assistance may contribute to a late diagnosis and could be a further exacerbating factor in the more
severe cognitive and expressive language outcomes reported in children with ASD. These findings
highlight a need for earlier recognition and diagnosis of ASD in Africa. Although in HIC there are
many ‗‗gold-standard‘‘ tools available to screen and diagnose ASD, there are no available validated
tools from Africa. The perception of abnormal behaviour may be mediated by culture, and screening
measures need to take into account these contextual factors. For example, children in some rural parts

3
of Africa are not allowed to look at elders in the eye, and deficits in eye contact are very common in
ASD so these children would score high on the ASD screening process, not because they have ASD
but because they are conditioned by their culture to behave in this manner. These cultural factors need
to be taken into account when developing or adapting screening measures (de Leeuw et al., 2020).
Although major advances in the genetic basis and developmental aspects of ASD have been made,
many aspects of the condition are still poorly understood in LAMIC. More specifically, there is little
research to date exploring risk factors per se for ASD in SSA (Abubakar et al., 2016b). There is also
no detailed epidemiological research for risk factors of ASD as there is for other NDD like epilepsy
(Ngugi et al., 2013). This means that children with ASD are likely to miss out on policy decisions
aimed at identification and management.
Prevalence of ASD is reported to be higher in children of Somali origin living in Stockholm
(Barnevik-Olsson et al, 2010), maternal birth outside the Nordic countries living in Sweden (Haglund
& Källén et al., 2011) and mothers of African origin living in the United Kingdom (Keen et al., 2010).
These findings suggest that ASD in Africa may be more common than is recognized and that
epidemiological research in Africa is needed to clarify the situation.
A more recent systematic review on ASD in SSA (Abubakar, et al., 2016b) found that 74% of studies
meeting their inclusion criteria were conducted in either South Africa or Nigeria, with 83% carried
out in the last decade and did not identify a single case-control study examining risk factors associated
with ASD for this region. Findings from another recent scoping review of ASD in SSA (Franz et al.,
2017), highlight a substantial need for large-scale clinical, training and research programmes to
improve the lives of people with ASD in SSA. In a report on the first International Child Neurology
Association Meeting on ASD in Africa (Ruparelia et al., 2016), strategies were proposed to improve
identification, diagnosis, management and support delivery for individuals with ASD across Africa in
these culturally diverse, low-resource settings. Emphasis was put on raising public awareness through
community engagement, improving access to information and training in ASD with special
considerations for the cultural, linguistic, and socioeconomic factors within Africa.
1.3. Screening for ASD
Currently there are no biomarkers for ASD, thus diagnosis depends largely on behavioural assessment
and observation. The diagnostic process is complex and requires collecting information about
characteristics of current and lifetime behaviours in early developmental periods using interviews,
questionnaires and/or direct observations in standardized administration settings.

4
Since ASD diagnostic tools such as the Autism Diagnostic Observation Schedule (ADOS) (Lord et
al., 2000) and the Autism Diagnostic Interview–Revised (ADI-R) (Le Couteur et al., 2003) require
formal clinical training and large amounts of resources, screening instruments have been developed to
aid in initial screening for ASD. These are administered to the child‘s primary caregiver, are less
costly and time consuming and can provide an efficient method for screening children who may
require further evaluation. A number of screening tools have been developed in HIC for ASD. The
relative ease of using these tools in HIC largely depends on the high literacy levels of parents. Table
1.1 highlights some examples of ASD specific screening tools that can be easily administered to a
parent or caregiver and have been culturally adapted.

5
Table 1.1 - ASD specific screening tools that can be administered to a parent or caregiver.
Screening tools Reference Age range Brief description Cultural adaptation and/or validation
Autism Behaviour
Checklist
(ABC)
Krug et al
(2008)
3 – 14 years 57-item questionnaire answered in yes/no
format and takes approx. 20 minutes. Results
indicate cut-off score ranges based on
different diagnoses.
Brazil (Marteleto & Pedromônico, 2005)
Iran (Yousefi et al., 2015)
Turkey (Özdemir et al., 2013)
Modified Checklist for
Autism in Toddlers
(M-CHAT)
Robbins et al
(2001)
16 – 30 months 23-item questionnaire answered in yes/no
format and takes approx. 5-10 minutes.
Results indicate need for further evaluation.
China (CHAT-23 - Wong et al., 2005)a
France (Baduel et al., 2016)
Japan (Inada et al., 2011)
Mexico (Albores-Gallo et al., 2012)
Spain (Canal-Bedia et al., 2010)
Turkey (Kndolot et al., 2016)
Social Communication
Questionnaire
(SCQ)
Rutter et al
(2003)
4+ years 40-item questionnaire answered in yes/no
format and takes approx. 10-15 minutes The
Lifetime Form focuses on the developmental
history and behaviour. The Current Form
focuses on behaviour during the last 3
months. Results are reported using a total
score and defined cut-off points.
Brazil (Sato et al., 2008)
Germany (Bolte et al., 2008)
Greece (Zarokanellou et al., 2017)
Taiwan (Gau et al., 2011)
Turkey (Avcil et al., 2015)
Social Responsiveness
Scale
(SRS)
Constantino &
Gruver (2005)
4 – 18 years 65-item questionnaire using a rating scale
and takes approx. 10-20 minutes. Results are
reported as a quantitative score for autistic
social impairment.
China (Gau et al., 2013)
France (Stordeur et al., 2019)
Germany (Bölte et al., 2008a)
Iran (Tehrani-Doost., 2018)
aCHAT-23 is a new checklist translated into Chinese, combining the M-CHAT (23 questions) with graded scores and section B (observational section) of the CHAT.

6
Only few published studies specifically on ASD screening and diagnosis in SSA were identified by
recent reviews (Franz et al., 2017; Abubakar et al., 2016b). An Ugandan tool development study
(Kakooza-Mwesige et al., 2014), which piloted a 23-question screener (the 23Q), including the Ten
Questions Questionnaire (TQQ) (Durkin et al., 1995) and 13 additional questions specifically aimed at
ASD detection was modestly successful in identifying children at high risk of ASD, but showed a
relatively low positive predictive value of only 8% (Kakooza-Mwesige et al., 2014). Harrison et al.
(2014) used the Childhood Autism Rating Scale, Second Edition (CARS-2; Schopler et al., 2010) in
Tanzania. They combined this observational diagnostic aid for ASD as part of a larger test battery to
diagnose ASD and described the process of cultural adaptation, however, the tool was not formally
validated. Additionally, two studies in South Africa have also evaluated the cultural adaptability of
ASD screening and diagnostic tools in their setting. The first by Smith et al. (2016) examined the
cultural appropriateness of the materials and procedures for administration of the Autism Diagnostic
Observation Schedule-2 (ADOS-2) and found that most of the materials and activities were
appropriate for use in their setting with only minor modifications. However, potential linguistic and
semantic biases were observed and therefore guidelines for using ADOS in their setting were
developed. The second by Chambers et al. (2016) adapted several measures for early screening for
ASD, providing initial evidence that the measures are feasible for use in their setting.
More recently, Marlow et al. (2019) published a review of screening tools for the identification of
ASD in infants and young children in LAMIC and recommended 3 tools for screening and detection
of ASD for use in LAMIC. They recommend the M-CHAT R/F (Robbins et al., 2014), the Pictorial
Autism Assessment Schedule (PAAS - Perera et al., 2009, 2017) and the Three-Item Direct
Observation Screen (TIDOS - Oner et al., 2013), as these are brief, low-cost and can be implemented
by paraprofessionals or lay community health workers.
These findings highlight a need for accelerated availability of validated screening tools for earlier
recognition and diagnosis of ASD in Africa. Although in HIC there are many tools available to screen
and diagnose ASD, there is a dearth of available validated tools for the use of screening and
identifying ASD in SSA. There is a need for investment in adapting and validating screening and
diagnostic tools for ASD as possible through consortiums of researchers working together across
continents or LAMIC regions while continuously engaging with local and international governments
to ensure sustainability of the process.
1.4. Risk factors associated with ASD
The heritability of ASD is estimated to be 70%-90% (Bailey et al., 1995; Hallmayer et al., 2011)
indicating that it is a strongly genetically determined childhood disorder. Research suggests that
siblings of individuals with ASD are at a 20-fold increased risk of developing ASD compared with the

7
general population (Ritvo et al., 1989; Lauritsen et al., 2005; Constantino et al., 2010; Ozonoff et al.,
2011). Despite major advances in understanding the genetic and developmental aspects of ASD in
HIC, there are few or no genetic or heritability studies of ASD in LAMIC. Yet the available evidence
shows strong genetic basis for these conditions, for instance the clustering of the broader autism
phenotypes in family members of autistic probands (Ruparelia et al., 2017).
There is strong evidence of the interplay between genetic and environmental factors (Hallmayer et al.,
2011; Sandin et al., 2014; Volk et al., 2014) in the development of ASD. Table 1.2 summarizes
common environmental risk factors for ASD in the literature. Recent epidemiologic research has
emphasized the prenatal and neonatal period as the most relevant period for environmental risk factors
to be associated with ASD. Gardener et al. (2009) published the first quantitative review and meta-
analysis of the association between maternal pregnancy-related factors and risk for ASD. They
examined over 50 prenatal factors and found advanced parental age, maternal prenatal medication use,
bleeding, gestational diabetes and being first born to be associated with a risk for ASD. In a
subsequent review and meta-analysis on over 60 perinatal and neonatal factors, Gardener et al. (2011)
found abnormal presentation, low birth weight, small for gestational age, congenital malformations,
feeding difficulties and meconium aspiration amongst others to be associated with a risk for ASD.
However, the authors warned of insufficient evidence to implicate any single prenatal, perinatal and
neonatal factor in ASD aetiology since these factors may interact synergistically (e.g. additively or
multiplicatively) or even antagonistically to determine the risk for ASD (Gardener et al., 2009;
Gardener et al., 2011).
More recently, in a retrospective case-cohort study, Hisle-Gorman et al. (2018) explored 29 prenatal,
perinatal and neonatal factors previously associated with ASD, reporting that the greatest risk was
associated with neonatal seizures, maternal mental health and epilepsy medications. In one of the few
studies examining the prenatal and perinatal factors associated with ASD, using a sibling design and
correlating these factors with ASD core symptoms, Chien et al. (2019) reported that probands with
ASD and their unaffected siblings from Taiwan had more prenatal and perinatal events than typically
developing controls, with higher number of prenatal and perinatal factors in probands than in
unaffected siblings. They also found the total number of prenatal and perinatal factors in ASD
probands to be associated with overall symptom severity as well as specific symptoms such as social
communication deficits.
8
Table 1.2 - Common risk factors for ASD in the literature.
Risk factor
categories
Types of
risk factors
Study
Range of odds ratios across studies
(95% CI)*
Parental factors
Advanced parental age Durkin et al (2008)a; King et al (2009)
a;
Mamidala et al (2013)b; Sandin et al (2016)
a;
Wang et al (2017)a, b
Maternal: 0.7 (0.5 – 1.0) – 1.84 (1.37 – 2.47)
Paternal: 1.05 (1.02 – 1.08) – 1.71 (1.41 – 2.08)
Prenatal factors
Chemical and
toxicant factors
Air pollution
Becerra et al (2013)a; Gong et al (2017)
a;
Raz et al (2018)a
0.77 (0.59- 1.00) – 1.40 (1.09 – 1.80)
Pesticides Roberts et al (2007)a; Shelton et al (2014)
a 0.6 (0.1 – 4.3) -7.6 (3.1 – 18.6)
Nutritional
factors
Maternal obesity Andersen et al (2018)a; Getz et al (2016)
a 1.39 (1.11 – 1.75) – 1.54( 1.262 – 1.89)
Gestational Vitamin D deficiency Magnusson et al (2016)a; Vinkhuyzen et al (2017)
a 0.99 (0.52 – 1.87) – 5.08 (2.53- 10.20)
Pregnancy
medical
complications
Gestational hypertension;
gestational diabetes; preeclampsia;
maternal bleeding
Chien et al (2018)a; Wang et al (2017)
a, b 1.33 (1.14 – 1.56) – 5.43 (1.76 – 16.77)
Pregnancy
infections
Prenatal fever; Respiratory infection Atladóttir et al (2012)a; Gardener et al (2009)
a, b;
Mamidala et al (2013)b
1.0 (0.9 – 1.2) - 3.80 (1.18 – 12.29) -
Medication use
during pregnancy
Antibiotics; Valproate;
Lmotrigine+Valproate; SSRIs
Atladóttir et al (2012)a; Rai et al (2013)
a;
Veroniki et al (2017)a, b
1.2 (1.0 – 1.4) – 1.32.70 (7.41 to 3851.00)
Gestational term
≤ 36 weeks Larsson et al (2005)a; Mamidala et al (2013)
b;
Wang et al (2017)a, b
;
1.31 (1.16 - 1.48) – 2.45 (1.55 – 3.86)
Perinatal factors
Delivery method
Caesarean section; Vacuum
Forceps; Assisted vaginal
Chien et al (2018)a; Wang et al (2017)
a, b
1.30 (1.15 - 1.48) – 1.40 (1.08 – 1.82)
Labour Induced labour Mamidala et al (2013)b; Wang et al (2017)
a, b; 1.11 (1.04 – 1.20) – 4.52 (2.27 – 9.01)

9
complications Prolonged labour
Birth
complications
Breech presentation; Umbilical cord
complications
Larsson et al (2005)a; Wang et al (2017)
a, b 1.47 (1.23 – 1.76) – 1.63 (1.18 – 2.26)
Adverse perinatal
events
Fetal distress; Birth asphyxia;
Delayed birth cry
Hadjkacem et al (2016)b; Mamidala et al (2013)
b;
Wang et al (2017)a, b
1.40 (1.11 – 1.76) – 10.63 (3.69 – 30.59)
Neonatal factors Low birth weight ( ≤ 2.5 kg) Chien et al (2018)a; Wang et al (2017)a, b
1.26 (1.20 – 1.34) – 3.46 (1.32 – 9.09)
Neonatal jaundice Mamidala et al (2013)b 2.89 (1.58 – 5.28)
Neonatal seizures Hisle-Gorman et al (2018)a 7.57 (5.68 – 10.07)
Seizures disorders (epilepsy) Sundelin et al (2016)a 10.49 (9.55-11.53)
Note. CI = Confidence Interval.
aStudies conducted in high-income countries (HIC); bStudies conducted in low and middle income countries (LAMIC).
*p < 0.05

10
However, most of these studies were not conducted in SSA, where the incidence of these risk factors
is high. In recent comprehensive scoping review of ASD in SSA only 3 risk factor studies were
identified (Franz et al., 2017; Abubakar et al., 2016b). In a descriptive case series study in Tanzania,
Mankoski et al. (2006) reported 3 out of 14 children studied developed ASD upon recovery from
malaria, suggesting that severe neurological infections, in the first few years of life, is associated with
ASD. Claassen et al. (2008) conducted a retrospective case study of dizygotic twin siblings in South
Africa, one of whom had ASD. They suggested that maternal stress contributed to the pathogenesis of
ASD as the blood plasma of the ASD probands had elevated glucocorticoids and serotonin in
comparison to the unaffected siblings. van Wijngaarden et al. (2013) conducted a longitudinal
descriptive study in the Republic of Seychelles and found no association between prenatal methyl
mercury exposure and ASD phenotype behaviours as measured by scores on two ASD screening
tools. However, key methodological aspects, in particular systematic diagnosis and
translation/validation of the tools is not available or questionable in these studies (Franz et al., 2017).
One Swedish report found 3 to 4-fold increase in prevalence of ASD in children of Somali origin
living in Stockholm compared to a non-Somali group (Barnevick-Olsson et al., 2008). Furthermore, a
study conducted in the UK, found maternal immigration and ethnicity to be associated with an
increased risk of ASD; in particular mothers of African and Caribbean ethnicity having increased risk
of ASD compared to mothers of white ethnicity (Keen et al., 2010). Another study looking at perinatal
factors and migration in Sweden found that maternal birth outside the Nordic countries was associated
with ASD (Haglund & Källén, 2011), indicating that children of women who were born in SSA or
East Asia had the highest risk for ASD. However, these factors of ethnicity and immigration can have
association with ASD due to two hypotheses. The social causation hypothesis asserts that
experiencing economic hardship increases the risk of subsequent mental illness. The selection
hypothesis asserts that mental illness can inhibit socioeconomic attainment and lead people to drift
into the lower social class or never escape poverty. Research suggests there is a reciprocal relationship
between socioeconomic status and mental health problems, some of which are in the spectrum of
neurodevelopmental disorders such as ASD (Hudson, 2005; Mossakowski et al., 2014).
Many of the risk factors mentioned earlier are common in SSA, suggesting that ASD may be more
common than recognized in this region, highlighting the need for more epidemiological studies in this
region to reliably determine the burden.

11
1.5. Endophenotypes of ASD
Despite the significant heritability in ASD (Bailey et al., 1995; Freitag et al., 2010; Hallmayer et al.,
2011; Tick et al., 2015), the search for the underlying genes has proved to be challenging, raising
questions on the underlying genetic mechanisms of ASD (Abrahams & Geschwind, 2008).
Recent evidence suggests that sub-threshold autistic traits are continuously distributed across the
general population (Constantino & Todd, 2003; Plomin et al., 2009; Ruzich et al., 2015). Several
researchers have found that first-degree relatives of autistic individuals often display milder forms of
autistic traits referred to as the Broader Autism Phenotype (BAP) (Ruparelia et al., 2017; Cruz et al.,
2013; Gerdts & Bernier et al., 2011; Sucksmith et al., 2011). This constellation of sub-threshold
autistic traits includes a set of behavioural and cognitive characteristics that reflect the phenotypic
expression that is qualitatively similar in unaffected relatives of autistic individuals. For instance, mild
challenges in social cognition in using facial cues and other features to determine mental states have
been noted in parents of children with ASD (e.g. Baron-Cohen & Hammer, 1997). Additional studies
report similar differences in emotion processing abilities, particularly emotion identification (e.g. Di
Michele et al., 2007; Szatmari et al., 2008) and phonological processing and reading abilities (e.g.
Schmidt et al., 2008). Research that includes such quantitative measures of autistic traits and
underlying mechanisms responsible for such features in first degree relatives is fundamental in
studying the genetic basis of ASD as it can help to identify which characteristics aggregate in family
members, and are thus likely to be potential endophenotypes for ASD at the neurocognitive level, and
may inform targeted preventative and therapeutic interventions.
Evidence of behavioural, cognitive and psychiatric endophenotypes in parents of children with ASD
is reviewed in more details in Chapter 2. Various instruments have been developed to assess the BAP
in adults. These include self-report and/or informant questionnaires, semi-structured interviews and
interviews combined with direct observation/assessment. Table in 2.1 of Chapter 2 describes the BAP
measures specifically developed to assess the BAP. To date, no studies have been conducted in SSA
on the BAP.
1.6. Study rationale
Currently, very little is known on the risk factors of ASD in Africa and the clinical profile of this
disorder remain unclear in this region (Ruparelia et al., 2016; Abubakar et al., 2016a; Elsabbagh et al.,
2012). It is evident that more epidemiological studies are required in order to define the scale of the
problem of ASD as well as defining the characteristics in particular the phenotypes of children with
ASD in Africa. This may help shed light on the aetiology of ASD and any reasons for possible

12
differences in prevalence between geographical regions, if any exist, as well as estimates to plan
interventions and management.
Good epidemiological studies depend on availability of appropriately adapted and validated tools.
Findings from the few studies conducted in Africa not only indicate a need for earlier recognition and
diagnosis of ASD in the region, but also highlight the need for culturally appropriate and standardized
measures for the diagnosis of ASD. This study aims to identify children with ASD using gold
standard screening tools which are adapted to the local language and culture in SSA. Furthermore, this
study endeavours to assess whether the profile of ASD is similar to HIC.
There is currently no research exploring risk factors for ASD in Africa. Many of the established risk
factors for ASD are common in East Africa, suggesting that ASD may be more common than
recognized. This study aims to collect data on family medical history and past and current health
conditions of children identified with ASD in Tanzania and their biological parents, enabling us to
compare our findings to those of HIC.
More sophisticated research of the endophenotypes of parents of children with ASD may help develop
better measures of evaluation of the BAP. To the best of our knowledge, there are no published
studies exploring the BAP and endophenotypes of ASD in Africa. This study aims to detect subtle
subclinical autistic traits in the parents of children with a confirmed diagnosis of ASD by exploring
the psychometric properties of an existing BAP measure. This can target care for both probands and
relatives.
1.7. Objectives
General objective
To explore the awareness, screening, endophenotypes and risk factors of ASD in Dar-es-Salaam,
Tanzania.
Specific objectives
(1) Systematically review the evidence of behavioural, cognitive and psychiatric endophenotypes in
parents of children with ASD.
(2) To explore the knowledge and lived experiences of ASD in Dar-es-Salaam, Tanzania.
(3) To adapt and evaluate the psychometric characteristics of the Social Communication
Questionnaire (SCQ).
(4) To determine the risk factors for ASD in Dar-es-Salaam, Tanzania.

13
(5) To adapt and evaluate the psychometric properties of the Autism Spectrum Quotient (AQ)
(6) To describe the BAP in biological parents of autistic children.
1.8. Structure of the PhD thesis
Chapter 2 provides a comprehensive systematic review on the behavioural, cognitive and psychiatric
endophenotypes and the BAP in parents of children with ASD. The content of this systematic review
is published in Autism Research and Treatment (Ruparelia et al., 2017 - Appendix 1).
Chapter 3 provides an overview of the methodology of the study, in particular, the study site,
population, study design, procedures and statistical analysis in general terms. Specific procedures and
statistical analysis will be mentioned in the respective subsequent chapters.
Chapter 4 presents qualitative data on the awareness and lived experiences of families of children with
ASD and community stakeholders in Dar-es-Salaam, Tanzania. Data was collected using focus group
discussions (FGD) and in-depth interviews (IDI) and results are presented under the following topic
guidelines: knowledge and awareness on the identification and presentation of ASD and perceived
causes of ASD as well as the challenges encountered. This chapter also includes a thematic model of
lived experiences. This chapter is broadly organised into a brief background, brief methodology, main
findings and summary or brief discussion of the findings.
Chapter 5 focuses on the validation and adaptation of the screening measure Social Communication
Questionnaire (SCQ) among children with a known diagnosis of ASD, other NDD (that are not ASD)
and a comparison group of typically developing children in Dares-Salaam. This chapter includes data
on psychometric properties, in particular internal consistency, test-retest and inter-informant
reliability and discriminant validity. The fit indices for the confirmatory factor analysis (CFA) of SCQ
are also provided. This chapter is broadly organised into a brief background, brief methodology, main
findings and summary or brief discussion of the findings.
Chapter 6 presents results on the risk factors among children with a known diagnosis of ASD, other
NDD (that are not ASD) and typically developing children in Dar-es-Salaam. This chapter is broadly
organised into a brief background, brief methods and procedures, main findings and summary or brief
discussion of the findings.
Chapter 7 focuses on the validation and adaptation of the BAP measure Autism Spectrum Quotient
(AQ) among biological parents of children with a known diagnosis of ASD, parents of children with

14
other NDD (but no ASD) and parents of typically developing children in Dar-es-Salaam. This chapter
includes data on psychometric properties, in particular internal consistency, test-retest and inter-
informant reliability and discriminant validity. This chapter is broadly organised into a brief
background, brief methodology, main findings and summary or brief discussion of the findings.
The last chapter, Chapter 8, synthesises the content of all chapters, whilst comparing main findings
with other published studies. This chapter outlines the contributions of these PhD studies to the
literature, provides directions for future research, highlights public health value of the findings and
discusses the strengths and limitations of the studies.

15
Chapter 2
Systematic review on Autism Spectrum Disorders (ASD) and endophenotypes
2.1. Background
The heritability of ASD is estimated to be from 70% to 90% (Bailey et al., 1995; Hallmayer et al.,
2011). Research suggests the risk of developing ASD in siblings of individuals with ASD is between
10 to 20%, considerably higher than when compared to about 1% for siblings of typically developing
children (Ozonoff et al., 2011; Constantino et al., 2010). These data suggest a strong genetic basis,
despite the clinical heterogeneity. Since numerous studies using linkage or candidate gene approaches
have not discovered a single genetic locus of major effect, it is thought that the definition of the
endophenotypes may provide insights into the biological basis of this condition.
Studies have provided substantial evidence indicating that first degree relatives of autistic individuals
often display milder forms of autistic traits referred to as the broader autism phenotype (BAP) (Piven
et al., 1997a). This milder expression includes a set of behavioral and cognitive characteristics that
reflect the phenotypic expression that is qualitatively similar in unaffected relatives of autistic
individuals. For instance, mild challenges in social cognition in using facial cues and other features to
determine mental states have been noted in parents of children with ASD (Baron-Cohen & Hammer,
1997). Additional studies report similar differences in emotion processing abilities, particularly
emotion identification (Di Michele et al., 2007; Szatmari et al., 2008) and phonological processing
(Schmidt et al., 2008). Research that includes such quantitative measures of autistic traits and
underlying mechanisms responsible for such features in first degree relatives is fundamental in
studying the genetic basis of ASD as it can help to identify which characteristics aggregate in family
members, and are thus likely to be potential endophenotypes for ASD at the neurocognitive level.
Endophenotypes are heritable markers associated with a given condition and can provide insight into
its etiology. Gottesman & Gould (2003) offered a set of criteria for identification of useful
endophenotypes suggesting that deficits must be: a) associated with illness in the population; b)
heritable; c) state-independent (manifests in an individual whether or not illness is active); d) co-
segregated with the condition within families; and e) also found in unaffected relatives at a higher
prevalence than in the general population. The study of endophenotypes is particularly useful in
understanding developmental disorders such as ASD that are diagnosed on clinical features, but are of

16
neurobiological origin, and can aid to better identify and characterize the nature of the genetic
contributions to this complex disorder.
Several researchers have reviewed the BAP traits in first degree relatives of autistic probands (Cruz et
al., 2013; Gerdts & Bernier, 2011; Sucksmith et al., 2011). Some reviews include studies that have
examined the BAP in parents and siblings of autistic probands. Although features of the ASD
phenotype have been found in the ‗at risk‘ infant sibling studies, no clear distinction can be made to
determine whether they are the characteristics of the BAP or that the infant siblings may later receive
an ASD diagnosis. Thus, I limited this review process to parents only by employing a systematic
approach to focus on the socio-behavioural, cognitive and psychiatric profiles of the BAP to
determine candidate endophenotypic traits for ASD.
I conducted a systematic review of the literature to assess the evidence of behavioral, cognitive and
psychiatric endophenotypes of ASD in parents. The aim of this review was to ascertain whether
parents of probands with ASD have higher prevalence of various components of the BAP, and more
specifically of behavioral, cognitive and other psychiatric conditions. The questions addressed were:
i. What are the behavioral, cognitive and other psychiatric (focusing primarily on depression
and anxiety) endophenotypes of ASD as manifested through the BAP in biological parents of
autistic probands?
ii. What are the tools used to measure these endophenotypes and the magnitude of effect?
iii. Do patterns evident in endophenotypes of ASD provide insight into cultural and geographical
differences?
2.2. Review methods
2.2.1. Data sources and search strategy
A comprehensive literature search was performed to collate evidence of behavioral, cognitive and
psychiatric endophenotypes in ASD. Literature searches for published and grey literature were
subsequently carried out using 5 databases: EMBASE, MEDLINE, PsychINFO, PsychEXTRA and
Global Health from inception through to August 2014 without language restriction. The strategy was
developed by breaking down the review questions into elemental facets according to the
recommendations of the National Health Service Centre for Reviews and Disseminations (Khan et al.,
2001). These facets included exposure, outcome, population, publication language and keywords
(Table 2.1). The initial search strategy used the words ‗autis* AND endophenotyp* OR phenotyp*‘.
These searches were further refined by the addition of the outcome terms and population (‗parent* OR
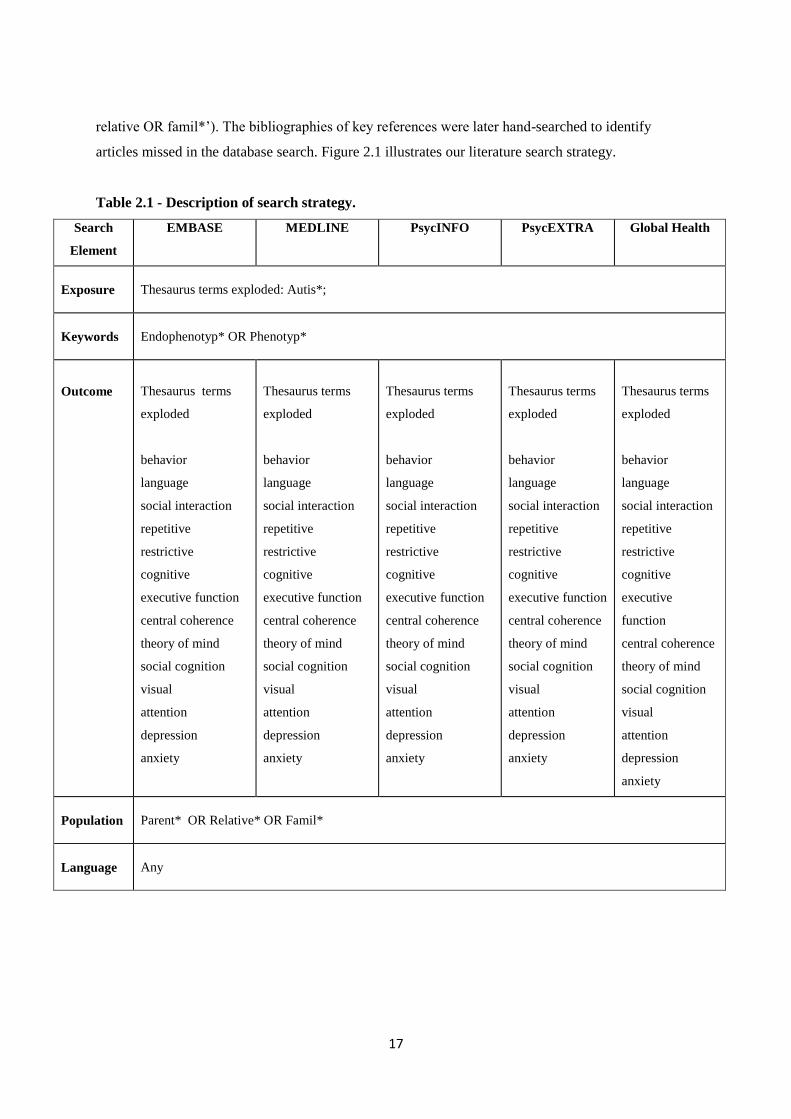
17
relative OR famil*‘). The bibliographies of key references were later hand-searched to identify
articles missed in the database search. Figure 2.1 illustrates our literature search strategy.
Table 2.1 - Description of search strategy.
Search
Element
EMBASE MEDLINE PsycINFO PsycEXTRA Global Health
Exposure
Thesaurus terms exploded: Autis*;
Keywords
Endophenotyp* OR Phenotyp*
Outcome
Thesaurus terms
exploded
behavior
language
social interaction
repetitive
restrictive
cognitive
executive function
central coherence
theory of mind
social cognition
visual
attention
depression
anxiety
Thesaurus terms
exploded
behavior
language
social interaction
repetitive
restrictive
cognitive
executive function
central coherence
theory of mind
social cognition
visual
attention
depression
anxiety
Thesaurus terms
exploded
behavior
language
social interaction
repetitive
restrictive
cognitive
executive function
central coherence
theory of mind
social cognition
visual
attention
depression
anxiety
Thesaurus terms
exploded
behavior
language
social interaction
repetitive
restrictive
cognitive
executive function
central coherence
theory of mind
social cognition
visual
attention
depression
anxiety
Thesaurus terms
exploded
behavior
language
social interaction
repetitive
restrictive
cognitive
executive
function
central coherence
theory of mind
social cognition
visual
attention
depression
anxiety
Population
Parent* OR Relative* OR Famil*
Language
Any

18
Figure 2.1 - Flow chart of study selection.
2.2.2. Data selection criteria
The titles and abstracts of papers identified were reviewed and the full versions of potential papers
were read to decide on final selection. The inclusion criteria were:
i. Original studies that employed a quantitative methodological approach to investigate
behavioral, cognitive and psychiatric (depression and anxiety) endophenotypes in biological
parents.
ii. The autistic proband (other conditions on the spectrum such as Asperger Syndrome, Pervasive
Developmental Disorder and Pervasive Developmental Disorder Not Otherwise Specified
were also included) must have a clinically established diagnosis of ASD (minimum DSM-III)
and no concomitant medical conditions associated with autistic symptomatology and visual,
auditory and motor impairment such as Fragile X or Tuberous Sclerosis.
Records identified through
database searching
(n = 7041)
Records after duplicates
removed
(n = 4127)
Studies meeting selection
criteria
(n = 60)
Records excluded
(n = 215)
Records screened for abstracts
(n = 278)
Full-text articles assessed for
eligibility
(n = 63)
Additional records identified
through manual search
(n = 9)
Full-text articles excluded with
reasons
(n = 12)
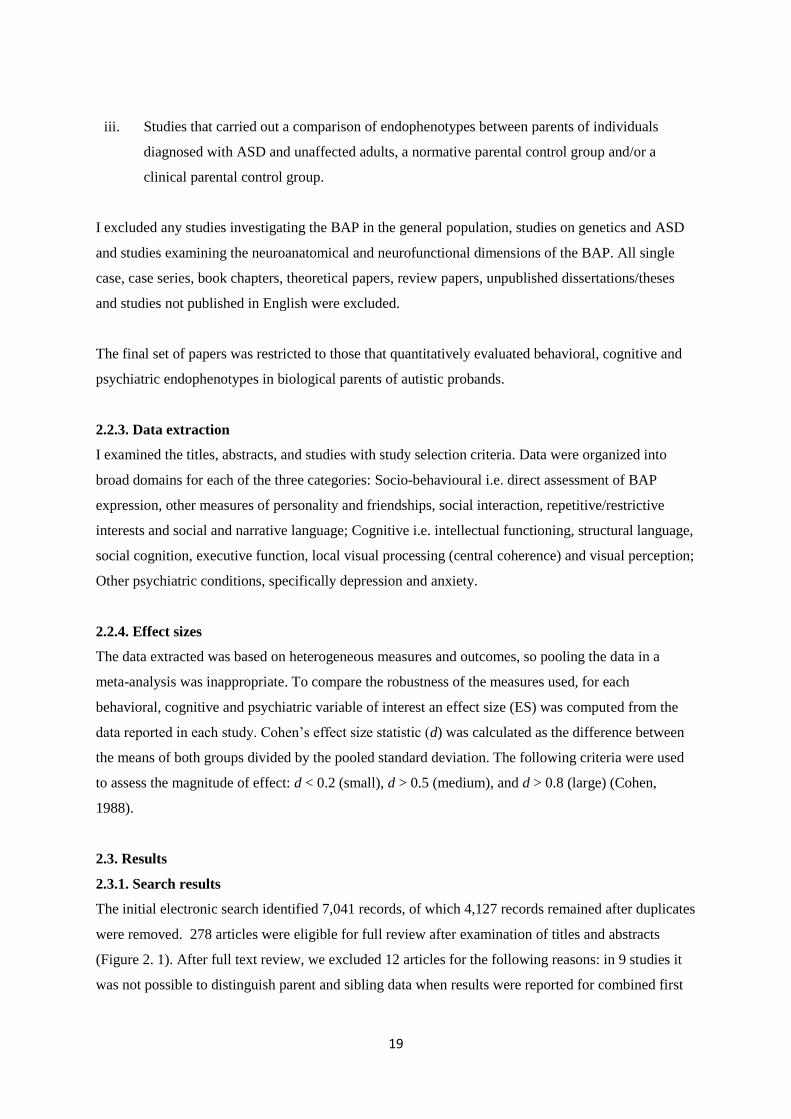
19
iii. Studies that carried out a comparison of endophenotypes between parents of individuals
diagnosed with ASD and unaffected adults, a normative parental control group and/or a
clinical parental control group.
I excluded any studies investigating the BAP in the general population, studies on genetics and ASD
and studies examining the neuroanatomical and neurofunctional dimensions of the BAP. All single
case, case series, book chapters, theoretical papers, review papers, unpublished dissertations/theses
and studies not published in English were excluded.
The final set of papers was restricted to those that quantitatively evaluated behavioral, cognitive and
psychiatric endophenotypes in biological parents of autistic probands.
2.2.3. Data extraction
I examined the titles, abstracts, and studies with study selection criteria. Data were organized into
broad domains for each of the three categories: Socio-behavioural i.e. direct assessment of BAP
expression, other measures of personality and friendships, social interaction, repetitive/restrictive
interests and social and narrative language; Cognitive i.e. intellectual functioning, structural language,
social cognition, executive function, local visual processing (central coherence) and visual perception;
Other psychiatric conditions, specifically depression and anxiety.
2.2.4. Effect sizes
The data extracted was based on heterogeneous measures and outcomes, so pooling the data in a
meta-analysis was inappropriate. To compare the robustness of the measures used, for each
behavioral, cognitive and psychiatric variable of interest an effect size (ES) was computed from the
data reported in each study. Cohen‘s effect size statistic (d) was calculated as the difference between
the means of both groups divided by the pooled standard deviation. The following criteria were used
to assess the magnitude of effect: d < 0.2 (small), d > 0.5 (medium), and d > 0.8 (large) (Cohen,
1988).
2.3. Results
2.3.1. Search results
The initial electronic search identified 7,041 records, of which 4,127 records remained after duplicates
were removed. 278 articles were eligible for full review after examination of titles and abstracts
(Figure 2. 1). After full text review, we excluded 12 articles for the following reasons: in 9 studies it
was not possible to distinguish parent and sibling data when results were reported for combined first

20
degree relatives, and in 3 studies, proband diagnosis was established using criteria prior to DSM-III.
The search criteria, additional articles identified through manual search and total numbers of articles
meeting selection criteria are shown in Figure 1.
2.3.2. Results of literature extraction
Twenty five of the 60 studies that fulfilled the inclusion criteria directly evaluated the BAP expression
(including personality, social behavior and pragmatic language features of the BAP). An additional 7
studies assessed other aspects within the socio-behavioural domain. Thirty seven reports assessed the
broad domain of cognitive functioning and seven studies investigated other psychiatric conditions.
Twenty seven of the studies were conducted in North America, 24 in Western Europe, 4 in the Middle
East, 3 in Western Pacific, 1 in South America and 1 used combined samples from North America,
Western Europe and Western Pacific. However, no studies were conducted in Asia or Africa. Index
families included a total of 4,833 mothers and 3,065 fathers that took part across all studies reviewed
(few studies did not specify sex breakdown). Studies varied greatly in their choice of comparison
control group, with 26 studies using a non-clinical comparison group, 21 studies using a normative
control sample and 13 studies using a combined sample of clinical and non-clinical control groups.
Thirteen studies evaluated the gradation of expression across family types using families with
multiple incidence autism (MPX) and single incidence autism (SPX).
I summarized the results of the literature search according to different socio-behavioural, cognitive
and psychiatric domains. For each domain I present the measures used within that domain and any
significant differences found between index parents and parental controls, and so results are described
in relation to proband diagnosis. All background measures used to establish BAP status without using
a comparison group as well as control tasks are not reported under the specific criteria in this review.
2.3.3. Socio-behavioural domain
This domain includes studies that evaluated the BAP expression using measures designed specifically
to assess social abilities, communication skills and personality traits characteristic of the BAP, as well
as measures of reciprocal interaction, restrictive and repetitive interest and social and narrative
language. Refer to Appendix 2 for the review of socio-behavioural studies of parents of autistic
probands.
BAP expression through direct clinical assessment
Studies explored the BAP using a variety of measures and research designs with some studies
utilizing conservative selection criteria, dividing parents of autistic probands into ‗BAP present‘
21
(BAP+) and ‗BAP absent‘ (BAP-) groups. As shown in Appendix 1, from eight of the measures
specifically designed to assess the BAP, four are more recent Questionnaires aiming to assess the
BAP quantitatively, and four use interviews and direct behavioral observations. Of the four
questionnaires, one is a self-report measure (Autism Spectrum Quotient - AQ), two are informant-
report measures (Communication Checklist - Adult - CCA; and Social Responsiveness Scale - SRS),
and one is a self – and informant report questionnaire (Broader Autism Phenotype Questionnaire -
BAPQ). Of the four remaining measures, two are semi-structured interviews (Family History
Interview – FHI / Family History Schedule - FHS and Modified Personality Assessment Schedule –
MPAS / Modified Personality Assessment Schedule - Revised - MPAS-R), and two assess BAP via
interviews and direct clinical observation/assessment (Broader Phenotype Autism Symptom Scale -
BPASS and Pragmatic Rating Scale - PRS / Pragmatic Rating Scale - Modified - PRS-M).
Autism Spectrum Quotient (AQ)
A total of ten reports measured the BAP using the self-report AQ (ES range 0.01 – 1.34). Three
studies used adaptations of the AQ; one in Italian (Ruta et al., 2012), one in Turkish (Köse et al.,
2013) and one in French (Robel et al., 2014). Within the ‗Social Skills‘ factor, five studies found
significantly higher deficits in social skills compared to parents of typically developing children (Ruta
et al., 2012; Köse et al., 2013; Bishop et al., 2004a; Kadak et al., 2014; Wheelwright et al., 2010).
Two studies reported significantly higher prevalence of ‗Attention Switching‘ deficits between the
index parents and parents of typically developing children (Wheelwright et al., 2010) and parents of
children with specific language impairment (Whitehouse et al., 2007). One study evaluating the
‗Attention to Detail‘ subscale, reported mothers of typically developing children scoring significantly
higher than index mothers (Schereen & Stauder, 2008). Within the ‗Communication‘ subscale, five
out of eight studies report significantly higher communication deficits between index parents and
parents of typically developing children (Ruta et al., 2012; Köse et al., 2013; Bishop et al., 2004a;
Wheelwright et al., 2010) and parents of children with a specific language impairment (Whitehouse et
al., 2007). However, only Wheelwright et al.‘s (2010) study reported a significant trend for index
parents to have more deficits in ‗Imagination‘ subscale compared to a sample of parents of typically
developing children. For the total AQ score, four studies reported higher combined total scores among
index parents when compared to parents of typically developing children (Ruta et al., 2012; Köse et
al., 2013; Wheelwright et al., 2010) and parents of children with specific language impairment
(Whitehouse et al., 2007).
Ingersoll et al. (2011) combined the social skill and communication factors and revealed index
mothers to score significantly higher than normative mothers on the AQ. Furthermore, in a more
recent study, using a validated French Autism Quotient (FAQ), Robel et al. (2014) distributed AQ

22
scores between two main factors, F1 corresponding to socialization and communication, and F2
corresponding to imagination and rigidity. They reported index parents to have more symptomatic
scores in the F1 domain compared to parents of typically developing children. No significant
differences were found for the F2 domain, however, the global score (F1 and F2 combined) remained
significant with index parents scoring higher.
Broader Autism Phenotype Questionnaire (BAPQ)
Two studies evaluated the BAP using the BAPQ (ES range 0.26 – 1.49). Hurley et al. (2007) used the
method of pre-establishing parents of autistic probands into ‗BAP present‘ (BAP+) and ‗BAP absent‘
(BAP-) groups by direct assessment on MPASR and PRS, reporting consistently higher scores for
‗BAP+‘ group compared to ‗BAP-‘ group and community control parents on all subscales; aloof,
rigid, pragmatic language and the total score. More recently, Sasson et al. (2013) reported similar
results for all BAPQ subscales and total score, with index fathers scoring significantly higher than
normative fathers and the same trend was significant for mothers of both groups.
Broader Phenotype Autism Symptom Scale (BPASS)
Bernier et al (2012) used the BPASS to assess the BAP in MPX parents compared to parents of SPX
families, parents of developmentally delayed children and parents of typically developing children
(ES range 0.75 – 1.28). Differences among groups were found in the ‗Social Motivation‘ subscale
where MPX parents showed significantly more deficits than the SPX parents, parents of
developmentally delayed children and parents of typically developing children. In both
‗Expressiveness‘ and ‗Restricted Interests‘ subscales a significant difference was found only between
the MPX parents scoring higher than parents of typically developing children. No group differences
were found within the ‗Communication‘ subscale and interestingly, SPX parents did not differ from
parents of children with developmental delay or typical development.
Communication Checklist – Adult Version (CC-A)
Whitehouse et al (2010) assessed the BAP using the CC-A (ES range 0.04 – 0.43), and found only the
‗Social Engagement‘ subscale had statistically significant differences between the index parents and a
normative sample, suggesting a more passive communication style for the index parents. No group
differences were found in the ‗Language Structure‘ and ‗Pragmatic Language‘ subscales, however,
analysis of the total score of the two groups (1 standard deviation below mean) was found to be
significant.
23
Family History Interview / Family History Schedule (FHI/FHS)
Three studies evaluated the BAP using the FHI/FHS semi-structured interview method (no ES
available). Folstein et al (1999) analyzed four items (language delays, reading difficulties, spelling
difficulties and articulation) on the ‗Communication‘ subscale. Accordingly, ‗Early language-related
cognitive difficulties‘ (ELRCD) were scored and a ‗definite‘ or ‗probable‘ rating was applied.
Significantly higher rates of definite and probable ELRCD‘s were found in index parents compared to
parents of children with Down‘s Syndrome. However, two other studies found index parents to
perform equally to comparison groups on the ‗Communication‘ subscale (Piven et al., 1997a; Pickles
et al., 2013). Within the ‗Social‘ factor, Piven et al. (1997a) found parents from MPX families had
significantly higher prevalence of social deficits than parents of Down‘s Syndrome children,
particularly in index fathers. Similarly, Pickles et al. (2013) reported significantly increased social
deficits in index parents compared to parents of children with specific language impairment.
Interestingly, no group differences were found between index parents and parents of children with a
combined diagnosis of specific language impairment and ASD. Only Piven et al (1997a) assessed the
‗Stereotyped Behaviors‘ subscale and reported MPX parents to have significantly more repetitive
stereotyped behaviors compared to parents of Down‘s Syndrome children.
Modified Personality Assessment Schedule (MPAS/MPAS-R)
One study used the MPAS to evaluate the BAP (Piven et al., 1994) and three subsequent studies have
used a modified version (MPAS-R) (Piven et al., 1997b; Losh et al., 2008; Losh et al., 2012) (ES not
available). Three out of the four studies assessing the ‗Aloof‘ subscale found significantly higher rates
of aloofness in index parents compared to parents of Down‘s Syndrome children (Piven et al., 1994;
Piven et al., 1997b), with one study reporting MPX parents to score significantly higher than SPX
parents who in turn scored significantly higher than parents of children with Down‘s Syndrome (Losh
et al., 2012). Similarly, the same trend for the ‗Anxious‘, ‗Hypersensitive‘, ‗Rigid‘ and ‗Untactful‘
personality traits was reported (Losh et al., 2012). Piven et al., (1997b) reported significantly higher
rates of anxiousness, hypersensitiveness and rigidity in MPX parents in comparison to parents of
Down‘s Syndrome, however, they found no significant differences between the two groups in the
‗Untactful‘, ‗Undemonstrative‘ and ‗Unresponsive‘ traits. Piven et al., (1994), however, did find
significantly higher rates of untactfulness and undemonstrativeness in index parents compared to
parents of children with Down‘s Syndrome. In a more recent study, Losh et al (2012) failed to find a
significant difference for the ‗Overly Conscientious‘ subscale, but they did find a significant
difference in the ‗Rigidity‘ subscale.

24
Pragmatic Rating Scale (PRS / PRS-M)
A total of five studies assessed the BAP using the PRS (ES range 0 – 1.14). Landa et al (1992)
combined blind and unblind ratings and reported higher total scores for the index parents compared to
their control sample of parents of Down‘s Syndrome and typical development. Losh et al (2012)
found in their sample of mothers only, that index mothers had similar pragmatic language violations
to mothers of children with Fragile X Syndrome, and both these groups had higher frequency of
violations than mothers of typically developing children. Piven et al (1997b) reported higher
frequency of pragmatic language violations and speech errors in MPX parents compared to parents of
Down‘s Syndrome children. Additionally, Losh et al (2008), found a linear trend for both pragmatic
language violations and speech errors, reporting MPX parents to score significantly higher than SPX
parents who in turn scored significantly higher than parents of children with Down‘s Syndrome. Ruser
et al (2007), used a modified version of the PRS (PRS-M) and reported index parents to have
significantly higher deficits in subscales of emotional expressiveness and awareness of the other,
over-talkativeness and language in comparison to parents of children with Down‘s Syndrome. Group
differences in the communicative factor was not found to be significant, however, index fathers
showed significantly increased communication deficits than index mothers. The total PRS-M score
revealed significant group differences between index parents and Down‘s Syndrome parents, with
index fathers scoring higher than index mothers.
Social Responsiveness Scale (SRS)
The SRS was used as a measure to assess the BAP by two studies in our review (ES range 0.02 –
0.90). De la Marche (2012) reported all index fathers (MPX and SPX combined) having a
significantly higher total score compared to unaffected adult males, however no statistical differences
were found between MPX fathers and SPX fathers and SPX fathers and male controls. In contrast,
Schwichtenberg et al (2010) found that both the MPX and SPX fathers in their sample scored
significantly higher than fathers of typically developing children. No differences between mothers in
both groups were found.
Other measures of personality and friendships
Another personality measure used in studies of the BAP is the NEO Personality Inventory (NEO-PI).
Two studies show a trend for parents from MPX families scoring significantly higher on the
neuroticism subscale in comparison to parents of children from SPX families (Losh et al., 2008) and
parents of Down‘s Syndrome probands (Piven et al., 1997b; Losh et al., 2008) (ES 0.79, n = 1).
Furthermore, the same two studies assessed quality of friendships using the Friendship Interview (FI),
indicating significantly fewer friendships in parents from MPX families in comparison to parents of
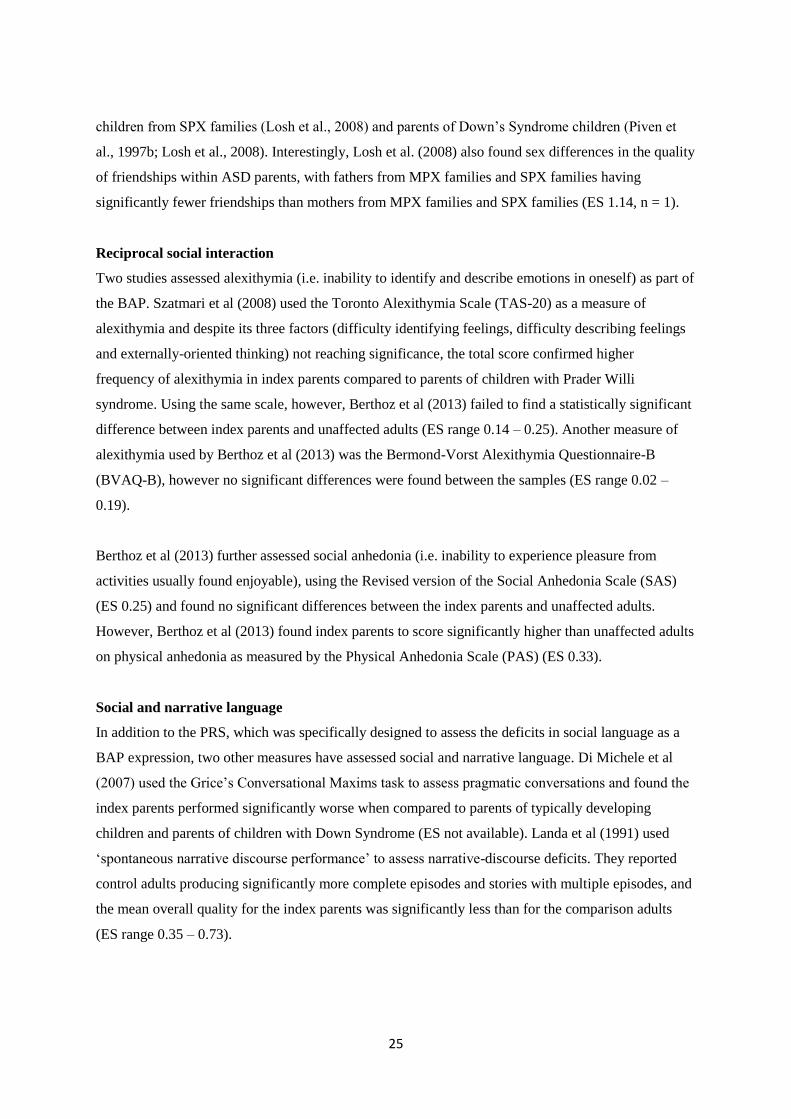
25
children from SPX families (Losh et al., 2008) and parents of Down‘s Syndrome children (Piven et
al., 1997b; Losh et al., 2008). Interestingly, Losh et al. (2008) also found sex differences in the quality
of friendships within ASD parents, with fathers from MPX families and SPX families having
significantly fewer friendships than mothers from MPX families and SPX families (ES 1.14, n = 1).
Reciprocal social interaction
Two studies assessed alexithymia (i.e. inability to identify and describe emotions in oneself) as part of
the BAP. Szatmari et al (2008) used the Toronto Alexithymia Scale (TAS-20) as a measure of
alexithymia and despite its three factors (difficulty identifying feelings, difficulty describing feelings
and externally-oriented thinking) not reaching significance, the total score confirmed higher
frequency of alexithymia in index parents compared to parents of children with Prader Willi
syndrome. Using the same scale, however, Berthoz et al (2013) failed to find a statistically significant
difference between index parents and unaffected adults (ES range 0.14 – 0.25). Another measure of
alexithymia used by Berthoz et al (2013) was the Bermond-Vorst Alexithymia Questionnaire-B
(BVAQ-B), however no significant differences were found between the samples (ES range 0.02 –
0.19).
Berthoz et al (2013) further assessed social anhedonia (i.e. inability to experience pleasure from
activities usually found enjoyable), using the Revised version of the Social Anhedonia Scale (SAS)
(ES 0.25) and found no significant differences between the index parents and unaffected adults.
However, Berthoz et al (2013) found index parents to score significantly higher than unaffected adults
on physical anhedonia as measured by the Physical Anhedonia Scale (PAS) (ES 0.33).
Social and narrative language
In addition to the PRS, which was specifically designed to assess the deficits in social language as a
BAP expression, two other measures have assessed social and narrative language. Di Michele et al
(2007) used the Grice‘s Conversational Maxims task to assess pragmatic conversations and found the
index parents performed significantly worse when compared to parents of typically developing
children and parents of children with Down Syndrome (ES not available). Landa et al (1991) used
‗spontaneous narrative discourse performance‘ to assess narrative-discourse deficits. They reported
control adults producing significantly more complete episodes and stories with multiple episodes, and
the mean overall quality for the index parents was significantly less than for the comparison adults
(ES range 0.35 – 0.73).

26
Repetitive / restrictive behaviors and interests
Repetitive and restrictive behaviors are a core symptom of ASD. The majority of findings in parents
of autistic probands corresponding to this domain are covered in the studies that assess the BAP in
terms of rigid and perfectionistic personalities. Only one study used an experimental questionnaire
designed to examine real-life, non-social skills and preferences such as insistence on routines and
circumscribed hobbies. Briskman et al (2001), reported index parents to score significantly higher
than parents of boys with dyslexia and typical development (ES range 0.37 – 1.11).
2.3.4. Cognitive domain
Most forms of neuropsychological tests involve multiple cognitive functions suggesting that cognitive
domains can be related to each other. I have organized the measures for this broad domain under
different categories based on the cognitive function which they predominantly assess, however, an
overlap may exist. Refer to Appendix 3 for the review of cognitive studies of parents of autistic
probands. References for the different measures can be found in the studies included in this review
and in more specialized text book resources (Lezak et al., 2012).
General intellectual functioning
Intelligence Quotient (IQ) was measured with different versions of the Weschler Scales in the studies.
Thirteen studies assessed total Verbal IQ (VIQ) (ES range 0.05 – 1.28, n = 12), with scores for index
parents similar to comparison groups in all but one study (Fombonne et al., 1997) with higher scores
for index parents when compared to parents of Down‘s Syndrome children. Several VIQ subtests
were also independently tested. Three studies used the Digit span subtest (some modified it to assess
short term memory) (ES range 0.04 – 0.67), of which two found better performance in index parents
compared to parents with children with Down‘s Syndrome (Fombonne et al., 1997) and parents of
children with specific language impairment (Whitehouse et al., 2007). Only one study used the
Arithmetic subscale and found no significant differences between index parents compared to parents
with children with Down‘s Syndrome (Fombonne et al., 1997) (ES 0.25). Four studies used the
Vocabulary subtest (ES range 0.04 – 0.96) and results were mixed, with one study indicating higher
scores for index parents compared to parents of children with Down‘s Syndrome (Fombonne et al.,
1997), another indicating a reverse trend with index parents scoring significantly lower than parents of
typically developing children (Smalley & Asarnow, 1990), and two revealing no significant
differences between groups. Four studies assessed the Comprehension subtest (ES range 0.31 – 0.74),
with only one indicating a significant difference with index parents scoring significantly higher than
parents of children with Down‘s Syndrome (Fombonne et al., 1997). Additionally, two studies used

27
the Similarities subtest (ES range 0.13 – 0.35) with only one reporting a significant difference
(Fombonne et al., 1997).
Thirteen studies also assessed total Performance IQ (PIQ) (ES range 0 – 1.16, n = 12), with three
studies reporting a significant difference, with index parents performing poorer than parents of
children with Down‘s Syndrome (Folstein et al., 1999; Piven & Palmer, 1997) and unaffected adults
(Schmidt et al., 2008). One study, however, reported an opposite trend with index fathers performing
significantly better than fathers with a child with specific language impairment (Lindgren et al.,
2009). Several PIQ subtests were also independently tested. Four studies used the Picture Completion
subtest (ES range 0.07 – 0.65), however only two reported significant lower scores for index parents
compared to parents of children with Down‘s Syndrome (Folstein et al., 1999; Piven & Palmer, 1997).
Moreover, Folstein et al (1999) also reported lower scores on the Picture Arrangement subtest with
the same trend of significance (ES range 0.03 – 0.26, n = 2). Two studies assessed the Object
Assembly subtest (ES range 0.12 – 0.62), however only one reported a significant difference with
MPX parents scoring lower than parents of Down‘s Syndrome children (Piven & Palmer, 1997).
Furthermore, Schmidt et al. (2008), found significantly lower scores on the Matrix Reasoning subtest
in index parents compared to unaffected adults (ES 0.67). Interestingly, none of the five studies
assessing the Block Design subtest (ES range 0.04 – 0.43) and one study assessing the Digit Symbol
subtest found significant differences between groups (ES range 0.17 – 0.19).
Full Scale IQ (FSIQ) (ES range 0.05 – 1.88, n = 13) was assessed in fourteen studies in our review
with three studies reporting a significant poorer performance in index parents when compared to
parents of children with Down‘s Syndrome (Folstein et al., 1999; Losh et al., 2008) and a combined
clinical group of parents of children with Down‘s Syndrome and typical development (Losh & Piven,
2007).
Additionally, four studies used the Raven‘s Progressive Matrices to report Nonverbal IQ (NVIQ),
with no significant differences found between groups (Bölte & Poustka, 2003; Bölte and Poustka,
2006; Bölte et al., 2007; Sucksmith et al., 2013) (ES range 0.05 – 0.57).
Structural language abilities
A number of studies assessed structural language abilities using a variety of different measures.
Results are divided into specific domains. Receptive language skills were assessed by three studies
using two measures. The Peabody Picture Vocabulary Test (PPVT-III) (ES range 0.33 – 1.58) was
used by two studies with only one study reporting index mothers as having significantly more deficits

28
than mothers of children with ASD and language impairment who in turn had more deficits compared
to mothers of children with a specific language impairment (Lindgren et al., 2009). Whitehouse et al
(2007) used the Test for Reception of Grammar-2 (TROG-2) to evaluate receptive grammar and
reported no differences between groups (ES not available). Schmidt et al (2008) assessed expressive
language using the Expressive Vocabulary Test (EVT) (ES 0.10) and the Verbal Fluency subtest of
the Delis Kaplan Executive Function System (DK-EFS) (ES 0.16 – 0.39) reporting no significant
differences between index parents and unaffected adults. Additionally, they assessed figurative
language using the Figurative Language subtest from the Test of Language Competence - Expanded
Edition (TOLC-E) reporting no significant differences between the two groups (ES 0.28).
Phonological processing was assessed in five reports using five different tests. Lindgren et al (2009)
used the Comprehensive Test of Phonological Processing (CTOPP) (ES range 0.02 – 1.42, n = 2),
revealing significantly better performance in phonological awareness and the non-word repetition
subtests in the index mothers compared to mothers of children with a specific language impairment.
In contrast, however, Schmidt et al (2008) found index parents to perform significantly lower than
unaffected adults in the same non-word subtest. Bishop et al (2004b) used a different Non-word
Memory Test (ES range 0.02 – 0.04) and a Nonsense Passage Reading test (ES range 0.04 – 0.42) to
assess phonological processing, none indicating significant differences between index parents and
parents of typically developing children. However, Whitehouse et al (2007) did find index parents to
perform significantly better than parents of children with specific language impairment in the
Nonsense Words subtest of the NEPSY (A Developmental Neuropsychological Assessment Test
Battery) (ES range 0.04 – 0.88). In contrast, Plumet et al (1995) found no significant differences in
composite verbal scores when comparing index parents to parents of children with Down‘s Syndrome
using a battery of verbal tasks with an emphasis on orthographic and phonological abilities (ES 0.22).
Reading skills were assessed by eight studies using seven different measures. Piven and Palmer
(1997) used the Rapid Automized Naming (RAN) task and found no differences in the number and
letter categories, however, they found significant differences with MPX parents taking longer to
complete the task on the color and object categories (ES range 0.17 – 0.58). Similarly, Losh et al.
(2010) combined the color and object categories and reported index parents taking longer to complete
the task when compared with parents of typically developing children (ES not available). The
Woodcock-Johnson Psycho-Educational Battery – Revised (WJ-R) has several subtests, and no
significant differences were found in the broad reading (ES range 0.48 – 2.11) and reading skill
composite scores (Lindgren et al., 2009) (ES range 0.40 – 1.84), the word attack subtest (Piven &
Palmer, 1997; Lindgren et al., 2009) (ES range 0.09 – 1.35) and letter word subtest (Piven & Palmer,

29
1997). However, Folstein et al (1999) found a significantly lower reading age and reading grade using
the nonsense word reading subtest in index parents compared to parents of children with Down‘s
Syndrome (ES 0.40). Mothers of children with ASD performed better in the dictation (ES range 0.17
– 0.99, n = 2) and passage comprehension subtests (ES range 0.45 – 1.54, n = 2) compared to mothers
of children with specific language impairment (Lindgren et al., 2009). In contrast, Piven and Palmer
(1997) found MPX parents had more difficulties in the passage comprehension subtest when
compared with parents of children with Down‘s Syndrome. Interestingly, no differences were noted in
comprehension (ES range 0.12 – 0.36) and passage reading subtests (ES range 0.21 – 0.36) using the
Gray Oral Reading Test (GORT) (Folstein et al., 1999; Fombonne et al., 1997) and the Edinburgh
Reading Test (ERT) (Fombonne et al., 1997). Fombonne et al (1997) also used the National Adult
Reading Test (NART) (ES range 0.20 – 0.44, n = 2) reporting index parents scoring significantly
lower than parents of children with Down‘s Syndrome. However, Baron-Cohen & Hammer (1997)
found no significant differences in error scores between index parents and parents of typically
developing children. Whitehouse et al (2007) used the Test of Word Reading Efficiency (ES range
0.03 – 0.62) and found index parents performed better than parents of children with specific language
impairment on the phonemic decoding efficiency subtest (nonsense words). Finally, Schmidt et al
(2008) found no significant differences in reading difficulties using the Reading History
Questionnaire (RHQ) between index parents and unaffected adults (ES 0.34).
Three studies assessed spelling abilities using two different measures. Whitehouse et al (2007) found
no group differences using a Speeded Dictation task (ES not available). Furthermore, Fombonne et al
(1997) found a superior performance by index parents on the Schonell Spelling Test (SST) (ES range
0.02 – 0.13, n = 2). Only one study assessed oromotor functioning using the oromotor sequencing
subtest of the NEPSY Test Battery (ES range 0.43 – 0.54) reporting index families performing better
than parents of children with specific language impairment (Whitehouse et al., 2007).
Social cognition
In this domain measures assess the ability to process information relating to other people‘s mental
states. Five reports assessed the ‗Theory of Mind‘ using different versions of Reading the Mind in the
Eyes Test (ES range 0.03 – 1.51, n = 4). Three studies reported deficits between index parents and
comparison groups (Baron-Cohen & Hammer, 1997; Losh & Piven, 2007; Losh et al., 2009). In
contrast, Gocken et al (2009) and Tajmirriyahi et al (2013), found no significant group differences in
mental state decoding in the eyes test. Furthermore, Gocken et al (2009) explored mental state
decoding using a faces test and reported no significant differences between index parents and a
normative sample (ES 0.23). Tajmirriyahi et al (2013), however, used a novel method of Reading the

30
Mind in the Voice Test to reveal significantly higher deficits in mental state decoding in index parents
when compared to parents of children with Down‘s Syndrome and typical development (ES range
0.63 – 0.98). Additionally, Di Michele et al (2007) used False Belief Tasks (smarties task, Sally-Anne
task and unexpected transfer test) and found index parents passed fewer false belief tests in
comparison to parents of children with Down‘s Syndrome and typical development (ES not
available). Similarly, Gocken et al (2009) reported poorer performance in index parents compared to a
normative sample using the Unexpected Outcomes Test (UOT) (ES 0.58), however, they did not find
a significant difference using The Hinting Task (ES 0.36).
Remarkably, only one study assessed empathy using the Empathy Quotient (EQ) reporting significant
impairments in empathy in index fathers compared to unaffected males (Sucksmith et al., 2013) (ES
0.11 – 0.40).
Affect perception was assessed in eight studies using twelve different tests of emotion recognition and
labeling. Using the ‗Bubbles‘ method with pictures of facial affect, Adolphs et al (2008), showed no
difference in accuracy and reaction time, however, the ‗BAP+‘ group used significantly different
facial information (eye region and mouth region) in comparison to the ‗BAP-‗ group and parents of
typically developing children (ES not available). Using the Penn Emotion Recognition Test (ER40),
das Neves (2011) reported significantly longer time for correct responses in index parents compared
to unaffected adults (ES range 0.54 – 1.09). They also report less accurate responses, identification of
female and male faces as well as mild and extreme emotions. Bölte and Poustka (2003) showed no
significant differences in groups using the Facial Affect Recognition Test (pictures by Ekman and
Friesen) (ES range 0.32 – 2.06). Similarly, Sucksmith et al (2013) found no significant differences in
accuracy and adjusted response time in index parents compared to unaffected adults using the
Karolinska Directed Emotional Faces task (KDEF) (ES range 0.08 – 0.30). Kadak et al (2014), used
the Emotion Recognition Test (using photos of facial affect from Ekman and Friesen) and found index
parents had impaired recognition of happy, surprised and neutral faces compared to parents of
typically developing children (ES range 0.05 – 0.50).
Two studies assessed emotional labeling and matching of facial patterns using three different
measures. Using Schematic Line Drawings (ES not available), Palermo et al (2006) showed impaired
labeling for sad, disgust and overall recognition of facial patterns in index parents compared to
parents of typically developing children. In contrast, using the Emotion Matching Task (ES 0.06) and
the Emotion Labeling Task (ES 0.19), Smalley and Asarnow (1990) found no significant
impairments.

31
Executive function
Executive function encompasses abilities that underlie goal directed behavior. This broad domain was
split into specific subdomains. Cognitive flexibility was assessed by four studies evaluating set-
shifting tasks. Two studies using the Intradimensional/Extradimensional set shifting task (IDED)
revealed significantly higher rates of learned irrelevance (Wong et al., 2006) (ES 0.52), trials to
criterion (Hughes et al., 1997) (ES range 0.69 – 0.83) and errors to criterion (Hughes et al., 1997) (ES
range 0.64 – 0.70) in index parents compared to control samples in the Extradimensional Stage only.
However, Bölte & Poustka (2006) used the Wisconsin Card Sorting Test (WCST) (ES range 0.06 –
0.18) and the Trail Making Test (TMT – Parts A and B) (ES range 0.13 – 0.38) and found no impaired
cognitive control between groups. Similarly, Losh et al (2009) also showed no significant difference
in the total time to complete the TMT task between groups.
Five reports assessed planning abilities using two measures. Using the Tower of London (ToL) (ES
range 0.07 – 0.93, n = 2), Hughes et al (1997) found index parents requiring a significantly increased
number of extra moves to complete the task compared to unaffected adults. In contrast, Wong et al
(2006) found no significant group differences in the number of extra moves and rule violations. Three
studies used the Tower of Hanoi version (ToH) revealing no significant differences in the total time to
complete variable (ES range 0.01 – 0.45n = 1) between index parents and a matched clinical sample
(Bölte & Poustka, 2006) and non-clinical sample (Losh et al., 2009), and one study reporting
significant differences in planning efficiency between index parents and parents of children with
Down‘s Syndrome (Piven & Palmer, 1997).
One study assessed generativity using the Pattern Meanings test which measures ideational fluency,
indicated a significantly impaired overall response generativity in index parents compared to a mixed
sample of clinical and non-clinical comparison group (Wong et al., 2006) (ES 0.51).
Spatial working memory was assessed by one study using a Visual Search Test, indicating index
parents scoring significantly higher between search errors when compared to unaffected adults
(Hughes et al, 1997) (ES range 0.27 – 0.95). In contrast, however, using the Response to Inhibition
and Load (RIL) test, Wong et al (2006) tested inhibition and it‘s interaction with working memory
and found unimpaired reaction times and number of errors in index parents (ES range 0.04 – 0.28).
Verbal working memory was assessed using three measures by one study. Using the Stroop
Interference Test (ES 0.2) and a Verbal Fluency test (letters KAS in Turkish) (ES 0.26), Gocken et al
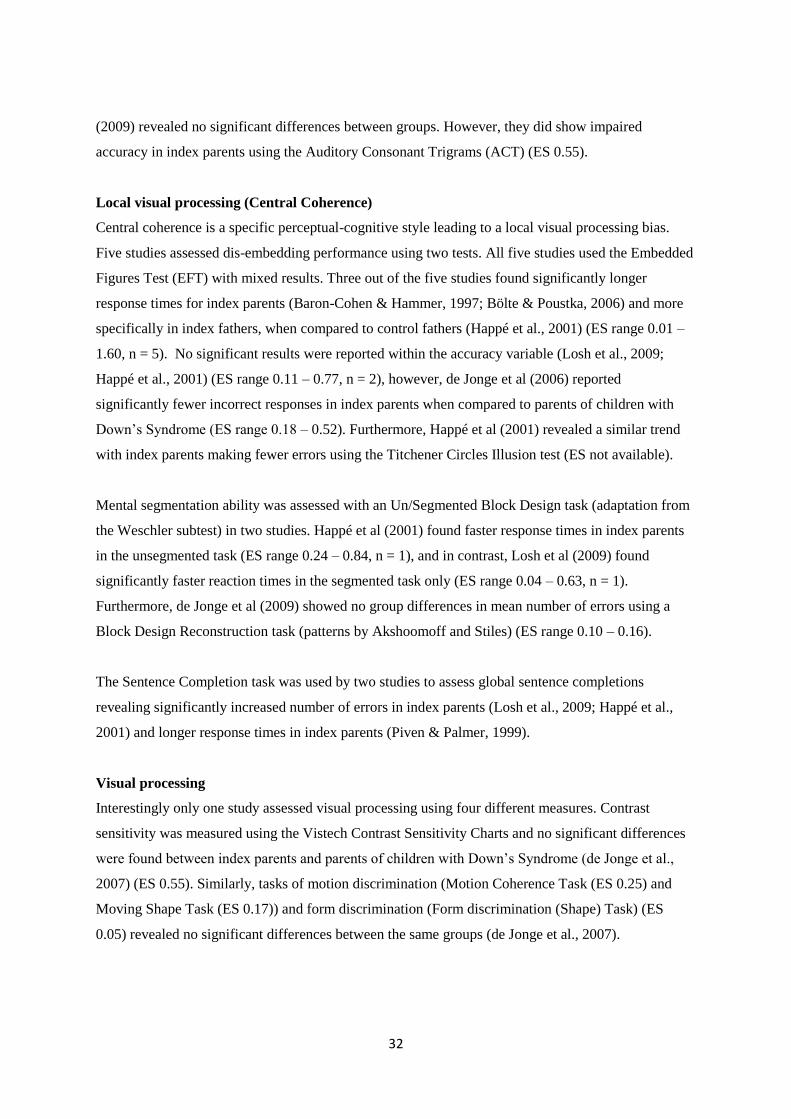
32
(2009) revealed no significant differences between groups. However, they did show impaired
accuracy in index parents using the Auditory Consonant Trigrams (ACT) (ES 0.55).
Local visual processing (Central Coherence)
Central coherence is a specific perceptual-cognitive style leading to a local visual processing bias.
Five studies assessed dis-embedding performance using two tests. All five studies used the Embedded
Figures Test (EFT) with mixed results. Three out of the five studies found significantly longer
response times for index parents (Baron-Cohen & Hammer, 1997; Bölte & Poustka, 2006) and more
specifically in index fathers, when compared to control fathers (Happé et al., 2001) (ES range 0.01 –
1.60, n = 5). No significant results were reported within the accuracy variable (Losh et al., 2009;
Happé et al., 2001) (ES range 0.11 – 0.77, n = 2), however, de Jonge et al (2006) reported
significantly fewer incorrect responses in index parents when compared to parents of children with
Down‘s Syndrome (ES range 0.18 – 0.52). Furthermore, Happé et al (2001) revealed a similar trend
with index parents making fewer errors using the Titchener Circles Illusion test (ES not available).
Mental segmentation ability was assessed with an Un/Segmented Block Design task (adaptation from
the Weschler subtest) in two studies. Happé et al (2001) found faster response times in index parents
in the unsegmented task (ES range 0.24 – 0.84, n = 1), and in contrast, Losh et al (2009) found
significantly faster reaction times in the segmented task only (ES range 0.04 – 0.63, n = 1).
Furthermore, de Jonge et al (2009) showed no group differences in mean number of errors using a
Block Design Reconstruction task (patterns by Akshoomoff and Stiles) (ES range 0.10 – 0.16).
The Sentence Completion task was used by two studies to assess global sentence completions
revealing significantly increased number of errors in index parents (Losh et al., 2009; Happé et al.,
2001) and longer response times in index parents (Piven & Palmer, 1999).
Visual processing
Interestingly only one study assessed visual processing using four different measures. Contrast
sensitivity was measured using the Vistech Contrast Sensitivity Charts and no significant differences
were found between index parents and parents of children with Down‘s Syndrome (de Jonge et al.,
2007) (ES 0.55). Similarly, tasks of motion discrimination (Motion Coherence Task (ES 0.25) and
Moving Shape Task (ES 0.17)) and form discrimination (Form discrimination (Shape) Task) (ES
0.05) revealed no significant differences between the same groups (de Jonge et al., 2007).

33
2.3.5. Other psychiatric conditions domain
This domain was assessed in seven reports using nine different measures. Refer to Appendix 4 for the
review of other psychiatric conditions of parents of autistic probands. Piven et al (1991) used the
Schedule for Affective Disorders and Schizophrenia - Lifetime Version (SADS-L) and found
significantly higher scores in the ‗Anxiety‘ factor when compared to parents of children with Down‘s
Syndrome, and no statistical significance was found for the ‗Major Depressive Disorder‘ subscale
between the two groups (ES not available). However, using a modified version of the Schedule for
Affective Disorders and Schizophrenia - Lifetime Version Modified for the Study of Anxiety
Disorders, Revised (SADS-LA-R), Piven and Palmer (1999) did find significantly higher frequency of
‗Major Depressive Disorder‘ in index parents in addition to the ‗Social Phobia‘ factor.
Micali et al (2004) devised a parental questionnaire and validated their results from consented medical
records from GPs, found a significant trend towards higher prevalence of ‗Depression‘ and ‗Anxiety‘
in index parents. Using the Symptom Checklist-90-Revised (SCL-90-R), Bölte et al (2007), found
significantly increased frequency in index parents in four of the nine subscales (Depression, Hostility,
Phobic-anxiety and Paranoid Ideation) (ES range 0 – 1.33). Additionally, Bölte et al (2007) also
assessed personality style and disorder using the Personality Style and Disorder Inventory (PSSI), and
reported significantly higher rates in index parents in five out of fourteen factors (Reserved/Schizoid,
Self-critical/Insecure, Critical/Negativistic, Spontaneous/Borderline and Quiet/Depressive) (ES range
0.02- 1.18).
Gocken et al (2009) assessed Depression and Anxiety factors using the Brief Psychiatric Rating Scale
(BPRS) between index parents and a normative comparison group and only found a statistically
significant difference in the Depression factor with index parents scoring higher (ES range 0.29 –
0.44). Similarly, Ingersoll et al (2011) assessed depressed mood using the Centre for Epidemiological
Studies – Depression Scales (CESD) and showed index mothers as having increased rates of
depression when compared to a normative sample of mothers (ES 0.35). Interestingly, Berthoz et al
(2013), reported no significant differences in levels of depressive mood using the Beck Depression
Inventory (BDI) (ES 0.50) and no significant differences were found in Anxiety levels using the State
(ES 0.19) and Trait portions (ES 1.24) of State-Trait Anxiety Inventory Form Y (STAI-Y) (Berthoz et
al., 2013).
2.4. Discussion
This systematic review aimed to assess the evidence of behavioral, cognitive and psychiatric profiles
of the BAP in unaffected biological parents of autistic probands by synthesizing the evidence from 60
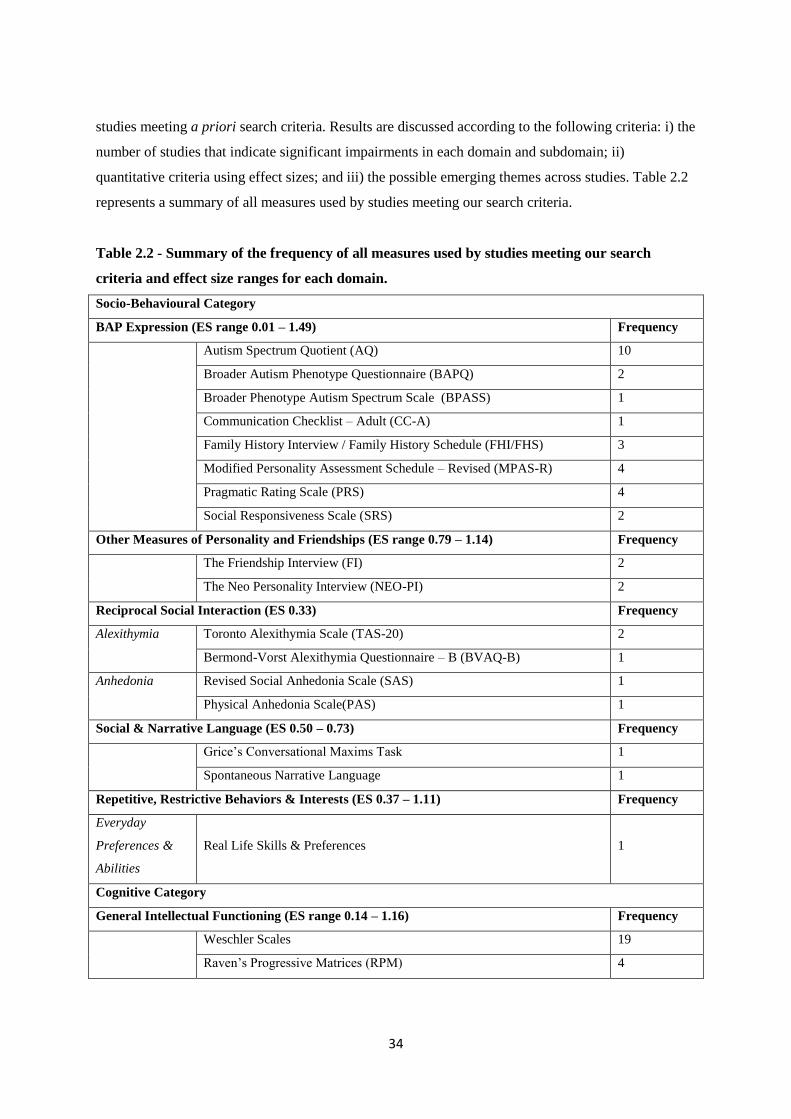
34
studies meeting a priori search criteria. Results are discussed according to the following criteria: i) the
number of studies that indicate significant impairments in each domain and subdomain; ii)
quantitative criteria using effect sizes; and iii) the possible emerging themes across studies. Table 2.2
represents a summary of all measures used by studies meeting our search criteria.
Table 2.2 - Summary of the frequency of all measures used by studies meeting our search
criteria and effect size ranges for each domain.
Socio-Behavioural Category
BAP Expression (ES range 0.01 – 1.49) Frequency
Autism Spectrum Quotient (AQ) 10
Broader Autism Phenotype Questionnaire (BAPQ) 2
Broader Phenotype Autism Spectrum Scale (BPASS) 1
Communication Checklist – Adult (CC-A) 1
Family History Interview / Family History Schedule (FHI/FHS) 3
Modified Personality Assessment Schedule – Revised (MPAS-R) 4
Pragmatic Rating Scale (PRS) 4
Social Responsiveness Scale (SRS) 2
Other Measures of Personality and Friendships (ES range 0.79 – 1.14) Frequency
The Friendship Interview (FI) 2
The Neo Personality Interview (NEO-PI) 2
Reciprocal Social Interaction (ES 0.33) Frequency
Alexithymia Toronto Alexithymia Scale (TAS-20) 2
Bermond-Vorst Alexithymia Questionnaire – B (BVAQ-B) 1
Anhedonia Revised Social Anhedonia Scale (SAS) 1
Physical Anhedonia Scale(PAS) 1
Social & Narrative Language (ES 0.50 – 0.73) Frequency
Grice‘s Conversational Maxims Task 1
Spontaneous Narrative Language 1
Repetitive, Restrictive Behaviors & Interests (ES 0.37 – 1.11) Frequency
Everyday
Preferences &
Abilities
Real Life Skills & Preferences
1
Cognitive Category
General Intellectual Functioning (ES range 0.14 – 1.16) Frequency
Weschler Scales 19
Raven‘s Progressive Matrices (RPM) 4

35
Structural Language Abilities (ES range 0.04 – 1.65) Frequency
Receptive
Language
Peabody Picture Vocabulary Test (PPVT-III) 2
Test for Reception of Grammar - 2 (TROG-2) 1
Expressive
Language
Expressive Vocabulary Test (EVT) 1
Verbal Fluency Subtest - Delis Kaplan Executive Function System (DK-
EFS)
1
Figurative
Language
Figurative Language Subtest - Test of Language Competence – Expanded
(TOLC-E)
1
Phonological
Awareness
Comprehensive Test of Phonological Processing (CTOPP) 2
Nonword Memory Test 1
Nonsense Passage Reading Test 1
Nonsense Words Subtest - Nepsy Test Battery 1
Battery of Verbal Tasks (inc. orthographic & phonological abilities) 1
Reading Abilities Rapid Automized Naming (RAN) 2
Woodcock-Johnson Psycho-Educational Battery – Revised (WJ-R) 3
Gray Oral Reading Test (GORT) 2
Edinburgh Reading Test (ERT) 1
National Adult Reading Test (NART) 2
Test of Word Reading Efficiency 1
Reading History Questionnaire (RHQ) 1
Spelling Abilities Schonell Spelling Test (SST) 1
Speeded Dictation Task 2
Oromotor
Functioning
Oromotor Sequencing Subtest - NEPSY Test Battery 1
Social Cognition (ES range 0.05 – 1.51) Frequency
Theory of Mind Reading the Mind in the Eyes Test (different versions) 5
The Faces Test 1
Reading the Mind in the Voice Test 1
False Belief Tasks (Smarties task; Sally-Anne task; unexpected transfer
test)
1
Unexpected Outcomes Test (UOT) 1
The Hinting Task 1
Empathy Empathy Quotient (EQ) 1
Affect
Perception /
Emotion
Recognition
Pictures of Facial Affect – ‗Bubbles‘ Method 1
Penn Emotion Recognition Test (ER40) 1
Facial Affect Recognition Test 1
Emotion Recognition Test 1

36
Karolinska Directed Emotional Faces task (KDEF) 1
Point Light Basic Emotions task 1
Trustworthiness of Faces task 1
The Morphed Faces task 1
The Movie Still task 1
Schematic Line Drawings task 1
Emotion Matching Task 1
Emotion Labeling Task 1
Executive Function (ES range 0.27 – 1.27) Frequency
Set-Shifting Intradimensional – Extradimensional Set-Shifting task (IDED) 2
Wisconsin Card Sorting Test (WCST) 1
Trail Making Test (A & B) 2
Planning Tower of London (ToL) 2
Tower of Hanoi (ToH) 3
Generativity /
Ideational
Fluency
Pattern Meanings 1
Spatial Working
Memory /
Inhibition
Visual Search Test 1
The Delayed Oculomotor Task 1
Response Inhibition & Load (RIL) 1
Verbal Working
memory
Auditory Consonant Trigrams (ACT) 1
Verbal Fluency Test 1
Stroop Interference Test 1
Central Coherence (Local Visual Processing) (ES range 0.18- 1.60) Frequency
Disembedding
Performance
Embedded Figures Test (EFT) 5
Titchener Circles Illusion 1
Mental
Segmentation
Ability
Unsegmented Block Design Task (adapted from Weschler Scales) 2
Segmented Block Design Task (adapted from Weschler Scales) 2
Block Design task (Weschler scales) 2
Block Design Reconstruction task 1
Attentional
Engagement
Detection Task 1
Global Sentence
Completions
Sentence Completion Task 2
Visual Processing (ES not available) Frequency
Contrast Vistech Contrast Sensitivity Charts 1

37
Sensitivity
Motion
Discrimination
Motion Coherence Task 1
Moving Shape Task 1
Form
Discrimination
Form Discrimination (Shape) Task 1
Other Psychiatric Conditions Category (Depression and Anxiety)
(ES range 0 – 1.33)
Frequency
Brief Psychiatric Rating Scale (BPRS) 1
Personality Style & Disorder Inventory (PSSI) 1
Symptom Checklist 90 – Revised (SCL-90-R) 1
Schedule for Affective Disorders and Schizophrenia – Lifetime Version
(SADS-L)
1
Schedule for Affective Disorders and Schizophrenia – Lifetime Version
Modified for the Study of Anxiety Disorders – Revised (SADS-LA-R)
1
Parental Questionnaire 1
The Centre for Epidemiological Studies – Depression Scales (CESD) 1
Beck Depression Inventory (BDI) 1
State-Trait Anxiety Inventory Form Y (STAI-Y) 1
Note. BAP = Broader Autism Phenotype; ES = Effect Size.
2.4.1. Summary of findings
Findings emerging from this review are discussed according to each domain. Within the socio-
behavioural domain, eight measures that directly assess the BAP expression in unaffected parents
showed substantial deficits in the domain of social and communication skills (AQ, 7/10 studies;
BPASS, 1 study; CC-A, 1 study; FHI/FHS, 2/2 studies; SRS, 2/2 studies), rigid and perfectionistic
(BAPQ, 2/2 studies; MPAS-R, 3/3 studies) and aloof (BAPQ, 2/2; MPAS-R, 3/4 studies) personality
traits as well as pragmatic language difficulties (BAPQ, 2/2 studies; PRS, 4/4 studies) related to the
core deficit in ASD and are reported consistently across most studies. Moreover, additional deficits in
social and narrative language have been highlighted using measures of spontaneous narrative
discourse (Landa et al., 1992) and the Grice‘s Conversational Maxims task (Di Michele et al., 2007).
Available evidence also points to index parents establishing fewer friendships (FI, 2/2 studies) and an
elevated frequency of neuroticism (NEO-PI, 2/2 studies). Despite being a core domain of a clinical
diagnosis for ASD, the majority of findings in parents of autistic probands corresponding to restricted
and repetitive behaviors and interests are covered in the studies that assess the BAP in terms of rigid
and perfectionistic personality styles. Only one study used an experimental questionnaire designed to

38
examine -real life non-social skills and preferences such as insistence on routines and circumscribed
hobbies (Briskman et al., 2001).
Within the socio-behavioural domain, reciprocal social interaction is probably the least studied
subdomain in parents of autistic probands. As such, findings from alexithymia (TAS-20, 1/2 studies;
BVAQ-B, 1 study with no significance found) and physical (PAS, 1/1 study) and social anhedonia
(SAS, 1 study with no significance found) are modest and require further studies to explore these
traits. Thus, I agree with previous reviews (Cruz et al., 2013; Gerdts & Bernier, 2011; Sucksmith et
al., 2011) indicating that mild social/communication deficits, rigid/aloof personality traits and
pragmatic language difficulties may be the most useful social behavioral candidate endophenotype
traits as they meet all the established criteria (Gottesman & Gould, 2003), however, effect sizes
throughout this domain varied considerably.
At the cognitive level, a remarkable finding is the discrepancies found in intellectual functioning of
parents of autistic probands compared to parents of children with and without a clinical diagnosis.
One of thirteen studies revealed significantly higher VIQ scores when compared to a clinical sample
of parents of a child with Down‘s Syndrome Fombonne et al., 1997). Three of thirteen studies
assessing PIQ reached a similar significant trend when compared to parents with a Down‘s Syndrome
child (Folstein et al., 1999; Piven & Palmer, 1997) and unaffected adults (Schmidt et al., 2008). Total
PIQ scores were significantly higher in index parents when compared to parents with a child with
specific language impairment (Lindgren et al., 2009). Only two of twelve reports reached a significant
deficit in FSIQ when index parents were compared to parents of children with Down‘s Syndrome
(Folstein et al., 1999) and when compared to a combined sample of parents of a child with Down‘s
Syndrome and of typical development. However, it is noteworthy that scores for all parents were well
within the average range in all studies. Thus there is limited evidence for the role of intellectual
functioning as an endophenotype for ASD with no clear clinical significance.
Several measures were used to assess the structural language abilities within the cognitive domain.
Interestingly, no significant differences were found in the expressive language (TROG-2, 1 study with
no significance found; EVT, 1 study with no significance found; DK-EFS Verbal Fluency Subtest, 1
study with no significance found) and figurative language categories (TOLCE-E Figurative Language
Subtest, 1 study with no significance found). Lindgren et al (2009) found index parents to perform
better than parents with a child with a specific language impairment on measures assessing receptive
language (PPVT III, 1/2 studies; TROG-2, 1 study with no significance found) refuting the hypothesis

39
that families with ASD and specific language impairment don‘t share similar genetic loading for
language.
In phonological awareness, findings are mixed with studies only reporting few deficits in nonsense
word/passage reading tests (2/3 studies) with index parents performing better than parents with a
specific language impairment child (Whitehouse et al., 2007) and parents of children with Down‘s
Syndrome (Folstein et al., 1999). Using the RAN measure for reading skills, two studies reported
faster times to complete the colour and object only tasks in index parents when compared to parents of
children with Down‘s Syndrome (piven & Palmer et al., 1997) and parents of typically developing
children (Losh et al., 2010). This may have relevance with regards to perceptual load in ASD.
However, no significant differences were found in the rapid naming subtest of the CTOPP (Lindgren
et al., 2009).
Findings from the social cognition domain including mental state decoding, affect perception,
emotion recognition and labeling in the BAP also report mixed and conflicting results. Remarkably
only one studied assessed empathy warranting further research in this subdomain.
Evidence from the broad domain of executive function in the BAP is also inconsistent but it is worth
noting the few studies that have found impairments did not appropriately match experimental and
control groups for IQ (e.g. Hughes et al., 1997).
Similarly, findings from studies assessing performance on tests where local visual processing is an
advantage (central coherence) were mixed in studies of the BAP. Conflicting results in the
disembedding performance was noted (EFT, 4/8 studies; Titchener Circles Illusion, 1 study) as well as
mental segmentation abilities (Unsegmented Block Design task, 1/2 studies; Segmented Block Design
task, 1/2 studies; Block Design Reconstruction Task, 1 study with no significance found). Two
studies, however, indicate higher frequency of errors and response times in index parents during a
global sentence completion task (Sentence Completion task, 2/2 studies). Nonetheless, this area of
cognition in the BAP also warrants further research.
Lastly, a number of studies have documented higher rates of depression (in 5/7 measures), anxiety (in
2/6 measures) and social phobia/social phobic anxiety (in 4/6 measures) in parents of children with
ASD compared to normative samples (e.g. Gocken et al., 2009) and a clinical sample (e.g. Bölte et al.,
2007). I also note depression and anxiety to be more prevalent (2/6 studies) in mothers of children
with ASD. Ingersoll et al (2011) reported increased depressed mood in index mothers when compared
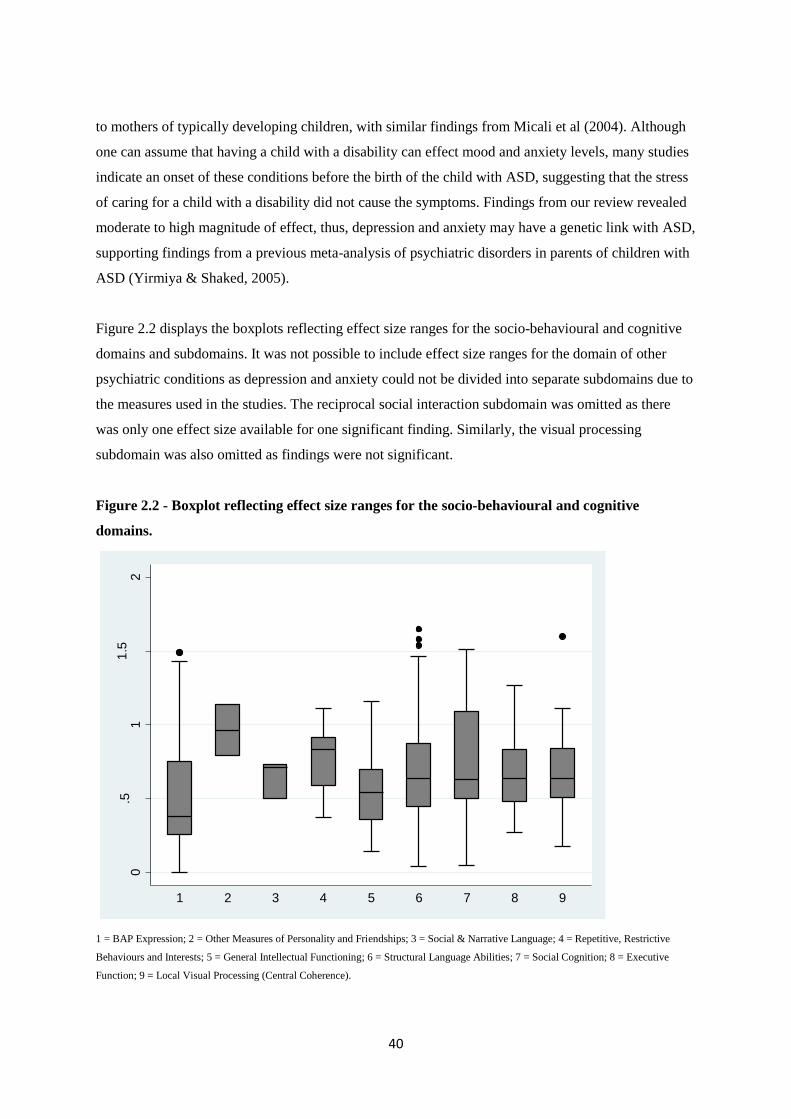
40
to mothers of typically developing children, with similar findings from Micali et al (2004). Although
one can assume that having a child with a disability can effect mood and anxiety levels, many studies
indicate an onset of these conditions before the birth of the child with ASD, suggesting that the stress
of caring for a child with a disability did not cause the symptoms. Findings from our review revealed
moderate to high magnitude of effect, thus, depression and anxiety may have a genetic link with ASD,
supporting findings from a previous meta-analysis of psychiatric disorders in parents of children with
ASD (Yirmiya & Shaked, 2005).
Figure 2.2 displays the boxplots reflecting effect size ranges for the socio-behavioural and cognitive
domains and subdomains. It was not possible to include effect size ranges for the domain of other
psychiatric conditions as depression and anxiety could not be divided into separate subdomains due to
the measures used in the studies. The reciprocal social interaction subdomain was omitted as there
was only one effect size available for one significant finding. Similarly, the visual processing
subdomain was also omitted as findings were not significant.
Figure 2.2 - Boxplot reflecting effect size ranges for the socio-behavioural and cognitive
domains.
1 = BAP Expression; 2 = Other Measures of Personality and Friendships; 3 = Social & Narrative Language; 4 = Repetitive, Restrictive
Behaviours and Interests; 5 = General Intellectual Functioning; 6 = Structural Language Abilities; 7 = Social Cognition; 8 = Executive
Function; 9 = Local Visual Processing (Central Coherence).
0.5
11
.52
Effe
ctS
ize
1 2 3 4 5 6 7 8 9

41
2.4.2. Emerging themes
A number of studies reviewed suggest that subclinical autistic traits aggregate in MPX families and
occur less frequently in SPX families (Bernier et al., 2012; Losh et al., 2008). For instance a
decreased number and intensity of BAP traits observed in parents of SPX in comparison to MPX
provide behavioral evidence consistent with findings of increased de novo, non-inherited genetic
events in SPX families (e.g. Sebat et al., 2007). Losh et al (2008) suggest that the BAP gradation
expression across family types is consistent with increasing genetic liability to ASD.
A male bias is a well-documented feature in ASD (Werling & Geschwind, 2013). Findings from our
review also indicate few sex differences, indicating this male bias (Ruser et al., 2007; De la Marche et
al., 2012; Schwichtenberg et al., 2010). However, despite this and the clear sex bias in ASD, many
studies do not suggest sex differences for most BAP features (e.g. Klusek et al., 2014).
Furthermore, our findings indicate that the majority of the studies reviewed were conducted in
Western countries. There were too few studies from non-Western countries to make any meaningful
comparisons. Further cross-cultural research is required to understand the endophenotypes of ASD
within different cultural and geographical settings in order to tackle this geographical distribution
bias.
2.4.3. Measure quality
It is clear from this review that a large number of measures have been utilized to assess the BAP in
relation to different domains and the constructs analyzed are heterogeneous. However it should be
noted that the current review does not assess in depth whether the BAP measures are valid or reliable
in measuring BAP. Domain-wise, in many cases the same measures have been used by other studies. I
discuss whether results for each measure in the same domain show the same magnitude and in the
same direction.
For instance, Davidson et al (2014) reported that frequency of BAP traits vary significantly depending
upon the measure utilized, highlighting the need for a different approach that utilizes multiple
informants and relies on the assessment of distinct BAP traits.
2.4.4. Methodological limitations of studies
Any discordant findings in the studies reviewed may be partly explained by methodological
differences between studies. Sample size and choice of comparison group play an important role in
42
the outcome of results. Six studies enrolled 30 or less index parents. Thus, relatively small sample
sizes may lead to false negative results and/or limit the power to detect the BAP in the three domains.
Studies vary in their choice of a comparison group with some relying on the convenience of clinic-
based samples where selection biases may lead to distorted results and others emphasizing the use of
population based samples. For example, parents of children with Down‘s Syndrome were frequently
used, but these parents are likely to be older and possibly different socio-economic status. Few studies
matched index parents to control groups on intellectual functioning, age and socio-economic basis,
thus making it difficult to assimilate if differences on specific cognitive tasks represent a specific
impairment in functioning or are attributable to differences in demographic data.
2.4.5. Limitations and future directions
In addition to the limitation outlined above, there are other limitations. Given that nine additional
studies were found through a manual search after the initial search, it is possible that other studies
were not ascertained by our search terms. To address this limitation, future research may also consider
additional search terms beyond those used here.
This review aimed to identify endophenotypes in behavioral, cognitive and psychiatric domains
independently, and as such we did not assess associations between the BAP features across different
domains. Losh et al (2009) suggest that it is likely that specific BAP traits co-segregate with
performance in other domains. For instance, parents displaying rigid/perfectionistic personality traits
could perform differently on tasks requiring cognitive flexibility. Additionally, most studies meeting
our search criteria assessed only one or two domains, rendering it difficult to establish whether an
endophenotypic overlap, if any, exists.
Future reviews should also include studies that examine neuroanatomical and neurofunctional
correlates of the BAP. These are essential in furthering our understanding of the neural correlates of
the behavioral, cognitive and psychiatric aspects of ASD.
More sophisticated research of the endophenotypes of parents of children with ASD may help develop
better measures of evaluation of the BAP. Future studies should use a more comprehensive and
quantitative framework using more robust measures to detect subtle subclinical autistic traits in the
BAP in cross-cultural settings. To the best of our knowledge, no study assessing the endophenotypic
profile of ASD in Africa has been published yet. Such research by our team is underway.

43
2.4.6. Conclusions
In summary, the current review increases our understanding of the BAP and extends the findings of
previous reviews (Gerdts & Bernier, 2011; Sucksmith et al., 2011). It also supplements a systematic
review (Cruz et al., 2013) and a meta-analysis (Yirmiya & Shaked, 2005) with a broader scope.
However, findings should be interpreted with caution because of the small number of studies in such
heterogeneously broad domains and other methodological limitations.
The assessment of the BAP profile in parents of autistic probands allows us to have a better insight
into the varying underlying genetic mechanisms in ASD. The behavioral, cognitive and psychiatric
endophenotypes in parents of autistic probands are still not clarified, however, evidence points
towards mild social/communication deficits, rigid/aloof personality traits and pragmatic language
difficulties as the most useful social behavioral candidate endophenotype traits. The existence of some
deficits in the cognitive domain, does suggest familial vulnerability for ASD, however, more research
is required to elucidate these findings within this domain. Furthermore, increased depressed mood and
anxiety can also be useful markers of vulnerability.
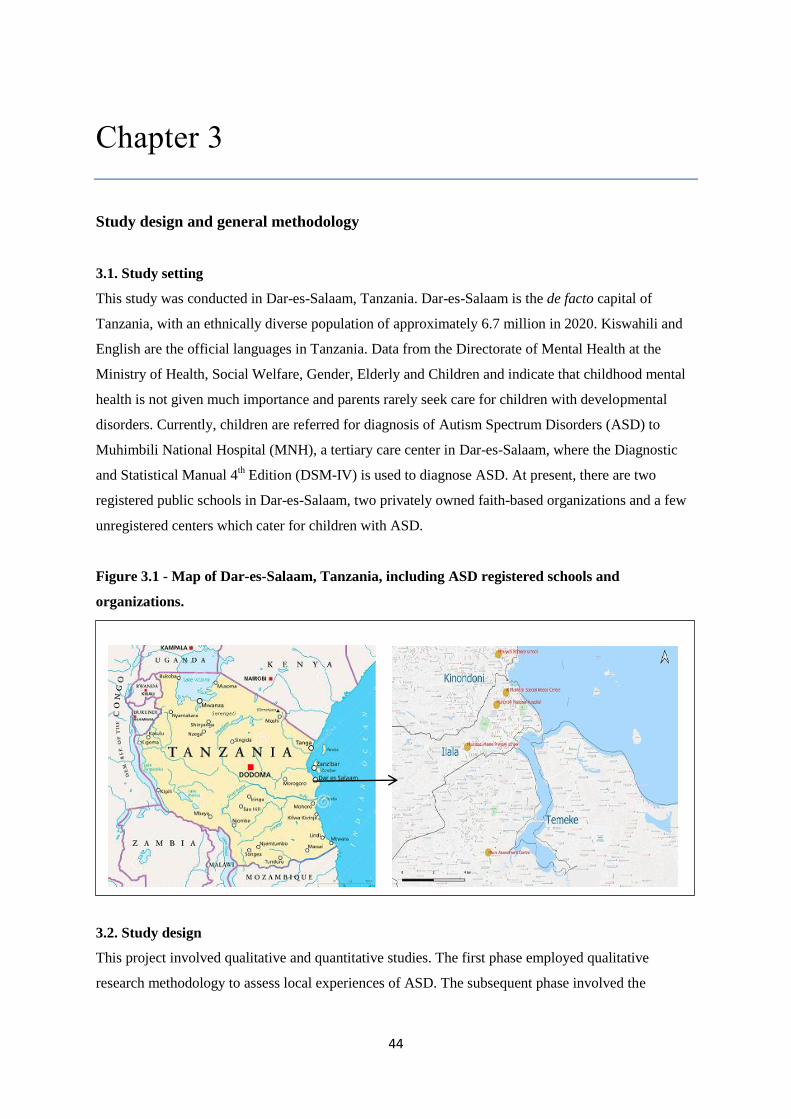
44
Chapter 3
Study design and general methodology
3.1. Study setting
This study was conducted in Dar-es-Salaam, Tanzania. Dar-es-Salaam is the de facto capital of
Tanzania, with an ethnically diverse population of approximately 6.7 million in 2020. Kiswahili and
English are the official languages in Tanzania. Data from the Directorate of Mental Health at the
Ministry of Health, Social Welfare, Gender, Elderly and Children and indicate that childhood mental
health is not given much importance and parents rarely seek care for children with developmental
disorders. Currently, children are referred for diagnosis of Autism Spectrum Disorders (ASD) to
Muhimbili National Hospital (MNH), a tertiary care center in Dar-es-Salaam, where the Diagnostic
and Statistical Manual 4th Edition (DSM-IV) is used to diagnose ASD. At present, there are two
registered public schools in Dar-es-Salaam, two privately owned faith-based organizations and a few
unregistered centers which cater for children with ASD.
Figure 3.1 - Map of Dar-es-Salaam, Tanzania, including ASD registered schools and
organizations.
3.2. Study design
This project involved qualitative and quantitative studies. The first phase employed qualitative
research methodology to assess local experiences of ASD. The subsequent phase involved the

45
evaluation of the psychometric properties of the Social Communications Questionnaire (SCQ) and it‘s
utility as a screening measure in my sample, an evaluation of the Autism Spectrum Quotient (AQ) and
investigating the broader autism phenotype (BAP) in parents of children with ASD, as well as a case-
control study to determine the risk factors for ASD in this region.
3.3. Sample size determination
3.3.1 Validation of the SCQ study
In order to obtain reliable and valid computations, a minimum sample size of 100 participants is
required (Kline, 1979; MacCallum et al. 1999). For discriminant validity, I estimated sample sizes
based on a validation study conducted in China (Guo et al., 2011) that had a similar design to my
proposed study. In the Chinese study, the adapted measure was validated based on data from three
groups of children; those with a previous diagnosis of ASD, those with neurodevelopmental disorders
and typically developing children. The differences in test scores between children with autistic traits
(Mean = 25.3, SD = 9.20) and those with a neurodevelopmental disorder (Mean = 12.2, SD = 10.6)
were large. I assumed a Gaussian distribution. Using these mean scores I computed an effect size,
Cohen d = 1.36. This effect size indicates that I would be able to detect the differences in performance
in a minimum sample size of 40 children. Taking into consideration that I am working in a new region
with little or limited expertise compared to China, I computed the sample size based on a more
modest effect size of 0.7, an alpha of 0.05 and assuming a power of 95%; which indicates that a total
of 100 children are needed to detect differences in performance.
3.3.2 Risk factor study
In order to establish a sample size requirement for the risk factor study, I estimated sample sizes based
on a risk factor study conducted in India (Mamidala, 2014) in which they assess pre and perinatal risk
factors for ASD. I chose fetal distress as the risk variable of interest for the purpose of sample size
determination. Using the percentages of distribution of risk factor in children with ASD (23%) and
typically developing children (4.2%), I applied a likelihood ratio test of 2 independent proportions at
90% power and 5% significance level. Using these assumptions, I would need at least 122 children,
half of whom are cases and the other half controls to measure the risk factors in my study. The
children were matched based on their level of expressive language which is necessary for assessments
with the ADOS-2 Modules. Epidemiologically, this may have introduced selection bias, and so
regression models of case-control studies of risk factors should be adjusted for chronological age, to
circumvent this issue.

46
3.3.3 Broader Autism Phenotype (BAP) study
In order to establish a sample size requirement for the endophenotype study, I estimate sample sizes
based on a recent broader ASD phenotype study conducted in Turkey (Kadak, 2014) in which they
use the AQ on parents of children with ASD and parents of typically developing children. This would
give an indication of how many parents need to be screened in order to detect broader autism
phenotype traits in this study, and thus enables us to establish how many children with ASD need to
be identified in the previous study. Using mean scores of parents of children with ASD (Mean= 19.63,
SD= 5.42) and parents of typically developing children (Mean= 17.61, SD= 4.57) I computed an
effect size, Cohen d= 0.39. With an alpha of 0.05 and assuming a power of 90%, a total of 240
parents, half of whom are cases and the other half controls, are needed to detect differences in
performance for discriminant validity.
3.4. Assessment measures
3.4.1. ASD screening measure
Social Communication Questionnaire (SCQ - Rutter et al., 2003): The Lifetime version of the SCQ
is a brief 40-item yes/no questionnaire that helps to evaluate communication skills and social
functioning in children who may have ASD. This questionnaire is a cost effective way of screening
for referral for a complete diagnostic evaluation. It is administered to a parent or other primary
caregiver and takes less than 10 minutes. The SCQ is suggested for use in children above 4 years of
age and is not appropriate for children with a mental age younger than 2 years. The SCQ has strong
discriminating power between those with and without ASD (Chandler et al., 2007) and has been
translated and validated cross-culturally in German (Bölte et al., 2008b), Portuguese (Sato et al.,
2009), Chinese (Gau et al., 2011), Turkish (Avcil et al., 2015) and Greek (Zarokanellou et al., 2017).
In addition to the Total Score, the SCQ can also be used to provide sub-scores that match the
Reciprocal Interaction domain, the Communication domain and the Restricted, Repetitive and
Stereotyped Patterns of Behaviour domain of the ADI-R.
3.4.2. Additional tools used to aid confirmation of the diagnosis of ASD in probands
Autism Diagnostic Observation Schedule, 2nd
Edition (ADOS - Lord et al., 2000; ADOS-2 - Lord et
al., 2012): The ADOS is designed to diagnose and assess ASD using a series of structured and semi-
structured tasks that involve social interaction between the examiner and the subject. It consists of
four modules; each attuned to differing developmental and language levels, ranging from little if any
expressive and receptive language, and therefore can be administered to subjects ranging from
children as young as 18 months through adolescence and adulthood. Each module takes 30 to 40
minutes to administer, making it a quick and robust instrument. The ADOS has been found to have

47
exceptional diagnostic sensitivity and specificity (Lord et al., 2000). Other diagnostic tools for ASD
are also available including the Autism Diagnostic Interview Revised (ADI-R; Le Couteur et al.,
2003), the Diagnostic Interview for Social and Communication Disorders (DISCO; Wing et al., 2002)
and the Developmental, Dimensional and Diagnostic Interview (3Di; Skuse et al., 2004), all of which
use interview techniques with parents or caretakers as a means of collecting information concerning
the developmental history and current behaviour. The ADOS, however, is an observational
assessment and can be used to evaluate almost anyone suspected of having ASD, from toddlers to
adults, from children with no speech to adults who are verbally fluent.
Diagnostic Statistical Manual of Mental Disorders, 5th
Edition (DSM-5 - APA, 2013): A DSM-5
checklist and guidelines were used for clinical assessments of the children in my sample (Appendix
5). The DSM-5 defines ASD within two domains; ―persistent difficulties with social communication
and social interaction‖ and ―restricted and repetitive patterns of behaviours, activities and interests
(this includes sensory behaviour). To diagnose the child with ASD, he/she must display all 3 criteria
under the social interaction and social communication domain and at least 2 out of 4 under the
restricted interests and repetitive behaviour domain. The symptoms must be present since early
childhood and limit and impair everyday functioning. The DSM-5 also requires a severity rating be
given for each domain ranging from requiring some support to requiring very substantial support.
3.4.3. Broader Autism Phenotype (BAP) measure
Autism Spectrum Quotient - Adult (AQ – Baron-Cohen et al., 2001): This is a self-report
questionnaire used as a measure of the extent of autistic traits in adults. There are 50-items covering
behaviors from 5 domains; communication, social skills, attention switching, imagination and
attention to detail. Participants rate to what extent they agree or disagree on statements on a 4-point
Likert scale. It is quick and easy to use and produces a near normal distribution in the general
population (Baron-Cohen et al., 2001). The AQ has been used extensively and has been shown to
have consistent results across culture (e.g. Dutch AQ: Hoekstra et al., 2008; Japanese AQ:
Wakabayashi et al., 2006), and the AQ score is a good predictor of clinical diagnosis (Woodbury-
Smith et al., 2005). Wheelwright et al (2010) have documented the AQ as providing an efficient
method for quantifying where an individual lies along the dimension of autistic traits, and extends the
notion of a broader phenotype among first degree relatives of those with ASD.
3.4.4. Socio-demographic questionnaire
A socio-demographic questionnaire was used to collect data for each participant‘s family and socio-
demographic information (Appendix 6). This was designed based on prior used questionnaires from a
48
similar setting (e.g. Kariuki et al., 2016). Additionally, it included information on past medical history
based on the probable risk factors of ASD from existing literature and those likely to be specific and
common in this setting. Care was taken to analyse and include the most relevant and specific risk
factors. The risk factors analysed were:
Parental factors: Maternal age at delivery, maternal age at first birth, paternal age at delivery,
parental marital status, parental religion, parental ethnicity, parental education, parental
occupation, parental age gap, birth order, birth weight and number of children ever born.
Prenatal factors: Pregnancy medical complications (gestational hypertension, gestational
diabetes, eclampsia, maternal bleeding), pregnancy infections (prenatal fever, malaria during
pregnancy), medication use during pregnancy (antibiotics), pre-term birth (≤ 37 weeks).
Perinatal factors: Assisted delivery (vacuum mediated delivery), labour complications
(induced labour, prolonged labour), birth complications (breech presentation, umbilical cord
complications, meconium aspiration), adverse perinatal events (birth asphyxia, delayed birth
cry, difficulties breastfeeding).
Neonatal factors: Low birth weight (< 2.5 kg), neonatal jaundice, neonatal seizures
immediately after birth.
Postnatal medical factors: Family history of seizures, seizures disorders, malaria (before the
age of 3 years), head injury associated with loss of consciousness (before the age of 3 years).
3.4.5. Neuropsychological testing
For the purpose of this study, I used the adapted version of the Raven‘s Coloured Progressive
Matrices (CPM; Raven et al., 1998; Adapted version; Kitsao-Wekulo et al., 2012) and the adapted
version of the Peabody Picture Vocabulary Test (PPVT; Dunn & Dunn, 1981; Adapted version;
Holding et al., 2004), both providing sound psychometric properties (internal consistency ≥ .70; test
reliability ≥.75) enabling reliable administration by a trained person without previous experience in
testing.
The Raven‘s CPM measures reasoning ability and is designed for young children between 5 to 12
years of age, older adults and mentally and physically impaired persons. The test consists of 36 items
in 3 sets (A, Ab, B), with 12 items per set and takes between 15 to 30 minutes to administer. The
items are arranged to assess the main cognitive processes which children under 11 years of age are
usually capable. The PPVT is designed to assess the verbal intelligence of an individual. It measures
receptive language processing from 2 years of age and takes 20 to 30 minutes to administer. All
children in this study were asked to complete both these neuropsychological tests as a means to
control for IQ and receptive language.
49
3.5. Training
3.5.1. Phase one: Qualitative study
I received training in Focus Group Discussions (FGD) and In-Depth Interviews (IDI) at KEMRI-
Wellcome Trust Research Programme (KWTRP) in Kilifi, Kenya, from an experienced researcher
with adequate knowledge and training in qualitative assessments. As Kiswahili is not my first
language, a fieldworker was recruited to facilitate the FGD and IDI in Kiswahili. The fieldworker had
previous experience in qualitative assessments and was familiar with research protocols. Practice
sessions were held with primary school administrative staff where some participants were recruited
from the attached autism unit.
3.5.2. Phase two: Main case-control studies
I attended a week-long course on the introduction to clinical training and research reliability training
on the revised Autism Diagnostic Observation Schedule (ADOS-2) in Stellenbosch and Cape Town,
South Africa. I was trained by Prof. Petrus de Vries specifically on (i) updates on ASD diagnosis
(including DSM-5) (ii) an introduction to ADOS-2, demonstrations, role-play, hands on coding,
discussion of ADOS assessments and (iii) obtaining research reliability training. I attended a further
booster training by Prof. Petrus de Vries in research reliability for the ADOS-2 at KWTRP in Kilifi,
Kenya. The focus of this training was on the administration of the tool and subsequent coding. I also
received training by the team at the Neuroscience Department at KWTRP in Kilifi, Kenya, in
quantitative data synthesis, and the administration of the neuropsychological tests such as Raven‘s
CPM and PPVT.
A local fieldworker with prior research experience was trained on the study design, the process of
consenting and administration of the socio-demographic questionnaire, SCQ, AQ and
neuropsychological testing (Raven‘s CPM and PPVT). Additionally, the fieldworker was trained in
the ethical principles of research conduct with human participants including respect for study
participants and confidentiality. I conducted simulation exercises with the fieldworker on consenting,
administration of questionnaires, proper handling and coding of questionnaires, over a one week
period prior to data collection.
3.6. Translation of measures
Permission was sought and granted from the Western Psychological Services (WPS) to translate the
SCQ. Initial translation of the English version of the SCQ into Kiswahili was done by two
independent linguistic specialists at KWTRP in Kilifi, Kenya. A panel meeting of experts was held to
harmonize all translated items and subsequent back-translation into English was done by another
50
independent linguistic specialist. Items 21, 34 and 40 were slightly modified to take into account the
local cultural context. For instance, for item 34, social games for children such as the ‗Mulberry Bush‘
and ‗London Bridge is falling down‘ were replaced with local games such as ‗Ukuti Ukuti‘, which
involves a group of children holding hands, jumping and singing and going around in a circle. The
final Kenyan version of the SCQ was then slightly modified to suit the Tanzanian Kiswahili by the
fieldworker recruited for phase two and a linguistic specialist at Muhimbili University of Health and
Allied Sciences (MUHAS), and back-translated into English by another linguistic specialist at
MUHAS. The back-translated version was reviewed by a clinical psychologist from the Department
of Psychiatry, Muhimbili National Hospital (MNH), who recommended minor modifications until
thee questions therein retained their original meaning (Appendix 7).
Permission was sought and granted from the Western Psychological Services (WPS) to translate the
ADOS-2 manual. The same translation and back-translation method as above was used for the ADOS-
2 Manual (all modules).
I sought permission from the Autism Research Centre (ARC) at the University of Cambridge to
translate the AQ into Kiswahili. The AQ was then translated in Tanzanian Kiswahili by a linguistic
specialist at MUHAS, and back-translated into English by another linguistic specialist at MUHAS.
The back-translated version was reviewed by a clinical psychologist from the Department of
Psychiatry, Muhimbili National Hospital (MNH), who recommended minor modifications until the
questions therein retained their original meaning (Appendix 8). We attempted to adapt the AQ,
without significant modifications in terms of item content. We made some attempts to use local terms
for item 13 and 24 for instance, which refer to library, party, theatre and museum. However, it is
possible that some parents may not have had access to or experiences of these places/activities and
would not be able to relate to items about them. Nonetheless, care was taken to ensure semantic
equivalence of the translated items. The tool was informally piloted with parents for feedback on
whether they understood the questions, wording appropriately in case meanings were ambiguous or
unclear.
3.7. Ethical considerations and informed consent
This study was approved by the MUHAS Directorate of Research and Publications (Ref.
No.MU/DRP/AEC/Vol.XV111/93), National Institute for Medical Research (NIMR;
NIMR/HQ/R.8a/Vol.IX/1811) and registered with the Tanzania Commission for Science and
Technology (COSTECH; No. 2014-294-NA-2014-127). Where necessary, approval to access special

51
needs schools, assessment centers, mainstream schools and day care centers was obtained from Ilala,
Kinondoni and Temeke municipal councils.
All participants were informed of the objectives of the study. Verbal and written consent were sought
from all parties using the consent forms designed for the studies (Appendix 9 & 10). Parents of
participating children received an oral description, with examples, of the types of assessments. Parents
and guardians were asked for oral consent and the child for assent to proceed. The family was allowed
to withdraw the child from the study at any point, without fear or prejudice.
3.8. Sampling and data collection procedures
I was fully involved with the recruitment of participants and collected all the data for these studies
with assistance from the fieldworkers where Kiswahili was required. I directly administered the
neuropsychological tests, ADOS, SCQ, AQ and the socio-demographic questionnaire. I trained,
supervised and oversaw any assistance from the fieldworkers.
I adapted the tools to be administered in the Tanzanian context and for use in low-literate parents. We
did forward translation from English to Kiswahili and backward translation from Kiswahili to
English, and independently checked whether the translated version retained the original meaning.
Additionally, we conducted cognitive interviews with parents and caregivers to ensure that the
translated items were understood. We then piloted the tools on parents to check reliability of the
interviewers, to time duration of tool administration and to pick any inconsistencies before using them
in the main studies. Furthermore, because of literacy issues, each item on the SCQ, AQ and socio-
demographic questionnaire was read out to the parents and filled in together with the parents to ensure
each item was thoroughly understood.
Considerations were given to blinding of assessors, however, in most instances I was doing the
recruitment and assessments and so was not blinded to the case-comparison status. Additionally, due
to the conditions of the children with ASD and NDD blinding was not always possible. Some of the
children with ASD and NDD presented with severe and often noticeable symptoms that would be
difficult for the assessors not to notice when interacting with the child. This may have introduced bias
as assessors were aware of the status of each child which may have influenced the way questions were
asked as well as expectations of their responses
52
3.8.1. Phase one: Qualitative study
Recruitment of study participants was done through a purposive sampling procedure. Two groups of
participants were interviewed to capture a diversity of perspectives. First, caregivers of children with
ASD were recruited through ASD units at Msimbazi Mseto Primary School (Ilala District) and
Mbuyuni Primary School (Kinondoni District). Second, a broad range of key community informants
were recruited. Parents of typically developing children were recruited from the mainstream facilities
of the same two schools. Special needs educators and mainstream teachers were also recruited from
these two schools as well as the Mtoni Assessment Centre (Temeke District). The government
stakeholder was recruited from the Ministry of Education, Special Needs Division. Clinicians and
social workers were recruited from MNH. Chapter 4 describes the participant groups and composition
of FGD and IDI.
All FGD‘s were conducted in Kiswahili by an experienced fieldworker, with between four and seven
participants in each, and each took approximately one and a half hours. I organized and supervised all
FGD. I conducted ten IDI in English and the fieldworker conducted three in Kiswahili, and each
interview took approximately one hour.
Interview schedules were developed by the research team following discussion and agreement
between my supervisors and I, which included the following topic guidelines: description of
behaviour manifestations, perceived causes of ASD and challenges encountered. Before commencing
the FGD and IDI, informed consent was obtained and after completing the session all travel expenses
were reimbursed. All FGDs and IDIs were audio-taped with the permission of participants to enable
verbatim transcription.
3.8.2. Phase two: Main case-control studies
Three groups of children were recruited for the study. Children who had a diagnosis of ASD (n = 110)
were recruited from the Child and Adolescent Clinic, Department of Psychiatry, Muhimbili National
Hospital (MNH), private clinics and centres, and autism units attached to local primary schools in
Dar-es-Salaam Tanzania. These children were aged from 5 to 12 years and had no known genetic
disorders, deafness or motor impairment. Previous diagnosis was made by either a psychiatrist at
MNH using DSM-IV criteria, or by a paediatrician in a private setting using DSM-IV criteria and the
M-CHAT or an education assessment centre using pre-determined assessment criteria. At least one
biological parent had to be available for the study (where biological parent was unavailable, data was
collected from the caregiver, but excluded from the endophenotype study [AQ data]). Children with
neurodevelopmental disorders (NDD n = 61) aged 5 to 12 years were recruited from MNH and special

53
needs schools in Dar-es-Salaam, Tanzania. The NDD group was matched on chronological age and
had a previous diagnosis of a neurodevelopmental disorder which included, Down‘s Syndrome (n =
10), Learning Disability (n = 33), Seizure Disorders (n = 8) and ADHD (n = 10). The typically
developing (TD) children (n = 116) were randomly selected from the community with no known
concerns of language and/or behavioral problems and did not have any history of learning or
psychiatric disabilities according to our assessments. They were matched with the ASD group on a
surrogate marker of IQ i.e. level of expressive language (ADOS-2 Module). This was done as most of
the children with ASD in our sample were nonverbal, thus matching on developmental age and verbal
ability would allow better comparisons of autistic traits.
Families were invited to the clinic or the schools for assessment. Each visit lasted approximately 2 to
3 hours. After obtaining consent, parents of participating children were asked to complete the Social
Demographic Questionnaire and the SCQ. All children were requested to complete the
neuropsychological testing (Raven‘s CPM and the PPVT), followed by an ADOS-2 assessment.
Parents were asked to be present in the assessment room and each assessment was videotaped so that
later a panel of both local and international experts can categorize these children and this information
was used as an extra validity check.
After completing ADOS assessments, two children with a previous diagnosis of ASD were excluded
from further analysis as they did not meet the cut-offs for ASD with the ADOS, SCQ and DSM-5
criteria. Additionally one child with Down‘s syndrome scored very high on the SCQ and DSM-5
criteria, but we were unable to do an ADOS assessment on him as he was not mobile, and as such we
excluded him from further analysis. The sample, therefore, consisted of a total of 284 children. It was
not possible to do an ADOS assessment on all children for the following reasons; unavailability of the
child (n= 6), incomplete assessments due to unmanageable behaviour (n= 15). Additionally, we are
missing ADOS video recordings for two children. A number of families with typically developing
children did not consent to video record the ADOS assessment (n= 21). Figure 3.2 is a flow chart
showing participant enrolment. To ensure quality of assessment, all assessment forms were checked
for accuracy and inconsistencies on the day of the assessment.

54
Figure 3.2 - Flow chart showing participant enrolment.
3.9. Data management and statistical analysis
I was solely involved with the management of the database.
3.9.1. Phase one: Qualitative study
Data collected in Kiswahili was translated and transcribed in English by a trained and experienced
bilingual translator, and all data in English was transcribed in full. The transcripts were randomly
checked against the recordings and imported into NVivo 10 (QSR International). Data were analyzed
Initial number of children
recruited
(n = 287)
ASD (n = 110)
Total number of children
assessed with SCQ,
DSM-5, and collected all
socio-demographic data
(n = 108)
Total number of children
assessed with ADOS
(n = 94)
TD (n = 116) NDD (n = 61)
Children excluded:
Child scored below ASD
cut-off on the SCQ, no
ASD according to ADOS
and DSM-5
(n = 2)
Child excluded:
Child scored very high on
SCQ and DSM-5,
however could not do
ADOS as not mobile
(n = 1)
Total number of children
assessed with SCQ,
DSM-5, and collected all
socio-demographic data
(n = 60)
Total number of children
assessed with ADOS
(n = 57)
Total number of children
assessed with SCQ,
DSM-5, and collected all
socio-demographic data
(n = 116)
Total number of children
assessed with ADOS
(n = 112)

55
using thematic analysis. The first step was to generate tentative themes representing participants‘
awareness and experiences in each transcript. For quality control, subsequent analysis involved initial
coding of randomly selected transcripts by me and a supervisor. This enabled us to identify patterns
across the data set and refine themes which guided the initial coding process. I coded all the data and
transcripts were repeatedly re-examined and cross-compared with initial coding by a supervisor to
identify common themes and explore participants underlying perceptions. Coherence of themes was
discussed during frequent meetings throughout the analytic process, and final themes and subthemes
were agreed upon by the research team.
3.9.2. Phase two: Main case-control studies
A database was created on LimeSurvey (https://www.limesurvey.org/), a free and open source on-line
survey application written in PHP based on MySQL. I designed the database formats and coding. All
ADOS assessment videos were stored in external hard drives.
All analysis were performed between the ASD and TD groups, and then ASD and NDD groups.
Additional analysis between NDD and TD groups and between combined NDD+ASD and TD groups
were performed for the risk factor analysis. Exploratory analysis on the distribution of continuous
variables and univariable analysis were carried out using IBM SPSS Statistics version 20. After
checking for normality of continuous variables, transformations (log or square-root) were performed
where necessary. Parametric tests such as Student‘s-t-test were used on the transformed continuous
scores if transformation resulted in a normal distribution. Otherwise, non-parametric tests such as the
Mann-Whitney U test were used on the raw scores of continuous variables when the transformed
scores did not achieve a Gaussian distribution. For categorical variables the Pearson‘s chi-square test
were performed (or Fisher‘s exact test if frequency was ≤ 5). Multivariate analysis and likelihood
ratio tests (LRT) for the risk factor analysis were performed using STATA version 13. Since the
outcome variables were binary or dichotomous, logistic regression modelling was applied in
computing odds ratios for the univariable and multivariable risk factors. The multivariable model
focused on risk factors with plausible biological basis for the risk of ASD in such a way that parental
marital status, religion, ethnicity, level of education and occupation were entered into the model as
covariates to account for their potential confounding of other risk factors. All variables reaching a
significance p-value of ≤ 0.250 in the univariable analysis were entered in the multivariable models,
retaining all variables if the model showed acceptable goodness-of-fit statistics (measured using
Hosmer-Lemeshow test). LRT was used to test for evidence of departure from linear trend, such that
if linear trend was not violated a single odds ratio assuming all categories as linear ordinal levels was

56
computed, with odds ratios for individual categories computed if there was evidence for departure
from linear trend.
For the validation studies, Cronbach‘s coefficient alphas were used to examine the internal
consistency of the instruments using IBM SPSS Statistics version 20. Receiver operating
characteristic curve (ROC) analysis was performed using STATA version 15. Further evaluation of
the psychometric properties namely confirmatory factor analysis (CFA) and intraclass correlation
coefficient (ICC) were performed using R version 3.0.2.

57
Chapter 4
Awareness and lived experiences of families of children with Autism Spectrum
Disorders (ASD) and community stakeholders in Dar-es-Salaam, Tanzania.
4.1. Background
Given the global high prevalence of Autism Spectrum Disorders (ASD), there has been an increased
interest to conduct research and provide services for children and families affected by ASD. In
Africa, such efforts are constrained by the multitude of challenges. Despite the growing research
evidence from the rest of the world there is relatively little known or published research about ASD in
sub-Saharan Africa (Ruparelia et al., 2016; Abubakar et al., 2016b; Elsabagh et al., 2012). Poor
community awareness, a lack of validated diagnostic tools and scarcity of professional manpower for
evaluation and interventions are some of the challenges in conducting research in this this region
(Ruparelia et al., 2016; Abubakar et al., 2016a; Bakare et al., 2014; Newton & Chugani, 2013; Bakare
& Munir, 2009b).
While there is paucity of research highlighting lived experiences and challenges in raising a child with
ASD in other developing countries (e.g. Wang et al., 2011; Divan et al., 2012), there is little research
into these experiences and challenges within sub-Saharan Africa (Gona et al., 2016; Tekola et al.,
2016). Furthermore, studies in Nigeria report low level of knowledge of ASD not only in the general
population, but also among the medical community (Bakare & Munir, 2011a; Eisegbe et al., 2015).
There is currently very limited knowledge on lived experiences of children with ASD throughout
Tanzania (Manji & Hogan, 2013); to the best of my knowledge there has been no empirical
publications describing these experiences in Tanzania. A National Association for People with Autism
- Tanzania (NAPA-T) was formed to bring together efforts of parents and caregivers in caring for and
teaching people with ASD. A recent study highlighted a low level of knowledge of ASD amongst
mainstream teachers in primary schools in Dar-es-Salaam, (Edward, 2015). Manji and Hogan (2013),
however, report limited awareness of ASD at various levels and a lack of facilities for addressing the
needs of people with ASD. Ambilike & Outwater (2012) describe the psychological, social, and
economic challenges experienced by caregivers of children with neurodevelopmental disorders in
Dar-es-Salaam, Tanzania.

58
Further research exploring the family‘s experiences of children with ASD in this region is imperative.
We carried out a qualitative study to determine the level of knowledge and explore the family‘s
experiences of ASD in Dar-es-Salaam, Tanzania.
4.2. Methodology
This study employed qualitative research methodology to access local experiences of ASD. Both
focus group discussions (FGD) and in-depth interviews (IDI) were conducted, since triangulation
enhances validity of the collected data. Participation was voluntary and written consent was obtained
from all study participants. Ethical approval for the study was obtained from the Directorate of
Research and Publications at Muhimbili University of Health and Allied Sciences (MUHAS), the
National Institute for Medical Research (NIMR) and the Tanzania Commission for Science and
Technology (COSTECH).
4.2.1. Study sample
Recruitment of study participants was done through a purposive sampling procedure. Two groups of
participants were interviewed to capture a diversity of perspectives. First, caregivers of children with
ASD were recruited through ASD units at Msimbazi Mseto Primary School (Ilala District) and
Mbuyuni Primary School (Kinondoni District). Second, a broad range of key community informants
were recruited. Parents of typically developing children were recruited from the mainstream facilities
of the same two schools. Special needs educators and mainstream teachers were also recruited from
these two schools as well as the Mtoni Assessment Centre (Temeke District). The government
stakeholder was recruited from the Ministry of Education, Special Needs Division. Clinicians and
social workers were recruited from MNH. Table 4.1 describes the participant groups and composition
of FGD and IDI. We noted that there were several challenges and barriers to access special needs
schools for children with ASD. Firstly, very few special needs schools are available and care given is
not comprehensive, not all needs of these children are met, with limited resources and specialist care.
It is mostly parents who are educated and economically privileged that are able to send their children
to these special facilities, while many children of poor families do not know about these facilities or
cannot afford to send their children to them.
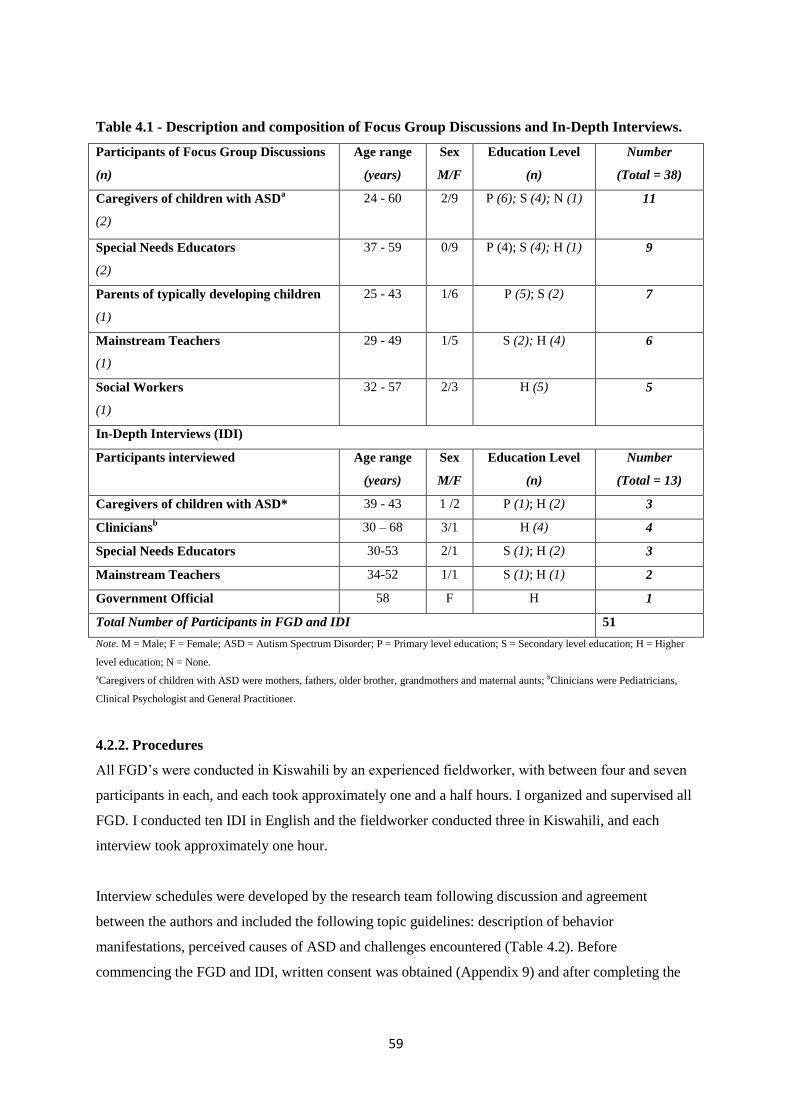
59
Table 4.1 - Description and composition of Focus Group Discussions and In-Depth Interviews.
Participants of Focus Group Discussions
(n)
Age range
(years)
Sex
M/F
Education Level
(n)
Number
(Total = 38)
Caregivers of children with ASDa
(2)
24 - 60 2/9 P (6); S (4); N (1) 11
Special Needs Educators
(2)
37 - 59
0/9
P (4); S (4); H (1) 9
Parents of typically developing children
(1)
25 - 43
1/6 P (5); S (2) 7
Mainstream Teachers
(1)
29 - 49
1/5 S (2); H (4) 6
Social Workers
(1)
32 - 57
2/3 H (5) 5
In-Depth Interviews (IDI)
Participants interviewed Age range
(years)
Sex
M/F
Education Level
(n)
Number
(Total = 13)
Caregivers of children with ASD* 39 - 43 1 /2 P (1); H (2) 3
Cliniciansb 30 – 68 3/1 H (4) 4
Special Needs Educators 30-53 2/1 S (1); H (2) 3
Mainstream Teachers 34-52 1/1 S (1); H (1) 2
Government Official 58 F H 1
Total Number of Participants in FGD and IDI 51
Note. M = Male; F = Female; ASD = Autism Spectrum Disorder; P = Primary level education; S = Secondary level education; H = Higher
level education; N = None.
aCaregivers of children with ASD were mothers, fathers, older brother, grandmothers and maternal aunts; bClinicians were Pediatricians,
Clinical Psychologist and General Practitioner.
4.2.2. Procedures
All FGD‘s were conducted in Kiswahili by an experienced fieldworker, with between four and seven
participants in each, and each took approximately one and a half hours. I organized and supervised all
FGD. I conducted ten IDI in English and the fieldworker conducted three in Kiswahili, and each
interview took approximately one hour.
Interview schedules were developed by the research team following discussion and agreement
between the authors and included the following topic guidelines: description of behavior
manifestations, perceived causes of ASD and challenges encountered (Table 4.2). Before
commencing the FGD and IDI, written consent was obtained (Appendix 9) and after completing the
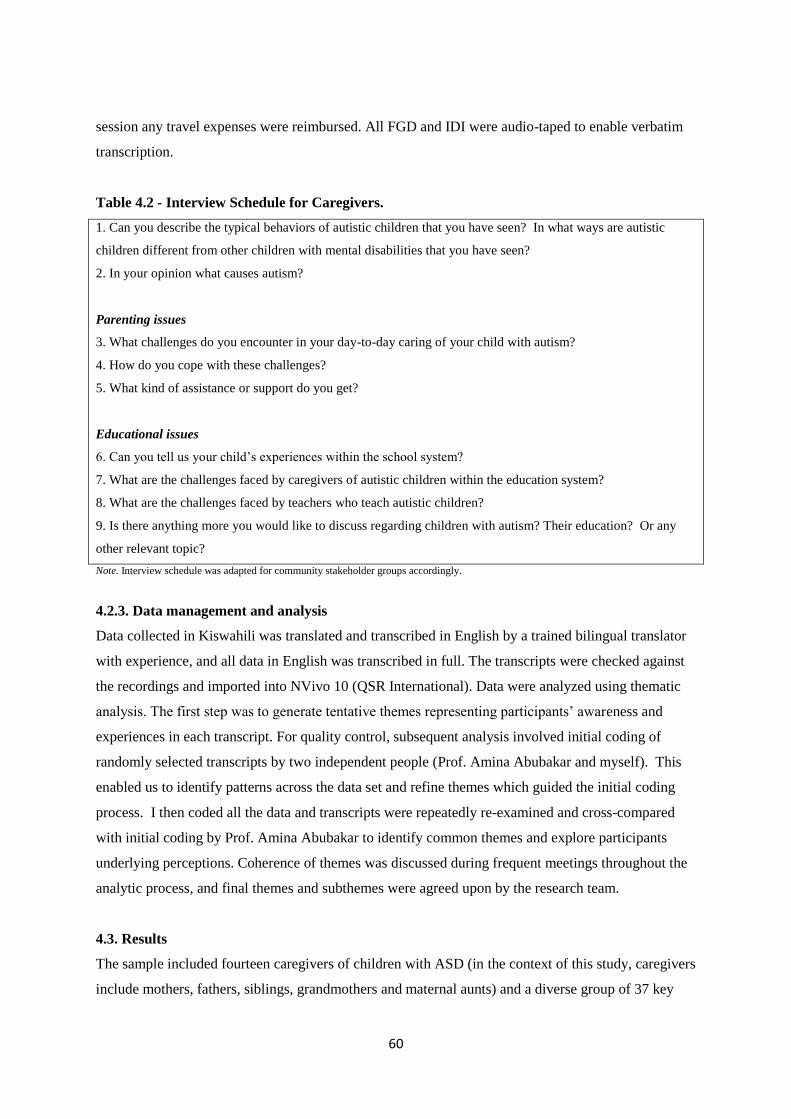
60
session any travel expenses were reimbursed. All FGD and IDI were audio-taped to enable verbatim
transcription.
Table 4.2 - Interview Schedule for Caregivers.
1. Can you describe the typical behaviors of autistic children that you have seen? In what ways are autistic
children different from other children with mental disabilities that you have seen?
2. In your opinion what causes autism?
Parenting issues
3. What challenges do you encounter in your day-to-day caring of your child with autism?
4. How do you cope with these challenges?
5. What kind of assistance or support do you get?
Educational issues
6. Can you tell us your child‘s experiences within the school system?
7. What are the challenges faced by caregivers of autistic children within the education system?
8. What are the challenges faced by teachers who teach autistic children?
9. Is there anything more you would like to discuss regarding children with autism? Their education? Or any
other relevant topic?
Note. Interview schedule was adapted for community stakeholder groups accordingly.
4.2.3. Data management and analysis
Data collected in Kiswahili was translated and transcribed in English by a trained bilingual translator
with experience, and all data in English was transcribed in full. The transcripts were checked against
the recordings and imported into NVivo 10 (QSR International). Data were analyzed using thematic
analysis. The first step was to generate tentative themes representing participants‘ awareness and
experiences in each transcript. For quality control, subsequent analysis involved initial coding of
randomly selected transcripts by two independent people (Prof. Amina Abubakar and myself). This
enabled us to identify patterns across the data set and refine themes which guided the initial coding
process. I then coded all the data and transcripts were repeatedly re-examined and cross-compared
with initial coding by Prof. Amina Abubakar to identify common themes and explore participants
underlying perceptions. Coherence of themes was discussed during frequent meetings throughout the
analytic process, and final themes and subthemes were agreed upon by the research team.
4.3. Results
The sample included fourteen caregivers of children with ASD (in the context of this study, caregivers
include mothers, fathers, siblings, grandmothers and maternal aunts) and a diverse group of 37 key

61
community informants including special needs educators (n=12), mainstream teachers (n = 8), parents
of typically developing children (n = 7), social workers (n = 5), clinicians (n = 4) and a government
official. Below I present the findings from the main themes which emerged from analysis of the
interviews and group discussions. Figure 4.1 illustrates the thematic model emerging from the
analysis.

62
Figure 4.1 - Thematic model of lived experiences.
Challenges
Healthcare setting
Educational Setting
Family / Community
Setting
Inadequate support
and pathway to care
and education
Limited information
available to give to
caregivers
Under/
misdiagnosis
Lack of
appropriate
diagnostic tools
Low awareness amongst
healthcare practitioners
Urban vs.
rural
discrepanc
Poor
attendance
in school
Unable to
give one-
to-one
attention
Difficulty in meeting
the child‘s needs
Lack of family/social
support
Transportation to
school
Financial
burden
Stigma
Misperception
Lack of understanding,
awareness and acceptance
Lack of teachers / facilities / resources / training
Lived
Experiences
Supernatural
causes Biomedical
causes
Witchcraft
Serious illness
(seizures, malaria)
Pregnancy/labor
problems
Preference to play alone
Lack of expressiveness
Heritability
Knowledge and
Awareness
Identification and
presentation
Perceived causes
Language
problems
Intellectual and
developmental
problems
Repetitive &
stereotyped
behaviours
Social
interaction
problems
Slow learners
Lack of appropriate
speech
Resistance to change
Isolation Behaviour
problems
Self-harm
behaviour
Aggressive
Need for repetitive
behaviours
Lack of fear
‗Naughty‘

63
4.3.1. Knowledge and awareness of ASD: Identification and presentation
This section describes participants‘ awareness and knowledge of behavioral manifestations seen in
children with ASD. Five emerging subthemes were identified as ‗social interaction problems‘,
‗repetitive and stereotyped behaviors‘, ‗behavior problems‘, ‗language problems‘ and ‗intellectual and
developmental problems‘.
Social interaction problems
It was common for all caregivers and most community informants to describe isolation and lack of
expressiveness as a core symptom of behavior in children with ASD. Participants often revealed the
preference of children with ASD to play alone:
‘… they can play alone; they don’t like socialization and interaction with others. That is the
difference.’
(IDI, Special Needs Educator)
Repetitive and stereotyped behaviors
All participants revealed that a striking characteristic in children with ASD they observed was the
need for repetitive and stereotyped behaviors and children often expressed resistance to change:
‘… they have repetitive behavior and they want to follow their routines.’
(IDI, Caregiver)
‘When there is a visitor coming or a stranger you have to alert them because they resist and react to
changes unlike children with intellectual disorder who are easy to follow orders.’
(FGD, Special Needs Educators)
Behavior problems
Generally, most participants perceived children with ASD as ‗aggressive‘. This term was used
frequently during interviews and group discussions. However, perceptions of aggressive behavior
were stronger amongst the community informants. Although caregivers perceived their child‘s
behavior as aggressive, at least one parent thought that this was a result of unmet needs of the child,
and not just an unprovoked characteristic.
‘They are sometimes so quick tempered and aggressive, usually when they feel you do not want to
give them what they want.’
(FGD, Caregivers)

64
Caregivers and special needs educators further expressed their concern for self-harm behaviors and
the lack of fear they observed in children with ASD:
‘ … they are not afraid of things that can hurt them like fire or crossing the road without keen
observation.’
(FGD, Special Needs teachers)
One clinician commented that often children with ASD are perceived as ‗naughty‘ in this setting,
primarily due to the lack of awareness of ASD and its‘ associated behavioral symptoms:
‘Some of the people are not aware of autism. Some of them will think this is a naughty child who in
Swahili they say ‘Mtoto Mtundu’…’
(IDI, Clinician)
Language problems
Both groups consistently revealed that children with ASD lack appropriate speech, or are nonverbal:
‘…he is able to understand a lot of things but he is unable to talk.’
(FGD, Caregivers)
‘…and they rarely speak.’
(FGD, Mainstream Teachers)
Intellectual and developmental problems
Some participants from both groups perceived children with ASD to be slow learners. However, only
parents of typically developing children and mainstream teachers revealed that they were initially
unaware that children with ASD could attend school, and believed they could never learn to read or
write:
‘Autism is an intellectual disorder whereby a child is able to learn and be aware of things but cannot
read or write.’
(FGD, Mainstream Teachers)
4.3.2. Knowledge and awareness of ASD: Perceived causes
The attributed causes revealed during the interviews and group discussions were identified as either
‗biomedical causes‘ or ‗supernatural causes‘.

65
Biomedical causes
The majority of participants attributed biomedical reasons as the cause of ASD. Participants from both
groups attributed heritability as a primary cause for ASD:
‘In fact they are trying to tell us that it might be genetic.’
(IDI, Caregiver)
‘I think the condition is through inheritance. Sometimes a family can consist of a number of autistic
children so I think it’s inherited.’
(FGD, Special Needs Educators)
It was also common for participants to reveal pregnancy and labor related problems as another
attributed cause:
‘What the mother consumes when she is pregnant especially the diet, stress by the mother when still
pregnant since the brain of the mother is connected to the child.’
(FGD, Special Needs Educators)
Caregivers, and less commonly amongst other key informants, believed that serious illness, more
specifically seizures and malaria were the cause of ASD:
‘When my child was three years, she got sick, the doctor said it was nothing. The condition worsened
and she experienced seizures. I took her to the witchdoctors and when she started to recover, her
developmental stages were affected.’
(IDI, Caregiver)
Supernatural causes
Interestingly, only some parents of typically developing children revealed that they thought
supernatural reasons to be a cause of ASD. Witchcraft was the most common within this sub-theme:
‘I have no knowledge of the cause of autism but I have heard rumors that parents sacrifice their
children to gain wealth and as a result the child becomes disabled.’
(FGD, Parents of typically developing children)

66
4.3.3. Challenges
This section outlines challenges experienced by caregivers and other key community informants.
These challenges are described under three key subthemes; ‗family/community setting‘, ‗educational
setting‘ and ‗healthcare setting‘.
Family/community setting
All participants highlighted the lack of understanding, awareness and acceptance within the
community as a core challenge leading to a misperception of ASD and a stigma.
‘In my street some of them just come and tell you your kid has been bewitched suggesting you need to
go to the priest who can do prayers or to go to the witchdoctors.’
(IDI, Caregiver)
‘Other parents are ashamed so they decide to lock their children inside the house and they don’t take
them to school or the hospital.’
(FGD, Social Workers)
The lack of awareness, acceptance and associated stigma often leads to a financial burden for families
caring for a child with ASD in relation to housing and paying for damage.
‘There are many challenges, for example, the way one is forced to a hire their own house instead of
sharing with other families … when you have other members the child may disturb them or destroy
something.’
(IDI, Caregiver)
‘… in my case one time my child threw a stone and broke a car window of someone he did not
understand, so I had to pay. My prayer is to the society to accept us.’
(FGD, Caregivers)
Another major challenge faced by caregivers is transportation to the school. Many families struggle to
send their child to school as the child must be accompanied to school and this can prove to be a
challenge in terms of the means and cost of transport and caregivers may also have other duties to
attend:
‘Using public transport is difficult for these kids, it’s not easy taking a ‘daladala’ (bus), so we pay for
the taxi to make sure he goes to school every day. It’s very expensive and most parents cannot afford
it.’
(IDI, Caregiver)

67
The lack of family and social support can also be challenging for caregivers, in particular for mothers,
who are often left alone to care for their child. Many participants revealed that relationships and
marriages were negatively affected as a result of raising a child with ASD:
‘… most of the time the mother is blamed for giving birth to such a child. Sometimes they are
abandoned and left to take care of the responsibilities. Some fathers think of these children as a
misfortune and of no importance.’
(FGD, Special Needs Educators)
Additionally, the difficulty in meeting the child‘s needs was also revealed, as caregivers often struggle
to understand the child‘s needs and manage their behavior appropriately:
‘You feel pain having a child who cannot express himself. You feel like you want to help but don’t
know how so there is that feeling that you are not doing something right for that child.’
(IDI, Caregiver)
Educational setting
Another important subtheme was the challenges experienced within the educational setting. All
participants highlighted the lack of teachers, facilities, resources and training catered specially for
ASD:
‘I think one is teaching materials, and the other is training because we don’t have special programs
for teachers, we are just having few visitors who are coming from different countries and helping
teachers in Tanzania to handle these children.’
(IDI, Government Official)
Consequently, children with ASD are often put in the same schools or units as other disabilities.
Special needs educators further expressed that these challenges hindered their role as teachers as they
were not able to give appropriate one to one attention to the children:
‘We have few teachers in the school and the number of children is so big. Since every child has to be
attended individually it is sometimes impossible to meet all the needs of the children.’
(FGD, Special Needs Educators)
Another common challenge expressed by caregivers and special needs educators was the poor
attendance in school:

68
‘… a parent may bring a child twice a week or after three months because of their own personal
issues, so it becomes a big challenge for us because every time we have to repeat what we started.’
(FGD, Special Needs Educators)
Interestingly, teachers who taught in mainstream facilities revealed an urban versus rural discrepancy
in the initiative caregivers took to seek education for their children with ASD:
‘… those who take their children to school are mostly from the town centers and those who are
financially stable.’
(FGD, Mainstream Teachers)
‘In urban areas parents do take their children to school but you cannot find that in the rural areas.
Children are being left at home and neglected. Parents do not see the importance of educating these
children.’
(FGD, Mainstream Teachers)
Healthcare setting
A further subtheme which emerged were the challenges experienced within the healthcare setting. All
participants emphasized low awareness of ASD amongst the healthcare practitioners and the lack of
appropriate diagnostic tools consequently leading to under diagnosing or misdiagnosing ASD:
‘In Tanzania, we don’t have many psychologists and child and adolescent psychiatrists who have any
of the right diagnostic facilities for autism so it is very difficult to first diagnose autism.’
(IDI, Caregivers of children with ASD)
‘I don't think there are many of us who know particularly well how to diagnose autism, therefore
there is a lot of delay.’
(IDI, Clinician)
Clinicians also expressed their concern that even if a diagnosis was made, they had very limited
information and guidance to give to the caregivers in relation to receiving adequate support and an
appropriate pathway to care and education:
‘… and even if there is a diagnosis made, there are not that many skilled people to intervene like
speech therapists, occupational therapists, behavioral therapists ….’
(IDI, Clinician)

69
4.3.4. Recommendations
Participants had views on what needs have to be met in order to enhance awareness and support for
children with ASD in Tanzania, specifically in relation to ‗raising awareness‘ in the hope to increase
acceptance and in ‗availing more resources‘.
Raising awareness
All participants believed there is a clear need to raise awareness in the community in order to increase
acceptance of ASD:
‘What I would like to say is that most Tanzanians are not aware of autism. There should be programs
aired on television to educate people on cases of autistic children. This will help us create and spread
more awareness.’
(FGD, Special Needs Educators)
‘I would also call upon the government and the society to accept children with these conditions and
be able to help them.’
(FGD, Caregivers)
Providing more resources
Increasing more and better facilities and training for ASD was equally important to all participants.
Some argued that boarding facilities would help take the burden away from the caregiver, reduce the
transport costs incurred by families, and maintain school attendance:
‘There should be boarding schools for these children to reduce the cost and the expenses the parents
incur.’
(FGD, Mainstream Teachers)
‘There should be openings of more units in every district because children are left behind at home.’
(FGD, Special Needs Educators)
Clinicians also highlighted the pressing need for an appropriate diagnostic tool:
‘I think it’s important to have a diagnostic tool which is acceptable here and for medical
professionals and parents to be aware of the problem, how to diagnose and manage the problem.’
(IDI, Clinician)
Interestingly, one parent also raised the provision of social protection as a way forward:

70
‘The government should recognize us and invest in us, there should be financial security for the
children in case we are no longer with them.’
(FGD, Caregivers)
4.4. Discussion
This study investigated the knowledge of ASD and lived experiences of caregivers and a diverse
group of key community informants in Dar-es-Salaam, Tanzania, using qualitative methodology. The
findings indicate consistent sub-themes emerging within the areas of concern: knowledge and
awareness in the identification and presentation of ASD and its‘ perceived causes, and the challenges
experienced by caregivers. Additionally, participants provided recommendations for way forward.
Results suggest that despite being a resource limited setting with prevailing poor socio-economic
status, caregivers and special needs educators have gained moderate knowledge of ASD, perhaps
because they were recruited from schools that catered specifically for children with ASD. In
comparison, however, other key community informants such as parents of typically developing
children and mainstream teachers had relatively limited knowledge of ASD highlighting the general
lack of awareness, understanding and acceptance of ASD within the community. This could be
attributed to the high levels of stigma associated with neurodisability in Africa and resonates with
previous literature on ASD in Africa (Eisegbe et al., 2015; Igwe et al., 2011; Bakare et al., 2009a;
Bakare et al., 2008).
Most comments about the identification and presentation of ASD fell into the categories of the core
symptom domains of ASD with both behavioral and socio-communication deficits being raised.
Consistent with earlier reported work (Belhadj et al., 2006; Mankoski et al., 2006; Bakare & Munir,
2011b), nonverbal characteristics of some children with ASD seemed to be overemphasized, perhaps
a reflection of late diagnosis and intervention. It was also evident in the findings that some
participants, and more frequently parents of typically developing children and mainstream teachers
were unable to distinguish ASD symptomatology from other intellectual disorders and behavioral and
developmental problems. This finding could be attributed to the lack of awareness of ASD within the
community as well as associated neurological comorbidities, more specifically intellectual disability.
Kisanji‘s (1995) study conducted interviews and proverbs surveyed from local literature in Tanzania
showed that the characteristics of major disabilities, except mild to moderate intellectual disability
were clearly known.

71
Most of the participants perceived biomedical reasons such as hereditary, brain abnormalities and
infectious diseases as the cause of ASD. These etiological explanations support those based on
clinical observations by Mankoski et al. (2006), who documented cases of ASD following central
nervous system infection or sepsis in a case series of children in Tanzania. Unexpectedly, however,
participants may have been well educated or shared socially desirable responses. Surprisingly, only
parents with typically developing children attributed ASD etiology to supernatural causes. Stone-
MacDonald (2012), however, found cultural beliefs in a rural region of Tanzania centered on God‘s
plan or role in the community, and a mixture of Christian, Muslim, and traditional beliefs. The finding
from this study, for instance, is also inconsistent with etiological perceptions of ASD among a
significant proportion of healthcare workers in Nigeria who hold beliefs of supernatural causes for
ASD (Bakare et al., 2009b). More recently, Gona et al. (2015) compared perceived causes of ASD in
families with a child with ASD in urban and rural settings in Kenya, and found supernatural causes as
well as biomedical causes were thought to cause ASD across both settings. Although, in this study
participants commented that the general perception of the causes of ASD within the community were
supernatural causes; these findings however, were different from other research in the region (Bakare
et al., 2009b; Gona et al., 2015), in that only parents of typically developing children in this Da-es-
Salaam sample within this urban setting perceived ASD to be caused by supernatural beliefs. This
highlights the need for public engagement to raise awareness within the community.
In general, there was the belief that there is a significant lack of understanding, awareness and
acceptance within the community. These findings indicate that this gap in the community‘s
knowledge often leads to misperception of ASD, negative stigma associated with the symptoms of
ASD and a financial burden to families raising a child with ASD. The challenges of transportation to
school, lack of family and/or social support and subsequent marital adjustments were also highlighted
by participants. It is evident that many of the challenges raised in this study resonate with findings in
the existing literature of ASD in other developing countries (e.g. Desai et al., 2012), and in caring for
children with ASD (Gona et al., 2016; Tekola et al., 2016). Within the educational setting, challenges
reflected the lack of resources, facilities and training as well poor attendance. Participants further
emphasized the low level awareness of ASD amongst the healthcare practitioners and the lack of
appropriate diagnostic tools consequently leading to under diagnosing or misdiagnosing ASD. This
data concurs with previous findings from several studies conducted in Nigeria revealing a low level of
knowledge and awareness about ASD in Africa (Eisegbe et al., 2015; Igwe et al., 2011; Bakare et al.,
2009a; Bakare et al., 2008).
This study has several limitations. Although a diverse group of participants took part in the study, the
sample was limited to key community informants that have had contact with professionals either in
the educational setting or healthcare setting. For instance, the mainstream teachers and parents of

72
typically developing children were recruited from the mainstream primary schools that had ASD
units, thus it is not clear whether the views of the participants represent the perceptions and
experiences of the larger population. Children living in urban areas have more access to these special
schools and facilities and thus parents in rural areas were not included in this study. Furthermore,
poorer and less literate parents in urban areas may not bring their children to these schools.
This study provides knowledge, awareness and lived experiences of caregivers and key community
informants and contributing to the limited literature on ASD in Tanzania and in Africa. The increased
knowledge of these perspectives contributes to better understanding, awareness, acceptance and
provision for ASD in Tanzania.
73
Chapter 5
Evaluation of the psychometric properties of the Lifetime version of the Kiswahili Social
Communication Questionnaire (SCQ) in Dar-es-Salaam, Tanzania.
5.1. Background
Despite the growing knowledge of the global prevalence of ASD (Fombonne et al., 2011; Elsabbagh
et al., 2012), relatively little is known on the prevalence of ASD in sub-Saharan Africa (SSA) and
details of clinical presentations of this disorder remain unclear for this region (Ruparelia et., 2016;
Elsabbagh et al., 2012).
A review of cases of ASD in Africa revealed that nearly all of the children were diagnosed relatively
late, around the age of 8 years and some into their teenage years (Bakare & Munir, 2011a). Moreover,
two of these studies revealed high nonverbal proportion among children with ASD (Belhadj et al.,
2006; Mankoski et al., 2006). This delay in diagnosis may also contribute to the lack of appropriate
language skills in many of the children with ASD, perhaps because they did not have access to early
interventions. One of the major difficulties in identifying children with ASD in Africa lies in the poor
standards of available educational and medical infrastructures (Ruparelia et al., 2016). These findings
also highlight a need for earlier recognition and diagnosis of ASD in Africa. Although in high income
countries (HIC) there are many tools available to screen and diagnose ASD, there is a dearth of
available validated tools for the use of screening and identifying ASD in SSA, where the phenotype
may be different compared to HIC.
According to a recent scoping review (Franz et al., 2017) and a systematic review on ASD in SSA
(Abubakar et al., 2016b) only few published studies specifically on ASD screening and diagnosis in
SSA were identified. An Ugandan tool development study (Kakooza-Mwesige et al., 2014), which
piloted a 23-question screener (the 23Q), including the Ten Questions Questionnaire (TQQ) (Durkin
et al., 1995) and 13 additional questions specifically aimed at ASD detection was modestly successful
in identifying children at high risk of ASD, but showed a relatively low positive predictive value of
only 8% (Kakooza-Mwesige et al., 2014). Harrison et al. (2014) used the Childhood Autism Rating
Scale, Second Edition (CARS-2; Schopler et al., 2010) in Tanzania. They combined this observational
diagnostic aid for ASD as part of a larger test battery to diagnose ASD and described the process of
cultural adaptation, however, the tool was not validated. Additionally, 2 studies in South Africa have
also evaluated the cultural adaptability of ASD screening and diagnostic tools in their setting. Smith et
al. (2016) examined the cultural appropriateness of the materials and procedures for administration of

74
the Autism Diagnostic Observation Schedule-2 (ADOS-2) and found that most of the materials and
activities were appropriate for use in their setting with only minor modifications. However, potential
linguistic and semantic biases were observed and therefore guidelines for using ADOS in their setting
were developed. Chambers et al. (2016) adapted several measures for early screening for ASD,
providing initial evidence that the measures are feasible for use in their setting.
Since ASD diagnostic tools such as the Autism Diagnostic Observation Schedule (ADOS) (Lord et
al., 2000) and the Autism Diagnostic Interview–Revised (ADI-R) (Le Couteur et al., 2003) require
formal clinical training and large amounts of resources, screening instruments have been developed to
aid in initial screening for ASD. These are administered to the child‘s primary caregiver, are less
costly and time consuming and can provide an efficient method for screening children who may
require further evaluation.
One frequently used screening measure is the Social Communication Questionnaire (SCQ) (Berument
et al., 1999; Rutter et al., 2003). The SCQ is a brief 40-item caregiver-report screening measure for
ASD that focuses on behavioural impairments in the areas of reciprocal social interaction, language
and communication, and repetitive and stereotyped patterns of behaviour (Berument et al., 1999). The
SCQ is based on the Autism Diagnostic Interview-Revised (ADI-R; Rutter et al., 2003), a semi-
structured caregiver interview that covers ASD symptomatology and developmental history. The SCQ
manual suggests the SCQ is applicable to subjects of any chronological age above the age of 4.0 years
provided that their mental age is at least 2.0 years (Rutter et al., 2003). Since the use of the SCQ under
the age of 4.0 years had not been systematically tested and no subjects under the age of 4.0 were
included in the sample used in the development of the SCQ, the authors caution against using the
SCQ in subjects younger than 4.0 years of age. There are two different versions of the SCQ. The SCQ
Lifetime, which measures ASD symptoms that have ever been present, focussing on ages 4-5 years on
some questions, or to consider behaviour in the past 12 months if the child is not yet 4 years. The
SCQ Current measures behaviours that have been present in the past 3 months.
Berument et al. (1999) published the initial validation study of the SCQ and examined the diagnostic
validity, factor structure and convergent validity with the ADI-R in individuals aged 4 to 40 years
with pervasive developmental disorders (PDD) including autism and individuals with other
psychiatric diagnoses such as language disorders and intellectual disability (ID). They found a
sensitivity of 85% and a specificity of 75% for the recommended cut-off score of 15 when
differentiating between individuals with and without a diagnosis of ASD, and sensitivity of 96% and
specificity of 67% for differentiating ASD from ID.

75
The SCQ has been adapted and cross-culturally validated for use in other languages and cultural
contexts namely; German, Portuguese, Chinese, Turkish and Greek (Table 5.1). Bölte et al. (2008b)
published the first cross-cultural validation study using the German version of the SCQ and found
acceptable psychometric properties in a child and adolescent psychiatric sample and derived a clinical
cut-off that differentiated ASD from other disorders such as anxiety disorders and obsessive-
compulsive disorders amongst others (Table 5.1).
Sato et al. (2009) published preliminary analysis of validity of the Portuguese version of the SCQ
using a sample that includes children with a diagnosis of PDD, Down‘s syndrome and other
psychiatric disorders. The authors reported acceptable internal consistency and a clinical cut-off that
differentiated PDD from the other groups (Table 5.1).
Gau et al. (2011) examined the validity of the Chinese version of the SCQ in children aged 2 to 18
years with a clinical diagnosis of ASD specified according to the DSM-IV diagnostic criteria. They
reported acceptable psychometric properties including test–retest reliability, internal consistencies,
and concurrent validity when compared with the Chinese version of the ADI-R (Gau et al., 2010).
Additionally, they found boys scored significantly higher than girls on the SCQ total score, and
children with ID scored significantly higher on the social interaction subscale than children without
ID. They also conducted exploratory factor analysis revealing a 3-factor model (social interaction,
repetitive behaviours and communication) that had acceptable fits in confirmatory factor analysis
(Table 5.1).
Avcil et al. (2015) examined the validity of the Turkish version of the SCQ in children and
adolescents aged 4 to 18 years with PDD and others with ID. They reported acceptable test–retest
reliability, high internal consistency and recommended the cut-off point of 15 as determined by the
receiver operating characteristic (ROC) analysis. After performing factor analysis, the authors report a
4-factor model (reciprocal social interaction, communication, abnormal language and stereotyped
repetitive behaviours) (Table 5.1).
Findings from a pilot study investigating the psychometric properties of the Greek version of the SCQ
(Zarokanellou et al., 2017) in a sample of children aged 7 to10 years diagnosed with ASD and
typically developing children revealed a clinical cut-off point of 15. The authors reported acceptable
internal consistencies and fit models for the confirmatory factor analysis (Table 5.1).
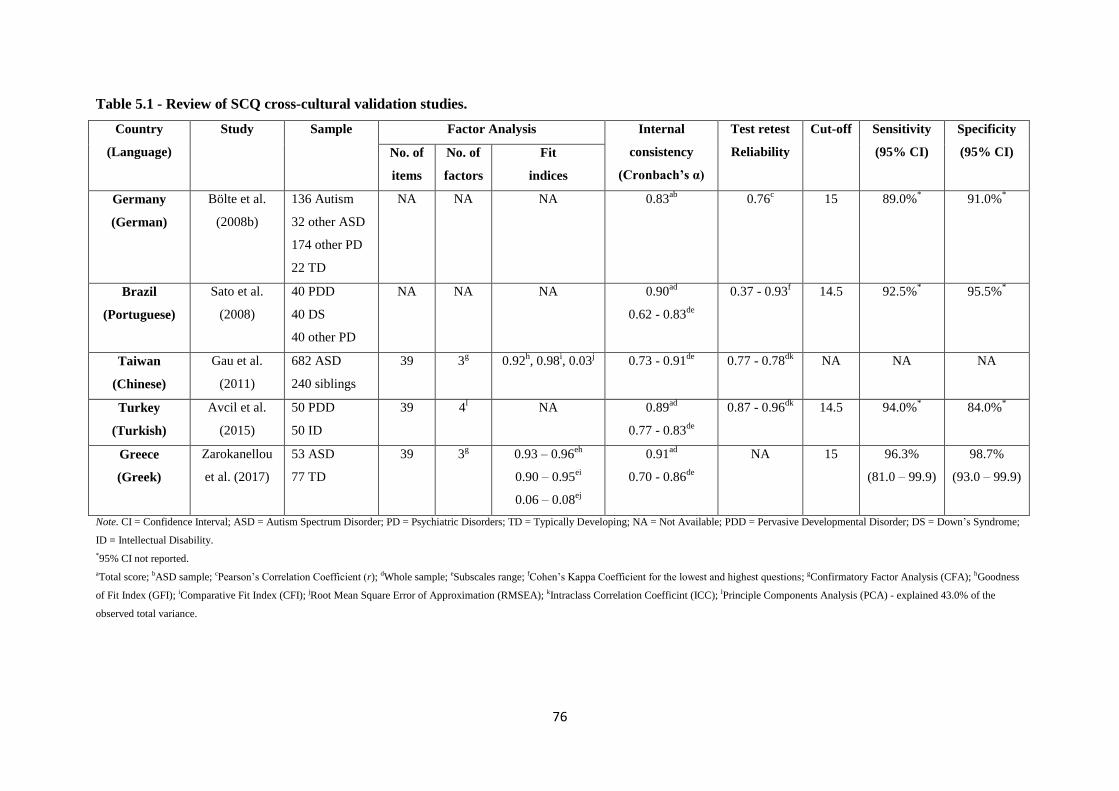
76
Table 5.1 - Review of SCQ cross-cultural validation studies.
Country
(Language)
Study Sample Factor Analysis Internal
consistency
(Cronbach’s α)
Test retest
Reliability
Cut-off Sensitivity
(95% CI)
Specificity
(95% CI) No. of
items
No. of
factors
Fit
indices
Germany
(German)
Bölte et al.
(2008b)
136 Autism
32 other ASD
174 other PD
22 TD
NA NA NA 0.83ab
0.76c 15 89.0%
* 91.0%
*
Brazil
(Portuguese)
Sato et al.
(2008)
40 PDD
40 DS
40 other PD
NA NA NA 0.90ad
0.62 - 0.83de
0.37 - 0.93f 14.5 92.5%
* 95.5%
*
Taiwan
(Chinese)
Gau et al.
(2011)
682 ASD
240 siblings
39 3g 0.92
h, 0.98
i, 0.03
j 0.73 - 0.91
de
0.77 - 0.78dk
NA NA NA
Turkey
(Turkish)
Avcil et al.
(2015)
50 PDD
50 ID
39 4l NA 0.89
ad
0.77 - 0.83de
0.87 - 0.96dk
14.5 94.0%* 84.0%
*
Greece
(Greek)
Zarokanellou
et al. (2017)
53 ASD
77 TD
39 3g 0.93 – 0.96
eh
0.90 – 0.95ei
0.06 – 0.08ej
0.91ad
0.70 - 0.86de
NA 15 96.3%
(81.0 – 99.9)
98.7%
(93.0 – 99.9)
Note. CI = Confidence Interval; ASD = Autism Spectrum Disorder; PD = Psychiatric Disorders; TD = Typically Developing; NA = Not Available; PDD = Pervasive Developmental Disorder; DS = Down‘s Syndrome;
ID = Intellectual Disability.
*95% CI not reported.
aTotal score; bASD sample; cPearson‘s Correlation Coefficient (r); dWhole sample; eSubscales range; fCohen‘s Kappa Coefficient for the lowest and highest questions; gConfirmatory Factor Analysis (CFA); hGoodness
of Fit Index (GFI); iComparative Fit Index (CFI); jRoot Mean Square Error of Approximation (RMSEA); kIntraclass Correlation Coefficint (ICC); lPrinciple Components Analysis (PCA) - explained 43.0% of the
observed total variance.
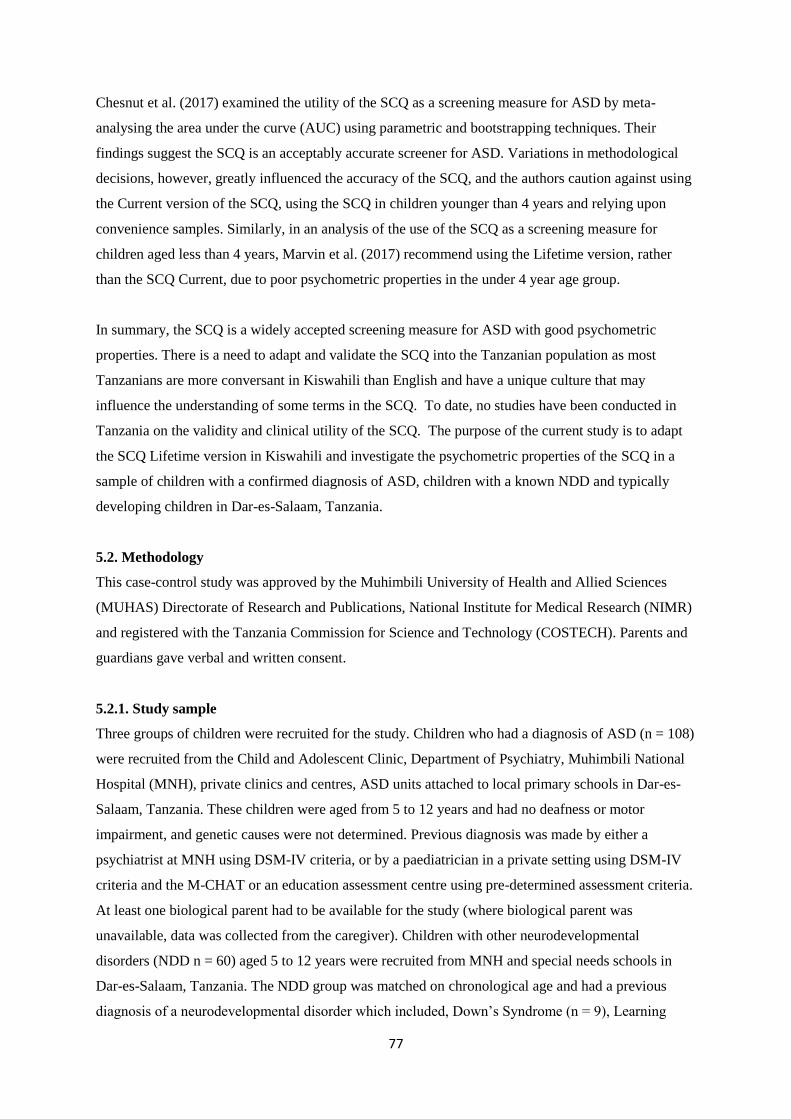
77
Chesnut et al. (2017) examined the utility of the SCQ as a screening measure for ASD by meta-
analysing the area under the curve (AUC) using parametric and bootstrapping techniques. Their
findings suggest the SCQ is an acceptably accurate screener for ASD. Variations in methodological
decisions, however, greatly influenced the accuracy of the SCQ, and the authors caution against using
the Current version of the SCQ, using the SCQ in children younger than 4 years and relying upon
convenience samples. Similarly, in an analysis of the use of the SCQ as a screening measure for
children aged less than 4 years, Marvin et al. (2017) recommend using the Lifetime version, rather
than the SCQ Current, due to poor psychometric properties in the under 4 year age group.
In summary, the SCQ is a widely accepted screening measure for ASD with good psychometric
properties. There is a need to adapt and validate the SCQ into the Tanzanian population as most
Tanzanians are more conversant in Kiswahili than English and have a unique culture that may
influence the understanding of some terms in the SCQ. To date, no studies have been conducted in
Tanzania on the validity and clinical utility of the SCQ. The purpose of the current study is to adapt
the SCQ Lifetime version in Kiswahili and investigate the psychometric properties of the SCQ in a
sample of children with a confirmed diagnosis of ASD, children with a known NDD and typically
developing children in Dar-es-Salaam, Tanzania.
5.2. Methodology
This case-control study was approved by the Muhimbili University of Health and Allied Sciences
(MUHAS) Directorate of Research and Publications, National Institute for Medical Research (NIMR)
and registered with the Tanzania Commission for Science and Technology (COSTECH). Parents and
guardians gave verbal and written consent.
5.2.1. Study sample
Three groups of children were recruited for the study. Children who had a diagnosis of ASD (n = 108)
were recruited from the Child and Adolescent Clinic, Department of Psychiatry, Muhimbili National
Hospital (MNH), private clinics and centres, ASD units attached to local primary schools in Dar-es-
Salaam, Tanzania. These children were aged from 5 to 12 years and had no deafness or motor
impairment, and genetic causes were not determined. Previous diagnosis was made by either a
psychiatrist at MNH using DSM-IV criteria, or by a paediatrician in a private setting using DSM-IV
criteria and the M-CHAT or an education assessment centre using pre-determined assessment criteria.
At least one biological parent had to be available for the study (where biological parent was
unavailable, data was collected from the caregiver). Children with other neurodevelopmental
disorders (NDD n = 60) aged 5 to 12 years were recruited from MNH and special needs schools in
Dar-es-Salaam, Tanzania. The NDD group was matched on chronological age and had a previous
diagnosis of a neurodevelopmental disorder which included, Down‘s Syndrome (n = 9), Learning

78
Disability (n = 33), Seizure Disorders (n = 8) and ADHD (n = 10). Typically developing (TD)
children (n = 116) were randomly selected from the community with no known concerns of language
and/or behavioral problems and did not have any history of learning or psychiatric disabilities
according to our assessments. They were matched with the ASD group on a surrogate marker of IQ
i.e. level of expressive language (ADOS-2 Module).
5.2.2. Assessment measures
ASD screening instrument
Social Communication Questionnaire (SCQ; Rutter et al., 2003): The SCQ Lifetime version was
used in this study. This is a brief 40-item Yes/No questionnaire that helps to evaluate communication
skills and social functioning suggested for use in children above 4 years of age who may have ASD.
This questionnaire is a cost-effective way of screening for referral for a complete diagnostic
evaluation. It is administered to a parent or other primary caregiver and takes less than 10 minutes.
The SCQ has strong discriminating power between those with and without ASD and has been
translated and validated cross-culturally (Table 5.1). In addition to the Total Score, the SCQ can also
be used to provide subscores that match the Reciprocal Interaction domain, the Communication
domain and the Restricted, Repetitive and Stereotyped Patterns of Behaviour domain of the ADI-R.
Although formal scoring of these subdomains is not supported in the SCQ Auto Score materials, the
manual is in full support of researchers wanting to investigate these subdomains. It is important to
note, according to the SCQ manual, items 17, 18 and 38 do not belong to any of the subdomains and
are therefore omitted from domain-wise analysis and factor analysis.
Additional tools used to aid confirmation of the diagnosis of ASD in probands
Autism Diagnostic Observation Scale, 2nd
Edition (ADOS; Lord et al., 2000; ADOS-2; Lord et al.,
2012): The ADOS is designed to diagnose and assess ASD using a series of structured and semi-
structured tasks that involve social interaction between the examiner and the subject. It consists of
four modules; each attuned to differing developmental and language levels, ranging from little if any
expressive and receptive language, and therefore can be administered to subjects ranging from
children as young as 18 months through adolescence and adulthood. Each module takes just 30-40
minutes to administer, making it a quick and robust instrument. ADOS has been found to have
exceptional diagnostic sensitivity and specificity (Lord et al., 2000). Other diagnostic tools for ASD
are also available including the Autism Diagnostic Interview Revised (ADI-R; Le Couteur et al.,
2003), the Diagnostic Interview for Social and Communication Disorders (DISCO; Wing et al., 2002)
and the Developmental, Dimensional and Diagnostic Interview (3Di; Skuse et al., 2004), all of which
use interview techniques with parents or caretakers as a means of collecting information concerning
the developmental history and current behaviour. The ADOS, however, is an observational

79
assessment and can be used to evaluate almost anyone suspected of having ASD, from toddlers to
adults, from children with no speech to adults who are verbally fluent.
Diagnostic Statistical Manual of Mental Disorders, 5th
Edition (DSM-5 - APA, 2013): A DSM-5
checklist (Appendix 5), guidelines and criteria exemplars were used for clinical assessments of the
children in our sample. DSM-5 defines ASD within two domains; ―persistent difficulties with social
communication and social interaction‖ and ―restricted and repetitive patterns of behaviours, activities
and interests‖ (this includes sensory behaviour). To diagnose the child with ASD, he/she must display
all 3 criteria under the social interaction and social communication domain and at least 2 out of 4
under the restricted interests and repetitive behaviour domain. The symptoms must be present since
early childhood and limit and impair everyday functioning. The DSM-5 also requires a severity rating
be given for each domain ranging from requiring some support to requiring very substantial support.
Neuropsychological testing
For the purpose of this study, we used the adapted version of the Raven‘s Coloured Progressive
Matrices (CPM; Raven et al., 1998; Kitsao-Wekulo et al., 2012) and the adapted version of the
Peabody Picture Vocabulary Test (PPVT; Dunn & Dunn, 1981; Holding et al., 2004), both providing
sound psychometric properties (internal consistency ≥ .70; test reliability ≥.75) enabling reliable
administration by a trained person without previous experience in testing.
The Raven‘s CPM measures reasoning ability and is designed for young children between 5 to 12
years of age, older adults and mentally and physically impaired persons. The test consists of 36 items
in 3 sets (A, Ab, B), with 12 items per set and takes between 15 to 30 minutes to administer. The
items are arranged to assess the main cognitive processes which children under 11 years of age are
usually capable. The PPVT is designed to assess the verbal intelligence of an individual. It measures
receptive language processing from 2 years of age and takes 20 to 30 minutes to administer. All
children in this study were asked to complete both these neuropsychological tests as a means to
control for IQ and receptive language.
5.2.3. Translation of measures
Permission was sought and granted from the Western Psychological Services (WPS) to translate the
SCQ. Initial translation of the English version of the SCQ into Kiswahili was done by two
independent linguistic specialists at KEMRI-Wellcome Trust Research Programme (KWTRP) in
Kilifi, Kenya. A panel meeting of experts was held to harmonize all translated items and subsequent
back-translation into English was done by another independent linguistic specialist. Items 21, 34 and
40 were slightly modified to take into account the local cultural context. For instance, for item 34,
social games for children such as the ‗Mulberry Bush‘ and ‗London Bridge is falling down‘ were
replaced with local games such as ‗Ukuti Ukuti‘, which involves a group of children holding hands,

80
jumping and singing and going around in a circle. The final Kenyan version of the SCQ was then
slightly modified to suit the Tanzanian Kiswahili by the fieldworker recruited for phase two and a
linguistic specialist at MUHAS, and back-translated into English by another linguistic specialist at
MUHAS. The back-translated version was reviewed by a clinical psychologist from the Department
of Psychiatry at MNH, who recommended minor modifications until the questions therein retained
their original meaning (Appendix 7). Permission was sought and granted from the WPS to translate
the ADOS-2 Manual. The same translation and back-translation method as above was used for the
ADOS-2 Manual (all modules).
5.2.4. Procedures
Parents and guardians were informed of the objectives of the study. Verbal and written consent were
sought from all parties. Families were invited to the clinic or the schools for assessment. Each visit
lasted approximately 2 to 3 hours. After obtaining consent, parents of participating children were
asked to complete the Social Demographic Questionnaire and the SCQ. All children were requested to
complete the neuropsychological testing (RAVEN‘s CPM and the PPVT), followed by an ADOS-2
assessment. Parents were asked to be present in the assessment room and each assessment was
videotaped so that later a panel of experts can categorize these children and this information was used
as an extra validity check. Of the 284 respondents, 50 were selected using a fixed interval sample
method. Of these, 35 (70%) completed the SCQ after at least 2 weeks to examine the test-retest
reliability. I was fully involved with the recruitment of participants and collected all the data for this
study with assistance from the fieldworker where Kiswahili was required. I directly administered the
neuropsychological tests, ADOS, SCQ and the socio-demographic questionnaire. I trained, supervised
and oversaw any assistance from the fieldworker.
5.2.5. Statistical analysis
Data analysis was done using IBM SPSS version 20 and R version 3.0.2. Descriptive statistics were
computed and the distribution of scores per group explored. To evaluate discriminant validity,
differences in scores between sex and respondent groups were tested using Mann Whitney U tests.
A p-value of ≤0.05 was considered statistically significant. The internal consistency of the SCQ was
calculated using Cronbach's coefficient alpha (α) (Cronbach, 1951). An Intraclass Correlation
Coefficient (ICC) and Spearman‘s correlation coefficient were used to evaluate the test–retest
reliability. Confirmatory Factor Analysis (CFA) with diagonally weighted least squares was
performed to determine a 2 factor model of the SCQ. The factors were derived from the DSM-5
criteria of ASD; combining social interaction and communication as one factor, and restricted,
repetitive behaviour or interests as the second factor. For the purposes of further factor analysis,
responses for all nonverbal children were replaced with a score of 1. The cut-off for standardized
coefficient loadings was set at 0.30. An acceptable model fit was obtained if the Root Mean Squared
81
Error of Approximation (RMSEA) was < 0.06 and if the Tucker Lewis Index (TLI) and Comparative
Fit Index (CFI) were > 0.9 (Yu, 2002; Browne & Cudeck, 1992). ROC analysis was performed to test
the sensitivity and specificity of the SCQ.
5.3. Results
5.3.1. General sample description
SCQ data was collected for 108 children diagnosed with ASD, 116 typically developing (TD) children
and 60 children with other neurodevelopmental disorders (NDD). Of these eligible children, males
formed 79% of the ASD group, 57% of the TD group and 65% of the NDD group. The median age
was significantly different between ASD and TD groups (7.1 vs. 2.8; p < 0.0001), because the TD
group was matched on expressive language level. There was also a significant difference between the
median age between ASD and NDD groups (7.1 vs. 10.0; p < 0.0001). Frequency of males was
significantly higher in the ASD group than in the TD group (79% vs. 57%; p = 0.001). Item 1 on the
SCQ documents whether or not the child has phrase speech (―Is she/he now able to talk using short
phrases or sentences?‖). Only 24% of our ASD sample had phrase speech in comparison to 93% of
the TD group (p < 0.0001) and 58% of the NDD group (p = 0.001). Furthermore, only 6% of the ASD
group were able to complete the Raven‘s CPM in comparison to 30% of the NDD group (p < 0.0001)
and only 11% of the ASD group were able to complete the PPVT in comparison to the 72% of NDD
group (p < 0.0001). It was not possible to do the Raven‘s CPM and PPVT neuropsychological testing
on the TD group since they were too young. The 108 respondents in the ASD group comprised of 91
(84%) mothers, 14 (13%) fathers and 3 (3%) other caregivers. Similarly, more mothers were
respondents in the TD (87%) and NDD groups (85%). Table 5.2 compares the distribution of
participant characteristics between ASD and TD groups and ASD and NDD groups.
Table 5.2 - Distribution of participant characteristics between ASD, NDD and TD groups
enrolled in this study.
Participant
characteristics
ASD
(n = 108)
TD
(n = 116)
NDD
(n = 60)
ASD vs. TD
p-value
ASD vs. NDD
p-value
Age in years:
Median (IQR)
7.1
(5.9 – 9.1)
2.8
(2.6 – 3.1)
10.0
(8.2 – 11.0)
< 0.0001*a
< 0.0001*a
Male sex 85 (79%) 66 (57%) 39 (65%) 0.001*b
0.053b
Phrase speech
(SCQ Item 1)
26 (24%) 108 (93%) 35 (58%) < 0.0001*b
0.001*b
Raven’s CPM 6 (6%) NA 18 (30%) NA 0.001*b
PPVT 12 (11%) NA 43 (72%) NA < 0.0001*b
Note. ASD = Autism Spectrum Disorder; TD = Typically Developing; NDD = Neurodevelopmental Disorders; IQR = Interquartile Range;
SCQ = Social Communication Questionnaire; CPM = Coloured Progressive Matrices; PPVT – Peabody Picture Vocabulary Test.
aMann Whitney U test; bPearson‘s chi-squared test (dichotomous and categorical variables). *p < 0.05
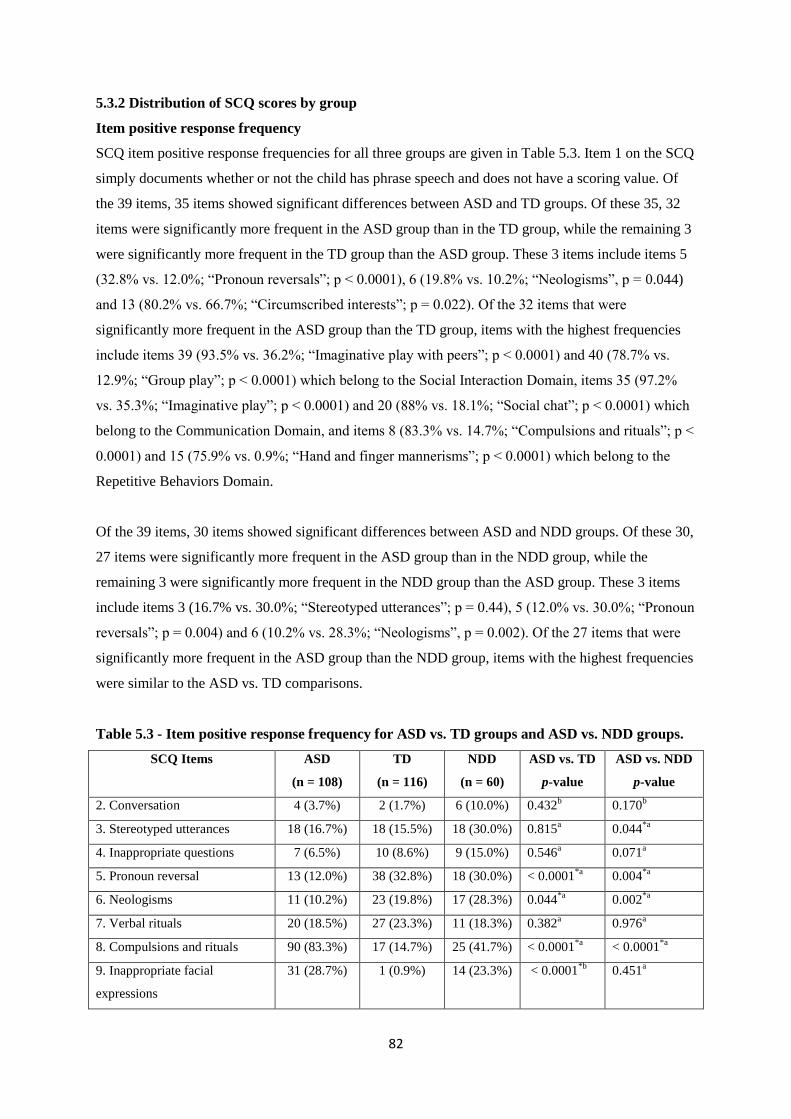
82
5.3.2 Distribution of SCQ scores by group
Item positive response frequency
SCQ item positive response frequencies for all three groups are given in Table 5.3. Item 1 on the SCQ
simply documents whether or not the child has phrase speech and does not have a scoring value. Of
the 39 items, 35 items showed significant differences between ASD and TD groups. Of these 35, 32
items were significantly more frequent in the ASD group than in the TD group, while the remaining 3
were significantly more frequent in the TD group than the ASD group. These 3 items include items 5
(32.8% vs. 12.0%; ―Pronoun reversals‖; p < 0.0001), 6 (19.8% vs. 10.2%; ―Neologisms‖, p = 0.044)
and 13 (80.2% vs. 66.7%; ―Circumscribed interests‖; p = 0.022). Of the 32 items that were
significantly more frequent in the ASD group than the TD group, items with the highest frequencies
include items 39 (93.5% vs. 36.2%; ―Imaginative play with peers‖; p < 0.0001) and 40 (78.7% vs.
12.9%; ―Group play‖; p < 0.0001) which belong to the Social Interaction Domain, items 35 (97.2%
vs. 35.3%; ―Imaginative play‖; p < 0.0001) and 20 (88% vs. 18.1%; ―Social chat‖; p < 0.0001) which
belong to the Communication Domain, and items 8 (83.3% vs. 14.7%; ―Compulsions and rituals‖; p <
0.0001) and 15 (75.9% vs. 0.9%; ―Hand and finger mannerisms‖; p < 0.0001) which belong to the
Repetitive Behaviors Domain.
Of the 39 items, 30 items showed significant differences between ASD and NDD groups. Of these 30,
27 items were significantly more frequent in the ASD group than in the NDD group, while the
remaining 3 were significantly more frequent in the NDD group than the ASD group. These 3 items
include items 3 (16.7% vs. 30.0%; ―Stereotyped utterances‖; p = 0.44), 5 (12.0% vs. 30.0%; ―Pronoun
reversals‖; p = 0.004) and 6 (10.2% vs. 28.3%; ―Neologisms‖, p = 0.002). Of the 27 items that were
significantly more frequent in the ASD group than the NDD group, items with the highest frequencies
were similar to the ASD vs. TD comparisons.
Table 5.3 - Item positive response frequency for ASD vs. TD groups and ASD vs. NDD groups.
SCQ Items ASD
(n = 108)
TD
(n = 116)
NDD
(n = 60)
ASD vs. TD
p-value
ASD vs. NDD
p-value
2. Conversation 4 (3.7%) 2 (1.7%) 6 (10.0%) 0.432b 0.170
b
3. Stereotyped utterances 18 (16.7%) 18 (15.5%) 18 (30.0%) 0.815a 0.044
*a
4. Inappropriate questions 7 (6.5%) 10 (8.6%) 9 (15.0%) 0.546a 0.071
a
5. Pronoun reversal 13 (12.0%) 38 (32.8%) 18 (30.0%) < 0.0001*a
0.004*a
6. Neologisms 11 (10.2%) 23 (19.8%) 17 (28.3%) 0.044*a
0.002*a
7. Verbal rituals 20 (18.5%) 27 (23.3%) 11 (18.3%) 0.382a 0.976
a
8. Compulsions and rituals 90 (83.3%) 17 (14.7%) 25 (41.7%) < 0.0001*a
< 0.0001*a
9. Inappropriate facial
expressions
31 (28.7%) 1 (0.9%) 14 (23.3%) < 0.0001*b
0.451a
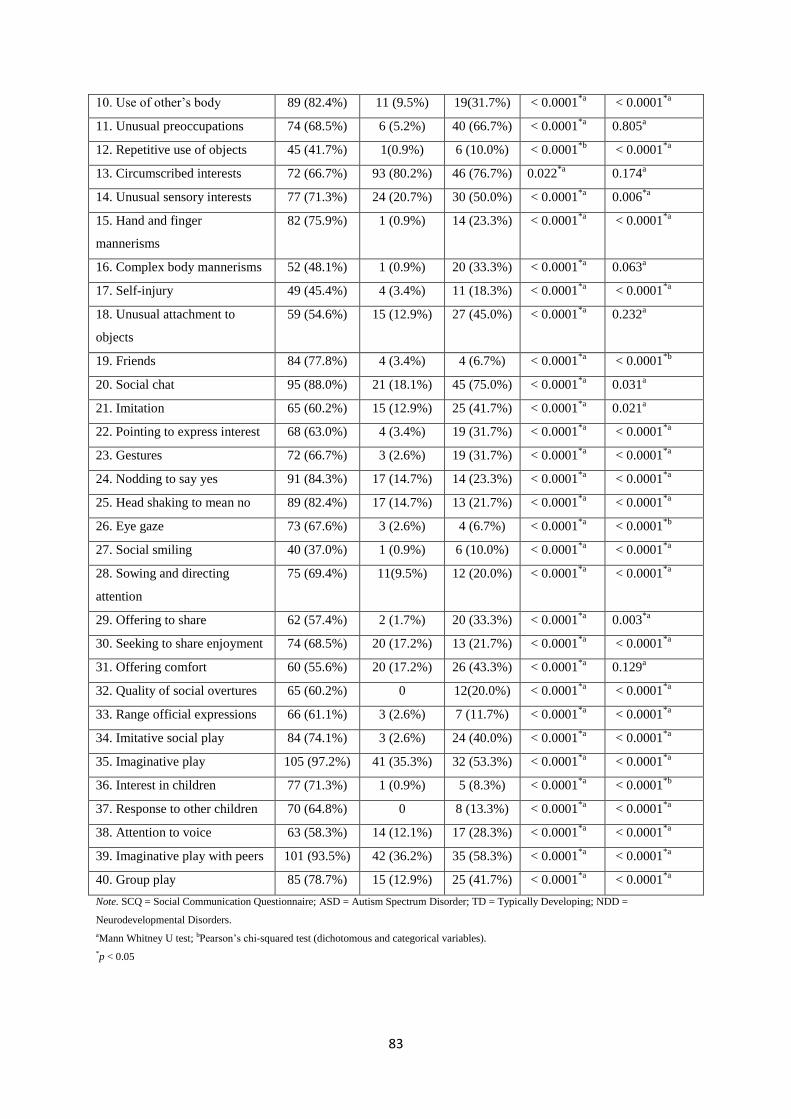
83
10. Use of other‘s body 89 (82.4%) 11 (9.5%) 19(31.7%) < 0.0001*a
< 0.0001*a
11. Unusual preoccupations 74 (68.5%) 6 (5.2%) 40 (66.7%) < 0.0001*a
0.805a
12. Repetitive use of objects 45 (41.7%) 1(0.9%) 6 (10.0%) < 0.0001*b
< 0.0001*a
13. Circumscribed interests 72 (66.7%) 93 (80.2%) 46 (76.7%) 0.022*a
0.174a
14. Unusual sensory interests 77 (71.3%) 24 (20.7%) 30 (50.0%) < 0.0001*a
0.006*a
15. Hand and finger
mannerisms
82 (75.9%) 1 (0.9%) 14 (23.3%) < 0.0001*a
< 0.0001*a
16. Complex body mannerisms 52 (48.1%) 1 (0.9%) 20 (33.3%) < 0.0001*a
0.063a
17. Self-injury 49 (45.4%) 4 (3.4%) 11 (18.3%) < 0.0001*a
< 0.0001*a
18. Unusual attachment to
objects
59 (54.6%) 15 (12.9%) 27 (45.0%) < 0.0001*a
0.232a
19. Friends 84 (77.8%) 4 (3.4%) 4 (6.7%) < 0.0001*a
< 0.0001*b
20. Social chat 95 (88.0%) 21 (18.1%) 45 (75.0%) < 0.0001*a
0.031a
21. Imitation 65 (60.2%) 15 (12.9%) 25 (41.7%) < 0.0001*a
0.021a
22. Pointing to express interest 68 (63.0%) 4 (3.4%) 19 (31.7%) < 0.0001*a
< 0.0001*a
23. Gestures 72 (66.7%) 3 (2.6%) 19 (31.7%) < 0.0001*a
< 0.0001*a
24. Nodding to say yes 91 (84.3%) 17 (14.7%) 14 (23.3%) < 0.0001*a
< 0.0001*a
25. Head shaking to mean no 89 (82.4%) 17 (14.7%) 13 (21.7%) < 0.0001*a
< 0.0001*a
26. Eye gaze 73 (67.6%) 3 (2.6%) 4 (6.7%) < 0.0001*a
< 0.0001*b
27. Social smiling 40 (37.0%) 1 (0.9%) 6 (10.0%) < 0.0001*a
< 0.0001*a
28. Sowing and directing
attention
75 (69.4%) 11(9.5%) 12 (20.0%) < 0.0001*a
< 0.0001*a
29. Offering to share 62 (57.4%) 2 (1.7%) 20 (33.3%) < 0.0001*a
0.003*a
30. Seeking to share enjoyment 74 (68.5%) 20 (17.2%) 13 (21.7%) < 0.0001*a
< 0.0001*a
31. Offering comfort 60 (55.6%) 20 (17.2%) 26 (43.3%) < 0.0001*a
0.129a
32. Quality of social overtures 65 (60.2%) 0 12(20.0%) < 0.0001*a
< 0.0001*a
33. Range official expressions 66 (61.1%) 3 (2.6%) 7 (11.7%) < 0.0001*a
< 0.0001*a
34. Imitative social play 84 (74.1%) 3 (2.6%) 24 (40.0%) < 0.0001*a
< 0.0001*a
35. Imaginative play 105 (97.2%) 41 (35.3%) 32 (53.3%) < 0.0001*a
< 0.0001*a
36. Interest in children 77 (71.3%) 1 (0.9%) 5 (8.3%) < 0.0001*a
< 0.0001*b
37. Response to other children 70 (64.8%) 0 8 (13.3%) < 0.0001*a
< 0.0001*a
38. Attention to voice 63 (58.3%) 14 (12.1%) 17 (28.3%) < 0.0001*a
< 0.0001*a
39. Imaginative play with peers 101 (93.5%) 42 (36.2%) 35 (58.3%) < 0.0001*a
< 0.0001*a
40. Group play 85 (78.7%) 15 (12.9%) 25 (41.7%) < 0.0001*a
< 0.0001*a
Note. SCQ = Social Communication Questionnaire; ASD = Autism Spectrum Disorder; TD = Typically Developing; NDD =
Neurodevelopmental Disorders.
aMann Whitney U test; bPearson‘s chi-squared test (dichotomous and categorical variables).
*p < 0.05

84
Discriminant validity
The SCQ median total scores and median scores on all three domains were compared between ASD
and TD groups and ASD and NDD groups (Table 5.4). The median SCQ total score was significantly
higher for the ASD group compared to the TD group (23.0 (IQR 19.0 – 25.0) vs. 5.0 (IQR 2.25 – 6.0);
p< 0.0001) and significantly higher for the ASD group compared to the NDD group (23.0 (IQR 19.0 –
25.0) vs. 12.0 (IQR 9.0 – 15.0); p< 0.0001). A similar trend was found when comparing ASD to TD
groups and ASD to NDD groups on all three domains (p< 0.001). Figure 5.1 illustrates the boxplots
for group differences for SCQ total scores and all three domains.
Table 5.4 - Discriminant validity for ASD vs. TD groups and ASD vs. NDD groups.
SCQ Scores ASD
(n = 108)
TD
(n = 116)
NDD
(n = 60)
ASD vs. TD
p-valuea
ASD vs. NDD
p-valuea
Total Score:
Median (IQR)
23.0
(19.0 – 26.0)
5.0
(2.3 – 6.0)
12.0
(9.0 – 15.0)
< 0.0001* < 0.0001
*
Social Interaction
Domain:
Median (IQR)
10.0
(7.0 -12.5)
1.0
(0 – 1.0)
3.5
(2.0 -5.0)
< 0.001* < 0.001
*
Communication
Domain:
Median (IQR)
7.0
(5.0 – 8.0)
2.0
(0- 3.0)
4.0
(3.0 – 6.0)
< 0.001* < 0.001
*
Repetitive
Behaviours
Domain:
Median (IQR)
5.0
(4.0 – 6.0)
1.0
(1.0 – 2.0)
3.0
(2.0 – 4.0)
< 0.001* < 0.001
*
Note. SCQ = Social Communication Questionnaire; ASD = Autism Spectrum Disorder; TD = Typically Developing; NDD =
Neurodevelopmental Disorders; IQR = Interquartile Range.
a Mann Whitney U test as continuous variable and non-parametric despite log-transforming it.
*p < 0.05

85
Figure 5.1 - Group comparison boxplots.
Note. SCQ = Social Communication Questionnaire; ASD = Autism Spectrum Disorder; NDD = Neurodevelopmental Disorders; TD =
Typically Developing.
Participant sex and respondent effects
Differences in SCQ total scores and all three domains between male and female participants were
compared for each group; ASD, NDD and TD respectively (Table 5.5). Our results found only one
significant difference between male participants with NDD and female participants with NDD for the
repetitive behaviors domain (3 (IQR 2 – 5) vs. (2 (IQR 2 – 3); p= 0.030).
Table 5.6 demonstrates the differences in SCQ total scores and all three domains between mother and
father respondents and mother and caregiver respondents for each group. When comparing respondent
differences, no significant differences were found between mothers of children with ASD and fathers
of children with ASD, mothers of children with ASD and caregivers of children with ASD, mothers of
children with NDD and fathers of children with NDD, mothers of children with NDD and caregivers
of children with NDD, mothers of TD children and fathers of TD children, as well as mothers of TD
children and caregivers of TD children.
01
02
03
0S
CQ
to
tal sco
re
ASD NDD TD
05
10
15
So
cia
l in
tera
ctio
n
ASD NDD TD
05
10
15
Co
mm
un
ication
ASD NDD TD
02
46
8R
ep
etitive
be
ha
vio
ur
ASD NDD TD

86
Table 5.5 - Differences in SCQ total scores and the 3 domains between male and female participants for each group.
SCQ
Whole
group
(n=284)
ASD
Male
(n = 85)
ASD
Female
(n=23)
TD
Male
(n= 66)
TD
Female
(n = 50)
NDD
Male
(n = 39)
NDD
Female
(n=21)
Difference
between
ASD male and
ASD female
p-valuea
Difference
between
NDD male and
NDD female
p-valuea
Difference
between
TD male and
TD female
p-valuea
Total score
Median (IQR)
12
(5 – 21)
24
(20 - 26)
22
(18 – 25)
5
(3 – 6)
4
(2 – 6)
12
(9 – 15)
12
(10 – 15)
0.256 0.518 0.259
Social interaction
domain
Median (IQR)
3
(1 – 9)
10
(7 – 13)
9
(6 – 12)
1
(0 - 2)
1
(0 – 1)
2
(1 – 5)
4
(2 – 5)
0.338 0.132 0.281
Communication
domain
Median (IQR)
4
(2 – 7)
7
(5 – 8)
7
(5 – 8)
2
(0 – 3)
1
(0 – 2)
3
(2 – 6)
5
(3 – 7)
0.232 0.121 0.062
Repetitive
behaviour domain
Median (IQR)
3
(1 – 5)
5
(4 – 6)
5
(3 – 6)
1
(1 – 2)
1
(1 – 2)
3
(2 – 5)
2
(2 – 3)
0.786 0.030* 0.180
Note. Social Communication Questionnaire; ASD = Autism Spectrum Disorder; TD = Typically Developing; NDD = Neurodevelopmental Disorders; IQR = Interquartile Range.
a Mann Whitney U test.
*p < 0.05

87
Table 5.6 - Differences in SCQ total scores and the 3 domains between mother and father respondents and mother and caregiver respondents for
each group.
SCQ
ASD NDD TD ASD NDD TD
Mo
(n = 91)
Fa
(n = 14)
Cg
(n = 3)
Mo
(n =51)
Fa
(n = 6)
Cg
(n = 3)
Mo
(n=101
)
Fa
(n = 6)
Cg
(n = 9)
Mo vs.
Fa
p-valuea
Mo vs.
Cg
p-valuea
Mo vs.
Fa
p-valuea
Mo vs.
Cg
p-valuea
Mo vs.
Fa
p-valuea
Mo vs.
Cg
p-valuea
Total score
Median (IQR)
23
(18 – 26)
24.5
(20 – 26)
21
(17 – 21)
12
(9 -15)
10
(10 – 14)
12
(11 – 16)
5
(3 – 6)
4.5
(3 – 6)
3
(1 – 5)
0.688 0.306 0.855 0.622 0.769 0.164
Social
interaction
domain
Median (IQR)
10
(7 – 13)
10
(8 – 12)
10
(3 – 10)
3
(2 – 5)
2
(1 – 4)
4
(4 – 5)
1
(0 -1)
0
(0 – 3)
1
(0 – 1)
0.677 0.369
0.422 0.445 0.670 0.954
Comm.
domain
Median (IQR)
7
(5 – 8)
7
(6 – 8)
7
(7 – 8)
4
(3 – 6)
6
(1 – 6)
4
(3 – 6)
2
(0 -3)
1.5
(1 – 4)
1
(0 – 2)
0.512 0.542 0.958 0.894 0.846 0.108
Repetitive
behaviour
domain
Median (IQR)
5
(4 – 6)
5
(4 – 6)
4
(3 – 5)
3
(2 – 4)
2.5
(2 – 5)
3
(2 – 5)
1
(1 – 2)
1
(1 – 2)
1
(1 – 2)
0.477 0.381 0.884 0.817 0.769 0.732
Note. ASD = Autism Spectrum Disorder; NDD = Neurodevelopmental Disorders; TD = typically developing; Mo = Mother; Fa = Father; Cg = Caregiver; IQR = Interquartile Range.
aMann Whitney U test.
*p < 0.05

88
5.3.3. SCQ reliability
Internal consistency of the SCQ
The internal consistency of the SCQ as measured by Cronbach‘s coefficient alpha for all items for the
whole group was 0.92 (95% CI, 0.91-0.93) and was 0.68 (95% CI, 0.58-0.76) for the ASD group, 0.67
(95% CI, 0.54-0.78) for the NDD group and 0.56 (95% CI, 0.44-0.67) for the TD group (Table 5.7).
All three domains of the SCQ had acceptable to excellent Cronbach‘s coefficient alphas (0.65–0.92)
for the whole group. However, when measuring the internal consistency of the individual groups for
each domain the Cronbach‘s coefficient alphas were much lower (0.25-0.75) with higher Cronbach‘s
coefficient alphas for the social interaction domain for the ASD group (0.75) and lowest for the
repetitive behaviours domain for the ASD group (0.25). However, when the social interaction and
communication domains were combined the Cronbach‘s coefficient alphas were much higher (Table
5.7).
Table 5.7 - Internal consistency of the SCQ for all items and all 3 domains for individual groups
and the whole group.
SCQ
ASD
Cronbach’s α
(95% CI)
NDD
Cronbach’s α
(95% CI)
TD
Cronbach’s α
(95% CI)
Whole Group
Cronbach’s α
(95% CI)
All items 0.68
(0.58 – 0.76)
0.67
(0.54 – 0.78)
0.56
(0.44 – 0.67)
0.92
(0.91 – 0.93)
Social Interaction
Domain
0.75
(0.68 – 0.82)
0.61
(0.45 – 0.74)
0.45
(0.29 – 0.59)
0.91
(0.89 – 0.93)
Communication
Domain
0.44
(0.28 – 0.59)
0.51
(0.31 – 0.69)
0.47
(0.31 – 0.60)
0.74
(0.69 – 0.78)
Social and
Communication
Domaina
0.74
(0.67 – 0.81)
0.68
(0.55 – 0.71)
0.58
(0.46 – 0.68)
0.92
(0.91 – 0.93)
Repetitive Behaviours
Domain
0.25
(0.02 – 0.45)
0.46
(0.22 – 0.64)
0.29
(0.08 – 0.47)
0.65
(0.58 – 0.71)
Note. SCQ = Social Communication Questionnaire; ASD = Autism Spectrum Disorder; NDD = Neurodevelopmental Disorders; TD =
Typically Developing; CI = Confidence Interval.
a Based on combining the social interaction domain and communication domain.
Test-retest reliability
The SCQ was initially filled out by parents or caregivers of a total of 284 children. Of these 284
children, 35 were screened again after two weeks. Table 5.8 shows the SCQ demonstrated excellent
test-retest reliability (ICC = 0.972 [95% CI, 0.945-0.986] – 0.998 [95% CI, 0.996-0.999]). The before
and after SCQ total scores were significantly correlated (Spearman correlation coefficient (rho) =
0.995; p < 0.001).
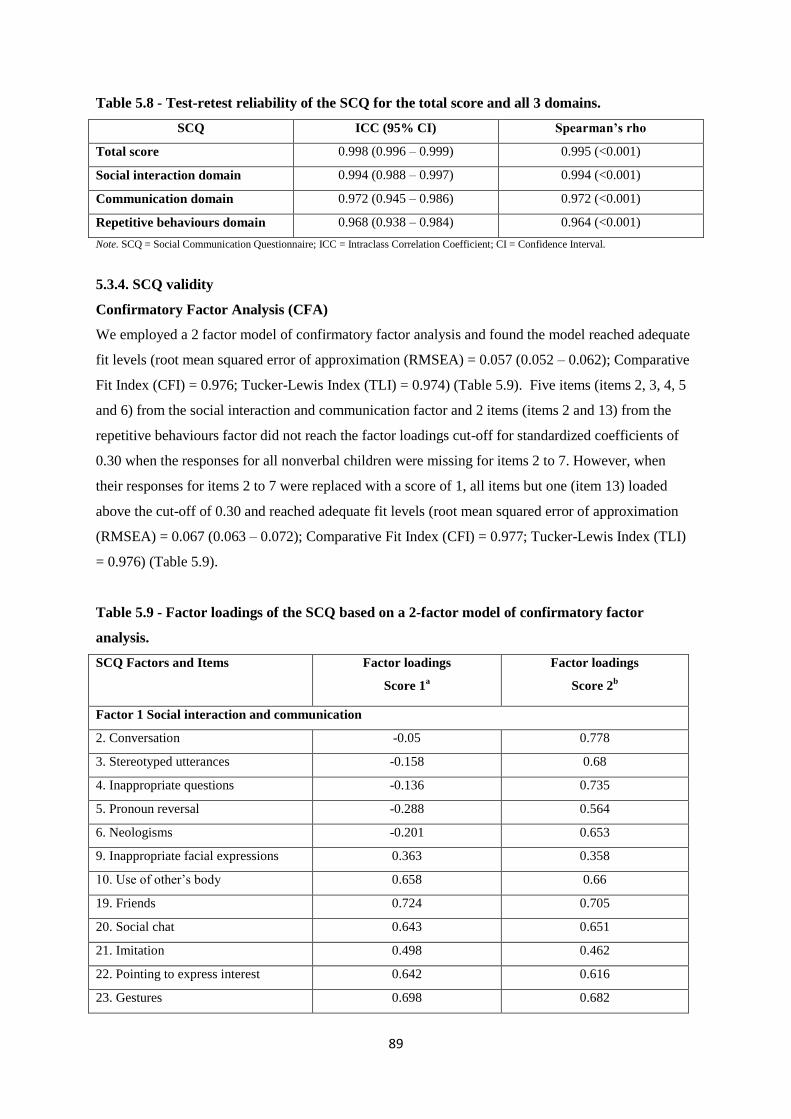
89
Table 5.8 - Test-retest reliability of the SCQ for the total score and all 3 domains.
SCQ ICC (95% CI) Spearman’s rho
Total score 0.998 (0.996 – 0.999) 0.995 (<0.001)
Social interaction domain 0.994 (0.988 – 0.997) 0.994 (<0.001)
Communication domain 0.972 (0.945 – 0.986) 0.972 (<0.001)
Repetitive behaviours domain 0.968 (0.938 – 0.984) 0.964 (<0.001)
Note. SCQ = Social Communication Questionnaire; ICC = Intraclass Correlation Coefficient; CI = Confidence Interval.
5.3.4. SCQ validity
Confirmatory Factor Analysis (CFA)
We employed a 2 factor model of confirmatory factor analysis and found the model reached adequate
fit levels (root mean squared error of approximation (RMSEA) = 0.057 (0.052 – 0.062); Comparative
Fit Index (CFI) = 0.976; Tucker-Lewis Index (TLI) = 0.974) (Table 5.9). Five items (items 2, 3, 4, 5
and 6) from the social interaction and communication factor and 2 items (items 2 and 13) from the
repetitive behaviours factor did not reach the factor loadings cut-off for standardized coefficients of
0.30 when the responses for all nonverbal children were missing for items 2 to 7. However, when
their responses for items 2 to 7 were replaced with a score of 1, all items but one (item 13) loaded
above the cut-off of 0.30 and reached adequate fit levels (root mean squared error of approximation
(RMSEA) = 0.067 (0.063 – 0.072); Comparative Fit Index (CFI) = 0.977; Tucker-Lewis Index (TLI)
= 0.976) (Table 5.9).
Table 5.9 - Factor loadings of the SCQ based on a 2-factor model of confirmatory factor
analysis.
SCQ Factors and Items Factor loadings
Score 1a
Factor loadings
Score 2b
Factor 1 Social interaction and communication
2. Conversation -0.05 0.778
3. Stereotyped utterances -0.158 0.68
4. Inappropriate questions -0.136 0.735
5. Pronoun reversal -0.288 0.564
6. Neologisms -0.201 0.653
9. Inappropriate facial expressions 0.363 0.358
10. Use of other‘s body 0.658 0.66
19. Friends 0.724 0.705
20. Social chat 0.643 0.651
21. Imitation 0.498 0.462
22. Pointing to express interest 0.642 0.616
23. Gestures 0.698 0.682

90
24. Nodding to say yes 0.815 0.774
25. Head shaking to mean no 0.823 0.78
26. Eye gaze 0.671 0.662
27. Social smiling 0.542 0.525
28. Sowing and directing attention 0.764 0.737
29. Offering to share 0.48 0.489
30. Seeking to share enjoyment 0.716 0.699
31. Offering comfort 0.401 0.392
32. Quality of social overtures 0.675 0.66
33. Range official expressions 0.727 0.699
34. Imitative social play 0.733 0.716
35. Imaginative play 0.647 0.64
36. Interest in children 0.762 0.736
37. Response to other children 0.708 0.696
39. Imaginative play with peers 0.636 0.633
40. Group play 0.673 0.677
Factor 2 Repetitive behaviors
7. Verbal rituals -0.165 0.718
8. Compulsions and rituals 0.65 0.655
11. Unusual preoccupations 0.545 0.558
12. Repetitive use of objects 0.533 0.513
13. Circumscribed interests -0.192 -0.172
14. Unusual sensory interests 0.377 0.414
15. Hand and finger mannerisms 0.762 0.732
16. Complex body mannerisms 0.545 0.527
Note. SCQ = Social Communication Questionnaire.
aSCQ scores with responses from nonverbal children missing from items 2 to 7; bSCQ scores with responses from nonverbal children
replaced with a score of 1 from items 2 to 7.
5.3.5. Diagnostic accuracy of the SCQ
Sensitivity & Specificity
I used a pre-determined total score cut-off of > 15 suggested by the authors (Rutter et al., 2003) as
our sample size was not sufficient to explore cut-offs. Previous diagnosis by a clinician and adherence
to DSM-5 criteria was used as clinical confirmation. When comparing ASD and TD groups, and using
the cut-off point of >15 both sensitivity and specificity were 100% (AUC=1) (Table 5.10). Similarly,
sensitivity remained at 100% when comparing ASD and NDD (AUC= 0.85) and for whole group
(AUC= 0.95) but specificity decreased to 70.0% and 89.8% respectively. Figures 5.2, 5.3 and 5.4
illustrate the ROC curve analysis.

91
Table 5.10 - Sensitivity, specificity and ROC analysis (AUC).
Sensitivity Specificity ROC Analysis (AUC)
ASD vs TD 100% 100% 1
ASD vs NDD 100% 70.0% 0.85
GROUP 100% 89.8% 0.95
Note. ASD = Autism Spectrum Disorder; TD = Typically Developing; NDD = Neurodevelopmental Disorders; ROC = Receiver Operating
Curve; AUC = Area under the Curve.
Figure 5.2 - Area under the curve (AUC) for all groups.
Figure 5.3 - Area under the curve (AUC) for ASD vs. TD.
0.0
00
.25
0.5
00.7
51
.00
Se
nsitiv
ity
0.00 0.25 0.50 0.75 1.001 - Specificity
Area under ROC curve = 0.9489
0.0
00
.25
0.5
00
.75
1.0
0S
en
sitiv
ity
0.00 0.25 0.50 0.75 1.001 - Specificity
Area under ROC curve = 1.0000
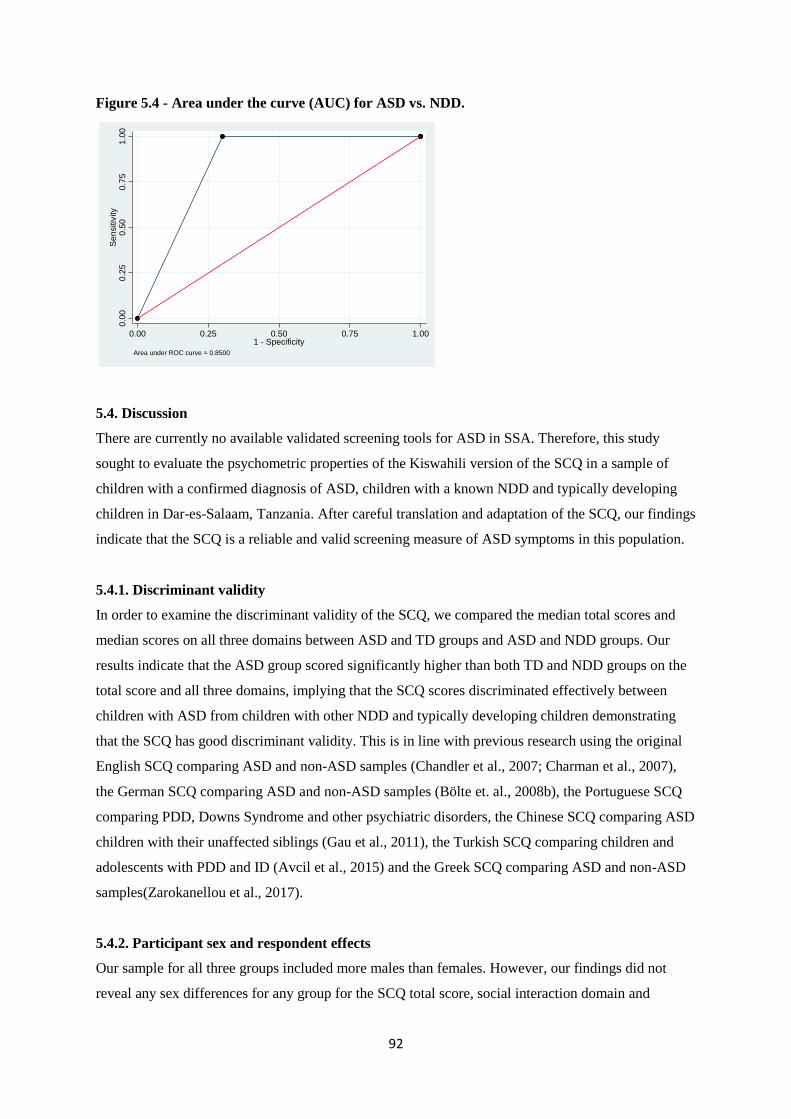
92
Figure 5.4 - Area under the curve (AUC) for ASD vs. NDD.
5.4. Discussion
There are currently no available validated screening tools for ASD in SSA. Therefore, this study
sought to evaluate the psychometric properties of the Kiswahili version of the SCQ in a sample of
children with a confirmed diagnosis of ASD, children with a known NDD and typically developing
children in Dar-es-Salaam, Tanzania. After careful translation and adaptation of the SCQ, our findings
indicate that the SCQ is a reliable and valid screening measure of ASD symptoms in this population.
5.4.1. Discriminant validity
In order to examine the discriminant validity of the SCQ, we compared the median total scores and
median scores on all three domains between ASD and TD groups and ASD and NDD groups. Our
results indicate that the ASD group scored significantly higher than both TD and NDD groups on the
total score and all three domains, implying that the SCQ scores discriminated effectively between
children with ASD from children with other NDD and typically developing children demonstrating
that the SCQ has good discriminant validity. This is in line with previous research using the original
English SCQ comparing ASD and non-ASD samples (Chandler et al., 2007; Charman et al., 2007),
the German SCQ comparing ASD and non-ASD samples (Bölte et. al., 2008b), the Portuguese SCQ
comparing PDD, Downs Syndrome and other psychiatric disorders, the Chinese SCQ comparing ASD
children with their unaffected siblings (Gau et al., 2011), the Turkish SCQ comparing children and
adolescents with PDD and ID (Avcil et al., 2015) and the Greek SCQ comparing ASD and non-ASD
samples(Zarokanellou et al., 2017).
5.4.2. Participant sex and respondent effects
Our sample for all three groups included more males than females. However, our findings did not
reveal any sex differences for any group for the SCQ total score, social interaction domain and
0.0
00
.25
0.5
00
.75
1.0
0S
en
sitiv
ity
0.00 0.25 0.50 0.75 1.001 - Specificity
Area under ROC curve = 0.8500

93
communication domain. Only one significant difference between male participants with NDD and
female participants with NDD for the repetitive behaviors domain was found with males scoring
higher in this domain than females. These findings conflict with those published by Gau et al. (2011),
who found significant higher total scores for ASD males compared to ASD females using the Chinese
version of the SCQ. In addition, many studies have reported sex differences in ASD, in particular that
females have lower frequency of challenging behaviours (McLennan et al., 1993), exhibit less
stereotyped behaviour during play (Lord et al., 1982) and had better language and social skills
(Gillberg & Coleman, 2000). One reason for this discrepancy could be that the phenotype maybe
different in this population. Our sample included more mothers than fathers and caregivers and similar
respondent patterns across the groups (ASD = 84% mothers; TD = 87% mothers; NDD = 85%
mothers). When comparing respondent effects, our results revealed that there were no significant
differences between mother and father respondents and mother and caregiver respondents for all
group comparisons.
5.4.3. Reliability of the SCQ
The reliability coefficient alphas for the whole group for all items (Cronbach‘s α = 0.92) and all three
domains (Cronbach‘s α = 0.65 – 0.91) of the SCQ were acceptable to excellent, highlighting the SCQ
as a valuable screening measure in this population. Our findings reveal higher reliability coefficient
alphas than other cross-cultural validation studies of the SCQ total scores (e.g. Sato et al., 2009; Avcil
et al., 2015) and similar for the domain scores (Gau et al., 2011), although the latter used only ASD
samples and non-effected siblings. The coefficient alphas for the individual groups for all items and
the three domains were much lower, perhaps due to smaller sample sizes. For instance, Bolte et al.
(2008) documented a higher correlation coefficient (Cronbach‘s α = 0.83) for their slightly larger
ASD sample. Our findings revealed excellent test-retest reliability (ICC = 0.972 – 0.998) for the SCQ
total scores and three domains, with the before and after scores significantly correlated (r = 0.964 –
0.995; p < 0.001) suggesting the stability of the SCQ over time. Our finding was better than that
reported from a German version of the SCQ (0.76).
5.4.4. Validity of the SCQ
According to confirmatory factor analysis, our findings support the use of a 2-factor model as
recommended by DSM-5 criteria since all fit indices reached acceptable levels. This is clinically
important in that use of items for impairments in social interaction may predict problems in
communication and vice versa. Previous studies also demonstrate an evident overlap between the
social interaction domain and the communication domains (Avcil et al., 2015; Gau et al., 2011). All
item loadings were above the cut-off for standardized coefficients of 0.3 except one (item 13) when
the responses for items 2 to 7 were replaced with a score of 1. Similar to our study, high standardized

94
coefficients have been reported in another cross cultural study from Taiwan which used a 3 factor
model rather than the 2 model used in our study(Gau et al., 2011).
5.4.5. Sensitivity and specificity of the SCQ
ROC curve analyses suggested excellent predictive ability in our study. At the standard cut-off point
of 15 our results yielded sensitivity of 100% and specificity of 100% (AUC = 1) when discriminating
ASD with TD samples and sensitivity remained at 100% when discriminating ASD with NDD
(AUC= 0.85) and for whole group (AUC= 0.95) but specificity decreased to 70.0% and 89.8%
respectively. Our findings are better than that reported in the initial validation study of the SCQ
(Berument et al., 1999) when discriminating ASD with non-ASD, as well as when discriminating
between ASD and ID, and similar in terms of higher sensitivity estimates than specificity estimates. In
contrast, other studies found still adequate but lower sensitivity estimates and higher specificity
estimates (Bolte et al., 2008; Sato et al., 2009; Zarokanellou et al., 2017). The use of preselected
groups with a known diagnosis may have led to these findings in our study.
5.4.6. Strengths and limitations
The strengths of the present study include the careful translation and adaptation of the SCQ into the
local language Kiswahili. The inclusion of NDD and TD samples and using both verbal and nonverbal
children to evaluate diagnostic validity lends additional support for the utility of the SCQ as a
screening measure in clinical practice. The use of additional tools such as the ADOS and DSM-5
criteria to aid in the confirmation of the diagnosis of the ASD sample and the use of a clinical
consensus process corroborated by independent expert rating are also strengths. One limitation of the
present study is that the age of the TD sample at the time of screening was much younger (< 4 years
of age) than the ASD and NDD samples and younger than would be required for first-level screening
of children using the SCQ. Another limitation in our study is that we had to make an assumption that
all nonverbal children in our sample had a score of 1 for items 2-7 in the SCQ. A larger sample size
would allow for more comprehensive validity analysis with CFA and further explore different cut-off
points. Analysis of inter-informant reliability would have also allowed for further reliability tests for
the SCQ. Additionally, our method of sampling approach meant that parents of children from rural
areas did not participate and their responses may have been different.
5.4.7. Conclusions
We report on the performance of the Kiswahili version of the SCQ in screening for ASD in a sample
of children with a diagnosis of ASD, children with a known NDD and typically developing children.
Our findings reveal good discriminant validity, acceptable internal consistency properties and
excellent test–retest correlation coefficients. Additionally a 2-factor model of social and
communication as well as repetitive behaviours reached an adequate fit. ROC curve analyses

95
suggested excellent discriminant ability in our study as scoring above the recommended cut-off of 15
for ASD was highly indicative that the child had ASD. In sum, the SCQ has suitable psychometric
properties confirming the utility of the SCQ as a first level screening measure for ASD among
Tanzanian children.
96
Chapter 6
Risk factors associated with Autism Spectrum Disorders (ASD) in Dar-es-Salaam,
Tanzania: a case-control study.
6.1. Background
The underlying aetiology of Autism Spectrum Disorders (ASD) remains unknown, particularly in low
and middle-income countries (LAMIC) in sub-Saharan Africa (SSA), where the incidence of risk
factors such as pregnancy complications and adverse perinatal events is high. The heritability of ASD
is estimated to be 70%-90% (Bailey et al., 1995; Hallmayer et al., 2011) indicating that it is a strongly
genetically determined childhood disorder. Research suggests that siblings of individuals with ASD
are at a 20-fold increased risk of developing ASD compared with the general population (Ritvo et al.,
1989; Lauritsen et al., 2005; Constantino et al., 2010; Ozonoff et al., 2011). Despite major advances in
understanding the genetic and developmental aspects of ASD in high-income countries, there are few
or no genetic or heritability studies of ASD in LAMIC.
Furthermore, there is strong evidence of the interplay between genetic and environmental factors
(Hallmayer et al., 2011; Meek et al, 2013; Sandin et al., 2014; Volk et al., 2014) suggesting that both
factors play an important role in the development of ASD. Recent epidemiologic research has
emphasized the prenatal and neonatal period as the most relevant period for environmental risk factors
to be associated with ASD. Gardener et al. (2009) published the first quantitative review and meta-
analysis of the association between maternal pregnancy-related factors and risk for ASD. They
examined over 50 prenatal factors and found advanced parental age, maternal prenatal medication use,
bleeding, gestational diabetes and being first born to be associated with a risk for ASD. In a
subsequent review and meta-analysis on over 60 perinatal and neonatal factors, Gardener et al. (2011)
found abnormal presentation, low birth weight, small for gestational age, congenital malformation,
feeding difficulties and meconium aspiration amongst others to be associated with a risk for ASD.
However, the authors warned of insufficient evidence to implicate any single prenatal, perinatal and
neonatal factor in ASD aetiology (Gardener et al., 2009; Gardener et al., 2011).
More recently, in a retrospective case-cohort study, Hisle-Gorman et al. (2018) explored 29 prenatal,
perinatal and neonatal factors previously associated with ASD, reporting the greatest increased risk
was associated with neonatal seizures, maternal mental health and epilepsy medications. In one of the
few studies examining the prenatal and perinatal factors associated with ASD using a sibling design
and correlating these factors with ASD core symptoms, Chien et al. (2018) report probands with ASD

97
and their unaffected siblings had more prenatal and perinatal events than typically developing
controls, with higher number of prenatal and perinatal factors in probands than in unaffected siblings.
They also found the total number of prenatal and perinatal factors in ASD probands to be associated
with overall symptom severity as well as specific symptoms such as social communication deficits.
However, most of these studies were not conducted in SSA, where these risk factors are also common.
In a recent comprehensive scoping review of ASD in SSA only 3 risk factor studies were identified
(Franz et al., 2017; Abubakar et al., 2016b). In a descriptive case series study in Tanzania, Mankoski
et al. (2006) reported 3 out of 14 children studied developed ASD upon recovery from malaria,
suggesting that severe neurological infections, when contracted in the first few years of life, can cause
ASD. Claassen et al. (2008) conducted a retrospective case study of dizygotic twin siblings in South
Africa, one of whom had ASD. They suggested that maternal stress contributed to the pathogenesis of
ASD as the blood plasma of the ASD proband had elevated glucocorticoids and serotonin in
comparison to the unaffected sibling. van Wijngaarden et al. (2013) conducted a longitudinal
descriptive study in the Republic of Seychelles and found no association between prenatal methyl
mercury exposure and ASD phenotype behaviours as measured by scores on two ASD screening
tools. However, key methodological aspects, in particular systematic diagnosis and
translation/validation of the tools is not available or questionable in these studies (Franz et al., 2017).
One Swedish report found increased prevalence of ASD (three to four times) in children of Somali
origin living in Stockholm compared to a non-Somali group (Barnevick-Olsson et al., 2008).
Furthermore, a study conducted in the UK, found maternal immigration and ethnicity to be associated
with an increased risk of ASD; in particular mothers of African and Caribbean ethnicity having
increased risk of ASD compared to mothers of white ethnicity (Keen et al., 2010). Another study
looking at perinatal factors and migration in Sweden found that maternal birth outside the Nordic
countries was associated with ASD (Haglund & Källén, 2011), indicating that children of women who
were born in SSA or East Asia had the highest risk for ASD. Additionally, many of the risk factors
mentioned earlier are common in SSA, suggesting that ASD may be more common than recognized in
this region.
The current study was designed to investigate the prenatal, perinatal, neonatal and postnatal risk
factors for ASD in Dar-es-Salaam, Tanzania. As such 3 groups of children were recruited for this
study: (i) children with an ASD diagnosis; (ii) children diagnosed with other neurodevelopmental
disorders (NDD) that are not ASD; and (iii) typically developing children (TD). The ASD group was
compared to the TD group in order to identify the general risk factors for ASD. Additionally, the ASD
group was compared to the NDD group to identify factors unique to ASD as neurodevelopmental
disorders are a broad category. The NDD group was also compared to the TD group in order to find

98
the general risk factors for other neurodevelopmental disorders excluding ASD. Lastly, the ASD and
NDD groups were combined and compared to the TD group as both groups are related disorders and
may have common risk factors and combining them also improves the power to identify the common
risk factors.
6.2. Methodology
This case-control study was approved by the Muhimbili University of Health and Allied Sciences
(MUHAS) Directorate of Research and Publications, National Institute for Medical Research (NIMR)
and registered with the Tanzania Commission for Science and Technology (COSTECH). Parents and
guardians gave verbal and written consent.
6.2.1. Study sample
Three groups of children were recruited for the study. Children who had a diagnosis of ASD (n = 108)
were recruited from the Child and Adolescent Clinic, Department of Psychiatry, Muhimbili National
Hospital (MNH), private clinics and centres, and autism units attached to local primary schools in
Dar-es-Salaam, Tanzania. These children were aged from 5 to 12 years and had no known genetic
disorders, deafness or motor impairment. Previous diagnosis was made by either a psychiatrist at
MNH using DSM-IV criteria, or by a paediatrician in a private setting using DSM-IV criteria and the
M-CHAT or an education assessment centre using pre-determined assessment criteria. At least one
biological parent had to be available for the study (where biological parent was unavailable, data was
collected from the main caregiver). Children with other neurodevelopmental disorders (NDD n = 60)
aged 5 to 12 years were recruited from MNH and special needs schools in Dar-es-Salaam, Tanzania.
The NDD group was matched on chronological age and had a previous diagnosis of a
neurodevelopmental disorder which included, Down‘s Syndrome (n = 9), Learning Disability (n =
33), Seizure Disorders (n = 8) and ADHD (n = 10). Typically developing (TD) children (n = 116)
were randomly selected from the community with no known concerns of language and/or behavioral
or emotional problems and did not have any history of learning or psychiatric disabilities according to
our further assessments. They were matched with the ASD group on a surrogate marker of IQ i.e.
level of expressive language (ADOS-2 Module) but not by age.
6.2.2. Procedures
Families were invited to the clinic or the schools for assessment. Each visit lasted approximately 2 to
3 hours. After obtaining consent, parents of participating children were asked to complete the Social
Demographic Questionnaire and the Social Communication Questionnaire (SCQ). Children in the
ASD group and the NDD group were requested to complete the neuropsychological testing
(RAVEN‘s Coloured Progressive Matrices and the Peabody Picture Vocabulary Test). It was
inappropriate for the children in the TD group to do these neuropsychological tests as they were

99
younger than 5 years of age. All children were subsequently asked to proceed for an ADOS-2
assessment. Parents were asked to be present in the assessment room. Each assessment was
videotaped so that later a panel of both local and international experts can categorize these children
and this information will be used as an extra validity check. I was fully involved with the recruitment
of participants and collected all the data for this study with assistance from the fieldworker where
Kiswahili was required. I directly administered the neuropsychological tests, ADOS, SCQ and the
socio-demographic questionnaire. I trained, supervised and oversaw any assistance from the
fieldworker.
6.2.3. Definition of investigated risk factors
A socio-demographic questionnaire was designed to collect data for each participant‘s parental and
socio-demographic information such as age at delivery and first birth, employment, education,
religion and ethnicity. Additionally, it included information on past medical history based on the
possible risk factors of ASD from existing literature and those likely to be specific and common in our
setting such as adverse perinatal events. Care was taken to analyse and include the most relevant and
specific risk factors. The risk factors analysed are defined in Table 6.1.
Table 6.1 - Definition of investigated risk factors.
Risk factors Types of risk factors Categories for analysis
Parental factors Mother‘s age (years) at delivery < 30
30 – 35
≥ 35
Father‘s age (years) at delivery < 30
30 – 35
35 – 40
≥ 40
Mother‘s age at first birth
Mother / Father‘s marital status Single
Married
Separated/ Divorced
Widowed
Mother / Father‘s religion Catholic
Protestant
Islam
Mother / Father‘s ethnicity Northern
Southern
Eastern
Central

100
Other
Mother / Father‘s education level None
Primary
Secondary
Tertiary
Mother / Father‘s occupation Formal employment
Informal employment
None
Parental age gap The difference between the father‘s and
mother‘s age
Birth order Order in which a child was born e.g. first
born, second born or last born
Birth weight As reported by parents
Number of children ever born Children ever born in family whether dead
or alive
Prenatal factors Pregnancy medical complications Gestational hypertension
Gestational diabetes
Eclampsia
Maternal bleeding
Pregnancy infections Prenatal fever
Malaria during pregnancy
Medication use during pregnancy Antibiotics
Gestational term ≤ 37 weeks
Perinatal factors Assisted delivery Vacuum mediated delivery
Labour complications Induced labour
Prolonged labour
Birth complications Breech presentation
Umbilical cord complications
Meconium aspiration
Adverse perinatal events Birth asphyxia
Delayed birth cry
Difficulties breastfeeding
Neonatal factors Low birth weight ≤ 2.5 kg
Neonatal jaundice Parental reports of yellow colouration of
skin and/or eyes at birth of child
Neonatal seizures immediately after birth Parental reports of seizures at birth
Postnatal factors Family history of seizures Parental reports of seizures in the family
(first and second degree relatives)
Seizures disorders Parental reports of seizures

101
Malaria Before age 3
Head injury with loss of consciousness Before age 3
Note. Eight (7%) mothers of children with Autism Spectrum Disorder (ASD), 1 (1%) mother of a typically developing child (TD) and 5
(8%) mothers from the neurodevelopmental disorders (NDD) group were from other African ethnicities, but have lived in Dar-es-Salaam for
more than 15 years. All children enrolled in this study were from a singleton pregnancy, born in hospital and had all their childhood
immunizations.
6.2.4. Statistical analysis
Exploratory analysis on the distribution of continuous variables and univariable analysis were carried
out using IBM SPSS Statistics version 20. After checking for normality of continuous variables,
transformations (log or square-root) were performed where necessary. Parametric tests such as
Student‘s-t-test were used on the transformed continuous scores if transformation resulted in a normal
distribution. Otherwise, non-parametric tests such as the Mann-Whitney U test were used on the raw
scores of continuous variables when the transformed scores did not achieve a Gaussian distribution.
For categorical variables the Pearson‘s chi-square test were performed (or Fisher‘s exact test if
frequency was ≤ 5). Multivariate analysis and likelihood ratio tests (LRT) for the risk factor analysis
were performed using STATA version 13. Since the outcome variables were binary or dichotomous,
logistic regression modelling was applied in computing odds ratios for the univariable and
multivariable risk factors. The multivariable model focused on risk factors with plausible biological
basis for the risk of ASD in such a way that parental marital status, religion, ethnicity, level of
education and occupation were entered into the model as covariates to account for their potential
confounding of other risk factors. All variables reaching a significance p-value of ≤ 0.250 in the
univariable analysis were entered in the multivariable models, retaining all variables if the model
showed acceptable goodness-of-fit statistics (measured using Hosmer-Lemeshow test). LRT was used
to test for evidence of departure from linear trend, such that if linear trend was not violated a single
odds ratio assuming all categories as linear ordinal levels was computed, with odds ratios for
individual categories computed if there was evidence for departure from linear trend.
6.3. Results
We collected data on parental and socio-demographic information for 108 children diagnosed with
ASD, 116 typically developing (TD) children and 60 children with other neurodevelopmental
disorders (NDD) in Dar-es-Salaam, Tanzania. Of these eligible children, males formed 79% of the
ASD group, 57% of the TD group and 65% of the NDD group. Table 6.2 compares the distribution of
characteristics, socio-demographic and family history data between ASD and TD groups, ASD and
NDD groups, NDD and TD groups and lastly combined ASD+NDD and TD groups. Statistically
significant differences between the groups were observed for some socio-demographic and medical
history factors. Odds ratios (OR) and 95% confidence intervals (CI) for all group comparisons were
calculated using logistic regression analyses (Tables 6.3 – 6.10 respectively).

102
Table 6.2 - Distribution of characteristics, socio-demographic and family history data between ASD, TD, NDD and combined ASD+NDD groups
enrolled in this study.
Participant characteristics and
socio-demographic data
ASD
(n = 108)
TD
(n = 116)
NDD
(n = 60)
ASD+NDD
(n = 168)
ASD vs. TD
p-value
ASD vs.
NDD
p-value
NDD vs. TD
p-value
ASD+NDD
vs. TD
p-value
Child’s age in years:
Median (IQR)
7.1
(5.9 – 9.1)
2.8
(2.6 – 3.1)
9.95
(8.2 – 11.0)
8.1
(6.3 - 10.2)
< 0.0001*a
< 0.0001*a
< 0.0001*a
< 0.0001*a
Child’s male sex 85 (79%) 66 (57%) 39 (65%) 124 (74%) 0.001*b
0.053b 0.299
b 0.003
*b
Parental factors
Mother’s age in years:
Mean (SD)
36.5
(4.86)
31.5
(7.21)
39.1
(6.74)
37.5
(5.72)
< 0.0001*c
0.005*c
< 0.0001*c < 0.0001
*c
Mother’s age at delivery in years:
Mean (SD)
28.9
(4.53)
28.6
(7.17)
29.7
(6.82)
29.2
(5.45)
0.473e 0.473
e 0.313
e 0.301
e
< 30 70 (65%) 70 (60%) 27 (45%) 97 (58%) 0.334b 0.035
*b 0.050
*b 0.484
b
30 – 35 26 (24%) 25 (22%) 20 (33%) 46 (27%)
≥ 35 12 (11%) 21 (18%) 13 (12%) 25 (15%)
Mother’s age at first birth in
years:
Median (IQR)
26.0
(23.0 – 28.0)
22.0
(19.0 – 25.0)
23.0
(19.0 – 27.8)
26.0
(22.0 – 29.0)
< 0.0001*f
0.098f 0.019
*f < 0.0001
*f
Mother’s marital status 0.115d 0.001
*d 0.159
d 0.659
d
Single 3 (3%) 10 (9%) 6 (10%) 9 (5%)
Married 98 (90%) 92 (79%) 40 (67%) 138 (82%)
Separated/ Divorced 5 (5%) 10 (9%) 12 (20%) 17 (10%)
Widowed 2 (2%) 4 (3%) 2 (3%) 4 (2%)
Mother’s religion < 0.0001*b
0.004*b
0.086b*
<0.0001b*
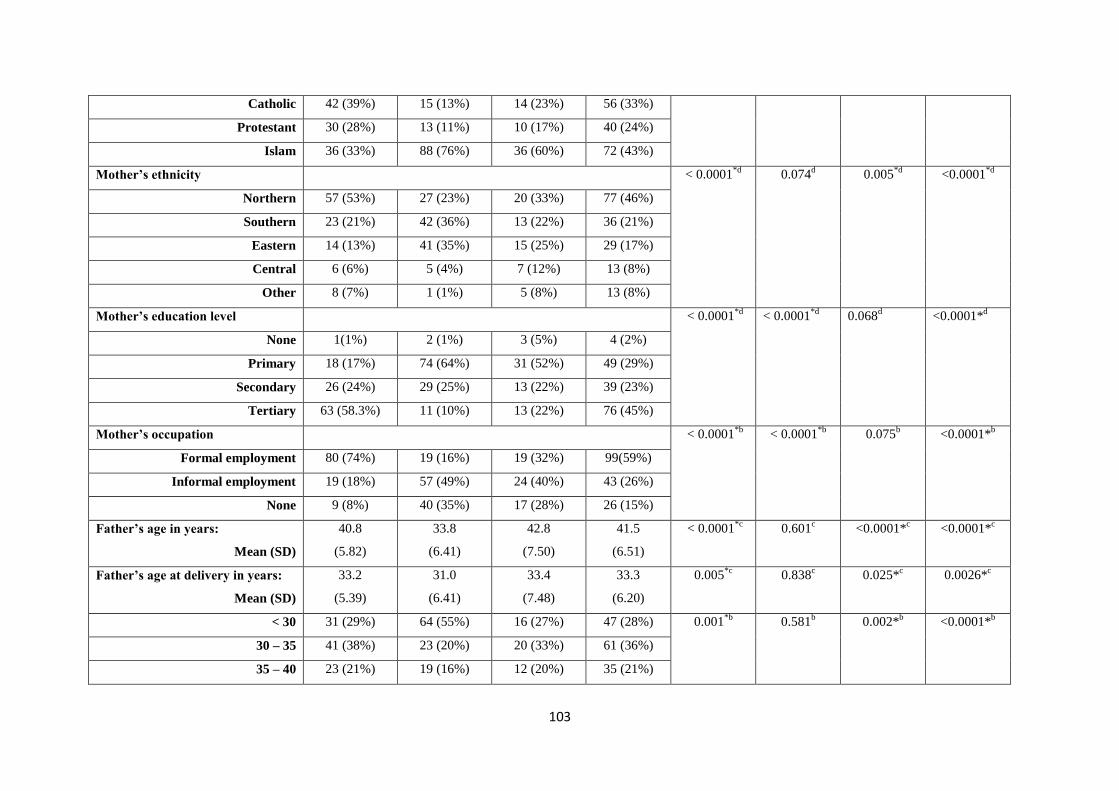
103
Catholic 42 (39%) 15 (13%) 14 (23%) 56 (33%)
Protestant 30 (28%) 13 (11%) 10 (17%) 40 (24%)
Islam 36 (33%) 88 (76%) 36 (60%) 72 (43%)
Mother’s ethnicity < 0.0001*d
0.074d 0.005
*d <0.0001
*d
Northern 57 (53%) 27 (23%) 20 (33%) 77 (46%)
Southern 23 (21%) 42 (36%) 13 (22%) 36 (21%)
Eastern 14 (13%) 41 (35%) 15 (25%) 29 (17%)
Central 6 (6%) 5 (4%) 7 (12%) 13 (8%)
Other 8 (7%) 1 (1%) 5 (8%) 13 (8%)
Mother’s education level < 0.0001*d
< 0.0001*d
0.068d
<0.0001*d
None 1(1%) 2 (1%) 3 (5%) 4 (2%)
Primary 18 (17%) 74 (64%) 31 (52%) 49 (29%)
Secondary 26 (24%) 29 (25%) 13 (22%) 39 (23%)
Tertiary 63 (58.3%) 11 (10%) 13 (22%) 76 (45%)
Mother’s occupation < 0.0001*b
< 0.0001*b
0.075b
<0.0001*b
Formal employment 80 (74%) 19 (16%) 19 (32%) 99(59%)
Informal employment 19 (18%) 57 (49%) 24 (40%) 43 (26%)
None 9 (8%) 40 (35%) 17 (28%) 26 (15%)
Father’s age in years:
Mean (SD)
40.8
(5.82)
33.8
(6.41)
42.8
(7.50)
41.5
(6.51)
< 0.0001*c
0.601c <0.0001*
c <0.0001*
c
Father’s age at delivery in years:
Mean (SD)
33.2
(5.39)
31.0
(6.41)
33.4
(7.48)
33.3
(6.20)
0.005*c
0.838c 0.025*
c 0.0026*
c
< 30 31 (29%) 64 (55%) 16 (27%) 47 (28%) 0.001*b
0.581b 0.002*
b <0.0001*
b
30 – 35 41 (38%) 23 (20%) 20 (33%) 61 (36%)
35 – 40 23 (21%) 19 (16%) 12 (20%) 35 (21%)

104
≥ 40 13 (12%) 10 (9%) 12 (20%) 25 (15%)
Father’s marital status 0.028*d
0.008*d
0.340*d
0.260*d
Single 3 (3%) 8 (7%) 6 (10%) 9 (5%)
Married 100 (93%) 93 (80%) 40 (67%) 140 (83%)
Separated / Divorced 4 (4%) 14 (12%) 12 (20%) 16 (10%)
Widowed 1 (1%) 1 (1%) 2 (3%) 3(2%)
Father’s religion < 0.0001*b
0.002*b
0.182* <0.0001*b
Catholic 40 (37%) 15 (13%) 14 (23%) 54 (32%)
Protestant 33 (31%) 18 (15%) 10 (17%) 43 (26 %)
Islam 35 (32%) 83 (72%) 36 (60%) 71 (42%)
Father’s ethnicity < 0.0001*d
0.013*d
0.669*d
< 0.0001*d
Northern 55 (51%) 26 (22%) 17 (28%) 72 (43%)
Southern 19 (18%) 44 (38%) 20 (33%) 39 (23|%)
Eastern 19 (18%) 36 (31%) 17 (28%) 36 (21%)
Central 6 (5%) 9 (7.8%) 4 (7%) 10 (6%)
Other 9 (8%) 1 (1%) 2 (3%) 11 (7%)
Father’s education level < 0.0001*d
0.001*d
0.252*d
< 0.0001*d
None 1 (1%) 1 (1%) 3 (5%) 4 (2%)
Primary 10 (9%) 62 (53%) 31 (52%) 41 (24%)
Secondary 22 (20%) 34 (29%) 13 (22%) 35 (21%)
Tertiary 75 (70%) 19 (16%) 13 (22%) 88 (52%)
Father’s occupation < 0.0001*d
< 0.0001*d
0.001*b
<0.0001*b
Formal employment 86 (80%) 37(32%) 33 (55%) 119 (71%)
Informal employment 19 (18%) 70 (60%) 18 (30%) 37 (22%)
None 3 (3%) 9 (8%) 9 (15%) 9 (5%)

105
Parental age gap in years:
Median (IQR)
3.55
(0.10 - 9.26)
1.85
(-1.69 - 9.82)
2.95
(-0.45 - 10.4)
3.50
(-0.01 -
9.26)
0.006*a
0.281a 0.261
a 0.012*
a
Mother is older than Father 10 (9%) 16 (14%) 6 (10%) 16 (10%) 0.290b 0.290
b 0.396
b 0.036*
b
Father is older than Mother 97(90%) 90 (78%) 49 (82%) 146 (87%) 0.019*b
0.014*b
0.471b
0.263b
Birth order: Median (IQR) 1 (1-2) 2 (1-2) 2 (1-3) 2 (1-2) 0.466a
0.042*a
0.141a
0.853a
Birth weight (kg): Median (IQR) 3.2
(3 – 3.6)
3.0
(2.8 - 3.5)
3.0
(2.9 - 3.5)
3.2
(3.0 - 3.6)
0.056a
0.188a 0.875
a 0.150
a
No. of children ever born:
Median (IQR)
2.0 (2 - 3) 2.0 (1- 2) 3.0 (2 - 4) 2 (2-3) < 0.0001*a
0.027*a
<0.0001a
<0.0001a
Prenatal factors
Pregnancy medical complications
(gestational hypertension,
gestational diabetes, eclampsia and
maternal bleeding)
10 (9%) 4 (4%) 3 (5%) 13 (8%) 0.098d 0.383
d 0.691
d 0.202
d
Pregnancy infections (prenatal
fever and malaria during
pregnancy)
21 (19%) 4 (4%) 2 (3%) 23 (14%) < 0.0001*d
0.004*d
1.00d
0.004*d
Medication use during pregnancy 30 (28%) 20 (17%) 18 (30%) 48 (29%) 0.058b 0.760
b 0.051*
b 0.028*
b
Gestational term ≤ 37 weeks 8 (7%) 0 (0%)
2 (3%) 10 (6%) 0.003*d
0.498d 0.268
b 0.025*
b
Perinatal factors
Assisted delivery (vacuum
mediated delivery)
5 (5%) 2 (2%) 1 (2%) 6 (4%) 0.266d 0.423
d 0.978
d 0.335
d
Labour complications (induced
labour and prolonged labour)
18 (17%) 2 (2%) 2 (3%) 20 (12%) < 0.0001*d
0.012*d
0.606d
0.001*d

106
Birth complications (breech
presentation, umbilical cord
complications and meconium
aspiration)
18 (17%) 2 (2%)
5 (8%) 23 (14%) < 0.0001*d
0.162d 0.046*
d <0.0001*
d
Adverse perinatal events (birth
asphyxia, delayed birth cry and
difficulties breastfeeding)
35 (32%) 2 (2%) 24 (40%) 59 (35%) < 0.0001*d
0.399b <0.0001*
d <0.0001*
d
Neonatal factors
Low birth weight (≤ 2.5 kg) 12 (11%) 17 (15%) 11 (18%) 23 (14%) 0.430b 0.192
b 0.527
b 0.818
b
Neonatal jaundice 9 (8%) 0 (0%)
6 (10%) 15 (9%) < 0.0001*d 0.717
b 0.007*
d 0.003*
d
Neonatal seizures immediately
after birth
6 (6%) 0 (0%)
7 (12%) 13 (8%) 0.012*d
0.155b 0.002*
d 0.010*
d
Postnatal factors
Family history of seizures 11 (10%) 9 (8%) 7 (12%) 18 (11%) 0.525b 0.766
b 0.393
b 0.404
b
Seizures disorders 22 (20%) 0 (0%)
8 (13%) 30 (18%) < 0.0001*d 0.254
b 0.001*
d <0.0001*
d
Malaria (before age 3) 33 (31%) 5 (4%) 3 (5%) 36 (21%) < 0.0001*d < 0.0001
*d 1.00
d <0.0001*
d
Head injury with loss of
consciousness (before age 3)
9 (8%) 0 (0%) 11 (18%) 20 (12%) 0.001*d 0.055
b <0.0001*
d <0.0001*
d
Note. ASD = Autism Spectrum Disorder; TD = Typically Developing; NDD = Neurodevelopmental Disorders; IQR = Interquartile Range; SD = Standard Deviation. Non parametric continuous data is reported as
median and parametric data is reported as means. No parent in our study was from the Western Region of Tanzania.
aMann Whitney U test; bPearson‘s chi-squared test (dichotomous and categorical variables); ct-test on raw data (continuous variable); dFisher‘s exact test (if less than 5); et-test on square root transformed; ft-test on log
transformed.
*p < 0.05
107
6.3.1. ASD vs. TD groups
General description
The median age was significantly different between ASD and TD groups (7.1 vs. 2.8; p < 0.0001),
because the TD was matched on expressive language level. Frequency of males was significantly
higher in the ASD group than in the TD group (79% vs. 57%; p = 0.001) (Table 6.2).
Mother‘s age at assessment (p < 0.0001) and mother‘s age at first birth (p < 0.0001) were significantly
higher for mothers of children with ASD compared to mothers of TD children. However, mothers of
children with ASD were similar to the TD group mothers in terms of age at delivery. Mothers of
children with ASD were also more likely to have higher education levels (58% vs. 10%; p < 0.0001)
and working in formal employment (74% vs. 16%; p < 0001) compared to mothers of the TD group.
Statistically significant differences were also noted for mother‘s religion and ethnicity between the
two groups (p < 0.0001) (Table 6.1).
Father‘s age at assessment (p < 0.0001) and delivery (p < 0.0001) were significantly higher for fathers
of children with ASD compared to fathers of the TD group. Similarly, fathers of children with ASD
were more likely to be married (93% vs. 80%; p = 0.028), have higher levels of education (70% vs.
16%; p < 0.0001) and working in formal employment (80% vs. 32%; p < 0.0001) compared to TD
fathers. There was a significant difference between the parental age gap in the ASD and TD groups (p
< 0.006), and with 90% of fathers older than mothers in the ASD group compared to 78% of fathers in
the TD group (p = 0.019).
Within the prenatal factors, mothers of children with ASD were significantly more likely to have
infections during pregnancy (19% vs. 4%; p < 0.0001) and pre-term births (7% vs. 0%; p = 0.003)
compared to mothers of the TD group. Labour complications (17% vs. 2%; p < 0.0001), birth
complications (17% vs. 2%; p < 0.0001) and adverse perinatal events (32% vs. 2%; p < 0.0001) were
significantly more common in the ASD group compared to the TD group. The ASD group were also
more likely to have neonatal jaundice (8% vs. 0%; p < 0.0001) and neonatal seizures immediately
after birth (6% vs. 0%; p = 0.012) compared to the TD group. Significant differences between the
ASD and TD groups in postnatal factors included seizures disorders (20% vs. 0%; p < 0.0001),
malaria before the age of 3 years (31% vs. 4%; p < 0.0001) and head injury with loss of consciousness
before the age of 3 years (8% vs. 0%; p = 0.001).
Risk factors for ASD, compared to the TD group
Univariable analysis of ASD vs. TD groups
The factors listed in Table 6.3 were evaluated as possible risk factors for ASD. Of all the factors
investigated for univariable analysis, 34 factors reached the significant cut-off of 0.05. Of these
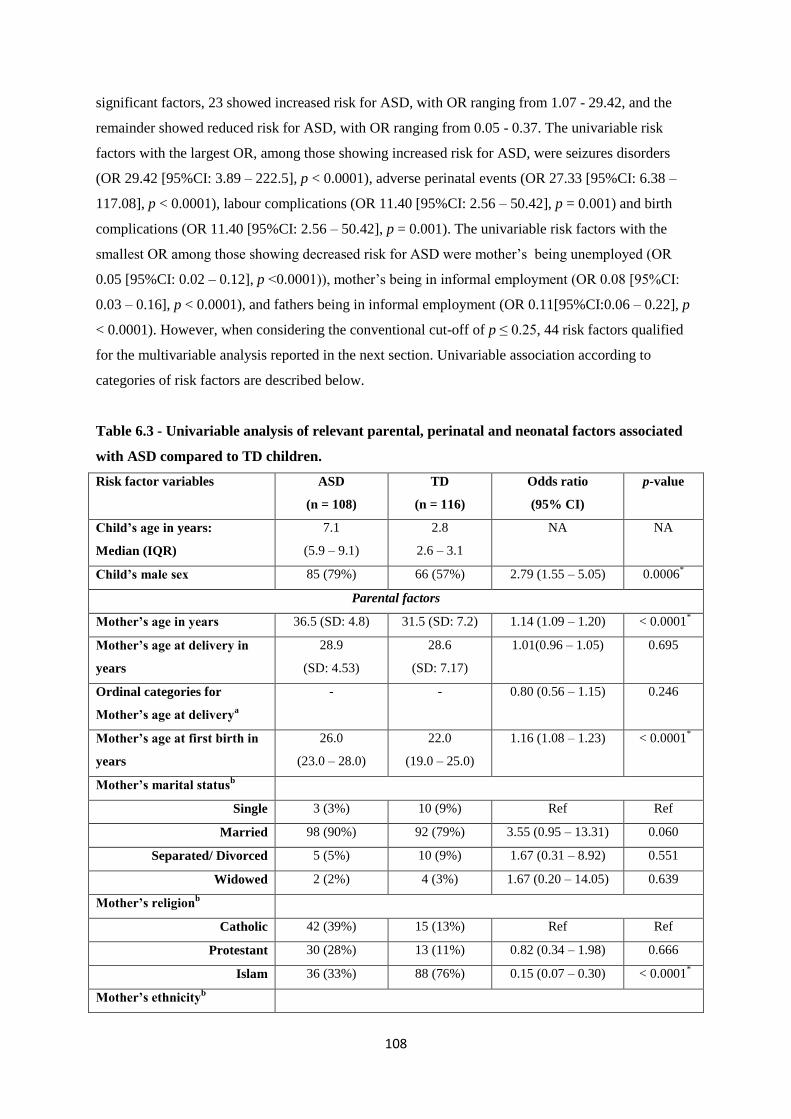
108
significant factors, 23 showed increased risk for ASD, with OR ranging from 1.07 - 29.42, and the
remainder showed reduced risk for ASD, with OR ranging from 0.05 - 0.37. The univariable risk
factors with the largest OR, among those showing increased risk for ASD, were seizures disorders
(OR 29.42 [95%CI: 3.89 – 222.5], p < 0.0001), adverse perinatal events (OR 27.33 [95%CI: 6.38 –
117.08], p < 0.0001), labour complications (OR 11.40 [95%CI: 2.56 – 50.42], p = 0.001) and birth
complications (OR 11.40 [95%CI: 2.56 – 50.42], p = 0.001). The univariable risk factors with the
smallest OR among those showing decreased risk for ASD were mother‘s being unemployed (OR
0.05 [95%CI: 0.02 – 0.12], p <0.0001)), mother‘s being in informal employment (OR 0.08 [95%CI:
0.03 – 0.16], p < 0.0001), and fathers being in informal employment (OR 0.11[95%CI:0.06 – 0.22], p
< 0.0001). However, when considering the conventional cut-off of p ≤ 0.25, 44 risk factors qualified
for the multivariable analysis reported in the next section. Univariable association according to
categories of risk factors are described below.
Table 6.3 - Univariable analysis of relevant parental, perinatal and neonatal factors associated
with ASD compared to TD children.
Risk factor variables ASD
(n = 108)
TD
(n = 116)
Odds ratio
(95% CI)
p-value
Child’s age in years:
Median (IQR)
7.1
(5.9 – 9.1)
2.8
2.6 – 3.1
NA NA
Child’s male sex 85 (79%) 66 (57%) 2.79 (1.55 – 5.05) 0.0006*
Parental factors
Mother’s age in years 36.5 (SD: 4.8) 31.5 (SD: 7.2) 1.14 (1.09 – 1.20) < 0.0001*
Mother’s age at delivery in
years
28.9
(SD: 4.53)
28.6
(SD: 7.17)
1.01(0.96 – 1.05) 0.695
Ordinal categories for
Mother’s age at deliverya
- - 0.80 (0.56 – 1.15) 0.246
Mother’s age at first birth in
years
26.0
(23.0 – 28.0)
22.0
(19.0 – 25.0)
1.16 (1.08 – 1.23) < 0.0001*
Mother’s marital statusb
Single 3 (3%) 10 (9%) Ref Ref
Married 98 (90%) 92 (79%) 3.55 (0.95 – 13.31) 0.060
Separated/ Divorced 5 (5%) 10 (9%) 1.67 (0.31 – 8.92) 0.551
Widowed 2 (2%) 4 (3%) 1.67 (0.20 – 14.05) 0.639
Mother’s religionb
Catholic 42 (39%) 15 (13%) Ref Ref
Protestant 30 (28%) 13 (11%) 0.82 (0.34 – 1.98) 0.666
Islam 36 (33%) 88 (76%) 0.15 (0.07 – 0.30) < 0.0001*
Mother’s ethnicityb

109
Northern 57 (53%) 27 (23%) Ref Ref
Southern 23 (21%) 42 (36%) 0.26 (0.13 – 0.51) < 0.0001*
Eastern 14 (13%) 41 (35%) 0.16 (0.08 – 0.35) < 0.0001*
Central 6 (6%) 5 (4%) 0.57 (0.16 – 2.03) 0.384
Other 8 (7%) 1 (1%) 3.79 (0.45 – 31.85) 0.220
Mother’s education levela
Ordinal categories 4 (IQR: 3-4) 2 (IQR: 2-3) 4.46 (3.01 – 6.58) < 0.0001*
Mother’s occupationb
Formal employment 80 (74%) 19 (16%) Ref Ref
Informal employment 19 (18%) 57 (49%) 0.08 (0.03- 0.16) < 0.0001*
None 9 (8%) 40 (35%) 0.05 (0.02 – 0.12) < 0.0001*
Father’s age in years 40.8 (SD: 5.82) 33.8(SD: 6.41) 1.21 (1.41 – 1.27) < 0.0001*
Father’s age at delivery in
years
33.2 (SD: 5.39) 31.0 (SD: 6.41) 1.07 (1.02 – 1.12) 0.006*
Categories for Father’s age at
delivery (years)b
< 30 31 (29%) 64 (55%) Ref 0.005*
30 – 35 41 (38%) 23 (20%) 3.68 (1.88 – 7.16) 0.001*
35 – 40 23 (21%) 19 (16%) 2.49 (1.18 – 5.25) 0.016*
≥ 40 13 (12%) 10 (9%) 2.68 (1.05 – 6.79) 0.037*
Father’s marital statusb
Single 3 (3%) 8 (7%) Ref Ref
Married 100 (93%) 93 (80%) 2.86(0.73 – 11.13) 0.128
Separated / Divorced 4 (4%) 14 (12%) 0.76 (0.13 – 4.30) 0.758
Widowed 1 (1%) 1 (1%) 2.67 (0.12 – 57.62) 0.532
Father’s religiona
Ordinal categories - - 0.37 (0.26 – 0.53) < 0.0001*
Father’s ethnicityb
Northern 55 (51%) 26 (22%) Ref Ref
Southern 19 (18%) 44 (38%) 0.20 (0.10 – 0.42) < 0.0001*
Eastern 19 (18%) 36 (31%) 0.25 (0.12 – 0.52) < 0.0001*
Central 6 (6%) 9 (8%) 0.32 (0.10 (0.97) 0.046*
Other 9 (8%) 1 (1%) 0.43 (0.51 – 35.37) 0.180
Father’s education levela
Ordinal categories - - 4.63 (3.10 – 6.92) < 0.0001*
Father’s occupationb
Formal employment 86 (80%) 37(32%) Ref Ref
Informal employment 19 (18%) 70 (60%) 0.11 (0.06 – 0.22) < 0.0001*
None 3 (3%) 9 (8%) 0.14 (0.03 – 0.56) 0.005*
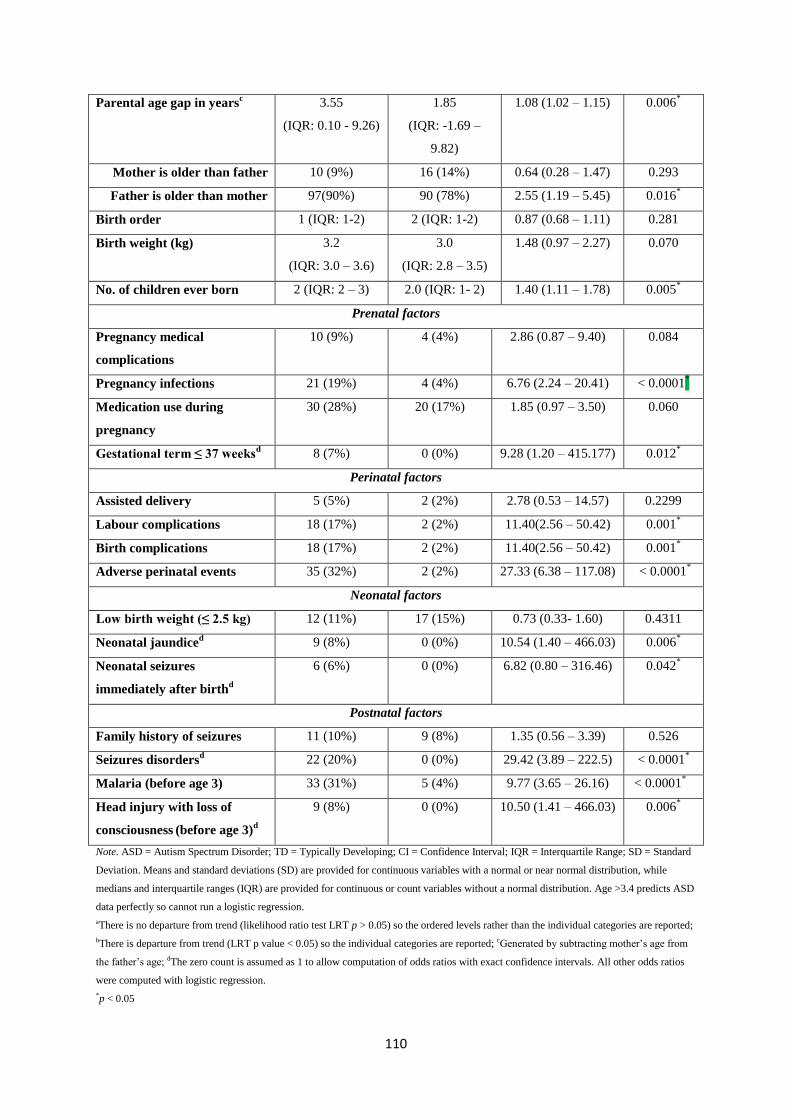
110
Parental age gap in yearsc 3.55
(IQR: 0.10 - 9.26)
1.85
(IQR: -1.69 –
9.82)
1.08 (1.02 – 1.15) 0.006*
Mother is older than father 10 (9%) 16 (14%) 0.64 (0.28 – 1.47) 0.293
Father is older than mother 97(90%) 90 (78%) 2.55 (1.19 – 5.45) 0.016*
Birth order 1 (IQR: 1-2) 2 (IQR: 1-2) 0.87 (0.68 – 1.11) 0.281
Birth weight (kg) 3.2
(IQR: 3.0 – 3.6)
3.0
(IQR: 2.8 – 3.5)
1.48 (0.97 – 2.27) 0.070
No. of children ever born 2 (IQR: 2 – 3) 2.0 (IQR: 1- 2) 1.40 (1.11 – 1.78) 0.005*
Prenatal factors
Pregnancy medical
complications
10 (9%) 4 (4%) 2.86 (0.87 – 9.40) 0.084
Pregnancy infections 21 (19%) 4 (4%) 6.76 (2.24 – 20.41) < 0.0001*
Medication use during
pregnancy
30 (28%) 20 (17%) 1.85 (0.97 – 3.50) 0.060
Gestational term ≤ 37 weeksd 8 (7%) 0 (0%)
9.28 (1.20 – 415.177) 0.012
*
Perinatal factors
Assisted delivery 5 (5%) 2 (2%) 2.78 (0.53 – 14.57) 0.2299
Labour complications 18 (17%) 2 (2%) 11.40(2.56 – 50.42) 0.001*
Birth complications 18 (17%) 2 (2%)
11.40(2.56 – 50.42) 0.001*
Adverse perinatal events 35 (32%) 2 (2%) 27.33 (6.38 – 117.08) < 0.0001*
Neonatal factors
Low birth weight (≤ 2.5 kg) 12 (11%) 17 (15%) 0.73 (0.33- 1.60) 0.4311
Neonatal jaundiced 9 (8%) 0 (0%)
10.54 (1.40 – 466.03) 0.006
*
Neonatal seizures
immediately after birthd
6 (6%) 0 (0%)
6.82 (0.80 – 316.46) 0.042*
Postnatal factors
Family history of seizures 11 (10%) 9 (8%) 1.35 (0.56 – 3.39) 0.526
Seizures disordersd 22 (20%) 0 (0%)
29.42 (3.89 – 222.5) < 0.0001
*
Malaria (before age 3) 33 (31%) 5 (4%) 9.77 (3.65 – 26.16) < 0.0001*
Head injury with loss of
consciousness (before age 3)
d
9 (8%) 0 (0%) 10.50 (1.41 – 466.03) 0.006*
Note. ASD = Autism Spectrum Disorder; TD = Typically Developing; CI = Confidence Interval; IQR = Interquartile Range; SD = Standard
Deviation. Means and standard deviations (SD) are provided for continuous variables with a normal or near normal distribution, while
medians and interquartile ranges (IQR) are provided for continuous or count variables without a normal distribution. Age >3.4 predicts ASD
data perfectly so cannot run a logistic regression.
aThere is no departure from trend (likelihood ratio test LRT p > 0.05) so the ordered levels rather than the individual categories are reported;
bThere is departure from trend (LRT p value < 0.05) so the individual categories are reported; cGenerated by subtracting mother‘s age from
the father‘s age; dThe zero count is assumed as 1 to allow computation of odds ratios with exact confidence intervals. All other odds ratios
were computed with logistic regression.
*p < 0.05
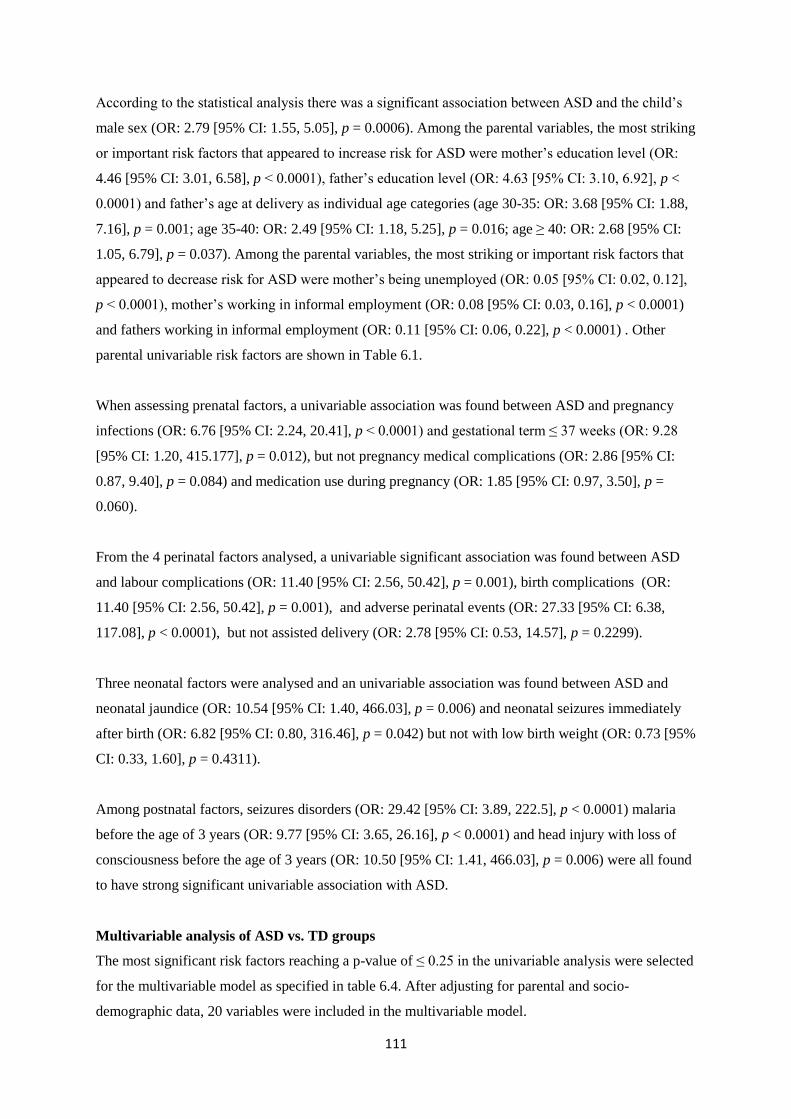
111
According to the statistical analysis there was a significant association between ASD and the child‘s
male sex (OR: 2.79 [95% CI: 1.55, 5.05], p = 0.0006). Among the parental variables, the most striking
or important risk factors that appeared to increase risk for ASD were mother‘s education level (OR:
4.46 [95% CI: 3.01, 6.58], p < 0.0001), father‘s education level (OR: 4.63 [95% CI: 3.10, 6.92], p <
0.0001) and father‘s age at delivery as individual age categories (age 30-35: OR: 3.68 [95% CI: 1.88,
7.16], p = 0.001; age 35-40: OR: 2.49 [95% CI: 1.18, 5.25], p = 0.016; age ≥ 40: OR: 2.68 [95% CI:
1.05, 6.79], p = 0.037). Among the parental variables, the most striking or important risk factors that
appeared to decrease risk for ASD were mother‘s being unemployed (OR: 0.05 [95% CI: 0.02, 0.12],
p < 0.0001), mother‘s working in informal employment (OR: 0.08 [95% CI: 0.03, 0.16], p < 0.0001)
and fathers working in informal employment (OR: 0.11 [95% CI: 0.06, 0.22], p < 0.0001) . Other
parental univariable risk factors are shown in Table 6.1.
When assessing prenatal factors, a univariable association was found between ASD and pregnancy
infections (OR: 6.76 [95% CI: 2.24, 20.41], p < 0.0001) and gestational term ≤ 37 weeks (OR: 9.28
[95% CI: 1.20, 415.177], p = 0.012), but not pregnancy medical complications (OR: 2.86 [95% CI:
0.87, 9.40], p = 0.084) and medication use during pregnancy (OR: 1.85 [95% CI: 0.97, 3.50], p =
0.060).
From the 4 perinatal factors analysed, a univariable significant association was found between ASD
and labour complications (OR: 11.40 [95% CI: 2.56, 50.42], p = 0.001), birth complications (OR:
11.40 [95% CI: 2.56, 50.42], p = 0.001), and adverse perinatal events (OR: 27.33 [95% CI: 6.38,
117.08], p < 0.0001), but not assisted delivery (OR: 2.78 [95% CI: 0.53, 14.57], p = 0.2299).
Three neonatal factors were analysed and an univariable association was found between ASD and
neonatal jaundice (OR: 10.54 [95% CI: 1.40, 466.03], p = 0.006) and neonatal seizures immediately
after birth (OR: 6.82 [95% CI: 0.80, 316.46], p = 0.042) but not with low birth weight (OR: 0.73 [95%
CI: 0.33, 1.60], p = 0.4311).
Among postnatal factors, seizures disorders (OR: 29.42 [95% CI: 3.89, 222.5], p < 0.0001) malaria
before the age of 3 years (OR: 9.77 [95% CI: 3.65, 26.16], p < 0.0001) and head injury with loss of
consciousness before the age of 3 years (OR: 10.50 [95% CI: 1.41, 466.03], p = 0.006) were all found
to have strong significant univariable association with ASD.
Multivariable analysis of ASD vs. TD groups
The most significant risk factors reaching a p-value of ≤ 0.25 in the univariable analysis were selected
for the multivariable model as specified in table 6.4. After adjusting for parental and socio-
demographic data, 20 variables were included in the multivariable model.
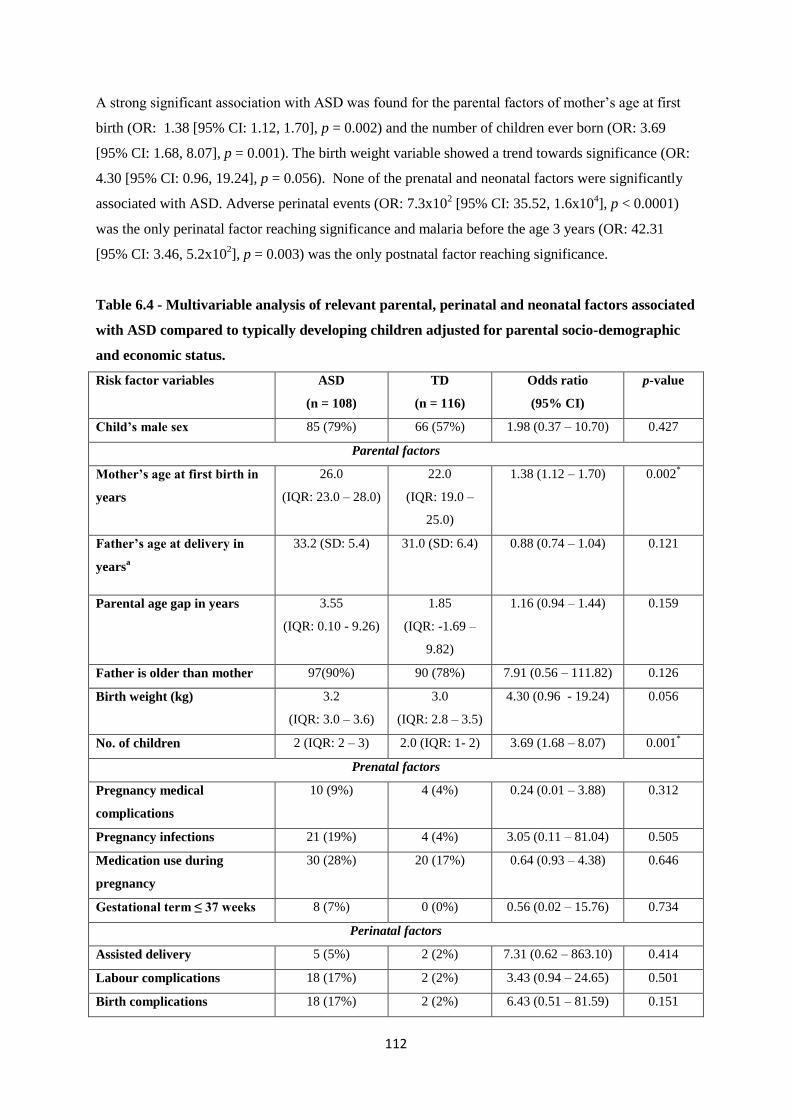
112
A strong significant association with ASD was found for the parental factors of mother‘s age at first
birth (OR: 1.38 [95% CI: 1.12, 1.70], p = 0.002) and the number of children ever born (OR: 3.69
[95% CI: 1.68, 8.07], p = 0.001). The birth weight variable showed a trend towards significance (OR:
4.30 [95% CI: 0.96, 19.24], p = 0.056). None of the prenatal and neonatal factors were significantly
associated with ASD. Adverse perinatal events (OR: 7.3x10² [95% CI: 35.52, 1.6x10
4], p < 0.0001)
was the only perinatal factor reaching significance and malaria before the age 3 years (OR: 42.31
[95% CI: 3.46, 5.2x10²], p = 0.003) was the only postnatal factor reaching significance.
Table 6.4 - Multivariable analysis of relevant parental, perinatal and neonatal factors associated
with ASD compared to typically developing children adjusted for parental socio-demographic
and economic status.
Risk factor variables ASD
(n = 108)
TD
(n = 116)
Odds ratio
(95% CI)
p-value
Child’s male sex 85 (79%) 66 (57%) 1.98 (0.37 – 10.70) 0.427
Parental factors
Mother’s age at first birth in
years
26.0
(IQR: 23.0 – 28.0)
22.0
(IQR: 19.0 –
25.0)
1.38 (1.12 – 1.70) 0.002*
Father’s age at delivery in
yearsa
33.2 (SD: 5.4) 31.0 (SD: 6.4) 0.88 (0.74 – 1.04) 0.121
Parental age gap in years 3.55
(IQR: 0.10 - 9.26)
1.85
(IQR: -1.69 –
9.82)
1.16 (0.94 – 1.44) 0.159
Father is older than mother 97(90%) 90 (78%) 7.91 (0.56 – 111.82) 0.126
Birth weight (kg) 3.2
(IQR: 3.0 – 3.6)
3.0
(IQR: 2.8 – 3.5)
4.30 (0.96 - 19.24) 0.056
No. of children 2 (IQR: 2 – 3) 2.0 (IQR: 1- 2) 3.69 (1.68 – 8.07) 0.001*
Prenatal factors
Pregnancy medical
complications
10 (9%) 4 (4%) 0.24 (0.01 – 3.88) 0.312
Pregnancy infections 21 (19%) 4 (4%) 3.05 (0.11 – 81.04) 0.505
Medication use during
pregnancy
30 (28%) 20 (17%) 0.64 (0.93 – 4.38) 0.646
Gestational term ≤ 37 weeks 8 (7%) 0 (0%)
0.56 (0.02 – 15.76) 0.734
Perinatal factors
Assisted delivery 5 (5%) 2 (2%) 7.31 (0.62 – 863.10) 0.414
Labour complications 18 (17%) 2 (2%) 3.43 (0.94 – 24.65) 0.501
Birth complications 18 (17%) 2 (2%)
6.43 (0.51 – 81.59) 0.151

113
Adverse perinatal events 35 (32%) 2 (2%) 7.3x10² (35.52 -
1.6x10⁴)
< 0.0001*
Neonatal factors
Neonatal jaundice 9 (8%) 0 (0%)
28.08 (0.48 –
1.6x10³)
0.109
Neonatal seizures
immediately after birth
6 (6%) 0 (0%)
4.4x10⁻³
(0.05x10⁻⁸
–
6.5x10²)
0.960
Postnatal factors
Seizures disorders 22 (20%) 0 (0%)
4.3x10³ (0.02 –
7.49x10⁸)
0.174
Malaria (before age 3) 33 (31%) 5 (4%) 42.31 (3.46 –
5.2x10²)
0.003*
Head injury with loss of
consciousness (before age 3)
9 (8%) 0 (0%) 0.11 (3.3x10⁻³
–
35.80)
0.222
Note. ASD = Autism Spectrum Disorder; TD = Typically Developing; CI = Confidence Interval; SD = Standard Deviation; IQR =
Interquartile Range. In the multivariable analysis only variables that reached a p value cut-off of ≤ 0.25in the Univariable analysis and were
not in multicollineality with each other were included.
aFollows the linear trend assumptions explained in the Univariable analysis table.
*p < 0.05
6.3.2. ASD vs. NDD groups
General description
The median age was different between ASD and NDD groups (7.1 vs. 9.95; p < 0.0001). Frequency of
males was higher in the ASD group than in the NDD group (79% vs. 65%) but did not reach
significance (Table 6.2).
Mother‘s age at assessment (p = 0.005) and mother‘s age at delivery as a categorical variable (p =
0.035) were significantly higher for mothers of children with ASD compared to mothers of the NDD
group, however, mothers of children with ASD were similar to the NDD group mothers in terms of
age at first birth. Mothers of children with ASD were also more likely to be married (90% vs.67%; p =
0.001), have higher education levels (58% vs. 22%; p < 0.0001) and working in formal employment
(74% vs. 32%; p < 0001) compared to mothers of the NDD group.
When comparing ASD and NDD groups‘ father‘s age at assessment and delivery, no significant
differences were noted. However, fathers of children with ASD were more likely to be married (93%
vs. 67%; p = 0.008), have higher levels of education (70% vs. 22%; p = 0.001) and working in formal
employment (80% vs. 55%; p < 0.0001) than fathers of the NDD group. There was no significant
difference between the parental age gap of the two groups, however, with the variable father older
than mother, significant difference was found (90% vs. 82%; p = 0.014). Parents of children with
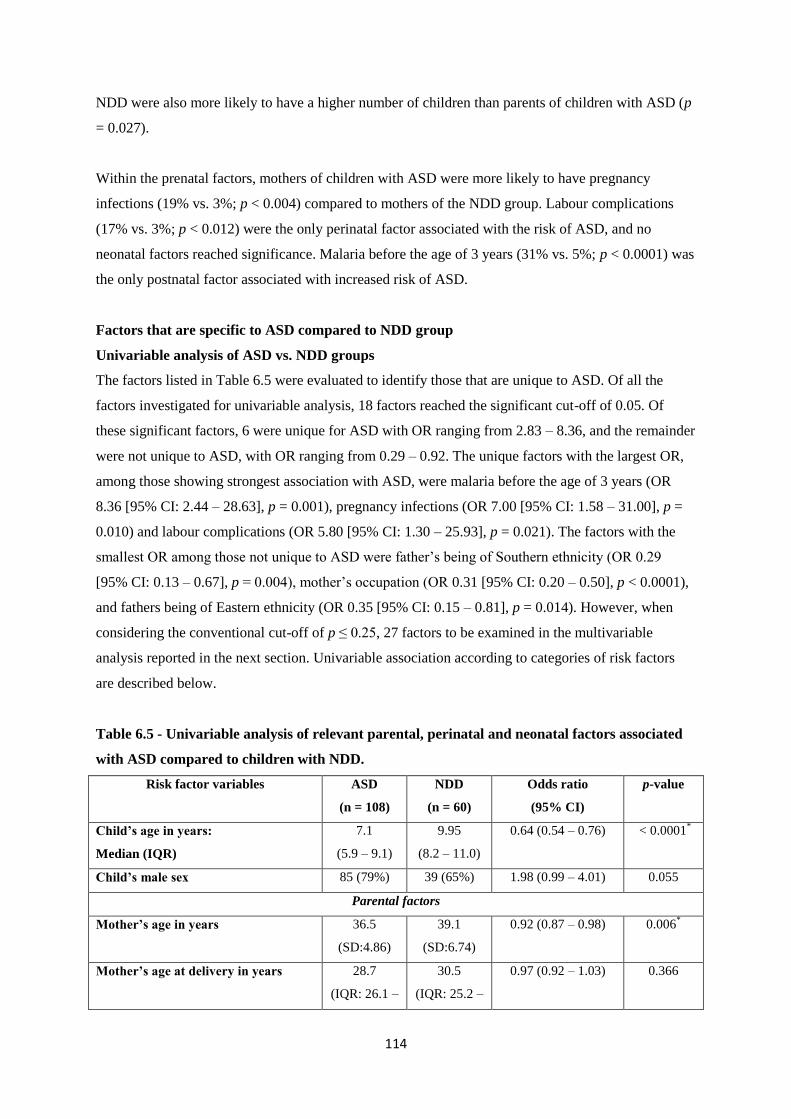
114
NDD were also more likely to have a higher number of children than parents of children with ASD (p
= 0.027).
Within the prenatal factors, mothers of children with ASD were more likely to have pregnancy
infections (19% vs. 3%; p < 0.004) compared to mothers of the NDD group. Labour complications
(17% vs. 3%; p < 0.012) were the only perinatal factor associated with the risk of ASD, and no
neonatal factors reached significance. Malaria before the age of 3 years (31% vs. 5%; p < 0.0001) was
the only postnatal factor associated with increased risk of ASD.
Factors that are specific to ASD compared to NDD group
Univariable analysis of ASD vs. NDD groups
The factors listed in Table 6.5 were evaluated to identify those that are unique to ASD. Of all the
factors investigated for univariable analysis, 18 factors reached the significant cut-off of 0.05. Of
these significant factors, 6 were unique for ASD with OR ranging from 2.83 – 8.36, and the remainder
were not unique to ASD, with OR ranging from 0.29 – 0.92. The unique factors with the largest OR,
among those showing strongest association with ASD, were malaria before the age of 3 years (OR
8.36 [95% CI: 2.44 – 28.63], p = 0.001), pregnancy infections (OR 7.00 [95% CI: 1.58 – 31.00], p =
0.010) and labour complications (OR 5.80 [95% CI: 1.30 – 25.93], p = 0.021). The factors with the
smallest OR among those not unique to ASD were father‘s being of Southern ethnicity (OR 0.29
[95% CI: 0.13 – 0.67], p = 0.004), mother‘s occupation (OR 0.31 [95% CI: 0.20 – 0.50], p < 0.0001),
and fathers being of Eastern ethnicity (OR 0.35 [95% CI: 0.15 – 0.81], p = 0.014). However, when
considering the conventional cut-off of p ≤ 0.25, 27 factors to be examined in the multivariable
analysis reported in the next section. Univariable association according to categories of risk factors
are described below.
Table 6.5 - Univariable analysis of relevant parental, perinatal and neonatal factors associated
with ASD compared to children with NDD.
Risk factor variables ASD
(n = 108)
NDD
(n = 60)
Odds ratio
(95% CI)
p-value
Child’s age in years:
Median (IQR)
7.1
(5.9 – 9.1)
9.95
(8.2 – 11.0)
0.64 (0.54 – 0.76) < 0.0001*
Child’s male sex 85 (79%) 39 (65%) 1.98 (0.99 – 4.01) 0.055
Parental factors
Mother’s age in years 36.5
(SD:4.86)
39.1
(SD:6.74)
0.92 (0.87 – 0.98) 0.006*
Mother’s age at delivery in years 28.7
(IQR: 26.1 –
30.5
(IQR: 25.2 –
0.97 (0.92 – 1.03) 0.366

115
32.2) 34.0)
Ordinal categories for Mother’s age at
deliverya
- - 0.58 (0.38 – 0.88) 0.312
Mother’s age at first birth in years 26.0
(IQR:23.0 –
28.0)
23.0
(IQR:19.0 –
27.75)
1.05 (0.98 – 1.12) 0.177
Mother’s marital statusb
Single 3 (3%) 6 (10%) Ref Ref
Married 98 (90%) 40 (67%) 4.90 (1.17 – 20.55) 0.030*
Separated / Divorced 5 (5%) 12 (20%) 0.83 (0.15 – 4.70) 0.837
Widowed 2 (2%) 2 (3%) 2.00 (0.18 – 22.06) 0.571
Mother’s religionb
Ordinal categories - - 0.56 (0.37 – 0.82) 0.003*
Mother’s ethnicity
Ordinal categories - - 0.81 (0.67 – 0.99) 0.038*
Mother’s education levela
Ordinal categories - - 2.83 (1.90 – 4.20) < 0.0001*
Mother’s occupationa
Ordinal categories - - 0.31 (0.20 – 0.50) < 0.0001*
Father’s age in years 40.8
(SD:5.82)
42.8
(SD:7.50)
0.95 (0.91 – 1.00) 0.063
Father’s age at delivery in years 33.2
(SD:5.39)
33.4
(SD:7.48)
0.99 (0.95 – 1.05) 0.837
Ordinal categories for Father’s age at
deliverya
- - 0.85 (0.62 – 1.16) 0.309
Father’s marital statusa
Ordinal categories - - 0.42 (0.20 – 0.89) 0.024*
Father’s religiona
Ordinal categories - - 0.55 (0.37 – 0.82) 0.003*
Father’s ethnicityb
Northern 55 (51%) 17 (28%) Ref Ref
Southern 19 (18%) 20 (33%) 0.29 (0.13 – 0.67) 0.004*
Eastern 19 (18%) 17 (28%) 0.35 (0.15 – 0.81) 0.014*
Central 6 (6%) 4 (7%) 0.46 (0.12 – 1.84) 0.274
Other 9 (8%) 2 (3%) 1.39 (0.27 – 7.07) 0.691
Father’s education levela
Ordinal categories - - 3.36 (2.19 – 5.16) < 0.0001*
Father’s Occupationa
Ordinal categories - - 0.38 (0.22 – 0.65) < 0.0001*

116
Parental age gap in yearsc 3.55
(IQR: - 0.10
– 9.26)
2.95
(IQR: -0.45
– 10.4)
1.03 (0.96 – 1.11) 0.410
Mother is older than Father 10 (9%) 6 (10%) 0.92 (0.32 – 2.66) 0.875
Father is older than Mother 97(90%) 49 (82%) 1.98 (0.80 – 4.89) 0.139
Birth order 1 (IQR:1-2) 2 (IQR:1-3) 0.71 (0.53 – 0.94) 0.016*
Birth weight (kg) 3.2 (IQR: 3
– 3.6)
3.0 (IQR:
2.9 – 3.5)
1.45 (0.89 – 2.37) 0.1344
No. of children 2 (2 – 3) 3.0 (2- 4) 0.75 (0.59 – 0.96) 0.020*
Prenatal factors
Pregnancy medical complications 10 (9.3%) 3 (5%) 1.94 (0.51 – 7.34) 0.330
Pregnancy infections 21 (19%) 2 (3%) 7.00 (1.58 – 31.00) 0.010*
Medication use during pregnancy 30 (28%) 18 (30%) 0.90 (0.45 – 1.80) 0.760
Gestational term ≤ 37 weeks 8 (7%) 2 (3%) 2.32 (0.48 – 11.30) 0.297
Perinatal factors
Assisted delivery 5 (5%) 1 (2%) 2.86 (0.33 – 25.10) 0.342
Labour complications 18 (17%) 2 (3%) 5.80 (1.30 – 25.93) 0.021*
Birth complications 18 (17%) 5 (8%) 2.20 (0.77 – 6.26) 0.140
Adverse perinatal events 35 (32%) 24 (40%) 0.72 (037 – 1.38) 0.324
Neonatal factors
Low birth weight (≤ 2.5 kg) 12 (11%) 11 (18%) 0.56 (0.23 – 1.35) 0.196
Neonatal jaundice 9 (8%) 6 (10%) 0.82 (0.28 – 2.42) 0.717
Neonatal seizures immediately after
birth
6 (6%) 7 (12%) 0.45 (0.14 – 1.39) 0.164
Postnatal factors
Family history of seizures 11 (10%) 7 (12%) 0.86 (0.31 – 2.35) 0.766
Seizures disorders 22 (20%) 8 (13%) 1.66 (0.69 – 4.01) 0.257
Malaria (before age 3) 33 (31%) 3 (5%) 8.36 (2.44 – 28.63) 0.001*
Head injury with loss of consciousness
(before age 3)
9 (8%) 11 (18%) 0.41 (0.16 – 1.04) 0.061
Note. ASD = Autism Spectrum Disorder; NDD = Neurodevelopmental Disorders; CI = confidence interval; IQR = Interquartile Range; SD
= Standard Deviation. Means and standard deviations (SD) are provided for continuous variables with a normal or near normal distribution,
while medians and interquartile ranges (IQR) are provided for continuous or count variables without a normal distribution.
aThere is no departure from trend (likelihood ratio test LRT p > 0.05) so the ordered levels rather than the individual categories are reported;
bThere is departure from trend (LRT p value < 0.05) so the individual categories are reported; cGenerated by subtracting mother‘s age from
the father‘s age.
*p < 0.05
According to the statistical analysis, the child‘s age (OR: 0.64 [95% CI: 0.54, 0.76], p < 0.0001) was a
factor unique to ASD compared to NDD. Mother‘s marital status of ‗married‘ (OR: 4.90 [95% CI:
1.17, 20.55], p = 0.030), mother‘s education level as an ordinal category (OR: 2.83 [95% CI: 1.90,
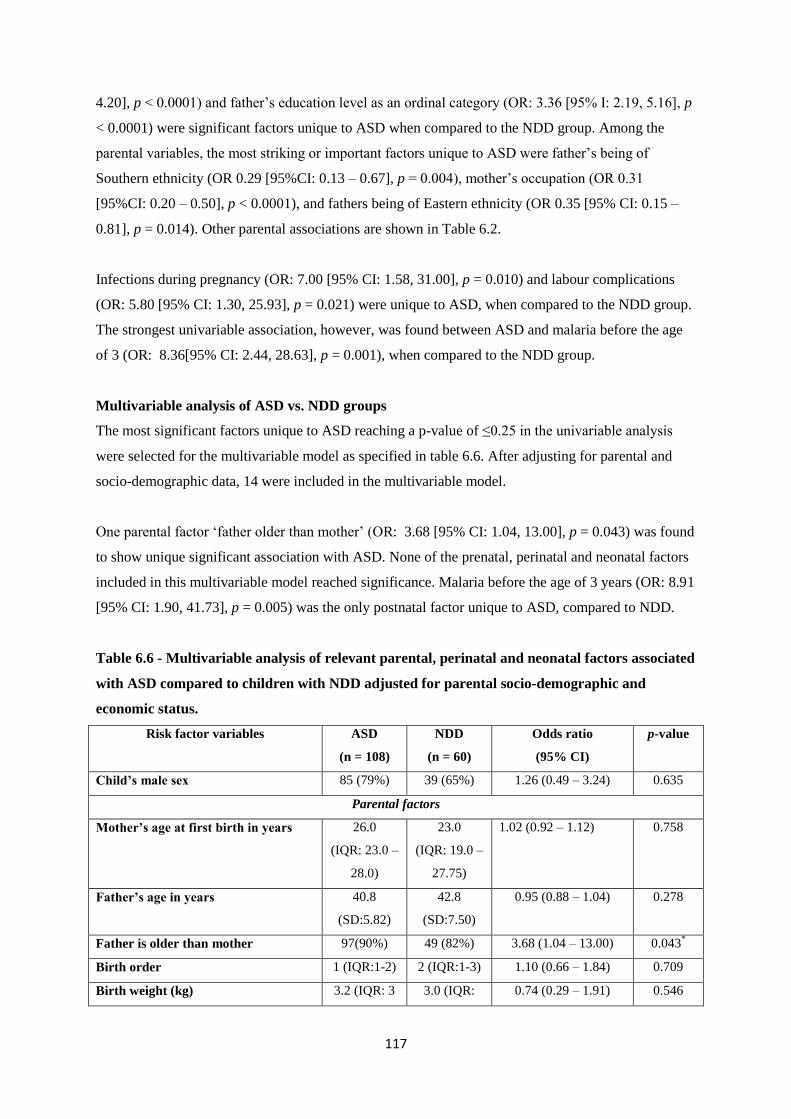
117
4.20], p < 0.0001) and father‘s education level as an ordinal category (OR: 3.36 [95% I: 2.19, 5.16], p
< 0.0001) were significant factors unique to ASD when compared to the NDD group. Among the
parental variables, the most striking or important factors unique to ASD were father‘s being of
Southern ethnicity (OR 0.29 [95%CI: 0.13 – 0.67], p = 0.004), mother‘s occupation (OR 0.31
[95%CI: 0.20 – 0.50], p < 0.0001), and fathers being of Eastern ethnicity (OR 0.35 [95% CI: 0.15 –
0.81], p = 0.014). Other parental associations are shown in Table 6.2.
Infections during pregnancy (OR: 7.00 [95% CI: 1.58, 31.00], p = 0.010) and labour complications
(OR: 5.80 [95% CI: 1.30, 25.93], p = 0.021) were unique to ASD, when compared to the NDD group.
The strongest univariable association, however, was found between ASD and malaria before the age
of 3 (OR: 8.36[95% CI: 2.44, 28.63], p = 0.001), when compared to the NDD group.
Multivariable analysis of ASD vs. NDD groups
The most significant factors unique to ASD reaching a p-value of ≤0.25 in the univariable analysis
were selected for the multivariable model as specified in table 6.6. After adjusting for parental and
socio-demographic data, 14 were included in the multivariable model.
One parental factor ‗father older than mother‘ (OR: 3.68 [95% CI: 1.04, 13.00], p = 0.043) was found
to show unique significant association with ASD. None of the prenatal, perinatal and neonatal factors
included in this multivariable model reached significance. Malaria before the age of 3 years (OR: 8.91
[95% CI: 1.90, 41.73], p = 0.005) was the only postnatal factor unique to ASD, compared to NDD.
Table 6.6 - Multivariable analysis of relevant parental, perinatal and neonatal factors associated
with ASD compared to children with NDD adjusted for parental socio-demographic and
economic status.
Risk factor variables ASD
(n = 108)
NDD
(n = 60)
Odds ratio
(95% CI)
p-value
Child’s male sex 85 (79%) 39 (65%) 1.26 (0.49 – 3.24) 0.635
Parental factors
Mother’s age at first birth in years 26.0
(IQR: 23.0 –
28.0)
23.0
(IQR: 19.0 –
27.75)
1.02 (0.92 – 1.12) 0.758
Father’s age in years 40.8
(SD:5.82)
42.8
(SD:7.50)
0.95 (0.88 – 1.04) 0.278
Father is older than mother 97(90%) 49 (82%) 3.68 (1.04 – 13.00) 0.043*
Birth order 1 (IQR:1-2) 2 (IQR:1-3) 1.10 (0.66 – 1.84) 0.709
Birth weight (kg) 3.2 (IQR: 3 3.0 (IQR: 0.74 (0.29 – 1.91) 0.546

118
– 3.6) 2.9 – 3.5)
No. of children 2 (2 – 3) 3.0 (2- 4) 0.93 (0.61 – 1.44) 0.756
Prenatal factors
Pregnancy infections 21 (19%) 2 (3%) 4.41 (0.78 – 24.97) 0.093
Perinatal factors
Labour complications 18 (17%) 2 (3%) 2.79 (0.47 – 16.49) 0.258
Birth complications 18 (17%) 5 (8%) 1.72 (0.44 – 6.67) 0.434
Neonatal factors
Low birth weight (≤ 2.5 kg) 12 (11%) 11 (18%) 0.26 (0.05 – 1.49) 0.132
Neonatal seizures immediately after
birth
6 (6%) 7 (12%) 0.55 (0.13 – 2.37) 0.423
Postnatal factors
Malaria (before age 3) 33 (31%) 3 (5%) 8.91 (1.90 – 41.73) 0.005*
Head injury with loss of consciousness
(before age 3)
9 (8%) 11 (18%) 0.48 (0.13 – 1.72) 0.258
Note. ASD = Autism Spectrum Disorder; NDD = Neurodevelopmental Disorders; CI = confidence interval; IQR = Interquartile Range; SD
= Standard Deviation. In the multivariable analysis only variables that reached a p value cut-off of ≤ 0.25in the Univariable analysis and
were not in multicollineality with each other were included.
*p < 0.05
6.3.3. NDD vs. TD groups
General description
The median age was significantly different between NDD and TD groups (9.95 vs. 2.8; p < 0.0001),
as mentioned earlier because the TD was matched on expressive language level. There was no
significant difference in the frequency of male participants in both the NDD group and in the TD
group (65% vs. 57%; p = 0.299) (Table 6.2).
Mother‘s age at assessment (p < 0.0001), mother‘s age at delivery (p = 0.050) and mother‘s age at
first birth (p = 0.019) were significantly higher for mothers of children with NDD compared to
mothers of TD children. There were no significant differences in other maternal socio-demographic
factors except for a statistically significant difference in mother‘s ethnicity between the NDD and TD
groups (p = 0.005).
Father‘s age at assessment (p < 0.0001) and delivery (p = 0.002) were significantly higher for fathers
of children with NDD compared to fathers of the TD group. Fathers of children with NDD were more
likely to be working in formal employment (55% vs. 32%; p = 0.001), however no other significant
differences were noted for other paternal socio-demographic factors.

119
Mothers of children with NDD were significantly more likely to have taken medication during
pregnancy (30% vs. 17%; p = 0.051) compared to mothers of the TD group. Birth complications (8%
vs. 2%; p = 0.046) and adverse perinatal events (40% vs. 2%; p < 0.0001) were significantly more
common in the NDD group compared to the TD group. The NDD group were also more likely to have
neonatal jaundice (10% vs. 0%; p = 0.007) and neonatal seizures immediately after birth (12% vs. 0%;
p = 0.002) compared to the TD group. Significant differences between the NDD and TD groups in
postnatal factors included seizures disorders (13% vs. 0%; p = 0.001) and head injury with loss of
consciousness before the age of 3 years (18% vs. 0%; p < 0.0001).
Risk factors for NDD, compared to the TD group
Univariable analysis of NDD vs. TD groups
The factors listed in Table 6.7 were evaluated as possible risk factors for other NDD but not ASD. Of
all the factors investigated for univariable analysis, 18 factors reached the significant cut-off of 0.05.
Of these significant factors, 12 showed increased risk for other NDD, with OR ranging from 1.05 –
38.00, and the remainder showed reduced risk for other NDD, with OR ranging from 0.28 - 0.78. The
univariable risk factors with the largest OR, among those showing increased risk for other NDD, were
adverse perinatal events (OR 38.00 [95% CI: 8.56 – 168.67], p < 0.0001), head injury with loss of
consciousness before the age of 3 (OR 25.81 [95% CI: 3.24 – 205.45], p = 0.002) and seizures
disorders (OR 17.69 [95% CI: 2.15 – 145.13], p = 0.007). The univariable risk factors with the
smallest OR among those showing decreased risk for other NDD were fathers working in informal
employment (OR 0.28 [95% CI: 0.14 – 0.57], p <0.0001) and mother‘s being of Southern ethnicity
(OR 0.41 [95% CI: 0.17 – 0.97], p = 0.044). However, when considering the conventional cut-off of p
≤ 0.25, 27 risk factors qualified for the multivariable analysis reported in the next section. Univariable
association according to categories of risk factors are described below.
Among the parental variables, the risk factors that appeared to increase risk for other NDD were
mother‘s age at assessment (OR: 1.15 [95% CI: 1.09, 1.21], p < 0.0001), mother‘s age at first birth
(OR: 1.07 [95% CI: 1.01, 1.14], p < 0.0001), father‘s age at assessment (OR: 1.29 [95% CI: 1.13,
1.26], p < 0.0001), father‘s age at delivery (OR: 1.05 [95% CI: 1.00, 1.10], p = 0.027) and the number
of children ever born (OR: 1.59 [95% CI: 1.25, 2.02], p < 0.0001). Among the parental variables, the
risk factors that appeared to decrease risk for other NDD were mothers being of Islamic religion (OR:
0.43 [95% CI: 0.19, 1.00], p = 0.050), mothers being of Southern ethnicity (OR: 0.41 [95% CI: 0.17,
0.97], p = 0.044), mothers achieving tertiary level education (OR: 0.78 [95% CI: 0.11, 5.59], p =
0.012), mother‘s being unemployed (OR: 0.42 [95% CI: 0.18, 0.99], p = 0.049), mother‘s working in
informal employment (OR: 0.42 [95% CI: 0.19, 0.93, p = 0.033) and fathers working in informal
employment (OR: 0.28 [95% CI: 0.14, 0.57], p < 0.0001) .
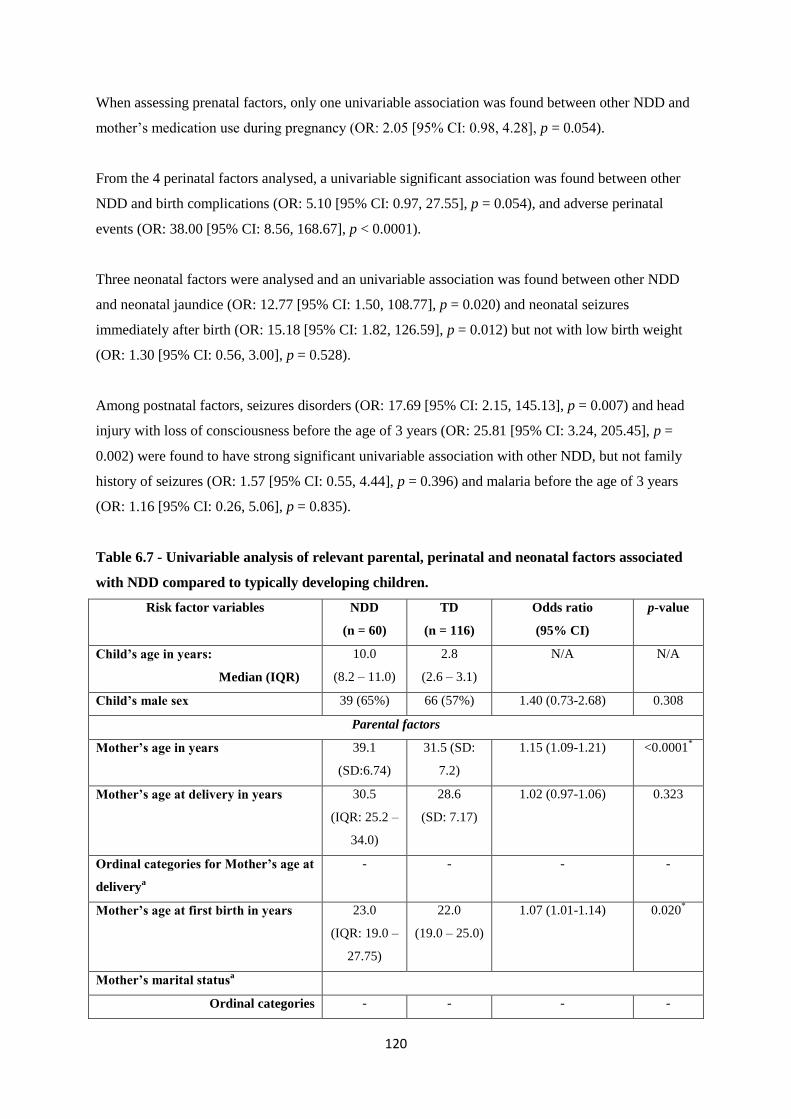
120
When assessing prenatal factors, only one univariable association was found between other NDD and
mother‘s medication use during pregnancy (OR: 2.05 [95% CI: 0.98, 4.28], p = 0.054).
From the 4 perinatal factors analysed, a univariable significant association was found between other
NDD and birth complications (OR: 5.10 [95% CI: 0.97, 27.55], p = 0.054), and adverse perinatal
events (OR: 38.00 [95% CI: 8.56, 168.67], p < 0.0001).
Three neonatal factors were analysed and an univariable association was found between other NDD
and neonatal jaundice (OR: 12.77 [95% CI: 1.50, 108.77], p = 0.020) and neonatal seizures
immediately after birth (OR: 15.18 [95% CI: 1.82, 126.59], p = 0.012) but not with low birth weight
(OR: 1.30 [95% CI: 0.56, 3.00], p = 0.528).
Among postnatal factors, seizures disorders (OR: 17.69 [95% CI: 2.15, 145.13], p = 0.007) and head
injury with loss of consciousness before the age of 3 years (OR: 25.81 [95% CI: 3.24, 205.45], p =
0.002) were found to have strong significant univariable association with other NDD, but not family
history of seizures (OR: 1.57 [95% CI: 0.55, 4.44], p = 0.396) and malaria before the age of 3 years
(OR: 1.16 [95% CI: 0.26, 5.06], p = 0.835).
Table 6.7 - Univariable analysis of relevant parental, perinatal and neonatal factors associated
with NDD compared to typically developing children.
Risk factor variables NDD
(n = 60)
TD
(n = 116)
Odds ratio
(95% CI)
p-value
Child’s age in years:
Median (IQR)
10.0
(8.2 – 11.0)
2.8
(2.6 – 3.1)
N/A N/A
Child’s male sex 39 (65%) 66 (57%) 1.40 (0.73-2.68) 0.308
Parental factors
Mother’s age in years 39.1
(SD:6.74)
31.5 (SD:
7.2)
1.15 (1.09-1.21) <0.0001*
Mother’s age at delivery in years 30.5
(IQR: 25.2 –
34.0)
28.6
(SD: 7.17)
1.02 (0.97-1.06) 0.323
Ordinal categories for Mother’s age at
deliverya
- - - -
Mother’s age at first birth in years 23.0
(IQR: 19.0 –
27.75)
22.0
(19.0 – 25.0)
1.07 (1.01-1.14) 0.020*
Mother’s marital statusa
Ordinal categories - - - -
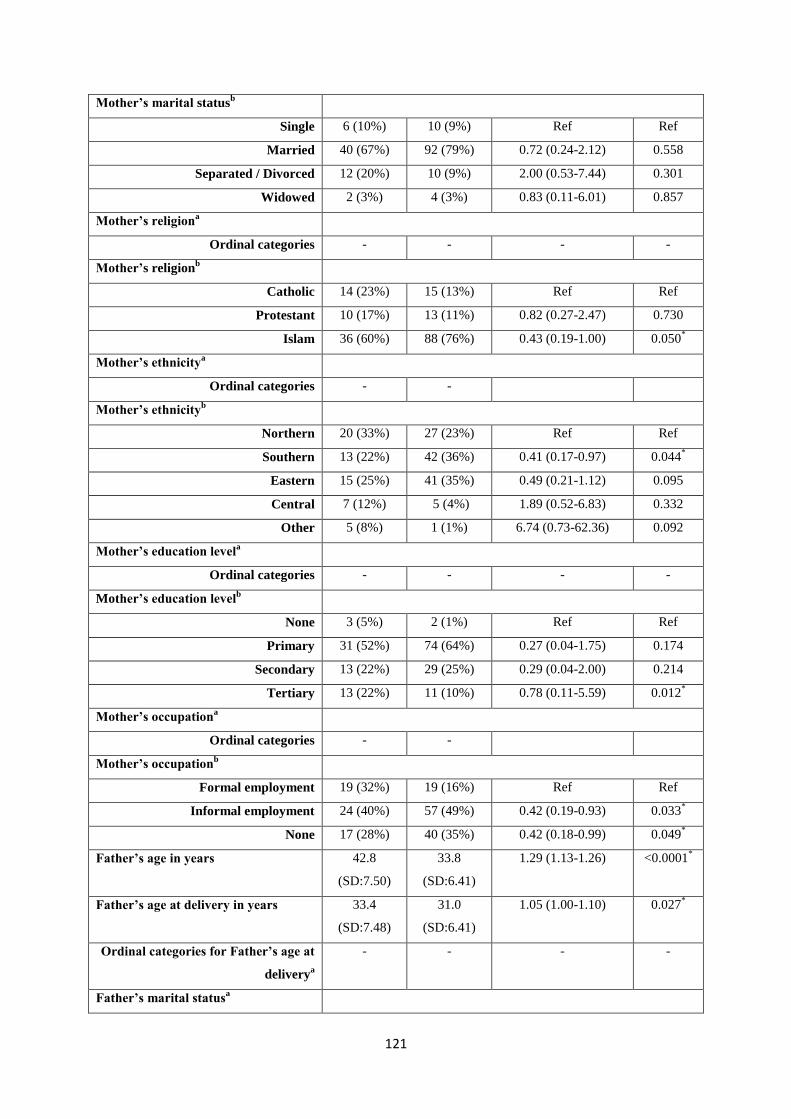
121
Mother’s marital statusb
Single 6 (10%) 10 (9%) Ref Ref
Married 40 (67%) 92 (79%) 0.72 (0.24-2.12) 0.558
Separated / Divorced 12 (20%) 10 (9%) 2.00 (0.53-7.44) 0.301
Widowed 2 (3%) 4 (3%) 0.83 (0.11-6.01) 0.857
Mother’s religiona
Ordinal categories - - - -
Mother’s religionb
Catholic 14 (23%) 15 (13%) Ref Ref
Protestant 10 (17%) 13 (11%) 0.82 (0.27-2.47) 0.730
Islam 36 (60%) 88 (76%) 0.43 (0.19-1.00) 0.050*
Mother’s ethnicitya
Ordinal categories - -
Mother’s ethnicityb
Northern 20 (33%) 27 (23%) Ref Ref
Southern 13 (22%) 42 (36%) 0.41 (0.17-0.97) 0.044*
Eastern 15 (25%) 41 (35%) 0.49 (0.21-1.12) 0.095
Central 7 (12%) 5 (4%) 1.89 (0.52-6.83) 0.332
Other 5 (8%) 1 (1%) 6.74 (0.73-62.36) 0.092
Mother’s education levela
Ordinal categories - - - -
Mother’s education levelb
None 3 (5%) 2 (1%) Ref Ref
Primary 31 (52%) 74 (64%) 0.27 (0.04-1.75) 0.174
Secondary 13 (22%) 29 (25%) 0.29 (0.04-2.00) 0.214
Tertiary 13 (22%) 11 (10%) 0.78 (0.11-5.59) 0.012*
Mother’s occupationa
Ordinal categories - -
Mother’s occupationb
Formal employment 19 (32%) 19 (16%) Ref Ref
Informal employment 24 (40%) 57 (49%) 0.42 (0.19-0.93) 0.033*
None 17 (28%) 40 (35%) 0.42 (0.18-0.99) 0.049*
Father’s age in years 42.8
(SD:7.50)
33.8
(SD:6.41)
1.29 (1.13-1.26) <0.0001*
Father’s age at delivery in years 33.4
(SD:7.48)
31.0
(SD:6.41)
1.05 (1.00-1.10) 0.027*
Ordinal categories for Father’s age at
deliverya
- - - -
Father’s marital statusa
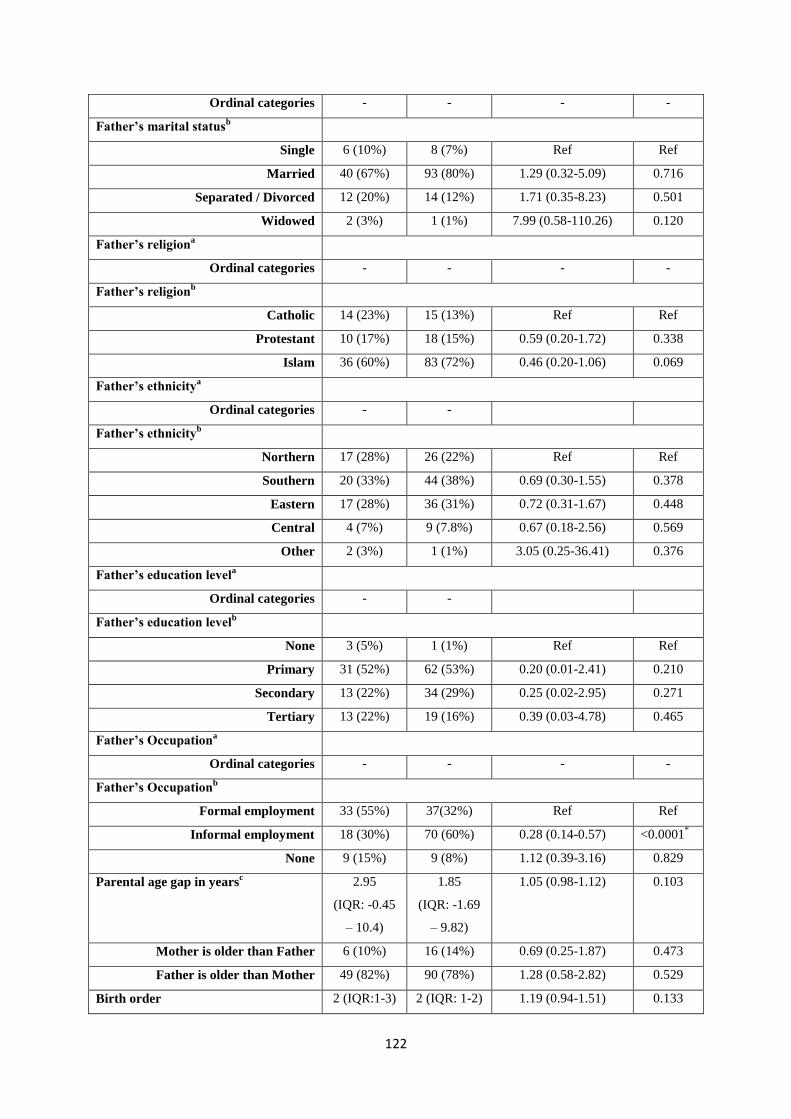
122
Ordinal categories - - - -
Father’s marital statusb
Single 6 (10%) 8 (7%) Ref Ref
Married 40 (67%) 93 (80%) 1.29 (0.32-5.09) 0.716
Separated / Divorced 12 (20%) 14 (12%) 1.71 (0.35-8.23) 0.501
Widowed 2 (3%) 1 (1%) 7.99 (0.58-110.26) 0.120
Father’s religiona
Ordinal categories - - - -
Father’s religionb
Catholic 14 (23%) 15 (13%) Ref Ref
Protestant 10 (17%) 18 (15%) 0.59 (0.20-1.72) 0.338
Islam 36 (60%) 83 (72%) 0.46 (0.20-1.06) 0.069
Father’s ethnicitya
Ordinal categories - -
Father’s ethnicityb
Northern 17 (28%) 26 (22%) Ref Ref
Southern 20 (33%) 44 (38%) 0.69 (0.30-1.55) 0.378
Eastern 17 (28%) 36 (31%) 0.72 (0.31-1.67) 0.448
Central 4 (7%) 9 (7.8%) 0.67 (0.18-2.56) 0.569
Other 2 (3%) 1 (1%) 3.05 (0.25-36.41) 0.376
Father’s education levela
Ordinal categories - -
Father’s education levelb
None 3 (5%) 1 (1%) Ref Ref
Primary 31 (52%) 62 (53%) 0.20 (0.01-2.41) 0.210
Secondary 13 (22%) 34 (29%) 0.25 (0.02-2.95) 0.271
Tertiary 13 (22%) 19 (16%) 0.39 (0.03-4.78) 0.465
Father’s Occupationa
Ordinal categories - - - -
Father’s Occupationb
Formal employment 33 (55%) 37(32%) Ref Ref
Informal employment 18 (30%) 70 (60%) 0.28 (0.14-0.57) <0.0001*
None 9 (15%) 9 (8%) 1.12 (0.39-3.16) 0.829
Parental age gap in yearsc 2.95
(IQR: -0.45
– 10.4)
1.85
(IQR: -1.69
– 9.82)
1.05 (0.98-1.12) 0.103
Mother is older than Father 6 (10%) 16 (14%) 0.69 (0.25-1.87) 0.473
Father is older than Mother 49 (82%) 90 (78%) 1.28 (0.58-2.82) 0.529
Birth order 2 (IQR:1-3) 2 (IQR: 1-2) 1.19 (0.94-1.51) 0.133
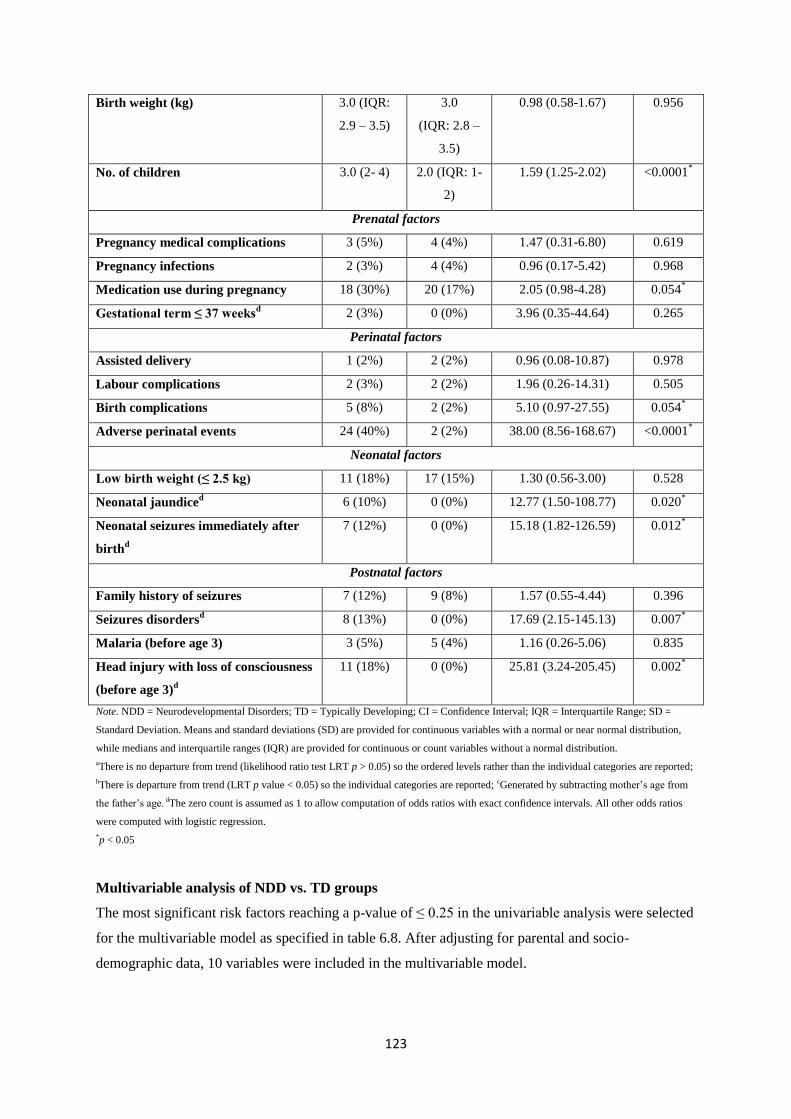
123
Birth weight (kg) 3.0 (IQR:
2.9 – 3.5)
3.0
(IQR: 2.8 –
3.5)
0.98 (0.58-1.67) 0.956
No. of children 3.0 (2- 4) 2.0 (IQR: 1-
2)
1.59 (1.25-2.02) <0.0001*
Prenatal factors
Pregnancy medical complications 3 (5%) 4 (4%) 1.47 (0.31-6.80) 0.619
Pregnancy infections 2 (3%) 4 (4%) 0.96 (0.17-5.42) 0.968
Medication use during pregnancy 18 (30%) 20 (17%) 2.05 (0.98-4.28) 0.054*
Gestational term ≤ 37 weeksd
2 (3%) 0 (0%)
3.96 (0.35-44.64) 0.265
Perinatal factors
Assisted delivery 1 (2%) 2 (2%) 0.96 (0.08-10.87) 0.978
Labour complications 2 (3%) 2 (2%) 1.96 (0.26-14.31) 0.505
Birth complications 5 (8%) 2 (2%)
5.10 (0.97-27.55) 0.054*
Adverse perinatal events 24 (40%) 2 (2%) 38.00 (8.56-168.67) <0.0001*
Neonatal factors
Low birth weight (≤ 2.5 kg) 11 (18%) 17 (15%) 1.30 (0.56-3.00) 0.528
Neonatal jaundiced 6 (10%) 0 (0%)
12.77 (1.50-108.77) 0.020
*
Neonatal seizures immediately after
birthd
7 (12%) 0 (0%)
15.18 (1.82-126.59) 0.012*
Postnatal factors
Family history of seizures 7 (12%) 9 (8%) 1.57 (0.55-4.44) 0.396
Seizures disordersd 8 (13%) 0 (0%)
17.69 (2.15-145.13) 0.007
*
Malaria (before age 3) 3 (5%) 5 (4%) 1.16 (0.26-5.06) 0.835
Head injury with loss of consciousness
(before age 3)d
11 (18%) 0 (0%) 25.81 (3.24-205.45)
0.002*
Note. NDD = Neurodevelopmental Disorders; TD = Typically Developing; CI = Confidence Interval; IQR = Interquartile Range; SD =
Standard Deviation. Means and standard deviations (SD) are provided for continuous variables with a normal or near normal distribution,
while medians and interquartile ranges (IQR) are provided for continuous or count variables without a normal distribution.
aThere is no departure from trend (likelihood ratio test LRT p > 0.05) so the ordered levels rather than the individual categories are reported;
bThere is departure from trend (LRT p value < 0.05) so the individual categories are reported; cGenerated by subtracting mother‘s age from
the father‘s age. dThe zero count is assumed as 1 to allow computation of odds ratios with exact confidence intervals. All other odds ratios
were computed with logistic regression.
*p < 0.05
Multivariable analysis of NDD vs. TD groups
The most significant risk factors reaching a p-value of ≤ 0.25 in the univariable analysis were selected
for the multivariable model as specified in table 6.8. After adjusting for parental and socio-
demographic data, 10 variables were included in the multivariable model.

124
Among the parental variables, a strong significant association with other NDD was found for the
number of children ever born (OR: 5.38 [95% CI: 1.60, 18.09], p = 0.007). None of the prenatal and
neonatal factors were significantly associated with other NDD. Birth complications (OR: 78.06 [95%
CI: 1.73, 3.56x10³], p = 0.025) and adverse perinatal events (OR: 383.31[95% CI: 16.66, 8.82x10
2], p
< 0.0001) were the only perinatal factors reaching significance and seizures disorders (OR: 125.01
[95% CI: 1.73, 9.04x10³], p = 0.027) and head injury with loss of consciousness before the age of 3
years (OR: 925.765 [95% CI: 7.98, 1.07x10⁵], p = 0.005) were the only postnatal factors reaching
significance.
Table 6.8 - Multivariable analysis of relevant parental, perinatal and neonatal factors associated
with NDD compared to typically developing children adjusted for parental socio-demographic
and economic status.
Risk factor variables NDD
(n = 60)
TD
(n = 116)
Odds ratio
(95% CI)
p-value
Parental factors
Parental age gap in years 2.95
(IQR: -0.45 –
10.4)
1.85
(IQR: -1.69 –
9.82)
0.08 (0.00 –
1.144x10⁵ )
0.793
Birth order 2.0
(IQR: 1 – 3)
2.0
(IQR: 1 – 2)
0.12 (0.03 – 0.44) 0.001*
No. of children 3.0
(IQR: 2 – 4)
2.0
(IQR: 1- 2)
5.38 (1.60 – 18.09) 0.007*
Prenatal factors
Medication use during
pregnancy
18 (30%) 20 (17%) 1.96 (0.21 – 17.98) 0.55
Perinatal factors
Birth complications 5 (8%) 2 (2%)
78.06 (1.73 –
3.56x10³)
0.025*
Adverse perinatal events 24 (40%) 2 (2%) 383.31 (16.66 – 8.82
x102)
0.000*
Neonatal factors
Neonatal jaundice 6 (10%) 0 (0%)
0.82 (0.03 – 19.53) 0.901
Neonatal seizures
immediately after birth
7 (12%) 0 (0%)
4.35 (0.09 – 211.41) 0.458
Postnatal factors
Seizures disorders 8 (13%) 0 (0%)
125.01 (1.73 –
9.04x10³)
0.027*
Head injury with loss of 11 (18%) 0 (0%) 925.765 (7.981 – 0.005*
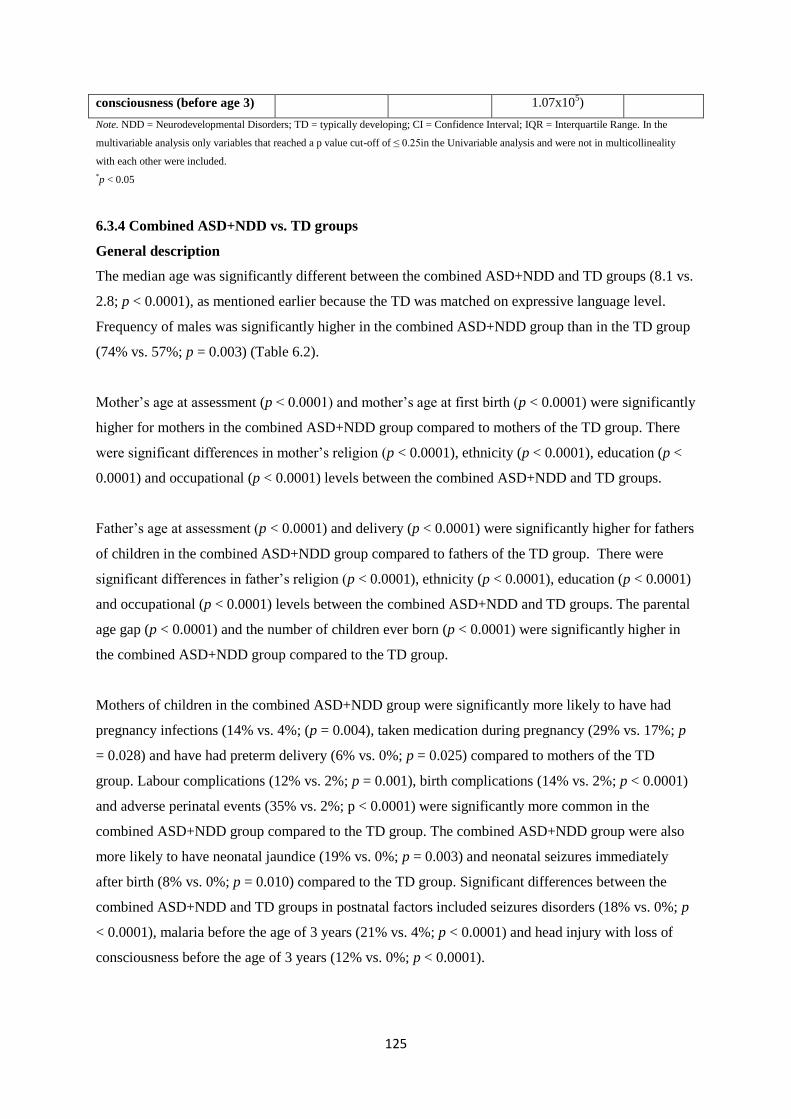
125
consciousness (before age 3) 1.07x10⁵)
Note. NDD = Neurodevelopmental Disorders; TD = typically developing; CI = Confidence Interval; IQR = Interquartile Range. In the
multivariable analysis only variables that reached a p value cut-off of ≤ 0.25in the Univariable analysis and were not in multicollineality
with each other were included.
*p < 0.05
6.3.4 Combined ASD+NDD vs. TD groups
General description
The median age was significantly different between the combined ASD+NDD and TD groups (8.1 vs.
2.8; p < 0.0001), as mentioned earlier because the TD was matched on expressive language level.
Frequency of males was significantly higher in the combined ASD+NDD group than in the TD group
(74% vs. 57%; p = 0.003) (Table 6.2).
Mother‘s age at assessment (p < 0.0001) and mother‘s age at first birth (p < 0.0001) were significantly
higher for mothers in the combined ASD+NDD group compared to mothers of the TD group. There
were significant differences in mother‘s religion (p < 0.0001), ethnicity (p < 0.0001), education (p <
0.0001) and occupational (p < 0.0001) levels between the combined ASD+NDD and TD groups.
Father‘s age at assessment (p < 0.0001) and delivery (p < 0.0001) were significantly higher for fathers
of children in the combined ASD+NDD group compared to fathers of the TD group. There were
significant differences in father‘s religion (p < 0.0001), ethnicity (p < 0.0001), education (p < 0.0001)
and occupational (p < 0.0001) levels between the combined ASD+NDD and TD groups. The parental
age gap (p < 0.0001) and the number of children ever born (p < 0.0001) were significantly higher in
the combined ASD+NDD group compared to the TD group.
Mothers of children in the combined ASD+NDD group were significantly more likely to have had
pregnancy infections (14% vs. 4%; (p = 0.004), taken medication during pregnancy (29% vs. 17%; p
= 0.028) and have had preterm delivery (6% vs. 0%; p = 0.025) compared to mothers of the TD
group. Labour complications (12% vs. 2%; p = 0.001), birth complications (14% vs. 2%; p < 0.0001)
and adverse perinatal events (35% vs. 2%; p < 0.0001) were significantly more common in the
combined ASD+NDD group compared to the TD group. The combined ASD+NDD group were also
more likely to have neonatal jaundice (19% vs. 0%; p = 0.003) and neonatal seizures immediately
after birth (8% vs. 0%; p = 0.010) compared to the TD group. Significant differences between the
combined ASD+NDD and TD groups in postnatal factors included seizures disorders (18% vs. 0%; p
< 0.0001), malaria before the age of 3 years (21% vs. 4%; p < 0.0001) and head injury with loss of
consciousness before the age of 3 years (12% vs. 0%; p < 0.0001).

126
Risk factors for combined ASD+NDD, compared to the TD group
Univariable analysis of NDD vs. TD groups
The factors listed in Table 6.9 were evaluated as possible risk factors for NDD including ASD. Of all
the factors investigated for univariable analysis, 29 factors reached the significant cut-off of 0.05. Of
these significant factors, 18 showed increased risk for ASD+NDD, with OR ranging from 1.06 –
38.85, and the remainder showed reduced risk for ASD+NDD, with OR ranging from 0.12 - 0.41. The
univariable risk factors with the largest OR, among those showing increased risk for ASD+NDD,
were adverse perinatal events (OR 38.85 [95% CI: 7.35 – 129.37], p < 0.0001), head injury with loss
of consciousness before the age of 3 (OR 15.54 [95% CI: 2.05 – 117.51], p < 0.0001) and seizures
disorders (OR 25.00 [95% CI: 3.35 – 186.14], p = 0.002) . The univariable risk factors with the
smallest OR among those showing decreased risk for ASD+NDD were mothers in unemployment
(OR 0.12 [95% CI: 0.06 – 0.25], p <0.0001), mothers working in informal employment (OR 0.14
[95% CI: 0.07 – 0.27], p <0.0001) and father‘s working in informal employment (OR 0.16 [95% CI:
0.09 – 0.28], p < 0.0001). However, when considering the conventional cut-off of p ≤ 0.25, 39 risk
factors qualified for the multivariable analysis reported in the next section. Univariable association
according to categories of risk factors are described below.
Child‘s male sex was a significant risk factor for ASD+NDD (OR 2.13 [95% CI: 1.29 – 3.53], p =
0.003). Among the parental variables, the risk factors that appeared to increase risk for ASD+NDD
were mother‘s age at assessment (OR: 1.15 [95% CI: 1.10, 1.20], p < 0.0001), mother‘s age at first
birth (OR: 1.12 [95% CI: 1.06, 1.18], p < 0.0001), father‘s age at assessment (OR: 1.29 [95% CI:
1.13, 1.26], p < 0.0001), father‘s age at delivery (OR: 1.06 [95% CI: 1.02, 1.10], p = 0.003), parental
age gap (OR 1.07 [95% CI: 1.02 – 1.13], p = 0.005) and the number of children ever born (OR: 1.53
[95% CI: 1.23, 1.90], p < 0.0001). Among the parental variables, the risk factors that appeared to
decrease risk for other NDD were mothers being of Islamic religion (OR: 0.21 [95% CI: 0.11, 0.41], p
< 0.0001), mothers being of Southern ethnicity (OR: 0.30 [95% CI: 0.16, 0.56], p < 0.0001), mothers
being of Eastern ethnicity (OR 0.24 [95% CI: 0.12 – 0.47], p <0.0001), mother‘s being unemployed
(OR: 0.12 [95% CI: 0.06, 0.25], p < 0.0001), mother‘s working in informal employment (OR: 0.14
[95% CI: 0.07, 0.27, p < 0.0001), fathers being of Islamic religion (OR: 0.23 [95% CI: 0.12, 0.45], p <
0.0001), fathers being of Southern ethnicity (OR: 0.32 [95% CI: 0.17, 0.59], p < 0.0001), fathers
being of Eastern ethnicity (OR 0.36 [95% CI: 0.18 – 0.68], p = 0.002), father‘s being unemployed
(OR: 0.41 [95% CI: 0.16, 1.06], p < 0.0001), father‘s working in informal employment (OR: 0.16
[95% CI: 0.09, 0.28, p < 0.0001).
Among the prenatal factors, a univariable association was found between ASD+NDD and pregnancy
medical complications (OR: 9.04 [95% CI: 2.08, 39.14], p = 0.003), pregnancy infections (OR: 4.44
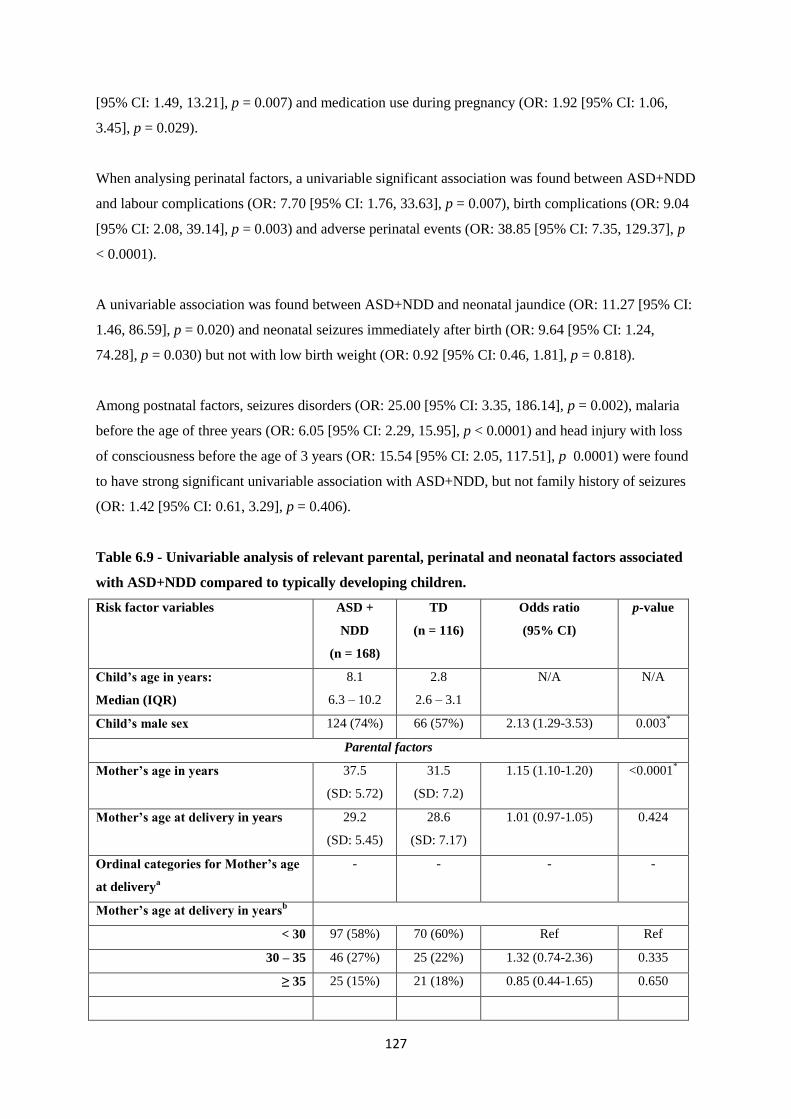
127
[95% CI: 1.49, 13.21], p = 0.007) and medication use during pregnancy (OR: 1.92 [95% CI: 1.06,
3.45], p = 0.029).
When analysing perinatal factors, a univariable significant association was found between ASD+NDD
and labour complications (OR: 7.70 [95% CI: 1.76, 33.63], p = 0.007), birth complications (OR: 9.04
[95% CI: 2.08, 39.14], p = 0.003) and adverse perinatal events (OR: 38.85 [95% CI: 7.35, 129.37], p
< 0.0001).
A univariable association was found between ASD+NDD and neonatal jaundice (OR: 11.27 [95% CI:
1.46, 86.59], p = 0.020) and neonatal seizures immediately after birth (OR: 9.64 [95% CI: 1.24,
74.28], p = 0.030) but not with low birth weight (OR: 0.92 [95% CI: 0.46, 1.81], p = 0.818).
Among postnatal factors, seizures disorders (OR: 25.00 [95% CI: 3.35, 186.14], p = 0.002), malaria
before the age of three years (OR: 6.05 [95% CI: 2.29, 15.95], p < 0.0001) and head injury with loss
of consciousness before the age of 3 years (OR: 15.54 [95% CI: 2.05, 117.51], p 0.0001) were found
to have strong significant univariable association with ASD+NDD, but not family history of seizures
(OR: 1.42 [95% CI: 0.61, 3.29], p = 0.406).
Table 6.9 - Univariable analysis of relevant parental, perinatal and neonatal factors associated
with ASD+NDD compared to typically developing children.
Risk factor variables ASD +
NDD
(n = 168)
TD
(n = 116)
Odds ratio
(95% CI)
p-value
Child’s age in years:
Median (IQR)
8.1
6.3 – 10.2
2.8
2.6 – 3.1
N/A N/A
Child’s male sex 124 (74%) 66 (57%) 2.13 (1.29-3.53) 0.003*
Parental factors
Mother’s age in years 37.5
(SD: 5.72)
31.5
(SD: 7.2)
1.15 (1.10-1.20) <0.0001*
Mother’s age at delivery in years 29.2
(SD: 5.45)
28.6
(SD: 7.17)
1.01 (0.97-1.05) 0.424
Ordinal categories for Mother’s age
at deliverya
- - - -
Mother’s age at delivery in yearsb
< 30 97 (58%) 70 (60%) Ref Ref
30 – 35 46 (27%) 25 (22%) 1.32 (0.74-2.36) 0.335
≥ 35 25 (15%) 21 (18%) 0.85 (0.44-1.65) 0.650

128
Mother’s age at first birth in years 26.0
(22.0 – 29.0)
22.0
(19.0 – 25.0)
1.12 (1.06-1.18) <0.0001*
Mother’s marital statusa
Ordinal categories - - - -
Mother’s marital statusb
Single 9 (5%) 10 (9%) Ref Ref
Married 138 (82%) 92 (79%) 1.66 (0.65-4.25) 0.286
Separated / Divorced 17 (10%) 10 (9%) 1.88 (0.57-6.22) 0.296
Widowed 4 (2%) 4 (3%) 1.11 (0.21-5.80) 0.901
Mother’s religiona
Ordinal categories - -
Mother’s religionb
Catholic 56 (33%) 15 (13%) Ref ref
Protestant 40 (24%) 13 (11%) 0.82 (0.35-1.92) 0.654
Islam 72 (43%) 88 (76%) 0.21 (0.11-0.41) <0.0001*
Mother’s ethnicitya
Ordinal categories - -
Mother’s ethnicityb
Northern 77 (46%) 27 (23%) Ref ref
Southern 36 (21%) 42 (36%) 0.30 (0.16-0.56) <0.0001*
Eastern 29 (17%) 41 (35%) 0.24 (0.12-0.47) <0.0001*
Central 13 (8%) 5 (4%) 0.91 (0.29-2.79) 0.872
Other 13 (8%) 1 (1%) 4.55 (0.56-36.51) 0.153
Mother’s education levela
Ordinal categories - -
Mother’s education levelb
None 4 (2%) 2 (1%) Ref Ref
Primary 49 (29%) 74 (64%) 0.33 (0.05-1.87) 0.212
Secondary 39 (23%) 29 (25%) 0.67 (0.11-3.92) 0.659
Tertiary 76 (45%) 11 (10%) 3.45 (0.56-21.13) 0.180
Mother’s occupationa
Ordinal categories - -
Mother’s occupationb
Formal employment 99(59%) 19 (16%) Ref ref
Informal employment 43 (26%) 57 (49%) 0.14 (0.07-0.27) <0.0001*
None 26 (15%) 40 (35%) 0.12 (0.06-0.25) <0.0001*
Father’s age in years 41.5
(SD: 6.51)
33.8
(SD:6.41)
1.20 (1.14-1.26) <0.0001*
Father’s age at delivery in years 33.3 31.0 1.06 (1.02-1.10-) 0.003*

129
(SD: 6.20) (SD:6.41)
Ordinal categories for Father’s age
at deliverya
- - - -
Father’s marital statusa
Ordinal categories - -
Father’s marital statusb
Single 9 (5%) 8 (7%) Ref Ref
Married 140 (83%) 93 (80%) 2.07 (0.69-6.18) 0.188
Separated / Divorced 16 (10%) 14 (12%) 1.23 (0.33-4.54) 0.747
Widowed 3(2%) 1 (1%) 5.33 (0.46-60.79) 0.178
Father’s religiona
Ordinal categories - -
Father’s religionb
Catholic 54 (32%) 15 (13%) Ref Ref
Protestant 43 (26 %) 18 (15%) 0.66 (0.30-1.46) 0.311
Islam 71 (42%) 83 (72%) 0.23 (0.12-0.45) <0.0001*
Father’s ethnicitya
Ordinal categories - -
Father’s ethnicityb
Northern 72 (43%) 26 (22%) Ref Ref
Southern 39 (23|%) 44 (38%) 0.32 (0.17-0.59) <0.0001*
Eastern 36 (21%) 36 (31%) 0.36 (0.18-0.68) 0.002*
Central 10 (6%) 9 (7.8%) 0.40 (0.14-1.09) 0.075
Other 11 (7%) 1 (1%) 3.97 (0.48-32.29) 0.197
Father’s education levela
Ordinal categories - -
Father’s education levelb
None 4 (2%) 1 (1%) Ref Ref
Primary 41 (24%) 62 (53%) 0.19 (0.01-1.93) 0.162
Secondary 35 (21%) 34 (29%) 0.38 (0.03-3.84) 0.415
Tertiary 88 (52%) 19 (16%) 1.57 (0.15-16.01) 0.699
Father’s Occupationa
Ordinal categories - - - -
Father’s Occupationb
Formal employment 119 (71%) 37(32%) Ref Ref
Informal employment 37 (22%) 70 (60%) 0.16 (0.09-0.28) <0.0001*
None 9 (5%) 9 (8%) 0.41 (0.16-1.06) <0.0001*
Parental age gap in yearsc 1.85
(IQR: -1.69
1.07 (1.02-1.13) 0.005*
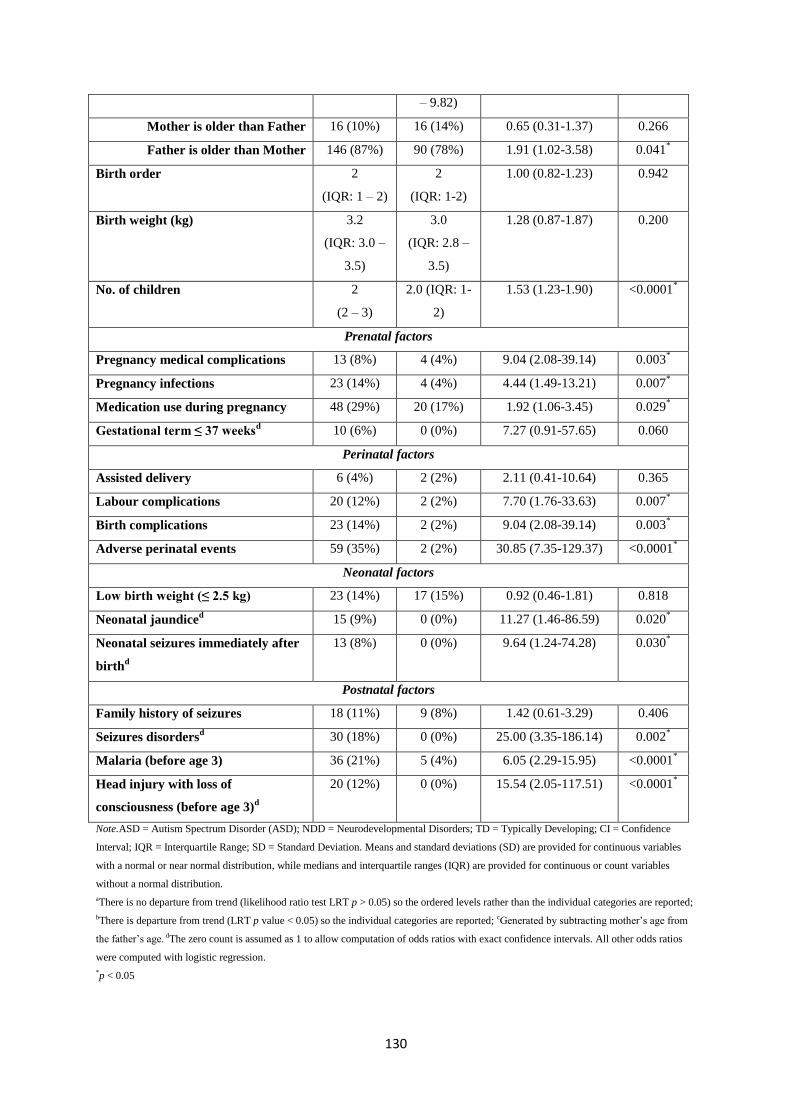
130
– 9.82)
Mother is older than Father 16 (10%) 16 (14%) 0.65 (0.31-1.37) 0.266
Father is older than Mother 146 (87%) 90 (78%) 1.91 (1.02-3.58) 0.041*
Birth order 2
(IQR: 1 – 2)
2
(IQR: 1-2)
1.00 (0.82-1.23) 0.942
Birth weight (kg) 3.2
(IQR: 3.0 –
3.5)
3.0
(IQR: 2.8 –
3.5)
1.28 (0.87-1.87) 0.200
No. of children 2
(2 – 3)
2.0 (IQR: 1-
2)
1.53 (1.23-1.90) <0.0001*
Prenatal factors
Pregnancy medical complications 13 (8%) 4 (4%) 9.04 (2.08-39.14) 0.003*
Pregnancy infections 23 (14%) 4 (4%) 4.44 (1.49-13.21) 0.007*
Medication use during pregnancy 48 (29%) 20 (17%) 1.92 (1.06-3.45) 0.029*
Gestational term ≤ 37 weeksd
10 (6%) 0 (0%)
7.27 (0.91-57.65) 0.060
Perinatal factors
Assisted delivery 6 (4%) 2 (2%) 2.11 (0.41-10.64) 0.365
Labour complications 20 (12%) 2 (2%) 7.70 (1.76-33.63) 0.007*
Birth complications 23 (14%) 2 (2%)
9.04 (2.08-39.14) 0.003*
Adverse perinatal events 59 (35%) 2 (2%) 30.85 (7.35-129.37) <0.0001*
Neonatal factors
Low birth weight (≤ 2.5 kg) 23 (14%) 17 (15%) 0.92 (0.46-1.81) 0.818
Neonatal jaundiced 15 (9%) 0 (0%)
11.27 (1.46-86.59) 0.020
*
Neonatal seizures immediately after
birthd
13 (8%) 0 (0%)
9.64 (1.24-74.28) 0.030*
Postnatal factors
Family history of seizures 18 (11%) 9 (8%) 1.42 (0.61-3.29) 0.406
Seizures disordersd 30 (18%) 0 (0%)
25.00 (3.35-186.14) 0.002
*
Malaria (before age 3) 36 (21%) 5 (4%) 6.05 (2.29-15.95) <0.0001*
Head injury with loss of
consciousness (before age 3)d
20 (12%) 0 (0%) 15.54 (2.05-117.51) <0.0001*
Note.ASD = Autism Spectrum Disorder (ASD); NDD = Neurodevelopmental Disorders; TD = Typically Developing; CI = Confidence
Interval; IQR = Interquartile Range; SD = Standard Deviation. Means and standard deviations (SD) are provided for continuous variables
with a normal or near normal distribution, while medians and interquartile ranges (IQR) are provided for continuous or count variables
without a normal distribution.
aThere is no departure from trend (likelihood ratio test LRT p > 0.05) so the ordered levels rather than the individual categories are reported;
bThere is departure from trend (LRT p value < 0.05) so the individual categories are reported; cGenerated by subtracting mother‘s age from
the father‘s age. dThe zero count is assumed as 1 to allow computation of odds ratios with exact confidence intervals. All other odds ratios
were computed with logistic regression.
*p < 0.05

131
Multivariable analysis of ASD+NDD vs. TD groups
The most significant risk factors reaching a p-value of ≤ 0.25 in the univariable analysis were selected
for the multivariable model as specified in table 6.10. After adjusting for parental and socio-
demographic data, 17 variables were included in the multivariable model.
Child‘s male sex had a significant association with ASD+NDD (OR: 6.87 [95% CI: 1.31, 36.15], p =
0.023). None of the parental, prenatal and neonatal factors were significantly associated with
ASD+NDD. Birth complications (OR: 22.87 [95% CI: 1.14, 457.86], p = 0.041) and adverse perinatal
events (OR: 206.96 [95% CI: 20.47, 2.10x10³], p < 0.0001) were the only perinatal factors reaching
significance. Seizures disorders (OR: 64.94 [95% CI: 2.29, 1.84x10³], p = 0.014), malaria before the
age of 3 years (OR: 12.94 [95% CI: 1.74, 96.44], p = 0.013) and head injury with loss of
consciousness before the age of 3 years (OR: 78.06 [95% CI: 3.75, 1.62x10³], p = 0.005) were the
postnatal factors reaching significance.
Table 6.10 - Multivariable analysis of relevant parental, perinatal and neonatal factors
associated with ASD compared to typically developing children adjusted for parental socio-
demographic and economic status.
Risk factor variables ASD+NDD
(n = 168)
TD
(n = 116)
Odds ratio
(95% CI)
p-value
Child’s male sex 85 (79%) 66 (57%) 6.87 (1.31 – 36.15) 0.023*
Parental factors
Parental age gap in years 3.50
(IQR: -0.01 –
9.26)
1.85
(IQR: -1.69 –
9.82)
1.67 (0.00 –
1.38x10⁵)
0.929
Father is older than Mother 146 (87%) 90 (78%) 1.67 (0.21 – 13.41) 0.632
Birth weight (kg) 3.2
(IQR: 3.0 – 3.6)
3.0
(IQR: 2.8 – 3.5)
1.04 (0.36 – 2.97) 0.946
No. of children 2.0 (IQR: 2 – 3) 2.0 (IQR: 1- 2) 1.15 (0.62 – 2.16) 0.656
Prenatal factors
Pregnancy medical
complications
13 (8%) 4 (4%) 0.10 (0.01 – 1.90) 0.125
Pregnancy infections 23(14%) 4 (4%) 1.63 (0.05 – 54.18) 0.785
Medication use during
pregnancy
48 (29%) 20 (17%) 0.94 (0.18 – 5.03) 0.943
Gestational term ≤ 37 weeks 10 (6%) 0 (0%)
0.42 (0.01 – 12.42) 0.616
Perinatal factors
Labour complications 20 (12%) 2 (2%) 13.73 (0.23 – 818.58) 0.209
Birth complications 23 (14%) 2 (2%)
22.87 (1.14 – 457.86) 0.041*

132
Adverse perinatal events 59 (35%) 2 (2%) 206.96 (20.47 –
2.10x10³)
0.000*
Neonatal factors
Neonatal jaundice 15 (9%) 0 (0%)
15.68 (0.85 – 288.94) 0.064
Neonatal seizures
immediately after birth
13 (8%) 0 (0%)
12.67 (0.29 – 548.27) 0.186
Postnatal factors
Seizures disorders 30 (18%) 0 (0%)
64.94 (2.29 –
1.84x10³)
0.014*
Malaria (before age 3 years) 36 (21%) 5 (4%) 12.94 (1.74 – 96.44) 0.013*
Head injury with loss of
consciousness (before age 3
years)
20 (12%) 0 (0%) 78.06
(3.75 – 1.62x10³)
0.005*
Note. ASD = Autism Spectrum Disorder; NDD = Neurodevelopmental Disorders; TD = Typically Developing; CI = Confidence Interval;
IQR = Interquartile Range. In the multivariable analysis only variables that reached a p value cut-off of ≤ 0.25in the Univariable analysis
and were not in multicollineality with each other were included.
*p < 0.05
6.4. Discussion
To our knowledge, this is the first case-control study to comprehensively investigate risk factors for
ASD in Tanzania, comparing ASD with TD and NDD groups. Our findings show that a number of
risk factors are associated with ASD, in particular, socio-demographic, prenatal, perinatal, neonatal
and postnatal factors. These factors are different to those associated with other NDDs. These findings
indicate that some risk factors are unique to ASD, but many are shared between these disorders. The
findings from the current study are summarized below according to ASD vs. TD and ASD vs. NDD.
These comparisons are also discussed in the context of other additional comparisons with NDD vs.
TD and combined ASD+NDD vs. TD analysis.
6.4.1. ASD vs. TD summary of findings
In the present study, socio-demographic factors such as the child‘s male sex were positively
associated with an increased risk of ASD when compared to TD groups. Our results are consistent
with the theory that ASD affects males four times more than females (Fombonne, 2005) as several
theories have suggested the involvement of the sex chromosome in the aetiology of ASD, and the role
of hormonal influences in utero (Baron-Cohen et al., 2011). These sex differences in the risk of ASD
are also dependent on phenotypic diversity in brain structure, whereby risk for ASD is greatest with
relatively thinner cerebral cortex, the typical neuroanatomical brain phenotype for males compared to
females (Ecker et al., 2017). Given that children with ASD were recruited from care centres, it may be
helpful to rule out admission bias for male children, through future qualitative studies, since this trend
133
was also observed in previous studies of neurological disorders in rural parts of Africa (Kariuki et al.,
2015).
This study showed that advanced parental age at delivery was associated with an increased risk of
ASD. There is an inconsistent association of advanced parental age with ASD reported from several
studies. However, in a recent meta-analysis of 27 studies, Wu et al (2017) found that every 10-year
increase in maternal and paternal age increases the risk of ASD in the offspring by 18 and 21%
respectively. Furthermore, the oldest age category (in both mothers and fathers) was associated with a
small but significant increase in risk of ASD in the offspring. However, I found an association of ASD
with mother‘s age at first birth but not father's age at delivery, in the multivariable model. This could
mean mother's age at birth has more impact on development of ASD than father's age at delivery in
this setting. This hypothesis can be examined by examining the risk of ASD at different age quartiles
for the fathers, but this sample was too small to run this sensitivity analysis. Additionally, these
findings of a significant increase in ASD risk with increasing parental age gap, albeit the association
did not reach multivariable statistical significance, is consistent with a recent population-based cohort
study suggesting an association with increasing difference in age between parents and ASD risk
(Sandin et al., 2016). Genetic factors are thought to determine the association between parental age
and risk for ASD, in particular de novo mutation for advanced father's age and chromosomal changes
and/or epigenetic modifications for mother's advanced age (Sandin et al., 2016).
The findings indicate an increased risk of ASD associated with adverse perinatal events. The evidence
of the association perinatal factors and risk of ASD in the literature is mixed and warrants more
research (Ng et al, 2017). Among the perinatal factors investigated in this study, labor complications,
birth complications and adverse perinatal events were found to be strongly associated with ASD than
the TD group, even in the multivariable analysis. Previous studies have reported significant
associations of prenatal risk factors such as gestational hypertension and maternal bleeding with ASD
(e.g. Gardener et al., 2009; Gardener et al, 2011). Perinatal factors have also been highlighted in a
recent review of neurodevelopmental disorders, including ASD (Bitta et al., 2017). Given that this
risk factors has been consistently identified in epidemiological studies of neurological disorders such
as epilepsy (Ngugi et al., 2013) and mental health problems (Kariuki et al., 2017a) underlines its
importance in neurodevelopment.
Obstetric complications are plausibly associated with an increased risk for ASD as the prenatal period
is found to be critical for fetal brain development. The most common type of perinatal damage is
hypoxic-ischaemic encephalopathy, which can be detected early on electroencephalography and
neuroimaging (Hagberg eta l., 2016) although these investigative resources are very limited in
LAMIC. Infection during the pregnancy can have a detrimental effect on the development of the

134
foetal immune system, but infections during pregnancy did not reach multivariable significance in this
study probably because this information could not be recalled reliably by the mothers. Pre-term birth
(< 37 weeks) was another prenatal factor strongly associated with an increased risk for ASD in the
univariable but not multivariable analysis. Pre-term births are common in LAMIC and may increase
risk for ASD according to a recent scoping review (Ng, 2017). The lack of independent association of
preterm birth with ASD in our study may be due to challenges of reporting of conception dates by the
mothers, most of who do not attend antenatal clinics.
Postnatal factors such as seizures disorders, malaria before the age of 3 years and head injury with
loss of consciousness before the age of 3 years were all found to be significantly associated with
ASD. Of the risk factors investigated in this study, malaria before the age of three was associated with
the highest independent risk of ASD in the multivariable analysis, being frequently more common
among the ASD group (31%) than the TD group (4%). A recent study in Nigeria observed that
children between the ages of 2 - 5 years had the highest prevalence of Plasmodium infections
compared with the other age groups (Nmadu et al., 2015). Malaria especially when presenting with
impaired consciousness and seizures is known to cause brain damage. Malaria can sequester into the
brain capillaries causing diffuse brain damage, but electroencephalogram (EEG) recordings showed
that the damage is more prominent in the posterior-temporal regions of the brain that are supplied by
middle and posterior cerebral arteries (Kariuki et al., 2017b). Features similar to those of impaired
communication in ASD, in particular speech and language impairment, were documented in Kenyan
children previously treated for severe malaria in hospital (Carter et al., 2006). The strong significant
association of ASD with malaria may have attenuated the independent association of seizures with
ASD in the multivariable analysis, since most seizures in parasitaemic children are attributable to
malaria (Kariuki et al., 2011). There, however, have been no single cohort studies examining all
endophenotypes of ASD following severe malaria in Africa. Only a previous case series study
conducted in Dar-es-Salaam, Tanzania where authors were able to confirm 3 out of 14 children
diagnosed with ASD developed ASD following severe infections including malaria (Mankoski et al.,
2006) , but these numbers were small and there were no comparison controls. Given the enormous
burden of severe malaria with neurological involvement in many rural parts of Africa (Idro et al.,
2007), studies on ASD following severe are urgently needed to inform preventative strategies.
Other neonatal factors such as neonatal jaundice were identified in the univariate analysis, but not in
the multivariate analysis. Elevated serum bilirubin levels can be toxic to the developing central
nervous system (Maimburg & Vaeth, 2006; Zhang et al., 2010). It is possible that the impact of
neonatal factors on neurodevelopmental disorders, including ASD, is only apparent on long-term
follow-ups (Mwaniki et al., 2012), and this should be examined in prospective cohort studies.

135
6.4.2. ASD vs. NDD summary of findings
Comparing children with ASD with those with other NDD enabled us to examine if there are unique
risk factors for ASD. Although several factors reached significance in the univariable analysis, only
fathers being older than mother and malaria under 3 years remained significant in the multivariable
analysis. This is important in targeted control for unique factors for ASD in these poor settings in
Africa. The finding that a father being older than mother is a risk factor for ASD is not surprising as it
has consistently been documented in the literature. It is thought the consistency is due to long-term
potential for fathering children even in advanced age, especially in settings where polygamy is
allowed. Therefore, the role of a father‘s age on ASD may be mediated through spontaneous
mutations. Perhaps fathers can be educated about the importance of having children early as a way of
preventing ASD in their offspring, although the success of such interventions in largely patriarchal
societies remains to be seen.
Malaria before the age of 3 years and father being older than mother were independent risk factors
unique to ASD when comparing ASD and NDD groups, suggesting that control of these postnatal risk
factor may specifically reduce the burden of ASD. As suggested above, follow-up studies of malaria
as a risk factor for ASD should be urgently set-up in endemic area, to quantify the burden of ASD
attributable to severe malaria. These studies should follow-up different phenotypes of severe malaria
(e.g. impaired consciousness, malarial seizures, malarial prostration and malarial anemia) to
understand the underlying mechanisms for development of ASD.
It is important to note that the lack of significance in the ASD vs. NDD analysis for factors that were
significant in the ASD vs. TD analysis e.g. adverse perinatal events is of public health importance as
it may suggest that these risk factors are shared between ASD and other NDD. This hypothesis was
supported by identification of adverse perinatal events as independent risk factors for NDD when
compared to TD; similar risk factors were found for ASD when compared to TD. Epidemiological
studies have so far shown that this supposition is true when adverse perinatal events are associated
with both neurological disorders and mental health problems. Hypothetically, control of such risk
factors would not only reduce the burden of ASD but also that for other NDD. The later analysis of
NDD vs. TD also helped identify risk factors such as seizure disorders, head injury and number of
children that may be more important to other NDD than to ASD, although few observations may
explain the differences in associations. These factors identified in NDD vs. TD but not in ASD vs. TD
(e.g. seizures and head injury) cause direct brain damage, suggesting that symptomatic causes are
more important causes of other NDD than they are for ASD, which are highly determined by genetic
factors. Combining other NDD with ASD and comparing with TD improved the power for detecting
risk factors such as seizure disorders and head injury which may have role in ASD, but did not reach
significance in the ASD vs. TD comparison because of small observation for each group. It is

136
important to note that the large confidence intervals (CI) in our results may mean that there were few
observations in some groups.
6.4.3. Strengths and limitations
Strengths
Our study has several strengths. Firstly, to the best of my knowledge, this is the first study to attempt
to study the biologically plausible risk factors for ASD in SSA. The ASD screening (Social
Communication Questionnaire – SCQ) tool was standardized and underwent adaptation and validation
to the local population before its application in this study. Furthermore, all children were directly
observed for their behaviour and language using the Autism Diagnostic Observation Schedule
(ADOS) which aided in the clinical confirmation of the child‘s diagnosis. The inclusion of the NDD
group made the study more robust, allowing us to identify risk factors unique to ASD. A large number
of risk factors were investigated which were pragmatically selected by a thorough search of the
literature, and included risk factors that have biological plausibility with regard to the association with
ASD and NDD. A robust statistical analysis approach was used (including testing for departure from
linear trend for ordinal variables and examining goodness of fit of the models) and we accounted for
potential confounders in the multivariable model. Findings from this analysis may not be
representative of other areas in Tanzania, especially rural areas, where participants were not drawn.
Limitations
There are several potential limitations in our study. Recall and reporting bias of retrospective self-
reporting answers by parents/caregivers might have occurred, resulting in insignificant associations
for some factors. This was not a community based study and therefore children with ASD and NDD
recruited from care centres may not be representative of the general population. It is possible that we
may have missed out on some children who may not have attended the facilities we approached in our
method of identification of the study participants. Children living in urban areas have more access to
these special schools and facilities and thus parents in rural areas were not included in this study.
Furthermore, poorer and less literate parents in urban areas may not bring their children to these
schools. Our sample size was relatively small; a larger sample size might have yielded more power to
detect more significant associations. The TD group were matched by level of expressive language and
this may have caused age selection bias. These differences were inevitable because delayed diagnosis
and lack of expressive language is common in ASD, which would result in older children seeking
care. However, the inclusion of the NDD comparison may have helped to deal with this limitation
since the NDD children were slightly older than the ASD children. It is, however, important to note
that the NDD group comprised of heterogeneous conditions. This is especially relevant since
conditions such as Down‘s syndrome has a distinct genetic aetiology that is not shared with the
parents, while ADHD and learning disability are often idiopathic and likely influenced by common
137
genetic factors and by a range of possible environmental factors. Residual confounding due to other
unmeasured characteristics cannot be ruled out. It is important to note, that the majority of ASD
children in this study had comorbidity with intellectual disability, and it may be that ASD with and
without intellectual disability may have different risk factors, but the small sample size could not
allow this sensitivity analysis. Neurobiological factors that might explain the heterogeneity of ASD
such as differences in risk between males and females, differences between subtypes, and relation of
symptom severity to risk factors were not investigated. Biomarkers of ASD, in particular
electrophysiology (e.g. Bosl et al., 2017) and neuroimaging (e.g. Ecker et al., 2015), were not
investigated.
6.4.4. Conclusions
In conclusion, this study identified postnatal malaria (before age 3 years) and father being older than
mother as a significant independent risk factor unique to ASD. Other factors such as seizures
disorders and head injury were more important to other NDD that were not ASD. Our results
underscore the importance of ASD research and its association with malaria in SSA populations since
in this region infectious diseases like malaria which are associated with central nervous system
complications (Carter et al., 2003) continue to be a major public health concern. Further studies are
needed to understand the mechanisms for associations between communicable and non-
communicable diseases such as malaria and NDD, and between genetic and environmental factors
specifically associated with ASD. Furthermore, future studies need to examine if advanced age in
fathers is associated with spontaneous mutations for ASD in the offspring. The study also shows that
some risk factors in particular adverse perinatal events are shared between ASD and other NDD.
Interventions to control such risk factors would not only reduce the burden of ASD, but also that for
other NDD.

138
Chapter 7
Assessing the Broader Autism Phenotype (BAP): Cross-cultural validation of the
Kiswahili Autism Spectrum Quotient (AQ) in a Tanzanian parent sample.
7.1. Background
Despite ASD‘s significant heritability (Bailey et al., 1995; Freitag et al., 2010; Hallmayer et al., 2011;
Tick et al., 2015), the search for the underlying genes has proved to be challenging, raising questions
on the underlying genetic mechanisms of ASD (Abrahams & Geschwind, 2008). Recent evidence
suggests that sub-threshold autistic traits are continuously distributed across the general population
(Constantino & Todd, 2003; Plomin et al., 2009; Ruzich et al., 2015). Several researchers have
reviewed substantial evidence indicating that first-degree relatives of autistic individuals often display
milder forms of autistic traits referred to as the Broader Autism Phenotype (BAP) (Ruparelia et al.,
2017; Cruz et al., 2013; Gerdts & Bernier et al., 2011; Sucksmith et al., 2011). This constellation of
sub-threshold autistic traits includes a set of behavioural and cognitive characteristics that reflect the
phenotypic expression that is qualitatively similar in unaffected relatives of autistic individuals.
Various instruments have been developed to assess the BAP in adults. These include self-report
and/or informant questionnaires, semi-structured interviews and interviews combined with direct
observation/assessment. One of the most widely used quantitative measures of autistic traits is the
Autism Spectrum Quotient (AQ) developed by Baron-Cohen et al (2001), and its scoring follows a
continuous quantitative approach. The AQ is a brief self-administered, forced-choice questionnaire
that has been used extensively to measure autistic traits in adults (≥16 years) with normal intelligence
in the general population, as well as in clinical samples. It is also used in relatives of individuals with
a diagnosis of ASD to measure the BAP.
The AQ consists of 50 items about ability and preference. It has five subscales of 10 items each:
Social Skills, Communication, Attention Switching, Attention to Details and Imagination. Individuals
are instructed to respond to each item using a ‗definitely agree‘, ‗slightly agree‘, ‗slightly disagree‘
and ‗definitely disagree‘ scale. Using a binary system, responses for items endorsing an autistic trait
are scored as +1, while the opposite responses are scored as a 0, summing to a maximum score of 50.
Some researchers have used an alternative scoring system using a 4-point Likert scale (Hoekstra et al.,
2008; Austin, 2005), whereby the highest score is 200 and lowest 50. To avoid a response bias, all
items on the AQ are counterbalanced so that half of the ‗agree‘ responses and half of the ‗disagree‘
responses are scored as an autistic trait.

139
In the first validation study of the AQ using (i) adult males and females with Asperger Syndrome
(AS) and high functioning autism (HFA); (ii) scientists versus non-scientists in Cambridge University
students; (iii) winners of the UK Mathematics Olympiad and (iv) control adults, Baron-Cohen et al.
(2001) found that the total AQ score and its five subscale scores are normally distributed and have
demonstrated good test-retest reliability, good internal consistency and high sensitivity and
specificity. Additionally, they report sex differences in the mean total AQ score with males scoring
higher than females.
The AQ has since been adapted and validated in other languages and cultural contexts using clinical
and non-clinical samples (Japan - Wakabayashi et al., 2006; Austria - Voracek & Dressler, 2006;
Netherlands - Hoekstra et al., 2008; Scotland - Stewart & Austin, 2009; French-Canadian sample -
Lepage et al., 2009; Australia - Broadbent et al., 2013; Poland - Pisula et al., 2013). Freeth et al.
(2013) conducted a cross-cultural comparison of the expression of autistic traits in Western and
Eastern cultures. They used the original English AQ in the UK, India and Malaysia and found
behaviours associated with autistic traits were reported to a greater extent in the Eastern cultures than
the Western culture. Additionally, some researchers have sought to conduct cross-cultural validation
of the AQ to identify the BAP in parents of children with ASD (e.g. French - Rousselot-Pailley et al.
2011; Italian - Ruta et al., 2012; Persian - Mohammadi et al., 2012). However, these studies initially
assessed the psychometric properties of the AQ using a general population sample, before the
application of the tool in parents of children with ASD. To date, only two studies have investigated
the psychometric properties of AQ using parent samples of children with ASD, to derive a
standardized quantitative measure to define the BAP. Table 7.1 illustrates a review of the two AQ
cross-cultural validation studies using parent samples.
Lau et al. (2013) examined the psychometric properties of the Chinese version of the AQ using a large
sample of parents of children with ASD and parents of typically developing children in Taiwan. After
performing factor analysis, the authors reported a 35 item 5-factor model (Socialness, Mindreading,
Patterns, Attention to Details and Attention Switching) with acceptable fit indices. They reported fair
internal consistency and test-retest reliability (Table 7.1). Findings from a large study investigating
the psychometric properties of the Mandarin version of the AQ for Mainland China (Zhang et al.,
2016) in a sample of parents of children with ASD and parents of typically developing children
revealed acceptable test-retest reliability and internal consistency (Table 7.1).
Parental BAP tools may be useful in analysing or understanding sources of variability in ASD
etiology and for informing the development of parent-mediated ASD interventions such as those
aimed at improving a child‘s disruptive behaviours and communication. A recent systematic review of

140
BAP in parents of children with ASD reported a prevalence of BAP that ranged from 2.6% to 80%
(using different measures), being more prevalent in fathers than mothers (Rubenstein & Chawla,
2018).
In summary, the AQ is a widely accepted and reliable measure of BAP in parents of children with
ASD. Furthermore, cross-cultural findings indicate that patterns are stable and possibly independent
of cultural influences. To date, no studies have been conducted in SSA on the validity of the AQ. This
study aims to build on existing cross-cultural research assessing the validity of the Kiswahili version
of the AQ and examining the distribution of scores in a sample of parents of children with a
confirmed diagnosis of ASD, parents of children with a known NDD and parents of typically
developing children in the Tanzanian population.

141
Table 7.1 - Review of AQ cross-cultural validation studies using parent samples.
Country
(Language)
Study
Sample
Factor Analysis Internal consistency
(Cronbach’s α)
Test retest
Reliability No. of items No. of
factors
Fit
indices
Taiwan
(Chinese)
Lau et al.
(2013)
1208 ASD
2984 TD
35 5 a 0.54
b
0.969 c
0.84 de
0.54 - 0.88 df
0.65 deg
0.40 - 0.72 def
China
(Mandarin)
Zhang et al.
(2016)
1037 ASD (522Mo / 515Fa)
1040 TD (515Mo / 525Fa)
32 ASD* (6F / 26M)
37 SCH* (7F / 30M)
38 OCD* (7F / 31M)
38 HC* (8F / 30M)
NA NA NA 0.817 eh
0.622 - 0.765 fh
0.806 ei
0.619 - 0.760 fi
0.79 ehj
0.42 - 0.75 fhj
0.89 eij
0.62 - 0.85 fij
Note: ASD = Autism Spectrum Disorder; TD = Typically Developing; HC = Healthy Controls; SCH = Schizophrenia; OCD = Obsessive Compulsive Disorder; Mo = Mother; Fa = Father; F = Female; M = Male; NA =
Not Available.
*Not a parent sample.
aConfirmatory Factor Analysis (CFA) – modification of original subscales as per their 5 factor Principal Component Analysis (PCA); bRoot Mean Square Error of Approximation (RMSEA); cComparative Fit Index
(CFI); dWhole sample; eTotal score; fSubscale range; gIntraclass Correlation Coefficient (ICC); hASD parent group; ITD parent group; jPearson‘s Correlation Coefficient (r).
142
7.2. Methodology
This case-control study was approved by Muhimbili University of Health and Allied Sciences
(MUHAS) Directorate of Research and Publications, National Institute for Medical Research (NIMR)
and registered with the Tanzania Commission for Science and Technology (COSTECH). All parents
gave verbal and written consent.
7.2.1. Study sample
Three groups of parents were recruited for this study. Parents of children who had a diagnosis of ASD
(n = 103) were recruited from the Child and Adolescent Clinic, Department of Psychiatry, Muhimbili
National Hospital (MNH), private clinics and centres, ASD units attached to local primary schools in
Dar-es-Salaam Tanzania. At least one biological parent had to be available for the study. Parents of
children with other neurodevelopmental disorders which included, Down‘s Syndrome (n = 9),
Learning Disability (n = 32), Seizure Disorders (n = 6) and ADHD (n = 10) (NDD n = 57) were
recruited from MNH and special needs schools in Dar-es-Salaam, Tanzania. Parents of typically
developing (TD) children (n = 107) were randomly selected from the community. I was fully involved
with the recruitment of participants and collected all the data for this study with assistance from the
fieldworker where Kiswahili was required. I directly administered the AQ. I trained, supervised and
oversaw any assistance from the fieldworker.
7.2.2. BAP measure
Autism Spectrum Quotient - Adult (AQ – Baron-Cohen et al., 2001): This is a self-report
questionnaire used as a measure of the extent of autistic traits in adults. Participants rate to what
extent they agree or disagree on statements on a 4-point Likert scale. In its initial validation with
English speaking samples in the UK, it was observed to be relatively quick and easy to use and
produces a near normal distribution in the general population (Baron-Cohen et al., 2001). The AQ has
been used extensively and has been shown to have consistent results across cultures (Dutch AQ:
Hoekstra et al., 2008; Japanese AQ: Wakabayashi et al., 2006), and the AQ score has been reported to
be a good predictor of clinical diagnosis (Woodbury-Smith et al., 2005). Wheelwright et al (2010)
used the AQ to define the broader, medium and narrow autism phenotype (subsequently abbreviated
as BAP, MAP and NAP, respectively).
As in previous AQ studies (Lau et al., 2013; Hoekstra et al., 2008; Austin, 2005), this study also
employed a scoring method with an ordinal scale (4-point Likert scale ranging from 1 to 4 for items
portraying autistic features, and inverted for the reversed items) instead of the original dichotomous
scale. This was done in order to obtain a better approximate of continuous distribution and to provide
more information for procedures such as factor analysis (Swygert et al., 2001; Gorsuch, 1983). The
143
same scoring protocol was subsequently applied when performing group comparisons (except item
positive response frequency distribution, where the original scoring protocol was used).
7.2.3. Translation of the AQ
Permission was sought from the Autism Research Centre (ARC) at the University of Cambridge to
translate the AQ into Kiswahili. The AQ was then translated in Tanzanian Kiswahili by a linguistic
specialist at MUHAS, and back-translated into English by another linguistic specialist at MUHAS.
The back-translated version was reviewed by a clinical psychologist from the Department of
Psychiatry, Muhimbili National Hospital (MNH), who recommended minor modifications. This
iterative process continued until the team was satisfied that the Kiswahili version retained the original
meaning (Appendix 8). We attempted to adapt the AQ, without significant modifications in terms of
item content. We made some attempts to use local terms for item 13 and 24 for instance, which refer
to library, party, theatre and museum. However, it is possible that some parents may not have had
access to or experiences of these places/activities and would not be able to relate to items about them.
Nonetheless, care was taken to ensure semantic equivalence of the translated items. The tool was
informally piloted with parents for feedback on whether they understood the questions, wording
appropriately in case meanings were ambiguous or unclear.
7.2.4. Procedures
Parents were informed of the objectives of the study. After obtaining consent, parents of participating
children in our other study were asked to complete the AQ. Of the 267 respondents, 50 were selected
using a fixed interval sample method. Of these, 35 (70%) completed the AQ after at least 2 weeks to
examine the test-retest reliability.
7.2.5. Statistical analysis
Data analysis was done using IBM SPSS version 20 and R version 3.0.2. Descriptive statistics were
computed and the distribution of scores per group explored. To evaluate discriminant validity,
differences in scores between all parents, mothers and fathers for each group were tested using Mann
Whitney U-tests. Between and within group differences across the 3 groups (ASD, TD and NDD)
were tested using the non-parametric Kruskal Wallis test since the data was not normally distributed.
A p-value of ≤0.05 was considered statistically significant. The internal consistency of the SCQ was
calculated using Cronbach's coefficient alpha (α) (Cronbach, 1951). An interclass correlation
coefficient (ICC) and Spearman‘s correlation coefficient were used to evaluate the test–retest
reliability. Confirmatory factor analysis (CFA) with diagonally weighted least squares was performed
to determine a 5 factor model of the AQ. If the items did not follow specified factorial structures in
the literature an exploratory Principle Components Analysis (PCA) was performed using varimax
rotation. The cut-off for standardized coefficient loadings was set at 0.30. Wheelwright et al.‘s (2010)
144
proposed definition of the BAP (AQ total scores of ≥1SDs above the mean), MAP (AQ total scores of
≥2 SDs above the mean) and NAP (AQ total scores ≥ 3 SDs above the mean) was used in order to
determine the proportion of parents with each phenotype.
7.3. Results
7.3.1. General sample description
AQ data was collected from 103 parents of children diagnosed with ASD, 107 parents of typically
developing children and 57 parents of children with other neurodevelopmental disorders (NDD).
Mothers formed 70% of the ASD group, 77% of the TD group and 79% of the NDD group with no
significant differences between the ASD and TD parent groups (p = 0.270) and the ASD and NDD
parent groups (p = 0.217) . The median age of the child was significantly different between ASD and
TD groups (7.0 vs. 2.8; p < 0.0001), because the TD group was matched on expressive language level.
There was also a significant difference between the child‘s median age between ASD and NDD
groups (7.0 vs. 9.9; p < 0.0001). Child‘s male sex was significantly higher in the ASD group than in
the TD group (78% vs. 58%; p = 0.001). The median age of the mother was significantly different
between ASD and TD parents groups (36.5 vs. 31.0; p < 0.0001) as well as ASD and NDD parent
groups (36.5 vs. 38.9; p < 0.0001). However, in the father‘s age there was only a significant difference
between the ASD and TD parent groups (40.8 vs. 33.8; p < 0.0001). Table 7.2 compares the
distribution of participant characteristics between ASD and TD parent groups and ASD and NDD
parent groups.

145
Table 7.2 - Distribution of participant baseline characteristics between ASD, NDD and TD
groups enrolled in this study.
Participant
characteristics
ASD
(n = 103)
TD
(n = 107)
NDD
(n = 57)
ASD vs. TD
p-value
ASD vs. NDD
p-value
Child age in years:
Median (IQR)
7.0
(5.8 – 9.0)
2.8
(2.6 – 3.1)
9.9
(8.1 – 10.8)
< 0.0001*a
< 0.0001*a
Child male sex 80 (78%) 62 (58%) 37 (65%) 0.001*b
0.061b
Mother’s age in
years:
Mean (SD)
36.5
(4.80)
31.0
(7.07)
38.9
(6.85)
< 0.0001*c
0.007*c
Father’s age in years:
Mean (SD)
40.8
(5.86)
33.8
(6.55)
42.5
(7.51)
< 0.0001*c
0.491c
Gender of parents
Mothers
Fathers
72 (70%)
31 (30%)
82 (77%)
25 (23%)
45 (79%)
12 (21%)
0.270b
0.217b
Note. ASD = Autism Spectrum Disorder; TD = Typically Developing; NDD = Neurodevelopmental Disorders; IQR = Interquartile Range;
SD = Standard Deviation.
aMann Whitney U test; bPearson‘s chi-squared test (dichotomous and categorical variables); ct-test on raw data (continuous variable).
*p < 0.05
7.3.2. Distribution of AQ scores by group
Item positive response frequency
AQ item positive response frequencies for all three groups are given in Table 7.3. The original scoring
protocol was applied for the purpose of reporting item positive response frequencies in this section.
Of the 50 items, 20 items showed significant differences between ASD and TD groups. Of these 20,
19 items were significantly more frequent in the ASD group than in the TD group, while the
remaining one was significantly more frequent in the TD group than the ASD group (item 30: 95.3%
vs. 71.8%; ―I don‘t usually notice small changes in a situation, or a person‘s appearance‖; p <
0.0001). Of the 20 items that were significantly more frequent in the ASD group than the TD group,
items with the highest frequencies include item 12 (78.6% vs. 36.2%; ―I tend to notice details that
others do not‖; p = 0.005) which belongs to the Attention Switching subscale, item 25 (74.8% vs.
57.9%; ―It does not upset me if my daily routine is disturbed‖; p = 0.010) which belongs to the
Attention to Detail subscale and item 7 (64.1% vs. 43.9%; ―Other people frequently tell me that what
I‘ve said is impolite, even though I think it is polite‖; p = 0.003) which belongs to the Communication
subscale.
Of the 50 items, 24 items showed significant differences between ASD and NDD groups. Of these 24,
17 items were significantly more frequent in the ASD group than in the NDD group, while the
remaining 7 were significantly more frequent in the NDD group than the ASD group. These 6 items

146
include items 6 (91.2% vs. 69.9%; ―I usually notice car number plates or similar strings of
information‖; p = 0.002), 9 (77.2% vs. 56.3%; ―I am fascinated by dates‖; p = 0.009), 16 (96.5% vs.
76.7%; ―I tend to have very strong interests which I get upset about if I can‘t pursue‖, p = 0.001), 20
(42.1% vs. 27.2%; ―When I‘m reading a story, I find it difficult to work out the characters‘
intentions‖; p = 0.054), 24 (89.5% vs. 76.7%; ―I would rather go to the theatre than a museum‖; p =
0.0047), 30 (87.7% vs. 71.8%; ―I don‘t usually notice small changes in a situation, or a person‘s
appearance‖; p = 0.021) and 46 (89.5% vs. 72.8%; ―New situations make me anxious‖, p = 0.014). Of
the 17 items that were significantly more frequent in the ASD group than the NDD group, items with
the highest frequencies include item 43 (97.1 % vs. 86%; ―I like to plan any activities I participate in
carefully‖; p = 0.011) which belongs to the Attention Switching subscale, and items 12 (78.6% vs.
56.1%; ―I tend to notice details that others do not‖; p = 0.003) and 49 (56.3% vs. 33.3%; ―I am not
very good at remembering people‘s date of birth‖; p = 0.005) which belong to the Attention to Detail
subscale.
Table 7.3 – Item positive response frequency for ASD vs. TD groups and ASD vs. NDD groups.
AQ ASD
(n = 108)
TD
(n = 116)
NDD
(n = 60)
ASD vs. TD
p – value
ASD vs.
NDD
p – value
1. I prefer to do things with
others rather than on my own.
30
(29.1%)
4
(3.7%)
0 < 0.000*b
< 0.000*b
2. I prefer to do things the same
way over and over again.
31
(30.1%)
24
(22.4%)
8
(14.0%)
0.206a 0.0023
*a
3. If I try to imagine something,
I find it very easy to create a
picture in my mind.
16
(15.5%)
1
(0.9%)
2
(3.5%)
< 0.000*b
0.0020*a
4. I frequently get so strongly
absorbed in one thing that I lose
sight of other things.
43
(41.7%)
29
(27.1 %)
21
(36.8%)
0.025*a
0.544a
5. I often notice small sounds
when others do not.
59
(57.3%)
58
(54.2%)
33
(57.9%)
0.654a 0.940
a
6. I usually notice car number
plates or similar strings of
information.
72
(69.9%)
83
(77.6%)
52
(91.2%)
0.206a 0.002
*a
7. Other people frequently tell
me that what I‘ve said is
impolite, even though I think it
is polite.
66
(64.1%)
47
(43.9%)
39
(68.4%)
0.003*a
0.580a
8. When I‘m reading a story, I 20 13 4 0.148a 0.039
*b

147
can easily imagine what the
characters might look like.
(19.4%) (12.1%) (7.0%)
9. I am fascinated by dates. 58
(56.3%)
63
(58.9%)
44
(77.2%)
0.707a 0.009
*a
10. In a social group, I can
easily keep track of several
different people‘s
conversations.
29
(28.2%)
20
(18.7%)
4
(7.0%)
0.105a 0.002
*b
11. I find social situations easy. 25
(24.3%)
35
(32.7%)
7
(12.3%)
0.176a 0.069
a
12. I tend to notice details that
others do not.
81
(78.6%)
65
(60.7%)
32
(56.1%)
0.005*a 0.003*a
13. I would rather go to a
library than a party.
55
(53.4%)
22
(20.6%)
29
(50.9%)
< 0.0001*a
0.760a
14. I find making up stories
easy.
43
(41.7%)
31
(29.0%)
21
(36.8%)
0.053a 0.544
a
15. I find myself drawn more
strongly to people than to
things.
51
(49.5%)
27
(25.2%)
18
(31.6%)
< 0.0001*a
0.028*a
16. I tend to have very strong
interests which I get upset about
if I can‘t pursue.
79
(76.7%)
93
(86.9%)
55
(96.5%)
0.055a 0.001
*a
17. I enjoy social chit-chat. 26
(25.2%)
13
(12.1%)
3
(5.3%)
0.015*a
0.002*a
18. When I talk, it isn‘t always
easy for others to get a word in
edgeways.
27
(26.2%)
9
(8.4%)
2
(3.5%)
0.001*a
< 0.0001*b
19. I am fascinated by numbers. 46
(44.7%)
59
(55.1%)
24
(42.1%)
0.129a 0.755
a
20. When I‘m reading a story, I
find it difficult to work out the
characters‘ intentions.
28
(27.2%)
27
(25.2%)
24
(42.1%)
0.748a 0.054
*a
21. I don‘t particularly enjoy
reading fiction.
38
(36.9%)
29
(27.1%)
18
(31.6%)
0.128a 0.500
a
22. I find it hard to make new
friends.
50
(48.5%)
12
(11.2%)
18
(31.6%)
< 0.0001*a
0.038*a
23. I notice patterns in things all
the time.
79
(76.7%)
91
(85%)
45
(78.9%)
0.124a 0.744
a
24. I would rather go to the 79 71 51 0.097a 0.047*
a
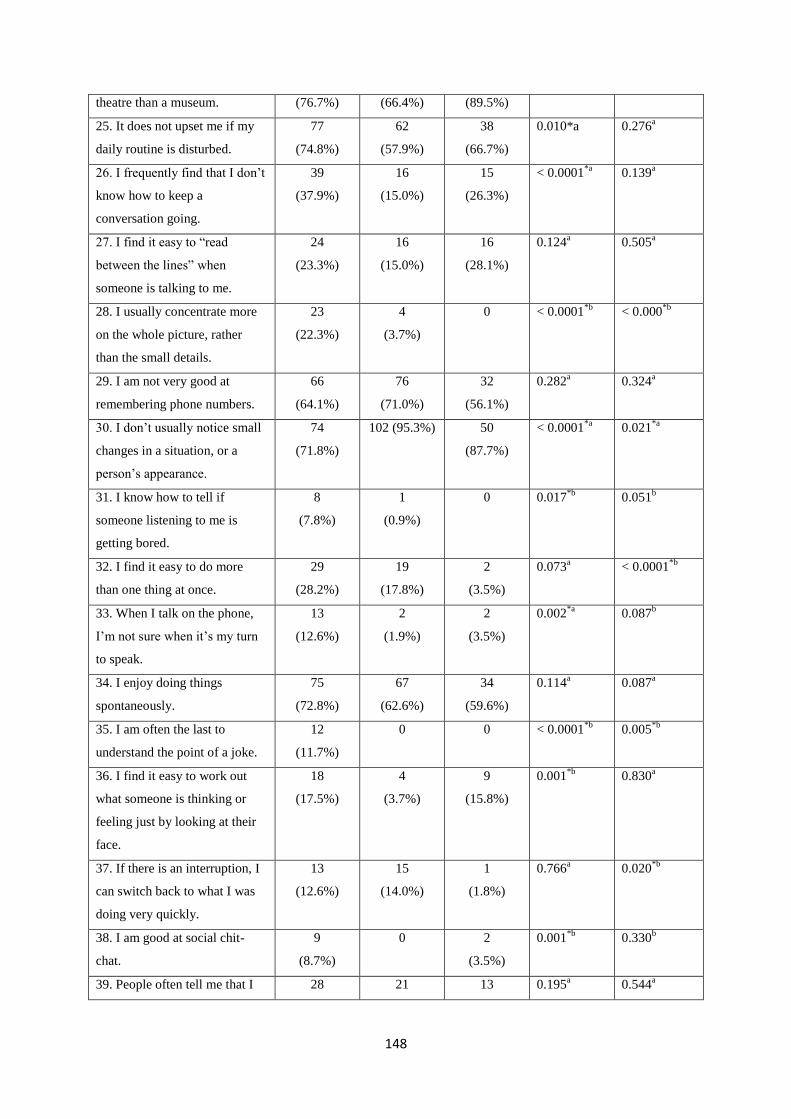
148
theatre than a museum. (76.7%) (66.4%) (89.5%)
25. It does not upset me if my
daily routine is disturbed.
77
(74.8%)
62
(57.9%)
38
(66.7%)
0.010*a 0.276a
26. I frequently find that I don‘t
know how to keep a
conversation going.
39
(37.9%)
16
(15.0%)
15
(26.3%)
< 0.0001*a
0.139a
27. I find it easy to ―read
between the lines‖ when
someone is talking to me.
24
(23.3%)
16
(15.0%)
16
(28.1%)
0.124a 0.505
a
28. I usually concentrate more
on the whole picture, rather
than the small details.
23
(22.3%)
4
(3.7%)
0 < 0.0001*b
< 0.000*b
29. I am not very good at
remembering phone numbers.
66
(64.1%)
76
(71.0%)
32
(56.1%)
0.282a 0.324
a
30. I don‘t usually notice small
changes in a situation, or a
person‘s appearance.
74
(71.8%)
102 (95.3%) 50
(87.7%)
< 0.0001*a
0.021*a
31. I know how to tell if
someone listening to me is
getting bored.
8
(7.8%)
1
(0.9%)
0 0.017*b
0.051b
32. I find it easy to do more
than one thing at once.
29
(28.2%)
19
(17.8%)
2
(3.5%)
0.073a < 0.0001
*b
33. When I talk on the phone,
I‘m not sure when it‘s my turn
to speak.
13
(12.6%)
2
(1.9%)
2
(3.5%)
0.002*a
0.087b
34. I enjoy doing things
spontaneously.
75
(72.8%)
67
(62.6%)
34
(59.6%)
0.114a 0.087
a
35. I am often the last to
understand the point of a joke.
12
(11.7%)
0 0 < 0.0001*b
0.005*b
36. I find it easy to work out
what someone is thinking or
feeling just by looking at their
face.
18
(17.5%)
4
(3.7%)
9
(15.8%)
0.001*b
0.830a
37. If there is an interruption, I
can switch back to what I was
doing very quickly.
13
(12.6%)
15
(14.0%)
1
(1.8%)
0.766a 0.020
*b
38. I am good at social chit-
chat.
9
(8.7%)
0 2
(3.5%)
0.001*b
0.330b
39. People often tell me that I 28 21 13 0.195a 0.544
a

149
keep going on and on about the
same thing.
(27.2%) (19.6%) (22.8%)
40. When I was young, I used
to enjoy playing games
involving pretending with other
children.
10
(9.7%)
0 1
(1.8%)
0.001*b
0.099b
41. I like to collect information
about categories of things (e.g.
types of car, types of bird, types
of train, types of plant, etc.).
67
(65.0%)
82
(76.6%)
31
(54.4%)
0.064a 0.185
a
42. I find it difficult to imagine
what it would be like to be
someone else.
69
(67.0%)
63
(58.9%)
31
(54.4%)
0.224a 0.115
a
43. I like to plan any activities I
participate in carefully.
100
(97.1%)
106
(99.1%)
49
(86.0%)
0.294a 0.011
*a
44. I enjoy social occasions. 19
(18.4%)
7
(6.5%)
8
(14.0%)
0.009*a
0.476a
45. I find it difficult to work out
people‘s intentions.
69
(67.0%)
62
(57.9%)
38
(66.7%)
0.176a 0.967
a
46. New situations make me
anxious.
75
(72.8%)
73
(68.2%)
51
(89.5%)
0.466a 0.014
*a
47. I enjoy meeting new people. 8
(7.8%)
0 0 0.003*b
0.051b
48. I am a good diplomat. 7
(6.8%)
3
(2.8%)
0 0.208b 0.051
b
49. I am not very good at
remembering people‘s date of
birth.
58
(56.3%)
29
(27.1%)
19
(33.3%)
< 0.000*a
0.005*a
50. I find it very easy to play
games with children that
involve pretending.
28
(27.2%)
17
(15.9%)
6
(10.5%)
0.046*a
0.014*a
Note. AQ = Autism Spectrum Quotient; ASD = Autism Spectrum Disorder; TD = Typically Developing; NDD = Neurodevelopmental
Disorders.
aMann Whitney U test; bPearson‘s chi-squared test (dichotomous and categorical variables).
*p < 0.05
Discriminant validity
The AQ median total scores and median scores for all five subscales for all parent groups (combined
parents, mothers and fathers) were compared between ASD and TD parent groups and ASD and NDD
parent groups (Table 7.4). The median AQ total score was significantly higher for all parents from the

150
ASD group compared to the all parents from the TD group (88 (IQR 79 – 99) vs. 77 (IQR 66 – 83);
p< 0.0001) and significantly higher for all parents from the ASD group compared to all parents from
the NDD group (88 (IQR 79 – 99) vs. 76 (IQR 66 – 84); p< 0.0001). A similar trend was found when
comparing all parents and mothers only from the ASD to TD groups and ASD to NDD groups on total
score and all five subscales of the AQ (p< 0.0001). In the ASD versus TD comparisons, the only
significant difference for fathers was for the attention to detail subscale. In the ASD versus NDD
comparisons, there was a significant difference for fathers on the total score and all subscales except
for the imagination subscale. Furthermore, all AQ total scores and subscales differed across the 3
groups (ASD, TD and NDD) for all parents and mothers only. For fathers, significant differences
across the 3 groups were only observed for total score and attention to detail (Table 7.5).

151
Table 7.4 - Discriminant validity for AQ for all parents, mothers and fathers in ASD vs. TD groups and ASD vs. NDD groups for AQ total score and
sub-subscales.
AQ Scores
ASD
(n = 103)
TD
(n = 107)
NDD
(n = 57)
ASD vs. TDa
p-value
ASD vs. NDDa
p-value
All
parents
Mothers
(n = 72)
Fathers
(n = 31)
All
parents
Mothers
(n = 82)
Fathers
(n = 25)
All
parents
Mothers
(n = 45)
Fathers
(n = 12)
All
parents Mothers Fathers
All
parents Mothers Fathers
Total Score:
Median (IQR)
88
(79 - 99)
89
(83 - 100)
81
(72 - 99)
77
(66 - 83)
76
(67 - 82)
80
(66 - 84)
76
(66 - 84)
78
(66 - 84)
70
(65 - 77)
<
0.0001*
<
0.0001*
0.1335 <
0.0001*
<
0.0001*
0.0122*
Social Skills:
Median (IQR)
17
(15 - 20)
17
(16 – 20)
15
(13 - 20)
15
(13 - 18)
15
(13 – 18)
15
(12 - 18)
14
(12 - 18)
15
(12-18)
13
(11 - 15)
<
0.0001*
<
0.0001*
0.5794 <
0.0001*
0.0003* 0.0165*
Attention
switching:
Median (IQR)
18
(15 - 20)
18
(15 – 20)
17
(14 - 19)
15
(13 - 16)
15
(13 – 16)
14
(13 - 17)
15
(13- 17)
15
(12 – 18)
16
(13 - 17)
<
0.0001*
<
0.0001*
0.0632 <
0.0001*
0.0003* 0.0465*
Attention to
detail:
Median (IQR)
17
(14 - 20)
18
(14- 21)
17
(14 - 20)
15
(12 - 17)
15
(12 – 17)
14
(12 - 16)
14
(12 - 17)
15
(13 – 17)
14
(12- 16)
<
0.0001*
<
0.0001*
0.0300* <
0.0001*
0.0008* 0.0486*
Communication:
Median (IQR)
18
(15 - 21)
18
(17- 22)
16
(14 - 20)
15
(13 - 17)
14
(13 – 16)
15
(13 - 18)
15
(13 - 17)
15
(13 – 17)
14
(13 - 16)
<
0.0001*
<
0.0001*
0.172 <
0.0001*
<
0.0001*
0.0336*
Imagination:
Median (IQR)
18
(15 - 21)
18
(16 – 21)
16
(15 - 19)
15
(13 - 18)
15
(13 – 18)
16
(15 - 17)
15
(13 - 18)
15
(13 – 18)
15
(13 - 18)
<
0.0001*
<
0.0001*
0.3237 <
0.0001*
<
0.0001*
0.1781
Note. AQ = Autism Spectrum Quotient; ASD = Autism Spectrum Disorder; TD = Typically Developing; NDD = Neurodevelopmental Disorders; IQR = Interquartile Range.
aMann Whitney U test as continuous variable and non-parametric despite log-transforming it.
*p < 0.05

152
Table 7.5 - Discriminant validity for AQ for all parents, mothers and fathers across all groups (ASD, TD and NDD) for AQ total score and sub-
subscales.
AQ Scores
ASD
(n = 103)
TD
(n = 107)
NDD
(n = 57)
Group differences
(ASD, TD & NDD)a
p-value
All
parents
Mothers
(n = 72)
Fathers
(n = 31)
All
parents
Mothers
(n = 82)
Fathers
(n = 25)
All
parents
Mothers
(n = 45)
Fathers
(n = 12)
All
parents Mothers Fathers
Total Score:
Median (IQR)
88
(79 - 99)
89
(83 - 100)
81
(72 - 99)
77
(66 - 83)
76
(67 - 82)
80
(66 - 84)
76
(66 - 84)
78
(66 - 84)
70
(65 - 77)
<
0.0001*
<
0.0001*
0.032*
Social Skills:
Median (IQR)
17
(15 - 20)
17
(16 – 20)
15
(13 - 20)
15
(13 - 18)
15
(13 – 18)
15
(12 - 18)
14
(12 - 18)
15
(12-18)
13
(11 - 15)
<
0.0001*
<
0.0001*
0.076
Attention
switching:
Median (IQR)
18
(15 - 20)
18
(15 – 20)
17
(14 - 19)
15
(13 - 16)
15
(13 – 16)
14
(13 - 17)
15
(13- 17)
15
(12 – 18)
16
(13 - 17)
<
0.0001*
<
0.0001*
0.062
Attention to
detail:
Median (IQR)
17
(14 - 20)
18
(14- 21)
17
(14 - 20)
15
(12 - 17)
15
(12 – 17)
14
(12 - 16)
14
(12 - 17)
15
(13 – 17)
14
(12- 16)
<
0.0001*
<
0.0001*
0.040*
Communication:
Median (IQR)
18
(15 - 21)
18
(17- 22)
16
(14 - 20)
15
(13 - 17)
14
(13 – 16)
15
(13 - 18)
15
(13 - 17)
15
(13 – 17)
14
(13 - 16)
<
0.0001*
<
0.0001*
0.083
Imagination:
Median (IQR)
18
(15 - 21)
18
(16 – 21)
16
(15 - 19)
15
(13 - 18)
15
(13 – 18)
16
(15 - 17)
15
(13 - 18)
15
(13 – 18)
15
(13 - 18)
<
0.0001*
<
0.0001*
0.324
Note. AQ = Autism Spectrum Quotient; ASD = Autism Spectrum Disorder; TD = Typically Developing; NDD = Neurodevelopmental Disorders; IQR = Interquartile Range.
aKruskal Wallis test.
*p < 0.05
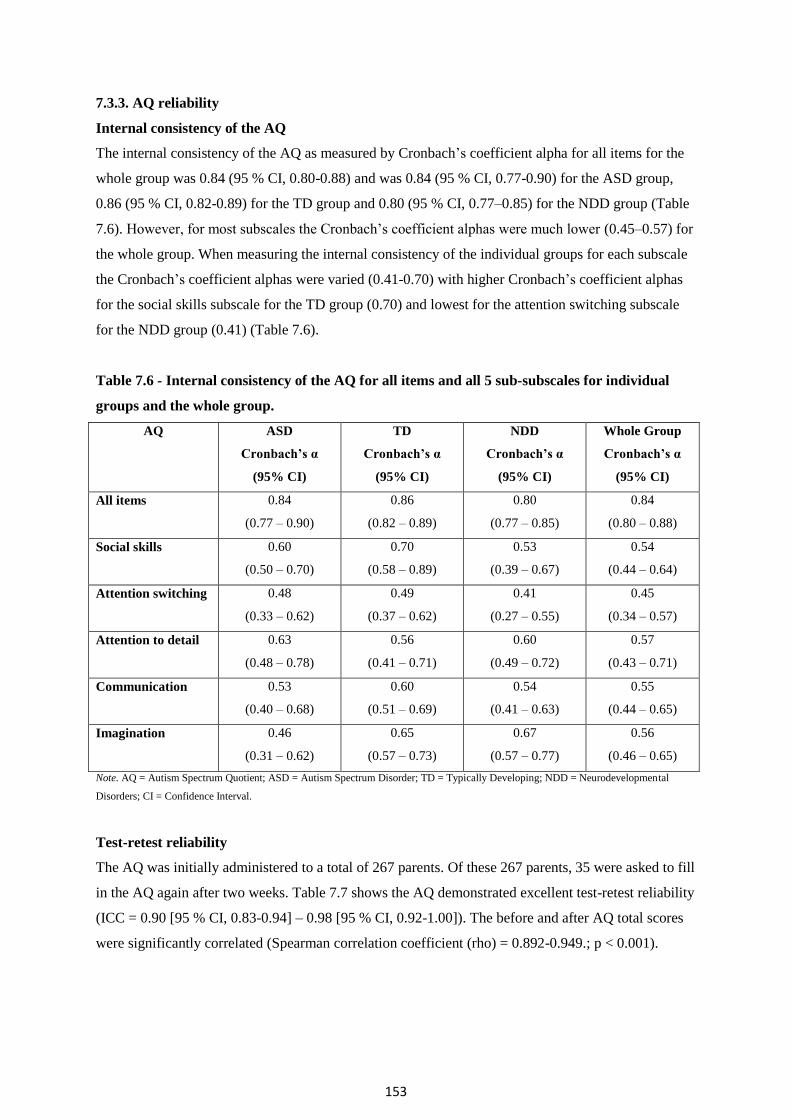
153
7.3.3. AQ reliability
Internal consistency of the AQ
The internal consistency of the AQ as measured by Cronbach‘s coefficient alpha for all items for the
whole group was 0.84 (95 % CI, 0.80-0.88) and was 0.84 (95 % CI, 0.77-0.90) for the ASD group,
0.86 (95 % CI, 0.82-0.89) for the TD group and 0.80 (95 % CI, 0.77–0.85) for the NDD group (Table
7.6). However, for most subscales the Cronbach‘s coefficient alphas were much lower (0.45–0.57) for
the whole group. When measuring the internal consistency of the individual groups for each subscale
the Cronbach‘s coefficient alphas were varied (0.41-0.70) with higher Cronbach‘s coefficient alphas
for the social skills subscale for the TD group (0.70) and lowest for the attention switching subscale
for the NDD group (0.41) (Table 7.6).
Table 7.6 - Internal consistency of the AQ for all items and all 5 sub-subscales for individual
groups and the whole group.
AQ ASD
Cronbach’s α
(95% CI)
TD
Cronbach’s α
(95% CI)
NDD
Cronbach’s α
(95% CI)
Whole Group
Cronbach’s α
(95% CI)
All items 0.84
(0.77 – 0.90)
0.86
(0.82 – 0.89)
0.80
(0.77 – 0.85)
0.84
(0.80 – 0.88)
Social skills 0.60
(0.50 – 0.70)
0.70
(0.58 – 0.89)
0.53
(0.39 – 0.67)
0.54
(0.44 – 0.64)
Attention switching 0.48
(0.33 – 0.62)
0.49
(0.37 – 0.62)
0.41
(0.27 – 0.55)
0.45
(0.34 – 0.57)
Attention to detail 0.63
(0.48 – 0.78)
0.56
(0.41 – 0.71)
0.60
(0.49 – 0.72)
0.57
(0.43 – 0.71)
Communication 0.53
(0.40 – 0.68)
0.60
(0.51 – 0.69)
0.54
(0.41 – 0.63)
0.55
(0.44 – 0.65)
Imagination 0.46
(0.31 – 0.62)
0.65
(0.57 – 0.73)
0.67
(0.57 – 0.77)
0.56
(0.46 – 0.65)
Note. AQ = Autism Spectrum Quotient; ASD = Autism Spectrum Disorder; TD = Typically Developing; NDD = Neurodevelopmental
Disorders; CI = Confidence Interval.
Test-retest reliability
The AQ was initially administered to a total of 267 parents. Of these 267 parents, 35 were asked to fill
in the AQ again after two weeks. Table 7.7 shows the AQ demonstrated excellent test-retest reliability
(ICC = 0.90 [95 % CI, 0.83-0.94] – 0.98 [95 % CI, 0.92-1.00]). The before and after AQ total scores
were significantly correlated (Spearman correlation coefficient (rho) = 0.892-0.949.; p < 0.001).
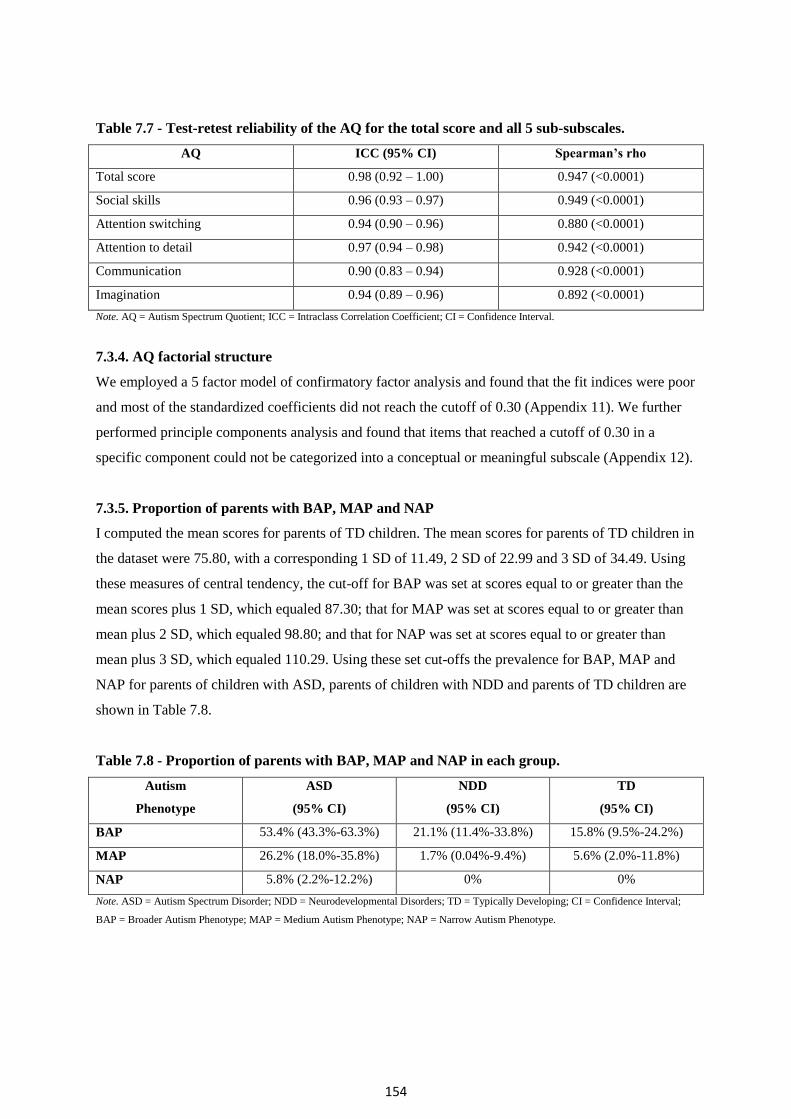
154
Table 7.7 - Test-retest reliability of the AQ for the total score and all 5 sub-subscales.
AQ ICC (95% CI) Spearman’s rho
Total score 0.98 (0.92 – 1.00) 0.947 (<0.0001)
Social skills 0.96 (0.93 – 0.97) 0.949 (<0.0001)
Attention switching 0.94 (0.90 – 0.96) 0.880 (<0.0001)
Attention to detail 0.97 (0.94 – 0.98) 0.942 (<0.0001)
Communication 0.90 (0.83 – 0.94) 0.928 (<0.0001)
Imagination 0.94 (0.89 – 0.96) 0.892 (<0.0001)
Note. AQ = Autism Spectrum Quotient; ICC = Intraclass Correlation Coefficient; CI = Confidence Interval.
7.3.4. AQ factorial structure
We employed a 5 factor model of confirmatory factor analysis and found that the fit indices were poor
and most of the standardized coefficients did not reach the cutoff of 0.30 (Appendix 11). We further
performed principle components analysis and found that items that reached a cutoff of 0.30 in a
specific component could not be categorized into a conceptual or meaningful subscale (Appendix 12).
7.3.5. Proportion of parents with BAP, MAP and NAP
I computed the mean scores for parents of TD children. The mean scores for parents of TD children in
the dataset were 75.80, with a corresponding 1 SD of 11.49, 2 SD of 22.99 and 3 SD of 34.49. Using
these measures of central tendency, the cut-off for BAP was set at scores equal to or greater than the
mean scores plus 1 SD, which equaled 87.30; that for MAP was set at scores equal to or greater than
mean plus 2 SD, which equaled 98.80; and that for NAP was set at scores equal to or greater than
mean plus 3 SD, which equaled 110.29. Using these set cut-offs the prevalence for BAP, MAP and
NAP for parents of children with ASD, parents of children with NDD and parents of TD children are
shown in Table 7.8.
Table 7.8 - Proportion of parents with BAP, MAP and NAP in each group.
Autism
Phenotype
ASD
(95% CI)
NDD
(95% CI)
TD
(95% CI)
BAP 53.4% (43.3%-63.3%) 21.1% (11.4%-33.8%) 15.8% (9.5%-24.2%)
MAP 26.2% (18.0%-35.8%) 1.7% (0.04%-9.4%) 5.6% (2.0%-11.8%)
NAP 5.8% (2.2%-12.2%) 0% 0%
Note. ASD = Autism Spectrum Disorder; NDD = Neurodevelopmental Disorders; TD = Typically Developing; CI = Confidence Interval;
BAP = Broader Autism Phenotype; MAP = Medium Autism Phenotype; NAP = Narrow Autism Phenotype.
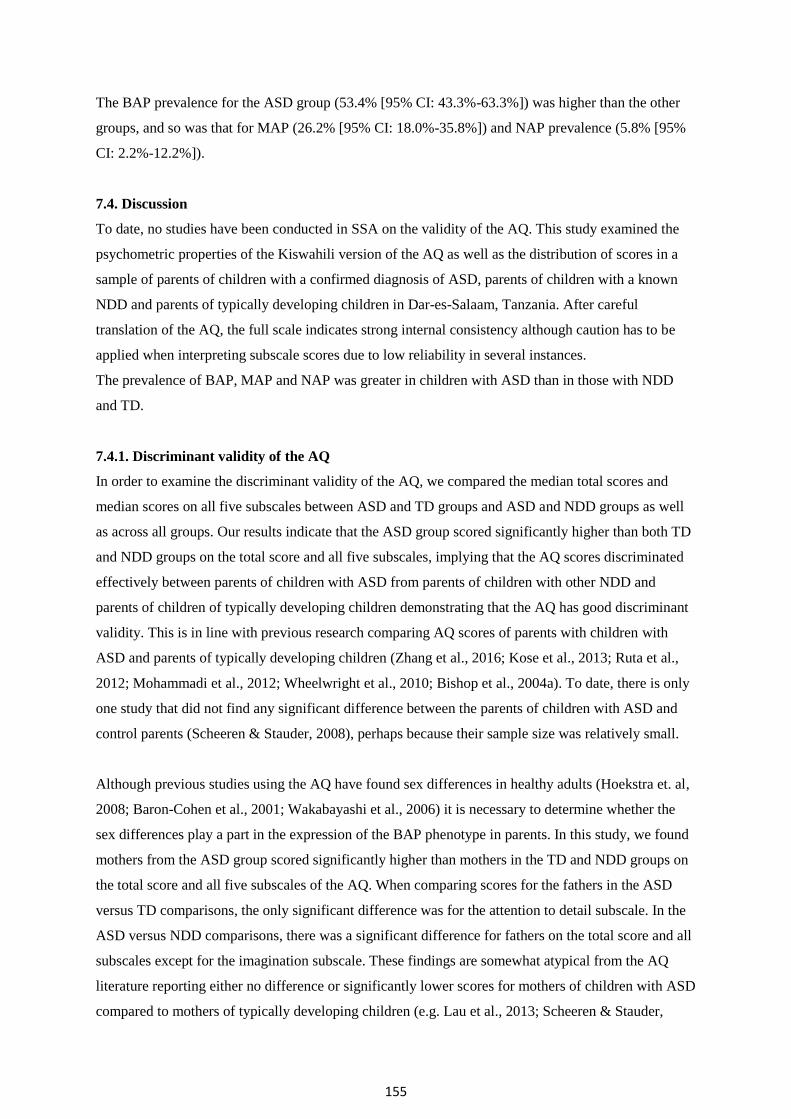
155
The BAP prevalence for the ASD group (53.4% [95% CI: 43.3%-63.3%]) was higher than the other
groups, and so was that for MAP (26.2% [95% CI: 18.0%-35.8%]) and NAP prevalence (5.8% [95%
CI: 2.2%-12.2%]).
7.4. Discussion
To date, no studies have been conducted in SSA on the validity of the AQ. This study examined the
psychometric properties of the Kiswahili version of the AQ as well as the distribution of scores in a
sample of parents of children with a confirmed diagnosis of ASD, parents of children with a known
NDD and parents of typically developing children in Dar-es-Salaam, Tanzania. After careful
translation of the AQ, the full scale indicates strong internal consistency although caution has to be
applied when interpreting subscale scores due to low reliability in several instances.
The prevalence of BAP, MAP and NAP was greater in children with ASD than in those with NDD
and TD.
7.4.1. Discriminant validity of the AQ
In order to examine the discriminant validity of the AQ, we compared the median total scores and
median scores on all five subscales between ASD and TD groups and ASD and NDD groups as well
as across all groups. Our results indicate that the ASD group scored significantly higher than both TD
and NDD groups on the total score and all five subscales, implying that the AQ scores discriminated
effectively between parents of children with ASD from parents of children with other NDD and
parents of children of typically developing children demonstrating that the AQ has good discriminant
validity. This is in line with previous research comparing AQ scores of parents with children with
ASD and parents of typically developing children (Zhang et al., 2016; Kose et al., 2013; Ruta et al.,
2012; Mohammadi et al., 2012; Wheelwright et al., 2010; Bishop et al., 2004a). To date, there is only
one study that did not find any significant difference between the parents of children with ASD and
control parents (Scheeren & Stauder, 2008), perhaps because their sample size was relatively small.
Although previous studies using the AQ have found sex differences in healthy adults (Hoekstra et. al,
2008; Baron-Cohen et al., 2001; Wakabayashi et al., 2006) it is necessary to determine whether the
sex differences play a part in the expression of the BAP phenotype in parents. In this study, we found
mothers from the ASD group scored significantly higher than mothers in the TD and NDD groups on
the total score and all five subscales of the AQ. When comparing scores for the fathers in the ASD
versus TD comparisons, the only significant difference was for the attention to detail subscale. In the
ASD versus NDD comparisons, there was a significant difference for fathers on the total score and all
subscales except for the imagination subscale. These findings are somewhat atypical from the AQ
literature reporting either no difference or significantly lower scores for mothers of children with ASD
compared to mothers of typically developing children (e.g. Lau et al., 2013; Scheeren & Stauder,

156
2008) and significantly higher scores for fathers of children with ASD compared to fathers of
typically developing children in particular in the social skills and communication subscales (e.g.
Bishop et al., 2004a). This could be attributed to the notion that fathers of children with ASD in our
sample may have been more knowledgeable about the heritability and behaviour patterns of ASD,
avoiding the label of being autistic due to the stigma attached and therefore under-reporting autistic
features of themselves. This could also be because few fathers participated in this study.
7.4.2. Reliability of the AQ
The reliability coefficient alpha for the whole group for all items (Cronbach‘s α = 0.84) was good and
comparable to the Chinese cross-cultural validation for use in Taiwan (Lau et. al, 2013), however,
their sample did not include a third group of parents of children with a known NDD. However, our
findings for all five subscales (Cronbach‘s α = 0.45 – 0.57) reveal much lower coefficient alphas than
that reported by Lau et al. (Cronbach‘s α = 0.54 – 0.88), perhaps because the sample size in this study
was much smaller even though we included three groups of parents. The coefficient alphas for the
individual groups for all items and the five subscales were much lower, perhaps also due to smaller
sample sizes. For instance, Zhang et al. (2008) documented higher correlation coefficient (Cronbach‘s
α = 0.817) for all items in their larger ASD sample.
7.4.3. Factorial analysis of the AQ
The factorial analysis of the AQ in this setting needs further evaluation in future studies as many
items didn‘t reach the cut-off of a standardized coefficient of 0.30 nor could they be categorized into a
conceptual or meaningful subscale. This could suggest that the information gained about the
interdependencies between observed items cannot be used to reduce the set of variables into
independent latent factors. Therefore, it is possible to argue that the items possess more unique
variance (that is specific to individual items) than common variance that is usually shared across
highly correlated items. This could be a result of the small sample size in our study and perhaps the
structure of the AQ is less defined in our context, and so a unidimensional structure can be used. For
instance, Lau et al. (2013) examined the psychometric properties of the Chinese version of the AQ
using a much larger sample of parents of children with ASD and parents of TD children in Taiwan,
found a 35 item 5-factor model with acceptable fit indices.
7.4.4. Proportion of BAP, MAP and NAP
The prevalence of BAP in parents of children with ASD (53.4%) was higher than for parents with
either children with NDD (21.1%) or developing typically (15.8%), suggesting these BAP phenotypes
are particularly characteristic of ASD in our settings. Similar to BAP, there was a preponderance of
MAP and NAP in parents of children with ASD than those with NDD or TD, supporting that this is
not a chance, but biological/clinically meaningful occurrence. These prevalence estimates for ASD

157
are comparable to previous studies from HIC (ASD, 13.8% - 43.5%; TD, 8.2% - 22.0%) (Bishop et
al., 2004a; Bishop et al., 2004b; Wheelwright et al., 2010; Ruta et al., 2012; Berthoz et al., 2013) and
to a few others in LAMIC (ASD, 25.2% - 50.0%; TD, 8.1% - 11.8%) (Mohammadi et al., 2012; Bora
et al., 2017). The prevalence was lowest in parents of TD children as expected, and could suggest a
lowered familial clustering of genetic or environmental risk factors in these families compared to
those of ASD families.
7.4.5. Strengths and limitations
To the best of my knowledge, this is the first study to validate a BAP measure in SSA. The AQ was
carefully translated into the local language Kiswahili. The inclusion of parents of children with a
known NDD made the study more robust. It is, however, important to note that the NDD group
comprised of heterogeneous conditions. This is especially relevant since conditions such as Down‘s
syndrome has a distinct genetic aetiology that is not shared with the parents, while ADHD and
learning disability are often idiopathic and likely influenced by common genetic factors and by a
range of possible environmental factors. However, our sample size was relatively small; a larger
sample size would allow for more comprehensive validity analysis with CFA and PCA and address
some weaknesses in the internal consistencies. Other factors other than small sample sizes could also
contribute to poor internal consistencies and poor factorial structure. For instance parents may have
found it difficult to interpret some items (which reflects error variance that is a subset of unique
variance) and maybe the structure of the AQ is less defined in our context (may represent specific
variance that is a subset of unique variance). It is also important to note that the AQ was not adapted
in terms of item content, and this could have introduced possible issues with cultural relevance of
some of the AQ items. Children living in urban areas have more access to these special schools and
facilities and thus parents in rural areas were not included in this study. Furthermore, poorer and less
literate parents in urban areas may not bring their children to these schools.
7.4.6. Conclusions
The findings from this study suggest the Kiswahili version of the AQ has average to acceptable
psychometric properties highlighting reasonable cross-cultural stability of autistic traits in this
population. Further studies of BAP can include the concepts of the MAP and NAP and could be more
specific in explaining variance for genetic studies since they are based on a more stringent cut-off
threshold. Future studies are warranted to further investigate the BAP in other close relatives and to
relate AQ scores to molecular genetic differences. These BAP estimates should be replicated in
studies from other settings in Africa.

158
Chapter 8
Synthesized discussion
8.1. Background
The aim of this thesis was to explore the situation, features and presentation of Autism Spectrum
Disorders (ASD) in Dar-es-Salaam, Tanzania, comparing children with ASD with other
neurodevelopmental disorders (NDD) that are not ASD, as well as typically developing children (TD).
In particular, describing the knowledge and lived experiences of caregivers of children with ASD and
community stakeholders, developing and adapting tools for the identification of children with ASD,
identifying the risk factors for ASD and characterizing the Broader Autism Phenotype (BAP) in
parents of children with ASD in this population.
There are relatively little data on the prevalence of ASD in sub-Saharan Africa (SSA) and the clinical
presentation of ASD in this region is not fully understood (Ruparelia et. al, 2016; Elsabbagh et al.,
2012). There is limited knowledge on lived experiences and challenges of children with ASD
throughout Tanzania (Manji & Hogan, 2013). Additionally, recent epidemiologic research has
highlighted the prenatal and neonatal period as the most vulnerable period when most environmental
risk factors are associated with ASD (Gardener et al., 2009; Gardener et al., 2011). However, there are
very few epidemiological studies of ASD conducted in SSA where there is a high incidence of risk
factors such as pregnancy complications, adverse perinatal events, and infections with a propensity for
the central nervous system. Furthermore, cross-cultural findings from BAP studies indicate that
patterns are stable and independent of cultural influences, pointing to some biological basis for
manifestations of these phenotypes.
This chapter is a synthesized discussion of the results of this PhD thesis. Initially, I conducted a
systematic review to synthesize available evidence of behavioral, cognitive and psychiatric profiles of
the BAP in unaffected biological parents of ASD probands, as well as NDD and TD probands. I
assimilated the evidence from 60 studies that met a priori search criteria from scientific databases.
Thereafter, I conducted a qualitative study to investigate the knowledge and lived experiences of
caregivers of children with ASD (n = 14) and key community informants (n = 37). Additionally, I
conducted a case-control study in 284 children living in Dar-es-Salaam, Tanzania including children
with ASD (n = 108), children with other neurodevelopmental disorders (NDD) that are not ASD (n =
60) and typically developing children (TD) (n = 116), to clinically validate ASD screening tools (e.g.
the Social Communication Questionnaire (SCQ)) and to identify potential risk factors for ASD in this
159
population, comparing between those unique to ASD and those other NDD that are not ASD. This
followed a final case-control study assessing the BAP traits of parents of children in my case-control
studies mentioned above (n = 267) which included parents of children with ASD (n = 103), parents of
children with other NDD (n = 57) and parents of TD children (n = 107).
8.2. Overview and interpretation of findings
8.2.1. Systematic review
The findings from the Systematic Review identify mild social/communication deficits, rigid/aloof
personality traits, and pragmatic language difficulties as the most important socio-behavioural
endophenotype traits. The existence of deficits in the cognitive domains and depressed mood / anxiety
can also be useful markers for familial vulnerability clustering of ASD.
Findings from the socio-behavioural domain are in concordance with previous reviews (Cruz et al.,
2013; Gerdts & Bernier, 2011; Sucksmith et al., 2011) indicating that mild social/communication
deficits, rigid/aloof personality traits, and pragmatic language difficulties may be the most useful
socio-behavioural candidate endophenotype traits as they meet all the established criteria for the
identification of useful endophenotypes (Gottesman & Gould, 2003). Cruz et al (2013) for instance,
also found parents of ASD probands to have more difficulties in interpersonal relationships and in
pragmatic language use as well as more rigidity traits.
Findings from the cognitive domain reveal limited evidence for the role of intellectual functioning as
an endophenotype for ASD with no clear significance. Although several measures assessed structural
language abilities, phonological awareness, social cognition, executive functioning and visual
processing, findings were variable suggesting these areas of cognition warrant further research
because their assessments require standardised tools and requires specialized training. A number of
studies documented higher frequency of depression, anxiety and social phobia/social phobic anxiety
in parents of children with ASD compared to normative and clinical samples, with depression and
anxiety being more prevalent in mothers of children with ASD, relative to a normative comparison
group. Although it can be argued that having a child with a disability can affect mood and anxiety
levels, many studies indicate an onset of these conditions before the birth of the child with ASD,
suggesting these BAP symptoms were not directly related to caring for a child with a disability.
Findings from our review revealed moderate to high magnitude of effect of BAP symptoms; thus,
depression and anxiety may have a genetic link with ASD, supporting constellation of psychiatric
disorders in parents of children with ASD (Yirmiya & Shaked, 2005).
Subclinical autistic traits aggregate in families with multiple incidence of ASD (MPX) and occur less
frequently in families with single incidence of ASD (SPX) (Bernier et al., 2012; Losh et al., 2008),

160
which is consistent with findings of increased de novo, non-inherited and spontaneous genetic events
in SPX families (e.g., Sebat et al 2007). Findings from my review also indicate few sex differences,
indicating a male bias (Ruser et al., 2007; Schwichtenberg et al., 2010; De la Marche et al., 2012),
perhaps related to their heightened sensitivity for being associated with raising children with
neurobehavioural disorders. However, despite this and the clear sex bias in ASD, many studies do not
suggest sex differences for most BAP features (e.g. Klusek et al., 2014). Furthermore, my findings
indicate that the majority of the studies reviewed were conducted in Western countries, which are not
representative of many settings in SSA.
However, findings from my review should be interpreted with caution because of the small number of
studies in such heterogeneously broad domains and several methodological limitations. For instance,
different tools were used to determine BAP and cut-offs scores were arbitrary. This complicated the
pooling of overall prevalence of BAP across the eligible studies, because of the aforementioned
sources of heterogeneity.
8.2.2. Awareness and lived experiences of ASD
Findings from the qualitative study indicate consistent sub-themes emerging within the areas of
concern. These emerging sub-themes were useful in underlining knowledge and awareness in the
identification and presentation of ASD and its‘ perceived causes, and the challenges experienced by
caregivers. The results show that caregivers and special needs educators have gained moderate
knowledge of ASD, perhaps because they were recruited from schools that catered specifically for
children with ASD. In comparison, however, other key community informants such as parents and
mainstream teachers had relatively limited knowledge of ASD consistent with general lack of
awareness, understanding and acceptance of ASD within the communities in Africa. This could be
attributed to the high levels of stigma associated with many neurobehavioural impairments in Africa
previously recognized (Eisegbe et al., 2015; Igwe et al., 2011; Bakare et al., 2009a; Bakare et al.,
2008).
As in earlier work (Belhadj et al., 2006; Mankoski et al., 2006; Bakare & Munir, 2011b), nonverbal
characteristics of children with ASD seemed to be overemphasized, perhaps an indicator of poor
diagnostic approaches which contributed to only the severe cases being known. Many parents of
typically developing children and mainstream teachers were unable to distinguish ASD
symptomatology from other intellectual disorders and behavioral/developmental problems. This could
reflect the lack of awareness of ASD within the community.
Most of the participants perceived biomedical reasons such as hereditary, brain abnormalities and
infectious diseases as the cause of ASD, which is similar to clinical observations in Tanzania (2006).

161
Only parents with TD children in our study attributed ASD etiology to supernatural causes, which is
inconsistent with community perceptions from other research in the region (Bakare et al., 2009b;
Gona et al., 2015), highlighting the need for public engagement to raise awareness within the
community.
My findings reveal that many of the challenges raised in this study resonate with findings in the
existing literature of ASD from other developing countries (e.g. Desai et al., 2012; Gona et al., 2016;
Tekola et al., 2016). Participants emphasized and acknowledged the low level awareness of ASD
amongst the healthcare practitioners and the lack of appropriate diagnostic tools. These Tanzanian
data concur with previous findings from several studies conducted in Nigeria revealing a low- level of
knowledge and awareness about ASD in Africa (Eisegbe et al., 2015; Igwe et al., 2011; Bakare et al.,
2009a; Bakare et al., 2008).
8.2.3. Psychometric properties of the SCQ
My findings reveal good discriminant validity since the ASD group scored significantly higher than
both TD and NDD groups on the total score and all three domains, similar to previous studies of
English SCQ (Chandler et al., 2007; Charman et al., 2007), and other languages (German SCQ - Bölte
et. al., 2008b; Portuguese SCQ – Sato et al., 2009; Chinese SCQ - Gau et al., 2011; Turkish SCQ -
Avcil et al., 2015; Greek SCQ - Zarokanellou et al., 2017). I did not find any sex differences for any
group for the SCQ total score, social interaction domain and communication domain, although some
studies from elsewhere did report particularly higher scores for females (McLennan et al., 1993; Lord
et al., 1982; Gillberg & Coleman, 2000). These findings also revealed that there were no significant
differences between mother and father respondents and mother and caregiver respondents for all
group comparisons.
The results indicate acceptable to excellent reliability coefficients (Cronbach‘s α = 0.65-0.93) which
are higher than other cross-cultural validation studies of the SCQ total scores (e.g. Sato et al., 2009;
Avcil et al., 2015) and similar for the domain scores (Gau et al., 2011). Additionally, our findings
reveal excellent test-retest reliability (ICC = 0.972 – 0.998) for the SCQ total scores and its three
domains, with the before and after scores significantly correlated (r = 0.964 – 0.995; p < 0.001).
Furthermore, the results support the use of a 2-factor model of combined social interaction and
communication and repetitive behaviours as recommended by DSM-5 criteria since all fit indices
reached acceptable levels. All item loadings were above the cut-off for standardized coefficients of
0.3 except one (item 13) when the responses for items 2 to 7 were replaced with a score of 1 in order
to include all nonverbal children.

162
The ROC curve analyses suggested excellent predictive ability as scoring above the recommended
cut-off of 15 for ASD was highly indicative that the child had ASD. Results yielded sensitivity of
100% and specificity of 100% (AUC = 1) when discriminating ASD with TD samples and sensitivity
remained at 100% when discriminating ASD with NDD (AUC= 0.85) and for whole group (AUC=
0.95) but specificity decreased to 70.0% and 89.8% respectively. Our findings are better than that
reported in the initial validation study of the SCQ (Berument et al., 1999) when discriminating ASD
with non-ASD, as well as when discriminating between ASD and ID, and similar in terms of higher
sensitivity estimates than specificity estimates.
8.2.4. Risk factors associated with ASD
A number of risk factors were assessed for their association with ASD, in particular, socio-
demographic, prenatal, perinatal, neonatal and postnatal factors. Some risk factors were unique to
ASD, but many are shared with other NDD disorders.
ASD vs. TD summary of findings
Socio-demographic factors such as the child‘s male sex were positively associated with an increased
risk of ASD when compared to TD groups. Our results are consistent with the theory that ASD affects
males four times more than females (Fombonne, 2005) as several theories have suggested the
involvement of the sex chromosome in the aetiology of ASD, the role of hormonal influences in utero
(Baron-Cohen et al., 2011) and phenotypic diversity in brain structure (Ecker et al., 2017). This trend
was also observed in neurological disorders in rural parts of Africa (Kariuki et al., 2015).
Advanced parental age at delivery was associated with an increased risk of ASD, but there is an
inconsistent association of advanced parental age with ASD reported from several studies. Wu et al
(2017) found that maternal and paternal age increases the risk of ASD in the offspring by up to 21%. I
found that mother's age at birth has more impact on development of ASD than father's age at delivery
in this setting. An association of ASD with increasing difference in age between parents is reported
(Sandin et al., 2016), but did not reach multivariable statistical significance in my study. Genetic
factors are thought to determine the association between parental age and risk for ASD (Sandin et al.,
2016).
The findings indicate an increased risk of ASD associated with adverse perinatal events. Previous
studies have reported significant associations of prenatal risk factors such as gestational hypertension
and maternal bleeding with ASD (e.g. Gardener et al., 2009; Gardener et al, 2011). Perinatal factors
have also been highlighted in a recent review of neurodevelopmental disorders, including ASD (Bitta
et al., 2017). The lack of independent association of preterm birth and infections during pregnancy
with ASD in our study may be due to poor health records.

163
Of the postnatal factors risk factors investigated in this study, malaria before the age of three was
associated with the highest independent risk of ASD in the multivariable analysis, being frequently
more common among the ASD group (31%) than the TD group (4%). This is in line with a case-series
study from Tanzania reporting encephalitis as a potential cause for ASD (Mankoski et al., 2006).
Malaria can cause diffuse brain damage, but the damage is more prominent in the posterior-temporal
regions of the brain that are supplied by middle and posterior cerebral arteries, subsequently causing
features similar to those of impaired communication in ASD, in particular speech and language
(Carter et al., 2006). The strong significant association of ASD with malaria may have attenuated the
independent association of seizures with ASD in the multivariable analysis, since most seizures in
parasitaemic children are attributable to malaria (Kariuki et al., 2011). This could support the double
hit hypothesis in which the vulnerability of ASD may start during embryogenesis, but will not
manifest phenotypically until another adverse event / risk factor happens sometime later, for instance,
exposure to brain infections (Wiśniowiecka-Kowalnik & Nowakowska, 2019). It is plausible that
exposure to malaria before age 3 years, activates non-heritable gene mutations, that adds to pre-
existing heritable gene mutations, in a dose dependent manner, enhancing penetrance of ASD
phenotype (e.g. Girrirajan & Eichler, 2010). Late onset of ASD would be due to either delayed onset
of the second non-heritable mutation or onset of both non-heritable mutations that are required for
expression of ASD phenotype. Given the enormous burden of severe malaria with neurological
involvement in many rural parts of Africa (Idro et al., 2007), studies on ASD following severe malaria
are urgently needed to inform preventative strategies. It is possible that the impact of neonatal factors
such as jaundice (which did not reach multivariate significance) on neurodevelopmental disorders,
including ASD, is important on long-term follow-ups (Mwaniki et al., 2012), which should be
examined in prospective cohort studies.
ASD vs. NDD summary of findings
Although several factors reached significance in the univariable analysis, only fathers being older than
mother and malaria under 3 years remained significant in the multivariable analysis. As suggested
above, follow-up studies of malaria as a risk factor for ASD should be urgently set-up in endemic
area, to quantify the burden of ASD attributable to severe malaria. Cultural ways e.g. polygamy may
explain fathering children in advanced age, and the role of a father‘s age on ASD may be mediated
through spontaneous mutations.
The lack of significance in the ASD vs. NDD analysis may suggest that these risk factors are shared
between ASD and other NDD. This hypothesis was supported by identification of adverse perinatal
events as independent risk factors for NDD when compared to TD; similar risk factors were found for
ASD when compared to TD. Hypothetically, interventions to control of such risk factors would not
only reduce the burden of ASD but also that for other NDD. These factors identified in NDD vs. TD

164
but not in ASD vs. TD (e.g. seizures and head injury) cause direct brain damage, suggesting NDD
have a symptomatic basis that may have a poorer prognosis as shown recently (Abuga et al., 2019). It
is important to note that the large confidence intervals (CI) in our results may mean that there were
few observations in some groups.
8.2.5. Psychometric properties of the AQ
The findings indicate that the AQ has good discriminant validity as the AQ scores discriminated
effectively between parents of children with ASD from parents of children with other NDD and
parents of children of typically developing children. This is in line with previous research comparing
AQ scores of parents with children with ASD and parents of typically developing children (Zhang et
al., 2016; Köse et al., 2013; Ruta et al., 2012; Mohammadi et al., 2012; Wheelwright et al., 2010;
Bishop et al., 2004a).
Mothers from the ASD group scored significantly higher than mothers in the TD and NDD groups on
the total score and all five subscales of the AQ. When comparing scores for the fathers in the ASD
versus TD comparisons, the only significant difference was for the attention to detail subscale. In the
ASD versus NDD comparisons, there was a significant difference for fathers on the total score and all
subscales except for the imagination subscale. These findings are somewhat atypical from the AQ
literature reporting either no difference or significantly lower scores for mothers of children with ASD
compared to mothers of typically developing children (e.g. Lau et al., 2013; Scheeren & Stauder,
2008) and significantly higher scores for fathers of children with ASD compared to fathers of
typically developing children in particular in the social skills and communication subscales (e.g.
Bishop et al., 2004a). It is possible that fathers of children with ASD in our sample may have been
more aware about the problematic behaviours patterns of ASD, avoiding the label of being autistic
due to the stigma attached and therefore under-reporting autistic features of themselves.
The whole group Cronbach‘s coefficient alpha was acceptable (Cronbach‘s α = 0.84) and comparable
to the Chinese cross-cultural validation for use in Taiwan (Lau et. al, 2013), however, their sample did
not include a third group of parents of children with a known NDD, which may share genetic, clinical
and social profiles with ASD. These findings show that the items are homogeneously assessing ASD
constructs. Lower coefficient alphas were found for all five subscales than that reported by Lau et al.
(2013), perhaps because the sample size in this study was much smaller even though we included
three groups of parents. The coefficient alphas for the individual groups for all items and the five
subscales were much lower, as would be expected with smaller sample sizes.
This study also found higher prevalence of BAP in parents of children with ASD (53%) than those
with either NDD (21%) or developing typically (16%), implying familiar clustering of these

165
neurodevelopmental disorders, and that there should be targeted interventions for all family members.
These BAP estimates for ASD are comparable to previous studies from HIC (Bishop et al., 2004a;
Bishop et al., 2004b; Wheelwright et al., 2010; Ruta et al., 2012; Taylor et al., 2013; Berthoz et al.,
2013) and few in LAMIC (Mohammadi et al., 2012; Bora et al., 2017). The prevalence was lowest in
parents of TD children as expected, and could suggest a lowered familial clustering in these families
compared to ASD families. More research is warranted to determine the prevalence of BAP and its
utility in guiding interventions in other LAMIC and in particular SSA.
8.3. Public health significance of the findings
The findings from this study have several important implications. There is need to describe the
endophenotypes of parents of children with ASD to help develop better measures to detect subtle
subclinical autistic traits in the BAP in African settings. These BAP findings would justify tailored
interventions to the entire family of children with ASD and possibly other NDD, as well as support
the basis for inclusion of trios (mother, father and child triad) in genetic studies of ASD and related
NDD. This study identifies the gap in knowledge in the general community highlighting the need for
sustained awareness and sensitization programs to improve understanding, acceptance and
management of ASD in African settings. The adaptation and validation of the SCQ lends support for
the clinical utility of the SCQ as a first level screening measure for ASD among Tanzanian children
and can inform specialized care and initiation/evaluation of intervention thereby reducing the
diagnostic and treatment gaps. This study also identifies postnatal malaria (before age 3 years) as a
significant independent risk factor unique to ASD. This findings can inform policy on preventative
and therapeutic measures such as improving coverage and utilization of treated bed nets, development
of new and effective vaccines for malaria (as only RTS,S/AS01 has reached implementation) and
acceleration of discovery of new anti-malarial medicines. Some risk factors in particular adverse
perinatal events are shared between ASD and other NDD, and therefore interventions to control such
risk factors would not only reduce the burden of ASD, but also that for other related NDD. The higher
BAP prevalence in ASD than other NDDs and TD justifies the need to invest in the investigation of
the genetic basis of ASD, and supports intervention programs to extend and include caregivers and
families of children with ASD. Parental BAP may be an important tool for analysing sources of
heterogeneity in ASD etiology (estimating variability explained by either genetic or environmental
conditions) and for informing the development of parent-mediated ASD interventions such as those
aimed at improving a child‘s disruptive behaviours and communication.
8.4. Study strengths and limitations
This study has some strengths. The ASD screening tool (SCQ) was standardized and underwent
adaptation and validation to the local population before its application in this study. Furthermore, all
children were directly observed for their behaviour and language using the internationally recognised

166
Autism Diagnostic Observation Schedule (ADOS-2) and complemented by the DSM-5 criteria which
aided in the clinical confirmation of the diagnosis of the ASD sample. Another strength is that this
clinical consensus process was iteratively corroborated by independent expert rating. The inclusion of
the NDD and TD comparison groups and using both verbal and nonverbal children made the study
more robust, lending additional support for the utility (in terms of reliability and validity) of the SCQ
as a screening measure in clinical practice. The inclusion of the NDD group also allowed us to
identify risk factors unique to ASD as well those shared by these disorders. Additionally, a large
number of risk factors were investigated, which were pragmatically selected by a thorough search of
the literature, and included risk factors that have biological plausibility in the pathophysiological and
pathogenetic processes of ASD and NDD. A robust statistical analysis approach was used (including
testing for departure from linear trend for ordinal variables and examining goodness of fit of the
models) and we accounted for potential confounders in the multivariable models. Lastly, the BAP
questionnaire (AQ) was carefully translated and adapted into the local language Kiswahili, and the
inclusion of parents of children with a known NDD aided in the development of cut-offs for the BAP
scores.
There are several potential limitations in this study. This was not a community-based study and
therefore children with ASD and NDD recruited from care centres may not be representative of the
general population due to Berkson‘s bias, but this will only be important in follow-up studies of
children with these disorders. It is possible that some children may be missed because they did not
attend the facilities we approached for identification of study participants. Children living in urban
areas have more access to these special schools and facilities and thus parents in rural areas were not
included in this study. Furthermore, poorer and less literate parents in urban areas may not bring their
children to these schools. Furthermore, blinding of assessors was not fully possible, and this may have
introduced bias as assessors were aware of the status of each child which may have influenced the
way questions were asked as well as expectations of their responses. Although our sample size was
sufficient to allow for comprehensive reliability and validity analysis, slightly larger samples might
have yielded more power to detect more significant associations in the multivariable analysis of risk
factors. The TD group were matched by level of expressive language and this may have caused age
selection bias in the identification of risk factors that are time dependent. These differences were
inevitable because delayed diagnosis and lack of expressive language is common in ASD, which
would result in older children seeking care. However, the inclusion of the NDD comparison group
may have helped to deal with this limitation since the age of NDD children were similar to or slightly
older than that of ASD children. It is, however, important to note that the NDD group comprised of
heterogeneous conditions. This is especially relevant since conditions such as Down‘s syndrome has a
distinct genetic aetiology that is not shared with the parents, while ADHD and learning disability are
often idiopathic and likely influenced by common genetic factors and by a range of possible

167
environmental factors. Cultural beliefs in this region may be associated with stigma and therefore the
inevitable under-reporting of ASD or BAP symptoms. Recall and reporting bias of retrospective self-
reporting answers by parents/caregivers might have occurred, resulting in insignificant associations
for some factors.
8.5. Directions for future research
There is a strong need for lobbying for funding and investment in the development of assessment
tools, and guidelines for preventative and management interventions for children with ASD and
possibly other related NDD in Africa. Further studies are needed to understand the pathogenesis of
ASD, for instance genomics studies, identification of biological and neurophysiological biomarkers
and prospective follow up studies of children with ASD, to examine long-term consequences. Further
studies in this population can focus on refining and characterizing the phenotype of ASD in Africa,
comparing with other settings worldwide. There is need to further investigate the BAP in other close
relatives and to relate to molecular genetic differences as well as examining the neuroanatomical and
neurofunctional correlates of the BAP, comparing with that of children with ASD. Further studies are
also needed to understand the mechanisms for associations between communicable diseases such as
malaria and ASD or other NDD, and on the interaction between genetic and environmental factors
specifically associated with these disorders. Furthermore, future studies need to examine the
mechanisms through which advanced age in fathers is associated with spontaneous mutations for ASD
in the offspring, but it is possible advanced age increases the probability of transmitting more ASD-
penetrant mutations to the offspring. Finally, there is an urgent need for raising public awareness
about the causes, risk factors and nature of ASD in SSA to improve understanding, acceptance and
provision of care for children with ASD in Tanzania and other similar settings in SSA.
8.6. Conclusions
In summary, the systematic review increases our understanding of the BAP profile in parents of
probands with ASD, allowing appreciation of potential varying underlying genetic mechanisms in
ASD, and need for tailored interventions for both children with ASD and their close relatives.
Evidence from the systematic review pointed towards mild social/communication deficits, rigid/aloof
personality traits, and pragmatic language difficulties as the most useful social behavioural candidate
endophenotype traits, but more research is required to clarify the cognitive domains of BAP since
deficits in this domain, like socio-behavioural ones, does suggest familial vulnerability for ASD.
Furthermore, increased depressed mood and anxiety can also be useful markers of vulnerability for
ASD. The Kiswahili adaptation of the AQ provides preliminary evidence that the prevalence of BAP
is relatively high particularly in parents of probands with ASD in SSA, and warrants further
investigations in future studies.

168
Our findings also indicate consistent emerging sub-themes with regards to knowledge of the
identification and presentation of ASD and its‘ perceived causes, and the challenges experienced by
caregivers, that should be addressed through future sensitization programs. These awareness programs
should take into consideration the recommendations that were raised by the study participants such as
increasing investment in facilities and appropriate diagnostic tools. After careful translation and
adaptation of the SCQ and AQ, our findings indicate that the SCQ is a reliable and valid screening
measure of ASD symptoms in this population and the AQ has fairly acceptable psychometric
properties which may highlight reasonable cross-cultural stability of autistic traits in this population.
Nonetheless, validation and adaptation of other ASD assessment and BAP tools should be encouraged
through collaborative efforts between researchers, stakeholders and policy makers.
Additionally, this study identified postnatal malaria (before age 3 years) and father being older than
mother as a significant independent risk factor unique to ASD, both of which render credibility to the
double hit hypothesis. Other factors such as seizures disorders and head injury were more important to
other NDD that were not ASD, implying symptomatic pathology is more important in the former
disorders. Our results highlight the importance of ASD research and its association with malaria in
SSA populations since in this region infectious disease like malaria (Mankoski et al., 2006) which are
associated with central nervous system complications (Carter et al., 2003) continue to be a major
public health concern. Further research is warranted to understand the pathophysiological and
pathogenetic mechanisms for development of ASD and other related NDD in this and other settings of
SSA.

169
References
1. Abrahams, B.S., & Geschwind, D.H. (2008). Advances in autism genetics: on the threshold of
a new neurobiology. Nature Reviews Genetics, 9(5), 341-355.
https://doi.org/10.1038/nrg2346
2. Abubakar, A., Ssewanyana, D., de Vries, P. J., & Newton, C. R. (2016a). Autism spectrum
disorders in sub-Saharan Africa. The Lancet Psychiatry, 3(9), 800-802.
https://doi.org/10.1016/S2215-0366(16)30138-9
3. Abubakar, A., Ssewanyana, D., & Newton, C. R. (2016b). A systematic review of Autism
Spectrum Disorders in sub-Saharan Africa. Behavioural Neurology, 2016.
http://dx.doi.org/10.1155/2016/3501910
4. Abuga, J. A., Kariuki, S. M., Kinyanjui, S. M., Van Hensbroek, M. B., & Newton, C. R.
(2019). Premature mortality in children aged 6–9 years with neurological impairments in rural
Kenya: a cohort study. The Lancet Global Health, 7(12), e1728-e1735.
https://doi.org/10.1016/S2214-109X(19)30425-5
5. Adolphs, R., Spezio, M. L., Parlier, M. & Piven, J. (2008). Distinct face-processing strategies
in parents of autistic children. Current Biology, 18(14), 1090-1093.
https://doi.org/10.1016/j.cub.2008.06.073
6. Albores-Gallo, L., Roldán-Ceballos, O., Villarreal-Valdes, G., Betanzos-Cruz, B. X., Santos-
Sánchez, C., Martínez-Jaime, M. M., ... & Hilton, C. L. (2012). M-CHAT Mexican version
validity and reliability and some cultural considerations. ISRN neurology, 2012.
http://dx.doi.org/10.5402/2012/408694
7. Ambikile, J. S., & Outwater, A. (2012). Challenges of caring for children with mental
disorders: Experiences and views of caregivers attending the outpatient clinic at Muhimbili
National Hospital, Dar es Salaam-Tanzania. Child and Adolescent Psychiatry and Mental
Health, 6(1), 16. https://doi.org/10.1186/1753-2000-6-16
8. American Psychiatric Association. (2013). Diagnostic and statistical manual of mental
disorders (DSM-5,5th ed.), Arlington, VA: American Psychiatric Publishing.
9. Andersen, C. H., Thomsen, P. H., Nohr, E. A., & Lemcke, S. (2018). Maternal body mass
index before pregnancy as a risk factor for ADHD and autism in children. European Child &
Adolescent Psychiatry, 27(2), 139-148. https://doi.org/10.1007/s00787-017-1027-6
10. Atladóttir, H. Ó., Henriksen, T. B., Schendel, D. E., & Parner, E. T. (2012). Autism after
infection, febrile episodes, and antibiotic use during pregnancy: an exploratory
study. Pediatrics, 130(6), e1447-e1454. https://doi.org/10.1542/peds.2012-1107
11. Austin, E. J. (2005). Personality correlates of the broader autism phenotype as assessed by the
Autism Spectrum Quotient (AQ). Personality and Individual Differences, 38(2), 451-460.
https://doi.org/10.1016/j.paid.2004.04.022
170
12. Avcil, S., Baykara, B., Baydur, H., Münir, K. M., & Emiroğlu, N. I. (2015). The validity and
reliability of the Social Communication Questionnaire-Turkish form in autistics aged 4-18
years. Turkish Journal of Psychiatry, 26(1), 56-64.
13. Baduel, S., Guillon, Q., Afzali, M. H., Foudon, N., Kruck, J., & Rogé, B. (2017). The French
version of the Modified-Checklist for Autism in Toddlers (M-CHAT): a validation study on a
French sample of 24 month-old children. Journal of Autism and Developmental
Disorders, 47(2), 297-304. https://doi.org/10.1007/s10803-016-2950-y
14. Bailey, A., Le Couteur, A., Gottesman, I., Bolton, P., Simonoff, E., Yuzda, F. Y., & Rutter,
M. (1995). Autism as a strongly genetic disorder: Evidence from a British twin study.
Psychological Medicine, 25(1), 63-77. https://doi.org/10.1017/S0033291700028099
15. Bakare, M. O., Ebigbo, P. O., Agomoh, A. O., & Menkiti, N. C. (2008). Knowledge about
childhood autism among health workers (KCAHW) questionnaire: description, reliability and
internal consistency. Clinical Practice and Epidemiology in Mental Health, 4(1), 17.
https://doi.org/10.1186/1745-0179-4-17
16. Bakare, M. O., Agomoh, A. O., Ebigbo, P. O., Eaton, J., Okonkwo, K. O., Onwukwe, J. U., &
Onyeama, G. M. (2009a). Etiological explanation, treatability and preventability of childhood
autism: a survey of Nigerian healthcare workers' opinion. Annals of General Psychiatry, 8(1),
6. https://doi.org/10.1186/1744-859X-8-6
17. Bakare, M. O., Ebigbo, P. O., Agomoh, A. O., Eaton, J., Onyeama, G. M., Okonkwo, K. O.,
... & Aguocha, C. M. (2009b). Knowledge about childhood autism and opinion among
healthcare workers on availability of facilities and law caring for the needs and rights of
children with childhood autism and other developmental disorders in Nigeria. BMC
Pediatrics, 9, 12. https://doi.org/10.1186/1471-2431-9-12
18. Bakare, M. O., & Munir, K. M. (2011a). Autism spectrum disorders (ASD) in Africa: a
perspective. African Journal of Psychiatry, 14(3), 208-210.
https://doi.org/10.4314/ajpsy.v14i3.3
19. Bakare, M. O., & Munir, K. M. (2011b). Excess of nonverbal cases of autism spectrum
disorders presenting to orthodox clinical practice in Africa - a trend possibly resulting from
late diagnosis and intervention. South African Journal of Psychiatry, 17(4), 118-120.
20. Bakare, M. O., Munir, K. M., & Bello-Mojeed, M. A. (2014). Public health and research
funding for childhood neurodevelopmental disorders in Sub-Saharan Africa: a time to balance
priorities. Healthcare in Low-Resource Settings, 2(1). https://doi.org/10.4081/hls.2014.1559
21. Barnevik–Olsson, M., Gillberg, C., & Fernell, E. (2008). Prevalence of autism in children
born to Somali parents living in Sweden: a brief report. Developmental Medicine & Child
Neurology, 50(8), 598-601. https://doi.org/10.1111/j.1469-8749.2008.03036.x
22. Baron-Cohen, S. & Hammer, J. (1997). Parents of children with Asperger Syndrome: what is
the cognitive phenotype? Journal of Cognitive Neuroscience, 9(4), 548-554.
171
23. Baron-Cohen, S., Wheelwright S., Skinner, R., Martin J., & Clubley, E. (2001). The Autism
Spectrum Quotient (AQ): Evidence from Asperger syndrome/high functioning autism, males
and females, scientists and mathematicians. Journal of Autism and Developmental Disorders,
31(1), 5-17. https://doi.org/10.1023/A:1005653411471
24. Baron-Cohen, S., Lombardo, M. V., Auyeung, B., Ashwin, E., Chakrabarti, B., &
Knickmeyer, R. (2011). Why are autism spectrum conditions more prevalent in males? PLoS
Biology, 9(6). https://doi.org/10.1371/journal.pbio.1001081
25. Baxter, A. J., Brugha, T. S., Erskine, H. E., Scheurer, R. W., Vos, T., & Scott, J. G. (2015).
The epidemiology and global burden of autism spectrum disorders. Psychological
Medicine, 45(3), 601-613. https://doi.org/10.1017/S003329171400172X
26. Becerra, T. A. (2013). Perinatal Risk Factors and Autism in Los Angeles County: The Role of
Air Pollution, Maternal Race/Ethnicity and Nativity (Doctoral dissertation, UCLA).
27. Belhadj, A., Mrad, R., & Halayem, M. B. (2006). A clinic and paraclinic study of Tunisian
population of children with autism. About 63 cases. La Tunisie Médicale, 84(12), 763-767.
28. Bernier, R., Gerdts, J., Munson, J., Dawson, G., & Estes, A. (2012). Evidence for broader
autism phenotype characteristics in parents from multiple incidence autism families. Autism
Research, 5(1), 13–20. https://doi.org/10.1002/aur.226
29. Berthoz, S., Lalanne, C., Crane, L., & Hill, E. L. (2013). Investigating emotional impairments
in adults with autism spectrum Disorders and the broader autism phenotype. Psychiatry
Research, 208(3), 257–264. https://doi.org/10.1016/j.psychres.2013.05.014
30. Berument, S. K., Rutter, M., Lord, C., Pickles, A., & Bailey, A. (1999). Autism Screening
Questionnaire: diagnostic validity. The British Journal of Psychiatry, 175(5), 444-451.
https://doi.org/10.1192/bjp.175.5.444
31. Bishop, D. V., Maybery, M., Maley, A., Wong, D., Hill, W. & Hallmayer, J. (2004a). Using
self-report to identify the broad phenotype in parents of children with autistic spectrum
disorders: a study using the Autism-Spectrum Quotient. Journal of Child Psychology and
Psychiatry, 45(8), 1431-1436. https://doi.org/10.1111/j.1469-7610.2004.00325.x
32. Bishop, D. V., Maybery, M., Wong, D., Maley, A., Hill, W. & Hallmayer, J. (2004b). Are
phonological processing deficits part of the broad autism phenotype? American Journal of
Medical Genetics Part B: Neuropsychiatric Genetics, 128(1), 54–60.
https://doi.org/10.1002/ajmg.b.30039
33. Bitta, M., Kariuki, S. M., Abubakar, A., & Newton, C. R. J. (2017). Burden of
neurodevelopmental disorders in low and middle-income countries: A systematic review and
meta-analysis. Wellcome Open Research, 2(121), 1-18.
https://dx.doi.org/10.12688%2Fwellcomeopenres.13540.3

172
34. Bölte, S. & Poustka, F. (2003). The recognition of facial affect in autistic and schizophrenic
subjects and their first-degree relatives. Psychological Medicine, 33(5), 907- 915.
https://doi.org/10.1017/S0033291703007438
35. Bölte, S. & Poustka, F. (2006). The broader cognitive phenotype of autism in parents: how
specific is the tendency for local processing and executive dysfunction? Journal of Child
Psychology and Psychiatry, 47(6), 639-645. https://doi.org/10.1111/j.1469-
7610.2006.01603.x
36. Bölte, S., Knecht, S. & Poustka, F. (2007). A case-control study of personality style and
psychopathology in parents of subjects with autism. Journal of Autism and Developmental
Disorders, 37(2), 243-250. https://doi.org/10.1007/s10803-006-0165-3
37. Bölte, S., Poustka, F., & Constantino, J. N. (2008a). Assessing autistic traits: Cross‐cultural
validation of the Social Responsiveness Scale (SRS). Autism Research, 1(6), 354-363.
https://doi.org/10.1002/aur.49
38. Bölte, S., Holtmann, M., & Poustka, F. (2008b). The Social Communication Questionnaire
(SCQ) as a screener for autism spectrum disorders: additional evidence and cross-cultural
validity. Journal of the American Academy of Child & Adolescent Psychiatry, 47(6), 719–
720. https://doi.org/10.1097/CHI.0b013e31816c42bd
39. Bora, E., Aydın, A., Saraç, T., Kadak, M. T., & Köse, S. (2017). Heterogeneity of subclinical
autistic traits among parents of children with autism spectrum disorder: Identifying the
broader autism phenotype with a data‐driven method. Autism Research, 10(2), 321-326.
https://doi.org/10.1002/aur.1661
40. Bosl, W. J., Loddenkemper, T., & Nelson, C. A. (2017). Nonlinear EEG biomarker profiles
for autism and absence epilepsy. Neuropsychiatric Electrophysiology, 3(1), 1.
https://doi.org/10.1186/s40810-017-0023-x
41. Briskman, J., Happé, F. & Frith, U. (2001). Exploring the cognitive phenotype of autism:
weak ―central coherence‖ in parents and siblings of children with autism: II. Real-life skills
and preferences. Journal of Child Psychology and Psychiatry and Allied Disciplines, 42(3),
309- 316. https://doi.org/10.1017/S0021963001006904
42. Broadbent, J., Galic, I., & Stokes, M. A. (2013). Validation of Autism Spectrum Quotient
adult version in an Australian sample. Autism Research and Treatment, 2013, 1-7.
https://doi.org/10.1155/2013/984205
43. Browne, M. W., & Cudeck, R. (1992). Alternative ways of assessing model fit. Sociological
Methods and Research, 21(2), 230-258. https://doi.org/10.1177%2F0049124192021002005
44. Canal-Bedia, R., García-Primo, P., Martín-Cilleros, M. V., Santos-Borbujo, J., Guisuraga-
Fernández, Z., Herráez-García, L., ... & Posada-de La Paz, M. (2011). Modified checklist for
autism in toddlers: cross-cultural adaptation and validation in Spain. Journal of Autism and
Developmental Disorders, 41(10), 1342-1351. https://doi.org/10.1007/s10803-010-1163-z

173
45. Carter, J. A., Neville, B. G., & Newton, C. R. (2003). Neuro-cognitive impairment following
acquired central nervous system infections in childhood: a systematic review. Brain Research
Reviews, 43(1), 57-69. https://doi.org/10.1016/S0165-0173(03)00192-9
46. Carter, J. A., Lees, J. A., Gona, J. K., Murira, G., Rimba, K., Neville, B. G., & Newton, C. R.
(2006). Severe falciparum malaria and acquired childhood language disorder. Developmental
Medicine and Child Neurology, 48(1), 51-57. https://doi.org/10.1017/S0012162206000107
47. Chandler, S., Charman, T., Baird, G., Simonoff, E., Loucas, T. O. M., Meldrum, D., ... &
Pickles, A. (2007). Validation of the Social Communication Questionnaire in a population
cohort of children with autism spectrum disorders. Journal of the American Academy of Child
& Adolescent Psychiatry, 46(10), 1324-1332. https://doi.org/10.1097/chi.0b013e31812f7d8d
48. Charman, T., Baird, G., Simonoff, E., Loucas, T., Chandler, S., Meldrum, D., & Pickles, A.
(2007). Efficacy of three screening instruments in the identification of autistic-spectrum
disorders. The British Journal of Psychiatry, 191(6), 554-559.
https://doi.org/10.1192/bjp.bp.107.040196
49. Chesnut, S. R., Wei, T., Barnard-Brak, L., & Richman, D. M. (2017). A meta-analysis of the
social communication questionnaire: screening for autism spectrum disorder. Autism, 21(8),
920-928. https://doi.org/10.1177%2F1362361316660065
50. Chien, Y., Chou, M. C., Chou, W. J., Wu, Y. Y., Tsai, W. C., Chiu, Y. N., & Gau, S. S. F.
(2018). Prenatal and perinatal risk factors and the clinical implications on autism spectrum
disorder. Autism; 23(3), 783-79. https://doi.org/10.1177/1362361318772813
51. Claassen, M., Naudé, H., Pretorius, E., & Bosman, M. C. (2008). The contribution of prenatal
stress to the pathogenesis of autism as a neurobiological developmental disorder: a dizygotic
twin study. Early Child Development and Care, 178(5), 487-511.
https://doi.org/10.1080/03004430600851173
52. Cohen, J. (1988). Statistical power analysis for the behavioural science (2nd ed.). Hillsdale,
NJ: Lawrence Erlbaum Associates.
53. Constantino, J. N., & Todd, R. D. (2005). Intergenerational transmission of subthreshold
autistic traits in the general population. Biological Psychiatry, 57(6), 655-660.
https://doi.org/10.1016/j.biopsych.2004.12.014
54. Constantino, J. N., Zhang, Y. I., Frazier, T., Abbacchi, A. M. & Law, P. (2010). Sibling
recurrence and the genetic epidemiology of autism. American Journal of Psychiatry, 167(11),
1349–1356. https://doi.org/10.1176/appi.ajp.2010.09101470
55. Cruz, L. P., Camargos-Júnior, W., & Rocha, F. L. (2013). The broad autism phenotype in
parents of individuals with autism: a systematic review of the literature. Trends in Psychiatry
and Psychotherapy, 35(4): 252-263. https://doi.org/10.1590/2237-6089-2013-0019

174
56. das Neves, M. D. C. L., Tremeau, F., Nicolato, R., Lauar, H., Romano-Silva, M. A., &
Correa, H. (2011). Facial emotion recognition deficits in relatives of children with autism are
not associated with 5HTTLPR. Revista Brasileira de Psiquiatria, 33(3), 261-7.
57. Davidson, J., Goin-Kochel, R. P., Green-Snyder, L. A., Hundley, R. J., Warren, Z., & Peters,
S. U. (2014). Expression of the broad autism phenotype in simplex autism families from the
Simons Simplex Collection. Journal of Autism and Developmental Disorders, 44(10), 2392–
2399. https://doi.org/10.1007/s10803-012-1492-1
58. de Jonge, M. V., Kemner, C., & van Engeland, H. (2006). Superior disembedding
performance of high-functioning individuals with autism spectrum disorders and their
parents: The need for subtle measures. Journal of Autism and Developmental Disorders,
36(5), 677-83. https://doi.org/10.1007/s10803-006-0113-2
59. de Jonge, M. V., Kemner, C., De Haan, E. H., Coppens, J. E., Van den Berg, T. J. T. P., &
Van Engeland, H. (2007). Visual information processing in high-functioning individuals with
autism spectrum disorders and their parents. Neuropsychology, 21(1), 65-73.
https://doi.org/10.1037/0894-4105.21.1.65
60. de Jonge, M., Kemner, C., Naber, F., & Van Engeland, H. (2009). Block design
reconstruction skills: not a good candidate for an endophenotypic marker in autism research.
European Child and Adolescent Psychiatry, 18(4), 197-205. https://doi.org/10.1007/s00787-
008-0708-6
61. De la Marche, W., Noens, I., Luts, J., Scholte, E., Van Huffel, S., & Steyaert, J. (2012).
Quantitative autism traits in first degree relatives: evidence for the broader autism phenotype
in fathers, but not in mothers and siblings. Autism, 16(3), 247–260.
https://doi.org/10.1177/1362361311421776
62. de Leeuw, A., Happé, F., & Hoekstra, R. A. (2020). A conceptual framework for
understanding the cultural and contextual factors on autism across the globe. Autism
Research. https://doi.org/10.1002/aur.2276
63. Desai, M. U., Divan, G., Wertz, F. J., & Patel, V. (2012). The discovery of autism: Indian
parents‘ experiences of caring for their child with an autism spectrum disorder. Transcultural
Psychiatry, 49(3-4), 613-637. https://doi.org/10.1177%2F1363461512447139
64. Di Michelle, V., Mazza, M., Cerbo, R., Roncone, R., & Casacchia, M. (2007). Deficits in
pragmatic conversation as manifestation of genetic liability in autism. Clinical
Neuropsychiatry, 4(4): 144-51.
65. Divan, G., Vajaratkar, V., Desai, M. U., Strik‐Lievers, L., & Patel, V. (2012). Challenges,
coping strategies, and unmet needs of families with a child with autism spectrum disorder in
Goa, India. Autism Research, 5(3), 190-200. https://doi.org/10.1002/aur.1225
66. Dunn, L. M., & Dunn, L. M. (1981). Peabody Picture Vocabulary Test-Revised. Circle Pines,
MN: American Guidance Service, Inc.

175
67. Durkin, M. S., Wang, W., Shrout, P. E., Zaman, S. S., Hasan, Z. M., Desai, P., & Davidson,
L. L. (1995). Evaluating a ten questions screen for childhood disability: reliability and
internal structure in different cultures. Journal of Clinical Epidemiology, 48(5), 657-666.
https://doi.org/10.1016/0895-4356(94)00163-K
68. Durkin, M. S., Maenner, M. J., Newschaffer, C. J., Lee, L. C., Cunniff, C. M., Daniels, J. L.,
... & Schieve, L. A. (2008). Advanced parental age and the risk of autism spectrum
disorder. American Journal of Epidemiology, 168(11), 1268-1276.
https://doi.org/10.1093/aje/kwn250
69. Eaves, L. C., Wingert, H. D., Ho, H. H., & Mickelson, E. C. (2006). Screening for autism
spectrum disorders with the Social Communication Questionnaire. Journal of Developmental
& Behavioral Pediatrics, 27(2), S95-S103.
70. Ecker, C., Bookheimer, S. Y., & Murphy, D. G. (2015). Neuroimaging in autism spectrum
disorder: brain structure and function across the lifespan. The Lancet Neurology, 14(11),
1121-1134. https://doi.org/10.1016/S1474-4422(15)00050-2
71. Edward, G. (2015). Teachers‘ knowledge and perceived challenges of teaching children with
autism in Tanzanian regular primary schools. International Journal of Academic Research
and Reflection, 3(5), 36-47.
72. Elsabbagh, M., Divan, G., Koh, Y. J., Kim, Y. S., Kauchali, S., Marcín, C., ... & Fombonne,
E. (2012). Global prevalence of autism and other pervasive developmental disorders. Autism
Research, 5(3), 160-179. https://doi.org/10.1002/aur.239
73. Eseigbe, E. E., Nuhu, F. T., Sheikh, T. L., Eseigbe, P., Sanni, K. A., & Olisah, V. O. (2015).
Knowledge of childhood autism and challenges of management among medical doctors in
Kaduna State, Northwest Nigeria. Autism Research and Treatment, 2015.
https://doi.org/10.1155/2015/892301
74. Folstein, S. E., Santangelo, S. L., Gilman, S. E., Piven, J., Landa, R., Lainhart, J., … &
Wzorek, M. (1999). Predictors of cognitive test patterns in autism families. Journal of Child
Psychology and Psychiatry and Allied Disciplines, 40(7), 1117-1128.
https://doi.org/10.1111/1469-7610.00528
75. Fombonne, E., Bolton, P., Prior, J., Jordan, H. & Rutter, M. (1997). A family study of autism:
Cognitive patterns and levels in parents and siblings. Journal of Child Psychology and
Psychiatry, 38(6), 667-683. https://doi.org/10.1111/j.1469-7610.1997.tb01694.x
76. Fombonne, E. (2005). Epidemiology of autistic disorder and other pervasive developmental
disorders. The Journal of Clinical Psychiatry, 66(Suppl 10), 3-8.
77. Franz, L., Chambers, N., von Isenburg, M., & de Vries, P. J. (2017). Autism spectrum
disorder in sub-Saharan Africa: A comprehensive scoping review. Autism Research, 10(5),
723-749. https://doi.org/10.1002/aur.1766
176
78. Freeth, M., Sheppard, E., Ramachandran, R., & Milne, E. (2013). A cross-cultural
comparison of autistic traits in the UK, India and Malaysia. Journal of Autism and
Developmental Disorders, 43(11), 2569-2583. https://doi.org/10.1007/s10803-013-1808-9
79. Freitag, C. M., Staal, W., Klauck, S. M., Duketis, E., & Waltes, R. (2010). Genetics of autistic
disorders: review and clinical implications. European Child & Adolescent Psychiatry, 19(3),
169-178. https://doi.org/10.1007/s00787-009-0076-x
80. Gardener, H., Spiegelman, D., & Buka, S. L. (2009). Prenatal risk factors for autism:
comprehensive meta-analysis. The British Journal of Psychiatry, 195(1), 7-14.
https://doi.org/10.1192/bjp.bp.108.051672
81. Gardener, H., Spiegelman, D., & Buka, S. L. (2011). Perinatal and neonatal risk factors for
autism: a comprehensive meta-analysis. Pediatrics, 128(2), 344-355.
https://doi.org/10.1542/peds.2010-1036
82. Gau, S. S. F., Lee, C. M., Lai, M. C., Chiu, Y. N., Huang, Y. F., Kao, J. D., & Wu, Y. Y.
(2011). Psychometric properties of the Chinese version of the Social Communication
Questionnaire. Research in Autism Spectrum Disorders, 5(2), 809-818.
https://doi.org/10.1016/j.rasd.2010.09.010
83. Gau, S. S. F., Liu, L. T., Wu, Y. Y., Chiu, Y. N., & Tsai, W. C. (2013). Psychometric
properties of the Chinese version of the social responsiveness scale. Research in Autism
Spectrum Disorders, 7(2), 349-360. https://doi.org/10.1016/j.rasd.2012.10.004
84. Gentile, S. (2014). Risks of neurobehavioral teratogenicity associated with prenatal exposure
to valproate monotherapy: a systematic review with regulatory repercussions. CNS
Spectrums, 19(4), 305-315. https://doi.org/10.1017/S1092852913000990
85. Gerdts, J., Bernier, R. (2011). The broader autism phenotype and its implications on the
etiology and treatment of autism spectrum disorders. Autism Research and Treatment, 2011.
https://doi.org/10.1155/2011/545901
86. Getz, K. D., Anderka, M. T., Werler, M. M., & Jick, S. S. (2016). Maternal Pre‐pregnancy
Body Mass Index and Autism Spectrum Disorder among Offspring: A Population‐Based
Case–Control Study. Paediatric and Perinatal Epidemiology, 30(5), 479-487.
https://doi.org/10.1111/ppe.12306
87. Gillberg, C., & Coleman, M. (2000). The biology of the autistic syndromes (3rd Ed).
Cambridge, UK: Cambridge University Press.
88. Girirajan, S., & Eichler, E. E. (2010). Phenotypic variability and genetic susceptibility to
genomic disorders. Human Molecular Genetics, 19(R2), R176-R187.
https://doi.org/10.1093/hmg/ddq366
89. Gokcen, S., Bora, E., Erermis, S., Kesikci, H. & Aydin, C. (2009). Theory of Mind and verbal
working memory deficits in parents of autistic children. Psychiatry Research, 166(1), 46-53.
https://doi.org/10.1016/j.psychres.2007.11.016

177
90. Gona, J. K., Newton, C. R., Rimba, K., Mapenzi, R., Kihara, M., Van de Vijver, F. J., &
Abubakar, A. (2015). ). Parents‘ and professionals‘ perceptions on causes and treatment
options for Autism Spectrum Disorders (ASD) in a multicultural context on the Kenyan
Coast. PLoS ONE, 10(8), e0132729. https://doi.org/10.1371/journal.pone.0132729
91. Gona, J. K., Newton, C. R., Rimba, K. K., Mapenzi, R., Kihara, M., Vijver, F. V., &
Abubakar, A. (2016). Challenges and coping strategies of parents of children with autism on
the Kenyan coast. Rural Remote Health, 16(2), 3517.
92. Gong, T., Dalman, C., Wicks, S., Dal, H., Magnusson, C., Lundholm, C., ... & Pershagen, G.
(2017). Perinatal exposure to traffic-related air pollution and autism spectrum
disorders. Environmental health perspectives, 125(1), 119-126.
https://doi.org/10.1289/EHP118
93. Gorsuch, R. L. (1983). Factor analysis. Hillsdale, NJ: Erlbaum.
94. Gottesman, I. I. & Gould, T. D. (2003). The endophenotype concept in psychiatry; etymology
and strategic intentions. The American Journal of Psychiatry, 160(4), 636- 645.
https://doi.org/10.1176/appi.ajp.160.4.636
95. Granader, Y. E., Bender, H. A., Zemon, V., Rathi, S., Nass, R., & MacAllister, W. S. (2010).
The clinical utility of the Social Responsiveness Scale and Social Communication
Questionnaire in tuberous sclerosis complex. Epilepsy & Behavior, 18(3), 262-266.
http://dx.doi.org/10.1016/j.yebeh.2010.04.010
96. Guo, Y. Q., Tang, Y., Rice, C., Lee, L. C., Wang, Y. F., & Cubells, J. F. (2011). Validation of
the autism spectrum screening questionnaire, Mandarin Chinese version (CH-ASSQ) in
Beijing, China. Autism, 15(6), 713-727. https://doi.org/10.1177%2F1362361310396383
97. Hadjkacem, I., Ayadi, H., Turki, M., Yaich, S., Khemekhem, K., Walha, A., ... & Ghribi, F.
(2016). Prenatal, perinatal and postnatal factors associated with autism spectrum
disorder. Jornal de Pediatria, 92(6), 595-601. https://doi.org/10.1016/j.jped.2016.01.012
98. Hagberg, H., Edwards, A. D., & Groenendaal, F. (2016). Perinatal brain damage: the term
infant. Neurobiology of Disease, 92, 102-112. https://doi.org/10.1016/j.nbd.2015.09.011
99. Haglund, N. G., & Källén, K. B. (2011). Risk factors for autism and Asperger syndrome:
perinatal factors and migration. Autism, 15(2), 163-183.
https://doi.org/10.1177%2F1362361309353614
100. Hall, S. S., Lightbody, A. A., Hirt, M., Rezvani, A., & Reiss, A. L. (2010). Autism in fragile
X syndrome: a category mistake? Journal of the American Academy of Child & Adolescent
Psychiatry, 49(9), 921-933. http://dx.doi.org/10.1016/j.jaac.2010.07.001
101. Hallmayer, J., Cleveland, S., Torres, A., Phillips, J., Cohen, B., Torigoe, T., ... & Risch, N.
(2011). Genetic heritability and shared environmental factors among twin pairs with
autism. Archives of General Psychiatry, 68(11), 1095-
1102. https://doi.org/10.1001/archgenpsychiatry.2011.76

178
102. Happé, F., Frith, U. & Briskman, J. (2001). Exploring the cognitive phenotype of autism:
weak ―central coherence‖ in parents and siblings of children with autism: I. Experimental
tests. Journal of Child Psychology and Psychiatry and Allied Discipline, 42(3), 299-307.
https://doi.org/10.1017/S0021963001006916
103. Harrison, A. J., Zimak, E. H., Sheinkopf, S. J., Manji, K. P., & Morrow, E. M. (2014).
Observation-centered approach to ASD assessment in Tanzania. Intellectual and
Developmental Disabilities, 52(5), 330-347. https://doi.org/10.1352/1934-9556-52.5.330
104. Hisle-Gorman, E., Susi, A., Stokes, T., Gorman, G., Erdie-Lalena, C., & Nylund, C. M.
(2018). Prenatal, perinatal, and neonatal risk factors of autism spectrum disorder. Pediatric
Research, 84(2), 190-198. https://doi.org/10.1038/pr.2018.23
105. Hoekstra, R. A., Bartels, M., Cath, D. C., & Boomsma, D. I. (2008). Factor structure,
reliability and criterion validity of the Autism-Spectrum Quotient (AQ): a study in Dutch
population and patient groups. Journal of Autism and Developmental Disorders, 38(8), 1555-
1566. https://doi.org/10.1007/s10803-008-0538-x
106. Holding, P. A., Taylor, H. G., Kazungu, S. D., Mkala, T., Gona, J., Mwamuye, B., ... &
Stevenson, J. (2004). Assessing cognitive outcomes in a rural African population:
development of a neuropsychological battery in Kilifi District, Kenya. Journal of the
International Neuropsychological Society, 10(2), 246-260.
https://doi.org/10.1017/S1355617704102166
107. Hudson, C. G. (2005). Socioeconomic status and mental illness: tests of the social causation
and selection hypotheses. American Journal of Orthopsychiatry, 75(1), 3-18.
https://doi.org/10.1037/0002-9432.75.1.3
108. Hughes, C., Leboyer, M. & Bouvard, M. (1997). Executive function in parents of children
with autism. Psychological Medicine, 27(1), 209-220.
https://doi.org/10.1017/S0033291796004308
109. Hurley, R. S. E., Losh, M., Parlier, M., Reznick, J. S., & Piven, J. (2007). The Broad Autism
Phenotype Questionnaire. Journal of Autism and Developmental Disorders, 37, 1679-1690.
https://doi.org/10.1007/s10803-006-0299-3
110. Idring, S., Magnusson, C., Lundberg, M., Ek, M., Rai, D., Svensson, A. C., ... & Lee, B. K.
(2014). Parental age and the risk of autism spectrum disorders: findings from a Swedish
population-based cohort. International journal of epidemiology, 43(1), 107-115.
https://doi.org/10.1093/ije/dyt262
111. Idro, R., Ndiritu, M., Ogutu, B., Mithwani, S., Maitland, K., Berkley, J., ... & Marsh, K.
(2007). Burden, features, and outcome of neurological involvement in acute falciparum
malaria in Kenyan children. The Journal of the American Medical Association, 297(20),
2232-2240. http://doi.org/10.1001/jama.297.20.2232

179
112. Igwe, M. N., Ahanotu, A. C., Bakare, M. O., Achor, J. U., & Igwe, C. (2011). Assessment of
knowledge about childhood autism among paediatric and psychiatric nurses in Ebonyi State,
Nigeria. Child and Adolescent Psychiatry and Mental Health, 5(1), 1.
https://doi.org/10.1186/1753-2000-5-1
113. Inada, N., Koyama, T., Inokuchi, E., Kuroda, M., & Kamio, Y. (2011). Reliability and
validity of the Japanese version of the Modified Checklist for autism in toddlers (M-
CHAT). Research in Autism Spectrum Disorders, 5(1), 330-336.
https://doi.org/10.1016/j.rasd.2010.04.016
114. Ingersoll, B., Meyer, K., & Becker, M. W. (2011). Increased rates of depressed mood in
mothers of children with ASD associated with the presence of the broader autism phenotype.
Autism Research, 4(2), 143-148. https://doi.org/10.1002/aur.170
115. Kadak, M. T., Demiel, Ö. F., Yavuz, M., & Demir, T. (2014). Recognition of emotional facial
expressions and broad autism phenotype in parents of children diagnosed with autistic
spectrum disorder. Comprehensive Psychiatry, 55(5), 1146–1151.
https://doi.org/10.1016/j.comppsych.2014.03.004
116. Kakooza-Mwesige, A., Ssebyala, K., Karamagi, C., Kiguli, S., Smith, K., Anderson, M. C., ...
& Grether, J. K. (2014). Adaptation of the ―ten questions‖ to screen for autism and other
neurodevelopmental disorders in Uganda. Autism, 18(4), 447-457.
https://doi.org/10.1177%2F1362361313475848
117. Kariuki, S. M., Ikumi, M., Ojal, J., Sadarangani, M., Idro, R., Olotu, A., ... & Newton, C. R.
(2011). Acute seizures attributable to falciparum malaria in an endemic area on the Kenyan
coast. Brain, 134(5), 1519-1528. https://doi.org/10.1093/brain/awr051
118. Kariuki, S. M., Chengo, E., Ibinda, F., Odhiambo, R., Etyang, A., Ngugi, A. K., & Newton,
C. R. J. C. (2015). Burden, causes, and outcomes of people with epilepsy admitted to a rural
hospital in Kenya. Epilepsia, 56(4), 577–584. http://doi.org/10.1111/epi.12935
119. Kariuki, S. M., Abubakar, A., Murray, E., Stein, A., & Newton, C. R. (2016). Evaluation of
psychometric properties and factorial structure of the Pre-School Child Behaviour Checklist
at the Kenyan Coast. Child and Adolescent Psychiatry and Mental Health, 10(1), 1.
https://doi.org/10.1186/s13034-015-0089-9
120. Kariuki, S. M., Abubakar, A., Kombe, M., Kazungu, M., Odhiambo, R., Stein, A., & Newton,
C. R. J. C. (2017a). Burden, risk factors, and comorbidities of behavioural and emotional
problems in Kenyan children: a population-based study. The Lancet. Psychiatry, 4(2), 136-
145. http://doi.org/10.1016/S2215-0366(16)30403-5
121. Kariuki, S. M., Abubakar, A., Stein, A., Marsh, K., & Newton, C. R. J. (2017b). Prevalence,
causes, and behavioral and emotional comorbidities of acute symptomatic seizures in Africa:
a critical review. Epilepsia Open, 2(1), 8–19. http://doi.org/10.1002/epi4.12035

180
122. Kolevzon, A., Gross, R., & Reichenberg, A. (2007). Prenatal and perinatal risk factors for
autism: a review and integration of findings. Archives of Pediatrics & Adolescent
Medicine, 161(4), 326-333. http://doi.org/10.1001/archpedi.161.4.326
123. Keen, D. V., Reid, F. D., & Arnone, D. (2010). Autism, ethnicity and maternal
immigration. The British Journal of Psychiatry, 196(4), 274-281.
https://doi.org/10.1192/bjp.bp.109.065490
124. Khan, K. S., ter Riet, G., Glanville, J., Sowden, A. J., & Kleijnen, J. (2001). Undertaking
systematic reviews of research on effectiveness: CRD Guidelines for those carrying out or
commissioning reviews (2nd ed.). York: York Publishing Services.
125. King, M. D., Fountain, C., Dakhlallah, D., & Bearman, P. S. (2009). Estimated autism risk
and older reproductive age. American Journal of Public Health, 99(9), 1673-1679.
https://doi.org/10.2105/AJPH.2008.149021
126. Kisanji, J. (1995). Interface between culture and disability in the Tanzanian context: Part
I. International Journal of Disability, Development and Education, 42(2), 93-108.
https://doi.org/10.1080/0156655950420202
127. Kitsao-Wekulo, P. K., Holding, P. A., Taylor, H. G., Abubakar, A., & Connolly, K. (2012).
Neuropsychological testing in a rural African school-age population: evaluating contributions
to variability in test performance. Assessment, 20(6), 776-784.
https://doi.org/10.1177%2F1073191112457408
128. Kline, P. (1979). Psychometrics and psychology. London: Academic Press.
129. Klusek , J., Losh., M., & Martin, G. E. (2014). Sex differences and within-family associations
in the broad autism phenotype. Autism, 18(2), 106-116.
https://doi.org/10.1177%2F1362361312464529
130. Koczat, D. L., Rogers, S. J., Pennington, B. F., & Ross, R. G. (2002). Eye movement
abnormality suggestive of a spatial working memory deficit is present in parents of autistic
probands. Journal of Autism and Developmental Disorders, 32(6), 513-518.
https://doi.org/10.1023/A:1021246712459
131. Kondolot, M., Özmert, E. N., Öztop, D. B., Mazıcıoğlu, M. M., Gümüş, H., & Elmalı, F.
(2016). The modified checklist for autism in Turkish toddlers: A different cultural adaptation
sample. Research in Autism Spectrum Disorders, 21, 121-127.
https://doi.org/10.1016/j.rasd.2015.10.006
132. Köse, S., Bora, E., Erermis, S., Özbaran, B., Bildik, T., & Aydin, C. (2013).Broader autistic
phenotype in parents of children with autism: Autism Spectrum Quotient – Turkish version.
Psychiatry and Clinical Neurosciences, 67(1), 20-27. https://doi.org/10.1111/pcn.12005
133. Landa, R., Folstein, S. E. & Isaacs, C. (1991). Spontaneous narrative-discourse performance
of parents of autistic individuals. Journal of Speech, Language and Hearing Research, 34(6),
1339-1345. https://doi.org/10.1044/jshr.3406.1339
181
134. Landa, R., Piven, J., Wzorek, M. M., Gayle, J. O., Chase, G. A., & Folstein, S. E. (1992).
Social language use in parents of autistic individuals. Psychological Medicine, 22(1), 245-
254. https://doi.org/10.1017/S0033291700032918
135. Larsson, H. J., Eaton, W. W., Madsen, K. M., Vestergaard, M., Olesen, A. V., Agerbo, E., ...
& Mortensen, P. B. (2005). Risk factors for autism: perinatal factors, parental psychiatric
history, and socioeconomic status. American Journal of Epidemiology, 161(10), 916-925.
https://doi.org/10.1093/aje/kwi123
136. Lau, W. Y. P., Gau, S. S. F., Chiu, Y. N., Wu, Y. Y., Chou, W. J., Liu, S. K., & Chou, M. C.
(2013). Psychometric properties of the Chinese version of the Autism Spectrum Quotient
(AQ). Research in Developmental Disabilities, 34(1), 294-305.
https://doi.org/10.1016/j.ridd.2012.08.005
137. Lauritsen, M. B., Pedersen, C. B., & Mortensen, P. B. (2005). Effects of familial risk factors
and place of birth on the risk of autism: a nationwide register‐based study. Journal of Child
Psychology and Psychiatry, 46(9), 963-971. https://doi.org/10.1111/j.1469-
7610.2004.00391.x
138. Le Couteur, A., Lord, C., and Rutter, M. (2003). Autism Diagnostic Interview-Revised (ADI-
R), Los Angeles: Western Psychological Services.
139. Lepage, J. F., Lortie, M., Taschereau-Dumouchel, V., & Théoret, H. (2009). Validation of
French-Canadian versions of the Empathy Quotient and Autism Spectrum
Quotient. Canadian Journal of Behavioural Science, Revue Canadienne des Sciences du
Comportement, 41(4), 272–276. https://doi.org/10.1037/a0016248
140. Lezak, M.D., Howieson, D.B., Bigler, E.D. & Tranel, D. (2012). Neuropsychological
Assessment (5th ed.). New York: Oxford University Press.
141. Lindgren, K. A., Folstein, S. E., Tomblin, J. B., & Tager-Flusberg, H. (2009). Language and
reading abilities of children with autism spectrum disorders and specific language impairment
and their first‐degree relatives. Autism Research, 2(1), 22-38. https://doi.org/10.1002/aur.63
142. Lord, C., Schopler, E., & Revicki, D. (1982). Sex differences in autism. Journal of Autism
and Developmental Disorders, 12(4), 317-330. https://doi.org/10.1007/BF01538320
143. Lord, C., Risi, S., Lambrecht, L., Cook, E. H., Leventhal, B. L., DiLavore, P. C., ... & Rutter,
M. (2000). The Autism Diagnostic Observation Schedule—Generic: A standard measure of
social and communication deficits associated with the spectrum of autism. Journal of Autism
and Developmental Disorders, 30(3), 205-223. https://doi.org/10.1023/A:1005592401947
144. Lord, C., Rutter, M., DiLavore, P. C., Risi, S., Gotham, K., & Bishop, S. (2012). Autism
Diagnostic Observation Schedule (2nd ed.). Torrance, CA: Western Psychological Services.
145. Losapio, M. F., & Pondé, M. P. (2008). Translation into Portuguese of the M-CHAT Scale for
early screening of autism. Revista de Psiquiatria do Rio Grande do Sul, 30(3), 221-9.

182
146. Losh, M., Piven, J. (2007). Social-cognition and the broad autism phenotype: identifying
genetically meaningful phenotypes. Journal of Child Psychology and Psychiatry, 48(1), 105-
112. https://doi.org/10.1111/j.1469-7610.2006.01594.x
147. Losh, M., Childress, D., Lam, K., & Piven, J. (2008). Defining key features of the broad
autism phenotype: A comparison across parents of multiple‐and single‐incidence autism
families. American Journal of Medical Genetics Part B: Neuropsychiatric Genetics, 147(4),
424-433. https://doi.org/10.1002/ajmg.b.30612
148. Losh, M., Adolphs, R., Poe, M. D., Couture, S., Penn, D., Baranek, G. T., & Piven, J. (2009).
Neuropsychological profile of autism and the broad autism phenotype. Archives of General
Psychiatry, 66(5), 518-526. https://doi.org/10.1001/archgenpsychiatry.2009.34
149. Losh, M., Esserman, D., & Piven, J. (2010). Rapid automatized naming as an index of genetic
liability to autism. Journal of Neurodevelopmental Disorders, 2(2), 109-116.
https://doi.org/10.1007/s11689-010-9045-4
150. Losh, M., Klusek, J., Martin, G. E., Sideris, J., Parlier, M., & Piven, J. (2012). Defining
genetically meaningful language and personality traits in relatives of individuals with fragile
X syndrome and relatives of individuals with autism. American Journal of Medical Genetics
Part B: Neuropsychiatric Genetics, 159(6), 660-668. https://doi.org/10.1002/ajmg.b.32070
151. MacCallum, R. C., Widaman, K. F., Zhang, S., & Hong, S. (1999). Sample size in factor
analysis. Psychological Methods, 4(1), 84-99. https://psycnet.apa.org/doi/10.1037/1082-
989X.4.1.84
152. Magnusson, C., Kosidou, K., Dalman, C., Lundberg, M., Lee, B. K., Rai, D., ... & Arver, S.
(2016). Maternal vitamin D deficiency and the risk of autism spectrum disorders: population-
based study. BJPsych open, 2(2), 170-172. https://doi.org/10.1192/bjpo.bp.116.002675
153. Maimburg, R. D., & Væth, M. (2006). Perinatal risk factors and infantile autism. Acta
Psychiatrica Scandinavica, 114(4), 257-264. https://doi.org/10.1111/j.1600-
0447.2006.00805.x
154. Mamidala, M. P., Polinedi, A., PTV, P. K., Rajesh, N., Vallamkonda, O. R., Udani, V., ... &
Rajesh, V. (2013). Prenatal, perinatal and neonatal risk factors of Autism Spectrum Disorder:
a comprehensive epidemiological assessment from India. Research in Developmental
Disabilities, 34(9), 3004-3013. https://doi.org/10.1016/j.ridd.2013.06.019
155. Manji, K. P., & Hogan, M. N. (2013). Identifying gaps in knowledge, prevalence and care of
children with Autism Spectrum Disorder in Tanzania – a qualitative review article. Tanzania
Medical Journal, 26(2), 7-16. https://doi.org/10.4314/tmj.v26i2.3
156. Mankoski, R. E., Collins, M., Ndosi, N. K., Mgalla, E. H., Sarwatt, V. V., & Folstein, S. E.
(2006). Etiologies of autism in a case-series from Tanzania. Journal of Autism and
Developmental Disorders, 36(8), 1039. https://doi.org/10.1007/s10803-006-0143-9

183
157. Marlow, M., Servili, C., & Tomlinson, M. (2019). A review of screening tools for the
identification of autism spectrum disorders and developmental delay in infants and young
children: recommendations for use in low‐and middle‐income countries. Autism
Research, 12(2), 176-199. https://doi.org/10.1002/aur.2033
158. Marteleto, M. R. F., & Pedromônico, M. R. M. (2005). Validity of Autism Behavior Checklist
(ABC): preliminary study. Brazilian Journal of Psychiatry, 27(4), 295-301.
https://doi.org/10.1590/S1516-44462005000400008
159. Marvin, A. R., Marvin, D. J., Lipkin, P. H., & Law, J. K. (2017). Analysis of Social
Communication Questionnaire (SCQ) screening for children less than age 4. Current
Developmental Disorders Reports, 4(4), 137-144. https://doi.org/10.1007/s40474-017-0122-1
160. McLennan, J. D., Lord, C., & Schopler, E. (1993). Sex differences in higher functioning
people with autism. Journal of Autism and Developmental Disorders, 23(2), 217-227.
https://doi.org/10.1007/BF01046216
161. Mwaniki, M. K., Atieno, M., Lawn, J. E., & Newton, C. R. (2012). Long-term
neurodevelopmental outcomes after intrauterine and neonatal insults: a systematic
review. The Lancet, 379(9814), 445-452. https://doi.org/10.1016/S0140-6736(11)61577-8
162. Micali, N., Chakrabarti, S. & Fombonne, E. (2004). The Broad Autism Phenotype: Findings
from an Epidemiological Survey. Autism, 8(1), 21-37.
https://doi.org/10.1177%2F1362361304040636
163. Mohammadi, M. R., Zarafshan, H., & Ghasempour, S. (2012). Broader autism phenotype in
Iranian parents of children with autism spectrum disorders vs. normal children. Iranian
Journal of Psychiatry, 7(4), 157-163.
164. Mossakowski, K. N. (2014). Social causation and social selection. The Wiley Blackwell
Encyclopedia of Health, Illness, Behavior, and Society. John Wiley & Sons, Ltd.
165. Mung'ala-Odera, V., Meehan, R., Njuguna, P., Mturi, N., Alcock, K. J., & Newton, C. R. J. C.
(2006). Prevalence and risk factors of neurological disability and impairment in children
living in rural Kenya. International Journal of Epidemiology, 35(3), 683-688.
https://doi.org/10.1093/ije/dyl023
166. Mung‘ala‐Odera, V., & Newton, C. R. J. C. (2007). Identifying children with neurological
impairment and disability in resource‐poor countries. Child: care, health and
development, 33(3), 249-256. https://doi.org/10.1111/j.1365-2214.2006.00714.x
167. Newton, C. R. & Chugani, D. C. (2013). The continuing role of ICNA in Africa: how to
tackle autism? Developmental Medicine and Child Neurology, 55(6), 488-489.
168. Ng, M., de Montigny, J. G., Ofner, M., & Docé, M. T. (2017). Environmental factors
associated with autism spectrum disorder: a scoping review for the years 2003–2013. Health
Promotion and Chronic Disease Prevention in Canada, 37(1), 1-23.

184
169. Ngugi, A. K., Bottomley, C., Kleinschmidt, I., Wagner, R. G., Kakooza-Mwesige, A., Ae-
Ngibise, K., ... & Chengo, E. (2013). Prevalence of active convulsive epilepsy in sub-Saharan
Africa and associated risk factors: cross-sectional and case-control studies. The Lancet
Neurology, 12(3), 253-263. http://doi.org/10.1016/S1474-4422(13)70003-6
170. Nmadu, P. M., Peter, E., Alexander, P., Koggie, A. Z., & Maikenti, J. I. (2015). The
prevalence of malaria in children between the ages 2-15 visiting Gwarinpa General Hospital
life-camp, Abuja, Nigeria. Journal of Health Science, 5(3), 47-51.
http://doi.org/10.5923/j.health.20150503.01
171. Oner, P., Oner, O., & Munir, K. (2014). Three-item Direct Observation Screen (TIDOS) for
autism spectrum disorder. Autism, 18(6), 733-742.
https://doi.org/10.1177%2F1362361313487028
172. Oosterling, I., Rommelse, N., De Jonge, M., Van Der Gaag, R. J., Swinkels, S., Roos, S., ... &
Buitelaar, J. (2010). How useful is the Social Communication Questionnaire in toddlers at
risk of autism spectrum disorder? Journal of Child Psychology and Psychiatry, 51(11), 1260-
1268. http://dx.doi.org/10.1111/j.1469-7610.2010.02246.x
173. Özdemir, O., Diken, I. H., Diken, O., & Şekercioğlu, G. (2013). Reliability and validity of
modified Turkish version of Autism Behavior Checklist (ABC): results of pilot
study. International Journal of Early Childhood Special Education, 5(2), 168-186.
174. Ozonoff, S., Young, G. S., Carter, A., Messinger, D., Yirmiya, N., Zwaigenbaum, L., ... &
Stone, W. L. (2011). Recurrence risk for autism spectrum disorders: a Baby Siblings Research
Consortium study. Pediatrics, 128(3), e488-e495. https://doi.org/10.1542/peds.2010-2825
175. Palermo, M. T., Pasqualetti, P., Barbati, G., Intelligente, F., & Rossini, P. M. (2006).
Recognition of schematic facial displays of emotion in parents of children with autism.
Autism; 10(4), 353-364. https://doi.org/10.1177%2F1362361306064431
176. Perera, H., Wijewardena, K., & Aluthwelage, R. (2009). Screening of 18–24-month-old
children for autism in a semi-urban community in Sri Lanka. Journal of Tropical
Pediatrics, 55(6), 402-405. https://doi.org/10.1093/tropej/fmp031
177. Pickles, A., St. Claire, M. C., & Conti-Ramsden, G. (2013). Communication and social
deficits in relatives of individuals with SLI and relatives of individuals with ASD. Journal of
Autism and Developmental Disorders, 43(1), 156–167. https://doi.org/10.1007/s10803-012-
1556-2
178. Pisula, E., Kawa, R., Szostakiewicz, Ł., Łucka, I., Kawa, M., & Rynkiewicz, A. (2013).
Autistic traits in male and female students and individuals with high functioning autism
spectrum disorders measured by the Polish version of the Autism-Spectrum Quotient. PloS
one, 8(9), e75236.
179. Piven, J., Chase, G. A., Landa, R., Wzorek, M., Gayle, J., Cloud, D., & Folstein, S. (1991).
Psychiatric disorders in the parents of autistic individuals. Journal of the American Academy
185
of Child & Adolescent Psychiatry, 30(3), 471-478. https://doi.org/10.1097/00004583-
199105000-00019
180. Piven, J., Wzorek, M., Landa, R., Lainhart, J., Bolton, P., Chase, G. A., & Folstein, S. (1994).
Personality characteristics of the parents of autistic individuals. Psychological
Medicine, 24(3), 783-795. https://doi.org/10.1017/S0033291700027938
181. Piven, J., & Palmer, P. (1997). Cognitive deficits in parents from multiple‐incidence autism
families. Journal of Child Psychology and Psychiatry, 38(8), 1011-1021.
https://doi.org/10.1111/j.1469-7610.1997.tb01618.x
182. Piven, J., Palmer, P., Jacobi, D., Childress, D., & Arndt, S. (1997a). Broader autism
phenotype: evidence from a family history study of multiple-incidence autism families.
American Journal of Psychiatry, 154(2), 185-190. https://doi.org/10.1176/ajp.154.2.185
183. Piven, J., Palmer, P., Landa, R., Santangelo, S., Jacobi, D., & Childress, D. (1997b).
Personality and language characteristics in parents from multiple‐incidence autism
families. American Journal of Medical Genetics, 74(4), 398-411.
https://doi.org/10.1002/(SICI)1096-8628(19970725)74:4%3C398::AID-
AJMG11%3E3.0.CO;2-D
184. Piven, J., & Palmer, P. (1999). Psychiatric disorder and the broad autism phenotype: evidence
from a family study of multiple-incidence autism families. American Journal of
Psychiatry, 156(4), 557-563.
185. Plomin, R., Haworth, C. M., & Davis, O. S. (2009). Common disorders are quantitative
traits. Nature Reviews Genetics, 10(12), 872-878. https://doi.org/10.1038/nrg2670
186. Plumet, M. H., Goldblum, M. C., & Leboyer, M. (1995). Verbal skills in relatives of autistic
females. Cortex, 31(4), 723-733. https://doi.org/10.1016/S0010-9452(13)80023-8
187. Rai, D., Lee, B. K., Dalman, C., Golding, J., Lewis, G., & Magnusson, C. (2013). Parental
depression, maternal antidepressant use during pregnancy, and risk of autism spectrum
disorders: population based case-control study. BMJ, 346, f2059.
https://doi.org/10.1136/bmj.f2059
188. Raven, J. C., Court, J.H., & Raven, J. (1998). Manual for Raven’s Progressive Mattrices and
Vocabulary Scales: Section 2, The Coloured Progressive matrices. San Antonio, TX:
Psychological Corporation.
189. Raz, R., Roberts, A. L., Lyall, K., Hart, J. E., Just, A. C., Laden, F., & Weisskopf, M. G.
(2015). Autism spectrum disorder and particulate matter air pollution before, during, and after
pregnancy: a nested case–control analysis within the Nurses‘ Health Study II
cohort. Environmental health perspectives, 123(3), 264-270.
https://doi.org/10.1289/ehp.1408133

186
190. Ritvo, E. R., Jorde, L. B., Mason-Brothers, A., & Freeman, B. J., Pingree C, … & Mo A.
(1989). The UCLA-University of Utah epidemiologic survey of autism: recurrence risk
estimate and genetic counseling American Journal of Psychiatry, 146(8), 1032-1036.
191. Robins, D. L., Casagrande, K., Barton, M., Chen, C. M. A., Dumont-Mathieu, T., & Fein, D.
(2014). Validation of the modified checklist for autism in toddlers, revised with follow-up
(M-CHAT-R/F). Pediatrics, 133(1), 37-45. https://doi.org/10.1542/peds.2013-1813
192. Robel, L., Rousselot-Pailley, B., Fortin, C., Levy-Rueff, M., Golse, B., & Falissard, B.
(2014). Subthreshold traits of the broad autistic spectrum are distributed across different
subgroups in parents, but not siblings, of probands with autism European Child and
Adolescent Psychiatry, 23(4), 225-233. https://doi.org/10.1007/s00787-013-0451-5
193. Roberts, E. M., English, P. B., Grether, J. K., Windham, G. C., Somberg, L., & Wolff, C.
(2007). Maternal residence near agricultural pesticide applications and autism spectrum
disorders among children in the California Central Valley. Environmental health
perspectives, 115(10), 1482-1489. https://doi.org/10.1289/ehp.10168
194. Rousselot-Pailley, B., Fortin, C., Golse, B., Falissard, B., Robel, L. (2011). The FAQ self-
report is a valid instrument to characterize endophenotypes of the autistic spectrum in parents
of children with autism. L’Encéphale; 37: 191-198.
https://doi.org/10.1016/j.encep.2010.08.014
195. Ruparelia, K., Abubakar, A., Badoe, E., Bakare, M., Visser, K., Chugani, D. C., … &
Newton, C. R. (2016). Autism Spectrum Disorders in Africa: Current challenges in
identification, assessment, and treatment: A report on the International Child Neurology
Association Meeting on ASD in Africa, Ghana, April 3-5, 2014. Journal of Child
Neurology, 31(8), 1018–1026. https://doi.org/10.1177/0883073816635748
196. Ruparelia, K., Manji, K., Abubakar, A., & Newton, C. R. (2017). Investigating the evidence
of behavioral, cognitive, and psychiatric endophenotypes in autism: a systematic review.
Autism Research and Treatment, 2017. https://doi.org/10.1155/2017/6346912
197. Ruser, T. F., Arin, D., Dowd, M., Putnam, S., Winklosky, B., Rosen-Sheidley, B., ... &
Folstein, S. (2007). Communicative competence in parents of children with autism and
parents of children with specific language impairment. Journal of Autism and Developmental
Disorders, 37(7), 1323-1336. https://doi.org/10.1007/s10803-006-0274-z
198. Ruta, L., Mazzone, D., Mazzone, L., Wheelwright, S., & Baron-Cohen, S. (2012). The
Autism-Spectrum Quotient—Italian version: A cross-cultural confirmation of the broader
autism phenotype. Journal of Autism and Developmental Disorders, 42(4), 625-633.
https://doi.org/10.1007/s10803-011-1290-1
199. Rutter, M., Bailey, A., & Lord, C. (2003). Social Communication Questionnaire – WPS
(SCQ_WPS). Los Angeles, CA: Western Psychological Services.

187
200. Ruzich, E., Allison, C., Smith, P., Watson, P., Auyeung, B., Ring, H., & Baron-Cohen, S.
(2015). Measuring autistic traits in the general population: a systematic review of the Autism-
Spectrum Quotient (AQ) in a nonclinical population sample of 6,900 typical adult males and
females. Molecular Autism, 6(1), 2. https://doi.org/10. 1186/2040-2392-6-2.
201. Sandin, S., Lichtenstein, P., Kuja-Halkola, R., Larsson, H., Hultman, C. M., & Reichenberg,
A. (2014). The familial risk of autism. Journal of the American Medical Association, 311(17),
1770-1777. https://doi.org/10.1001/jama.2014.4144
202. Sandin, S., Schendel, D., Magnusson, P., Hultman, C., Surén, P., Susser, E., ... & Henning,
M. (2016). Autism risk associated with parental age and with increasing difference in age
between the parents. Molecular Psychiatry, 21(5), 693-700.
https://doi.org/10.1038/mp.2015.70
203. Sasson, N. J., Lam, K. S., Parlier, M., Daniels, J. L., & Piven, J. (2013). Autism and the broad
autism phenotype: familial patterns and intergenerational transmission. Journal of
Neurodevelopmental Disorders, 5(1), 11. https://doi.org/10.1186/1866-1955-5-11
204. Sato, F. P., Paula, C. S., Lowenthal, R., Nakano, E. Y., Brunoni, D., Schwartzman, J. S., &
Mercadante, M. T. (2009). Instrument to screen cases of pervasive developmental disorder: a
preliminary indication of validity. Brazilian Journal of Psychiatry, 31(1), 30-33.
https://doi.org/10.1590/S1516-44462009000100008
205. Scheeren, A. M., & Stauder, J. E. (2008). Broader autism phenotype in parents of autistic
children: reality or myth?. Journal of Autism and Developmental Disorders, 38(2), 276.
https://doi.org/10.1007/s10803-007-0389-x
206. Schmidt, G. L., Kimel, L. K., Winterrowd, E., Pennington, B. F., Hepburn, S. L., & Rojas, D.
C. (2008). Impairments in phonological processing and nonverbal intellectual function in
parents of children with autism. Journal of Clinical and Experimental Neuropsychology;
30(5), 557-567. https://doi.org/10.1080/13803390701551225
207. Schopler, E., Van Bourgondein, M.E., Wellman, G.J., & Love, S.R. (2010). Childhood
Autism Rating Scale, 2nd
ed. (CARS-2). San Antonia, TX: Pearson.
208. Schwichtenberg, A. J., Young, G. S., Sigman, M., Hutman, T., & Ozonoff, S. (2010). Can
family affectedness inform infant sibling outcomes of autism spectrum disorders? Journal of
Child Psychology and Psychiatry, 51(9), 1021–1030. https://doi.org/10.1111/j.1469-
7610.2010.02267.x
209. Sebat, J., Lakshmi, B., Malhotra, D., Troge, J., Lese-Martin, C., Walsh, T., ... & Leotta, A.
(2007). Strong association of de novo copy number mutations with autism.
Science, 316(5823), 445-449.
210. Shelton, J. F., Tancredi, D. J., & Hertz‐Picciotto, I. (2010). Independent and dependent
contributions of advanced maternal and paternal ages to autism risk. Autism Research, 3(1),
30-39. https://doi.org/10.1002/aur.116

188
211. Shelton, J. F., Geraghty, E. M., Tancredi, D. J., Delwiche, L. D., Schmidt, R. J., Ritz, B., ... &
Hertz-Picciotto, I. (2014). Neurodevelopmental disorders and prenatal residential proximity to
agricultural pesticides: the CHARGE study. Environmental Health Perspectives, 122(10),
1103-1109. https://doi.org/10.1289/ehp.1307044
212. Skuse, D., Warrington, R., Bishop, D., Chowdhury, U., Lau, J., Mandy, W., & Place, M.
(2004). The Developmental, Dimensional and Diagnostic Interview (3di): a novel
computerized assessment for autism spectrum disorders. Journal of the American Academy of
Child & Adolescent Psychiatry, 43(5), 548-558. https://doi.org/10.1097/00004583-
200405000-00008
213. Smalley, S. L. & Asarnow, R. F. (1990). Brief report: Cognitive subclinical markers in
autism. Journal of Autism and Developmental Disorders, 20(2), 271-278.
https://psycnet.apa.org/doi/10.1007/BF02284724
214. Snow, A. V., & Lecavalier, L. (2008). Sensitivity and specificity of the Modified Checklist
for Autism in Toddlers and the Social Communication Questionnaire in preschoolers
suspected of having pervasive developmental disorders. Autism, 12(6), 627-644.
http://dx.doi.org/10.1177/1362361308097116
215. Stone-MacDonald, A. (2012). Cultural beliefs about disability in practice: experiences at a
special school in Tanzania. International Journal of Disability, Development and
Education, 59(4), 393-407. https://doi.org/10.1080/1034912X.2012.723947
216. Stordeur, C., Boele, A., Peyre, H., Delorme, R., & Acquaviva, E. (2019). Psychometric
properties of the French Version of the Social Responsiveness Scale in autism spectrum
disorder with or without attention deficit hyperactivity disorder. L'Encéphale, 45(4), 285-289.
https://doi.org/10.1016/j.encep.2018.08.004
217. Sucksmith, E., Roth, I., & Hoekstra, R. A. (2011). Autistic traits below the clinical threshold:
re-examining the broader autism phenotype in the 21st century. Neuropsychology Review, 21,
360-389. https://doi.org/10.1007/s11065-011-9183-9
218. Sucksmith, E., Allison, C., Baron-Cohen, S., Chakrabarti, B., & Hoekstra, R. A. (2013).
Empathy and emotion recognition in people with autism, first-degree relatives, and
controls. Neuropsychologia, 51(1), 98-105.
https://doi.org/10.1016/j.neuropsychologia.2012.11.013
219. Sundelin, H. E., Larsson, H., Lichtenstein, P., Almqvist, C., Hultman, C. M., Tomson, T., &
Ludvigsson, J. F. (2016). Autism and epilepsy: a population-based nationwide cohort
study. Neurology, 87(2), 192-197. https://doi.org/10.1212/WNL.0000000000002836
220. Swygert, K. A., McLeod, L. D., & Thissen, D. (2001). Factor analysis for items or testlets
scored in more than two categories. In D. T. H. Wainer (1st ed.), Test scoring. Mahwah, NJ:
Lawrence Erlbaum.

189
221. Szatmari, P., Jones, M. B., Tuff, L., Bartolucci, G., Fisman, S., & Mahoney, W. (1993). Lack
of cognitive impairment in first-degree relatives of children with pervasive developmental
disorders. Journal of the American Academy of Child & Adolescent Psychiatry, 32(6), 1264-
1273. https://doi.org/10.1097/00004583-199311000-00022
222. Szatmari, P., Georgiades, S., Duku, E., Zwaigenbaum, L., Goldberg, J., & Bennett, T. (2008).
Alexithymia in parents of children with autism spectrum disorder. Journal of Autism and
Developmental Disorders, 38(10), 1859-1865. https://doi.org/10.1007/s10803-008-0576-4
223. Tajmirriyahi, M., Nejati, V., Pouretemad, H., & Sepehr, R. M. (2013). Reading the mind in
the face and voice in parents of children with Autism Spectrum Disorders. Research in Autism
Spectrum Disorders, 7(12), 1543-1550. https://doi.org/10.1016/j.rasd.2013.08.007
224. Taylor, L. J., Maybery, M. T., Wray, J., Ravine, D., Hunt, A., & Whitehouse, A. J. (2013).
Brief report: do the nature of communication impairments in autism spectrum disorders relate
to the broader autism phenotype in parents? Journal of Autism and Developmental
Disorders, 43(12), 2984-2989. https://doi.org/10.1007/s10803-013-1838-3
225. Tehrani-Doost, M., Shahrivar, Z., Torabi, N., Ansari, S., Haji-Esmaeelzadeh, M., & Saeed-
Ahmadi, S. (2018). Cross-cultural validation and normative data of the Social Responsiveness
Scale in a group of Iranian general child population. Journal of Autism and Developmental
Disorders, 1-8. https://doi.org/10.1007/s10803-018-3773-9
226. Tekola, B., Baheretibeb, Y., Roth, I., Tilahun, D., Fekadu, A., Hanlon, C., & Hoekstra, R. A.
(2016). Challenges and opportunities to improve autism services in low-income countries:
lessons from a situational analysis in Ethiopia. Global Mental Health, 3.
https://doi.org/10.1017/gmh.2016.17
227. Tick, B., Bolton, P., Happé, F., Rutter, M., & Rijsdijk, F. (2016). Heritability of autism
spectrum disorders: a meta‐analysis of twin studies. Journal of Child Psychology and
Psychiatry, 57(5), 585-595. https://doi.org/10.1111/jcpp.12499
228. Turner, T., Pihur, V., & Chakravarti, A. (2011). Quantifying and modelling birth order effects
in autism. PloS One, 6(10), e26418.
229. van Wijngaarden, E., Davidson, P. W., Smith, T. H., Evans, K., Yost, K., Love, T., ... &
Myers, G. J. (2013). Autism spectrum disorder phenotypes and prenatal exposure to
methylmercury. Epidemiology, 24(5), 651.
https://dx.doi.org/10.1097%2FEDE.0b013e31829d2651
230. Veroniki, A. A., Rios, P., Cogo, E., Straus, S. E., Finkelstein, Y., Kealey, R., ... &
Hemmelgarn, B. R. (2017). Comparative safety of antiepileptic drugs for neurological
development in children exposed during pregnancy and breast feeding: a systematic review
and network meta-analysis. BMJ Open, 7(7), e017248. http://dx.doi.org/10.1136/bmjopen-
2017-017248

190
231. Vinkhuyzen, A. A., Eyles, D. W., Burne, T. H., Blanken, L. M., Kruithof, C. J., Verhulst, F.,
... & McGrath, J. J. (2017). Gestational vitamin D deficiency and autism spectrum
disorder. BJPsych Open, 3(2), 85-90. https://doi.org/10.1192/bjpo.bp.116.004077
232. Volk, H. E., Kerin, T., Lurmann, F., Hertz-Picciotto, I., McConnell, R., & Campbell, D. B.
(2014). Autism spectrum disorder: interaction of air pollution with the MET receptor tyrosine
kinase gene. Epidemiology, 25(1), 44-47. https://doi.org/10.1097/EDE.0000000000000030
233. Voracek, M., & Dressler, S. G. (2006). Lack of correlation between digit ratio (2D: 4D) and
Baron-Cohen‘s ―Reading the Mind in the Eyes‖ test, empathy, systemising, and autism-
spectrum quotients in a general population sample. Personality and Individual
Differences, 41(8), 1481-1491. https://doi.org/10.1016/j.paid.2006.06.009
234. Wakabayashi, A., Baron-Cohen, S., Wheelwright, S., & Tojo, Y. (2006). The Autism-
Spectrum Quotient (AQ) in Japan: a cross-cultural comparison. Journal of Autism and
Developmental Disorders, 36(2), 263-270. https://doi.org/10.1007/s10803-005-0061-2
235. Wang, P., Michaels, C. A., & Day, M. S. (2011). Stresses and coping strategies of Chinese
families with children with autism and other developmental disabilities. Journal of Autism
and Developmental Disorders, 41(6), 783-795. https://doi.org/10.1007/s10803-010-1099-3
236. Wang, J., Lee, L. C., Chen, Y. S., & Hsu, J. W. (2012). Assessing autistic traits in a Taiwan
preschool population: cross-cultural validation of the Social Responsiveness Scale
(SRS). Journal of Autism and Developmental Disorders, 42(11), 2450-2459.
https://doi.org/10.1007/s10803-012-1499-7
237. Wang, C., Geng, H., Liu, W., & Zhang, G. (2017). Prenatal, perinatal, and postnatal factors
associated with autism: a meta-analysis. Medicine, 96(18).
http://dx.doi.org/10.1097/MD.0000000000006696
238. Werling, D. M., & Geschwind, D. H. (2013). Sex differences in autism spectrum
disorders. Current Opinion in Neurology, 26(2), 146-153.
https://doi.org/10.1097/WCO.0b013e32835ee548
239. Wheelwright, S., Auyeung, B., Allison, C., & Baron-Cohen, S. (2010). Defining the broader,
medium and narrow autism phenotype among parents using the Autism Spectrum Quotient
(AQ). Molecular Autism, 1(1), 10. https://doi.org/10.1186/2040-2392-1-10
240. Whitehouse, A. J. O., Barry, J. G., & Bishop, D. V. (2007). The broader language phenotype
of autism: a comparison with specific language impairment. Journal of Child Psychology and
Psychiatry, 48(8), 822-830. https://doi.org/10.1111/j.1469-7610.2007.01765.x
241. Whitehouse, A. J. O., Coon, H., Miller, J., Salisbury, B., & Bishop, D. V. (2010). Narrowing
the broader autism phenotype: a study using the Communication Checklist-Adult Version
(CC-A). Autism, 14(6), 559-574. https://doi.org/10.1177%2F1362361310382107
242. Wing, L., Leekam, S. R., Libby, S. J., Gould, J., & Larcombe, M. (2002). The Diagnostic
Interview for Social and Communication Disorders: background, inter‐rater reliability and

191
clinical use. Journal of Child Psychology and Psychiatry, 43(3), 307-325.
https://doi.org/10.1111/1469-7610.00023
243. Wingate M, et al. (2014). Prevalence of autism spectrum disorder among children aged 8
years-autism and developmental disabilities monitoring network, 11 sites, United States,
2010. MMWR Surveillance Summary; 63(2): 1–21.
244. Wiśniowiecka-Kowalnik, B., & Nowakowska, B. A. (2019). Genetics and epigenetics of
autism spectrum disorder-current evidence in the field. Journal of Applied Genetics, 60(1),
37-47. https://doi.org/10.1007/s13353-018-00480-w
245. Wong, V., Hui, L. H. S., Lee, W. C., Leung, L. S. J., Ho, P. K. P., Lau, W. L. C., ... & Chung,
B. (2004). A modified screening tool for autism (Checklist for Autism in Toddlers [CHAT-
23]) for Chinese children. Pediatrics, 114(2), e166-e176.
https://doi.org/10.1542/peds.114.2.e166
246. Wong, D., Maybery, M., Bishop, D. V. M., Maley, A., & Hallmayer, J. (2006). Profiles of
executive function in parents and siblings of individuals with autism spectrum
disorders. Genes, Brain and Behavior, 5(8), 561-576. https://doi.org/10.1111/j.1601-
183X.2005.00199.x
247. Woodbury-Smith, M. R., Robinson, J., Wheelwright, S., & Baron-Cohen, S. (2005).
Screening adults for Asperger syndrome using the AQ: A preliminary study of its diagnostic
validity in clinical practice. Journal of Autism and Developmental Disorders, 35(3), 331-335.
https://doi.org/10.1007/s10803-005-3300-7
248. Wu, S., Wu, F., Ding, Y., Hou, J., Bi, J., & Zhang, Z. (2017). Advanced parental age and
autism risk in children: a systematic review and meta‐analysis. Acta Psychiatrica
Scandinavica, 135(1), 29-41. https://doi.org/10.1111/acps.12666
249. Yirmiya, N., & Shaked, M. (2005). Psychiatric disorders in parents of children with autism: a
meta‐analysis. Journal of Child Psychology and Psychiatry, 46(1), 69-83.
https://doi.org/10.1111/j.1469-7610.2004.00334.x
250. Yousefi, N., Dadgar, H., Mohammadi, M. R., Jalilevand, N., Keyhani, M. R., & Mehri, A.
(2015). The validity and reliability of Autism Behavior Checklist in Iran. Iranian Journal of
Psychiatry, 10(3), 144.
251. Yu, C. Y. (2002). Evaluation of model fit indices for latent variable models with categorical
and continuous outcomes. In Paper presented at the annual conference of the American
Educational Research Association, April 4, 2002, New Orleans.
252. Zarokanellou, V., Kolaitis, G., Vlassopoulos, M., & Papanikolaou, K. (2017). Brief report: A
pilot study of the validity and reliability of the Greek version of the Social Communication
Questionnaire. Research in Autism Spectrum Disorders, 38, 1-5.
https://doi.org/10.1016/j.rasd.2017.03.001

192
253. Zhang, J., Landy, H. J., Branch, D. W., Burkman, R., Haberman, S., Gregory, K. D., ... &
Hibbard, J. U. (2010). Contemporary patterns of spontaneous labor with normal neonatal
outcomes. Obstetrics and Gynecology, 116(6), 1281.
http://doi.org/10.1097/AOG.0b013e3181fdef6e
254. Zhang, L., Sun, Y., Chen, F., Wu, D., Tang, J., Han, X., ... & Wang, K. (2016). Psychometric
properties of the Autism-Spectrum Quotient in both clinical and non-clinical samples:
Chinese version for mainland China. BMC Psychiatry, 16(1), 213.
https://doi.org/10.1186/s12888-016-0915-5

193
Appendix 1: Published Systematic Review
Hindawi
Autism Research and Treatment
Volume 2017, Article ID 6346912, 17 pages
https://doi.org/10.1155/2017/6346912
Review Article
Investigating the Evidence of Behavioral, Cognitive, and Psychiatric Endophenotypes in Autism: A Systematic Review
Kavita Ruparelia,1,2 Karim Manji,2 Amina Abubakar,3 and Charles R. Newton4
1 Open University, Milton Keynes, UK 2Department of Pediatrics and Child Health, Muhimbili University of Health and Allied Sciences, Dar es Salaam, Tanzania 3KEMRI-Wellcome Trust Research Programme, Centre for Geographic Medicine Research (Coast), Kilifi, Kenya 4Department of Psychiatry, University of Oxford, Oxford, UK
Correspondence should be addressed to Kavita Ruparelia; [email protected]
Received 23 January 2017; Accepted 4 June 2017; Published 5 July 2017
Academic Editor: Roberto Canitano
Copyright © 2017 Kavita Ruparelia et al. This is an open access article distributed under the Creative Commons Attribution
License, which permits unrestricted use, distribution, and reproduction in any medium, provided the original work is properly
cited.
Substantial evidence indicates that parents of autistic individuals often display milder forms of autistic traits referred to as the
broader autism phenotype (BAP). To determine if discrete endophenotypes of autism can be identified, we reviewed the literature to
assess the evidence of behavioral, cognitive, and psychiatric profiles of the BAP. A systematic review was conducted using EMBASE,
MEDLINE, PsycINFO, PsycEXTRA, and Global Health. Sixty papers met our inclusion criteria and results are discussed according
to the proportion of studies that yield significant deficits per domain. The behavioral, cognitive, and psychiatric endophenotypes
in parents of autistic probands are still not clarified; however, evidence suggests mild social/communication deficits, rigid/aloof
personality traits, and pragmatic language difficulties as the most useful sociobehavioral candidate endophenotype traits. The
existence of deficits in the cognitive domain does suggest familial vulnerability for autism. Furthermore, increased depressed mood
and anxiety can also be useful markers; however, findings should be interpreted with caution because of the small number of studies
in such heterogeneously broad domains and several methodological limitations.
1. Introduction
Autism is a life-long complex neurodevelopmental disorder which has heterogeneous clinical manifestations and multi-
factorial aetiology. It is characterized by impairments in social
interaction and communication and restricted patterns of behavior, interests, and activities, occurring within the first
3 years of life [1].
The heritability of autism is estimated to be from 70% to 90% [2, 3]. Research suggests the risk of developing autism in siblings of individuals with autism is between
10 and 20%, considerably higher than when compared to
about 1% for siblings of typically developing children [4, 5]. These data suggest a strong genetic basis, despite the clinical
heterogeneity. Since numerous studies using linkage or candidate gene approaches have not discovered a single
genetic locus of major effect, it is thought that the
definition of the endophenotypes may provide insights into the biological basis of this condition.
Studies have provided substantial evidence indicating
that first-degree relatives of autistic individuals often
display milder forms of autistic traits referred to as the
broader autism phenotype (BAP) [6]. This milder expression
includes a set of behavioral and cognitive characteristics that reflect the phenotypic expression that is qualitatively
similar in unaffected relatives of autistic individuals. For
instance, mild challenges in social cognition in using facial cues and other features to determine mental states have
been noted in parents of children with autism [7]. Additional studies report similar differences in emotion processing
abilities, particularly emotion identification [8, 9] and
phonological processing [10]. Research that includes such quantitative measures of autistic traits and underlying
mechanisms responsible for such features in first-degree
relatives is fundamental in
studying the genetic basis of autism as it can help to identify which characteristics aggregate in family members and are
thus likely to be potential endophenotypes for autism at the
neurocognitive level. Endophenotypes are heritable markers associated with a
given condition and can provide insight into its etiology.
Gottesman and Gould [11] offered a set of criteria for

194
identification of useful endophenotypes suggesting that
deficits must be (a) associated with illness in the population;
(b) heritable; (c) state-independent (manifesting in an individual whether
or not illness is active); (d) cosegregated with the condition within families; and (e) also found in unaffected relatives at a
higher prevalence than in the general population. The study
of endophenotypes is particularly useful in understanding developmental disorders such as autism that are diagnosed
on clinical features but are of neurobiological origin and can
aid to better identify and characterize the nature of the genetic contributions to this complex disorder.
Several researchers have reviewed the BAP traits in first- degree relatives of autistic probands [12–14]. Some reviews
include studies that have examined the BAP in parents and
siblings of autistic probands. Although features of the autism phenotype have been found in the ―at risk‖ infant
sibling studies, no clear distinction can be made to determine
whether they are the characteristics of the BAP or whether the infant siblings may later receive an autism diagnosis. Thus,
we limited this review process to parents only by employing a systematic approach to focus on the sociobehavioral,
cognitive and psychiatric profiles of the broader autism
phenotype to determine candidate endophenotypic traits for autism.
We conducted a systematic review of the literature to
assess the evidence of behavioral, cognitive, and psychiatric endophenotypes of autism in parents. The aim of this review
was to ascertain whether parents of probands with autism
have higher prevalence of various components of the BAP and more specifically of behavioral, cognitive, and other
psychiatric conditions. The questions addressed were as follows:
(1) What are the behavioral, cognitive, and other
psychiatric (focusing primarily on depression and anxiety) endophenotypes of autism as manifested
through the broader autism phenotype in biological
parents of autistic probands?
(2) What are the tools used to measure these
endophenotypes and the magnitude of effect?
(3) Do patterns evident in endophenotypes of autism provide insight into cultural and geographical
differences?
2. Review Methods
2.1. Data Sources and Search Strategy. A comprehensive
literature search was performed to collate evidence of behavioral, cognitive, and psychiatric endophenotypes in
autism. Literature searches for published and grey
literature were subsequently carried out using 5 databases, EMBASE, MEDLINE, PsycINFO, PsycEXTRA, and
Global Health, from inception to August 2014 without
language restriction. The strategy was developed by breaking down the review questions into elemental facets
according to the recommendations of the National Health Service Centre for Reviews and Disseminations [15].
These facets included exposure, outcome, population,
publication language, and keywords (Table 1). The initial
search strategy used the words ―autis∗ AND
endophenotyp∗ OR phenotyp∗‖. These searches were further
refined by the addition of the outcome terms and population
(―parent∗ OR relative OR famil∗‖). The bibliographies of
key references were later hand-searched to identify articles
missed in the database search. Figure 1 illustrates our literature search strategy.
2.2. Data Selection Criteria. The titles and abstracts of papers
identified were reviewed and the full versions of potential
papers were read to decide on final selection. The inclusion criteria were
(1) original studies that employed a quantitative methodological approach to investigate behavioral,
cognitive, and psychiatric (depression and anxiety)
endophenotypes in biological parents,
(2) the fact that autistic proband (other conditions on the spectrum such as Asperger Syndrome, Pervasive
Developmental Disorder, and Pervasive Develop- mental Disorder Not Otherwise Specified were also
included) must have a clinically established diagnosis
of autism (minimum DSM-III) and no concomitant medical conditions associated with autistic
symptomatology and visual, auditory, and motor
impairment such as Fragile X or Tuberous Sclerosis.
(3) Studies that carried out a comparison of
endophenotypes between parents of individuals diagnosed with autism and unaffected adults, a
normative parental control group, and/or a clinical
parental control group.
We excluded any studies investigating the BAP in the general
population, studies on genetics and autism, and studies
examining the neuroanatomical and neurofunctional
dimensions of the BAP. All single case studies, case series, book chapters, theoretical papers, review papers,
unpublished dissertations/theses, and studies not published in English were excluded.
The final set of papers was restricted to those that
quantitatively evaluated behavioral, cognitive, and psychiatric endophenotypes in biological parents of autistic
probands.
2.3. Data Extraction. The author (KR) examined the titles, abstracts, and studies with study selection criteria. Data were organized into broad domains for each of the three
categories: sociobehavioral, that is, direct assessment of
BAP expression, other measures of personality and friend- ships, social interaction, repetitive/restrictive interests, and
social and narrative language; cognitive, that is, intellectual functioning, structural language, social cognition, executive
function, local visual processing (central coherence), and
visual perception; other psychiatric conditions, specifically depression and anxiety.

195
Search
element
TABLE 1: Description of search strategy.
EMBASE MEDLINE PsycINFO PsycEXTRA Global Health
Exposure Thesaurus terms explored: Autis∗
Keywords Endophenotyp∗ OR Phenotyp∗
Outcome
Thesaurus terms explored
Behavior
Language
Social
interaction
Repetitive
Restrictive
Cognitive
Executive
function
Central
coherence
Theory of mind
Social cognition
Visual
Attention
Depression
anxiety
Thesaurus terms explored
Behavior
Language
Social
interaction
Repetitive
Restrictive
Cognitive
Executive
function
Central
coherence
Theory of mind
Social cognition
Visual
Attention
Depression
anxiety
Thesaurus terms explored
Behavior
Language
Social
interaction
Repetitive
Restrictive
Cognitive
Executive
function
Central
coherence
Theory of mind
Social cognition
Visual
Attention
Depression
anxiety
Thesaurus terms explored
Behavior
Language
Social
interaction
Repetitive
Restrictive
Cognitive
Executive
function
Central
coherence
Theory of mind
Social cognition
Visual
Attention
Depression
anxiety
Thesaurus terms explored
Behavior
Language
Social
interaction
Repetitive
Restrictive
Cognitive
Executive
function
Central
coherence
Theory of mind
Social cognition
Visual
Attention
Depression
anxiety
Population Parent∗ OR Relative∗ OR Famil∗
Language Any
Records identified through
database searching (n = 7041)
Records after duplicates are removed
(n = 4127)
Records screened for abstracts
(n = 278)
Records excluded
(n = 215)
Full-text articles assessed for eligibility
(n = 63)
Full-text articles excluded with reasons (n = 12)
Additional records identified through manual search
(n = 9)
Studies meeting selection criteria
(n = 60)
FIGURe 1: Flow chart of study selection.
196
2.4. Effect Sizes. The data extracted was based on
heterogeneous measures and outcomes, so pooling the data
in a meta- analysis was inappropriate. To compare the robustness of the measures used, for each behavioral,
cognitive, and psychiatric variable of interest an effect size
(ES) was computed from the data reported in each study.
Cohen‘s effect size statistic (𝑑) was calculated as the
difference between the means of both groups divided by the pooled standard deviation. The following criteria were used
to assess the magnitude of effect:
𝑑 < 0.2 (small), 𝑑 > 0.5 (medium), and 𝑑 > 0.8 (large) [16].
3. Results
3.1. Search Results. The initial electronic search identified 7,041 records, of which 4,127 records remained after
duplicates were removed. 278 articles were eligible for full
review after examination of titles and abstracts (Figure 1). After full text review, we excluded 12 articles for the
following reasons: in 9 studies it was not possible to distinguish parent and sibling data when results were
reported for combined first-degree relatives, and, in 3
studies, proband diagnosis was established using criteria prior to DSM-III. The search criteria, additional articles
identified through manual search, and total numbers of
articles meeting selection criteria are shown in Figure 1.
3.2. Results of Literature Extraction. Twenty-five of the 60
studies that fulfilled the inclusion criteria directly evaluated
the BAP expression (including personality, social behavior, and pragmatic language features of the BAP). An additional
7 studies assessed other aspects within the sociobehavioral domain. Thirty-seven reports assessed the broad domain of
cognitive functioning and seven studies investigated other
psychiatric conditions. Twenty-seven of the studies were conducted in North America, 24 in Western Europe, 4 in the
Middle East, and 3 in Western Pacific and 1 was conducted
in South America and 1 used combined samples from North America, Western Europe, and Western Pacific. However,
no studies were conducted in Asia or Africa. Index families included a total of 4,833 mothers and 3,065 fathers that took
part across all studies reviewed (few studies did not specify
sex breakdown). Studies varied greatly in their choice of comparison control group, with 26 studies using a nonclinical
comparison group, 21 studies using a normative control
sample, and 13 studies using a combined sample of clinical and nonclinical control groups. Thirteen studies evaluated
the gradation of expression across family types using families with multiple incidence autism (MPX) and single incidence
autism (SPX).
We summarized the results of the literature search according to different sociobehavioral, cognitive and
psychiatric domains. For each domain we present the
measures used within that domain and any significant differences found between index parents and parental
controls, and so results are described in relation to proband diagnosis. All background measures used to establish BAP
status without using a comparison group as well as control
tasks are not reported under the specific criteria in this review.
3.3. Sociobehavioral Domain (Supplementary Table 1). This
domain includes studies that evaluated the BAP expression
using measures designed specifically to assess social abilities,
communication skills, and personality traits characteristic of the BAP, as well as measures of reciprocal interaction,
restrictive, and repetitive interest and social and narrative
language.
3.3.1. BAP Expression through Direct Clinical Assessment. Studies explored the BAP using a variety of measures and
research designs with some studies utilizing conservative
selection criteria, dividing parents of autistic probands into ―BAP present‖ (BAP+) and ―BAP absent‖ (BAP−) groups. As
shown in Supplementary Table 1 in Supplementary Material available online at https://doi.org/10.1155/2017/6346912, from
eight of the measures specifically designed to assess the
BAP, four are more recent questionnaires aiming to assess the BAP quantitatively, and four use interviews and direct
behavioral observations. Of the four questionnaires, one is a
self-report measure (Autism Spectrum Quotient (AQ)), two are informant report measures (Communication Checklist-
Adult (CCA); and Social Responsiveness Scale (SRS)), and one is a self-report and informant report questionnaire
(Broader Autism Phenotype Questionnaire (BAPQ)). Of the
four remaining measures, two are semistructured interviews (Family History Interview (FHI)/Family History Schedule
(FHS) and Modified Personality Assessment Schedule
(MPAS)/Modified Personality Assessment Schedule-Revised (MPAS-R)) and two assess BAP via interviews and direct
clinical observation/assessment (Broader Phenotype Autism Symptom Scale (BPASS) and Pragmatic Rating Scale (PRS)).
Autism Spectrum Quotient (AQ). A total of ten reports measured the BAP using the self-report AQ (ES range: 0.01–
1.34). Three studies used adaptations of the AQ: one in
Italian [17], one in Turkish [18], and one in French [19]. Within the ―social skills‖ factor, five studies found
significantly higher deficits in social skills compared to parents of typically developing children [17, 18, 20–22].
Two studies reported significantly higher prevalence of
―Attention Switching‖ deficits between the index parents and parents of typically developing children [22] and
parents of children with specific language impairment [23].
One study evaluating the ―Attention to Detail‖ subscale reported mothers of typically developing children scoring
significantly higher than index mothers [24]. Within the ―Communication‖ subscale, five out of eight studies reported
significantly higher communication deficits between index
parents and parents of typically developing children [17, 18, 20, 22] and parents of children with a specific language
impairment [23]. However, only Wheelwright et al.‘s (2010)
[22] study reported a significant trend for index parents to have more deficits in ―Imagination‖ subscale compared to a
sample of parents of typically developing children. For the total AQ score, four studies reported higher combined total
scores among index parents when compared to parents of
typically developing children [17, 18, 22] and parents of children with specific language impairment [23].
Ingersoll et al. (2011) [25] combined the social skill and
communication factors and revealed index mothers to score significantly higher than normative mothers on the AQ.
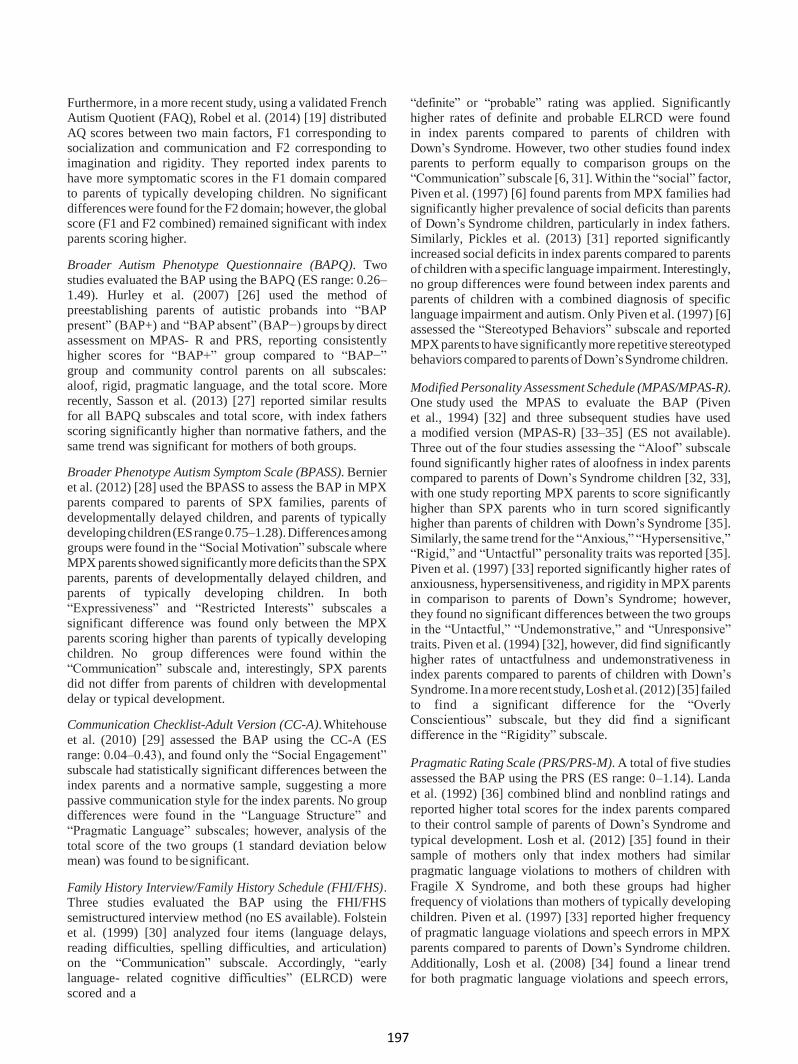
197
Furthermore, in a more recent study, using a validated French Autism Quotient (FAQ), Robel et al. (2014) [19] distributed
AQ scores between two main factors, F1 corresponding to socialization and communication and F2 corresponding to
imagination and rigidity. They reported index parents to
have more symptomatic scores in the F1 domain compared to parents of typically developing children. No significant
differences were found for the F2 domain; however, the global score (F1 and F2 combined) remained significant with index
parents scoring higher.
Broader Autism Phenotype Questionnaire (BAPQ). Two studies evaluated the BAP using the BAPQ (ES range: 0.26–
1.49). Hurley et al. (2007) [26] used the method of preestablishing parents of autistic probands into ―BAP
present‖ (BAP+) and ―BAP absent‖ (BAP−) groups by direct assessment on MPAS- R and PRS, reporting consistently
higher scores for ―BAP+‖ group compared to ―BAP−‖
group and community control parents on all subscales: aloof, rigid, pragmatic language, and the total score. More
recently, Sasson et al. (2013) [27] reported similar results
for all BAPQ subscales and total score, with index fathers scoring significantly higher than normative fathers, and the
same trend was significant for mothers of both groups.
Broader Phenotype Autism Symptom Scale (BPASS). Bernier
et al. (2012) [28] used the BPASS to assess the BAP in MPX parents compared to parents of SPX families, parents of
developmentally delayed children, and parents of typically
developing children (ES range 0.75–1.28). Differences among groups were found in the ―Social Motivation‖ subscale where
MPX parents showed significantly more deficits than the SPX
parents, parents of developmentally delayed children, and parents of typically developing children. In both
―Expressiveness‖ and ―Restricted Interests‖ subscales a significant difference was found only between the MPX
parents scoring higher than parents of typically developing
children. No group differences were found within the ―Communication‖ subscale and, interestingly, SPX parents
did not differ from parents of children with developmental
delay or typical development.
Communication Checklist-Adult Version (CC-A). Whitehouse
et al. (2010) [29] assessed the BAP using the CC-A (ES
range: 0.04–0.43), and found only the ―Social Engagement‖ subscale had statistically significant differences between the
index parents and a normative sample, suggesting a more
passive communication style for the index parents. No group differences were found in the ―Language Structure‖ and
―Pragmatic Language‖ subscales; however, analysis of the
total score of the two groups (1 standard deviation below mean) was found to be significant.
Family History Interview/Family History Schedule (FHI/FHS). Three studies evaluated the BAP using the FHI/FHS
semistructured interview method (no ES available). Folstein et al. (1999) [30] analyzed four items (language delays,
reading difficulties, spelling difficulties, and articulation) on the ―Communication‖ subscale. Accordingly, ―early
language- related cognitive difficulties‖ (ELRCD) were
scored and a
―definite‖ or ―probable‖ rating was applied. Significantly higher rates of definite and probable ELRCD were found
in index parents compared to parents of children with
Down‘s Syndrome. However, two other studies found index parents to perform equally to comparison groups on the
―Communication‖ subscale [6, 31]. Within the ―social‖ factor,
Piven et al. (1997) [6] found parents from MPX families had significantly higher prevalence of social deficits than parents
of Down‘s Syndrome children, particularly in index fathers. Similarly, Pickles et al. (2013) [31] reported significantly
increased social deficits in index parents compared to parents
of children with a specific language impairment. Interestingly, no group differences were found between index parents and
parents of children with a combined diagnosis of specific
language impairment and autism. Only Piven et al. (1997) [6] assessed the ―Stereotyped Behaviors‖ subscale and reported
MPX parents to have significantly more repetitive stereotyped behaviors compared to parents of Down‘s Syndrome children.
Modified Personality Assessment Schedule (MPAS/MPAS-R). One study used the MPAS to evaluate the BAP (Piven
et al., 1994) [32] and three subsequent studies have used a modified version (MPAS-R) [33–35] (ES not available).
Three out of the four studies assessing the ―Aloof‖ subscale
found significantly higher rates of aloofness in index parents compared to parents of Down‘s Syndrome children [32, 33],
with one study reporting MPX parents to score significantly
higher than SPX parents who in turn scored significantly higher than parents of children with Down‘s Syndrome [35].
Similarly, the same trend for the ―Anxious,‖ ―Hypersensitive,‖ ―Rigid,‖ and ―Untactful‖ personality traits was reported [35].
Piven et al. (1997) [33] reported significantly higher rates of
anxiousness, hypersensitiveness, and rigidity in MPX parents in comparison to parents of Down‘s Syndrome; however,
they found no significant differences between the two groups
in the ―Untactful,‖ ―Undemonstrative,‖ and ―Unresponsive‖ traits. Piven et al. (1994) [32], however, did find significantly
higher rates of untactfulness and undemonstrativeness in index parents compared to parents of children with Down‘s
Syndrome. In a more recent study, Losh et al. (2012) [35] failed
to find a significant difference for the ―Overly Conscientious‖ subscale, but they did find a significant
difference in the ―Rigidity‖ subscale.
Pragmatic Rating Scale (PRS/PRS-M). A total of five studies
assessed the BAP using the PRS (ES range: 0–1.14). Landa
et al. (1992) [36] combined blind and nonblind ratings and
reported higher total scores for the index parents compared
to their control sample of parents of Down‘s Syndrome and
typical development. Losh et al. (2012) [35] found in their
sample of mothers only that index mothers had similar
pragmatic language violations to mothers of children with
Fragile X Syndrome, and both these groups had higher
frequency of violations than mothers of typically developing
children. Piven et al. (1997) [33] reported higher frequency
of pragmatic language violations and speech errors in MPX
parents compared to parents of Down‘s Syndrome children.
Additionally, Losh et al. (2008) [34] found a linear trend
for both pragmatic language violations and speech errors,

198
reporting MPX parents to score significantly higher than SPX parents who in turn scored significantly higher than
parents of children with Down‘s Syndrome. Ruser et al. (2007) [37] used a modified version of the PRS (PRS-M) and
reported index parents to have significantly higher deficits
in subscales of emotional expressiveness and awareness of the other, overtalkativeness, and language in comparison to
parents of children with Down‘s Syndrome. Group differences in the communicative factor were not found to be
significant; however, index fathers showed significantly
increased communication deficits than index mothers. The total PRS- M score revealed significant group differences
between index parents and Down‘s Syndrome parents, with
index fathers scoring higher than index mothers.
Social Responsiveness Scale (SRS). The SRS was used as a
measure to assess the BAP by two studies in our review (ES
range: 0.02–0.90). De la Marche et al. (2012) [38] reported all index fathers (MPX and SPX combined) having a
significantly higher total score compared to unaffected adult
males; however no statistical differences were found between MPX fathers and SPX fathers and SPX fathers and
male controls. In contrast, Schwichtenberg et al. (2010) [39] found that both the MPX and SPX fathers in their sample
scored significantly higher than fathers of typically
developing children. No differences between mothers in both groups were found.
3.3.2. Other Measures of Personality and Friendships. Another personality measure used in studies of the BAP is
the NEO Personality Inventory (NEO-PI). Two studies show
a trend for parents from MPX families scoring significantly higher on the neuroticism subscale in comparison to
parents of children from SPX families [34] and parents of
DS probands [33, 34] (ES 0.79, 𝑛 = 1). Furthermore, the
same two studies assessed quality of friendships using the
Friendship Interview (FI), indicating significantly fewer friendships in parents from MPX families in comparison
to parents of children from SPX families [34] and parents of Down‘s Syndrome children [33, 34]. Interestingly, Losh
et al. (2008) [34] also found sex differences in the quality
of friendships within ASD parents, with fathers from MPX families and SPX families having significantly fewer
friendships than mothers from MPX families and SPX
families (ES 1.14, 𝑛 = 1).
3.3.3. Reciprocal Social Interaction. Two studies assessed
alexithymia (i.e., inability to identify and describe emotions
in oneself) as part of the BAP. Szatmari et al. (2008) [9] used the Toronto Alexithymia Scale (TAS-20) as a measure
of alexithymia and, despite its three factors (difficulty identifying feelings, difficulty describing feelings, and
externally oriented thinking) not reaching significance, the
total score confirmed higher frequency of alexithymia in index parents compared to parents of children with Prader
Willi syndrome. Using the same scale, however, Berthoz et al.
(2013) [40] failed to find a statistically significant difference between index parents and unaffected adults (ES range:
0.14–0.25). Another measure of alexithymia used by Berthoz et al. (2013) [40] was the Bermond-Vorst Alexithymia
Questionnaire-B (BVAQ-B);
however no significant differences were found between the samples (ES range: 0.02–0.19).
Berthoz et al. (2013) [40] further assessed social
anhedonia (i.e., inability to experience pleasure from activities usually found enjoyable), using the revised version
of the Social Anhedonia Scale (SAS) (ES 0.25) and found
no significant differences between the index parents and unaffected adults. However, Berthoz et al. (2013) [40]
found index parents to score significantly higher than unaffected adults on physical anhedonia as measured by the
Physical Anhedonia Scale (PAS) (ES 0.33).
3.3.4. Social and Narrative Language. In addition to the PRS, which was specifically designed to assess the deficits
in social language as a BAP expression, two other measures have assessed social and narrative language. Di Michele et
al. (2007) [8] used Grice‘s Conversational Maxims task to
assess pragmatic conversations and found the index parents performed significantly worse when compared to parents
of typically developing children and parents of children with Down Syndrome (ES not available). Landa et al. (1991)
[41] used ―spontaneous narrative discourse performance‖
to assess narrative discourse deficits. They reported control adults producing significantly more complete episodes and
stories with multiple episodes, and the mean overall quality
for the index parents was significantly less than that for the comparison adults (ES range: 0.35–0.73).
3.3.5. Repetitive/Restrictive Behaviors and Interests. Repetitive and restrictive behaviors are a core symptom of
autism. The majority of findings in parents of autistic
probands corresponding to this domain are covered in the studies that assess the BAP in terms of rigid and
perfectionistic personalities. Only one study used an
experimental questionnaire designed to examine real-life, nonsocial skills and preferences such as insistence on
routines and circumscribed hobbies. Briskman et al. (2001) [42] reported index parents to score significantly higher
than parents of boys with dyslexia and typical development
(ES range: 0.37–1.11).
3.4. Cognitive Domain (Supplementary Table 2). Most forms
of neuropsychological tests involve multiple cognitive functions suggesting that cognitive domains can be related to
each other. We have organized the measures for this broad
domain under different categories based on the cognitive function which they predominantly assess; however, an
overlap may exist. References for the different measures can be found in the studies included in this review and in
more specialized text book resources [43].
3.4.1. Intellectual Functioning. Intelligence Quotient (IQ) was measured with different versions of the Wechsler Scales in
the studies. Thirteen studies assessed total Verbal IQ (VIQ)
(ES range: 0.05–1.28, 𝑛 = 12), with scores for index parents
similar to comparison groups in all but one study [44] with higher scores for index parents when compared to parents
of Down‘s Syndrome children. Several VIQ subtests were
also independently tested. Three studies used the digit span subtest (some modified it to assess short term memory)

199
(ES range: 0.04–0.67), of which two found better performance in index parents compared to parents with
children with Down‘s Syndrome [44] and parents of children with specific language impairment [23]. Only one
study used the Arithmetic subscale and found no significant
differences between index parents compared to parents with children with Down‘s Syndrome [44] (ES: 0.25). Four
studies used the vocabulary subtest (ES range: 0.04–0.96) and results were mixed, with one study indicating higher
scores for index parents compared to parents of children
with Down‘s Syndrome [44], another indicating a reverse trend with index parents scoring significantly lower than
parents of typically developing children [45], and two
revealing no significant differences between groups. Four studies assessed the comprehension subtest (ES range:
0.31–0.74), with only one indicating a significant difference with index parents scoring significantly higher
than parents of children with Down‘s Syndrome [44].
Additionally, two studies used the similarities subtest (ES range: 0.13–0.35) with only one reporting a significant
difference [44].
Thirteen studies also assessed total Performance IQ (PIQ)
(ES range: 0–1.16, 𝑛 = 12), with three studies reporting a
significant difference, with index parents performing poorer than parents of children with Down‘s Syndrome [30, 46] and
unaffected adults [10]. One study, however, reported an
opposite trend with index fathers performing significantly better than fathers with a child with specific language
impairment [47]. Several PIQ subtests were also independently tested. Four studies used the picture
completion subtest (ES range: 0.07–0.65); however only
two reported significant lower scores for index parents compared to parents of children with Down‘s Syndrome
[30, 46]. Moreover, Folstein et al. (1999) [30] also reported
lower scores on the picture arrangement subtest with the
same trend of significance (ES range: 0.03–0.26, 𝑛 = 2).
Two studies assessed the object assembly subtest (ES range: 0.12–0.62); however only one reported a significant
difference with MPX parents scoring lower than parents of
Down‘s Syndrome children [46]. Furthermore, Schmidt et al. (2008) [10] found significantly lower scores on the
matrix reasoning subtest in index parents compared to unaffected adults (ES 0.67). Interestingly, none of the five
studies assessing the block design subtest (ES range: 0.04–
0.43) and one study assessing the digit symbol subtest found significant differences between groups (ES range:
0.17–0.19).
Full Scale IQ (FSIQ) (ES range: 0.05–1.88, 𝑛 = 13) was assessed in fourteen studies in our review with three studies
reporting a significant poorer performance in index parents when compared to parents of children with Down‘s Syndrome
[30, 34] and a combined clinical group of parents of children
with Down‘s Syndrome and typical development [48]. Additionally, four studies used Raven‘s Progressive
Matrices to report Nonverbal IQ (NVIQ), with no significant differences found between groups [49–52] (ES range: 0.05–
0.57).
3.4.2. Structural Language Abilities. A number of studies assessed structural language abilities using a variety of
different measures. Results are divided into specific
domains. Receptive language skills were assessed by
three studies using two measures. The Peabody Picture Vocabulary Test (PPVT-III) (ES range: 0.33–1.58) was
used by two studies with only one study reporting index
mothers as having significantly more deficits than mothers of children with autism and language impairment who in
turn had more deficits compared to mothers of children
with a specific language impairment [47]. Whitehouse et al. (2007) [23] used the Test for Reception of Grammar-2
(TROG-2) to evaluate receptive grammar and reported no differences between groups (ES not available). Schmidt et al.
(2008) [10] assessed expressive language using the
Expressive Vocabulary Test (EVT) (ES 0.10) and the verbal fluency subtest of the Delis Kaplan Executive Function
System (DK-EFS) (ES: 0.16–0.39) reporting no significant
differences between index parents and unaffected adults. Additionally, they assessed figurative language using the
figurative language subtest from the Test of Language Competence-Expanded Edition (TOLC-E) reporting no
significant differences between the two groups (ES: 0.28).
Phonological processing was assessed in five reports using five different tests. Lindgren et al. (2009) [47] used the
Comprehensive Test of Phonological Processing (CTOPP)
(ES range: 0.02–1.42, 𝑛 = 2), revealing significantly better performance in phonological awareness and the nonword
repetition subtests in the index mothers compared to mothers of children with a specific language impairment. In contrast,
however, Schmidt et al. (2008) [10] found index parents to
perform significantly lower than unaffected adults in the same nonword subtest. Bishop et al. (2004) [53] used a
different Nonword Memory Test (ES range: 0.02–0.04) and a Nonsense Passage Reading test (ES range: 0.04–0.42) to
assess phonological processing, none indicating significant
differences between index parents and parents of typically developing children. However, Whitehouse et al. (2007) [23]
did find index parents to perform significantly better than
parents of children with specific language impairment in the nonsense words subtest of the NEPSY (a Developmental
Neuropsychological Assessment Test Battery) (ES range: 0.04–0.88). In contrast, Plumet et al. (1995) [54] found no
significant differences in composite verbal scores when
comparing index parents to parents of children with Down‘s Syndrome using a battery of verbal tasks with an emphasis on
orthographic and phonological abilities (ES: 0.22).
Reading skills were assessed by eight studies using seven different measures. Piven and Palmer (1997) [46] used the
Rapid Automized Naming (RAN) task and found no differences in the number and letter categories; however,
they found significant differences with MPX parents taking
longer to complete the task on the color and object categories (ES range: 0.17–0.58). Similarly, Losh et al.
(2010) [55] combined the color and object categories and
reported index parents taking longer to complete the task when compared with parents of typically developing
children (ES not available). The Woodcock-Johnson Psychoeducational Battery-Revised (WJ-R) has several
subtests, and no significant differences were found in the
broad reading (ES range: 0.48–2.11) and reading skill composite scores [47] (ES range: 0.40–1.84), the word
attack subtest [46, 47] (ES range: 0.09–1.35), and letter
word subtest [46]. However, Folstein et al. (1999) [30]

200
found a significantly lower reading age and reading grade using the nonsense word reading subtest in index parents
compared to parents of children with Down‘s Syndrome (ES: 0.40). Mothers of children with autism performed
better in the dictation (ES range: 0.17–0.99, 𝑛 = 2) and
passage comprehension subtests (ES range: 0.45–1.54, 𝑛 =
2) compared to mothers of children with specific language impairment [47]. In contrast, Piven and Palmer (1997) [46]
found MPX parents had more difficulties in the passage com-
prehension subtest when compared with parents of children with Down‘s Syndrome. Interestingly, no differences were
noted in comprehension (ES range: 0.12–0.36) and passage
reading subtests (ES range: 0.21–0.36) using the Gray Oral Reading Test (GORT) [30, 44] and the Edinburgh Reading
Test (ERT) [44]. Fombonne et al. (1997) [44] also used the
National Adult Reading Test (NART) (ES range: 0.20–0.44,
𝑛 = 2) reporting index parents scoring significantly lower
than parents of children with Down‘s Syndrome. However, Baron-Cohen and Hammer (1997) [7] found no significant
differences in error scores between index parents and parents of typically developing children. Whitehouse et al. (2007)
[23] used the Test of Word Reading Efficiency (ES range:
0.03–0.62) and found index parents performed better than parents of children with specific language impairment on
the phonemic decoding efficiency subtest (nonsense words).
Finally, Schmidt et al. (2008) [10] found no significant differences in reading difficulties using the Reading History
Questionnaire (RHQ) between index parents and unaffected
adults (ES: 0.34). Three studies assessed spelling abilities using two
different measures. Whitehouse et al. (2007) [23] found no group differences using a Speeded Dictation task (ES not
available). Furthermore, Fombonne et al. (1997) [44] found
a superior performance by index parents on the Schonell
Spelling Test (SST) (ES range: 0.02–0.13, 𝑛 = 2). Only one
study assessed oromotor functioning using the oromotor sequencing subtest of the NEPSY Test Battery (ES range:
0.43–0.54) reporting index families performing better than
parents of children with specific language impairment [23].
3.4.3. Social Cognition. In this domain measures assess the
ability to process information relating to other people‘s
mental states. Five reports assessed the ―Theory of Mind‖ using different versions of Reading the Mind in the Eyes Test
(ES range: 0.03–1.51, 𝑛 = 4). Three studies reported deficits between index parents and comparison groups [7, 48, 56].
In contrast, Gocken et al. (2009) [57] and Tajmirriyahi et al.
(2013) [58] found no significant group differences in mental state decoding in the eyes test. Furthermore, Gocken et al.
(2009) [57] explored mental state decoding using a faces
test and reported no significant differences between index parents and a normative sample (ES: 0.23). Tajmirriyahi et
al. (2013) [58], however, used a novel method of Reading
the Mind in the Voice Test to reveal significantly higher deficits in mental state decoding in index parents when
compared to parents of children with Down‘s Syndrome and typical development (ES range: 0.63–0.98). Additionally, Di
Michele et al. (2007) [8] used False Belief tasks (smarties task,
Sally-Anne task, and unexpected transfer test) and found
index parents passed fewer false belief tests in comparison to parents of children with Down‘s Syndrome and typical
development (ES not available). Similarly, Gocken et al.
(2009) [57] reported poorer performance in index parents compared to a normative sample using the Unexpected
Outcomes Test (UOT) (ES: 0.58); however, they did not find
a significant difference using the Hinting task (ES: 0.36). Remarkably, only one study assessed empathy using the
Empathy Quotient (EQ) reporting significant impairments in empathy in index fathers compared to unaffected males [52]
(ES: 0.11–0.40).
Affect perception was assessed in eight studies using twelve different tests of emotion recognition and labeling.
Using the ―Bubbles‖ method with pictures of facial affect,
Adolphs et al. (2008) [59] showed no difference in accuracy and reaction time; however, the ―BAP+‖ group used
significantly different facial information (eye region and mouth region) in comparison to the ―BAP−‖ group and
parents of typically developing children (ES not
available). Using the Penn Emotion Recognition Test (ER40), das Neves et al. (2011) [60] reported significantly
longer time for correct responses in index parents compared
to unaffected adults (ES range: 0.54–1.09). They also reported less accurate responses, identification of female and
male faces, and mild and extreme emotions. Bolte and Poustka (2003) [49] showed no significant differences in
groups using the Facial Affect Recognition Test (pictures by
Ekman and Friesen) (ES range: 0.32–2.06). Similarly, Sucksmith et al. (2013) [52] found no significant
differences in accuracy and adjusted response time in index
parents compared to unaffected adults using the Karolinska Directed Emotional Faces task (KDEF) (ES range: 0.08–0.30).
Kadak et al. (2014) [21] used the Emotion Recognition Test
(using photos of facial affect from Ekman and Friesen) and found index parents had impaired recognition of happy,
surprised, and neutral faces compared to parents of typically developing children (ES range: 0.05–0.50).
Two studies assessed emotional labeling and matching
of facial patterns using three different measures. Using Schematic Line Drawings (ES not available), Palermo et
al. (2006) [61] showed impaired labeling for sad, disgust,
and overall recognition of facial patterns in index parents compared to parents of typically developing children. In
contrast, using the Emotion Matching task (ES: 0.06) and the Emotion Labeling task (ES: 0.19), Smalley and Asarnow
(1990) [45] found no significant impairments.
3.4.4. Executive Function. Executive function encompasses abilities that underlie goal directed behavior. This broad domain was split into specific subdomains. Cognitive
flexibility was assessed by four studies evaluating set-
shifting tasks. Two studies using the intradimensional/extradimensional set-shifting task (IDED)
revealed significantly higher rates of learned irrelevance [62] (ES: 0.52), trials to criterion [63] (ES range: 0.69–
0.83), and errors to criterion [63] (ES range: 0.64–0.70) in
index parents compared to control samples in the extradimensional stage only. However, Bolte and Poustka
(2006) [50] used the Wisconsin Card Sorting Test (WCST)
(ES range: 0.06–0.18) and the Trail Making Test (TMT, Parts A and B) (ES range: 0.13–0.38) and found no impaired
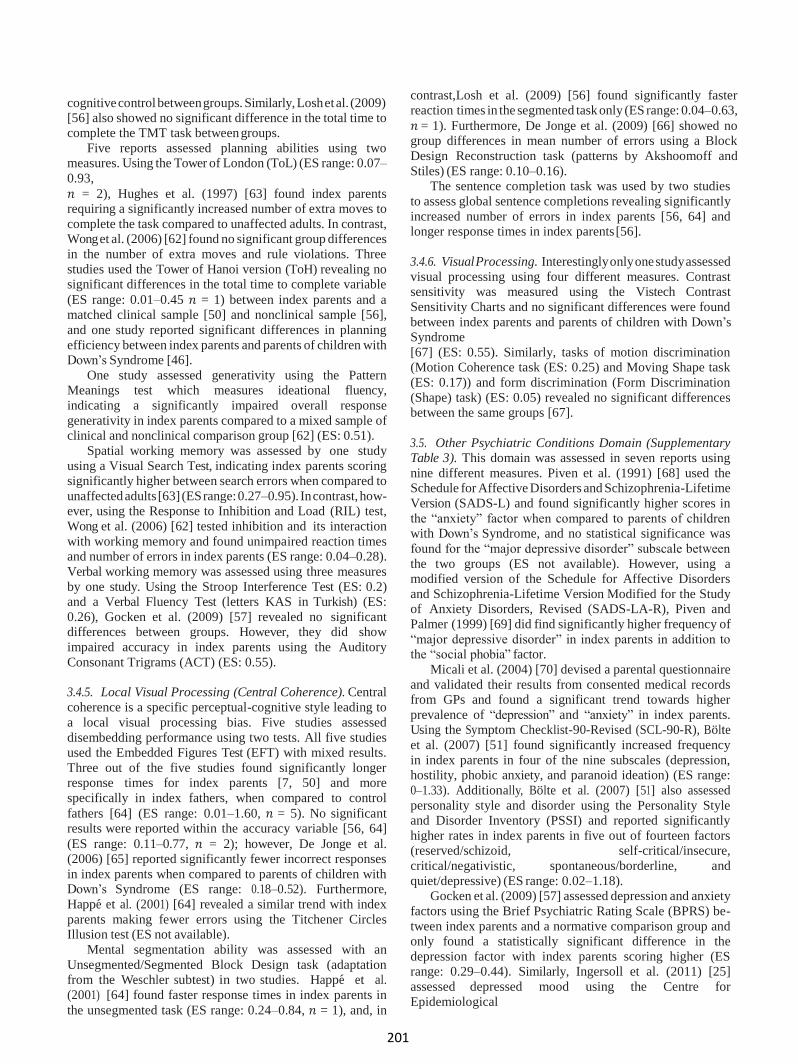
201
cognitive control between groups. Similarly, Losh et al. (2009) [56] also showed no significant difference in the total time to complete the TMT task between groups.
Five reports assessed planning abilities using two measures. Using the Tower of London (ToL) (ES range: 0.07–
0.93,
𝑛 = 2), Hughes et al. (1997) [63] found index parents requiring a significantly increased number of extra moves to
complete the task compared to unaffected adults. In contrast, Wong et al. (2006) [62] found no significant group differences
in the number of extra moves and rule violations. Three
studies used the Tower of Hanoi version (ToH) revealing no significant differences in the total time to complete variable
(ES range: 0.01–0.45 𝑛 = 1) between index parents and a matched clinical sample [50] and nonclinical sample [56],
and one study reported significant differences in planning
efficiency between index parents and parents of children with Down‘s Syndrome [46].
One study assessed generativity using the Pattern Meanings test which measures ideational fluency,
indicating a significantly impaired overall response
generativity in index parents compared to a mixed sample of clinical and nonclinical comparison group [62] (ES: 0.51).
Spatial working memory was assessed by one study
using a Visual Search Test, indicating index parents scoring significantly higher between search errors when compared to
unaffected adults [63] (ES range: 0.27–0.95). In contrast, how- ever, using the Response to Inhibition and Load (RIL) test,
Wong et al. (2006) [62] tested inhibition and its interaction
with working memory and found unimpaired reaction times and number of errors in index parents (ES range: 0.04–0.28).
Verbal working memory was assessed using three measures
by one study. Using the Stroop Interference Test (ES: 0.2) and a Verbal Fluency Test (letters KAS in Turkish) (ES:
0.26), Gocken et al. (2009) [57] revealed no significant differences between groups. However, they did show
impaired accuracy in index parents using the Auditory
Consonant Trigrams (ACT) (ES: 0.55).
3.4.5. Local Visual Processing (Central Coherence). Central
coherence is a specific perceptual-cognitive style leading to
a local visual processing bias. Five studies assessed
disembedding performance using two tests. All five studies used the Embedded Figures Test (EFT) with mixed results.
Three out of the five studies found significantly longer response times for index parents [7, 50] and more
specifically in index fathers, when compared to control
fathers [64] (ES range: 0.01–1.60, 𝑛 = 5). No significant results were reported within the accuracy variable [56, 64]
(ES range: 0.11–0.77, 𝑛 = 2); however, De Jonge et al. (2006) [65] reported significantly fewer incorrect responses
in index parents when compared to parents of children with Down‘s Syndrome (ES range: 0.18–0.52). Furthermore,
Happe et al. (2001) [64] revealed a similar trend with index
parents making fewer errors using the Titchener Circles Illusion test (ES not available).
Mental segmentation ability was assessed with an
Unsegmented/Segmented Block Design task (adaptation from the Weschler subtest) in two studies. Happe et al.
(2001) [64] found faster response times in index parents in
the unsegmented task (ES range: 0.24–0.84, 𝑛 = 1), and, in
contrast,Losh et al. (2009) [56] found significantly faster reaction times in the segmented task only (ES range: 0.04–0.63,
𝑛 = 1). Furthermore, De Jonge et al. (2009) [66] showed no group differences in mean number of errors using a Block
Design Reconstruction task (patterns by Akshoomoff and
Stiles) (ES range: 0.10–0.16). The sentence completion task was used by two studies
to assess global sentence completions revealing significantly
increased number of errors in index parents [56, 64] and longer response times in index parents [56].
3.4.6. Visual Processing. Interestingly only one study assessed
visual processing using four different measures. Contrast sensitivity was measured using the Vistech Contrast
Sensitivity Charts and no significant differences were found
between index parents and parents of children with Down‘s Syndrome
[67] (ES: 0.55). Similarly, tasks of motion discrimination (Motion Coherence task (ES: 0.25) and Moving Shape task
(ES: 0.17)) and form discrimination (Form Discrimination
(Shape) task) (ES: 0.05) revealed no significant differences between the same groups [67].
3.5. Other Psychiatric Conditions Domain (Supplementary Table 3). This domain was assessed in seven reports using
nine different measures. Piven et al. (1991) [68] used the Schedule for Affective Disorders and Schizophrenia-Lifetime
Version (SADS-L) and found significantly higher scores in
the ―anxiety‖ factor when compared to parents of children with Down‘s Syndrome, and no statistical significance was
found for the ―major depressive disorder‖ subscale between
the two groups (ES not available). However, using a modified version of the Schedule for Affective Disorders
and Schizophrenia-Lifetime Version Modified for the Study of Anxiety Disorders, Revised (SADS-LA-R), Piven and
Palmer (1999) [69] did find significantly higher frequency of
―major depressive disorder‖ in index parents in addition to the ―social phobia‖ factor.
Micali et al. (2004) [70] devised a parental questionnaire
and validated their results from consented medical records from GPs and found a significant trend towards higher
prevalence of ―depression‖ and ―anxiety‖ in index parents. Using the Symptom Checklist-90-Revised (SCL-90-R), Bolte
et al. (2007) [51] found significantly increased frequency
in index parents in four of the nine subscales (depression, hostility, phobic anxiety, and paranoid ideation) (ES range:
0–1.33). Additionally, Bolte et al. (2007) [51] also assessed
personality style and disorder using the Personality Style and Disorder Inventory (PSSI) and reported significantly
higher rates in index parents in five out of fourteen factors (reserved/schizoid, self-critical/insecure,
critical/negativistic, spontaneous/borderline, and
quiet/depressive) (ES range: 0.02–1.18). Gocken et al. (2009) [57] assessed depression and anxiety
factors using the Brief Psychiatric Rating Scale (BPRS) be-
tween index parents and a normative comparison group and only found a statistically significant difference in the
depression factor with index parents scoring higher (ES range: 0.29–0.44). Similarly, Ingersoll et al. (2011) [25]
assessed depressed mood using the Centre for
Epidemiological

202
Studies-Depression Scales (CESD) and showed index mothers as having increased rates of depression when
compared to a normative sample of mothers (ES: 0.35). Interestingly, Berthoz et al. (2013) [40] reported no
significant differences in levels of depressive mood using
the Beck Depression Inventory (BDI) (ES: 0.50) and no significant differences were found in anxiety levels using
the state (ES: 0.19) and trait portions (ES: 1.24) of State-Trait Anxiety Inventory Form Y (STAI-Y) [40].
4. Discussion
This systematic review aimed to assess the evidence of
behavioral, cognitive, and psychiatric profiles of the BAP in
unaffected biological parents of autistic probands by
synthesizing the evidence from 60 studies meeting a priori search criteria. Results are discussed according to the
following criteria: (i) the number of studies that indicate
significant impairments in each domain and subdomain; (ii) quantitative criteria using effect sizes; and (iii) the possible
emerging themes across studies. Table 2 represents a summary of all measures used by studies meeting our
search criteria.
4.1. Summary of Findings. Findings emerging from this
review are discussed according to each domain. Within the sociobehavioral domain, eight measures that directly assess
the BAP expression in unaffected parents showed
substantial deficits in the domain of social and communication skills (AQ, 7/10 studies; BPASS, 1 study;
CC-A, 1 study; FHI/FHS, 2/2 studies; SRS, 2/2 studies),
rigid and perfectionistic (BAPQ, 2/2 studies; MPAS-R, 3/3 studies) and aloof (BAPQ, 2/2; MPAS-R, 3/4 studies)
personality traits, and pragmatic language difficulties (BAPQ, 2/2 studies; PRS, 4/4 studies) related to the core
deficit in autism and are reported consistently across most
studies. Moreover, additional deficits in social and narrative language have been highlighted using measures of
spontaneous narrative discourse [36] and Grice‘s
Conversational Maxims task [8]. Available evidence also points to index parents establishing fewer friendships (FI, 2/2
studies) and an elevated frequency of neuroticism (NEO-PI, 2/2 studies). Despite being a core domain of a clinical
diagnosis for autism, the majority of findings in parents of
autistic probands corresponding to restricted and repetitive behaviors and interests are covered in the studies that assess
the BAP in terms of rigid and perfectionistic personality
styles. Only one study used an experimental questionnaire designed to examine real-life nonsocial skills and
preferences such as insistence on routines and circumscribed hobbies [42].
Within the sociobehavioral domain, reciprocal social
interaction is probably the least studied subdomain in parents of autistic probands. As such, findings from alexithymia
(TAS-20, 1/2 studies; BVAQ-B, 1 study with no significance
found) and physical (PAS, 1/1 study) and social anhedonia (SAS, 1 study with no significance found) are modest and
require further studies to explore these traits. Thus, we agree with previous reviews [12–14] indicating that mild
social/communication deficits, rigid/aloof personality traits,
and pragmatic language difficulties may be the most useful
social behavioral candidate endophenotype traits as they meet all the established criteria [11]; however, effect sizes
throughout this domain varied considerably.
At the cognitive level, a remarkable finding is the discrepancies found in intellectual functioning of parents of
autistic probands compared to parents of children with and
without a clinical diagnosis. One of thirteen studies revealed significantly higher VIQ scores when compared to a clinical
sample of parents of a child with Down‘s Syndrome [44]. Three of thirteen studies assessing PIQ reached a similar
significant trend when compared to parents with a Down‘s
Syndrome child [30, 46] and unaffected adults [10]. Total PIQ scores were significantly higher in index parents when
compared to parents with a child with specific language
impairment [47]. Only two of twelve reports reached a significant deficit in FSIQ when index parents were compared
to parents of children with Down‘s Syndrome [30] and when compared to a combined sample of parents of a child with
Down‘s Syndrome and of typical development. However, it is
noteworthy that scores for all parents were well within the average range in all studies. Thus there is limited evidence for
the role of intellectual functioning as an endophenotype for
autism with no clear clinical significance. Several measures were used to assess the structural
language abilities within the cognitive domain. Interestingly, no significant differences were found in the expressive
language (TROG-2, 1 study with no significance found;
EVT, 1 study with no significance found; DK-EFS verbal fluency subtest, 1 study with no significance found) and
figurative language categories (TOLCE-E figurative
language subtest, 1 study with no significance found). Lindgren et al. (2009) [47] found index parents to perform
better than parents with a child with a specific language impairment on measures assessing receptive language
(PPVT-III, 1/2 studies; TROG-2, 1 study with no
significance found) refuting the hypothesis that families with autism and specific language impairment do not share
similar genetic loading for language.
In phonological awareness, findings are mixed with studies only reporting few deficits in nonsense word/passage
reading tests (2/3 studies) with index parents performing better than parents with a specific language impairment
child [23] and parents of children with Down‘s Syndrome
[30]. Using the RAN measure for reading skills, two studies reported faster times to complete the color and object only
tasks in index parents when compared to parents of children
with Down‘s Syndrome [46] and parents of typically developing children [55]. This may have relevance with
regard to perceptual load in autism. However, no significant differences were found in the rapid naming subtest of the
CTOPP [47].
Findings from the social cognition domain including mental state decoding, affect perception, emotion
recognition, and labeling in the BAP also report mixed and
conflicting results. Remarkably only one studied assessed empathy warranting further research in this subdomain.
Evidence from the broad domain of executive function in the BAP is also inconsistent but the few studies that have
found impairments did not appropriately match
experimental and control groups for IQ are worth noting (e.g., [63]).
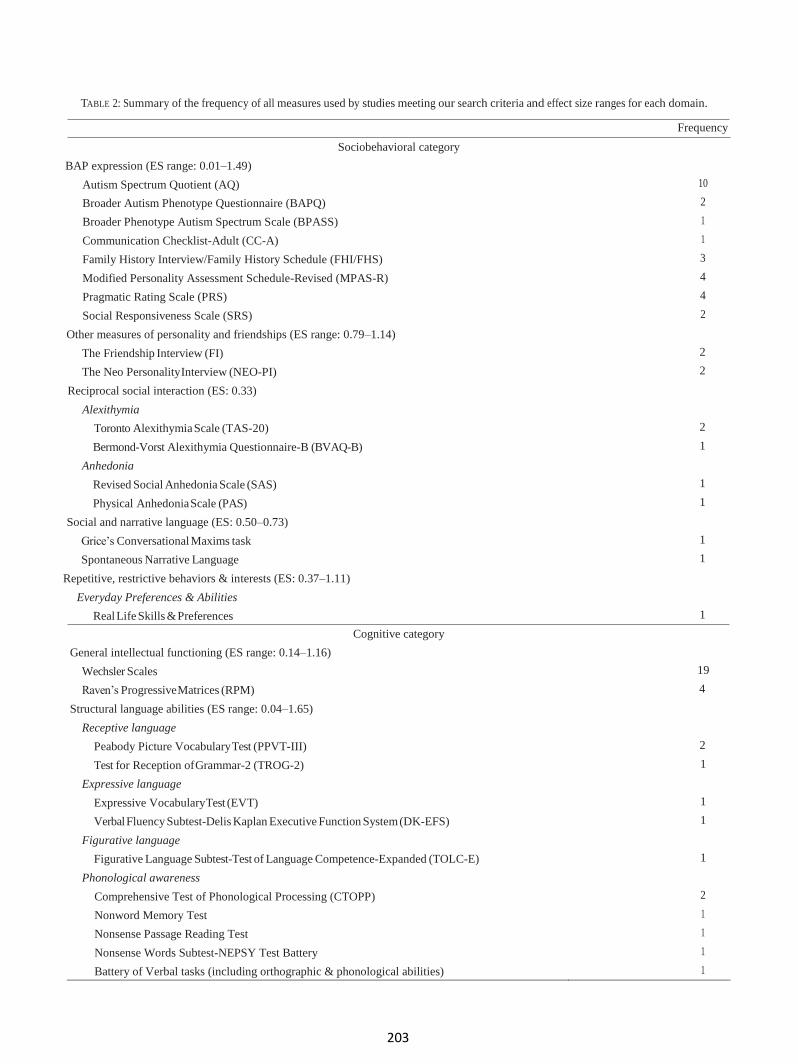
203
TABLE 2: Summary of the frequency of all measures used by studies meeting our search criteria and effect size ranges for each domain.
Frequency
Sociobehavioral category
BAP expression (ES range: 0.01–1.49)
Autism Spectrum Quotient (AQ) 10
Broader Autism Phenotype Questionnaire (BAPQ) 2
Broader Phenotype Autism Spectrum Scale (BPASS) 1
Communication Checklist-Adult (CC-A) 1
Family History Interview/Family History Schedule (FHI/FHS) 3
Modified Personality Assessment Schedule-Revised (MPAS-R) 4
Pragmatic Rating Scale (PRS) 4
Social Responsiveness Scale (SRS) 2
Other measures of personality and friendships (ES range: 0.79–1.14)
The Friendship Interview (FI) 2
The Neo Personality Interview (NEO-PI) 2
Reciprocal social interaction (ES: 0.33)
Alexithymia
Toronto Alexithymia Scale (TAS-20) 2
Bermond-Vorst Alexithymia Questionnaire-B (BVAQ-B) 1
Anhedonia
Revised Social Anhedonia Scale (SAS) 1
Physical Anhedonia Scale (PAS) 1
Social and narrative language (ES: 0.50–0.73)
Grice‘s Conversational Maxims task 1
Spontaneous Narrative Language 1
Repetitive, restrictive behaviors & interests (ES: 0.37–1.11)
Everyday Preferences & Abilities
Real Life Skills & Preferences 1
Cognitive category
General intellectual functioning (ES range: 0.14–1.16)
Wechsler Scales 19
Raven‘s Progressive Matrices (RPM) 4
Structural language abilities (ES range: 0.04–1.65)
Receptive language
Peabody Picture Vocabulary Test (PPVT-III) 2
Test for Reception of Grammar-2 (TROG-2) 1
Expressive language
Expressive Vocabulary Test (EVT) 1
Verbal Fluency Subtest-Delis Kaplan Executive Function System (DK-EFS) 1
Figurative language
Figurative Language Subtest-Test of Language Competence-Expanded (TOLC-E) 1
Phonological awareness
Comprehensive Test of Phonological Processing (CTOPP) 2
Nonword Memory Test 1
Nonsense Passage Reading Test 1
Nonsense Words Subtest-NEPSY Test Battery 1
Battery of Verbal tasks (including orthographic & phonological abilities) 1

204
Reading abilities
TABLE 2: Continued.
Frequency
Rapid Automized Naming (RAN) 2
Woodcock-Johnson Psychoeducational Battery-Revised (WJ-R) 3
Gray Oral Reading Test (GORT) 2
Edinburgh Reading Test (ERT) 1
National Adult Reading Test (NART) 2
Test of Word Reading Efficiency 1
Reading History Questionnaire (RHQ) 1
Spelling abilities
Schonell Spelling Test (SST) 1
Speeded Dictation task 2
Oromotor functioning
Oromotor Sequencing Subtest-NEPSY Test Battery 1
Social cognition (ES range: 0.05–1.51)
Theory of Mind
Reading the Mind in the Eyes Test (different versions) 5
The Faces Test 1
Reading the Mind in the Voice Test 1
False Belief tasks (Smarties task; Sally-Anne task; unexpected transfer test) 1
Unexpected Outcomes Test (UOT) 1
The Hinting task 1
Empathy
Empathy Quotient (EQ) 1
Affect perception/emotion recognition
Pictures of facial affect, ―Bubbles‖ method 1
Penn Emotion Recognition Test (ER40) 1
Facial Affect Recognition Test 1
Emotion Recognition Test 1
Karolinska Directed Emotional Faces task (KDEF) 1
Point Light Basic Emotions task 1
Trustworthiness of Faces task 1
The Morphed Faces task 1
The Movie Still task 1
Schematic Line Drawings task 1
Emotion Matching task 1
Emotion Labeling task 1
Executive function (ES range: 0.27–1.27)
Set-shifting
intradimensional-extradimensional Set-Shifting task (IDED) 2
Wisconsin Card Sorting Test (WCST) 1
Trail Making Test (A & B) 2
Planning
Tower of London (ToL) 2
Tower of Hanoi (ToH) 3
Generativity/ideational fluency
Pattern Meanings 1

205
Spatial working memory/inhibition
TABLE 2: Continued.
Frequency
Visual Search Test 1
The Delayed Oculomotor task 1
Response Inhibition & Load (RIL) 1
Verbal working memory
Auditory Consonant Trigrams (ACT) 1
Verbal Fluency Test 1
Stroop Interference Test 1
Central coherence (local visual processing) (ES range: 0.18–1.60)
Disembedding performance
Embedded Figures Test (EFT) 5
Titchener Circles Illusion 1
Mental segmentation ability
Unsegmented Block Design task (adapted from Wechsler Scales)
2
Segmented Block Design task (adapted from Wechsler Scales) 2
Block Design task (Wechsler scales) 2
Block Design Reconstruction task 1
Attentional engagement
Detection task 1
Global sentence completions
Sentence completion task 2
Visual processing (ES not available)
Contrast sensitivity
Vistech Contrast Sensitivity Charts 1
Motion discrimination
Motion Coherence task 1
Moving Shape task 1
Form discrimination
Form Discrimination (Shape) task 1
Other psychiatric conditions category (depression and anxiety) (ES range: 0–1.33)
Brief Psychiatric Rating Scale (BPRS) 1
Personality Style & Disorder Inventory (PSSI) 1
Symptom Checklist 90-Revised (SCL-90-R) 1
Schedule for Affective Disorders and Schizophrenia-Lifetime Version (SADS-L) 1
Schedule for Affective Disorders and Schizophrenia-Lifetime Version Modified for the
Study of Anxiety Disorders-Revised (SADS-LA-R)
Parental questionnaire 1
The Centre for Epidemiological Studies-Depression Scales (CESD) 1
Beck Depression Inventory 1
State-Trait Anxiety Inventory Form Y (STAI-Y) 1
Similarly, findings from studies assessing performance on tests where local visual processing is an advantage
(centralcoherence) were mixed in studies of the BAP.
Conflicting results in the disembedding performance were noted (EFT, 4/8 studies; Titchener Circles Illusion, 1 study)
as well as mental segmentation abilities (Unsegmented
Block Design task,
1/2 studies; Segmented Block Design task, 1/2 studies; Block
Design Reconstruction task, 1 study with no significance
found). Two studies, however, indicate higher frequency of
errors and response times in index parents during a global
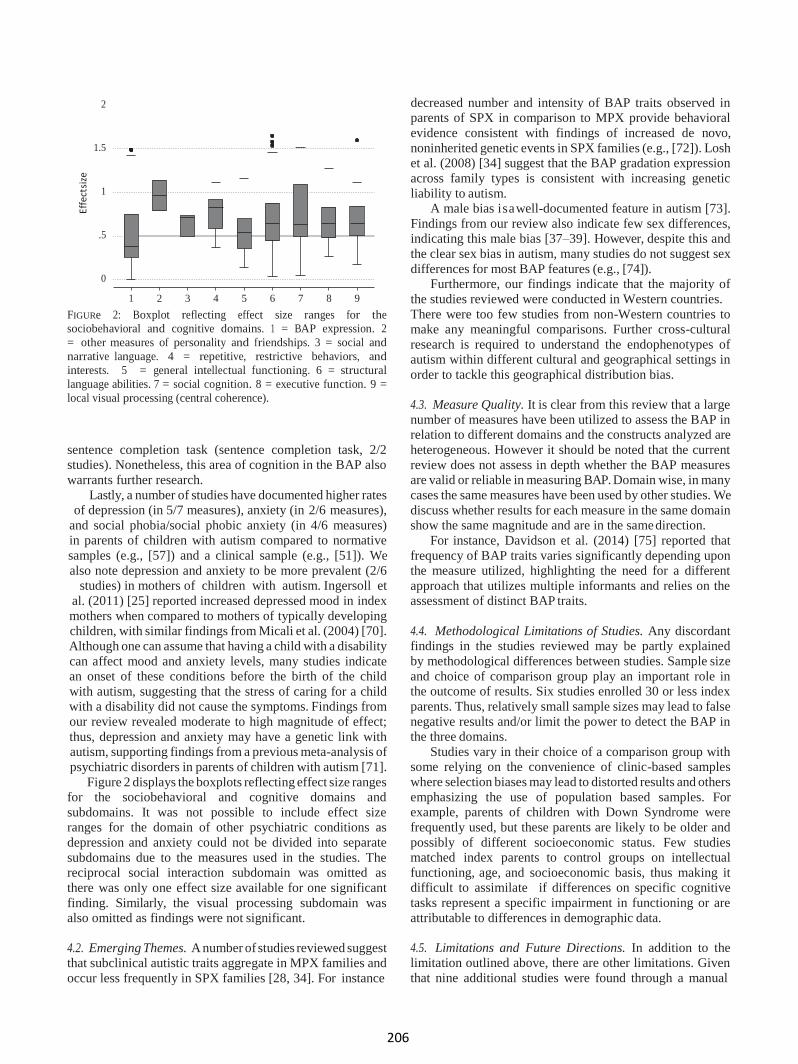
206
2
1.5
1
.5
0
1
2 3 4 5 6 7 8 9
decreased number and intensity of BAP traits observed in parents of SPX in comparison to MPX provide behavioral
evidence consistent with findings of increased de novo,
noninherited genetic events in SPX families (e.g., [72]). Losh et al. (2008) [34] suggest that the BAP gradation expression
across family types is consistent with increasing genetic
liability to autism. A male bias isawell-documented feature in autism [73].
Findings from our review also indicate few sex differences, indicating this male bias [37–39]. However, despite this and
the clear sex bias in autism, many studies do not suggest sex
differences for most BAP features (e.g., [74]). Furthermore, our findings indicate that the majority of
the studies reviewed were conducted in Western countries.
FIGURe 2: Boxplot reflecting effect size ranges for the
sociobehavioral and cognitive domains. 1 = BAP expression. 2
= other measures of personality and friendships. 3 = social and
narrative language. 4 = repetitive, restrictive behaviors, and
interests. 5 = general intellectual functioning. 6 = structural
language abilities. 7 = social cognition. 8 = executive function. 9 =
local visual processing (central coherence).
sentence completion task (sentence completion task, 2/2 studies). Nonetheless, this area of cognition in the BAP also
warrants further research.
Lastly, a number of studies have documented higher rates of depression (in 5/7 measures), anxiety (in 2/6 measures),
and social phobia/social phobic anxiety (in 4/6 measures) in parents of children with autism compared to normative
samples (e.g., [57]) and a clinical sample (e.g., [51]). We
also note depression and anxiety to be more prevalent (2/6 studies) in mothers of children with autism. Ingersoll et
al. (2011) [25] reported increased depressed mood in index
mothers when compared to mothers of typically developing children, with similar findings from Micali et al. (2004) [70].
Although one can assume that having a child with a disability
can affect mood and anxiety levels, many studies indicate an onset of these conditions before the birth of the child
with autism, suggesting that the stress of caring for a child with a disability did not cause the symptoms. Findings from
our review revealed moderate to high magnitude of effect;
thus, depression and anxiety may have a genetic link with autism, supporting findings from a previous meta-analysis of
psychiatric disorders in parents of children with autism [71].
Figure 2 displays the boxplots reflecting effect size ranges for the sociobehavioral and cognitive domains and
subdomains. It was not possible to include effect size ranges for the domain of other psychiatric conditions as
depression and anxiety could not be divided into separate
subdomains due to the measures used in the studies. The reciprocal social interaction subdomain was omitted as
there was only one effect size available for one significant
finding. Similarly, the visual processing subdomain was also omitted as findings were not significant.
4.2. Emerging Themes. A number of studies reviewed suggest that subclinical autistic traits aggregate in MPX families and
occur less frequently in SPX families [28, 34]. For instance
There were too few studies from non-Western countries to make any meaningful comparisons. Further cross-cultural
research is required to understand the endophenotypes of autism within different cultural and geographical settings in
order to tackle this geographical distribution bias.
4.3. Measure Quality. It is clear from this review that a large number of measures have been utilized to assess the BAP in relation to different domains and the constructs analyzed are
heterogeneous. However it should be noted that the current
review does not assess in depth whether the BAP measures are valid or reliable in measuring BAP. Domain wise, in many
cases the same measures have been used by other studies. We
discuss whether results for each measure in the same domain show the same magnitude and are in the same direction.
For instance, Davidson et al. (2014) [75] reported that
frequency of BAP traits varies significantly depending upon the measure utilized, highlighting the need for a different
approach that utilizes multiple informants and relies on the assessment of distinct BAP traits.
4.4. Methodological Limitations of Studies. Any discordant findings in the studies reviewed may be partly explained
by methodological differences between studies. Sample size
and choice of comparison group play an important role in the outcome of results. Six studies enrolled 30 or less index
parents. Thus, relatively small sample sizes may lead to false
negative results and/or limit the power to detect the BAP in the three domains.
Studies vary in their choice of a comparison group with some relying on the convenience of clinic-based samples
where selection biases may lead to distorted results and others
emphasizing the use of population based samples. For example, parents of children with Down Syndrome were
frequently used, but these parents are likely to be older and
possibly of different socioeconomic status. Few studies matched index parents to control groups on intellectual
functioning, age, and socioeconomic basis, thus making it difficult to assimilate if differences on specific cognitive
tasks represent a specific impairment in functioning or are
attributable to differences in demographic data.
4.5. Limitations and Future Directions. In addition to the limitation outlined above, there are other limitations. Given
that nine additional studies were found through a manual
Effe
ct si
ze
207
search after the initial search, it is possible that other studies
were not ascertained by our search terms. To address this
limitation, future research may also consider additional search terms beyond those used here.
This review aimed to identify endophenotypes in
behavioral, cognitive, and psychiatric domains independently, and as such we did not assess associations
between the BAP features across different domains. Losh et al. (2009) [56] suggest that it is likely that specific BAP
traits cosegregate with performance in other domains. For
instance, parents displaying rigid/perfectionistic personality traits could per- form differently on tasks requiring cognitive
flexibility. Additionally, most studies meeting our search
criteria assessed only one or two domains, rendering it difficult to establish whether an endophenotypic overlap, if
any, exists. Future reviews should also include studies that examine
neuroanatomical and neurofunctional correlates of the BAP.
These are essential in furthering our understanding of the neural correlates of the behavioral, cognitive, and psychiatric
aspects of autism.
More sophisticated research of the endophenotypes of parents of children with autism may help develop better
measures of evaluation of the BAP. Future studies should use a more comprehensive and quantitative framework using
more robust measures to detect subtle subclinical autistic
traits in the BAP in cross-cultural settings. To the best of our knowledge, no study assessing the endophenotypic profile of
autism in Africa has been published yet. Such research by our
team is underway.
4.6. Conclusions. In summary, the current review increases our understanding of the BAP and extends the findings of
previous reviews [13, 14]. It also supplements a systematic
review [12] and a meta-analysis [71] with a broader scope. However, findings should be interpreted with caution because
of the small number of studies in such heterogeneously broad domains and methodological limitations.
The assessment of the BAP profile in parents of autistic
probands allows us to have a better insight into the varying underlying genetic mechanisms in autism. The behavioral,
cognitive, and psychiatric endophenotypes in parents of
autistic probands are still not clarified; however, evidence points towards mild social/communication deficits,
rigid/aloof personality traits, and pragmatic language difficulties as the most useful social behavioral candidate
endophenotype traits. The existence of some deficits in the
cognitive domain does suggest familial vulnerability for autism; however, more research is required to elucidate these
findings within this domain. Furthermore, increased
depressed mood and anxiety can also be useful markers of vulnerability.
Conflicts of Interest
The authors declare that there are no conflicts of interest regarding the publication of this paper.
Acknowledgments
The authors would like to thank Catherine McGowan for help
with database searches.
References
[1] American Psychiatric Association, Diagnostic and Statistical
Manual of Mental Disorders (DSM-5), American Psychiatric
Publishing, Arlington, VA, USA, 5th edition, 2013.
[2] A. Bailey, A. Le Couteur, I. Gottesman et al. et al., ―Autism as a
strongly genetic disorder: Evidence from a British twin study,‖
Psychological Medicine, vol. 25, pp. 63–77, 1995.
[3] J. Hallmayer, S. Cleveland, A. Torres et al., ―Genetic heritability
and shared environmental factors among twin pairs with
autism,‖ Archives of General Psychiatry, vol. 68, no. 11, pp. 1095–
1102, 2011.
[4] S. Ozonoff, G. S. Young, A. Carter et al., ―Recurrence risk for
autism spectrum disorders: a baby siblings research consortium
study,‖ Pediatrics, vol. 128, pp. 488–495, 2011.
[5] J. N. Constantino, Y. Zhang, T. Frazier, A. M. Abbacchi, and
P. Law, ―Sibling recurrence and the genetic epidemiology of
autism,‖ The American Journal of Psychiatry, vol. 167, no. 11, pp.
1349–1356, 2010.
[6] J. Piven, P. Palmer, D. Jacobi, D. Childress, and S. Arndt,
―Broader autism phenotype: evidence from a family history
study of multiple-incidence autism families,‖ The American
Journal of Psychiatry, vol. 154, no. 2, pp. 185–190, 1997.
[7] S. Baron-Cohen and J. Hammer, ―Parents of children with
Asperger syndrome: what is the cognitive phenotype?‖ Journal
of Cognitive Neuroscience, vol. 9, no. 4, pp. 548–554, 1997.
[8] V. Di Michele, M. Mazza, R. Cerbo, R. Roncone, and M.
Casacchia, ―Deficits in pragmatic conversation as manifestation
of genetic liability in autism,‖ Clinical Neuropsychiatry, vol. 4,
pp. 144–151, 2007.
[9] P. Szatmari, S. Georgiades, E. Duku, L. Zwaigenbaum, J. Gold-
berg, and T. Bennett, ―Alexithymia in parents of children with
autism spectrum disorder,‖ Journal of Autism and
Developmental Disorders, vol. 38, pp. 1859–1865, 2008.
[10] G. L. Schmidt, L. K. Kimel, E. Winterrowd, B. F. Pennington, S.
L. Hepburn, D. C. Rojas et al., ―Impairments in phonological
processing and nonverbal intellectual function in parents of
children with autism,‖ Journal of Clinical and Experimental
Neuropsychology, vol. 30, no. 5, pp. 557–567, 2008.
[11] I. I. Gottesman and T. D. Gould, ―The endophenotype concept
in psychiatry: etymology and strategic intentions,‖ The Ameri-
can Journal of Psychiatry, vol. 160, no. 4, pp. 636–645, 2003.
[12] L. D. L. P. Cruz, W. Camargos-Junior, and F. L. Rocha, ―The
broad autism phenotype in parents of individuals with autism:
A systematic review of the literature,‖ Trends in Psychiatry and
Psychotherapy, vol. 35, no. 4, pp. 252–263, 2013.
[13] J. Gerdts and R. Bernier, ―The broader autism phenotype and its
implications on the etiology and treatment of autism spectrum
disorders,‖ Autism Research and Treatment, Article ID 545901,
2011.
[14] E. Sucksmith, I. Roth, and R. A. Hoekstra, ―Autistic traits
below the clinical threshold: re-examining the broader autism
phenotype in the 21st century,‖ Neuropsychology Review, vol. 21,
no. 4, pp. 360–389, 2011.
[15] K. S. Khan, G. Ter Riet, J. Glanville, A. J. Sowden, and J. Kleijnen,
Undertaking Systematic Reviews of Research on Effectiveness:
CRD Guidelines for Those Carrying Out or Commissioning
Reviews, York Publishing Services, York, UK, 2nd edition, 2001.
[16] J. Cohen, Statistical Power Analysis for the Behavioural Science,
Lawrence Erlbaum Associates, Hillsdale, NJ, USA, 2nd edition,
1988.

208
[17] L. Ruta, D. Mazzone, L. Mazzone, S. Wheelwright, and S. Baron-
Cohen, ―The Autism-Spectrum Quotient- Italian Version: A
Cross-Cultural Confirmation of the Broader Autism
Phenotype,‖ Journal of Autism and Developmental Disorders,
vol. 42, pp. 625–633, 2012.
[18] S. Kose, E. Bora, S. Erermis, B. O zbaran, T. Bildik, and C.
Aydin, ―Broader autistic phenotype in parents of children with
autism: Autism Spectrum Quotient-Turkish version,‖ Psychiatry
and Clinical Neurosciences, vol. 67, no. 1, pp. 20–27, 2013.
[19] L. Robel, B. Rousselot-Pailley, C. Fortin, M. Levy-Rueff, B.
Golse, and B. Falissard, ―Subthreshold traits of the broad autistic
spectrum are distributed across different subgroups in parents,
but not siblings, of probands with autism,‖ European Child and
Adolescent Psychiatry, vol. 23, no. 4, pp. 225–233, 2014.
[20] D. V. M. Bishop, M. Maybery, A. Maley, D. Wong, W. Hill, and
J. Hallmayer, ―Using self-report to identify the broad phenotype
in parents of children with autistic spectrum disorders: a
study using the autism-spectrum quotient,‖ Journal of Child
Psychology and Psychiatry and Allied Disciplines, vol. 45, no. 8,
pp. 1431–1436, 2004.
[21] M. T. Kadak, O . F. Demirel, M. Yavuz, and T. Demir,
―Recognition of emotional facial expressions and broad
autism phenotype in parents of children diagnosed with
autistic spectrum disorder,‖ Comprehensive Psychiatry, vol. 55,
no. 5, pp. 1146–1151, 2014.
[22] S. Wheelwright, B. Auyeung, C. Allison, and S. Baron-Cohen,
―Defining the broader, medium and narrow autism phenotype
among parents using the Autism Spectrum Quotient (AQ),‖
Molecular Autism, pp. 1–10, 2010.
[23] A. J. O. Whitehouse, J. G. Barry, and D. V. M. Bishop, ―The
broader Language Phenotype of Autism: a comparison with
specific language impairment,‖ Journal of Child Psychology and
Psychiatry, vol. 48, no. 8, pp. 822–830, 2007.
[24] A. M. Scheeren and J. E. A. Stauder, ―Broader Autism Phenotype
in Parents of Autistic Children: Reality or Myth?‖ Journal of
Autism and Developmental Disorders, vol. 28, pp. 276–287, 2008.
[25] B. Ingersoll, K. Meyer, and M. W. Becker, ―Increased rates of
depressed mood in mothers of children with ASD associated
with the presence of the broader autism phenotype,‖ Autism
Research, vol. 4, no. 2, pp. 143–148, 2011.
[26] R. S. E. Hurley, M. Losh, M. Parlier, J. S. Reznick, and J. Piven,
―The broad autism phenotype questionnaire,‖ Journal of Autism
and Developmental Disorders, vol. 37, pp. 1679–1690, 2007.
[27] N. J. Sasson, K. S. L. Lam, M. Parlier, J. L. Daniels, and J. Piven,
―Autism and the broad autism phenotype: Familial patterns and
intergenerational transmission,‖ Journal of Neurodevelopmental
Disorders, vol. 5, no. 1, pp. 1–7, 2013.
[28] R. Bernier, J. Gerdts, J. Munson, G. Dawson, and A. Estes,
―Evidence for broader autism phenotype characteristics in
parents from multiple-incidence autism families,‖ Autism
Research, vol. 5, no. 1, pp. 13–20, 2012.
[29] A. J. O. Whitehouse, H. Coon, J. Miller, B. Salisbury, and D. V.
M. Bishop, ―Narrowing the broader autism phenotype: a study
using the Communication Checklist -Adult version (CC-A),‖
Autism, vol. 14, no. 6, pp. 559–574, 2010.
[30] S. E. Folstein, S. L. Santangelo, S. E. Gilman et al., ―Predictors
of cognitive test patterns in autism families,‖ Journal of Child
Psychology and Psychiatry and Allied Disciplines, vol. 40, no. 7,
pp. 1117–1128, 1999.
[31] A. Pickles, M. C. St Clair, and G. Conti-Ramsden,
―Communication and social deficits in relatives of
individuals with sli and relatives of individuals with Asd,‖
Journal of Autism and Developmental Disorders, vol. 43,
no. 1, pp. 156–167, 2013.
[32] J. Piven, R. Landa, J. Lainhart, P. Bolton, and G. A. Chase,
―Personality characteristics of the parents of autistic
individuals,‖ Psychological Medicine, vol. 24, no. 3, pp. 783–
795, 1994.
[33] J. Piven, P. Palmer, R. Landa, S. Santangelo, D. Jacobi, and D.
Childress, ―Personality and language characteristics in parents
from multiple-incidence autism families,‖ American Journal of
Medical Genetics Part B (Neuropsychiatric Genetics), vol. 74, pp.
398–411, 1997.
[34] M. Losh, D. Childress, K. Lam, and J. Piven, ―Defining key
features of the broad autism phenotype: a comparison across
parents of multiple- and single-incidence autism families,‖
American Journal of Medical Genetics Part B (Neuropsychiatric
Genetics), vol. 147B, pp. 424–433, 2008.
[35] M. Losh, J. Klusek, G. E. Martin, J. Sideris, M. Parlier, and J.
Piven, ―Defining genetically meaningful language and
personality traits in relatives of individuals with fragile X
syndrome and relatives of individuals with autism,‖ American
Journal of Medical Genetics, Part B: Neuropsychiatric Genetics,
vol. 159, no. 6, pp. 660–668, 2012.
[36] R. Landa, J. Piven, M. M. Wzorek, J. O. Gayles, G. A. Chase,
and S. E. Folstein, ―Social language use in parents of autistic
individuals,‖ Psychological Medicine, vol. 22, pp. 245–254, 1992.
[37] T. F. Ruser, D. Arin, M. Dowd et al., ―Communicative
competence in parents of children with autism and parents of
children with specific language impairment,‖ Journal of Autism
and Developmental Disorders, vol. 37, no. 7, pp. 1323–1336, 2007.
[38] W. De la Marche, I. Noens, J. Luts, E. Scholte, S. Van Huffel, and
J. Steyaert, ―Quantitative autism traits in first degree relatives:
evidence for the broader autism phenotype in fathers, but not in
mothers and siblings,‖ Autism, vol. 16, no. 3, pp. 247–260, 2012.
[39] A. J. Schwichtenberg, G. S. Young, M. Sigman, T. Hutman,
and S. Ozonoff, ―Can family affectedness inform infant sibling
outcomes of autism spectrum disorders?‖ Journal of Child
Psychology and Psychiatry, vol. 51, no. 9, pp. 1021–1030, 2010.
[40] S. Berthoz, C. Lalanne, L. Crane, and E. L. Hill, ―Investigating
emotional impairments in adults with autism spectrum
disorders and the broader autism phenotype,‖ Psychiatry
Research, vol. 208, no. 3, pp. 257–264, 2013.
[41] R. Landa, S. E. Folstein, and C. Isaacs, ―Spontaneous narrative-
discourse performance of parents of autistic individuals,‖
Journal of Speech and Hearing Research, vol. 34, pp. 1339–1345,
1991.
[42] J. Briskman, F. Happe, and U. Frith, ―Exploring the cognitive
phenotype of autism: Weak ―central coherence‖ in parents
and siblings of children with autism: II. Real-life skills and
preferences,‖ Journal of Child Psychology and Psychiatry, vol. 42,
no. 3, pp. 309–316, 2001.
[43] M. D. Lezak, D. B. Howieson, E. D. Bigler, and D. Tranel,
Neuropsychological Assessment, Oxford University Press, New
York, 5th edition, 2012.
[44] E. Fombonne, P. Bolton, J. Prior, H. Jordan, and M. Rutter, ―A
family study of autism: cognitive patterns and levels in parents
and siblings,‖ Journal of Child Psychology and Psychiatry, vol. 38,
no. 6, pp. 667–683, 1997.
[45] S. L. Smalley and R. F. Asarnow, ―Cognitive subclinical markers
in autism,‖ Journal of Autism and Developmental Disorders, vol.
20, no. 2, pp. 271–278, 1990.
[46] J. Piven and P. Palmer, ―Cognitive deficits in parents from
multiple-incidence autism families,‖ Journal of Child Psychology
and Psychiatry, vol. 38, no. 8, pp. 1011–1021, 1997.

209
[47] K. A. Lindgren, S. E. Folstein, J. B. Tomblin, and H.
Tager- Flusberg, ―Language and reading abilities of
children with autism spectrum disorders and specific
language impairment and their first-degree relatives,‖
Autism Research, vol. 2, pp. 22– 38, 2009.
[48] M. Losh and J. Piven, ―Social-cognition and the
broad autism phenotype: identifying genetically
meaningful phenotypes,‖ Journal of Child Psychology
and Psychiatry, vol. 48, no. 1, pp. 105– 112, 2007.
[49] S. Bolte and F. Poustka, ―The recognition of facial
affect in autistic and schizophrenic subjects and their
first-degree relatives,‖ Psychological Medicine, vol. 33,
pp. 907–915, 2003.
[50] S. Bolte and F. Poustka, ―The broader cognitive
phenotype of autism in parents: how specific is the
tendency for local processing and executive
dysfunction?‖ Journal of Child Psychology and
Psychiatry, vol. 47, no. 6, pp. 639–645, 2006.
[51] S. Bolte, S. Knecht, and F. Poustka, ―A case-control
study of personality style and psychopathology in
parents of subjects with autism,‖ Journal of Autism
and Developmental Disorders, vol. 37, pp. 243–250,
2007.
[52] E. Sucksmith, C. Allison, S. Baron-Cohen, B.
Chakrabarti, and
R. A. Hoekstra, ―Empathy and emotion recognition in
people with autism, first-degree relatives, and controls,‖
Neuropsycholigia, vol. 51, no. 1, pp. 98–105, 2013.
[53] D. V. M. Bishop, M. Maybery, D. Wong, A. Maley, W.
Hill, and J. Hallmayer, ―Are phonological processing
deficits part of the broad autism phenotype?‖
American Journal of Medical Genetics Part B
(Neuropsychiatric Genetics), vol. 128, no. B, pp. 54–60,
2004.
[54] M.-H. Plumet, M.-C. Goldblum, and M. Leboyer,
―Verbal skills in relatives of autistic females,‖ Cortex,
vol. 31, no. 4, pp. 723–733, 1995.
[55] M. Losh, D. Esserman, and J. Piven, ―Rapid
automatized naming as an index of genetic liability to
autism,‖ Journal of Neurodevelopmental Disorders,
vol. 2, no. 2, pp. 109–116, 2010.
[56] M. Losh, R. Adolphs, M. D. Poe et al.,
―Neuropsychological profile of autism and the broad
autism phenotype,‖ Archives of General Psychiatry,
vol. 66, no. 5, pp. 518–526, 2009.
[57] S. Gokcen, E. Bora, S. Erermis, H. Kesikci, and C.
Aydin, ―Theory of mind and verbal working memory
deficits in parents of autistic children,‖ Psychiatry
Research, vol. 166, pp. 46–53, 2009.
[58] M. Tajmirriyahi, V. Nejati, H. Pouretemad, and R. M.
Sepehr, ―Reading the mind in the face and voice in
parents of children with Autism Spectrum Disorders,‖
Research in Autism Spectrum Disorders, vol. 7, no. 12,
pp. 1543–1550, 2013.
[59] R. Adolphs, M. L. Spezio, M. Parlier, and J. Piven,
―Distinct face- processing strategies in parents of
autistic children,‖ Current Biology, vol. 18, pp. 1090–
1093, 2008.
[60] M. D. C. L. das Neves, F. Tremeau, R. Nicolato, H.
Lauar, M.
A. Romano-Silva, and H. Correa, ―Facial emotion
recognition deficits in relatives of children with autism
are not associated with 5HTTLPR,‖ Revista Brasileira de
Psiquiatria, vol. 33, no. 3, pp. 261–267, 2011.
[61] M. T. Palermo, P. Pasqualetti, G. Barbati, F. Intelligente,
and P. M. Rossini, ―Recognition of schematic facial
displays of emotion in parents of children with autism,‖
Autism, vol. 10, no. 4, pp. 353–364, 2006.
[62] D. Wong, M. Maybery, D. V. M. Bishop, A. Maley, and
J. Hall- mayer, ―Profiles of executive function in parents
and siblings of individuals with autism spectrum
disorders,‖ Genes, Brain and Behavior, vol. 5, pp. 561–
576, 2006.
[63] C. Hughes, M. Leboyer, and M. Bouvard, ―Executive
function in parents of children with autism,‖
Psychological Medicine, vol. 27, pp. 209–220, 1997.
[64] F. Happe, J. Briskman, and U. Frith, ―Exploring the
cognitive phenotype of autism: weak ―central
coherence‖ in parents and siblings of children with
autism: I. Experimental Tests,‖ Journal of Child
Psychology and Psychiatry, vol. 42, pp. 299–307, 2001.
[65] M. V. De Jonge, C. Kemner, and H. Van Engeland,
―Superior disembedding performance of high-
functioning individuals with autism spectrum
disorders and their parents: The need for subtle
measures,‖ Journal of Autism and Developmental
Disorders, vol. 36, no. 5, pp. 677–683, 2006.
[66] M. De Jonge, C. Kemner, F. Naber, and H. Van
Engeland, ―Block design reconstruction skills: Not a
good candidate for an endophenotypic marker in
autism research,‖ European Child and Adolescent
Psychiatry, vol. 18, no. 4, pp. 197–205, 2009.
[67] M. V. de Jonge, C. Kemner, E. H. de Haan, J. E.
Coppens, T. J. van den Berg, H. van Engeland et al.,
―Visual information processing in high-functioning
individuals with autism spectrum disorders and their
parents,‖ Neuropsychology, vol. 21, pp. 65– 73, 2007.
[68] J. Piven, G. A. Chase, R. Landa, M. Wzorek, J. Gayle,
D. Cloud et al., ―Psychiatric disorders in the parents of
autistic individuals,‖ Journal of the American Academy
of Child and Adolescent Psychiatry, vol. 30, no. 3, pp.
471–478, 1991.
[69] J. Piven and P. Palmer, ―Psychiatric disorder and the
broad autism phenotype: evidence from a family study
of multiple- incidence autism families,‖ American
Journal of Psychiatry, vol. 156, no. 4, pp. 557–563,
1999.
[70] N. Micali, S. Chakrabarti, and E. Fombonne, ―The
broad autism phenotype: findings from an
epidemiological survey,‖ Autism, vol. 8, no. 1, pp. 21–
37, 2004.
[71] N. Yirmiya and M. Shaked, ―Psychiatric disorders in
parents of children with autism: A meta-analysis,‖
Journal of Child Psychology and Psychiatry and Allied
Disciplines, vol. 46, no. 1, pp. 69–83, 2005.
[72] J. Sebat, B. Lakshmi, D. Malhotra et al., ―Strong
association of de novo copy number mutations with
autism,‖ Science, vol. 316, no. 5823, pp. 445–449, 2007.
[73] Werling & Geschwind, ―Sex differences in autism

210
spectrum disorders,‖ Current Opinion in Neurology,
vol. 26, no. 2, pp. 146– 153, 2013.
[74] J. Klusek, M. Losh, and G. E. Martin, ―Sex
differences and within-family associations in the
broad autism phenotype,‖ Autism, vol. 18, no. 2, pp.
106–116, 2014.
[75] J. Davidson, R. P. Goin-Kochel, L. A. Green-Snyder,
R. J. Hund- ley, Z. Warren, and S. U. Peters,
―Expression of the broad autism phenotype in
simplex autism families from the simons simplex
collection,‖ Journal of Autism and Developmental
Disorders, vol. 44, no. 10, pp. 2392–2399, 2014.
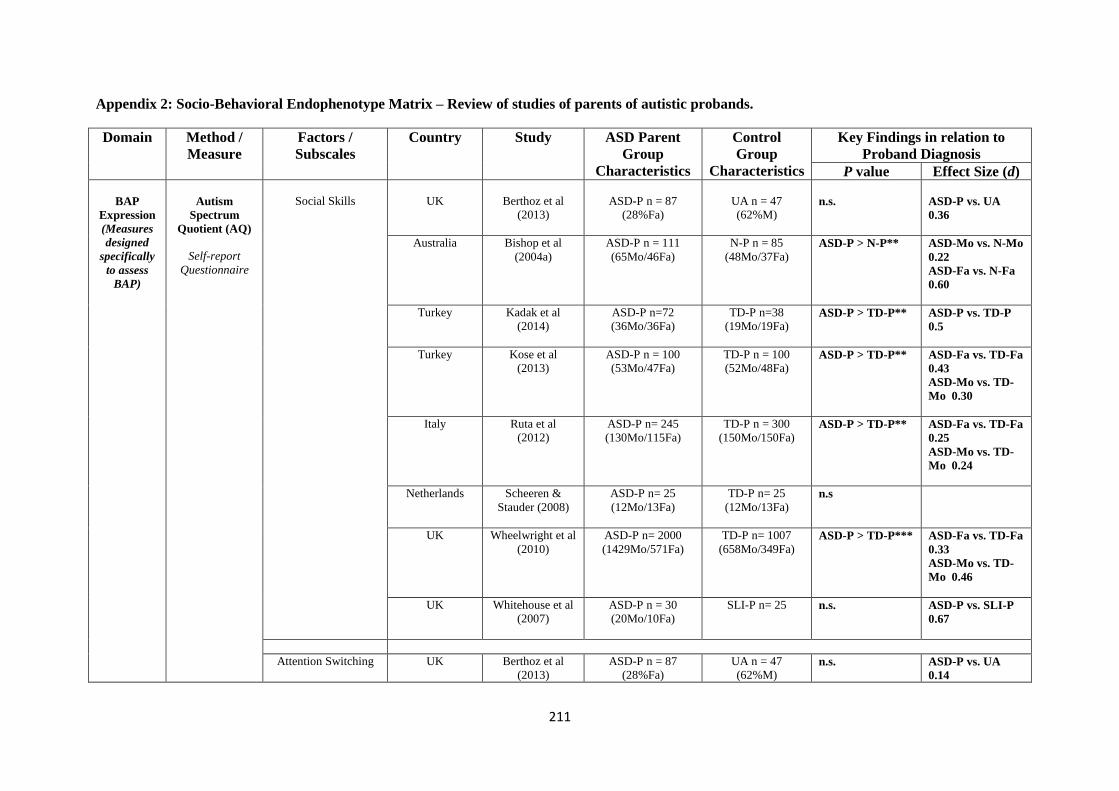
211
Appendix 2: Socio-Behavioral Endophenotype Matrix – Review of studies of parents of autistic probands.
Domain Method /
Measure
Factors /
Subscales
Country Study ASD Parent
Group
Characteristics
Control
Group
Characteristics
Key Findings in relation to
Proband Diagnosis
P value Effect Size (d)
BAP
Expression
(Measures
designed
specifically
to assess
BAP)
Autism
Spectrum
Quotient (AQ)
Self-report
Questionnaire
Social Skills
UK
Berthoz et al
(2013)
ASD-P n = 87
(28%Fa)
UA n = 47
(62%M)
n.s.
ASD-P vs. UA
0.36
Australia Bishop et al
(2004a)
ASD-P n = 111
(65Mo/46Fa)
N-P n = 85
(48Mo/37Fa)
ASD-P > N-P** ASD-Mo vs. N-Mo
0.22
ASD-Fa vs. N-Fa
0.60
Turkey Kadak et al
(2014)
ASD-P n=72
(36Mo/36Fa)
TD-P n=38
(19Mo/19Fa)
ASD-P > TD-P** ASD-P vs. TD-P
0.5
Turkey Kose et al
(2013)
ASD-P n = 100
(53Mo/47Fa)
TD-P n = 100
(52Mo/48Fa)
ASD-P > TD-P** ASD-Fa vs. TD-Fa
0.43
ASD-Mo vs. TD-
Mo 0.30
Italy Ruta et al
(2012)
ASD-P n= 245
(130Mo/115Fa)
TD-P n = 300
(150Mo/150Fa)
ASD-P > TD-P** ASD-Fa vs. TD-Fa
0.25
ASD-Mo vs. TD-
Mo 0.24
Netherlands Scheeren &
Stauder (2008)
ASD-P n= 25
(12Mo/13Fa)
TD-P n= 25
(12Mo/13Fa)
n.s
UK Wheelwright et al
(2010)
ASD-P n= 2000
(1429Mo/571Fa)
TD-P n= 1007
(658Mo/349Fa) ASD-P > TD-P*** ASD-Fa vs. TD-Fa
0.33
ASD-Mo vs. TD-
Mo 0.46
UK Whitehouse et al
(2007)
ASD-P n = 30
(20Mo/10Fa)
SLI-P n= 25 n.s. ASD-P vs. SLI-P
0.67
Attention Switching UK Berthoz et al
(2013)
ASD-P n = 87
(28%Fa)
UA n = 47
(62%M) n.s.
ASD-P vs. UA
0.14
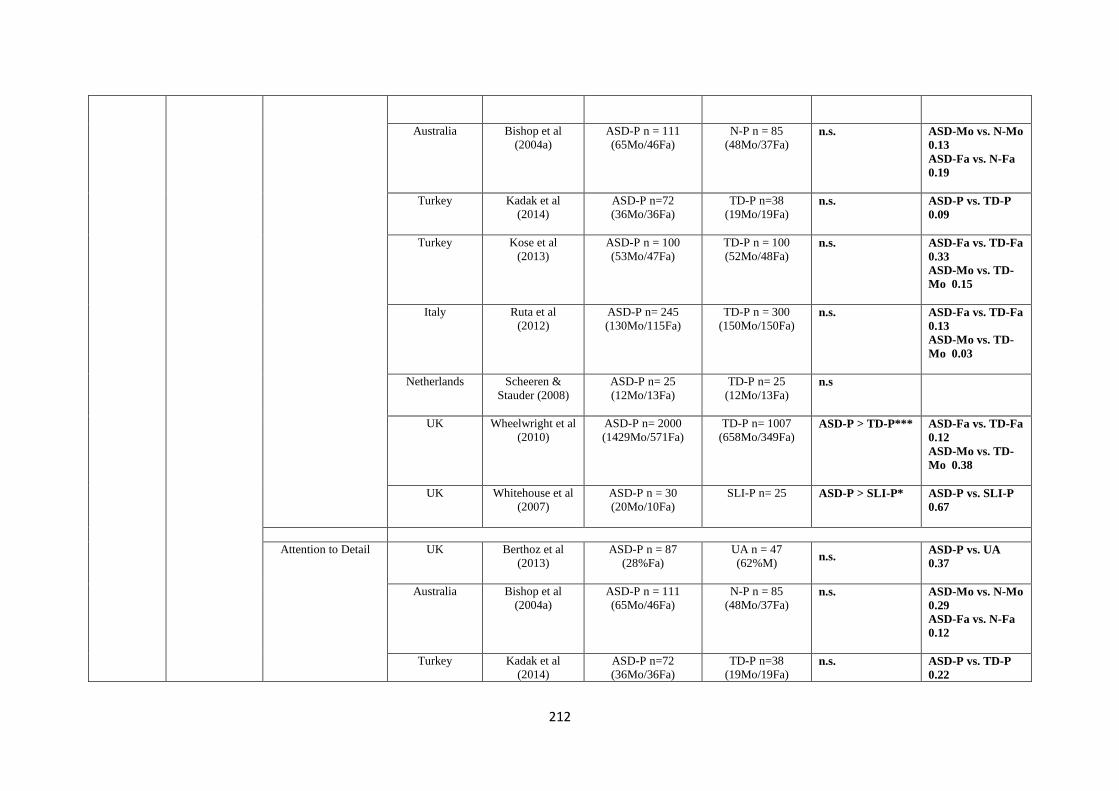
212
Australia Bishop et al
(2004a)
ASD-P n = 111
(65Mo/46Fa)
N-P n = 85
(48Mo/37Fa) n.s. ASD-Mo vs. N-Mo
0.13
ASD-Fa vs. N-Fa
0.19
Turkey Kadak et al
(2014)
ASD-P n=72
(36Mo/36Fa)
TD-P n=38
(19Mo/19Fa) n.s. ASD-P vs. TD-P
0.09
Turkey Kose et al
(2013)
ASD-P n = 100
(53Mo/47Fa)
TD-P n = 100
(52Mo/48Fa) n.s. ASD-Fa vs. TD-Fa
0.33
ASD-Mo vs. TD-
Mo 0.15
Italy Ruta et al
(2012)
ASD-P n= 245
(130Mo/115Fa)
TD-P n = 300
(150Mo/150Fa)
n.s. ASD-Fa vs. TD-Fa
0.13
ASD-Mo vs. TD-
Mo 0.03
Netherlands Scheeren &
Stauder (2008)
ASD-P n= 25
(12Mo/13Fa)
TD-P n= 25
(12Mo/13Fa)
n.s
UK Wheelwright et al
(2010)
ASD-P n= 2000
(1429Mo/571Fa)
TD-P n= 1007
(658Mo/349Fa) ASD-P > TD-P*** ASD-Fa vs. TD-Fa
0.12
ASD-Mo vs. TD-
Mo 0.38
UK Whitehouse et al
(2007)
ASD-P n = 30
(20Mo/10Fa)
SLI-P n= 25 ASD-P > SLI-P* ASD-P vs. SLI-P
0.67
Attention to Detail UK Berthoz et al
(2013)
ASD-P n = 87
(28%Fa)
UA n = 47
(62%M) n.s.
ASD-P vs. UA
0.37
Australia Bishop et al
(2004a)
ASD-P n = 111
(65Mo/46Fa)
N-P n = 85
(48Mo/37Fa) n.s. ASD-Mo vs. N-Mo
0.29
ASD-Fa vs. N-Fa
0.12
Turkey Kadak et al
(2014)
ASD-P n=72
(36Mo/36Fa)
TD-P n=38
(19Mo/19Fa) n.s. ASD-P vs. TD-P
0.22
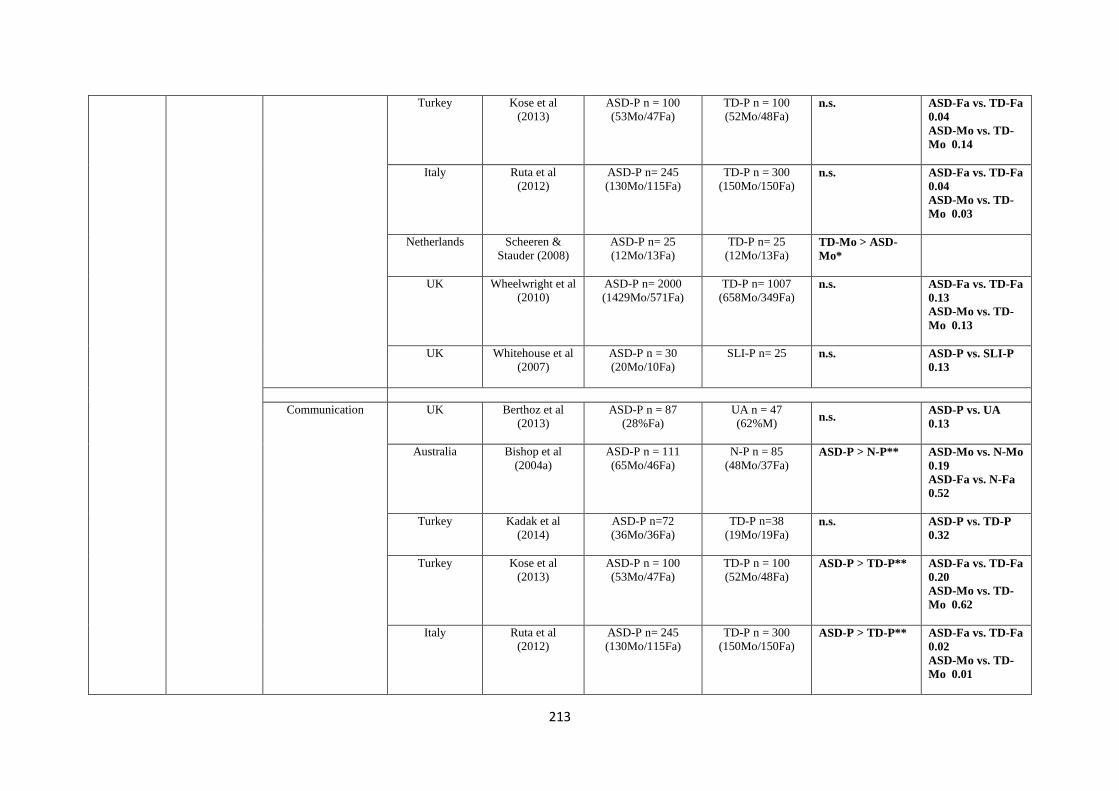
213
Turkey Kose et al
(2013)
ASD-P n = 100
(53Mo/47Fa)
TD-P n = 100
(52Mo/48Fa) n.s. ASD-Fa vs. TD-Fa
0.04
ASD-Mo vs. TD-
Mo 0.14
Italy Ruta et al
(2012)
ASD-P n= 245
(130Mo/115Fa)
TD-P n = 300
(150Mo/150Fa) n.s. ASD-Fa vs. TD-Fa
0.04
ASD-Mo vs. TD-
Mo 0.03
Netherlands Scheeren &
Stauder (2008)
ASD-P n= 25
(12Mo/13Fa)
TD-P n= 25
(12Mo/13Fa) TD-Mo > ASD-
Mo*
UK Wheelwright et al
(2010)
ASD-P n= 2000
(1429Mo/571Fa)
TD-P n= 1007
(658Mo/349Fa) n.s. ASD-Fa vs. TD-Fa
0.13
ASD-Mo vs. TD-
Mo 0.13
UK Whitehouse et al
(2007)
ASD-P n = 30
(20Mo/10Fa)
SLI-P n= 25 n.s. ASD-P vs. SLI-P
0.13
Communication UK Berthoz et al
(2013)
ASD-P n = 87
(28%Fa)
UA n = 47
(62%M) n.s.
ASD-P vs. UA
0.13
Australia Bishop et al
(2004a)
ASD-P n = 111
(65Mo/46Fa)
N-P n = 85
(48Mo/37Fa) ASD-P > N-P** ASD-Mo vs. N-Mo
0.19
ASD-Fa vs. N-Fa
0.52
Turkey Kadak et al
(2014)
ASD-P n=72
(36Mo/36Fa)
TD-P n=38
(19Mo/19Fa) n.s. ASD-P vs. TD-P
0.32
Turkey Kose et al
(2013)
ASD-P n = 100
(53Mo/47Fa)
TD-P n = 100
(52Mo/48Fa) ASD-P > TD-P** ASD-Fa vs. TD-Fa
0.20
ASD-Mo vs. TD-
Mo 0.62
Italy Ruta et al
(2012)
ASD-P n= 245
(130Mo/115Fa)
TD-P n = 300
(150Mo/150Fa) ASD-P > TD-P** ASD-Fa vs. TD-Fa
0.02
ASD-Mo vs. TD-
Mo 0.01

214
Netherlands Scheeren &
Stauder (2008)
ASD-P n= 25
(12Mo/13Fa)
TD-P n= 25
(12Mo/13Fa)
n.s
UK Wheelwright et al
(2010)
ASD-P n= 2000
(1429Mo/571Fa)
TD-P n= 1007
(658Mo/349Fa)
ASD-P > TD-P*** ASD-Fa vs. TD-Fa
0.22
ASD-Mo vs. TD-
Mo 0.41
UK Whitehouse et al
(2007)
ASD-P n = 30
(20Mo/10Fa)
SLI-P n= 25 ASD-P > SLI-P* ASD-P vs. SLI-P
0.63
Imagination UK Berthoz et al
(2013)
ASD-P n = 87
(28%Fa)
UA n = 47
(62%M) n.s.
ASD-P vs. UA
0.10
Australia Bishop et al
(2004a)
ASD-P n = 111
(65Mo/46Fa)
N-P n = 85
(48Mo/37Fa)
n.s. ASD-Mo vs. N-Mo
0.07
ASD-Fa vs. N-Fa
0.19
Turkey Kadak et al
(2014)
ASD-P n=72
(36Mo/36Fa)
TD-P n=38
(19Mo/19Fa) n.s. ASD-P vs. TD-P
0.02
Turkey Kose et al
(2013)
ASD-P n = 100
(53Mo/47Fa)
TD-P n = 100
(52Mo/48Fa)
n.s. ASD-Fa vs. TD-Fa
0.03
ASD-Mo vs. TD-
Mo 0.07
Italy Ruta et al
(2012)
ASD-P n= 245
(130Mo/115Fa)
TD-P n = 300
(150Mo/150Fa)
n.s. ASD-Fa vs. TD-Fa
0.06
ASD-Mo vs. TD-
Mo 0.57
Netherlands Scheeren &
Stauder (2008)
ASD-P n= 25
(12Mo/13Fa)
TD-P n= 25
(12Mo/13Fa)
n.s
UK Wheelwright et al
(2010)
ASD-P n= 2000
(1429Mo/571Fa)
TD-P n= 1007
(658Mo/349Fa)
ASD-P > TD-P*** ASD-Fa vs. TD-Fa
0.04
ASD-Mo vs. TD-
Mo 0.29
UK Whitehouse et al ASD-P n = 30 SLI-P n= 25 n.s. ASD-P vs. SLI-P

215
(2007) (20Mo/10Fa) 0.41
AQ Total Score UK Berthoz et al
(2013)
ASD-P n = 87
(28%Fa)
UA n = 47
(62%M) n.s.
ASD-P vs. UA
0.06
Turkey Kadak et al
(2014)
ASD-P n=72
(36Mo/36Fa)
TD-P n=38
(19Mo/19Fa) n.s. ASD-P vs. TD-P
0.39
Turkey Kose et al
(2013)
ASD-P n = 100
(53Mo/47Fa)
TD-P n = 100
(52Mo/48Fa) ASD-P > TD-P* ASD-Fa vs. TD-Fa
0.34
ASD-Mo vs. TD-
Mo 0.27
Italy Ruta et al
(2012)
ASD-P n= 245
(130Mo/115Fa)
TD-P n = 300
(150Mo/150Fa) ASD-P > TD-P** ASD-Fa vs. TD-Fa
0.30
ASD-Mo vs. TD-
Mo 0.29
Netherlands Scheeren &
Stauder (2008)
ASD-P n= 25
(12Mo/13Fa)
TD-P n= 25
(12Mo/13Fa) n.s ASD-Fa vs. TD-Fa
0.30
ASD-Mo vs. TD-
Mo 0.73
UK Wheelwright et al
(2010)
ASD-P n= 2000
(1429Mo/571Fa)
TD-P n= 1007
(658Mo/349Fa) ASD-P > TD-P*** ASD-Fa vs. TD-Fa
0.17
ASD-Mo vs. TD-
Mo 0.38
UK Whitehouse et al
(2007)
ASD-P n = 30
(20Mo/10Fa)
SLI-P n= 25 ASD-P > SLI-P* ASD-P vs. SLI-P
0.63
AQ
Social/Communication
score combined
USA Ingersoll et al
(2011)
ASD-Mo n = 71
(Only Mo)
N-Mo n = 94
(Only Mo) ASD-Mo > N-Mo*
ASD-Mo vs. N-Mo
0.33
F1 (communication &
socialization)
France Robel et al
(2014)
ASD-P n = 66
(35Mo/31Fa)
TD-P n = 127
(67Mo/60Fa) ASD-P > TD-P* ASD-P vs. TD-P
1.34
F2 (imagination & France Robel et al ASD-P n = 66 TD-P n = 127 n.s. ASD-P vs. TD-P

216
rigidity) (2014) (35Mo/31Fa) (67Mo/60Fa) 0.24
Global score (F1 & F2
combined)
France Robel et al
(2014)
ASD-P n = 66
(35Mo/31Fa)
TD-P n = 127
(67Mo/60Fa) ASD-P > TD-P* ASD-P vs. TD-P
0.76
Broader
Autism
Phenotype
Questionnaire
(BAPQ)
Self & Informant
Report
Questionnaire
Aloof
USA Hurley et al
(2007)
ASD-P = 86
(40Mo/46Fa)
BAP(+) n = 27
BAP(-) n = 59
N-P = 64
(32Mo/32Fa) BAP(+) > BAP(-),
N-P***
BAP(+) vs. BAP(-)
1.49
BAP(+) vs. N-P
1.30
USA Sasson et al
(2013)
ASD-P n=711
(50.5% Fa)
N-P n = 981
(49.9% Fa) ASD-Fa > N-Fa**
ASD-Mo > N-
Mo***
ASD-Fa vs. N-Fa
0.26
ASD-Mo vs. N-Mo
0.34
Rigid
USA Hurley et al
(2007)
ASD-P = 86
(40Mo/46Fa)
BAP(+) n = 27
BAP(-) n = 59
N-P = 64
(32Mo/32Fa) BAP(+) > BAP(-),
N-P***
BAP(+) vs. BAP(-)
0.77
BAP(+) vs. N-P
0.73
USA Sasson et al
(2013)
ASD-P n=711
(50.5% Fa)
N-P n = 981
(49.9% Fa)
ASD-Fa > N-
Fa***
ASD-Mo > N-
Mo***
ASD-Fa vs. N-Fa
0.35
ASD-Mo vs. N-Mo
0.29
Pragmatic Language
USA Hurley et al
(2007)
ASD-P = 86
(40Mo/46Fa)
BAP(+) n = 27
BAP(-) n = 59
N-P = 64
(32Mo/32Fa) BAP(+) > BAP(-
)** , N-P*
BAP(+) vs. BAP(-)
0.94
BAP(+) vs. N-P
1.13
USA Sasson et al
(2013)
ASD-P n=711
(50.5% Fa)
N-P n = 981
(49.9% Fa)
ASD-Fa > N-Fa**
ASD-Mo > N-
Mo***
ASD-Fa vs. N-Fa
0.28
ASD-Mo vs. N-Mo
0.44
Total score
USA Hurley et al
(2007)
ASD-P = 86
(40Mo/46Fa)
N-P = 64
(32Mo/32Fa) BAP(+) > BAP(-),
N-P***
BAP(+) vs. BAP(-)
1.49

217
BAP(+) n = 27
BAP(-) n = 59
BAP(+) vs. N-P
1.43
USA Sasson et al
(2013)
ASD-P n=711
(50.5% Fa)
N-P n = 981
(49.9% Fa) ASD-Fa > N-
Fa***
ASD-Mo > N-
Mo***
ASD-Fa vs. N-Fa
0.37
ASD-Mo vs. N-Mo
0.45
Broader
Phenotype
Autism
Symptom Scale
(BPASS)
Interview &
Direct
Behavioral
Observation
Social USA Bernier et al
(2012)
MPX-P n=39
SPX-P n=22
DD-P n = 20
TD-P n = 20 MPX-P > SPX-P*
> DD-P** > TD-
P*
MPX-P vs. DD-P
0.84
MPX-P vs. TD-P
0.77
MPX-P vs. SPX-P
0.75
Expressiveness USA Bernier et al
(2012)
MPX-P n=39
SPX-P n=22
DD-P n = 20
TD-P n = 20 MPX-P > TD-
P***
MPX-P vs. TD-P
1.28
Conversation USA Bernier et al
(2012)
MPX-P n=39
SPX-P n=22
DD-P n = 20
TD-P n = 20
n.s.
Restricted Interests USA Bernier et al
(2012)
MPX-P n=39
SPX-P n=22
DD-P n = 20
TD-P n = 20 MPX-P > TD-P* MPX-P vs. TD-P
0.93
Communication
Checklist -
Adult Version
(CC-A)
Informant
Report
Questionnaire
Language Structure UK / Ireland /
USA / Canada /
Australia
Whitehouse et al
(2010)
ASD-P n= 238
(115Mo/123Fa)
UA n= 187
(90M/97F) n.s. ASD-P vs. UA
0.04
Pragmatic Skills UK / Ireland /
USA / Canada /
Australia
Whitehouse et al
(2010)
ASD-P n= 238
(115Mo/123Fa)
UA n= 187
(90M/97F) n.s. ASD-P vs. UA
0.18
Social Engagement UK / Ireland /
USA / Canada /
Australia
Whitehouse et al
(2010)
ASD-P n= 238
(115Mo/123Fa)
UA n= 187
(90M/97F) ASD-P < UA* ASD-P vs. UA
0.43
Total Score (1 SD
below mean)
UK / Ireland /
USA / Canada /
Australia
Whitehouse et al
(2010)
ASD-P n= 238
(115Mo/123Fa)
UA n= 187
(90M/97F) ASD-P < UA*

218
Family History
Interview /
Schedule
(FHI/FHS)
Interview
Social
USA (FHS) Piven et al
(1997a)
MPX-P n= 48
(25Mo/23Fa)
DS-P n = 60
(30Mo/30Fa) MPX-P > DS-P**
MPX-Fa > DS-
Fa***
MPX-Mo > DS-
Mo*
UK Pickles et al
(2013)
Modified version
ASD-P n = 193
(97Mo/96Fa)
SLI-P n = 103
(54Mo/49Fa)
SLI+ASD-P n = 43
(23Mo/20Fa)
DS-P n = 70
(35Mo/35Fa)
ASD-P >SLI-P*
Communication
Definite & Probable
ELRCD
Definite only ELRCD
USA (FHS) Piven et al
(1997a)
MPX-P n= 48
(25Mo/23Fa)
DS-P n = 60
(30Mo/30Fa)
n.s.
UK
Pickles et al
(2013)
Modified version
ASD-P n = 193
(97Mo/96Fa)
SLI-P n = 103
(54Mo/49Fa)
SLI+ASD-P n = 43
(23Mo/20Fa)
DS-P n = 70
(35Mo/35Fa)
n.s.
USA Folstein et al
(1999)
ASD-P n = 166
DS-P n = 75 ASD-P > DS-P**
USA Folstein et al
(1999)
ASD-P n = 166 DS-P n = 75 ASD-P > DS-P*
Stereotyped
behaviours
USA (FHS) Piven et al
(1997a)
MPX-P n= 48
(25Mo/23Fa)
DS-P n = 60
(30Mo/30Fa) MPX-P > DS-P*
The Modified
Personality
Assessment
Schedule –
Revised
(MPAS-R)
Interview
Aloof
USA Losh et al
(2008)
MPX n=48
(25Mo/23Fa)
SPX n=78
DS-P n=60 MPX-P > DS-P**
SPX-P > DS-P**
MPX-P > SPX-P*
USA Losh et al
(2012)
ASD-Mo n = 89
(All Mo)
FXS-Mo n = 49
(All Mo)
TD-Mo n = 23
(All Mo)
n.s.

219
USA (MPAS) Piven et
al (1994)
ASD-P n = 87
(45Mo/42Fa)
DS-P n = 38
(19Mo/19Fa)
ASD-P > DS-P**
USA Piven et al
(1997b)
MPX-P n= 39 DS-P n = 58 MPX-P > DS-P**
Anxious
USA Losh et al
(2008)
MPX-P n=48
(25Mo/23Fa)
SPX-P n=78
DS-P n=60 MPX-P > DS-P**
SPX-P > DS-P*
MPX-P > SPX-
P**
USA Piven et al
(1997b)
MPX-P n= 39 DS-P n = 58 MPX-P > DS-P**
MPX-Fa > DS-
Fa**
Hypersensitive
USA Losh et al
(2008)
MPX-P n=48
(25Mo/23Fa)
SPX-P n=78
DS-P n=60 MPX-P > DS-
P***
SPX-P > DS-P*
MPX-P > SPX-P*
USA Piven et al
(1997b)
MPX-P n= 39
DS-P n = 58 MPX-P > DS-P**
Overly conscientious
USA Losh et al
(2008)
MPX n=48
(25Mo/23Fa)
SPX n=78
DS-P n=60 MPX-P > DS-P*
SPX-P > DS-P*
USA Losh et al
(2012)
ASD-Mo n = 89
(All Mo)
FXS-Mo n = 49
(All Mo)
TD-Mo n = 23
(All Mo)
n.s.
USA Piven et al
(1997b)
MPX-P n= 39
DS-P n = 58
n.s.
Rigid
USA Losh et al
(2008)
MPX-P n=48
(25Mo/23Fa)
SPX-P n=78
DS-P n=60 MPX-P > DS-
P***
SPX-P > DS-P*

220
MPX-P > SPX-
P**
USA Losh et al
(2012)
ASD-Mo n = 89
(All Mo)
FXS-Mo n = 49
(All Mo)
TD-Mo n = 23
(All Mo)
ASD-P, FXS-P >
TD-P*
USA Piven et al
(1997b)
MPX-P n= 39
DS-P n = 58 MPX-P > DS-P**
Untactful
USA Losh et al
(2008)
MPX-P n=48
(25Mo/23Fa)
SPX-P n=78
DS-P n=60 MPX-P > DS-P*
MPX-P > SPX-P*
USA (MPAS) Piven et
al (1994)
ASD-P n = 87
(45Mo/42Fa)
DS-P n = 38
(19Mo/19Fa) ASD-P > DS-P*
USA Piven et al
(1997b)
MPX-P n= 39
DS-P n = 58 n.s.
Undemonstrative
USA (MPAS) Piven et
al (1994)
ASD-P n = 87
(45Mo/42Fa)
DS-P n = 38
(19Mo/19Fa) ASD-P > DS-P*
USA Piven et al
(1997b)
MPX-P n= 39
DS-P n = 58 n.s.
Unresponsive USA Piven et al
(1997b)
MPX-P n= 39
DS-P n = 58 n.s.
Pragmatic
Rating Scale
(PRS)
Interview &
Direct
Behavioral
Pragmatic language
violations
USA Losh et al
(2008)
MPX-P n=48
(25Mo/23Fa)
SPX-P n=78
DS-P n=60 SPX-P > DS-P**
USA Losh et al
(2012)
ASD-Mo n = 89
(All Mo)
FXS-Mo n = 49
(All Mo)
TD-Mo n = 23
(All Mo)
ASD-Mo/FXS-Mo
>TD-Mo*

221
Observation
USA Piven et al
(1997b)
MPX-P n= 38
DS-P n = 58 MPX-P > DS-P** MPX-P vs. DS-P
0.80
Speech errors
USA Losh et al
(2008)
MPX-P n=48
(25Mo/23Fa)
SPX-P n=78
DS-P n=60 SPX-P > DS-P**
USA Piven et al
(1997b)
MPX-P n= 38
DS-P n = 58 MPX-P > DS-P** MPX-P vs. DS-P
0.93
Total score (blind
ratings)
USA Landa et al
(1992)
ASD-P n = 21 TD/DS n = 19 ASD-P > TD/DS-
P*
ASD-P vs. TD/DS-
P 0.71
Total score (blind &
unblind ratings
combined)
USA Landa et al
(1992)
ASD-P n = 43 TD/DS n = 21
TD n = 11
DS n = 10
ASD-P > TD/DS-
P***
ASD-P vs. TD/DS-
P 0.87
Pragmatic
Rating Scale -
Modified
(PRS-M)
Interview &
Direct
Behavioral
Observation
Emotional
expressiveness and
awareness of the other
USA Ruser et al
(2007)
ASD-P n= 47
(49% Fa)
SLI-P n= 47
(45% Fa)
DS-P n = 21
(48% Fa)
ASD-P > DS-P* ASD-P vs. SLI-P
0.25
ASD-P vs. DS-P
0.58
Communicative
performance
USA Ruser et al
(2007)
ASD-P n= 47
(49% Fa)
SLI-P n= 47 (45%
Fa)
DS-P n = 21
(48% Fa)
n.s. ASD-P vs. SLI-P
0.06
ASD-P vs. DS-P
0.40
Over-talkativeness USA Ruser et al
(2007)
ASD-P n= 47
(49% Fa)
SLI-P n= 47
(45% Fa)
DS-P n = 21
(48% Fa)
ASD-P > DS-P* ASD-P vs. SLI-P
0
ASD-P vs. DS-P
0.53
Language USA Ruser et al
(2007)
ASD-P n= 47
(49% Fa)
SLI-P n= 47
(45% Fa)
DS-P n = 21
(48% Fa)
ASD-P > DS-P** ASD-P vs. SLI-P
0.14
ASD-P vs. DS-P
0.92
Total score USA Ruser et al
(2007)
ASD-P n= 47
(49% Fa)
SLI-P n= 47
(45% Fa)
DS-P n = 21
ASD-P > DS-P** ASD-P vs. SLI-P
0.09
ASD-P vs. DS-P

222
(48% Fa)
1.14
Social
Responsiveness
Scale (SRS)
Self & Informant
Report
Questionnaire
Belgium /
Netherlands
De la Marche et
al (2012)
ASD-P n = 275
(143Mo/132Fa)
MPX-P n = 93
(48Mo/45Fa)
SPX-P n = 129
(68Mo/61Fa)
UA n = 595
(295F/300M)
ASD-Fa > UA-
M**
MPX-Fa > UA-
M*
ASD-Fa vs. UA-M
0.30
ASD-Mo vs. UA-F
0.28
MPX-Fa vs. UA-
M 0.44
SPX-Fa vs. UA-M
0.19
MPX-Fa vs. SPX-
Fa 0.23
USA Schwichtenberg
et al (2010)
MPX-P n = 21
(10Mo/11Fa)
SPX-P n = 239
(115Mo/124Fa)
TD-P n = 163
(81Mo/82Fa)
MPX-Fa > TD-
Fa*
SPX-Fa > TD-Fa*
MPX-Fa vs. TD-
Fa 0.90
SPX-Fa vs. TD-Fa
0.35
MPX-Fa vs. SPX-
Fa 0.38
MPX-Mo vs. TD-
Mo 0.27
SPX-Mo vs. TD-
Mo 0.02
MPX-Mo vs. SPX-
Mo 0.18
Other
measures of
Personality
and
Friendships
The Friendship
Interview
Quality of friendships
(higher scores indicate
fewer friendships)
USA Losh et al
(2008)
MPX-P n=48
(25Mo/23Fa)
SPX-P n=78
DS-P n=60 SPX-P > DS-P**
MPX-P > SPX-P*
USA Piven et al
(1997b)
MPX-P n= 38
DS-P n = 58 MPX-P > DS-
P***
MPX-P vs. DS-P
1.14
The NEO
Personality
Inventory
(NEO-PI)
Neuroticism
USA Losh et al
(2008)
MPX-P n=48
(25Mo/23Fa)
SPX-P n=78
DS-P n=60 SPX-P > DS-P***
MPX-P > SPX-P*
USA Piven et al
(1997b)
MPX-P n= 38
DS-P n = 58 MPX-P > DS-
P***
MPX-P vs. DS-P
0.79
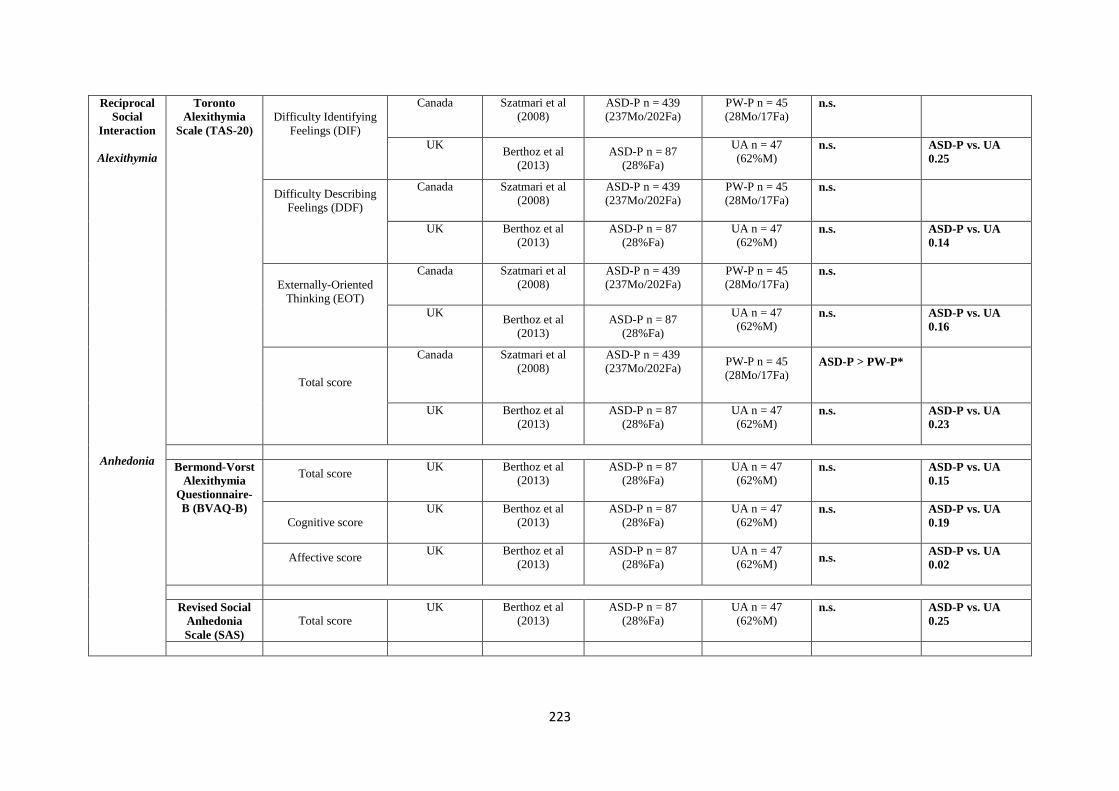
223
Reciprocal
Social
Interaction
Alexithymia
Anhedonia
Toronto
Alexithymia
Scale (TAS-20)
Difficulty Identifying
Feelings (DIF)
Canada Szatmari et al
(2008)
ASD-P n = 439
(237Mo/202Fa)
PW-P n = 45
(28Mo/17Fa)
n.s.
UK Berthoz et al
(2013)
ASD-P n = 87
(28%Fa)
UA n = 47
(62%M) n.s.
ASD-P vs. UA
0.25
Difficulty Describing
Feelings (DDF)
Canada
Szatmari et al
(2008)
ASD-P n = 439
(237Mo/202Fa)
PW-P n = 45
(28Mo/17Fa)
n.s.
UK Berthoz et al
(2013)
ASD-P n = 87
(28%Fa)
UA n = 47
(62%M) n.s.
ASD-P vs. UA
0.14
Externally-Oriented
Thinking (EOT)
Canada Szatmari et al
(2008)
ASD-P n = 439
(237Mo/202Fa)
PW-P n = 45
(28Mo/17Fa)
n.s.
UK Berthoz et al
(2013)
ASD-P n = 87
(28%Fa)
UA n = 47
(62%M) n.s.
ASD-P vs. UA
0.16
Total score
Canada Szatmari et al
(2008)
ASD-P n = 439
(237Mo/202Fa)
PW-P n = 45
(28Mo/17Fa)
ASD-P > PW-P*
UK Berthoz et al
(2013)
ASD-P n = 87
(28%Fa)
UA n = 47
(62%M) n.s.
ASD-P vs. UA
0.23
Bermond-Vorst
Alexithymia
Questionnaire-
B (BVAQ-B)
Total score
UK Berthoz et al
(2013)
ASD-P n = 87
(28%Fa)
UA n = 47
(62%M)
n.s.
ASD-P vs. UA
0.15
Cognitive score
UK Berthoz et al
(2013)
ASD-P n = 87
(28%Fa)
UA n = 47
(62%M)
n.s.
ASD-P vs. UA
0.19
Affective score
UK Berthoz et al
(2013)
ASD-P n = 87
(28%Fa)
UA n = 47
(62%M) n.s.
ASD-P vs. UA
0.02
Revised Social
Anhedonia
Scale (SAS)
Total score
UK Berthoz et al
(2013)
ASD-P n = 87
(28%Fa)
UA n = 47
(62%M)
n.s.
ASD-P vs. UA
0.25

224
Physical
Anhedonia
Scale (PAS)
Total score
UK Berthoz et al
(2013)
ASD-P n = 87
(28%Fa)
UA n = 47
(62%M) ASD-P > UA**
ASD-P vs. UA
0.33
Social and
Narrative
Language
Grice’s
Conversational
Maxims Task
No. of errors
Italy Di Michele et al
(2007)
ASD n = 46
DS n=14
TD n=12
ASD-P > TD-P***
ASD-P > DS-P*
Spontaneous
Narrative
Discourse
Story length (mean o.
of clauses)
USA Landa et al
(1991)
ASD-P n = 41
TD/DS-P n = 23
total
TD-P n = 10
DS-P n = 13
n.s.
ASD-P vs. TD/DS-
P 0.35
Stories w/ complete
episodes
USA Landa et al
(1991)
ASD-P n = 41
TD/DS-P n = 23
total
TD-P n = 10
DS-P n = 13
ASD-P < TD/DS-
P**
ASD-P vs. TD/DS-
P 0.71
Stories w/ multiple
episodes
USA Landa et al
(1991)
ASD-P n = 41
TD/DS-P n = 23
total
TD-P n = 10
DS-P n = 13
ASD-P < TD/DS-
P**
Stories w/ incomplete
episodes
USA Landa et al
(1991)
ASD-P n = 41
TD/DS-P n = 23
total
TD-P n = 10
DS-P n = 13
ASD-P > TD/DS-
P*
ASD-P vs. TD/DS-
P 0.50
Mean overall quality
USA Landa et al
(1991)
ASD-P n = 41
TD/DS-P n = 23
total
TD-P n = 10
DS-P n = 13
ASD-P < TD/DS-
P**
ASD-P vs. TD/DS-
P 0.73
Repetitive,
restrictive
Real-life Skills
and Preferences
Social items
UK Briskman et al
(2001)
ASD-P n = 42
(21Mo/21Fa)
DLX-P n = 27
(14Mo/13Fa) ASD-P > DLX-P >
TD-P*
ASD-P vs. DLX-P
0.92

225
behaviors
and
interests
(Everyday
Preferences
and
abilities)
TD-P n = 28
(14Mo/14Fa)
ASD-Fa > DLX-
Fa**
ASD-Fa > TD-
Fa**
ASD-Mo > DLX-
Mo**
ASD-Mo > TD-
Mo**
ASD-P vs. TD-P
0.91
ASD-Fa vs. DLX-
Fa 1.03
ASD-Fa vs. TD-Fa
1.11
ASD-Mo vs. DLX-
Mo 0.89
ASD-Mo vs. TD-
Mo 0.77
Non-social items
UK Briskman et al
(2001) [42]
ASD-P n = 42
(21Mo/21Fa)
DLX-P n = 27
(14Mo/13Fa)
TD-P n = 28
(14Mo/14Fa)
ASD-P > TD-P**
ASD-Fa > TD-Fa*
ASD-P vs. DLX-P
0.44
ASD-P vs. TD-P
0.76
ASD-Fa vs. DLX-
Fa 0.37
ASD-Fa vs. TD-Fa
0.9
ASD-Mo vs. DLX-
Mo 0.54
ASD-Mo vs. TD-
Mo 0.64
Note. ASD = Autism Spectrum Disorder; BAP = Broad Autism Phenotype; BAP(+) = BAP present; BAP (-) = BAP absent; P = Parent; Mo = Mother; Fa = Father; M = Male; F = Female; MPX = Multiple incidence
autism families; SPX = Single incidence autism families; DD = Developmental delay without autism; DLX = Dyslexia; DS = Down Syndrome; FXS = Fragile X Syndrome; N = Normative sample; PWD = Prader
Willie; SLI = Specific Language Impairment; TD = typically developing; UA = Unaffected adult.
*p<0.05; **p<0.01; ***p<0.001

226
Appendix 3: Cognitive Endophenotype Matrix – Review of studies of parents of autistic probands.
Domain Method /
Measure
Factors /
Subscales
Country Study ASD Parent
Group
Characteristics
Control
Group
Characteristics
Key Findings in relation to Proband
Diagnosis
P value Effect Size (d)
General
Intellectual
Functioning
Weschler Scales
Verbal IQ (VIQ)
Total Score or
Estimate
Australia
Bishop et al
(2004a)
ASD-P n = 121
(69Mo/52Fa)
N-P n = 89
(52Mo/37Fa) n.s.
ASD-Mo vs. N-Mo 0.20
ASD-Fa vs. N-Fa 0.21
Australia Bishop et al
(2004b)
ASD-P = 142
(77Mo/65Fa)
N-P n = 96
(57Mo/39Fa)
n.s.
ASD-Mo vs. N-Mo 0.19
ASD-Fa vs. N-Fa 0.07
Netherlands de Jonge et al
(2006)
MPX-P n = 51
(26Mo/25Fa)
DS-P n = 54
(28Fa/26Mo)
n.s.
MPX-P vs. DS-P 0.11
Netherlands de Jonge et al
(2007)
MPX-P n = 51
(26Mo/25Fa)
DS-P n = 52
(25Fa/27Mo)
n.s.
MPX-P vs. DS-P 0.17
Netherlands de Jonge et al (2009)
MPX-P n = 51 (26Mo/25Fa)
DS-P n = 57 (28Mo/29Fa)
n.s.
MPX-P vs. DS-P 0.09
USA Folstein et al
(1999)
ASD-P n = 166
DS-P n = 75
n.s.
ASD-P vs. DS-P 0.19
UK Fombonne et al
(1997)
ASD-P n = 160
(86Mo/74Fa)
DS-P n = 42
(23Mo/19Fa)
ASD-P > DS-P**
ASD-P vs. DS-P 0.51
UK Happé et al
(2001)
ASD-P n = 43
(21Mo/22Fa)
DLX-P n = 30
(15Mo/15Fa) TD-P n = 20
(10Mo/10Fa)
n.s.
ASD-Mo vs. DLX-Mo 0.05
ASD-Mo vs. TD-Mo 0.17
ASD-Fa vs. DLX-Fa 0.26
ASD-Fa vs. TD-Fa 0.19
USA Lindgren et al
(2009)
ALN-P n = 39
(20Mo/19Fa) ALI-P n = 62
(31Mo/31Fa)
SLI-P n = 70
(35Mo/35Fa)
n.s.
ALN-Fa vs. ALI-Fa 0.95
ALN-Fa vs. SLI-Fa 2.10
ALI-Fa vs. SLI-Fa 0.95
ALN-Mo vs. ALI-Mo 0.80
ALN-Mo vs. SLI-Mo 2.10
ALI-Mo vs. SLI-Mo 1.28
USA Piven & Palmer
(1997)
MPX-P n= 48
(25Mo/23Fa)
DS-P n = 60
(30Mo/30Fa)
n.s.
MPX-P vs. DS-P 0.16
USA Ruser et al
(2007)
ASD-P n= 47
(49% Fa)
SLI-P n= 47
(45% Fa) DS-P n = 21
n.s.
ASD-P vs. SLI-P 0.09
ASD-P vs. DS-P 0.26

227
(48% Fa)
USA Schmidt et al (2008)
ASD-P n = 22 (14Mo/8Fa)
UA n = 22 (14F/8M)
n.s.
ASD-P vs. UA 0.07
Australia Wong et al (2006)
ASD-P n = 145 (80Mo/65Fa)
TD-P n = 96 (57Mo/39Fa)
n.s.
Digit Span
UK Fombonne et al (1997)
ASD-P n = 160 (86Mo/74Fa)
DS-P n = 42 (23Mo/19Fa)
ASD-P > DS-P**
ASD-P vs. DS-P 0.48
UK Whitehouse et al
(2007) (modified version
to assess short-
term memory)
ASD-P n = 30
(20Mo/10Fa)
SLI-P n= 30
(22Mo/8Fa) TD-P n = 30
(23Mo/7Fa)
ASD-P > SLI-P**
ASD-P vs. SLI-P 0.67
ASD-P vs. TD-P 0.14
Canada Szatmari et al
(1993)
ASD-P n = 97
(51Mo/46Fa)
DS/LBW-P n = 54
(30Mo/24Fa)
n.s.
ASD-Fa vs. DS/LBW-P 0.40
ASD-M0 vs. DS/LBW-P 0.04
Arithmetic UK Fombonne et al
(1997)
ASD-P n = 160
(86Mo/74Fa)
DS-P n = 42
(23Mo/19Fa)
n.s.
ASD-P vs. DS-P 0.25
Vocabulary
UK Fombonne et al
(1997)
ASD-P n = 160
(86Mo/74Fa)
DS-P n = 42
(23Mo/19Fa)
ASD-P > DS-P***
ASD-P vs. DS-P 0.58
USA Schmidt et al
(2008)
ASD-P n = 22
(14Mo/8Fa)
UA n = 22 (14F/8M)
n.s.
ASD-P vs. UA 0.24
USA Smalley &
Asarnow
(1990)
ASD-P n = 15
TD-P n = 12
ASD-P < TD-P*
ASD-P vs. TD-P 0.96
Canada Szatmari et al
(1993)
ASD-P n = 97
(51Mo/46Fa)
DS/LBW-P n = 54
(30Mo/24Fa)
n.s.
ASD-Fa vs. DS/LBW-P 0.40
ASD-M0 vs. DS/LBW-P 0.04
Comprehension UK Fombonne et al
(1997)
ASD-P n = 160
(86Mo/74Fa)
DS-P n = 42
(23Mo/19Fa)
ASD-P > DS-P*
ASD-P vs. DS-P 0.35
USA Smalley &
Asarnow
(1990)
ASD-P n = 15
TD-P n = 12
n.s.
ASD-P vs. TD-P 0.74
Canada Szatmari et al ASD-P n = 97 DS/LBW-P n = 54 n.s. ASD-Fa vs. DS/LBW-P 0.36
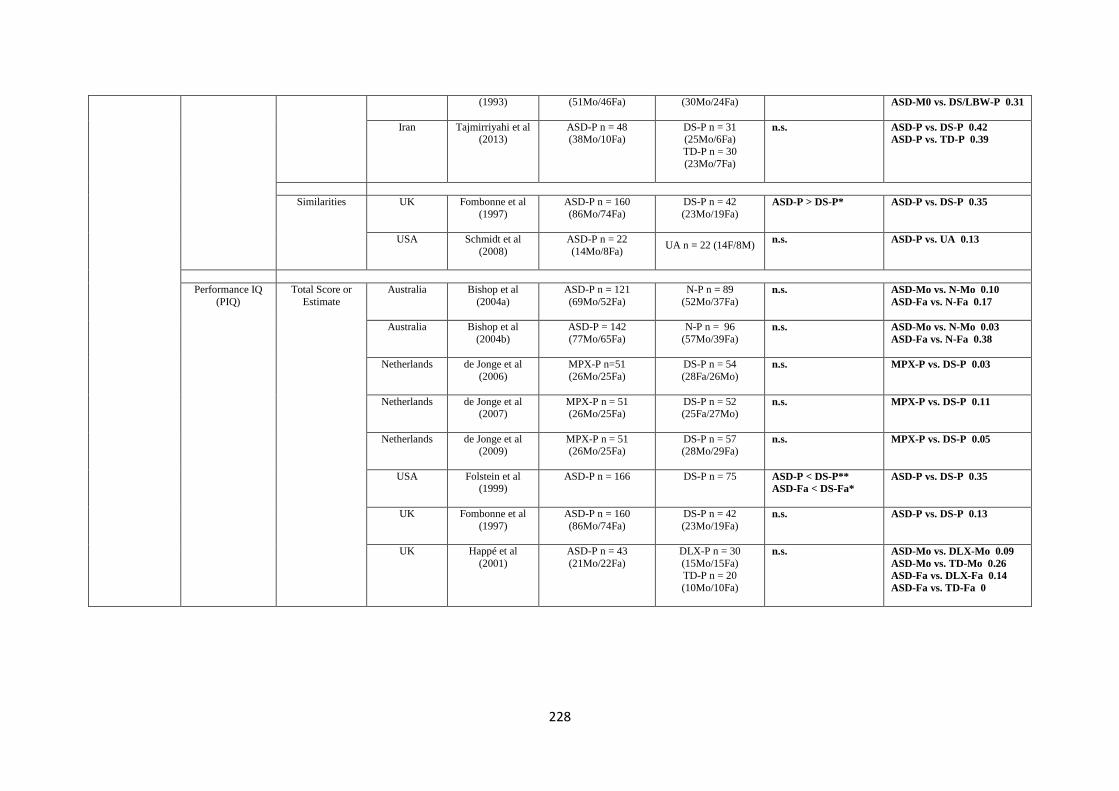
228
(1993)
(51Mo/46Fa)
(30Mo/24Fa)
ASD-M0 vs. DS/LBW-P 0.31
Iran Tajmirriyahi et al (2013)
ASD-P n = 48 (38Mo/10Fa)
DS-P n = 31 (25Mo/6Fa)
TD-P n = 30
(23Mo/7Fa)
n.s.
ASD-P vs. DS-P 0.42
ASD-P vs. TD-P 0.39
Similarities
UK Fombonne et al
(1997)
ASD-P n = 160
(86Mo/74Fa)
DS-P n = 42
(23Mo/19Fa)
ASD-P > DS-P*
ASD-P vs. DS-P 0.35
USA Schmidt et al
(2008)
ASD-P n = 22
(14Mo/8Fa)
UA n = 22 (14F/8M)
n.s.
ASD-P vs. UA 0.13
Performance IQ
(PIQ)
Total Score or
Estimate
Australia Bishop et al
(2004a)
ASD-P n = 121
(69Mo/52Fa)
N-P n = 89
(52Mo/37Fa)
n.s.
ASD-Mo vs. N-Mo 0.10
ASD-Fa vs. N-Fa 0.17
Australia Bishop et al
(2004b)
ASD-P = 142
(77Mo/65Fa)
N-P n = 96
(57Mo/39Fa)
n.s.
ASD-Mo vs. N-Mo 0.03
ASD-Fa vs. N-Fa 0.38
Netherlands de Jonge et al
(2006)
MPX-P n=51
(26Mo/25Fa)
DS-P n = 54
(28Fa/26Mo)
n.s.
MPX-P vs. DS-P 0.03
Netherlands de Jonge et al (2007)
MPX-P n = 51 (26Mo/25Fa)
DS-P n = 52 (25Fa/27Mo)
n.s.
MPX-P vs. DS-P 0.11
Netherlands de Jonge et al (2009)
MPX-P n = 51 (26Mo/25Fa)
DS-P n = 57 (28Mo/29Fa)
n.s.
MPX-P vs. DS-P 0.05
USA Folstein et al (1999)
ASD-P n = 166
DS-P n = 75
ASD-P < DS-P**
ASD-Fa < DS-Fa*
ASD-P vs. DS-P 0.35
UK Fombonne et al
(1997)
ASD-P n = 160
(86Mo/74Fa)
DS-P n = 42
(23Mo/19Fa)
n.s.
ASD-P vs. DS-P 0.13
UK Happé et al
(2001)
ASD-P n = 43
(21Mo/22Fa)
DLX-P n = 30
(15Mo/15Fa) TD-P n = 20
(10Mo/10Fa)
n.s.
ASD-Mo vs. DLX-Mo 0.09
ASD-Mo vs. TD-Mo 0.26
ASD-Fa vs. DLX-Fa 0.14
ASD-Fa vs. TD-Fa 0

229
USA Lindgren et al
(2009)
ALN-P n = 39
(20Mo/19Fa) ALI-P n = 62
(31Mo/31Fa)
SLI-P n = 70
(35Mo/35Fa)
ALN-Fa > ALI-Fa >
SLI-Fa**
ALN-Fa vs. ALI-Fa 0.44
ALN-Fa vs. SLI-Fa 1.16
ALI-Fa vs. SLI-Fa 0.72
ALN-Mo vs. ALI-Mo 0.37
ALN-Mo vs. SLI-Mo 0.77
ALI-Mo vs. SLI-Mo 0.40
USA Piven & Palmer (1997)
MPX-P n= 48 (25Mo/23Fa)
DS-P n = 60 (30Mo/30Fa)
MPX-P < DS-P*
MPX-P vs. DS-P 0.74
USA Ruser et al (2007)
ASD-P n= 47 (49% Fa)
SLI-P n= 47 (45% Fa)
DS-P n = 21
(48% Fa)
n.s.
ASD-P vs. SLI-P 0.14
ASD-P vs. DS-P 0.48
USA Schmidt et al
(2008)
ASD-P n = 22
(14Mo/8Fa)
UA n = 22 (14F/8M)
ASD-P< UA*
ASD-P vs. UA 0.62
Australia Wong et al
(2006)
ASD n = 145
(80Mo/65Fa)
TD-P n = 96
(57Mo/39Fa)
n.s.
Picture
Completion
USA Folstein et al
(1999)
ASD-P n = 166
DS-P n = 75
ASD-P < DS-P**
ASD-P vs. DS-P 0.42
UK
Fombonne et al
(1997)
ASD-P n = 160
(86Mo/74Fa)
DS-P n = 42
(23Mo/19Fa)
n.s.
ASD-P vs. DS-P 0.07
USA Piven & Palmer
(1997)
MPX-P n= 48
(25Mo/23Fa)
DS-P n = 60
(30Mo/30Fa)
MPX-P < DS-P*
MPX-P vs. DS-P 0.65
Iran Tajmirriyahi et al
(2013)
ASD-P n = 48
(38Mo/10Fa)
DS-P n = 31
(25Mo/6Fa)
TD-P n = 30 (23Mo/7Fa)
n.s.
ASD-P vs. DS-P 0.12
ASD-P vs. TD-P 0.46
Picture Arrangement
USA Folstein et al (1999)
ASD-P n = 166
DS-P n = 75
ASD-P < DS-P*
ASD-P vs. DS-P 0.26
UK Fombonne et al
(1997)
ASD-P n = 160
(86Mo/74Fa)
DS-P n = 42
(23Mo/19Fa)
n.s.
ASD-P vs. DS-P 0.03
Block Design UK Fombonne et al
(1997)
ASD-P n = 160
(86Mo/74Fa)
DS-P n = 42
(23Mo/19Fa) n.s.
ASD-P vs. DS-P 0.21

230
USA Piven & Palmer
(1997)
MPX-P n= 48
(25Mo/23Fa)
DS-P n = 60
(30Mo/30Fa)
n.s.
MPX-P vs. DS-P 0.34
USA Schmidt et al
(2008)
ASD-P n = 22
(14Mo/8Fa)
UA n = 22 (14F/8M)
n.s.
ASD-P vs. UA 0.43
USA Smalley &
Asarnow
(1990)
ASD-P n = 15
TD-P n = 12
n.s.
ASD-P vs. TD-P 0.36
Canada Szatmari et al
(1993)
ASD-P n = 97
(51Mo/46Fa)
DS/LBW-P n = 54
(30Mo/24Fa)
n.s.
ASD-Fa vs. DS/LBW-P 0.38
ASD-M0 vs. DS/LBW-P 0.04
Object Assembly UK Fombonne et al
(1997)
ASD-P n = 160
(86Mo/74Fa)
DS-P n = 42
(23Mo/19Fa)
n.s.
ASD-P vs. DS-P 0.12
USA Piven & Palmer
(1997)
MPX-P n= 48
(25Mo/23Fa)
DS-P n = 60
(30Mo/30Fa)
MPX-P < DS-P*
MPX-P vs. DS-P 0.62
Matrix
Reasoning
USA Schmidt et al
(2008)
ASD-P n = 22
(14Mo/8Fa)
UA n = 22 (14F/8M)
ASD-P < UA*
ASD-P vs. UA 0.67
Digit Symbol Canada Szatmari et al
(1993)
ASD-P n = 97
(51Mo/46Fa)
DS/LBW-P n = 54
(30Mo/24Fa)
n.s.
ASD-Fa vs. DS/LBW-P 0.19
ASD-M0 vs. DS/LBW-P 0.17
Full Scale IQ
(FSIQ)
Total Score or
Estimate
USA Adolphs et al
(2008)
AD-P n = 42 total
BAP(+) Aloof n = 15 (3Mo/12Fa)
BAP(-) n = 27
(20Mo/7Fa)
TD-P n = 20
(8Mo/12Fa)
n.s.
BAP (+) Aloof vs. TD-P 0.47
BAP(-) vs. TD-P 0.37
Netherlands de Jonge et al
(2006)
MPX-P n=51
(26Mo/25Fa)
DS-P n = 54
(28Fa/26Mo)
n.s.
MPX-P vs. DS-P 0.09
Netherlands de Jonge et al
(2007)
MPX-P n = 51
(26Mo/25Fa)
DS-P n = 52
(25Fa/27Mo)
n.s.
MPX-P vs. DS-P 0.10
Netherlands de Jonge et al (2009)
MPX-P n = 51 (26Mo/25Fa)
DS-P n = 57 (28Mo/29Fa)
n.s.
MPX-P vs. DS-P 0.06
USA Folstein et al (1999)
ASD-P n = 166
DS-P n = 75
ASD-P < DS-P**
ASD-Fa < DS-Fa*
ASD-P vs. DS-P 0.30

231
UK Fombonne et al
(1997)
ASD-P n = 160
(86Mo/74Fa)
DS-P n = 42
(23Mo/19Fa)
n.s.
ASD-P vs. DS-P 0.25
Turkey Gocken et al
(2009)
ASD-P n = 76
(38Mo/38Fa)
N-P n = 41
(21Mo/20Fa)
n.s.
ASD-P vs. N-P 0.09
UK Happé et al
(2001)
ASD-P n = 43
(21Mo/22)
DLX-P n = 30
(15Mo/15Fa) TD-P n = 20
(10Mo/10Fa)
n.s.
ASD-Mo vs. DLX-Mo 0.05
ASD-Mo vs. TD-Mo 0.21
ASD-Fa vs. DLX-Fa 0.28
ASD-Fa vs. TD-Fa 0.11
USA Lindgren et al
(2009)
ALN-P n = 39
(20Mo/19Fa)
ALI-P n = 62
(31Mo/31Fa)
SLI-P n = 70
(35Mo/35Fa)
n.s.
ALN-Fa vs. ALI-Fa 0.81
ALN-Fa vs. SLI-Fa 1.88
ALI-Fa vs. SLI-Fa 0.97
ALN-Mo vs. ALI-Mo 0.66
ALN-Mo vs. SLI-Mo 1.61
ALI-Mo vs. SLI-Mo 0.94
USA Losh & Piven
(2007)
ASD-P n = 48
(25Mo/23Fa)
BAP(+) Aloof n = 13 BAP(+) Rigid n = 11
BAP(-) n = 24
TD/DS-P n = 22 TD-
P n = 16 DS-P n =
6
ASD-P < TD/DS-P**
ASD-P vs. TD/DS-P 0.83
USA Losh et al (2008)
MPX n=48 (25Mo/23Fa)
SPX n=78
DS-P n=60 MPX-P < DS-P*
SPX-P < DS-P*
USA Losh et al
(2009)
ASD-P n= 83
BAP(+) Social n = 22
BAP(+) Rigid/Perfectionistic n
= 34
BAP(+) Social & Rigid n = 13 (5Mo/8Fa)
BAP(-) n = 40
TD-P n = 32
(19Mo/13Fa)
n.s.
ASD-P vs.TD-P 0.33
USA Piven et al
(1991)
ASD-P n = 81
(42Mo/39Fa)
DS-P n = 34
(18Mo/16Fa)
n.s
ASD-P vs. DS-P 0.21
USA Schmidt et al (2008)
ASD-P n = 22 (14Mo/8Fa)
UA n = 22 (14F/8M)
n.s.
ASD-P vs. UA 0.41
Nonverbal Reasoning
Block Design & Matrix
Reasoning
UK Whitehouse et al (2007)
ASD-P n = 30 (20Mo/10Fa)
SLI-P n= 30 (22Mo/8Fa)
TD-P n = 30
n.s.
ASD-Fa vs. SLI-Fa 0.30
ASD-Mo vs. SLI-Mo 0.43
ASD-Fa vs. TD-Fa 0.01
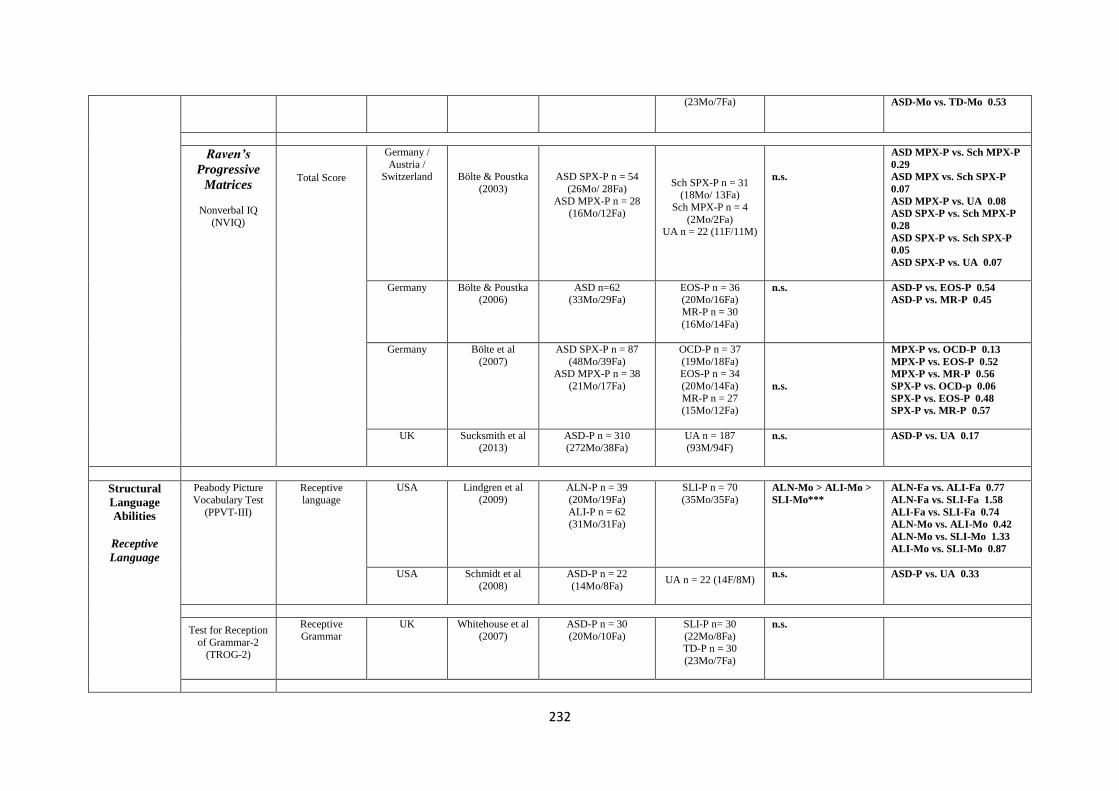
232
(23Mo/7Fa)
ASD-Mo vs. TD-Mo 0.53
Raven’s
Progressive
Matrices
Nonverbal IQ
(NVIQ)
Total Score
Germany /
Austria / Switzerland Bölte & Poustka
(2003)
ASD SPX-P n = 54
(26Mo/ 28Fa)
ASD MPX-P n = 28 (16Mo/12Fa)
Sch SPX-P n = 31 (18Mo/ 13Fa)
Sch MPX-P n = 4
(2Mo/2Fa) UA n = 22 (11F/11M)
n.s.
ASD MPX-P vs. Sch MPX-P
0.29
ASD MPX vs. Sch SPX-P
0.07
ASD MPX-P vs. UA 0.08
ASD SPX-P vs. Sch MPX-P
0.28
ASD SPX-P vs. Sch SPX-P
0.05
ASD SPX-P vs. UA 0.07
Germany Bölte & Poustka (2006)
ASD n=62 (33Mo/29Fa)
EOS-P n = 36 (20Mo/16Fa)
MR-P n = 30
(16Mo/14Fa)
n.s.
ASD-P vs. EOS-P 0.54
ASD-P vs. MR-P 0.45
Germany Bölte et al
(2007)
ASD SPX-P n = 87
(48Mo/39Fa) ASD MPX-P n = 38
(21Mo/17Fa)
OCD-P n = 37
(19Mo/18Fa) EOS-P n = 34
(20Mo/14Fa)
MR-P n = 27 (15Mo/12Fa)
n.s.
MPX-P vs. OCD-P 0.13
MPX-P vs. EOS-P 0.52
MPX-P vs. MR-P 0.56
SPX-P vs. OCD-p 0.06
SPX-P vs. EOS-P 0.48
SPX-P vs. MR-P 0.57
UK Sucksmith et al (2013)
ASD-P n = 310 (272Mo/38Fa)
UA n = 187 (93M/94F)
n.s.
ASD-P vs. UA 0.17
Structural
Language
Abilities
Receptive
Language
Peabody Picture
Vocabulary Test
(PPVT-III)
Receptive
language
USA Lindgren et al
(2009)
ALN-P n = 39
(20Mo/19Fa)
ALI-P n = 62 (31Mo/31Fa)
SLI-P n = 70
(35Mo/35Fa)
ALN-Mo > ALI-Mo >
SLI-Mo***
ALN-Fa vs. ALI-Fa 0.77
ALN-Fa vs. SLI-Fa 1.58
ALI-Fa vs. SLI-Fa 0.74
ALN-Mo vs. ALI-Mo 0.42
ALN-Mo vs. SLI-Mo 1.33
ALI-Mo vs. SLI-Mo 0.87
USA Schmidt et al
(2008)
ASD-P n = 22
(14Mo/8Fa)
UA n = 22 (14F/8M)
n.s.
ASD-P vs. UA 0.33
Test for Reception
of Grammar-2
(TROG-2)
Receptive
Grammar
UK Whitehouse et al
(2007)
ASD-P n = 30
(20Mo/10Fa)
SLI-P n= 30
(22Mo/8Fa) TD-P n = 30
(23Mo/7Fa)
n.s.

233
Expressive
Language
Figurative
Language
Phonological
awareness
Expressive
Vocabulary Test (EVT)
Expressive
language
USA Schmidt et al
(2008)
ASD-P n = 22
(14Mo/8Fa)
UA n = 22 (14F/8M)
n.s.
ASD-P vs. UA 0.10
Verbal Fluency
Subtest - Delis
Kaplan Executive Function System
(DK-EFS)
Letter fluency
USA Schmidt et al (2008)
ASD-P n = 22 (14Mo/8Fa)
UA n = 22 (14F/8M)
n.s.
ASD-P vs. UA 0.39
Category fluency
USA Schmidt et al (2008)
ASD-P n = 22 (14Mo/8Fa)
UA n = 22 (14F/8M)
n.s.
ASD-P vs. UA 0.35
Category switching
USA Schmidt et al (2008)
ASD-P n = 22 (14Mo/8Fa)
UA n = 22 (14F/8M)
n.s.
ASD-P vs. UA 0.16
Switching Accuracy
USA Schmidt et al (2008)
ASD-P n = 22 (14Mo/8Fa)
UA n = 22 (14F/8M)
n.s.
ASD-P vs. UA 0.22
Figurative Language Subtest
- Test of
Language Competence-
Expanded Edition
(TOLC-E)
Figurative Language
USA Schmidt et al (2008)
ASD-P n = 22 (14Mo/8Fa)
UA n = 22 (14F/8M)
n.s.
ASD-P vs. UA 0.28
Comprehensive
Test of
Phonological Processing
(CTOPP)
Phonological
Awareness
USA Lindgren et al
(2009)
ALN-P n = 39
(20Mo/19Fa) ALI-P n = 62
(31Mo/31Fa)
SLI-P n = 70
(35Mo/35Fa)
ALN-Mo > ALI-Mo >
SLI-Mo***
ALN-Fa vs. ALI-Fa 0.42
ALN-Fa vs. SLI-Fa 0.86
ALI-Fa vs. SLI-Fa 0.38
ALN-Mo vs. ALI-Mo 0.38
ALN-Mo vs. SLI-Mo 0.78
ALI-Mo vs. SLI-Mo 0.48
Phonological memory
USA Lindgren et al (2009)
ALN-P n = 39 (20Mo/19Fa)
ALI-P n = 62
(31Mo/31Fa)
SLI-P n = 70 (35Mo/35Fa)
n.s.
ALN-Fa vs. ALI-Fa 0.08
ALN-Fa vs. SLI-Fa 0.96
ALI-Fa vs. SLI-Fa 0.86
ALN-Mo vs. ALI-Mo 0.74
ALN-Mo vs. SLI-Mo 1.42
ALI-Mo vs. SLI-Mo 0.70
Rapid naming
USA Lindgren et al
(2009)
ALN-P n = 39
(20Mo/19Fa)
SLI-P n = 70
(35Mo/35Fa) n.s.
ALN-Fa vs. ALI-Fa 0.02
ALN-Fa vs. SLI-Fa 0.34
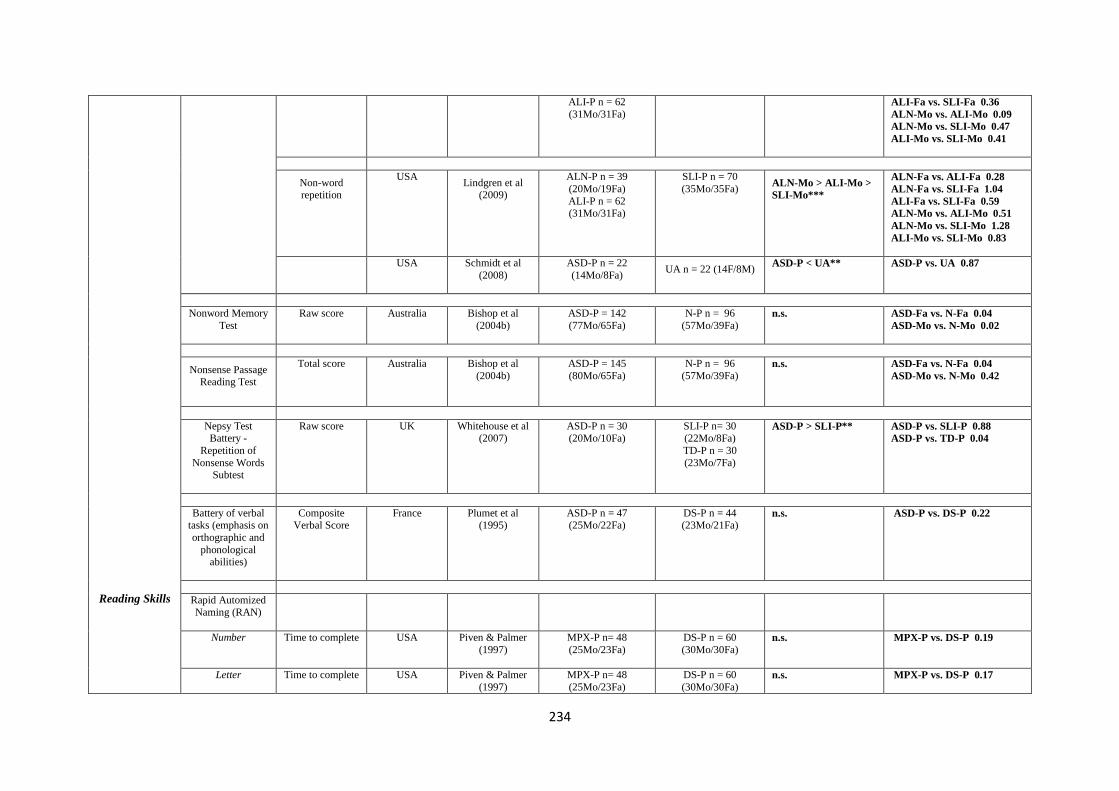
234
Reading Skills
ALI-P n = 62
(31Mo/31Fa)
ALI-Fa vs. SLI-Fa 0.36
ALN-Mo vs. ALI-Mo 0.09
ALN-Mo vs. SLI-Mo 0.47
ALI-Mo vs. SLI-Mo 0.41
Non-word repetition
USA Lindgren et al
(2009)
ALN-P n = 39
(20Mo/19Fa)
ALI-P n = 62 (31Mo/31Fa)
SLI-P n = 70
(35Mo/35Fa)
ALN-Mo > ALI-Mo >
SLI-Mo***
ALN-Fa vs. ALI-Fa 0.28
ALN-Fa vs. SLI-Fa 1.04
ALI-Fa vs. SLI-Fa 0.59
ALN-Mo vs. ALI-Mo 0.51
ALN-Mo vs. SLI-Mo 1.28
ALI-Mo vs. SLI-Mo 0.83
USA Schmidt et al
(2008)
ASD-P n = 22
(14Mo/8Fa)
UA n = 22 (14F/8M)
ASD-P < UA**
ASD-P vs. UA 0.87
Nonword Memory
Test
Raw score
Australia Bishop et al
(2004b)
ASD-P = 142
(77Mo/65Fa)
N-P n = 96
(57Mo/39Fa)
n.s.
ASD-Fa vs. N-Fa 0.04
ASD-Mo vs. N-Mo 0.02
Nonsense Passage Reading Test
Total score
Australia Bishop et al
(2004b)
ASD-P = 145
(80Mo/65Fa)
N-P n = 96
(57Mo/39Fa)
n.s.
ASD-Fa vs. N-Fa 0.04
ASD-Mo vs. N-Mo 0.42
Nepsy Test
Battery -
Repetition of
Nonsense Words Subtest
Raw score
UK Whitehouse et al
(2007)
ASD-P n = 30
(20Mo/10Fa)
SLI-P n= 30
(22Mo/8Fa)
TD-P n = 30
(23Mo/7Fa)
ASD-P > SLI-P**
ASD-P vs. SLI-P 0.88
ASD-P vs. TD-P 0.04
Battery of verbal tasks (emphasis on
orthographic and
phonological abilities)
Composite Verbal Score
France Plumet et al (1995)
ASD-P n = 47 (25Mo/22Fa)
DS-P n = 44 (23Mo/21Fa)
n.s.
ASD-P vs. DS-P 0.22
Rapid Automized
Naming (RAN)
Number
Time to complete
USA Piven & Palmer
(1997)
MPX-P n= 48
(25Mo/23Fa)
DS-P n = 60
(30Mo/30Fa)
n.s.
MPX-P vs. DS-P 0.19
Letter
Time to complete
USA Piven & Palmer
(1997)
MPX-P n= 48
(25Mo/23Fa)
DS-P n = 60
(30Mo/30Fa) n.s.
MPX-P vs. DS-P 0.17
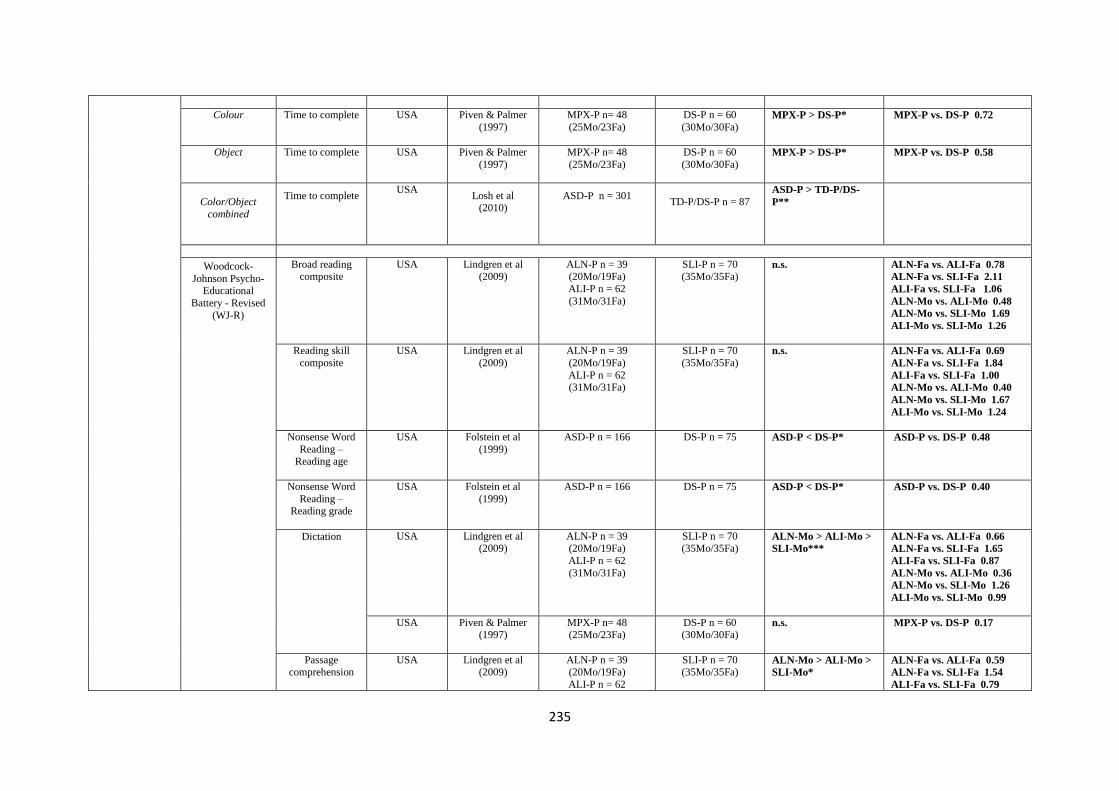
235
Colour
Time to complete
USA Piven & Palmer
(1997)
MPX-P n= 48
(25Mo/23Fa)
DS-P n = 60
(30Mo/30Fa)
MPX-P > DS-P*
MPX-P vs. DS-P 0.72
Object
Time to complete
USA Piven & Palmer
(1997)
MPX-P n= 48
(25Mo/23Fa)
DS-P n = 60
(30Mo/30Fa)
MPX-P > DS-P*
MPX-P vs. DS-P 0.58
Color/Object
combined
Time to complete
USA Losh et al
(2010)
ASD-P n = 301
TD-P/DS-P n = 87
ASD-P > TD-P/DS-
P**
Woodcock-
Johnson Psycho-Educational
Battery - Revised
(WJ-R)
Broad reading composite
USA Lindgren et al (2009)
ALN-P n = 39 (20Mo/19Fa)
ALI-P n = 62
(31Mo/31Fa)
SLI-P n = 70 (35Mo/35Fa)
n.s.
ALN-Fa vs. ALI-Fa 0.78
ALN-Fa vs. SLI-Fa 2.11
ALI-Fa vs. SLI-Fa 1.06
ALN-Mo vs. ALI-Mo 0.48
ALN-Mo vs. SLI-Mo 1.69
ALI-Mo vs. SLI-Mo 1.26
Reading skill
composite
USA Lindgren et al
(2009)
ALN-P n = 39
(20Mo/19Fa)
ALI-P n = 62 (31Mo/31Fa)
SLI-P n = 70
(35Mo/35Fa)
n.s.
ALN-Fa vs. ALI-Fa 0.69
ALN-Fa vs. SLI-Fa 1.84
ALI-Fa vs. SLI-Fa 1.00
ALN-Mo vs. ALI-Mo 0.40
ALN-Mo vs. SLI-Mo 1.67
ALI-Mo vs. SLI-Mo 1.24
Nonsense Word
Reading – Reading age
USA Folstein et al
(1999)
ASD-P n = 166
DS-P n = 75
ASD-P < DS-P*
ASD-P vs. DS-P 0.48
Nonsense Word
Reading – Reading grade
USA Folstein et al
(1999)
ASD-P n = 166
DS-P n = 75
ASD-P < DS-P*
ASD-P vs. DS-P 0.40
Dictation
USA Lindgren et al (2009)
ALN-P n = 39 (20Mo/19Fa)
ALI-P n = 62
(31Mo/31Fa)
SLI-P n = 70 (35Mo/35Fa)
ALN-Mo > ALI-Mo >
SLI-Mo***
ALN-Fa vs. ALI-Fa 0.66
ALN-Fa vs. SLI-Fa 1.65
ALI-Fa vs. SLI-Fa 0.87
ALN-Mo vs. ALI-Mo 0.36
ALN-Mo vs. SLI-Mo 1.26
ALI-Mo vs. SLI-Mo 0.99
USA Piven & Palmer (1997)
MPX-P n= 48 (25Mo/23Fa)
DS-P n = 60 (30Mo/30Fa)
n.s.
MPX-P vs. DS-P 0.17
Passage comprehension
USA Lindgren et al (2009)
ALN-P n = 39 (20Mo/19Fa)
ALI-P n = 62
SLI-P n = 70 (35Mo/35Fa)
ALN-Mo > ALI-Mo >
SLI-Mo*
ALN-Fa vs. ALI-Fa 0.59
ALN-Fa vs. SLI-Fa 1.54
ALI-Fa vs. SLI-Fa 0.79

236
(31Mo/31Fa)
ALN-Mo vs. ALI-Mo 0.50
ALN-Mo vs. SLI-Mo 1.46
ALI-Mo vs. SLI-Mo 1.01
USA Piven & Palmer
(1997)
MPX-P n= 48
(25Mo/23Fa)
DS-P n = 60
(30Mo/30Fa)
MPX-P < DS-P*
MPX-P vs. DS-P 0.45
Word Attack
USA
Lindgren et al
(2009)
ALN-P n = 39
(20Mo/19Fa) ALI-P n = 62
(31Mo/31Fa)
SLI-P n = 70
(35Mo/35Fa)
n.s.
ALN-Fa vs. ALI-Fa 0.48
ALN-Fa vs. SLI-Fa 1.30
ALI-Fa vs. SLI-Fa 0.75
ALN-Mo vs. ALI-Mo 0.31
ALN-Mo vs. SLI-Mo 1.35
ALI-Mo vs. SLI-Mo 1.06
USA Piven & Palmer
(1997)
MPX-P n= 48
(25Mo/23Fa)
DS –P n = 60
(30Mo/30Fa)
n.s.
MPX-P vs. DS-P 0.09
Letter Word
USA Piven & Palmer
(1997)
MPX-P n= 48
(25Mo/23Fa)
DS n = 60
(30Mo/30Fa)
n.s.
MPX-P vs. DS-P 0.24
Gray Oral Reading
Test (GORT)
Comprehension
USA Folstein et al
(1999)
ASD-P n = 166
DS-P n = 75
n.s.
ASD-P vs. DS-P 0.12
Passage
USA Folstein et al
(1999)
ASD-P n = 166
DS-P n = 75
n.s.
ASD-P vs. DS-P 0.21
Reading age
UK Fombonne et al
(1997)
ASD-P n = 160
(86Mo/74Fa)
DS-P n = 42
(23Mo/19Fa)
n.s.
ASD-P vs. DS-P 0.36
Edinburgh
Reading Test (ERT)
Reading age
UK Fombonne et al
(1997)
ASD-P n = 160
(86Mo/74Fa)
DS-P n = 42
(23Mo/19Fa)
n.s.
ASD-P vs. DS-P 0
National Adult
Reading Test (NART)
Error score
UK Baron-Cohen & Hammer
(1997)
AS-P n = 30 (15Mo/15Fa)
TD-P n = 30 (15Mo/15Fa)
n.s.
ASD-P vs, N-P 0.20
UK Fombonne et al
(1997)
ASD-P n = 160
(86Mo/74Fa)
DS-P n = 42
(23Mo/19Fa)
ASD-P < DS-P*
ASD-P vs. DS-P 0.44

237
Spelling
abilities
Oromotor
Functioning
Test of Word
Reading
Efficiency
Sight Word
Efficiency Subtest (real words)
Standard score
UK
Whitehouse et al (2007)
ASD-P n = 30
(20Mo/10Fa)
SLI-P n= 30
(22Mo/8Fa)
TD-P n = 30 (23Mo/7Fa)
n.s.
ASD-P vs. SLI-P 0.18
ASD-P vs. TD-P 0.03
Phonemic
Decoding
Efficiency Subtest
(nonsense words)
Standard score
UK Whitehouse et al
(2007)
ASD-P n = 30
(20Mo/10Fa)
SLI-P n= 30
(22Mo/8Fa)
TD-P n = 30
(23Mo/7Fa)
ASD-P > SLI-P*
ASD-P vs. SLI-P 0.62
ASD-P vs. TD-P 0.24
Reading History
Questionnaire
(RHQ)
Reading
difficulties
USA Schmidt et al
(2008)
ASD-P n = 22
(14Mo/8Fa)
UA n = 22 (14F/8M)
n.s.
ASD-P vs. UA 0.34
Schonell Spelling Test (SST)
Total words
correct
USA Folstein et al
(1999)
ASD-P n = 166
DS-P n = 75
n.s.
ASD-P vs. DS-P 0.13
UK Fombonne et al
(1997)
ASD-P n = 160
(86Mo/74Fa)
DS-P n = 42
(23Mo/19Fa)
ASD-P > DS-P**
ASD-P vs. DS-P 0.62
Spelling age
USA Folstein et al
(1999)
ASD-P n = 166
DS-P n = 75
n.s.
ASD-P vs. DS-P 0.02
Speeded Dictation
task
Raw Score
UK Whitehouse et al
(2007)
ASD-P n = 30
(20Mo/10Fa)
SLI-P n= 30
(22Mo/8Fa) TD-P n = 30
(23Mo/7Fa)
n.s.
Oromotor
Sequencing
Subtest - NEPSY
Test Battery
Raw score
UK Whitehouse et al
(2007)
ASD-P n = 30
(20Mo/10Fa)
SLI-P n= 30
(22Mo/8Fa)
TD-P n = 30
(23Mo/7Fa)
ASD-P > SLI-P**
ASD-P vs. SLI-P 0.54
ASD-P vs. TD-P 0.43
Social Reading the Mind in Eyes Test
Accuracy
UK Baron-Cohen & Hammer
AS-P n = 30 (15Mo/15Fa)
TD-P n = 30 (15Mo/15Fa)
ASD-Fa < N-Fa**
ASD-Mo < N-Mo***
ASD-Fa vs. N-Fa 0.99
ASD-Mo vs. N-Mo 1.51
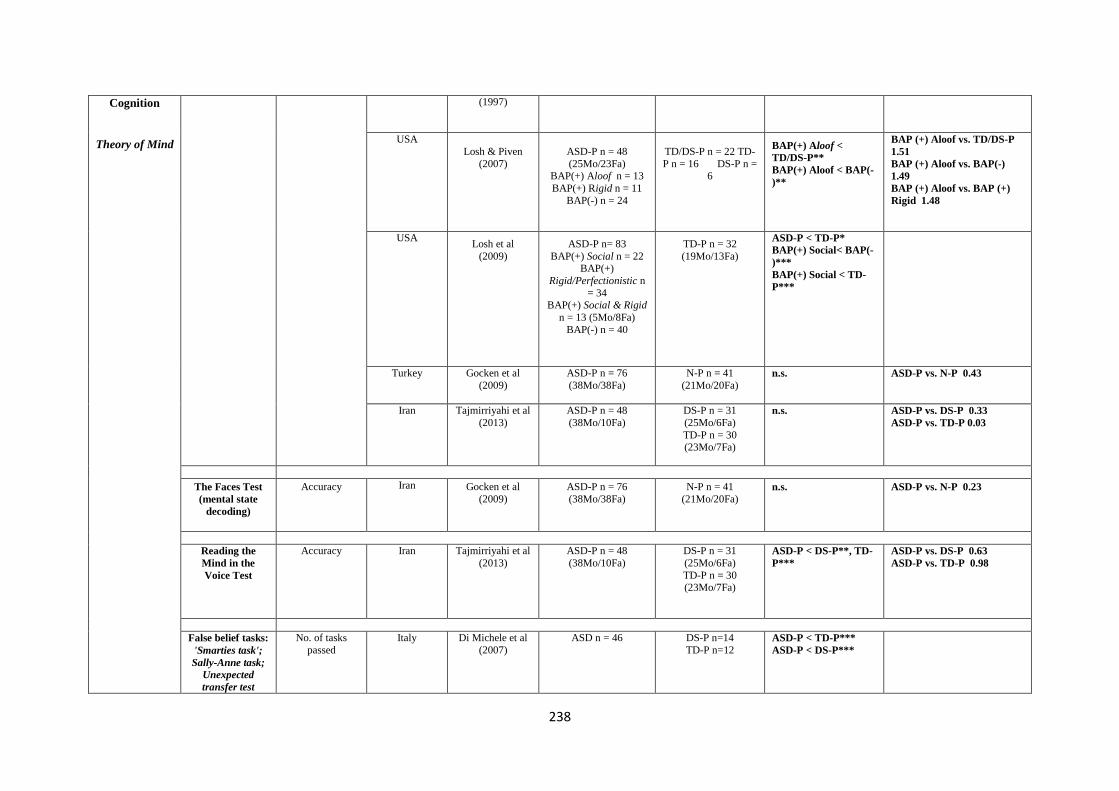
238
Cognition
Theory of Mind
(1997)
USA
Losh & Piven
(2007)
ASD-P n = 48
(25Mo/23Fa) BAP(+) Aloof n = 13
BAP(+) Rigid n = 11
BAP(-) n = 24
TD/DS-P n = 22 TD-
P n = 16 DS-P n = 6
BAP(+) Aloof <
TD/DS-P**
BAP(+) Aloof < BAP(-
)**
BAP (+) Aloof vs. TD/DS-P
1.51
BAP (+) Aloof vs. BAP(-)
1.49
BAP (+) Aloof vs. BAP (+)
Rigid 1.48
USA
Losh et al
(2009)
ASD-P n= 83
BAP(+) Social n = 22 BAP(+)
Rigid/Perfectionistic n
= 34 BAP(+) Social & Rigid
n = 13 (5Mo/8Fa)
BAP(-) n = 40
TD-P n = 32
(19Mo/13Fa)
ASD-P < TD-P*
BAP(+) Social< BAP(-
)***
BAP(+) Social < TD-
P***
Turkey Gocken et al
(2009)
ASD-P n = 76
(38Mo/38Fa)
N-P n = 41
(21Mo/20Fa)
n.s.
ASD-P vs. N-P 0.43
Iran Tajmirriyahi et al
(2013)
ASD-P n = 48
(38Mo/10Fa)
DS-P n = 31
(25Mo/6Fa)
TD-P n = 30 (23Mo/7Fa)
n.s.
ASD-P vs. DS-P 0.33
ASD-P vs. TD-P 0.03
The Faces Test
(mental state
decoding)
Accuracy
Iran Gocken et al
(2009)
ASD-P n = 76
(38Mo/38Fa)
N-P n = 41
(21Mo/20Fa)
n.s.
ASD-P vs. N-P 0.23
Reading the
Mind in the
Voice Test
Accuracy
Iran Tajmirriyahi et al
(2013)
ASD-P n = 48
(38Mo/10Fa)
DS-P n = 31
(25Mo/6Fa)
TD-P n = 30 (23Mo/7Fa)
ASD-P < DS-P**, TD-
P***
ASD-P vs. DS-P 0.63
ASD-P vs. TD-P 0.98
False belief tasks:
'Smarties task';
Sally-Anne task;
Unexpected
transfer test
No. of tasks
passed
Italy Di Michele et al
(2007)
ASD n = 46
DS-P n=14
TD-P n=12
ASD-P < TD-P***
ASD-P < DS-P***

239
Empathy
Affect
Perception /
Emotion
Recognition
Unexpected
Outcomes Test
(UOT)
Total score
Turkey Gocken et al (2009)
ASD-P n = 76 (38Mo/38Fa)
N-P n = 41 (21Mo/20Fa)
ASD-P < N-P**
ASD-P vs. N-P 0.58
The Hinting Task
Accuracy
Turkey Gocken et al
(2009)
ASD-P n = 76
(38Mo/38Fa)
N-P n = 41
(21Mo/20Fa)
n.s.
ASD-P vs. N-P 0.36
Empathy
Quotient (EQ)
Mean score
UK Sucksmith et al
(2013)
ASD-P n = 310
(272Mo/38Fa)
UA n = 187
(93M/94F)
ASD-Fa < UA-M*
ASD-Fa vs. US-M 0.40
ASD-Mo vs. UA-F 0.11
Pictures of Facial
affect - 'Bubbles'
method
Accuracy
USA Adolphs et al
(2008)
AD-P n = 42 total
BAP(+) Aloof n = 15
(3Mo/12Fa) BAP(-) n = 27
(20Mo/7Fa)
TD-P n = 20
(8Mo/12Fa)
n.s.
Reaction Time
USA
Adolphs et al (2008)
AD-P n = 42 total BAP(+) Aloof n = 15
(3Mo/12Fa)
BAP(-) n = 27 (20Mo/7Fa)
TD-P n = 20 (8Mo/12Fa)
n.s.
Use of Facial
Information
Eyes region Mouth region
USA Adolphs et al
(2008)
AD-P n = 42 total
BAP(+) Aloof n = 15
(3Mo/12Fa) BAP(-) n = 27
(20Mo/7Fa)
TD-P n = 20
(8Mo/12Fa)
BAP(+) <BAP(-) <TD-
P***
BAP(+) >BAP(-) >TD-
P***
Penn Emotion
Recognition Test
(ER40)
Time for correct answers
Brazil das Neves et al (2011)
ASD-P n = 40 (30Mo/10Fa)
UA n = 41 (28F/13M)
ASD-P > UA***
ASD-P vs. UA 1.09
Accuracy
Brazil das Neves et al
(2011)
ASD-P n = 40
(30Mo/10Fa)
UA n = 41 (28F/13M)
ASD-P < UA***
ASD-P vs. UA 0.76
Female faces
Brazil das Neves et al
(2011)
ASD-P n = 40
(30Mo/10Fa)
UA n = 41 (28F/13M)
ASD-P < UA***
ASD-P vs. UA 0.66
Male faces
Brazil das Neves et al
(2011)
ASD-P n = 40
(30Mo/10Fa)
UA n = 41 (28F/13M)
ASD-P < UA*
ASD-P vs. UA 0.63

240
Mild emotions
Brazil das Neves et al
(2011)
ASD-P n = 40
(30Mo/10Fa)
UA n = 41 (28F/13M)
ASD-P < UA*
ASD-P vs. UA 0.61
Extreme
emotions
Brazil das Neves et al
(2011)
ASD-P n = 40
(30Mo/10Fa)
UA n = 41 (28F/13M)
ASD-P < UA*
ASD-P vs. UA 0.54
Facial Affect
Recognition Test
(pictures by
Ekman &
Friesen)
Expected answers
Germany / Austria /
Switzerland Bölte & Poustka
(2003)
ASD SPX-P n = 54
(26Mo/ 28Fa)
ASD MPX-P n = 28
(16Mo/12Fa)
Sch SPX-P n = 31
(18Mo/ 13Fa)
Sch MPX-P n = 4 (2Mo/2Fa)
UA n = 22 (11F/11M)
n.s.
ASD MPX-P vs. Sch MPX-P
0.54
ASD MPX vs. Sch SPX-P
0.36
ASD MPX-P vs. UA 2.06
ASD SPX-P vs. Sch MPX-P
1.39
ASD SPX-P vs. Sch SPX-P
0.57
ASD SPX-P vs. UA 0.32
Emotion
Recognition Test
- using set of
photographs
from Ekman &
Friesen's (1976)
'Photos of Facial
Affect'
Happiness
Turkey Kadak et al
(2014)
ASD-P n=72
(36Mo/36Fa)
TD-P n=38
(19Mo/19Fa)
ASD-P < TD-P*
ASD-P vs. TD-P 0.05
Sadness
Turkey Kadak et al
(2014)
ASD-P n=72
(36Mo/36Fa)
TD-P n=38
(19Mo/19Fa)
n.s.
ASD-P vs. TD-P 0.07
Fearful
Turkey Kadak et al
(2014)
ASD-P n=72
(36Mo/36Fa)
TD-P n=38
(19Mo/19Fa)
n.s.
ASD-P vs. TD-P 0.19
Disgusted
Turkey Kadak et al
(2014) ASD-P n=72 (36Mo/36Fa)
TD-P n=38
(19Mo/19Fa)
n.s.
ASD-P vs. TD-P 0.28
Angry
Turkey Kadak et al (2014)
ASD-P n=72 (36Mo/36Fa)
TD-P n=38 (19Mo/19Fa)
n.s.
ASD-P vs. TD-P 0.09
Surprised
Turkey Kadak et al (2014)
ASD-P n=72 (36Mo/36Fa)
TD-P n=38 (19Mo/19Fa)
ASD-P < TD-P*
ASD-P vs. TD-P 0.40
Neutral
Turkey Kadak et al
(2014)
ASD-P n=72
(36Mo/36Fa)
TD-P n=38
(19Mo/19Fa)
ASD-P < TD-P*
ASD-P vs. TD-P 0.50
Karolinska
Directed
Emotional Faces
task (KDEF)
Mean accuracy
p/emotion
UK Sucksmith et al
(2013)
ASD-P n = 297
(261Mo/36Fa)
UA n = 184
(92M/92F)
n.s.
ASD-Fa vs. UA-M 0.12
ASD-Mo vs. UA-F 0.08
Overall mean
accuracy adjusted
UK Sucksmith et al
(2013)
ASD-P n = 297
(261Mo/36Fa)
UA n = 184
(92M/92F) n.s.
ASD-Fa vs. UA-M 0.30
ASD-Mo vs. UA-F 0.20

241
response time
p/emotion
Point light basic
emotions
Positive emotions
Accuracy
USA Losh et al
(2009)
ASD-P n= 83 BAP(+) Social n = 22
BAP(+)
Rigid/Perfectionistic n = 34
BAP(+) Social & Rigid
n = 13 (5Mo/8Fa) BAP(-) n = 40
TD-P n = 32 (19Mo/13Fa)
ASD-P < TD-P**
Negative emotions
Accuracy
USA Losh et al
(2009)
ASD-P n= 83
BAP(+) Social n = 22
BAP(+) Rigid/Perfectionistic n
= 34
BAP(+) Social & Rigid n = 13 (5Mo/8Fa)
BAP(-) n = 40
TD-P n = 32
(19Mo/13Fa)
n.s.
Point light
trustworthiness
Positive stimuli
Accuracy
USA
Losh et al
(2009)
ASD-P n= 83
BAP(+) Social n = 22
BAP(+) Rigid/Perfectionistic n
= 34
BAP(+) Social & Rigid n = 13 (5Mo/8Fa)
BAP(-) n = 40
TD-P n = 32
(19Mo/13Fa)
ASD-P <TD-P**
BAP(+) Social < BAP
(-)**
Negative stimuli
Accuracy
USA Losh et al
(2009)
ASD-P n= 83
BAP(+) Social n = 22
BAP(+) Rigid/Perfectionistic n
= 34
BAP(+) Social & Rigid n = 13 (5Mo/8Fa)
BAP(-) n = 40
TD-P n = 32 (19Mo/13Fa)
BAP(+) Social > BAP(-
)*
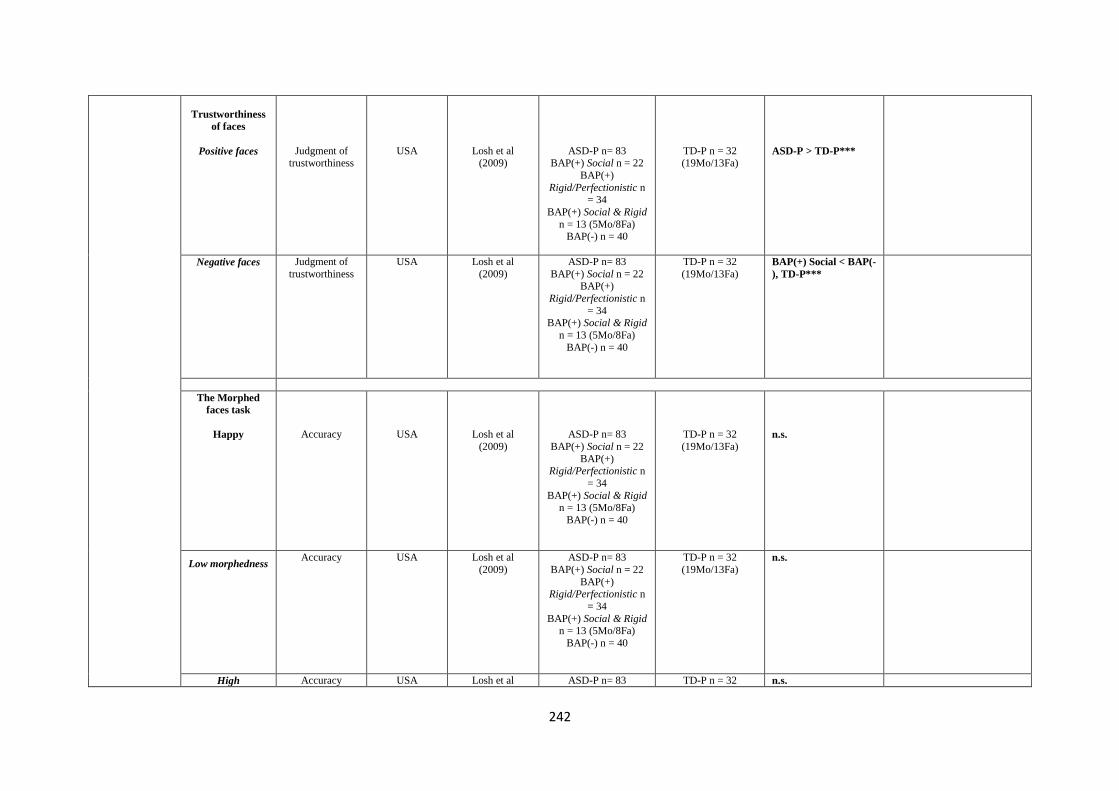
242
Trustworthiness
of faces
Positive faces
Judgment of trustworthiness
USA
Losh et al (2009)
ASD-P n= 83 BAP(+) Social n = 22
BAP(+)
Rigid/Perfectionistic n = 34
BAP(+) Social & Rigid
n = 13 (5Mo/8Fa) BAP(-) n = 40
TD-P n = 32 (19Mo/13Fa)
ASD-P > TD-P***
Negative faces
Judgment of
trustworthiness
USA Losh et al
(2009)
ASD-P n= 83
BAP(+) Social n = 22 BAP(+)
Rigid/Perfectionistic n
= 34 BAP(+) Social & Rigid
n = 13 (5Mo/8Fa)
BAP(-) n = 40
TD-P n = 32
(19Mo/13Fa)
BAP(+) Social < BAP(-
), TD-P***
The Morphed
faces task
Happy
Accuracy
USA
Losh et al
(2009)
ASD-P n= 83
BAP(+) Social n = 22
BAP(+) Rigid/Perfectionistic n
= 34
BAP(+) Social & Rigid n = 13 (5Mo/8Fa)
BAP(-) n = 40
TD-P n = 32
(19Mo/13Fa)
n.s.
Low morphedness
Accuracy
USA Losh et al
(2009)
ASD-P n= 83
BAP(+) Social n = 22
BAP(+) Rigid/Perfectionistic n
= 34
BAP(+) Social & Rigid n = 13 (5Mo/8Fa)
BAP(-) n = 40
TD-P n = 32
(19Mo/13Fa)
n.s.
High Accuracy USA Losh et al ASD-P n= 83 TD-P n = 32 n.s.
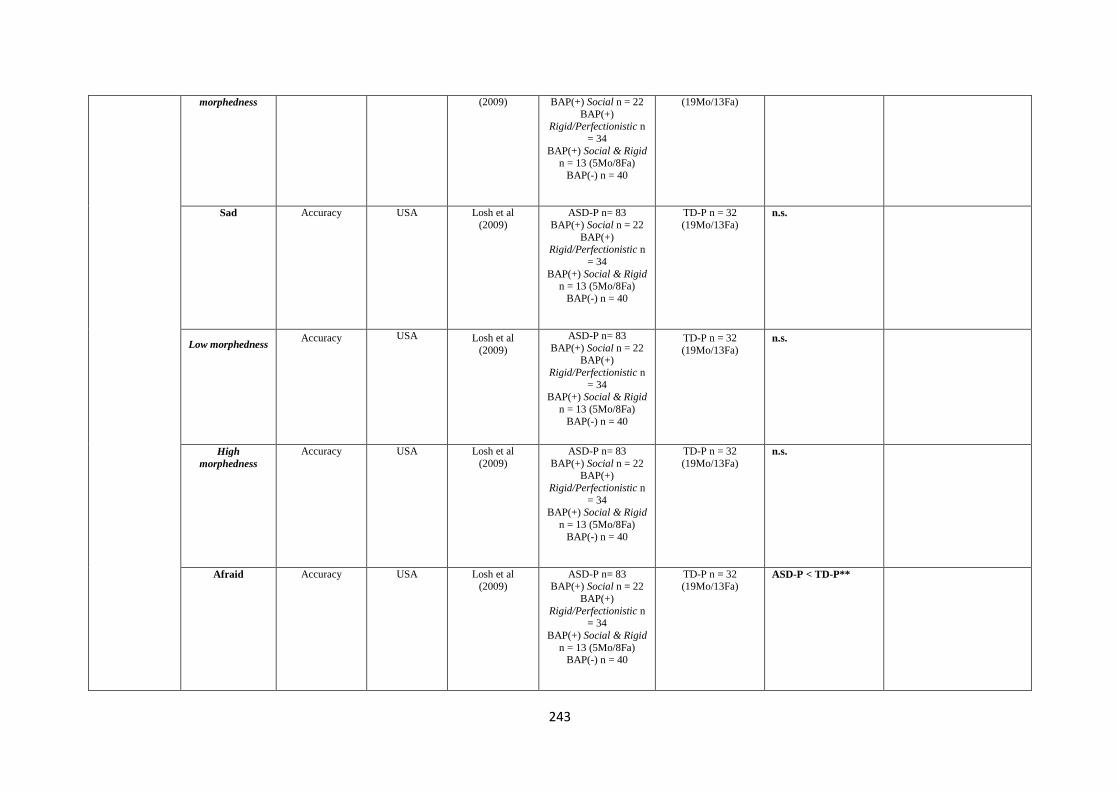
243
morphedness
(2009)
BAP(+) Social n = 22
BAP(+) Rigid/Perfectionistic n
= 34
BAP(+) Social & Rigid n = 13 (5Mo/8Fa)
BAP(-) n = 40
(19Mo/13Fa)
Sad
Accuracy
USA Losh et al
(2009)
ASD-P n= 83
BAP(+) Social n = 22
BAP(+) Rigid/Perfectionistic n
= 34
BAP(+) Social & Rigid n = 13 (5Mo/8Fa)
BAP(-) n = 40
TD-P n = 32
(19Mo/13Fa)
n.s.
Low morphedness
Accuracy
USA Losh et al
(2009)
ASD-P n= 83
BAP(+) Social n = 22 BAP(+)
Rigid/Perfectionistic n
= 34 BAP(+) Social & Rigid
n = 13 (5Mo/8Fa)
BAP(-) n = 40
TD-P n = 32
(19Mo/13Fa)
n.s.
High
morphedness
Accuracy
USA
Losh et al
(2009)
ASD-P n= 83
BAP(+) Social n = 22 BAP(+)
Rigid/Perfectionistic n
= 34 BAP(+) Social & Rigid
n = 13 (5Mo/8Fa)
BAP(-) n = 40
TD-P n = 32
(19Mo/13Fa)
n.s.
Afraid
Accuracy
USA Losh et al (2009)
ASD-P n= 83 BAP(+) Social n = 22
BAP(+)
Rigid/Perfectionistic n = 34
BAP(+) Social & Rigid
n = 13 (5Mo/8Fa) BAP(-) n = 40
TD-P n = 32 (19Mo/13Fa)
ASD-P < TD-P**
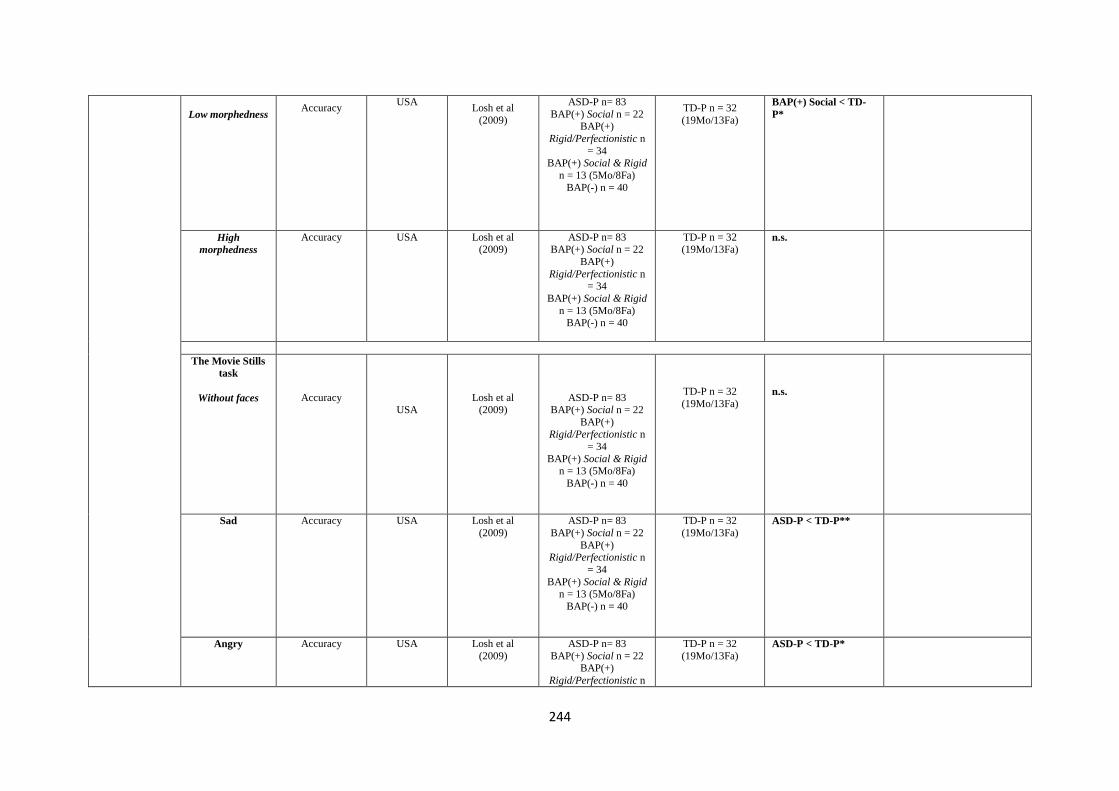
244
Low morphedness
Accuracy
USA Losh et al
(2009)
ASD-P n= 83
BAP(+) Social n = 22 BAP(+)
Rigid/Perfectionistic n
= 34 BAP(+) Social & Rigid
n = 13 (5Mo/8Fa)
BAP(-) n = 40
TD-P n = 32
(19Mo/13Fa)
BAP(+) Social < TD-
P*
High
morphedness
Accuracy
USA Losh et al (2009)
ASD-P n= 83 BAP(+) Social n = 22
BAP(+)
Rigid/Perfectionistic n = 34
BAP(+) Social & Rigid
n = 13 (5Mo/8Fa) BAP(-) n = 40
TD-P n = 32 (19Mo/13Fa)
n.s.
The Movie Stills
task
Without faces
Accuracy
USA
Losh et al (2009)
ASD-P n= 83 BAP(+) Social n = 22
BAP(+)
Rigid/Perfectionistic n
= 34
BAP(+) Social & Rigid n = 13 (5Mo/8Fa)
BAP(-) n = 40
TD-P n = 32
(19Mo/13Fa)
n.s.
Sad
Accuracy
USA Losh et al
(2009)
ASD-P n= 83
BAP(+) Social n = 22
BAP(+) Rigid/Perfectionistic n
= 34
BAP(+) Social & Rigid n = 13 (5Mo/8Fa)
BAP(-) n = 40
TD-P n = 32
(19Mo/13Fa)
ASD-P < TD-P**
Angry
Accuracy
USA Losh et al
(2009)
ASD-P n= 83
BAP(+) Social n = 22 BAP(+)
Rigid/Perfectionistic n
TD-P n = 32
(19Mo/13Fa)
ASD-P < TD-P*
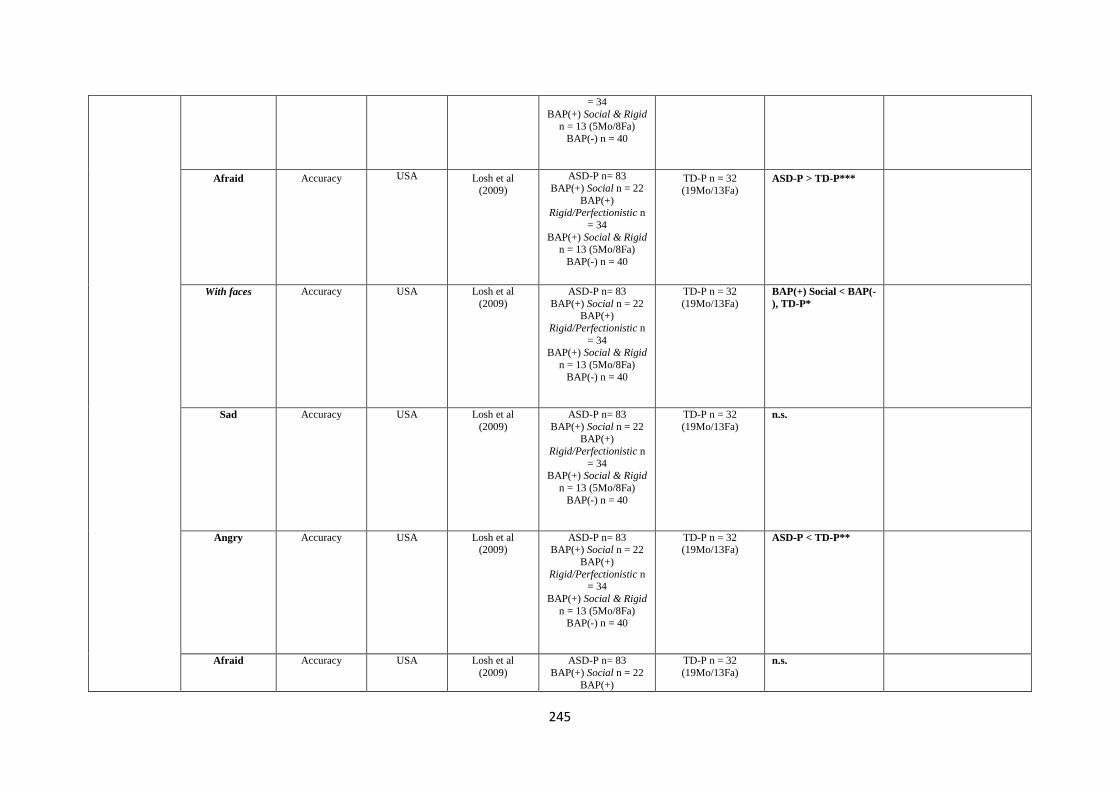
245
= 34
BAP(+) Social & Rigid n = 13 (5Mo/8Fa)
BAP(-) n = 40
Afraid
Accuracy
USA Losh et al (2009)
ASD-P n= 83
BAP(+) Social n = 22
BAP(+) Rigid/Perfectionistic n
= 34
BAP(+) Social & Rigid n = 13 (5Mo/8Fa)
BAP(-) n = 40
TD-P n = 32 (19Mo/13Fa)
ASD-P > TD-P***
With faces
Accuracy
USA Losh et al
(2009)
ASD-P n= 83
BAP(+) Social n = 22 BAP(+)
Rigid/Perfectionistic n
= 34 BAP(+) Social & Rigid
n = 13 (5Mo/8Fa)
BAP(-) n = 40
TD-P n = 32
(19Mo/13Fa)
BAP(+) Social < BAP(-
), TD-P*
Sad
Accuracy
USA Losh et al
(2009)
ASD-P n= 83
BAP(+) Social n = 22
BAP(+)
Rigid/Perfectionistic n
= 34 BAP(+) Social & Rigid
n = 13 (5Mo/8Fa)
BAP(-) n = 40
TD-P n = 32
(19Mo/13Fa)
n.s.
Angry
Accuracy
USA Losh et al (2009)
ASD-P n= 83 BAP(+) Social n = 22
BAP(+)
Rigid/Perfectionistic n = 34
BAP(+) Social & Rigid
n = 13 (5Mo/8Fa) BAP(-) n = 40
TD-P n = 32 (19Mo/13Fa)
ASD-P < TD-P**
Afraid
Accuracy
USA Losh et al
(2009)
ASD-P n= 83
BAP(+) Social n = 22
BAP(+)
TD-P n = 32
(19Mo/13Fa)
n.s.
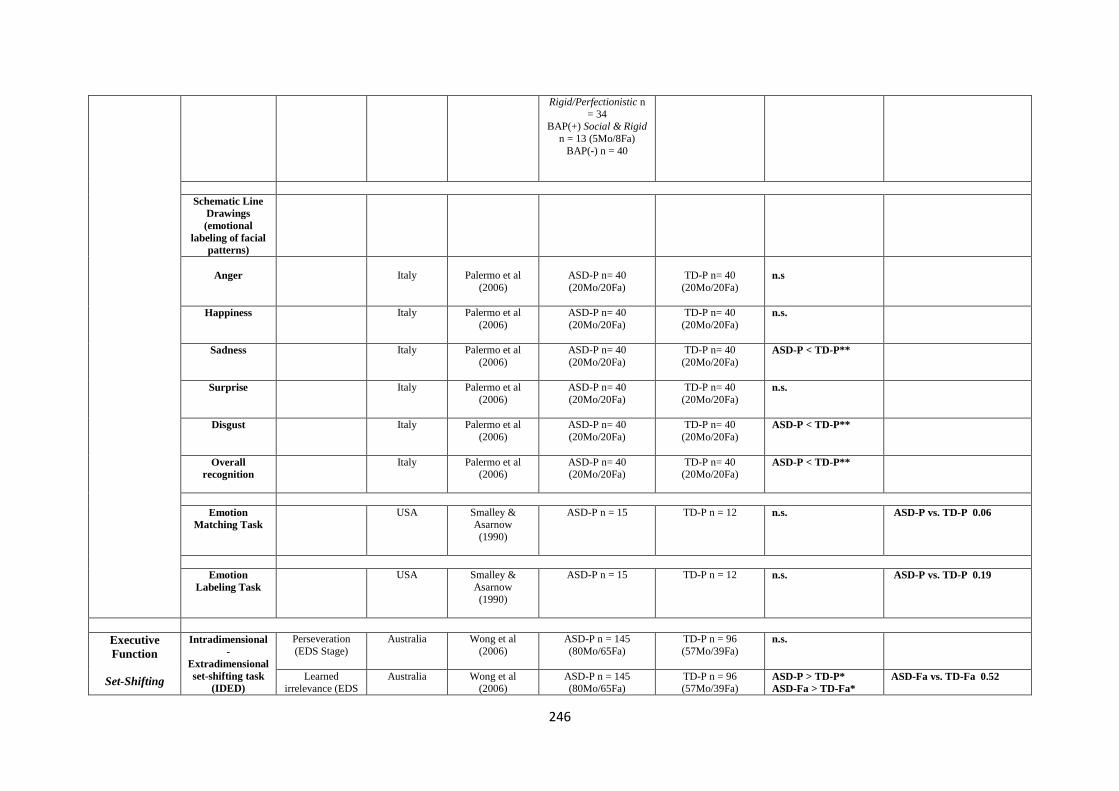
246
Rigid/Perfectionistic n
= 34 BAP(+) Social & Rigid
n = 13 (5Mo/8Fa)
BAP(-) n = 40
Schematic Line
Drawings
(emotional
labeling of facial
patterns)
Anger
Italy Palermo et al
(2006)
ASD-P n= 40
(20Mo/20Fa)
TD-P n= 40
(20Mo/20Fa) n.s
Happiness
Italy Palermo et al
(2006)
ASD-P n= 40
(20Mo/20Fa)
TD-P n= 40
(20Mo/20Fa)
n.s.
Sadness
Italy Palermo et al
(2006)
ASD-P n= 40
(20Mo/20Fa)
TD-P n= 40
(20Mo/20Fa)
ASD-P < TD-P**
Surprise
Italy Palermo et al
(2006)
ASD-P n= 40
(20Mo/20Fa)
TD-P n= 40
(20Mo/20Fa)
n.s.
Disgust
Italy Palermo et al
(2006)
ASD-P n= 40
(20Mo/20Fa)
TD-P n= 40
(20Mo/20Fa)
ASD-P < TD-P**
Overall
recognition
Italy Palermo et al
(2006)
ASD-P n= 40 (20Mo/20Fa)
TD-P n= 40 (20Mo/20Fa)
ASD-P < TD-P**
Emotion
Matching Task
USA Smalley & Asarnow
(1990)
ASD-P n = 15
TD-P n = 12
n.s.
ASD-P vs. TD-P 0.06
Emotion
Labeling Task
USA Smalley &
Asarnow
(1990)
ASD-P n = 15
TD-P n = 12
n.s.
ASD-P vs. TD-P 0.19
Executive
Function
Set-Shifting
Intradimensional
-
Extradimensional
set-shifting task
(IDED)
Perseveration
(EDS Stage)
Australia Wong et al
(2006)
ASD-P n = 145
(80Mo/65Fa)
TD-P n = 96
(57Mo/39Fa)
n.s.
Learned irrelevance (EDS
Australia Wong et al (2006)
ASD-P n = 145 (80Mo/65Fa)
TD-P n = 96 (57Mo/39Fa)
ASD-P > TD-P*
ASD-Fa > TD-Fa*
ASD-Fa vs. TD-Fa 0.52

247
Planning
Stage)
Trials to criterion (EDS Stage)
France Hughes et al (1997)
ASD-P n=40 (20Mo/20Fa)
LD-P n=40 (22Mo/18Fa)
UA n=36
(18M, 15F)
ASD-P > LD-P**
ASD-P > UA***
ASD-P vs. LD-P 0.69
ASD-P vs. UA 0.83
Errors to criterion
(EDS Stage)
France Hughes et al
(1997)
ASD-P n=40
(20Mo/20Fa)
LD-P n=40
(22Mo/18Fa) UA n=36
(18M, 15F)
ASD-P > LD-P*
ASD-P > UA**
ASD-P vs. LD-P 0.64
ASD-P vs. UA 0.70
Wisconsin Card
Sorting Test
(WCST)
Preservative
errors
Germany Bölte & Poustka
(2006)
ASD-P n=62
(33Mo/29Fa)
EOS-P n = 36
(20Mo/16Fa)
MR-P n = 30 (16Mo/14Fa)
n.s.
ASD-P vs. EOS-P 0.06
ASD-P vs. MR-P 0.18
Trail Making
Test (A & B)
Total time to complete
Germany Bölte & Poustka (2006)
ASD-P n=62 (33Mo/29Fa)
EOS-P n = 36 (20Mo/16Fa)
MR-P n = 30
(16Mo/14Fa)
n.s.
ASD-P vs. EOS-P 0.38
ASD-P vs. MR-P 0.13
USA Losh et al
(2009)
ASD-P n= 83
BAP(+) Social n = 22 BAP(+)
Rigid/Perfectionistic n
= 34 BAP(+) Social & Rigid
n = 13 (5Mo/8Fa)
BAP(-) n = 40
TD-P n = 32
(19Mo/13Fa)
n.s.
Tower of London
(ToL)
Number of extra
moves
France Hughes et al
(1997)
ASD-P n=40
(20Mo/20Fa)
LD-P n=40
(22Mo/18Fa) UA n=36
(18M, 15F)
ASD-P > UA*
ASD-P vs. LD-P 0.41
ASD-P vs. UA 0.93
Adjusted extra moves score
Australia Wong et al (2006)
ASD-P n = 145 (80Mo/65Fa)
TD-P n = 96 (57Mo/39Fa)
n.s.
ASD-P vs. TD-P 0.07
Rule violations
Australia Wong et al (2006) [62]
ASD-P n = 145 (80Mo/65Fa)
TD-P n = 96 (57Mo/39Fa)
n.s.
Solutions correct
France Hughes et al
(1997) [63]
ASD-P n=40
(20Mo/20Fa)
LD-P n=40
(22Mo/18Fa) UA n=36
ASD-P < UA***
ASD-P vs. LD-P 0.34
ASD-P vs. UA 0.93
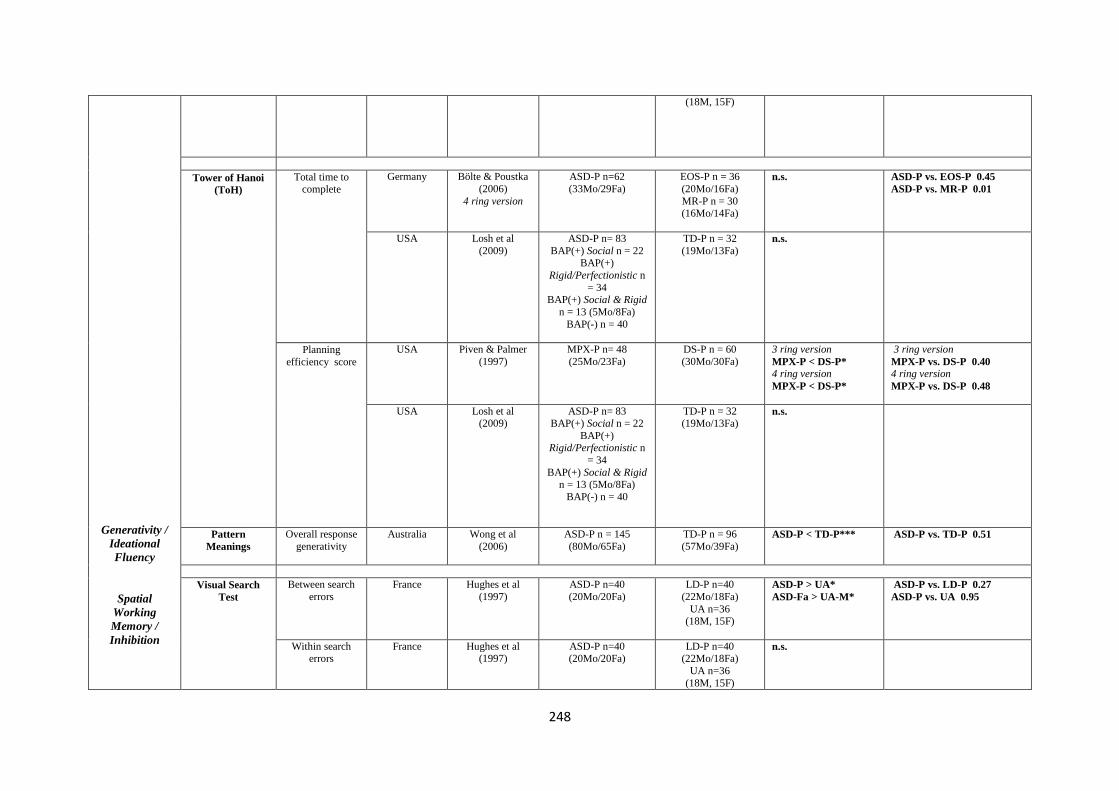
248
Generativity /
Ideational
Fluency
Spatial
Working
Memory /
Inhibition
(18M, 15F)
Tower of Hanoi
(ToH)
Total time to complete
Germany Bölte & Poustka
(2006)
4 ring version
ASD-P n=62
(33Mo/29Fa)
EOS-P n = 36
(20Mo/16Fa)
MR-P n = 30 (16Mo/14Fa)
n.s.
ASD-P vs. EOS-P 0.45
ASD-P vs. MR-P 0.01
USA Losh et al
(2009)
ASD-P n= 83
BAP(+) Social n = 22
BAP(+)
Rigid/Perfectionistic n
= 34 BAP(+) Social & Rigid
n = 13 (5Mo/8Fa)
BAP(-) n = 40
TD-P n = 32
(19Mo/13Fa)
n.s.
Planning
efficiency score
USA Piven & Palmer
(1997)
MPX-P n= 48
(25Mo/23Fa)
DS-P n = 60
(30Mo/30Fa)
3 ring version
MPX-P < DS-P*
4 ring version
MPX-P < DS-P*
3 ring version
MPX-P vs. DS-P 0.40
4 ring version
MPX-P vs. DS-P 0.48
USA Losh et al (2009)
ASD-P n= 83 BAP(+) Social n = 22
BAP(+) Rigid/Perfectionistic n
= 34
BAP(+) Social & Rigid n = 13 (5Mo/8Fa)
BAP(-) n = 40
TD-P n = 32 (19Mo/13Fa)
n.s.
Pattern
Meanings
Overall response
generativity
Australia
Wong et al
(2006)
ASD-P n = 145
(80Mo/65Fa)
TD-P n = 96
(57Mo/39Fa)
ASD-P < TD-P***
ASD-P vs. TD-P 0.51
Visual Search
Test
Between search
errors
France Hughes et al
(1997)
ASD-P n=40
(20Mo/20Fa)
LD-P n=40
(22Mo/18Fa)
UA n=36 (18M, 15F)
ASD-P > UA*
ASD-Fa > UA-M*
ASD-P vs. LD-P 0.27
ASD-P vs. UA 0.95
Within search errors
France Hughes et al (1997)
ASD-P n=40 (20Mo/20Fa)
LD-P n=40 (22Mo/18Fa)
UA n=36
(18M, 15F)
n.s.
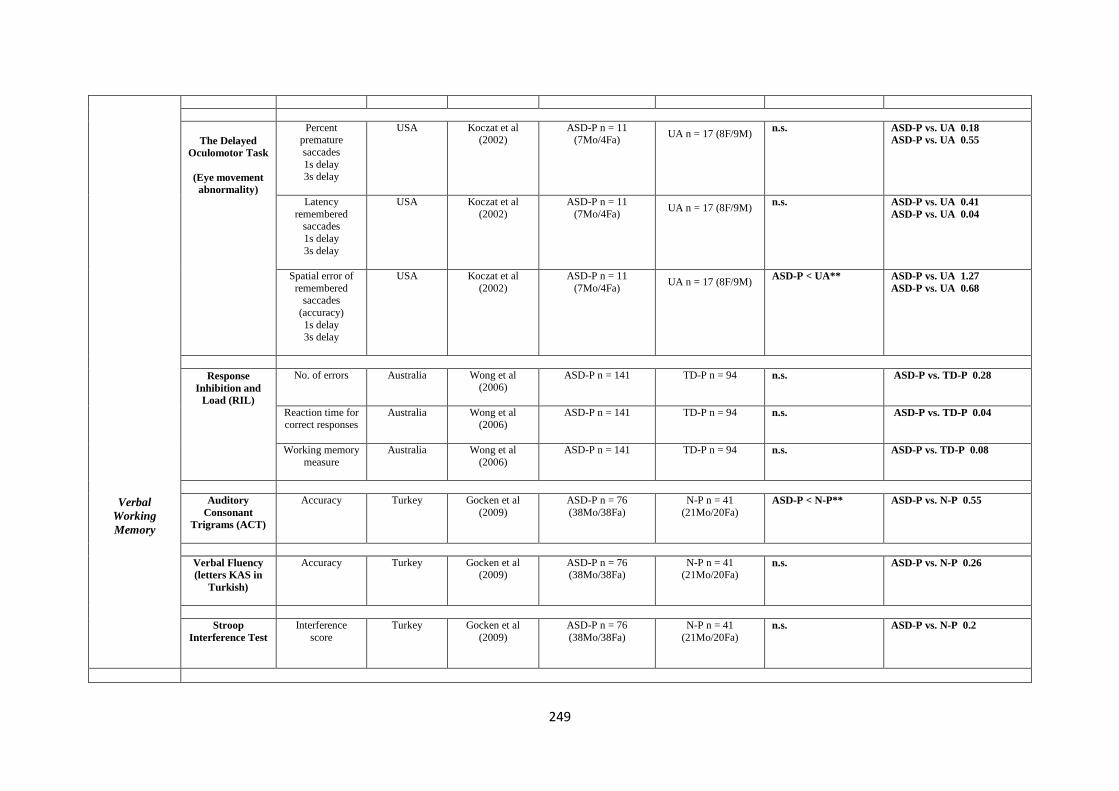
249
Verbal
Working
Memory
The Delayed
Oculomotor Task
(Eye movement
abnormality)
Percent premature
saccades
1s delay 3s delay
USA
Koczat et al (2002)
ASD-P n = 11 (7Mo/4Fa)
UA n = 17 (8F/9M)
n.s.
ASD-P vs. UA 0.18
ASD-P vs. UA 0.55
Latency
remembered saccades
1s delay
3s delay
USA Koczat et al
(2002)
ASD-P n = 11
(7Mo/4Fa)
UA n = 17 (8F/9M)
n.s.
ASD-P vs. UA 0.41
ASD-P vs. UA 0.04
Spatial error of
remembered saccades
(accuracy)
1s delay 3s delay
USA Koczat et al
(2002)
ASD-P n = 11
(7Mo/4Fa)
UA n = 17 (8F/9M)
ASD-P < UA**
ASD-P vs. UA 1.27
ASD-P vs. UA 0.68
Response
Inhibition and
Load (RIL)
No. of errors
Australia Wong et al (2006)
ASD-P n = 141
TD-P n = 94
n.s.
ASD-P vs. TD-P 0.28
Reaction time for correct responses
Australia Wong et al (2006)
ASD-P n = 141
TD-P n = 94
n.s.
ASD-P vs. TD-P 0.04
Working memory
measure
Australia Wong et al
(2006)
ASD-P n = 141
TD-P n = 94
n.s.
ASD-P vs. TD-P 0.08
Auditory
Consonant
Trigrams (ACT)
Accuracy
Turkey Gocken et al
(2009)
ASD-P n = 76
(38Mo/38Fa)
N-P n = 41
(21Mo/20Fa)
ASD-P < N-P**
ASD-P vs. N-P 0.55
Verbal Fluency
(letters KAS in
Turkish)
Accuracy
Turkey
Gocken et al (2009)
ASD-P n = 76 (38Mo/38Fa)
N-P n = 41 (21Mo/20Fa)
n.s.
ASD-P vs. N-P 0.26
Stroop
Interference Test
Interference
score
Turkey Gocken et al
(2009)
ASD-P n = 76
(38Mo/38Fa)
N-P n = 41
(21Mo/20Fa)
n.s.
ASD-P vs. N-P 0.2

250
Central
Coherence
(Local visual
processing)
Disembedding
Performance
Embedded
Figures Test
(EFT)
Reaction Time
UK Baron-Cohen &
Hammer (1997)
AS-P n = 30
(15Mo/15Fa)
TD-P n = 30
(15Mo/15Fa)
ASD-Fa > N-Fa**
ASD-Mo > N-Mo**
ASD-Fa vs. N-Fa 0.51
ASD-Mo vs. N-Fa 0.68
Germany Bölte & Poustka
(2006)
ASD-P n=62
(33Mo/29Fa)
EOS-P n = 36
(20Mo/16Fa) MR-P n = 30
(16Mo/14Fa)
ASD-P > EOS-P***
ASD-P > MR-P*
ASD-P vs. EOS-P 1.60
ASD-P vs. MR-P 0.79
Netherlands de Jonge et al
(2006)
MPX-P n=51
(26Mo/25Fa)
DS-P n = 54
(28Fa/26Mo)
n.s.
MPX-P vs. DS-P 0.01
MPX-Fa vs. DS-Fa 0.04
MPX-Mo vs. DS-Mo 0.09
UK Happé et al
(2001)
ASD-P n = 43
(21Mo/22Fa)
DLX-P n = 30
(15Mo/15Fa)
TD-P n = 20 (10Mo/10Fa)
ASD-Fa > DLX-Fa**
ASD-Fa > TD-Fa**
ASD-Mo vs. DLX-Mo 0.54
ASD-Mo vs. TD-Mo 0.64
ASD-Fa vs. DLX-Fa 1.11
ASD-Fa vs. TD-Fa 1.09
USA Losh et al (2009)
ASD-P n= 83 BAP(+) Social n = 22
BAP(+)
Rigid/Perfectionistic n = 34
BAP(+) Social & Rigid
n = 13 (5Mo/8Fa) BAP(-) n = 40
TD-P n = 32 (19Mo/13Fa)
n.s.
Accuracy
Netherlands de Jonge et al (2006)
MPX-P n=51 (26Mo/25Fa)
DS-P n = 54 (28Fa/26Mo)
n.s.
MPX-P vs. DS-P 0.16
MPX-Fa vs. DS-Fa 0.21
MPX-Mo vs. DS-Mo 0.11
UK Happé et al (2001)
ASD-P n = 43 (21Mo/22Fa)
DLX-P n = 30 (15Mo/15Fa)
TD-P n = 20
(10Mo/10Fa)
n.s.
ASD-Mo vs. DLX-Mo 0.26
ASD-Mo vs. TD-Mo 0.77
ASD-Fa vs. DLX-Fa 0.17
ASD-Fa vs. TD-Fa 0.31
USA
Losh et al
(2009)
ASD-P n= 83
BAP(+) Social n = 22 BAP(+)
Rigid/Perfectionistic n
= 34
BAP(+) Social & Rigid
n = 13 (5Mo/8Fa)
BAP(-) n = 40
TD-P n = 32
(19Mo/13Fa)
n.s.
No. of incorrect
responses
Netherlands de Jonge et al
(2006)
MPX-P n=51
(26Mo/25Fa)
DS-P n = 54
(28Fa/26Mo)
ASD-Fa < DS-Fa*
MPX-P vs. DS-P 0.32
MPX-Fa vs. DS-Fa 0.52
MPX-Mo vs. DS-Mo 0.18
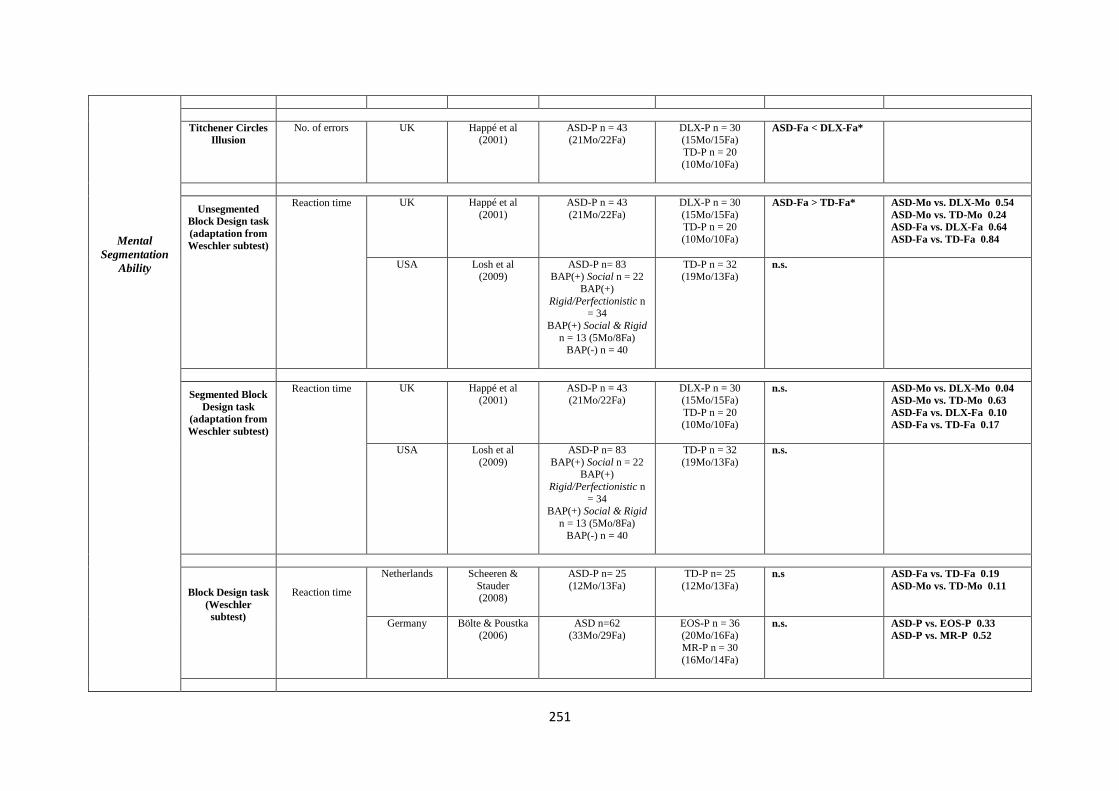
251
Mental
Segmentation
Ability
Titchener Circles
Illusion
No. of errors
UK Happé et al (2001)
ASD-P n = 43 (21Mo/22Fa)
DLX-P n = 30 (15Mo/15Fa)
TD-P n = 20
(10Mo/10Fa)
ASD-Fa < DLX-Fa*
Unsegmented
Block Design task
(adaptation from
Weschler subtest)
Reaction time
UK Happé et al
(2001)
ASD-P n = 43
(21Mo/22Fa)
DLX-P n = 30
(15Mo/15Fa) TD-P n = 20
(10Mo/10Fa)
ASD-Fa > TD-Fa*
ASD-Mo vs. DLX-Mo 0.54
ASD-Mo vs. TD-Mo 0.24
ASD-Fa vs. DLX-Fa 0.64
ASD-Fa vs. TD-Fa 0.84
USA Losh et al (2009)
ASD-P n= 83 BAP(+) Social n = 22
BAP(+)
Rigid/Perfectionistic n = 34
BAP(+) Social & Rigid
n = 13 (5Mo/8Fa) BAP(-) n = 40
TD-P n = 32 (19Mo/13Fa)
n.s.
Segmented Block
Design task
(adaptation from
Weschler subtest)
Reaction time
UK Happé et al (2001)
ASD-P n = 43 (21Mo/22Fa)
DLX-P n = 30 (15Mo/15Fa)
TD-P n = 20 (10Mo/10Fa)
n.s.
ASD-Mo vs. DLX-Mo 0.04
ASD-Mo vs. TD-Mo 0.63
ASD-Fa vs. DLX-Fa 0.10
ASD-Fa vs. TD-Fa 0.17
USA Losh et al
(2009)
ASD-P n= 83
BAP(+) Social n = 22 BAP(+)
Rigid/Perfectionistic n
= 34 BAP(+) Social & Rigid
n = 13 (5Mo/8Fa)
BAP(-) n = 40
TD-P n = 32
(19Mo/13Fa)
n.s.
Block Design task
(Weschler
subtest)
Reaction time
Netherlands
Scheeren &
Stauder (2008)
ASD-P n= 25
(12Mo/13Fa)
TD-P n= 25
(12Mo/13Fa) n.s ASD-Fa vs. TD-Fa 0.19
ASD-Mo vs. TD-Mo 0.11
Germany Bölte & Poustka (2006)
ASD n=62 (33Mo/29Fa)
EOS-P n = 36 (20Mo/16Fa)
MR-P n = 30
(16Mo/14Fa)
n.s.
ASD-P vs. EOS-P 0.33
ASD-P vs. MR-P 0.52

252
Attentional
Engagement
Global
Sentence
Completions
Block design
reconstruction
task (patterns by
Akshoomoff &
Stiles)
Accuracy
Netherlands de Jonge et al
(2009)
MPX-P n = 51
(26Mo/25Fa)
DS-P n = 57
(28Mo/29Fa)
n.s.
MPX-P vs. DS-P 0.16
Reconstruction
time
Netherlands de Jonge et al
(2009)
MPX-P n = 51
(26Mo/25Fa)
DS-P n = 57
(28Mo/29Fa)
n.s.
Mean no. of
errors
Netherlands de Jonge et al
(2009)
MPX-P n = 51
(26Mo/25Fa)
DS-P n = 57
(28Mo/29Fa)
n.s.
MPX-P vs. DS-P 0.10
Detection Task
(Reaction time
task)
Eyes task (social)
Netherlands Scheeren &
Stauder
(2008)
ASD-P n= 25
(12Mo/13Fa)
TD-P n= 25
(12Mo/13Fa) ASD-Fa > TD-Fa*
Arrows task
(non-social)
Netherlands Scheeren &
Stauder
(2008)
ASD-P n= 25
(12Mo/13Fa)
TD-P n= 25
(12Mo/13Fa) n.s
Sentence
Completion task
Errors (local
completions) and
long delays
UK Happé et al
(2001)
ASD-P n = 43
(21Mo/22Fa)
DLX-P n = 30
(15Mo/15Fa)
TD-P n = 20 (10Mo/10Fa)
ASD-P > DLX-P >
TD-P***
ASD-Fa > DLX –
Fa***
ASD-Fa > TD-Fa***
ASD-Mo > DLX-Mo**
ASD-Mo >TD-Mo**
Frequency of
errors (no. of
global responses)
USA Losh et al
(2009)
ASD-P n= 83
BAP(+) Social n = 22
BAP(+) Rigid/Perfectionistic n
= 34
BAP(+) Social & Rigid n = 13 (5Mo/8Fa)
BAP(-) n = 40
TD-P n = 32
(19Mo/13Fa)
ASD-P > TD-P**
Response time
USA Losh et al
(2009)
ASD-P n= 83
BAP(+) Social n = 22
BAP(+) Rigid/Perfectionistic n
= 34
BAP(+) Social & Rigid n = 13 (5Mo/8Fa)
BAP(-) n = 40
TD-P n = 32
(19Mo/13Fa)
ASD-P > TD-P*
BAP(+)
Rigid/Perfectionistic <
TD-P**
BAP(-) < TD-P*
Visual Vistech contrast
sensitivity charts
Mean contrast
sensitivity
Netherlands de Jonge et al
(2007)
MPX-P n = 51
(26Mo/25Fa)
DS-P n = 52
(25Fa/27Mo) n.s.
MPX-P vs. DS-P 0.55

253
Processing
Contrast
Sensitivity
Motion
Discrimination
Form
Discrimination
threshold
Motion
Coherence Task
Mean motion
coherence threshold
Netherlands de Jonge et al
(2007)
MPX-P n = 51
(26Mo/25Fa)
DS-P n = 52
(25Fa/27Mo)
n.s.
MPX-P vs. DS-P 0.25
Moving Shape
Task
Reaction time
Netherlands de Jonge et al
(2007)
MPX-P n = 51
(26Mo/25Fa)
DS-P n = 52
(25Fa/27Mo)
n.s.
MPX-P vs. DS-P 0.17
Form
Discrimination
(Shape) Task
Reaction Time
Netherlands de Jonge et al (2007)
MPX-P n = 51 (26Mo/25Fa)
DS-P n = 52 (25Fa/27Mo)
n.s.
MPX-P vs. DS-P 0.05
Note. ASD = Autism Spectrum Disorder; BAP = Broad Autism Phenotype; BAP(+) = BAP present; BAP (-) = BAP absent; P = Parent; Mo = Mother; Fa = Father; M = Male; F = Female; MPX = Multiple incidence
autism families; SPX = Single incidence autism families; ALN = Autism without language impairment; ALI =Autism with language impairment; DLX = Dyslexia; DS = Down Syndrome; EOS = Early onset
Schizophrenia; LBW = low birth weight; LD = learning difficulties; N = Normative sample; MR = Mental Retardation; Sch SPX = single incidence Schizophrenia families; Sch MPX = multiple incidence
Schizophrenia families; SLI = Specific Language Impairment; TD = typically developing; UA = Unaffected adult.
*p<0.05; **p<0.01; ***p<0.001

254
Appendix 4: Other Psychiatric Conditions Endophenotype Matrix – Review of studies of parents of autistic probands.
Domain Method /
Measure
Factors /
Subscales
Country Study ASD Parent
Group
Characteristics
Control
Group
Characteristics
Key Findings in relation to
Proband Diagnosis
P value Effect Size (d)
Other
Psychiatric
Conditions
Brief
Psychiatric
Rating Scale
(BPRS)
Anxiety
Iran Gocken et al
(2009)
ASD-P n = 76
(38Mo/38Fa)
N-P n = 41
(21Mo/20Fa) n.s.
ASD-P vs. N-P 0.29
Depression
Iran Gocken et al
(2009)
ASD-P n = 76
(38Mo/38Fa)
N-P n = 41
(21Mo/20Fa)
ASD-P > N-P*
ASD-P vs. N-P 0.44
Personality
Style and
Disorder
Inventory
(PSSI)
Reserved/schizoid
Germany
Bölte et al (2007)
ASD SPX-P n = 87 (48Mo/39Fa)
ASD MPX-P n = 38
(21Mo/17Fa)
OCD-P n = 37 (19Mo/18Fa)
EOS-P n = 34
(20Mo/14Fa) MR-P n = 27
(15Mo/12Fa)
SPX-P / MPX-P >
OCD-P, EOS-P**
MPX-P vs. OCD-P
1.07
MPX-P vs. EOS-P
1.09
MPX-P vs. MR-P 0.14
SPX-P vs. OCD-p 1.06
SPX-P vs. EOS-P 1.18
SPX-P vs. MR-P 0.15
Self-critical/insecure
Germany
Bölte et al (2007)
ASD SPX-P n = 87 (48Mo/39Fa)
ASD MPX-P n = 38
(21Mo/17Fa)
OCD-P n = 37 (19Mo/18Fa)
EOS-P n = 34
(20Mo/14Fa) MR-P n = 27
(15Mo/12Fa)
ASD SPX-P /ASD
MPX-P > EOS-P**
MPX-P vs. OCD-P
0.31
MPX-P vs. EOS-P
1.15
MPX-P vs. MR-P 0.32
SPX-P vs. OCD-p 0.02
SPX-P vs. EOS-P 0.86
SPX-P vs. MR-P 0.02
Critical/negativistic
Germany
Bölte et al
(2007)
ASD SPX-P n = 87
(48Mo/39Fa) ASD MPX-P n = 38
(21Mo/17Fa)
OCD-P n = 37
(19Mo/18Fa) EOS-P n = 34
(20Mo/14Fa)
MR-P n = 27 (15Mo/12Fa)
SPX-P /MPX-P >
EOS-P**
MPX-P vs. OCD-P
0.29
MPX-P vs. EOS-P
0.92
MPX-P vs. MR-P 0.03
SPX-P vs. OCD-p 0.17
SPX-P vs. EOS-P 0.74
SPX-P vs. MR-P 0.06
Spontaneous/borderline
Germany Bölte et al
(2007)
ASD SPX-P n = 87
(48Mo/39Fa) ASD MPX-P n = 38
(21Mo/17Fa)
OCD-P n = 37
(19Mo/18Fa) EOS-P n = 34
(20Mo/14Fa)
MR-P n = 27
MPX-P > EOS-P**
MPX-P vs. OCD-P
0.18
MPX-P vs. EOS-P
0.25
MPX-P vs. MR-P 0.09

255
(15Mo/12Fa)
SPX-P vs. OCD-p 0.39
SPX-P vs. EOS-P 0.72
SPX-P vs. MR-P 0.04
Quiet/depressive
Germany
Bölte et al (2007)
ASD SPX-P n = 87 (48Mo/39Fa)
ASD MPX-P n = 38
(21Mo/17Fa)
OCD-P n = 37
(19Mo/18Fa)
EOS-P n = 34 (20Mo/14Fa)
MR-P n = 27
(15Mo/12Fa)
SPX-P /MPX-P >
EOS-P**
MPX-P vs. OCD-P
0.53
MPX-P vs. EOS-P
1.03
MPX-P vs. MR-P 0.31
SPX-P vs. OCD-p 0.35
SPX-P vs. EOS-P 0.87
SPX-P vs. MR-P 0.16
Symptom
Checklist-90-
Revised
(SCL-90-R)
Depression
Germany
Bölte et al
(2007)
ASD SPX-P n = 87
(48Mo/39Fa) ASD MPX-P n = 38
(21Mo/17Fa)
OCD-P n = 37
(19Mo/18Fa) EOS-P n = 34
(20Mo/14Fa)
MR-P n = 27 (15Mo/12Fa)
MPX-P > OCD-P,
EOS-P**
MPX-P vs. OCD-P
0.89
MPX-P vs. EOS-P
1.06
MPX-P vs. MR-P 0.66
SPX-P vs. OCD-p 0.42
SPX-P vs. EOS-P 0.57
SPX-P vs. MR-P 0.15
Anxiety
Germany
Bölte et al (2007)
ASD SPX-P n = 87 (48Mo/39Fa)
ASD MPX-P n = 38
(21Mo/17Fa)
OCD-P n = 37 (19Mo/18Fa)
EOS-P n = 34
(20Mo/14Fa) MR-P n = 27
(15Mo/12Fa)
n.s.
MPX-P vs. OCD-P
0.17
MPX-P vs. EOS-P
0.92
MPX-P vs. MR-P 0.29
SPX-P vs. OCD-p 0.01
SPX-P vs. EOS-P 0.66
SPX-P vs. MR-P 0.10
Phobic-anxiety
Germany
Bölte et al (2007)
ASD SPX-P n = 87 (48Mo/39Fa)
ASD MPX-P n = 38
(21Mo/17Fa)
OCD-P n = 37 (19Mo/18Fa)
EOS-P n = 34
(20Mo/14Fa) MR-P n = 27
(15Mo/12Fa)
SPX-P / MPX-P >
OCD-P, EOS-P**
MPX-P vs. OCD-P
0.25
MPX-P vs. EOS-P
1.33
MPX-P vs. MR-P 0.45
SPX-P vs. OCD-p 0
SPX-P vs. EOS-P 0.91
SPX-P vs. MR-P 0.19
Paranoid ideation
Germany Bölte et al
(2007)
ASD SPX-P n = 87
(48Mo/39Fa)
ASD MPX-P n = 38 (21Mo/17Fa)
OCD-P n = 37
(19Mo/18Fa)
EOS-P n = 34 (20Mo/14Fa)
MR-P n = 27
(15Mo/12Fa)
MPX-P > EOS-P**
MPX-P vs. OCD-P
0.44
MPX-P vs. EOS-P
0.93
MPX-P vs. MR-P 0.57
SPX-P vs. OCD-p 0.19
SPX-P vs. EOS-P 0.65

256
SPX-P vs. MR-P 0.29
Schedule for
Affective
Disorders and
Schizophrenia -
Lifetime
Version
(SADS-L)
Anxiety
USA Piven et al
(1991)
ASD-P n = 81
(42Mo/39Fa)
DS-P n = 34
(18Mo/16Fa)
ASD-P > DS-P*
Major Depressive
Disorder
USA Piven et al
(1991)
ASD-P n = 81
(42Mo/39Fa)
DS-P n = 34
(18Mo/16Fa)
n.s
Schedule for
Affective
Disorders and
Schizophrenia -
Lifetime
Version
Modified for
the Study of
Anxiety
Disorders,
Revised
(SADS-LA-R)
Major Depressive
Disorder
USA Piven & Palmer
(1999)
MPX-P n= 48
(25Mo/23Fa)
DS-P n = 60
(30Mo/30Fa)
ASD-P > DS-P**
Social phobia
USA
Piven & Palmer (1999)
MPX-P n= 48 (25Mo/23Fa)
DS-P n = 60 (30Mo/30Fa)
ASD-P > DS-P*
Parental
Questionnaire
(Devised by
Author and
results
validated by
consented
medical records
from GP)
Depression
UK Micali et al
(2004)
ASD-P n = 152
(79Mo/73Fa)
ODP-P n = 114
(59Mo/55Fa)
ASD-Mo > ODP-Mo*
Anxiety
UK Micali et al
(2004)
ASD-P n = 152
(79Mo/73Fa)
ODP-P n = 114
(59Mo/55Fa)
ASD-Mo > ODP-
Mo***
The Centre for
Epidemiological
Studies –
Depression
Scales (CESD)
Depressed Mood
USA Ingersoll et al
(2011)
ASD-Mo n = 71
(Only Mo)
N-Mo n = 94 (Only
Mo)
ASD-Mo > N-Mo*
ASD-Mo vs. N-Mo
0.35
Beck
Depression
Inventory (BDI)
Depression
UK Berthoz et al (2013)
ASD-P n = 87 (28%Fa)
UA n = 47 (62%M)
n.s.
ASD-P vs. UA 0.50

257
State-Trait
Anxiety
Inventory Form
Y (STAI-Y)
State scale
(STAI-S)
Trait scale (STAI-T)
Anxiety (State portion)
UK
Berthoz et al
(2013)
ASD-P n = 87
(28%Fa)
UA n = 47
(62%M)
n.s.
ASD-P vs. UA 0.19
Anxiety (Trait portion)
UK Berthoz et al
(2013)
ASD-P n = 87 (28%Fa)
UA n = 47 (62%M)
n.s.
ASD-P vs. UA 1.24
Note. ASD = Autism Spectrum Disorder; BAP = Broad Autism Phenotype; BAP(+) = BAP present; BAP (-) = BAP absent; P = Parent; Mo = Mother; Fa = Father; M = Male; F = Female; MPX = Multiple incidence
autism families; SPX = Single incidence autism families; DS = Down Syndrome; EOS = Early onset Schizophrenia; MR = Mental Retardation; N = Normative sample; OCD = Obsessive Compulsive Disorder; ODP =
Other developmental problems without autism; UA = Unaffected adult.
*p<0.05; **p<0.01; ***p<0.001

258
Appendix 5 - DSM-5 Checklist for ASD

259
Appendix 6: Socio-demographic Questionnaire
MUHIMBILI AUTISM 2016
SOCIO-DEMOGRAPHY, BIRTH AND MEDICAL HISTORY
FOR UNDER 18 YEARS
Personal Details
Today‘s Date: (dd/mm/yyyy) [__]__]/[__]__]/[__]__]__]__](TDATE)
AS Number: [_A_]_S_]__]__]__ [__](AS NO)
PID NO: [ ][ ][ ][ ][ ][ ][ ](PID)
Name: __________________________________________________________________________
RESID: [__[__]__]__]__]__](RESID)
DOB: [__]__]/[__]__]/[__]__]__]__](DOB)
Age: [__][__](AGE)
Sex: [__](SEX)
Does s/he attend school: [__](SCH)
Mother/ Guardian‘s Name: ______________________________________________
(GDNAME)
Who will answer questions about the index? [__](RESP)
1. Self 5. Index‘s grandmother
2. Self and other 6. Index‘s sibling
3. The Index‘s mother 7. Another relative
4. The Index‘s father 8. Other.
Is the informant one who mainly takes care of the Index? (Y/N) [__](INFCT)
Interviewer:
Has the communication sheet been read to the respondent? (Y/N) ……………….
[__](COM_SHT)
Has the respondent consented to participate in the study? (Y/N)…………………
[__](CONSENT)
If NO consent is given, what reasons are given for the decline?
1…………………………………………………………………………
(REAS_NOC1)
2…………………………………………………………………………
(REAS_NOC2)
3…………………………………………………………………………
(REAS_NOC3)
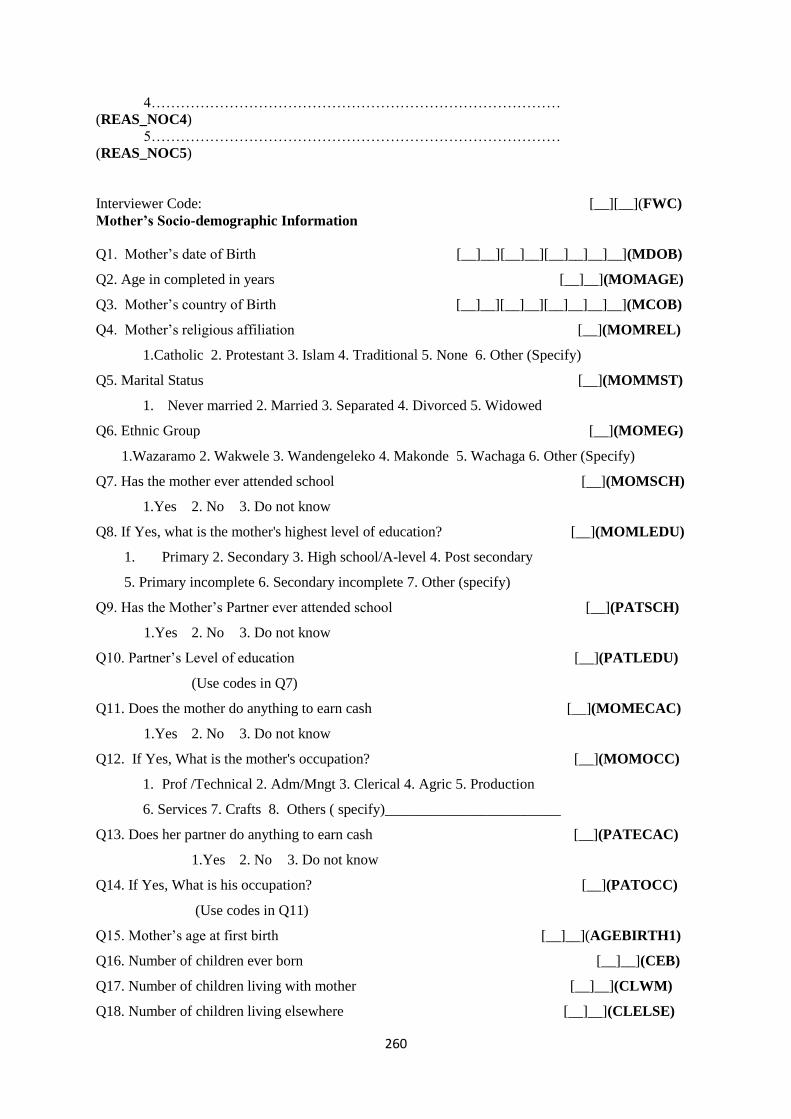
260
4…………………………………………………………………………
(REAS_NOC4)
5…………………………………………………………………………
(REAS_NOC5)
Interviewer Code: [__][__](FWC)
Mother’s Socio-demographic Information
Q1. Mother‘s date of Birth [__]__][__]__][__]__]__]__](MDOB)
Q2. Age in completed in years [__]__](MOMAGE)
Q3. Mother‘s country of Birth [__]__][__]__][__]__]__]__](MCOB)
Q4. Mother‘s religious affiliation [__](MOMREL)
1.Catholic 2. Protestant 3. Islam 4. Traditional 5. None 6. Other (Specify)
Q5. Marital Status [__](MOMMST)
1. Never married 2. Married 3. Separated 4. Divorced 5. Widowed
Q6. Ethnic Group [__](MOMEG)
1.Wazaramo 2. Wakwele 3. Wandengeleko 4. Makonde 5. Wachaga 6. Other (Specify)
Q7. Has the mother ever attended school [__](MOMSCH)
1.Yes 2. No 3. Do not know
Q8. If Yes, what is the mother's highest level of education? [__](MOMLEDU)
1. Primary 2. Secondary 3. High school/A-level 4. Post secondary
5. Primary incomplete 6. Secondary incomplete 7. Other (specify)
Q9. Has the Mother‘s Partner ever attended school [__](PATSCH)
1.Yes 2. No 3. Do not know
Q10. Partner‘s Level of education [__](PATLEDU)
(Use codes in Q7)
Q11. Does the mother do anything to earn cash [__](MOMECAC)
1.Yes 2. No 3. Do not know
Q12. If Yes, What is the mother's occupation? [__](MOMOCC)
1. Prof /Technical 2. Adm/Mngt 3. Clerical 4. Agric 5. Production
6. Services 7. Crafts 8. Others ( specify)________________________
Q13. Does her partner do anything to earn cash [__](PATECAC)
1.Yes 2. No 3. Do not know
Q14. If Yes, What is his occupation? [__](PATOCC)
(Use codes in Q11)
Q15. Mother‘s age at first birth [__]__](AGEBIRTH1)
Q16. Number of children ever born [__]__](CEB)
Q17. Number of children living with mother [__]__](CLWM)
Q18. Number of children living elsewhere [__]__](CLELSE)
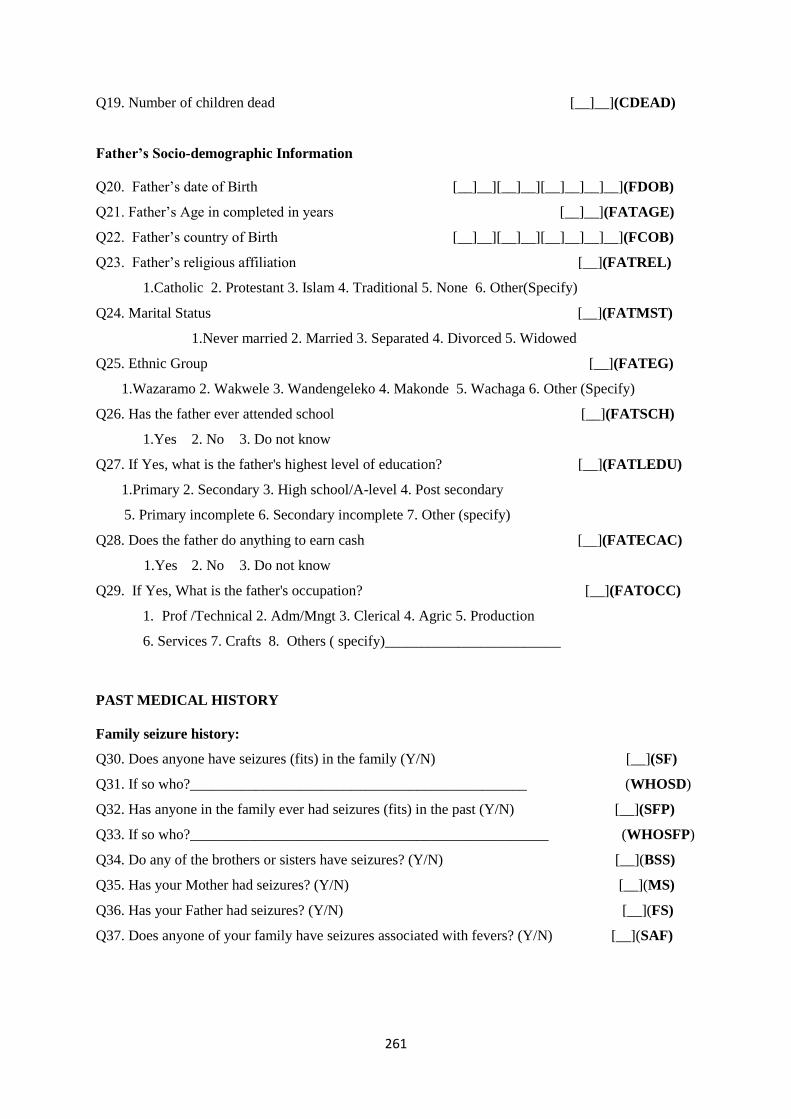
261
Q19. Number of children dead [__]__](CDEAD)
Father’s Socio-demographic Information
Q20. Father‘s date of Birth [__]__][__]__][__]__]__]__](FDOB)
Q21. Father‘s Age in completed in years [__]__](FATAGE)
Q22. Father‘s country of Birth [__]__][__]__][__]__]__]__](FCOB)
Q23. Father‘s religious affiliation [__](FATREL)
1.Catholic 2. Protestant 3. Islam 4. Traditional 5. None 6. Other(Specify)
Q24. Marital Status [__](FATMST)
1.Never married 2. Married 3. Separated 4. Divorced 5. Widowed
Q25. Ethnic Group [__](FATEG)
1.Wazaramo 2. Wakwele 3. Wandengeleko 4. Makonde 5. Wachaga 6. Other (Specify)
Q26. Has the father ever attended school [__](FATSCH)
1.Yes 2. No 3. Do not know
Q27. If Yes, what is the father's highest level of education? [__](FATLEDU)
1.Primary 2. Secondary 3. High school/A-level 4. Post secondary
5. Primary incomplete 6. Secondary incomplete 7. Other (specify)
Q28. Does the father do anything to earn cash [__](FATECAC)
1.Yes 2. No 3. Do not know
Q29. If Yes, What is the father's occupation? [__](FATOCC)
1. Prof /Technical 2. Adm/Mngt 3. Clerical 4. Agric 5. Production
6. Services 7. Crafts 8. Others ( specify)________________________
PAST MEDICAL HISTORY
Family seizure history:
Q30. Does anyone have seizures (fits) in the family (Y/N) [__](SF)
Q31. If so who?______________________________________________ (WHOSD)
Q32. Has anyone in the family ever had seizures (fits) in the past (Y/N) [__](SFP)
Q33. If so who?_________________________________________________ (WHOSFP)
Q34. Do any of the brothers or sisters have seizures? (Y/N) [__](BSS)
Q35. Has your Mother had seizures? (Y/N) [__](MS)
Q36. Has your Father had seizures? (Y/N) [__](FS)
Q37. Does anyone of your family have seizures associated with fevers? (Y/N) [__](SAF)
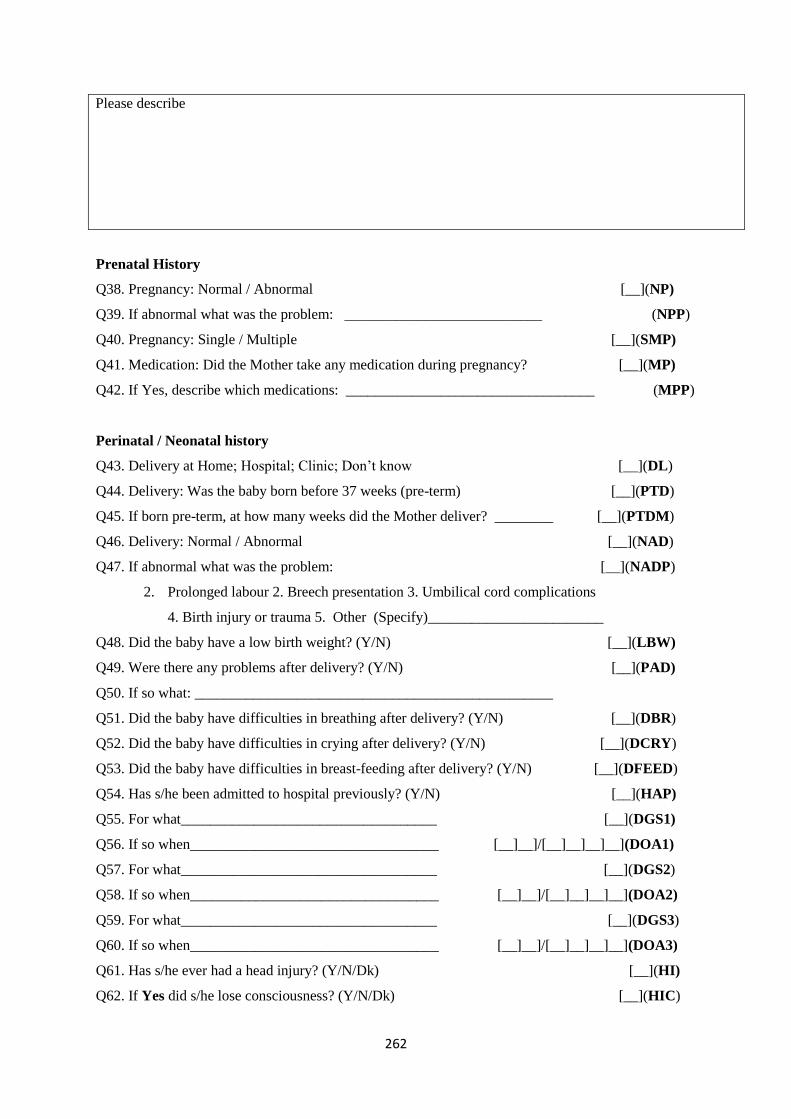
262
Please describe
Prenatal History
Q38. Pregnancy: Normal / Abnormal [__](NP)
Q39. If abnormal what was the problem: ___________________________ (NPP)
Q40. Pregnancy: Single / Multiple [__](SMP)
Q41. Medication: Did the Mother take any medication during pregnancy? [__](MP)
Q42. If Yes, describe which medications: __________________________________ (MPP)
Perinatal / Neonatal history
Q43. Delivery at Home; Hospital; Clinic; Don‘t know [__](DL)
Q44. Delivery: Was the baby born before 37 weeks (pre-term) [__](PTD)
Q45. If born pre-term, at how many weeks did the Mother deliver? ________ [__](PTDM)
Q46. Delivery: Normal / Abnormal [__](NAD)
Q47. If abnormal what was the problem: [__](NADP)
2. Prolonged labour 2. Breech presentation 3. Umbilical cord complications
4. Birth injury or trauma 5. Other (Specify)________________________
Q48. Did the baby have a low birth weight? (Y/N) [__](LBW)
Q49. Were there any problems after delivery? (Y/N) [__](PAD)
Q50. If so what: _________________________________________________
Q51. Did the baby have difficulties in breathing after delivery? (Y/N) [__](DBR)
Q52. Did the baby have difficulties in crying after delivery? (Y/N) [__](DCRY)
Q53. Did the baby have difficulties in breast-feeding after delivery? (Y/N) [__](DFEED)
Q54. Has s/he been admitted to hospital previously? (Y/N) [__](HAP)
Q55. For what___________________________________ [__](DGS1)
Q56. If so when__________________________________ [__]__]/[__]__]__]__](DOA1)
Q57. For what___________________________________ [__](DGS2)
Q58. If so when__________________________________ [__]__]/[__]__]__]__](DOA2)
Q59. For what___________________________________ [__](DGS3)
Q60. If so when__________________________________ [__]__]/[__]__]__]__](DOA3)
Q61. Has s/he ever had a head injury? (Y/N/Dk) [__](HI)
Q62. If Yes did s/he lose consciousness? (Y/N/Dk) [__](HIC)

263
Q63. Was s/he admitted to hospital? (Y/N/Dk) [__](HIA)
Q64. Other relevant history? (Y/N) [__](ORH)
Please describe
Q65. Birth weight [__|__].[__](BW)
Q66. Birth weight at first visit to Clinic [__|__].[__](BWC)
Q67. Completed immunization(Y/N) [__](CIM)
Q68. How long have you lived in Dar es Salaam? (Years) ______________________ (KDURY)
Sign if you have checked that the form is complete_____________________________

264
Appendix 7: Kiswahili version of the Social Communication Questionnaire (SCQ)
MUHIMBILI AUTISM 2016
SOCIAL COMMUNICATION QUESTIONNAIRE (SCQ)
Personal Details
Today‘s Date: (dd/mm/yyyy) [__]__]/[__]__]/[__]__]__]__](TDATE) AS Number: [_A_]_S_]__]__]__[__](AS NO) PID NO: [ ][ ][ ][ ][ ][ ][ ](PID) Name: ______________________________________________________________________________ RESID: [__]__]__]__]__](RESID) DOB: [__]__]/[__]__]/[__]__]__]__](DOB) Age: [__][__](AGE) Sex: [__](SEX)
Interviewer Code: [__][__](FWC) Section A:
1. Kwa maoni yako ni magumu gani mwanao anayo? (Ni muhimu umsisitize mama kuwa tunataka zaidi
kuelewa magumu ya kukua na kuendelea kwa mtoto)
2. Sasa nataka tuongee juu ya mwanao alipokuwa na umri wa miaka 4 hadi 5. Kwa maoni yako ni
magumu gani mwanao alikuwa nayo wakati huo? (Ni muhimu umsisitize mama kuwa tunataka zaidi
kuelewa magumu ya kukua na kuendelea kwa mtoto
1. Je kwa sasa anaweza kuongea akitumia maneno au sentensi fupi? K.m Nipe
maji
Ikiwa hapana ruka mpaka swali la 8
Y N
2. Je unaweza kuwa na mazungumzo ya kueleweka kati yako na yeye?
0 1
3. Je amewahi kutumia maneno yasiyo ya kawaida au kusema kitu hicho hicho
tena na tena kwa namna hiyohiyo ( au kwa maneno ambayo ameyasikia kwa
watu wengine wakiyatumia au ametunga)?
1 0
4. Je amewahi kuuliza maswali ambayo ni ya aibu au ambayo hayafai kijamii?
Kwa mfano wewe umekojoa kitandani leo ?
1 0

265
5. Je amewahi kuchanganya maneno k.m kusema yeye au wewe akimaanisha
mimi?
1 0
6. Je amewahi kutumia maneno aliyotunga mwenyewe au kuongea
kimafumbo k.m. kusema tochi ya Mungu kumaanisha mwezi?
1 0
7. Je amewahi kusema kitu kimoja kwa kurudia rudia au
kukuhimiza/kukusisitiza useme hivyo tena na tena k.m Nenda nenda, njoo
njoo?
1 0
a) Kuna swali lolote ambalo hukulielewa
b) Kuna swali lolote ambalo ungeliuliza kwa njia nyingine
c) For every question with a YES please ask the mother to explain and give examples
d) For the bolded questions please ask the mother to explain in her own word ‗
alilielewaje swali hili‘
8. Je amewahi kuwa na vitu ambavyo anaonekana akivifanya katika mpangilio
Fulani au njia fulani au mazoea Fulani alilosisitiza ulipitie? K.m mazoea ya
kupitia mahali Fulani kwenye nyumba au kuzoea kuketi katika kiti hicho
hicho kila wakati?
1 0
9. Je hali yake ya uso huonyesha hali vile ilivyo? K.m huzuni, kama ana
huzuni?
0 1
10. Je amewahi kutumia mkono wako kama kifaa/ chombo au kama ni sehemu
ya mwili wake (kwa mfano kuota akitumia kidole chako, au kuweka mkono
wako ili ufungue mlango)?
1 0
11. Je amewahi kupenda sana kitu ambacho huchukua muda wake mwingi na
ambacho ni kinyume kwa watu wengine( kwa mfano kuangalia mti, mbuzi
kwa muda mrefu)?
1 0
12. Je amewahi kupenda sana sehemu Fulani ya kitu cha kuchezea badala ya kitu
chochote (k.m kuzungusha gurudumu la gari la kuchezea), badala ya
kusukuma gari hilo?
1 0
a) Kuna swali lolote ambalo hukulielewa
b) Kuna swali lolote ambalo ungeliuliza kwa njia nyingine
c) For every question with a YES please ask the mother to explain and give examples
d) For the bolded questions please ask the mother to explain in her own word ‗
alilielewaje swali hili‘
13. Je amewahi kupenda kusiko kwa kawaida ambako kwa upande
mwingine ni sawa kwa umri wake na marika yake (k.m kucheza na
magari kwa muda mrefu)?
1 0
14. Je amewahi kuonekana kupenda kusiko kwa kawaida katika kuona, hisi,
sauti, ladha ama harufu ya vitu au watu? K.m kupenda sana sauti ya pikipiki
au gari?
1 0
15. Je amewahi kuwa na tabia Fulani, au njia zisizo za kawaida za kurusha
mikono au vidole vyake, kama vile kuinua makwapa juu na chini au
kupitisha vidole vyake mbele ya macho yake?
1 0
16. Je amewahi kuwa na kutikisika kwa mwili kusiko kwa kawaida k.m
kujizungusha au kujirusha juu na chini?
1 0
17. Je amewahi kujiumiza kwa makusudi, kama vile kujiuma mkono au
kujigonga kichwa chake?
1 0
18. Je amewahi kuwa na kitu chochote ambacho alikuwa anakibeba popote
aendapo?
1 0

266
19. Je ana marafiki maalum au rafiki mmoja bora/wa karibu? 0 1
a) Kuna swali lolote ambalo hukulielewa
b) Kuna swali lolote ambalo ungependa kuliuliza kwa njia nyingine?
c) For every question with a YES please ask the mother to explain and give examples
d) For the bolded questions please ask the mother to explain in her own word ‗
alilielewaje swali hili‘
For the following behaviours please focus on the time period between the child‘s fourth and fifth birthdays. You
may find it easier to remember how things were at that time by focusing on key events, such as starting school,
moving house, Christmas time, or other specific events that are particularly memorable for you as a family. If
your child is not yet 4 years old, please consider her or his behaviour in the past twelve months.
Y N
20. Alipofika umri wa miaka 4 hadi 5, aliwahi kuongea/kuzungumza nawe kwa
uzuri/ukarimu bila nia ya kupata chochote?
0 1
21. Alipofika umri wa miaka 4 hadi 5, aliwahi kukuigiza kwa kazi uliyokuwa
ukifanya (kama kutoa vumbi, kulima, au kurekebisha vitu)?
0 1
22. Alipofika umri wa miaka 4 hadi 5, aliwahi kuokota vitu vilivyopo karibu
naye, kwa makusudi ya kukuonyesha tu (sio sababu alivitaka)?
0 1
23. Alipofika umri wa miaka 4 hadi 5, aliwahi kutumia ishara, mbali na kuota
au kukuvuta mkono kukujulisha anachotaka?
0 1
24. Alipofika umri wa miaka 4 hadi 5, aliweza kuitikia kwa kichwa
akimaanisha ndio?
0 1
a) Kuna swali lolote ambalo hukulielewa
b) Kuna swali lolote ambalo ungeliuliza kwa njia nyingine
c) For every question with a YES please ask the mother to explain and give examples
d) For the bolded questions please ask the mother to explain in her own word ‗
alilielewaje swali hili‘
25. Alipofika umri wa miaka 4 hadi 5, aliweza kutikisa kichwa akimaanisha la? 0 1
26. Alipofika umri wa miaka 4 hadi 5, aliweza kukuangalia usoni alipokuwa
akifanya vitu pamoja nawe au akiongea nawe?
0 1
27. Alipofika umri wa miaka 4 hadi 5, je alitabasamu na mtu alipotabasamu
kwake?
0 1
28. Alipofika umri wa miaka 4 hadi 5, aliwahi kukuonyesha vitu
vilivyomfurahisha kwa Kutaka umsikilize?
0 1
29. Alipofika umri wa miaka 4 hadi 5, aliwahi kukubali kugawana nawe vitu
mbali na chakula?
0 1
a) Kuna swali lolote ambalo hukulielewa
b) Kuna swali lolote ambalo ungeliuliza kwa njia nyingine
c) For every question with a YES please ask the mother to explain and give examples
d) For the bolded questions please ask the mother to explain in her own word ‗
alilielewaje swali hili‘
30. Alipofika umri wa miaka 4 hadi 5, aliwahi kuonekana kutaka ujiunge naye 0 1

267
katika kufurahia kitu fulani?
31. Alipofika umri wa miaka 4 hadi 5, aliwahi kujaribu kukuliwaza/ kukufariji
ulipokuwa huna raha au umekasirishwa?
0 1
32. Alipofika umri wa miaka 4hadi 5, alipokuwa anataka kitu, au anataka
msaada alikuangalia na kutumia ishara , na sauti ama maneno ili umsikilize?
0 1
33. Alipofika umri wa miaka 4 hadi 5, alionyesha hali ya kawaida ya
kuwasiliana kwa uso?
0 1
34. Alipofika umri wa miaka 4 hadi 5, aliwahi kujiunga na kujaribu Kuigiza
vitendo katika michezo ya pamoja, kama vile katotokatoto/ukuti?
0 1
a) Kuna swali lolote ambalo hukulielewa
b) Kuna swali lolote ambalo ungeliuliza kwa njia nyingine
c) For every question with a YES please ask the mother to explain and give examples
d) For the bolded questions please ask the mother to explain in her own word ‗
alilielewaje swali hili‘
35. Alipofika umri wa miaka 4 hadi 5, aliwahi kucheza michezo ya kuiga k.m
wa baba na mama?
0 1
36. Alipofika umri wa miaka 4 hadi 5, alionekana kupenda watoto wengine wa
rika lake ambao hakuwajua?
0 1
37. Alipofika umri wa miaka 4 hadi 5, je aliweza kumkubali mtoto mwingine
alipomkaribia?
0 1
38. Alipofika umri wa miaka 4 hadi 5, ulipoingia chumbani, na kuanza kuongea
naye bila kuita jina lake, je alikuangalia na kukusikiliza?
0 1
39. Alipofika umri wa miaka 4 hadi 5, alicheza michezo ya kufikiria na mtoto
mwingine kwa njia ambayo ungeeleza kuwa kila mmoja alielewa yule
mwingine alikuwa anajifanya kuwa nani? K.m mwalimu na
mwanafunzi/dereva na conductor.
0 1
40. Alipofika umri wa miaka 4 hadi 5, je alicheza kwa kushirikiana katika
michezo ambayo ilihitaji Kujiunga na kikundi kingine cha watoto wengine,
kama vile mchezo wa bao au mchezo Wa mpira?
0 1
a) Kuna swali lolote ambalo hukulielewa
b) Kuna swali lolote ambalo ungeliuliza kwa njia nyingine
c) For every question with a YES please ask the mother to explain and give examples
d) For the bolded questions please ask the mother to explain in her own word ‗
alilielewaje swali hili‘
TOTAL SCORE
Comments:
Sign if you have checked that the form is complete_____________________________

268
Appendix 8: Kiswahili version of the Autism Spectrum Quotient (AQ)
MUHIMBILI AUTISM 2016
THE ADULT AUTISM SPECTRUM QUOTIENT (AQ)
AGES 16+
Name:........................................... Sex:...........................................
Jina:…………………………….. Jinsia yake:……………………
Date of birth: Today‘s Date.................................
Tarehe ya kuzaliwa:……………… Tarehe ya leo:……………………
How to fill out the questionnaire
Jinsi ya kujaza form ya maswali
Below is a list of statements. Please read each statement very carefully and rate how strongly you
agree or disagree with it by circling your answer.
(Hapa chini ni orodha ya maelezo . tafadhali soma kwa makini na ulinganishe kwa kiasi gani
unakubali au unakataa kwa kuzungushia jibu lako.
DO NOT MISS ANY STATEMENT OUT. Usiache swali lolote
1. I prefer to do things with others rather than on
my own.
Napendelea kufanya vitu pamoja na wenzangu
kuliko kufanya mwenyewe.
definitely
agree
nakubali
kabisa
slightly
agree
nakubali
kiasi
slightly
disagree
sikubali
kiasi
definitely
disagree
sikubali kabisa
2. I prefer to do things the same way over and
over again.
Napendelea kufanya vitu kwa njia ile ile mara
zote
definitely
agree
nakubali
kabisa
slightly
agree
nakubali
kiasi
slightly
disagree
sikubali
kiasi
definitely
disagree
sikubali
kabisa

269
3. If I try to imagine something, I find it very
easy to create a picture in my mind.
Kama najaribu kufikiria kitu ,huwa inakuwa
nirahisi sana kutengeneza picha kwenye akili
yangu.
definitely
agree
nakubali
kabisa
slightly
agree
nakubali
kiasi
slightly
disagree
sikubali
kiasi
definitely
disagree
sikubali kabisa
4. I frequently get so strongly absorbed in one
thing that I lose sight of other things.
Mara nyingi natumia nguvu nyingi kwa kitu
kimoja ambapo sioni vitu vingine kirahisi.
definitely
agree
nakubali
kabisa
slightly
agree
nakubali
kiasi
slightly
disagree
sikubali
kiasi
definitely
disagree
sikubali kabisa
5. I often notice small sounds when others do not.
Mara kwa mara huwa nasikia sauti ndogo
ambayo wengine hawaisikii.
definitely
agree
nakubali
kabisa
slightly
agree
nakubali
kiasi
slightly
disagree
sikubali
kiasi
definitely
disagree
sikubali kabisa
6. I usually notice car number plates or similar
strings of information.
Kwa kawaida huwa na tambua namba za gari
au kitu kinachofanana na taarifa hizo.
definitely
agree
nakubali
kabisa
slightly
agree
nakubali
kiasi
slightly
disagree
sikubali
kiasi
definitely
disagree
sikubali kabisa
7. Other people frequently tell me that what I‘ve
said is impolite, even though I think it is polite.
Mara kwa mara watu wengine waniambia
nilichosema nimeongea kwa ukali ,japo kuwa
mimi nafikiri nimeongea kwa upole.
definitely
agree
nakubali
kabisa
slightly
agree
nakubali
kiasi
slightly
disagree
sikubali
kiasi
definitely
disagree
sikubali
kabisa
8. When I‘m reading a story, I can easily imagine
what the characters might look like.
Ninaposoma hadithi, ninaweza kufikiri kirahisi
muhusika anafanaje.
definitely
agree
nakubali
kabisa
slightly
agree
nakubali
kiasi
slightly
disagree
sikubali
kiasi
definitely
disagree
sikubali kabisa
9.
I am fascinated by dates.
Huwa Ninavutiwa sana na tarehe.
definitely
agree
nakubali
kabisa
slightly
agree
nakubali
kiasi
slightly
disagree
sikubali
kiasi
definitely
disagree
sikubali kabisa
10.
In a social group, I can easily keep track of
several different people‘s conversations.
Ninaweza kufuatilia mazungumzo mengi ya
watu mbalimbali kwenye makundi ya kijamii
kwa urahisi.
definitely
agree
nakubali
kabisa
slightly
agree
nakubali
kiasi
slightly
disagree
sikubali
kiasi
definitely
disagree
sikubali kabisa
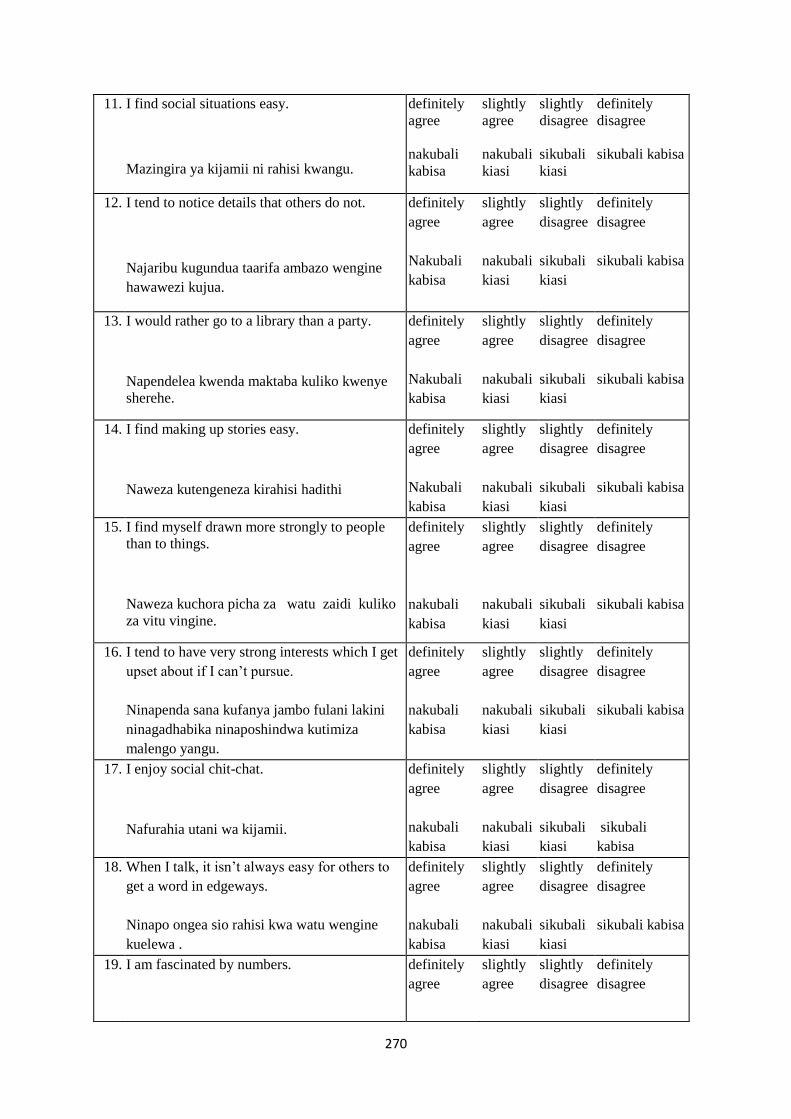
270
11. I find social situations easy.
Mazingira ya kijamii ni rahisi kwangu.
definitely
agree
nakubali
kabisa
slightly
agree
nakubali
kiasi
slightly
disagree
sikubali
kiasi
definitely
disagree
sikubali kabisa
12. I tend to notice details that others do not.
Najaribu kugundua taarifa ambazo wengine
hawawezi kujua.
definitely
agree
Nakubali
kabisa
slightly
agree
nakubali
kiasi
slightly
disagree
sikubali
kiasi
definitely
disagree
sikubali kabisa
13. I would rather go to a library than a party.
Napendelea kwenda maktaba kuliko kwenye
sherehe.
definitely
agree
Nakubali
kabisa
slightly
agree
nakubali
kiasi
slightly
disagree
sikubali
kiasi
definitely
disagree
sikubali kabisa
14. I find making up stories easy.
Naweza kutengeneza kirahisi hadithi
definitely
agree
Nakubali
kabisa
slightly
agree
nakubali
kiasi
slightly
disagree
sikubali
kiasi
definitely
disagree
sikubali kabisa
15. I find myself drawn more strongly to people
than to things.
Naweza kuchora picha za watu zaidi kuliko
za vitu vingine.
definitely
agree
nakubali
kabisa
slightly
agree
nakubali
kiasi
slightly
disagree
sikubali
kiasi
definitely
disagree
sikubali kabisa
16. I tend to have very strong interests which I get
upset about if I can‘t pursue.
Ninapenda sana kufanya jambo fulani lakini
ninagadhabika ninaposhindwa kutimiza
malengo yangu.
definitely
agree
nakubali
kabisa
slightly
agree
nakubali
kiasi
slightly
disagree
sikubali
kiasi
definitely
disagree
sikubali kabisa
17. I enjoy social chit-chat.
Nafurahia utani wa kijamii.
definitely
agree
nakubali
kabisa
slightly
agree
nakubali
kiasi
slightly
disagree
sikubali
kiasi
definitely
disagree
sikubali
kabisa
18. When I talk, it isn‘t always easy for others to
get a word in edgeways.
Ninapo ongea sio rahisi kwa watu wengine
kuelewa .
definitely
agree
nakubali
kabisa
slightly
agree
nakubali
kiasi
slightly
disagree
sikubali
kiasi
definitely
disagree
sikubali kabisa
19. I am fascinated by numbers.
definitely
agree
slightly
agree
slightly
disagree
definitely
disagree

271
Ninavutiwa sana na namba nakubali
kabisa
nakubali
kiasi
sikubali
kiasi
sikubali kabisa
20. When I‘m reading a story, I find it difficult to
work out the characters‘ intentions.
Ninaposoma hadithi ninapata ugumu wa
kumgundua mhusika wa hadithi hiyo.
definitely
agree
nakubali
kabisa
slightly
agree
nakubali
kiasi
slightly
disagree
sikubali
kiasi
definitely
disagree
sikubali
kabisa
21. I don‘t particularly enjoy reading fiction.
Kwa ujumla Sifurahii kusoma hadithi fupi
definitely
agree
nakubali
kabisa
slightly
agree
nakubali
kiasi
slightly
disagree
sikubali
kiasi
definitely
disagree
sikubali
kabisa
22. I find it hard to make new friends.
Napata ugumu wa kuwa na marafiki wapya
definitely
agree
nakubali
kabisa
slightly
agree
nakubali
kiasi
slightly
disagree
sikubali
kiasi
definitely
disagree
sikubali
kabisa
23. I notice patterns in things all the time.
Huwa ninagundua mfululizo wa vitu kwa
wakati wote.
definitely
agree
nakubali
kabisa
slightly
agree
nakubali
kiasi
slightly
disagree
sikubali
kiasi
definitely
disagree
sikubali kabisa
24. I would rather go to the theatre than a museum.
Napenda kwenda kwenye nyumba za starehe
kuliko za makumbusho.
definitely
agree
nakubali
kabisa
slightly
agree
nakubali
kiasi
slightly
disagree
sikubali
kiasi
definitely
disagree
sikubali kabisa
25. It does not upset me if my daily routine is
disturbed.
Mimi sijali hata kama nikipata usumbufu
kwenye shughuli zangu za kila siku.
definitely
agree
nakubali
kabisa
slightly
agree
nakubali
kiasi
slightly
disagree
sikubali
kiasi
definitely
disagree
sikubali kabisa
26. I frequently find that I don‘t know how to keep
a conversation going.
Mara kwa mara nashindwa kujua jinsi ya
kufanya mazungumzo ya endelee
definitely
agree
nakubali
kabisa
slightly
agree
nakubali
kiasi
slightly
disagree
sikubali
kiasi
definitely
disagree
sikubali kabisa
27. I find it easy to ―read between the lines‖ when
someone is talking to me.
Napata urahisi wa kusoma mstari kwa mstari
japokuwa kuna mtu anaongea na mimi .
definitely
agree
nakubali
kabisa
slightly
agree
nakubali
kiasi
slightly
disagree
sikubali
kiasi
definitely
disagree
sikubali kabisa
28. I usually concentrate more on the whole
picture, rather than the small details.
Mara nyingi nafikiria juu ya picha nzima
kuliko kwenye taarifa fupi.
definitely
agree
nakubali
kabisa
slightly
agree
nakubali
kiasi
slightly
disagree
sikubali
kiasi
definitely
disagree
sikubali
kabisa

272
29. I am not very good at remembering phone
numbers.
Mimi siwezi kukumbuka vizuri namba za
simu.
definitely
agree
nakubali
kiasi
slightly
agree
nakubali
kiasi
slightly
disagree
sikubali
kiasi
definitely
disagree
sikubali kabisa
30.
I don‘t usually notice small changes in a
situation, or a person‘s appearance.
Kwa kawaida sigundui hali ya mabadiliko
madogo au muonekano wa mtu kwa ujumla.
definitely
agree
nakubali
kabisa
slightly
agree
nakubali
kiasi
slightly
disagree
sikubali
kiasi
definitely
disagree
sikubali
kabisa
31. I know how to tell if someone listening to me
is getting bored.
Natambua endapo namweleza mtu jambo
fulani halafu hafurahii .
definitely
agree
nakubali
kabisa
slightly
agree
nakubali
kiasi
slightly
disagree
sikubali
kiasi
definitely
disagree
sikubali
kabisa
32. I find it easy to do more than one thing at once.
Naona ni rahisi kufanya zaidi ya kitu kimoja
kwa wakati mmoja.
definitely
agree
nakubali
kabisa
slightly
agree
nakubali
kiasi
slightly
disagree
sikubali
kiasi
definitely
disagree
sikubali
kabisa
33. When I talk on the phone, I‘m not sure when
it‘s my turn to speak.
Ninapo ongea na simu sinauhakika kama ni
zamu yangu kuongea.
definitely
agree
nakubali
kabisa
slightly
agree
nakubali
kiasi
slightly
disagree
sikubali
kiasi
definitely
disagree
sikubali
kabisa
34. I enjoy doing things spontaneously.
Nafurahia kufanya vitu kwa ghafla
definitely
agree
nakubali
kabisa
slightly
agree
nakubali
kiasi
slightly
disagree
sikubali
kiasi
definitely
disagree
sikubali kabisa
35. I am often the last to understand the point of a
joke.
Mara nyingi nakuwa wa mwisho kuelewa
nafasi ya utani.
definitely
agree
nakubali
kabisa
slightly
agree
nakubali
kiasi
slightly
disagree
sikubali
kiasi
definitely
disagree
sikubali kabisa
36. I find it easy to work out what someone is
thinking or feeling just by looking at their face.
Ni rahisi kwa kumwangalia mtu kujua ni
wakati gani anafikiria au anahisi
definitely
agree
nakubali
kabisa
slightly
agree
nakubali
kiasi
slightly
disagree
sikubali
kiasi
definitely
disagree
sikubali kabisa
37. If there is an interruption, I can switch back to
what I was doing very quickly.
Ninapokuwa na mwingiliano,ghafla naweza
kurudi kwenye kitu nilichokuwa nakifanya
mara moja.
definitely
agree
nakubali
kabisa
slightly
agree
nakubali
kiasi
slightly
disagree
sikubali
kiasi
definitely
disagree
sikubali kabisa

273
38. I am good at social chit-chat.
Niko vizuri kwa mazungumzo ya kijamii.
definitely
agree
nakubali
kabisa
slightly
agree
nakubali
kiasi
slightly
disagree
sikubali
kiasi
definitely
disagree
sikubali kabisa
39. People often tell me that I keep going on and
on about the same thing.
Mara nginyi watu huwa wananiambia kuwa
naendelea na vitu hivyohivyo.
definitely
agree
nakubali
kabisa
slightly
agree
nakubali
kiasi
slightly
disagree
sikubali
kiasi
definitely
disagree
sikubali kabisa
40. When I was young, I used to enjoy playing
games involving pretending with other
children.
Nilipokuwa mtoto nilifurahi kucheza michezo
inayowahusisha na wengine.
definitely
agree
nakubali
kabisa
slightly
agree
nakubali
kiasi
slightly
disagree
sikubali
kiasi
definitely
disagree
sikubali kabisa
41. I like to collect information about categories of
things (e.g. types of car, types of bird, types of
train, types of plant, etc.).
Napenda kukusanya taarifa kuhusu makundi ya
vitu (kwa mfano aina za gari, aina za ndege,
aina za gari moshi , aina ya mimea)
definitely
agree
nakubali
kabisa
slightly
agree
nakubali
kiasi
slightly
disagree
sikubali
kiasi
definitely
disagree
sikubali kabisa
42. I find it difficult to imagine what it would be
like to be someone else.
Inaniwia vigumu kufikiria kujifanya kama mtu
mwingine.
definitely
agree
nakubali
kabisa
slightly
agree
nakubali
kiasi
slightly
disagree
sikubali
kiasi
definitely
disagree
sikubali
kabisa
43. I like to plan any activities I participate in
carefully.
Ninapenda kupanga shughuli yoyote na
kuishiriki kikamilifu
definitely
agree
nakubali
kabisa
slightly
agree
nakubali
kiasi
slightly
disagree
sikubali
kiasi
definitely
disagree
sikubali
kabisa
44. I enjoy social occasions.
Nafurahia matukio ya kijamii mara chache.
definitely
agree
nakubali
kabisa
slightly
agree
nakubali
kiasi
slightly
disagree
sikubali
kiasi
definitely
disagree
sikubali
kabisa
45. I find it difficult to work out people‘s
intentions.
Inakuwa nivigumu kwangu kufanyia kazi
mitazamo ya watu.
definitely
agree
nakubali
kabisa
slightly
agree
nakubali
kiasi
slightly
disagree
sikubali
kiasi
definitely
disagree
sikubali kabisa
46. New situations make me anxious.
Ninakuwa mwoga kwenye mazingira mapya
definitely
agree
nakubali
slightly
agree
nakubali
slightly
disagree
sikubali
definitely
disagree
sikubali
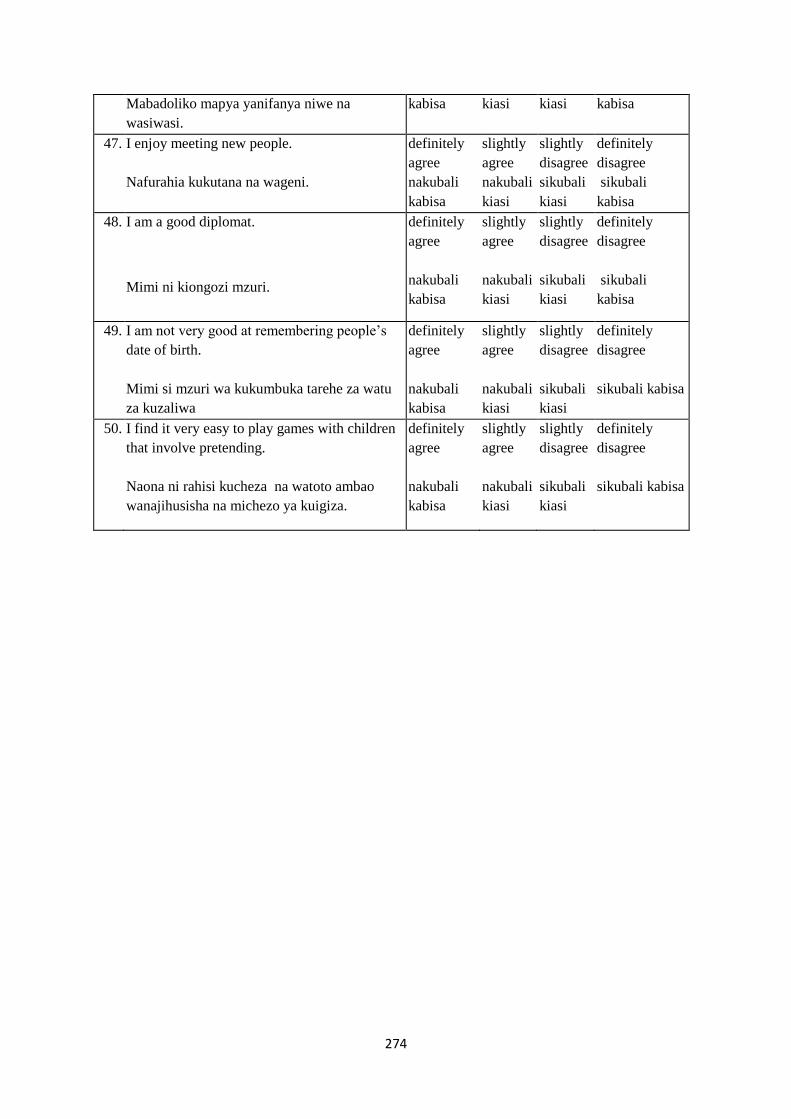
274
Mabadoliko mapya yanifanya niwe na
wasiwasi.
kabisa kiasi kiasi kabisa
47. I enjoy meeting new people.
Nafurahia kukutana na wageni.
definitely
agree
nakubali
kabisa
slightly
agree
nakubali
kiasi
slightly
disagree
sikubali
kiasi
definitely
disagree
sikubali
kabisa
48. I am a good diplomat.
Mimi ni kiongozi mzuri.
definitely
agree
nakubali
kabisa
slightly
agree
nakubali
kiasi
slightly
disagree
sikubali
kiasi
definitely
disagree
sikubali
kabisa
49. I am not very good at remembering people‘s
date of birth.
Mimi si mzuri wa kukumbuka tarehe za watu
za kuzaliwa
definitely
agree
nakubali
kabisa
slightly
agree
nakubali
kiasi
slightly
disagree
sikubali
kiasi
definitely
disagree
sikubali kabisa
50. I find it very easy to play games with children
that involve pretending.
Naona ni rahisi kucheza na watoto ambao
wanajihusisha na michezo ya kuigiza.
definitely
agree
nakubali
kabisa
slightly
agree
nakubali
kiasi
slightly
disagree
sikubali
kiasi
definitely
disagree
sikubali kabisa

275
Appendix 9: Consent form for qualitative study (English)
MUHIMBILI UNIVERSITY OF HEALTH AND ALLIED SCIENCES
P. O. BOX 65001 DAR ES SALAAM TANZANIA
A: Informed consent for participants that will take part in the Focus Group Discussions
and In-depth Interviews.
Study Title: Evaluating the knowledge, awareness and lived experiences of Autism in Tanzania.
Lay title: Understanding the awareness and experiences of Autism in Tanzania.
Institution
MUHAS / MNH / KEMRI Kavita Ruparelia, Karim Manji, Amina Abubakar, Charles Newton
What is MUHAS/MNH /KEMRI and what is this study about?
MUHAS is the National Public University for Health Sciences, where the scientific aspects of
the proposal and supervision will take place. The research committee within MUHAS must
agree that the research is important, relevant to Tanzania and follows nationally and
internationally agreed research guidelines. This includes ensuring that all participants‘ safety
and rights are respected.
MNH is the teaching hospital, a public health facility, a tertiary referral hospital. All the
research done shall be approved by the host institution/s
KEMRI is a government organization in Kenya that carries out medical research to find better
ways of preventing and treating illness in the future for everybody‘s benefit. All research at
KEMRI has to be approved before it begins by several national committees who look
carefully at planned work.
In this study we want to learn more about the knowledge, awareness and experiences of Autism in this
community. This is important because Autism is known to be a big problem for families, and to
develop appropriate interventions for the families of children with Autism, we first need to identify
the level of knowledge, experiences and challenges of Autism in this community.
Why do you want to talk to me and what does it involve?
We have chosen you because we feel that your experience as a parent, teacher, clinician or
community representative can contribute much to our understanding and knowledge of Autism. We
are requesting you to join us for a discussion on community‘s perceptions, beliefs, and descriptions of
Autism and its symptoms. This discussion will take approximately 1 hour. We would like you to take

276
part in a discussion with [5-6] other persons with similar experiences or have a one-to-one interview.
We would also like to request you to allow us to audio tape the discussions. Recording everything
you are saying is important because in case the person who is writing notes misses some information
s/he will listen to the tapes. The discussion will be recorded to assist later in fully writing up the
information. No-one will be identified by name in the recording.
Are there any risks or disadvantages to me/my child of taking part?
A part from the time it takes to complete the test, there are no disadvantages at all for participating in
this research.
Benefits of the Study
There will be no direct benefits of the study to you. However, this study is intended to provide a better
understanding of the problem of Autism in this community and Tanzania in general. We hope that the
findings shall enable better service provision for all children with Autism in the future.
What will happen if I do not agree to participate?
Your participation in this project is voluntary. You are free to withdraw from the study at any time.
Who will see the information from this study?
We will not share individual information about you or other participants with anyone beyond a few
people who are closely concerned with the research. Only the principal investigator will listen to the
tapes being recorded. All of our documents/ recordings are stored securely in locked cabinets and on
password protected computers. We will ask everybody in the discussion to keep what is said in the
group confidential, but it is important to recognize that we cannot stop participants sharing what they
have heard.
What if I have any questions?
You are free to ask any question about this research. If you have any further questions about the
study, you are free to contact the research team using the contact below:
Contacts person
Prof. Karim Manji
MUHAS, P.O. Box 65001, Dar-es-Salam, Tanzania
Telephone: 0754350630
If you want to ask someone independent anything about this research please contact:
Prof. Mainen Moshi, Director of Research and Publication, MUHAS, P.O. Box 65001, Dar-es-Salaam

277
Or
Ms. Joyce Ikingura, National Health Research Ethics Committee (NatHREC), National Institute for
Medical Research (NIMR), P.O. Box 9653, Dar-es-Salaam
I ______________________________________, have been told about this study. I have had the
study explained to me. I have understood all that has been read/explained and had my questions
answered satisfactorily.
Yes please tick I agree to be interviewed
Yes please tick I agree for the interview to be recorded
I understand that I can change my mind at any stage and it will not affect me/my child in any way.
Signature:
Date:
Participant Time:
(please print name)
I certify that I have followed the study SOP to obtain consent from the [participant]. S/he apparently
understood the nature and the purpose of the study and consents to the participation [of the child] in
the study. S/he has been given opportunity to ask questions which have been answered satisfactorily.
Signature:
Date:
Designee/ Investigator’s Name: Time:
(please print name)
Thumb print of the parent as named above if they cannot write: ______________________
Where parent/guardian cannot read, a witness* may observe consent process and sign below if
needed:
I attest that the information concerning this research was accurately explained and apparently
understood by the subject/parent/guardian and that informed consent was freely given by the
subject/parent/guardian.
Witness’ signature: _____________________________________ Date _____________
Witness’ name: _____________________________________ Time ______________
*A witness is a person who is independent from the trial or a member of staff who was not involved in
gaining the consent.

278
Appendix 10: Consent form for main case-control studies (English)
MUHIMBILI UNIVERSITY OF HEALTH AND ALLIED SCIENCES
P. O. BOX 65001 DAR ES SALAAM TANZANIA
B: Informed consent for participants in the families that will take part in the validation
studies.
Study Title: Adapting culturally appropriate measures for screening Autism in Tanzania.
Lay title: Developing measures for screening Autism in Tanzania.
Institution
MUHAS / MNH / KEMRI Kavita Ruparelia, Karim Manji, Amina Abubakar, Charles Newton
What is MUHAS/MNH /KEMRI and what is this study about?
MUHAS is the National Public University for Health Sciences, where the scientific aspects of
the proposal and supervision will take place. The research committee within MUHAS must
agree that the research is important, relevant to Tanzania and follows nationally and
internationally agreed research guidelines. This includes ensuring that all participants‘ safety
and rights are respected.
MNH is the teaching hospital, a public health facility, a tertiary referral hospital. All the
research done shall be approved by the host institution/s
KEMRI is a government organization in Kenya that carries out medical research to find better
ways of preventing and treating illness in the future for everybody‘s benefit. All research at
KEMRI has to be approved before it begins by several national committees who look
carefully at planned work.
In this study we want to learn more about the causes, distribution and effects of Autism among
children. This is important because Autism is known to be a big problem for families, and to develop
appropriate interventions for the families of children with Autism, we first need to identify children
who have Autism, understand their behavior, know how many children suffer from Autism and why.
In order to do this, we need to develop an appropriate tool for identifying children who are Autistic in
our communities.
Why do you want to talk to me and what does it involve?
We want to talk to you because you have a child who is attending a special school and the child is
aged 6-12 years old. We want to request you and your child to come to MNH, any relevant schools or

279
clinics, to take part in various activities that will help us develop tools that can be used to recognize
children with Autism. During that visit:
You will answer several questionnaires about your child‘s behavior and health and also some
questions about yourself and your family
Your child will be requested to take part in various activities and we will request for your
child to be video-taped while doing these activities
Children suspected of Autism will be referred to relevant facilities for necessary assistance
The visit will take approximately 3 hours.
Are there any risks or disadvantages to me/my child of taking part?
A part from the time it takes to complete the test, there are no disadvantages at all for participating in
this research.
Benefits of the Study
There will be no direct benefits of the study to you. However, this study is intended to provide a better
understanding of the problem of Autism in this community and Tanzania in general. We hope that the
findings shall enable better service provision for all children with Autism in the future.
What will happen if I do not agree to participate?
Your participation in this project is voluntary. If you do not want to take part, your refusal will not
affect your relationship with MNH or MUHAS. You will be able to receive all services as usual. If
you agree to participate now you are free to withdraw or withdraw your child from the study at any
time without any problem.
Who will see the information from this study?
We will not share individual information about you or other participants with anyone beyond a few
people who are closely concerned with the research. All of our documents/ recordings are stored
securely in locked cabinets and on password protected computers. The knowledge gained from this
research will be shared in summary form, without revealing individuals‘ identities, with parents,
teachers, doctors and nurses.
What if I have any questions?
You are free to ask any question about this research. If you have any further questions about the
study, you are free to contact the research team using the contact below:

280
Contacts person
Prof. Karim Manji
MUHAS, P.O. Box 65001, Dar-es-Salam, Tanzania
Telephone: 0754350630
If you want to ask someone independent anything about this research please contact:
Prof. Mainen Moshi, Director of Research and Publication, MUHAS, P.O. Box 65001, Dar-es-Salaam
Or
Ms. Joyce Ikingura, National Health Research Ethics Committee (NatHREC), National Institute for
Medical Research (NIMR), P.O. Box 9653, Dar-es-Salaam
I [being the parent of______________________________________(name of child)], have been told
about this study. I have had the study explained to me. I have understood all that has been
read/explained and had my questions answered satisfactorily.
Yes please tick I agree to be interviewed
Yes please tick I agree for the interview to be recorded
I understand that I can change my mind at any stage and it will not affect me/my child in any way.
Signature:
Date:
Participant / Guardian Name: Time:
(please print name)
I certify that I have followed the study SOP to obtain consent from the [participant/guardian]. S/he
apparently understood the nature and the purpose of the study and consents to the participation [of the
child] in the study. S/he has been given opportunity to ask questions which have been answered
satisfactorily.
Signature:
Date:
Designee/ Investigator’s Name: Time:
(please print name)

281
Thumb print of the parent as named above if they cannot write: ______________________
Where parent/guardian cannot read, a witness* may observe consent process and sign below if
needed:
I attest that the information concerning this research was accurately explained and apparently
understood by the subject/parent/guardian and that informed consent was freely given by the
subject/parent/guardian.
Witness’ signature: _____________________________________ Date _____________
Witness’ name: _____________________________________ Time ______________
*A witness is a person who is independent from the trial or a member of staff who was not involved in
gaining the consent.

282
Appendix 11: Kiswahili version of the Autism Spectrum Quotient 5-Factor Model using
Confirmatory Factor Analysis (CFA).
Factors and Items Factor
Loadings
Factor 1: Social Skills
1 I prefer to do things with others rather than on my own. 0.019
11 I find social situations easy. 0.162
13 I would rather go to a library than a party. 0.131
15 I find myself drawn more strongly to people than to things. 0.118
22 I find it hard to make new friends. -0.035
36 I find it easy to work out what someone is thinking or feeling just by looking at
their face. 0.031
44 I enjoy social occasions. 0.556
45 I find it difficult to work out people‘s intentions. 0.604
47 I enjoy meeting new people. 0.775
48 I am a good diplomat. 0.653
Factor 2: Attention Switching
2 I prefer to do things the same way over and over again. 0.671
4 I frequently get so strongly absorbed in one thing that I lose sight of other things. 0.532
10 In a social group, I can easily keep track of several different people‘s
conversations. 0.129
16 I tend to have very strong interests which I get upset about if I can‘t pursue. 0.227
25 It does not upset me if my daily routine is disturbed. 0.188
32 I find it easy to do more than one thing at once. 0.223
34 I enjoy doing things spontaneously. 0.164
37 If there is an interruption, I can switch back to what I was doing very quickly. 0.14
43 I like to plan any activities I participate in carefully. 0.062
46 46. New situations make me anxious. 0.099
Factor 3: Attention to Detail
5 I often notice small sounds when others do not. 0.568
6 I usually notice car number plates or similar strings of information. 0.575
9 I am fascinated by dates. 0.319
12 I tend to notice details that others do not. 0.315
19 I am fascinated by numbers. 0.264
23 I notice patterns in things all the time. 0.25
28 I usually concentrate more on the whole picture, rather than the small details. 0.145
29 I am not very good at remembering phone numbers. 0.168
30 I don‘t usually notice small changes in a situation, or a person‘s appearance. 0.31

283
49 49. I am not very good at remembering people‘s date of birth. 0.064
Factor 4: Communication
7 Other people frequently tell me that what I‘ve said is impolite, even though I
think it is polite. 0.14
17 I enjoy social chit-chat. 0.055
18 When I talk, it isn‘t always easy for others to get a word in edgeways. -0.034
26 I frequently find that I don‘t know how to keep a conversation going. 0.145
27 I find it easy to ―read between the lines‖ when someone is talking to me. 0.042
31 I know how to tell if someone listening to me is getting bored. 0.289
33 When I talk on the phone, I‘m not sure when it‘s my turn to speak. 0.497
35 I am often the last to understand the point of a joke. 0.526
38 I am good at social chit-chat. 0.637
39 People often tell me that I keep going on and on about the same thing. 0.518
Factor 4: Imagination
3 If I try to imagine something, I find it very easy to create a picture in my mind. 0.05
8 When I‘m reading a story, I can easily imagine what the characters might look
like. 0.01
14 I find making up stories easy. -0.207
20 When I‘m reading a story, I find it difficult to work out the characters‘ intentions. -0.233
21 I don‘t particularly enjoy reading fiction. -0.207
24 I would rather go to the theatre than a museum. -0.204
40 When I was young, I used to enjoy playing games involving pretending with
other children. 0.701
41 I like to collect information about categories of things (e.g. types of car, types of
bird, types of train, types of plant, etc.). 0.687
42 I find it difficult to imagine what it would be like to be someone else. 0.729
50 50. I find it very easy to play games with children that involve pretending. 0.203
Fit indices: Root Mean Square Error of Approximation (RMSEA), 0.13 (95% CI 0.127 – 0.133); Comparative Fit Index (CFI), 0.117;
Tucker Lewis Index (TLI), 0.08.

284
Appendix 12: Principle Components Analysis (PCA) for the Kiswahili version of the Autism
Spectrum Quotient (AQ) using Varimax rotation.
Original
Subscale
Item Factor
1
Factor
2
Factor
3
Factor
4
Factor
5
CO 38 I am good at social chit-chat. 0.710
AS 37 If there is an interruption, I can
switch back to what I was doing very
quickly.
0.678
IM 41 I like to collect information about
categories of things (e.g. types of car,
types of bird, types of train, types of
plant, etc.).
0.666
SS 36 I find it easy to work out what
someone is thinking or feeling just by
looking at their face.
0.654
IM 40 When I was young, I used to enjoy
playing games involving pretending
with other children.
0.650
CO 35 I am often the last to understand the
point of a joke.
0.643
CO 39 People often tell me that I keep going
on and on about the same thing.
0.639
IM 42 I find it difficult to imagine what it
would be like to be someone else.
0.573
AS 34 I enjoy doing things spontaneously. 0.451
AS 43 I like to plan any activities I
participate in carefully.
0.424
IM 8 When I‘m reading a story, I can
easily imagine what the characters
might look like.
0.666
CO 7 Other people frequently tell me that
what I‘ve said is impolite, even
though I think it is polite.
0.660
SS 11 I find social situations easy. 0.639
AD 9 I am fascinated by dates. 0.631
AD 5 I often notice small sounds when
others do not.
0.575
AD 6 I usually notice car number plates or 0.566

285
similar strings of information.
AS 10 In a social group, I can easily keep
track of several different people‘s
conversations.
0.549
AS 4 I frequently get so strongly absorbed
in one thing that I lose sight of other
things.
0.492
IM 3 If I try to imagine something, I find it
very easy to create a picture in my
mind.
0.478
SS 13 I would rather go to a library than a
party.
0.430
AD 12 I tend to notice details that others do
not.
0.427
CO 27 I find it easy to ―read between the
lines‖ when someone is talking to
me.
0.630
AD 30 I don‘t usually notice small changes
in a situation, or a person‘s
appearance.
0.628
CO 31 I know how to tell if someone
listening to me is getting bored.
0.627
AD 28 I usually concentrate more on the
whole picture, rather than the small
details.
0.618
AD 29 I am not very good at remembering
phone numbers.
0.609
CO 26 I frequently find that I don‘t know
how to keep a conversation going.
0.593
AS 25 It does not upset me if my daily
routine is disturbed.
0.543
AS 32 I find it easy to do more than one
thing at once.
0.506
AD 23 I notice patterns in things all the time. 0.465
CO 33 When I talk on the phone, I‘m not
sure when it‘s my turn to speak.
0.449
IM 24 I would rather go to the theatre than a
museum.
0.422
SS 1 I prefer to do things with others 0.349

286
rather than on my own.
AS 2 I prefer to do things the same way
over and over again.
0.345
SS 48 I am a good diplomat. 0.786
SS 47 I enjoy meeting new people. 0.783
AS 46 New situations make me anxious. 0.752
AD 49 I am not very good at remembering
people‘s date of birth.
0.733
SS 45 I find it difficult to work out people‘s
intentions.
0.696
SS 44 I enjoy social occasions. 0.583
IM 50 I find it very easy to play games with
children that involve pretending.
0.507
IM 21 I don‘t particularly enjoy reading
fiction.
0.665
CO 18 When I talk, it isn‘t always easy for
others to get a word in edgeways.
0.664
IM 20 When I‘m reading a story, I find it
difficult to work out the characters‘
intentions.
0.662
AD 19 I am fascinated by numbers. 0.605
SS 22 I find it hard to make new friends. 0.539
AS 16 I tend to have very strong interests
which I get upset about if I can‘t
pursue.
0.533
IM 14 I find making up stories easy. 0.485
SS 15 I find myself drawn more strongly to
people than to things.
0.479
CO 17 I enjoy social chit-chat. 0.464
Note. CO = Communication; AS = Attention switching; IM = Imagination; SS = Social skills; AD = Attention to detail.
Copyright © 2022 FDOKUMEN