
A multimodal approach to emotion recognition ability in autism spectrum disorders
11
A multimodal approach to emotion recognition ability in autism spectrum disorders Catherine R.G. Jones, 1 Andrew Pickles, 2 Milena Falcaro, 2 Anita J.S. Marsden, 3 Francesca Happe ´, 4 Sophie K. Scott, 5 Disa Sauter, 5 Jenifer Tregay, 3 Rebecca J. Phillips, 3 Gillian Baird, 6 Emily Simonoff, 7 and Tony Charman 1 1 Centre for Research in Autism and Education, Department of Psychology and Human Development, Institute of Education, London, UK; 2 Biostatistics Group, School of Community-Based Medicine, University of Manchester, UK; 3 UCL Institute of Child Health, London, UK; 4 MRC SDGP Research Centre, Institute of Psychiatry, King’s College London, UK; 5 UCL Institute of Cognitive Neuroscience, London, UK; 6 Guy’s & St Thomas’ NHS Foundation Trust, London, UK; 7 Department of Child and Adolescent Psychiatry, King’s College London, Institute of Psychiatry, UK Background: Autism spectrum disorders (ASD) are characterised by social and communication diffi- culties in day-to-day life, including problems in recognising emotions. However, experimental investi- gations of emotion recognition ability in ASD have been equivocal, hampered by small sample sizes, narrow IQ range and over-focus on the visual modality. Methods: We tested 99 adolescents (mean age 15;6 years, mean IQ 85) with an ASD and 57 adolescents without an ASD (mean age 15;6 years, mean IQ 88) on a facial emotion recognition task and two vocal emotion recognition tasks (one verbal; one non- verbal). Recognition of happiness, sadness, fear, anger, surprise and disgust were tested. Using structural equation modelling, we conceptualised emotion recognition ability as a multimodal con- struct, measured by the three tasks. We examined how the mean levels of recognition of the six emotions differed by group (ASD vs. non-ASD) and IQ (‡ 80 vs. < 80). Results: We found no evidence of a fun- damental emotion recognition deficit in the ASD group and analysis of error patterns suggested that the ASD group were vulnerable to the same pattern of confusions between emotions as the non-ASD group. However, recognition ability was significantly impaired in the ASD group for surprise. IQ had a strong and significant effect on performance for the recognition of all six emotions, with higher IQ adolescents outperforming lower IQ adolescents. Conclusions: The findings do not suggest a fundamental difficulty with the recognition of basic emotions in adolescents with ASD. Keywords: Autism spectrum disorder, emotion recognition, emotion processing, social communication, structural equation modelling. Autism spectrum disorders (ASDs), the common clinical term for the pervasive developmental disor- ders (American Psychiatric Association, 2000; World Health Organisation, 1993), are defined by social and communication difficulties, and deficits related to emotional processing are seen as a hallmark symptom. Basic emotion recognition is a funda- mental ‘building block’ of more sophisticated emo- tional and social understanding and establishing the degree of deficit in ASD is important for ascertaining at what level social-emotional understanding begins to break down for these individuals. The most widely used emotion recognition task requires identification of the emotional state of faces in a forced-choice paradigm, with the participant being tested on a selection from the six ‘basic’ emo- tions of happiness, sadness, fear, anger, surprise and disgust (Ekman & Friesen, 1976). Some studies report significantly poorer performance in ASD for either total score or individual emotions (e.g., Ash- win, Chapman, Colle, & Baron-Cohen, 2006; Baron- Cohen, Spitz, & Cross, 1993; Boraston, Blakemore, Chilvers, & Skuse, 2007; Corden, Chilvers, & Skuse, 2008; Pelphrey et al., 2002; Philip et al., in press; Wallace, Coleman, & Bailey, 2008; Wright et al., 2008) but others have found no difference between the ASD and comparison groups (e.g., Castelli, 2005; Grossman, Klin, Carter, & Volkmar, 2000). For those studies that do find a difference, the specific emo- tions that are problematic vary, with each of the core emotions except for happiness being identified in at least one study but with sadness and fear being the most commonly cited (Ashwin et al., 2006; Boraston et al., 2007; Corden et al., 2008; Pelphrey et al., 2002; Philip et al., in press; Wallace et al., 2008). One explanation for the inconsistent findings is likely to be sample size, with the studies cited here including between 11 and 39 participants with ASD. In addition, small sample sizes limit exploration of the effect of IQ on performance and many previous studies include exclusively high or low IQ partici- pants. Research into emotion recognition ability in ASD has also been limited by over-focus on the visual modality, specifically the recognition of emotion in faces. Understanding emotional states in real life involves reading a variety of cues that include tone of voice, non-verbal vocalisations, vocal content, ges- Conflict of interest statement: No conflicts declared. Journal of Child Psychology and Psychiatry 52:3 (2011), pp 275–285 doi:10.1111/j.1469-7610.2010.02328.x Ó 2010 The Authors. Journal of Child Psychology and Psychiatry Ó 2010 Association for Child and Adolescent Mental Health. Published by Blackwell Publishing, 9600 Garsington Road, Oxford OX4 2DQ, UK and 350 Main St, Malden, MA 02148, USA
Transcript of A multimodal approach to emotion recognition ability in autism spectrum disorders
A multimodal approach to emotion recognitionability in autism spectrum disorders
Catherine R.G. Jones,1 Andrew Pickles,2 Milena Falcaro,2 Anita J.S. Marsden,3
Francesca Happe,4 Sophie K. Scott,5 Disa Sauter,5 Jenifer Tregay,3 Rebecca J.Phillips,3 Gillian Baird,6 Emily Simonoff,7 and Tony Charman1
1Centre for Research in Autism and Education, Department of Psychology and Human Development, Institute ofEducation, London, UK; 2Biostatistics Group, School of Community-Based Medicine, University of Manchester, UK;3UCL Institute of Child Health, London, UK; 4MRC SDGP Research Centre, Institute of Psychiatry, King’s CollegeLondon, UK; 5UCL Institute of Cognitive Neuroscience, London, UK; 6Guy’s & St Thomas’ NHS Foundation Trust,London, UK; 7Department of Child and Adolescent Psychiatry, King’s College London, Institute of Psychiatry, UK
Background: Autism spectrum disorders (ASD) are characterised by social and communication diffi-culties in day-to-day life, including problems in recognising emotions. However, experimental investi-gations of emotion recognition ability in ASD have been equivocal, hampered by small sample sizes,narrow IQ range and over-focus on the visual modality. Methods: We tested 99 adolescents (mean age15;6 years, mean IQ 85) with an ASD and 57 adolescents without an ASD (mean age 15;6 years, meanIQ 88) on a facial emotion recognition task and two vocal emotion recognition tasks (one verbal; one non-verbal). Recognition of happiness, sadness, fear, anger, surprise and disgust were tested. Usingstructural equation modelling, we conceptualised emotion recognition ability as a multimodal con-struct, measured by the three tasks. We examined how the mean levels of recognition of the six emotionsdiffered by group (ASD vs. non-ASD) and IQ (‡ 80 vs. < 80). Results: We found no evidence of a fun-damental emotion recognition deficit in the ASD group and analysis of error patterns suggested that theASD group were vulnerable to the same pattern of confusions between emotions as the non-ASD group.However, recognition ability was significantly impaired in the ASD group for surprise. IQ had a strongand significant effect on performance for the recognition of all six emotions, with higher IQ adolescentsoutperforming lower IQ adolescents. Conclusions: The findings do not suggest a fundamental difficultywith the recognition of basic emotions in adolescents with ASD. Keywords: Autism spectrum disorder,emotion recognition, emotion processing, social communication, structural equation modelling.
Autism spectrum disorders (ASDs), the commonclinical term for the pervasive developmental disor-ders (American Psychiatric Association, 2000; WorldHealth Organisation, 1993), are defined by socialand communication difficulties, and deficits relatedto emotional processing are seen as a hallmarksymptom. Basic emotion recognition is a funda-mental ‘building block’ of more sophisticated emo-tional and social understanding and establishing thedegree of deficit in ASD is important for ascertainingat what level social-emotional understanding beginsto break down for these individuals.
The most widely used emotion recognition taskrequires identification of the emotional state of facesin a forced-choice paradigm, with the participantbeing tested on a selection from the six ‘basic’ emo-tions of happiness, sadness, fear, anger, surpriseand disgust (Ekman & Friesen, 1976). Some studiesreport significantly poorer performance in ASD foreither total score or individual emotions (e.g., Ash-win, Chapman, Colle, & Baron-Cohen, 2006; Baron-Cohen, Spitz, & Cross, 1993; Boraston, Blakemore,Chilvers, & Skuse, 2007; Corden, Chilvers, & Skuse,
2008; Pelphrey et al., 2002; Philip et al., in press;Wallace, Coleman, & Bailey, 2008; Wright et al.,2008) but others have found no difference betweenthe ASD and comparison groups (e.g., Castelli, 2005;Grossman, Klin, Carter, & Volkmar, 2000). For thosestudies that do find a difference, the specific emo-tions that are problematic vary, with each of the coreemotions except for happiness being identified in atleast one study but with sadness and fear being themost commonly cited (Ashwin et al., 2006; Borastonet al., 2007; Corden et al., 2008; Pelphrey et al.,2002; Philip et al., in press; Wallace et al., 2008).One explanation for the inconsistent findings islikely to be sample size, with the studies cited hereincluding between 11 and 39 participants with ASD.In addition, small sample sizes limit exploration ofthe effect of IQ on performance and many previousstudies include exclusively high or low IQ partici-pants.
Research into emotion recognition ability in ASDhas also been limited by over-focus on the visualmodality, specifically the recognition of emotion infaces. Understanding emotional states in real lifeinvolves reading a variety of cues that include tone ofvoice, non-verbal vocalisations, vocal content, ges-Conflict of interest statement: No conflicts declared.
Journal of Child Psychology and Psychiatry 52:3 (2011), pp 275–285 doi:10.1111/j.1469-7610.2010.02328.x
! 2010 The Authors. Journal of Child Psychology and Psychiatry! 2010 Association for Child and Adolescent Mental Health.Published by Blackwell Publishing, 9600 Garsington Road, Oxford OX4 2DQ, UK and 350 Main St, Malden, MA 02148, USA
tures and posture. Recognising emotion from humanvocalisations is the auditory equivalent of facialemotion recognition. Four studies have recentlyinvestigated the recognition of emotion in spokensentences with neutral verbal content (excludingtasks with relevant verbal content, which provideadditional emotional semantic cues), with threefinding evidence of a deficit in children or adults withASD (Lindner & Rosen, 2006; Mazefsky & Oswald,2007; Philip et al., in press) and one finding no dif-ference in adults with Asperger’s syndrome (O’Con-nor, 2007). However, only one (Philip et al., in press)tested the full range of the six ‘basic’ emotions, andnot all used comparison groups that were fullymatched for IQ. Vocal emotion recognition can alsobe assessed by using non-verbal sounds, i.e., vocalexpressions of emotion that do not involve speech(laughter, crying, gasps, etc.), and which are usedexpressly to communicate emotional state. Using aparadigm pioneered by Hobson (1986), studies ofnon-verbal emotion recognition in ASD report bothimpairment (Hobson, 1986; Hobson, Ouston, & Lee,1988) and intact ability (Ozonoff et al., 1990; Prioret al., 1990). However, the paradigm uses cross-modal matching (i.e., pairing emotional voices withemotional faces); we are not aware of any studiesthat have used the more straightforward emotion-word matching paradigm to assess non-verbal vocalemotion recognition in ASD.
Evidence suggests that emotion recognition indifferent domains is underpinned by a multimodalemotion processing ability (e.g., Borod et al., 2000;Scott et al., 1997). However, current research intoemotion recognition ability in ASD investigatesvisual or vocal emotion recognition ability discretely.In the current study we tested both visual (facial) andauditory (verbal and non-verbal vocalisations) emo-tion recognition in adolescents with ASD comparedto age- and IQ-matched controls, including both highand low IQ participants. A structural equationmodelling (SEM) approach allowed us to model‘emotion recognition ability’ for each emotion as acomposite trait, measured by the three tasks. Thisapproach enables us to encapsulate emotion recog-nition ability as a multimodal construct, which weargue better illustrates competence in recognisingemotion than focusing on one modality.
Method
Participants
Ninety-nine adolescents with an ASD (mean age = 15years 6 months (SD 5.6 months)) and 57 adolescentswithout an ASD (mean age = 15;6 (SD 5.9)) were tested.The 99 participants with an ASD (53 childhood autism;46 other ASD) and 26 of the participants without anASD were recruited from the population-derived SpecialNeeds and Autism Project cohort (SNAP; Baird et al.,2006). For this cohort, consensus clinical ICD-10
diagnoses were made using information from the ADI-R(Lord, Rutter, & Le Couteur, 1994) and ADOS-G (Lordet al., 2000) as well as IQ, language and adaptivebehaviour measures (see Baird et al., 2006; for details).The 26 participants assigned to the non-ASD groupwere adolescents who did not reach clinical criteria foran ASD (Baird et al., 2006). Rather, they had a range ofprimary ICD-10 diagnoses (16 mild mental retardation;3 moderate mental retardation; 3 specific reading/spelling disorder; 2 AD/HD; 1 expressive/receptivelanguage disorder; 1 no diagnosis). The remaining non-ASD participants (n = 31) were recruited from localmainstream schools. Parent and teacher report con-firmed that all were typically developing; none had apsychiatric or developmental diagnosis, a statement ofspecial educational needs or were receiving medication.The Social Communication Questionnaire (SCQ; Rutter,Bailey, & Lord, 2003) was collected from parents of 25of the 31 adolescents; no individual scored 15 or above,which is the cut-off for ASD. Measures of IQ wereobtained using the Wechsler Abbreviated Scale ofIntelligence (WASIUK; Wechsler, 1999) with the full-scale IQ of the total cohort ranging from 50 to 133. Toexplore the effects of IQ on performance, the partici-pants were split into low IQ (full-scale IQ < 80) and highIQ (full scale IQ ‡ 80) subgroups. There was a signifi-cant difference in IQ between the high IQ subgroupswith and without ASD, with a mean full-scale IQ of104.0 (SD = 11.8) in the non-ASD group and 96.9 (SD =10.0) in the ASD group (t(91) = 3.07; p < .01). Achievingbalance through pairwise and group-wise matchingwould have lost participants and thus power. Instead,we matched the distributions by weighting the ASDsubjects (formally by the ratio of the non-ASD to ASDkernel density estimates of the within-group IQ distri-butions) and undertaking a weighted analysis in Mplus(Muthen &Muthen, 1998–2007). While it is not possibleto use standard likelihood ratio tests with weighteddata, testing using appropriate Wald tests remainsstraightforward. All estimates, confidence intervals andtest statistics reported took account of this weighting.Following the weighting procedure, there were no groupdifferences between the ASD and non-ASD participantsfor age or IQ (t-test, all p > .10); see Table 1).
The study was approved by the South East ResearchEthics Committee (05/MRE01/67) and informed con-sent was obtained from all participants.
Tasks
All tasks were programmed in Matlab v6.5 (MathworksInc., Sherbon, MA) using Cogent 2000 (WellcomeDepartment of Imaging Neuroscience, UCL Instituteof Neurology, London, UK; http://vislab.ucl.ac.uk/Cogent/) and presented on a Hewlett-Packard laptopcomputer with a 15’’ LCD display screen. For the verbaltasks, stimuli were delivered binaurally through head-phones (Sennheiser HD 280 pro).
Emotion recognition from facial cues. Facialexpressions of emotion task (FE). This task used facesfrom the Ekman–Friesen test of affect recognition(Ekman & Friesen, 1976). The stimuli (.jpg files) wereblack and white halftone photographs of male andfemale faces expressing one of six ‘basic’ emotions
276 Catherine R.G. Jones et al.
! 2010 The AuthorsJournal of Child Psychology and Psychiatry ! 2010 Association for Child and Adolescent Mental Health.
(happiness, sadness, anger, fear, surprise, disgust).Each stimulus was displayed on the screen until theparticipant’s response had been input by the examiner.A total of 60 faces were presented, 10 of each emotion,in the same order as the original Ekman–Friesen test.
Emotion recognition from vocal cues. These tasksused stimuli designed by SS and DS (Sauter, 2006;Sauter, Calder, Eisner, & Scott, in press). The stimulihave been validated in typical adults (Sauter et al., inpress) as well as used in previous studies (Garrido et al.,2009; Sauter & Scott, 2007).
(i) Verbal vocal expressions of emotion task (V-VE). Thestimuli (.wav files) were vocal recordings of four ac-tors (2 male; 2 female) expressing one of the six basicemotions verbally. The verbal content was three-digitnumbers (e.g., ‘one-hundred and thirty-seven’, ‘five-hundred and forty-five’). Stimulus length was onaverage 1.84 s (SD .46 s). A total of 30 stimuli werepresented, 5 of each emotion, in one of six pseudo-randomised orders.
(ii) Non-verbal vocal expressions of emotion task (NV-VE). The stimuli (.wav files) were vocal recordings offour actors (2 male; 2 female) expressing one of thesix basic emotions non-verbally. Examples of thenon-verbal stimuli include crying vocalisations forsadness and laughing vocalisations for happiness.Stimulus length was on average 1.01 s (SD .52 s). Atotal of 30 stimuli were presented, 5 of each emotion,in one of six pseudo-randomised orders.
For all tasks, the inter-response interval was 1000ms.
Design and procedure
Each participant completed the tasks in a random orderover two days of testing (interspersed with other tasks).The lag between the two testing sessions averaged at 29days (SD: 36 days). The laptop was placed directly infront of the participants, who were seated at a desk.A laminated A4 response sheet was placed on the deskbetween the participant and the laptop. The sheet wasdivided into a 3 · 2 grid, with each grid square con-taining one of the response options (‘Happiness’, ‘Sad-ness’, ‘Anger’, Fear’, ‘Surprise’, ‘Disgust’).
Before the task began the participant was asked toread the six emotions aloud. If a participant struggled toread the emotions then cartoon drawings of the emo-
tions were added to the response sheet and the exam-iner reiterated the six response options on each trial asnecessary. For each task, participants were told thatthey were going to see some faces/hear some voices.They were instructed to ‘decide how the person is feel-ing’ and to choose the word from the response sheetthat ‘best describes how that person is feeling’. Partic-ipants were allowed to give their answer verbally orpoint to the word, and the examiner would then inputthe response using one of six labelled keys on the key-board. The FE task also included six practice trials priorto the task, to ensure that the task was understood.
Structural equation modelling. Data were analysedusing structural equation modelling in MPlus 5.2. With18 different measures a method for dealing with theproblems of multiple testing was essential. Since thetasks involved six emotions and three modalities wemade use of structural equation models that recognisedour theory and design and postulated a more parsi-monious set of latent traits that allowed for correlatedmeasurement error. We considered that the tasksmeasured six (correlated) emotion-specific recognitionabilities (latent traits) for each participant. The partici-pant characteristics of diagnosis and IQ group wereallowed to influence item responses only through meandifferences in these six traits (the reference category ofparticipants being set to mean zero on each trait with allitem thresholds freely estimated and thus able to varyin difficulty). We also considered a model with just asingle general emotion recognition factor (i.e., encom-passing all emotion conditions); this offers a morepowerful test of group differences in gross recognitionability in circumstances where emotion-specific traitsare highly correlated.
Since the tasks were of distinct types, notably dis-tinguished by stimulus modality, we also expectedcorrelation in ability by modality. We therefore consid-ered two models. The first, a correlated trait-correlateduniqueness model (CTCU; see Marsh, 1989), modelledthe six emotion-specific recognition abilities (traits), asoutlined above, and allowed 15 free correlations amongthe responses within each of the three modalities (seeFigure 3).The second, a multitrait-multimethod struc-ture model (MTMM; see, e.g., Campbell & Fiske, 1959,and Loehlin, 2004), was more restrictive in postulatingthat a participant’s expected performance on a task wasthe sum of an emotion-specific ability (trait) and astimulus modality-specific (method) ability. Both traitand stimulus modality factors can be linked to
Table 1 Mean age, verbal IQ, performance IQ and full-scale IQ (SD in brackets) for the non-ASD and ASD groups. The recalculatedweighted mean IQ for the ASD groups (ASD-WT) is also shown. Data for all cases, low IQ (FSIQ < 80) and high IQ (FSIQ ‡ 80) shownseparately
n M:F Age VIQ PIQ FSIQ
All Non-ASD 57 54:3 15;6 (5.9) 86.3 (20.2) 91.5 (21.7) 88.0 (22.2)ASD 99 90:9 15;6 (5.6) 81.1 (17.9) 90.6 (18.6) 84.6 (18.0)
Low IQ Non-ASD 23 20:3 15;5 (4.1) 65.8 (8.6) 68.5 (9.5) 64.5 (8.4)ASD 40 35:5 15;6 (5.0) 64.7 (9.9) 73.1 (13.5) 66.4 (9.5)ASD-WT 63.2 70.6 64.3
High IQ Non-ASD 34 34:0 15;7 (6.9) 100.1 (12.5) 107.1 (11.0) 104.0 (11.8)ASD 59 55:4 15;6 (6.0) 92.2 (12.9) 102.4 (10.4) 96.9 (10.0)ASD-WT 96.3 104.8 100.6
Emotion recognition in autism spectrum disorders 277
! 2010 The AuthorsJournal of Child Psychology and Psychiatry ! 2010 Association for Child and Adolescent Mental Health.

explanatory variables. The MTMM model with positivemethod factor loadings assumes consistency of differ-ences across modalities, such that if one emotion iseasier under one modality then all emotions should be.This offered a framework within which systematic dif-ferences across groups by modality (e.g., the ASD groupbeing better with an auditory stimulus) could be tested.However, empirical applications of the MTMM modeloften fail to converge, or converge on improper solutions(Marsh, 1989).
Since the scores on each task were ordinal and onsome tasks some participants performed at or close toceiling, the analysis used WLSMV (weighted leastsquares mean and variance adjusted) in Mplus. Rea-sonable fitting models give Comparative Fit Index (CFI)values of .95 or larger and Root Mean Square Errors(RMSE) of .08 or less. The WLSMV estimator precludesthe use of the standard likelihood ratio comparison ofmodels. Instead, models are compared by means ofadjusted Wald tests.
SEM-based findings were supported by single andmultivariable regression analyses of total and sub-total scores, the latter estimated using a generalizedestimating equation (GEE) with an unstructuredcovariance matrix estimated in Stata 11 (StataCorp,2009).
Results
Emotion recognition abilities in ASD vs. non-ASDparticipants
The mean emotion recognition scores for the threetasks are shown in Figure 1, plotted as a diagnosticgroup comparison, and in Figure 2, plotted as an IQgroup comparison. For technical reasons or timeconstraints, 4 participants were not administeredthe FE task, 4 were not administered the V-VE task,and 3 were not administered the NV-VE task. Allparticipants completed at least one task, so no par-ticipants have been excluded from the illustrativetables and figures or the SEM models.
Data from the tasks were ordinal and censored; nosimple transformation yielded single task scoressuitable for continuous variable methods.
MTMM model. Regardless of parameterisation(Marsh, 1989) this model failed to give a positivedefinitive residual covariance matrix and thus didnot provide a model suitable as a basis for inferringgroup differences. Although more complex methodeffects are possible, simple additive method com-ponents of variance would be expected to result inpositively correlated residual errors. Contrary tothis expectation, the free correlations estimatedamong the 45 within-method measurement errorsfrom the CTCU models (described in the next sec-tion) were generally small, ranging from –.37 (FEhappy with disgust) to .45 (V-VE anger with disgust)with averages of .019 for FE, .113 for V-VE and.053 for NV-VE. Multivariable regression analysis
(using GEE) of the three total scores, obtained fromsumming across the six emotions within eachmethod, gave no evidence for differences in per-formance either for diagnosis by IQ interaction(Adjusted Wald v2(3) = 4.05, p = .26)) or for diag-nostic group (Adjusted Wald v2(3) = 2.85, p = .42from a model without the diagnosis by IQ inter-action). We therefore focused upon the traits (seebelow), treating the correlations of shared methodeffects as a nuisance.
non-ASDASD
Emotion
Emotion
Emotion
Faci
al e
xpre
ssio
ns s
core
Verb
al v
ocal
exp
ress
ions
sco
reN
on-v
erba
l voc
al e
xpre
ssio
ns s
core
0
1
2
3
4
5
6
7
8
9
10
H S F A Su D
0
1
2
3
4
5
H S F A Su D
0
1
2
3
4
5
H S F A Su D
(a)
(b)
(c)
Figure 1 Mean scores for each emotion on the threetasks (± SE) compared by diagnostic group: (a) Facialexpressions (FE) (b) Verbal vocal expressions (V-VE) (c)Non-verbal vocal expressions (NV-VE) H = Happy; S =Sad; F = Fear; A = Anger; Su = Surprise; D = Disgust
278 Catherine R.G. Jones et al.
! 2010 The AuthorsJournal of Child Psychology and Psychiatry ! 2010 Association for Child and Adolescent Mental Health.

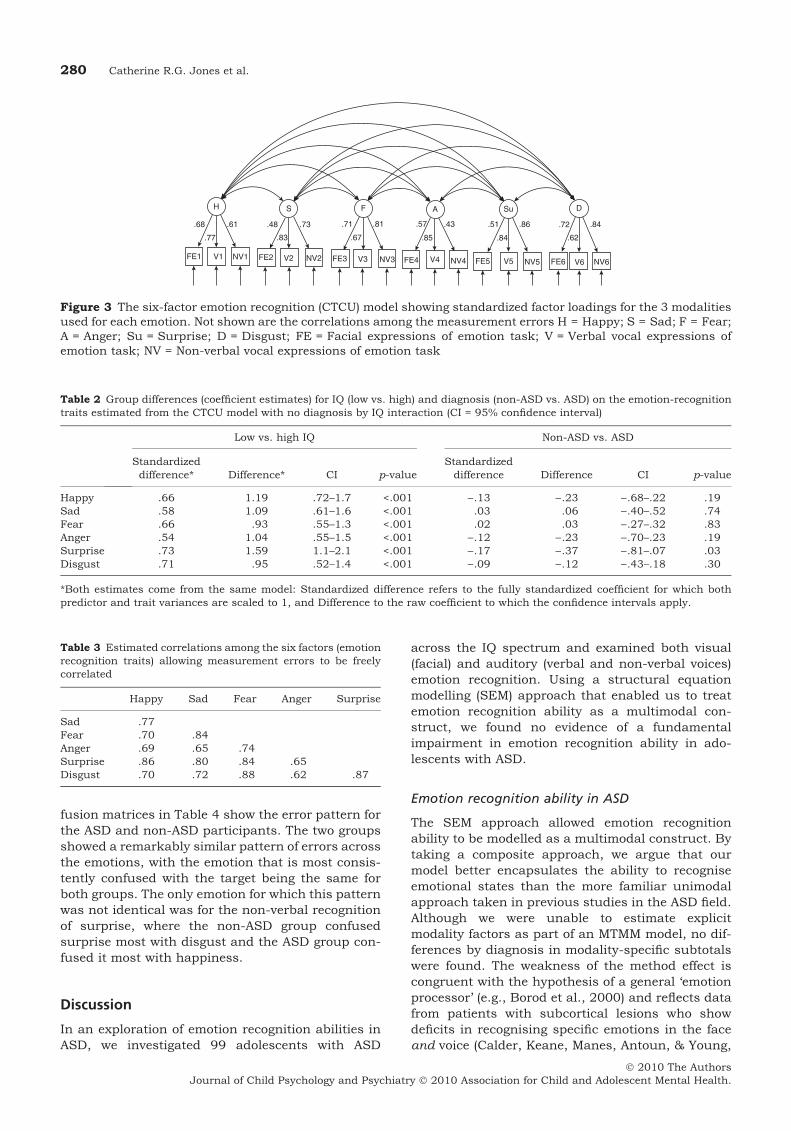
CTCU model. Figure 3 shows parameter estimatesfrom the CTCU model. As is often the case (seeBrown, 2006), although the v2 test of model fit indi-cated imperfect fit (v2(37) = 65.17, p = .003), both theCFI (.96) and the RMSE (.07) criteria suggested thefit to be satisfactory. As expected and shown on thefigure, the standardized loadings for each latentemotion recognition trait factor were all positive. Thetrait factors explained on average half of the taskscore variance (ranging between 18% for non-verbalanger and 74% for verbal surprise).
Extending the model to regress the emotion rec-ognition trait factors on the participant groups (IQ,diagnosis and their interaction) showed no signifi-cant effect for the interaction (diagnosis by IQ) eitherindividually (1df Wald test p-values: happy .30, sad.16, fear .48, anger .53, surprise .75 and disgust .61)or altogether (adjusted Wald v2 (6) = 2.75, p = .84)(Model v2 (46) = 62.05, p = .06; CFI = .96; RMSE =.047). The conventional statistical approach is to findthe most parsimonious model, so the model wasrefitted without the interaction. This main effectsonly model, (Model v2 (49) = 74.65, p = .01; CFI = .95;RMSE = .058), gave the coefficient estimates shownin Table 2. Consistently significant and large effectswere evident for IQ group but not for diagnosis (thegroup difference for surprise was significant at thenominal critical p-value of .05 but not the Bonferronicorrected value of .008). A combined Wald test forthe six diagnosis group differences was not signifi-cant (v2 (6) = 9.93, p = .13). The pattern of findingswas similar when IQ was modelled as a continuousvariable.
The estimated correlations among the traits areshown in Table 3. The smallest of these correlationsis .62, suggesting that emotion recognition abilitydoes not have a marked specificity in this sample.We therefore also tested a model in which the sixemotion factors were replaced by a single factor forall 18 tasks. As in the six-factor model, correlationsamong the errors for measures using the samemodality were allowed. This model, (Model v2 (41) =88.34, p < .001; CFI: .94; RMSE: .086) fitted mar-ginally less well that the six-factor solution. Consis-tent with the six-factor solution model, there was noevidence for differences for diagnosis by IQ interac-tion (p > .2). Further, in the absence of the interac-tion (Model v2 (56) = 99.45, p = .0003; CFI: .91;RMSE: .071) there was no significant effect of diag-nosis (standardized difference = ).079, SE = .063,p = .208) but a significant effect of IQ (standardizedIQ group difference = .726; SE = .107; p < .001).Thus, a one-factor solution, although providing amore powerful test for gross differences by diagnosis,did not alter the pattern of findings.
We used the non-central chi-square method toestimate the power to detect a medium-size groupdifference of .7 SD on the means of the six latentemotion variables. This gave 67% for happy, 84% forsad, 88% for anger, 87% for fear, 83% for surpriseand 77% for disgust. For the single common factormodel the power was 96% to detect a group differ-ence of .7 SD and 76% for .5 SD.
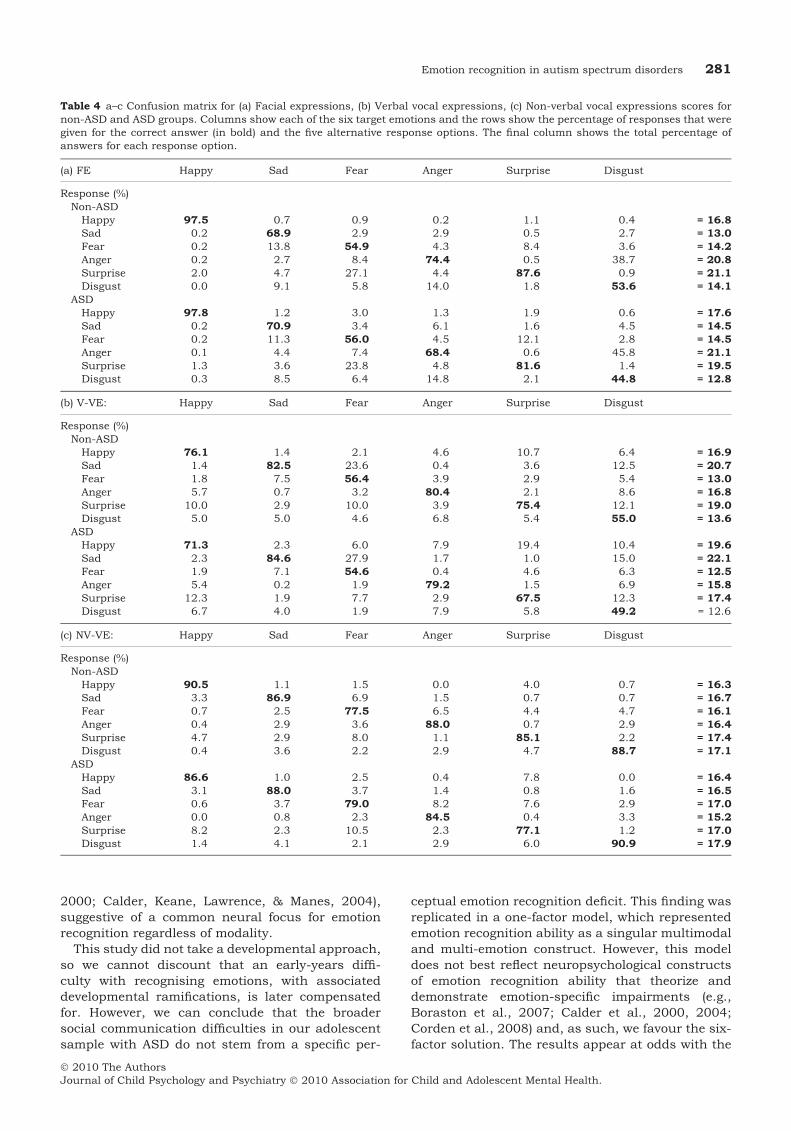
Error patterns in recognising individual emotions inASD vs. non-ASD
Analysis of error patterns on raw percentage accu-racy scores was used to determine if the ASD groupwere making systematic errors (i.e., confusing twoemotions) not seen in the non-ASD group. The con-
FSIQ<80FSIQ>=80
Faci
al e
xpre
ssio
ns s
core
Verb
al v
ocal
exp
ress
ions
sco
reN
on-v
erba
l voc
al e
xpre
ssio
ns s
core
Emotion
Emotion
Emotion
0
1
2
3
4
5
6
7
8
9
10
H S F A Su D
0
1
2
3
4
5
H S F A Su D
0
1
2
3
4
5
H S F A Su D
(a)
(b)
(c)
Figure 2 Mean scores for each emotion on the threetasks (± SE) compared by IQ group: (a) Facial expres-sions (FE) (b) Verbal vocal expressions (V-VE) (c) Non-verbal vocal expressions (NV-VE) H = Happy; S = Sad;F = Fear; A = Anger; Su = Surprise; D = Disgust
Emotion recognition in autism spectrum disorders 279
! 2010 The AuthorsJournal of Child Psychology and Psychiatry ! 2010 Association for Child and Adolescent Mental Health.
fusion matrices in Table 4 show the error pattern forthe ASD and non-ASD participants. The two groupsshowed a remarkably similar pattern of errors acrossthe emotions, with the emotion that is most consis-tently confused with the target being the same forboth groups. The only emotion for which this patternwas not identical was for the non-verbal recognitionof surprise, where the non-ASD group confusedsurprise most with disgust and the ASD group con-fused it most with happiness.
Discussion
In an exploration of emotion recognition abilities inASD, we investigated 99 adolescents with ASD
across the IQ spectrum and examined both visual(facial) and auditory (verbal and non-verbal voices)emotion recognition. Using a structural equationmodelling (SEM) approach that enabled us to treatemotion recognition ability as a multimodal con-struct, we found no evidence of a fundamentalimpairment in emotion recognition ability in ado-lescents with ASD.
Emotion recognition ability in ASD
The SEM approach allowed emotion recognitionability to be modelled as a multimodal construct. Bytaking a composite approach, we argue that ourmodel better encapsulates the ability to recogniseemotional states than the more familiar unimodalapproach taken in previous studies in the ASD field.Although we were unable to estimate explicitmodality factors as part of an MTMM model, no dif-ferences by diagnosis in modality-specific subtotalswere found. The weakness of the method effect iscongruent with the hypothesis of a general ‘emotionprocessor’ (e.g., Borod et al., 2000) and reflects datafrom patients with subcortical lesions who showdeficits in recognising specific emotions in the faceand voice (Calder, Keane, Manes, Antoun, & Young,
H
.68 .61
.77
S
.48
.83
.73 .71
.67
.81
F A
.57
.85
.43 .51
.84
.86
Su
.72
.62
.84
D
FE1 V1 NV1 FE2 V2 NV2 FE3 V3 NV3 FE4 V4 NV4 FE5 V5 NV5 FE6 V6 NV6
Figure 3 The six-factor emotion recognition (CTCU) model showing standardized factor loadings for the 3 modalitiesused for each emotion. Not shown are the correlations among the measurement errors H = Happy; S = Sad; F = Fear;A = Anger; Su = Surprise; D = Disgust; FE = Facial expressions of emotion task; V = Verbal vocal expressions ofemotion task; NV = Non-verbal vocal expressions of emotion task
Table 2 Group differences (coefficient estimates) for IQ (low vs. high) and diagnosis (non-ASD vs. ASD) on the emotion-recognitiontraits estimated from the CTCU model with no diagnosis by IQ interaction (CI = 95% confidence interval)
Low vs. high IQ Non-ASD vs. ASD
Standardizeddifference* Difference* CI p-value
Standardizeddifference Difference CI p-value
Happy .66 1.19 .72–1.7 <.001 ).13 ).23 ).68–.22 .19Sad .58 1.09 .61–1.6 <.001 .03 .06 ).40–.52 .74Fear .66 .93 .55–1.3 <.001 .02 .03 ).27–.32 .83Anger .54 1.04 .55–1.5 <.001 ).12 ).23 ).70–.23 .19Surprise .73 1.59 1.1–2.1 <.001 ).17 ).37 ).81–.07 .03Disgust .71 .95 .52–1.4 <.001 ).09 ).12 ).43–.18 .30
*Both estimates come from the same model: Standardized difference refers to the fully standardized coefficient for which bothpredictor and trait variances are scaled to 1, and Difference to the raw coefficient to which the confidence intervals apply.
Table 3 Estimated correlations among the six factors (emotionrecognition traits) allowing measurement errors to be freelycorrelated
Happy Sad Fear Anger Surprise
Sad .77Fear .70 .84Anger .69 .65 .74Surprise .86 .80 .84 .65Disgust .70 .72 .88 .62 .87
280 Catherine R.G. Jones et al.
! 2010 The AuthorsJournal of Child Psychology and Psychiatry ! 2010 Association for Child and Adolescent Mental Health.
2000; Calder, Keane, Lawrence, & Manes, 2004),suggestive of a common neural focus for emotionrecognition regardless of modality.
This study did not take a developmental approach,so we cannot discount that an early-years diffi-culty with recognising emotions, with associateddevelopmental ramifications, is later compensatedfor. However, we can conclude that the broadersocial communication difficulties in our adolescentsample with ASD do not stem from a specific per-
ceptual emotion recognition deficit. This finding wasreplicated in a one-factor model, which representedemotion recognition ability as a singular multimodaland multi-emotion construct. However, this modeldoes not best reflect neuropsychological constructsof emotion recognition ability that theorize anddemonstrate emotion-specific impairments (e.g.,Boraston et al., 2007; Calder et al., 2000, 2004;Corden et al., 2008) and, as such, we favour the six-factor solution. The results appear at odds with the
Table 4 a–c Confusion matrix for (a) Facial expressions, (b) Verbal vocal expressions, (c) Non-verbal vocal expressions scores fornon-ASD and ASD groups. Columns show each of the six target emotions and the rows show the percentage of responses that weregiven for the correct answer (in bold) and the five alternative response options. The final column shows the total percentage ofanswers for each response option.
(a) FE Happy Sad Fear Anger Surprise Disgust
Response (%)Non-ASDHappy 97.5 0.7 0.9 0.2 1.1 0.4 = 16.8Sad 0.2 68.9 2.9 2.9 0.5 2.7 = 13.0Fear 0.2 13.8 54.9 4.3 8.4 3.6 = 14.2Anger 0.2 2.7 8.4 74.4 0.5 38.7 = 20.8Surprise 2.0 4.7 27.1 4.4 87.6 0.9 = 21.1Disgust 0.0 9.1 5.8 14.0 1.8 53.6 = 14.1
ASDHappy 97.8 1.2 3.0 1.3 1.9 0.6 = 17.6Sad 0.2 70.9 3.4 6.1 1.6 4.5 = 14.5Fear 0.2 11.3 56.0 4.5 12.1 2.8 = 14.5Anger 0.1 4.4 7.4 68.4 0.6 45.8 = 21.1Surprise 1.3 3.6 23.8 4.8 81.6 1.4 = 19.5Disgust 0.3 8.5 6.4 14.8 2.1 44.8 = 12.8
(b) V-VE: Happy Sad Fear Anger Surprise Disgust
Response (%)Non-ASDHappy 76.1 1.4 2.1 4.6 10.7 6.4 = 16.9Sad 1.4 82.5 23.6 0.4 3.6 12.5 = 20.7Fear 1.8 7.5 56.4 3.9 2.9 5.4 = 13.0Anger 5.7 0.7 3.2 80.4 2.1 8.6 = 16.8Surprise 10.0 2.9 10.0 3.9 75.4 12.1 = 19.0Disgust 5.0 5.0 4.6 6.8 5.4 55.0 = 13.6
ASDHappy 71.3 2.3 6.0 7.9 19.4 10.4 = 19.6Sad 2.3 84.6 27.9 1.7 1.0 15.0 = 22.1Fear 1.9 7.1 54.6 0.4 4.6 6.3 = 12.5Anger 5.4 0.2 1.9 79.2 1.5 6.9 = 15.8Surprise 12.3 1.9 7.7 2.9 67.5 12.3 = 17.4Disgust 6.7 4.0 1.9 7.9 5.8 49.2 = 12.6
(c) NV-VE: Happy Sad Fear Anger Surprise Disgust
Response (%)Non-ASDHappy 90.5 1.1 1.5 0.0 4.0 0.7 = 16.3Sad 3.3 86.9 6.9 1.5 0.7 0.7 = 16.7Fear 0.7 2.5 77.5 6.5 4.4 4.7 = 16.1Anger 0.4 2.9 3.6 88.0 0.7 2.9 = 16.4Surprise 4.7 2.9 8.0 1.1 85.1 2.2 = 17.4Disgust 0.4 3.6 2.2 2.9 4.7 88.7 = 17.1
ASDHappy 86.6 1.0 2.5 0.4 7.8 0.0 = 16.4Sad 3.1 88.0 3.7 1.4 0.8 1.6 = 16.5Fear 0.6 3.7 79.0 8.2 7.6 2.9 = 17.0Anger 0.0 0.8 2.3 84.5 0.4 3.3 = 15.2Surprise 8.2 2.3 10.5 2.3 77.1 1.2 = 17.0Disgust 1.4 4.1 2.1 2.9 6.0 90.9 = 17.9
Emotion recognition in autism spectrum disorders 281
! 2010 The AuthorsJournal of Child Psychology and Psychiatry ! 2010 Association for Child and Adolescent Mental Health.

majority of face emotion recognition studies, whichhave found evidence of a deficit in ASD (e.g., Ashwinet al., 2006; Boraston et al., 2007; Corden et al.,2008; Wallace et al., 2008; Wright et al., 2008) (thedata on vocal emotion recognition are too sparse toprovide a true precedent). However, our study hasused a methodologically sound approach thatincorporates the largest sample tested to date, thefull range of testable IQ and a narrow age-range. Itshould also be noted that emotion-specific deficits injust one or two emotions have often been reported inthe absence of a global (across emotion) deficit,which does not indicate a fundamental emotionrecognition dysfunction (e.g., Boraston et al., 2007;Corden et al., 2008; Wright et al., 2008) and thespecific emotions that cause difficulty have beenvariable across studies. Further, studies usingdifferent methodologies have also indicated thatemotion recognition may be intact in ASD (e.g.,Buitelaar, van der Wees, Swaab-Barneveld, & vander Gaag, 1999; Loveland et al., 1997; Ozonoff,Pennington, & Rogers, 1990).
By dividing our groups into those of low (FSIQ< 80) and high (FSIQ ‡ 80) IQ we were also able toinvestigate the effects of IQ on performance. Par-ticipants with a low IQ had significantly worse rec-ognition ability for all emotions, regardless ofwhether they had an ASD or not, which comple-ments earlier studies demonstrating the importanceof IQ on emotion recognition ability (Buitelaar et al.,1999; Loveland et al., 1997). A more recent studyreported that individuals with and without ASD andwith a low verbal mental age performed similarly ona measure of facial emotion discrimination(Loveland, Bachevalier, Pearson, & Lane, 2008).However, for those with a higher verbal mental age,the ASD group performed significantly more poorlythan those without a diagnosis. We found no evi-dence of a Group · IQ interaction in our owndataset. Comparing our data to a developmentalstudy of performance on the Ekman–Friesen faces(Campbell et al., 2006), both low IQ groups scoredat an equivalent level to typically developing 6–7-year-olds, whilst the high IQ groups performedsimilarly to typically developing 15–17-year-olds. Indemonstrating that IQ rather than diagnosis is adiscriminator of emotion recognition ability, ourfindings align with Wright et al. (2008) who foundthat age, sex and IQ accounted for 55% of the var-iance on a facial emotion recognition task (totalscore) amongst a group of children with and with-out ASD, whilst diagnosis only accounted for anadditional 1%.
When discussing these results it should beacknowledged that the recognition of emotional cuescan be measured in a variety of ways, and this nec-essarily limits the generalisability of the results. Thecurrent design collates performance from indepen-dently measured modes and creates a single index ofmulti-channel processing proficiency. This is dis-
tinct from a cross-modal approach, where the abilityto simultaneously integrate information from differ-ent modalities produces a unitary response. There-fore, our results cannot speak to the ability ofindividuals with ASD to simultaneously integrateemotional information across modalities and it ispossible that deficits might be apparent at the levelof complex multi-sensory integration (although seeLoveland et al., 1997 for a null result). Further, thestimuli in the current study represent salientexemplars of the chosen emotions. We cannot inferhow the adolescents with ASD would have respondedto more ambiguous stimuli, which exhibit lessintense expressions of emotion; behavioural resultshave been mixed (e.g., Castelli, 2005; Humphreys,Minshew, Leonard, & Behrmann, 2007), whilst arecent imaging study suggests a lack of neuralmodulation to changes in the intensity of facial fearin ASD (Ashwin, Baron-Cohen, Wheelwright,O’Riordan, & Bullmore, 2007). Specific to visualstimuli, there are additional literatures on dynamicfacial stimuli (e.g., Gepner, Deruelle, & Grynfeltt,2001), as well as emotional gesture and bodilyexpression (e.g., Atkinson, 2009; Hobson, 1986).However, our null result in such a large sampleusing multimodal measuring of a very specific andfundamental type of cognitive emotion recognitionprovides an appropriate platform from which toexplore and compare variation in performanceacross the nuances of emotion recognition.
When discussing the limitations of the study it isalso important to recognise that the sample size,although large within the ASD literature, providesgood power only for effects of medium size or larger.Although our fit indices were good and our confi-dence intervals acceptable, the impact of this studywould be bolstered by replication in other largesamples.
A circumscribed difficulty in recognising surprise
We found modest evidence of a circumscribed diffi-culty with the recognition of surprise. Baron-Cohenet al. (1993) have argued that, unlike emotions suchas happiness or sadness that are typically under-stood at the ‘simple’ (produced by a situation) level,surprise is invariably a ‘cognitive’ emotion (producedby a belief), i.e., understanding the person’s belief isnecessary to understand the emotion. The expres-sion of surprise is further complex as, unlike theother core emotions, it can reflect both positive andnegative valance or even be affectively neutral. Thisvaried valance has led to discussion that surprise isnot an emotion but is a cognitive state that ‘focuseson aspects of knowledge and belief rather than onaffect per se’ (Ortony & Turner, 1990, p. 317). Con-curring with our results, Baron-Cohen et al. (1993)reported that low-functioning children with ASDhave difficulty in recognising the facial expression ofsurprise but not happiness or sadness. The majority
282 Catherine R.G. Jones et al.
! 2010 The AuthorsJournal of Child Psychology and Psychiatry ! 2010 Association for Child and Adolescent Mental Health.

of emotion recognition studies have not reported aspecific deficit in surprise recognition, although ourmultimodal approach is better suited to detecting adeficit that is driven by cognitive factors that are notmodality-specific. From a different perspective, thesocial motivation hypothesis (see Dawson, Webb, &McPartland, 2005) asserts that lack of interest insocial cues in ASD reduces the attention paid tothem, ultimately leading to individuals with adegraded sensitivity for social and emotional nuan-ces. This has echoes of the cognitive avoidanceof emotional situations seen in individuals withgeneralised social anxiety disorder, behaviour thatis known to impact upon emotion recognitioncapabilities (see Montagne et al., 2006 for a discus-sion). It could be suggested that avoidance of, orinattendance to, social situations exponentially im-pacts the development of recognition of emotionsthat are (a) less common in everyday life and (b)dependent on complex social scenarios, includingbeliefs. We argue that, using these criteria, surpriseis the emotion that would be most vulnerable. It isalso worth acknowledging that many parents andcare-givers learn that their child with ASD respondswell to routine and finds surprising or unexpectedevents difficult to manage. This could lead to care-givers moderating their reactions of surprise andalso avoiding exposing their child to events thatevoke surprise, which speculatively may contributeto under-exposure of this particular emotionalexpression.
Emotion recognition processing style is similar inASD and non-ASD
For all three tasks, analysis of the confusions indi-viduals made when recognising emotions showed aremarkably similar pattern of errors across thegroups with and without ASD. This is compatiblewith the hypothesis that similar styles of deductivereasoning are underpinning comparison of similarvisual or auditory information in both groups. Forexample, both groups mistook facial expressions offear for surprise around 25% of the time and mistookfacial expressions of surprise for fear around 10% ofthe time; this is arguably due to orienting to andmisinterpreting the wide eyes seen in both emotionalstates. Previous research into the processing styleused during emotion recognition in ASD has beenfocused in the visual domain. Studies of the patternof eye gaze during face scanning suggest atypicallooking patterns in ASD (Hernandez et al., 2009;Pelphrey et al., 2002; although see van der Geest,Kemner, Verbaten, & van Engeland, 2002 for a nulleffect). However, this seems to be driven by the in-creased amount of time spent looking at non-corefacial features or outside of the picture. When indi-viduals with ASD are looking at core facial features
they show the same basic pattern of looking prefer-ences as controls, spending more time looking at theeyes and starting gaze search with the eyes(Hernandez et al., 2009; Pelphrey et al., 2002). Thisseems to suggest that individuals with ASD collectthe same pertinent perceptual information as thosewithout ASD, but that the quality of this informationis degraded due to reduced looking time, which isperhaps driven by a lack of interest in faces, avoid-ance of faces or difficulties with attention. Of note,there is suggestion that the modification of gazefocus as a function of emotional expression is thesame for those with and without ASD (Hernandez etal., 2009; van der Geest et al., 2002). Although wedid not collect eye-tracking data and cannot com-ment directly on the looking patterns of our ownparticipants, the distribution of confusion errors andthe comparable level of performance across groupsare congruent with the hypothesis that the visualscanning of core facial features in adolescents withASD is similar to those without ASD.
Summary
In recognising ASD as a complex behavioural, per-ceptual and cognitive disorder it is important toisolate potential contributing factors to theexpressed symptoms, which are invariably multi-faceted. By targeting emotion recognition ability wewere able to explore a relatively basic and funda-mental contributor to social and communicationcompetence. Further, the application of SEMenabled us to model emotion recognition ability morerealistically as a composite of multi-channel pro-cessing proficiency. Our results suggest that basicemotion recognition ability should not be consideredin isolation as the source of the social and commu-nication difficulties observed in ASD.
Acknowledgements
This study was supported by the Medical ResearchCouncil (G0400065) and research at the Centre forResearch in Autism and Education is supported bythe Clothworkers’ Foundation and the Pears Foun-dation. We are grateful to the participants and theirparents for generously giving their time to take partin this study.
Correspondence to
Tony Charman, Centre for Research in Autism andEducation, Department of Psychology and HumanDevelopment, Institute of Education, 25 WoburnSquare, London WC1H 0AA, UK; Email: [email protected]
Emotion recognition in autism spectrum disorders 283
! 2010 The AuthorsJournal of Child Psychology and Psychiatry ! 2010 Association for Child and Adolescent Mental Health.

Key points
• Emotion recognition ability in ASD has primarily focused on emotion recognition of faces and results havebeen varied.
• Using a large sample (n = 99) of adolescents with ASD and matched controls, we modelled emotionrecognition as a composite of visual (face) and vocal (verbal and non-verbal) emotion recognition ability.
• There was no evidence of a fundamental difficulty with emotion recognition in the adolescents with ASD,although a circumscribed difficulty with surprise was noted.
• IQ had a large and significant effect on performance, with higher IQ adolescents outperforming lower IQadolescents.
• Clinically, this suggests that basic emotion recognition should not be considered a source of social andcommunication difficulties in adolescents with ASD.
References
American Psychiatric Association. (2000). Diagnostic andstatistical manual of mental disorders 4th edn – textrevision (DSM-IV-TR). Washington, DC: American Psychi-atric Association.
Ashwin, C., Baron-Cohen, S., Wheelwright, S., O’Riordan,M., & Bullmore, E.T. (2007). Differential activation of theamygdala and the ‘social brain’ during fearful face-processing in Asperger syndrome. Neuropsychologia,45, 2–14.
Ashwin, C., Chapman, E., Colle, L., & Baron-Cohen, S.(2006). Impaired recognition of negative basic emotionsin autism: A test of the amygdala theory. Social Neuro-science, 1, 349–363.
Atkinson, A.P. (2009). Impaired recognition of emotionsfrom body movements is associated with elevated motioncoherence thresholds in autism spectrum disorders.Neuropsychologia, 47, 3023–3029.
Baird, G., Simonoff, E., Pickles, A., Chandler, S., Loucas,T., Meldrum, D., & Charman, T. (2006). Prevalence ofdisorders of the autism spectrum in a population cohortof children in South Thames: The Special Needs andAutism Project (SNAP). Lancet, 368, 210–215.
Baron-Cohen, S., Spitz, A., & Cross, P. (1993). Do childrenwith autism recognise surprise? A research note. Cogni-tion and Emotion, 7, 507–516.
Boraston, Z., Blakemore, S.J., Chilvers, R., & Skuse, D.(2007). Impaired sadness recognition is linked to socialinteraction deficit in autism. Neuropsychologia, 45,1501–1510.
Borod, J.C., Pick, L.H., Hall, S., Sliwinski, M., Madigan, N.,Obler, L.K., Welkowitz, J., Canino, E., Erhan, H.M.,Goral, M., Morrison, C., & Tabert, M. (2000). Relation-ships among facial, prosodic and lexical channels ofemotional perceptual processing. Cognition and Emotion,14, 193–211.
Brown, T.A. (2006). Confirmatory factor analysis. NewYork: Guilford Press.
Buitelaar, J.K., van der Wees, M., Swaab-Barneveld, H., &van der Gaag, R.J. (1999). Verbal memory and perfor-mance IQ predict theory of mind and emotion recognitionability in children with autistic spectrum disorders andin psychiatric control children. Journal of Child Psychol-ogy and Psychiatry, 40, 869–881.
Calder, A.J., Keane, J., Lawrence, A.D., & Manes, F.(2004). Impaired recognition of anger following damageto the ventral striatum. Brain, 127, 1958–1969.
Calder, A.J., Keane, J., Manes, F., Antoun, N., & Young,A.W. (2000). Impaired recognition and experience of
disgust following brain injury. Nature Neuroscience, 3,1077–1078.
Campbell, D.T., & Fiske, D.W. (1959). Convergent anddiscriminant validation by the multitrait-multimethodmatrix. Psychological Bulletin, 56, 81–105.
Campbell, R., Lawrence, K., Mandy, W., Mitra, C., Jeya-kuma, L., & Skuse, D. (2006). Meanings in motion andfaces: Developmental associations between the process-ing of intention from geometrical animations and gazedetection accuracy. Development and Psychopathology,18, 99–118.
Castelli, F. (2005). Understanding emotions from stan-dardized facial expressions in autism and normal devel-opment. Autism, 9, 428–449.
Corden, B., Chilvers, R., & Skuse, D. (2008). Avoidance ofemotionally arousing stimuli predicts social-perceptualimpairment in Asperger’s syndrome. Neuropsychologia,46, 137–147.
Dawson, G., Webb, S.J., & McPartland, J. (2005). Under-standing the nature of face processing impairment inautism: Insights frombehavioral and electrophysiologicalstudies. Developmental Neuropsychology, 27, 403–424.
Ekman, P., & Friesen, W.V. (1976). Pictures of facial affect.Palo Alto, CA: Consulting Psychologists Press.
Garrido, L., Eisner, F., McGettigan, C., Stewart, L., Sauter,D., Hanley, J.R., Schweinberger, S.R., Warren, J.D., &Duchaine, B. (2009). Developmental phonagnosia: Aselective deficit to vocal identity recognition. Neuropsych-ologia, 47, 123–131.
Gepner, B., Deruelle, C., & Grynfeltt, S. (2001). Motion andemotion: A novel approach to the study of face process-ing by young autistic children. Journal of Autism andDevelopmental Disorders, 31, 37–45.
Grossman, J.B., Klin, A., Carter, A.S., & Volkmar, F.R.(2000). Verbal bias in recognition of facial emotions inchildren with Asperger syndrome. Journal of Child Psy-chology and Psychiatry, 41, 369–379.
Hernandez, N., Metzger, A., Magne, R., Bonnet-Brilhault,F., Roux, S., Barthelemy, C., & Martineau, J. (2009).Exploration of core features of a human face by healthyand autistic adults analyzed by visual scanning. Neuro-psychologia, 47, 1004–1012.
Hobson, R.P. (1986). The autistic child’s appraisal orexpressions of emotion. Journal of Child Psychologyand Psychiatry, 27, 321–342.
Hobson, R.P., Ouston, J., & Lee, A. (1988). Emotionrecognition in autism: Co-ordinating faces and voices.Psychological Medicine, 18, 911–923.
Humphreys, K., Minshew, N., Leonard, G.L., & Behrmann,M. (2007). A fine-grained analysis of facial expression
284 Catherine R.G. Jones et al.
! 2010 The AuthorsJournal of Child Psychology and Psychiatry ! 2010 Association for Child and Adolescent Mental Health.

processing in high-functioning adults with autism. Neu-ropsychologia, 45, 685–695.
Lindner, J.L., & Rosen, L.A. (2006). Decoding of emotionthrough facial expression, prosody and verbal content inchildren and adolescents with Asperger’s syndrome.Journal of Autism and Developmental Disorders, 36,769–777.
Loehlin, J.C. (2004). Latent variable models: An introduc-tion to factor, path, and structural analysis (4th edn).Hillsdale, NJ: Lawrence Erlbaum Associates.
Lord, C., Risi, S., Lambrecht, L., Cook, E.H., Leventhal,B.L., DiLavore, P.C., Pickles, A., & Rutter, M. (2000). TheAutism Diagnostic Observation Schedule–Generic: Astandard measure of social and communication deficitsassociated with the spectrum of autism. Journal ofAutism and Developmental Disorders, 30, 205–223.
Lord, C., Rutter, M., & Le Couteur, A. (1994). AutismDiagnostic Interview–Revised – A revised version of adiagnostic interview for caregivers of individuals withpossible pervasive developmental disorders. Journal ofAutism and Developmental Disorders, 24, 659–685.
Loveland, K.A., Bachevalier, J., Pearson, D.A., & Lane,D.M. (2008). Front-limbic functioning in children andadolescents with and without autism. Neuropsychologia,15, 49–62.
Loveland, K.A., Tunali-Kotoski, B., Chen, Y.R., Ortegon, J.,Pearson, D.A., Brelsford, K.A., & Gibbs, M.C. (1997).Emotion recognition in autism: Verbal and nonverbalinformation. Development and Psychopathology, 9, 579–593.
Marsh, H.W. (1989). Confirmatory factor analysis of multi-trait-multimethod data: Many problems and a few solu-tions. Applied Psychological Measurement, 13, 335–361.
Mazefsky, C.A., & Oswald, D.P. (2007). Emotion perceptionin Asperger’s syndrome and high-functioning autism:The importance of diagnostic criteria and cue intensity.Journal of Autism and Developmental Disorders, 37,1086–1095.
Muthen, L.K., & Muthen, B.O. (1998-2007). Mplus user’sguide (5th edn). Los Angeles, CA: Muthen & Muthen.
Montagne, B., Schutters, S., Westenberg, H.G., van Honk,J., Kessels, R.P., & de Haan, E.H. (2006). Reducedsensitivity in the recognition of anger and disgust insocial anxiety disorder. Cognitive Neuropsychiatry, 11,389–401.
O’Connor, K. (2007). Brief report: Impaired identification ofdiscrepancies between expressive faces and voices inadults with Asperger’s syndrome. Journal of Autism andDevelopmental Disorders, 37, 2008–2013.
Ortony, A., & Turner, T.J. (1990). What’s basic about basicemotions? Psychological Review, 97, 315–331.
Ozonoff, S., Pennington, B.F., & Rogers, S.J. (1990). Arethere emotion perception deficits in young autistic chil-dren? Journal of Child Psychology and Psychiatry, 31,343–361.
Pelphrey, K.A., Sasson, N.J., Reznick, J.S., Paul, G.,Goldman, B.D., & Piven, J. (2002). Visual scanning of
faces in autism. Journal of Autism and DevelopmentalDisorders, 32, 249–261.
Philip, R.C.M., Whalley, H.C., Stanfield, A.C., Sprengel-meyer, R., Santos, I.M., Young, A.W., Atkinson, A.P.,Calder, A.J., Johnstone, E.C., Lawrie, S.M., & Hall, J.(in press). Deficits in facial, body movement and vocalemotional processing in autism spectrum disorders.Psychological Medicine, available on CJO 27 Jan 2010doi:10.1017/S0033291709992364.
Prior, M., Dahlstrom, B., & Squires, T.L. (1990). Autisticchildren’s knowledge of thinking and feeling states inother people. Journal of Child Psychology and Psychia-try, 31, 587–601.
Rutter, M., Bailey, A., & Lord, C. (2003). Social Communi-cation Questionnaire (SCQ). Los Angeles, CA: WesternPsychological Services.
Sauter, D. (2006). An investigation into vocal expressions ofemotions: The roles of valence, culture and acousticfactors. University College London.
Sauter, D., Calder, A.J., Eisner, F., & Scott, S.K. (in press).Perceptual cues in non-verbal vocal expressions ofemotion. Quarterly Journal of Experimental Psychology,First published on: 29 April 2010 (iFirst).
Sauter, D., & Scott, S.K. (2007). More than one kind ofhappiness: Can we recognise vocal expressions of dif-ferent positive states? Motivation and Emotion, 31, 192–99.
Scott, S.K., Young, A.W., Calder, A.J., Hellawell, D.J.,Aggleton, J.P., & Johnson, M. (1997). Impaired auditoryrecognition of fear and anger following bilateral amyg-dala lesions. Nature, 385, 254–257.
StataCorp. (2009). Statistical software: Release 11.0. Col-lege Station, TX: Stata Corporation.
van der Geest, J.N., Kemner, C., Verbaten, M.N., & vanEngeland, H. (2002). Gaze behaviour of children withpervasive developmental disorder toward human faces: Afixation time study. Journal of Child Psychology andPsychiatry, 43, 669–678.
Wallace, S., Coleman, M., & Bailey, A. (2008). An investi-gation of basic facial expression recognition in autismspectrum disorders. Cognition and Emotion, 22, 1353–1380.
Wechsler, D. (1999). The Wechsler Abbreviated Scale ofIntelligence – UK. San Antonio, TX: The PsychologicalCorporation.
Wright, B., Clarke, N., Jordan, J., Young, A.W., Clarke, P.,Miles, J., Nation, K., Clarke, L., & Williams, C. (2008).Emotion recognition in faces and the use of visualcontext in young people with high-functioning autismspectrum disorders. Autism, 12, 607–626.
World Health Organisation. (1993). Mental disorders: Aglossary and guide to their classification in accordancewith the 10th revision of the International Classificationof Diseases: Research diagnostic criteria (ICD-10). Gene-va: WHO.
Manuscript accepted 2 July 2010
Emotion recognition in autism spectrum disorders 285
! 2010 The AuthorsJournal of Child Psychology and Psychiatry ! 2010 Association for Child and Adolescent Mental Health.