Multimodal Data Collection System for Driver Emotion ... - MDPI
21
Citation: Oh, G.; Jeong, E.; Kim, R.C.; Yang, J.H.; Hwang, S.; Lee, S.; Lim, S. Multimodal Data Collection System for Driver Emotion Recognition Based on Self-Reporting in Real-World Driving. Sensors 2022, 22, 4402. https://doi.org/10.3390/ s22124402 Academic Editors: Mincheol Whang and Sung Park Received: 29 April 2022 Accepted: 7 June 2022 Published: 10 June 2022 Publisher’s Note: MDPI stays neutral with regard to jurisdictional claims in published maps and institutional affil- iations. Copyright: © 2022 by the authors. Licensee MDPI, Basel, Switzerland. This article is an open access article distributed under the terms and conditions of the Creative Commons Attribution (CC BY) license (https:// creativecommons.org/licenses/by/ 4.0/). sensors Article Multimodal Data Collection System for Driver Emotion Recognition Based on Self-Reporting in Real-World Driving Geesung Oh 1 , Euiseok Jeong 1 , Rak Chul Kim 1 , Ji Hyun Yang 2 , Sungwook Hwang 3 , Sangho Lee 3 and Sejoon Lim 2, * 1 Graduate School of Automotive Engineering, Kookmin University, Seoul 02707, Korea; [email protected] (G.O.); [email protected] (E.J.); [email protected] (R.C.K.) 2 Department of Automobile and IT Convergence, Kookmin University, Seoul 02707, Korea; [email protected] 3 Chassis System Control Research Lab, Hyundai Motor Group, Hwaseong 18280, Korea; [email protected] (S.H.); [email protected] (S.L.) * Correspondence: [email protected]; Tel.: +82-2-910-5469 Abstract: As vehicles provide various services to drivers, research on driver emotion recognition has been expanding. However, current driver emotion datasets are limited by inconsistencies in collected data and inferred emotional state annotations by others. To overcome this limitation, we propose a data collection system that collects multimodal datasets during real-world driving. The proposed system includes a self-reportable HMI application into which a driver directly inputs their current emotion state. Data collection was completed without any accidents for over 122 h of real-world driving using the system, which also considers the minimization of behavioral and cognitive disturbances. To demonstrate the validity of our collected dataset, we also provide case studies for statistical analysis, driver face detection, and personalized driver emotion recognition. The proposed data collection system enables the construction of reliable large-scale datasets on real-world driving and facilitates research on driver emotion recognition. The proposed system is avaliable on GitHub. Keywords: driver emotion recognition; multimodal; self-report; real-world driving 1. Introduction In recent decades, the use of data-driven state-of-the-art techniques such as deep learning has increased interest in and performance of human affect recognition [1]. This has increased interest in the development of driver emotion recognition systems. Since driving is significantly affected by the driver’s emotions [2–4], driver emotion recognition studies have been conducted for various purposes such as driving safety, adjusting vehicle dynamics, and emotion elicitation of drivers [4–6]. All studies are affected by the quality and quantity of data. Therefore, research on quantitative and qualitative datasets for driver emotion recognition is being actively conducted [7–14]. Although large-scale and high-quality datasets are collected through various studies, the collection conditions vary significantly. First, the experimental environment is largely divided into simulation and real-world driving. Second, the modalities of collected signals are also diverse. When broadly classified, there are video, audio, bio-physiological, and con- troller area network (CAN) data. In detail, the position of cameras and microphones differ, and the collection list of biophysiological or CAN data is not unified. Lastly, the annotation of emotional states is various, which is critical for emotion recognition. The simplest way to classify a driver’s emotional state is by driving experiments (e.g., assume that heavy traffic on the urban is high stress, and light traffic on the highway is low stress) [7–9]. There is also an approach in which external annotators judge a driver’s emotional state based on the collected information about the driver. However, this approach has limitations in that it has Sensors 2022, 22, 4402. https://doi.org/10.3390/s22124402 https://www.mdpi.com/journal/sensors
-
Upload
khangminh22 -
Category
Documents
-
view
0 -
download
0
Transcript of Multimodal Data Collection System for Driver Emotion ... - MDPI

Citation: Oh, G.; Jeong, E.; Kim, R.C.;
Yang, J.H.; Hwang, S.; Lee, S.; Lim, S.
Multimodal Data Collection System
for Driver Emotion Recognition
Based on Self-Reporting in
Real-World Driving. Sensors 2022, 22,
4402. https://doi.org/10.3390/
s22124402
Academic Editors: Mincheol Whang
and Sung Park
Received: 29 April 2022
Accepted: 7 June 2022
Published: 10 June 2022
Publisher’s Note: MDPI stays neutral
with regard to jurisdictional claims in
published maps and institutional affil-
iations.
Copyright: © 2022 by the authors.
Licensee MDPI, Basel, Switzerland.
This article is an open access article
distributed under the terms and
conditions of the Creative Commons
Attribution (CC BY) license (https://
creativecommons.org/licenses/by/
4.0/).
sensors
Article
Multimodal Data Collection System for Driver EmotionRecognition Based on Self-Reporting in Real-World DrivingGeesung Oh 1 , Euiseok Jeong 1, Rak Chul Kim 1, Ji Hyun Yang 2 , Sungwook Hwang 3, Sangho Lee 3
and Sejoon Lim 2,*
1 Graduate School of Automotive Engineering, Kookmin University, Seoul 02707, Korea;[email protected] (G.O.); [email protected] (E.J.); [email protected] (R.C.K.)
2 Department of Automobile and IT Convergence, Kookmin University, Seoul 02707, Korea;[email protected]
3 Chassis System Control Research Lab, Hyundai Motor Group, Hwaseong 18280, Korea;[email protected] (S.H.); [email protected] (S.L.)
* Correspondence: [email protected]; Tel.: +82-2-910-5469
Abstract: As vehicles provide various services to drivers, research on driver emotion recognitionhas been expanding. However, current driver emotion datasets are limited by inconsistencies incollected data and inferred emotional state annotations by others. To overcome this limitation, wepropose a data collection system that collects multimodal datasets during real-world driving. Theproposed system includes a self-reportable HMI application into which a driver directly inputstheir current emotion state. Data collection was completed without any accidents for over 122 hof real-world driving using the system, which also considers the minimization of behavioral andcognitive disturbances. To demonstrate the validity of our collected dataset, we also provide casestudies for statistical analysis, driver face detection, and personalized driver emotion recognition. Theproposed data collection system enables the construction of reliable large-scale datasets on real-worlddriving and facilitates research on driver emotion recognition. The proposed system is avaliableon GitHub.
Keywords: driver emotion recognition; multimodal; self-report; real-world driving
1. Introduction
In recent decades, the use of data-driven state-of-the-art techniques such as deeplearning has increased interest in and performance of human affect recognition [1]. Thishas increased interest in the development of driver emotion recognition systems. Sincedriving is significantly affected by the driver’s emotions [2–4], driver emotion recognitionstudies have been conducted for various purposes such as driving safety, adjusting vehicledynamics, and emotion elicitation of drivers [4–6]. All studies are affected by the qualityand quantity of data. Therefore, research on quantitative and qualitative datasets for driveremotion recognition is being actively conducted [7–14].
Although large-scale and high-quality datasets are collected through various studies,the collection conditions vary significantly. First, the experimental environment is largelydivided into simulation and real-world driving. Second, the modalities of collected signalsare also diverse. When broadly classified, there are video, audio, bio-physiological, and con-troller area network (CAN) data. In detail, the position of cameras and microphones differ,and the collection list of biophysiological or CAN data is not unified. Lastly, the annotationof emotional states is various, which is critical for emotion recognition. The simplest way toclassify a driver’s emotional state is by driving experiments (e.g., assume that heavy trafficon the urban is high stress, and light traffic on the highway is low stress) [7–9]. There is alsoan approach in which external annotators judge a driver’s emotional state based on thecollected information about the driver. However, this approach has limitations in that it has
Sensors 2022, 22, 4402. https://doi.org/10.3390/s22124402 https://www.mdpi.com/journal/sensors
Sensors 2022, 22, 4402 2 of 21
a high-cost and requires others to report their emotional states [10,11]. In the self-reportingapproach, drivers report their emotional states, but this should not interfere with the maintask of driving. Hence, it is restricted to experiments through simulation or they have toreport their emotional states after the completion of the experiments [12–14]. As previouslystated, since data collection environments, measured data types, and annotation methodsvery, Zepf et al. have argued that a consistent dataset is needed to facilitate research ondriver emotion recognition [15].
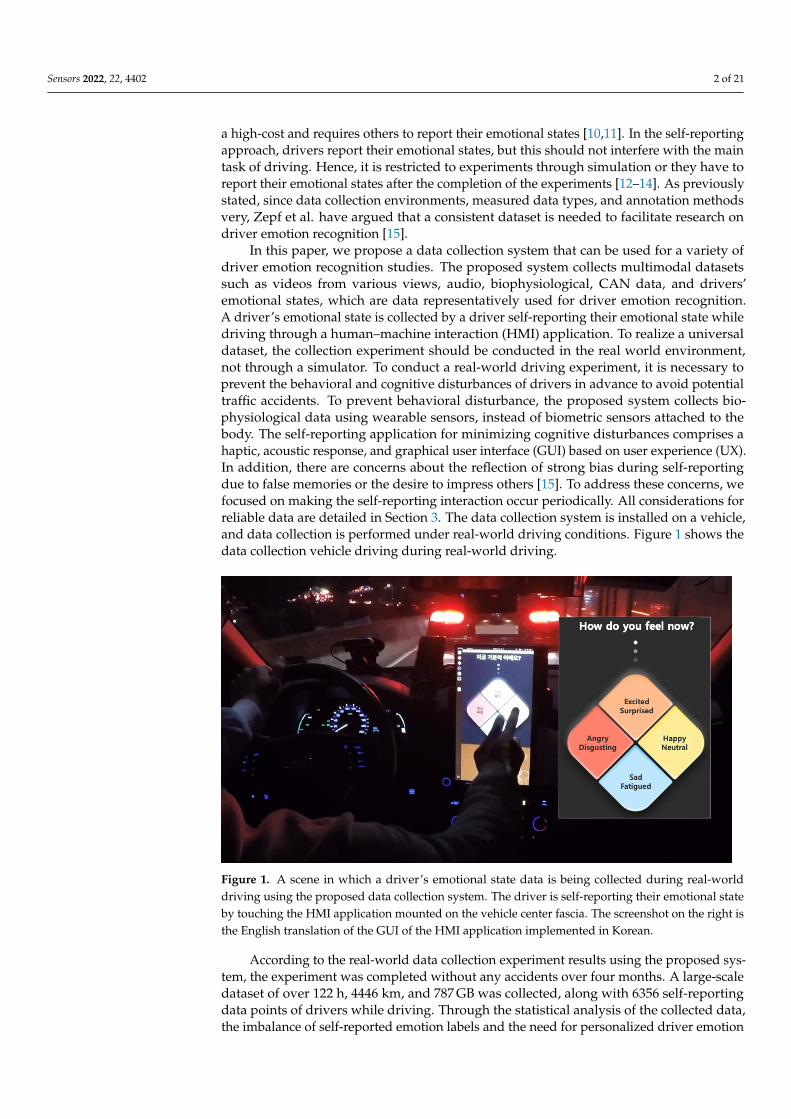
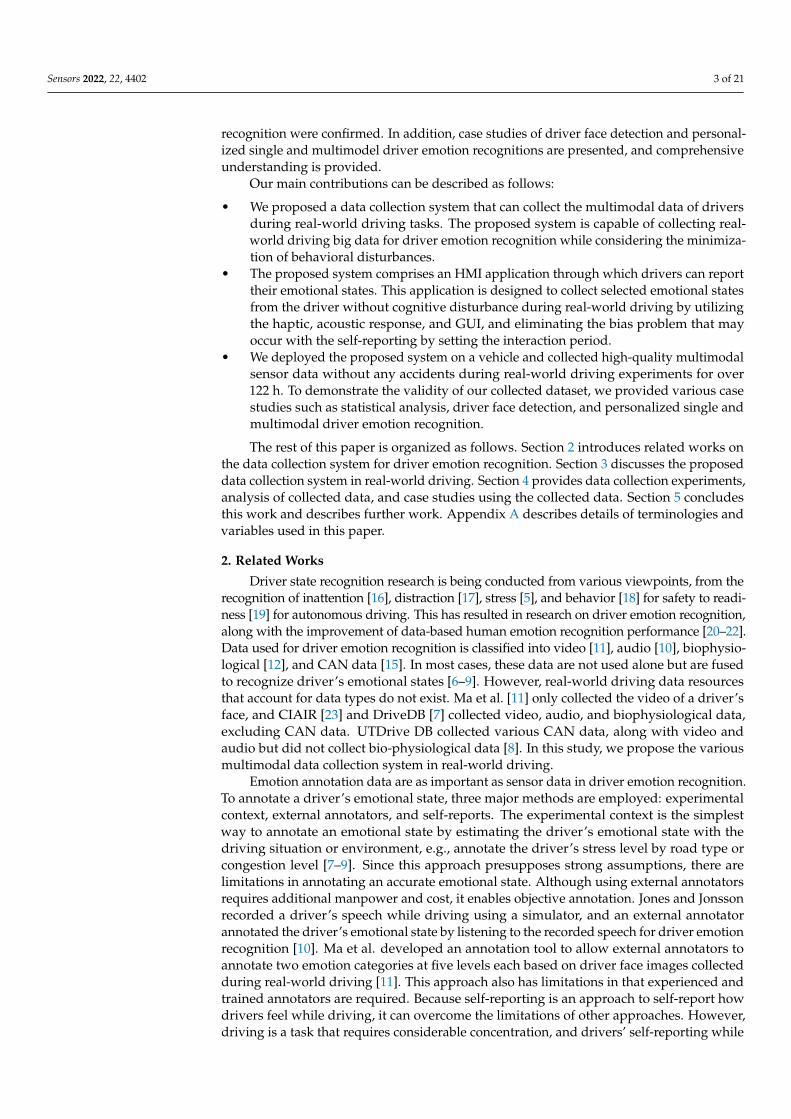
In this paper, we propose a data collection system that can be used for a variety ofdriver emotion recognition studies. The proposed system collects multimodal datasetssuch as videos from various views, audio, biophysiological, CAN data, and drivers’emotional states, which are data representatively used for driver emotion recognition.A driver’s emotional state is collected by a driver self-reporting their emotional state whiledriving through a human–machine interaction (HMI) application. To realize a universaldataset, the collection experiment should be conducted in the real world environment,not through a simulator. To conduct a real-world driving experiment, it is necessary toprevent the behavioral and cognitive disturbances of drivers in advance to avoid potentialtraffic accidents. To prevent behavioral disturbance, the proposed system collects bio-physiological data using wearable sensors, instead of biometric sensors attached to thebody. The self-reporting application for minimizing cognitive disturbances comprises ahaptic, acoustic response, and graphical user interface (GUI) based on user experience (UX).In addition, there are concerns about the reflection of strong bias during self-reportingdue to false memories or the desire to impress others [15]. To address these concerns, wefocused on making the self-reporting interaction occur periodically. All considerations forreliable data are detailed in Section 3. The data collection system is installed on a vehicle,and data collection is performed under real-world driving conditions. Figure 1 shows thedata collection vehicle driving during real-world driving.
Figure 1. A scene in which a driver’s emotional state data is being collected during real-worlddriving using the proposed data collection system. The driver is self-reporting their emotional stateby touching the HMI application mounted on the vehicle center fascia. The screenshot on the right isthe English translation of the GUI of the HMI application implemented in Korean.
According to the real-world data collection experiment results using the proposed sys-tem, the experiment was completed without any accidents over four months. A large-scaledataset of over 122 h, 4446 km, and 787 GB was collected, along with 6356 self-reportingdata points of drivers while driving. Through the statistical analysis of the collected data,the imbalance of self-reported emotion labels and the need for personalized driver emotion
Sensors 2022, 22, 4402 3 of 21
recognition were confirmed. In addition, case studies of driver face detection and personal-ized single and multimodel driver emotion recognitions are presented, and comprehensiveunderstanding is provided.
Our main contributions can be described as follows:
• We proposed a data collection system that can collect the multimodal data of driversduring real-world driving tasks. The proposed system is capable of collecting real-world driving big data for driver emotion recognition while considering the minimiza-tion of behavioral disturbances.
• The proposed system comprises an HMI application through which drivers can reporttheir emotional states. This application is designed to collect selected emotional statesfrom the driver without cognitive disturbance during real-world driving by utilizingthe haptic, acoustic response, and GUI, and eliminating the bias problem that mayoccur with the self-reporting by setting the interaction period.
• We deployed the proposed system on a vehicle and collected high-quality multimodalsensor data without any accidents during real-world driving experiments for over122 h. To demonstrate the validity of our collected dataset, we provided various casestudies such as statistical analysis, driver face detection, and personalized single andmultimodal driver emotion recognition.
The rest of this paper is organized as follows. Section 2 introduces related works onthe data collection system for driver emotion recognition. Section 3 discusses the proposeddata collection system in real-world driving. Section 4 provides data collection experiments,analysis of collected data, and case studies using the collected data. Section 5 concludesthis work and describes further work. Appendix A describes details of terminologies andvariables used in this paper.
2. Related Works
Driver state recognition research is being conducted from various viewpoints, from therecognition of inattention [16], distraction [17], stress [5], and behavior [18] for safety to readi-ness [19] for autonomous driving. This has resulted in research on driver emotion recognition,along with the improvement of data-based human emotion recognition performance [20–22].Data used for driver emotion recognition is classified into video [11], audio [10], biophysio-logical [12], and CAN data [15]. In most cases, these data are not used alone but are fusedto recognize driver’s emotional states [6–9]. However, real-world driving data resourcesthat account for data types do not exist. Ma et al. [11] only collected the video of a driver’sface, and CIAIR [23] and DriveDB [7] collected video, audio, and biophysiological data,excluding CAN data. UTDrive DB collected various CAN data, along with video andaudio but did not collect bio-physiological data [8]. In this study, we propose the variousmultimodal data collection system in real-world driving.
Emotion annotation data are as important as sensor data in driver emotion recognition.To annotate a driver’s emotional state, three major methods are employed: experimentalcontext, external annotators, and self-reports. The experimental context is the simplestway to annotate an emotional state by estimating the driver’s emotional state with thedriving situation or environment, e.g., annotate the driver’s stress level by road type orcongestion level [7–9]. Since this approach presupposes strong assumptions, there arelimitations in annotating an accurate emotional state. Although using external annotatorsrequires additional manpower and cost, it enables objective annotation. Jones and Jonssonrecorded a driver’s speech while driving using a simulator, and an external annotatorannotated the driver’s emotional state by listening to the recorded speech for driver emotionrecognition [10]. Ma et al. developed an annotation tool to allow external annotators toannotate two emotion categories at five levels each based on driver face images collectedduring real-world driving [11]. This approach also has limitations in that experienced andtrained annotators are required. Because self-reporting is an approach to self-report howdrivers feel while driving, it can overcome the limitations of other approaches. However,driving is a task that requires considerable concentration, and drivers’ self-reporting while
Sensors 2022, 22, 4402 4 of 21
driving affects the experiment. Hence, most self-reporting is performed immediately afterthe driving experiments. Taib et al. [13] and Ihme et al. [14] conducted a driving simulationexperiment for driver frustration and asked participants who drove for self-reportinginformation after the experiment. Taib et al. used a 9-point Likert scale and Ihme et al.used a self-assessment manikin (SAM) [24] for self-reporting. Kato et al. proposed a self-report application that can visualize data and selected the driver’s emotional state whiledriving [12]. The proposed application enables a driver’s self-reporting to be performedin real time while driving, not after the experiment. This application was only used in asimulation experiment, and to use it in real-world driving experiments, additional safetyconsiderations are required. In addition, concerns about subjective biases that may beincluded in self-reports are another challenge to overcome [15]. In this study, we proposean HMI application that allows drivers to safely report their emotional states while real-world driving.
3. Proposed Work
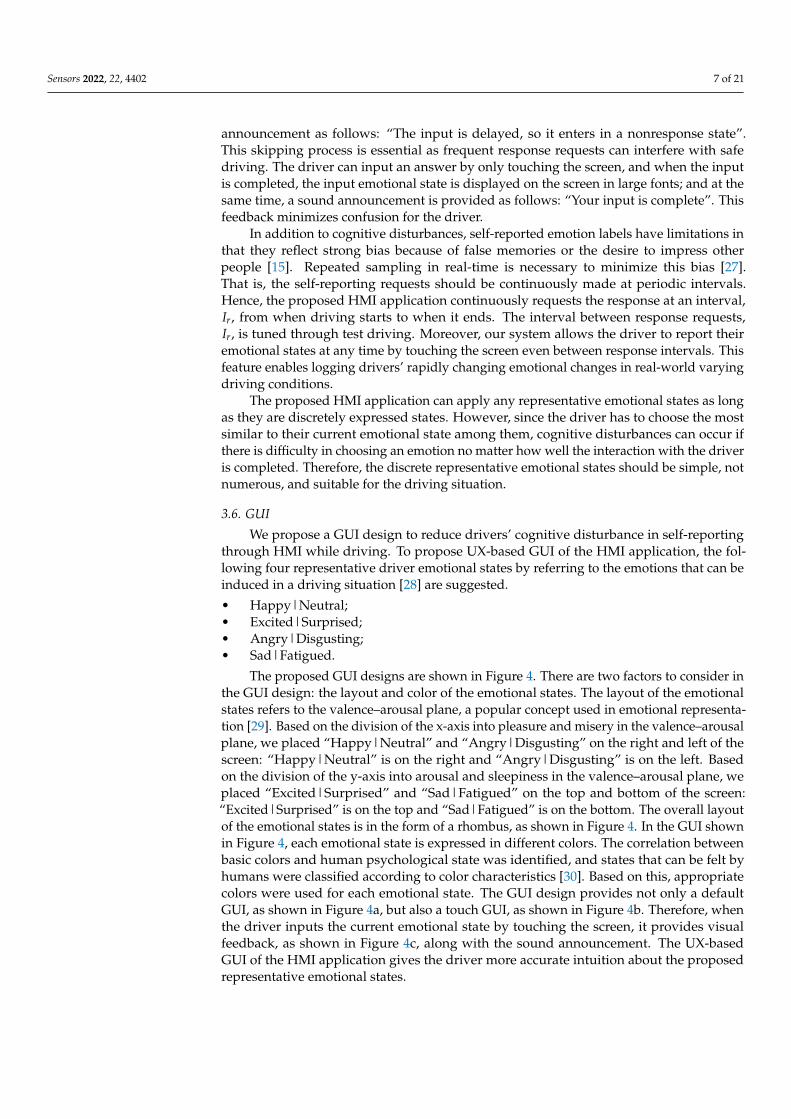
In this section, a system that enables the simultaneous collection of videos, audio,biophysiology, and CAN data during real-world driving is described. The system also in-cludes an HMI application that interacts with the driver and collects the driver’s emotionalstate. In other words, this section demonstrates methods for developing hardware andsoftware systems for a multimodal dataset based on self-reporting in real-world drivingfor driver emotion recognition. All systems are built into the vehicle, as the data collectionis performed under driving conditions. We used an IONIQ 1.6 Hybrid vehicle (Hyundai,Seoul, KR, https://www.hyundai.com/, accessed on 31 March 2022) shown in Figure 2a asthe base environment for building the proposed system. Figure 3 shows the flowchart ofthe entire system. When the system starts, the first thing to check is whether the vehicleis ignited. The system is designed to start after the vehicle is ignited because the surgevoltage generated when the vehicle is ignited can reduce the quality of data collected usingelectronic sensors. In addition, for safety reasons, whether the vehicle is stopped beforestarting and ending the system is checked (blue rhombus in Figure 3). This prevents thedriver from operating the system while driving. After confirming that data collection ispossible, two types of metadata are requested before the main data collection. One is thename of the driver, which must be input by the driver manually. The other is the currentodometer, which can be obtained automatically via vehicle CAN data. After obtainingthe current odometer and treating it as the starting odometer, the main data collectionprocess starts. The main data collection process uses multiprocessing to efficiently collectdifferent multimodel data (orange rectangle in Figure 3). When a suitable end request isinput into the system by the driver, the main data collection process is terminated, and ifthe vehicle is stopped, the vehicle odometer is obtained once more and treated as theending odometer. Finally, all data, metadata, and collected data (green box in Figure 3)are integrated into one dataset (red rectangle in Figure 3) , and the entire system is shutdown. All processes in the proposed system are performed using a computer, shownas Figure 2d. The proposed system is released as an open source repository on GitHub(https://github.com/KMUIMLAB/DMS, accessed on 27 May 2022) and the details of eachdata type for multimodal data collection are discussed in the following sections.
3.1. Video
We use two RealSense D435i cameras (Intel, Santa Clara, CA, USA, https://www.intel.com/, accessed on 31 March 2022) to collect video data composed of various modalities.The RealSense camera provides a maximum of three video modalities: red, green, and blue(RGB), infrared (IR), and depth. In addition to the RGB image, the IR image, which isrobust to environment changes, such as illumination changes, is essential in real-worlddriving. One camera is installed on the dashboard to capture the driver’s face, as shown inFigure 2b, and the other is installed on the top of the passenger seat window to capturethe driver’s posture, as shown in Figure 2c. Since the sample rate of the camera can be set,
Sensors 2022, 22, 4402 5 of 21
we set it as Rv Hz. Alternatively, each camera sequentially captures Rv individual imagesper second.
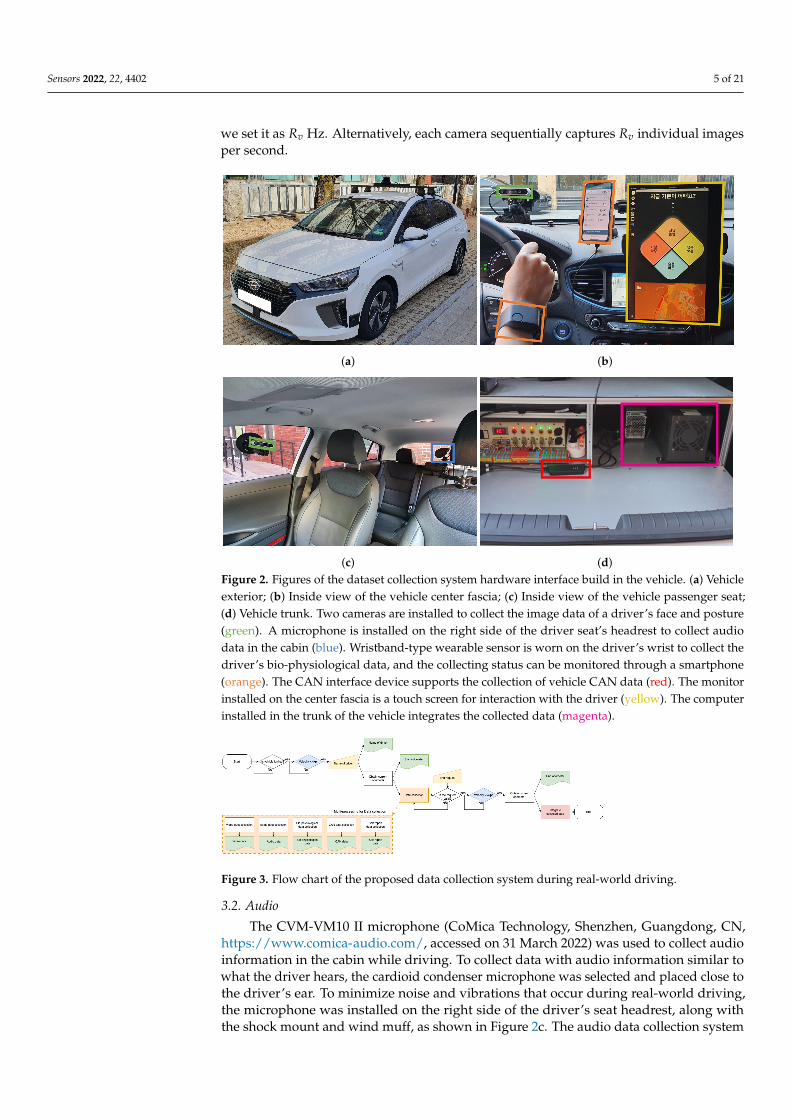
(a) (b)
(c) (d)Figure 2. Figures of the dataset collection system hardware interface build in the vehicle. (a) Vehicleexterior; (b) Inside view of the vehicle center fascia; (c) Inside view of the vehicle passenger seat;(d) Vehicle trunk. Two cameras are installed to collect the image data of a driver’s face and posture(green). A microphone is installed on the right side of the driver seat’s headrest to collect audiodata in the cabin (blue). Wristband-type wearable sensor is worn on the driver’s wrist to collect thedriver’s bio-physiological data, and the collecting status can be monitored through a smartphone(orange). The CAN interface device supports the collection of vehicle CAN data (red). The monitorinstalled on the center fascia is a touch screen for interaction with the driver (yellow). The computerinstalled in the trunk of the vehicle integrates the collected data (magenta).
Figure 3. Flow chart of the proposed data collection system during real-world driving.
3.2. Audio
The CVM-VM10 II microphone (CoMica Technology, Shenzhen, Guangdong, CN,https://www.comica-audio.com/, accessed on 31 March 2022) was used to collect audioinformation in the cabin while driving. To collect data with audio information similar towhat the driver hears, the cardioid condenser microphone was selected and placed close tothe driver’s ear. To minimize noise and vibrations that occur during real-world driving,the microphone was installed on the right side of the driver’s seat headrest, along withthe shock mount and wind muff, as shown in Figure 2c. The audio data collection system

Sensors 2022, 22, 4402 6 of 21
collects Ra audio data samples per second until the system stops according to the samplerate, Ra Hz.
3.3. Biophysiological
To collect biophysiological data of the driver, the biometric sensor must be in contactwith the driver’s body. The attached sensor may cause behavioral disturbances, resultingin potential accidents. For safe biophysiological data collection during real-world driving,it is necessary to prevent behavioral disturbances in advance, and we used an E4 wristband(Empatica, Boston, MA, USA, https://www.empatica.com/, accessed on 31 March 2022),as a solution. The E4 wristband (E4) is a wearable biometric sensor and is used as analternative sensor while exhibiting similar data quality 85% of the time compared to theclinician standard device [25]. As a result of comparing the E4 and laboratory biometricsensor data in terms of emotion recognition performance, similar accuracy was realized [26].Hence, we used the E4 for biophysiological data collection during real-world driving. E4provides skin temperature, electrodermal activity (EDA), photoplethysmography (PPG),and 3-axis acceleration of the band, along with interbeat interval (IBI) and heart rate (HR)through postprocessing. As shown in Figure 2b, biophysiological data collection is possibleby simply wearing E4 on the wrist while driving, and real-time monitoring is also possibleusing a mobile device through the application provided by E4. Unlike video or audio data,E4 collects each data at an optimized sampling rate, so no separate setting is required. Eachsample rate is shown in Table 1.
3.4. CAN
The method of mounting additional sensors or collecting on-board diagnostics (OBD)signals can also be used to access vehicle signals; however, since we can access vehicle CAN,we can collect vehicle signals with the CAN interface device. CAN is a message-basedprotocol designed to allow vehicle controllers to communicate with each other. The USBcanPro 2xHS v2 (KVASER, Mission Viejo, CA, USA, https://www.kvaser.com/, accessed on31 March 2022) is a CAN interface device used to access vehicle CAN signals to collectvehicle data. As shown in Figure 2d, the device is located in the trunk of the vehicle andconnects the vehicle CAN line to the computer. Among the many signals on CAN, weselect key signals closely related to the driver. Since the selected key signals are updatedaccording to the set cycle time, the sample rate of CAN data, Rc, is set according to thecycle time. The collected key data and the sample rate are presented in Table 1.
3.5. HMI
Drivers’ emotion annotation is essential in datasets for driver’s emotion recognition.Although external annotators or the experimental context can be employed to estimate andannotate drivers’ emotional states, we focused on annotating the driver’s emotional stateusing reports from the driver rather than via estimation. This method is called self-reportand will be performed in real-world driving experiments. It must be designed with anemphasis on safety. Requiring drivers to report driving conditions may cause cognitivedisturbances, probably leading to severe traffic accidents on the road.
To minimize cognitive disturbances, we proposed the HMI application that period-ically interacts with the driver through haptic and acoustic response and receives theemotional state response from the driver. We used a TFX133T DEX monitor (HANSUNG,Seoul, KR, https://www.monsterlabs.co.kr/, accessed on 31 March 2022), and the touchscreen has a built-in speaker to realize haptic and acoustic responses. The screen wasinstalled on the center fascia of the vehicle, as shown in Figure 2b. When data collectionstarts, the HMI application requests that the driver report their emotional state with asound announcement as follows: “Please enter your current state”. If there is no responsefrom the driver for Irr seconds from the request, the application requests once more withthe same sound announcement. If there is no response from the driver within Is secondsfrom the first request, not to disturb the driver, it is treated as a nonresponse with a sound
Sensors 2022, 22, 4402 7 of 21
announcement as follows: “The input is delayed, so it enters in a nonresponse state”.This skipping process is essential as frequent response requests can interfere with safedriving. The driver can input an answer by only touching the screen, and when the inputis completed, the input emotional state is displayed on the screen in large fonts; and at thesame time, a sound announcement is provided as follows: “Your input is complete”. Thisfeedback minimizes confusion for the driver.
In addition to cognitive disturbances, self-reported emotion labels have limitations inthat they reflect strong bias because of false memories or the desire to impress otherpeople [15]. Repeated sampling in real-time is necessary to minimize this bias [27].That is, the self-reporting requests should be continuously made at periodic intervals.Hence, the proposed HMI application continuously requests the response at an interval,Ir, from when driving starts to when it ends. The interval between response requests,Ir, is tuned through test driving. Moreover, our system allows the driver to report theiremotional states at any time by touching the screen even between response intervals. Thisfeature enables logging drivers’ rapidly changing emotional changes in real-world varyingdriving conditions.
The proposed HMI application can apply any representative emotional states as longas they are discretely expressed states. However, since the driver has to choose the mostsimilar to their current emotional state among them, cognitive disturbances can occur ifthere is difficulty in choosing an emotion no matter how well the interaction with the driveris completed. Therefore, the discrete representative emotional states should be simple, notnumerous, and suitable for the driving situation.
3.6. GUI
We propose a GUI design to reduce drivers’ cognitive disturbance in self-reportingthrough HMI while driving. To propose UX-based GUI of the HMI application, the fol-lowing four representative driver emotional states by referring to the emotions that can beinduced in a driving situation [28] are suggested.
• Happy|Neutral;• Excited|Surprised;• Angry|Disgusting;• Sad|Fatigued.
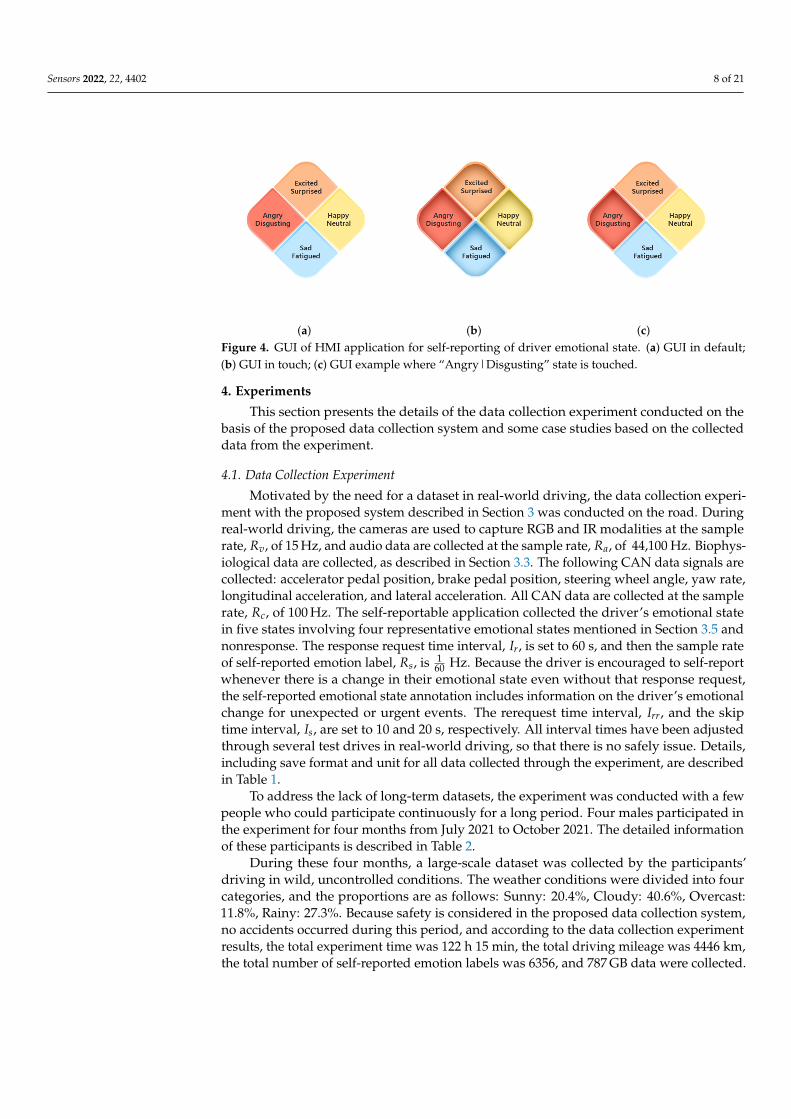
The proposed GUI designs are shown in Figure 4. There are two factors to consider inthe GUI design: the layout and color of the emotional states. The layout of the emotionalstates refers to the valence–arousal plane, a popular concept used in emotional representa-tion [29]. Based on the division of the x-axis into pleasure and misery in the valence–arousalplane, we placed “Happy|Neutral” and “Angry|Disgusting” on the right and left of thescreen: “Happy|Neutral” is on the right and “Angry|Disgusting” is on the left. Basedon the division of the y-axis into arousal and sleepiness in the valence–arousal plane, weplaced “Excited|Surprised” and “Sad|Fatigued” on the top and bottom of the screen:“Excited|Surprised” is on the top and “Sad|Fatigued” is on the bottom. The overall layoutof the emotional states is in the form of a rhombus, as shown in Figure 4. In the GUI shownin Figure 4, each emotional state is expressed in different colors. The correlation betweenbasic colors and human psychological state was identified, and states that can be felt byhumans were classified according to color characteristics [30]. Based on this, appropriatecolors were used for each emotional state. The GUI design provides not only a defaultGUI, as shown in Figure 4a, but also a touch GUI, as shown in Figure 4b. Therefore, whenthe driver inputs the current emotional state by touching the screen, it provides visualfeedback, as shown in Figure 4c, along with the sound announcement. The UX-basedGUI of the HMI application gives the driver more accurate intuition about the proposedrepresentative emotional states.
Sensors 2022, 22, 4402 8 of 21
(a) (b) (c)Figure 4. GUI of HMI application for self-reporting of driver emotional state. (a) GUI in default;(b) GUI in touch; (c) GUI example where “Angry|Disgusting” state is touched.
4. Experiments
This section presents the details of the data collection experiment conducted on thebasis of the proposed data collection system and some case studies based on the collecteddata from the experiment.
4.1. Data Collection Experiment
Motivated by the need for a dataset in real-world driving, the data collection experi-ment with the proposed system described in Section 3 was conducted on the road. Duringreal-world driving, the cameras are used to capture RGB and IR modalities at the samplerate, Rv, of 15 Hz, and audio data are collected at the sample rate, Ra, of 44,100 Hz. Biophys-iological data are collected, as described in Section 3.3. The following CAN data signals arecollected: accelerator pedal position, brake pedal position, steering wheel angle, yaw rate,longitudinal acceleration, and lateral acceleration. All CAN data are collected at the samplerate, Rc, of 100 Hz. The self-reportable application collected the driver’s emotional statein five states involving four representative emotional states mentioned in Section 3.5 andnonresponse. The response request time interval, Ir, is set to 60 s, and then the sample rateof self-reported emotion label, Rs, is 1
60 Hz. Because the driver is encouraged to self-reportwhenever there is a change in their emotional state even without that response request,the self-reported emotional state annotation includes information on the driver’s emotionalchange for unexpected or urgent events. The rerequest time interval, Irr, and the skiptime interval, Is, are set to 10 and 20 s, respectively. All interval times have been adjustedthrough several test drives in real-world driving, so that there is no safely issue. Details,including save format and unit for all data collected through the experiment, are describedin Table 1.
To address the lack of long-term datasets, the experiment was conducted with a fewpeople who could participate continuously for a long period. Four males participated inthe experiment for four months from July 2021 to October 2021. The detailed informationof these participants is described in Table 2.
During these four months, a large-scale dataset was collected by the participants’driving in wild, uncontrolled conditions. The weather conditions were divided into fourcategories, and the proportions are as follows: Sunny: 20.4%, Cloudy: 40.6%, Overcast:11.8%, Rainy: 27.3%. Because safety is considered in the proposed data collection system,no accidents occurred during this period, and according to the data collection experimentresults, the total experiment time was 122 h 15 min, the total driving mileage was 4446 km,the total number of self-reported emotion labels was 6356, and 787 GB data were collected.
Sensors 2022, 22, 4402 9 of 21
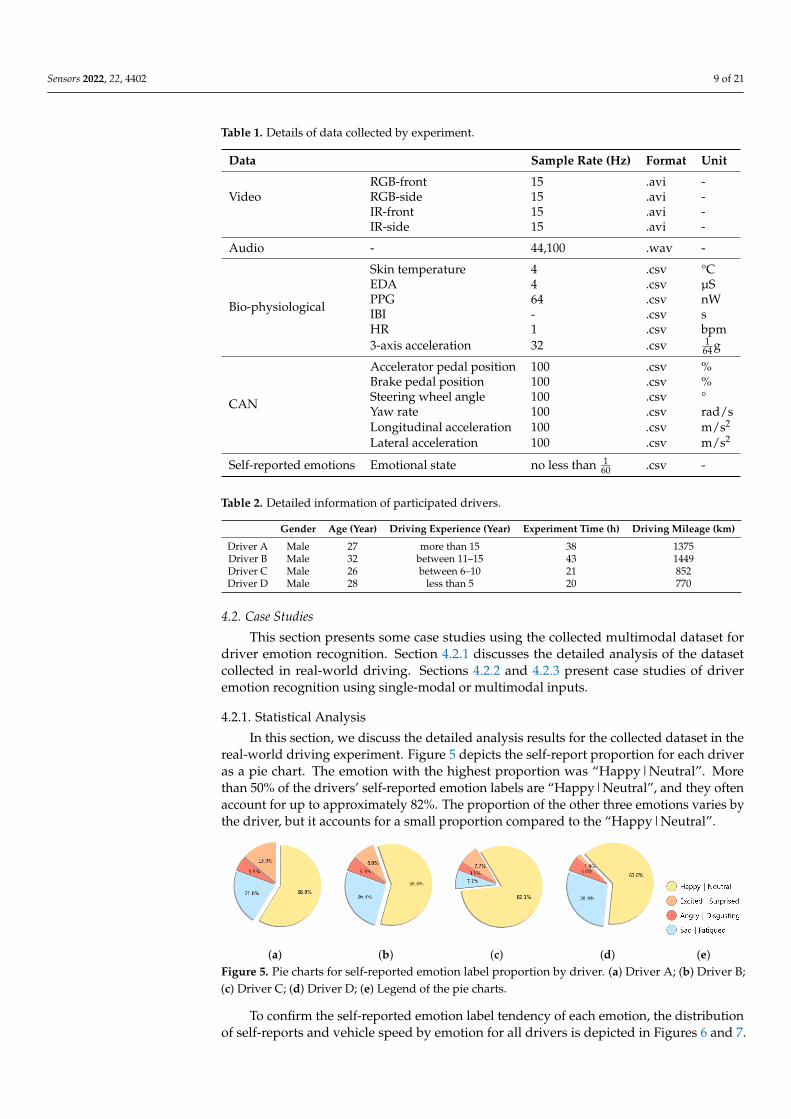
Table 1. Details of data collected by experiment.
Data Sample Rate (Hz) Format Unit
VideoRGB-front 15 .avi -RGB-side 15 .avi -IR-front 15 .avi -IR-side 15 .avi -
Audio - 44,100 .wav -
Bio-physiological
Skin temperature 4 .csv °CEDA 4 .csv µSPPG 64 .csv nWIBI - .csv sHR 1 .csv bpm3-axis acceleration 32 .csv 1
64 g
CAN
Accelerator pedal position 100 .csv %Brake pedal position 100 .csv %Steering wheel angle 100 .csv °Yaw rate 100 .csv rad/sLongitudinal acceleration 100 .csv m/s2
Lateral acceleration 100 .csv m/s2
Self-reported emotions Emotional state no less than 160 .csv -
Table 2. Detailed information of participated drivers.
Gender Age (Year) Driving Experience (Year) Experiment Time (h) Driving Mileage (km)
Driver A Male 27 more than 15 38 1375Driver B Male 32 between 11–15 43 1449Driver C Male 26 between 6–10 21 852Driver D Male 28 less than 5 20 770
4.2. Case Studies
This section presents some case studies using the collected multimodal dataset fordriver emotion recognition. Section 4.2.1 discusses the detailed analysis of the datasetcollected in real-world driving. Sections 4.2.2 and 4.2.3 present case studies of driveremotion recognition using single-modal or multimodal inputs.
4.2.1. Statistical Analysis
In this section, we discuss the detailed analysis results for the collected dataset in thereal-world driving experiment. Figure 5 depicts the self-report proportion for each driveras a pie chart. The emotion with the highest proportion was “Happy|Neutral”. Morethan 50% of the drivers’ self-reported emotion labels are “Happy|Neutral”, and they oftenaccount for up to approximately 82%. The proportion of the other three emotions varies bythe driver, but it accounts for a small proportion compared to the “Happy|Neutral”.
(a) (b) (c) (d) (e)Figure 5. Pie charts for self-reported emotion label proportion by driver. (a) Driver A; (b) Driver B;(c) Driver C; (d) Driver D; (e) Legend of the pie charts.
To confirm the self-reported emotion label tendency of each emotion, the distributionof self-reports and vehicle speed by emotion for all drivers is depicted in Figures 6 and 7.
Sensors 2022, 22, 4402 10 of 21
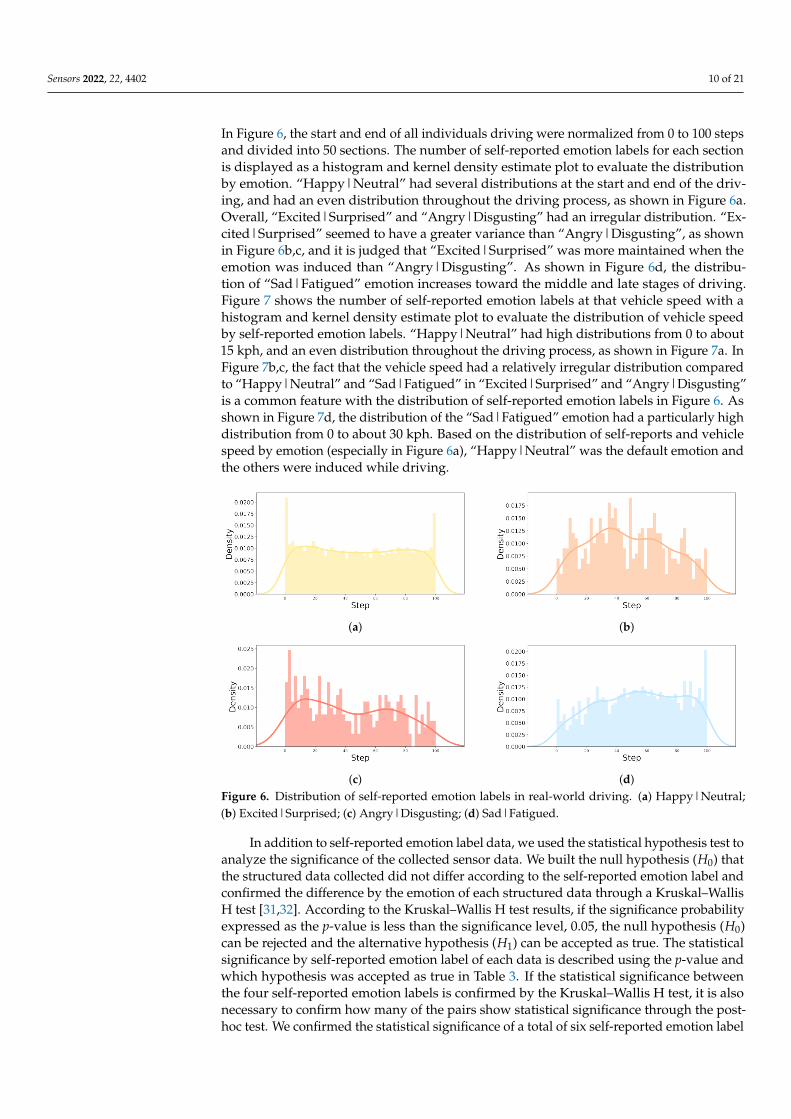
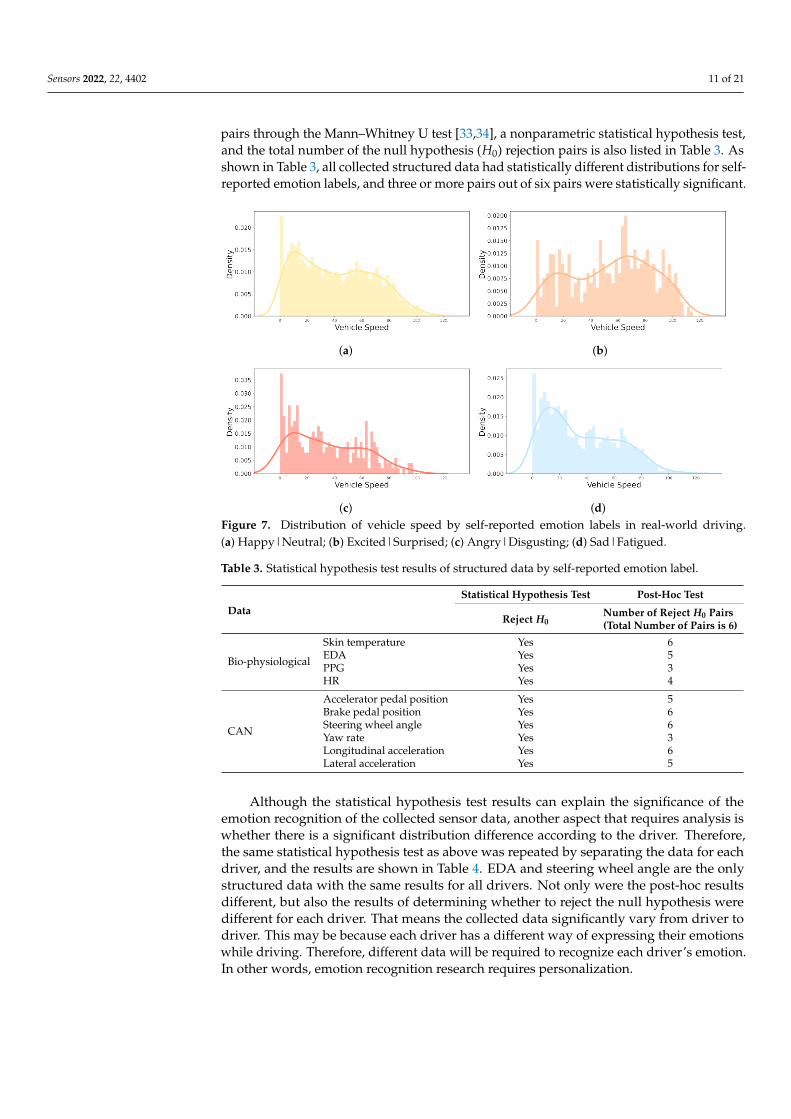
In Figure 6, the start and end of all individuals driving were normalized from 0 to 100 stepsand divided into 50 sections. The number of self-reported emotion labels for each sectionis displayed as a histogram and kernel density estimate plot to evaluate the distributionby emotion. “Happy|Neutral” had several distributions at the start and end of the driv-ing, and had an even distribution throughout the driving process, as shown in Figure 6a.Overall, “Excited|Surprised” and “Angry|Disgusting” had an irregular distribution. “Ex-cited|Surprised” seemed to have a greater variance than “Angry|Disgusting”, as shownin Figure 6b,c, and it is judged that “Excited|Surprised” was more maintained when theemotion was induced than “Angry|Disgusting”. As shown in Figure 6d, the distribu-tion of “Sad|Fatigued” emotion increases toward the middle and late stages of driving.Figure 7 shows the number of self-reported emotion labels at that vehicle speed with ahistogram and kernel density estimate plot to evaluate the distribution of vehicle speedby self-reported emotion labels. “Happy|Neutral” had high distributions from 0 to about15 kph, and an even distribution throughout the driving process, as shown in Figure 7a. InFigure 7b,c, the fact that the vehicle speed had a relatively irregular distribution comparedto “Happy|Neutral” and “Sad|Fatigued” in “Excited|Surprised” and “Angry|Disgusting”is a common feature with the distribution of self-reported emotion labels in Figure 6. Asshown in Figure 7d, the distribution of the “Sad|Fatigued” emotion had a particularly highdistribution from 0 to about 30 kph. Based on the distribution of self-reports and vehiclespeed by emotion (especially in Figure 6a), “Happy|Neutral” was the default emotion andthe others were induced while driving.
(a) (b)
(c) (d)Figure 6. Distribution of self-reported emotion labels in real-world driving. (a) Happy|Neutral;(b) Excited|Surprised; (c) Angry|Disgusting; (d) Sad|Fatigued.
In addition to self-reported emotion label data, we used the statistical hypothesis test toanalyze the significance of the collected sensor data. We built the null hypothesis (H0) thatthe structured data collected did not differ according to the self-reported emotion label andconfirmed the difference by the emotion of each structured data through a Kruskal–WallisH test [31,32]. According to the Kruskal–Wallis H test results, if the significance probabilityexpressed as the p-value is less than the significance level, 0.05, the null hypothesis (H0)can be rejected and the alternative hypothesis (H1) can be accepted as true. The statisticalsignificance by self-reported emotion label of each data is described using the p-value andwhich hypothesis was accepted as true in Table 3. If the statistical significance betweenthe four self-reported emotion labels is confirmed by the Kruskal–Wallis H test, it is alsonecessary to confirm how many of the pairs show statistical significance through the post-hoc test. We confirmed the statistical significance of a total of six self-reported emotion label
Sensors 2022, 22, 4402 11 of 21
pairs through the Mann–Whitney U test [33,34], a nonparametric statistical hypothesis test,and the total number of the null hypothesis (H0) rejection pairs is also listed in Table 3. Asshown in Table 3, all collected structured data had statistically different distributions for self-reported emotion labels, and three or more pairs out of six pairs were statistically significant.
(a) (b)
(c) (d)Figure 7. Distribution of vehicle speed by self-reported emotion labels in real-world driving.(a) Happy|Neutral; (b) Excited|Surprised; (c) Angry|Disgusting; (d) Sad|Fatigued.
Table 3. Statistical hypothesis test results of structured data by self-reported emotion label.
DataStatistical Hypothesis Test Post-Hoc Test
Reject H0Number of Reject H0 Pairs(Total Number of Pairs is 6)
Bio-physiological
Skin temperature Yes 6EDA Yes 5PPG Yes 3HR Yes 4
CAN
Accelerator pedal position Yes 5Brake pedal position Yes 6Steering wheel angle Yes 6Yaw rate Yes 3Longitudinal acceleration Yes 6Lateral acceleration Yes 5
Although the statistical hypothesis test results can explain the significance of theemotion recognition of the collected sensor data, another aspect that requires analysis iswhether there is a significant distribution difference according to the driver. Therefore,the same statistical hypothesis test as above was repeated by separating the data for eachdriver, and the results are shown in Table 4. EDA and steering wheel angle are the onlystructured data with the same results for all drivers. Not only were the post-hoc resultsdifferent, but also the results of determining whether to reject the null hypothesis weredifferent for each driver. That means the collected data significantly vary from driver todriver. This may be because each driver has a different way of expressing their emotionswhile driving. Therefore, different data will be required to recognize each driver’s emotion.In other words, emotion recognition research requires personalization.
Sensors 2022, 22, 4402 12 of 21
Table 4. Statistical hypothesis test results of structured data by self-reported emotion label accordingto driver.
Data
Statistical Hypothesis Test Post-Hoc Test
Reject H0Number of Reject H0 Pairs(Total Number of Pairs is 6)
Driver A Driver B Driver C Driver D Driver A Driver B Driver C Driver D
Bio-physiological
Skin temperature Yes Yes Yes Yes 5 6 6 6EDA Yes Yes Yes Yes 6 6 6 6PPG No Yes No Yes - 1 - 3HR Yes Yes Yes Yes 4 5 5 2
CAN
Accelerator pedal position Yes Yes Yes Yes 5 6 6 6Brake pedal position Yes Yes Yes Yes 6 5 6 6Steering wheel angle Yes Yes Yes Yes 6 6 6 6Yaw rate Yes Yes Yes Yes 6 6 4 5Longitudinal acceleration Yes Yes Yes Yes 6 5 3 6Lateral acceleration Yes Yes Yes Yes 5 6 6 6
4.2.2. Driver Face Detection
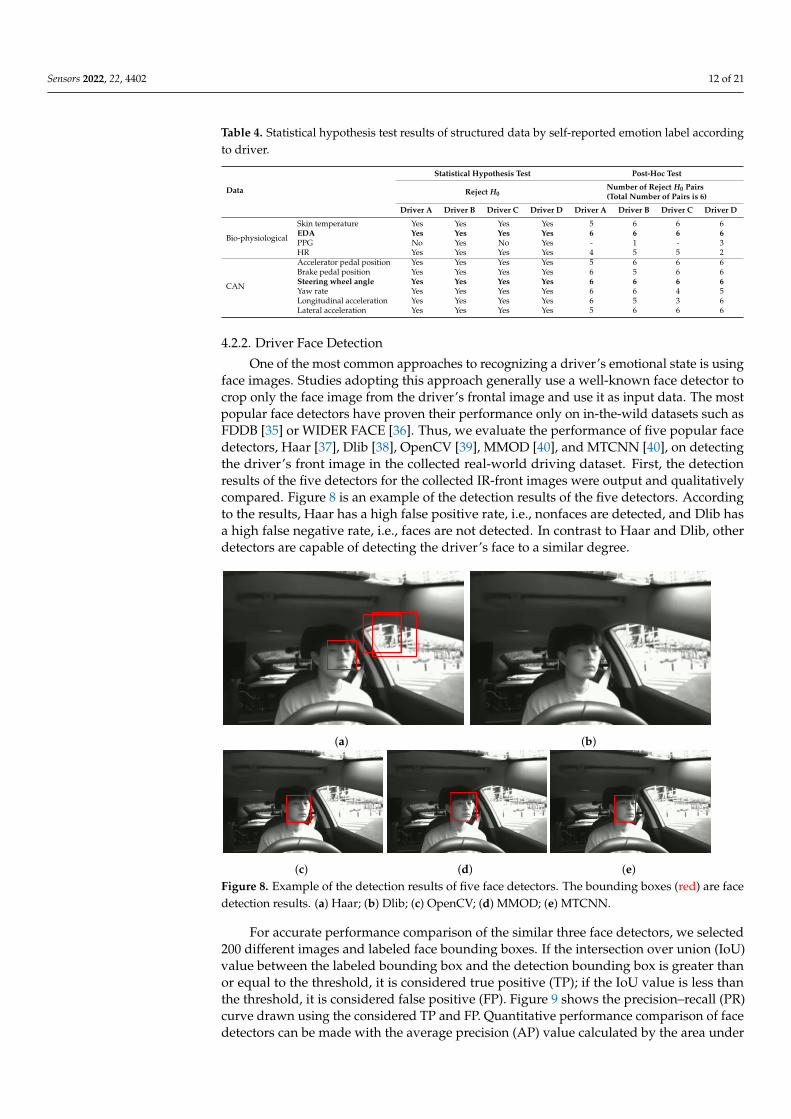
One of the most common approaches to recognizing a driver’s emotional state is usingface images. Studies adopting this approach generally use a well-known face detector tocrop only the face image from the driver’s frontal image and use it as input data. The mostpopular face detectors have proven their performance only on in-the-wild datasets such asFDDB [35] or WIDER FACE [36]. Thus, we evaluate the performance of five popular facedetectors, Haar [37], Dlib [38], OpenCV [39], MMOD [40], and MTCNN [40], on detectingthe driver’s front image in the collected real-world driving dataset. First, the detectionresults of the five detectors for the collected IR-front images were output and qualitativelycompared. Figure 8 is an example of the detection results of the five detectors. Accordingto the results, Haar has a high false positive rate, i.e., nonfaces are detected, and Dlib hasa high false negative rate, i.e., faces are not detected. In contrast to Haar and Dlib, otherdetectors are capable of detecting the driver’s face to a similar degree.
(a) (b)
(c) (d) (e)Figure 8. Example of the detection results of five face detectors. The bounding boxes (red) are facedetection results. (a) Haar; (b) Dlib; (c) OpenCV; (d) MMOD; (e) MTCNN.
For accurate performance comparison of the similar three face detectors, we selected200 different images and labeled face bounding boxes. If the intersection over union (IoU)value between the labeled bounding box and the detection bounding box is greater thanor equal to the threshold, it is considered true positive (TP); if the IoU value is less thanthe threshold, it is considered false positive (FP). Figure 9 shows the precision–recall (PR)curve drawn using the considered TP and FP. Quantitative performance comparison of facedetectors can be made with the average precision (AP) value calculated by the area under

Sensors 2022, 22, 4402 13 of 21
the PR curve. Depending on whether the threshold is 0.5, 0.75, or 0.95, AP performance isexpressed as AP50, AP75, or AP95, respectively. Refer to Table 5 for detailed comparisonresults. Since the inference speed of the face detector is as important as detection accuracy,Table 5 describes the inference speed and the GPU specifications.
(a) (b) (c)
(d) (e) (f)Figure 9. PR curve for face detectors capable of detecting the driver’s face. The thresholds are 0.5and 0.75. (a) OpenCV, threshold is 0.5; (b) MMOD, threshold is 0.5; (c) MTCNN, threshold is 0.5;(d) OpenCV, threshold is 0.75; (e) MMOD, threshold is 0.75; (f) MTCNN, threshold is 0.75.
Table 5. Driver’s face detection performance comparison of face detectors.
AP50 AP75 AP95 Speed GPU
OpenCV 68.4 51.4 0.0 400 FPS Nvidia GTX 3080MMOD 83.8 18.1 0.0 260 FPS Nvidia GTX 3080MTCNN 81.4 72.0 0.0 4 FPS Nvidia GTX 3080
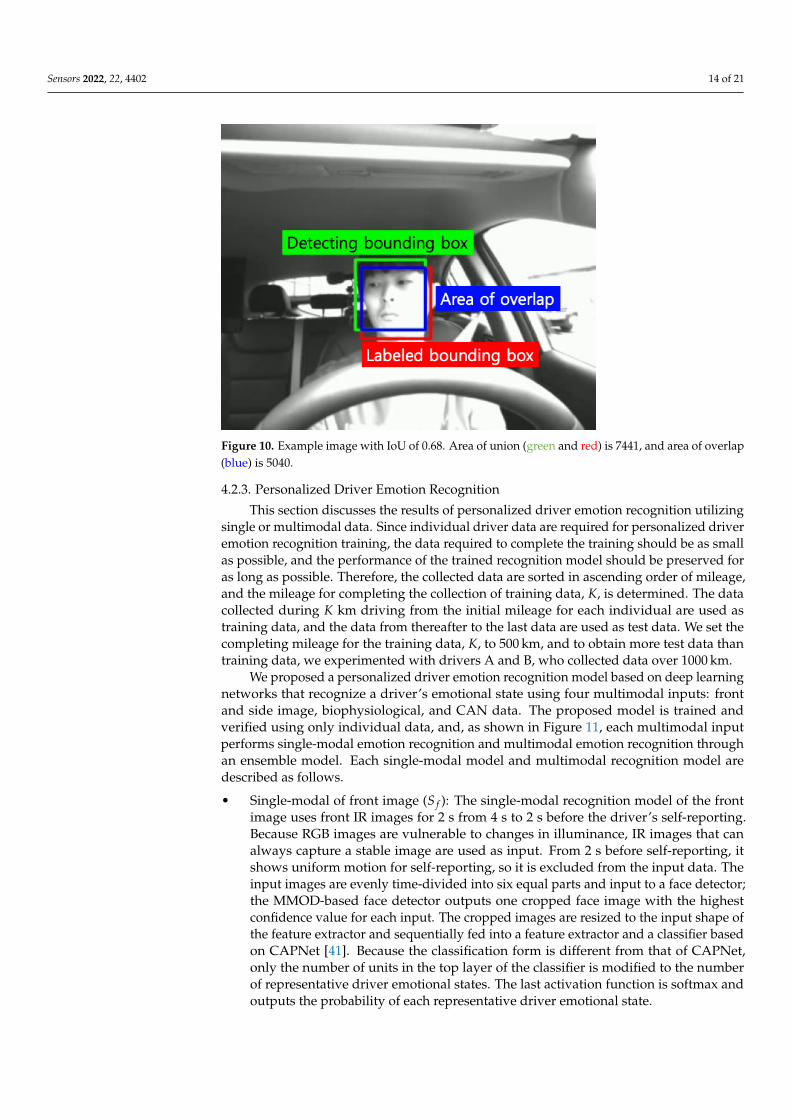
OpenCV has the fastest inference speed, but its detection performance is low. ForMMOD and MTCNN, AP50 is at a similar level, but at AP75, the detection performanceof MMOD decreases rapidly. Although the AP75 performance of MTCNN is inferior toAP50, it is insignificant. Conversely, in the case of inference speed performance, MMODsignificantly outperforms MTCNN. Since the inference speed of MTCNN is also insufficient,it seems appropriate to use a suitable face detector as the driver face detector depending onthe purpose or computational sources. In terms of AP95, the performance of all detectorsis 0.0. This is due to the small area occupied by the driver’s face in the driver’s frontimage, and the IoU value may not exceed the threshold value of 0.95 due to differences indetermining whether only the eyes and nose are included, or including the forehead orchin when the bounding box is labeled. Figure 10 shows an example image of the detectedand labeled driver face bounding boxes with an IoU value of 0.68, it detects the driver’sfacial expression sufficiently. In face detection for driver emotion recognition, the thresholdshould not be as high as 0.5 or 0.95. Therefore, we crop the face image using the MMODface detector, which achieved the highest detection performance in AP50 for driver emotionrecognition, as discussed in Section 4.2.3.
Sensors 2022, 22, 4402 14 of 21
Figure 10. Example image with IoU of 0.68. Area of union (green and red) is 7441, and area of overlap(blue) is 5040.
4.2.3. Personalized Driver Emotion Recognition
This section discusses the results of personalized driver emotion recognition utilizingsingle or multimodal data. Since individual driver data are required for personalized driveremotion recognition training, the data required to complete the training should be as smallas possible, and the performance of the trained recognition model should be preserved foras long as possible. Therefore, the collected data are sorted in ascending order of mileage,and the mileage for completing the collection of training data, K, is determined. The datacollected during K km driving from the initial mileage for each individual are used astraining data, and the data from thereafter to the last data are used as test data. We set thecompleting mileage for the training data, K, to 500 km, and to obtain more test data thantraining data, we experimented with drivers A and B, who collected data over 1000 km.
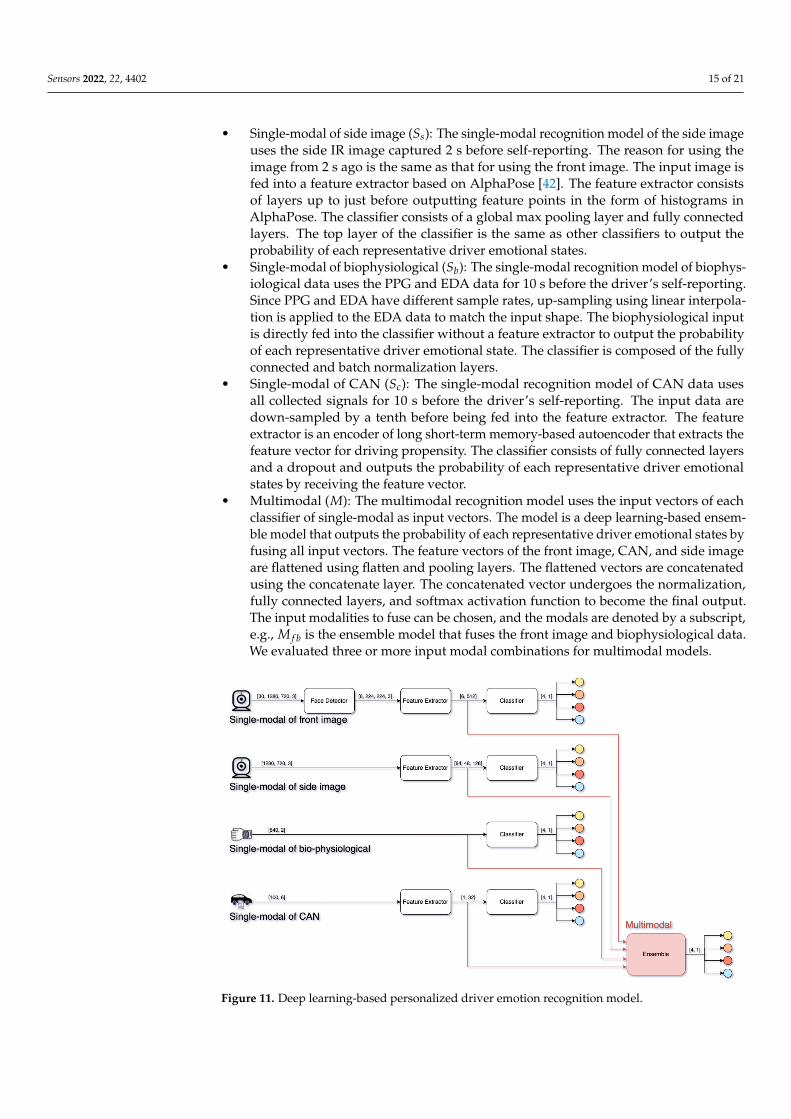
We proposed a personalized driver emotion recognition model based on deep learningnetworks that recognize a driver’s emotional state using four multimodal inputs: frontand side image, biophysiological, and CAN data. The proposed model is trained andverified using only individual data, and, as shown in Figure 11, each multimodal inputperforms single-modal emotion recognition and multimodal emotion recognition throughan ensemble model. Each single-modal model and multimodal recognition model aredescribed as follows.
• Single-modal of front image (S f ): The single-modal recognition model of the frontimage uses front IR images for 2 s from 4 s to 2 s before the driver’s self-reporting.Because RGB images are vulnerable to changes in illuminance, IR images that canalways capture a stable image are used as input. From 2 s before self-reporting, itshows uniform motion for self-reporting, so it is excluded from the input data. Theinput images are evenly time-divided into six equal parts and input to a face detector;the MMOD-based face detector outputs one cropped face image with the highestconfidence value for each input. The cropped images are resized to the input shape ofthe feature extractor and sequentially fed into a feature extractor and a classifier basedon CAPNet [41]. Because the classification form is different from that of CAPNet,only the number of units in the top layer of the classifier is modified to the numberof representative driver emotional states. The last activation function is softmax andoutputs the probability of each representative driver emotional state.
Sensors 2022, 22, 4402 15 of 21
• Single-modal of side image (Ss): The single-modal recognition model of the side imageuses the side IR image captured 2 s before self-reporting. The reason for using theimage from 2 s ago is the same as that for using the front image. The input image isfed into a feature extractor based on AlphaPose [42]. The feature extractor consistsof layers up to just before outputting feature points in the form of histograms inAlphaPose. The classifier consists of a global max pooling layer and fully connectedlayers. The top layer of the classifier is the same as other classifiers to output theprobability of each representative driver emotional states.
• Single-modal of biophysiological (Sb): The single-modal recognition model of biophys-iological data uses the PPG and EDA data for 10 s before the driver’s self-reporting.Since PPG and EDA have different sample rates, up-sampling using linear interpola-tion is applied to the EDA data to match the input shape. The biophysiological inputis directly fed into the classifier without a feature extractor to output the probabilityof each representative driver emotional state. The classifier is composed of the fullyconnected and batch normalization layers.
• Single-modal of CAN (Sc): The single-modal recognition model of CAN data usesall collected signals for 10 s before the driver’s self-reporting. The input data aredown-sampled by a tenth before being fed into the feature extractor. The featureextractor is an encoder of long short-term memory-based autoencoder that extracts thefeature vector for driving propensity. The classifier consists of fully connected layersand a dropout and outputs the probability of each representative driver emotionalstates by receiving the feature vector.
• Multimodal (M): The multimodal recognition model uses the input vectors of eachclassifier of single-modal as input vectors. The model is a deep learning-based ensem-ble model that outputs the probability of each representative driver emotional states byfusing all input vectors. The feature vectors of the front image, CAN, and side imageare flattened using flatten and pooling layers. The flattened vectors are concatenatedusing the concatenate layer. The concatenated vector undergoes the normalization,fully connected layers, and softmax activation function to become the final output.The input modalities to fuse can be chosen, and the modals are denoted by a subscript,e.g., M f b is the ensemble model that fuses the front image and biophysiological data.We evaluated three or more input modal combinations for multimodal models.
Figure 11. Deep learning-based personalized driver emotion recognition model.

Sensors 2022, 22, 4402 16 of 21
It is necessary to define a loss function when training the proposed models. Be-cause the self-reported emotion label has data imbalance, as described in Section 4.2.1, highperformance cannot be expected if a typical loss function is used such as cross entropy. Weovercome the data imbalance problem by making the precision and recall differentiable bycomputing the likelihood values of TP, FP, and false negative (FN) using probabilities. Theloss function we used is shown as follows:
L(y, y) = 1 − 1N(
pTP1
pTP1 + pFP
1 + ε+
N
∑i=2
pTPi
pTPi + pFN
i + ε) (1)
pTP = y ◦ y (2)
pFP = (
1.1.1.1.
− y) ◦ y (3)
pFN = y ◦ (
1.1.1.1.
− y) (4)
where y and y represent a one-hot vector of the self-reported emotion and predictedemotion, respectively, where the first element of each vector represents the default emo-tion, “Happy|Neutral”. pTP, pFP, and pFN are the likelihood values of TP, FP, and FN,respectively, where ◦ is an element-wise product.
Equation (1) is a loss function for increasing the precision of default emotion and forincreasing the recall of induced emotions, where N represents the total number of represen-tative emotions, and ε represents a very small value that prevents the precision or recallvalues from going to infinity. This loss function, L(y, y), can be used for backpropagationby probabilistically expressing the precision and recall for each prediction class. It increasesprecision for the majority class, the default emotional state, and increases recall for minorityclass, inducible emotional states.
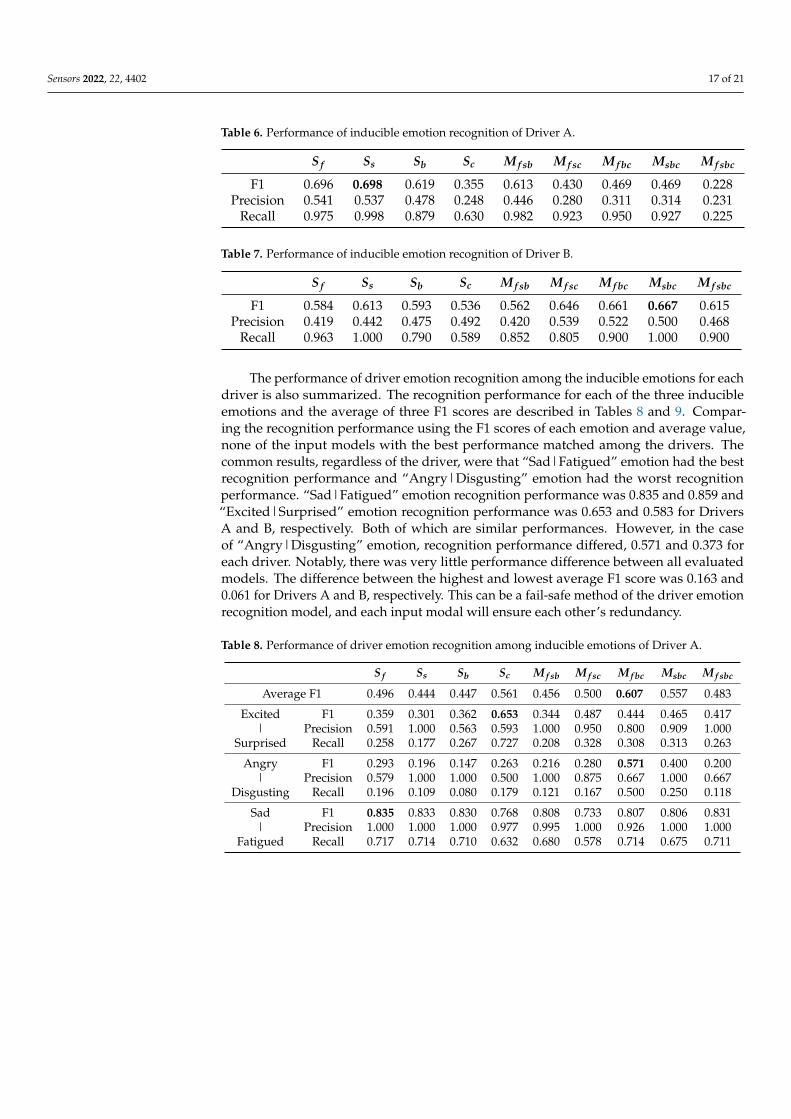
The evaluation results with test data are in terms of F1 score, precision, and recall,and are described for each driver. As mentioned in Section 4.2.1, since the representativedriver emotional states are divided into default and inducible emotions, the recognitionperformance of inducible emotions is evaluated first. Tables 6 and 7 summarize the per-formance of inducible emotion recognition between default and inducible emotions foreach driver. The highest recognition performance is the F1 score 0.698 of Ss for Driver Aand 0.667 of Msbc for Driver B. As expected in Section 4.2.1, the input modals with the bestperformance for each driver differed. Driver A achieved the best performance in a singlefront image, and Driver B achieved the best in a side image, biophysiological, CAN datacombination. However, their performance was similar. Driver B had similar performancebetween all evaluated models from 0.562 to 0.667. For Driver A, models without CAN datahad a similar performance from 0.613 to 0.696, but models with CAN data such as Sc, M f sc,M f bc, Msbc, and M f sbc had a significantly lower performance from 0.228 to 0.469. DriverB can interpret that when inducible emotions are induced while driving, emotions are ex-pressed overall in the front and side images and biophysiological, and CAN data, whereasdriver A can interpret that the induction of emotion is not expressed in CAN data. Theseresults may support the fact that driver emotion recognition necessitates personalization.
Sensors 2022, 22, 4402 17 of 21
Table 6. Performance of inducible emotion recognition of Driver A.
S f Ss Sb Sc M f sb M f sc M f bc Msbc M f sbc
F1 0.696 0.698 0.619 0.355 0.613 0.430 0.469 0.469 0.228Precision 0.541 0.537 0.478 0.248 0.446 0.280 0.311 0.314 0.231
Recall 0.975 0.998 0.879 0.630 0.982 0.923 0.950 0.927 0.225
Table 7. Performance of inducible emotion recognition of Driver B.
S f Ss Sb Sc M f sb M f sc M f bc Msbc M f sbc
F1 0.584 0.613 0.593 0.536 0.562 0.646 0.661 0.667 0.615Precision 0.419 0.442 0.475 0.492 0.420 0.539 0.522 0.500 0.468
Recall 0.963 1.000 0.790 0.589 0.852 0.805 0.900 1.000 0.900
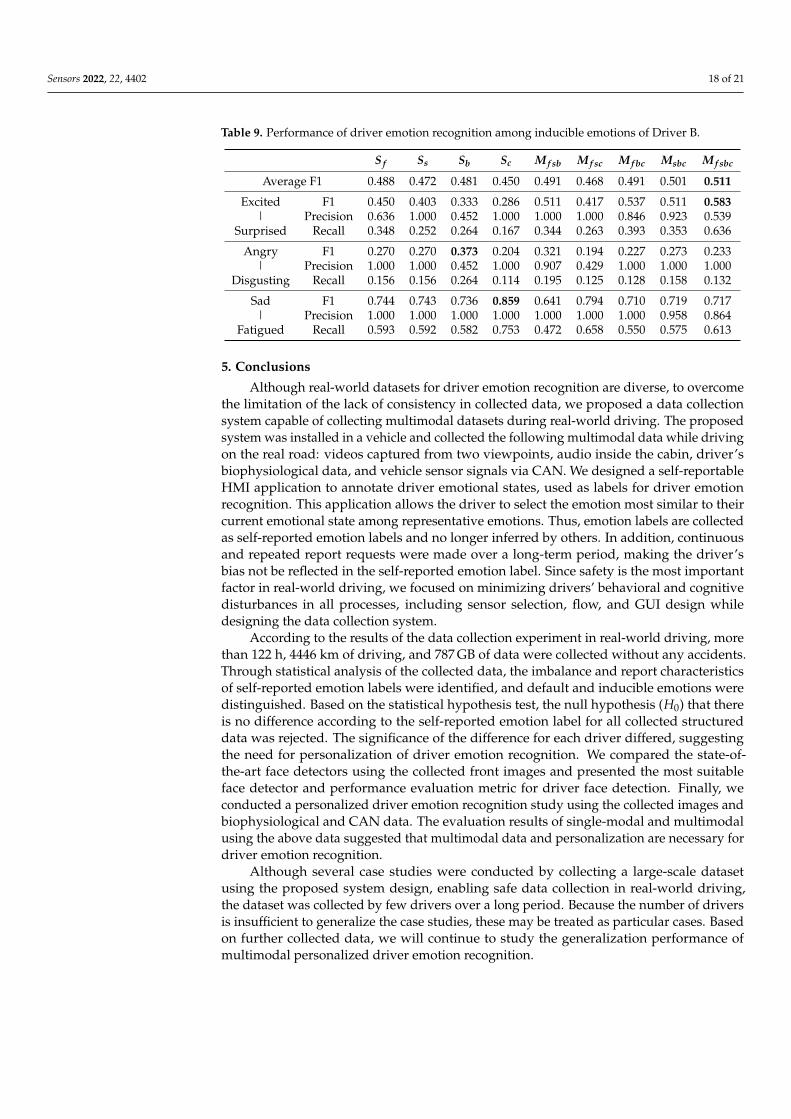
The performance of driver emotion recognition among the inducible emotions for eachdriver is also summarized. The recognition performance for each of the three inducibleemotions and the average of three F1 scores are described in Tables 8 and 9. Compar-ing the recognition performance using the F1 scores of each emotion and average value,none of the input models with the best performance matched among the drivers. Thecommon results, regardless of the driver, were that “Sad|Fatigued” emotion had the bestrecognition performance and “Angry|Disgusting” emotion had the worst recognitionperformance. “Sad|Fatigued” emotion recognition performance was 0.835 and 0.859 and“Excited|Surprised” emotion recognition performance was 0.653 and 0.583 for DriversA and B, respectively. Both of which are similar performances. However, in the caseof “Angry|Disgusting” emotion, recognition performance differed, 0.571 and 0.373 foreach driver. Notably, there was very little performance difference between all evaluatedmodels. The difference between the highest and lowest average F1 score was 0.163 and0.061 for Drivers A and B, respectively. This can be a fail-safe method of the driver emotionrecognition model, and each input modal will ensure each other’s redundancy.
Table 8. Performance of driver emotion recognition among inducible emotions of Driver A.
S f Ss Sb Sc M f sb M f sc M f bc Msbc M f sbc
Average F1 0.496 0.444 0.447 0.561 0.456 0.500 0.607 0.557 0.483
Excited|
Surprised
F1 0.359 0.301 0.362 0.653 0.344 0.487 0.444 0.465 0.417Precision 0.591 1.000 0.563 0.593 1.000 0.950 0.800 0.909 1.000
Recall 0.258 0.177 0.267 0.727 0.208 0.328 0.308 0.313 0.263
Angry|
Disgusting
F1 0.293 0.196 0.147 0.263 0.216 0.280 0.571 0.400 0.200Precision 0.579 1.000 1.000 0.500 1.000 0.875 0.667 1.000 0.667
Recall 0.196 0.109 0.080 0.179 0.121 0.167 0.500 0.250 0.118
Sad|
Fatigued
F1 0.835 0.833 0.830 0.768 0.808 0.733 0.807 0.806 0.831Precision 1.000 1.000 1.000 0.977 0.995 1.000 0.926 1.000 1.000
Recall 0.717 0.714 0.710 0.632 0.680 0.578 0.714 0.675 0.711
Sensors 2022, 22, 4402 18 of 21
Table 9. Performance of driver emotion recognition among inducible emotions of Driver B.
S f Ss Sb Sc M f sb M f sc M f bc Msbc M f sbc
Average F1 0.488 0.472 0.481 0.450 0.491 0.468 0.491 0.501 0.511
Excited|
Surprised
F1 0.450 0.403 0.333 0.286 0.511 0.417 0.537 0.511 0.583Precision 0.636 1.000 0.452 1.000 1.000 1.000 0.846 0.923 0.539
Recall 0.348 0.252 0.264 0.167 0.344 0.263 0.393 0.353 0.636
Angry|
Disgusting
F1 0.270 0.270 0.373 0.204 0.321 0.194 0.227 0.273 0.233Precision 1.000 1.000 0.452 1.000 0.907 0.429 1.000 1.000 1.000
Recall 0.156 0.156 0.264 0.114 0.195 0.125 0.128 0.158 0.132
Sad|
Fatigued
F1 0.744 0.743 0.736 0.859 0.641 0.794 0.710 0.719 0.717Precision 1.000 1.000 1.000 1.000 1.000 1.000 1.000 0.958 0.864
Recall 0.593 0.592 0.582 0.753 0.472 0.658 0.550 0.575 0.613
5. Conclusions
Although real-world datasets for driver emotion recognition are diverse, to overcomethe limitation of the lack of consistency in collected data, we proposed a data collectionsystem capable of collecting multimodal datasets during real-world driving. The proposedsystem was installed in a vehicle and collected the following multimodal data while drivingon the real road: videos captured from two viewpoints, audio inside the cabin, driver’sbiophysiological data, and vehicle sensor signals via CAN. We designed a self-reportableHMI application to annotate driver emotional states, used as labels for driver emotionrecognition. This application allows the driver to select the emotion most similar to theircurrent emotional state among representative emotions. Thus, emotion labels are collectedas self-reported emotion labels and no longer inferred by others. In addition, continuousand repeated report requests were made over a long-term period, making the driver’sbias not be reflected in the self-reported emotion label. Since safety is the most importantfactor in real-world driving, we focused on minimizing drivers’ behavioral and cognitivedisturbances in all processes, including sensor selection, flow, and GUI design whiledesigning the data collection system.
According to the results of the data collection experiment in real-world driving, morethan 122 h, 4446 km of driving, and 787 GB of data were collected without any accidents.Through statistical analysis of the collected data, the imbalance and report characteristicsof self-reported emotion labels were identified, and default and inducible emotions weredistinguished. Based on the statistical hypothesis test, the null hypothesis (H0) that thereis no difference according to the self-reported emotion label for all collected structureddata was rejected. The significance of the difference for each driver differed, suggestingthe need for personalization of driver emotion recognition. We compared the state-of-the-art face detectors using the collected front images and presented the most suitableface detector and performance evaluation metric for driver face detection. Finally, weconducted a personalized driver emotion recognition study using the collected images andbiophysiological and CAN data. The evaluation results of single-modal and multimodalusing the above data suggested that multimodal data and personalization are necessary fordriver emotion recognition.
Although several case studies were conducted by collecting a large-scale datasetusing the proposed system design, enabling safe data collection in real-world driving,the dataset was collected by few drivers over a long period. Because the number of driversis insufficient to generalize the case studies, these may be treated as particular cases. Basedon further collected data, we will continue to study the generalization performance ofmultimodal personalized driver emotion recognition.

Sensors 2022, 22, 4402 19 of 21
Author Contributions: Conceptualization, S.L. (Sejoon Lim) and S.L. (Sangho Lee); methodology, G.O.,E.J. and R.C.K.; software, G.O. and E.J.; validation, J.H.Y., S.L. (Sejoon Lim) and S.L. (Sangho Lee); formalanalysis, G.O.; investigation, G.O., J.H.Y. and S.L. (Sejoon Lim); resources, G.O., J.H.Y. and S.H.; datacuration, G.O., E.J., R.C.K. and S.H.; writing—original draft preparation, G.O.; writing—review andediting, J.H.Y. and S.L. (Sejoon Lim); visualization, G.O. and E.J.; supervision, S.L. (Sejoon Lim); projectadministration, S.L. (Sejoon Lim) and S.L. (Sangho Lee); and funding acquisition, J.H.Y., S.L. (Sejoon Lim)and S.L. (Sangho Lee). All authors have read and agreed to the published version of the manuscript.
Funding: This research was supported by the Hyundai Motor Group, the Knowledge Service IndustryCore Technology Development Program funded by the Ministry of Trade, Industry, and Energy ofKorea (No. 20003519), the Basic Science Research Program of the National Research Foundationof Korea funded by the Ministry of Science, ICT, and Future Planning (No. 2021R1A2C1005433),the BK21 Program through the National Research Foundation of Korea (NRF) funded by the Ministryof Education (No. 5199990814084), and the Korea Institute of Police Technology (KIPoT) grant fundedby the Korea government (KNPA) (No. 092021C26S03000, Development of infrastructure informationintegration and management technologies for real time traffic safety facility operation).
Institutional Review Board Statement: The study was conducted according to the guidelines of theDeclaration of Helsinki and approved by the Institutional Review Board of Kookmin University(protocol code: KMU-202104-HR-264; date of approval: 2 June 2021).
Informed Consent Statement: Informed consent was obtained from all subjects involved in the study.
Acknowledgments: The authors thank Junghwan Ryu, Taesan Kim, and Joonghoo Park for buil-ing a vehicle with a data collection system and Youngdong Kwon and Myengkyu Lee for settingrepresentative emotions and GUI design.
Conflicts of Interest: The authors declare no conflict of interest.
AbbreviationsThe following abbreviations are used in this manuscript:
CAN Controller area networkHMI Human–machine interactionGUI Graphical user interfaceUX User experienceSAM Self-assessment manikinRGB Red green blueIR InfraredE4 E4 wristbandEDA Electrodermal activityPPG PhotoplethysmographyIBI Interbeat intervalHR Heart rateOBD On-board diagnosticsIoU Intersection over unionTP True positiveFP False positivePR Presicion–recallAP Average precisionFN False negative
Sensors 2022, 22, 4402 20 of 21
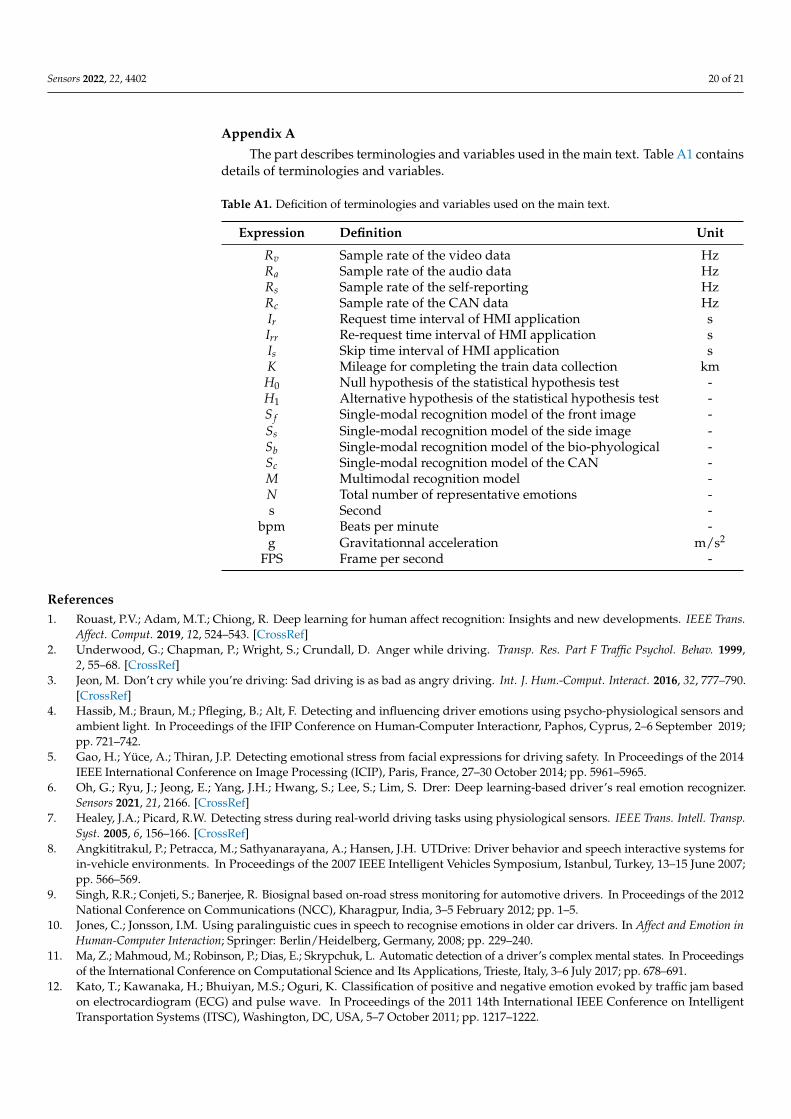
Appendix A
The part describes terminologies and variables used in the main text. Table A1 containsdetails of terminologies and variables.
Table A1. Deficition of terminologies and variables used on the main text.
Expression Definition Unit
Rv Sample rate of the video data HzRa Sample rate of the audio data HzRs Sample rate of the self-reporting HzRc Sample rate of the CAN data HzIr Request time interval of HMI application sIrr Re-request time interval of HMI application sIs Skip time interval of HMI application sK Mileage for completing the train data collection kmH0 Null hypothesis of the statistical hypothesis test -H1 Alternative hypothesis of the statistical hypothesis test -S f Single-modal recognition model of the front image -Ss Single-modal recognition model of the side image -Sb Single-modal recognition model of the bio-phyological -Sc Single-modal recognition model of the CAN -M Multimodal recognition model -N Total number of representative emotions -s Second -
bpm Beats per minute -g Gravitationnal acceleration m/s2
FPS Frame per second -
References1. Rouast, P.V.; Adam, M.T.; Chiong, R. Deep learning for human affect recognition: Insights and new developments. IEEE Trans.
Affect. Comput. 2019, 12, 524–543. [CrossRef]2. Underwood, G.; Chapman, P.; Wright, S.; Crundall, D. Anger while driving. Transp. Res. Part F Traffic Psychol. Behav. 1999,
2, 55–68. [CrossRef]3. Jeon, M. Don’t cry while you’re driving: Sad driving is as bad as angry driving. Int. J. Hum.-Comput. Interact. 2016, 32, 777–790.
[CrossRef]4. Hassib, M.; Braun, M.; Pfleging, B.; Alt, F. Detecting and influencing driver emotions using psycho-physiological sensors and
ambient light. In Proceedings of the IFIP Conference on Human-Computer Interactionr, Paphos, Cyprus, 2–6 September 2019;pp. 721–742.
5. Gao, H.; Yüce, A.; Thiran, J.P. Detecting emotional stress from facial expressions for driving safety. In Proceedings of the 2014IEEE International Conference on Image Processing (ICIP), Paris, France, 27–30 October 2014; pp. 5961–5965.
6. Oh, G.; Ryu, J.; Jeong, E.; Yang, J.H.; Hwang, S.; Lee, S.; Lim, S. Drer: Deep learning-based driver’s real emotion recognizer.Sensors 2021, 21, 2166. [CrossRef]
7. Healey, J.A.; Picard, R.W. Detecting stress during real-world driving tasks using physiological sensors. IEEE Trans. Intell. Transp.Syst. 2005, 6, 156–166. [CrossRef]
8. Angkititrakul, P.; Petracca, M.; Sathyanarayana, A.; Hansen, J.H. UTDrive: Driver behavior and speech interactive systems forin-vehicle environments. In Proceedings of the 2007 IEEE Intelligent Vehicles Symposium, Istanbul, Turkey, 13–15 June 2007;pp. 566–569.
9. Singh, R.R.; Conjeti, S.; Banerjee, R. Biosignal based on-road stress monitoring for automotive drivers. In Proceedings of the 2012National Conference on Communications (NCC), Kharagpur, India, 3–5 February 2012; pp. 1–5.
10. Jones, C.; Jonsson, I.M. Using paralinguistic cues in speech to recognise emotions in older car drivers. In Affect and Emotion inHuman-Computer Interaction; Springer: Berlin/Heidelberg, Germany, 2008; pp. 229–240.
11. Ma, Z.; Mahmoud, M.; Robinson, P.; Dias, E.; Skrypchuk, L. Automatic detection of a driver’s complex mental states. In Proceedingsof the International Conference on Computational Science and Its Applications, Trieste, Italy, 3–6 July 2017; pp. 678–691.
12. Kato, T.; Kawanaka, H.; Bhuiyan, M.S.; Oguri, K. Classification of positive and negative emotion evoked by traffic jam basedon electrocardiogram (ECG) and pulse wave. In Proceedings of the 2011 14th International IEEE Conference on IntelligentTransportation Systems (ITSC), Washington, DC, USA, 5–7 October 2011; pp. 1217–1222.

Sensors 2022, 22, 4402 21 of 21
13. Taib, R.; Tederry, J.; Itzstein, B. Quantifying driver frustration to improve road safety. In Proceedings of the CHI’14 ExtendedAbstracts on Human Factors in Computing Systems, Toronto, ON, Canada, 26 April–1 May 2014; pp. 1777–1782.
14. Ihme, K.; Dömeland, C.; Freese, M.; Jipp, M. Frustration in the face of the driver: A simulator study on facial muscle activityduring frustrated driving. Interact. Stud. 2018, 19, 487–498. [CrossRef]
15. Zepf, S.; Hernandez, J.; Schmitt, A.; Minker, W.; Picard, R.W. Driver emotion recognition for intelligent vehicles: A survey. ACMComput. Surv. 2020, 53, 1–30. [CrossRef]
16. Ortega, J.D.; Kose, N.; Cañas, P.; Chao, M.A.; Unnervik, A.; Nieto, M.; Otaegui, O.; Salgado, L. Dmd: A large-scale multi-modaldriver monitoring dataset for attention and alertness analysis. In Proceedings of the European Conference on Computer Vision,Glasgow, UK, 23–28 August 2020; pp. 387–405.
17. Jegham, I.; Khalifa, A.B.; Alouani, I.; Mahjoub, M.A. A novel public dataset for multimodal multiview and multispectral driverdistraction analysis: 3MDAD. Signal Process. Image Commun. 2020, 88, 115960. [CrossRef]
18. Martin, M.; Roitberg, A.; Haurilet, M.; Horne, M.; Reiß, S.; Voit, M.; Stiefelhagen, R. Drive&act: A multi-modal dataset forfine-grained driver behavior recognition in autonomous vehicles. In Proceedings of the IEEE/CVF International Conference onComputer Vision, Seoul, Korea, 27 October–2 November 2019; pp. 2801–2810.
19. Deo, N.; Trivedi, M.M. Looking at the driver/rider in autonomous vehicles to predict take-over readiness. IEEE Trans. Intell. Veh.2019, 5, 41–52. [CrossRef]
20. Song, T.; Zheng, W.; Song, P.; Cui, Z. EEG emotion recognition using dynamical graph convolutional neural networks. IEEETrans. Affect. Comput. 2018, 11, 532–541. [CrossRef]
21. Tao, W.; Li, C.; Song, R.; Cheng, J.; Liu, Y.; Wan, F.; Chen, X. EEG-based emotion recognition via channel-wise attention and selfattention. IEEE Trans. Affect. Comput. 2020 . [CrossRef]
22. Li, S.; Deng, W. Deep facial expression recognition: A survey. IEEE Trans. Affect. Comput. 2020.2020.2981446. [CrossRef]
23. Kawaguchi, N.; Matsubara, S.; Takeda, K.; Itakura, F. Multimedia data collection of in-car speech communication. In Proceedingsof the 7th European Conference on Speech Communication and Technology, Aalborg, Denmark, 3–7 September 2001.
24. Bradley, M.M.; Lang, P.J. Measuring emotion: The self-assessment manikin and the semantic differential. J. Behav. Ther. Exp.Psychiatry 1994, 25, 49–59. [CrossRef]
25. McCarthy, C.; Pradhan, N.; Redpath, C.; Adler, A. Validation of the Empatica E4 wristband. In Proceedings of the 2016 IEEEEMBS International Student Conference (ISC), Ottawa, ON, Canada, 29–31 May 2016; pp. 1–4.
26. Ragot, M.; Martin, N.; Em, S.; Pallamin, N.; Diverrez, J.M. Emotion recognition using physiological signals: Laboratory vs.wearable sensors. In Proceedings of the International Conference on Applied Human Factors and Ergonomics, Los Angeles, CA,USA, 17–21 July 2017; pp. 15–22.
27. Shiffman, S.; Stone, A.A.; Hufford, M.R. Ecological momentary assessment. Annu. Rev. Clin. Psychol. 2008, 4, 1–32. [CrossRef]28. Jeon, M.; Walker, B.N. What to detect? Analyzing factor structures of affect in driving contexts for an emotion detection and
regulation system. In Proceedings of the 55th Annual Meeting of the Human Factors and Ergonomics Society, Human Factorsand Ergonomics Society, Las Vegas, NV, USA, 19–23 September 2011; Volume 55, pp. 1889–1893.
29. Russell, J.A. A circumplex model of affect. J. Personal. Soc. Psychol. 1980, 39, 1161. [CrossRef]30. Schauss, A.G. Tranquilizing effect of color reduces aggressive behavior and potential violence. J. Orthomol. Psychiatry 1979,
8, 218–221.31. Kruskal, W.H.; Wallis, W.A. Use of ranks in one-criterion variance analysis. J. Am. Stat. Assoc. 1952, 47, 583–621. [CrossRef]32. Ostertagova, E.; Ostertag, O.; Kovác, J. Methodology and application of the Kruskal-Wallis test. In Applied Mechanics and Materials;
Trans Tech Publications Ltd.: Bäch, Switzerland, 2014; Volume 611, pp. 115–120.33. Kruskal, W.H. Historical notes on the Wilcoxon unpaired two-sample test. J. Am. Stat. Assoc. 1957, 52, 356–360. [CrossRef]34. Hart, A. Mann-Whitney test is not just a test of medians: Differences in spread can be important. Bmj 2001, 323, 391–393.
[CrossRef]35. Jain, V.; Learned-Miller, E. Fddb: A Benchmark for Face Detection in Unconstrained Settings; Technical Report UMCS-2010-009;
University of Massachusetts: Amherst, MA, USA, 2010 .36. Yang, S.; Luo, P.; Loy, C.C.; Tang, X. Wider face: A face detection benchmark. In Proceedings of the IEEE Conference on Computer
Vision and Pattern Recognition, Las Vegas, NV, USA, 27–30 June 2016; pp. 5525–5533.37. Viola, P.; Jones, M. Rapid object detection using a boosted cascade of simple features. In Proceedings of the 2001 IEEE Computer
Society Conference on Computer Vision and Pattern Recognition, CVPR 2001, Kauai, HI, USA, 8–14 December 2001; Volume 1; p. I.38. Dalal, N.; Triggs, B. Histograms of oriented gradients for human detection. In Proceedings of the 2005 IEEE Computer Society
Conference on Computer Vision and Pattern Recognition (CVPR’05), San Diego, CA, USA, 20–25 June 2005; Volume 1, pp. 886–893.39. Viola, P.; Jones, M.J. Robust real-time face detection. Int. J. Comput. Vis. 2004, 57, 137–154. [CrossRef]40. King, D.E. Max-margin object detection. arXiv 2015, arXiv:1502.00046.41. Oh, G.; Jeong, E.; Lim, S. Causal affect prediction model using a past facial image sequence. In Proceedings of the IEEE/CVF
International Conference on Computer Vision, Montreal, BC, Canada, 11–17 October 2021; pp. 3550–3556.42. Fang, H.S.; Xie, S.; Tai, Y.W.; Lu, C. RMPE: Regional Multi-person Pose Estimation. In Proceedings of the IEEE International
Conference on Computer Vision, Venice, Italy, 22–29 October 2017.