Australia's notifiable diseases status, 2001 Annual report of the National Notifiable Diseases...
78
Australia’s notifiable diseases status, 2001 Annual report of the National Notifiable Diseases Surveillance System Charlie Blumer, 1 Paul Roche, 1 Jenean Spencer, 1 Ming Lin, 1 Alison Milton, 1 Chris Bunn, 2 Heather Gidding, 3 John Kaldor, 4 Martyn Kirk, 5 Rob Hall, 6 Tony Della-Porta, 7 Robyn Leader, 8 Phil Wright 8 With contributions from: National organisations Communicable Diseases Network Australia and subcommittees Australian Childhood Immunisation Register Australian Gonococcal Surveillance Programme Australian Meningococcal Surveillance Programme Australian Sentinel Practice Research Network Australian Quarantine Inspection Service National Centre in HIV Epidemiology and Clinical Research National Centre for Immunisation Research and Surveillance of Vaccine Preventable Diseases National Enteric Pathogens Surveillance Scheme National Rotavirus Research Centre Sentinel Chicken Surveillance Programme The National Creutzfeldt-Jakob Disease Registry World Health Organization Collaborating Centre for Reference and Research on Influenza State and Territory health departments Communicable Diseases Control Unit, Australian Capital Territory Department of Health and Community Care, Australian Capital Territory Communicable Diseases Surveillance and Control Unit, New South Wales Health Department, New South Wales Centre for Disease Control, Northern Territory Department of Health and Community Services, Northern Territory Communicable Diseases Unit, Queensland Health, Queensland Communicable Diseases Control Branch, South Australian Department of Human Services, South Australia Communicable Diseases Surveillance, Department of Health and Human Services, Tasmania Communicable Diseases Section, Department of Human Services, Victoria Communicable Diseases Control Branch, Health Department of Western Australia, Western Australia CDI Vol 27, No 1 2003 1 Annual report of the National Notifiable Diseases Surveillance System
-
Upload
independent -
Category
Documents
-
view
0 -
download
0
Transcript of Australia's notifiable diseases status, 2001 Annual report of the National Notifiable Diseases...
Australia’s notifiable diseases status, 2001Annual report of the National Notifiable Diseases Surveillance System
Charlie Blumer,1
Paul Roche,1
Jenean Spencer,1
Ming Lin,1
Alison Milton,1
Chris Bunn,2
Heather Gidding,3
John
Kaldor,4
Martyn Kirk,5
Rob Hall,6
Tony Della-Porta,7
Robyn Leader,8
Phil Wright8
With contributions from:
National organisations
Communicable Diseases Network Australia and subcommittees
Australian Childhood Immunisation Register
Australian Gonococcal Surveillance Programme
Australian Meningococcal Surveillance Programme
Australian Sentinel Practice Research Network
Australian Quarantine Inspection Service
National Centre in HIV Epidemiology and Clinical Research
National Centre for Immunisation Research and Surveillance of Vaccine Preventable Diseases
National Enteric Pathogens Surveillance Scheme
National Rotavirus Research Centre
Sentinel Chicken Surveillance Programme
The National Creutzfeldt-Jakob Disease Registry
World Health Organization Collaborating Centre for Reference and Research on Influenza
State and Territory health departments
Communicable Diseases Control Unit, Australian Capital Territory Department of Health and Community Care,Australian Capital Territory
Communicable Diseases Surveillance and Control Unit, New South Wales Health Department, New SouthWales
Centre for Disease Control, Northern Territory Department of Health and Community Services, NorthernTerritory
Communicable Diseases Unit, Queensland Health, Queensland
Communicable Diseases Control Branch, South Australian Department of Human Services, South Australia
Communicable Diseases Surveillance, Department of Health and Human Services, Tasmania
Communicable Diseases Section, Department of Human Services, Victoria
Communicable Diseases Control Branch, Health Department of Western Australia, Western Australia
CDI Vol 27, No 1 2003 1
Annual report of the National Notifiable Diseases Surveillance System
AbstractIn 2001 there were 104,187 notifications of communicable diseases in Australia reported to the National Notifiable
Diseases Surveillance System (NNDSS). The number of notifications in 2001 was an increase of 16 per cent of those
reported in 2000 (89,740) and the largest annual total since the NNDSS commenced in 1991. In 2001, nine new
diseases were added to the list of diseases reported to NNDSS and four diseases were removed. The new diseases
were cryptosporidiosis, laboratory-confirmed influenza, invasive pneumococcal disease, Japanese encephalitis,
Kunjin virus infection, Murray Valley encephalitis virus infection, anthrax, Australian bat lyssavirus, and other
lyssaviruses (not elsewhere classified). Bloodborne virus infections remained the most frequently notified disease
(29,057 reports, 27.9% of total), followed by sexually transmitted infections (27,647, 26.5%), gastrointestinal
diseases (26,086, 25%), vaccine preventable diseases (13,030 (12.5%), vectorborne diseases (5,294, 5.1%), other
bacterial infections (1,978, 1.9%), zoonotic infections (1,091, 1%) and four cases of quarantinable diseases. In 2001
there were increases in the number of notifications of incident hepatitis C, chlamydial infections, pertussis, Barmah
Forest virus infection and ornithosis. There were decreases in the number of notifications of hepatitis A,
Haemophilus influenzae type b infections, measles, rubella, Ross River virus infections and brucellosis. This report
also summarises data on communicable diseases from other surveillance systems including the Laboratory
Virology and Serology Reporting Scheme and sentinel general practitioner schemes. In addition, this report
comments on other important developments in communicable disease control in Australia in 2001. Commun Dis
Intell 2003;27:1–78.
Keywords: surveillance, communicable diseases, epidemiology
1. Surveillance and Epidemiology Section, Department of Health and Ageing, PO Box 9848, Canberra, AustralianCapital Territory
2. Principal Veterinary Officer, Animal Health and Welfare Branch, Bureau of Resource Sciences, Department ofAgriculture, Fisheries and Forestries, Canberra, Australian Capital Territory
3. Epidemiology Research Officer, National Centre for Immunisation Research and Surveillance of VaccinePreventable Diseases, New South Wales
4. Deputy Director, National Centre in HIV Epidemiology and Clinical Research, New South Wales
5. Coordinating Epidemiologist, OzFoodNet, Australian New Zealand Food Authority and Department of Health andAgeing
6. Chief Health Officer and Director of Public Health, Department of Human Services, Victoria
7. Manager, Technical and Support Services, The Australian Animal Health Laboratory, Commonwealth Scientific andIndustrial Research Organisation, Canberra, Australian Capital Territory
8 Infection Management Section, Communicable Diseases and Health Protection, Department of Health and Ageing,Canberra, Australian Capital Territory
Corresponding author: Mr Charlie Blumer, Surveillance and Epidemiology Section, Department of Health and Ageing,GPO Box 9848 (MDP 6), Canberra ACT 2601. Telephone: +61 2 6289 7326. Facsimile: +61 6289 7791. Email:[email protected].
2 CDI Vol 27, No 1 2003
Annual report of the National Notifiable Diseases Surveillance System
CDI Vol 27, No 1 2003 3
Annual report of the National Notifiable Diseases Surveillance System
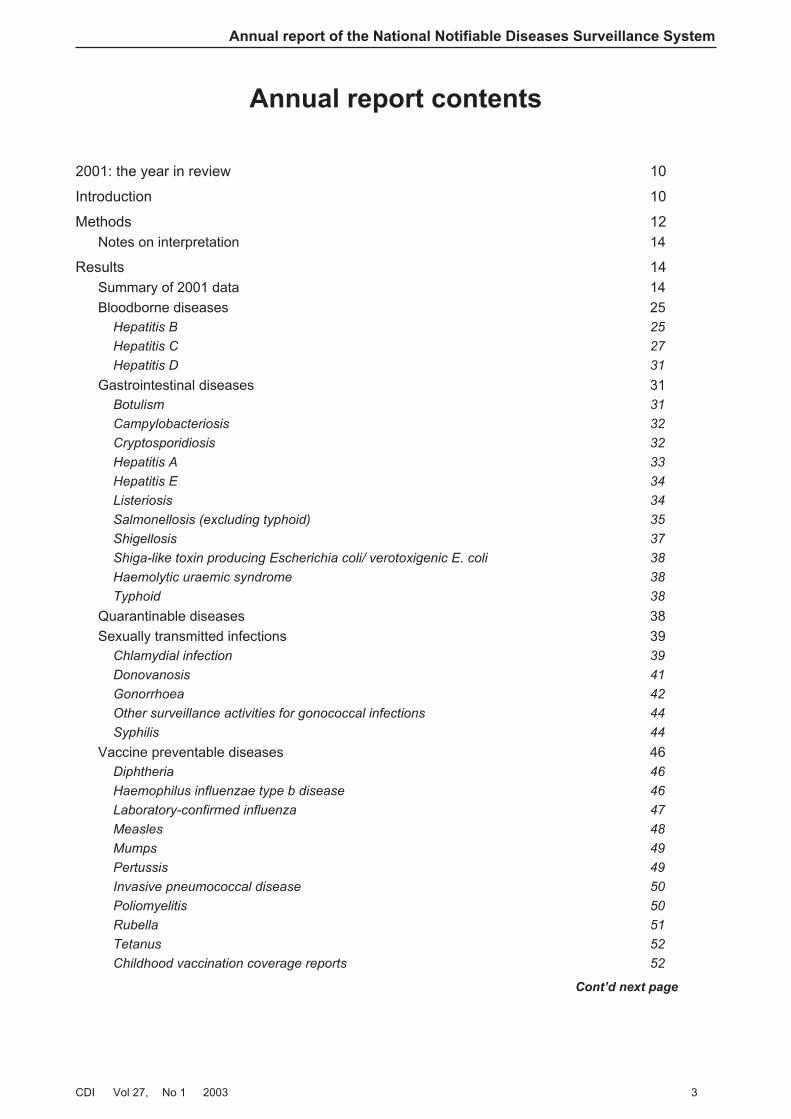
Annual report contents
2001: the year in review 10
Introduction 10
Methods 12
Notes on interpretation 14
Results 14
Summary of 2001 data 14
Bloodborne diseases 25
Hepatitis B 25
Hepatitis C 27
Hepatitis D 31
Gastrointestinal diseases 31
Botulism 31
Campylobacteriosis 32
Cryptosporidiosis 32
Hepatitis A 33
Hepatitis E 34
Listeriosis 34
Salmonellosis (excluding typhoid) 35
Shigellosis 37
Shiga-like toxin producing Escherichia coli/ verotoxigenic E. coli 38
Haemolytic uraemic syndrome 38
Typhoid 38
Quarantinable diseases 38
Sexually transmitted infections 39
Chlamydial infection 39
Donovanosis 41
Gonorrhoea 42
Other surveillance activities for gonococcal infections 44
Syphilis 44
Vaccine preventable diseases 46
Diphtheria 46
Haemophilus influenzae type b disease 46
Laboratory-confirmed influenza 47
Measles 48
Mumps 49
Pertussis 49
Invasive pneumococcal disease 50
Poliomyelitis 50
Rubella 51
Tetanus 52
Childhood vaccination coverage reports 52
Cont’d next page
4 CDI Vol 27, No 1 2003
Annual report of the National Notifiable Diseases Surveillance System
Annual report contents, continued
Vectorborne diseases 53
Introduction 53
Barmah Forest virus infection and Ross River virus infection 53
Murray Valley encephalitis and Kunjin 56
Japanese encephalitis 58
Dengue 58
Arbovirus — not elsewhere classified 59
Malaria 59
Zoonoses 61
Brucellosis 61
Leptospirosis 62
Ornithosis 63
Q fever 64
Australian bat lyssavirus and lyssavirus (unspecified) 64
Anthrax 65
Other bacterial infections 65
Legionellosis 65
Leprosy 67
Invasive meningococcal disease 67
Tuberculosis 69
Other communicable disease surveillance 69
Laboratory Virology and Serology Reporting Scheme 69
Australian Sentinel Practice Research Network 72
Antibiotic resistance in Australia 72
Creutzfeldt-Jakob disease 73
Responses to possible bioterrorism 73
Appendices 74
References 75

CDI Vol 27, No 1 2003 5
Annual report of the National Notifiable Diseases Surveillance System
Tables
Table 1. Diseases notified to the National Notifiable Diseases Surveillance System, Australia, 2001
Table 2. Notifications of communicable diseases, Australia, 2001, by state or territory
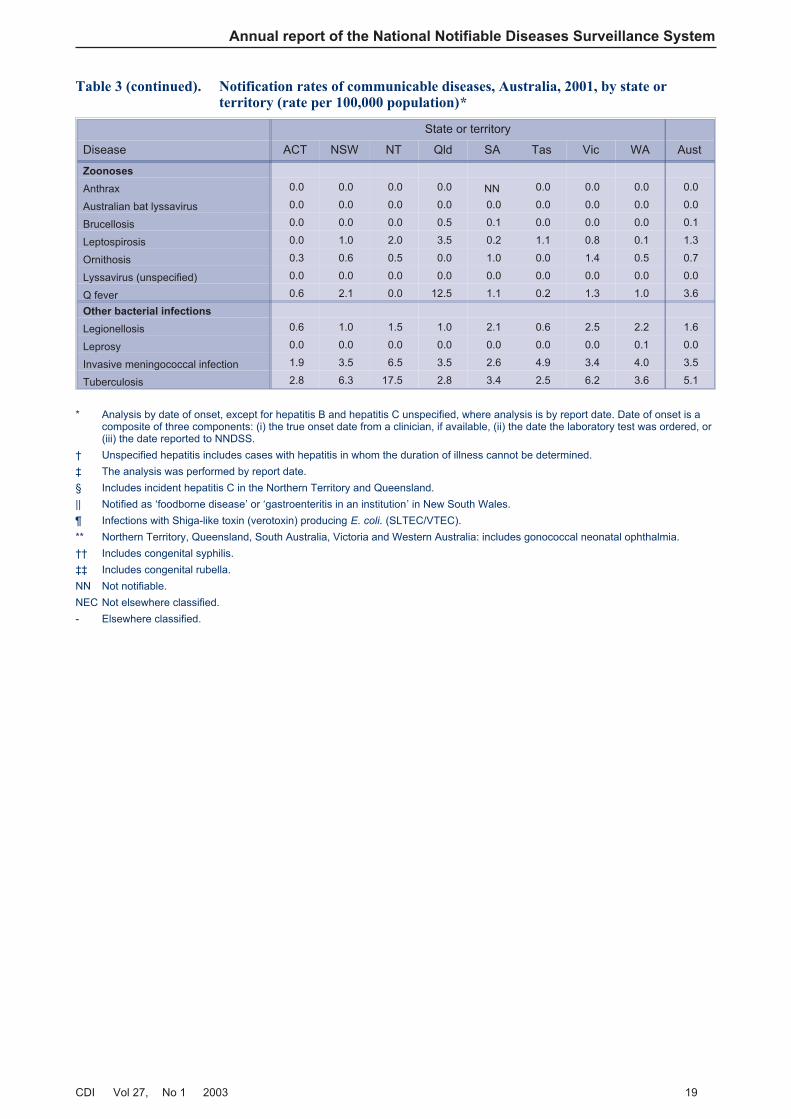
Table 3. Notification rates of communicable diseases, Australia, 2001, by state or territory (rate per100,000 population)
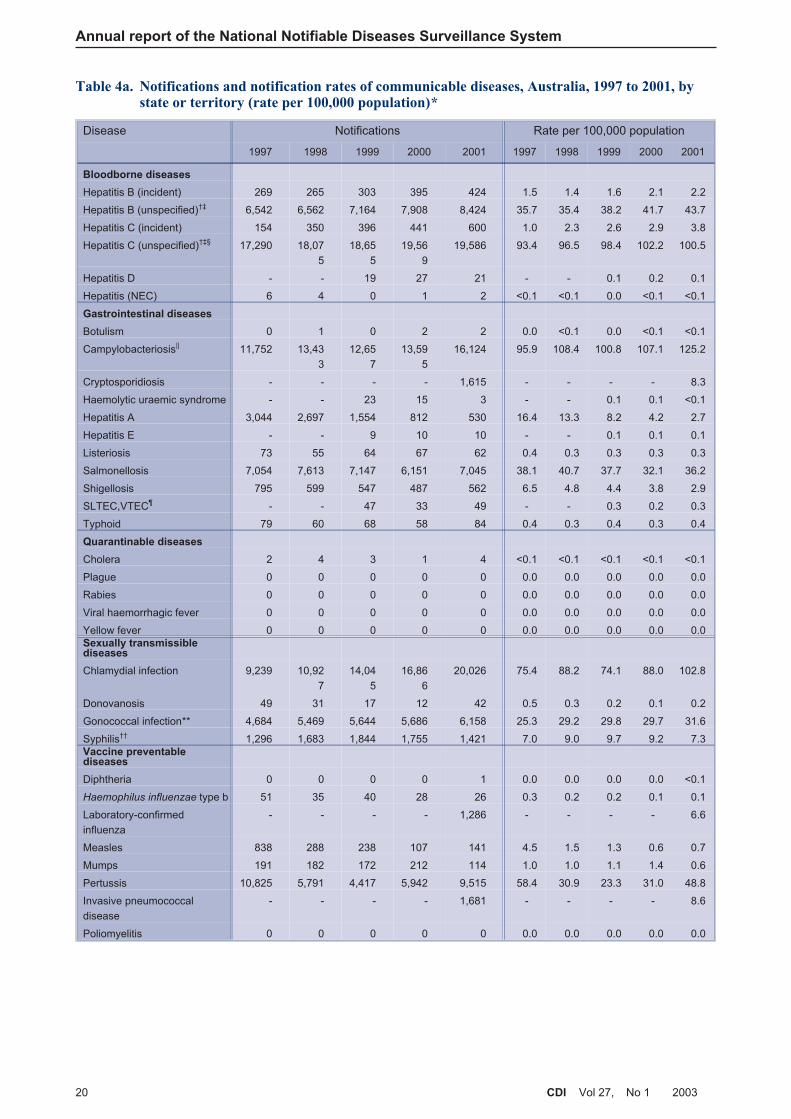
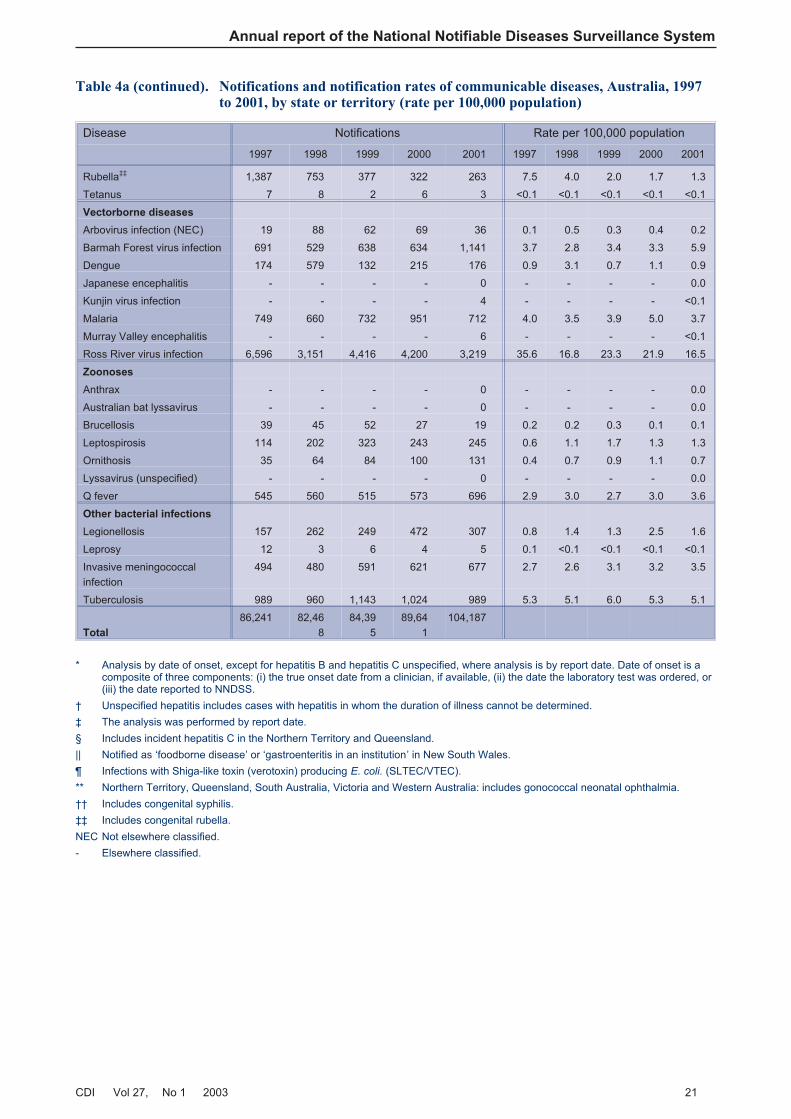
Table 4a. Notifications and notification rates of communicable diseases, Australia, 1997 to 2001, by stateor territory (rate per 100,000 population)
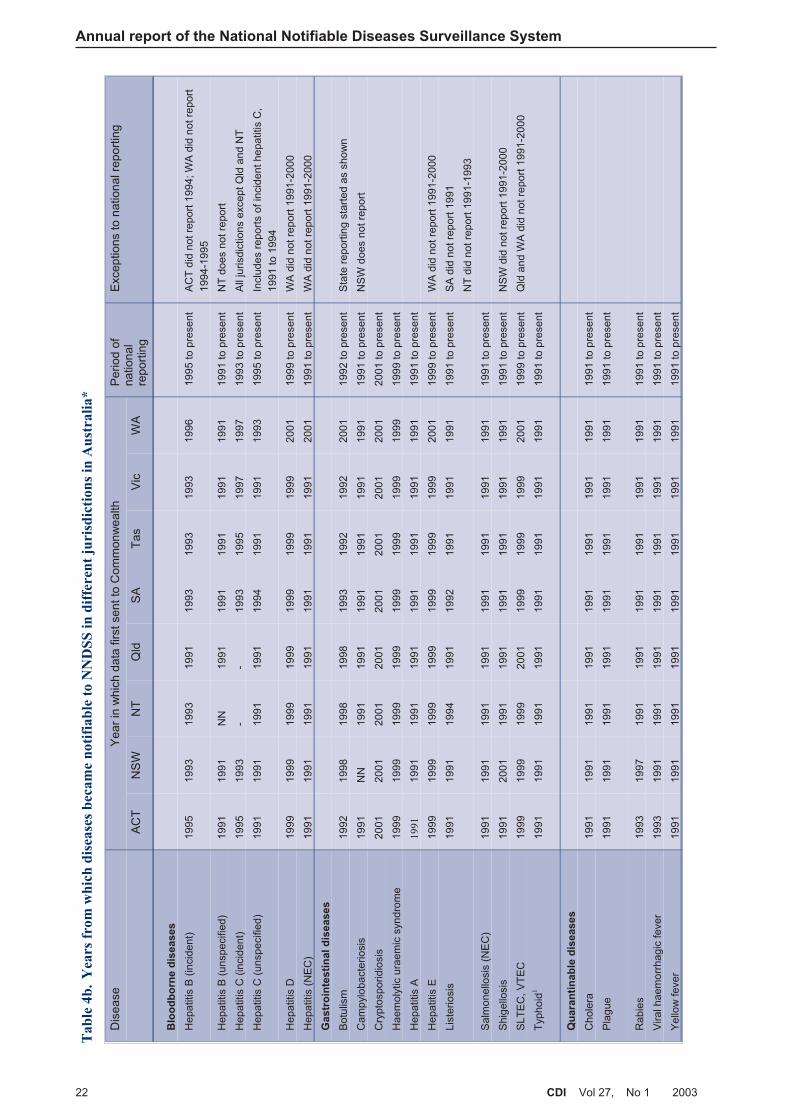
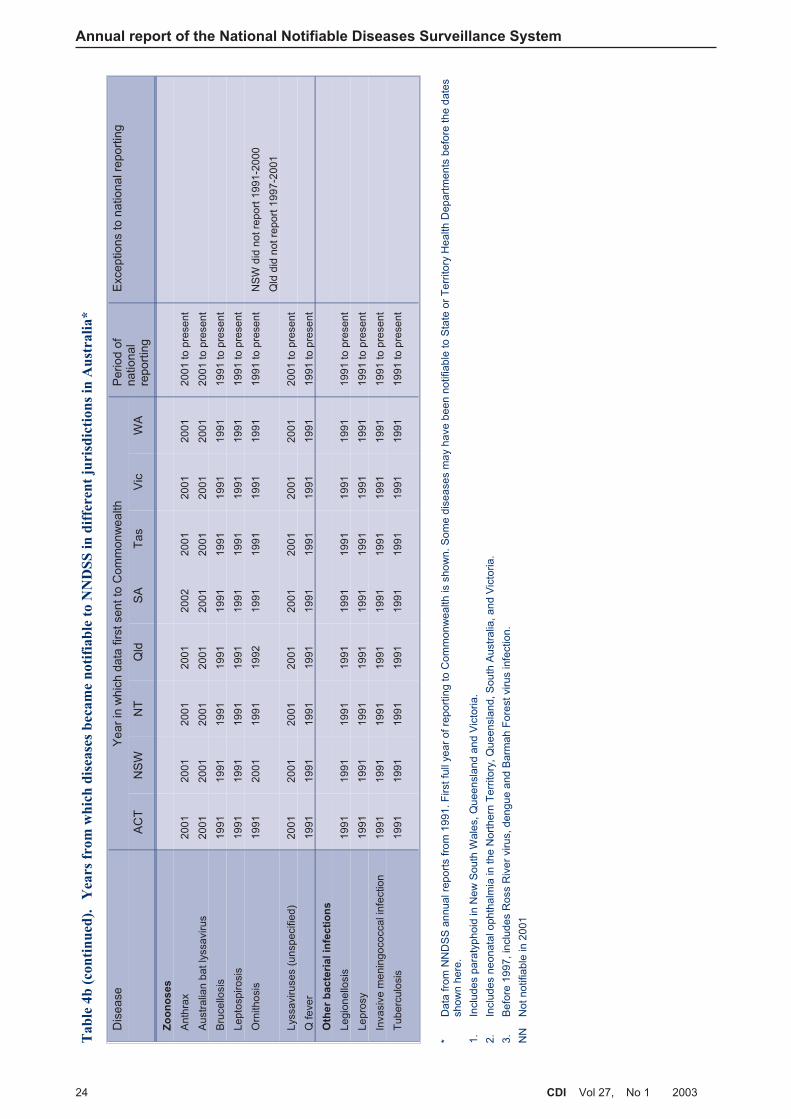
Table 4b. Years from which diseases became notifiable to NNDSS in different jurisdictions in Australia
Table 5. Risk factors identified in notifications of incident hepatitis B virus infection, Australia, 2001, byreporting state or territory
Table 6. Method of diagnosis, incident hepatitis C cases, the Australian Capital Territory, SouthAustralia, Tasmania and Victoria, 2001
Table 7. Assessment of injecting drug use, incident hepatitis C cases, Australian Capital Territory, SouthAustralia, Tasmania and Victoria, 2001
Table 8. Exposure assessment, incident hepatitis C cases, Australian Capital Territory, South Australia,Tasmania and Victoria, 2001
Table 9. Risk exposures associated with infection with hepatitis A virus infection, Australia, 2001 byreporting state or territory
Table 10. Top 10 isolates of Salmonella, Australia, 2001
Table 11. Trends in notifications of chlamydial infection, 1994 to 2001, by state or territory
Table 12. Proportion of gonococcal isolates showing antibiotic resistance, Australia, 1998 to 2001
Table 13. Vaccination schedules for seven-valent conjugate pneumococcal vaccine in Australia
Table 14. Percentage of Australian children born in 2000 vaccinated according to data available on theAustralian Childhood Immunisation Register. Estimate at one year of age
Table 15. Percentage of Australian children born in 1999 vaccinated according to data available on theAustralian Childhood Immunisation Register. Estimate at two years of age
Table 16. Notifications of infection with Murray Valley encephalitis and Kunjin viruses, Australia, 2001
Table 17. Notifications of malaria, Australia, 2001, by country of infection
Table 18. Notifications of malaria, Australia, 2001, by Plasmodium species
Table 19. Number of malaria cases reported to the Army Malaria Institute, 1998 to 2001, by area ofoperation and Plasmodium species
Table 20. Notifications of legionellosis, Australia, 2001, by species and state or territory
Table 21. Deaths due to legionellosis, Australia, 2001, by species and state or territory
Table 22. Notifications of invasive meningococcal infection by serogroups, 2001, by state or territory
Table 23. Deaths due to invasive meningococcal infection by serogroups, 2001, by state or territory
Table 24. Infectious agents reported to the Laboratory Virology and Serology Reporting Scheme, 2001, byjurisdiction
Table 25. Cases reported to the Australian National Creutzfeldt-Jakob Disease Registry: 1970 to 2001
6 CDI Vol 27, No 1 2003
Annual report of the National Notifiable Diseases Surveillance System
Figures
Figure 1. The communicable disease surveillance pyramid
Figure 2. Trends in notifications to the National Notifiable Diseases Surveillance System, Australia, 1991to 2001
Figure 3. Notifications to the National Notifiable Diseases Surveillance System, Australia, 2001, bydisease category
Figure 4. Selected diseases from the National Notifiable Diseases Surveillance System, comparison of totalnotifications for 2001 with previous five year means
Figure 5. Trends in notification rates, incident and unspecified hepatitis B virus infection, Australia, 1995to 2001
Figure 6. Notification rates for incident hepatitis B virus infections, Australia, 2001, by age group and sex
Figure 7. Trends in notification rates of incident hepatitis B virus infections, Australia, 1995 to 2001, byage group
Figure 8. Notification rates for unspecified hepatitis B virus infections, Australia, 2001, by age and sex
Figure 9. Trends in notification rates of unspecified hepatitis B virus infections, Australia, 1994 to 2001, byage group
Figure 10. Trends in notification rates, incident and unspecified hepatitis C infection, Australia, 1995 to2001
Figure 11. Notification rates for unspecified hepatitis C infections, Australia, 2001, by age group and sex
Figure 12. Trends in notification rates of unspecified hepatitis C infections, Australia, 1995 to 2001, by agegroup
Figure 13. Notification rates for incident hepatitis C infections, Australia, 2001, by age group and sex
Figure 14. Trends in notification rates of incident hepatitis C infections, Australia, 1997 to 2001, by agegroup
Figure 15. Trends in notifications of campylobacteriosis, Australia, 1991 to 2001, by month of onset
Figure 16. Notification rates of campylobacteriosis, Australia, 2001, by age group and sex
Figure 17. Notification rates of cryptosporidiosis, Australia, 2001, by age group and sex
Figure 18. Notification rates of hepatitis A, Australia, 2001, by age group and sex
Figure 19. Notification rates of listeriosis, Australia, 2001, by age group and sex
Figure 20. Trends in notifications of salmonellosis, Australia, 1991 to 2001, by month of onset
Figure 21. Notification rates of salmonellosis, Australia, 2001, by age group and sex
Figure 22. Trends in notifications of shigellosis, Australia, 1991 to 2001, by month of onset
Figure 23. Notification rates for shigellosis, Australia, 2001, by age group and sex
Figure 24. Notification rates of typhoid, Australia, 2001, by age group and sex
Figure 25. Trends in notification rates of chlamydial infection, Australia, 1994 to 2001, by year of onset
Figure 26. Notification rates of chlamydial infection, Australia, 2001, by age group and sex
Figure 27. Trends in notification rates of chlamydial infection in persons aged 15–29 years, Australia, 1997to 2001, by sex
Figure 28. Trends in age-standardised notification rates of chlamydial infection, the Northern Territory,South Australia and Western Australia (combined), 1997 to 2001, by Indigenous status
Figure 29. Trends in notification rates of gonococcal infection, Australia, 1991 to 2001
Figure 30. Notification rates of gonococcal infection, Australia, 2001, by age group and sex
CDI Vol 27, No 1 2003 7
Annual report of the National Notifiable Diseases Surveillance System
Figure 31. Trends in notification rates of gonococcal infection, in persons aged 15–29 years, Australia,1991 to 2001, by sex
Figure 32. Trends in age-standardised notification rates of gonococcal infection, the Northern Territory,South Australia and Western Australia (combined), 1997 to 2001, by Indigenous status
Figure 33. Notification rates of syphilis, Australia, 2001, by age group and sex
Figure 34. Trends in notification rates of syphilis, in persons aged 15–29 years, Australia, 1991 to 2001, bysex
Figure 35. Trends in age-standardised notification rates of syphilis, the Northern Territory, South Australiaand Western Australia (combined), 1997 to 2001, by Indigenous status
Figure 36. Trends in notifications of Haemophilus influenzae type b infections, Australia, 1991 to 2001, bymonth of onset
Figure 37. Notification rates of Haemophilus influenzae type b infection, Australia, 2001, by age group andsex
Figure 38. Notifications of laboratory-confirmed influenza and month when reporting to the NationalNotifiable Diseases Surveillance System began in each state or territory, Australia, 2001
Figure 39. Notification rates of laboratory- confirmed influenza, Australia, 2001, by age group and sex
Figure 40. Trends in notification rates of measles, Australia, 1991 to 2001, by month of onset
Figure 41. Notification rates of measles, Australia, 1998 to 2001, by age group
Figure 42. Notification rates of mumps, Australia, 2001, by age group and sex
Figure 43. Trends in notifications of pertussis, Australia, 1991 to 2001, by month of onset
Figure 44. Notification rates of pertussis, Australia, 1996 to 2001, by age group
Figure 45. Notification rates of pertussis, Australia, 2001, by age group and sex
Figure 46. Notification rates of invasive pneumococcal disease, Australia, 2001, by age group and sex
Figure 47. Notification rates of rubella, Australia, 2001, by age group and sex
Figure 48. Trends in notification rates of Barmah Forest virus infection and Ross River virus infection,Australia, 1995 to 2001, by year of onset
Figure 49. Trends in ratio of Ross River virus infection to Barmah Forest virus infection notification,Australia, 1995 to 2001, by month of onset
Figure 50. Notification rates of Barmah Forest virus infection, Australia, 2001, by age group and sex
Figure 51. Notification rates of Ross River virus infection, Australia, 2001, by age group and sex
Figure 52a. Numbers of seroconversions to Murray Valley encephalitis virus in sentinel chickens, NewSouth Wales, Northern Territory and Western Australia, 2001
Figure 52b. Numbers of seroconversions to Kunjin virus in sentinel chickens, New South Wales, NorthernTerritory, Western Australia, and Victoria, 2001
Figure 53. Notification rates of dengue, Australia, 2001, by age group and sex
Figure 54. Trends in notifications of dengue, Australia, 1991 to 2001, by month of onset
Figure 55. Trends in notification rates of malaria, Australia, 1991 to 2001, by year of onset
Figure 56. Notification rates of malaria, Australia, 2001, by age group and sex
Figure 57. Trends in notifications of brucellosis, Australia, 1991 to 2001, by year of onset
Figure 58. Notification rates of leptospirosis, Australia, 2001, by age group and sex
Figure 59. Trends in notification rates of leptospirosis, Australia, 1991 to 2001, by year of onset
Figure 60. Trends in notification rates of ornithosis, Australia, 1991 to 2001, by year of onset
Figure 61. Notification rates of ornithosis, Australia, 2001, by age group and sex
8 CDI Vol 27, No 1 2003
Annual report of the National Notifiable Diseases Surveillance System
Figure 62. Notification rates of Q fever, Australia, 2001, by age group and sex
Figure 63. Trends in notification rates of Q fever, Australia, 1991 to 2000, by year of onset
Figure 64. Trends in notification rates of legionellosis, Australia, 1991 to 2001, by year of onset
Figure 65. Notification rates of legionellosis, Australia, 2001, by age group and sex
Figure 66. Trends in notification rates of invasive meningococcal infection, Australia, 1992 to 2001, by yearof onset
Figure 67. Notification rates of invasive meningococcal infection, Australia, 2001, by age group and sex
Figure 68. Notification rates of tuberculosis Australia, 2001, by age group and sex
Figure 69. Reports of viral infections to the Laboratory Virology and Serology Reporting Scheme, 2001, byviral group
Figure 70. Laboratory reports of varicella- zoster virus to the Laboratory Virology and Serology ReportingScheme and hospitalisations with a principal diagnosis of varicella, Australia, 1997 to 1999
Figure 71. Laboratory reports to the Laboratory Virology and Serology Reporting Scheme of rotavirusinfection, Australia, 1991 to 2000, by month of specimen collection
Maps
Map 1. Australian Bureau of Statistics Statistical Divisions
Map 2. Notification rates of salmonellosis, Australia, 2001, by Statistical Division of residence
Map 3. Notification rates of chlamydial infection, Australia, 2001, by Statistical Division of residence
Map 4. Notification rates of gonococcal infection, Australia, 2001, by Statistical Division of residence
Map 5. Notification rates of syphilis, Australia, 2001, by Statistical Division of residence
Map 6. Notification rates of pertussis, Australia, 2001, by Statistical Division of residence
Map 7. Notification rates of invasive pneumococcal disease, Australia, 2001, by Statistical Division ofresidence
Map 8. Notification rates of Barmah Forest virus infection, Australia 2001, by Statistical Division ofresidence
Map 9. Notification rates of Ross River virus infection, Australia 2001, by Statistical Division ofresidence
Map 10. Geographical distribution of sentinel chicken flocks for the surveillance of arboviruses, Australia,2001
Map 11. Notification rates of leptospirosis, Australia, 2001, by Statistical Division of residence

Abbreviations used in this report
7vPCV 7-valent conjugate pneumococcal vaccine
23vPPV 23-valent conjugate pneumococcal vaccine
AIDS Acquired immune deficiency syndrome
ASPREN Australian Sentinel Practice Research Network
BF Barmah Forest virus
CDNA Communicable Diseases Network Australia
CJD Creutzfeldt-Jakob disease
DoHA Department of Health and Ageing
DT Definitive Type (of Salmonella)
DTP Diphtheria-tetanus-pertussis
EAGAR Expert Advisory Group for Antimicrobial Resistance
Hib Haemophilus influenzae type b
HIV Human immunodeficiency virus
HUS Haemolytic uraemic syndrome
ICD10-AM International Classification of Diseases, version 10, Australian Modification
IDU Injecting drug use(r)
IPD Invasive pneumococcal disease
JE Japanese encephalitis virus
JETACAR Joint Expert Technical Advisory Committee on Antibiotic Resistance
LabVISE Laboratory Virology and Serology Reporting Scheme
MMR Measles-mumps-rubella
MVE Murray Valley encephalitis virus
NCHECR National Centre in HIV Epidemiology and Clinical Research
NCIRS National Centre for Immunisation Research and Surveillance
NEC Not elsewhere classified
NN Not notifiable
NNDSS National Notifiable Diseases Surveillance System
OPV Oral polio vaccine
PNG Papua New Guinea
RR Ross River virus
SLTEC/VTEC Shiga-like toxin producing Escherichia coli, Verotoxin-producing E. coli
STI(s) Sexually transmitted infection(s)
STM Salmonella Typhimurium
TB Tuberculosis
USA United States of America
WHO World Health Organization
WPR Western Pacific Region
CDI Vol 27, No 1 2003 9
Annual report of the National Notifiable Diseases Surveillance System
2001: the year in reviewThe year 2001 will be remembered for the terroristattacks on the United States of America (USA) andthe deliberate release of anthrax. A total of 22 cases ofanthrax were detected and there were five deaths.1
In response to these events, governments aroundthe world prepared for bioterrorism by stockpiling ofvaccines and antibiotics, monitoring unusual clinicalpresentations through ‘syndromic surveillance’ andstrengthening laboratory capacity to test clinical andenvironmental samples for pathogens of biosecurityconcern. The release of anthrax in the USA wasfollowed by ‘white powder incidents’ in Australia andelsewhere, straining emergency, medical and laboratoryservices. No deliberate releases of pathogens weredetected in Australia.
Improvements continued to be made in the surveillanceand control of communicable diseases in Australia in2001. Following the demonstration of high vaccineefficacy in the USA,2 the seven-valent conjugatepneumococcal vaccine (7vPCV) was introduced inAustralia in July 2001. A targeted vaccination schedulewas developed to immunise children at high risk.Enhanced surveillance was introduced to measurethe impact of vaccines on the serotype frequency andprevalence of antibiotic resistance in the pneumococci.Continued development of Australia’s response to thetransmissible spongiform encephalopathies includedthe introduction of a certification system for importedbeef products in July 2001.3 The publication ofGuidelines for the early clinical and public health
management of meningococcal disease in Australia
by the Communicable Diseases Network Australia(CDNA) in June 2001 was timely as there were anumber of highly publicised clusters ofmeningococcal cases in Australia later in 2001.
Internationally, cases of vaccine-derived poliocausing paralytic disease caused concern about theglobal polio eradication program. An outbreak of21 cases of polio in Hispaniola and three cases in thePhilippines occurred in communities with relativelylow vaccination rates. These outbreaks demonstratethe potential of the polio virus to evade the impact ofvaccination, and underline the importance ofmaintaining high levels of vaccination coverage.
New molecular clues to the basis of the virulence ofpandemic strains of laboratory-confirmed influenzawere unravelled in 2001.4,5 The Australian Action Planfor Pandemic Influenza, updated in 2001, establishedplans, levels of alerts and responsibilities for the controlof an influenza pandemic, were one to occur.
The surveillance of communicable diseases inAustralia was further improved in 2001 by a revisionof the diseases under surveillance and through theintroduction of enhanced surveillance of invasivepneumococcal disease. In their first year of operation
OzFoodNet, the network of foodborne diseaseepidemiologists in Australia, were involved in thecontrol of two international foodborne diseaseoutbreaks and identified 86 domestic outbreaks. TheOzFoodNet report for 2001 provides valuableadditional information about the epidemiology offoodborne disease in Australia.6
Control of communicable diseases in Australiacontinues to face challenges. In 2001, theseincluded imported cases of measles causingoutbreaks among unvaccinated people. Clusters ofmeningococcal disease in adolescents and youngadults in a series of well publicised clusters in 2001and 2002, prompted the Commonwealth Governmentto commence an immunisation program with themeningococcal C vaccine.
Continued improvements will need to be made tosurveillance systems to manage the changingepidemiology of communicable diseases in Australiaand to provide essential data for biosecurity.
IntroductionSurveillance of communicable diseases is vital forthe control of communicable diseases, to identify andassess diseases requiring control or prevention andto monitor trends over time. It is also required for theguidance of policy making.
Surveillance in Australia exists at the national, state/territory and local levels. Primary responsibility forpublic health action lies with the states and territoriesand local health authorities.
The role of surveillance at a national level includes:
• identifying national trends in disease;
• guidance for policy development at a nationallevel and resource allocation;
• Monitoring the need for and impact of nationalcontrol programs;
• coordination of national or multi-jurisdictionaloutbreaks;
• description of the epidemiology of rare diseases,that occur infrequently at state and territory levels;
• meeting various international reporting requirements,such as providing disease statistics to the WorldHealth Organization (WHO); and
• support for quarantine activities, which are aCommonwealth responsibility.
The National Notifiable Diseases Surveillance System(NNDSS) is based on fortnightly reporting by the statesand territories to the Commonwealth. Fifty-fivecommunicable diseases agreed upon nationallythrough CDNA are reported to NNDSS (Table 1). Thesystem is complemented by several other surveillancesystems, which provide information on other particulardiseases, including some that are not reported toNNDSS.
10 CDI Vol 27, No 1 2003
Annual report of the National Notifiable Diseases Surveillance System
CDI Vol 27, No 1 2003 11
Annual report of the National Notifiable Diseases Surveillance System
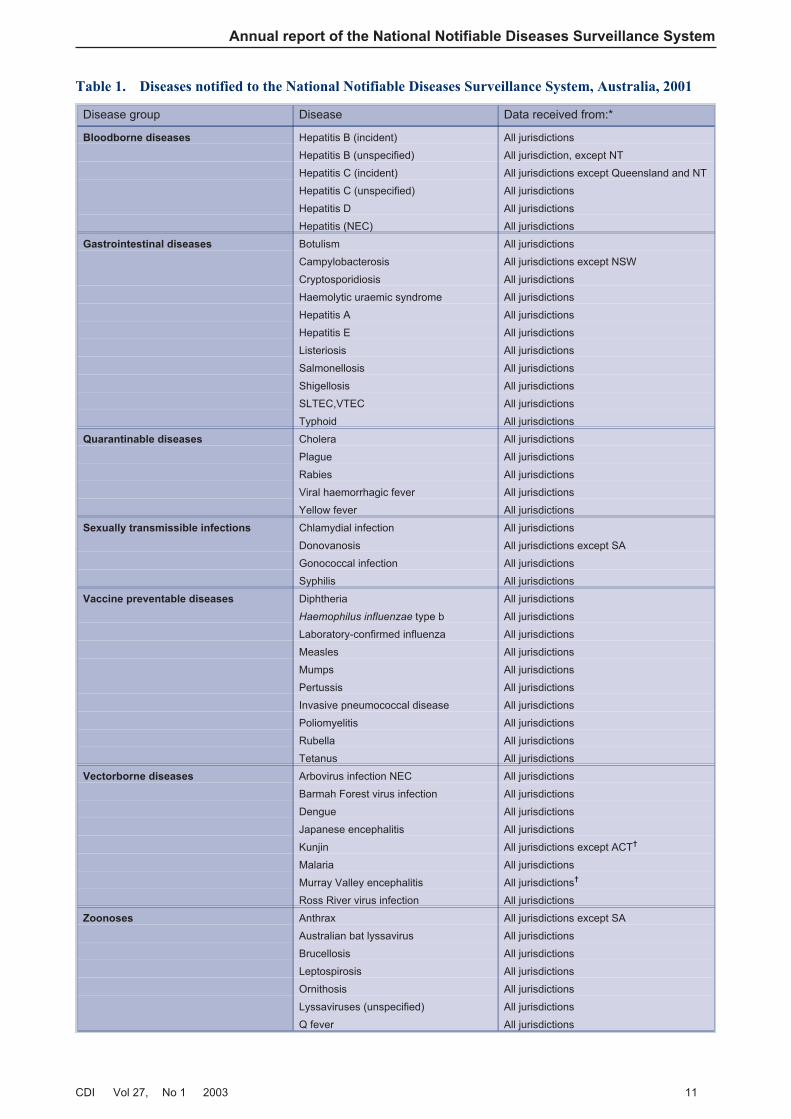
Table 1. Diseases notified to the National Notifiable Diseases Surveillance System, Australia, 2001
Disease group Disease Data received from:*
Bloodborne diseases Hepatitis B (incident) All jurisdictions
Hepatitis B (unspecified) All jurisdiction, except NT
Hepatitis C (incident) All jurisdictions except Queensland and NT
Hepatitis C (unspecified) All jurisdictions
Hepatitis D All jurisdictions
Hepatitis (NEC) All jurisdictions
Gastrointestinal diseases Botulism All jurisdictions
Campylobacterosis All jurisdictions except NSW
Cryptosporidiosis All jurisdictions
Haemolytic uraemic syndrome All jurisdictions
Hepatitis A All jurisdictions
Hepatitis E All jurisdictions
Listeriosis All jurisdictions
Salmonellosis All jurisdictions
Shigellosis All jurisdictions
SLTEC,VTEC All jurisdictions
Typhoid All jurisdictions
Quarantinable diseases Cholera All jurisdictions
Plague All jurisdictions
Rabies All jurisdictions
Viral haemorrhagic fever All jurisdictions
Yellow fever All jurisdictions
Sexually transmissible infections Chlamydial infection All jurisdictions
Donovanosis All jurisdictions except SA
Gonococcal infection All jurisdictions
Syphilis All jurisdictions
Vaccine preventable diseases Diphtheria All jurisdictions
Haemophilus influenzae type b All jurisdictions
Laboratory-confirmed influenza All jurisdictions
Measles All jurisdictions
Mumps All jurisdictions
Pertussis All jurisdictions
Invasive pneumococcal disease All jurisdictions
Poliomyelitis All jurisdictions
Rubella All jurisdictions
Tetanus All jurisdictions
Vectorborne diseases Arbovirus infection NEC All jurisdictions
Barmah Forest virus infection All jurisdictions
Dengue All jurisdictions
Japanese encephalitis All jurisdictions
Kunjin All jurisdictions except ACT†
Malaria All jurisdictions
Murray Valley encephalitis All jurisdictions†
Ross River virus infection All jurisdictions
Zoonoses Anthrax All jurisdictions except SA
Australian bat lyssavirus All jurisdictions
Brucellosis All jurisdictions
Leptospirosis All jurisdictions
Ornithosis All jurisdictions
Lyssaviruses (unspecified) All jurisdictions
Q fever All jurisdictions
The results of communicable disease surveillance arereported through several avenues of communication.Fortnightly teleconferences of the CDNA provide themost up-to-date information on topics of immediateinterest. The Communicable Diseases Intelligence
journal, published quarterly, contains results ofsurveillance and research reports on the epidemiologyand control of various communicable diseases. Datasummaries are published on the CommunicableDiseases Australia website on a fortnightly basis.The annual report of the NNDSS, Australia’snotifiable diseases status, provides yearly summariesof notifications.
MethodsAustralia is a federation of six states (New SouthWales, Queensland, South Australia, Tasmania,Victoria and Western Australia) and two territories(the Australian Capital Territory and the NorthernTerritory). State and Territory health departmentscollect notifications of communicable diseases undertheir public health legislation. The CommonwealthDepartment of Health and Ageing (DoHA) does nothave any legislated responsibility for public healthapart from human quarantine. States and territorieshave agreed to forward data on nationally agreedcommunicable diseases to DoHA for the purposes ofnational communicable disease surveillance.
In 2001, data were transmitted to DoHA eachfortnight by the states and territories. TheCommonwealth received final data sets for 2001from the states and territories by July 2002. Apparenterrors or incomplete data for some diseases,together with any queries arising from the data, werereturned to the states and territories for review.
The national data set includes fields for a uniquerecord reference number; notifying state or territory;disease code; age; sex; Indigenous status; postcodeof residence; the date of onset of the disease; andthe date of report to the state or territory healthdepartment. Additional information was available onthe species and serogroups isolated in cases of
legionellosis, invasive meningococcal disease andmalaria, and on the vaccination status in cases ofchildhood vaccine-preventable diseases. While notincluded in the national dataset, additionalinformation concerning mortality and specific healthrisk factors for some diseases was obtained fromstates and territories.
Analyses in this report are based on date of diseaseonset, unless otherwise specified. For analysis ofseasonal trends, notifications were reported bymonth of onset. Population notification rates werecalculated using 2001 mid-year census-basedestimates of the resident population, supplied by theAustralian Bureau of Statistics (Appendix 1).Population data used in previous annual reports wasbased on forward projections from the 1996 census.The population calculated for the year 2001 is lessthan the year 2000 estimate. Comparison of ratesacross these years will thus be subject to slight error.
Where diseases were not notifiable in a state orterritory for a particular year, adjusted rates werecalculated using a denominator excluding thatjurisdiction’s population. The Australian Institute ofHealth and Welfare supplied hospital admission datafor the financial year 2000–01.
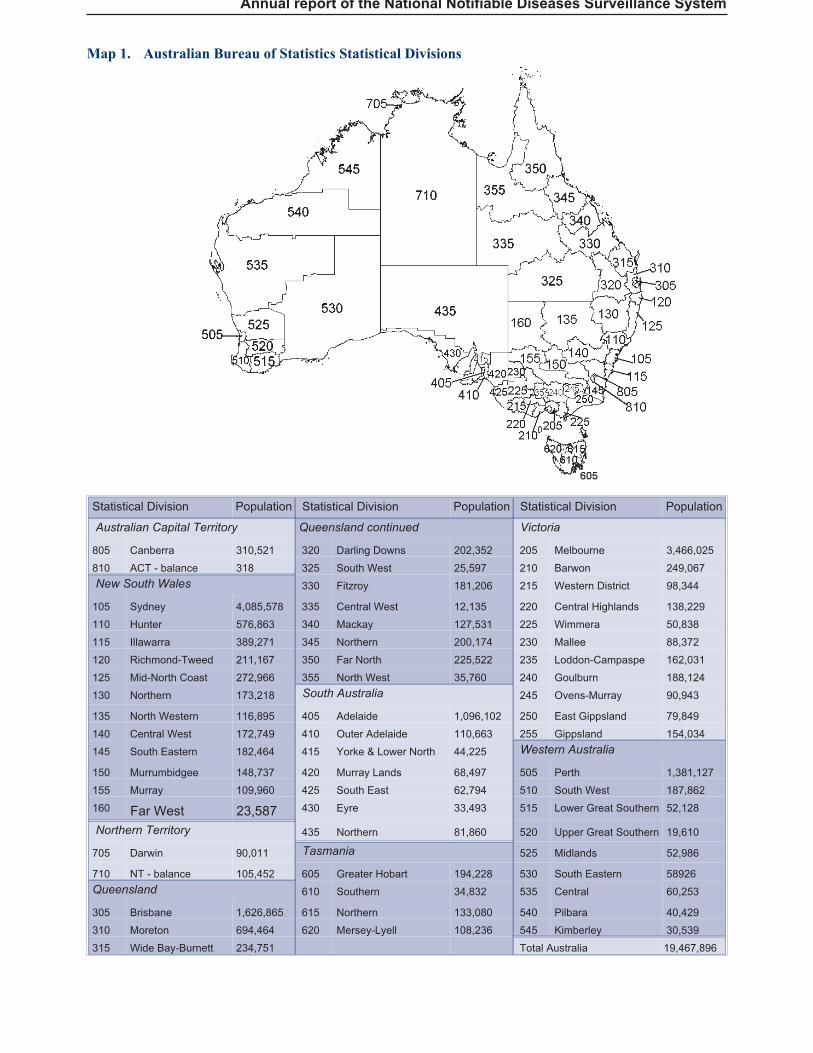
Maps were generated using MapInfo, and werebased on postcodes of residence, which have beenallocated to Statistical Divisions by the AustralianBureau of Statistics (Map 1). The two StatisticalDivisions that make up the Australian CapitalTerritory are combined, as the population for onedivision is very small. Similarly, the Darwin and‘Northern Territory – balance’ Statistical Divisionshave been combined to calculate rates for theNorthern Territory as a whole. Rates for the differentStatistical Divisions were ordered into six groups —the highest value, the lowest value (above zero)those equal to zero, and the intermediate valuesdivided into three equal-sized groups.
12 CDI Vol 27, No 1 2003
Annual report of the National Notifiable Diseases Surveillance System
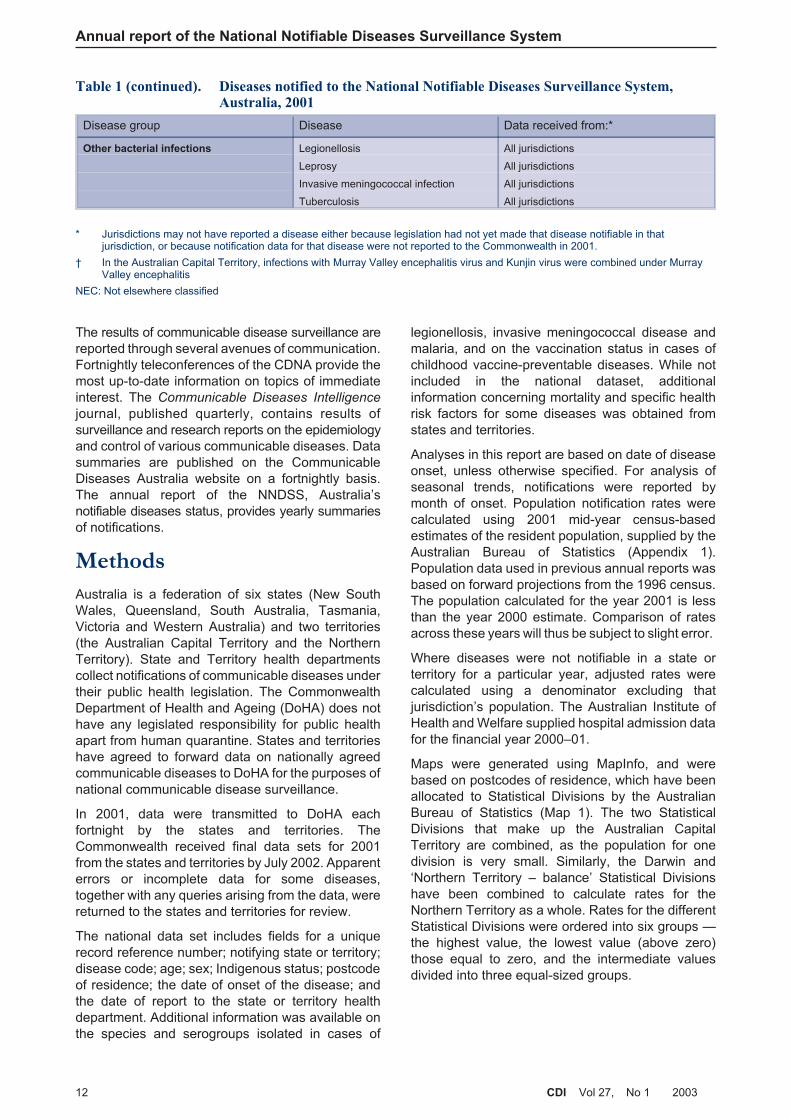
Disease group Disease Data received from:*
Other bacterial infections Legionellosis All jurisdictions
Leprosy All jurisdictions
Invasive meningococcal infection All jurisdictions
Tuberculosis All jurisdictions
* Jurisdictions may not have reported a disease either because legislation had not yet made that disease notifiable in thatjurisdiction, or because notification data for that disease were not reported to the Commonwealth in 2001.
† In the Australian Capital Territory, infections with Murray Valley encephalitis virus and Kunjin virus were combined under MurrayValley encephalitis
NEC: Not elsewhere classified
Table 1 (continued). Diseases notified to the National Notifiable Diseases Surveillance System,Australia, 2001
Annual report of the National Notifiable Diseases Surveillance System
Map 1. Australian Bureau of Statistics Statistical Divisions
Statistical Division Population Statistical Division Population Statistical Division Population
Australian Capital Territory Queensland continued Victoria
805 Canberra 310,521 320 Darling Downs 202,352 205 Melbourne 3,466,025
810 ACT - balance 318 325 South West 25,597 210 Barwon 249,067
New South Wales 330 Fitzroy 181,206 215 Western District 98,344
105 Sydney 4,085,578 335 Central West 12,135 220 Central Highlands 138,229
110 Hunter 576,863 340 Mackay 127,531 225 Wimmera 50,838
115 Illawarra 389,271 345 Northern 200,174 230 Mallee 88,372
120 Richmond-Tweed 211,167 350 Far North 225,522 235 Loddon-Campaspe 162,031
125 Mid-North Coast 272,966 355 North West 35,760 240 Goulburn 188,124
130 Northern 173,218 South Australia 245 Ovens-Murray 90,943
135 North Western 116,895 405 Adelaide 1,096,102 250 East Gippsland 79,849
140 Central West 172,749 410 Outer Adelaide 110,663 255 Gippsland 154,034
145 South Eastern 182,464 415 Yorke & Lower North 44,225 Western Australia
150 Murrumbidgee 148,737 420 Murray Lands 68,497 505 Perth 1,381,127
155 Murray 109,960 425 South East 62,794 510 South West 187,862
160 Far West 23,587 430 Eyre 33,493 515 Lower Great Southern 52,128
Northern Territory 435 Northern 81,860 520 Upper Great Southern 19,610
705 Darwin 90,011 Tasmania 525 Midlands 52,986
710 NT - balance 105,452 605 Greater Hobart 194,228 530 South Eastern 58926
Queensland 610 Southern 34,832 535 Central 60,253
305 Brisbane 1,626,865 615 Northern 133,080 540 Pilbara 40,429
310 Moreton 694,464 620 Mersey-Lyell 108,236 545 Kimberley 30,539
315 Wide Bay-Burnett 234,751 Total Australia 19,467,896
Notes on interpretation
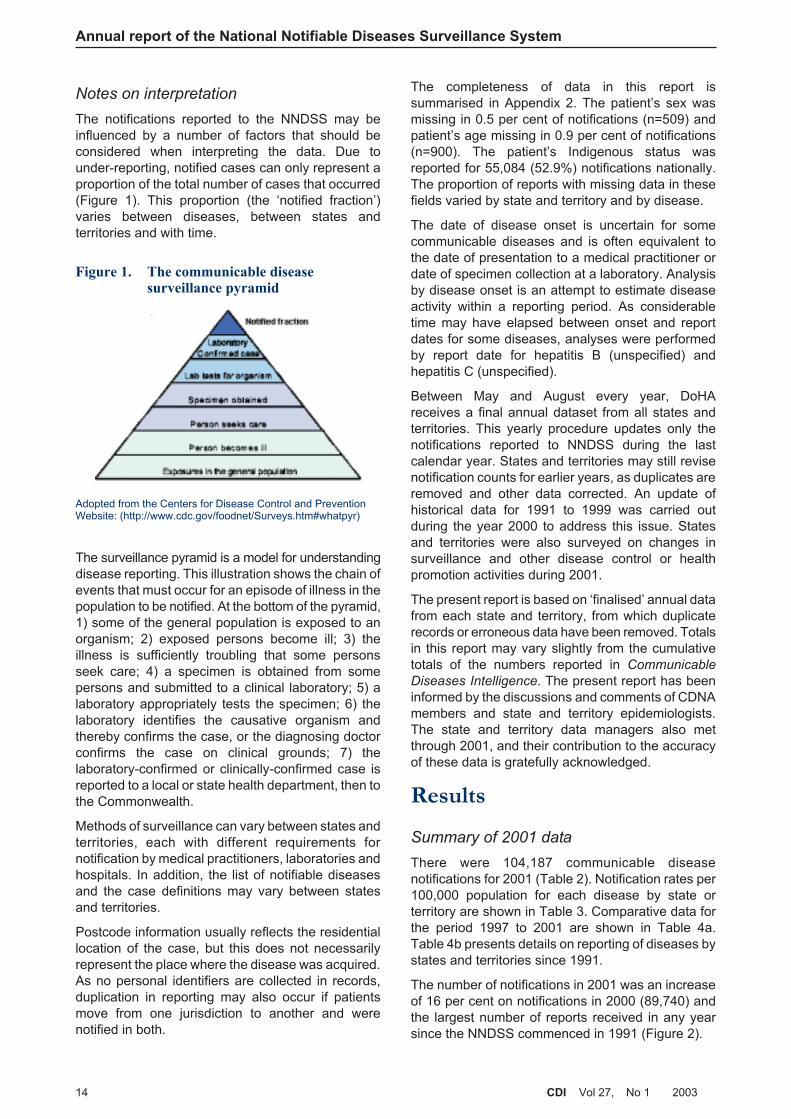
The notifications reported to the NNDSS may beinfluenced by a number of factors that should beconsidered when interpreting the data. Due tounder-reporting, notified cases can only represent aproportion of the total number of cases that occurred(Figure 1). This proportion (the ‘notified fraction’)varies between diseases, between states andterritories and with time.
The surveillance pyramid is a model for understandingdisease reporting. This illustration shows the chain ofevents that must occur for an episode of illness in thepopulation to be notified. At the bottom of the pyramid,1) some of the general population is exposed to anorganism; 2) exposed persons become ill; 3) theillness is sufficiently troubling that some personsseek care; 4) a specimen is obtained from somepersons and submitted to a clinical laboratory; 5) alaboratory appropriately tests the specimen; 6) thelaboratory identifies the causative organism andthereby confirms the case, or the diagnosing doctorconfirms the case on clinical grounds; 7) thelaboratory-confirmed or clinically-confirmed case isreported to a local or state health department, then tothe Commonwealth.
Methods of surveillance can vary between states andterritories, each with different requirements fornotification by medical practitioners, laboratories andhospitals. In addition, the list of notifiable diseasesand the case definitions may vary between statesand territories.
Postcode information usually reflects the residentiallocation of the case, but this does not necessarilyrepresent the place where the disease was acquired.As no personal identifiers are collected in records,duplication in reporting may also occur if patientsmove from one jurisdiction to another and werenotified in both.
The completeness of data in this report issummarised in Appendix 2. The patient’s sex wasmissing in 0.5 per cent of notifications (n=509) andpatient’s age missing in 0.9 per cent of notifications(n=900). The patient’s Indigenous status wasreported for 55,084 (52.9%) notifications nationally.The proportion of reports with missing data in thesefields varied by state and territory and by disease.
The date of disease onset is uncertain for somecommunicable diseases and is often equivalent tothe date of presentation to a medical practitioner ordate of specimen collection at a laboratory. Analysisby disease onset is an attempt to estimate diseaseactivity within a reporting period. As considerabletime may have elapsed between onset and reportdates for some diseases, analyses were performedby report date for hepatitis B (unspecified) andhepatitis C (unspecified).
Between May and August every year, DoHAreceives a final annual dataset from all states andterritories. This yearly procedure updates only thenotifications reported to NNDSS during the lastcalendar year. States and territories may still revisenotification counts for earlier years, as duplicates areremoved and other data corrected. An update ofhistorical data for 1991 to 1999 was carried outduring the year 2000 to address this issue. Statesand territories were also surveyed on changes insurveillance and other disease control or healthpromotion activities during 2001.
The present report is based on ‘finalised’ annual datafrom each state and territory, from which duplicaterecords or erroneous data have been removed. Totalsin this report may vary slightly from the cumulativetotals of the numbers reported in Communicable
Diseases Intelligence. The present report has beeninformed by the discussions and comments of CDNAmembers and state and territory epidemiologists.The state and territory data managers also metthrough 2001, and their contribution to the accuracyof these data is gratefully acknowledged.
Results
Summary of 2001 data
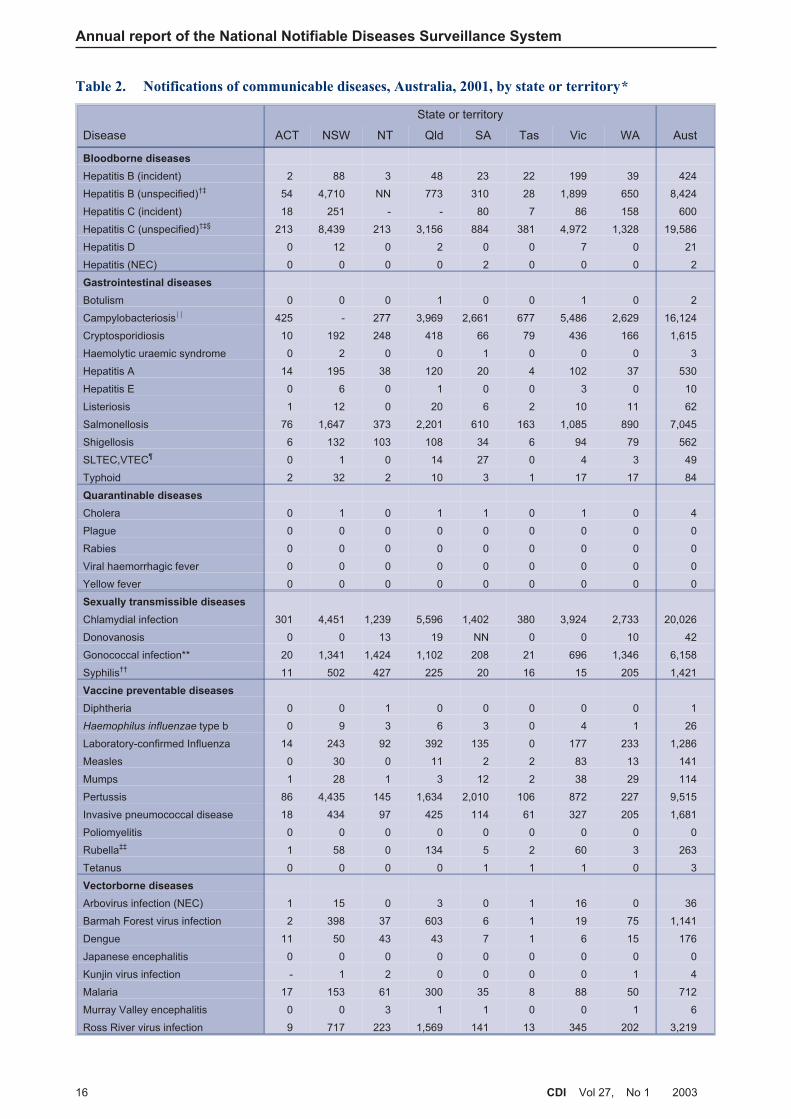
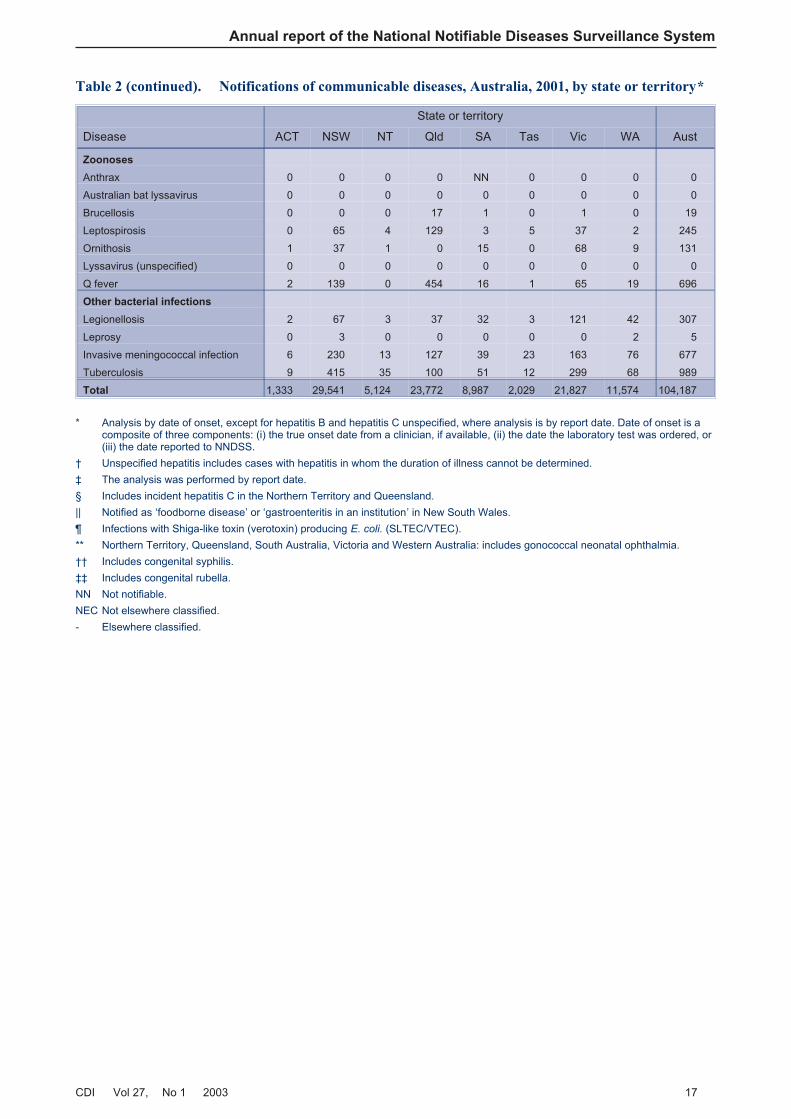
There were 104,187 communicable diseasenotifications for 2001 (Table 2). Notification rates per100,000 population for each disease by state orterritory are shown in Table 3. Comparative data forthe period 1997 to 2001 are shown in Table 4a.Table 4b presents details on reporting of diseases bystates and territories since 1991.
The number of notifications in 2001 was an increaseof 16 per cent on notifications in 2000 (89,740) andthe largest number of reports received in any yearsince the NNDSS commenced in 1991 (Figure 2).
14 CDI Vol 27, No 1 2003
Annual report of the National Notifiable Diseases Surveillance System
Figure 1. The communicable diseasesurveillance pyramid
Adopted from the Centers for Disease Control and PreventionWebsite: (http://www.cdc.gov/foodnet/Surveys.htm#whatpyr)
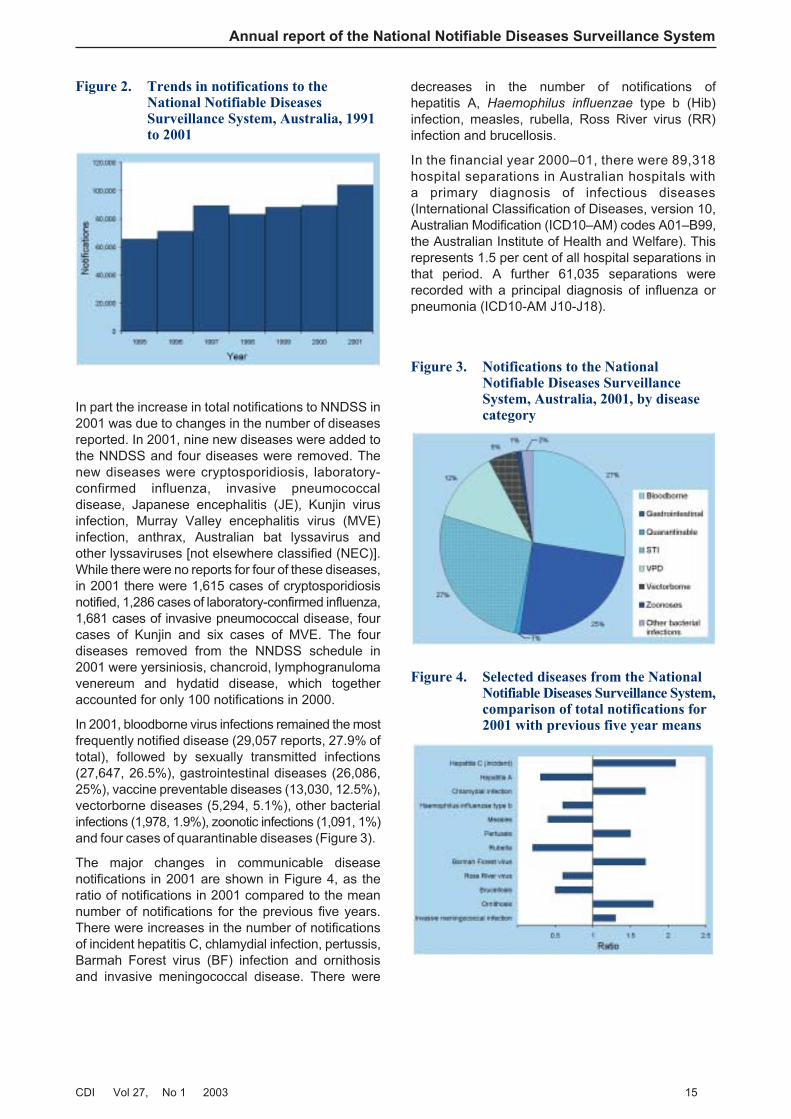
In part the increase in total notifications to NNDSS in2001 was due to changes in the number of diseasesreported. In 2001, nine new diseases were added tothe NNDSS and four diseases were removed. Thenew diseases were cryptosporidiosis, laboratory-confirmed influenza, invasive pneumococcaldisease, Japanese encephalitis (JE), Kunjin virusinfection, Murray Valley encephalitis virus (MVE)infection, anthrax, Australian bat lyssavirus andother lyssaviruses [not elsewhere classified (NEC)].While there were no reports for four of these diseases,in 2001 there were 1,615 cases of cryptosporidiosisnotified, 1,286 cases of laboratory-confirmed influenza,1,681 cases of invasive pneumococcal disease, fourcases of Kunjin and six cases of MVE. The fourdiseases removed from the NNDSS schedule in2001 were yersiniosis, chancroid, lymphogranulomavenereum and hydatid disease, which togetheraccounted for only 100 notifications in 2000.
In 2001, bloodborne virus infections remained the mostfrequently notified disease (29,057 reports, 27.9% oftotal), followed by sexually transmitted infections(27,647, 26.5%), gastrointestinal diseases (26,086,25%), vaccine preventable diseases (13,030, 12.5%),vectorborne diseases (5,294, 5.1%), other bacterialinfections (1,978, 1.9%), zoonotic infections (1,091, 1%)and four cases of quarantinable diseases (Figure 3).
The major changes in communicable diseasenotifications in 2001 are shown in Figure 4, as theratio of notifications in 2001 compared to the meannumber of notifications for the previous five years.There were increases in the number of notificationsof incident hepatitis C, chlamydial infection, pertussis,Barmah Forest virus (BF) infection and ornithosisand invasive meningococcal disease. There were
decreases in the number of notifications ofhepatitis A, Haemophilus influenzae type b (Hib)infection, measles, rubella, Ross River virus (RR)infection and brucellosis.
In the financial year 2000–01, there were 89,318hospital separations in Australian hospitals witha primary diagnosis of infectious diseases(International Classification of Diseases, version 10,Australian Modification (ICD10–AM) codes A01–B99,the Australian Institute of Health and Welfare). Thisrepresents 1.5 per cent of all hospital separations inthat period. A further 61,035 separations wererecorded with a principal diagnosis of influenza orpneumonia (ICD10-AM J10-J18).
CDI Vol 27, No 1 2003 15
Annual report of the National Notifiable Diseases Surveillance System
Figure 2. Trends in notifications to theNational Notifiable DiseasesSurveillance System, Australia, 1991to 2001
Figure 3. Notifications to the NationalNotifiable Diseases SurveillanceSystem, Australia, 2001, by diseasecategory
Figure 4. Selected diseases from the NationalNotifiable Diseases Surveillance System,comparison of total notifications for2001 with previous five year means
Annual report of the National Notifiable Diseases Surveillance System
16 CDI Vol 27, No 1 2003
Table 2. Notifications of communicable diseases, Australia, 2001, by state or territory*
State or territory
Disease ACT NSW NT Qld SA Tas Vic WA Aust
Bloodborne diseases
Hepatitis B (incident) 2 88 3 48 23 22 199 39 424
Hepatitis B (unspecified)†‡ 54 4,710 NN 773 310 28 1,899 650 8,424
Hepatitis C (incident) 18 251 - - 80 7 86 158 600
Hepatitis C (unspecified)†‡§ 213 8,439 213 3,156 884 381 4,972 1,328 19,586
Hepatitis D 0 12 0 2 0 0 7 0 21
Hepatitis (NEC) 0 0 0 0 2 0 0 0 2
Gastrointestinal diseases
Botulism 0 0 0 1 0 0 1 0 2
Campylobacteriosis|| 425 - 277 3,969 2,661 677 5,486 2,629 16,124
Cryptosporidiosis 10 192 248 418 66 79 436 166 1,615
Haemolytic uraemic syndrome 0 2 0 0 1 0 0 0 3
Hepatitis A 14 195 38 120 20 4 102 37 530
Hepatitis E 0 6 0 1 0 0 3 0 10
Listeriosis 1 12 0 20 6 2 10 11 62
Salmonellosis 76 1,647 373 2,201 610 163 1,085 890 7,045
Shigellosis 6 132 103 108 34 6 94 79 562
SLTEC,VTEC¶ 0 1 0 14 27 0 4 3 49
Typhoid 2 32 2 10 3 1 17 17 84
Quarantinable diseases
Cholera 0 1 0 1 1 0 1 0 4
Plague 0 0 0 0 0 0 0 0 0
Rabies 0 0 0 0 0 0 0 0 0
Viral haemorrhagic fever 0 0 0 0 0 0 0 0 0
Yellow fever 0 0 0 0 0 0 0 0 0
Sexually transmissible diseases
Chlamydial infection 301 4,451 1,239 5,596 1,402 380 3,924 2,733 20,026
Donovanosis 0 0 13 19 NN 0 0 10 42
Gonococcal infection** 20 1,341 1,424 1,102 208 21 696 1,346 6,158
Syphilis†† 11 502 427 225 20 16 15 205 1,421
Vaccine preventable diseases
Diphtheria 0 0 1 0 0 0 0 0 1
Haemophilus influenzae type b 0 9 3 6 3 0 4 1 26
Laboratory-confirmed Influenza 14 243 92 392 135 0 177 233 1,286
Measles 0 30 0 11 2 2 83 13 141
Mumps 1 28 1 3 12 2 38 29 114
Pertussis 86 4,435 145 1,634 2,010 106 872 227 9,515
Invasive pneumococcal disease 18 434 97 425 114 61 327 205 1,681
Poliomyelitis 0 0 0 0 0 0 0 0 0
Rubella‡‡ 1 58 0 134 5 2 60 3 263
Tetanus 0 0 0 0 1 1 1 0 3
Vectorborne diseases
Arbovirus infection (NEC) 1 15 0 3 0 1 16 0 36
Barmah Forest virus infection 2 398 37 603 6 1 19 75 1,141
Dengue 11 50 43 43 7 1 6 15 176
Japanese encephalitis 0 0 0 0 0 0 0 0 0
Kunjin virus infection - 1 2 0 0 0 0 1 4
Malaria 17 153 61 300 35 8 88 50 712
Murray Valley encephalitis 0 0 3 1 1 0 0 1 6
Ross River virus infection 9 717 223 1,569 141 13 345 202 3,219
Annual report of the National Notifiable Diseases Surveillance System
CDI Vol 27, No 1 2003 17
State or territory
Disease ACT NSW NT Qld SA Tas Vic WA Aust
Zoonoses
Anthrax 0 0 0 0 NN 0 0 0 0
Australian bat lyssavirus 0 0 0 0 0 0 0 0 0
Brucellosis 0 0 0 17 1 0 1 0 19
Leptospirosis 0 65 4 129 3 5 37 2 245
Ornithosis 1 37 1 0 15 0 68 9 131
Lyssavirus (unspecified) 0 0 0 0 0 0 0 0 0
Q fever 2 139 0 454 16 1 65 19 696
Other bacterial infections
Legionellosis 2 67 3 37 32 3 121 42 307
Leprosy 0 3 0 0 0 0 0 2 5
Invasive meningococcal infection 6 230 13 127 39 23 163 76 677
Tuberculosis 9 415 35 100 51 12 299 68 989
Total 1,333 29,541 5,124 23,772 8,987 2,029 21,827 11,574 104,187
* Analysis by date of onset, except for hepatitis B and hepatitis C unspecified, where analysis is by report date. Date of onset is acomposite of three components: (i) the true onset date from a clinician, if available, (ii) the date the laboratory test was ordered, or(iii) the date reported to NNDSS.
† Unspecified hepatitis includes cases with hepatitis in whom the duration of illness cannot be determined.
‡ The analysis was performed by report date.
§ Includes incident hepatitis C in the Northern Territory and Queensland.
|| Notified as ‘foodborne disease’ or ‘gastroenteritis in an institution’ in New South Wales.
¶ Infections with Shiga-like toxin (verotoxin) producing E. coli. (SLTEC/VTEC).
** Northern Territory, Queensland, South Australia, Victoria and Western Australia: includes gonococcal neonatal ophthalmia.
†† Includes congenital syphilis.
‡‡ Includes congenital rubella.
NN Not notifiable.
NEC Not elsewhere classified.
- Elsewhere classified.
Table 2 (continued). Notifications of communicable diseases, Australia, 2001, by state or territory*

Annual report of the National Notifiable Diseases Surveillance System
18 CDI Vol 27, No 1 2003
Table 3. Notification rates of communicable diseases, Australia, 2001, by state or territory (rate per100,000 population)*
State or territory
Disease ACT NSW NT Qld SA Tas Vic WA Aust
Bloodborne diseases
Hepatitis B (incident) 0.6 1.3 1.5 1.3 1.5 4.7 4.1 2.0 2.2
Hepatitis B (unspecified)†‡ 16.7 71.3 NN 21.3 20.5 5.9 39.4 34.1 43.7
Hepatitis C (incident) 5.6 3.8 - - 5.3 1.5 1.8 8.3 3.8
Hepatitis C (unspecified)†‡§ 65.7 127.7 106.5 86.8 58.4 80.6 103.1 69.7 100.5
Hepatitis D 0.0 0.2 0.0 0.1 0.0 0.0 0.1 0.0 0.1
Hepatitis (NEC) 0.0 0.0 0.0 0.0 0.1 0.0 0.0 0.0 0.0
Gastrointestinal diseases
Botulism 0.0 0.0 0.0 0.0 0.0 0.0 0.0 0.0 0.0
Campylobacteriosis|| 131.1 - 138.5 109.2 175.7 143.1 113.8 137.9 125.2
Cryptosporidiosis 3.1 2.9 124.0 11.5 4.4 16.7 9.0 8.7 8.3
Haemolytic uraemic syndrome 0.0 0.0 0.0 0.0 0.1 0.0 0.0 0.0 0.0
Hepatitis A 4.3 3.0 19.0 3.3 1.3 0.8 2.1 1.9 2.7
Hepatitis E 0.0 0.1 0.0 0.0 0.0 0.0 0.1 0.0 0.1
Listeriosis 0.3 0.2 0.0 0.6 0.4 0.4 0.2 0.6 0.3
Salmonellosis 23.4 24.9 186.5 60.5 40.3 34.5 22.5 46.7 36.2
Shigellosis 1.9 2.0 51.5 3.0 2.2 1.3 1.9 4.1 2.9
SLTEC,VTEC¶ 0.0 0.0 0.0 0.4 1.8 0.0 0.1 0.2 0.3
Typhoid 0.6 0.5 1.0 0.3 0.2 0.2 0.4 0.9 0.4
Quarantinable diseases
Cholera 0.0 0.0 0.0 0.0 0.1 0.0 0.0 0.0 0.0
Plague 0.0 0.0 0.0 0.0 0.0 0.0 0.0 0.0 0.0
Rabies 0.0 0.0 0.0 0.0 0.0 0.0 0.0 0.0 0.0
Viral haemorrhagic fever 0.0 0.0 0.0 0.0 0.0 0.0 0.0 0.0 0.0
Yellow fever 0.0 0.0 0.0 0.0 0.0 0.0 0.0 0.0 0.0
Sexually transmissible diseases
Chlamydial infection 92.8 67.3 619.4 153.9 92.6 80.3 81.4 143.4 102.8
Donovanosis 0.0 0.0 6.5 0.5 NN 0.0 0.0 0.5 0.2
Gonococcal infection** 6.2 20.3 711.9 30.3 13.7 4.4 14.4 70.6 31.6
Syphilis†† 3.4 7.6 213.5 6.2 1.3 3.4 0.3 10.8 7.3
Vaccine preventable diseases
Diphtheria 0.0 0.0 0.5 0.0 0.0 0.0 0.0 0.0 0.0
Haemophilus influenzae type b 0.0 0.1 1.5 0.2 0.2 0.0 0.1 0.1 0.1
Laboratory-confirmed influenza 4.3 3.7 46.0 10.8 8.9 0.0 3.7 12.2 6.6
Measles 0.0 0.5 0.0 0.3 0.1 0.4 1.7 0.7 0.7
Mumps 0.3 0.4 0.5 0.1 0.8 0.4 0.8 1.5 0.6
Pertussis 26.5 67.1 72.5 45.0 132.7 22.4 18.1 11.9 48.8
Invasive pneumococcal disease 5.6 6.6 48.5 11.7 7.5 12.9 6.8 10.8 8.6
Poliomyelitis 0.0 0.0 0.0 0.0 0.0 0.0 0.0 0.0 0.0
Rubella‡‡ 0.3 0.9 0.0 3.7 0.3 0.4 1.2 0.2 1.3
Tetanus 0.0 0.0 0.0 0.0 0.1 0.2 0.0 0.0 0.0
Vectorborne diseases
Arbovirus infection (NEC) 0.3 0.2 0.0 0.1 0.0 0.2 0.3 0.0 0.2
Barmah Forest virus infection 0.6 6.0 18.5 16.6 0.4 0.2 0.4 3.9 5.9
Dengue 3.4 0.8 21.5 1.2 0.5 0.2 0.1 0.8 0.9
Japanese encephalitis 0.0 0.0 0.0 0.0 0.0 0.0 0.0 0.0 0.0
Kunjin virus infection - 0.0 1.0 0.0 0.0 0.0 0.0 0.1 0.0
Malaria 5.2 2.3 30.5 8.3 2.3 1.7 1.8 2.6 3.7
Murray Valley encephalitis 0.0 0.0 1.5 0.0 0.1 0.0 0.0 0.1 0.0
Ross River virus infection 2.8 10.8 111.5 43.2 9.3 2.7 7.2 10.6 16.5
Annual report of the National Notifiable Diseases Surveillance System
CDI Vol 27, No 1 2003 19
State or territory
Disease ACT NSW NT Qld SA Tas Vic WA Aust
Zoonoses
Anthrax 0.0 0.0 0.0 0.0 NN 0.0 0.0 0.0 0.0
Australian bat lyssavirus 0.0 0.0 0.0 0.0 0.0 0.0 0.0 0.0 0.0
Brucellosis 0.0 0.0 0.0 0.5 0.1 0.0 0.0 0.0 0.1
Leptospirosis 0.0 1.0 2.0 3.5 0.2 1.1 0.8 0.1 1.3
Ornithosis 0.3 0.6 0.5 0.0 1.0 0.0 1.4 0.5 0.7
Lyssavirus (unspecified) 0.0 0.0 0.0 0.0 0.0 0.0 0.0 0.0 0.0
Q fever 0.6 2.1 0.0 12.5 1.1 0.2 1.3 1.0 3.6
Other bacterial infections
Legionellosis 0.6 1.0 1.5 1.0 2.1 0.6 2.5 2.2 1.6
Leprosy 0.0 0.0 0.0 0.0 0.0 0.0 0.0 0.1 0.0
Invasive meningococcal infection 1.9 3.5 6.5 3.5 2.6 4.9 3.4 4.0 3.5
Tuberculosis 2.8 6.3 17.5 2.8 3.4 2.5 6.2 3.6 5.1
* Analysis by date of onset, except for hepatitis B and hepatitis C unspecified, where analysis is by report date. Date of onset is acomposite of three components: (i) the true onset date from a clinician, if available, (ii) the date the laboratory test was ordered, or(iii) the date reported to NNDSS.
† Unspecified hepatitis includes cases with hepatitis in whom the duration of illness cannot be determined.
‡ The analysis was performed by report date.
§ Includes incident hepatitis C in the Northern Territory and Queensland.
|| Notified as ‘foodborne disease’ or ‘gastroenteritis in an institution’ in New South Wales.
¶ Infections with Shiga-like toxin (verotoxin) producing E. coli. (SLTEC/VTEC).
** Northern Territory, Queensland, South Australia, Victoria and Western Australia: includes gonococcal neonatal ophthalmia.
†† Includes congenital syphilis.
‡‡ Includes congenital rubella.
NN Not notifiable.
NEC Not elsewhere classified.
- Elsewhere classified.
Table 3 (continued). Notification rates of communicable diseases, Australia, 2001, by state orterritory (rate per 100,000 population)*
Annual report of the National Notifiable Diseases Surveillance System
20 CDI Vol 27, No 1 2003
Table 4a. Notifications and notification rates of communicable diseases, Australia, 1997 to 2001, bystate or territory (rate per 100,000 population)*
Disease Notifications Rate per 100,000 population
1997 1998 1999 2000 2001 1997 1998 1999 2000 2001
Bloodborne diseases
Hepatitis B (incident) 269 265 303 395 424 1.5 1.4 1.6 2.1 2.2
Hepatitis B (unspecified)†‡ 6,542 6,562 7,164 7,908 8,424 35.7 35.4 38.2 41.7 43.7
Hepatitis C (incident) 154 350 396 441 600 1.0 2.3 2.6 2.9 3.8
Hepatitis C (unspecified)†‡§ 17,290 18,07
5
18,65
5
19,56
9
19,586 93.4 96.5 98.4 102.2 100.5
Hepatitis D - - 19 27 21 - - 0.1 0.2 0.1
Hepatitis (NEC) 6 4 0 1 2 <0.1 <0.1 0.0 <0.1 <0.1
Gastrointestinal diseases
Botulism 0 1 0 2 2 0.0 <0.1 0.0 <0.1 <0.1
Campylobacteriosis|| 11,752 13,43
3
12,65
7
13,59
5
16,124 95.9 108.4 100.8 107.1 125.2
Cryptosporidiosis - - - - 1,615 - - - - 8.3
Haemolytic uraemic syndrome - - 23 15 3 - - 0.1 0.1 <0.1
Hepatitis A 3,044 2,697 1,554 812 530 16.4 13.3 8.2 4.2 2.7
Hepatitis E - - 9 10 10 - - 0.1 0.1 0.1
Listeriosis 73 55 64 67 62 0.4 0.3 0.3 0.3 0.3
Salmonellosis 7,054 7,613 7,147 6,151 7,045 38.1 40.7 37.7 32.1 36.2
Shigellosis 795 599 547 487 562 6.5 4.8 4.4 3.8 2.9
SLTEC,VTEC¶ - - 47 33 49 - - 0.3 0.2 0.3
Typhoid 79 60 68 58 84 0.4 0.3 0.4 0.3 0.4
Quarantinable diseases
Cholera 2 4 3 1 4 <0.1 <0.1 <0.1 <0.1 <0.1
Plague 0 0 0 0 0 0.0 0.0 0.0 0.0 0.0
Rabies 0 0 0 0 0 0.0 0.0 0.0 0.0 0.0
Viral haemorrhagic fever 0 0 0 0 0 0.0 0.0 0.0 0.0 0.0
Yellow fever 0 0 0 0 0 0.0 0.0 0.0 0.0 0.0Sexually transmissiblediseases
Chlamydial infection 9,239 10,92
7
14,04
5
16,86
6
20,026 75.4 88.2 74.1 88.0 102.8
Donovanosis 49 31 17 12 42 0.5 0.3 0.2 0.1 0.2
Gonococcal infection** 4,684 5,469 5,644 5,686 6,158 25.3 29.2 29.8 29.7 31.6
Syphilis†† 1,296 1,683 1,844 1,755 1,421 7.0 9.0 9.7 9.2 7.3Vaccine preventablediseases
Diphtheria 0 0 0 0 1 0.0 0.0 0.0 0.0 <0.1
Haemophilus influenzae type b 51 35 40 28 26 0.3 0.2 0.2 0.1 0.1
Laboratory-confirmed
influenza
- - - - 1,286 - - - - 6.6
Measles 838 288 238 107 141 4.5 1.5 1.3 0.6 0.7
Mumps 191 182 172 212 114 1.0 1.0 1.1 1.4 0.6
Pertussis 10,825 5,791 4,417 5,942 9,515 58.4 30.9 23.3 31.0 48.8
Invasive pneumococcal
disease
- - - - 1,681 - - - - 8.6
Poliomyelitis 0 0 0 0 0 0.0 0.0 0.0 0.0 0.0
CDI Vol 27, No 1 2003 21
Annual report of the National Notifiable Diseases Surveillance System
Disease Notifications Rate per 100,000 population
1997 1998 1999 2000 2001 1997 1998 1999 2000 2001
Rubella‡‡ 1,387 753 377 322 263 7.5 4.0 2.0 1.7 1.3
Tetanus 7 8 2 6 3 <0.1 <0.1 <0.1 <0.1 <0.1
Vectorborne diseases
Arbovirus infection (NEC) 19 88 62 69 36 0.1 0.5 0.3 0.4 0.2
Barmah Forest virus infection 691 529 638 634 1,141 3.7 2.8 3.4 3.3 5.9
Dengue 174 579 132 215 176 0.9 3.1 0.7 1.1 0.9
Japanese encephalitis - - - - 0 - - - - 0.0
Kunjin virus infection - - - - 4 - - - - <0.1
Malaria 749 660 732 951 712 4.0 3.5 3.9 5.0 3.7
Murray Valley encephalitis - - - - 6 - - - - <0.1
Ross River virus infection 6,596 3,151 4,416 4,200 3,219 35.6 16.8 23.3 21.9 16.5
Zoonoses
Anthrax - - - - 0 - - - - 0.0
Australian bat lyssavirus - - - - 0 - - - - 0.0
Brucellosis 39 45 52 27 19 0.2 0.2 0.3 0.1 0.1
Leptospirosis 114 202 323 243 245 0.6 1.1 1.7 1.3 1.3
Ornithosis 35 64 84 100 131 0.4 0.7 0.9 1.1 0.7
Lyssavirus (unspecified) - - - - 0 - - - - 0.0
Q fever 545 560 515 573 696 2.9 3.0 2.7 3.0 3.6
Other bacterial infections
Legionellosis 157 262 249 472 307 0.8 1.4 1.3 2.5 1.6
Leprosy 12 3 6 4 5 0.1 <0.1 <0.1 <0.1 <0.1
Invasive meningococcal
infection
494 480 591 621 677 2.7 2.6 3.1 3.2 3.5
Tuberculosis 989 960 1,143 1,024 989 5.3 5.1 6.0 5.3 5.1
Total
86,241 82,46
8
84,39
5
89,64
1
104,187
* Analysis by date of onset, except for hepatitis B and hepatitis C unspecified, where analysis is by report date. Date of onset is acomposite of three components: (i) the true onset date from a clinician, if available, (ii) the date the laboratory test was ordered, or(iii) the date reported to NNDSS.
† Unspecified hepatitis includes cases with hepatitis in whom the duration of illness cannot be determined.
‡ The analysis was performed by report date.
§ Includes incident hepatitis C in the Northern Territory and Queensland.
|| Notified as ‘foodborne disease’ or ‘gastroenteritis in an institution’ in New South Wales.
¶ Infections with Shiga-like toxin (verotoxin) producing E. coli. (SLTEC/VTEC).
** Northern Territory, Queensland, South Australia, Victoria and Western Australia: includes gonococcal neonatal ophthalmia.
†† Includes congenital syphilis.
‡‡ Includes congenital rubella.
NEC Not elsewhere classified.
- Elsewhere classified.
Table 4a (continued). Notifications and notification rates of communicable diseases, Australia, 1997to 2001, by state or territory (rate per 100,000 population)
22 CDI Vol 27, No 1 2003
Annual report of the National Notifiable Diseases Surveillance System
Ta
ble
4b
.Y
ears
fro
mw
hic
hd
isea
ses
bec
am
en
oti
fia
ble
toN
ND
SS
ind
iffe
ren
tju
risd
icti
on
sin
Au
stra
lia
*
Dis
ease
Year
inw
hic
hdata
firs
tsent
toC
om
monw
ealth
Period
of
natio
nal
report
ing
Exceptions
tonationalre
port
ing
AC
TN
SW
NT
Qld
SA
Tas
Vic
WA
Blo
od
bo
rne
dis
eases
He
pa
titis
B(in
cid
en
t)1
99
51
99
31
99
31
99
11
99
31
99
31
99
31
99
61
99
5to
pre
se
nt
AC
Td
idn
ot
rep
ort
19
94
;W
Ad
idn
ot
rep
ort
19
94
-19
95
He
pa
titis
B(u
nsp
ecifie
d)
19
91
19
91
NN
19
91
19
91
19
91
19
91
19
91
19
91
top
rese
nt
NT
do
es
no
tre
po
rt
He
pa
titis
C(in
cid
en
t)1
99
51
99
3-
-1
99
31
99
51
99
71
99
71
99
3to
pre
se
nt
All
juri
sd
ictio
ns
exce
pt
Qld
an
dN
T
He
pa
titis
C(u
nsp
ecifie
d)
19
91
19
91
19
91
19
91
19
94
19
91
19
91
19
93
19
95
top
rese
nt
Inclu
de
sre
po
rts
of
incid
en
th
ep
atitis
C,
19
91
to1
99
4
He
pa
titis
D1
99
91
99
91
99
91
99
91
99
91
99
91
99
92
00
11
99
9to
pre
se
nt
WA
did
no
tre
po
rt1
99
1-2
00
0
He
pa
titis
(NE
C)
19
91
19
91
19
91
19
91
19
91
19
91
19
91
20
01
19
91
top
rese
nt
WA
did
no
tre
po
rt1
99
1-2
00
0
Gastr
oin
testi
nal
dis
eases
Bo
tulis
m1
99
21
99
81
99
81
99
81
99
31
99
21
99
22
00
11
99
2to
pre
se
nt
Sta
tere
po
rtin
gsta
rte
da
ssh
ow
n
Ca
mp
ylo
ba
cte
rio
sis
19
91
NN
19
91
19
91
19
91
19
91
19
91
19
91
19
91
top
rese
nt
NS
Wd
oe
sn
ot
rep
ort
Cry
pto
sp
ori
dio
sis
20
01
20
01
20
01
20
01
20
01
20
01
20
01
20
01
20
01
top
rese
nt
Ha
em
oly
tic
ura
em
icsyn
dro
me
19
99
19
99
19
99
19
99
19
99
19
99
19
99
19
99
19
99
top
rese
nt
He
pa
titis
A1
99
11
99
11
99
11
99
11
99
11
99
11
99
11
99
11
99
1to
pre
se
nt
He
pa
titis
E1
99
91
99
91
99
91
99
91
99
91
99
91
99
92
00
11
99
9to
pre
se
nt
WA
did
no
tre
po
rt1
99
1-2
00
0
Lis
teri
osis
19
91
19
91
19
94
19
91
19
92
19
91
19
91
19
91
19
91
top
rese
nt
SA
did
no
tre
po
rt1
99
1
NT
did
no
tre
po
rt1
99
1-1
99
3
Sa
lmo
ne
llosis
(NE
C)
19
91
19
91
19
91
19
91
19
91
19
91
19
91
19
91
19
91
top
rese
nt
Sh
ige
llosis
19
91
20
01
19
91
19
91
19
91
19
91
19
91
19
91
19
91
top
rese
nt
NS
Wd
idn
ot
rep
ort
19
91
-20
00
SL
TE
C,
VT
EC
19
99
19
99
19
99
20
01
19
99
19
99
19
99
20
01
19
99
top
rese
nt
Qld
an
dW
Ad
idn
ot
rep
ort
19
91
-20
00
Typ
ho
id1
19
91
19
91
19
91
19
91
19
91
19
91
19
91
19
91
19
91
top
rese
nt
Qu
ara
nti
nab
led
iseases
Ch
ole
ra1
99
11
99
11
99
11
99
11
99
11
99
11
99
11
99
11
99
1to
pre
se
nt
Pla
gu
e1
99
11
99
11
99
11
99
11
99
11
99
11
99
11
99
11
99
1to
pre
se
nt
Ra
bie
s1
99
31
99
71
99
11
99
11
99
11
99
11
99
11
99
11
99
1to
pre
se
nt
Vira
lh
ae
mo
rrh
ag
icfe
ve
r1
99
31
99
11
99
11
99
11
99
11
99
11
99
11
99
11
99
1to
pre
se
nt
Ye
llow
feve
r1
99
11
99
11
99
11
99
11
99
11
99
11
99
11
99
11
99
1to
pre
se
nt

CDI Vol 27, No 1 2003 23
Annual report of the National Notifiable Diseases Surveillance System
Dis
ease
Year
inw
hic
hdata
firs
tsent
toC
om
monw
ealth
Period
of
natio
nal
report
ing
Exceptions
tonationalre
port
ing
AC
TN
SW
NT
Qld
SA
Tas
Vic
WA
Sexu
ally
tran
sm
issib
led
iseases
Ch
lam
ydia
lin
fectio
n1
99
31
99
11
99
11
99
11
99
31
99
11
99
11
99
41
99
4to
pre
se
nt
NS
Wd
idn
ot
rep
ort
19
94
-1
99
8
Do
no
va
no
sis
19
91
20
02
19
91
19
91
20
02
19
93
19
91
19
91
19
91
top
rese
nt
NS
Wa
nd
SA
did
no
tre
po
rt1
99
1-2
00
1
Ta
sm
an
iad
idn
ot
rep
ort
19
91
-19
92
Go
no
co
cca
lin
fectio
n2
19
91
19
93
19
91
19
91
19
91
19
91
19
91
19
91
19
91
top
rese
nt
Syp
hili
s(i
nclu
de
sco
ng
en
ita
l
syp
hili
s)
19
91
19
91
19
91
19
91
19
91
19
91
19
91
19
91
19
91
top
rese
nt
Vaccin
ep
reven
tab
led
iseases
Dip
hth
eria
19
91
19
91
19
91
19
91
19
91
19
91
19
91
19
91
19
91
top
rese
nt
Ha
em
op
hilu
sin
flu
en
zae
typ
eb
19
91
19
91
19
91
19
91
19
91
19
91
19
91
19
94
19
91
top
rese
nt
WA
did
no
tre
po
rt1
99
1-1
99
3
La
bo
rato
ry-c
on
firm
ed
influ
en
za
20
01
20
01
20
01
20
01
20
01
20
01
20
01
20
01
20
01
top
rese
nt
Me
asle
s1
99
11
99
11
99
11
99
11
99
11
99
11
99
11
99
11
99
1to
pre
se
nt
Mu
mp
s1
99
21
99
21
99
51
99
71
99
41
99
51
99
21
99
41
99
5to
pre
se
nt
Qld
did
no
tre
po
rt(1
99
5-1
99
6&
19
99
-20
00
)
Pe
rtu
ssis
19
91
19
91
19
91
19
91
19
91
19
91
19
91
19
91
19
91
top
rese
nt
Inva
siv
ep
ne
um
oco
cca
ld
ise
ase
20
01
20
01
20
01
20
01
20
01
20
01
20
01
20
01
20
01
top
rese
nt
Po
liom
yelit
is1
99
11
99
11
99
11
99
11
99
11
99
11
99
11
99
11
99
1to
pre
se
nt
Ru
be
lla(i
nclu
de
sco
ng
en
ita
lru
be
lla)
19
91
19
91
19
93
19
91
19
93
19
95
19
92
19
94
19
93
top
rese
nt
Ta
sm
an
iad
idn
ot
rep
ort
19
93
-19
94
Te
tan
us
19
91
19
91
19
91
19
94
19
91
19
91
19
91
19
91
19
91
top
rese
nt
Qld
did
no
tre
po
rt1
99
1-1
99
3
Vecto
rbo
rne
dis
eases
Arb
oviru
sin
fectio
n(N
EC
)31
99
11
99
11
99
11
99
11
99
11
99
11
99
11
99
11
99
1to
pre
se
nt
Inclu
de
sJE
,M
VE
an
dK
un
jin1
99
1-2
00
0
Ba
rma
hF
ore
st
vir
us
infe
ctio
n1
99
51
99
51
99
71
99
51
99
51
99
51
99
51
99
61
99
5to
pre
se
nt
De
ng
ue
19
93
19
91
19
91
19
91
19
91
19
91
19
91
19
91
19
91
top
rese
nt
AC
Td
idn
ot
rep
ort
19
91
-19
92
Ja
pa
ne
se
en
ce
ph
alit
is2
00
12
00
12
00
12
00
12
00
12
00
12
00
12
00
12
00
1to
pre
se
nt
Ku
njin
vir
us
infe
ctio
n2
00
12
00
12
00
12
00
12
00
12
00
12
00
12
00
12
00
1to
pre
se
nt
Re
po
rte
du
nd
er
MV
Ein
AC
T
Ma
laria
19
91
19
91
19
91
19
91
19
91
19
91
19
91
19
91
19
91
top
rese
nt
Mu
rra
yV
alle
ye
nce
ph
alit
is2
00
12
00
12
00
12
00
12
00
12
00
12
00
12
00
12
00
1to
pre
se
nt
Co
mb
ine
dw
ith
Ku
njin
inA
CT
Ro
ss
Riv
er
vir
us
infe
ctio
n1
99
31
99
31
99
11
99
11
99
31
99
31
99
11
99
31
99
3to
pre
se
nt
Ta
ble
4b
(co
nti
nu
ed).
Yea
rsfr
om
wh
ich
dis
ease
sb
eca
me
no
tifi
ab
leto
NN
DS
Sin
dif
fere
nt
juri
sdic
tio
ns
inA
ust
rali
a*
24 CDI Vol 27, No 1 2003
Annual report of the National Notifiable Diseases Surveillance System
Dis
ease
Year
inw
hic
hdata
firs
tsent
toC
om
monw
ealth
Period
of
natio
nal
report
ing
Exceptions
tonationalre
port
ing
AC
TN
SW
NT
Qld
SA
Tas
Vic
WA
Zo
on
oses
An
thra
x2
00
12
00
12
00
12
00
12
00
22
00
12
00
12
00
12
00
1to
pre
se
nt
Au
str
alia
nb
at
lyssa
vir
us
20
01
20
01
20
01
20
01
20
01
20
01
20
01
20
01
20
01
top
rese
nt
Bru
ce
llosis
19
91
19
91
19
91
19
91
19
91
19
91
19
91
19
91
19
91
top
rese
nt
Le
pto
sp
iro
sis
19
91
19
91
19
91
19
91
19
91
19
91
19
91
19
91
19
91
top
rese
nt
Orn
ith
osis
19
91
20
01
19
91
19
92
19
91
19
91
19
91
19
91
19
91
top
rese
nt
NS
Wd
idn
ot
rep
ort
19
91
-20
00
Qld
did
no
tre
po
rt1
99
7-2
00
1
Lys
sa
vir
use
s(u
nsp
ecifie
d)
20
01
20
01
20
01
20
01
20
01
20
01
20
01
20
01
20
01
top
rese
nt
Qfe
ve
r1
99
11
99
11
99
11
99
11
99
11
99
11
99
11
99
11
99
1to
pre
se
nt
Oth
er
bacte
rial
infe
cti
on
s
Le
gio
ne
llosis
19
91
19
91
19
91
19
91
19
91
19
91
19
91
19
91
19
91
top
rese
nt
Le
pro
sy
19
91
19
91
19
91
19
91
19
91
19
91
19
91
19
91
19
91
top
rese
nt
Inva
siv
em
en
ing
oco
cca
lin
fectio
n1
99
11
99
11
99
11
99
11
99
11
99
11
99
11
99
11
99
1to
pre
se
nt
Tu
be
rcu
losis
19
91
19
91
19
91
19
91
19
91
19
91
19
91
19
91
19
91
top
rese
nt
*D
ata
fro
mN
ND
SS
an
nu
alre
po
rts
fro
m1
99
1.
First
full
yea
ro
fre
po
rtin
gto
Co
mm
on
we
alth
issh
ow
n.
So
me
dis
ea
se
sm
ay
ha
ve
be
en
no
tifia
ble
toS
tate
or
Te
rrito
ryH
ea
lth
De
pa
rtm
en
tsb
efo
reth
ed
ate
ssh
ow
nh
ere
.
1.
Inclu
de
sp
ara
typ
ho
idin
Ne
wS
ou
thW
ale
s,
Qu
ee
nsla
nd
an
dV
icto
ria
.
2.
Inclu
de
sn
eo
na
talo
ph
tha
lmia
inth
eN
ort
he
rnT
err
ito
ry,
Qu
ee
nsla
nd
,S
ou
thA
ustr
alia
,a
nd
Vic
tori
a.
3.
Be
fore
19
97
,in
clu
de
sR
oss
Riv
er
vir
us,
de
ng
ue
an
dB
arm
ah
Fo
rest
vir
us
infe
ctio
n.
NN
No
tn
otifia
ble
in2
00
1
Ta
ble
4b
(co
nti
nu
ed).
Yea
rsfr
om
wh
ich
dis
ease
sb
eca
me
no
tifi
ab
leto
NN
DS
Sin
dif
fere
nt
juri
sdic
tio
ns
inA
ust
rali
a*

Bloodborne diseases
In 2001, bloodborne viruses reported to the NNDSSincluded hepatitis B, C, D and hepatitis (NEC). Diagnosesof infections with human immuno-deficiency virus(HIV) and acquired immune deficiency syndrome(AIDS) are reported directly to the National Centre inHIV Epidemiology and Clinical Research (NCHECR).Information on national HIV/AIDS surveillance canbe obtained through the NCHECR website at:http//www.med.unsw.edu.au/ nchecr.
When reported to NNDSS, newly acquired hepatitis Cand hepatitis B virus infections (referred to as ‘incident’)were differentiated from those where the timing ofdisease acquisition was unknown (referred to as‘unspecified’). As considerable time may have elapsedbetween onset and report date for chronic hepatitisinfections, the analysis of unspecified hepatitis B andunspecified hepatitis C infections in the followingsections is by report date, rather than by onset date.
Hepatitis B
Incident hepatitis B notifications
Since 1994, all states and territories, except theAustralian Capital Territory, have reported incidentcases of hepatitis B to the NNDSS. The AustralianCapital Territory began reporting hepatitis B in 1995.The rate of incident hepatitis B notification between1995 and 2000 ranges from around 1 to 2 cases per100,000 population (Figure 5). In total, 424 incidentcases were reported to the NNDSS with an onsetdate in 2001, giving a national notification rate of2.2 cases per 100,000 population for the year. In 2001,the highest rates were reported from Tasmania(4.7 cases per 100,000 population) and Victoria(4.1 cases per 100,000 population).
The highest rate of incident hepatitis B notificationswere in the 20–24 year age group for both males andfemales (Figure 6). The highest notification rate formen was 9.8 cases per 100,000 population, while thehighest notification rate for women was 5.8 cases per100,000 population. Overall, there were moreinfections in males than in females, with a male tofemale ratio of 1.7:1.
Trends in the age distribution of incident hepatitis Bvirus infections are shown in Figure 7. Rates inchildren aged 0–14 years and adults over 40 years ofage have remained relatively stable, while increaseshave been observed in the 20–39 year age range.
Risk factor information for incident hepatitis B virusinfection was available from all states and territories,except New South Wales and Queensland. The dataare summarised in Table 5.
CDI Vol 27, No 1 2003 25
Annual report of the National Notifiable Diseases Surveillance System
Figure 5. Trends in notification rates, incidentand unspecified* hepatitis B virusinfection, Australia, 1995 to 2001
* By report date.
Figure 6. Notification rates for incidenthepatitis B virus infections,Australia, 2001, by age group andsex
Figure 7. Trends in notification rates ofincident hepatitis B virus infections,Australia, 1995 to 2001, by age group
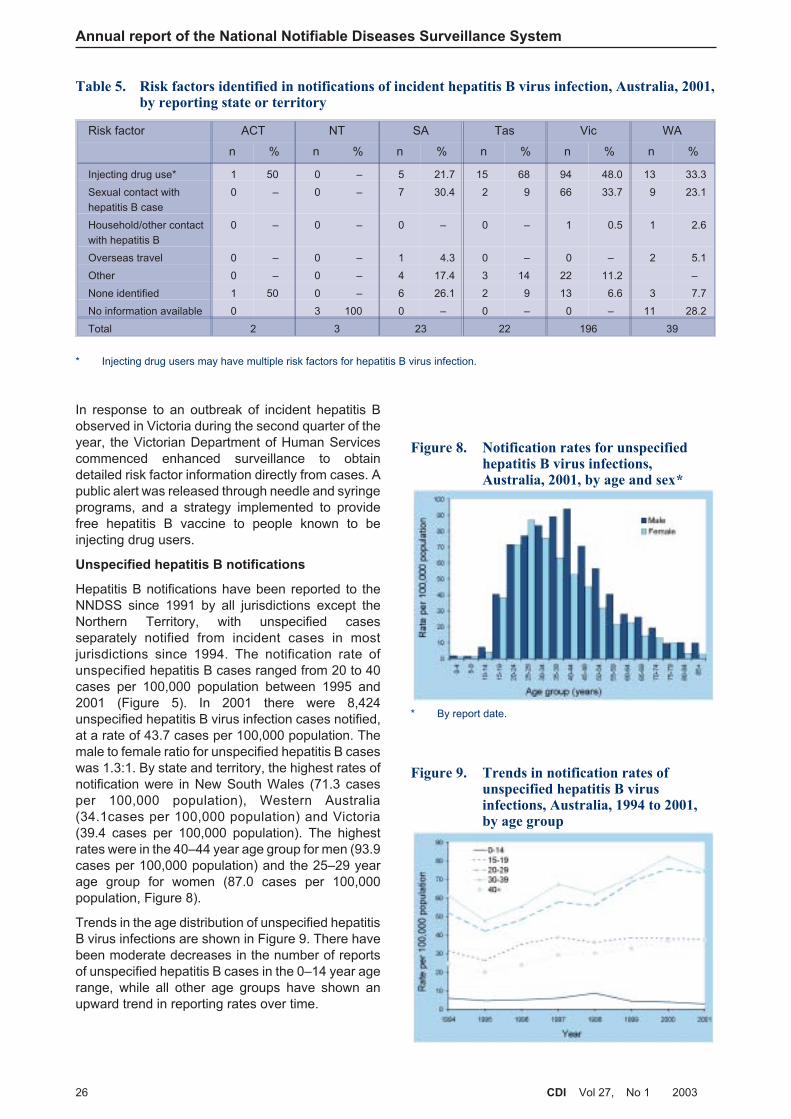
In response to an outbreak of incident hepatitis Bobserved in Victoria during the second quarter of theyear, the Victorian Department of Human Servicescommenced enhanced surveillance to obtaindetailed risk factor information directly from cases. Apublic alert was released through needle and syringeprograms, and a strategy implemented to providefree hepatitis B vaccine to people known to beinjecting drug users.
Unspecified hepatitis B notifications
Hepatitis B notifications have been reported to theNNDSS since 1991 by all jurisdictions except theNorthern Territory, with unspecified casesseparately notified from incident cases in mostjurisdictions since 1994. The notification rate ofunspecified hepatitis B cases ranged from 20 to 40cases per 100,000 population between 1995 and2001 (Figure 5). In 2001 there were 8,424unspecified hepatitis B virus infection cases notified,at a rate of 43.7 cases per 100,000 population. Themale to female ratio for unspecified hepatitis B caseswas 1.3:1. By state and territory, the highest rates ofnotification were in New South Wales (71.3 casesper 100,000 population), Western Australia(34.1cases per 100,000 population) and Victoria(39.4 cases per 100,000 population). The highestrates were in the 40–44 year age group for men (93.9cases per 100,000 population) and the 25–29 yearage group for women (87.0 cases per 100,000population, Figure 8).
Trends in the age distribution of unspecified hepatitisB virus infections are shown in Figure 9. There havebeen moderate decreases in the number of reportsof unspecified hepatitis B cases in the 0–14 year agerange, while all other age groups have shown anupward trend in reporting rates over time.
26 CDI Vol 27, No 1 2003
Annual report of the National Notifiable Diseases Surveillance System
Table 5. Risk factors identified in notifications of incident hepatitis B virus infection, Australia, 2001,by reporting state or territory
Risk factor ACT NT SA Tas Vic WA
n % n % n % n % n % n %
Injecting drug use* 1 50 0 – 5 21.7 15 68 94 48.0 13 33.3
Sexual contact with
hepatitis B case
0 – 0 – 7 30.4 2 9 66 33.7 9 23.1
Household/other contact
with hepatitis B
0 – 0 – 0 – 0 – 1 0.5 1 2.6
Overseas travel 0 – 0 – 1 4.3 0 – 0 – 2 5.1
Other 0 – 0 – 4 17.4 3 14 22 11.2 –
None identified 1 50 0 – 6 26.1 2 9 13 6.6 3 7.7
No information available 0 3 100 0 – 0 – 0 – 11 28.2
Total 2 3 23 22 196 39
* Injecting drug users may have multiple risk factors for hepatitis B virus infection.
Figure 8. Notification rates for unspecifiedhepatitis B virus infections,Australia, 2001, by age and sex*
* By report date.
Figure 9. Trends in notification rates ofunspecified hepatitis B virusinfections, Australia, 1994 to 2001,by age group

There were nine cases of unspecified hepatitis Bvirus infection in children in the 0–4 year age groupreported from New South Wales, South Australia,Queensland and Western Australia. No unspecifiedhepatitis B cases were identified in children aged 0–4years in the Australian Capital Territory, the NorthernTerritory, Tasmania or Victoria. Infant hepatitis Bimmunisation for Indigenous infants was introducedin the Northern Territory in 1988 and then expandedto all infants in this jurisdiction in 1990. Universalinfant hepatitis B immunisation was introduced inthe rest of Australia in May 2000. The effect ofvaccination may take a number of years to becomeobservable in childhood rates of the disease. Data onvaccination coverage, provided by the AustralianChildhood Immunisation Register, indicatesapproximately 95 per cent of infants are currentlyreceiving hepatitis B vaccination in Australia.
Hepatitis C
Unspecified hepatitis C notifications
Hepatitis C infection has been notifiable in allAustralian states and territories since 1995. Whilethe rate of unspecified hepatitis C notifications hasranged from 1.5 to 3 cases per 100,000 population in1997 and 2000 respectively, (Figure 10), 2001 is thefirst year since 1997 where the number of notificationshas decreased. Improved surveillance practice, suchas better classification of incident cases and increasedduplicate checking may account for some of thedecrease in unspecified hepatitis C notifications.Whether the decrease represents a smaller pool ofinfected individuals previously undiagnosed will onlybecome apparent in coming years.
In 2001 there were 19,586 unspecified hepatitis Cinfections reported to NNDSS, a notification rate of100.5 cases per 100,000 population. Of the totalnotifications of unspecified hepatitis C, 43 per cent ofthe notifications were from New South Wales. Thehighest notification rates were from the Northern
Territory (106.5 cases per 100,000 population) andVictoria (103.1 cases per 100,000 population). Themale to female ratio was 1.7:1. The highest reportingrate was in the 40–44 year age group for males(269.1 cases per 100,000 population), althoughthere was little variation across the 25–44 year agerange, from 240 to 269.1 cases per 100,000population. The highest notification rate for females(175.1 cases per 100,000 population) was in the20–24 year age group (Figure 11), while again therewas little variation across the 20–44 year age range.
Trends in the age distribution of unspecified hepatitis Cinfections are shown in Figure 12. Overall, thehighest rates are in the 20–39 year age range. Themost notable trends are the increase in notificationrates in the 15–24 year age range and a decrease inthe 30–39 year age group between 1998 and 2000.Between 2000 and 2001 there were decreases in allgroups in the 15–39 year age range.
CDI Vol 27, No 1 2003 27
Annual report of the National Notifiable Diseases Surveillance System
Figure 10. Trends in notification rates, incidentand unspecified* hepatitis Cinfection, Australia, 1995 to 2001
* By report date.
Figure 11. Notification rates for unspecifiedhepatitis C infections, Australia,2001, by age group and sex*
* By report date.
Figure 12. Trends in notification rates ofunspecified hepatitis C infections,Australia, 1995 to 2001, by age group*
* By report date.

Incident hepatitis C notifications
Reporting of incident hepatitis C notifications fromNew South Wales and Western Australia commencedin 1993, from the Australian Capital Territory in 1994,from South Australia and Tasmania in 1995 and fromVictoria in 1997. Incident hepatitis C cases are notdifferentiated from unspecified hepatitis C cases inQueensland or the Northern Territory. For thepurposes of this report, only incident hepatitis Ccases from 1997 onwards were analysed.
In total there were 600 incident cases of hepatitis Creported with an onset date in 2001, giving a rate of3.8 cases per 100,000 population. The proportion of allhepatitis C infection notifications that were identifiedas incident cases was three per cent in 2001, whichcontinues the upward trend of this proportion since1997, when the proportion was 0.9 per cent. Thehighest rates of incident hepatitis C infection in 2001were reported from Western Australia (8.3 cases per100,000 population), the Australian Capital Territory(5.6 cases per 100,000 population and South Australia(5.3 cases per 100,000 population). The majority ofincident hepatitis C notifications were in the 20–24year age group for both males and females, withrates of 20.3 and 13.7 cases per 100,000 population,respectively (Figure 13). Overall, the male to femaleratio was 1.5:1.
Trends in the age distribution of incident hepatitis Cinfections are shown in Figure 14. While rates in the0–14 year and over 40 year age groups have remainedstable, increases were observed in the 15–39 yearage range, with steep increases in the 20–39 yearage range between 2000 and 2001.
Enhanced surveillance for incident hepatitis C
infection notifications
In 1998 CDNA established the Hepatitis C SurveillanceCommittee. The committee was given the responsibilityfor improving the national capacity to monitor theoccurrence of the infection and its consequences, bythe development and implementation of a nationalhepatitis C surveillance strategy.7 In 2001, its termsof reference were extended to include the developmentof national surveillance for hepatitis B virus infection,and the name was changed to the CDNA ViralHepatitis Surveillance Committee.
In reviewing existing procedures in the course ofdeveloping the surveillance strategy, the committeeidentified the lack of standard case definitions acrossjurisdictions, and the absence of information on riskfactors for hepatitis C as key weaknesses in nationalsurveillance. The committee endorsed standard casedefinitions, and a set of categories that would beused to classify exposure for all cases determined tobe incident. Despite competing priorities and resourcelimitations, in 2001 some states and territories wereable to introduce enhanced surveillance for incidenthepatitis C infections.
Surveillance of incident hepatitis C infection cases isdifficult due to the asymptomatic nature of the diseaseand the need to collect paired sera to diagnoserecent infection by seroconversion. Detection ofincident cases prior to 2001 was on the basis ofseroconversion or clinical illness. In recognition thatcases of transmission from mother to child wouldnot usually be detected by either seroconversion orclinical illness, in 2001 perinatal cases were includedas incident infections. Enhanced surveillance, whereall hepatitis C notifications are further investigated toascertain the likely time of infection, is time andlabour intensive, due to the large number of notifications.Trends in the number of incident cases are affected
28 CDI Vol 27, No 1 2003
Annual report of the National Notifiable Diseases Surveillance System
Figure 13. Notification rates for incidenthepatitis C infections, Australia,2001, by age group and sex
Figure 14. Trends in notification rates ofincident hepatitis C infections,Australia, 1997 to 2001, by age group
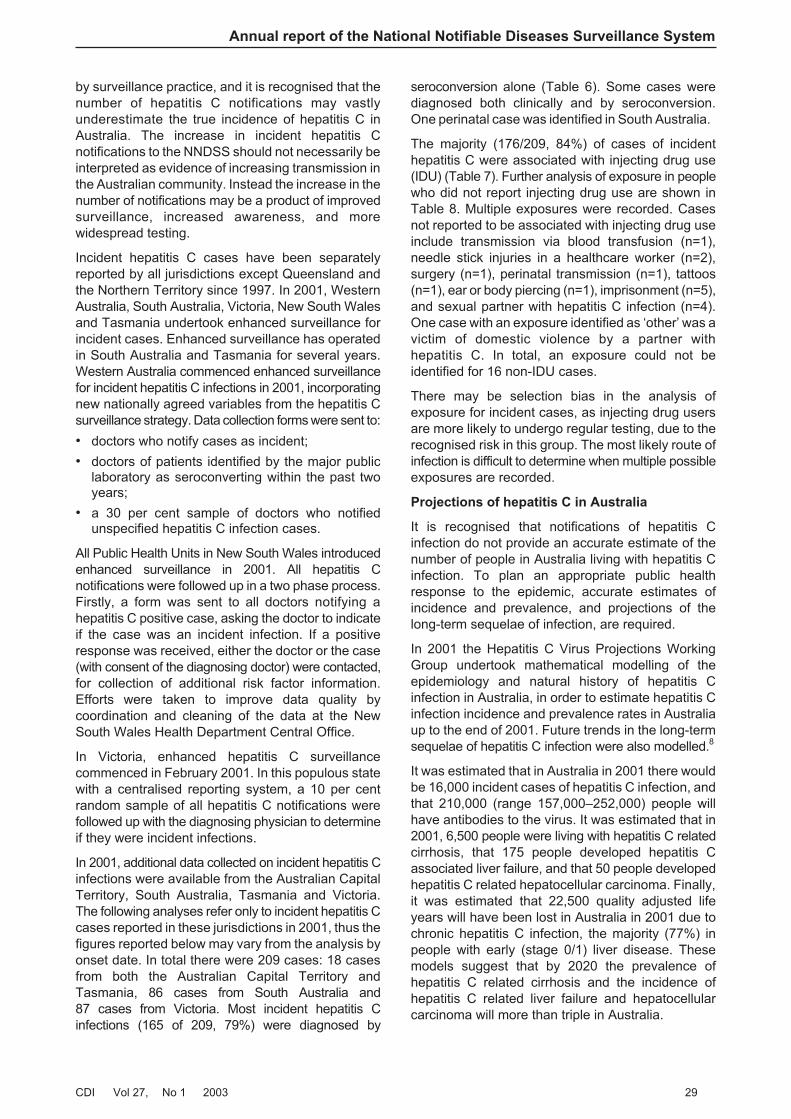
by surveillance practice, and it is recognised that thenumber of hepatitis C notifications may vastlyunderestimate the true incidence of hepatitis C inAustralia. The increase in incident hepatitis Cnotifications to the NNDSS should not necessarily beinterpreted as evidence of increasing transmission inthe Australian community. Instead the increase in thenumber of notifications may be a product of improvedsurveillance, increased awareness, and morewidespread testing.
Incident hepatitis C cases have been separatelyreported by all jurisdictions except Queensland andthe Northern Territory since 1997. In 2001, WesternAustralia, South Australia, Victoria, New South Walesand Tasmania undertook enhanced surveillance forincident cases. Enhanced surveillance has operatedin South Australia and Tasmania for several years.Western Australia commenced enhanced surveillancefor incident hepatitis C infections in 2001, incorporatingnew nationally agreed variables from the hepatitis Csurveillance strategy. Data collection forms were sent to:
• doctors who notify cases as incident;
• doctors of patients identified by the major publiclaboratory as seroconverting within the past twoyears;
• a 30 per cent sample of doctors who notifiedunspecified hepatitis C infection cases.
All Public Health Units in New South Wales introducedenhanced surveillance in 2001. All hepatitis Cnotifications were followed up in a two phase process.Firstly, a form was sent to all doctors notifying ahepatitis C positive case, asking the doctor to indicateif the case was an incident infection. If a positiveresponse was received, either the doctor or the case(with consent of the diagnosing doctor) were contacted,for collection of additional risk factor information.Efforts were taken to improve data quality bycoordination and cleaning of the data at the NewSouth Wales Health Department Central Office.
In Victoria, enhanced hepatitis C surveillancecommenced in February 2001. In this populous statewith a centralised reporting system, a 10 per centrandom sample of all hepatitis C notifications werefollowed up with the diagnosing physician to determineif they were incident infections.
In 2001, additional data collected on incident hepatitis Cinfections were available from the Australian CapitalTerritory, South Australia, Tasmania and Victoria.The following analyses refer only to incident hepatitis Ccases reported in these jurisdictions in 2001, thus thefigures reported below may vary from the analysis byonset date. In total there were 209 cases: 18 casesfrom both the Australian Capital Territory andTasmania, 86 cases from South Australia and87 cases from Victoria. Most incident hepatitis Cinfections (165 of 209, 79%) were diagnosed by
seroconversion alone (Table 6). Some cases werediagnosed both clinically and by seroconversion.One perinatal case was identified in South Australia.
The majority (176/209, 84%) of cases of incidenthepatitis C were associated with injecting drug use(IDU) (Table 7). Further analysis of exposure in peoplewho did not report injecting drug use are shown inTable 8. Multiple exposures were recorded. Casesnot reported to be associated with injecting drug useinclude transmission via blood transfusion (n=1),needle stick injuries in a healthcare worker (n=2),surgery (n=1), perinatal transmission (n=1), tattoos(n=1), ear or body piercing (n=1), imprisonment (n=5),and sexual partner with hepatitis C infection (n=4).One case with an exposure identified as ‘other’ was avictim of domestic violence by a partner withhepatitis C. In total, an exposure could not beidentified for 16 non-IDU cases.
There may be selection bias in the analysis ofexposure for incident cases, as injecting drug usersare more likely to undergo regular testing, due to therecognised risk in this group. The most likely route ofinfection is difficult to determine when multiple possibleexposures are recorded.
Projections of hepatitis C in Australia
It is recognised that notifications of hepatitis Cinfection do not provide an accurate estimate of thenumber of people in Australia living with hepatitis Cinfection. To plan an appropriate public healthresponse to the epidemic, accurate estimates ofincidence and prevalence, and projections of thelong-term sequelae of infection, are required.
In 2001 the Hepatitis C Virus Projections WorkingGroup undertook mathematical modelling of theepidemiology and natural history of hepatitis Cinfection in Australia, in order to estimate hepatitis Cinfection incidence and prevalence rates in Australiaup to the end of 2001. Future trends in the long-termsequelae of hepatitis C infection were also modelled.8
It was estimated that in Australia in 2001 there wouldbe 16,000 incident cases of hepatitis C infection, andthat 210,000 (range 157,000–252,000) people willhave antibodies to the virus. It was estimated that in2001, 6,500 people were living with hepatitis C relatedcirrhosis, that 175 people developed hepatitis Cassociated liver failure, and that 50 people developedhepatitis C related hepatocellular carcinoma. Finally,it was estimated that 22,500 quality adjusted lifeyears will have been lost in Australia in 2001 due tochronic hepatitis C infection, the majority (77%) inpeople with early (stage 0/1) liver disease. Thesemodels suggest that by 2020 the prevalence ofhepatitis C related cirrhosis and the incidence ofhepatitis C related liver failure and hepatocellularcarcinoma will more than triple in Australia.
CDI Vol 27, No 1 2003 29
Annual report of the National Notifiable Diseases Surveillance System
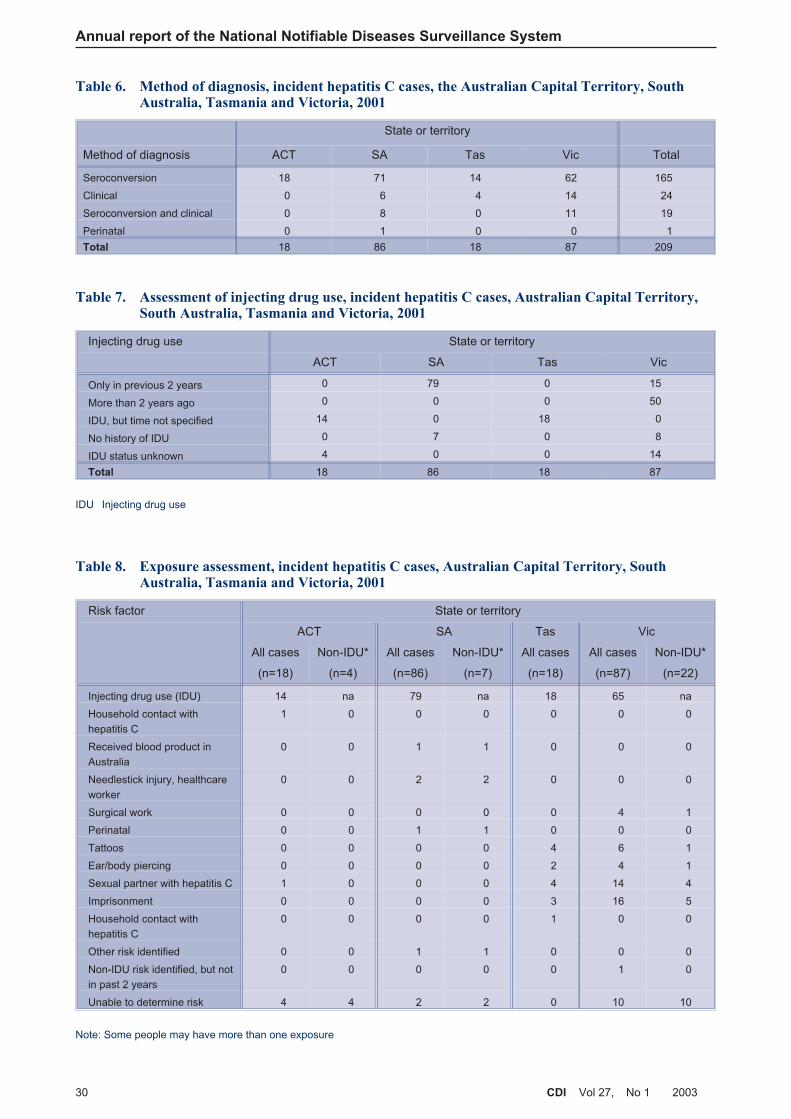
Annual report of the National Notifiable Diseases Surveillance System
30 CDI Vol 27, No 1 2003
Table 7. Assessment of injecting drug use, incident hepatitis C cases, Australian Capital Territory,South Australia, Tasmania and Victoria, 2001
Injecting drug use State or territory
ACT SA Tas Vic
Only in previous 2 years 0 79 0 15
More than 2 years ago 0 0 0 50
IDU, but time not specified 14 0 18 0
No history of IDU 0 7 0 8
IDU status unknown 4 0 0 14
Total 18 86 18 87
IDU Injecting drug use
Table 8. Exposure assessment, incident hepatitis C cases, Australian Capital Territory, SouthAustralia, Tasmania and Victoria, 2001
Risk factor State or territory
ACT SA Tas Vic
All cases
(n=18)
Non-IDU*
(n=4)
All cases
(n=86)
Non-IDU*
(n=7)
All cases
(n=18)
All cases
(n=87)
Non-IDU*
(n=22)
Injecting drug use (IDU) 14 na 79 na 18 65 na
Household contact with
hepatitis C
1 0 0 0 0 0 0
Received blood product in
Australia
0 0 1 1 0 0 0
Needlestick injury, healthcare
worker
0 0 2 2 0 0 0
Surgical work 0 0 0 0 0 4 1
Perinatal 0 0 1 1 0 0 0
Tattoos 0 0 0 0 4 6 1
Ear/body piercing 0 0 0 0 2 4 1
Sexual partner with hepatitis C 1 0 0 0 4 14 4
Imprisonment 0 0 0 0 3 16 5
Household contact with
hepatitis C
0 0 0 0 1 0 0
Other risk identified 0 0 1 1 0 0 0
Non-IDU risk identified, but not
in past 2 years
0 0 0 0 0 1 0
Unable to determine risk 4 4 2 2 0 10 10
Note: Some people may have more than one exposure
Table 6. Method of diagnosis, incident hepatitis C cases, the Australian Capital Territory, SouthAustralia, Tasmania and Victoria, 2001
State or territory
Method of diagnosis ACT SA Tas Vic Total
Seroconversion 18 71 14 62 165
Clinical 0 6 4 14 24
Seroconversion and clinical 0 8 0 11 19
Perinatal 0 1 0 0 1
Total 18 86 18 87 209
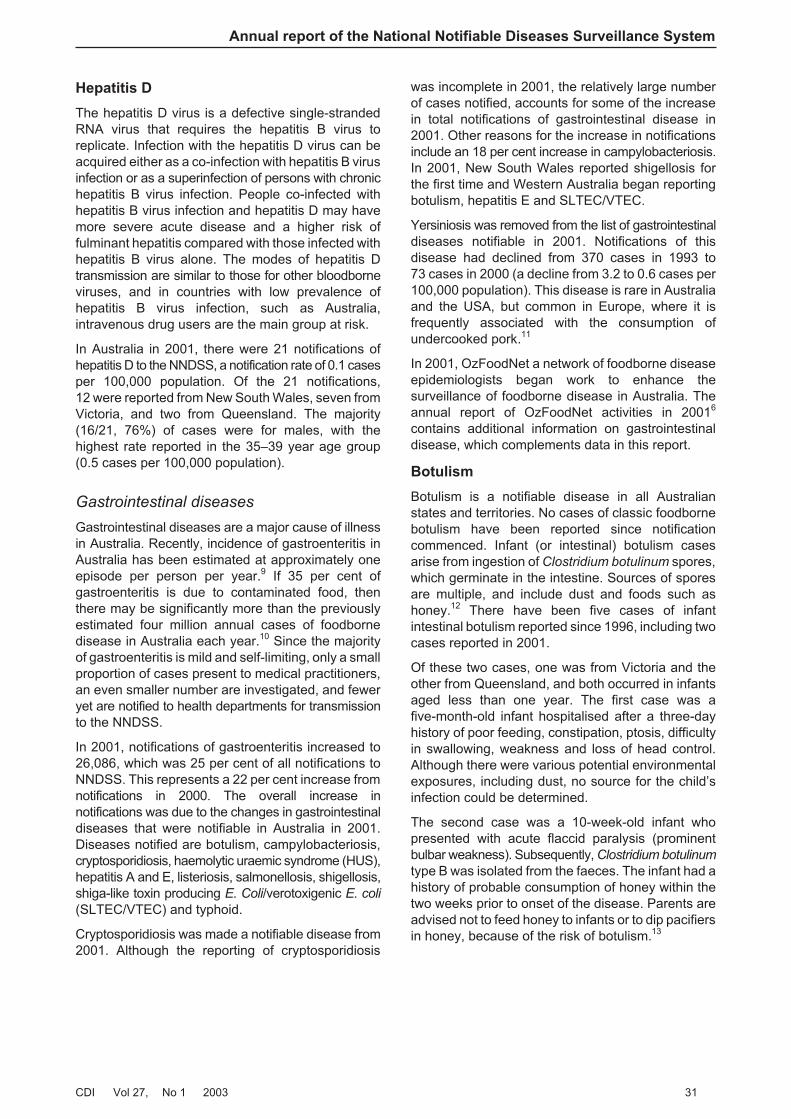
Hepatitis D
The hepatitis D virus is a defective single-strandedRNA virus that requires the hepatitis B virus toreplicate. Infection with the hepatitis D virus can beacquired either as a co-infection with hepatitis B virusinfection or as a superinfection of persons with chronichepatitis B virus infection. People co-infected withhepatitis B virus infection and hepatitis D may havemore severe acute disease and a higher risk offulminant hepatitis compared with those infected withhepatitis B virus alone. The modes of hepatitis Dtransmission are similar to those for other bloodborneviruses, and in countries with low prevalence ofhepatitis B virus infection, such as Australia,intravenous drug users are the main group at risk.
In Australia in 2001, there were 21 notifications ofhepatitis D to the NNDSS, a notification rate of 0.1 casesper 100,000 population. Of the 21 notifications,12 were reported from New South Wales, seven fromVictoria, and two from Queensland. The majority(16/21, 76%) of cases were for males, with thehighest rate reported in the 35–39 year age group(0.5 cases per 100,000 population).
Gastrointestinal diseases
Gastrointestinal diseases are a major cause of illnessin Australia. Recently, incidence of gastroenteritis inAustralia has been estimated at approximately oneepisode per person per year.9 If 35 per cent ofgastroenteritis is due to contaminated food, thenthere may be significantly more than the previouslyestimated four million annual cases of foodbornedisease in Australia each year.10 Since the majorityof gastroenteritis is mild and self-limiting, only a smallproportion of cases present to medical practitioners,an even smaller number are investigated, and feweryet are notified to health departments for transmissionto the NNDSS.
In 2001, notifications of gastroenteritis increased to26,086, which was 25 per cent of all notifications toNNDSS. This represents a 22 per cent increase fromnotifications in 2000. The overall increase innotifications was due to the changes in gastrointestinaldiseases that were notifiable in Australia in 2001.Diseases notified are botulism, campylobacteriosis,cryptosporidiosis, haemolytic uraemic syndrome (HUS),hepatitis A and E, listeriosis, salmonellosis, shigellosis,shiga-like toxin producing E. Coli/verotoxigenic E. coli
(SLTEC/VTEC) and typhoid.
Cryptosporidiosis was made a notifiable disease from2001. Although the reporting of cryptosporidiosis
was incomplete in 2001, the relatively large numberof cases notified, accounts for some of the increasein total notifications of gastrointestinal disease in2001. Other reasons for the increase in notificationsinclude an 18 per cent increase in campylobacteriosis.In 2001, New South Wales reported shigellosis forthe first time and Western Australia began reportingbotulism, hepatitis E and SLTEC/VTEC.
Yersiniosis was removed from the list of gastrointestinaldiseases notifiable in 2001. Notifications of thisdisease had declined from 370 cases in 1993 to73 cases in 2000 (a decline from 3.2 to 0.6 cases per100,000 population). This disease is rare in Australiaand the USA, but common in Europe, where it isfrequently associated with the consumption ofundercooked pork.11
In 2001, OzFoodNet a network of foodborne diseaseepidemiologists began work to enhance thesurveillance of foodborne disease in Australia. Theannual report of OzFoodNet activities in 20016
contains additional information on gastrointestinaldisease, which complements data in this report.
Botulism
Botulism is a notifiable disease in all Australianstates and territories. No cases of classic foodbornebotulism have been reported since notificationcommenced. Infant (or intestinal) botulism casesarise from ingestion of Clostridium botulinum spores,which germinate in the intestine. Sources of sporesare multiple, and include dust and foods such ashoney.12 There have been five cases of infantintestinal botulism reported since 1996, including twocases reported in 2001.
Of these two cases, one was from Victoria and theother from Queensland, and both occurred in infantsaged less than one year. The first case was afive-month-old infant hospitalised after a three-dayhistory of poor feeding, constipation, ptosis, difficultyin swallowing, weakness and loss of head control.Although there were various potential environmentalexposures, including dust, no source for the child’sinfection could be determined.
The second case was a 10-week-old infant whopresented with acute flaccid paralysis (prominentbulbar weakness). Subsequently, Clostridium botulinum
type B was isolated from the faeces. The infant had ahistory of probable consumption of honey within thetwo weeks prior to onset of the disease. Parents areadvised not to feed honey to infants or to dip pacifiersin honey, because of the risk of botulism.13
Annual report of the National Notifiable Diseases Surveillance System
CDI Vol 27, No 1 2003 31
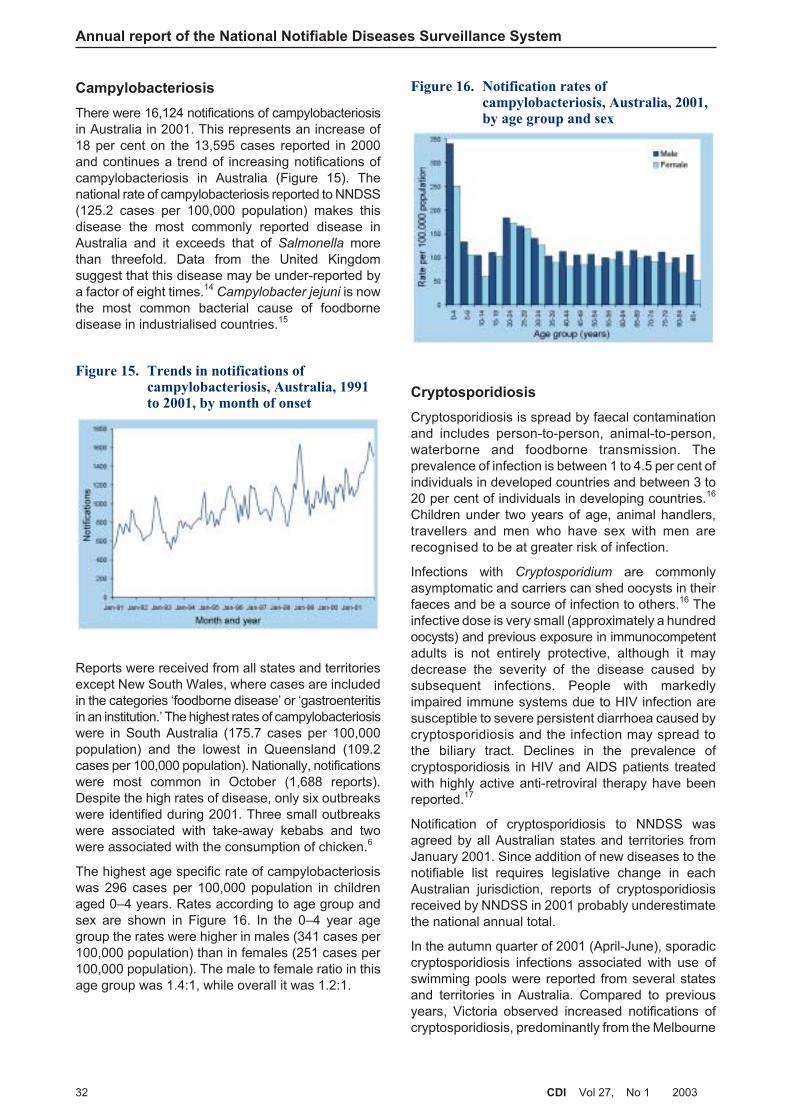
Campylobacteriosis
There were 16,124 notifications of campylobacteriosisin Australia in 2001. This represents an increase of18 per cent on the 13,595 cases reported in 2000and continues a trend of increasing notifications ofcampylobacteriosis in Australia (Figure 15). Thenational rate of campylobacteriosis reported to NNDSS(125.2 cases per 100,000 population) makes thisdisease the most commonly reported disease inAustralia and it exceeds that of Salmonella morethan threefold. Data from the United Kingdomsuggest that this disease may be under-reported bya factor of eight times.14
Campylobacter jejuni is nowthe most common bacterial cause of foodbornedisease in industrialised countries.15
Reports were received from all states and territoriesexcept New South Wales, where cases are includedin the categories ‘foodborne disease’ or ‘gastroenteritisin an institution.’ The highest rates of campylobacteriosiswere in South Australia (175.7 cases per 100,000population) and the lowest in Queensland (109.2cases per 100,000 population). Nationally, notificationswere most common in October (1,688 reports).Despite the high rates of disease, only six outbreakswere identified during 2001. Three small outbreakswere associated with take-away kebabs and twowere associated with the consumption of chicken.6
The highest age specific rate of campylobacteriosiswas 296 cases per 100,000 population in childrenaged 0–4 years. Rates according to age group andsex are shown in Figure 16. In the 0–4 year agegroup the rates were higher in males (341 cases per100,000 population) than in females (251 cases per100,000 population). The male to female ratio in thisage group was 1.4:1, while overall it was 1.2:1.
Cryptosporidiosis
Cryptosporidiosis is spread by faecal contaminationand includes person-to-person, animal-to-person,waterborne and foodborne transmission. Theprevalence of infection is between 1 to 4.5 per cent ofindividuals in developed countries and between 3 to20 per cent of individuals in developing countries.16
Children under two years of age, animal handlers,travellers and men who have sex with men arerecognised to be at greater risk of infection.
Infections with Cryptosporidium are commonlyasymptomatic and carriers can shed oocysts in theirfaeces and be a source of infection to others.16 Theinfective dose is very small (approximately a hundredoocysts) and previous exposure in immunocompetentadults is not entirely protective, although it maydecrease the severity of the disease caused bysubsequent infections. People with markedlyimpaired immune systems due to HIV infection aresusceptible to severe persistent diarrhoea caused bycryptosporidiosis and the infection may spread tothe biliary tract. Declines in the prevalence ofcryptosporidiosis in HIV and AIDS patients treatedwith highly active anti-retroviral therapy have beenreported.17
Notification of cryptosporidiosis to NNDSS wasagreed by all Australian states and territories fromJanuary 2001. Since addition of new diseases to thenotifiable list requires legislative change in eachAustralian jurisdiction, reports of cryptosporidiosisreceived by NNDSS in 2001 probably underestimatethe national annual total.
In the autumn quarter of 2001 (April-June), sporadiccryptosporidiosis infections associated with use ofswimming pools were reported from several statesand territories in Australia. Compared to previousyears, Victoria observed increased notifications ofcryptosporidiosis, predominantly from the Melbourne
Annual report of the National Notifiable Diseases Surveillance System
32 CDI Vol 27, No 1 2003
Figure 15. Trends in notifications ofcampylobacteriosis, Australia, 1991to 2001, by month of onset
Figure 16. Notification rates ofcampylobacteriosis, Australia, 2001,by age group and sex
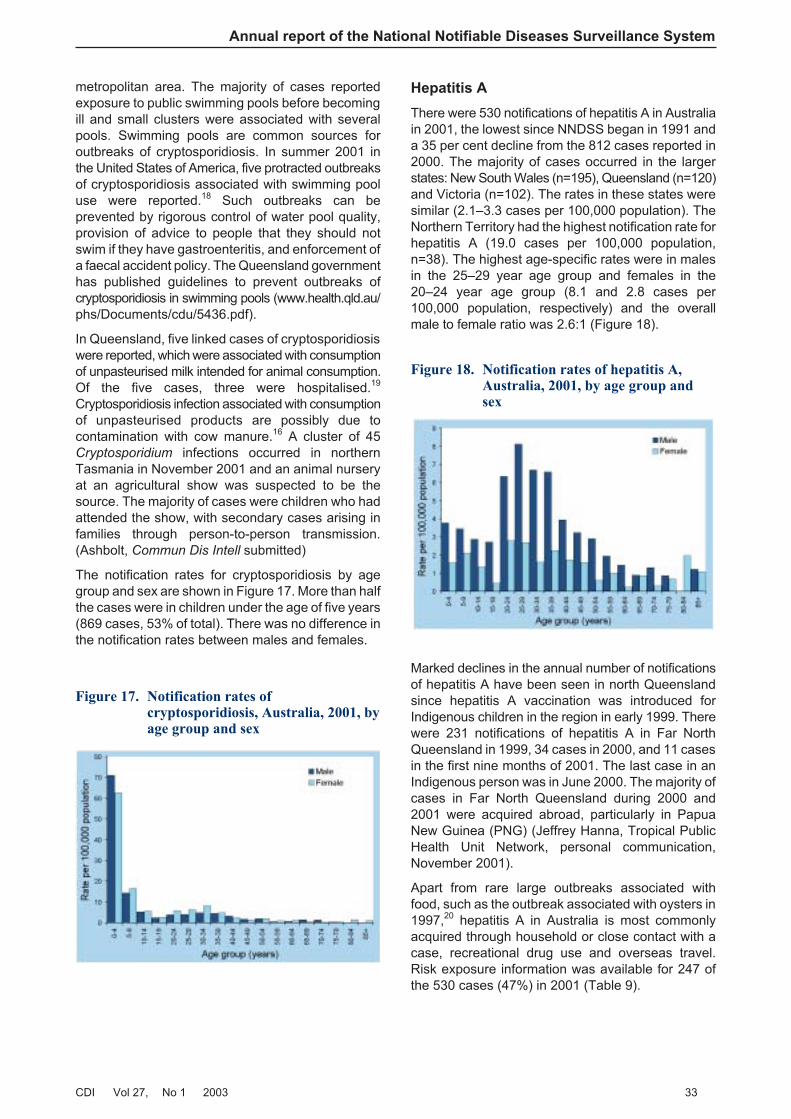
metropolitan area. The majority of cases reportedexposure to public swimming pools before becomingill and small clusters were associated with severalpools. Swimming pools are common sources foroutbreaks of cryptosporidiosis. In summer 2001 inthe United States of America, five protracted outbreaksof cryptosporidiosis associated with swimming pooluse were reported.18 Such outbreaks can beprevented by rigorous control of water pool quality,provision of advice to people that they should notswim if they have gastroenteritis, and enforcement ofa faecal accident policy. The Queensland governmenthas published guidelines to prevent outbreaks ofcryptosporidiosis in swimming pools (www.health.qld.au/phs/Documents/cdu/5436.pdf).
In Queensland, five linked cases of cryptosporidiosiswere reported, which were associated with consumptionof unpasteurised milk intended for animal consumption.Of the five cases, three were hospitalised.19
Cryptosporidiosis infection associated with consumptionof unpasteurised products are possibly due tocontamination with cow manure.16 A cluster of 45Cryptosporidium infections occurred in northernTasmania in November 2001 and an animal nurseryat an agricultural show was suspected to be thesource. The majority of cases were children who hadattended the show, with secondary cases arising infamilies through person-to-person transmission.(Ashbolt, Commun Dis Intell submitted)
The notification rates for cryptosporidiosis by agegroup and sex are shown in Figure 17. More than halfthe cases were in children under the age of five years(869 cases, 53% of total). There was no difference inthe notification rates between males and females.
Hepatitis A
There were 530 notifications of hepatitis A in Australiain 2001, the lowest since NNDSS began in 1991 anda 35 per cent decline from the 812 cases reported in2000. The majority of cases occurred in the largerstates: New South Wales (n=195), Queensland (n=120)and Victoria (n=102). The rates in these states weresimilar (2.1–3.3 cases per 100,000 population). TheNorthern Territory had the highest notification rate forhepatitis A (19.0 cases per 100,000 population,n=38). The highest age-specific rates were in malesin the 25–29 year age group and females in the20–24 year age group (8.1 and 2.8 cases per100,000 population, respectively) and the overallmale to female ratio was 2.6:1 (Figure 18).
Marked declines in the annual number of notificationsof hepatitis A have been seen in north Queenslandsince hepatitis A vaccination was introduced forIndigenous children in the region in early 1999. Therewere 231 notifications of hepatitis A in Far NorthQueensland in 1999, 34 cases in 2000, and 11 casesin the first nine months of 2001. The last case in anIndigenous person was in June 2000. The majority ofcases in Far North Queensland during 2000 and2001 were acquired abroad, particularly in PapuaNew Guinea (PNG) (Jeffrey Hanna, Tropical PublicHealth Unit Network, personal communication,November 2001).
Apart from rare large outbreaks associated withfood, such as the outbreak associated with oysters in1997,20 hepatitis A in Australia is most commonlyacquired through household or close contact with acase, recreational drug use and overseas travel.Risk exposure information was available for 247 ofthe 530 cases (47%) in 2001 (Table 9).
Annual report of the National Notifiable Diseases Surveillance System
CDI Vol 27, No 1 2003 33
Figure 17. Notification rates ofcryptosporidiosis, Australia, 2001, byage group and sex
Figure 18. Notification rates of hepatitis A,Australia, 2001, by age group andsex
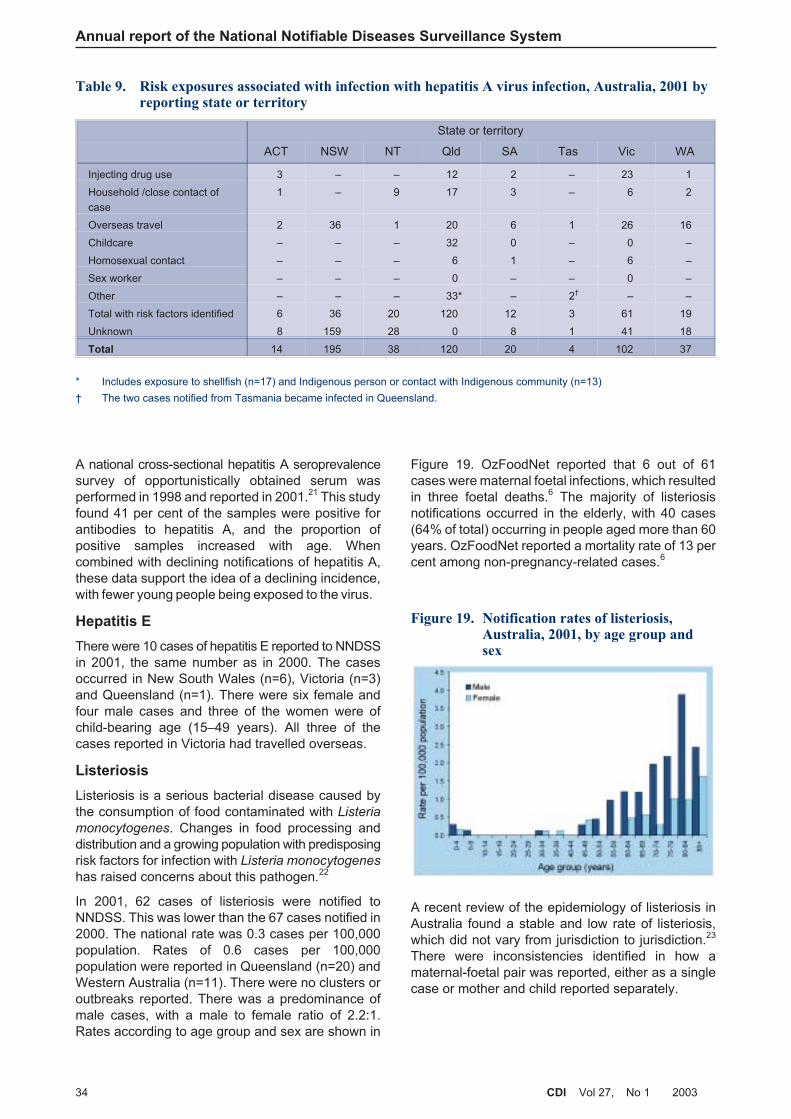
A national cross-sectional hepatitis A seroprevalencesurvey of opportunistically obtained serum wasperformed in 1998 and reported in 2001.21 This studyfound 41 per cent of the samples were positive forantibodies to hepatitis A, and the proportion ofpositive samples increased with age. Whencombined with declining notifications of hepatitis A,these data support the idea of a declining incidence,with fewer young people being exposed to the virus.
Hepatitis E
There were 10 cases of hepatitis E reported to NNDSSin 2001, the same number as in 2000. The casesoccurred in New South Wales (n=6), Victoria (n=3)and Queensland (n=1). There were six female andfour male cases and three of the women were ofchild-bearing age (15–49 years). All three of thecases reported in Victoria had travelled overseas.
Listeriosis
Listeriosis is a serious bacterial disease caused bythe consumption of food contaminated with Listeria
monocytogenes. Changes in food processing anddistribution and a growing population with predisposingrisk factors for infection with Listeria monocytogenes
has raised concerns about this pathogen.22
In 2001, 62 cases of listeriosis were notified toNNDSS. This was lower than the 67 cases notified in2000. The national rate was 0.3 cases per 100,000population. Rates of 0.6 cases per 100,000population were reported in Queensland (n=20) andWestern Australia (n=11). There were no clusters oroutbreaks reported. There was a predominance ofmale cases, with a male to female ratio of 2.2:1.Rates according to age group and sex are shown in
Figure 19. OzFoodNet reported that 6 out of 61cases were maternal foetal infections, which resultedin three foetal deaths.6 The majority of listeriosisnotifications occurred in the elderly, with 40 cases(64% of total) occurring in people aged more than 60years. OzFoodNet reported a mortality rate of 13 percent among non-pregnancy-related cases.6
A recent review of the epidemiology of listeriosis inAustralia found a stable and low rate of listeriosis,which did not vary from jurisdiction to jurisdiction.23
There were inconsistencies identified in how amaternal-foetal pair was reported, either as a singlecase or mother and child reported separately.
Annual report of the National Notifiable Diseases Surveillance System
34 CDI Vol 27, No 1 2003
Table 9. Risk exposures associated with infection with hepatitis A virus infection, Australia, 2001 byreporting state or territory
State or territory
ACT NSW NT Qld SA Tas Vic WA
Injecting drug use 3 – – 12 2 – 23 1
Household /close contact of
case
1 – 9 17 3 – 6 2
Overseas travel 2 36 1 20 6 1 26 16
Childcare – – – 32 0 – 0 –
Homosexual contact – – – 6 1 – 6 –
Sex worker – – – 0 – – 0 –
Other – – – 33* – 2† – –
Total with risk factors identified 6 36 20 120 12 3 61 19
Unknown 8 159 28 0 8 1 41 18
Total 14 195 38 120 20 4 102 37
* Includes exposure to shellfish (n=17) and Indigenous person or contact with Indigenous community (n=13)
† The two cases notified from Tasmania became infected in Queensland.
Figure 19. Notification rates of listeriosis,Australia, 2001, by age group andsex

Australia’s Imported Food Program undertakessurveillance of imported food, and is a joint activityof Food Standards Australia New Zealand and theAustralian Quarantine Inspection Service. All‘ready-to-eat’ imported foods, such as soft cheeseand smoked fish, must be free of Listeria. Data fromthe Imported Food Program from 1995 to 1998 showan increasing percentage of imported food items (upto 8%) was contaminated with Listeria.24 Surveillancefor Listeria contamination of imported food is thereforea vital measure for control of listeriosis in Australia.
Salmonellosis (excluding typhoid)
Salmonellosis is the second most commonly notifiedgastrointestinal disease in Australia and is primarilyassociated with food.25 In 2001, there were 7,045cases reported, an increase of 14.5 per cent on the6,151 cases reported in 2000. While there has beena variable trend over the last 10 years, improvementsin the investigation of foodborne disease by statesand territories may have contributed to recentincreased notifications.
Cases of salmonellosis were reported from eachAustralian state and territory in 2001, and the nationalrate was 36.2 cases per 100,000 population. Thehighest rate was in the Northern Territory (186.5 casesper 100,000 population). Rates of salmonellosis variedby Statistical Division (Map 2), with the Kimberleydistrict of northern Western Australia having the
highest rate (602 cases per 100,000 population). Ingeneral, there were higher rates of salmonellosis inmore northerly areas of the country. Reports ofsalmonellosis were highest in summer months(January–March, Figure 20). As in previous years,the highest age-specific rate was in children agedless than five years (196 cases per 100,000 population)and the male to female ratio was 1.1:1. Rates accordingto age group and sex are shown in Figure 21.
Annual report of the National Notifiable Diseases Surveillance System
CDI Vol 27, No 1 2003 35
Map 2. Notification rates of salmonellosis, Australia, 2001, by Statistical Division of residence
Figure 20. Trends in notifications ofsalmonellosis, Australia, 1991 to2001, by month of onset
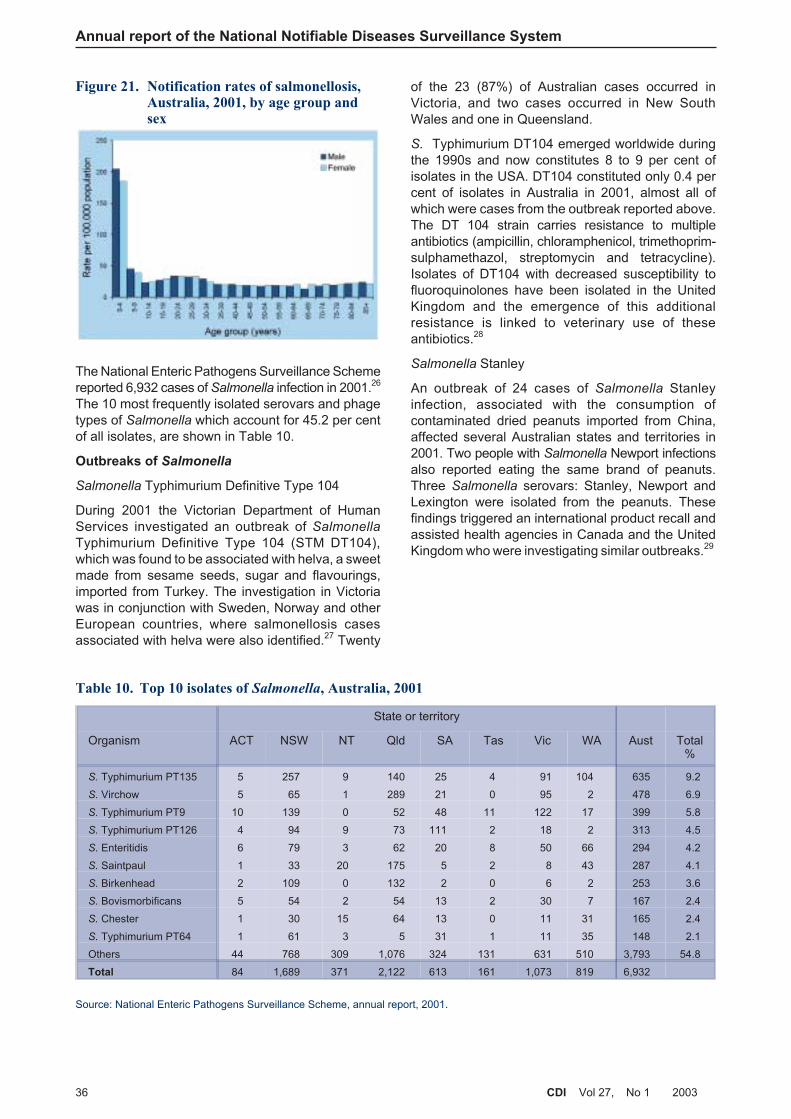
The National Enteric Pathogens Surveillance Schemereported 6,932 cases of Salmonella infection in 2001.26
The 10 most frequently isolated serovars and phagetypes of Salmonella which account for 45.2 per centof all isolates, are shown in Table 10.
Outbreaks of Salmonella
Salmonella Typhimurium Definitive Type 104
During 2001 the Victorian Department of HumanServices investigated an outbreak of Salmonella
Typhimurium Definitive Type 104 (STM DT104),which was found to be associated with helva, a sweetmade from sesame seeds, sugar and flavourings,imported from Turkey. The investigation in Victoriawas in conjunction with Sweden, Norway and otherEuropean countries, where salmonellosis casesassociated with helva were also identified.27 Twenty
of the 23 (87%) of Australian cases occurred inVictoria, and two cases occurred in New SouthWales and one in Queensland.
S. Typhimurium DT104 emerged worldwide duringthe 1990s and now constitutes 8 to 9 per cent ofisolates in the USA. DT104 constituted only 0.4 percent of isolates in Australia in 2001, almost all ofwhich were cases from the outbreak reported above.The DT 104 strain carries resistance to multipleantibiotics (ampicillin, chloramphenicol, trimethoprim-sulphamethazol, streptomycin and tetracycline).Isolates of DT104 with decreased susceptibility tofluoroquinolones have been isolated in the UnitedKingdom and the emergence of this additionalresistance is linked to veterinary use of theseantibiotics.28
Salmonella Stanley
An outbreak of 24 cases of Salmonella Stanleyinfection, associated with the consumption ofcontaminated dried peanuts imported from China,affected several Australian states and territories in2001. Two people with Salmonella Newport infectionsalso reported eating the same brand of peanuts.Three Salmonella serovars: Stanley, Newport andLexington were isolated from the peanuts. Thesefindings triggered an international product recall andassisted health agencies in Canada and the UnitedKingdom who were investigating similar outbreaks.29
Annual report of the National Notifiable Diseases Surveillance System
36 CDI Vol 27, No 1 2003
Figure 21. Notification rates of salmonellosis,Australia, 2001, by age group andsex
Table 10. Top 10 isolates of Salmonella, Australia, 2001
State or territory
Organism ACT NSW NT Qld SA Tas Vic WA Aust Total%
S. Typhimurium PT135 5 257 9 140 25 4 91 104 635 9.2
S. Virchow 5 65 1 289 21 0 95 2 478 6.9
S. Typhimurium PT9 10 139 0 52 48 11 122 17 399 5.8
S. Typhimurium PT126 4 94 9 73 111 2 18 2 313 4.5
S. Enteritidis 6 79 3 62 20 8 50 66 294 4.2
S. Saintpaul 1 33 20 175 5 2 8 43 287 4.1
S. Birkenhead 2 109 0 132 2 0 6 2 253 3.6
S. Bovismorbificans 5 54 2 54 13 2 30 7 167 2.4
S. Chester 1 30 15 64 13 0 11 31 165 2.4
S. Typhimurium PT64 1 61 3 5 31 1 11 35 148 2.1
Others 44 768 309 1,076 324 131 631 510 3,793 54.8
Total 84 1,689 371 2,122 613 161 1,073 819 6,932
Source: National Enteric Pathogens Surveillance Scheme, annual report, 2001.
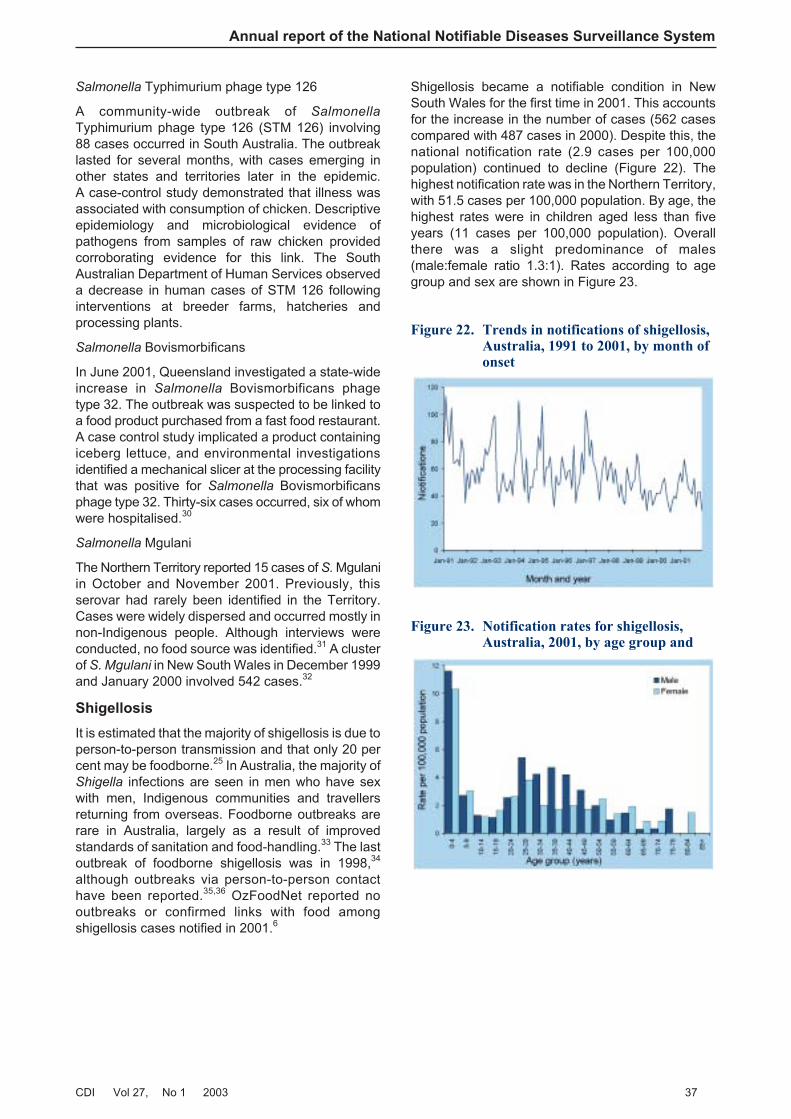
Salmonella Typhimurium phage type 126
A community-wide outbreak of Salmonella
Typhimurium phage type 126 (STM 126) involving88 cases occurred in South Australia. The outbreaklasted for several months, with cases emerging inother states and territories later in the epidemic.A case-control study demonstrated that illness wasassociated with consumption of chicken. Descriptiveepidemiology and microbiological evidence ofpathogens from samples of raw chicken providedcorroborating evidence for this link. The SouthAustralian Department of Human Services observeda decrease in human cases of STM 126 followinginterventions at breeder farms, hatcheries andprocessing plants.
Salmonella Bovismorbificans
In June 2001, Queensland investigated a state-wideincrease in Salmonella Bovismorbificans phagetype 32. The outbreak was suspected to be linked toa food product purchased from a fast food restaurant.A case control study implicated a product containingiceberg lettuce, and environmental investigationsidentified a mechanical slicer at the processing facilitythat was positive for Salmonella Bovismorbificansphage type 32. Thirty-six cases occurred, six of whomwere hospitalised.30
Salmonella Mgulani
The Northern Territory reported 15 cases of S. Mgulaniin October and November 2001. Previously, thisserovar had rarely been identified in the Territory.Cases were widely dispersed and occurred mostly innon-Indigenous people. Although interviews wereconducted, no food source was identified.31 A clusterof S. Mgulani in New South Wales in December 1999and January 2000 involved 542 cases.32
Shigellosis
It is estimated that the majority of shigellosis is due toperson-to-person transmission and that only 20 percent may be foodborne.25 In Australia, the majority ofShigella infections are seen in men who have sexwith men, Indigenous communities and travellersreturning from overseas. Foodborne outbreaks arerare in Australia, largely as a result of improvedstandards of sanitation and food-handling.33 The lastoutbreak of foodborne shigellosis was in 1998,34
although outbreaks via person-to-person contacthave been reported.35,36 OzFoodNet reported nooutbreaks or confirmed links with food amongshigellosis cases notified in 2001.6
Shigellosis became a notifiable condition in NewSouth Wales for the first time in 2001. This accountsfor the increase in the number of cases (562 casescompared with 487 cases in 2000). Despite this, thenational notification rate (2.9 cases per 100,000population) continued to decline (Figure 22). Thehighest notification rate was in the Northern Territory,with 51.5 cases per 100,000 population. By age, thehighest rates were in children aged less than fiveyears (11 cases per 100,000 population). Overallthere was a slight predominance of males(male:female ratio 1.3:1). Rates according to agegroup and sex are shown in Figure 23.
Annual report of the National Notifiable Diseases Surveillance System
CDI Vol 27, No 1 2003 37
Figure 23. Notification rates for shigellosis,Australia, 2001, by age group and
Figure 22. Trends in notifications of shigellosis,Australia, 1991 to 2001, by month ofonset

Shiga-like toxin producing Escherichia coli/
verotoxigenic E. coli
There were 49 cases of SLTEC/VTEC notified toNNDSS in 2001. This was an increase of 48 per centon the 33 cases reported in 2000. Reports ofSLTEC/VTEC infections were received fromQueensland and Western Australia for the first timein 2001. The notification rate rose slightly to 0.3 casesper 100,000 population.
As in previous years, more than 50 per cent (27/49)of cases were notified in South Australia, reflecting apolicy of screening all bloody stools for toxin genesby polymerase chain reaction. OzFoodNet reportedthat E. coli O157 was identified in 3 of 26 cases inSouth Australia, 2 of 4 cases in Victoria and 4 of10 cases in Queensland, although typing methodsare difficult to compare between jurisdictions.6
Haemolytic uraemic syndrome
Infections with SLTEC/VTEC have the potential tocause severe and life-threatening illness, includinghaemolytic uraemic syndrome. Young children aremore at risk and HUS in children is typicallypost-diarrhoeal. E. coli O157:H7 infection in childrenaged less than five years progress to HUS in 10 to14 per cent of cases.37
There were only three cases of HUS notified to theNNDSS in 2001, which was markedly lower than the15 cases reported in 2000. There is evidence thatnotified cases of HUS represent only a smallproportion of all cases. In California only 44 per centof cases were reported to public health authorities.37
The Australia Paediatric Surveillance Unit recorded325 reports of HUS from paediatricians between July1994 and December 2000, in children aged less than15 years. Of these 137 were confirmed and 97 wereassociated with diarrhoea.38 In the same period, only83 cases were notified to the NNDSS. A survey ofAustralian hospitalisation data conducted byOzFoodNet has shown 90 separations for HUS inthe 1998–99 financial year and 47 in the 1999–00financial year. By contrast, for the same periodsthere were 21 and 16 notifications of HUS to NNDSS,respectively.6 Ongoing studies are needed to addressthe differences seen between the datasets andnotification mechanisms in the states and territories.
Typhoid
Typhoid infections in Australia are usually associatedwith overseas travel. In 2001, there were 84notifications of typhoid to the NNDSS. This representsa 43 per cent increase on the 60 cases reported in2000. Of the 84 cases, the highest notification rateswere in the 20–24 year age group (1.2 cases per100,000 population) and there was a male to femaleratio of 1:1. Rates according to age group and sexare shown in Figure 24.
The National Enteric Pathogen Surveillance Schemeidentified 69 isolates of S. Typhi in 2001. Fifty-twoisolates were from Australian residents, nine fromrefugees in detention centres and eight fromoverseas visitors. The percentage known to beacquired overseas was 84 per cent (58/69). Therewas a single case of typhoid acquired within Australia,which was a laboratory-acquired infection.26
Quarantinable diseases
In Australia in 2001, the human diseases which werecovered by the Quarantine Act 1908 were cholera,plague, rabies, yellow fever, and four viral haemorrhagicfevers (Ebola, Marburg, Lassa and Crimean-Congo).These infections are of international public healthsignificance, with mandatory reporting to the WHO.All states and territories notify quarantinable diseasesto the NNDSS.
Four cases of cholera were the only reports ofquarantinable disease notified in Australia in 2001.All cases were imported and occurred in two malesand two females in New South Wales, Queensland,South Australia and Victoria. The organism wasidentified in one case as V. cholerae 01 — El TorInaba, imported from Hong Kong; another asV. cholerae 01, imported from Bali, Indonesia and athird as V. cholerae 01 — Ogawa, which also wasacquired in Bali. The occurrence of cholera in returningtravellers demonstrates the importance of consumingsafe food and drink in areas where cholera is knownto occur.
Two human cases of rabies, in which symptomsdeveloped in Australia, were the result of overseasexposure in 1987 and 1990.39 Although no cases ofrabies or yellow fever were reported in Australia in2001, worldwide these two diseases continue tocause fatalities and travellers should be aware ofmeasures they can take to prevent infection withthese viruses. Travellers intending to visit central
Annual report of the National Notifiable Diseases Surveillance System
38 CDI Vol 27, No 1 2003
Figure 24. Notification rates of typhoid,Australia, 2001, by age group andsex

Africa or central South America are encouraged toreceive the yellow fever vaccine from an approvedAustralian vaccination centre. Information onquarantinable diseases can be found on the DoHA’swebsite: (www.health.gov.au/pubhlth/strateg/quaranti/index.htm).
Sexually transmitted infections
Sexually transmitted infections (STIs) remain aprevalent public health problem in Australia, despiteefforts in prevention and education. In 2001,chlamydial infection, donovanosis, gonococcalinfection and syphilis were nationally reportable toNNDSS, while chancroid and lymphogranulomavenereum were removed from NNDSS reporting.During 2001, a total of 27,817 STI notifications werereceived by NNDSS, which accounted for 27 percent of all notifications.
A number of systems are involved in STI surveillancein Australia, including the NNDSS, the LaboratoryVirology and Serology Reporting Scheme (LabVISE)(for chlamydia and syphilis) and specialist laboratorynetworks such as the Australian GonococcalSurveillance Programme.40 The NCHECR has aninterest in STI surveillance, and have further analyseddata from the NNDSS and other reporting sources intheir annual surveillance report.41
The number of chlamydia and gonococcal infectionsreported in 2001 were the highest since 1991.Increases were also observed for donovanosis, whilethe number of syphilis notifications were at theirlowest level since reporting commenced. Increasesin some STIs may be due to higher rates of diagnosis,however, changes in surveillance methods may alsoaccount for some of the observed trends.
Chlamydial infection
The rate of chlamydial infections continued toincrease in 2001 (Figure 25). During the year, a totalof 20,026 notifications of chlamydial infection werereceived by NNDSS, an 18 per cent increase on the17,018 cases reported in 2000. The notification ratefor chlamydial infections in 2001 was 103 cases per100,000 population, an increase from 88 cases per100,000 population in 2000.
The increase in the number of chlamydial notificationsoccurred in all states and territories (Table 11). SouthAustralia recorded the largest increase in 2001, of37 per cent.
Notification rates vary widely between states andterritories. The rates were above the national averagein the Northern Territory (619.4 cases per 100,000population), Queensland (153.9 cases per 100,000population) and Western Australia (143.4 cases per100,000 population, Map 3).
Annual report of the National Notifiable Diseases Surveillance System
CDI Vol 27, No 1 2003 39
Table 11. Trends in notifications of chlamydial infection, 1994 to 2001, by state or territory
Year ACT NSW NT Qld SA Tas Vic WA Aust
1994 88 NN* 737 2,444 727 5 1,318 834 6,179
1995 80 NN 520 2,414 768 283 1,317 1,025 6,439
1996 110 NN 670 3,266 1,024 293 1,559 1,444 8,390
1997 142 NN 629 3,508 1,005 249 2,115 1,591 9,302
1998 194 NN 791 4,076 1,024 202 2,569 2,071 11,490
1999 177 2,461 863 4,476 973 254 2,939 1,903 14,046
2000 244 3,555 1,000 4,932 1,023 332 3,335 2,597 17,018
2001 301 4,389 1,239 5,596 1,402 380 3,924 2,733 19,964
Increase from 2000 (%) 23.4 23.5 23.9 13.5 37.0 14.5 17.7 5.2 17.3
* Not notifiable
Figure 25. Trends in notification rates ofchlamydial infection, Australia, 1994to 2001, by year of onset
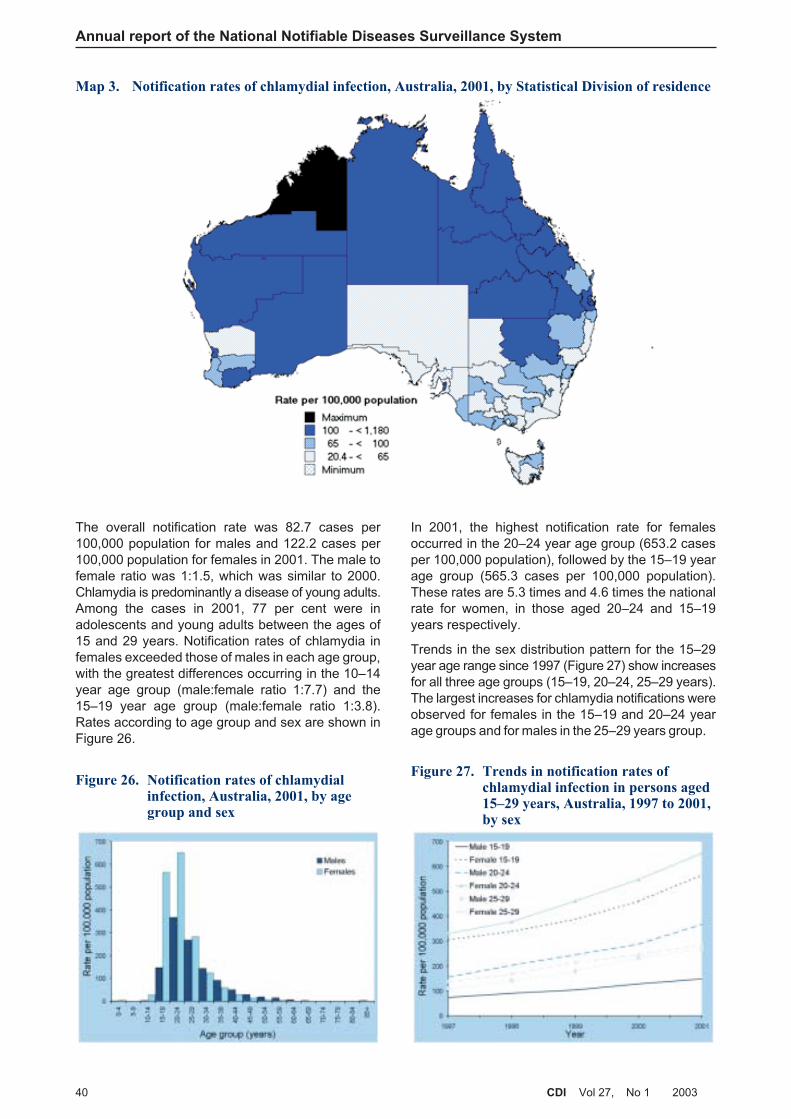
The overall notification rate was 82.7 cases per100,000 population for males and 122.2 cases per100,000 population for females in 2001. The male tofemale ratio was 1:1.5, which was similar to 2000.Chlamydia is predominantly a disease of young adults.Among the cases in 2001, 77 per cent were inadolescents and young adults between the ages of15 and 29 years. Notification rates of chlamydia infemales exceeded those of males in each age group,with the greatest differences occurring in the 10–14year age group (male:female ratio 1:7.7) and the15–19 year age group (male:female ratio 1:3.8).Rates according to age group and sex are shown inFigure 26.
In 2001, the highest notification rate for femalesoccurred in the 20–24 year age group (653.2 casesper 100,000 population), followed by the 15–19 yearage group (565.3 cases per 100,000 population).These rates are 5.3 times and 4.6 times the nationalrate for women, in those aged 20–24 and 15–19years respectively.
Trends in the sex distribution pattern for the 15–29year age range since 1997 (Figure 27) show increasesfor all three age groups (15–19, 20–24, 25–29 years).The largest increases for chlamydia notifications wereobserved for females in the 15–19 and 20–24 yearage groups and for males in the 25–29 years group.
Annual report of the National Notifiable Diseases Surveillance System
40 CDI Vol 27, No 1 2003
Map 3. Notification rates of chlamydial infection, Australia, 2001, by Statistical Division of residence
Figure 26. Notification rates of chlamydialinfection, Australia, 2001, by agegroup and sex
Figure 27. Trends in notification rates ofchlamydial infection in persons aged15–29 years, Australia, 1997 to 2001,by sex

There were 53 cases of chlamydia infection reportedin children aged less than 10 years. All of these werecases of chlamydial conjunctivitis. Notifications werefrom all states and territories except South Australiaand Tasmania.
Based on notifications from the Northern Territory,South Australia and Western Australia to NNDSS,the NCHECR have reported further details onchlamydial infection in Indigenous Australians. Forthese jurisdictions, Indigenous status was identifiedin 73 per cent of the notifications.41 In 2001, theestimated age standardised rate of chlamydial infectionamong Indigenous Australians was 880 cases per100,000 population, compared with the rate of 117cases per 100,000 population in non-IndigenousAustralians. Trends in notification rates of chlamydiain Indigenous and non-Indigenous Australiansbetween 1997 and 2001 are shown in Figure 28.
Chlamydial infection is caused by Chlamydia
trachomatis. The infection can be asymptomatic. Ithas been estimated that in about 80 per cent offemales and 40 per cent of males the infections areasymptomatic, and can easily remain undiagnosed.42 Itis difficult, therefore, to estimate the true burden ofchlamydial infection in Australia. The disease isusually transmitted by vaginal intercourse or duringoral or anal sex. Mother-to-child transmission canalso occur during birth and may result in conjunctivitisor pneumonia in the newborn.
There may be a number of reasons for the increasein the number of chlamydial cases over the pastdecade. The increase may reflect the effect of
chlamydia control campaigns that increase the rateof screening. The use of non-invasive tests (e.g.,testing of urine) and more sensitive assays forchlamydial infection may increase the number oftests undertaken and the number of positive results.Enhanced surveillance activities by health authoritiesand greater awareness of the disease by healthprofessionals may improve reporting.
If real, the continued increase in cases of chlamydiainfection over the past decade, particularly amongadolescents and young adults, is a cause for publichealth concern. Data on risk factors and evaluationsof preventative programs may help understanddisease transmission and deliver more comprehensiveand effective control programs. In 2001 theDepartment of Human Services, Victoria, launchedthe Chlamydia Strategy for Victoria, 2001 – 2004 toaddress the continuing increase in chlamydialinfections.43
Donovanosis
Donovanosis is a sexually transmissible infectioncaused by Calymmatobacterium granulomatis, agram-negative pleomorphic bacillus. It is characterisedby genital ulcerative lesions which may develop intoa chronic ulcerative disease if untreated. Lesionsmay be extensive and extragenital, and may beassociated with secondary bacterial infection. Themode of transmission of donovanosis is primarilythrough sexual contact, although it may also beacquired by a faecal route, or at birth by passagethrough an infected birth canal.44
Internationally, donovanosis is endemic in tropical andsub-tropical areas, particularly PNG, central America,southern Africa and southern India.16 In Australia,the disease is rare in the general population. It is,however, more common in Indigenous communitiesin rural and remote areas of northern Australia.45,46
Donovanosis was notifiable in all states andterritories except South Australia in 2001. Among thenotifiable STIs, donovanosis is the least commonlyreported. NNDSS received a total of 42 notificationsof donovanosis from the Northern Territory,Queensland and Western Australia in 2001, with arate of 0.2 cases per 100,000 population.
The number of donovanosis cases in 2001 was twicethat of 2000 (n=21). The increase of donovanosisnotifications may be the result of the donovanosiseradication program, which includes enhancedsurveillance in addition to the use of more sensitive andacceptable diagnostic assays, such as polymerasechain reaction.47,48 Ultimately though, it should leadto eradication. As part of the program, in 2001 aproject officer was employed in Western Australia, toraise awareness of donovanosis among health-careworkers and communities in rural and remote areasof the State.
Annual report of the National Notifiable Diseases Surveillance System
CDI Vol 27, No 1 2003 41
Figure 28. Trends in age-standardisednotification rates of chlamydialinfection, the Northern Territory,South Australia and WesternAustralia (combined), 1997 to 2001,by Indigenous status*
* Data for 2001 unfinalised
Source: NCHECR HIV/AIDS Annual surveillance report: 2001
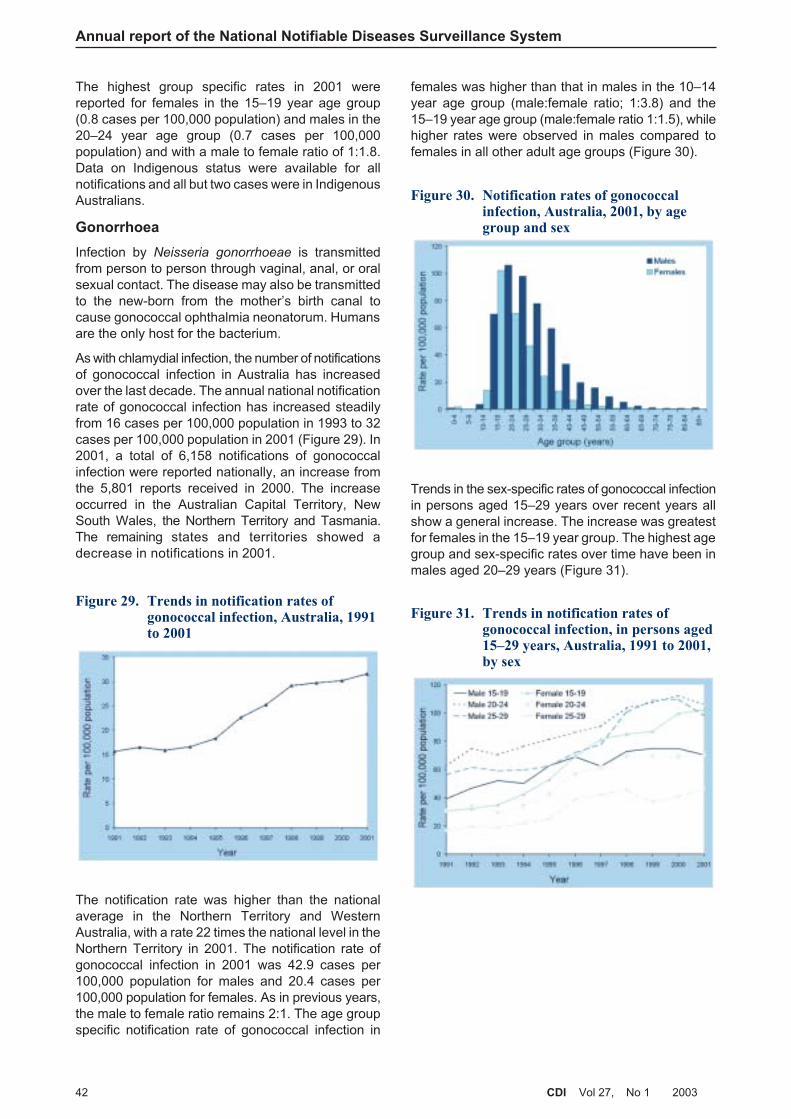
The highest group specific rates in 2001 werereported for females in the 15–19 year age group(0.8 cases per 100,000 population) and males in the20–24 year age group (0.7 cases per 100,000population) and with a male to female ratio of 1:1.8.Data on Indigenous status were available for allnotifications and all but two cases were in IndigenousAustralians.
Gonorrhoea
Infection by Neisseria gonorrhoeae is transmittedfrom person to person through vaginal, anal, or oralsexual contact. The disease may also be transmittedto the new-born from the mother’s birth canal tocause gonococcal ophthalmia neonatorum. Humansare the only host for the bacterium.
As with chlamydial infection, the number of notificationsof gonococcal infection in Australia has increasedover the last decade. The annual national notificationrate of gonococcal infection has increased steadilyfrom 16 cases per 100,000 population in 1993 to 32cases per 100,000 population in 2001 (Figure 29). In2001, a total of 6,158 notifications of gonococcalinfection were reported nationally, an increase fromthe 5,801 reports received in 2000. The increaseoccurred in the Australian Capital Territory, NewSouth Wales, the Northern Territory and Tasmania.The remaining states and territories showed adecrease in notifications in 2001.
The notification rate was higher than the nationalaverage in the Northern Territory and WesternAustralia, with a rate 22 times the national level in theNorthern Territory in 2001. The notification rate ofgonococcal infection in 2001 was 42.9 cases per100,000 population for males and 20.4 cases per100,000 population for females. As in previous years,the male to female ratio remains 2:1. The age groupspecific notification rate of gonococcal infection in
females was higher than that in males in the 10–14year age group (male:female ratio; 1:3.8) and the15–19 year age group (male:female ratio 1:1.5), whilehigher rates were observed in males compared tofemales in all other adult age groups (Figure 30).
Trends in the sex-specific rates of gonococcal infectionin persons aged 15–29 years over recent years allshow a general increase. The increase was greatestfor females in the 15–19 year group. The highest agegroup and sex-specific rates over time have been inmales aged 20–29 years (Figure 31).
Annual report of the National Notifiable Diseases Surveillance System
42 CDI Vol 27, No 1 2003
Figure 29. Trends in notification rates ofgonococcal infection, Australia, 1991to 2001
Figure 30. Notification rates of gonococcalinfection, Australia, 2001, by agegroup and sex
Figure 31. Trends in notification rates ofgonococcal infection, in persons aged15–29 years, Australia, 1991 to 2001,by sex
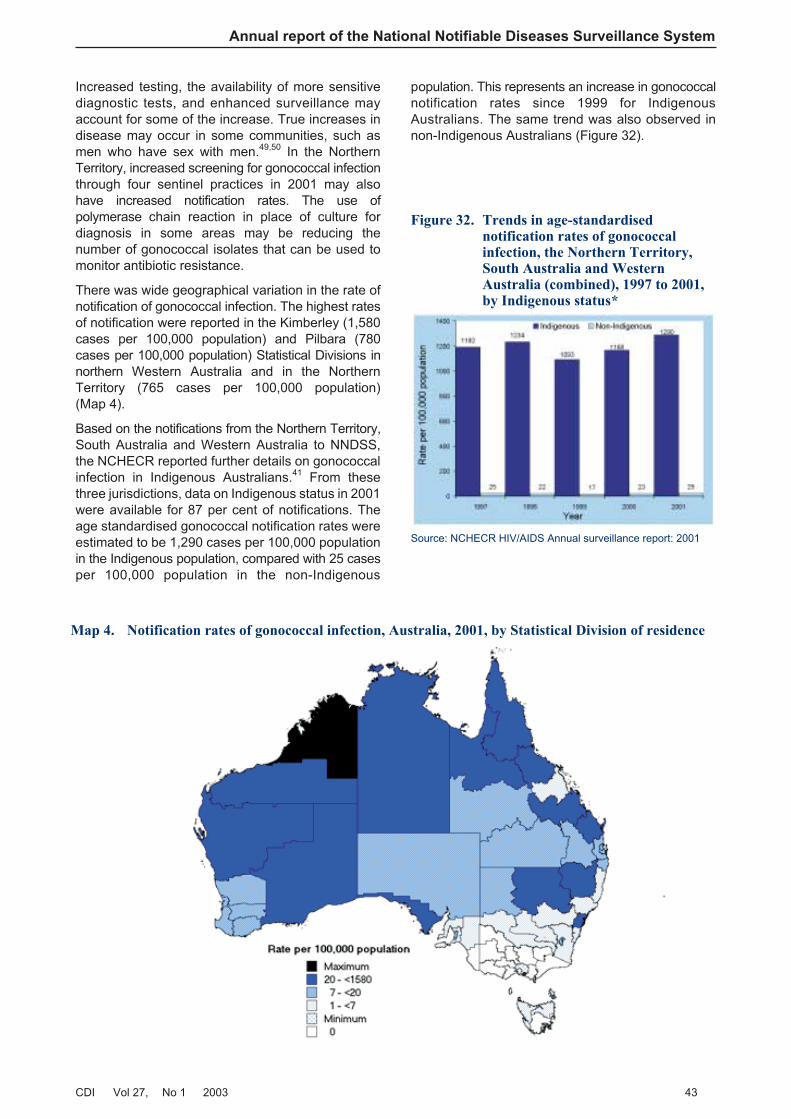
Increased testing, the availability of more sensitivediagnostic tests, and enhanced surveillance mayaccount for some of the increase. True increases indisease may occur in some communities, such asmen who have sex with men.49,50 In the NorthernTerritory, increased screening for gonococcal infectionthrough four sentinel practices in 2001 may alsohave increased notification rates. The use ofpolymerase chain reaction in place of culture fordiagnosis in some areas may be reducing thenumber of gonococcal isolates that can be used tomonitor antibiotic resistance.
There was wide geographical variation in the rate ofnotification of gonococcal infection. The highest ratesof notification were reported in the Kimberley (1,580cases per 100,000 population) and Pilbara (780cases per 100,000 population) Statistical Divisions innorthern Western Australia and in the NorthernTerritory (765 cases per 100,000 population)(Map 4).
Based on the notifications from the Northern Territory,South Australia and Western Australia to NNDSS,the NCHECR reported further details on gonococcalinfection in Indigenous Australians.41 From thesethree jurisdictions, data on Indigenous status in 2001were available for 87 per cent of notifications. Theage standardised gonococcal notification rates wereestimated to be 1,290 cases per 100,000 populationin the Indigenous population, compared with 25 casesper 100,000 population in the non-Indigenous
population. This represents an increase in gonococcalnotification rates since 1999 for IndigenousAustralians. The same trend was also observed innon-Indigenous Australians (Figure 32).
Annual report of the National Notifiable Diseases Surveillance System
CDI Vol 27, No 1 2003 43
Figure 32. Trends in age-standardisednotification rates of gonococcalinfection, the Northern Territory,South Australia and WesternAustralia (combined), 1997 to 2001,by Indigenous status*
Source: NCHECR HIV/AIDS Annual surveillance report: 2001
Map 4. Notification rates of gonococcal infection, Australia, 2001, by Statistical Division of residence
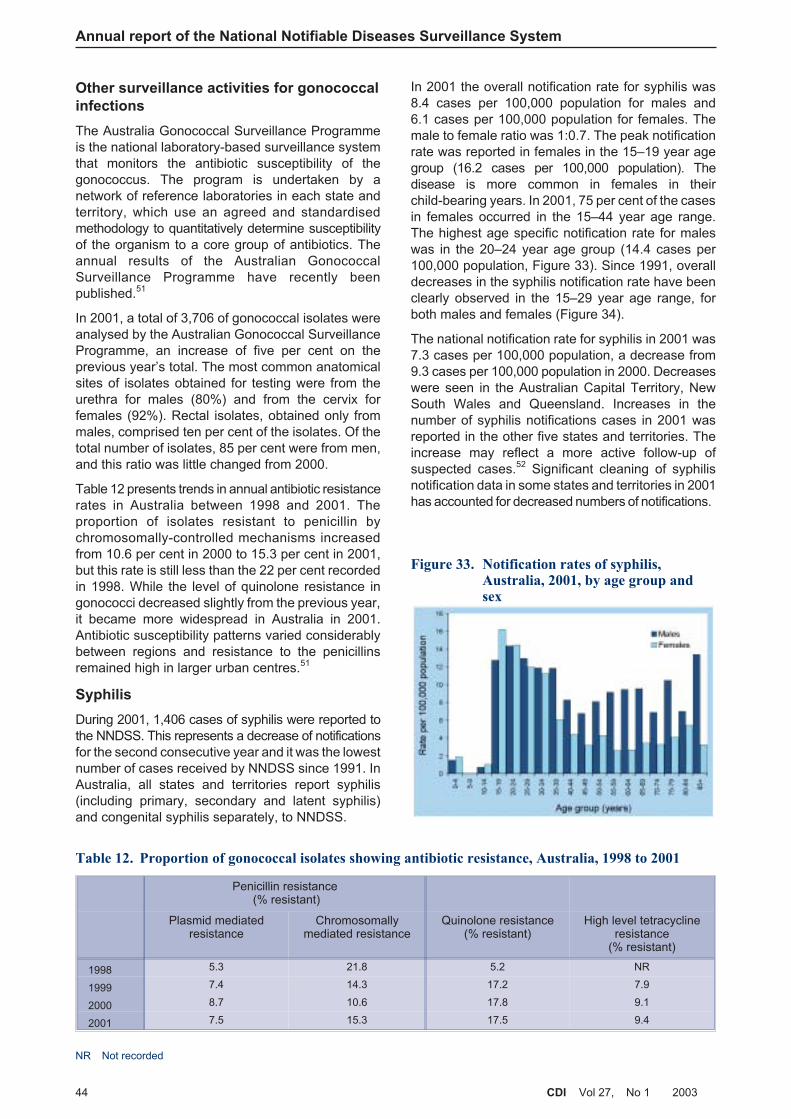
Other surveillance activities for gonococcal
infections
The Australia Gonococcal Surveillance Programmeis the national laboratory-based surveillance systemthat monitors the antibiotic susceptibility of thegonococcus. The program is undertaken by anetwork of reference laboratories in each state andterritory, which use an agreed and standardisedmethodology to quantitatively determine susceptibilityof the organism to a core group of antibiotics. Theannual results of the Australian GonococcalSurveillance Programme have recently beenpublished.51
In 2001, a total of 3,706 of gonococcal isolates wereanalysed by the Australian Gonococcal SurveillanceProgramme, an increase of five per cent on theprevious year’s total. The most common anatomicalsites of isolates obtained for testing were from theurethra for males (80%) and from the cervix forfemales (92%). Rectal isolates, obtained only frommales, comprised ten per cent of the isolates. Of thetotal number of isolates, 85 per cent were from men,and this ratio was little changed from 2000.
Table 12 presents trends in annual antibiotic resistancerates in Australia between 1998 and 2001. Theproportion of isolates resistant to penicillin bychromosomally-controlled mechanisms increasedfrom 10.6 per cent in 2000 to 15.3 per cent in 2001,but this rate is still less than the 22 per cent recordedin 1998. While the level of quinolone resistance ingonococci decreased slightly from the previous year,it became more widespread in Australia in 2001.Antibiotic susceptibility patterns varied considerablybetween regions and resistance to the penicillinsremained high in larger urban centres.51
Syphilis
During 2001, 1,406 cases of syphilis were reported tothe NNDSS. This represents a decrease of notificationsfor the second consecutive year and it was the lowestnumber of cases received by NNDSS since 1991. InAustralia, all states and territories report syphilis(including primary, secondary and latent syphilis)and congenital syphilis separately, to NNDSS.
In 2001 the overall notification rate for syphilis was8.4 cases per 100,000 population for males and6.1 cases per 100,000 population for females. Themale to female ratio was 1:0.7. The peak notificationrate was reported in females in the 15–19 year agegroup (16.2 cases per 100,000 population). Thedisease is more common in females in theirchild-bearing years. In 2001, 75 per cent of the casesin females occurred in the 15–44 year age range.The highest age specific notification rate for maleswas in the 20–24 year age group (14.4 cases per100,000 population, Figure 33). Since 1991, overalldecreases in the syphilis notification rate have beenclearly observed in the 15–29 year age range, forboth males and females (Figure 34).
The national notification rate for syphilis in 2001 was7.3 cases per 100,000 population, a decrease from9.3 cases per 100,000 population in 2000. Decreaseswere seen in the Australian Capital Territory, NewSouth Wales and Queensland. Increases in thenumber of syphilis notifications cases in 2001 wasreported in the other five states and territories. Theincrease may reflect a more active follow-up ofsuspected cases.52 Significant cleaning of syphilisnotification data in some states and territories in 2001has accounted for decreased numbers of notifications.
Annual report of the National Notifiable Diseases Surveillance System
44 CDI Vol 27, No 1 2003
Table 12. Proportion of gonococcal isolates showing antibiotic resistance, Australia, 1998 to 2001
Penicillin resistance(% resistant)
Plasmid mediatedresistance
Chromosomallymediated resistance
Quinolone resistance(% resistant)
High level tetracyclineresistance
(% resistant)
1998 5.3 21.8 5.2 NR
1999 7.4 14.3 17.2 7.9
2000 8.7 10.6 17.8 9.1
2001 7.5 15.3 17.5 9.4
NR Not recorded
Figure 33. Notification rates of syphilis,Australia, 2001, by age group andsex
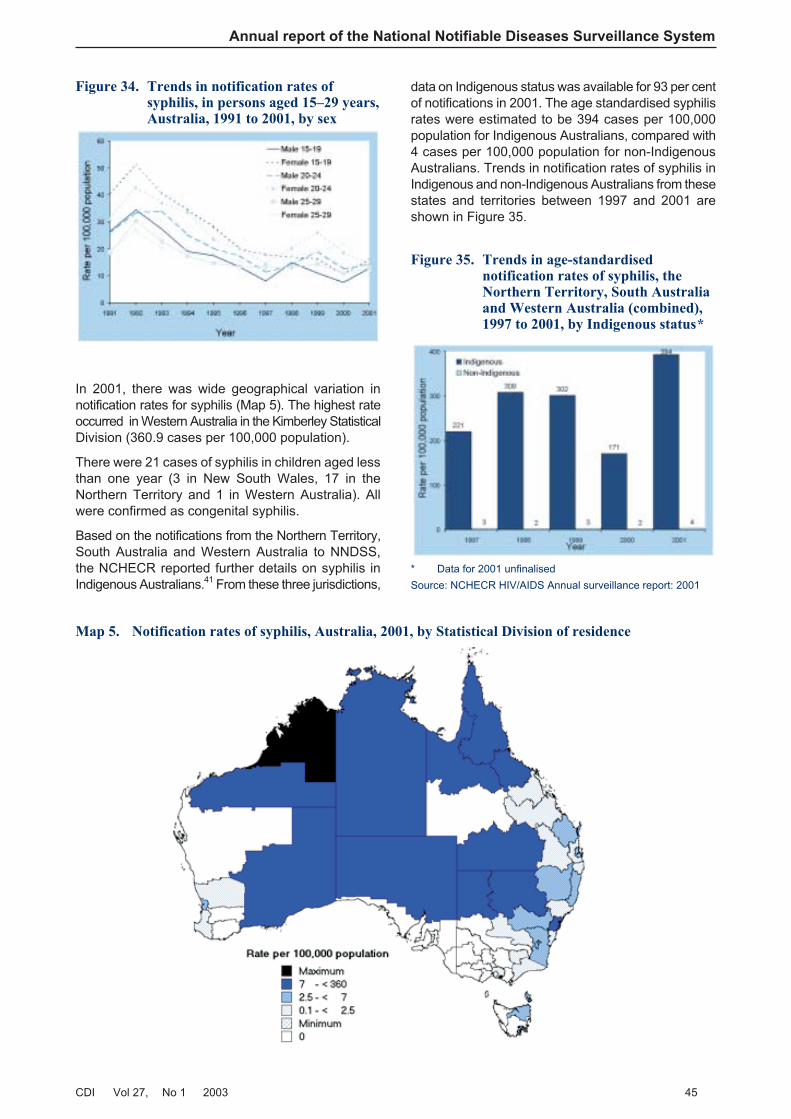
In 2001, there was wide geographical variation innotification rates for syphilis (Map 5). The highest rateoccurred in Western Australia in the Kimberley StatisticalDivision (360.9 cases per 100,000 population).
There were 21 cases of syphilis in children aged lessthan one year (3 in New South Wales, 17 in theNorthern Territory and 1 in Western Australia). Allwere confirmed as congenital syphilis.
Based on the notifications from the Northern Territory,South Australia and Western Australia to NNDSS,the NCHECR reported further details on syphilis inIndigenous Australians.41 From these three jurisdictions,
data on Indigenous status was available for 93 per centof notifications in 2001. The age standardised syphilisrates were estimated to be 394 cases per 100,000population for Indigenous Australians, compared with4 cases per 100,000 population for non-IndigenousAustralians. Trends in notification rates of syphilis inIndigenous and non-Indigenous Australians from thesestates and territories between 1997 and 2001 areshown in Figure 35.
Annual report of the National Notifiable Diseases Surveillance System
CDI Vol 27, No 1 2003 45
Map 5. Notification rates of syphilis, Australia, 2001, by Statistical Division of residence
Figure 34. Trends in notification rates ofsyphilis, in persons aged 15–29 years,Australia, 1991 to 2001, by sex
Figure 35. Trends in age-standardisednotification rates of syphilis, theNorthern Territory, South Australiaand Western Australia (combined),1997 to 2001, by Indigenous status*
* Data for 2001 unfinalised
Source: NCHECR HIV/AIDS Annual surveillance report: 2001

Vaccine preventable diseases
This section summarises the national notificationdata for laboratory-confirmed influenza and invasivepneumococcal disease as well as diseases targetedby the Australian Standard Vaccination Schedulein 2001. This includes diphtheria, Haemophilus
influenzae type b (Hib) infection, measles, mumps,pertussis, poliomyelitis, rubella and tetanus. TheNational Centre for Immunisation Research andSurveillance of Vaccine Preventable Diseases(NCIRS) have recently published a detailed analysisof vaccine preventable diseases in Australia for 1999to 2000.53
Laboratory-confirmed influenza and invasivepneumococcal disease (IPD), were added to the listof nationally notifiable diseases in 2001. Both thesediseases were made notifiable in all Australian statesand territories during 2001. Because of the need tochange public health legislation to include thesediseases, complete data for 2001 were not availablefrom all states and territories.
The rationale for the introduction of surveillance oflaboratory-confirmed influenza was to give betternational data on the annual incidence of influenza,the circulating viral subtypes and the effectiveness ofannual influenza vaccinations. In Australia, annualvaccination against influenza is provided free ofcharge to non-Indigenous Australians aged 65 yearsand above and to Indigenous Australians aged50 years and above. It is also recommended forindividuals who are at increased risk of influenza-related complications and those who may transmitinfluenza to persons at increased risk.54
There was only one change to the ChildhoodImmunisation Schedule in 2001 — a program forat-risk children using the seven-valent conjugatepneumococcal vaccine was recommended andpublicly funded (Table 13). The program wasintroduced with a focus on Indigenous children, whohave some of the highest incidences of invasivepneumococcal disease in the world.55 The conjugatevaccine has been demonstrated to have an efficacyof 94 per cent in preventing invasive pneumococcaldisease in young children.2
There were 13,030 notifications of vaccine preventablediseases in 2001; one in eight of the total notificationsto NNDSS. Pertussis was by far the most commonwith 9,515 notifications, or 73 per cent of all vaccinepreventable disease notifications.
Diphtheria
A single case of cutaneous diphtheria in a 52-year-oldman was reported from the Northern Territory inMarch 2001. A toxigenic strain of Corynebacterium
diphtheriae var. mitis was isolated. The patientacquired the disease in East Timor and had anuncertain vaccination history. This is the first casereported in Australia since 1993.
Haemophilus influenzae type b disease
Notifications of Hib disease have fallen more than30-fold since 1991, due to the efficacy of Hib conjugatevaccines (Figure 36). There were 26 notifications ofHib disease in 2001, a rate of 0.1 cases per 100,000population. This is eight per cent less than in 2000,and the lowest number of notifications recordedsince national surveillance began in 1991. Mostnotified cases (14, 53%) were aged less than fiveyears and five were infants aged less than one year.Rates according to age group and sex are shown inFigure 37. There were less notifications of Hibdisease for males than for females (male:femaleratio 0.7:1) in 2001.
Annual report of the National Notifiable Diseases Surveillance System
46 CDI Vol 27, No 1 2003
Table 13. Vaccination schedules for seven-valent conjugate pneumococcal vaccine in Australia
Date implemented July 2001
Serogroups in vaccine 4, 6B, 9V, 14, 18C, 19F, 23F
Target populations All Aboriginal and Torres Strait Islander infants in a 3-dose series at 2, 4 and 6 months ofage, with a booster dose of the 23-valent pneumococcal polysaccharide vaccine(23vPPV) at 18–24 months of age. Catch-up is recommended for Aboriginal children inCentral Australia up to the fifth birthday and for Aboriginal and Torres Strait Islanderchildren elsewhere up to the second birthday.
All Australian children with underlying predisposing medical conditions at 2, 4 and 6months of age with a booster dose (of 7vPCV) at 12 months of age and a booster doseof 23vPPV at 4–5 years of age. Catch-up vaccination is recommended for these childrenup to the fifth birthday.
Non-Indigenous children residing in Central Australia up to the second birthday, as catchup vaccination.
Data source Australian Immunisation Handbook, 8th edition
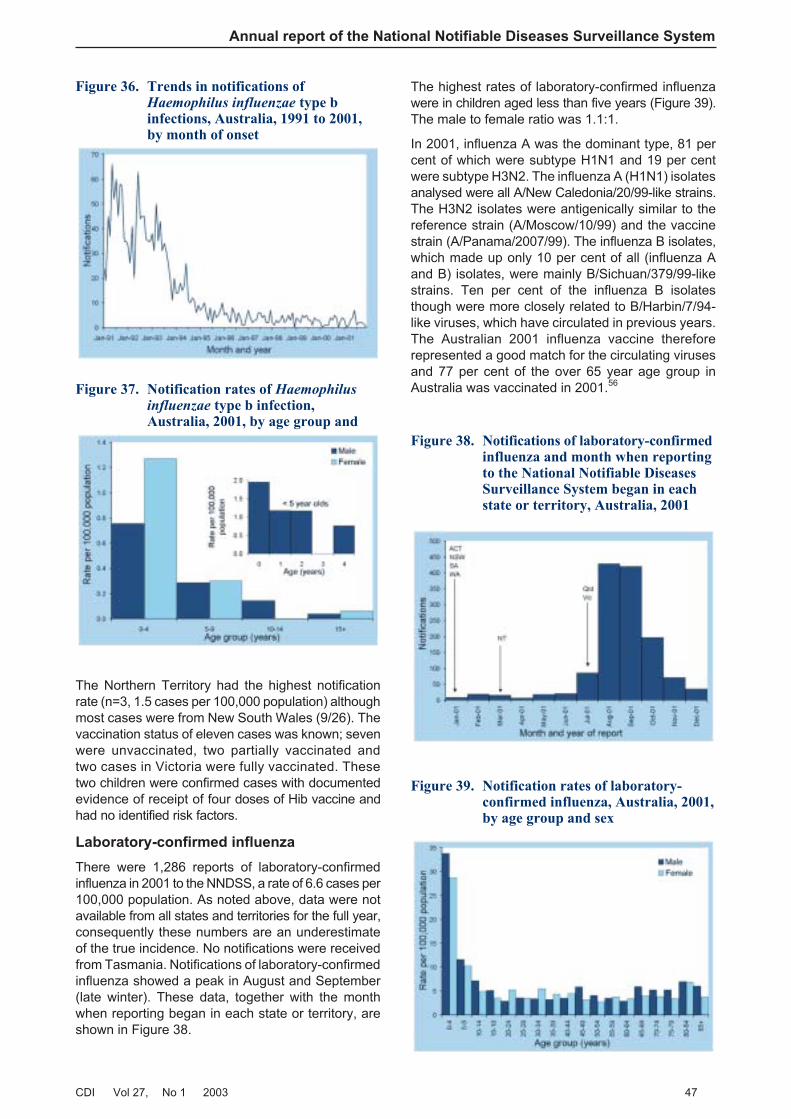
The Northern Territory had the highest notificationrate (n=3, 1.5 cases per 100,000 population) althoughmost cases were from New South Wales (9/26). Thevaccination status of eleven cases was known; sevenwere unvaccinated, two partially vaccinated andtwo cases in Victoria were fully vaccinated. Thesetwo children were confirmed cases with documentedevidence of receipt of four doses of Hib vaccine andhad no identified risk factors.
Laboratory-confirmed influenza
There were 1,286 reports of laboratory-confirmedinfluenza in 2001 to the NNDSS, a rate of 6.6 cases per100,000 population. As noted above, data were notavailable from all states and territories for the full year,consequently these numbers are an underestimateof the true incidence. No notifications were receivedfrom Tasmania. Notifications of laboratory-confirmedinfluenza showed a peak in August and September(late winter). These data, together with the monthwhen reporting began in each state or territory, areshown in Figure 38.
The highest rates of laboratory-confirmed influenzawere in children aged less than five years (Figure 39).The male to female ratio was 1.1:1.
In 2001, influenza A was the dominant type, 81 percent of which were subtype H1N1 and 19 per centwere subtype H3N2. The influenza A (H1N1) isolatesanalysed were all A/New Caledonia/20/99-like strains.The H3N2 isolates were antigenically similar to thereference strain (A/Moscow/10/99) and the vaccinestrain (A/Panama/2007/99). The influenza B isolates,which made up only 10 per cent of all (influenza Aand B) isolates, were mainly B/Sichuan/379/99-likestrains. Ten per cent of the influenza B isolatesthough were more closely related to B/Harbin/7/94-like viruses, which have circulated in previous years.The Australian 2001 influenza vaccine thereforerepresented a good match for the circulating virusesand 77 per cent of the over 65 year age group inAustralia was vaccinated in 2001.56
Annual report of the National Notifiable Diseases Surveillance System
CDI Vol 27, No 1 2003 47
Figure 36. Trends in notifications ofHaemophilus influenzae type binfections, Australia, 1991 to 2001,by month of onset
Figure 37. Notification rates of Haemophilusinfluenzae type b infection,Australia, 2001, by age group and
Figure 38. Notifications of laboratory-confirmedinfluenza and month when reportingto the National Notifiable DiseasesSurveillance System began in eachstate or territory, Australia, 2001
Figure 39. Notification rates of laboratory-confirmed influenza, Australia, 2001,by age group and sex
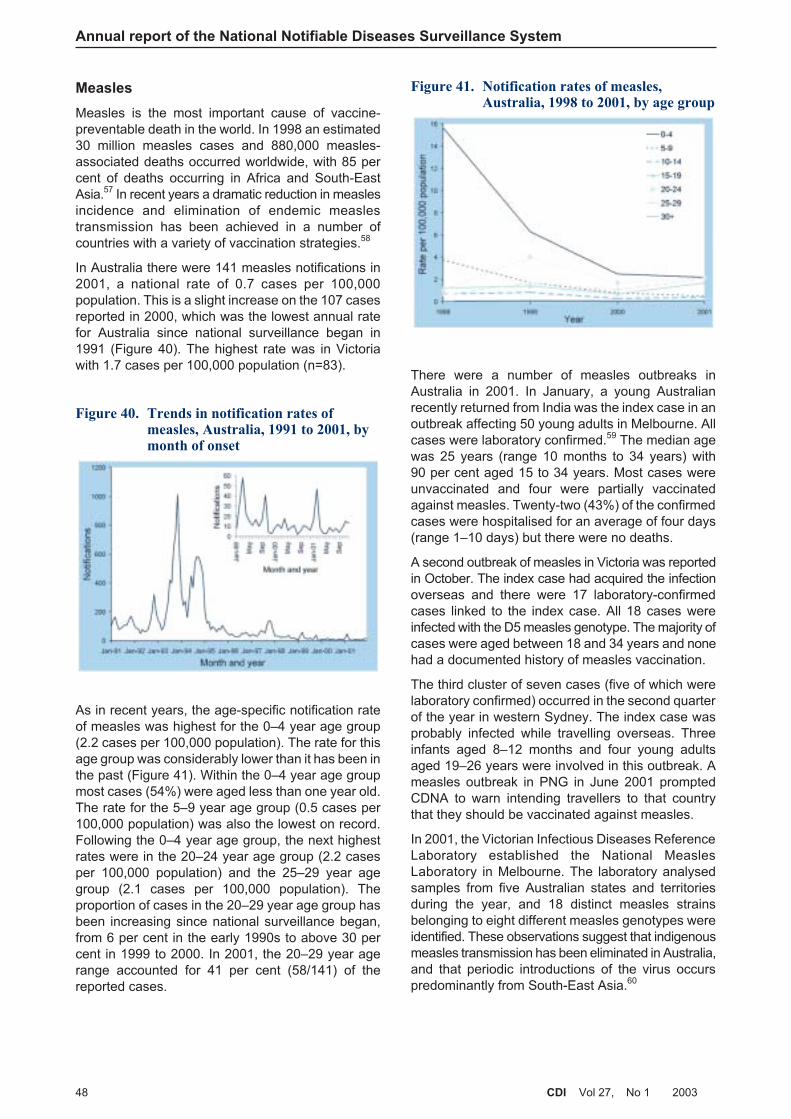
Measles
Measles is the most important cause of vaccine-preventable death in the world. In 1998 an estimated30 million measles cases and 880,000 measles-associated deaths occurred worldwide, with 85 percent of deaths occurring in Africa and South-EastAsia.57 In recent years a dramatic reduction in measlesincidence and elimination of endemic measlestransmission has been achieved in a number ofcountries with a variety of vaccination strategies.58
In Australia there were 141 measles notifications in2001, a national rate of 0.7 cases per 100,000population. This is a slight increase on the 107 casesreported in 2000, which was the lowest annual ratefor Australia since national surveillance began in1991 (Figure 40). The highest rate was in Victoriawith 1.7 cases per 100,000 population (n=83).
As in recent years, the age-specific notification rateof measles was highest for the 0–4 year age group(2.2 cases per 100,000 population). The rate for thisage group was considerably lower than it has been inthe past (Figure 41). Within the 0–4 year age groupmost cases (54%) were aged less than one year old.The rate for the 5–9 year age group (0.5 cases per100,000 population) was also the lowest on record.Following the 0–4 year age group, the next highestrates were in the 20–24 year age group (2.2 casesper 100,000 population) and the 25–29 year agegroup (2.1 cases per 100,000 population). Theproportion of cases in the 20–29 year age group hasbeen increasing since national surveillance began,from 6 per cent in the early 1990s to above 30 percent in 1999 to 2000. In 2001, the 20–29 year agerange accounted for 41 per cent (58/141) of thereported cases.
There were a number of measles outbreaks inAustralia in 2001. In January, a young Australianrecently returned from India was the index case in anoutbreak affecting 50 young adults in Melbourne. Allcases were laboratory confirmed.59 The median agewas 25 years (range 10 months to 34 years) with90 per cent aged 15 to 34 years. Most cases wereunvaccinated and four were partially vaccinatedagainst measles. Twenty-two (43%) of the confirmedcases were hospitalised for an average of four days(range 1–10 days) but there were no deaths.
A second outbreak of measles in Victoria was reportedin October. The index case had acquired the infectionoverseas and there were 17 laboratory-confirmedcases linked to the index case. All 18 cases wereinfected with the D5 measles genotype. The majority ofcases were aged between 18 and 34 years and nonehad a documented history of measles vaccination.
The third cluster of seven cases (five of which werelaboratory confirmed) occurred in the second quarterof the year in western Sydney. The index case wasprobably infected while travelling overseas. Threeinfants aged 8–12 months and four young adultsaged 19–26 years were involved in this outbreak. Ameasles outbreak in PNG in June 2001 promptedCDNA to warn intending travellers to that countrythat they should be vaccinated against measles.
In 2001, the Victorian Infectious Diseases ReferenceLaboratory established the National MeaslesLaboratory in Melbourne. The laboratory analysedsamples from five Australian states and territoriesduring the year, and 18 distinct measles strainsbelonging to eight different measles genotypes wereidentified. These observations suggest that indigenousmeasles transmission has been eliminated in Australia,and that periodic introductions of the virus occurspredominantly from South-East Asia.60
Annual report of the National Notifiable Diseases Surveillance System
48 CDI Vol 27, No 1 2003
Figure 40. Trends in notification rates ofmeasles, Australia, 1991 to 2001, bymonth of onset
Figure 41. Notification rates of measles,Australia, 1998 to 2001, by age group
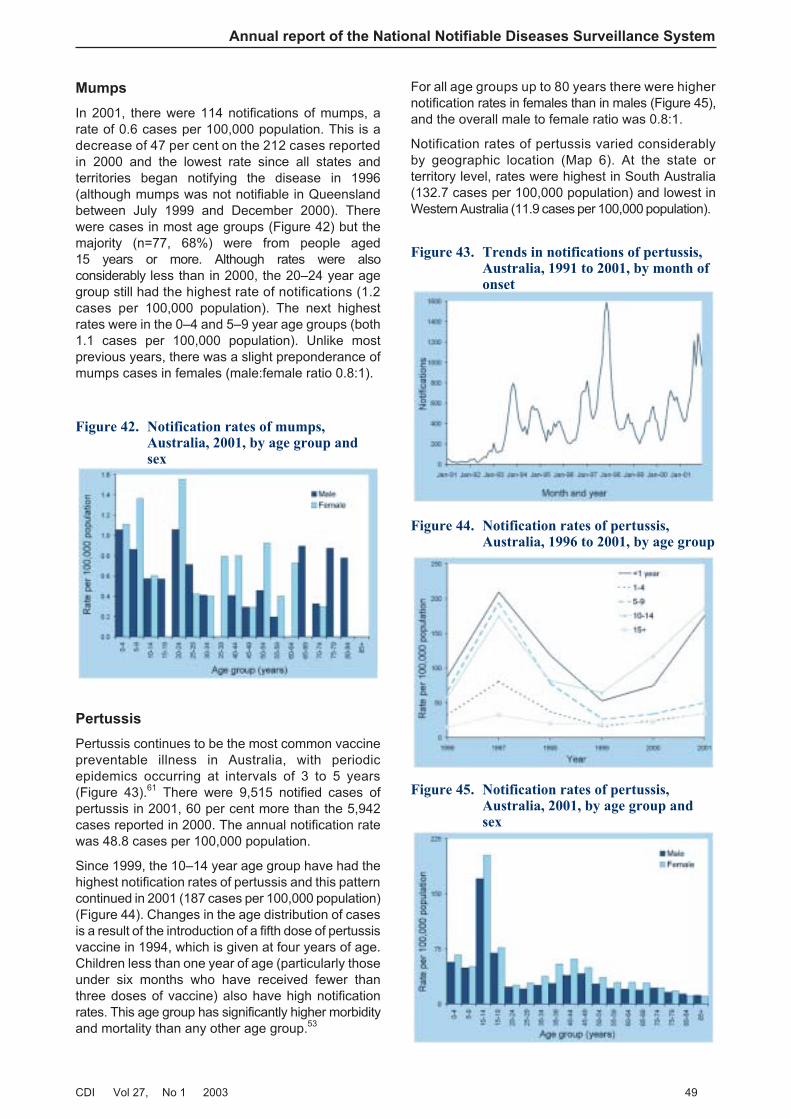
Mumps
In 2001, there were 114 notifications of mumps, arate of 0.6 cases per 100,000 population. This is adecrease of 47 per cent on the 212 cases reportedin 2000 and the lowest rate since all states andterritories began notifying the disease in 1996(although mumps was not notifiable in Queenslandbetween July 1999 and December 2000). Therewere cases in most age groups (Figure 42) but themajority (n=77, 68%) were from people aged15 years or more. Although rates were alsoconsiderably less than in 2000, the 20–24 year agegroup still had the highest rate of notifications (1.2cases per 100,000 population). The next highestrates were in the 0–4 and 5–9 year age groups (both1.1 cases per 100,000 population). Unlike mostprevious years, there was a slight preponderance ofmumps cases in females (male:female ratio 0.8:1).
Pertussis
Pertussis continues to be the most common vaccinepreventable illness in Australia, with periodicepidemics occurring at intervals of 3 to 5 years(Figure 43).61 There were 9,515 notified cases ofpertussis in 2001, 60 per cent more than the 5,942cases reported in 2000. The annual notification ratewas 48.8 cases per 100,000 population.
Since 1999, the 10–14 year age group have had thehighest notification rates of pertussis and this patterncontinued in 2001 (187 cases per 100,000 population)(Figure 44). Changes in the age distribution of casesis a result of the introduction of a fifth dose of pertussisvaccine in 1994, which is given at four years of age.Children less than one year of age (particularly thoseunder six months who have received fewer thanthree doses of vaccine) also have high notificationrates. This age group has significantly higher morbidityand mortality than any other age group.53
For all age groups up to 80 years there were highernotification rates in females than in males (Figure 45),and the overall male to female ratio was 0.8:1.
Notification rates of pertussis varied considerablyby geographic location (Map 6). At the state orterritory level, rates were highest in South Australia(132.7 cases per 100,000 population) and lowest inWestern Australia (11.9 cases per 100,000 population).
Annual report of the National Notifiable Diseases Surveillance System
CDI Vol 27, No 1 2003 49
Figure 42. Notification rates of mumps,Australia, 2001, by age group andsex
Figure 43. Trends in notifications of pertussis,Australia, 1991 to 2001, by month ofonset
Figure 44. Notification rates of pertussis,Australia, 1996 to 2001, by age group
Figure 45. Notification rates of pertussis,Australia, 2001, by age group andsex
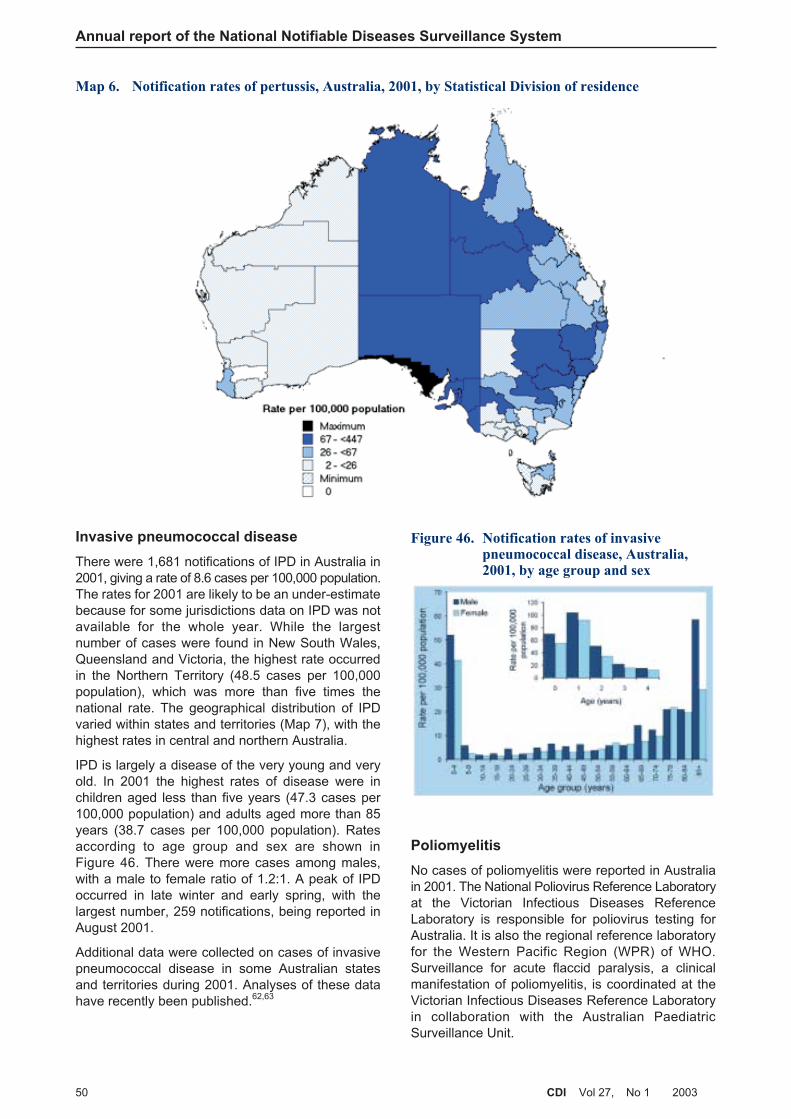
Invasive pneumococcal disease
There were 1,681 notifications of IPD in Australia in2001, giving a rate of 8.6 cases per 100,000 population.The rates for 2001 are likely to be an under-estimatebecause for some jurisdictions data on IPD was notavailable for the whole year. While the largestnumber of cases were found in New South Wales,Queensland and Victoria, the highest rate occurredin the Northern Territory (48.5 cases per 100,000population), which was more than five times thenational rate. The geographical distribution of IPDvaried within states and territories (Map 7), with thehighest rates in central and northern Australia.
IPD is largely a disease of the very young and veryold. In 2001 the highest rates of disease were inchildren aged less than five years (47.3 cases per100,000 population) and adults aged more than 85years (38.7 cases per 100,000 population). Ratesaccording to age group and sex are shown inFigure 46. There were more cases among males,with a male to female ratio of 1.2:1. A peak of IPDoccurred in late winter and early spring, with thelargest number, 259 notifications, being reported inAugust 2001.
Additional data were collected on cases of invasivepneumococcal disease in some Australian statesand territories during 2001. Analyses of these datahave recently been published.62,63
Poliomyelitis
No cases of poliomyelitis were reported in Australiain 2001. The National Poliovirus Reference Laboratoryat the Victorian Infectious Diseases ReferenceLaboratory is responsible for poliovirus testing forAustralia. It is also the regional reference laboratoryfor the Western Pacific Region (WPR) of WHO.Surveillance for acute flaccid paralysis, a clinicalmanifestation of poliomyelitis, is coordinated at theVictorian Infectious Diseases Reference Laboratoryin collaboration with the Australian PaediatricSurveillance Unit.
Annual report of the National Notifiable Diseases Surveillance System
50 CDI Vol 27, No 1 2003
Figure 46. Notification rates of invasivepneumococcal disease, Australia,2001, by age group and sex
Map 6. Notification rates of pertussis, Australia, 2001, by Statistical Division of residence
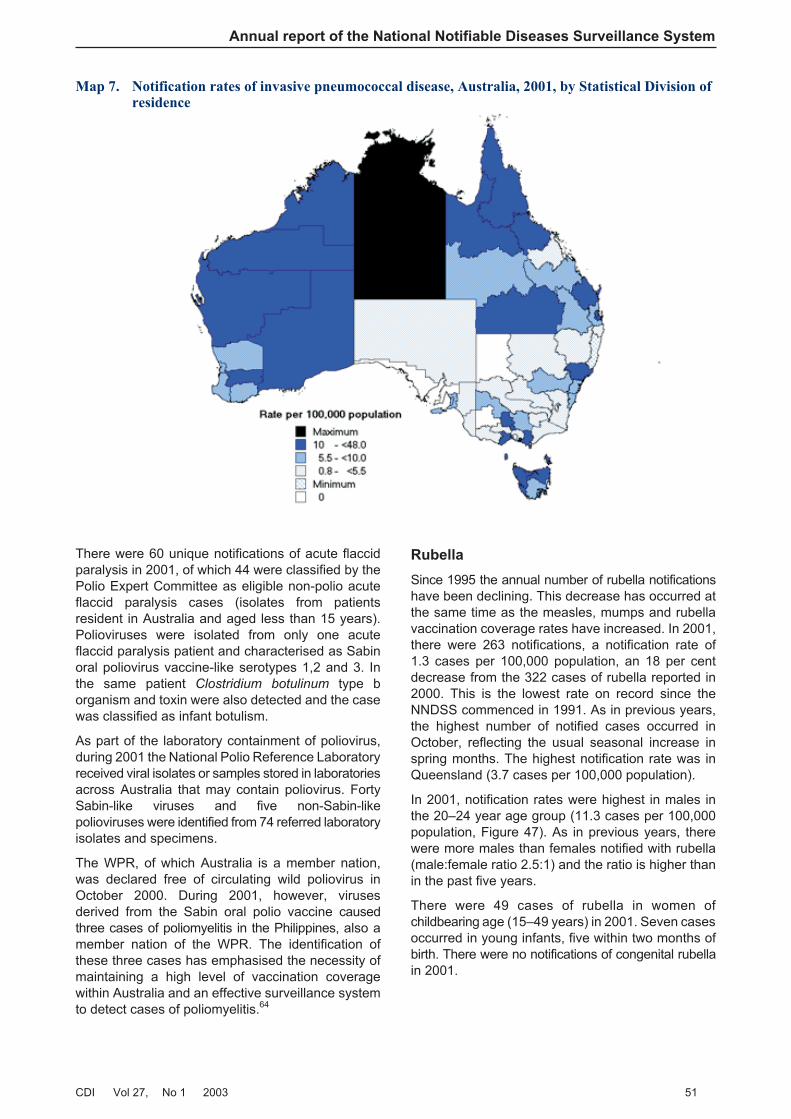
There were 60 unique notifications of acute flaccidparalysis in 2001, of which 44 were classified by thePolio Expert Committee as eligible non-polio acuteflaccid paralysis cases (isolates from patientsresident in Australia and aged less than 15 years).Polioviruses were isolated from only one acuteflaccid paralysis patient and characterised as Sabinoral poliovirus vaccine-like serotypes 1,2 and 3. Inthe same patient Clostridium botulinum type borganism and toxin were also detected and the casewas classified as infant botulism.
As part of the laboratory containment of poliovirus,during 2001 the National Polio Reference Laboratoryreceived viral isolates or samples stored in laboratoriesacross Australia that may contain poliovirus. FortySabin-like viruses and five non-Sabin-likepolioviruses were identified from 74 referred laboratoryisolates and specimens.
The WPR, of which Australia is a member nation,was declared free of circulating wild poliovirus inOctober 2000. During 2001, however, virusesderived from the Sabin oral polio vaccine causedthree cases of poliomyelitis in the Philippines, also amember nation of the WPR. The identification ofthese three cases has emphasised the necessity ofmaintaining a high level of vaccination coveragewithin Australia and an effective surveillance systemto detect cases of poliomyelitis.64
Rubella
Since 1995 the annual number of rubella notificationshave been declining. This decrease has occurred atthe same time as the measles, mumps and rubellavaccination coverage rates have increased. In 2001,there were 263 notifications, a notification rate of1.3 cases per 100,000 population, an 18 per centdecrease from the 322 cases of rubella reported in2000. This is the lowest rate on record since theNNDSS commenced in 1991. As in previous years,the highest number of notified cases occurred inOctober, reflecting the usual seasonal increase inspring months. The highest notification rate was inQueensland (3.7 cases per 100,000 population).
In 2001, notification rates were highest in males inthe 20–24 year age group (11.3 cases per 100,000population, Figure 47). As in previous years, therewere more males than females notified with rubella(male:female ratio 2.5:1) and the ratio is higher thanin the past five years.
There were 49 cases of rubella in women ofchildbearing age (15–49 years) in 2001. Seven casesoccurred in young infants, five within two months ofbirth. There were no notifications of congenital rubellain 2001.
Annual report of the National Notifiable Diseases Surveillance System
CDI Vol 27, No 1 2003 51
Map 7. Notification rates of invasive pneumococcal disease, Australia, 2001, by Statistical Division ofresidence

Tetanus
There have been less than eight cases of tetanusnotified each year in Australia since 1995 mainly inadults aged over 70 years. In 2001, there were threecases. Two were aged 70 years or more and the thirdwas also an adult. Two cases were male and onecases was female.
Childhood vaccination coverage reports
Estimates of vaccination coverage both overall andfor individual vaccines for children at 12 months ofage continued to improve in 2001. This trend wasalso evident in each state and territory. Vaccinationcoverage at one year of age is shown in Table 14.
Vaccination coverage at two years of age was firstreported in 1998. Coverage estimates for vaccinesrecommended at 12 and 18 months of age werehigher in 2001, compared with the previous year, aswere the estimates for being ‘fully vaccinated’ at twoyears of age. Vaccination coverage at two years ofage is shown in Table 15. The reported ‘fullyvaccinated’ coverage levels are lower than the levelsfor individual vaccines, because children who havemissed vaccination against some diseases are notnecessarily those who have missed vaccinationagainst the other diseases. It is important to note thatin other countries such as the United Kingdom, threedoses of the diphtheria-tetanus-pertussis and Hibvaccines constitute full vaccination for these vaccinesat two years of age.
Annual report of the National Notifiable Diseases Surveillance System
52 CDI Vol 27, No 1 2003
Figure 47. Notification rates of rubella,Australia, 2001, by age group andsex
Table 14. Percentage of Australian children born in 2000 vaccinated according to data available onthe Australian Childhood Immunisation Register. Estimate at one year of age
Per cent vaccinated
Vaccine group 1 Jan–31 Mar 2000 1 Apr–30 Jun 2000 1 Jul–30 Sep 2000 1 Oct–31 Dec 2000
DTP 91.8 91.9 92.2 92.0
OPV 91.7 91.8 92.1 91.9
Hib 94.8 94.5 94.3 94.5
Hepatitis B NA NA 94.3 94.4
Fully vaccinated 91.5 91.2 90.4 90.5
DTP Diphtheria-tetanus-pertussis
OPV Oral polio vaccine
NA Not available
Table 15. Percentage of Australian children born in 1999 vaccinated according to data available onthe Australian Childhood Immunisation Register. Estimate at two years of age
Per cent vaccinated
Vaccine group 1 Jan–31 Mar 1999 1 Apr–30 Jun 1999 1 Jul–30 Sep 1999 1 Oct–31 Dec 1999
DTP 89.5 89.8 90.3 90.2
OPV 93.9 93.9 94.3 94.4
Hib 95.0 95.2 95.3 95.4
MMR 92.8 93.1 93.2 93.4
Fully vaccinated 86.6 87.0 88.0 87.8
DTP Diphtheria-tetanus-pertussis
OPV Oral polio vaccine
MMR Measles-mumps-rubella
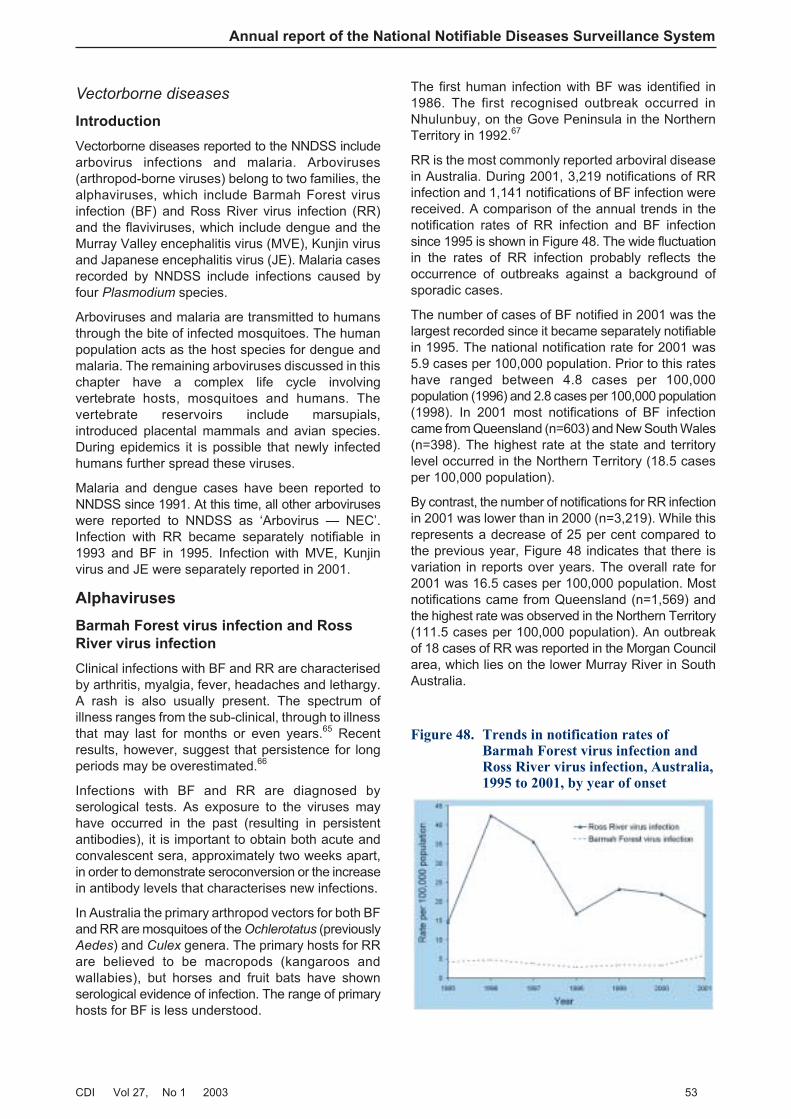
Vectorborne diseases
Introduction
Vectorborne diseases reported to the NNDSS includearbovirus infections and malaria. Arboviruses(arthropod-borne viruses) belong to two families, thealphaviruses, which include Barmah Forest virusinfection (BF) and Ross River virus infection (RR)and the flaviviruses, which include dengue and theMurray Valley encephalitis virus (MVE), Kunjin virusand Japanese encephalitis virus (JE). Malaria casesrecorded by NNDSS include infections caused byfour Plasmodium species.
Arboviruses and malaria are transmitted to humansthrough the bite of infected mosquitoes. The humanpopulation acts as the host species for dengue andmalaria. The remaining arboviruses discussed in thischapter have a complex life cycle involvingvertebrate hosts, mosquitoes and humans. Thevertebrate reservoirs include marsupials,introduced placental mammals and avian species.During epidemics it is possible that newly infectedhumans further spread these viruses.
Malaria and dengue cases have been reported toNNDSS since 1991. At this time, all other arboviruseswere reported to NNDSS as ‘Arbovirus — NEC’.Infection with RR became separately notifiable in1993 and BF in 1995. Infection with MVE, Kunjinvirus and JE were separately reported in 2001.
Alphaviruses
Barmah Forest virus infection and Ross
River virus infection
Clinical infections with BF and RR are characterisedby arthritis, myalgia, fever, headaches and lethargy.A rash is also usually present. The spectrum ofillness ranges from the sub-clinical, through to illnessthat may last for months or even years.65 Recentresults, however, suggest that persistence for longperiods may be overestimated.66
Infections with BF and RR are diagnosed byserological tests. As exposure to the viruses mayhave occurred in the past (resulting in persistentantibodies), it is important to obtain both acute andconvalescent sera, approximately two weeks apart,in order to demonstrate seroconversion or the increasein antibody levels that characterises new infections.
In Australia the primary arthropod vectors for both BFand RR are mosquitoes of the Ochlerotatus (previouslyAedes) and Culex genera. The primary hosts for RRare believed to be macropods (kangaroos andwallabies), but horses and fruit bats have shownserological evidence of infection. The range of primaryhosts for BF is less understood.
The first human infection with BF was identified in1986. The first recognised outbreak occurred inNhulunbuy, on the Gove Peninsula in the NorthernTerritory in 1992.67
RR is the most commonly reported arboviral diseasein Australia. During 2001, 3,219 notifications of RRinfection and 1,141 notifications of BF infection werereceived. A comparison of the annual trends in thenotification rates of RR infection and BF infectionsince 1995 is shown in Figure 48. The wide fluctuationin the rates of RR infection probably reflects theoccurrence of outbreaks against a background ofsporadic cases.
The number of cases of BF notified in 2001 was thelargest recorded since it became separately notifiablein 1995. The national notification rate for 2001 was5.9 cases per 100,000 population. Prior to this rateshave ranged between 4.8 cases per 100,000population (1996) and 2.8 cases per 100,000 population(1998). In 2001 most notifications of BF infectioncame from Queensland (n=603) and New South Wales(n=398). The highest rate at the state and territorylevel occurred in the Northern Territory (18.5 casesper 100,000 population).
By contrast, the number of notifications for RR infectionin 2001 was lower than in 2000 (n=3,219). While thisrepresents a decrease of 25 per cent compared tothe previous year, Figure 48 indicates that there isvariation in reports over years. The overall rate for2001 was 16.5 cases per 100,000 population. Mostnotifications came from Queensland (n=1,569) andthe highest rate was observed in the Northern Territory(111.5 cases per 100,000 population). An outbreakof 18 cases of RR was reported in the Morgan Councilarea, which lies on the lower Murray River in SouthAustralia.
Annual report of the National Notifiable Diseases Surveillance System
CDI Vol 27, No 1 2003 53
Figure 48. Trends in notification rates ofBarmah Forest virus infection andRoss River virus infection, Australia,1995 to 2001, by year of onset
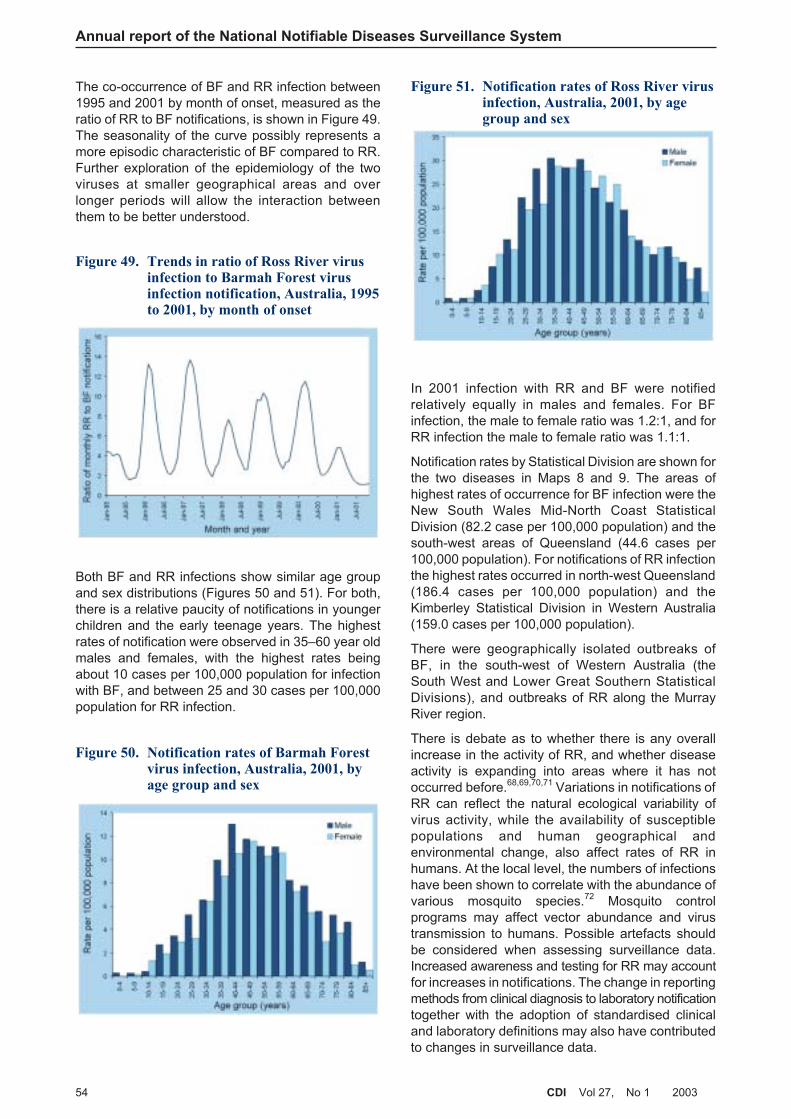
Annual report of the National Notifiable Diseases Surveillance System
54 CDI Vol 27, No 1 2003
The co-occurrence of BF and RR infection between1995 and 2001 by month of onset, measured as theratio of RR to BF notifications, is shown in Figure 49.The seasonality of the curve possibly represents amore episodic characteristic of BF compared to RR.Further exploration of the epidemiology of the twoviruses at smaller geographical areas and overlonger periods will allow the interaction betweenthem to be better understood.
Both BF and RR infections show similar age groupand sex distributions (Figures 50 and 51). For both,there is a relative paucity of notifications in youngerchildren and the early teenage years. The highestrates of notification were observed in 35–60 year oldmales and females, with the highest rates beingabout 10 cases per 100,000 population for infectionwith BF, and between 25 and 30 cases per 100,000population for RR infection.
In 2001 infection with RR and BF were notifiedrelatively equally in males and females. For BFinfection, the male to female ratio was 1.2:1, and forRR infection the male to female ratio was 1.1:1.
Notification rates by Statistical Division are shown forthe two diseases in Maps 8 and 9. The areas ofhighest rates of occurrence for BF infection were theNew South Wales Mid-North Coast StatisticalDivision (82.2 case per 100,000 population) and thesouth-west areas of Queensland (44.6 cases per100,000 population). For notifications of RR infectionthe highest rates occurred in north-west Queensland(186.4 cases per 100,000 population) and theKimberley Statistical Division in Western Australia(159.0 cases per 100,000 population).
There were geographically isolated outbreaks ofBF, in the south-west of Western Australia (theSouth West and Lower Great Southern StatisticalDivisions), and outbreaks of RR along the MurrayRiver region.
There is debate as to whether there is any overallincrease in the activity of RR, and whether diseaseactivity is expanding into areas where it has notoccurred before.68,69,70,71 Variations in notifications ofRR can reflect the natural ecological variability ofvirus activity, while the availability of susceptiblepopulations and human geographical andenvironmental change, also affect rates of RR inhumans. At the local level, the numbers of infectionshave been shown to correlate with the abundance ofvarious mosquito species.72 Mosquito controlprograms may affect vector abundance and virustransmission to humans. Possible artefacts shouldbe considered when assessing surveillance data.Increased awareness and testing for RR may accountfor increases in notifications. The change in reportingmethods from clinical diagnosis to laboratory notificationtogether with the adoption of standardised clinicaland laboratory definitions may also have contributedto changes in surveillance data.
Figure 49. Trends in ratio of Ross River virusinfection to Barmah Forest virusinfection notification, Australia, 1995to 2001, by month of onset
Figure 50. Notification rates of Barmah Forestvirus infection, Australia, 2001, byage group and sex
Figure 51. Notification rates of Ross River virusinfection, Australia, 2001, by agegroup and sex
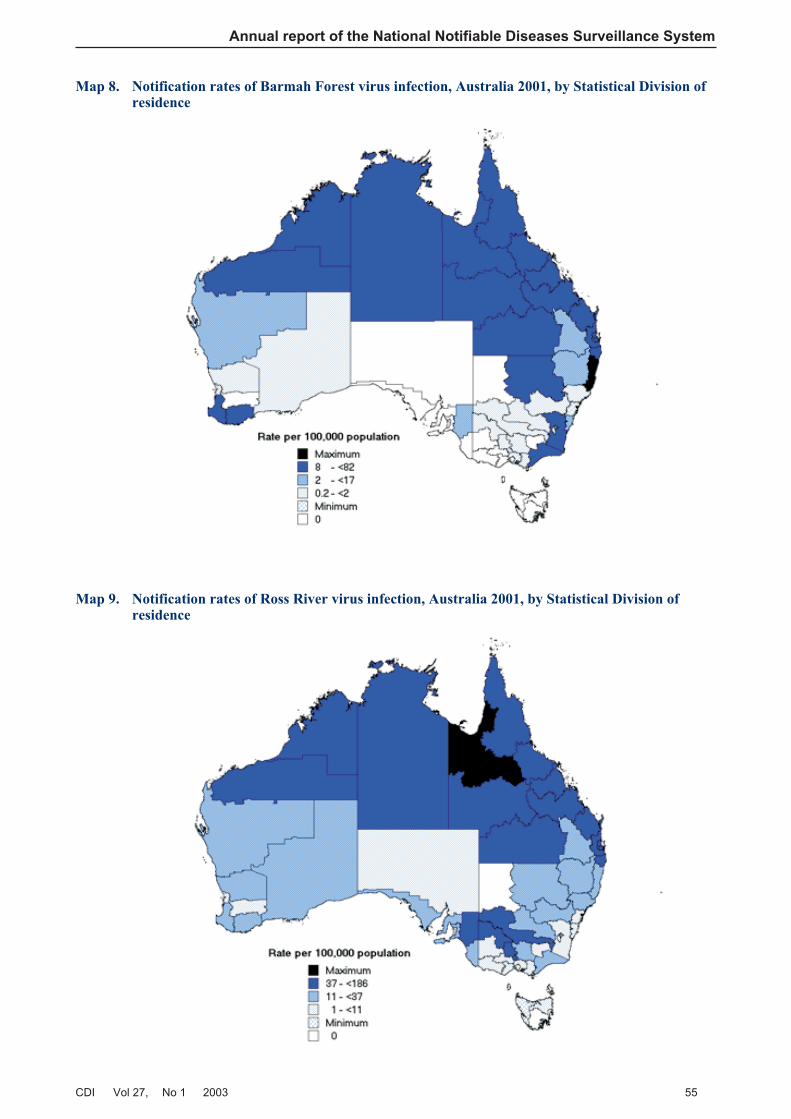
Annual report of the National Notifiable Diseases Surveillance System
CDI Vol 27, No 1 2003 55
Map 8. Notification rates of Barmah Forest virus infection, Australia 2001, by Statistical Division ofresidence
Map 9. Notification rates of Ross River virus infection, Australia 2001, by Statistical Division ofresidence
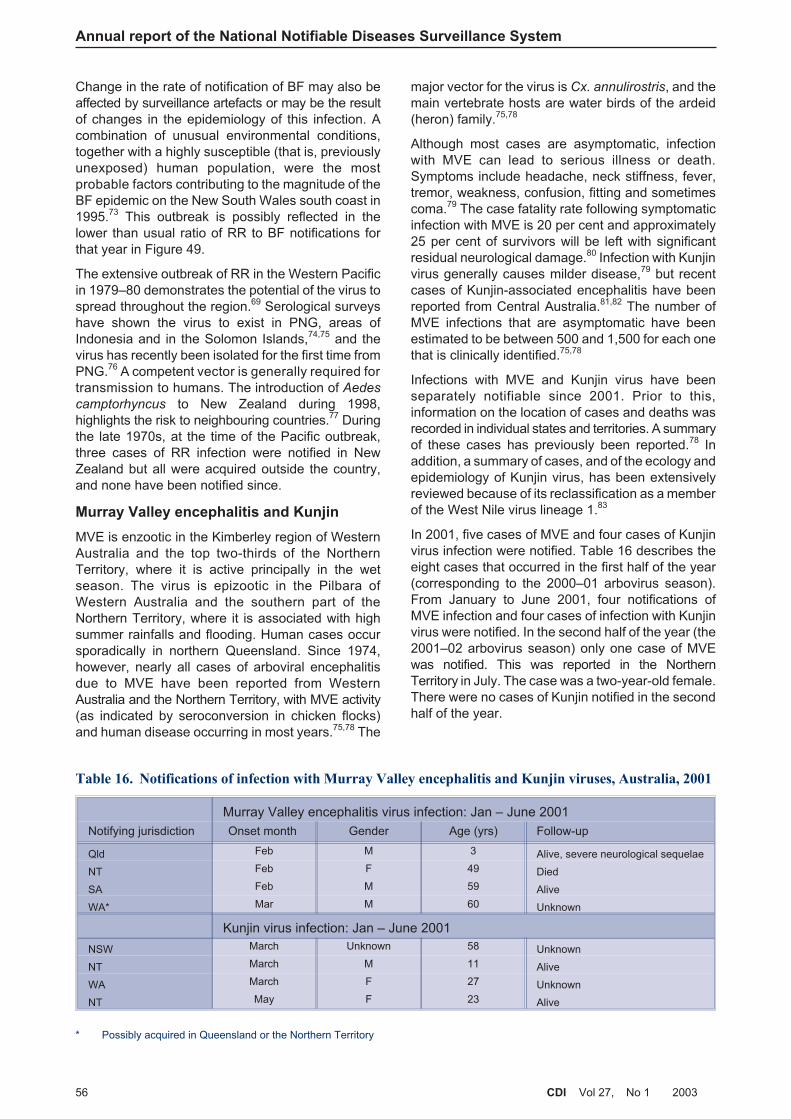
Change in the rate of notification of BF may also beaffected by surveillance artefacts or may be the resultof changes in the epidemiology of this infection. Acombination of unusual environmental conditions,together with a highly susceptible (that is, previouslyunexposed) human population, were the mostprobable factors contributing to the magnitude of theBF epidemic on the New South Wales south coast in1995.73 This outbreak is possibly reflected in thelower than usual ratio of RR to BF notifications forthat year in Figure 49.
The extensive outbreak of RR in the Western Pacificin 1979–80 demonstrates the potential of the virus tospread throughout the region.69 Serological surveyshave shown the virus to exist in PNG, areas ofIndonesia and in the Solomon Islands,74,75 and thevirus has recently been isolated for the first time fromPNG.76 A competent vector is generally required fortransmission to humans. The introduction of Aedes
camptorhyncus to New Zealand during 1998,highlights the risk to neighbouring countries.77 Duringthe late 1970s, at the time of the Pacific outbreak,three cases of RR infection were notified in NewZealand but all were acquired outside the country,and none have been notified since.
Murray Valley encephalitis and Kunjin
MVE is enzootic in the Kimberley region of WesternAustralia and the top two-thirds of the NorthernTerritory, where it is active principally in the wetseason. The virus is epizootic in the Pilbara ofWestern Australia and the southern part of theNorthern Territory, where it is associated with highsummer rainfalls and flooding. Human cases occursporadically in northern Queensland. Since 1974,however, nearly all cases of arboviral encephalitisdue to MVE have been reported from WesternAustralia and the Northern Territory, with MVE activity(as indicated by seroconversion in chicken flocks)and human disease occurring in most years.75,78 The
major vector for the virus is Cx. annulirostris, and themain vertebrate hosts are water birds of the ardeid(heron) family.75,78
Although most cases are asymptomatic, infectionwith MVE can lead to serious illness or death.Symptoms include headache, neck stiffness, fever,tremor, weakness, confusion, fitting and sometimescoma.79 The case fatality rate following symptomaticinfection with MVE is 20 per cent and approximately25 per cent of survivors will be left with significantresidual neurological damage.80 Infection with Kunjinvirus generally causes milder disease,79 but recentcases of Kunjin-associated encephalitis have beenreported from Central Australia.81,82 The number ofMVE infections that are asymptomatic have beenestimated to be between 500 and 1,500 for each onethat is clinically identified.75,78
Infections with MVE and Kunjin virus have beenseparately notifiable since 2001. Prior to this,information on the location of cases and deaths wasrecorded in individual states and territories. A summaryof these cases has previously been reported.78 Inaddition, a summary of cases, and of the ecology andepidemiology of Kunjin virus, has been extensivelyreviewed because of its reclassification as a memberof the West Nile virus lineage 1.83
In 2001, five cases of MVE and four cases of Kunjinvirus infection were notified. Table 16 describes theeight cases that occurred in the first half of the year(corresponding to the 2000–01 arbovirus season).From January to June 2001, four notifications ofMVE infection and four cases of infection with Kunjinvirus were notified. In the second half of the year (the2001–02 arbovirus season) only one case of MVEwas notified. This was reported in the NorthernTerritory in July. The case was a two-year-old female.There were no cases of Kunjin notified in the secondhalf of the year.
Annual report of the National Notifiable Diseases Surveillance System
56 CDI Vol 27, No 1 2003
Table 16. Notifications of infection with Murray Valley encephalitis and Kunjin viruses, Australia, 2001
Murray Valley encephalitis virus infection: Jan – June 2001
Notifying jurisdiction Onset month Gender Age (yrs) Follow-up
Qld Feb M 3 Alive, severe neurological sequelae
NT Feb F 49 Died
SA Feb M 59 Alive
WA* Mar M 60 Unknown
Kunjin virus infection: Jan – June 2001
NSW March Unknown 58 Unknown
NT March M 11 Alive
WA March F 27 Unknown
NT May F 23 Alive
* Possibly acquired in Queensland or the Northern Territory
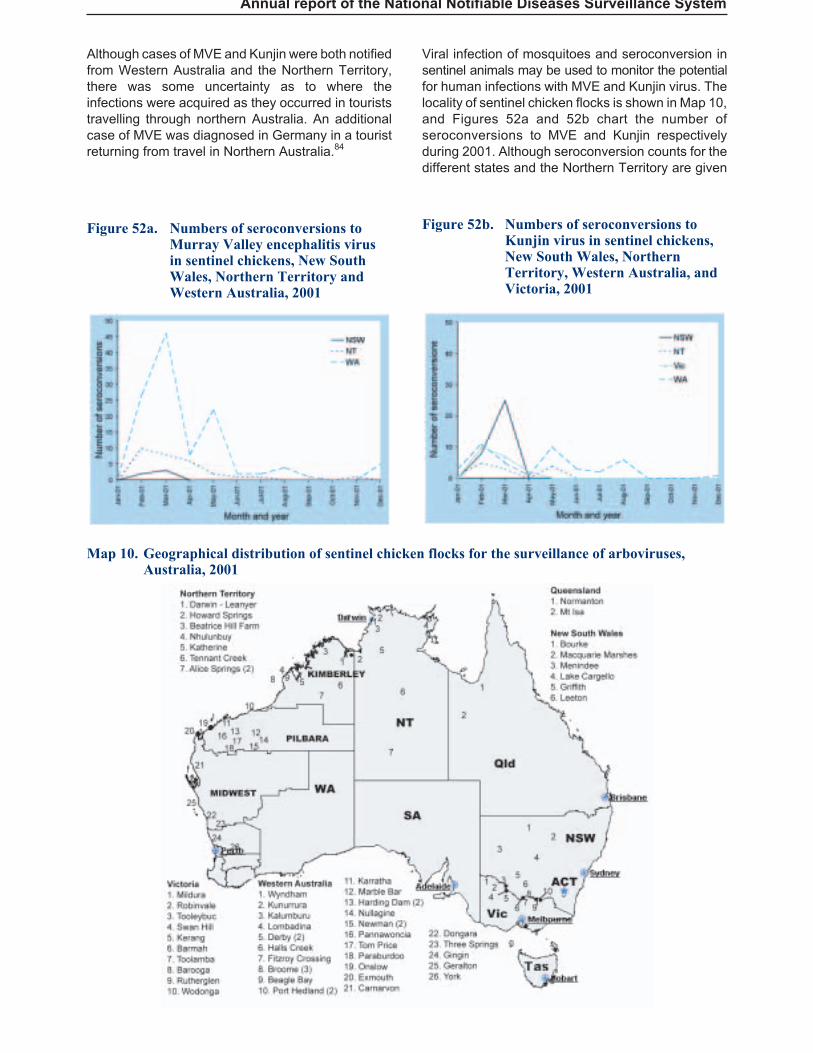
Although cases of MVE and Kunjin were both notifiedfrom Western Australia and the Northern Territory,there was some uncertainty as to where theinfections were acquired as they occurred in touriststravelling through northern Australia. An additionalcase of MVE was diagnosed in Germany in a touristreturning from travel in Northern Australia.84
Viral infection of mosquitoes and seroconversion insentinel animals may be used to monitor the potentialfor human infections with MVE and Kunjin virus. Thelocality of sentinel chicken flocks is shown in Map 10,and Figures 52a and 52b chart the number ofseroconversions to MVE and Kunjin respectivelyduring 2001. Although seroconversion counts for thedifferent states and the Northern Territory are given
Annual report of the National Notifiable Diseases Surveillance System
Map 10. Geographical distribution of sentinel chicken flocks for the surveillance of arboviruses,Australia, 2001
Figure 52a. Numbers of seroconversions toMurray Valley encephalitis virusin sentinel chickens, New SouthWales, Northern Territory andWestern Australia, 2001
Figure 52b. Numbers of seroconversions toKunjin virus in sentinel chickens,New South Wales, NorthernTerritory, Western Australia, andVictoria, 2001
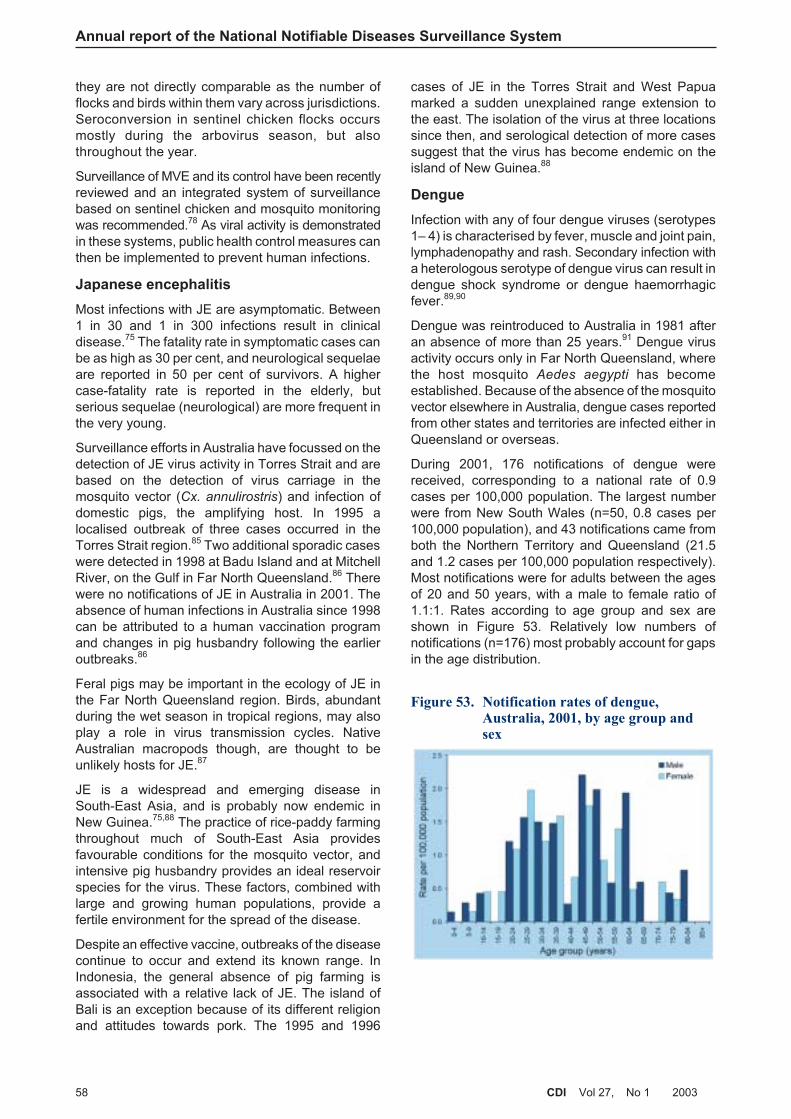
they are not directly comparable as the number offlocks and birds within them vary across jurisdictions.Seroconversion in sentinel chicken flocks occursmostly during the arbovirus season, but alsothroughout the year.
Surveillance of MVE and its control have been recentlyreviewed and an integrated system of surveillancebased on sentinel chicken and mosquito monitoringwas recommended.78 As viral activity is demonstratedin these systems, public health control measures canthen be implemented to prevent human infections.
Japanese encephalitis
Most infections with JE are asymptomatic. Between1 in 30 and 1 in 300 infections result in clinicaldisease.75 The fatality rate in symptomatic cases canbe as high as 30 per cent, and neurological sequelaeare reported in 50 per cent of survivors. A highercase-fatality rate is reported in the elderly, butserious sequelae (neurological) are more frequent inthe very young.
Surveillance efforts in Australia have focussed on thedetection of JE virus activity in Torres Strait and arebased on the detection of virus carriage in themosquito vector (Cx. annulirostris) and infection ofdomestic pigs, the amplifying host. In 1995 alocalised outbreak of three cases occurred in theTorres Strait region.85 Two additional sporadic caseswere detected in 1998 at Badu Island and at MitchellRiver, on the Gulf in Far North Queensland.86 Therewere no notifications of JE in Australia in 2001. Theabsence of human infections in Australia since 1998can be attributed to a human vaccination programand changes in pig husbandry following the earlieroutbreaks.86
Feral pigs may be important in the ecology of JE inthe Far North Queensland region. Birds, abundantduring the wet season in tropical regions, may alsoplay a role in virus transmission cycles. NativeAustralian macropods though, are thought to beunlikely hosts for JE.87
JE is a widespread and emerging disease inSouth-East Asia, and is probably now endemic inNew Guinea.75,88 The practice of rice-paddy farmingthroughout much of South-East Asia providesfavourable conditions for the mosquito vector, andintensive pig husbandry provides an ideal reservoirspecies for the virus. These factors, combined withlarge and growing human populations, provide afertile environment for the spread of the disease.
Despite an effective vaccine, outbreaks of the diseasecontinue to occur and extend its known range. InIndonesia, the general absence of pig farming isassociated with a relative lack of JE. The island ofBali is an exception because of its different religionand attitudes towards pork. The 1995 and 1996
cases of JE in the Torres Strait and West Papuamarked a sudden unexplained range extension tothe east. The isolation of the virus at three locationssince then, and serological detection of more casessuggest that the virus has become endemic on theisland of New Guinea.88
Dengue
Infection with any of four dengue viruses (serotypes1– 4) is characterised by fever, muscle and joint pain,lymphadenopathy and rash. Secondary infection witha heterologous serotype of dengue virus can result indengue shock syndrome or dengue haemorrhagicfever.89,90
Dengue was reintroduced to Australia in 1981 afteran absence of more than 25 years.91 Dengue virusactivity occurs only in Far North Queensland, wherethe host mosquito Aedes aegypti has becomeestablished. Because of the absence of the mosquitovector elsewhere in Australia, dengue cases reportedfrom other states and territories are infected either inQueensland or overseas.
During 2001, 176 notifications of dengue werereceived, corresponding to a national rate of 0.9cases per 100,000 population. The largest numberwere from New South Wales (n=50, 0.8 cases per100,000 population), and 43 notifications came fromboth the Northern Territory and Queensland (21.5and 1.2 cases per 100,000 population respectively).Most notifications were for adults between the agesof 20 and 50 years, with a male to female ratio of1.1:1. Rates according to age group and sex areshown in Figure 53. Relatively low numbers ofnotifications (n=176) most probably account for gapsin the age distribution.
Annual report of the National Notifiable Diseases Surveillance System
58 CDI Vol 27, No 1 2003
Figure 53. Notification rates of dengue,Australia, 2001, by age group andsex
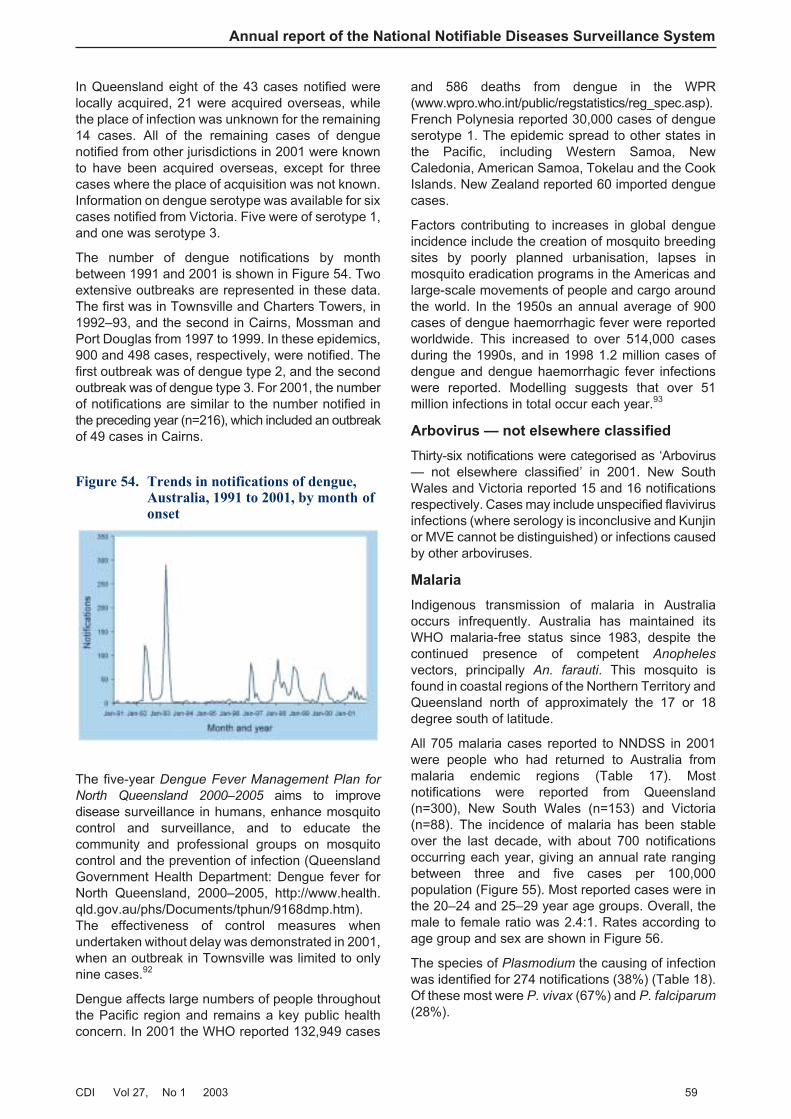
In Queensland eight of the 43 cases notified werelocally acquired, 21 were acquired overseas, whilethe place of infection was unknown for the remaining14 cases. All of the remaining cases of denguenotified from other jurisdictions in 2001 were knownto have been acquired overseas, except for threecases where the place of acquisition was not known.Information on dengue serotype was available for sixcases notified from Victoria. Five were of serotype 1,and one was serotype 3.
The number of dengue notifications by monthbetween 1991 and 2001 is shown in Figure 54. Twoextensive outbreaks are represented in these data.The first was in Townsville and Charters Towers, in1992–93, and the second in Cairns, Mossman andPort Douglas from 1997 to 1999. In these epidemics,900 and 498 cases, respectively, were notified. Thefirst outbreak was of dengue type 2, and the secondoutbreak was of dengue type 3. For 2001, the numberof notifications are similar to the number notified inthe preceding year (n=216), which included an outbreakof 49 cases in Cairns.
The five-year Dengue Fever Management Plan for
North Queensland 2000–2005 aims to improvedisease surveillance in humans, enhance mosquitocontrol and surveillance, and to educate thecommunity and professional groups on mosquitocontrol and the prevention of infection (QueenslandGovernment Health Department: Dengue fever forNorth Queensland, 2000–2005, http://www.health.qld.gov.au/phs/Documents/tphun/9168dmp.htm).The effectiveness of control measures whenundertaken without delay was demonstrated in 2001,when an outbreak in Townsville was limited to onlynine cases.92
Dengue affects large numbers of people throughoutthe Pacific region and remains a key public healthconcern. In 2001 the WHO reported 132,949 cases
and 586 deaths from dengue in the WPR(www.wpro.who.int/public/regstatistics/reg_spec.asp).French Polynesia reported 30,000 cases of dengueserotype 1. The epidemic spread to other states inthe Pacific, including Western Samoa, NewCaledonia, American Samoa, Tokelau and the CookIslands. New Zealand reported 60 imported denguecases.
Factors contributing to increases in global dengueincidence include the creation of mosquito breedingsites by poorly planned urbanisation, lapses inmosquito eradication programs in the Americas andlarge-scale movements of people and cargo aroundthe world. In the 1950s an annual average of 900cases of dengue haemorrhagic fever were reportedworldwide. This increased to over 514,000 casesduring the 1990s, and in 1998 1.2 million cases ofdengue and dengue haemorrhagic fever infectionswere reported. Modelling suggests that over 51million infections in total occur each year.93
Arbovirus — not elsewhere classified
Thirty-six notifications were categorised as ‘Arbovirus— not elsewhere classified’ in 2001. New SouthWales and Victoria reported 15 and 16 notificationsrespectively. Cases may include unspecified flavivirusinfections (where serology is inconclusive and Kunjinor MVE cannot be distinguished) or infections causedby other arboviruses.
Malaria
Indigenous transmission of malaria in Australiaoccurs infrequently. Australia has maintained itsWHO malaria-free status since 1983, despite thecontinued presence of competent Anopheles
vectors, principally An. farauti. This mosquito isfound in coastal regions of the Northern Territory andQueensland north of approximately the 17 or 18degree south of latitude.
All 705 malaria cases reported to NNDSS in 2001were people who had returned to Australia frommalaria endemic regions (Table 17). Mostnotifications were reported from Queensland(n=300), New South Wales (n=153) and Victoria(n=88). The incidence of malaria has been stableover the last decade, with about 700 notificationsoccurring each year, giving an annual rate rangingbetween three and five cases per 100,000population (Figure 55). Most reported cases were inthe 20–24 and 25–29 year age groups. Overall, themale to female ratio was 2.4:1. Rates according toage group and sex are shown in Figure 56.
The species of Plasmodium the causing of infectionwas identified for 274 notifications (38%) (Table 18).Of these most were P. vivax (67%) and P. falciparum
(28%).
Annual report of the National Notifiable Diseases Surveillance System
CDI Vol 27, No 1 2003 59
Figure 54. Trends in notifications of dengue,Australia, 1991 to 2001, by month ofonset
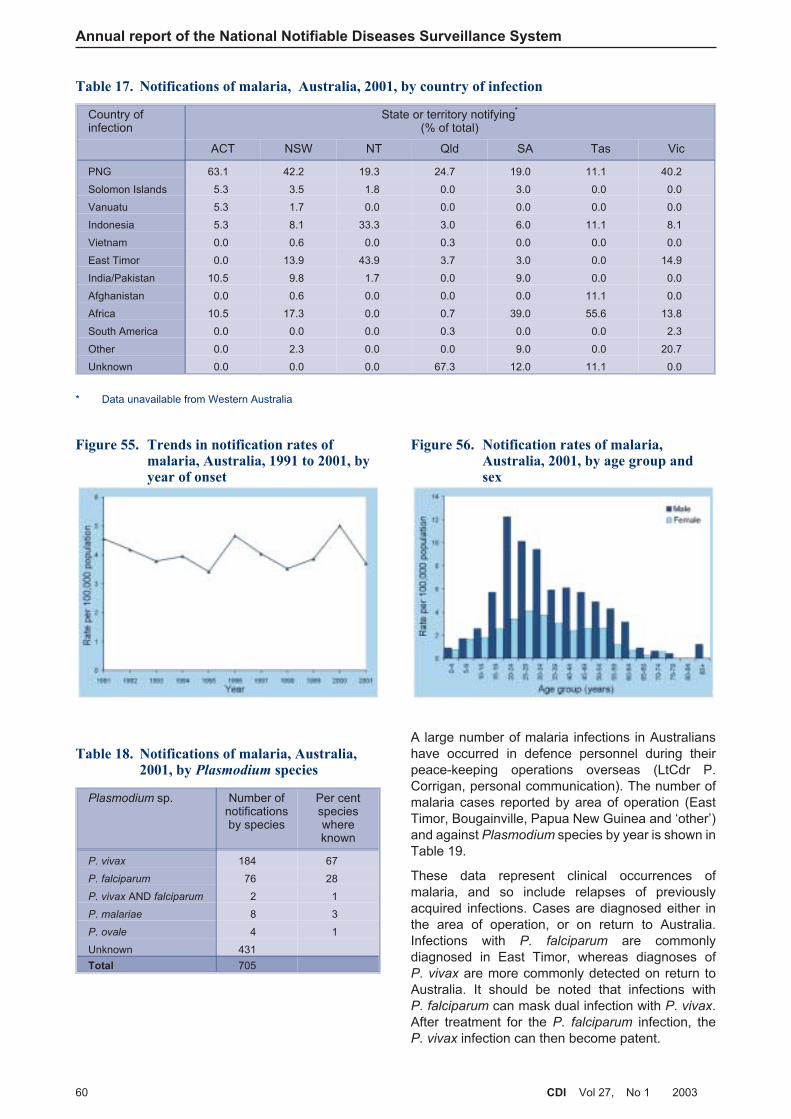
A large number of malaria infections in Australianshave occurred in defence personnel during theirpeace-keeping operations overseas (LtCdr P.Corrigan, personal communication). The number ofmalaria cases reported by area of operation (EastTimor, Bougainville, Papua New Guinea and ‘other’)and against Plasmodium species by year is shown inTable 19.
These data represent clinical occurrences ofmalaria, and so include relapses of previouslyacquired infections. Cases are diagnosed either inthe area of operation, or on return to Australia.Infections with P. falciparum are commonlydiagnosed in East Timor, whereas diagnoses ofP. vivax are more commonly detected on return toAustralia. It should be noted that infections withP. falciparum can mask dual infection with P. vivax.After treatment for the P. falciparum infection, theP. vivax infection can then become patent.
Annual report of the National Notifiable Diseases Surveillance System
60 CDI Vol 27, No 1 2003
Table 17. Notifications of malaria, Australia, 2001, by country of infection
Country ofinfection
State or territory notifying*
(% of total)
ACT NSW NT Qld SA Tas Vic
PNG 63.1 42.2 19.3 24.7 19.0 11.1 40.2
Solomon Islands 5.3 3.5 1.8 0.0 3.0 0.0 0.0
Vanuatu 5.3 1.7 0.0 0.0 0.0 0.0 0.0
Indonesia 5.3 8.1 33.3 3.0 6.0 11.1 8.1
Vietnam 0.0 0.6 0.0 0.3 0.0 0.0 0.0
East Timor 0.0 13.9 43.9 3.7 3.0 0.0 14.9
India/Pakistan 10.5 9.8 1.7 0.0 9.0 0.0 0.0
Afghanistan 0.0 0.6 0.0 0.0 0.0 11.1 0.0
Africa 10.5 17.3 0.0 0.7 39.0 55.6 13.8
South America 0.0 0.0 0.0 0.3 0.0 0.0 2.3
Other 0.0 2.3 0.0 0.0 9.0 0.0 20.7
Unknown 0.0 0.0 0.0 67.3 12.0 11.1 0.0
* Data unavailable from Western Australia
Figure 55. Trends in notification rates ofmalaria, Australia, 1991 to 2001, byyear of onset
Figure 56. Notification rates of malaria,Australia, 2001, by age group andsex
Table 18. Notifications of malaria, Australia,2001, by Plasmodium species
Plasmodium sp. Number ofnotificationsby species
Per centspecieswhereknown
P. vivax 184 67
P. falciparum 76 28
P. vivax AND falciparum 2 1
P. malariae 8 3
P. ovale 4 1
Unknown 431
Total 705
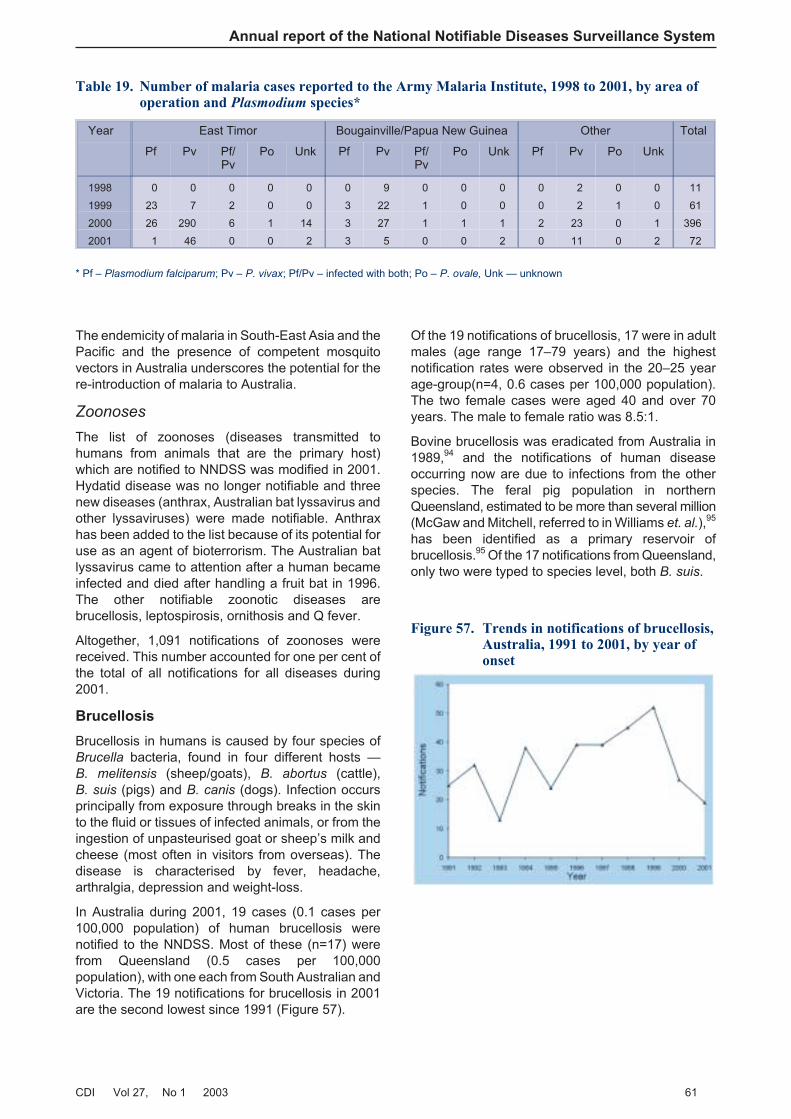
The endemicity of malaria in South-East Asia and thePacific and the presence of competent mosquitovectors in Australia underscores the potential for there-introduction of malaria to Australia.
Zoonoses
The list of zoonoses (diseases transmitted tohumans from animals that are the primary host)which are notified to NNDSS was modified in 2001.Hydatid disease was no longer notifiable and threenew diseases (anthrax, Australian bat lyssavirus andother lyssaviruses) were made notifiable. Anthraxhas been added to the list because of its potential foruse as an agent of bioterrorism. The Australian batlyssavirus came to attention after a human becameinfected and died after handling a fruit bat in 1996.The other notifiable zoonotic diseases arebrucellosis, leptospirosis, ornithosis and Q fever.
Altogether, 1,091 notifications of zoonoses werereceived. This number accounted for one per cent ofthe total of all notifications for all diseases during2001.
Brucellosis
Brucellosis in humans is caused by four species ofBrucella bacteria, found in four different hosts —B. melitensis (sheep/goats), B. abortus (cattle),B. suis (pigs) and B. canis (dogs). Infection occursprincipally from exposure through breaks in the skinto the fluid or tissues of infected animals, or from theingestion of unpasteurised goat or sheep’s milk andcheese (most often in visitors from overseas). Thedisease is characterised by fever, headache,arthralgia, depression and weight-loss.
In Australia during 2001, 19 cases (0.1 cases per100,000 population) of human brucellosis werenotified to the NNDSS. Most of these (n=17) werefrom Queensland (0.5 cases per 100,000population), with one each from South Australian andVictoria. The 19 notifications for brucellosis in 2001are the second lowest since 1991 (Figure 57).
Of the 19 notifications of brucellosis, 17 were in adultmales (age range 17–79 years) and the highestnotification rates were observed in the 20–25 yearage-group(n=4, 0.6 cases per 100,000 population).The two female cases were aged 40 and over 70years. The male to female ratio was 8.5:1.
Bovine brucellosis was eradicated from Australia in1989,94 and the notifications of human diseaseoccurring now are due to infections from the otherspecies. The feral pig population in northernQueensland, estimated to be more than several million(McGaw and Mitchell, referred to in Williams et. al.),95
has been identified as a primary reservoir ofbrucellosis.95 Of the 17 notifications from Queensland,only two were typed to species level, both B. suis.
Annual report of the National Notifiable Diseases Surveillance System
CDI Vol 27, No 1 2003 61
Table 19. Number of malaria cases reported to the Army Malaria Institute, 1998 to 2001, by area ofoperation and Plasmodium species*
Year East Timor Bougainville/Papua New Guinea Other Total
Pf Pv Pf/Pv
Po Unk Pf Pv Pf/Pv
Po Unk Pf Pv Po Unk
1998 0 0 0 0 0 0 9 0 0 0 0 2 0 0 11
1999 23 7 2 0 0 3 22 1 0 0 0 2 1 0 61
2000 26 290 6 1 14 3 27 1 1 1 2 23 0 1 396
2001 1 46 0 0 2 3 5 0 0 2 0 11 0 2 72
* Pf – Plasmodium falciparum; Pv – P. vivax; Pf/Pv – infected with both; Po – P. ovale, Unk — unknown
Figure 57. Trends in notifications of brucellosis,Australia, 1991 to 2001, by year ofonset
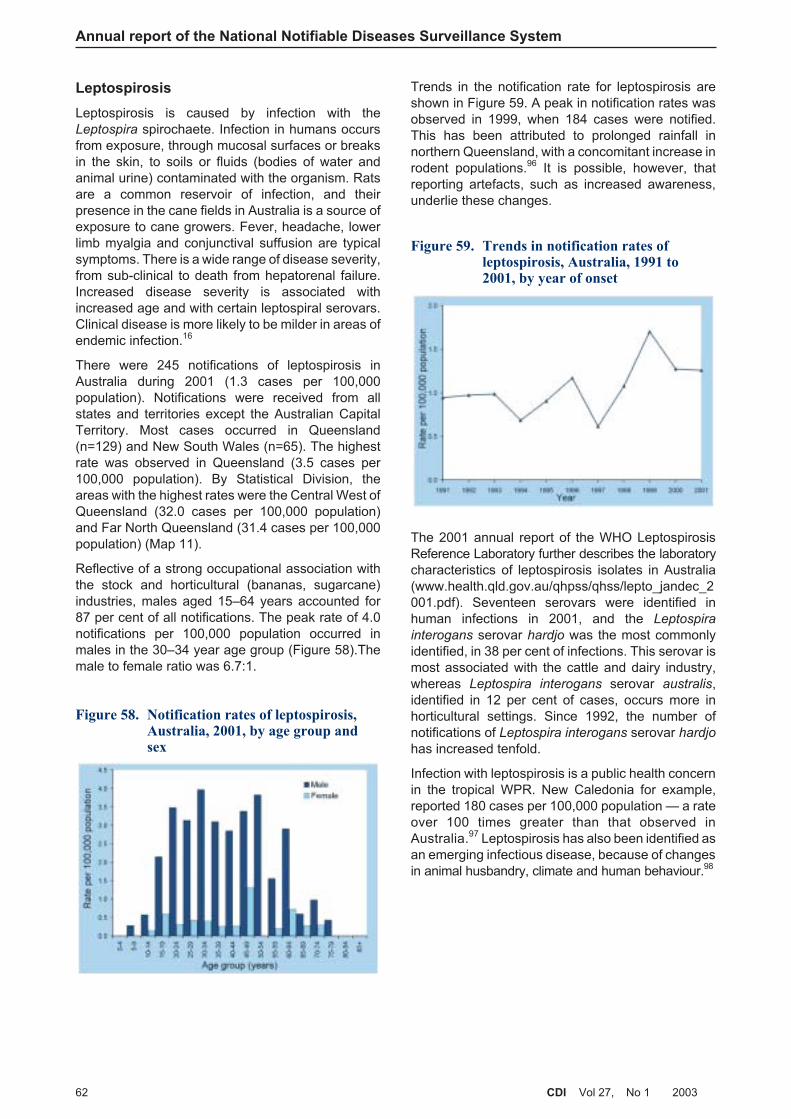
Leptospirosis
Leptospirosis is caused by infection with theLeptospira spirochaete. Infection in humans occursfrom exposure, through mucosal surfaces or breaksin the skin, to soils or fluids (bodies of water andanimal urine) contaminated with the organism. Ratsare a common reservoir of infection, and theirpresence in the cane fields in Australia is a source ofexposure to cane growers. Fever, headache, lowerlimb myalgia and conjunctival suffusion are typicalsymptoms. There is a wide range of disease severity,from sub-clinical to death from hepatorenal failure.Increased disease severity is associated withincreased age and with certain leptospiral serovars.Clinical disease is more likely to be milder in areas ofendemic infection.16
There were 245 notifications of leptospirosis inAustralia during 2001 (1.3 cases per 100,000population). Notifications were received from allstates and territories except the Australian CapitalTerritory. Most cases occurred in Queensland(n=129) and New South Wales (n=65). The highestrate was observed in Queensland (3.5 cases per100,000 population). By Statistical Division, theareas with the highest rates were the Central West ofQueensland (32.0 cases per 100,000 population)and Far North Queensland (31.4 cases per 100,000population) (Map 11).
Reflective of a strong occupational association withthe stock and horticultural (bananas, sugarcane)industries, males aged 15–64 years accounted for87 per cent of all notifications. The peak rate of 4.0notifications per 100,000 population occurred inmales in the 30–34 year age group (Figure 58).Themale to female ratio was 6.7:1.
Trends in the notification rate for leptospirosis areshown in Figure 59. A peak in notification rates wasobserved in 1999, when 184 cases were notified.This has been attributed to prolonged rainfall innorthern Queensland, with a concomitant increase inrodent populations.96 It is possible, however, thatreporting artefacts, such as increased awareness,underlie these changes.
The 2001 annual report of the WHO LeptospirosisReference Laboratory further describes the laboratorycharacteristics of leptospirosis isolates in Australia(www.health.qld.gov.au/qhpss/qhss/lepto_jandec_2001.pdf). Seventeen serovars were identified inhuman infections in 2001, and the Leptospira
interogans serovar hardjo was the most commonlyidentified, in 38 per cent of infections. This serovar ismost associated with the cattle and dairy industry,whereas Leptospira interogans serovar australis,identified in 12 per cent of cases, occurs more inhorticultural settings. Since 1992, the number ofnotifications of Leptospira interogans serovar hardjo
has increased tenfold.
Infection with leptospirosis is a public health concernin the tropical WPR. New Caledonia for example,reported 180 cases per 100,000 population — a rateover 100 times greater than that observed inAustralia.97 Leptospirosis has also been identified asan emerging infectious disease, because of changesin animal husbandry, climate and human behaviour.98
Annual report of the National Notifiable Diseases Surveillance System
62 CDI Vol 27, No 1 2003
Figure 58. Notification rates of leptospirosis,Australia, 2001, by age group andsex
Figure 59. Trends in notification rates ofleptospirosis, Australia, 1991 to2001, by year of onset
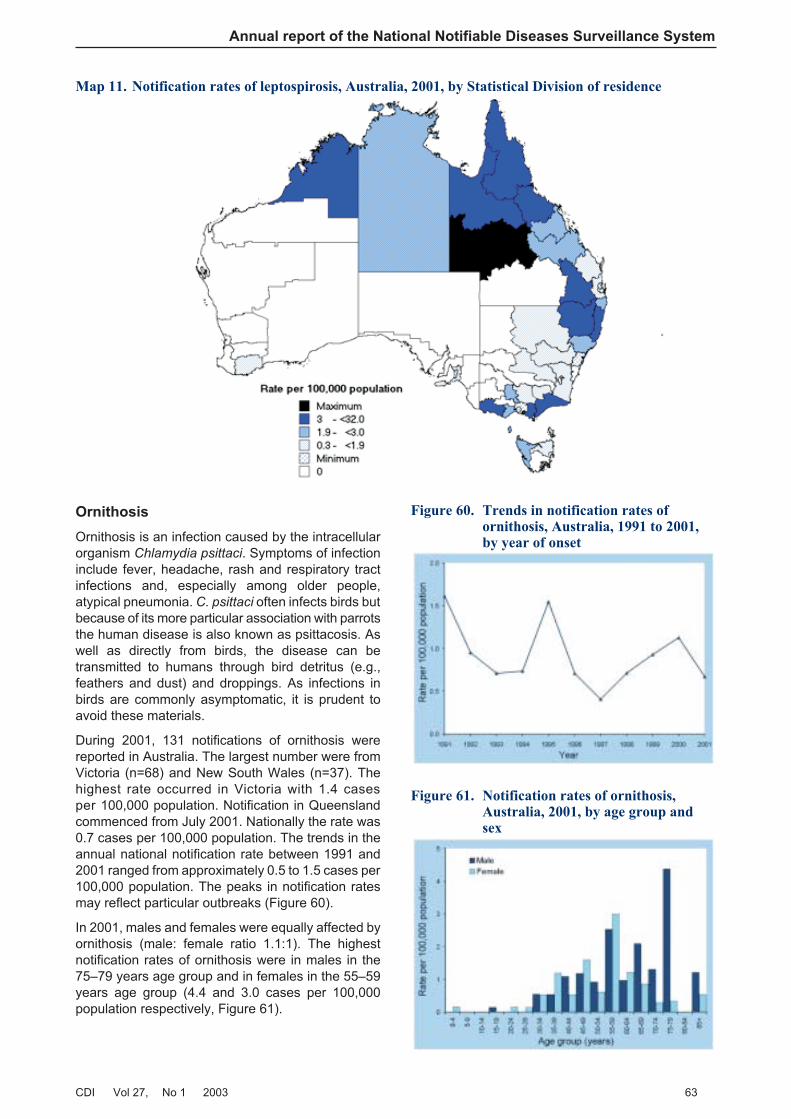
Ornithosis
Ornithosis is an infection caused by the intracellularorganism Chlamydia psittaci. Symptoms of infectioninclude fever, headache, rash and respiratory tractinfections and, especially among older people,atypical pneumonia. C. psittaci often infects birds butbecause of its more particular association with parrotsthe human disease is also known as psittacosis. Aswell as directly from birds, the disease can betransmitted to humans through bird detritus (e.g.,feathers and dust) and droppings. As infections inbirds are commonly asymptomatic, it is prudent toavoid these materials.
During 2001, 131 notifications of ornithosis werereported in Australia. The largest number were fromVictoria (n=68) and New South Wales (n=37). Thehighest rate occurred in Victoria with 1.4 casesper 100,000 population. Notification in Queenslandcommenced from July 2001. Nationally the rate was0.7 cases per 100,000 population. The trends in theannual national notification rate between 1991 and2001 ranged from approximately 0.5 to 1.5 cases per100,000 population. The peaks in notification ratesmay reflect particular outbreaks (Figure 60).
In 2001, males and females were equally affected byornithosis (male: female ratio 1.1:1). The highestnotification rates of ornithosis were in males in the75–79 years age group and in females in the 55–59years age group (4.4 and 3.0 cases per 100,000population respectively, Figure 61).
Annual report of the National Notifiable Diseases Surveillance System
CDI Vol 27, No 1 2003 63
Map 11. Notification rates of leptospirosis, Australia, 2001, by Statistical Division of residence
Figure 60. Trends in notification rates ofornithosis, Australia, 1991 to 2001,by year of onset
Figure 61. Notification rates of ornithosis,Australia, 2001, by age group andsex
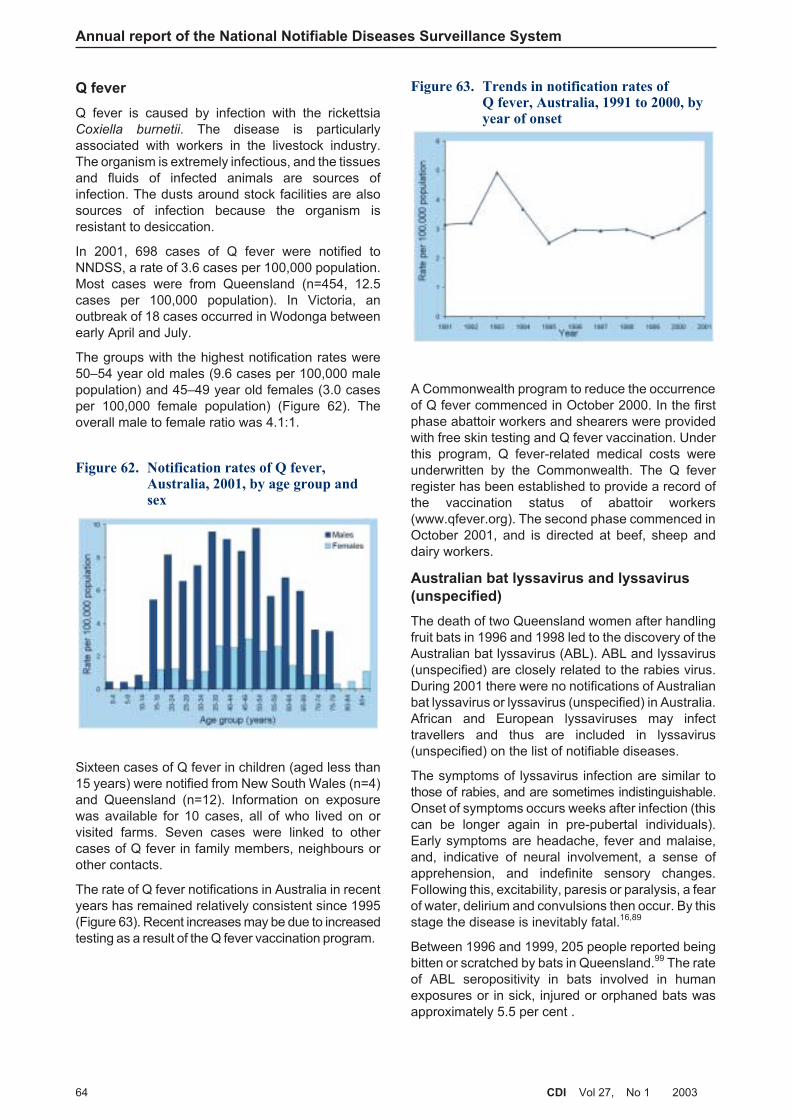
Q fever
Q fever is caused by infection with the rickettsiaCoxiella burnetii. The disease is particularlyassociated with workers in the livestock industry.The organism is extremely infectious, and the tissuesand fluids of infected animals are sources ofinfection. The dusts around stock facilities are alsosources of infection because the organism isresistant to desiccation.
In 2001, 698 cases of Q fever were notified toNNDSS, a rate of 3.6 cases per 100,000 population.Most cases were from Queensland (n=454, 12.5cases per 100,000 population). In Victoria, anoutbreak of 18 cases occurred in Wodonga betweenearly April and July.
The groups with the highest notification rates were50–54 year old males (9.6 cases per 100,000 malepopulation) and 45–49 year old females (3.0 casesper 100,000 female population) (Figure 62). Theoverall male to female ratio was 4.1:1.
Sixteen cases of Q fever in children (aged less than15 years) were notified from New South Wales (n=4)and Queensland (n=12). Information on exposurewas available for 10 cases, all of who lived on orvisited farms. Seven cases were linked to othercases of Q fever in family members, neighbours orother contacts.
The rate of Q fever notifications in Australia in recentyears has remained relatively consistent since 1995(Figure 63). Recent increases may be due to increasedtesting as a result of the Q fever vaccination program.
A Commonwealth program to reduce the occurrenceof Q fever commenced in October 2000. In the firstphase abattoir workers and shearers were providedwith free skin testing and Q fever vaccination. Underthis program, Q fever-related medical costs wereunderwritten by the Commonwealth. The Q feverregister has been established to provide a record ofthe vaccination status of abattoir workers(www.qfever.org). The second phase commenced inOctober 2001, and is directed at beef, sheep anddairy workers.
Australian bat lyssavirus and lyssavirus
(unspecified)
The death of two Queensland women after handlingfruit bats in 1996 and 1998 led to the discovery of theAustralian bat lyssavirus (ABL). ABL and lyssavirus(unspecified) are closely related to the rabies virus.During 2001 there were no notifications of Australianbat lyssavirus or lyssavirus (unspecified) in Australia.African and European lyssaviruses may infecttravellers and thus are included in lyssavirus(unspecified) on the list of notifiable diseases.
The symptoms of lyssavirus infection are similar tothose of rabies, and are sometimes indistinguishable.Onset of symptoms occurs weeks after infection (thiscan be longer again in pre-pubertal individuals).Early symptoms are headache, fever and malaise,and, indicative of neural involvement, a sense ofapprehension, and indefinite sensory changes.Following this, excitability, paresis or paralysis, a fearof water, delirium and convulsions then occur. By thisstage the disease is inevitably fatal.16,89
Between 1996 and 1999, 205 people reported beingbitten or scratched by bats in Queensland.99 The rateof ABL seropositivity in bats involved in humanexposures or in sick, injured or orphaned bats wasapproximately 5.5 per cent .
Annual report of the National Notifiable Diseases Surveillance System
64 CDI Vol 27, No 1 2003
Figure 62. Notification rates of Q fever,Australia, 2001, by age group andsex
Figure 63. Trends in notification rates ofQ fever, Australia, 1991 to 2000, byyear of onset
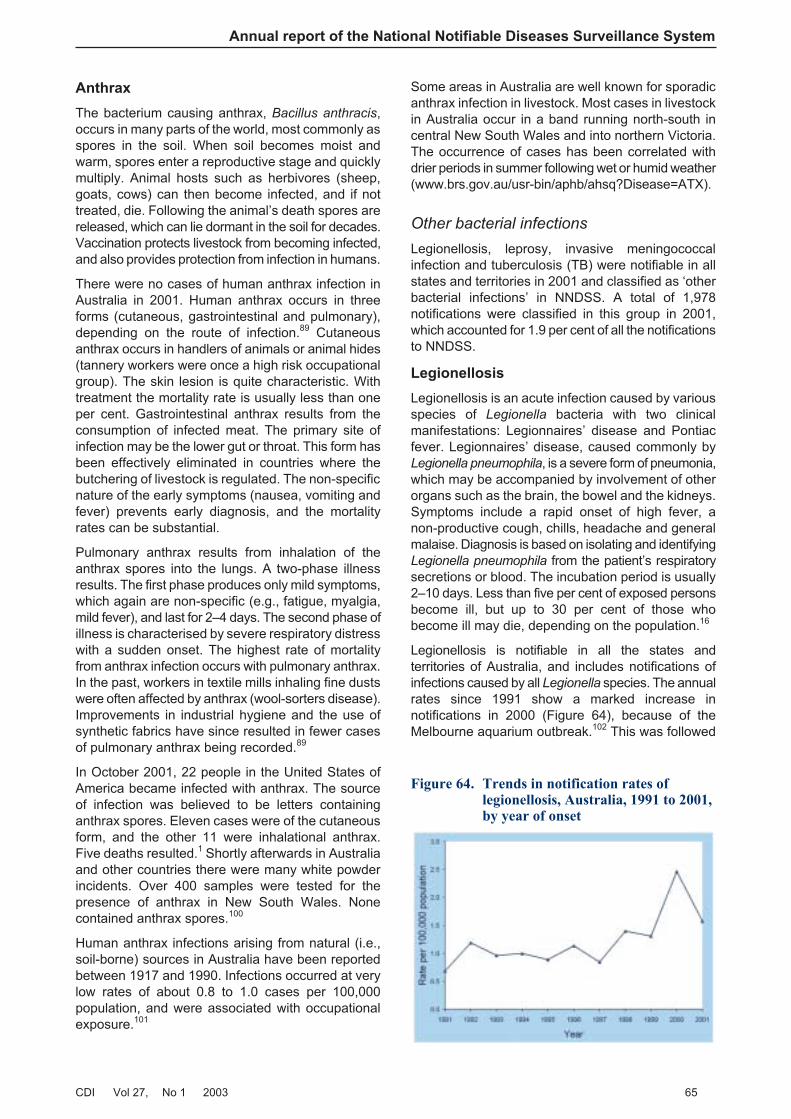
Anthrax
The bacterium causing anthrax, Bacillus anthracis,occurs in many parts of the world, most commonly asspores in the soil. When soil becomes moist andwarm, spores enter a reproductive stage and quicklymultiply. Animal hosts such as herbivores (sheep,goats, cows) can then become infected, and if nottreated, die. Following the animal’s death spores arereleased, which can lie dormant in the soil for decades.Vaccination protects livestock from becoming infected,and also provides protection from infection in humans.
There were no cases of human anthrax infection inAustralia in 2001. Human anthrax occurs in threeforms (cutaneous, gastrointestinal and pulmonary),depending on the route of infection.89 Cutaneousanthrax occurs in handlers of animals or animal hides(tannery workers were once a high risk occupationalgroup). The skin lesion is quite characteristic. Withtreatment the mortality rate is usually less than oneper cent. Gastrointestinal anthrax results from theconsumption of infected meat. The primary site ofinfection may be the lower gut or throat. This form hasbeen effectively eliminated in countries where thebutchering of livestock is regulated. The non-specificnature of the early symptoms (nausea, vomiting andfever) prevents early diagnosis, and the mortalityrates can be substantial.
Pulmonary anthrax results from inhalation of theanthrax spores into the lungs. A two-phase illnessresults. The first phase produces only mild symptoms,which again are non-specific (e.g., fatigue, myalgia,mild fever), and last for 2–4 days. The second phase ofillness is characterised by severe respiratory distresswith a sudden onset. The highest rate of mortalityfrom anthrax infection occurs with pulmonary anthrax.In the past, workers in textile mills inhaling fine dustswere often affected by anthrax (wool-sorters disease).Improvements in industrial hygiene and the use ofsynthetic fabrics have since resulted in fewer casesof pulmonary anthrax being recorded.89
In October 2001, 22 people in the United States ofAmerica became infected with anthrax. The sourceof infection was believed to be letters containinganthrax spores. Eleven cases were of the cutaneousform, and the other 11 were inhalational anthrax.Five deaths resulted.1 Shortly afterwards in Australiaand other countries there were many white powderincidents. Over 400 samples were tested for thepresence of anthrax in New South Wales. Nonecontained anthrax spores.100
Human anthrax infections arising from natural (i.e.,soil-borne) sources in Australia have been reportedbetween 1917 and 1990. Infections occurred at verylow rates of about 0.8 to 1.0 cases per 100,000population, and were associated with occupationalexposure.101
Some areas in Australia are well known for sporadicanthrax infection in livestock. Most cases in livestockin Australia occur in a band running north-south incentral New South Wales and into northern Victoria.The occurrence of cases has been correlated withdrier periods in summer following wet or humid weather(www.brs.gov.au/usr-bin/aphb/ahsq?Disease=ATX).
Other bacterial infections
Legionellosis, leprosy, invasive meningococcalinfection and tuberculosis (TB) were notifiable in allstates and territories in 2001 and classified as ‘otherbacterial infections’ in NNDSS. A total of 1,978notifications were classified in this group in 2001,which accounted for 1.9 per cent of all the notificationsto NNDSS.
Legionellosis
Legionellosis is an acute infection caused by variousspecies of Legionella bacteria with two clinicalmanifestations: Legionnaires’ disease and Pontiacfever. Legionnaires’ disease, caused commonly byLegionella pneumophila, is a severe form of pneumonia,which may be accompanied by involvement of otherorgans such as the brain, the bowel and the kidneys.Symptoms include a rapid onset of high fever, anon-productive cough, chills, headache and generalmalaise. Diagnosis is based on isolating and identifyingLegionella pneumophila from the patient’s respiratorysecretions or blood. The incubation period is usually2–10 days. Less than five per cent of exposed personsbecome ill, but up to 30 per cent of those whobecome ill may die, depending on the population.16
Legionellosis is notifiable in all the states andterritories of Australia, and includes notifications ofinfections caused by all Legionella species. The annualrates since 1991 show a marked increase innotifications in 2000 (Figure 64), because of theMelbourne aquarium outbreak.102 This was followed
Annual report of the National Notifiable Diseases Surveillance System
CDI Vol 27, No 1 2003 65
Figure 64. Trends in notification rates oflegionellosis, Australia, 1991 to 2001,by year of onset
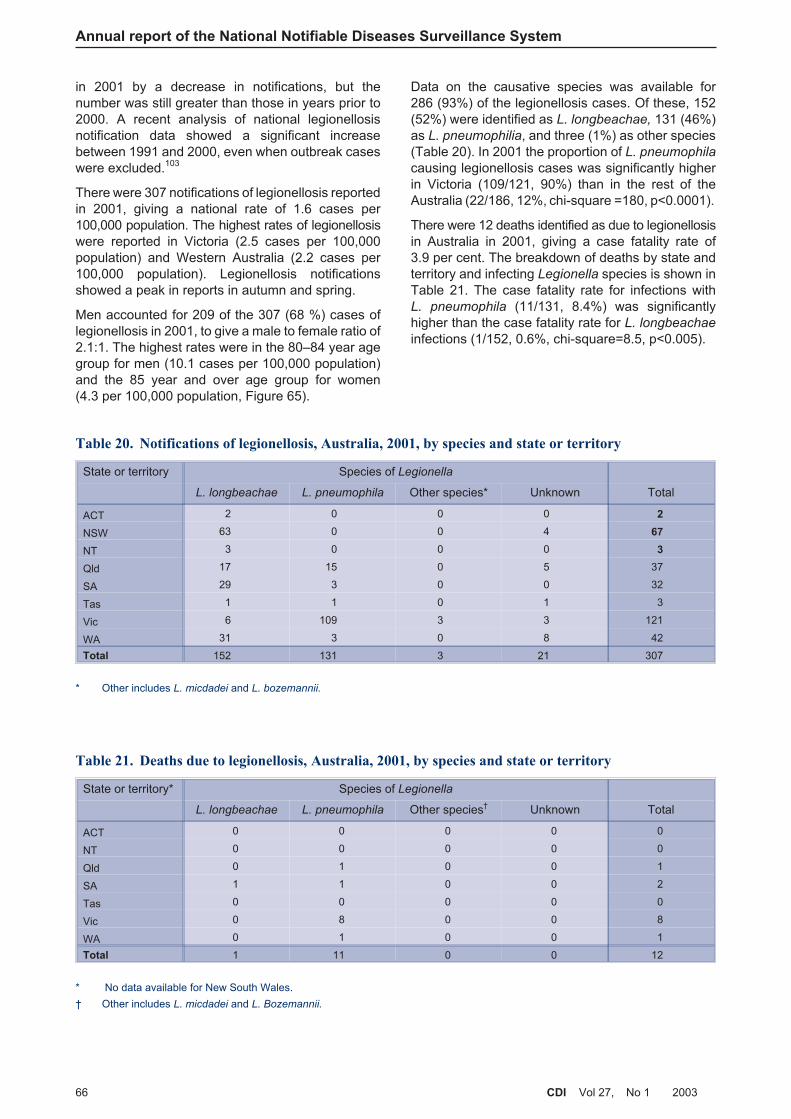
in 2001 by a decrease in notifications, but thenumber was still greater than those in years prior to2000. A recent analysis of national legionellosisnotification data showed a significant increasebetween 1991 and 2000, even when outbreak caseswere excluded.103
There were 307 notifications of legionellosis reportedin 2001, giving a national rate of 1.6 cases per100,000 population. The highest rates of legionellosiswere reported in Victoria (2.5 cases per 100,000population) and Western Australia (2.2 cases per100,000 population). Legionellosis notificationsshowed a peak in reports in autumn and spring.
Men accounted for 209 of the 307 (68 %) cases oflegionellosis in 2001, to give a male to female ratio of2.1:1. The highest rates were in the 80–84 year agegroup for men (10.1 cases per 100,000 population)and the 85 year and over age group for women(4.3 per 100,000 population, Figure 65).
Data on the causative species was available for286 (93%) of the legionellosis cases. Of these, 152(52%) were identified as L. longbeachae, 131 (46%)as L. pneumophilia, and three (1%) as other species(Table 20). In 2001 the proportion of L. pneumophila
causing legionellosis cases was significantly higherin Victoria (109/121, 90%) than in the rest of theAustralia (22/186, 12%, chi-square =180, p<0.0001).
There were 12 deaths identified as due to legionellosisin Australia in 2001, giving a case fatality rate of3.9 per cent. The breakdown of deaths by state andterritory and infecting Legionella species is shown inTable 21. The case fatality rate for infections withL. pneumophila (11/131, 8.4%) was significantlyhigher than the case fatality rate for L. longbeachae
infections (1/152, 0.6%, chi-square=8.5, p<0.005).
Annual report of the National Notifiable Diseases Surveillance System
66 CDI Vol 27, No 1 2003
Table 20. Notifications of legionellosis, Australia, 2001, by species and state or territory
State or territory Species of Legionella
L. longbeachae L. pneumophila Other species* Unknown Total
ACT 2 0 0 0 2
NSW 63 0 0 4 67
NT 3 0 0 0 3
Qld 17 15 0 5 37
SA 29 3 0 0 32
Tas 1 1 0 1 3
Vic 6 109 3 3 121
WA 31 3 0 8 42
Total 152 131 3 21 307
* Other includes L. micdadei and L. bozemannii.
Table 21. Deaths due to legionellosis, Australia, 2001, by species and state or territory
State or territory* Species of Legionella
L. longbeachae L. pneumophila Other species† Unknown Total
ACT 0 0 0 0 0
NT 0 0 0 0 0
Qld 0 1 0 0 1
SA 1 1 0 0 2
Tas 0 0 0 0 0
Vic 0 8 0 0 8
WA 0 1 0 0 1
Total 1 11 0 0 12
* No data available for New South Wales.
† Other includes L. micdadei and L. Bozemannii.
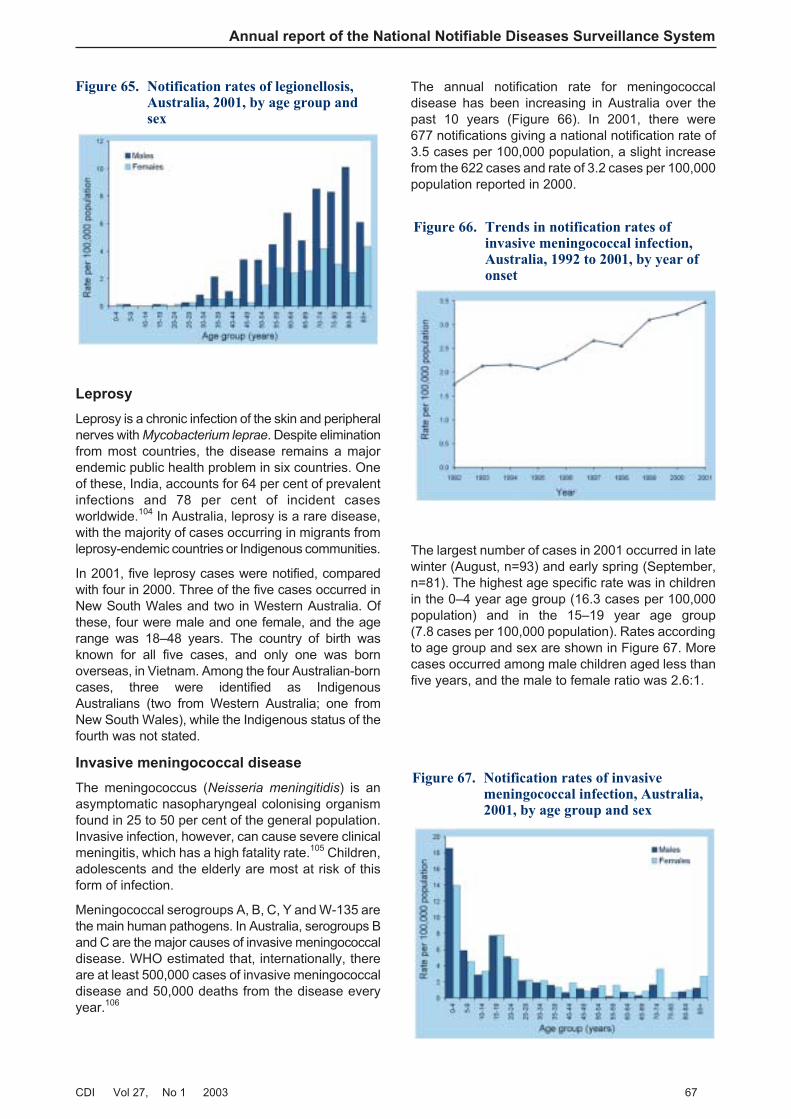
Leprosy
Leprosy is a chronic infection of the skin and peripheralnerves with Mycobacterium leprae. Despite eliminationfrom most countries, the disease remains a majorendemic public health problem in six countries. Oneof these, India, accounts for 64 per cent of prevalentinfections and 78 per cent of incident casesworldwide.104 In Australia, leprosy is a rare disease,with the majority of cases occurring in migrants fromleprosy-endemic countries or Indigenous communities.
In 2001, five leprosy cases were notified, comparedwith four in 2000. Three of the five cases occurred inNew South Wales and two in Western Australia. Ofthese, four were male and one female, and the agerange was 18–48 years. The country of birth wasknown for all five cases, and only one was bornoverseas, in Vietnam. Among the four Australian-borncases, three were identified as IndigenousAustralians (two from Western Australia; one fromNew South Wales), while the Indigenous status of thefourth was not stated.
Invasive meningococcal disease
The meningococcus (Neisseria meningitidis) is anasymptomatic nasopharyngeal colonising organismfound in 25 to 50 per cent of the general population.Invasive infection, however, can cause severe clinicalmeningitis, which has a high fatality rate.105 Children,adolescents and the elderly are most at risk of thisform of infection.
Meningococcal serogroups A, B, C, Y and W-135 arethe main human pathogens. In Australia, serogroups Band C are the major causes of invasive meningococcaldisease. WHO estimated that, internationally, thereare at least 500,000 cases of invasive meningococcaldisease and 50,000 deaths from the disease everyyear.106
The annual notification rate for meningococcaldisease has been increasing in Australia over thepast 10 years (Figure 66). In 2001, there were677 notifications giving a national notification rate of3.5 cases per 100,000 population, a slight increasefrom the 622 cases and rate of 3.2 cases per 100,000population reported in 2000.
The largest number of cases in 2001 occurred in latewinter (August, n=93) and early spring (September,n=81). The highest age specific rate was in childrenin the 0–4 year age group (16.3 cases per 100,000population) and in the 15–19 year age group(7.8 cases per 100,000 population). Rates accordingto age group and sex are shown in Figure 67. Morecases occurred among male children aged less thanfive years, and the male to female ratio was 2.6:1.
Annual report of the National Notifiable Diseases Surveillance System
CDI Vol 27, No 1 2003 67
Figure 65. Notification rates of legionellosis,Australia, 2001, by age group andsex
Figure 66. Trends in notification rates ofinvasive meningococcal infection,Australia, 1992 to 2001, by year ofonset
Figure 67. Notification rates of invasivemeningococcal infection, Australia,2001, by age group and sex
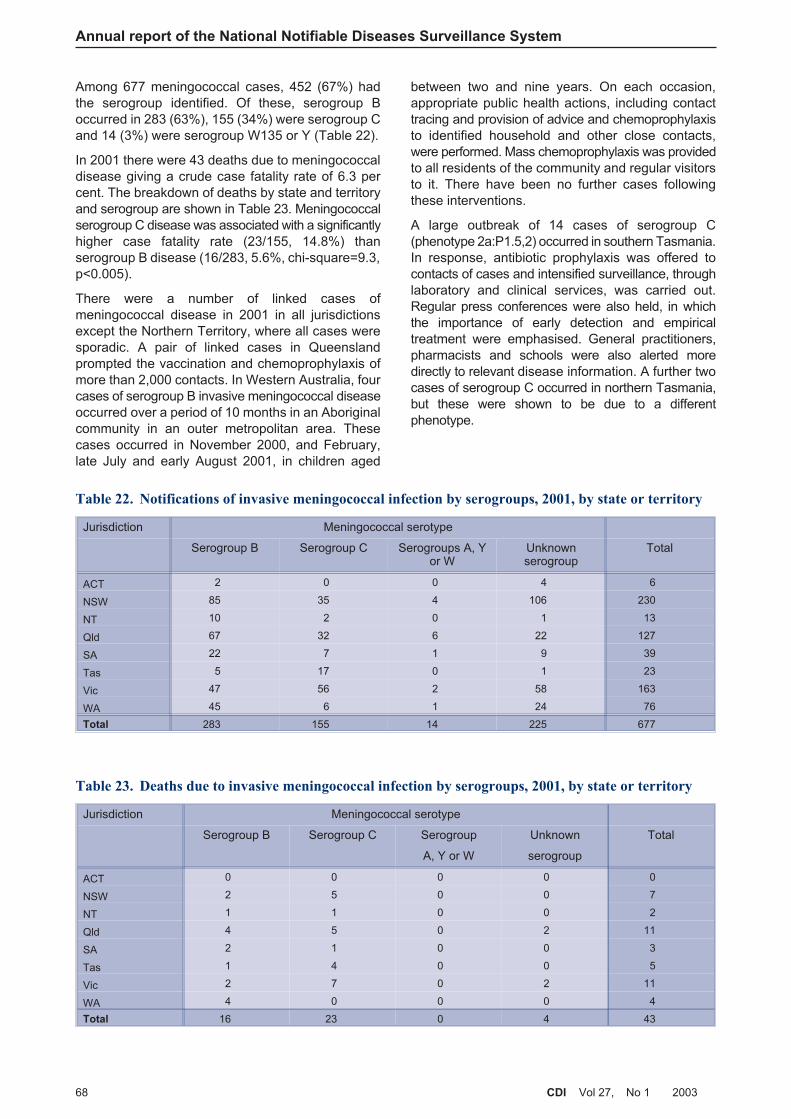
Among 677 meningococcal cases, 452 (67%) hadthe serogroup identified. Of these, serogroup Boccurred in 283 (63%), 155 (34%) were serogroup Cand 14 (3%) were serogroup W135 or Y (Table 22).
In 2001 there were 43 deaths due to meningococcaldisease giving a crude case fatality rate of 6.3 percent. The breakdown of deaths by state and territoryand serogroup are shown in Table 23. Meningococcalserogroup C disease was associated with a significantlyhigher case fatality rate (23/155, 14.8%) thanserogroup B disease (16/283, 5.6%, chi-square=9.3,p<0.005).
There were a number of linked cases ofmeningococcal disease in 2001 in all jurisdictionsexcept the Northern Territory, where all cases weresporadic. A pair of linked cases in Queenslandprompted the vaccination and chemoprophylaxis ofmore than 2,000 contacts. In Western Australia, fourcases of serogroup B invasive meningococcal diseaseoccurred over a period of 10 months in an Aboriginalcommunity in an outer metropolitan area. Thesecases occurred in November 2000, and February,late July and early August 2001, in children aged
between two and nine years. On each occasion,appropriate public health actions, including contacttracing and provision of advice and chemoprophylaxisto identified household and other close contacts,were performed. Mass chemoprophylaxis was providedto all residents of the community and regular visitorsto it. There have been no further cases followingthese interventions.
A large outbreak of 14 cases of serogroup C(phenotype 2a:P1.5,2) occurred in southern Tasmania.In response, antibiotic prophylaxis was offered tocontacts of cases and intensified surveillance, throughlaboratory and clinical services, was carried out.Regular press conferences were also held, in whichthe importance of early detection and empiricaltreatment were emphasised. General practitioners,pharmacists and schools were also alerted moredirectly to relevant disease information. A further twocases of serogroup C occurred in northern Tasmania,but these were shown to be due to a differentphenotype.
Annual report of the National Notifiable Diseases Surveillance System
68 CDI Vol 27, No 1 2003
Table 22. Notifications of invasive meningococcal infection by serogroups, 2001, by state or territory
Jurisdiction Meningococcal serotype
Serogroup B Serogroup C Serogroups A, Yor W
Unknownserogroup
Total
ACT 2 0 0 4 6
NSW 85 35 4 106 230
NT 10 2 0 1 13
Qld 67 32 6 22 127
SA 22 7 1 9 39
Tas 5 17 0 1 23
Vic 47 56 2 58 163
WA 45 6 1 24 76
Total 283 155 14 225 677
Table 23. Deaths due to invasive meningococcal infection by serogroups, 2001, by state or territory
Jurisdiction Meningococcal serotype
Serogroup B Serogroup C Serogroup
A, Y or W
Unknown
serogroup
Total
ACT 0 0 0 0 0
NSW 2 5 0 0 7
NT 1 1 0 0 2
Qld 4 5 0 2 11
SA 2 1 0 0 3
Tas 1 4 0 0 5
Vic 2 7 0 2 11
WA 4 0 0 0 4
Total 16 23 0 4 43
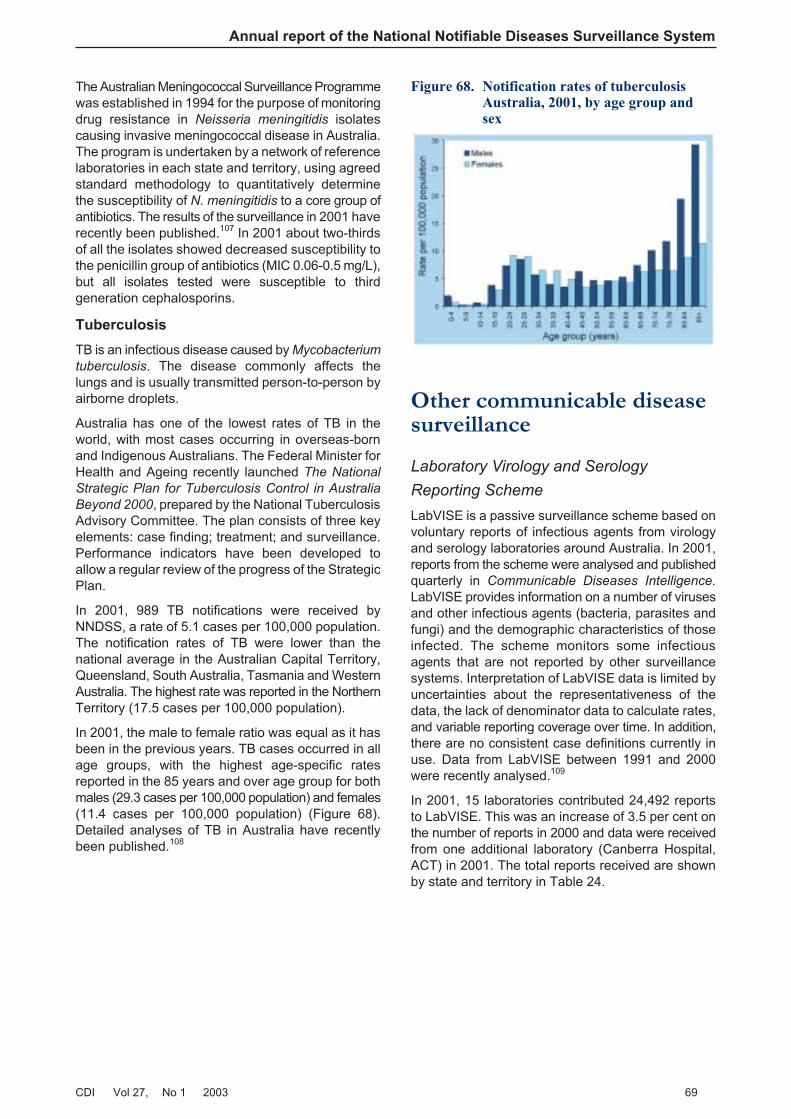
The Australian Meningococcal Surveillance Programmewas established in 1994 for the purpose of monitoringdrug resistance in Neisseria meningitidis isolatescausing invasive meningococcal disease in Australia.The program is undertaken by a network of referencelaboratories in each state and territory, using agreedstandard methodology to quantitatively determinethe susceptibility of N. meningitidis to a core group ofantibiotics. The results of the surveillance in 2001 haverecently been published.107 In 2001 about two-thirdsof all the isolates showed decreased susceptibility tothe penicillin group of antibiotics (MIC 0.06-0.5 mg/L),but all isolates tested were susceptible to thirdgeneration cephalosporins.
Tuberculosis
TB is an infectious disease caused by Mycobacterium
tuberculosis. The disease commonly affects thelungs and is usually transmitted person-to-person byairborne droplets.
Australia has one of the lowest rates of TB in theworld, with most cases occurring in overseas-bornand Indigenous Australians. The Federal Minister forHealth and Ageing recently launched The National
Strategic Plan for Tuberculosis Control in Australia
Beyond 2000, prepared by the National TuberculosisAdvisory Committee. The plan consists of three keyelements: case finding; treatment; and surveillance.Performance indicators have been developed toallow a regular review of the progress of the StrategicPlan.
In 2001, 989 TB notifications were received byNNDSS, a rate of 5.1 cases per 100,000 population.The notification rates of TB were lower than thenational average in the Australian Capital Territory,Queensland, South Australia, Tasmania and WesternAustralia. The highest rate was reported in the NorthernTerritory (17.5 cases per 100,000 population).
In 2001, the male to female ratio was equal as it hasbeen in the previous years. TB cases occurred in allage groups, with the highest age-specific ratesreported in the 85 years and over age group for bothmales (29.3 cases per 100,000 population) and females(11.4 cases per 100,000 population) (Figure 68).Detailed analyses of TB in Australia have recentlybeen published.108
Other communicable diseasesurveillance
Laboratory Virology and Serology
Reporting Scheme
LabVISE is a passive surveillance scheme based onvoluntary reports of infectious agents from virologyand serology laboratories around Australia. In 2001,reports from the scheme were analysed and publishedquarterly in Communicable Diseases Intelligence.
LabVISE provides information on a number of virusesand other infectious agents (bacteria, parasites andfungi) and the demographic characteristics of thoseinfected. The scheme monitors some infectiousagents that are not reported by other surveillancesystems. Interpretation of LabVISE data is limited byuncertainties about the representativeness of thedata, the lack of denominator data to calculate rates,and variable reporting coverage over time. In addition,there are no consistent case definitions currently inuse. Data from LabVISE between 1991 and 2000were recently analysed.109
In 2001, 15 laboratories contributed 24,492 reportsto LabVISE. This was an increase of 3.5 per cent onthe number of reports in 2000 and data were receivedfrom one additional laboratory (Canberra Hospital,ACT) in 2001. The total reports received are shownby state and territory in Table 24.
Annual report of the National Notifiable Diseases Surveillance System
CDI Vol 27, No 1 2003 69
Figure 68. Notification rates of tuberculosisAustralia, 2001, by age group andsex

Annual report of the National Notifiable Diseases Surveillance System
70 CDI Vol 27, No 1 2003
Table 24. Infectious agents reported to the Laboratory Virology and Serology Reporting Scheme,2001, by jurisdiction
Organism State or territory
ACT NSW NT Qld SA Tas Vic WA Aust
Measles virus 0 5 0 5 2 1 99 12 124
Mumps virus 0 1 0 1 4 0 8 18 32
Rubella virus 1 5 0 53 5 1 12 7 84
Hepatitis A virus 0 6 9 41 8 0 4 13 81
Hepatitis D virus 0 0 0 2 5 0 3 1 11
Hepatitis E virus 0 0 0 0 0 0 3 2 5
Ross River virus 0 31 92 463 89 3 33 153 864
Barmah Forest virus infection 0 14 7 208 3 0 1 36 269
Dengue 0 4 152 0 9 1 1 68 235
Murray Valley encephalitis
virus
0 0 5 1 0 0 0 1 7
Kunjin virus 0 0 3 1 0 0 0 5 9
Flavivirus (unspecified) 0 0 2 8 0 0 16 0 26
Adenovirus 6 249 32 33 404 14 245 235 1,218
Herpes virus 16 508 82 1,117 1,445 26 651 1,018 4,863
Other DNA viruses 0 6 5 86 194 0 53 103 447
Picornavirus 15 644 50 30 40 18 169 596 1,562
Ortho/paramyxoviruses 23 1,383 56 242 1,284 57 443 1,166 4,654
Other RNA viruses 21 668 5 1 322 16 333 524 1,890
Chlamydia trachomatis 50 529 129 927 773 29 41 930 3,409
Chlamydia pneumoniae 0 3 1 1 0 0 0 2 7
Chlamydia psittaci 1 4 4 0 0 0 59 9 77
Mycoplasma pneumoniae 0 88 28 221 268 15 178 173 971
Coxiella burnetii 4 10 0 59 13 0 47 28 161
Rickettsia species 0 0 0 0 1 4 2 3 10
Streptococcus group A 13 32 36 209 0 0 109 0 399
Streptococcus group B 20 0 0 0 0 0 0 0 20
Yersinia enterocolitica 0 4 0 0 0 0 1 0 5
Brucella species 0 0 0 4 1 0 1 0 6
Bordetella pertussis 23 202 35 239 863 7 269 28 1,666
Legionella pneumophila 0 2 0 0 0 0 62 3 67
Legionella longbeachae 0 1 2 0 3 0 3 28 37
Legionella species 0 0 0 0 0 0 15 0 15
Cryptococcus species 0 5 0 4 12 0 0 0 21
Leptospira species 0 1 1 24 11 1 0 2 40
Treponema pallidum 0 91 257 353 377 0 2 41 1,121
Protozoa 11 2 5 4 21 3 46
Echinococcus granulosus 0 0 0 0 19 0 1 13 33
Total 193 4,507 993 4,335 6,160 197 2,885 5,221 24,492
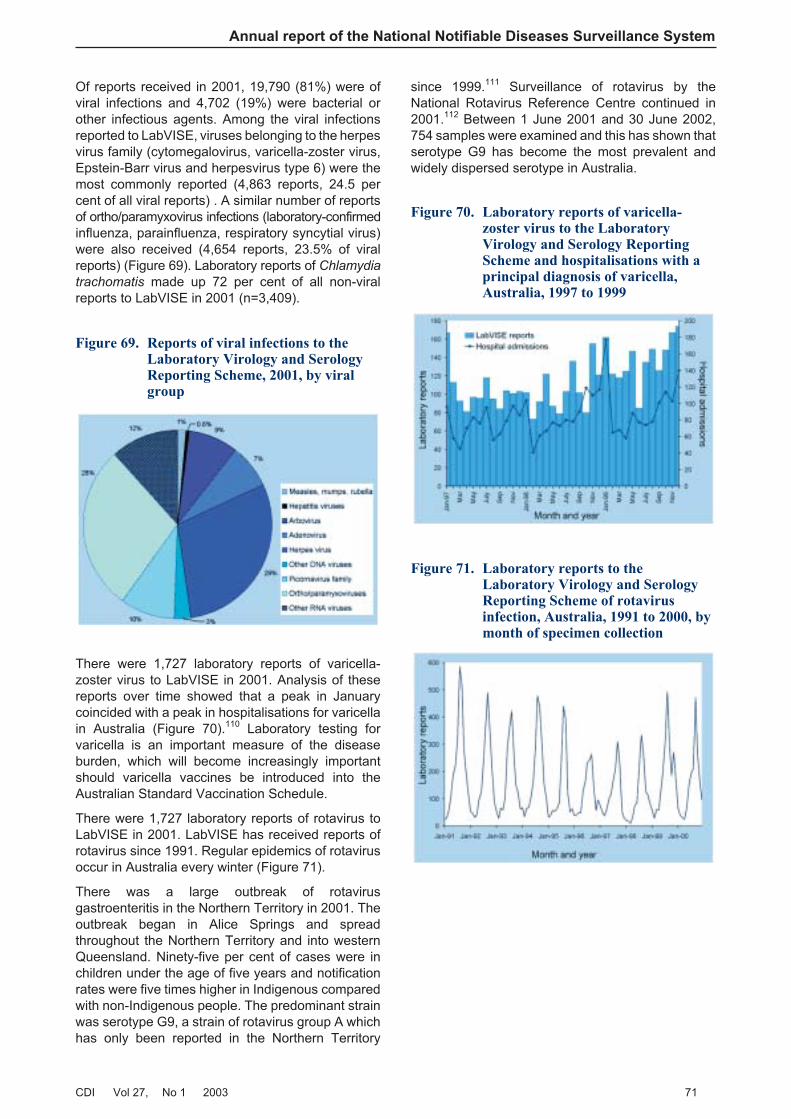
Of reports received in 2001, 19,790 (81%) were ofviral infections and 4,702 (19%) were bacterial orother infectious agents. Among the viral infectionsreported to LabVISE, viruses belonging to the herpesvirus family (cytomegalovirus, varicella-zoster virus,Epstein-Barr virus and herpesvirus type 6) were themost commonly reported (4,863 reports, 24.5 percent of all viral reports) . A similar number of reportsof ortho/paramyxovirus infections (laboratory-confirmedinfluenza, parainfluenza, respiratory syncytial virus)were also received (4,654 reports, 23.5% of viralreports) (Figure 69). Laboratory reports of Chlamydia
trachomatis made up 72 per cent of all non-viralreports to LabVISE in 2001 (n=3,409).
There were 1,727 laboratory reports of varicella-zoster virus to LabVISE in 2001. Analysis of thesereports over time showed that a peak in Januarycoincided with a peak in hospitalisations for varicellain Australia (Figure 70).110 Laboratory testing forvaricella is an important measure of the diseaseburden, which will become increasingly importantshould varicella vaccines be introduced into theAustralian Standard Vaccination Schedule.
There were 1,727 laboratory reports of rotavirus toLabVISE in 2001. LabVISE has received reports ofrotavirus since 1991. Regular epidemics of rotavirusoccur in Australia every winter (Figure 71).
There was a large outbreak of rotavirusgastroenteritis in the Northern Territory in 2001. Theoutbreak began in Alice Springs and spreadthroughout the Northern Territory and into westernQueensland. Ninety-five per cent of cases were inchildren under the age of five years and notificationrates were five times higher in Indigenous comparedwith non-Indigenous people. The predominant strainwas serotype G9, a strain of rotavirus group A whichhas only been reported in the Northern Territory
since 1999.111 Surveillance of rotavirus by theNational Rotavirus Reference Centre continued in2001.112 Between 1 June 2001 and 30 June 2002,754 samples were examined and this has shown thatserotype G9 has become the most prevalent andwidely dispersed serotype in Australia.
Annual report of the National Notifiable Diseases Surveillance System
CDI Vol 27, No 1 2003 71
Figure 69. Reports of viral infections to theLaboratory Virology and SerologyReporting Scheme, 2001, by viralgroup
Figure 70. Laboratory reports of varicella-zoster virus to the LaboratoryVirology and Serology ReportingScheme and hospitalisations with aprincipal diagnosis of varicella,Australia, 1997 to 1999
Figure 71. Laboratory reports to theLaboratory Virology and SerologyReporting Scheme of rotavirusinfection, Australia, 1991 to 2000, bymonth of specimen collection
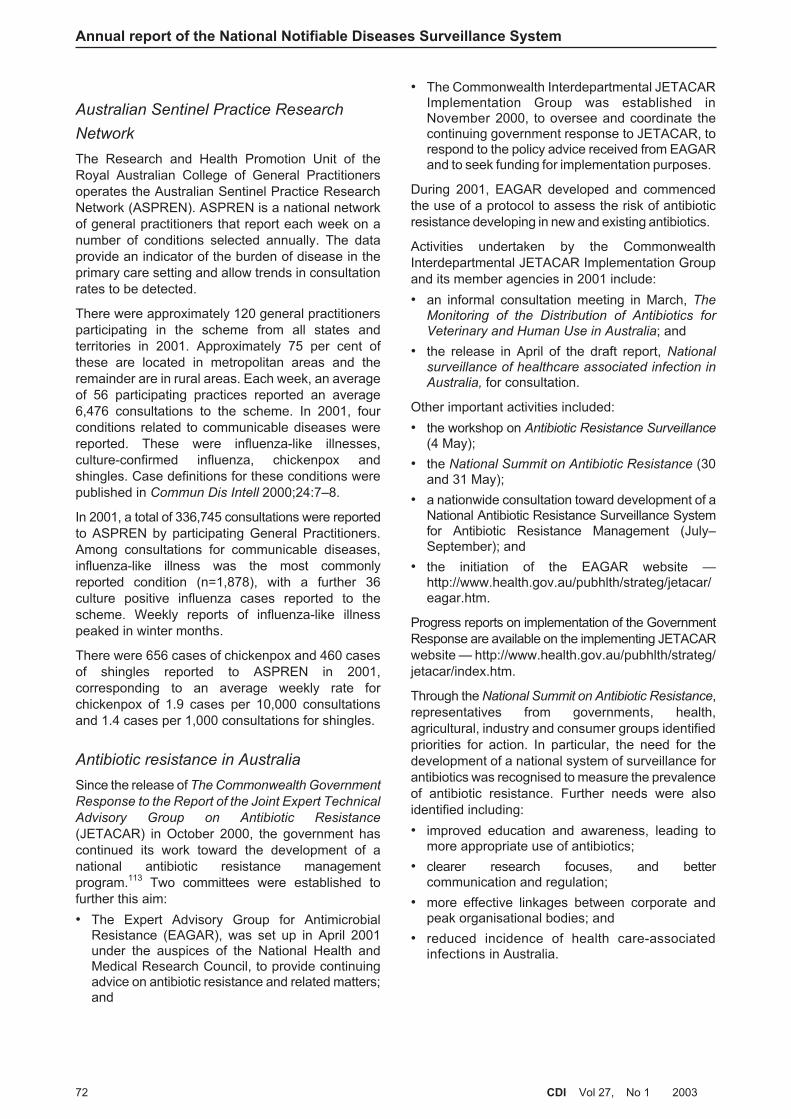
Australian Sentinel Practice Research
Network
The Research and Health Promotion Unit of theRoyal Australian College of General Practitionersoperates the Australian Sentinel Practice ResearchNetwork (ASPREN). ASPREN is a national networkof general practitioners that report each week on anumber of conditions selected annually. The dataprovide an indicator of the burden of disease in theprimary care setting and allow trends in consultationrates to be detected.
There were approximately 120 general practitionersparticipating in the scheme from all states andterritories in 2001. Approximately 75 per cent ofthese are located in metropolitan areas and theremainder are in rural areas. Each week, an averageof 56 participating practices reported an average6,476 consultations to the scheme. In 2001, fourconditions related to communicable diseases werereported. These were influenza-like illnesses,culture-confirmed influenza, chickenpox andshingles. Case definitions for these conditions werepublished in Commun Dis Intell 2000;24:7–8.
In 2001, a total of 336,745 consultations were reportedto ASPREN by participating General Practitioners.Among consultations for communicable diseases,influenza-like illness was the most commonlyreported condition (n=1,878), with a further 36culture positive influenza cases reported to thescheme. Weekly reports of influenza-like illnesspeaked in winter months.
There were 656 cases of chickenpox and 460 casesof shingles reported to ASPREN in 2001,corresponding to an average weekly rate forchickenpox of 1.9 cases per 10,000 consultationsand 1.4 cases per 1,000 consultations for shingles.
Antibiotic resistance in Australia
Since the release of The Commonwealth Government
Response to the Report of the Joint Expert Technical
Advisory Group on Antibiotic Resistance
(JETACAR) in October 2000, the government hascontinued its work toward the development of anational antibiotic resistance managementprogram.113 Two committees were established tofurther this aim:
• The Expert Advisory Group for AntimicrobialResistance (EAGAR), was set up in April 2001under the auspices of the National Health andMedical Research Council, to provide continuingadvice on antibiotic resistance and related matters;and
• The Commonwealth Interdepartmental JETACARImplementation Group was established inNovember 2000, to oversee and coordinate thecontinuing government response to JETACAR, torespond to the policy advice received from EAGARand to seek funding for implementation purposes.
During 2001, EAGAR developed and commencedthe use of a protocol to assess the risk of antibioticresistance developing in new and existing antibiotics.
Activities undertaken by the CommonwealthInterdepartmental JETACAR Implementation Groupand its member agencies in 2001 include:
• an informal consultation meeting in March, TheMonitoring of the Distribution of Antibiotics forVeterinary and Human Use in Australia; and
• the release in April of the draft report, Nationalsurveillance of healthcare associated infection inAustralia, for consultation.
Other important activities included:
• the workshop on Antibiotic Resistance Surveillance(4 May);
• the National Summit on Antibiotic Resistance (30and 31 May);
• a nationwide consultation toward development of aNational Antibiotic Resistance Surveillance Systemfor Antibiotic Resistance Management (July–September); and
• the initiation of the EAGAR website —http://www.health.gov.au/pubhlth/strateg/jetacar/eagar.htm.
Progress reports on implementation of the GovernmentResponse are available on the implementing JETACARwebsite — http://www.health.gov.au/pubhlth/strateg/jetacar/index.htm.
Through the National Summit on Antibiotic Resistance,representatives from governments, health,agricultural, industry and consumer groups identifiedpriorities for action. In particular, the need for thedevelopment of a national system of surveillance forantibiotics was recognised to measure the prevalenceof antibiotic resistance. Further needs were alsoidentified including:
• improved education and awareness, leading tomore appropriate use of antibiotics;
• clearer research focuses, and bettercommunication and regulation;
• more effective linkages between corporate andpeak organisational bodies; and
• reduced incidence of health care-associatedinfections in Australia.
Annual report of the National Notifiable Diseases Surveillance System
72 CDI Vol 27, No 1 2003
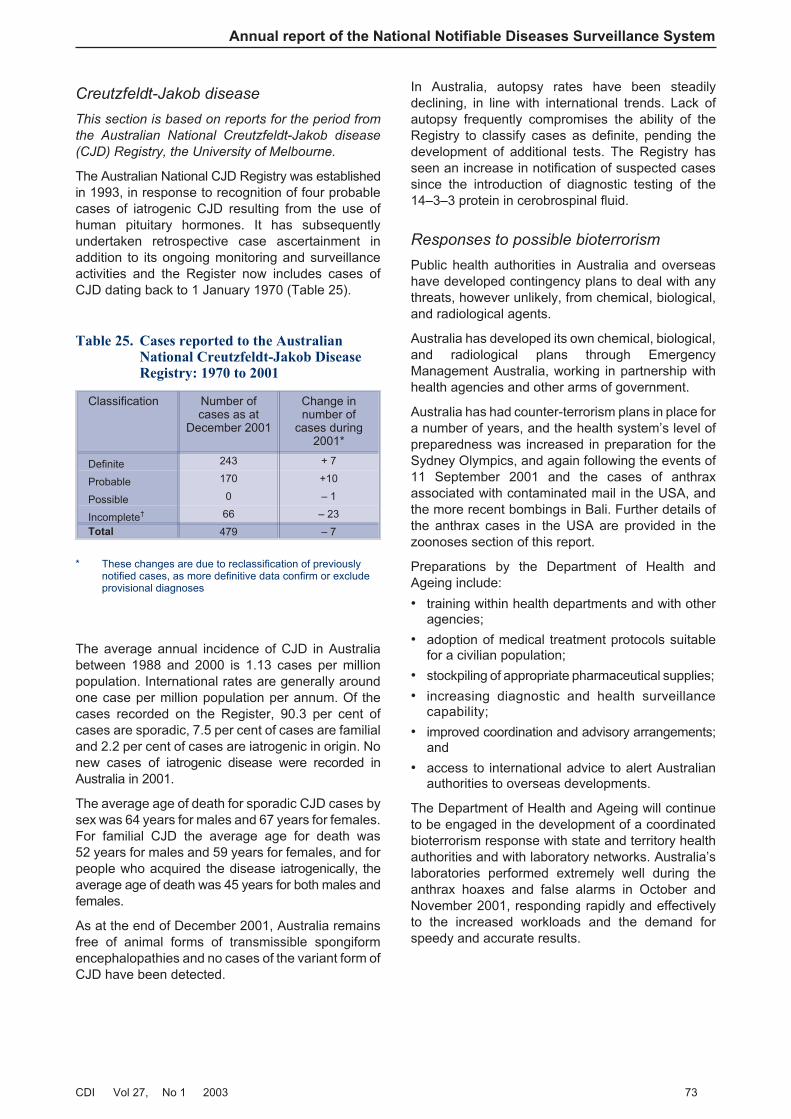
Creutzfeldt-Jakob disease
This section is based on reports for the period from
the Australian National Creutzfeldt-Jakob disease
(CJD) Registry, the University of Melbourne.
The Australian National CJD Registry was establishedin 1993, in response to recognition of four probablecases of iatrogenic CJD resulting from the use ofhuman pituitary hormones. It has subsequentlyundertaken retrospective case ascertainment inaddition to its ongoing monitoring and surveillanceactivities and the Register now includes cases ofCJD dating back to 1 January 1970 (Table 25).
The average annual incidence of CJD in Australiabetween 1988 and 2000 is 1.13 cases per millionpopulation. International rates are generally aroundone case per million population per annum. Of thecases recorded on the Register, 90.3 per cent ofcases are sporadic, 7.5 per cent of cases are familialand 2.2 per cent of cases are iatrogenic in origin. Nonew cases of iatrogenic disease were recorded inAustralia in 2001.
The average age of death for sporadic CJD cases bysex was 64 years for males and 67 years for females.For familial CJD the average age for death was52 years for males and 59 years for females, and forpeople who acquired the disease iatrogenically, theaverage age of death was 45 years for both males andfemales.
As at the end of December 2001, Australia remainsfree of animal forms of transmissible spongiformencephalopathies and no cases of the variant form ofCJD have been detected.
In Australia, autopsy rates have been steadilydeclining, in line with international trends. Lack ofautopsy frequently compromises the ability of theRegistry to classify cases as definite, pending thedevelopment of additional tests. The Registry hasseen an increase in notification of suspected casessince the introduction of diagnostic testing of the14–3–3 protein in cerobrospinal fluid.
Responses to possible bioterrorism
Public health authorities in Australia and overseashave developed contingency plans to deal with anythreats, however unlikely, from chemical, biological,and radiological agents.
Australia has developed its own chemical, biological,and radiological plans through EmergencyManagement Australia, working in partnership withhealth agencies and other arms of government.
Australia has had counter-terrorism plans in place fora number of years, and the health system’s level ofpreparedness was increased in preparation for theSydney Olympics, and again following the events of11 September 2001 and the cases of anthraxassociated with contaminated mail in the USA, andthe more recent bombings in Bali. Further details ofthe anthrax cases in the USA are provided in thezoonoses section of this report.
Preparations by the Department of Health andAgeing include:
• training within health departments and with otheragencies;
• adoption of medical treatment protocols suitablefor a civilian population;
• stockpiling of appropriate pharmaceutical supplies;
• increasing diagnostic and health surveillancecapability;
• improved coordination and advisory arrangements;and
• access to international advice to alert Australianauthorities to overseas developments.
The Department of Health and Ageing will continueto be engaged in the development of a coordinatedbioterrorism response with state and territory healthauthorities and with laboratory networks. Australia’slaboratories performed extremely well during theanthrax hoaxes and false alarms in October andNovember 2001, responding rapidly and effectivelyto the increased workloads and the demand forspeedy and accurate results.
Annual report of the National Notifiable Diseases Surveillance System
CDI Vol 27, No 1 2003 73
Table 25. Cases reported to the AustralianNational Creutzfeldt-Jakob DiseaseRegistry: 1970 to 2001
Classification Number ofcases as at
December 2001
Change innumber of
cases during2001*
Definite 243 + 7
Probable 170 +10
Possible 0 – 1
Incomplete† 66 – 23
Total 479 – 7
* These changes are due to reclassification of previouslynotified cases, as more definitive data confirm or excludeprovisional diagnoses
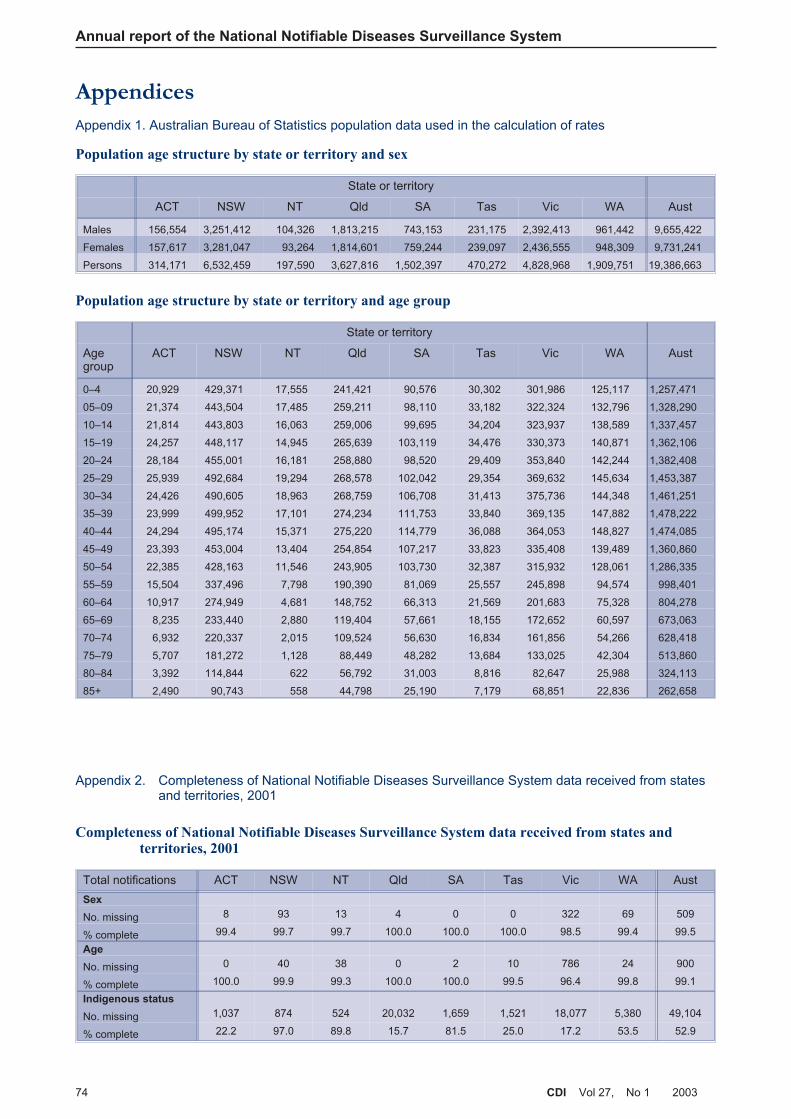
AppendicesAppendix 1. Australian Bureau of Statistics population data used in the calculation of rates
Appendix 2. Completeness of National Notifiable Diseases Surveillance System data received from statesand territories, 2001
Annual report of the National Notifiable Diseases Surveillance System
74 CDI Vol 27, No 1 2003
Completeness of National Notifiable Diseases Surveillance System data received from states andterritories, 2001
Total notifications ACT NSW NT Qld SA Tas Vic WA Aust
Sex
No. missing 8 93 13 4 0 0 322 69 509
% complete 99.4 99.7 99.7 100.0 100.0 100.0 98.5 99.4 99.5
Age
No. missing 0 40 38 0 2 10 786 24 900
% complete 100.0 99.9 99.3 100.0 100.0 99.5 96.4 99.8 99.1
Indigenous status
No. missing 1,037 874 524 20,032 1,659 1,521 18,077 5,380 49,104
% complete 22.2 97.0 89.8 15.7 81.5 25.0 17.2 53.5 52.9
Population age structure by state or territory and sex
State or territory
ACT NSW NT Qld SA Tas Vic WA Aust
Males 156,554 3,251,412 104,326 1,813,215 743,153 231,175 2,392,413 961,442 9,655,422
Females 157,617 3,281,047 93,264 1,814,601 759,244 239,097 2,436,555 948,309 9,731,241
Persons 314,171 6,532,459 197,590 3,627,816 1,502,397 470,272 4,828,968 1,909,751 19,386,663
Population age structure by state or territory and age group
State or territory
Agegroup
ACT NSW NT Qld SA Tas Vic WA Aust
0–4 20,929 429,371 17,555 241,421 90,576 30,302 301,986 125,117 1,257,471
05–09 21,374 443,504 17,485 259,211 98,110 33,182 322,324 132,796 1,328,290
10–14 21,814 443,803 16,063 259,006 99,695 34,204 323,937 138,589 1,337,457
15–19 24,257 448,117 14,945 265,639 103,119 34,476 330,373 140,871 1,362,106
20–24 28,184 455,001 16,181 258,880 98,520 29,409 353,840 142,244 1,382,408
25–29 25,939 492,684 19,294 268,578 102,042 29,354 369,632 145,634 1,453,387
30–34 24,426 490,605 18,963 268,759 106,708 31,413 375,736 144,348 1,461,251
35–39 23,999 499,952 17,101 274,234 111,753 33,840 369,135 147,882 1,478,222
40–44 24,294 495,174 15,371 275,220 114,779 36,088 364,053 148,827 1,474,085
45–49 23,393 453,004 13,404 254,854 107,217 33,823 335,408 139,489 1,360,860
50–54 22,385 428,163 11,546 243,905 103,730 32,387 315,932 128,061 1,286,335
55–59 15,504 337,496 7,798 190,390 81,069 25,557 245,898 94,574 998,401
60–64 10,917 274,949 4,681 148,752 66,313 21,569 201,683 75,328 804,278
65–69 8,235 233,440 2,880 119,404 57,661 18,155 172,652 60,597 673,063
70–74 6,932 220,337 2,015 109,524 56,630 16,834 161,856 54,266 628,418
75–79 5,707 181,272 1,128 88,449 48,282 13,684 133,025 42,304 513,860
80–84 3,392 114,844 622 56,792 31,003 8,816 82,647 25,988 324,113
85+ 2,490 90,743 558 44,798 25,190 7,179 68,851 22,836 262,658
References1. Jernigan DB, Ragunathan PL, Bell BP, Brechner R,
Bresnitz EA, Butler JC, et al. Investigation ofbioterrorism-related anthrax, United States, 2001:epidemiologic findings. Emerg Infect Dis2002;8:1019–1028.
2. Black S, Shinefield H, Fireman B, Lewis E, Ray P,Hansen JR. Efficacy, safety and immunogenicity ofheptavalent pneumococcal conjugate vaccine inchildren. Northern California Kaiser PermanenteVaccine Study Center Group. Pediatr Infect Dis J2000;19:187–195.
3. Brooke FJ. Australia announces new measures forimported beef products. Commun Dis Intell2001;25:253.
4. Laver G, Garman E. The origin and control ofpandemic influenza. Science 2001;293:1776–1777.
5. Hatta M, Gao P, Halfmann P, Kawaoka Y. Molecularbasis for high virulence of Hong Kong H5N1influenza A viruses. Science 2001;293:1840–1842.
6. Ashbolt R, Givney R, Gregory J, Hall G, Hundy R,Kirk M, et al. Enhancing foodborne disease surveillanceacross Australia in 2001: the OzFoodNet WorkingGroup. Commun Dis Intell 2001;26:375–406.
7. National Centre in HIV Epidemiology and ClinicalResearch. Australian Hepatitis C SurveillanceStrategy. National Centre in HIV Epidemiology andClinical Research, Sydney; 1999.
8. National Centre in HIV Epidemiology and ClinicalResearch. Estimates and projections of thehepatitis C virus epidemic in Australia 2002. Sydney:National Centre in HIV Epidemiology and ClinicalResearch, Sydney; 2002.
9. Hellard ME, Sinclair MI, Forbes AB, Fairley CK. Arandomized, blinded, controlled trial investigating thegastrointestinal health effects of drinking waterquality. Environ Health Perspect 2001;109:773–778.
10. Australia New Zealand Food Authority. Food safetystandards, costs and benefits. Canberra; 1999.
11. Tauxe RV. Emerging foodborne diseases: anevolving public health challenge. Emerg Infect Dis1997;3:425–434.
12. Cox N, Hinkle R. Infant botulism. Am Fam Physician2002;65:1388–1392.
13. McMaster P, Piper S, Schell D, Gillis J, Chong A.A taste of honey. J Paediatr Child Health2000;36:596–597.
14. Wheeler JG, Sethi D, Cowden JM, Wall PG,Rodrigues LC, Tompkins DS, et al. Study ofinfectious intestinal disease in England: rates in thecommunity, presenting to general practice, and reportedto national surveillance. BMJ 1999;318:1046–1050.
15. Allos BM. Campylobacter jejuni infections: update onemerging issues and trends. Clin Infect Dis2001;32:1201–1206.
16. Chin J ed. Control of Communicable DiseasesManual 17th edition. Washington: American PublicHealth Association, 2000.
17. Clark DP. New insights into human cryptosporidiosis.Clin Microbiol Rev 1999;12:554–563.
18. Protracted outbreaks of cryptosporidiosis associatedwith swimming pool use — Ohio and Nebraska, 2000.MMWR Morb Mortal Wkly Rep 2001;50:406–410.
19. Harper CM, Cowell NA, Adams BC, Langley AJ,Wohlsen TD. Outbreak of Cryptosporidium linked todrinking unpasteurised milk. Commun Dis Intell2002;26:449–450.
20. Conaty S, Bird P, Bell G, Kraa E, Grohmann G,McAnulty JM. Hepatitis A in New South Wales,Australia, from consumption of oysters: the first reportedoutbreak. Epidemiol Infect 2000;124:121–130.
21. Amin J, Gilbert GL, Escott RG, Heath TC, BurgessMA. Hepatitis A epidemiology in Australia: nationalseroprevalence and notifications. Med J Aust2001;174:338–341.
22. Schlech WF 3rd. Foodborne listeriosis. Clin InfectDis 2000;31:770–775.
23. Kirk M, Prasopa-Plaizier N, Dalton C, Unicomb L,Gregory J. The epidemiology of listeriosis in Australia.In: Listeria Risk Assessment and ManagementStrategy. Canberra: Food Standards Australia NewZealand; 2002.
24. Bull AL, Crerar SK, Beers MY. Australia’s importedfood program — a valuable source of informationon micro-organisms in foods. Commun Dis Intell2002;26:28–32.
25. Mead PS, Slutsker L, Dietz V, McCaig LF, Bresee JS,Shapiro C, et al. Food-related illness and death in theUnited States. Emerg Infect Dis 1999;5:607–625.
26. National Enteric Pathogen Surveillance Scheme.Human annual report, 2001. Melbourne: MicrobiologicalDiagnostic Unit, University of Melbourne; 2002.
27. ProMed-Mail. Salmonella Typhimurium DT104 - Australia,Europe. ProMed Mail (www.promedmail.org) 2001:Archive Number 20010822.1980.
28. Hohmann EL. Nontyphoidal salmonellosis. Clin InfectDis 2001;32:263–269.
29. ProMed-Mail. Salmonella Stanley, Peanuts — Australia— recall. ProMed Mail (www.promedmail.org)2001:Archive Number 20010911.2189.
30. Stafford RJ, McCall BJ, Neill AS, Leon DS, Dorricott GJ,Towner CD, et al. A statewide outbreak ofSalmonella Bovismorbificans phage type 32 infectionin Queensland. Commun Dis Intell2002;26:568–573.
31. Armstrong P. Considerations around an increase ofSalmonella Mgulani notifications in the Top End.Northern Territory Disease Control Bulletin2002;9:8–10.
32. Lesjak M, Delpech V, Ferson M, Morgan K,Paraskevopoulos P, McAnulty J. A SalmonellaMgulani cluster in New South Wales. Commun DisIntell 2000;24:304–305.
33. Lightfoot D. Shigella. In: Hocking AD, Arnold G,Jenson I, Newton K, Sutherland P, editors.Foodborne microorganisms of public healthsignificance. Sydney: Australian Institute of FoodScience and Technology Inc. NSW Branch, FoodMicrobiology Group; 1997:467–472.
34. Givney R, Darzenos J, Davos D. Shigella at a wake inAdelaide, June 1998. Commun Dis Intell1998;22:297.
35. McCall B, Stafford R, Cherian S, Heel K, Smith H,Corones N, et al. An outbreak of multi-resistantShigella sonnei in a long-stay geriatric nursingcentre. Commun Dis Intell 2000;24:272–275.
Annual report of the National Notifiable Diseases Surveillance System
CDI Vol 27, No 1 2003 75
36. O’Sullivan B, Delpech V, Pontivivo G, Karagiannis T,Marriott D, Harkness J, et al. Shigellosis linked tosex venues, Australia. Emerg Infect Dis2002;8:862–864.
37. Cummings KC, Mohle-Boetani JC, Werner SB, VugiaDJ. Population-based trends in pediatric hemolyticuremic syndrome in California, 1994–1999: substantialunderreporting and public health implications. Am JEpidemiol 2002;155:941–948.
38. Elliott EJ, Robins-Browne RM, O’Loughlin EV,Bennett-Wood V, Bourke J, Henning P, et al.Nationwide study of haemolytic uraemic syndrome:clinical, microbiological, and epidemiologicalfeatures. Arch Dis Child 2001;85:125-131.
39. Grattan-Smith PJ, O’Regan WJ, Ellis PS, O’FlahertySJ, McIntyre PB, Barnes CJ. Rabies. A secondAustralian case with a long incubation period. Med JAust 1992;156:651–654.
40. Tapsall J. Annual report of the Australian GonococcalSurveillance Programme, 2001. Commun Dis Intell2002;26:242–247.
41. National Centre in HIV Epidemiology and ClinicalResearch. HIV/AIDS, viral hepatitis and sexuallytransmissible infections in Australia annual surveillancereport 2001. Sydney: National Centre in HIVEpidemiology and Clinical Research, The Universityof New South Wales; 2001. Report No: 1442–8784.
42. Eng T, Butler W. The hidden epidemic: confrontingsexually transmissible diseases. Washington, D.C.:National Academy Press; 1997.
43. Chlamydia strategy for Victoria (2001–2004).Melbourne: Victorian Government Department of HealthServices; 2001. Report No: 0330700.
44. Ballard R. Calymmatobacterium granulomatis(donovanosis, granuloma inguinale). In: Mandell G,Bennett J, Dolin R, editors. Principles Practice ofInfectious Diseases. New York: Churchill Livingstone;1995:2210–2213.
45. Bowden F, Savage J. Is the eradication of donovanosispossible in Australia? Aust N Z J Public Health1998;22:7–8.
46. Mein JK, Anstey NM, Bowden FJ. Missing thediagnosis of donovanosis in northern Australia. MedJ Aust 1999;170:48.
47. O’Farrell N. Donovanosis: an update. Int J STD AIDS2001;12:423–427.
48. Miller P. Donovanosis control or eradication? Asituational review of donovanosis in Aboriginal andTorres Strait Islander populations in Australia.Canberra: Commonwealth of Australia; 2001.
49. Queensland Department of Health. 1997–2001notifiable diseases report: Communicable DiseasesUnit, Queensland Department of Health; 2001.
50. Andrews R, O’Grady K, Tallis G. Surveillance ofnotifiable infectious diseases in Victoria 2001.Melbourne: Communicable Diseases Section,Victorian Department of Human Services; 2002.
51. Australian Gonococcal Surveillance Programme.Annual report of the Australian GonococcalSurveillance Programme, 2001. Commun Dis Intell2002;26:242–247.
52. Surveillance report. Victorian Infectious DiseasesBulletin 2002;5:12.
53. McIntyre P, Gidding H, Gilmour R, Lawrence G, HullB, Horby P, et al. Vaccine preventable diseases andvaccination coverage in Australia, 1999–2000.Commun Dis Intell 2002;26:64–66.
54. National Health and Medical Research Council. TheAustralian Immunisation Handbook, 7th ed. Canberra:Australian Government Publishing Service, 2000.
55. Torzillo PJ, Gratten M. Conjugate pneumococcalvaccines for Aboriginal children in Australia. Med JAust 2000;173:S51–S53.
56. Roche P, Spencer J, Hampson A. Annual report ofthe National Influenza Surveillance Scheme, 2001.Commun Dis Intell 2002;26:204–213.
57. Measles: progress towards global control andregional elimination 1998–1999. Wkly Epidemiol Rec1999;74:429–440.
58. Gay NJ. Eliminating measles — no quick fix. BullWorld Health Organ 2000;78:949.
59. Davidson N, Andrews R, Riddell M, Leydon J,Lynch P. A measles outbreak among young adults inVictoria, February, 2001. Commun Dis Intell2002;26:273–278.
60. Victorian Infectious Diseases Reference Laboratory.Victorian Infectious Diseases Reference Laboratory,annual report, 2001. Melbourne; 2002.
61. Hewlett EL. Bordetella species. In: Mandell GL,Bennett JE, Dolin R, editors. Principles and Practicesof Infectious Diseases. 4th ed. New York: ChurchillLivingstone: 1995:2078–2084.
62. Roche P, Krause V. Invasive pneumococcal diseasein Australia, 2001. Commun Dis Intell 2002;26:505–519.
63. Hills SL, Hanna JN, Murphy D. Invasive pneumococcaldisease in North Queensland, 2001. Commun DisIntell 2002;26:520–524.
64. Thorley BR, Brussen KA, Stambos V, Yuen LKW,Kelly HA. Annual report of the Australian NationalPoliovirus Reference Laboratory and summary ofacute flaccid paralysis surveillance, 2001. CommunDis Intell 2002;26:419–427.
65. Boughton CR. Australian arboviruses of medicalimportance: The Royal Australian College of GeneralPractitioners; 1996.
66. Mylonas AD, Brown AM, Carthew TL, McGrath B,Purdie DM, Pandeya N, et al. Natural history of RossRiver virus-induced epidemic polyarthritis. Med JAust 2002;177:356–360.
67. Merianos A, Farland AM, Patel M, Currie B,Whelan P, Dentith H, et al. A concurrent outbreak ofBarmah Forest and Ross River virus disease inNhulunbuy, Northern Territory. Commun Dis Intell1992;16:110–111.
68. Selden SM, Cameron SA. Changing epidemiology ofRoss River virus disease in South Australia. Med JAust 1996;165:313–317.
69. Mackenzie JS, Chua KB, Daniels PW, Eaton BT,Field HE, Hall RA, et al. Emerging viral diseases ofSoutheast Asia and the Western Pacific. EmergInfect Dis 2001;7 Suppl 3:497–504.
70. Tong S, Bi P, Hayes J, Donald K, Mackenzie J.Geographic variation of notified Ross River virusinfections in Queensland, Australia, 1985–1996. AmJ Trop Med Hyg 2001;65:171–176.
Annual report of the National Notifiable Diseases Surveillance System
76 CDI Vol 27, No 1 2003
71. Amin J, Hueston L, Dwyer DE, Capon A. Ross Rivervirus infection in the north-west outskirts of theSydney basin. Commun Dis Intell 1998;22:101–102.
72. Ryan PA, Do KA, Kay BH. Spatial and temporalanalysis of Ross River virus disease patterns atMaroochy Shire, Australia: association betweenhuman morbidity and mosquito (Diptera: Culicidae)abundance. J Med Entomol 1999;36:515–521.
73. Doggett S, Russell R, Clancy J, Haniotis J, CloonanMJ. Barmah Forest virus epidemic on the south coastof New South Wales, Australia, 1994–1995. J MedEntomol 1999;36:861–868.
74. Hii J, Dyke T, Dagoro H, Sanders R. Health impactassessments of malaria and Ross River virusinfection in the Southern Highlands province ofPapua New Guinea. P N G Med J 1997;40:14–25.
75. Mackenzie JS, Broom AK, Hall RA, Johansen CA,Lindsay MD, Phillips DA, et al. Arboviruses in theAustralian region, 1990 to 1998. Commun Dis Intell1998;22:93–100.
76. Johansen CA, van den Hurk AF, Ritchie SA,Zborowski P, Nisbet DJ, Paru R, et al. Isolation ofJapanese encephalitis virus from mosquitoes (Diptera:Culicidae) collected in the Western Province of PapuaNew Guinea. Am J Trop Med Hyg 2000;62:631–638.
77. Crump JA, Murdoch DR, Baker MG. Emerginginfectious diseases in an island ecosystem: theNew Zealand perspective. Emerg Infect Dis2001;7:767–772.
78. Spencer JD, Azoulas J, Buick TD, Daniels PW,Doggett SL, Hapgood GD, et al. Murray Valleyencephalitis virus surveillance and control initiativesin Australia. Commun Dis Intell 2001;25:33–48.
79. Mackenzie JS, Smith DW, Broom AK, Bucens MR.Australian encephalitis in Western Australia, 1978–1991. Med J Aust 1993;158:591–595.
80. Cordova SP, Smith DW, Broom AK, Lindsay MD,Dowse GK, Beers MY. Murray Valley encephalitis inWestern Australia in 2000, with evidence of southerlyspread. Commun Dis Intell 2000;24:368–372.
81. Brown A, Krause V. Central Australian MVE update,2001. Commun Dis Intell 2001;25:49.
82. Brown A, Bolisetti S, Whelan P, Smith D, Wheaton G.Reappearance of human cases due to Murray Valleyencephalitis virus and Kunjin virus in Central Australiaafter an absence of 26 years. Commun Dis Intell2002;26:39–44.
83. Hall RA, Broom AK, Smith DW, Mackenzie JS. Theecology and epidemiology of Kunjin virus. Curr TopMicrobiol Immunol 2002;267:253–269.
84. ProMed-Mail. Viral enceph., imported — Germany exAustralia (03). www.promedmail.org 2001:ArchiveNumber 20010524.1007.
85. Hanna JN, Ritchie SA, Phillips DA, Shield J, BaileyMC, Mackenzie JS, et al. An outbreak of Japaneseencephalitis in the Torres Strait, Australia, 1995. MedJ Aust 1996;165:256–260.
86. Hanna JN, Ritchie SA, Phillips DA, Lee JM, Hills SL,van den Hurk AF, et al. Japanese encephalitis innorth Queensland, Australia, 1998. Med J Aust1999;170:533–536.
87. Mackenzie JS, Ritchie SA. CSIRO shows macropodsunlikely hosts for JE. Aust Vet J 2001;79:168.
88. Mackenzie JS, Johansen CA, Ritchie SA, van denHurk AF, Hall RA. Japanese encephalitis as anemerging virus: the emergence and spread ofJapanese encephalitis virus in Australasia. Curr TopMicrobiol Immunol 2002;267:49–73.
89. Mandell GL, Bennett JE, Dolin R, editors. Principlesand Practices of Infectious Diseases. 4th ed. NewYork: Churchill Livingstone: 1995.
90. Kurane I, Takasaki T. Dengue fever and denguehaemorrhagic fever: challenges of controlling anenemy still at large. Rev Med Virol 2001;11:301–311.
91. Mackenzie JS, la Brooy JT, Hueston L, CunninghamAL. Dengue in Australia. J Med Microbiol1996;45:159–161.
92. Hills S, Piispanen J, Humphreys J, Foley P. A focal,rapidly-controlled outbreak of dengue fever in twosuburbs in Townsville, North Queensland, 2001.Commun Dis Intell 2002;26:596–600.
93. World Health Organization. Strengthening imple-mentation of the global strategy for dengue fever/dengue hemorrhagic fever prevention and control.Geneva: World Health Organization; 1999 October.Available from: http://www.who.int/csr/resources/publications/dengue/whocdsdenic20001.pdf.Accessed 30 January 2003.
94. Cousins DV, Roberts JL. Australia’s campaign toeradicate bovine tuberculosis: the battle for freedomand beyond. Tuberculosis (Edinb) 2001;81:5–15.
95. Williams DT, Daniels PW, Lunt RA, Wang LF,Newberry KM, Mackenzie JS. Experimentalinfections of pigs with Japanese encephalitis virusand closely related Australian flaviviruses. Am J TropMed Hyg 2001;65:379–387.
96. Smythe L, Dohnt M, Symonds M, Barnett L, Moore M,Brookes D, et al. Review of leptospirosis notificationsin Queensland and Australia: January 1998 — June1999. Commun Dis Intell 2000;24:153–157.
97. Mancel E, Merien F, Present L, Salino D, AngibaudG, Perolat P. Clinical aspects of ocular leptospirosisin New Caledonia (South Pacific). Aust N Z JOphthalmol 1999;27:380–386.
98. Levett PN. Leptospirosis. Clin Microbiol Rev 2001;14:296–326.
99. McCall BJ, Epstein JH, Neill AS, Heel K, Field H,Barrett J, et al. Potential exposure to Australian Batlyssavirus, Queensland, 1996–1999. Emerg InfectDis 2000;6:259–264.
100. New South Wales Health Department. Anthrax. NSWPublic Health Bulletin 2001:12.
101. Hall R. Notifiable disease surveillance, 1917 to 1991.Commun Dis Intell 1993;17:226–236.
102. Lin M, Roche P, Spencer J, Milton A, Wright P,Witteveen D, et al. Australia’s notifiable diseasestatus, 2000. Annual report of the National NotifiableDiseases Surveillance System. Commun Dis Intell2002;26:118–203.
103. Li J, O’Brien ED, Guest C. A review of nationallegionellosis surveillance in Australia, 1991 to 2000.Commun Dis Intell 2002;26:462–470.
104. Leprosy — global situation. Wkly Epidemiol Rec2002;77:1–8.
105. Herf C, Nichols J, Fruh S, Holloway B, Anderson CU.Meningococcal disease recognition, treatment andprevention. Nurse Pract 1998;23:33–36.
Annual report of the National Notifiable Diseases Surveillance System
CDI Vol 27, No 1 2003 77
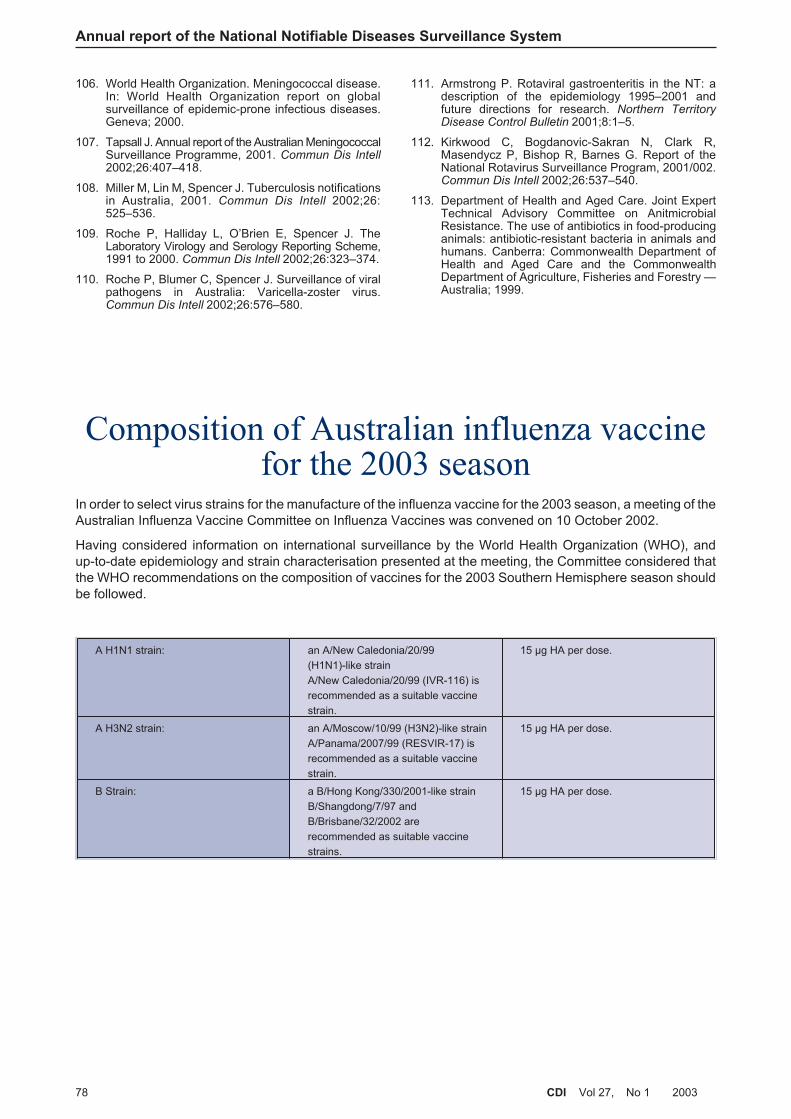
106. World Health Organization. Meningococcal disease.In: World Health Organization report on globalsurveillance of epidemic-prone infectious diseases.Geneva; 2000.
107. Tapsall J. Annual report of the Australian MeningococcalSurveillance Programme, 2001. Commun Dis Intell2002;26:407–418.
108. Miller M, Lin M, Spencer J. Tuberculosis notificationsin Australia, 2001. Commun Dis Intell 2002;26:525–536.
109. Roche P, Halliday L, O’Brien E, Spencer J. TheLaboratory Virology and Serology Reporting Scheme,1991 to 2000. Commun Dis Intell 2002;26:323–374.
110. Roche P, Blumer C, Spencer J. Surveillance of viralpathogens in Australia: Varicella-zoster virus.Commun Dis Intell 2002;26:576–580.
111. Armstrong P. Rotaviral gastroenteritis in the NT: adescription of the epidemiology 1995–2001 andfuture directions for research. Northern TerritoryDisease Control Bulletin 2001;8:1–5.
112. Kirkwood C, Bogdanovic-Sakran N, Clark R,Masendycz P, Bishop R, Barnes G. Report of theNational Rotavirus Surveillance Program, 2001/002.Commun Dis Intell 2002;26:537–540.
113. Department of Health and Aged Care. Joint ExpertTechnical Advisory Committee on AnitmicrobialResistance. The use of antibiotics in food-producinganimals: antibiotic-resistant bacteria in animals andhumans. Canberra: Commonwealth Department ofHealth and Aged Care and the CommonwealthDepartment of Agriculture, Fisheries and Forestry —Australia; 1999.
Composition of Australian influenza vaccinefor the 2003 season
In order to select virus strains for the manufacture of the influenza vaccine for the 2003 season, a meeting of theAustralian Influenza Vaccine Committee on Influenza Vaccines was convened on 10 October 2002.
Having considered information on international surveillance by the World Health Organization (WHO), andup-to-date epidemiology and strain characterisation presented at the meeting, the Committee considered thatthe WHO recommendations on the composition of vaccines for the 2003 Southern Hemisphere season shouldbe followed.
Annual report of the National Notifiable Diseases Surveillance System
78 CDI Vol 27, No 1 2003
A H1N1 strain: an A/New Caledonia/20/99
(H1N1)-like strain
A/New Caledonia/20/99 (IVR-116) is
recommended as a suitable vaccine
strain.
15 µg HA per dose.
A H3N2 strain: an A/Moscow/10/99 (H3N2)-like strain
A/Panama/2007/99 (RESVIR-17) is
recommended as a suitable vaccine
strain.
15 µg HA per dose.
B Strain: a B/Hong Kong/330/2001-like strain
B/Shangdong/7/97 and
B/Brisbane/32/2002 are
recommended as suitable vaccine
strains.
15 µg HA per dose.