Australia's notifiable diseases status, 2000 Annual report of the National Notifiable Diseases...
87
Annual report of the National Notifiable Diseases Surveillance System 118 CDI Vol 26, No 2, 2002 With contributions from: National organisations Communicable Diseases Network Australia Australian Childhood Immunisation Register Australian National Creutzfeldt-Jakob Disease Registry Australian Gonococcal Surveillance Programme Australian Meningococcal Surveillance Programme Australian Sentinel Practice Research Network Australian Quarantine and Inspection Service National Centre in HIV Epidemiology and Clinical Research National Centre for Immunisation Research and Surveillance of Vaccine Preventable Diseases National Enteric Pathogens Surveillance Scheme National Rotavirus Research Centre Sentinel Chicken Surveillance Programme World Health Organization Collaborating Centre for Reference and Research on Influenza State and Territory health departments Communicable Diseases Control Unit, Australian Capital Territory Department of Health and Community Care, Australian Capital Territory Communicable Diseases Surveillance and Control Unit, New South Wales Health Department, New South Wales Centre for Disease Control, Northern Territory Department of Health and Community Services, Northern Territory Communicable Diseases Unit, Queensland Health, Queensland Communicable Diseases Control Branch, South Australian Health Commission, South Australia Communicable Diseases Surveillance, Department of Health and Human Services, Tasmania Communicable Diseases Section, Department of Human Services, Victoria Communicable Diseases Control Branch, Health Department of Western Australia, Western Australia Australia’s notifiable diseases status, 2000 Annual report of the National Notifiable Diseases Surveillance System Ming Lin, 1 Paul Roche, 1 Jenean Spencer, 1 Alison Milton, 1 Phil Wright, 1 David Witteveen, 1 Robyn Leader, 1 Angela Merianos, 1 Chris Bunn, 2 Heather Gidding, 3 John Kaldor, 4 Martyn Kirk, 5 Rob Hall, 6 Tony Della-Porta 7
-
Upload
independent -
Category
Documents
-
view
1 -
download
0
Transcript of Australia's notifiable diseases status, 2000 Annual report of the National Notifiable Diseases...

Annual report of the National Notifiable Diseases Surveillance System
118 CDI Vol 26, No 2, 2002
With contributions from:
National organisations
Communicable Diseases Network Australia
Australian Childhood Immunisation Register
Australian National Creutzfeldt-Jakob Disease Registry
Australian Gonococcal Surveillance Programme
Australian Meningococcal Surveillance Programme
Australian Sentinel Practice Research Network
Australian Quarantine and Inspection Service
National Centre in HIV Epidemiology and Clinical Research
National Centre for Immunisation Research and Surveillance of Vaccine Preventable Diseases
National Enteric Pathogens Surveillance Scheme
National Rotavirus Research Centre
Sentinel Chicken Surveillance Programme
World Health Organization Collaborating Centre for Reference and Research on Influenza
State and Territory health departments
Communicable Diseases Control Unit, Australian Capital Territory Department of Health and Community Care,Australian Capital Territory
Communicable Diseases Surveillance and Control Unit, New South Wales Health Department, New South Wales
Centre for Disease Control, Northern Territory Department of Health and Community Services, Northern Territory
Communicable Diseases Unit, Queensland Health, Queensland
Communicable Diseases Control Branch, South Australian Health Commission, South Australia
Communicable Diseases Surveillance, Department of Health and Human Services, Tasmania
Communicable Diseases Section, Department of Human Services, Victoria
Communicable Diseases Control Branch, Health Department of Western Australia, Western Australia
Australia’s notifiable diseases status, 2000
Annual report of the National Notifiable Diseases Surveillance System
Ming Lin,1 Paul Roche,1 Jenean Spencer,1 Alison Milton,1 Phil Wright,1 David Witteveen,1 Robyn Leader,1
Angela Merianos,1 Chris Bunn,2 Heather Gidding,3 John Kaldor,4 Martyn Kirk,5 Rob Hall,6 Tony Della-Porta7

Annual report of the National Notifiable Diseases Surveillance System
119CDI Vol 26, No 2, 2002
Abstract
In 2000, there were 89,740 notifications of communicable diseases in Australia collected by the NationalNotifiable Diseases Surveillance System (NNDSS). The number of notifications in 2000 was an increaseof 5.9 per cent over those reported in 1999 (84,743) and the largest reporting year since the NNDSScommenced in 1991. Notifications in 2000 consisted of 28,341 bloodborne infections (32% of total),24,319 sexually transmitted infections (27%), 21,303 gastrointestinal infections (24%), 6,617 vaccinepreventable infections (7%), 6,069 vectorborne infections (7%), 2,121 other bacterial infections(legionellosis, meningococcal infection, leprosy and tuberculosis) (2%), 969 zoonotic infections (1%) andonly one case of a quarantinable infection. Steep declines in some childhood vaccine preventablediseases such as Haemophilus influenzae type b, measles, mumps and rubella, continued in 2000. Incontrast, notifications of pertussis and legionellosis increased sharply in the year. Notifications ofbloodborne viral diseases (particularly hepatitis B and hepatitis C) and some sexually transmittedinfections such as chlamydia, continue to increase in Australia. This report also summarises data oncommunicable diseases from other surveillance systems including the Laboratory Virology and SerologySurveillance Scheme (LabVISE) and sentinel general practitioner schemes. In addition this reportcomments on other important developments in communicable disease control in Australia in 2000.Commun Dis Intell 2002;26:118-203.
Keywords: Surveillance, communicable diseases, epidemiology
1. Surveillance and Epidemiology Section, Commonwealth Department of Health and Ageing, Australian Capital Territory.
2. Principal Veterinary Officer, Animal Health and Welfare Branch, Bureau of Resources Sciences, Department of Agriculture, Fisheries andForestries Australia, Australian Capital Territory.
3. Epidemiology Research Officer, National Centre for Immunisation Research and Surveillance of Vaccine Preventable Diseases, NewSouth Wales.
4. Deputy Director, National Centre in HIV Epidemiology and Clinical Research, New South Wales.
5. Coordinating Epidemiologist, OzFoodNet Victoria.
6. Director, Communicable Disease Control Branch, Department of Human Services, South Australia.
7. Manager, Technical and Support Services, Australian Animal Health Laboratory, Commonwealth Scientific and Industrial ResearchOrganisation,
Corresponding author: Dr Ming Lin, Epidemiologist, Surveillance and Epidemiology Section, Commonwealth Department of Health andAgeing, PO Box 9848 (MDP 6), Canberra, Australian Capital Territory, 2601. Telephone: +61 2 6289 7304. Facsimile: +61 2 6289 7791. E-mail: [email protected].

Annual report of the National Notifiable Diseases Surveillance System
120 CDI Vol 26, No 2, 2002
ContentsYear in review ....................................................................................................................................................127
Introduction ......................................................................................................................................................128
Methods ..........................................................................................................................................................130
Notes on interpretation ..............................................................................................................................130
Results ..........................................................................................................................................................133
Summary of 2000 data ..............................................................................................................................133
Bloodborne diseases ..................................................................................................................................138
Introduction....................................................................................................................................................138
Hepatitis B......................................................................................................................................................139
Hepatitis C ......................................................................................................................................................141
Hepatitis D......................................................................................................................................................143
Gastrointestinal diseases ..........................................................................................................................144
Introduction....................................................................................................................................................144
Botulism ........................................................................................................................................................144
Campylobacteriosis........................................................................................................................................146
Hepatitis A ......................................................................................................................................................147
Hepatitis E......................................................................................................................................................148
Listeriosis ......................................................................................................................................................148
Salmonellosis ................................................................................................................................................148
Shigellosis ......................................................................................................................................................151
Shiga-like toxin producing Escherichia coli/Verotogenic E. Coli ............................................................151
Haemolytic uraemic syndrome ....................................................................................................................151
Typhoid ..........................................................................................................................................................152
Yersiniosis ................................................................................................................................................152
Quarantinable diseases..............................................................................................................................153
Sexually transmitted infections..................................................................................................................153
Chancroid ......................................................................................................................................................154
Chlamydial infection ......................................................................................................................................154
Lymphogranuloma venereum ......................................................................................................................156
Donovanosis ..................................................................................................................................................156
Gonococcal infection ....................................................................................................................................156
Syphilis ..........................................................................................................................................................158
Vaccine preventable diseases....................................................................................................................160
Introduction....................................................................................................................................................160
Diphtheria ......................................................................................................................................................162
Haemophilus influenzae type b infection ..................................................................................................163
Measles ..........................................................................................................................................................163
Mumps............................................................................................................................................................165
Pertussis ........................................................................................................................................................165
Poliomyelitis....................................................................................................................................................167
Rubella............................................................................................................................................................167
Tetanus ..........................................................................................................................................................168
Childhood vaccination coverage reports ....................................................................................................168

Annual report of the National Notifiable Diseases Surveillance System
121CDI Vol 26, No 2, 2002
Vectorborne diseases ......................................................................................................................................169
Alphavirus Infections ..................................................................................................................................170
Barmah Forest virus infection ......................................................................................................................170
Ross River virus infection..............................................................................................................................172
Flavivirus infections ....................................................................................................................................173
Dengue fever ..................................................................................................................................................173
Arbovirus: not elsewhere classified ..............................................................................................................174
Malaria............................................................................................................................................................175
Other vector borne disease surveillance ..................................................................................................175
AQIS exotic mosquito interceptions in 2000 ..............................................................................................175
Zoonoses......................................................................................................................................................175
Brucellosis ......................................................................................................................................................177
Hydatid infection............................................................................................................................................177
Leptospirosis ..................................................................................................................................................178
Other leptospirosis surveillance ..................................................................................................................179
Ornithosis ......................................................................................................................................................180
Q fever ............................................................................................................................................................180
Other bacterial infections ..........................................................................................................................181
Legionellosis ..................................................................................................................................................181
Leprosy ..........................................................................................................................................................183
Invasive meningococcal disease..................................................................................................................183
Tuberculosis ..................................................................................................................................................185
Other communicable disease surveillance ....................................................................................................185
Laboratory Virology and Serology Reporting Scheme (LabVISE) ............................................................185
Rotavirus Surveillance Program ................................................................................................................188
Reports of the Australian National Polio Reference Laboratory ............................................................188
Australian Sentinel Practice Research Network ......................................................................................188
National Influenza Surveillance Scheme ..................................................................................................189
Antibiotic resistance in Australia ..............................................................................................................190
Creutzfeldt-Jakob disease in Australia ......................................................................................................190
Appendices........................................................................................................................................................191
Case definitions and mapping to ICD10 ..................................................................................................191
Tables of completeness of data ................................................................................................................199
National population data from which rates are calculated ....................................................................199
References ........................................................................................................................................................200

Annual report of the National Notifiable Diseases Surveillance System
122 CDI Vol 26, No 2, 2002
Tables
Table 1. Diseases notified to the National Notifiable Diseases Surveillance System, Australia, 2000 ..........................................................................................................................129
Table 2. Notifications of communicable diseases, Australia, 2000, by State or Territory ..................134
Table 3. Notification rates of communicable diseases, Australia, 2000, by State or Territory (rate per 100,000 population) ..................................................................................................136
Table 4. Trends in notifications of bloodborne viruses, Australia, 1991 to 2000 ..............................138
Table 5. Trends in notification rates of bloodborne viruses, Australia, 1991 to 2000 (rate per 100,000 population)..................................................................................................139
Table 6. Risk factors identified in notifications of incident hepatitis B virus infections, 2000, by reporting State or Territory ....................................................................................................140
Table 7. Trends in notifications of unspecified hepatitis C virus infections, Australia, 1991 to 2000, by State or Territory and date of report ..........................................................141
Table 8. Trends in notifications of hepatitis C virus in the 0–4 age group, Australia, 1997 to 2000..............................................................................................................................142
Table 9. Trends in notifications of incident hepatitis C virus infections, Australia, 1993 to 2000, by State or Territory ....................................................................................................................142
Table 10. Demographics of incident hepatitis C cases reported in the Australian Capital Territory, the Northern Territory, South Australia, Tasmania and Victoria, 2000 ..................................142
Table 11. Trends in notifications of foodborne disease, Australia, 1991 to 2000 ................................145
Table 12. Trends in notification rates of foodborne disease, Australia, 1991 to 2000 (rate per 100,000 population) ..................................................................................................145
Table 13. Top 10 isolates of Salmonella, Australia, 2000 (data from the National Enteric PathogenSurveillance Scheme) ................................................................................................................150
Table 14. Trends in notifications of sexually transmitted infections, Australia, 1991 to 2000 ............154
Table 15. Trends in notification rates of sexually transmitted infections, Australia, 1991 to 2000 (rate per 100,000 population) ..................................................................................................154
Table 16. Proportion of gonococcal isolates showing antibiotic resistance, Australia, 1998 to 2000 ............................................................................................................................159
Table 17. Trends in notifications of vaccine preventable diseases, Australia, 1991 to 2000..............161
Table 18. Trends in notification rates of vaccine preventable disease, Australia, 1991 to 2000 (rate per 100,000 population) ..................................................................................................161
Table 19. Percentage of Australian children born in 1999 vaccinated at one year of age for fourconsecutive birth cohorts, assessed during 2000 using the Australian Childhood Immunisation Register................................................................................................................169
Table 20. Percentage of Australian children born in 1998 vaccinated at 2 years of age for fourconsecutive birth cohorts, assessed during 2000 using the Australian Childhood Immunisation Register................................................................................................................169
Table 21. Trends in notifications of arboviral infections, Australia, 1991 to 2000................................170
Table 22. Trends in notification rates of arboviral infections, Australia, 1991 to 2000 (rate per 100,000 population) ..................................................................................................170
Table 23. Confirmed cases of Murray Valley encephalitis virus infection, Australia, 2000 ..................174
Table 24. Trends in notifications of zoonotic disease, Australia, 1991 to 2000....................................176
Table 25. Trends in notification rates of zoonotic disease, Australia, 1991 to 2000 (rate per 100,000 population) ..................................................................................................176
Table 26. Trends in notifications of other bacterial infections, Australia, 1991 to 2000 ....................182
Table 27. Trends in notification rates of other bacterial infections, Australia, 1991 to 2000 (rate per 100,000 population) ..................................................................................................182
Table 28. Meningococcal notifications, Australia, 1995 to 2000, by serogroup ..................................184
Table 29. Infectious agents reported to LabVISE, Australia, 2000 ........................................................186

Annual report of the National Notifiable Diseases Surveillance System
123CDI Vol 26, No 2, 2002
Figures
Figure 1. Communicable disease surveillance pyramid ..........................................................................130
Figure 2. Trends in notification rates of communicable diseases, Australia, 1991 to 2000 ..............133
Figure 3. Breakdown of communicable disease notifications by disease category..............................133
Figure 4. Selected diseases from National Notifiable Diseases Surveillance System, comparison of totals for 2000 with previous 5 year mean ....................................................133
Figure 5. Notification rates of incident hepatitis B infections, Australia, 2000 by age and sex..........139
Figure 6. Notification rates of unspecified hepatitis B infections, Australia, 2000, by age and sex ..140
Figure 7. Notification rates of unspecified hepatitis C infections, Australia, 2000, by age and sex ..141
Figure 8. Notification rates of incident hepatitis C infections, Australia, 2000, by age and sex ........143
Figure 9. Notification rates of campylobacteriosis, Australia, 2000, by age and sex ..........................146
Figure 10. Trends in notifications of campylobacteriosis, Australia, 1991 to 2000, by month of onset ......................................................................................................................146
Figure 11. Trends in notification rates of hepatitis A, Australia, 1994 to 2000, by year of onset ........147
Figure 12. Notification rates of hepatitis A, Australia, 2000, by age and sex..........................................147
Figure 13. Notification rates of listeriosis, Australia, 2000, by age and sex ..........................................148
Figure 14. Notification rates of salmonellosis, Australia, 2000, by age and sex ....................................148
Figure 15. Trends in notifications of salmonellosis, Australia, 1991 to 2000, by month of onset........149
Figure 16. Notification rates of shigellosis, Australia, 2000, by age and sex ..........................................151
Figure 17. Trends in notifications of shigellosis, Australia, 1991 to 2000, by month of onset..............151
Figure 18. Notification rates of typhoid, Australia, 2000, by age and sex ..............................................152
Figure 19. Notification rates of yersiniosis, Australia, 2000, by age and sex..........................................152
Figure 20. Notification rates of chlamydia, Australia, 2000, by age and sex ..........................................155
Figure 21. Trends in notification rates of chlamydia, the Northern Territory, South Australia and Western Australia, 1993 to 2000, by Indigenous status ................................................156
Figure 22. Trends in notification rates of gonococcal infections, Australia, 1991 to 2000 ..................156
Figure 23. Notification rates of gonococcal infection, Australia, 2000, by age and sex ........................157
Figure 24. Trends in notification rates of gonococcal infections, the Northern Territory, South Australia and Western Australia, 1993 to 2000, by Indigenous status ......................157
Figure 25. Notification rates of syphilis, Australia, 2000, by age and sex ..............................................160
Figure 26. Notification rates of syphilis, the Northern Territory, South Australia and Western Australia, 1993 to 2000, by Indigenous status ........................................................160
Figure 27. Trends in notifications of diphtheria, Australia, 1917 to 1998 ..............................................162
Figure 28. Trends in notifications of Haemophilus influenzae type b infection, Australia, 1991 to 2000..............................................................................................................................163
Figure 29. Notification rates of Haemophilus influenzae type b infection, Australia, 2000, by age and sex ............................................................................................................................163
Figure 30. Trends in notification rates of measles, Australia, 1991 to 2000, by month of onset ........164
Figure 31. Trends in notification rates of measles, Australia, 1998 to 2000, by age group..................164
Figure 32. Notification rates of measles, Australia, 2000, by age and sex ............................................165
Figure 33. Trends in notification rates of mumps, Australia, 1993 to 2000, by age group ..................165
Figure 34. Notification rates of mumps, Australia, 2000, by age and sex ..............................................165
Figure 35. Trends in notification rates of pertussis, Australia, 1991 to 2000, by month of onset........166
Figure 36. Trends in notification rates of pertussis, Australia, 1996 to 2000, by age group ................166
Figure 37. Notification rates of pertussis, Australia, 2000, by age and sex............................................166
Figure 38. Trends in notification rates of rubella, Australia, 1991 to 2000, by month of onset ..........168
Figure 39. Notification rates of rubella, Australia, 2000, by age and sex................................................168
Figure 40. Notification rates of Barmah Forest virus infection, Australia, 2000, by age and sex..........171

Annual report of the National Notifiable Diseases Surveillance System
124 CDI Vol 26, No 2, 2002
Figure 41. Trends in notification rates of Barmah Forest virus infection, Australia, 1995 to 2000, by month of onset........................................................................................................................171
Figure 42. Notification rates of Ross River virus infection, Australia, 2000, by age and sex ................172
Figure 43. Trends in notification rates of Ross River virus infection, Australia, 1991 to 2000 by month of onset ......................................................................................................................173
Figure 44. Trends in notification rates of dengue fever, Australia, 1991 to 2000, by month of onset 173
Figure 45. Seroconversions to Murray Valley encephalitis virus in sentinel chickens, Western Australia and Northern Territory, 1999 to 2000........................................................174
Figure 46. Trends in notification rates of leptospirosis, Australia, 1991 to 2000, by month of onset ..178
Figure 47. Notification rates of leptospirosis, Australia, 2000, by age and sex ......................................179
Figure 48. Trends in notification rates of ornithosis, Australia, 1991 to 2000, by year of onset ..........180
Figure 49. Trends in notification rates of Q fever, Australia, 1991 to 2000, by year of onset ..............181
Figure 50. Notification rates of Q fever, Australia, 2000, by age and sex................................................181
Figure 51. Trends in notification rates of Legionellosis, Australia, 1991 to 2000, by month of onset ......................................................................................................................182
Figure 52. Notification rates of legionellosis, Australia, 2000, by age and sex ......................................182
Figure 53. Trends in notification rates of invasive meningococcal infection, Australia, 1991 to 2000, by month of onset ............................................................................................183
Figure 54. Notification rates of invasive meningococcal infection, Australia, 2000, by age and sex ..184
Figure 55. LabVISE reports, Australia, 2000 ..............................................................................................187
Figure 56. Trends in laboratory reports of human parainfluenza virus strains 1, 2 and 3, Australia, 1991 to 2000, by month of report ..........................................................................187
Figure 57. Trends in laboratory reports of Echovirus 30, Australia, 1991 to 2000 by month of report ......................................................................................................................187
Figure 58. ASPREN communicable disease surveillance presentations to GPs, 2000..........................188
Maps
Map 1. Australian Bureau of Statistics Statistical Divisions ................................................................131
Map 2. Notification rates of salmonellosis, Australia, 2000, by Statistical Division of residence ..149
Map 3. Notification rates of chlamydial infection, Australia, 2000, by Statistical Division of residence ................................................................................................................................155
Map 4. Notification rates of gonococcal infections, Australia, 2000, by Statistical Division of residence ................................................................................................................................158
Map 5. Notification rates of syphilis, Australia, 2000, by Statistical Division of residence ..............159
Map 6. Notification rates of pertussis, Australia, 2000, by Statistical Division of residence ..........167
Map 7. Notification rates of Barmah Forest virus infection, Australia, 2000, by Statistical Division of residence ................................................................................................................................171
Map 8. Notification rates of Ross River virus infection, Australia, 2000, by Statistical Division of residence ................................................................................................................................172
Map 9. Notification rates of leptospirosis, Australia, 2000, by Statistical Division of residence ....178

Annual report of the National Notifiable Diseases Surveillance System
125CDI Vol 26, No 2, 2002
Abbreviations used in this report
ABS Australian Bureau of Statistics
ACT Australian Capital Territory
ACIR Australian Childhood Immunisation Register
ADF Australian Defence Forces
ADT Adult diphtheria tetanus vaccine
AFP Acute flaccid paralysis
AGSP Australian Gonococcal Surveillance Programme
AIDS Acquired immune deficiency syndrome
AIHW Australian Institute of Health and Welfare
Ag Antigen
AHMC Australian Health Minister's conference
ASPREN Australian Sentinel Practice Research Network
ATAGI Australian Technical Advisory Group on Immunisation
BBV Bloodborne viruses
CDC Centres for Disease Control and Prevention, Atlanta, Georgia
CDI Communicable Diseases Intelligence
CDNA Communicable Diseases Network Australia
CIJIG Commonwealth Inter-departmental JETACAR Implementation Group
CJD Creutzfeldt-Jakob Disease
CSF Cerebrospinal fluid
DoHA Department of Health and Ageing
DTP Diphtheria, Tetanus, Pertussis (vaccine)
EAGAR Expert Advisory Group on Antimicrobial Resistance
ELISA Enzyme-linked Immunosorbant assay
GBS Guillain Barre Syndrome
FAO Food and Agriculture Organization of the United Nations
HBsAg Hepatitis B surface antigen
HBV Hepatitis B virus
HCV Hepatitis C virus
HDV Hepatitis D virus
HEV Hepatitis E virus
Hib Haemophilus influenzae type b
HIV Human immunodeficiency virus
HUS Haemolytic uraemic syndrome
ICD–10 International Classification of Diseases, version 10
IFA Immunofluorescence assay
IgG Immunoglobulin G
IgM Immunoglobulin M
JE Japanese encephalitis
JETACAR Joint Expert Technical Advisory Committee on Antibiotic Resistance
LabVISE Laboratory Virology and Serology Reporting Scheme
MMR Measles-mumps-rubella (vaccine)
MVE Murray Valley encephalitis
NNDSS National Notifiable Diseases Surveillance System

Annual report of the National Notifiable Diseases Surveillance System
126 CDI Vol 26, No 2, 2002
NCHECR National Centre in HIV Epidemiology and Clinical Research
NEC Not elsewhere classified
NEPSS National Enteric Pathogen Surveillance Scheme
NHMRC National Health and Medical Research Council
NMSS National Mycobacterial Surveillance System
NN Not notifiable
NSW New South Wales
NT Northern Territory
OPV Oral polio vaccine
PCR Polymerase chain reaction
Qld Queensland
SA South Australia
SD Statistical Division
SLTEC Shiga-like toxin producing Escherichia coli
STI Sexually transmitted infection
Tas Tasmania
TB Tuberculosis
UK United Kingdom
USA United States of America
vCJD Variant Creutzfeldt-Jakob disease
Vic Victoria
VPD Vaccine preventable diseases
VTEC Verotoxin-producing Escherichia coli
WA Western Australia
WHO World Health Organization
WPR Western Pacific Region

Annual report of the National Notifiable Diseases Surveillance System
127CDI Vol 26, No 2, 2002
2000: The year in reviewIn 2000, there were continuing challenges to andadvances in communicable disease control inAustralia. Important initiatives were taken whichwill have impacts on communicable diseasessurveillance and control well into the future.
In September 2000, Sydney hosted the Olympicgames. This event drew around 300,000 domesticand international visitors as well as 15,000athletes and officials from 200 countries. Mediaattention was intense with around 15,000 mediapersonnel attending the games. The size of thisevent necessitated active health surveillancecovering notifiable diseases as well as surveillanceof presentations to emergency departments andmedical centres, and environmental and foodsafety inspections.1 Data from all these sourceswere entered into a special database and revieweddaily by medical epidemiologists. High prioritydiseases for surveillance included foodbornediseases, pneumonia, influenza, pertussis,meningitis, measles and hepatitis. The Gameswere completed without any major public healthincidents.
In April 2000, a large outbreak of legionellosisoccurred in Melbourne, with 113 cases notified inVictoria and another 12 cases elsewhere inAustralia and New Zealand. The outbreak wasassociated with visits to the Melbourne aquariumand resulted in 4 deaths. A contaminated water-cooling tower was implicated.
The deployment of 5,500 Australian DefenceForces (ADF) to East Timor in late 1999 resulted inincreased exposure to malaria and dengue. Twohundred and sixty-seven ADF personnel contractedmalaria, with 64 developing clinical symptoms inEast Timor and 212 being diagnosed on return toAustralia. A further 26 ADF personnel contracteddengue.
A milestone in communicable disease control waspassed in October 2000, when Australia, alongwith all other countries in the Western PacificRegion (WPR) was declared polio-free by the WorldHealth Organization (WHO). Australia’s last case ofpolio was reported in 1977 and all cases since thenhave been vaccine associated.2
A special issue of the Medical Journal of Australia inOctober 2000 focussed attention on the burden ofpneumococcal disease in Australia and future useof pneumococcal vaccines. The incidence ofpneumococcal disease among Aboriginal childrenin central Australia is among the highest in the
world.3 To date, vaccines composed of pneumo-coccal polysaccharides were the only available andthese were not effective in preventing infections inchildren. In 2000, the first efficacy trial of a newmultivalent conjugate vaccine againstStreptococcus pneumoniae showed a very highprotective efficacy against invasive pneumococcaldisease in children.4 The vaccine was licensed foruse in Australia in December 2000 and recommen-dations for a vaccination program in Australianchildren were published in March 2001. It is hopedthat this vaccination program, focussing on groupsof children at highest risk of disease, will have amajor impact on pneumococcal disease inAustralia.
An important new initiative in the control offoodborne disease in Australia was launched in2000. The Commonwealth Department of Healthand Ageing (DoHA) established and funded acollaborative network, called ‘OzFoodNet’ toenhance the existing surveillance mechanisms forfoodborne disease across Australia. OzFoodNetaims to estimate the incidence of foodbornedisease in Australia, to learn more about causesand determinants of foodborne disease, to identifyrisky practices associated with food handling andpreparation and to train foodborne diseaseepidemiologists.5 Specific studies include anational survey of diarrhoeal disease prevalence,case control studies on risk factors for infectionswith Campylobacter, Salmonella Enteriditis, Listeriaand Shiga-like toxin producing Escherichia coli(SLTEC) and developing a register to recordfoodborne disease outbreaks.
In August 2000, the Commonwealth published animplementation plan in response to the report bythe Joint Expert Advisory Committee on AntibioticResistance (JETACAR) The use of antibiotics in food-producing animals: antibiotic resistant bacteria inanimals and humans. An inter-departmentalimplementation group guided by an expert advisorycommittee is working on developing surveillancesystems to monitor the prevalence of antibioticresistance and other measures to control theprevalence of antibiotic resistance in Australia.
As international concern over variant Creutzfeldt-Jakob disease (vCJD) increased in 2000, AustralianHealth Ministers implemented a blood donordeferral policy from people who had resided in theUnited Kingdom (UK) for 6 months or more duringthe period 1980 to 1996. No cases of bovinespongiform encephalopathy have been found inAustralian cattle nor have there been any cases ofvCJD in Australia to date.

Annual report of the National Notifiable Diseases Surveillance System
128 CDI Vol 26, No 2, 2002
Since 1991, national communicable disease notifi-cation data has been collected and collated underthe National Notifiable Diseases SurveillanceSystem (NNDSS). In 2000, Australian States andTerritories agreed with the Commonwealth tocollect more comprehensive data on each casenotified to the NNDSS and began planning forenhanced surveillance for a number of keydiseases. The new data set will provide more detailon the causative organism and the vaccinationstatus of the case, and provide more compre-hensive epidemiological data. This will allow moresophisticated analyses of the nationalcommunicable diseases data set. Improvements inthe electronic transfer of data from States andTerritories to NNDSS continued in 2000.Development of a new data acquisition system wascommenced and discussion around appropriatedata collection for enhanced tuberculosis (TB)surveillance was initiated. This enhancedsurveillance was an initiative of the National TBAdvisory Committee and will improve nationalmonitoring of TB in Australia by recording completeclinical data, including antibiotic susceptibility, andoutcomes of treatment on all notified cases.
In summary, communicable disease control inAustralia in 2000 was advanced by the certificationof polio eradication and the introduction of newvaccine initiatives for pneumococcal disease.Improvements to understanding the epidemiologyof foodborne disease in Australia through theOzFoodNet initiative and the prevalence ofantibiotic resistance will have long-term benefits fordisease control. Improvements to data quality andinformation systems will further enhance thenational surveillance system and communicabledisease control.
IntroductionIt is of critical importance to collect, analyse andreport surveillance data on potentialcommunicable diseases. This action is essential tothe success of public health efforts. Surveillanceallows the detection of disease outbreaksprompting the appropriate investigation and controlmeasures to be instigated. Surveillance also allowsfor the monitoring of trends in disease prevalenceand considers the impact and effectiveness ofinterventions to control the spread of diseases.Surveillance systems exist at national, state andlocal levels. State and local surveillance systemsare crucial to the timely and effective detection andmanagement of outbreaks and in assisting in the
effective implementation of national policies. Thenational surveillance system combines some of thedata collected from state and territory-basedsystems to provide an overview at a national level.Specific functions of the national surveillancesystem include: detection and management ofoutbreaks affecting more than one jurisdiction;monitoring of the need for and impact of nationalcontrol programs; guidance of national policydevelopment; resource allocation and descriptionof the epidemiology of rare diseases for whichthere are only a few notifications in eachjurisdiction. National surveillance also assists withquarantine activities and facilitates agreed interna-tional collaborations such as reporting to the WHO.
The National Notifiable Diseases SurveillanceSystem was established in its current form in 1991,under the auspices of the Communicable DiseasesNetwork Australia (CDNA, formally theCommunicable Diseases Network of Australia andNew Zealand). The CDNA monitors the notifi-cation/reporting of an agreed list of communicablediseases in Australia. Data are regularly publishedin the Communicable Diseases Intelligence (CDI)journal and on the Communicable Diseases —Australia Website. This is achieved through thenational collation of notifications of these diseasesreceived by health authorities in the States andTerritories. In 2000, 50 diseases or diseasecategories were included, largely as recommendedby the National Health and Medical ResearchCouncil (NHMRC).6 In years since 2000 the list ofnotifiable diseases and categories has undergonereview and revision. Information collected onnotifiable diseases has been published in theAnnual Report of the NNDSS since1991.7,8,9,10,11,12,13,14,15
In 2000, 50 diseases or disease categories werenationally notifiable in Australia (Table 1) and thenational case definitions used in this year are listedin Appendix 1a–1h.

Annual report of the National Notifiable Diseases Surveillance System
129CDI Vol 26, No 2, 2002
Bloodborne diseases Hepatitis B (incident) All jurisdictionsHepatitis B (unspecified) All jurisdictions except NTHepatitis C (incident) All jurisdictions except NT, Qld*Hepatitis C (unspecified) All jurisdictionsHepatitis D All jurisdictions except WAHepatitis (NEC) All jurisdictions except WA
Gastrointestinal diseases Botulism All jurisdictions except WACampylobacteriosis All jurisdictions except NSWHaemolytic uraemic syndrome All jurisdictionsHepatitis A All jurisdictionsHepatitis E All jurisdictions except WAListeriosis All jurisdictionsSalmonellosis All jurisdictionsShigellosis All jurisdictions except NSWSLTEC,VTEC All jurisdictions except Qld, WATyphoid All jurisdictionsYersiniosis All jurisdictions except NSW
Quarantinable diseases Cholera All jurisdictionsPlague All jurisdictionsRabies All jurisdictionsViral haemorrhagic fever All jurisdictionsYellow fever All jurisdictions
Sexually transmitted infections Chancroid All jurisdictionsChlamydial infections All jurisdictionsDonovanosis All jurisdictions except NSW, SAGonococcal infection All jurisdictionsLymphogranuloma venereum All jurisdictions except WASyphilis All jurisdictions
Vaccine preventable diseases Diphtheria All jurisdictionsHaemophilus influenzae type B All jurisdictionsMeasles All jurisdictions
Mumps All jurisdictions except Qld†
Pertussis All jurisdictionsPoliomyelitis All jurisdictionsRubella All jurisdictionsTetanus All jurisdictions
Vectorborne diseases Arbovirus infection (NEC) All jurisdictionsBarmah Forest virus infection All jurisdictionsDengue All jurisdictionsMalaria All jurisdictionsRoss River virus infection All jurisdictions
Zoonoses Brucellosis All jurisdictionsHydatid disease All jurisdictions except NSWLeptospirosis All jurisdictionsOrnithosis All jurisdictions except NSW and QldQ fever All jurisdictions
Other bacterial infections Legionellosis All jurisdictionsLeprosy All jurisdictionsMeningococcal infection All jurisdictionsTuberculosis All jurisdictions
Table 1. Diseases notified to the National Notifiable Diseases Surveillance System, Australia, 2000
Disease group Disease Comments
* Notifications of hepatitis C (incident) were reported under hepatitis C (unspecified) in the Northern Territory and Queensland.
† Notification of mumps was removed from the notification list in Queensland from 2 July 1999 and the entire year of 2000.
NEC: not elsewhere classified

Annual report of the National Notifiable Diseases Surveillance System
130 CDI Vol 26, No 2, 2002
MethodsAustralia is a federation of six States (New SouthWales, Queensland, South Australia, Tasmania,Victoria and Western Australia) and two Territories(the Australian Capital Territory and the NorthernTerritory). The States and Territories collect notifi-cations of communicable diseases under theirpublic health legislation. The Commonwealth (orFederal) Government does not have any legislativeresponsibility for public health apart from humanquarantine. States and Territories have agreed toforward data on communicable diseases to theDoHA for the purposes of national communicabledisease surveillance.
In 2000, data were transmitted from States andTerritories to DoHA, fortnightly. Summaries of thedata were published on the CommunicableDiseases — Australia Website fortnightly and in theCDI monthly. The Commonwealth received finaldata sets from the States and Territories of casesreported in 2000 by August 2001. Missing dataand apparent errors together with any queriesarising from the data were returned to jurisdictionsfor review, correction of errors and ascertainmentof completeness of case information for the year.
For each case the national data set included fieldsfor a unique record reference number; jurisdictionof notification; disease code; age; sex; Indigenousstatus; postcode of residence; the date of onset ofthe disease and date of report to the State orTerritory health authority. Analysis of the data byIndigenous status was not possible because of theincomplete reporting of this information. Additionalinformation was available on the species andserogroups isolated in cases of legionellosis,meningococcal disease and malaria, and on thevaccination status in cases of childhood vaccinepreventable diseases. Additional information wasobtained from States and Territories concerningmortality and specific health risk factors of somediseases.
Analyses in this report are based on date ofdisease onset, unless specified. For analysis ofseasonal trends, notifications were reported bymonth of onset. Population notification rates werecalculated using 2000 mid-year estimates of theresident population supplied by the AustralianBureau of Statistics (ABS). An adjusted rate wascalculated where a disease was not notifiable in aState or Territory, using a denominator whichexcluded that population.
Maps were generated using MapInfo based on thepostcode of residence and allocated to AustralianBureau of Statistics Statistical Divisions (Map 1).The two Statistical Divisions that make up theAustralian Capital Territory were combined, as thepopulation for one division is very small.Notifications for Darwin and the remainder of theNorthern Territory were also combined to calculaterates for the Northern Territory as a whole. Ingeneral, notification rates for Statistical Divisionswere depicted in maps or discussed in the text onlywhere the number of notifications was sufficientlylarge for these to be meaningful.
Notes on interpretation
The notifications compiled by the NNDSS may beinfluenced by a number of factors that should beconsidered when interpreting the data. Due tounder-reporting, notified cases are likely to onlyrepresent a proportion of the total number of casesthat occurred (Figure 1). This proportion (the‘notified fraction’) may vary between diseases,between States and Territories and with time.
Figure 1. Communicable disease surveillancepyramid
Adopted from CDC Website.(http://www.cdc.gov/foodnet/Surveys.htm#whatpyr)
The burden of illness pyramid is a model for understandingdisease reporting. This illustration shows the chain of events thatmust occur for an episode of illness in the population to beregistered in surveillance. At the bottom of the pyramid, 1) someof the general population is exposed to an organism; 2) someexposed persons become ill; 3) the illness is sufficiently troublingthat some persons seek care; 4) a specimen is obtained fromsome persons and submitted to a clinical laboratory; 5) alaboratory appropriately tests the specimen; 6) the laboratoryidentifies the causative organism and thereby confirms the case,or the diagnosing doctors confirms the case on clinical grounds;7) the laboratory-confirmed or clinically confirmed case isreported to a local or state health department, then to theCommonwealth.

Annual report of the National Notifiable Diseases Surveillance System
131CDI Vol 26, No 2, 2002
Statistical Division Population Statistical Division Population Statistical Division Population
Map 1. Australian Bureau of Statistics Statistical Divisions
New South Wales
105 Sydney 4,085,578
110 Hunter 576,863
115 Illawarra 389,271
120 Richmond-Tweed 211,167
125 Mid-North Coast 272,966
130 Northern 173,218
135 North Western 116,895
140 Central West 172,749
145 South Eastern 182,464
150 Murrumbidgee 148,737
155 Murray 109,960
160 Far West 23,587
Australian Capital Territory
805 Canberra 310,521
810 ACT - balance 318
Northern Territory
705 Darwin 90,011
710 NT - balance 105,452
Queensland
305 Brisbane 1,626,865
310 Moreton 694,464
315 Wide Bay-Burnett 234,751
Queensland continued
320 Darling Downs 202,352
325 South West 25,597
330 Fitzroy 181,206,215
335 Central West 12,135
340 Mackay 127,531
345 Northern 200,174
350 Far North 225,522
355 North West 35,760
South Australia
405 Adelaide 1,096,102
410 Outer Adelaide 110,663
415 Yorke & Lower North 44,225
420 Murray Lands 68,497
425 South East 62,794
430 Eyre 33,493
435 Northern 81,860
Tasmania
605 Greater Hobart 194,228
610 Southern 34,832
615 Northern 133,080
620 Mersey-Lyell 108,236
Victoria
205 Melbourne 3,466,025
210 Barwon 249,067
215 Western District 99,477
220 Central Highlands 138,229
225 Wimmera 50,838
230 Mallee 88,372
235 Loddon-Campaspe 162,031
240 Goulburn 188,124
245 Ovens-Murray 90,102
250 East Gippsland 79,849
255 Gippsland 154,034
Western Australia
505 Perth 1,381,127
510 South West 187,862
515 Lower Great Southern 52,128
520 Upper Great Southern 19,610
525 Midlands 52,304
530 South Eastern 58,926
535 Central 60,300
540 Pilbara 40,429
545 Kimberley 30,539
Total Australia 19,157,037

Annual report of the National Notifiable Diseases Surveillance System
132 CDI Vol 26, No 2, 2002
Methods of surveillance may vary betweenjurisdictions, each with different requirements fornotification by medical practitioners, laboratoriesand hospitals. In addition, the list of notifiablediseases and the case definitions may varybetween jurisdictions.
Postcode information usually reflects the postcodeof residence. However, the postcode of residencemay not necessarily represent the place ofacquisition of the disease, or the area in whichpublic health action was taken in response to thenotification.
As no personal identifiers are collected in records,duplication in reporting may occur if patientsmoved from one jurisdiction to another and werenotified in both. Data from those StatisticalDivisions with small populations (Map 1) may resultin high notification rates even with small numbersof cases.
The completeness of data in this report issummarised in Appendix 2. The patient’s sex wasmissing in 0.5 per cent of notifications (n = 420)and patient’s age missing in 0.4 per cent of notifi-cations (n = 340). The patient’s Indigenous statuswas reported for 28,552 notifications (31.8%)nationally. The proportion of reports with missingdata in these fields varied by State or Territory, andalso by disease.
Data were analysed by date of disease onset,unless specified. The date of disease onset isuncertain for some communicable diseases and isoften equivalent to the date of presentation to amedical practitioner or date of specimen collectionat a laboratory. Analysis by disease onset is anattempt to estimate disease activity within areporting period. Analysis by date of onset shouldbe interpreted with caution, particularly for chronicdiseases such as hepatitis B and C, as consid-erable time may have elapsed between onset andreport date for these diseases. To overcome thisproblem, analysis was performed by report date forhepatitis B (unspecified) and hepatitis C(unspecified).
Rates per 100,000 population were calculatedusing State/Territory and national populationestimates for mid-year 2000 (Appendix 3) suppliedby the Australian Bureau of Statistics. Mortalitystatistics for 2000 were available from the ABS in2001. The Australian Institute of Health andWelfare (AIHW) supplied hospital admission datafor the financial year 1999/2000.
Between May and August every year, the NNDSSreceives a final annual dataset from alljurisdictions to update its system. This yearlyoperation only updates the notifications reported tothe NNDSS during the last calendar year. Statesand Territories continue to revise totals fromprevious years as duplicates are removed andother data corrected. However, the NNDSS had notrevised its historical notifications since 1991. As aresult, there was considerable difference in thenumber of notifications held in the NNDSS and theState and Territory records. Providing high qualityand precise information that is consistent withState and Territory records is a vital part ofmaintaining good surveillance information. In2001, the CDNA approved the revising of theNNDSS records with jurisdictions’ 1991 to 1999historical notifications. During November toDecember 2001, all jurisdictions except Victoriaresent notifications collected between 1991 and1999 to the NNDSS. Victoria confirmed thatrecords held at the Commonwealth level wereaccurate. Comparative historical data for 1991 to1999 used in this report represents more accurateinformation and may vary from previous reports.
During 2000, data were analysed monthly and theresult and commentary published in CDI. Incontrast, this report is based on ‘finalised’ annualdata from each jurisdiction, from which duplicatesor erroneous records have been removed. For thisreason, totals in this report may vary from thecumulative totals of the numbers reported in themonthly CDI reports. This report is informed by thediscussions and comments of members of theCDNA, who met fortnightly by teleconference todiscuss developments in communicable disease intheir jurisdiction. The CDNA data managers alsomet through 2000 and their contribution toaccurate data in this report is gratefullyacknowledged.
Results
Summary of 2000 data
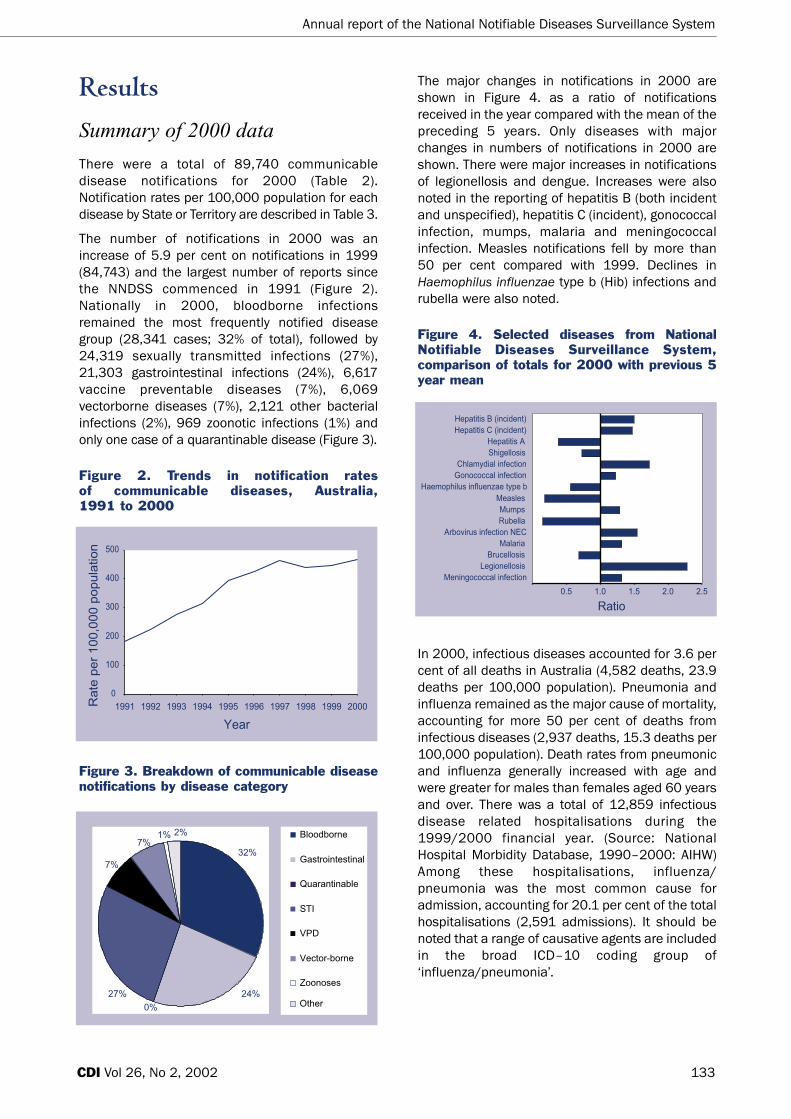
There were a total of 89,740 communicabledisease notifications for 2000 (Table 2).Notification rates per 100,000 population for eachdisease by State or Territory are described in Table 3.
The number of notifications in 2000 was anincrease of 5.9 per cent on notifications in 1999(84,743) and the largest number of reports sincethe NNDSS commenced in 1991 (Figure 2).Nationally in 2000, bloodborne infectionsremained the most frequently notified diseasegroup (28,341 cases; 32% of total), followed by24,319 sexually transmitted infections (27%),21,303 gastrointestinal infections (24%), 6,617vaccine preventable diseases (7%), 6,069vectorborne diseases (7%), 2,121 other bacterialinfections (2%), 969 zoonotic infections (1%) andonly one case of a quarantinable disease (Figure 3).
Figure 2. Trends in notification rates of communicable diseases, Australia, 1991 to 2000
Figure 3. Breakdown of communicable diseasenotifications by disease category
Annual report of the National Notifiable Diseases Surveillance System
133CDI Vol 26, No 2, 2002
The major changes in notifications in 2000 areshown in Figure 4. as a ratio of notificationsreceived in the year compared with the mean of thepreceding 5 years. Only diseases with majorchanges in numbers of notifications in 2000 areshown. There were major increases in notificationsof legionellosis and dengue. Increases were alsonoted in the reporting of hepatitis B (both incidentand unspecified), hepatitis C (incident), gonococcalinfection, mumps, malaria and meningococcalinfection. Measles notifications fell by more than50 per cent compared with 1999. Declines inHaemophilus influenzae type b (Hib) infections andrubella were also noted.
Figure 4. Selected diseases from NationalNotifiable Diseases Surveillance System,comparison of totals for 2000 with previous 5year mean
In 2000, infectious diseases accounted for 3.6 percent of all deaths in Australia (4,582 deaths, 23.9deaths per 100,000 population). Pneumonia andinfluenza remained as the major cause of mortality,accounting for more 50 per cent of deaths frominfectious diseases (2,937 deaths, 15.3 deaths per100,000 population). Death rates from pneumonicand influenza generally increased with age andwere greater for males than females aged 60 yearsand over. There was a total of 12,859 infectiousdisease related hospitalisations during the1999/2000 financial year. (Source: NationalHospital Morbidity Database, 1990–2000: AIHW)Among these hospitalisations, influenza/pneumonia was the most common cause foradmission, accounting for 20.1 per cent of the totalhospitalisations (2,591 admissions). It should benoted that a range of causative agents are includedin the broad ICD–10 coding group of‘influenza/pneumonia’.

Annual report of the National Notifiable Diseases Surveillance System
134 CDI Vol 26, No 2, 2002
Bloodborne diseases
Hepatitis B (incident) 3 96 6 56 30 18 114 72 395
Hepatitis B (unspecified)†‡ 48 3,893 NN 896 257 48 1,964 802 7,908
Hepatitis C (incident) 20 139 – – 89 31 87 75 441
Hepatitis C (unspecified)†‡§ 212 7,265 183 3,395 788 335 5,730 1,661 19,569
Hepatitis D 0 10 0 5 0 0 12 NN 27
Hepatitis (NEC) 0 1 0 0 0 0 0 NN 1
Gastrointestinal diseases
Botulism 0 0 1 0 0 0 1 NN 2
Campylobacteriosis|| 333 – 182 3,675 1,883 510 5,037 1,975 13,595
Haemolytic uraemic 0 9 0 2 1 0 2 1 15syndrome
Hepatitis A 5 200 44 133 54 3 193 180 812
Hepatitis E 0 9 0 0 0 1 0 NN 10
Listeriosis 0 18 3 13 7 3 10 13 67
Salmonellosis 105 1,409 304 1,827 450 131 1,021 904 6,151
Shigellosis|| 7 – 114 108 30 2 120 106 487
SLTEC,VTEC¶ 0 0 0 NN 33 0 0 NN 33
Typhoid 0 27 0 2 3 0 14 12 58
Yersiniosis|| 3 – 2 59 0 0 8 1 73
Quarantinable diseases
Cholera 0 0 0 0 1 0 0 0 1
Plague 0 0 0 0 0 0 0 0 0
Rabies 0 0 0 0 0 0 0 0 0
Viral haemorrhagic fever 0 0 0 0 0 0 0 0 0
Yellow fever 0 0 0 0 0 0 0 0 0
Sexually transmissible diseases
Chancroid 0 0 0 0 0 0 0 0 0
Chlamydial infection 243 3,482 959 4,931 1,023 332 3,336 2,560 16,866
Donovanosis 0 NN 5 6 NN 0 0 1 12
Gonococcal infection** 14 1,060 1,128 1,137 270 17 742 1,318 5,686
Lymphogranuloma 0 0 0 0 0 0 0 NN 0venereum
Syphilis†† 13 541 175 887 13 9 8 109 1,755
Table 2. Notifications of communicable diseases, Australia, 2000, by State or Territory*
Disease ACT NSW NT Qld SA Tas Vic WA Aust

Annual report of the National Notifiable Diseases Surveillance System
135CDI Vol 26, No 2, 2002
Vaccine preventable diseases
Diphtheria 0 0 0 0 0 0 0 0 0
Haemophilus influenzae 0 8 2 12 2 0 3 1 28type b
Measles 3 35 0 26 11 1 21 10 107
Mumps 17 92 4 NN 15 2 43 39 212
Pertussis 208 3,683 5 525 588 143 699 91 5,942
Poliomyelitis 0 0 0 0 0 0 0 0 0
Rubella‡‡ 4 191 0 46 7 1 67 6 322
Tetanus 0 2 0 0 3 0 1 0 6
Vectorborne diseases
Arbovirus infection NEC 0 12 9 10 0 1 26 11 69
Barmah Forest virus infection 0 190 9 346 12 0 19 58 634
Dengue 1 21 93 84 6 0 2 8 215
Malaria 18 231 76 409 41 7 115 54 951
Ross River virus infection 16 746 128 1,477 415 8 326 1,084 4,200
Zoonoses
Brucellosis 0 1 0 26 0 0 0 0 27
Hydatid infection 0 NN 0 8 0 0 13 5 26
Leptospirosis 1 53 8 134 8 0 35 4 243
Ornithosis 0 NN 1 NN 6 6 85 2 100
Q fever 0 130 0 390 11 1 27 14 573
Other diseases
Legionellosis 5 41 1 47 89 4 250 35 472
Leprosy 0 2 0 1 1 0 0 0 4
Meningococcal infection 5 253 9 60 32 15 162 85 621
Tuberculosis 18 438 43 89 58 10 284 84 1,024
Total 1,302 24,288 3,494 20,822 6,237 1,639 20,577 11,381 89,740
Table 2. Notifications of communicable diseases, Australia, 2000, by State or Territory,* continued
Disease ACT NSW NT Qld SA Tas Vic WA Aust
* Analysis by date of onset, except for hepatitis B and hepatitis C unspecified, where analysis is by report date. Date of onset is acomposite of three components: (i) the true onset date from a clinician, if available, (ii) the date the laboratory test was ordered, or (iii) the date reported to the NNDSS.
† Unspecified hepatitis includes cases with hepatitis in whom the duration of illness can not be determined.
‡ The analysis was performed by report date.
§ Includes hepatitis C (incident) cases in Northern Territory and Queensland.
|| Notified as ‘foodborne disease’ or ‘gastroenteritis in an institution’ in New South Wales.
¶ Infections with Shiga-like toxin (verotoxin) producing E. coli (SLTEC/VTEC).
** Northern Territory, Queensland, South Australia, Victoria, and Western Australia: includes gonococcal neonatal ophthalmia.
†† Includes congenital syphilis.
‡‡ Includes congenital rubella.
NN Not notifiable.
NEC Not Elsewhere Classified.
– Elsewhere classified.
Disease ACT NSW NT Qld SA Tas Vic WA Aust
Annual report of the National Notifiable Diseases Surveillance System
136 CDI Vol 26, No 2, 2002
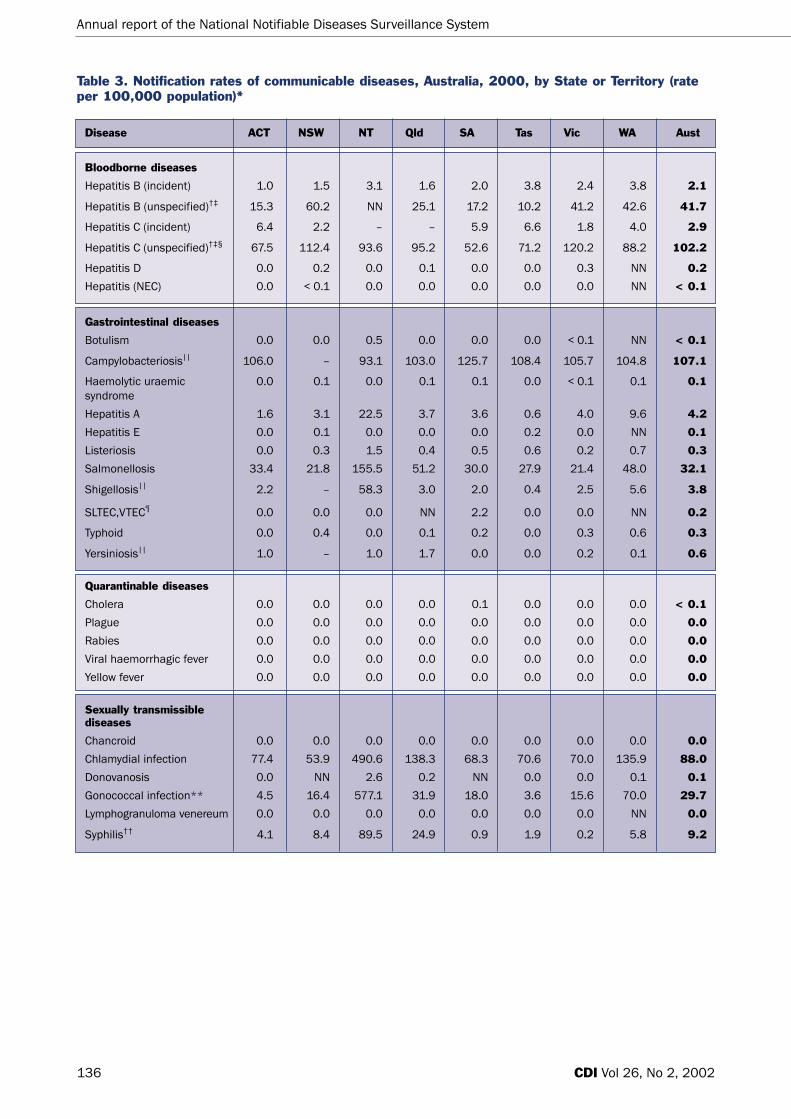
Bloodborne diseases
Hepatitis B (incident) 1.0 1.5 3.1 1.6 2.0 3.8 2.4 3.8 2.1
Hepatitis B (unspecified)†‡ 15.3 60.2 NN 25.1 17.2 10.2 41.2 42.6 41.7
Hepatitis C (incident) 6.4 2.2 – – 5.9 6.6 1.8 4.0 2.9
Hepatitis C (unspecified)†‡§ 67.5 112.4 93.6 95.2 52.6 71.2 120.2 88.2 102.2
Hepatitis D 0.0 0.2 0.0 0.1 0.0 0.0 0.3 NN 0.2
Hepatitis (NEC) 0.0 < 0.1 0.0 0.0 0.0 0.0 0.0 NN < 0.1
Gastrointestinal diseases
Botulism 0.0 0.0 0.5 0.0 0.0 0.0 < 0.1 NN < 0.1
Campylobacteriosis|| 106.0 – 93.1 103.0 125.7 108.4 105.7 104.8 107.1
Haemolytic uraemic 0.0 0.1 0.0 0.1 0.1 0.0 < 0.1 0.1 0.1syndrome
Hepatitis A 1.6 3.1 22.5 3.7 3.6 0.6 4.0 9.6 4.2
Hepatitis E 0.0 0.1 0.0 0.0 0.0 0.2 0.0 NN 0.1
Listeriosis 0.0 0.3 1.5 0.4 0.5 0.6 0.2 0.7 0.3
Salmonellosis 33.4 21.8 155.5 51.2 30.0 27.9 21.4 48.0 32.1
Shigellosis|| 2.2 – 58.3 3.0 2.0 0.4 2.5 5.6 3.8
SLTEC,VTEC¶ 0.0 0.0 0.0 NN 2.2 0.0 0.0 NN 0.2
Typhoid 0.0 0.4 0.0 0.1 0.2 0.0 0.3 0.6 0.3
Yersiniosis|| 1.0 – 1.0 1.7 0.0 0.0 0.2 0.1 0.6
Quarantinable diseases
Cholera 0.0 0.0 0.0 0.0 0.1 0.0 0.0 0.0 < 0.1
Plague 0.0 0.0 0.0 0.0 0.0 0.0 0.0 0.0 0.0
Rabies 0.0 0.0 0.0 0.0 0.0 0.0 0.0 0.0 0.0
Viral haemorrhagic fever 0.0 0.0 0.0 0.0 0.0 0.0 0.0 0.0 0.0
Yellow fever 0.0 0.0 0.0 0.0 0.0 0.0 0.0 0.0 0.0
Sexually transmissible diseases
Chancroid 0.0 0.0 0.0 0.0 0.0 0.0 0.0 0.0 0.0
Chlamydial infection 77.4 53.9 490.6 138.3 68.3 70.6 70.0 135.9 88.0
Donovanosis 0.0 NN 2.6 0.2 NN 0.0 0.0 0.1 0.1
Gonococcal infection** 4.5 16.4 577.1 31.9 18.0 3.6 15.6 70.0 29.7
Lymphogranuloma venereum 0.0 0.0 0.0 0.0 0.0 0.0 0.0 NN 0.0
Syphilis†† 4.1 8.4 89.5 24.9 0.9 1.9 0.2 5.8 9.2
Table 3. Notification rates of communicable diseases, Australia, 2000, by State or Territory (rateper 100,000 population)*

Zoonoses
Brucellosis 0.0 < 0.1 0.0 0.7 0.0 0.0 0.0 0.0 0.1
Hydatid infection 0.0 NN 0.0 0.2 0.0 0.0 0.3 0.3 0.2
Leptospirosis 0.3 0.8 4.1 3.8 0.5 0.0 0.7 0.2 1.3
Ornithosis 0.0 NN 0.5 NN 0.4 1.3 1.8 0.1 1.1
Q fever 0.0 2.0 0.0 10.9 0.7 0.2 0.6 0.7 3.0
Vectorborne diseases
Arbovirus infection NEC 0.0 0.2 4.6 0.3 0.0 0.2 0.5 0.6 0.4
Barmah Forest virus infection 0.0 2.9 4.6 9.7 0.8 0.0 0.4 3.1 3.3
Dengue 0.3 0.3 47.6 2.4 0.4 0.0 < 0.1 0.4 1.1
Malaria 5.7 3.6 38.9 11.5 2.7 1.5 2.4 2.9 5.0
Ross River virus infection 5.1 11.5 65.5 41.4 27.7 1.7 6.8 57.5 21.9
Other diseases
Legionellosis 1.6 0.6 0.5 1.3 5.9 0.9 5.2 1.9 2.5
Leprosy 0.0 < 0.1 0.0 < 0.1 0.1 0.0 0.0 0.0 < 0.1
Meningococcal infection 1.6 3.9 4.6 1.7 2.1 3.2 3.4 4.5 3.2
Tuberculosis 5.7 6.8 22.0 2.5 3.9 2.1 6.0 4.5 5.3
Vaccine preventable diseases
Diphtheria 0.0 0.0 0.0 0.0 0.0 0.0 0.0 0.0 0.0
Haemophilus influenzae 0.0 0.1 1.0 0.3 0.1 0.0 0.1 0.1 0.1type b
Measles 1.0 0.5 0.0 0.7 0.7 0.2 0.4 0.5 0.6
Mumps 5.4 1.4 2.0 NN 1.0 0.4 0.9 2.1 1.4
Pertussis 66.2 57.0 2.6 14.7 39.3 30.4 14.7 4.8 31.0
Poliomyelitis 0.0 0.0 0.0 0.0 0.0 0.0 0.0 0.0 0.0
Rubella‡‡ 1.3 3.0 0.0 1.3 0.5 0.2 1.4 0.3 1.7
Tetanus 0.0 < 0.1 0.0 0.0 0.2 0.0 < 0.1 0.0 < 0.1
Annual report of the National Notifiable Diseases Surveillance System
137CDI Vol 26, No 2, 2002
Table 3. Notification rates of communicable diseases, Australia, 2000, by State or Territory (rateper 100,000 population)*, continued
Disease ACT NSW NT Qld SA Tas Vic WA Aust
* Analysis by date of onset, except for hepatitis B and hepatitis C unspecified, where analysis is by report date. Date of onset is acomposite of three components: (i) the true onset date from a clinician, if available, (ii) the date the laboratory test was ordered, or (iii) the date reported to the NNDSS.
† Unspecified hepatitis includes cases with hepatitis in whom the duration of illness can not be determined.
‡ The analysis was performed by report date.
§ Includes hepatitis C (incident) cases in Northern Territory and Queensland.
|| Notified as ‘foodborne disease’ or ‘gastroenteritis in an institution’ in New South Wales.
¶ Infections with Shiga-like toxin (verotoxin) producing E. coli (SLTEC/VTEC).
** Northern Territory, Queensland, South Australia, Victoria, and Western Australia: includes gonococcal neonatal ophthalmia.
†† Includes congenital syphilis.
‡‡ Includes congenital rubella.
NN Not notifiable.
NEC Not elsewhere classified.
– Elsewhere classified.
Annual report of the National Notifiable Diseases Surveillance System
138 CDI Vol 26, No 2, 2002
Bloodborne diseases
Introduction
In 2000, bloodborne viruses (BBV) reported to theNNDSS included hepatitis B, C, D and hepatitis 'notelsewhere classified' (NEC). Newly acquiredhepatitis C virus (HCV) and hepatitis B virus (HBV)infections (incident) were differentiated from thosewhere the timing of disease acquisition is unknown(unspecified). HIV and AIDS diagnoses are reporteddirectly to the National Centre in HIV Epidemiologyand Clinical Research (NCHECR). Information onnational HIV/AIDS surveillance can be obtained through the NCHECR Website atwww.med.unsw.edu.au/nchecr.
As considerable time may have elapsed betweenonset and report date for chronic hepatitisinfections, the analysis of unspecified HBV andunspecified HCV infections in the following sectionsis by report date, rather than by onset date.
In 2000, bloodborne virus infections accounted for28,341 notifications to the NNDSS, which was 31.6per cent of the total notified cases.
The overall trends in the number of notificationsand rates for bloodborne viruses reported to theNNDSS since 1991 are shown in Tables 4 and 5.Hepatitis C remains the most commonly notifiedBBV in Australia. While most of the BBV show anincrease in the total number of notifications acrossthis reporting period, the increases are likely toreflect changes in surveillance practices ratherthan a true change in disease activity. Changes insurveillance are discussed on a disease by diseasebasis in the following sections. Only the reporting ofhepatitis NEC has decreased over time, probablydue to improved classification into the otherhepatitis groups
Table 4. Trends in notifications of bloodborne viruses, Australia, 1991 to 2000*†
Disease 1991 1992 1993 1994 1995 1996 1997 1998 1999 2000
Hepatitis B (incident) – – – 283 271 212 269 265 303 395
Hepatitis B (unspecified) 3,469 4,847 5,282 5,394 4,434 5,580 6,542 6,562 7,164 7,908
Hepatitis C (incident) – – 25 26 77 71 154 350 396 441
Hepatitis C (unspecified) – – – – 17,154 17,674 17,290 18,075 18,655 19,569
Hepatitis D – – – – – – – – 19 27
Hepatitis (NEC) 253 34 33 23 12 15 6 4 0 1
* Notifications of hepatitis B (unspecified) and hepatitis C (unspecified) were analysed by report date.
† All jurisdictions reported for all years with the following exceptions:
Hepatitis B (incident) not reported from the Australian Capital Territory (1994)
Hepatitis B (unspecified) not reported from the Northern Territory (1991 to 2000)
Hepatitis C (incident) not separated from hepatitis C (unspecified) in Queensland or the Northern Territory (1991 to 2000)
Hepatitis D not reported from Western Australia
Hepatitis (NEC) not reported from Western Australia

Annual report of the National Notifiable Diseases Surveillance System
139CDI Vol 26, No 2, 2002
Table 5. Trends in notification rates of bloodborne viruses, Australia, 1991 to 2000*† (rate per100,000 population)
Disease 1991 1992 1993 1994 1995 1996 1997 1998 1999 2000
Hepatitis B (incident) – – – 1.6 1.5 1.2 1.5 1.4 1.6 2.1
Hepatitis B (unspecified) 20.3 28.0 30.2 30.5 24.8 30.8 35.7 35.4 38.2 41.7
Hepatitis C (incident) – – 0.2 0.2 0.5 0.5 1.0 2.3 2.6 2.9
Hepatitis C (unspecified) – – – – 94.9 96.5 93.4 96.5 98.4 102.2
Hepatitis D – – – – – – – – 0.1 0.2
Hepatitis (NEC) 1.6 0.2 0.2 0.1 0.1 0.1 < 0.1 < 0.1 0.0 < 0.1
* Notifications of hepatitis B (unspecified) and hepatitis C (unspecified) were analysed by report date.
† All jurisdictions reported for all years with the following exceptions:
Hepatitis B (incident) not reported from the Australian Capital Territory (1994).
Hepatitis B (unspecified) not reported from the Northern Territory (1991 to 2000).
Hepatitis C (incident) not separated from hepatitis C (unspecified) in Queensland or the Northern Territory (1991 to 2000).
Hepatitis D not reported from Western Australia.
Hepatitis (NEC) not reported from Western Australia.
Hepatitis B
In the early 1990s incident and unspecifiedhepatitis B notifications were not reportedseparately by most jurisdictions. Since 1994, alljurisdictions have reported incident cases ofhepatitis B to the NNDSS. The overall trend inincident HBV notification rates between 1994 and2000 shows a relatively stable reporting rate,between 1–2 cases per 100,000 population.
In total, 395 incident cases of hepatitis B werereported to the NNDSS with an onset date in 2000,giving a national notification rate of 2.1 cases per100,000 population for this year. This representsan increase from the 303 incident cases reportedin 1999 (1.6 cases per 100,000 population), withthe most notable increases in the number of notifi-cations from Western Australia, Tasmania and NewSouth Wales. In 2000, the highest rates werereported from Western Australia (3.8 cases per100,000 population), Tasmania (3.8 cases per100,000 population) and the Northern Territory(3.1 cases per 100,000 population). The majorityof incident hepatitis B notifications were in the20–24 year age group (Figure 5). Overall, infectionsin males exceeded those in females (male tofemale ratio of 1.6:1).
Figure 5. Notification rates of incidenthepatitis B infections, Australia, 2000 by age and sex
Risk factor information for incident HBV infectionwas available from four jurisdictions, the AustralianCapital Territory, South Australia, Tasmania andVictoria and is summarised in Table 6. Thefollowing analyses refer only to incident HBV casesreported in these jurisdictions in 2000, thus thejurisdictional totals reported below may vary fromthe analysis by onset date.
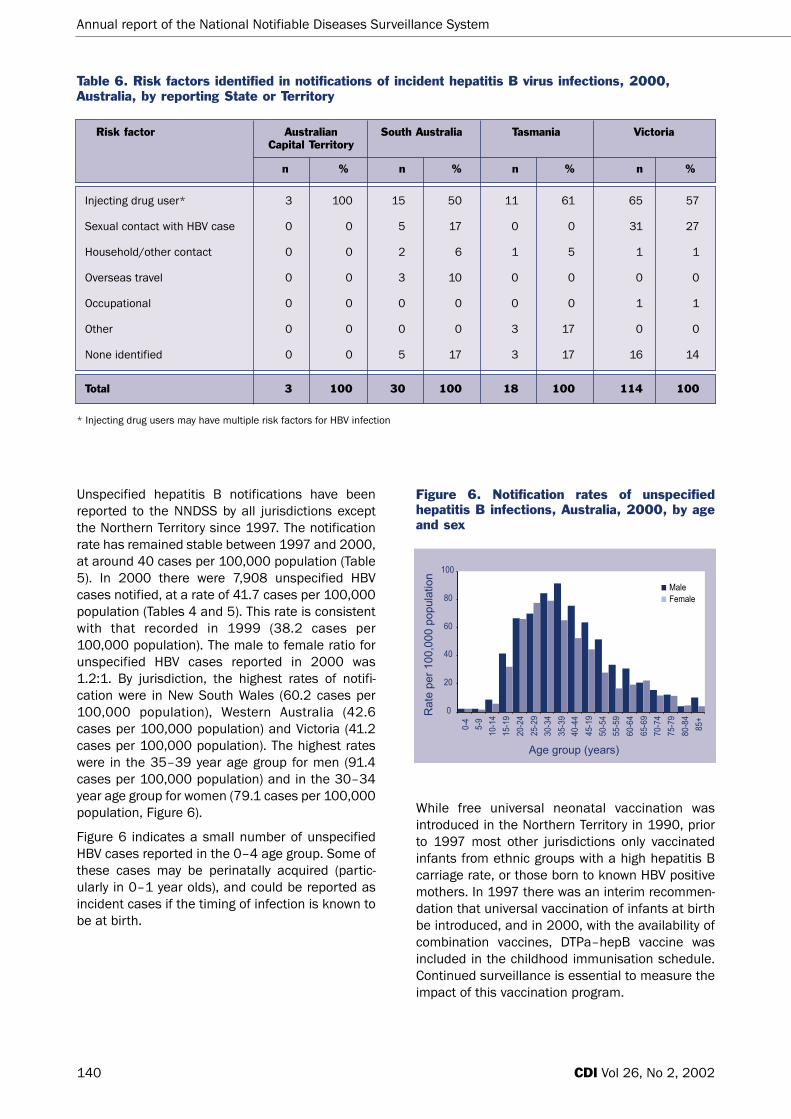
Total 3 100 30 100 18 100 114 100
Annual report of the National Notifiable Diseases Surveillance System
140 CDI Vol 26, No 2, 2002
Unspecified hepatitis B notifications have beenreported to the NNDSS by all jurisdictions exceptthe Northern Territory since 1997. The notificationrate has remained stable between 1997 and 2000,at around 40 cases per 100,000 population (Table5). In 2000 there were 7,908 unspecified HBVcases notified, at a rate of 41.7 cases per 100,000population (Tables 4 and 5). This rate is consistentwith that recorded in 1999 (38.2 cases per100,000 population). The male to female ratio forunspecified HBV cases reported in 2000 was1.2:1. By jurisdiction, the highest rates of notifi-cation were in New South Wales (60.2 cases per100,000 population), Western Australia (42.6cases per 100,000 population) and Victoria (41.2cases per 100,000 population). The highest rateswere in the 35–39 year age group for men (91.4cases per 100,000 population) and in the 30–34year age group for women (79.1 cases per 100,000population, Figure 6).
Figure 6 indicates a small number of unspecifiedHBV cases reported in the 0–4 age group. Some ofthese cases may be perinatally acquired (partic-ularly in 0–1 year olds), and could be reported asincident cases if the timing of infection is known tobe at birth.
Figure 6. Notification rates of unspecifiedhepatitis B infections, Australia, 2000, by ageand sex
While free universal neonatal vaccination wasintroduced in the Northern Territory in 1990, priorto 1997 most other jurisdictions only vaccinatedinfants from ethnic groups with a high hepatitis Bcarriage rate, or those born to known HBV positivemothers. In 1997 there was an interim recommen-dation that universal vaccination of infants at birthbe introduced, and in 2000, with the availability ofcombination vaccines, DTPa–hepB vaccine wasincluded in the childhood immunisation schedule.Continued surveillance is essential to measure theimpact of this vaccination program.
Risk factor Australian South Australia Tasmania Victoria Capital Territory
n % n % n % n %
Injecting drug user* 3 100 15 50 11 61 65 57
Sexual contact with HBV case 0 0 5 17 0 0 31 27
Household/other contact 0 0 2 6 1 5 1 1
Overseas travel 0 0 3 10 0 0 0 0
Occupational 0 0 0 0 0 0 1 1
Other 0 0 0 0 3 17 0 0
None identified 0 0 5 17 3 17 16 14
Table 6. Risk factors identified in notifications of incident hepatitis B virus infections, 2000,Australia, by reporting State or Territory
* Injecting drug users may have multiple risk factors for HBV infection

Annual report of the National Notifiable Diseases Surveillance System
141CDI Vol 26, No 2, 2002
Hepatitis C
Hepatitis C infection has been notifiable in mostAustralian jurisdictions since 1991 (Table 7). Thetotal number of unspecified hepatitis C notifi-cations has remained stable since 1994 at around15,000–20,000 cases per annum.
In 2000, there were 19,569 unspecified hepatitisC infections reported to the NNDSS, a notificationrate of 102.2 cases per 100,000 population,slightly higher than the 98.4 cases per 100,000population reported in 1999. Of the total notifi-cations of unspecified hepatitis C, 37 per cent ofthe notifications were from New South Wales. Thehighest notification rates were from Victoria (120.2cases per 100,000 population) and New SouthWales (112.4 cases per 100,000 population). Themale to female ratio was 1.8:1. The highest notifi-cation rates were in the 25–29 year age group formales (279.7 cases per 100,000 population) andin the 20–24 year age group for females (159.9cases per 100,000 population, Figure 7).
Similar to HBV, there were a number of HCV notifi-cations in the 0-4 age group (Table 8) which couldbe classified as incident if perinatally acquired.
Incident cases of hepatitis C have been separatelynotifiable since 1997 in all jurisdictions except theNorthern Territory and Queensland (Table 9). It isrecognised that the number of notifications vastlyunderestimates the true incidence of hepatitis C inAustralia. The increase in incident hepatitis Cnotifications to the NNDSS should not necessarily
Table 7. Trends in notifications of unspecified hepatitis C virus infections, Australia 1991 to 2000,by State or Territory and date of report
Year ACT NSW NT Qld SA Tas Vic WA Aust
1991 59 657 10 1,491 NR NR 1,667 NR 3,884
1992 110 3,761 93 2,702 NR NR 1,262 NR 7,928
1993 244 5,640 212 2,670 NR NR 2,659 1,106 12,531
1994 308 7,564 301 2,990 NR NR 3,523 1,305 15,991
1995 330 6,782 301 2,808 1,026 274 4,506 1,127 17,154
1996 267 7,318 216 2,796 1,075 291 4,597 1,114 17,674
1997 315 6,775 295 2,843 835 234 4,940 1,053 17,290
1998 290 6,759 233 2,921 795 275 5,681 1,121 18,075
1999 282 6,780 191 3,046 854 310 6,165 1,027 18,655
2000 212 7,265 183 3,395 788 335 5,730 1,661 19,569
NR not reported
Figure 7. Notification rates of unspecifiedhepatitis C infections, Australia, 2000, by ageand sex
be interpreted as evidence of increasingtransmission in the Australian community. Insteadthe increase in the number of incident HCV notifi-cations is largely a product of improvedsurveillance, increased awareness, and morewidespread testing.
The numbers of incident cases detected are likelyto be affected by the surveillance methods.16 In thelarger jurisdictions classification of incident casesis determined by passive reporting. In smallerjurisdictions, where all (or the majority) of hepatitisC notifications were actively investigated todetermine if they were incident or prevalent duringthis time period, a much higher proportion ofincident cases was reported.

Annual report of the National Notifiable Diseases Surveillance System
142 CDI Vol 26, No 2, 2002
Year Incident HCV infections* Unspecified HCV infections† Total
Table 8. Trends in notifications of hepatitis C virus infections in the 0–4 age group, Australia,1997 to 2000
1997 0 167 167
1998 5 573 578
1999 1 105 106
2000 1 97 98
* By date of onset.
† By date of report.
Year ACT NSW SA Tas Vic WA Aust
1993 NR* 23 NR NR NR 2 25
1994 6 20 NR NR NR 0 26
1995 8 33 33 2 NR 1 77
1996 8 19 28 4 NR 12 71
1997 3 19 48 2 9 73 154
1998 8 110 67 18 21 126 350
1999 20 100 80 18 70 108 396
2000 20 139 89 31 87 75 441
NR not reported
Table 9. Trends in notifications of incident hepatitis C virus infections, by State or Territory, 1993 to 2000
Table 10. Demographics of incident hepatitis C cases reported in the Australian Capital Territory,the Northern Territory, South Australia, Tasmania and Victoria, 2000
ACT NT SA Tasmania Victoria(n=20) (n=5*) (n=88) (n=27) (n=77)
Median age in years (range)
Males 24 (22–39) 32 (28–45) 26 (18–45) 26 (18–48) 23 (15–42)
Females 28 (17–28) 37 (27–47) 24 (15–50) 28 (17–36) 22 (14–39)
* Since enhanced surveillance commenced in July 2000.

Annual report of the National Notifiable Diseases Surveillance System
143CDI Vol 26, No 2, 2002
In total there were 441 incident cases of hepatitisC reported with an onset date in 2000, giving a rateof 2.9 cases per 100,000 population. Theproportion of all HCV notifications that were knownto be incident cases was 2.2 per cent in 2000,similar to the proportion in 1999 (2.1%), butreflecting the upward trend in this proportion since1993. The highest rates of incident hepatitis Cinfection were reported from Tasmania (6.6 casesper 100,000 population), the Australian CapitalTerritory (6.4 cases per 100,000 population) andSouth Australia (5.9 cases per 100,000population). The majority of incident hepatitis Cnotifications were in the 20–24 year age group(Figure 8).
Figure 8. Notification rates of incident hepatitis Cinfections, Australia, 2000, by age and sex
In 2000, additional data were collected on incidenthepatitis C infections in the Australian CapitalTerritory, the Northern Territory, South Australia,Tasmania and Victoria (M. Robotin, NCHECR,personal communication). The following analysesrefer only to incident hepatitis C cases reported inthese jurisdictions in 2000, thus the jurisdictionaltotals reported below may vary from the analysis byonset date.
Demographic profile of incident hepatitis C cases
The age and sex of incident hepatitis C casesnotified in 2000 are summarised in Table 10,according to the State or Territory of diagnosis.
Method of diagnosis of incident hepatitis C
The basis of diagnosis was seroconversion in 72per cent, clinical hepatitis in 23 per cent or acombination in 4 per cent of cases.
Reason for testing or reporting source
The reason for testing or the reporting source wasrecorded in three jurisdictions (the NorthernTerritory, Tasmania and Victoria). While no directcomparison can be made, as varying reasons wereinvestigated in each jurisdiction, drug and alcoholscreening was the major reason for testing inTasmania (accounting for 44% of cases) andVictoria (27% of cases), while the investigation ofsymptoms was the major reason for testing in theNorthern Territory (accounting for 60% of cases).
Exposure assessment for incident hepatitis Cinfections
Information on exposure assessment was availablefrom four jurisdictions (the Australian CapitalTerritory, the Northern Territory, Tasmania andVictoria). Injecting drug use was the most commonmode of transmission, accounting for 60 per centof cases in the Northern Territory, 70 per cent ofcases in the Australian Capital Territory, 74 per centof cases in Tasmania and 86 per cent of cases inVictoria. Less common modes of transmission (forexample, via tattoos, sexual exposure, iatrogenicexposure) were documented, although multipleexposures were not always recorded in eachjurisdiction. In jurisdictions where multipleexposures were recorded, the majority wereassociated with injecting drug use.
Hepatitis D
Hepatitis D is an unusual virus as it uses thehepatitis B surface antigen in its own replication,and therefore requires co-infection with HBV.17
Infection can occur concurrently with HBV, or canoccur as a superinfection, providing the individualis a HBV carrier.
There were 27 notifications of hepatitis D to theNNDSS in 2000 at a notification rate of 0.2 casesper 100,000 population. Of the 27 notifications, 12were reported from Victoria, 10 from New SouthWales and 5 from Queensland. The majority (85%)of notifications were from males, with the highestrate reported in 30–34 year age group (0.9 casesper 100,000 population).

Annual report of the National Notifiable Diseases Surveillance System
144 CDI Vol 26, No 2, 2002
Gastrointestinal disease
Introduction
Gastrointestinal and foodborne diseases are amajor cause of illness in Australia. In 2000,gastrointestinal illness accounted for 21,303 notifi-cations to the NNDSS, which was 23.7 per cent ofthe total notified diseases. Notifications offoodborne diseases to the NNDSS and notificationrates for foodborne diseases in Australia are shownin Tables 11 and 12.
The true prevalence of gastrointestinal disease isnot easy to quantify. There is a significant under-reporting in surveillance data especially of mildergastrointestinal disease. Mead et al18 haveestimated that the notified fraction of foodbornedisease in the United States of American (USA)varied from 2 per cent to 50 per cent depending onthe severity of the disease. In the UK, it wasestimated that for every case of infectiousintestinal disease notified there were on average136 cases in the community.19 This under-reportingvaried depending on the pathogen concerned. Inaddition there are multiple modes of transmissionfor the organisms that cause gastrointestinaldisease (i.e. some pathogens are also transmittedvia other routes). This complicates our ability toestimate what proportion of infections are actuallytransmitted by food. Again, this may vary bydisease. The estimated proportion of gastroin-testinal disease which is attributable to foodranges from 5 per cent for hepatitis A to 99 percent for Listeria.18 Surveillance data may also bebiased by different levels of reporting of gastroin-testinal disease in different age groups, withchildren and the elderly more likely to be seen by amedical practitioner.
Differences in laboratory testing practices andsurveillance methods in States and Territories mayalso account for the difference in observed notifi-cation rates. This is particularly true for diseasessuch as Shiga-like toxin producing /Verotoxinproducing E. coli (SLTEC/VTEC), where laboratorydiagnosis is difficult. States and Territories alsohave different reporting requirements for doctorsand laboratories, which can make nationalcomparison difficult. In 2000, all Australian Statesand Territories supplied data to the NNDSS onhepatitis A, haemolytic uraemic syndrome,
listeriosis, salmonellosis and typhoid. Data onbotulism, campylobacteriosis, hepatitis E,shigellosis, Shiga-like toxin producing /Verotoxinproducing E. coli (SLTEC/VTEC) and yersiniosis wereavailable from most but not all jurisdictions (Table 1).To overcome some of these difficulties, the CDNAagreed to standardise reportable conditions ineach jurisdiction from 1 January 2001.
The National Enteric Pathogen SurveillanceScheme (NEPSS) maintained by the MicrobiologicalDiagnostic Unit, Department of Microbiology andImmunology at the University of Melbourne, provideimportant surveillance data on bacterial entericpathogens. NEPSS collects, analysis and dissem-inates data on human enteric bacterial infectionsdiagnosed in Australia. These pathogens includeSalmonella, Shigella, E. coli, Vibrio, Yersinia,Plesiomonas, Aeromonas and Campylobacter spp.NEPSS holds more than 140,000 records ofhuman infections and 78,000 records of isolatesfrom non-human sources such as food andanimals. NEPSS monitors trends in theepidemiology of human enteric bacterial infections,identifies outbreaks (particularly when geograph-ically and/or temporally dispersed), identifiespotential sources of pathogens causing humandisease and monitors antibiotic resistance amongbacterial enteric pathogens.
Botulism
There have been no cases of foodborne botulismreported to the NNDSS since the inception of thesystem in 1991. There were 2 cases of infantbotulism reported in 2000, one case each fromVictoria and the Northern Territory, both in childrenaged less than one year.
Infant (or intestinal) botulism cases arise fromingestion of Clostridium botulinum spores, whichgerminate in the intestine. Spores are widespreadand are found in soil and dust as well as in foodssuch as honey. Symptoms include acute flaccidparalysis (AFP) thus botulism is often identified andreported in the differential diagnosis of AFP, whichis an important part of polio surveillance inAustralia.

Annual report of the National Notifiable Diseases Surveillance System
145
Table 11. Trends in notifications of foodborne disease, Australia, 1991 to 2000*
Disease 1991 1992 1993 1994 1995 1996 1997 1998 1999 2000
Botulism 0 0 0 0 0 0 0 1 0 2
Campylobacteriosis 8,813 9,221 8,070 10,069 11,240 12,109 11,752 13,433 12,657 13,595
Haemolytic uraemic syndrome – – – – – – – – 23 15
Hepatitis A 2,234 2,118 1,951 1,912 1,621 2,104 3,044 2,497 1,554 812
Hepatitis E – – – – – – – – 9 10
Listeriosis 49 45 49 36 59 70 73 55 64 67
Salmonellosis 5,496 4,416 4,505 5,199 5,873 5,786 7,054 7,613 7,147 6,151
Shigellosis 913 716 691 740 731 680 795 599 547 487
SLTEC,VTEC – – – – – – – – 47 33
Typhoid 93 41 80 66 70 80 79 60 68 58
Yersiniosis 329 352 370 311 207 215 207 160 125 73
* All jurisdictions reported for all years with the following exceptions
Botulism not reported from Western Australia.
Campylobacteriosis not reported from New South Wales.
Hepatitis E not reported from Western Australia.
Listeriosis not reported from South Australia (1991) or Northern Territory (1991 to 1993).
Shigellosis not reported from New South Wales.
SLTEC/VTEC not reported from Queensland or Western Australia.
Yersiniosis not reported from New South Wales (1991 to 2000) or Australian Capital Territory (1991 to 1992).
Table 12. Trends in notification rates of foodborne disease, Australia, 1991 to 2000* (rate per100,000 population)
Disease 1991 1992 1993 1994 1995 1996 1997 1998 1999 2000
Botulism 0.0 0.0 0.0 0.0 0.0 0.0 0.0 < 0.1 0.0 < 0.1
Campylobacteriosis 77.4 80.0 69.2 85.4 94.1 100.1 95.9 108.4 100.8 107.1
Haemolytic uraemic syndrome – – – – – – – – 0.1 0.1
Hepatitis A 12.9 12.1 11.0 10.7 9.0 11.5 16.4 13.3 8.2 4.2
Hepatitis E – – – – – – – – 0.1 0.1
Listeriosis 0.3 0.3 0.3 0.2 0.3 0.4 0.4 0.3 0.3 0.3
Salmonellosis 31.8 25.2 25.5 29.1 32.5 31.6 38.1 40.7 37.7 32.1
Shigellosis 8.0 6.2 5.9 6.3 6.1 5.6 6.5 4.8 4.4 3.8
SLTEC,VTEC – – – – – – – – 0.3 0.2
Typhoid 0.5 0.2 0.5 0.4 0.4 0.4 0.4 0.3 0.4 0.3
Yersiniosis 3.0 3.1 3.2 2.6 1.7 1.8 1.7 1.3 1.0 0.6
* All jurisdictions reported for all years with the following exceptions
Botulism not reported from Western Australia.
Campylobacteriosis not reported from New South Wales.
Hepatitis E not reported from Western Australia.
Listeriosis not reported from South Australia (1991) or Northern Territory (1991 to 1993).
Shigellosis not reported from New South Wales.
SLTEC/VTEC not reported from Queensland or Western Australia.
Yersiniosis not reported from New South Wales (1991 to 2000) or Australian Capital Territory (1991 to 1992).
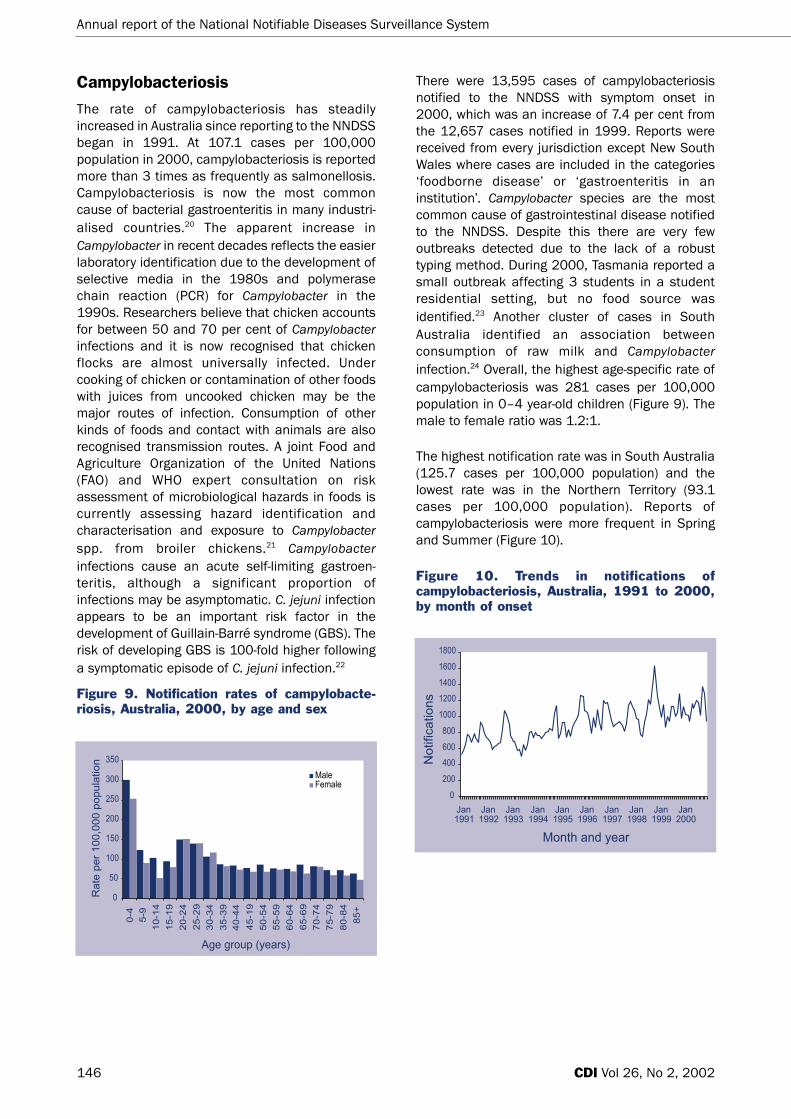
Annual report of the National Notifiable Diseases Surveillance System
146 CDI Vol 26, No 2, 2002
Campylobacteriosis
The rate of campylobacteriosis has steadilyincreased in Australia since reporting to the NNDSSbegan in 1991. At 107.1 cases per 100,000population in 2000, campylobacteriosis is reportedmore than 3 times as frequently as salmonellosis.Campylobacteriosis is now the most commoncause of bacterial gastroenteritis in many industri-alised countries.20 The apparent increase inCampylobacter in recent decades reflects the easierlaboratory identification due to the development ofselective media in the 1980s and polymerasechain reaction (PCR) for Campylobacter in the1990s. Researchers believe that chicken accountsfor between 50 and 70 per cent of Campylobacterinfections and it is now recognised that chickenflocks are almost universally infected. Undercooking of chicken or contamination of other foodswith juices from uncooked chicken may be themajor routes of infection. Consumption of otherkinds of foods and contact with animals are alsorecognised transmission routes. A joint Food andAgriculture Organization of the United Nations(FAO) and WHO expert consultation on riskassessment of microbiological hazards in foods iscurrently assessing hazard identification andcharacterisation and exposure to Campylobacterspp. from broiler chickens.21 Campylobacterinfections cause an acute self-limiting gastroen-teritis, although a significant proportion ofinfections may be asymptomatic. C. jejuni infectionappears to be an important risk factor in thedevelopment of Guillain-Barré syndrome (GBS). Therisk of developing GBS is 100-fold higher followinga symptomatic episode of C. jejuni infection.22
Figure 9. Notification rates of campylobacte-riosis, Australia, 2000, by age and sex
There were 13,595 cases of campylobacteriosisnotified to the NNDSS with symptom onset in2000, which was an increase of 7.4 per cent fromthe 12,657 cases notified in 1999. Reports werereceived from every jurisdiction except New SouthWales where cases are included in the categories‘foodborne disease’ or ‘gastroenteritis in aninstitution’. Campylobacter species are the mostcommon cause of gastrointestinal disease notifiedto the NNDSS. Despite this there are very fewoutbreaks detected due to the lack of a robusttyping method. During 2000, Tasmania reported asmall outbreak affecting 3 students in a studentresidential setting, but no food source wasidentified.23 Another cluster of cases in SouthAustralia identified an association betweenconsumption of raw milk and Campylobacterinfection.24 Overall, the highest age-specific rate ofcampylobacteriosis was 281 cases per 100,000population in 0–4 year-old children (Figure 9). Themale to female ratio was 1.2:1.
The highest notification rate was in South Australia(125.7 cases per 100,000 population) and thelowest rate was in the Northern Territory (93.1cases per 100,000 population). Reports ofcampylobacteriosis were more frequent in Springand Summer (Figure 10).
Figure 10. Trends in notifications ofcampylobacteriosis, Australia, 1991 to 2000,by month of onset

Annual report of the National Notifiable Diseases Surveillance System
147CDI Vol 26, No 2, 2002
Hepatitis A
Overall hepatitis A in Australia has declined signifi-cantly over the past 30 years although levels inIndigenous communities have remained high.National notifications of hepatitis A have declinedconsiderably since the peak rate recorded in theNNDSS in 1997 (16.4 cases per 100,000population). The impact of control measures,including vaccination of susceptible populationsand improvements in hygiene, have clearly had animpact on the incidence of hepatitis A in Australia(Tables 11 and 12).
In Australia, three patterns of hepatitis Aepidemiology are recognised.25 Firstly, there arelarge, slowly evolving community outbreaks,occurring at intervals of 5 years. Communityoutbreaks affect groups of people prone toinfection, who are susceptible to intense levels oftransmission within their groups. Infectedindividuals are also a potential source for infectionfor the wider community. Settings for communityoutbreaks include child care centres and pre-schools, communities of men who have sex withmen, schools and residential facilities for theintellectually disabled and communities of injectingdrug users. Secondly, sporadic cases of hepatitis Amay arise in people without obvious risk factorsalthough some may be associated with overseastravel or travel to Indigenous communities. Thirdly,point-source outbreaks of hepatitis A may arisefrom contaminated food or water or an infectedfood-handler. These are relatively rare in Australia.The last major point-source outbreak of hepatitis Aarose from contaminated oysters in New SouthWales in 1997.26
Vaccination against hepatitis A in Australia isrecommended for travellers to endemic areas,visitors to remote Indigenous communities,childcare and pre-school personnel, the intellec-tually disabled and their carers, healthcareworkers, sewerage workers, men who have sex withmen, injecting drug users, patients with chronicliver disease (or with hepatitis C), haemophiliacswho may have received pooled plasma concen-trates, and food handlers.25
There were 812 cases of hepatitis A notified to theNNDSS with symptom onset in 2000, which was adecrease of 48 per cent from the 1,554 casesnotified in 1999 (Figure 11). The highest age-specific rate was in the 25–29 year age group (8.4cases per 100,000 population) (Figure 12) and themale to female ratio was 1.5:1.
Figure 11. Trends in notification rates ofhepatitis A, Australia, 1994 to 2000, by yearof onset
Figure 12. Notification rates of hepatitis A,Australia, 2000, by age and sex
The highest notification rate was in the NorthernTerritory (22.5 cases per 100,000 population) andthe lowest rate was in Tasmania (0.6 cases per100,000 population). There has been a markeddecline in notifications of hepatitis A throughoutnorth Queensland since hepatitis A vaccinationwas introduced for Indigenous children in theregion in early 1999 (J. Hanna, personal communi-cation).

Annual report of the National Notifiable Diseases Surveillance System
148 CDI Vol 26, No 2, 2002
Hepatitis E
Hepatitis E is endemic in many countries of Asiabut is rarely reported in Australia. Women in thethird trimester of pregnancy are susceptible tofulminant hepatitis E disease, with a case fatalityrate as high as 20 per cent.27 Outbreaks in SouthAsia pose a risk to Australian travellers to theseregions. There were 10 cases of hepatitis E notifiedto the NNDSS in 2000, 9 from New South Walesand one from Tasmania. Of the 10 cases, one wasassociated with travel to India. There was no travelhistory available for the remaining cases.
Listeriosis
Listeriosis is a serious but relatively rare foodbornedisease to which neonates, pregnant women, theimmuno-compromised and the elderly are partic-ularly susceptible. In pregnant women the infectioncan be passed to the foetus. Infants may bestillborn, born with septicaemia or developmeningitis in the neonatal period. Clusters of casesof listeriosis have been noted in hospitals,nurseries and aged care facilities.27
The notification rate of listeriosis in Australia hasremained steady over the past 10 years (Tables 11and 12). As food preparation practices change avariety of products have been found to be vehiclesfor Listeria spp. The Australian QuarantineInspection Service (AQIS) and the Australia NewZealand Food Authority are responsible for thelaboratory testing of food imported into Australia.Between 1995 and 1998, Listeria contamination offoods such as smoked fish and soft cheeses,constituted the most frequent findings.28
Listeriosis was notifiable in all Australianjurisdictions in 2000; however practices varied asto whether a materno-fetal case constituted one ortwo cases. There were 67 cases of listeriosisreported to the NNDSS in 2000, which was asimilar number to previous years (Table 11). Thehighest age-specific rate of listeriosis was 2.0cases per 100,000 population in the 80–84 yearage group (Figure 13) and the male to female ratiowas 0.7:1.
The highest notification rate was in the NorthernTerritory (1.5 cases per 100,000 population) Therewere no cases reported from the Australian CapitalTerritory. There was no clustering of cases oflisteriosis. Five materno-foetal pairs were reportedwhich resulted in three foetal deaths.
Figure 13. Notification rates of listeriosis,Australia, 2000, by age and sex
Salmonellosis (excluding typhoid)
Salmonellosis remains the second most commoncause of gastroenteritis in Australia and the mostimportant cause of bacterial foodborne diseaseoutbreaks. In 2000, rates of Salmonella notifi-cations fell for the second year running, to 32.1cases per 100,000 population.
There were 6,151 cases of salmonellosis reportedto the NNDSS with symptom onset in 2000, whichwas a decrease of 13.9 per cent from the 7,147cases reported in 1999 (Table 11). The highestage-specific rate was 179.2 cases per 100,000population in 0–4 year-old children (Figure 14) andthe male to female ratio was 1:1. The highest notifi-cation rate was in the Northern Territory (155.5cases per 100,000 population) and the lowest ratewas reported from Victoria (21.4 cases per100,000 population).
Figure 14. Notification rates of salmonellosis,Australia, 2000, by age and sex
The Kimberley Statistical Division in WesternAustralia had the highest rate of salmonellosis, inexcess of 399 cases per 100,000 population,which was comparable to previous years (Map 2).Reports of salmonellosis were greatest in themonths of January to March (Figure 15).

Annual report of the National Notifiable Diseases Surveillance System
149CDI Vol 26, No 2, 2002
Map 2. Notification rates of salmonellosis, Australia, 2000, by Statistical Division of residence
Figure 15. Trends in notifications ofsalmonellosis, Australia, 1991 to 2000, bymonth of onset
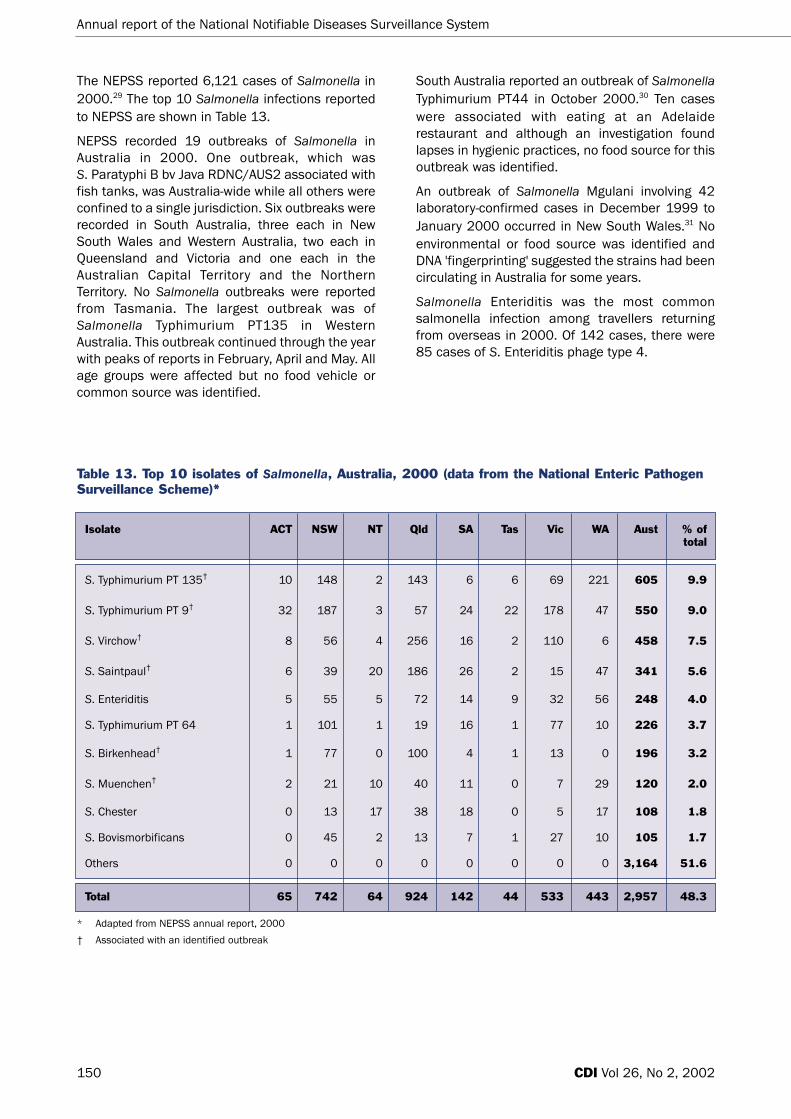
Total 65 742 64 924 142 44 533 443 2,957 48.3
Annual report of the National Notifiable Diseases Surveillance System
150 CDI Vol 26, No 2, 2002
Table 13. Top 10 isolates of Salmonella, Australia, 2000 (data from the National Enteric PathogenSurveillance Scheme)*
Isolate ACT NSW NT Qld SA Tas Vic WA Aust % oftotal
S. Typhimurium PT 135† 10 148 2 143 6 6 69 221 605 9.9
S. Typhimurium PT 9† 32 187 3 57 24 22 178 47 550 9.0
S. Virchow† 8 56 4 256 16 2 110 6 458 7.5
S. Saintpaul† 6 39 20 186 26 2 15 47 341 5.6
S. Enteriditis 5 55 5 72 14 9 32 56 248 4.0
S. Typhimurium PT 64 1 101 1 19 16 1 77 10 226 3.7
S. Birkenhead† 1 77 0 100 4 1 13 0 196 3.2
S. Muenchen† 2 21 10 40 11 0 7 29 120 2.0
S. Chester 0 13 17 38 18 0 5 17 108 1.8
S. Bovismorbificans 0 45 2 13 7 1 27 10 105 1.7
Others 0 0 0 0 0 0 0 0 3,164 51.6
* Adapted from NEPSS annual report, 2000
† Associated with an identified outbreak
South Australia reported an outbreak of SalmonellaTyphimurium PT44 in October 2000.30 Ten caseswere associated with eating at an Adelaiderestaurant and although an investigation foundlapses in hygienic practices, no food source for thisoutbreak was identified.
An outbreak of Salmonella Mgulani involving 42laboratory-confirmed cases in December 1999 toJanuary 2000 occurred in New South Wales.31 Noenvironmental or food source was identified andDNA 'fingerprinting' suggested the strains had beencirculating in Australia for some years.
Salmonella Enteriditis was the most commonsalmonella infection among travellers returningfrom overseas in 2000. Of 142 cases, there were85 cases of S. Enteriditis phage type 4.
The NEPSS reported 6,121 cases of Salmonella in2000.29 The top 10 Salmonella infections reportedto NEPSS are shown in Table 13.
NEPSS recorded 19 outbreaks of Salmonella inAustralia in 2000. One outbreak, which was S. Paratyphi B bv Java RDNC/AUS2 associated withfish tanks, was Australia-wide while all others wereconfined to a single jurisdiction. Six outbreaks wererecorded in South Australia, three each in NewSouth Wales and Western Australia, two each inQueensland and Victoria and one each in theAustralian Capital Territory and the NorthernTerritory. No Salmonella outbreaks were reportedfrom Tasmania. The largest outbreak was ofSalmonella Typhimurium PT135 in WesternAustralia. This outbreak continued through the yearwith peaks of reports in February, April and May. Allage groups were affected but no food vehicle orcommon source was identified.

Annual report of the National Notifiable Diseases Surveillance System
151CDI Vol 26, No 2, 2002
Shigellosis
In 2000, the NNDSS notification rate of shigellosisfell for the third year running, and was the lowestrate recorded since the surveillance system began.There were 487 cases of shigellosis reported to theNNDSS with onset of symptoms in 2000, whichwas an 11 per cent decrease from 547 casesreported in 1999. The highest age-specific rate was18 cases per 100,000 population in 0–4 year-oldchildren (Figure 16) and the male to female ratiowas 1.2:1.
Figure 16. Notification rates of shigellosis,Australia, 2000, by age and sex
Reports were received from every jurisdictionexcept New South Wales where cases are includedin the categories 'foodborne disease' or 'gastroen-teritis in an institution'. The highest notification ratewas in the Northern Territory (58.3 cases per100,000 population) and the lowest rate wasreported from Tasmania (0.4 cases per 100,000population). Cases were more commonly notifiedduring the months of January to April (Figure 17).
Reports of Shigella to the NEPSS identified 147cases of S. sonnei biotype g among gay men ininner city Sydney. This outbreak was associatedwith casual sex at sex-on-premises-venues.32
(O’Sullivan et al Communicable Diseases ControlConference 2001, Abstract No.31)
Figure 17. Trends in notifications ofshigellosis, Australia, 1991 to 2000, by monthof onset
Shiga-like toxin producing Escherichiacoli/Verotoxin-producing E. coli
There were 33 cases of STEC/VTEC reported to theNNDSS with symptom onset in 2000, which was a24 per cent decrease from 43 cases reported in1999. SLTEC/VTEC was a notifiable disease in2000 in all jurisdictions except Queensland andWestern Australia. In 2000, all of the 33 cases ofSLTEC/VTEC were reported from South Australia.This reflects the practice in South Australia ofscreening faecal specimens from all cases ofbloody diarrhoea for toxin genes, by PCR.
The highest age-specific rate was 0.9 cases per100,000 population in the 80–84 year age groupand the male to female ratio was 1.8:1.
Haemolytic uraemic syndrome
Infections with SLTEC/VTEC have the potential tocause severe and life-threatening illness includinghaemolytic uraemic syndrome (HUS). Haemolyticuraemic syndrome will generally be diagnosed onthe basis of microangiopathic haemolytic anaemia,acute renal impairment and thrombocytopaenia(reduced platelet counts). Children aged less than5 years are at increased risk of haemolytic uraemicsyndrome. In an outbreak of HUS associated withthe consumption of mettwurst in South Australia in1994/1995 there was one death and 18 childrenrequired dialysis.33

Annual report of the National Notifiable Diseases Surveillance System
152 CDI Vol 26, No 2, 2002
There were 15 cases of HUS notified to the NNDSSwith symptom onset in 2000 (Table 11). There wasno evidence of clustering among HUS cases.
The highest age-specific rate was 0.6 cases per100,000 population in 0–4 year-old children andthe male to female ratio was 1.1:1.
Typhoid
Typhoid notifications in Australia are stronglyassociated with overseas travel. Since the majorityof cases are imported, the education of overseastravellers, especially young people travelling inAsia, is the most important public health action tocontrol typhoid in Australia.
There were 58 cases of typhoid reported to theNNDSS with symptom onset in 2000, a reductionof nearly 15 per cent compared with the 68 casesreported in 1999. Of the 56 isolations of S. Typhi byNEPSS in 2000, all but 2 cases had a history oftravel (mostly in Asia) prior to onset.
The highest age-specific rate of typhoid was 0.7cases per 100,000 population in the 20–29 yearage group (Figure 18) and the male to female ratiowas 1.5:1. The highest notification rate was inWestern Australia (0.6 cases per 100,000population).
Figure 18. Notification rates of typhoid,Australia, 2000, by age and sex
Yersiniosis
The notification rate for yersiniosis has fallen overthe 10-year period from 1991 to 2000. Thesedeclines are a worldwide phenomenon and mayrelate to changes in laboratory testing of faecesand improvements in animal slaughtering practice(M. Barton, personal communication). The steady
decline in the incidence of this disease and a lackof outbreaks lead the CDNA to remove yersiniosisfrom the national notifiable diseases list in January2001.
Yersinia enterocolitica, the causative organism ofyersiniosis, causes both sporadic cases anddisease outbreaks, with pork a frequently incrim-inated food.27 Person-to-person transmission hasbeen documented in outbreak settings and directtransmission from dogs to humans has beenpostulated.
There were 73 cases of yersiniosis reported to theNNDSS with dates of symptom onset in 2000,which was a 42 per cent decrease from the 125cases reported in 1999. The highest age-specificrate was 2.6 cases per 100,000 population in 0–4year old children (Figure 19) and the male tofemale ratio was 1.5:1. Reports were received fromevery jurisdiction except New South Wales wherecases are included in the categories 'foodbornedisease' or 'gastroenteritis in an institution'. Thehighest notification rates were in Queensland (1.7cases per 100,000 population) and the NorthernTerritory (1.0 cases per 100,000 population).
Figure 19. Notification rates of yersiniosis,Australia, 2000, by age and sex
Policy initiatives in foodborne diseasesurveillance and control in 2000
A Food Policy Unit was formed within theCommonwealth Department of Health and Ageingin 2000. The Unit aims to coordinate policydevelopment with a focus on food safety;strengthening the evidence base for decisionmaking; fostering collaboration betweengovernment, consumers and the food industry; andpromoting nationally consistent policy regulationand action.34

Annual report of the National Notifiable Diseases Surveillance System
153CDI Vol 26, No 2, 2002
In the latter part of 2000, the CommonwealthDepartment of Health and Ageing established andfunded a collaborative network called ‘OzFoodNet’to enhance surveillance mechanisms for foodbornedisease across Australia. The aims of OzFoodNetare to:
• estimate the incidence of foodborne disease inAustralia;
• learn more about the causes and determinantsof foodborne disease;
• identify risky practices associated with foodpreparation and handling;
• train foodborne disease epidemiologists.
The work of OzFoodNet will improve surveillance offoodborne disease across Australia. Collaboratorsof OzFoodNet include State and Territory healthauthorities, the National Centre for Epidemiologyand Population Health, the Public HealthLaboratory Network and national governmentagencies.35
Quarantinable diseases
In Australia, the human diseases proclaimed to bequarantinable under the Quarantine Act 1908 arecholera, plague, rabies, yellow fever, and four viralhaemorrhagic fevers (Ebola, Marburg, Lassa andCrimean-Congo). Cholera, plague, yellow fever andthe viral haemorrhagic fevers are of internationalpublic health significance with mandatory reportingto the WHO under international health regulations(http://www.who.int/m/topics/international_health_regulations/en/index.html). Rabies is a disease ofboth human and animal quarantine importance inAustralia. All States and Territories are required bylaw to notify the quarantinable diseases to theNNDSS.
The only case of quarantinable disease reported in Australia in 2000 was a case of cholera (V. cholerae 0139). The disease was acquired inBali, Indonesia. The continued reporting of cholerain travellers returning from foreign countriesdemonstrates the importance of travellersconsuming safe food and drink in areas wherecholera is known to occur, including many Asianand South Pacific countries.
Although no cases of rabies or yellow fever werereported in Australia, worldwide these two diseasescontinue to cause fatalities and travellers shouldbe aware of measures they can take to preventinfection with these viruses. Travellers intending tovisit central Africa or central South America areencouraged to receive the yellow fever vaccine froman approved Australian vaccination centre.Information on quarantinable diseases can befound on the DoHA Website at: http://www.health.gov.au/pubhlth/strateg/quaranti/index.htm.
Sexually transmitted infections
A number of systems are involved in sexuallytransmitted infection (STI) surveillance in Australia,including the NNDSS, the Laboratory Virology andSerology Reporting Scheme (LabVISE) andspecialist laboratory networks such as theAustralian Gonococcal Surveillance Programme(AGSP). The NCHECR has an interest in STIsurveillance, and have further analysed data fromthe NNDSS and other reporting sources in theirannual surveillance report.
In 2000, STI reports accounted for 24,319 notifi-cations to the NNDSS, which was 27 per cent of allnotifications.
STIs reported to the NNDSS in 2000 includedchancroid, chlamydial infection, donovanosis,gonococcal infection, lymphogranuloma venereumand syphilis. Laboratory diagnoses of chlamydiaand syphilis were also reported via LabVISE. OtherSTIs not subject to national surveillance throughthe NNDSS or via LabVISE include genital herpes(herpes simplex virus type I and II), genital warts(human papilloma virus, several types), trichomo-niasis and parasitic infestations such as pubic liceand scabies.
The trends in the number and rates of STI notifi-cations reported to the NNDSS between 1991 and2000 are shown in Tables 14 and 15. Notificationrates for chancroid, lymphogranuloma venereumand syphilis remained relatively stable over thedecade. The number of donovanosis notificationsdecreased over time, while increased numbers ofchlamydia and gonococcal infections werereported. Some of the increases may be due tohigher levels of infections. Changes in surveillancemethods and laboratory tests (particularly the useof nucleic acid testing) may also account for someof the observed increases.

Annual report of the National Notifiable Diseases Surveillance System
154 CDI Vol 26, No 2, 2002
Table 14. Trends in notifications of sexually transmitted infections, Australia, 1991 to 2000*
Disease 1991 1992 1993 1994 1995 1996 1997 1998 1999 2000
Chancroid 1 4 0 0 2 1 1 1 0 0
Chlamydial infection – – – 6,153 6,407 8,366 9,239 10,927 14,045 16,866
Donovanosis 72 80 71 121 87 51 49 31 17 12
Gonococcal infection 2,705 2,889 2,811 2,968 3,308 4,144 4,684 5,469 5,644 5,686
Lymphogranuloma venereum 0 3 1 2 1 0 0 0 0 0
Syphilis 1,974 2,683 2,260 2,275 1,735 1,449 1,296 1,683 1,844 1,755
* All jurisdictions reported for all years with the following exceptions:
Chlamydial infection not reported from New South Wales (1994 to 1998).
Donovanosis not reported from New South Wales or South Australia (all years) or Tasmania (1991 to 1992).
Lymphogranuloma venereum not reported from Western Australia.
Disease 1991 1992 1993 1994 1995 1996 1997 1998 1999 2000
Chancroid < 0.1 < 0.1 0.0 0.0 < 0.1 < 0.1 < 0.1 < 0.1 0.0 0.0
Chlamydial infection – – – 52.2 53.7 69.1 75.4 88.2 74.1 88.0
Donovanosis 0.8 0.8 0.7 1.2 0.8 0.5 0.5 0.3 0.2 0.1
Gonococcal infection 15.7 16.5 15.9 16.6 18.3 22.6 25.3 29.2 29.8 29.7
Lymphogranuloma venereum 0.0 < 0.1 < 0.1 < 0.1 < 0.1 0.0 0.0 0.0 0.0 0.0
Syphilis 11.4 15.3 12.8 12.7 9.6 7.9 7.0 9.0 9.7 9.2
Table 15. Trends in notification rates of sexually transmitted infections, Australia, 1991 to 2000*(rate per 100,000 population)
* All jurisdictions reported for all years with the following exceptions:
Chlamydial infection not reported from New South Wales (1994 to 1998).
Donovanosis not reported from New South Wales or South Australia (all years) or Tasmania (1991 to 1992).
Lymphogranuloma venereum not reported from Western Australia.
Chancroid
Cases of chancroid (a bacterial infection causinggenital ulcers) have rarely been reported to theNNDSS since 1991. No cases of chancroid werereported in Australia in 2000, and in 2001 thisdisease was removed from the list of nationallynotifiable diseases.
Chlamydial infection
Chlamydial infections were the most commonlyreported STI and the second most commonlyreported notifiable disease in Australia in 2000. Inthis year 16,866 notifications of chlamydialinfection were reported, an increase on the 14,045cases reported in 1999 (Table 14). There were 81cases reported in children aged less than 10 years.Notifications reported in young children may becases of chlamydial conjunctivitis. In 2000,Queensland had a campaign of screening forchlamydial infections, including PCR testing ofsamples from young women and Indigenouspeople.

Annual report of the National Notifiable Diseases Surveillance System
155CDI Vol 26, No 2, 2002
The notification rate for chlamydial infections in2000 was 88 cases per 100,000 population, whilein 1999 the rate was 74.1 cases per 100,000population. This reflects an upward trend in thenumber of syphilis notifications reported to theNNDSS since 1997. In 2000, the male to femaleratio was 0.7:1. In both males and females thehighest rate of disease was recorded for the 20–24year age group (Figure 20). High rates of notifi-cation were reported from northern Australia(including the Northern Territory, Western Australiaand Queensland), with rates over 490 cases per100,000 population in the Northern Territory in2000 (Map 3).
Figure 20. Notification rates of chlamydia,Australia, 2000, by age and sex
Some important surveillance issues must be takeninto account when analysing the trends inchlamydia notification rates. Firstly, in New SouthWales, reporting of genital chlamydial infectioncommenced in September 1998, so that thereporting of this infection was national for the firsttime in 1999. Secondly, chlamydial infections maybe under-reported because of the high proportionof asymptomatic infections, particularly amongwomen.27 The introduction of screening programscan have a marked effect on notification rates overtime. Thirdly, the use of nucleic acid tests forchlamydia may also explain increases in notifi-cations.
Based on NNDSS data, the NCHECR reported ratesof chlamydial disease in Indigenous Australians.36
Using data from the Northern Territory, SouthAustralia and Western Australia (the onlyjurisdictions to report Indigenous status in morethan half of notifications), the estimated crude rateof chlamydial infection among IndigenousAustralians in 2000 was 1,207 cases per 100,000population compared with a rate of 95 cases per100,000 population in non-Indigenous Australians.For these jurisdictions, 831 of notifications did nothave Indigenous status reported. Trends in notifi-cation rates of chlamydia in Indigenous and non-Indigenous Australians between 1993 and 2000are shown in Figure 21.
Map 3. Notification rates of chlamydial infection, Australia, 2000, by Statistical Division of residence

Annual report of the National Notifiable Diseases Surveillance System
156 CDI Vol 26, No 2, 2002
Figure 21. Trends in notification rates ofchlamydia, the Northern Territory, SouthAustralia and Western Australia, 1993 to2000, by Indigenous status
Lymphogranuloma venereum
Lymphogranuloma venereum is a sexually acquiredchlamydial infection caused by certain serovars ofChlamydia trachomatis. There were no cases oflymphogranuloma venereum reported from anyState or Territory in 2000. In Australia, there haveonly been 7 reports of lymphogranuloma venereumto the NNDSS since 1991 and none since 1995. In2001 lymphogranuloma venereum was removedfrom the list of nationally notifiable diseases inAustralia.
Donovanosis
Donovanosis is a relatively uncommon STI, charac-terised by genital ulceration which may develop intoa chronic ulcerative disease if untreated. Lesionsmay be extensive and extra-genital in some cases,and may be associated with secondary bacterialinfection. Donovanosis is generally found in tropicalcountries, and in Australia occurs mostly inIndigenous people in rural and remotecommunities. The causative organism, formerlyknown as Calymmatobacterium granulomatis, hasbeen redesignated Klebsiella granulomatis.
Donovanosis is a notifiable disease in alljurisdictions except New South Wales and SouthAustralia. Notifications of donovanosis have fallenover the past 10 years, and particularly since1994. Eradication of donovanosis was proposed aspart of the 1997 National Indigenous Australians’Sexual Health Strategy, and since then significantadvances have been made in the control of thisdisease in Indigenous Australians.37 The decreases
in notifications are due to earlier diagnosis andtreatment (including the introduction of moresensitive and acceptable testing methods andmore effective treatment with azithromycin), bettereducation strategies, with a partnership approachencompassing Aboriginal and Torres Strait Islanderpeople.
A total of 12 notifications of donovanosis werereceived in 2000, including five from the NorthernTerritory, six from Queensland and one fromWestern Australia. This represents a decrease from1999, when 17 notifications were receivednationally. In 2000, the highest rate of notificationswas in the 25–34 year age range. The male tofemale ratio was 1:1, a change from 1999, whenthe male to female ratio was 1:7.
Gonococcal infection
The number of notifications of gonococcal infectionin Australia has increased over the past decade. In2000, a total of 5,686 notifications of gonococcalinfection were received nationally (Table 14),similar to the 5,644 received in 1999. The notifi-cation rate of gonococcal infection has increasedsteadily from around 16 cases per 100,000population in 1993 to around 30 cases per100,000 population in 1998 to 2000 (Figure 22).This rate remains far below the very high ratesrecorded in the 1970s and early 1980s, whichpeaked at 84.4 cases per 100,000 population in1982.38 In 2000, Queensland and the NorthernTerritory had screening programs for gonococcalinfection in Indigenous communities.
Figure 22. Trends in notification rates ofgonococcal infections, Australia, 1991 to2000

Annual report of the National Notifiable Diseases Surveillance System
157CDI Vol 26, No 2, 2002
In 2000, the male to female ratio for gonococcalnotifications was 2:1, similar to the ratio inprevious years (in 1999 the ratio was 2.2:1). Peaknotification rates for females (97 cases per100,000 population) occurred in the 15–19 yearage group. For males the corresponding group wasthe 25–29 year age group, where the notificationrate was 105 cases per 100,000 population(Figure 23). There was a wide geographicalvariation in the rate of notification of gonococcalinfection (Map 4). The highest rates of notificationwere from the Northern Territory (577 cases per100,000 population) and from northern StatisticalDivisions in Western Australia (Map 4).
Figure 23. Notification rates of gonococcalinfection, Australia, 2000, by age and sex
Division of residence
The increase in the number of gonococcal notifi-cations is due in part to an ongoing outbreak ofgonorrhoea among men who have sex with men.39
The proportion of male cases of gonococcalinfection associated with homosexual contact wasreported in four jurisdictions and varied from 28per cent in metropolitan Western Australia to 75per cent in Tasmania. Increased acceptance ofnon-invasive sample collection for nucleic acidtesting may also increase testing rates andencourage opportunistic screening, leading toincreased diagnoses. Increased testing may alsoresult from the introduction of sexual healthprograms and other health promotion activities.
The NCHECR reported rates of gonococcal diseasein Indigenous Australians, based on the NNDSSdata.36 These analyses are based on data from theNorthern Territory, South Australia and WesternAustralia, which were the only jurisdictions to reportIndigenous status in more than half of notifi-cations. From these three jurisdictions, 11 per centof notifications did not have Indigenous statusrecorded. It is estimated that in 2000 the rate ofgonococcal infections among IndigenousAustralians was 1,608 per 100,000 population,compared with a rate of 36 per 100,000population in non-Indigenous Australians, largelyexplaining the geographic variation in notificationsof gonococcal infection. This represents anincrease in gonococcal notification rates since1993 for Indigenous Australians (Figure 24). Smallincreases were also observed in non-IndigenousAustralians.
Figure 24. Trends in notification rates ofgonococcal infections, the Northern Territory,South Australia and Western Australia, 1993 to2000, by Indigenous status
The Australian Gonococcal SurveillanceProgramme is the national laboratory-basedsurveillance system that documents the antibioticsensitivity of gonococcal isolates. The program isundertaken by a network of reference laboratoriesin each state and territory, using agreed standardmethodology to quantitatively determine thesusceptibility of gonococci to a core group ofantibiotics. Surveillance of antibiotic resistance ingonococci is important, as resistance rates can bequite volatile, and it is recommended that aparticular treatment regime be discontinued once5 per cent of isolates are resistant to that agent.

Annual report of the National Notifiable Diseases Surveillance System
158 CDI Vol 26, No 2, 2002
Syphilis
In 2000, all jurisdictions reported syphilis(including primary, secondary and latent syphilis)and congenital syphilis to the NNDSS. A total of1,755 notifications of syphilis were received in2000 (Tables 14 and 15) with a rate of 9.2 casesper 100,000 population, consistent the rate in1999 (1,844 notifications, a rate of 9.7 cases per100,000 population). The peak notification rateoccurred in 1992. Rates have since decreased andbeen relatively stable since 1998 (Table 15).
In 2000, there was wide geographical variation inthe notification rate for syphilis (Table 14, Map 5).The highest rate was described in the NorthernTerritory (89.5 cases per 100,000 population). Themale to female ratio for syphilis notifications was1.2:1. Notification rates were higher amongfemales in the 25–29 year age group (21.8 casesper 100,000 population). In comparison, thecorresponding peak age group for males was the50–54 year age group, where the rate was 17.4cases per 100,000 population, although thereporting rates in all age groups for adult males isgenerally quite similar (Figure 25).
A survey of the antibiotic susceptibility of Neisseriagonorrhoeae by the AGSP in 2000, has beenpublished.40 The proportion of Neisseria gonorrhoeaisolates with antibiotic resistance in the WHOWestern Pacific Region for 2000 have beencompared.41 Table 16 shows the trends in antibioticresistance in Australia between 1998 and 2000.As in previous years, antibiotic susceptibilitypatterns in 2000 varied significantly betweenregions. Generally, rates of resistance to penicillinand quinolone groups of antibiotics were higher inurban than in rural areas. Quinolone resistancebecame more widespread in 2000, with increasesin Queensland, Western Australia and SouthAustralia. A high rate of quinolone resistantgonococci isolated from homosexually active menwas observed in 1999 in New South Wales andVictoria. High rates were again seen in 2000 inVictoria, but not in New South Wales.
Map 4. Notification rates of gonococcal infections, Australia, 2000, by Statistical Division ofresidence

Annual report of the National Notifiable Diseases Surveillance System
159CDI Vol 26, No 2, 2002
Table 16. Proportion of gonococcal isolates showing antibiotic resistance, Australia, 1998 to 2000
Year Penicillin (% resistant) Quinolone resistance High level (% resistant) tetracycline
resistance(% resistant)
Plasmid mediated Chromosomally mediated resistance resistance
1998 5.3 21.8 5.2 NR
1999 7.4 14.3 17.2 7.9
2000 8.7 10.6 17.8 9.1
Map 5. Notification rates of syphilis, Australia, 2000, by Statistical Division of residence

Annual report of the National Notifiable Diseases Surveillance System
CDI Vol 26, No 2, 2002160
Figure 25. Notification rates of syphilis,Australia, 2000, by age and sex
In 2000, there were 5 cases of syphilis reported inthe 0–4 year age group, and 2 cases in 5–9 yearage group. Of these, 2 cases (one each in NewSouth Wales and Queensland) were confirmed ascongenital syphilis.
The NCHECR has reported rates of syphilis inIndigenous Australians based on NNDSS data.36
These estimates are based on data from theNorthern Territory, South Australia and WesternAustralia, which were the only jurisdictions to reportIndigenous status in more than half of notifi-cations. Of the reports from these jurisdictions,only 4 per cent did not have Indigenous statusidentified. The estimated rate of syphilis amongIndigenous Australians in 2000 was 176 per100,000 population compared with a rate of 2.8per 100,000 population in non-IndigenousAustralians.
Trends in notification rates of syphilis in Indigenousand non-Indigenous Australians from these statesand territories between 1993 and 2000 are shownin Figure 26.
Figure 26. Notification rates of syphilis, theNorthern Territory, South Australia and WesternAustralia, 1993 to 2000, by Indigenous status
Vaccine preventable diseases
Introduction
This section summarises the national notificationdata for diseases targeted by the AustralianStandard Childhood Vaccination Schedule in 2000.This includes diphtheria, Haemophilus influenzaetype b infection, measles, mumps, pertussis,poliomyelitis, rubella and tetanus.
There were 6,617 notifications of vaccinepreventable diseases (VPDs) in 2000; 7.4 per centof the total notifications. Pertussis was by far themost common accounting for 5,942 notificationsor 89.8 per cent of all VPD notifications.Notifications of vaccine preventable diseases tothe NNDSS and notification rates for vaccinepreventable diseases in Australia are shown inTables 17 and 18.

Annual report of the National Notifiable Diseases Surveillance System
161CDI Vol 26, No 2, 2002
Table 17. Trends in notifications of vaccine preventable diseases, Australia, 1991 to 2000*
Disease 1991 1992 1993 1994 1995 1996 1997 1998 1999 2000
Diphtheria 1 12 0 0 0 0 0 0 0 0
Haemophilus influenzae type b 533 465 370 163 77 49 51 35 40 28
Measles 1,438 1,452 4,693 4,805 1,185 481 838 288 238 107
Mumps – – – – 156 125 191 182 172 212
Pertussis 343 795 4,413 5,441 4,230 4,545 10,825 5,791 4,417 5,942
Polio 0 0 0 0 0 0 0 0 0 0
Rubella – – 4,006 3,488 5,751 2,933 1,387 753 377 322
Tetanus 13 13 10 13 7 3 7 8 2 6
* All jurisdictions reported for all years with the following exceptions:
Haemophilus influenzae type b not reported from Western Australia (1991 to 1993).
Mumps not reported from Queensland (1995,1996, 1999 and 2000).
Rubella not reported from Tasmania (1993 to 1994).
Tetanus not reported from Queensland (1991 to 1993).
Table 18. Trends in notification rates of vaccine preventable diseases, Australia, 1991 to 2000* (rateper 100,000 population)
Disease 1991 1992 1993 1994 1995 1996 1997 1998 1999 2000
Diphtheria < 0.1 0.1 0.0 0.0 0.0 0.0 0.0 0.0 0.0 0.0
Haemophilus influenzae type b 3.4 2.9 2.3 0.9 0.4 0.3 0.3 0.2 0.2 0.1
Measles 8.3 8.3 26.6 26.9 6.6 2.6 4.5 1.5 1.3 0.6
Mumps – – – – 1.1 0.8 1.0 1.0 1.1 1.4
Pertussis 2.0 4.5 25.0 30.5 23.4 24.8 58.4 30.9 23.3 31.0
Polio 0 0 0 0 0 0 0 0 0 0
Rubella – – 23.3 20.1 31.8 16.0 7.5 4.0 2.0 1.7
Tetanus 0.1 0.1 0.1 0.1 < 0.1 < 0.1 < 0.1 < 0.1 < 0.1 < 0.1
* All jurisdictions reported for all years with the following exceptions:
Haemophilus influenzae type b not reported from Western Australia (1991 to 1993).
Mumps not reported from Queensland (1995,1996, 1999 and 2000).
Rubella not reported from Tasmania (1993 to 1994).
Tetanus not reported from Queensland (1991 to 1993).

Annual report of the National Notifiable Diseases Surveillance System
CDI Vol 26, No 2, 2002162
In 2000, the following changes to the childhoodimmunisation schedule25 occurred:
New vaccines
New combination vaccines for:
• diphtheria-tetanus-acellular pertussis-hepatitisB (DTPa-hepB); and
• Haemophilus influenzae type b — hepatitis B (Hib (PRP-OMP)-hep B),
for all three doses in the primary vaccinationschedule. This allowed the introduction of universalhepatitis B vaccination (commencing at birth)without requiring an extra injection.
New schedule
• Two alternative schedules depending on whichof the above combination vaccines is used anddiffering only in the timing of the 4th dose ofthese vaccines.
• All Australian children recommended to receivethe same Hib vaccine (PRP-OMP), whichreduces the number of injections and thecomplexity of the schedule.
• Introduction of universal vaccination forhepatitis B beginning at birth. Infants born tohepatitis B carrier mothers receive hepatitis Bimmunoglobulin and vaccine at birth.Preadolescent hepatitis B vaccination nowrecommended at 10–13 years. Booster dosesof hepatitis B vaccine no longer recommended.
• Second booster of DTPa now recommended at4 years, instead of 4–5 years.
• Second dose of MMR now given at 4 yearsinstead of 10–16 years.
• Tetanus and diphtheria boosters no longerrecommended every 10 years. A tetanusbooster at age 50 is recommended if noboosters have been given within the last 10 years.
• Inactivated poliomyelitis vaccine is anacceptable alternative to live, oral poliomyelitisvaccine (OPV) in the primary vaccinationschedule. However, OPV will remain the publiclyfunded vaccine.
• Influenza vaccine recommended for childrenwith cystic fibrosis, people with severe asthmaand pregnant women in the second or thirdtrimester of pregnancy during the influenzaseason.
The annual report of vaccination coverageestimates for children aged 12 months and thesecond annual report for children aged 24 months(using data extracted from the AustralianChildhood Immunisation Register-ACIR) are alsoincluded in this section. A full description of themethodology used for calculating these estimateshave been described previously.42
Diphtheria
There were no cases of diphtheria notified in 2000.The last known case occurred in 1992 and wasnotified in 1993. There has been a dramaticdecline in the incidence of diphtheria in Australiasince the first half of the 20th century (Figure 27).
Figure 27. Trends in notifications of diphtheria,Australia, 1917 to 1998
At the height of the 1921 diphtheria outbreak inAustralia, there were 23,199 notifications giving anotification rate of 426 cases per 100,000population.43 Although diphtheria hasn’t beenfound in Australia since 1992, a recent case in NewZealand44 and the extensive outbreak in the formerstates of the Soviet Union in the 1990s45 highlightthe potential for diphtheria to re-emerge.
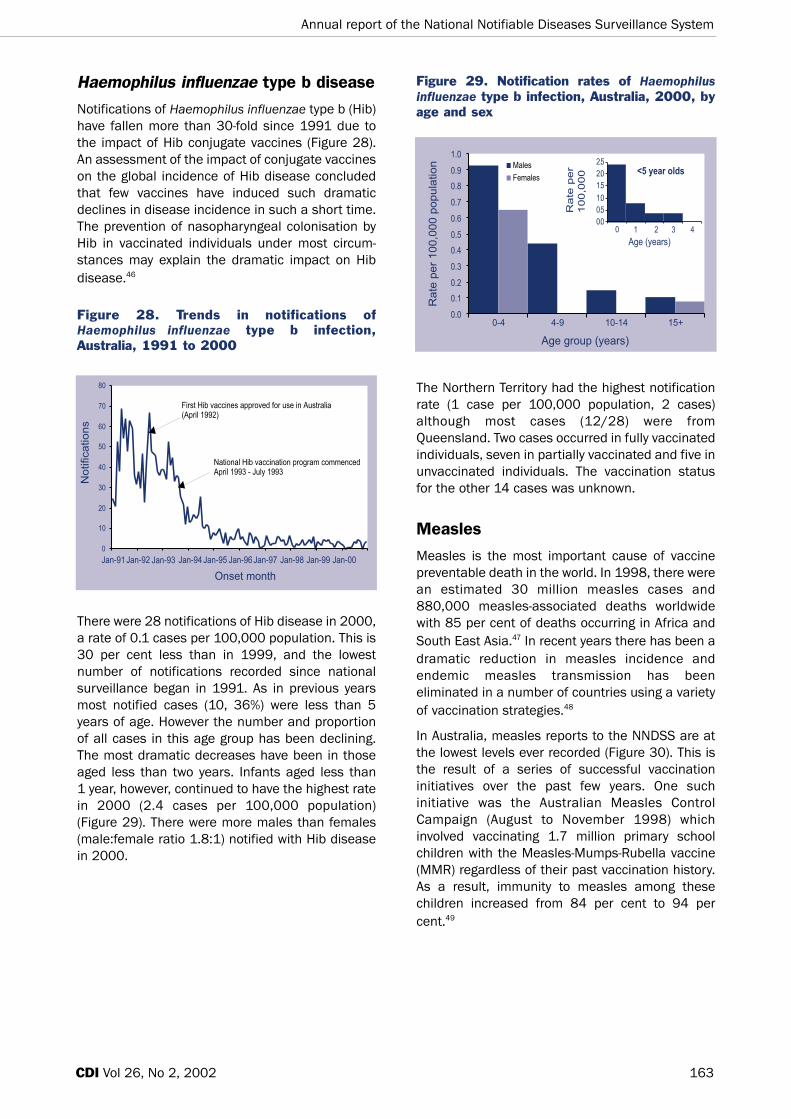
Annual report of the National Notifiable Diseases Surveillance System
163CDI Vol 26, No 2, 2002
Haemophilus influenzae type b disease
Notifications of Haemophilus influenzae type b (Hib)have fallen more than 30-fold since 1991 due tothe impact of Hib conjugate vaccines (Figure 28).An assessment of the impact of conjugate vaccineson the global incidence of Hib disease concludedthat few vaccines have induced such dramaticdeclines in disease incidence in such a short time.The prevention of nasopharyngeal colonisation byHib in vaccinated individuals under most circum-stances may explain the dramatic impact on Hibdisease.46
Figure 28. Trends in notifications ofHaemophilus influenzae type b infection,Australia, 1991 to 2000
There were 28 notifications of Hib disease in 2000,a rate of 0.1 cases per 100,000 population. This is30 per cent less than in 1999, and the lowestnumber of notifications recorded since nationalsurveillance began in 1991. As in previous yearsmost notified cases (10, 36%) were less than 5years of age. However the number and proportionof all cases in this age group has been declining.The most dramatic decreases have been in thoseaged less than two years. Infants aged less than 1 year, however, continued to have the highest ratein 2000 (2.4 cases per 100,000 population)(Figure 29). There were more males than females(male:female ratio 1.8:1) notified with Hib diseasein 2000.
Figure 29. Notification rates of Haemophilusinfluenzae type b infection, Australia, 2000, byage and sex
The Northern Territory had the highest notificationrate (1 case per 100,000 population, 2 cases)although most cases (12/28) were fromQueensland. Two cases occurred in fully vaccinatedindividuals, seven in partially vaccinated and five inunvaccinated individuals. The vaccination statusfor the other 14 cases was unknown.
Measles
Measles is the most important cause of vaccinepreventable death in the world. In 1998, there werean estimated 30 million measles cases and880,000 measles-associated deaths worldwidewith 85 per cent of deaths occurring in Africa andSouth East Asia.47 In recent years there has been adramatic reduction in measles incidence andendemic measles transmission has beeneliminated in a number of countries using a varietyof vaccination strategies.48
In Australia, measles reports to the NNDSS are atthe lowest levels ever recorded (Figure 30). This isthe result of a series of successful vaccinationinitiatives over the past few years. One suchinitiative was the Australian Measles ControlCampaign (August to November 1998) whichinvolved vaccinating 1.7 million primary schoolchildren with the Measles-Mumps-Rubella vaccine(MMR) regardless of their past vaccination history.As a result, immunity to measles among thesechildren increased from 84 per cent to 94 percent.49

Annual report of the National Notifiable Diseases Surveillance System
CDI Vol 26, No 2, 2002164
Figure 30. Trends in notification rates ofmeasles, Australia, 1991 to 2000, by month ofonset
There is evidence that endemic transmission ofmeasles in some parts of Australia is beinginterrupted. All measles cases in Western Australiain 1999/2000 were imported from overseas orepidemiologically linked to imported cases.(Dowse, Communicable Diseases ControlConference, April 2001, Abstract 58). Usingmeasles virus genotyping, Lambert and colleagueshave shown that endemic measles virus strains areno longer circulating in Victoria. Instead, sporadicintroduction of imported strains is responsible forlimited focal spread. (Lambert, CommunicableDiseases Conference, April 2001, Abstract 60). Ifone accepts that measles elimination should bedefined as a situation in which endemictransmission has stopped, sustained transmissioncannot occur (because the proportion ofsusceptible people is sufficiently low), andsecondary spread from importations will endnaturally without intervention,50 then Australia mayhave already achieved measles elimination.
There were 107 cases of measles notified in 2000,a national rate of 0.6 cases per 100,000population. This is less than half the numberreported in 1999 and is the lowest annual rate forAustralia since national surveillance began in1991. In 2000, Western Australia and theAustralian Capital Territory began laboratory testingof all notified cases and initiated improved contacttracing. The highest rates of notification were in theAustralian Capital Territory (1 case per 100,000population; 3 cases), Queensland (0.7 cases per100,000 population; 26 cases) and SouthAustralia (0.7 cases per 100,000 population; 11cases) (Tables 2 and 3). Twenty-two cases were
documented as acquired overseas and 21 casesresulted from seven identified outbreaks in whichthe index case had acquired measles outsideAustralia. The source of infection for the remaining85 cases was not recorded.
As in recent years, age-specific notification rateswere highest for the 0–4 year age group (2.5 casesper 100,000 population) especially those aged lessthan one year (3.6 cases per 100,000 population)and one year of age (5.2 cases per 100,000population). Rates for this age group were,however, considerably lower than in the past(Figure 31). Rates for the 5–9 year age group (0.8cases per 100,000 population) were also thelowest on record.
Figure 31. Trends in notification rates ofmeasles, Australia, 1998 to 2000, by agegroup
The 20–24 year age group had the second highestage-specific rate (1.7 cases per 100,000population) and accounted for 21 per cent(23/107) of the reported cases in 2000 (similar tothe 20% of cases this age group contributed in1999). This age group is a ‘missed middle’ of youngadults born in the second half of the 1970s, whohave neither been vaccinated nor exposed to thewild measles virus. In the past few years, Australiahas recorded measles outbreaks among youngadults, often associated with an index case whohas travelled to countries with high endemic levelsof measles.51,52,53 As in past years there weresimilar numbers of males and females withmeasles reported in 2000 (male:female ratio1.1:1, Figure 32).

Annual report of the National Notifiable Diseases Surveillance System
165CDI Vol 26, No 2, 2002
Figure 32. Notification rates of measles,Australia, 2000, by age and sex
Mumps
Mumps notification rates in Australia have beenclose to 1.0 cases per 100,000 population since1997 (Table 18). Increased coverage of theAustralian population with the MMR vaccine hasnot had the dramatic impact on mumps incidencethat has been seen for measles and rubella.Moreover, in recent years the notification rates formumps have increased in older age groups, inwhom mumps morbidity is more severe (Figure 33).Increased use of the MMR vaccine in adolescentsand adults over the next few years and ongoingsurveillance are essential for mumps control andelimination in Australia. (Gidding, CommunicableDiseases Control Conference, April 2001, Abstract 57)
Figure 33. Trends in notification rates ofmumps, Australia, 1993 to 2000, by agegroup
In 2000, there were 212 notifications of mumps, arate of 1.4 cases per 100,000 population. This isabove the WHO elimination target of <1 case per100,000 population and is a 23% increase on the172 cases reported in 1999. There were cases inmost age groups with the majority (151, 71%) aged15 years or more (Figure 34). In contrast withprevious years the highest notification rates were inthe 20–24 year age group (3.1 cases per 100,000population) and the 15–19 year age group (2.6cases per 100,000 population). This pattern wasapparent even in New South Wales where onlylaboratory-confirmed cases are notifiable. Overall,there was a slight preponderance of mumps notifi-cations from males (male:female ratio 1.3:1).Mumps was not notifiable in Queensland from July1999 to December 2000.
Figure 34. Notification rates of mumps,Australia, 2000, by age and sex
Pertussis
Pertussis continues to be the most commonvaccine preventable illness in Australia, withperiodic epidemics occurring at intervals of 3 to 5years (Figure 35).54 As a result of infant immuni-sation against pertussis in Australia (five dosesgiven at 2, 4, 6, 18 and 48 months) the peak notifi-cation rate is now found among young adolescents(aged 10–14) (Figure 36).

Annual report of the National Notifiable Diseases Surveillance System
CDI Vol 26, No 2, 2002166
Figure 35. Trends in notification rates ofpertussis, Australia, 1991 to 2000, by monthof onset
Figure 36. Trends in notification rates ofpertussis, Australia, 1996 to 2000, by agegroup
Despite high levels of vaccination, pertussis hasincreased in a number of countries since 1997.This has prompted investigations into the evolutionof variants of Bordetella pertussis. Mooi andcolleagues have observed antigenic divergencebetween vaccine strains and clinical isolates ofBordetella pertussis specifically in the surface-associated protein pertactin and the pertussistoxin.55 Replacement of vaccine with non-vaccinestrains as a result of herd immunity has not yet hadany measurable effect on pertussis vaccineefficacy, but surveillance of variant strains of thebacteria may be important for the control ofpertussis in the future.
Several recent studies have examined theimportance of pertussis as a cause of prolongedcoughing in adults and adolescents. A recent studyin Canada suggests that up to 20 per cent of
prolonged coughs are associated with laboratoryevidence of pertussis infection.56 The nature of thatevidence is controversial, however, as only 2.3 percent of symptomatic cases were confirmed byculture, PCR or a fourfold increase in pertussisantibody. The remainder were diagnosed on thebasis of a single high pertussis antibody titre.
Since it is well established that adolescents andadults are frequently the source of pertussisinfection for infants and children, and adolescentsnow have the highest rates of disease, vaccinationof adolescents with acellular pertussis vaccineshas been instituted in France, Germany andCanada. It remains to be seen how this will impacton the epidemiology of pertussis in thesecountries. Implementation of an adolescentvaccination program in Australia is currently beingconsidered by a working party of the AustralianTechnical Advisory Group on Immunisation (ATAGI).
There were 5,942 notified cases of pertussis in2000, 1,525 more than in 1999. The annual notifi-cation rate was 31.0 cases per 100,000population. Pertussis notifications peaked inAugust, when 721 cases were notified. As in 1999,the 10–14 year age group had the highest notifi-cation rate of pertussis (117.7 cases per 100,000population) (Figure 37).
Figure 37. Notification rates of pertussis,Australia, 2000, by age and sex
Notification rates of pertussis varied considerablyby geographic location (Map 6). At theState/Territory level, rates were highest in theAustralian Capital Territory (66.2 cases per100,000 population) and lowest in the NorthernTerritory (2.6 cases per 100,000 population),where only 5 cases were notified. In 2000, SouthAustralia included pertussis cases diagnosed byPCR for the first time.

Annual report of the National Notifiable Diseases Surveillance System
167CDI Vol 26, No 2, 2002
Poliomyelitis
No cases of poliomyelitis were reported in Australiain 2000. It is difficult to determine exactly when thelast case of locally acquired poliomyelitis occurredin Australia. However, the last laboratory confirmedcase was in 1967 and there were three clinicallycompatible cases notified in 1972 with noadditional information currently available.57 Allcases notified since 1972 have been investigatedfurther and this has led them to be re-classified ascases of vaccine-associated poliomyelitis. The lastknown imported case of poliomyelitis was due towild poliovirus type 1 in 1977.
On 29 October 2000, the WHO certified theWestern Pacific Region polio-free.58 The lastrecorded case in the region was reported inCambodia in 1997.
Since the live oral polio vaccine has the potential tocause vaccine associated disease, the USA hasrecently replaced this vaccine with an inactivatedpolio vaccine. This issue is under consideration inAustralia by ATAGI
A report on the Australian National Polio ReferenceLaboratory is given later in this report (p188).
Rubella
Since 1995, annual numbers of rubella notifi-cations have been declining (Figure 38). Thisdecrease has occurred at the same time as MMRvaccine usage has been increasing. In 2000, therewere 322 notifications, a notification rate of 1.7cases per 100,000 population. This is the loweston record both nationally and in each State orTerritory. As in previous years, the highest numberof notified cases occurred in October, reflecting theexpected seasonal increase in Spring months. Thehighest notification rate was from New South Wales(3.0 cases per 100,000 population), where allcases were laboratory-confirmed.
Map 6. Notification rates of pertussis, Australia, 2000, by Statistical Division of residence

Annual report of the National Notifiable Diseases Surveillance System
168 CDI Vol 26, No 2, 2002
Figure 38. Trends in notification rates ofrubella, Australia, 1991 to 2000, by month ofonset
In 2000, the notification rate of rubella was highestin males in the 20–24 year age group (11.2 casesper 100,000 population, Figure 39). However, ratesfor this group have been decreasing in recent yearsdue to the replacement of the schoolgirl rubellaprogram with adolescent vaccination of both malesand females between 1994 and 1998. Overall,there were more males than females notified withrubella (male:female ratio 2.0:1) in 2000.
Figure 39. Notification rates of rubella,Australia, 2000, by age and sex
There were 68 notifications of rubella from womenof childbearing age (15–49 years) in 2000, a rateof 1.4 cases per 100,000 population. No notifi-cations of congenital rubella were received in 2000(Annual Report of the Australian PaediatricSurveillance Unit). Only 6 cases of congenitalrubella have been reported since 1995, with thelast case notified in 1999.
Tetanus
In 2000, there were 6 cases of tetanus notified tothe NNDSS. Five of these were in adults aged 50years or greater and one was in an infant. Of the 6cases, 1 was partially vaccinated, 2 wereunvaccinated (including the 2-year-old infant) andthe vaccination status of the other three wasunknown. Five of the 6 cases were females.
Childhood vaccination coveragereports
Estimates of vaccination coverage for both 'fullyvaccinated' and individual vaccines for children at12 months of age continued to improve in 2000(Table 19). This trend was also evident in eachState and Territory. Vaccination coverage at 12months of age for Australia as a whole has nowsurpassed the Immunise Australia Program targetof 90 per cent coverage for the first milestonevaccines.
Vaccination coverage at 2 years of age was firstreported in 1998. Coverage estimates forindividual vaccines recommended at 12 monthsand 18 months of age were higher in 2000compared with the previous year, as were theestimates for being 'fully vaccinated' at 2 years ofage (Table 20). 'Fully vaccinated' coverageestimates were reported to be considerably lowerthan estimates for individual vaccines. One likelyfactor is poor identification of children on immuni-sation encounter forms, which leads to difficultiesmatching new and existing vaccination records onthe ACIR. Further, in their regular parent surveys,the Health Insurance Commission have foundsome parents have an objection to particularvaccines, although not always the same vaccines.It is important to note that in countries such as theUnited Kingdom, three doses of diphtheria-tetanus-poliomeylitis vaccine (DTP) and Hib vaccineconstitute full vaccination with these vaccines at 2years of age.

Fully vaccinated 88.4 89.0 91.3 91.2
Fully vaccinated 88.4 89.0 91.3 91.2
Annual report of the National Notifiable Diseases Surveillance System
169CDI Vol 26, No 2, 2002
Table 19. Percentage of Australian children born in 1999 vaccinated at one year of age for fourconsecutive birth cohorts assessed during 2000 using the Australian Childhood ImmunisationRegister
Vaccine group % vaccinated in birth cohort
1 Jan to 31 Mar 1999 1 Apr to 30 Jun 1999 1 Jul to 30 Sep 1999 1 Oct to 31 Dec 1999
DTP 89.8 89.8 91.8 91.5
OPV 89.8 90.2 91.8 91.4
Hib 89.3 90.3 91.7 94.6
Table 20. Percentage of Australian children born in 1998 vaccinated at 2 years of age for fourconsecutive birth cohorts, assessed during 2000 using the Australian Childhood ImmunisationRegister
Vaccine group % vaccinated in birth cohort
1 Jan to 31 Mar 1998 1 Apr to 30 Jun 1998 1 Jul to 30 Sep 1998 1 Oct to 31 Dec 1998
DTP 87.5 88.9 89.6 88.3
OPV 91.9 92.2 92.7 93.1
Hib 87.2 89.2 89.6 94.7
MMR 91.0 91.3 92.3 92.4
Vectorborne diseases
Vectorborne diseases under surveillance inAustralia in 2000 included arboviruses (arthropodborne viruses) and malaria. In this year the NNDSScollected information on 2 alpha viruses (BarmahForest virus and Ross River virus), and oneflavivirus (dengue) as well as malaria. Otherarboviruses not including Barmah Forest, RossRiver and dengue viruses were designated'arbovirus not elsewhere classified (NEC)'. Thiscategory included infections with the flavivirusesMurray Valley encephalitis (MVE) virus, Kunjin virus,Japanese encephalitis (JE) virus, Kokobera virusand Stratford virus, as well as the alphavirusSindbis. In 2000, there were 6,069 notifications ofvectorborne diseases to the NNDSS (6.8% of totalnotifications).
Surveillance of human infection with MVE andKunjin viruses is supplemented by sentinel chickensurveillance. Animal surveillance measuringseroconversions to JE in pigs is also used tocomplement surveillance in humans. Vector data,virus isolations and meteorological data are used
to predict conditions suitable for an outbreak ofarbovirus disease, and complement animal andhuman surveillance mechanisms.
Trends in the reporting of arboviruses over theperiod 1991 to 2000 are shown in Tables 21 and 22.The number of notifications classified as arbovirus(NEC) has decreased since 1995, when BarmahForest virus became notified separately. Sincethen, notification rates for Barmah Forrest virushave remained stable. In comparison, dengue andRoss River virus notification rates have showedperiods of increased disease activity over this timeframe. The number of notifications of malaria haveremained consistent over the decade. The notifi-cation rate of vectorborne disease depends onannual rainfall patterns, the mosquito populationsand the exposure of humans to mosquitoes.
Control of mosquito populations and interception ofexotic mosquito species, which may be diseasevectors are important control strategies forvectorborne disease. Media warnings to residentsduring times of increased risk emphasise personalprotection and risk reduction by reducing potentialmosquito breeding sites.59

Annual report of the National Notifiable Diseases Surveillance System
170 CDI Vol 26, No 2, 2002
Table 22. Trends in notification rates of arboviral infections, Australia, 1991 to 2000* (rate per100,000 population)
Disease 1991 1992 1993 1994 1995 1996 1997 1998 1999 2000
Arbovirus infection NEC 1.1 0.4 1.0 0.2 0.2 0.1 0.1 0.5 0.3 0.4
Barmah Forest virus infection – – – – 4.2 4.8 3.7 2.8 3.4 3.3
Dengue 0.1 2.2 3.9 0.1 0.2 0.7 0.9 3.1 0.7 1.1
Malaria 4.6 4.2 3.8 4.0 3.4 4.7 4.0 3.5 3.9 5.0
Ross River virus infection – 32.6 29.7 21.4 14.6 42.5 35.6 16.8 23.3 21.9
* All jurisdictions reported for all years with the following exception
Dengue not reported from Australian Capital Territory (1991 to 1992).
Alphavirus Infections
Barmah Forest virus infection
This virus was first isolated from mosquitoestrapped in the Barmah Forest in Victoria in 1974.Outbreaks of Barmah Forest disease have beendescribed since the virus was first shown to causehuman disease in 1988. Barmah Forest virusinfection is characterised by polyarthritis, myalgia,rash, fever, lethargy and malaise and may cause achronic disease in some patients.60 Aedes andCulex mosquitoes are the major mosquito vectors,while marsupials are suspected vertebrate hosts.
In 2000, 634 notifications of Barmah Forest virusinfection were reported, similar to the 638 casesreported in 1999. The highest rates were reportedin the Northern Territory (4.6 cases per 100,000population) and Queensland (9.7 cases per100,000 population). Rates were very low insouthern states; no cases were reported from theAustralian Capital Territory and Tasmania (Map 7).The male to female ratio was 1.4:1. The highestrate of infection (6.6. cases per 100,000population) was in those aged 50–54 years,although the notification rates across the 35–69age range were similar (Figure 40). Peak notifi-cations were in the period January to April andfollowed previously observed seasonal trends(Figure 41).
Table 21. Trends in number of notifications of arboviral infections, Australia, 1991 to 2000*
Disease 1991 1992 1993 1994 1995 1996 1997 1998 1999 2000
Arbovirus infection NEC 196 64 173 31 43 12 19 88 62 69
Barmah Forest virus infection – – – – 762 876 691 529 638 634
Dengue 18 373 681 17 39 123 174 579 132 215
Malaria 787 731 669 706 618 853 749 660 732 951
Ross River virus infection – 5,701 5,254 3,828 2,644 7,783 6,596 3,151 4,416 4,200
* All jurisdictions reported for all years with the following exception
Dengue not reported from Australian Capital Territory (1991 to 1992).

Annual report of the National Notifiable Diseases Surveillance System
171CDI Vol 26, No 2, 2002
Map 7. Notification rates of Barmah Forest virus infection, Australia, 2000, by Statistical Division ofresidence
Figure 40. Notification rates of Barmah Forestvirus infection, Australia, 2000, by age and sex
Figure 41. Trends in notification rates ofBarmah Forest virus infection, Australia, 1995to 2000, by month of onset

Annual report of the National Notifiable Diseases Surveillance System
172 CDI Vol 26, No 2, 2002
Ross River virus
Ross River virus is the most common cause ofarbovirus disease notified in Australia. Whilesporadic cases occur throughout Australia,epidemics occur in temperate regions and intropical north-eastern Australia throughout theyear. Epidemics in temperate regions areassociated with heavy rainfall. Evidence indicatesthat the virus may persist in desiccation-resistanteggs of the Aedes spp mosquito, which wouldexplain the rapid onset of cases after heavy rainand flooding. Marsupials and horses have beenimplicated as hosts for the virus and flying foxesmay be responsible for the wide spread dispersal ofdifferent genetic types of the virus.61
Major outbreaks have been recorded in WesternAustralia (1991/1992 and 1995/1996), Victoriaand South Australia (1993 and 1997), New SouthWales (1996 and 1997) and Queensland (1996).Queensland has had the largest number of casesof Ross River virus infection for the past 3 years(1998 to 2000).
Clinical Ross River virus disease occurs mostcommonly in adults, marked by arthralgia andmyalgia (joint and muscle pain). True arthritisoccurs in over 40 per cent of patients, while about50 per cent of patients have a fever or rash.62
There were 4,200 notifications of Ross River virusinfections in 2000, giving a rate of 21.9 cases per100,000 population, a slight decrease from the23.3 cases per 100,000 population observed in1999. Rates were highest in the Northern Territory(65.5 cases per 100,000 population), WesternAustralia (57.5 cases per 100,000 population) andQueensland (41.4 cases per 100,000 population)(Map 8). The male to female ratio was 1:1. Thehighest notification rate for females (40.6 casesper 100,000 population) was in the 35–39 yearage group. The highest rate for men (38.5 casesper 100,000 population) was in the 40–44 yearage group (Figure 42). Peak reporting was in thefirst and second quarters of the year (Figure 43).
Figure 42. Notification rates of Ross Rivervirus infection, Australia, 2000, by age and sex
Map 8. Notification rates of Ross River virus infection, Australia, 2000, by Statistical Division ofresidence

Annual report of the National Notifiable Diseases Surveillance System
173CDI Vol 26, No 2, 2002
Figure 43. Trends in notification rates of RossRiver virus infection, Australia, 1991 to 2000by month of onset
Flavivirus infections
Dengue fever
Historical trends of dengue in Australia
Dengue fever is an acute febrile illness charac-terised by sudden onset, fever, headache and rash.Dengue haemorrhagic fever is a major compli-cation arising from secondary infection withheterologous serotypes of the dengue virus.63 Thiscomplication has a high fatality rate. Two cases ofdengue haemorrhagic fever have been reported inAustralia, one in 1992 and another in 1997.62 Thereis a concern that introduction of other dengueserotypes into northern Australia could increasethe risk of dengue haemorrhagic fever.
Dengue virus is not endemic in Australia and thespread of dengue in Australia is limited to the rangeof the mosquito vector Aedes aegypti which spansthe Torres Strait Islands and north Queensland.62
An outbreak caused by dengue type 2 of more than900 confirmed cases occurred in Townsville andCharters Towers in 1992 to 1993. In 1996/1997another outbreak of dengue type 2 occurred in theTorres Strait. In 1997/1998 165 cases of denguetype 3 and 12 of dengue type 2 were reported fromCairns.62
Dengue occurrence in 2000
There were 215 notifications of dengue in 2000, arate of 1.1 cases per 100,000 population, anincrease on the 1999 rate of 0.7 cases per100,000 population. The highest rates were foundin the Northern Territory (47.6 cases per 100,000population) and Queensland (2.4 cases per100,000 population). The male to female ratio was1.6:1. The highest notification rates among menwere in the 35–39 and 50–54 year age groups(3.2 cases per 100,000 population). The highestnotification rate for women, at 2.4 cases per100,000 population, was in the 30–34 year agegroup. Notifications of dengue for 2000 peaked inSummer (first and fourth quarters of the year,Figure 44).
Figure 44. Trends in notification rates ofdengue fever, Australia, 1991 to 2000, bymonth of onset
In all jurisdictions except Queensland, denguecases were acquired overseas (n=131). InQueensland, 11 (13%) cases were identified asacquired within Australia, 22 (26%) acquiredoverseas and the source of infection was unknownin the remaining 51 cases.
The Western Pacific Region, which includescountries in East Asia and the Pacific, reported45,603 cases of dengue in 2000. The number ofcases in the region has decreased since 1998,when there was a pandemic of dengue across theregion. In 2000, cases increased on 1999 figuresin only 2 countries — Cambodia and Palau — and inboth countries increases were seen in the numbersof all serotypes (WPR/WHO. Summary of thedengue situation in the Western Pacific Region anupdate:2001. http://www.wpro.who.int/document/DENGUE_SITUATION_IN_WPR_Aug01.doc).

Annual report of the National Notifiable Diseases Surveillance System
174 CDI Vol 26, No 2, 2002
Arbovirus: not elsewhere classified
In 2000, there were 69 notifications of arboviruses‘not elsewhere classified’ reported to the NNDSS,giving a rate of 0.4 cases per 100,000 population.This rate was similar to that in 1999 (0.3 cases per100,000 population). The jurisdiction reporting thelargest number of cases of arbovirus infectionsNEC in 2000 was Victoria, notifying 26 (38%) of the69 cases in that year. The male to female ratio was1.4:1. The highest rate for women (0.8 cases per100,000 population) was in the 50–54 year agegroup and for men the highest rate (1.2 cases per100,000 population) was in the 65–69 year agegroup.
While cases of infection with Murray Valleyencephalitis virus were only separately reported byWestern Australia in 2000, information provided bythe individual jurisdictions indicated there were 16cases in the year (Table 23). Exceptional weather
conditions in 2000 provided ideal conditions formosquito breeding and MVE virus transmission.The activity in Western Australia was unusual asthere was a new southerly extension into the Mid-west region.64
Data from sentinel chicken surveillance (Figure 45)provided an early warning of disease activity in2000. In Western Australia, seroconversions insentinel chickens preceded likely dates of exposurein human cases by 4–18 weeks in all but onecase.65
While not specifically identified in the NNDSS,there were 4 cases of Kunjin virus infectionidentified in 2000. No cases of Japaneseencephalitis were reported in 2000. The last caseof Japanese encephalitis in Australia was reportedin 1998.
Table 23. Confirmed cases of Murray Valley encephalitis virus infection, Australia, 2000
Jurisdiction where diagnosis was made Likely place of disease acquisition Cases (Deaths)
Northern Territory Darwin 1
Alice Springs 3
WA* 2(1)
SA 1
Western Australia Pilbara 2
Mid-west 3
Gascoyne 1
Murchison 1
Total 16
* includes one case acquired in the Kimberley and a second case acquired in Mid-west/Kimberley region.
Figure 45. Seroconversions to Murray Valley encephalitis virus in sentinel chickens, WesternAustralia and Northern Territory, 1999 to 2000

Annual report of the National Notifiable Diseases Surveillance System
175CDI Vol 26, No 2, 2002
Malaria
While Australia has been free of endemic malariasince 1983, sporadic cases are reported amongtravellers returning from malaria endemiccountries. The three requirements for malariatransmission exist in Australia: infected humanscarrying gametocytes in their blood, mosquitovectors and suitable climate. Thus, surveillance ofhuman cases of malaria and the rapid entomo-logical response to prevent infection of localAnopheles mosquitoes are important public healthactivities in northern Australia.66
In 2000, there were 951 cases of malaria reportedto the NNDSS, giving a rate of 5.0 cases per100,000 population. This represented an increasein the notification rate, compared with the 3.9cases per 100,000 population reported in 1999.Among the jurisdictions, the highest rates werereported from the Northern Territory (38.9 casesper 100,000 population), Queensland (11.5 casesper 100,000 population) and the Australian CapitalTerritory (5.7 cases per 100,000 population). Themale to female ratio was 3.7:1, an increase on theratio for 1999 (2.6:1). The peak notification ratesfor men (29.2 cases per 100,000 population) andfor women (4.5 cases per 100,000 population)were in the 20–24 year age group.
Malarial parasites were identified and reported in943 (99%) of the 951 cases reported to theNNDSS. Plasmodium vivax was the most commonisolate (717 cases, 75% of the total), followed by P. falciparum (194 cases, 20%).
Travel to malaria endemic countries wasdocumented in all cases in New South Wales, theNorthern Territory, South Australia, Tasmania,Victoria and Western Australia. The travel datawere also recorded for 96 of 409 notifications inQueensland. The data were not collected in theAustralian Capital Territory. Data on the use of anti-malaria prophylaxis were available from Victoriaand the Northern Territory. In Victoria 50 per cent ofcases had not taken prophylaxis and a majority ofthese were either newly arrived migrants orAustralian residents visiting relatives in theircountry of birth. In the Northern Territory, 53 (70%)had received prophylaxis, 21 (28%) had not, whilethe status of the remaining 2 patients wasunknown.
Malaria in the Australian Defence Forces returningto Australia from duty in East Timor in 2000accounted for 267 cases. While all of the 5,500troops were given prophylaxis with doxycycline, 64developed symptoms of malaria during their 4–5
months in East Timor and a further 212 soldiersdeveloped symptoms on return to Australia. Ofsoldiers developing malaria while in East Timor,two-thirds were infected with P. falciparum, all ofwhich were successfully treated with mefloquineand doxycycline. By contrast all but two of thesoldiers who developed malaria on return toAustralia were infected with P. vivax. When thesesoldiers were treated with primaquine, 44 soldiershad relapses, which suggested that P. vivax in EastTimor was primaquine tolerant.67
Other vectorborne diseasesurveillance
AQIS exotic mosquito interceptions in 2000
In 2000, the Australian Quarantine and InspectionService reported 41 interceptions of mosquitoes onvarious imported goods. Of the 41 interceptions,22 species were considered unknown to Australia,or of limited distribution, including 15 interceptionsof Aedes aegypti, six of Aedes albopictus and oneCulex spathifurca. Thus, in 2000 there remained aconstant threat of importation of exotic mosquitospecies, some of which may be vectors of humandisease.
Zoonoses
Zoonoses are diseases of humans acquired froman animal source. Although there are manyrecognised zoonoses in Australia, only five zoonoticinfections were reported at the national level in2000. These were brucellosis, hydatid infection,leptospirosis, ornithosis and Q fever. All notifiablezoonoses have epidemic potential and are oftenassociated with particular occupations. Zoonoticinfection may present with non-specific clinicalsymptoms and a definitive diagnosis depends onappropriate laboratory investigations. The trend inthe number and rates of zoonoses disease notifi-cations reported to the NNDSS between 1991 and2000 are shown in Tables 24 and 25.
A total of 969 notifiable zoonotic infection caseswere received by the NNDSS in 2000, whichaccounted for 1.1 per cent of all notifications. Thenumber of notifications remained at almost thesame level as in previous years.

Annual report of the National Notifiable Diseases Surveillance System
176 CDI Vol 26, No 2, 2002
Table 24. Trends in notifications of zoonotic disease, Australia, 1991 to 2000*
Disease 1991 1992 1993 1994 1995 1996 1997 1998 1999 2000
Brucellosis 25 32 13 38 24 39 39 45 52 27
Hydatid infection 25 34 25 33 31 28 56 37 26 26
Leptospirosis 163 170 174 122 164 214 114 202 323 243
Ornithosis 136 110 83 87 185 86 35 64 84 100
Q fever 544 561 870 656 456 544 545 560 515 573
* All jurisdictions reported for all years with the following exceptions:
Hydatid infection not reported from New South Wales (1991–2000).
Ornithosis not reported from New South Wales (1991 to 2000) and only reported from Queensland during the period of 1992 to 1996.
Table 25. Trends in notification rates of zoonotic disease, Australia, 1991 to 2000* (rate per100,000 population)
Disease 1991 1992 1993 1994 1995 1996 1997 1998 1999 2000
Brucellosis 0.1 0.2 0.1 0.2 0.1 0.2 0.2 0.2 0.3 0.1
Hydatid infection 0.2 0.3 0.2 0.3 0.3 0.2 0.5 0.3 0.2 0.2
Leptospirosis 0.9 1.0 1.0 0.7 0.9 1.2 0.6 1.1 1.7 1.3
Ornithosis 1.6 1.0 0.7 0.7 1.5 0.7 0.4 0.7 0.9 1.1
Q fever 3.1 3.2 4.9 3.7 2.5 3.0 2.9 3.0 2.7 3.0
* All jurisdictions reported for all years with the following exceptions:
Hydatid infection not reported from New South Wales (1991–2000).
Ornithosis not reported from New South Wales (1991 to 2000) and only reported from Queensland during the period of 1992 to 1996.
All States and Territories reported brucellosis,leptospirosis and Q fever to the NNDSS in 2000. InNew South Wales neither hydatid infection norornithosis were notifiable diseases in 2000 andornithosis was not notifiable in Queensland.Zoonotic diseases are not found in all jurisdictionsin Australia. The Northern Territory has not reportedany cases of brucellosis or Q fever and only a singlecase of hydatid disease between 1991 and 2000,and Tasmania has not reported any cases ofbrucellosis during the same period.
The majority of zoonotic infections were reportedfrom Queensland (558, 58%), followed by NewSouth Wales (184, 19%). Queensland had thehighest notification rate of Q fever (10.9 cases per100,000 population), the Northern Territory hadthe highest notification rate of leptospirosis (4.1cases per 100,000 population) while Victoria hadthe highest notification rate of ornithosis (1.8cases per 100,000 population) (Table 25).

Annual report of the National Notifiable Diseases Surveillance System
177CDI Vol 26, No 2, 2002
Brucellosis
Brucella are small aerobic gram-negative bacilli.Human brucellosis is caused by any of four species:Brucella melitensis (primarily from goats, sheep,and camels), Brucella abortus (from cattle), Brucellasuis (from pigs) and Brucella canis (from dogs). B.melitensis and B. abortus are exotic to Australia andcases of B. melitensis are usually imported intoAustralia from overseas travellers who haveconsumed unpasteurised dairy products. B. suis isrestricted to localised populations of feral pigs inQueensland.
Brucella remains one of the world's major zoonoticpathogens, and is responsible for enormouseconomic losses as well as considerable humanmorbidity in endemic areas, especially indeveloping areas of the Mediterranean Region,Middle East, western Asia and parts of Africa andLatin America. The Brucella organism is transmittedfrom Brucella-infected animals to humans by directcontact with blood, tissues and urine of infectedanimals. Infection is through breaks in the skin orthrough consumption of contaminated animalproducts, such as milk. Airborne transmission fromanimal to humans is also possible. The organismmay also be transmitted from human to human viablood transfusion and bone marrow or organtransplantation, through the placenta, duringbreast-feeding, and during sexual activity.68,69,70 Thedisease usually presents within weeks of exposure,but in some exceptional cases, the incubationperiod may be as long as several years.71 Thepathogen could also be a potential agent ofbiological terrorism, particularly B. melitensis and B. suis. The bacteria are highly infectious by aerosoland could be delivered as a slurry in bombletswhich may survive for 6 weeks in dust and 10weeks in soil or water.72,73,74
There were 27 notifications of brucellosis in 2000,a rate of 0.1 cases per 100,000 population, a decrease from 1999 (52 cases; 0.3 cases per100,000 population). This is the lowest nationalnotification rate on record since 1994.
The majority of notifications (20, 74%) occurredbetween August and December. The age-specificrate was highest in the 40–44 year age group at0.5 cases per 100,000 population. Men were moreoften infected than women with the overall male tofemale ratio being 8:1.
Almost all the cases of brucellosis were reportedfrom Queensland, except for one case which wasreported from New South Wales. The highest rates
of disease were reported in the Central West (24.7cases per 100,000 population) and the South West(15.6 cases per 100,000 population) StatisticalDivisions of Queensland. A previous study hassuggested that there is a high frequency of B. suisinfections in Queensland among men who huntand slaughter feral pigs.75
Hydatid infection
Hydatid infection, caused by the larval stage of thetapeworm Echinococcus granulosus, is generallyfound in rural Australia. Disease typically occurswhere humans become infected by the ingestion ofeggs passed in the faeces of dogs, dingoes orfoxes.76 Wallabies, wombats, feral pigs, sheep andkangaroos are all intermediate hosts that act asreservoirs of the disease. Dogs and foxes, feedingoff the offal or other remains of these animalsbecome infected, and can carry the disease intorural communities, or to the periphery of urbansettlements.77
Symptoms of hydatid disease usually occur only inthe advanced stages of disease, and the infectionmay remain asymptomatic for many years. In thepast, hydatid disease has been shown to be under-reported in Australia.78
In 2000, hydatid infection was notifiable in allStates and Territories in Australia, except NewSouth Wales. Following a successful eliminationprogram in the period 1965 to 1996, Tasmaniawas declared free from hydatid disease in 1996and has remained this status since. A total of 26cases were notified during 2000. This is the samenumber as reported in 1999. The annual notifi-cation rate was 0.2 cases per 100,000 population.The highest number of cases (n=13) was reportedin Victoria, followed by Queensland (n=8) andWestern Australia (n=5). The highest rate of hydatidinfection as reported in the Kimberley region ofWestern Australia (3.3 cases per 100,000population).
Of the 26 hydatid cases notified, 10 were men, 13were women and three were of unknown gender.The male to female ratio was 0.8:1. The highestage-specific rates were in women aged 65–74years (0.9 cases per 100,000 population) and inmen aged 75–79 years (1.4 cases per 100,000population).
Information on the country of birth was obtainedfor 13 of 26 hydatid notifications. There were 6cases among Australian born people (including anIndigenous Australian) and 7 cases amongoverseas born persons (4 cases from Greece; 1 case each from Bosnia, China and England).
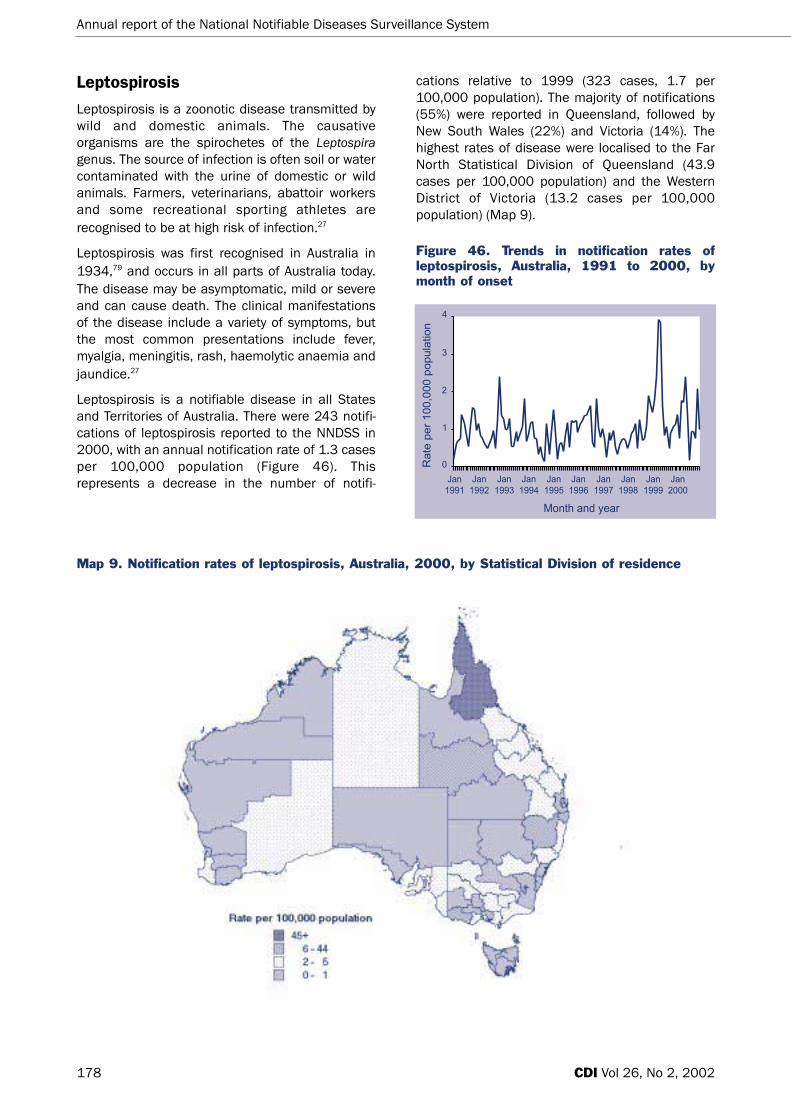
Annual report of the National Notifiable Diseases Surveillance System
178 CDI Vol 26, No 2, 2002
Leptospirosis
Leptospirosis is a zoonotic disease transmitted bywild and domestic animals. The causativeorganisms are the spirochetes of the Leptospiragenus. The source of infection is often soil or watercontaminated with the urine of domestic or wildanimals. Farmers, veterinarians, abattoir workersand some recreational sporting athletes arerecognised to be at high risk of infection.27
Leptospirosis was first recognised in Australia in1934,79 and occurs in all parts of Australia today.The disease may be asymptomatic, mild or severeand can cause death. The clinical manifestationsof the disease include a variety of symptoms, butthe most common presentations include fever,myalgia, meningitis, rash, haemolytic anaemia andjaundice.27
Leptospirosis is a notifiable disease in all Statesand Territories of Australia. There were 243 notifi-cations of leptospirosis reported to the NNDSS in2000, with an annual notification rate of 1.3 casesper 100,000 population (Figure 46). Thisrepresents a decrease in the number of notifi-
cations relative to 1999 (323 cases, 1.7 per100,000 population). The majority of notifications(55%) were reported in Queensland, followed byNew South Wales (22%) and Victoria (14%). Thehighest rates of disease were localised to the FarNorth Statistical Division of Queensland (43.9cases per 100,000 population) and the WesternDistrict of Victoria (13.2 cases per 100,000population) (Map 9).
Figure 46. Trends in notification rates ofleptospirosis, Australia, 1991 to 2000, bymonth of onset
Map 9. Notification rates of leptospirosis, Australia, 2000, by Statistical Division of residence

Annual report of the National Notifiable Diseases Surveillance System
179CDI Vol 26, No 2, 2002
The seasonal trends show two distinct peaks ofleptospirosis in 2000. The first peak of 38 notifi-cations occurred in May and the second peak of 33notifications was in November (Figure 46). Themajority of notifications were male, with a male tofemale ratio of 8.3:1. The highest age-specific ratefor men was in those in the 35–39 year age group(5.2 cases per 100,000 population) (Figure 47).
Figure 47. Notification rates of leptospirosis,Australia, 2000, by age and sex
In early September, the Centers for Disease Controland Prevention (CDC) in United States of Americaalerted the DoHA to an outbreak of leptospirosisamong participants of the Eco Challenge Race thatwas held in Sabah, Malaysia from 20 August to 3September 2000. The event attracted a total of304 athletes from 27 countries, which included 12Australian athletes from New South Wales,Queensland, Tasmania and Victoria. TheSurveillance and Epidemiology Section, DoHA,cooperated with the directors and epidemiologistsof the health authorities in these jurisdictions toconduct the outbreak investigation. All of theathletes (except one who resided in the USA at thetime of the investigation) were contacted byjurisdictional health authorities. Public healthofficers conducted interviews using a structuredquestionnaire collecting information on symptomsand possible exposures. The questionnaire wassent to the CDC via the Surveillance andEpidemiology Section. Blood samples werecollected from some of athletes and sent to theCollaborating Centre for Reference and Researchon Leptospirosis, WHO/FAO Western Pacific Regionin Queensland.
There was no case of leptospirosis identifiedamong the Australian participants in the overallinvestigation. During the international investi-
gation, 158 (52%) the participating athletes werecontacted by the CDC. Of the 158 respondents,109 reported illness, including chills, myalgias,headache, diarrhoea, dark urine and arthralgias;68 (44%) had illness that met the case definition ofleptospirosis of the CDC.80 The age of cases rangedfrom 22 to 50 years (median: 34 years) and 73 percent were male. The median duration of illness was6 days (range: 1–19 days) and 25 (34%) case-patients were hospitalised for the illness.80
An outbreak of leptospirosis was reported in theNorthern Territory in November and December2000.81 Six cases of leptospirosis were notified tothe Northern Territory Department of Health andCommunity Services. Two men and 3 women wereinvolved in hunting during the time they acquiredthe disease. The third male case lived on a ruralblock where there are many animals and reportedregularly going barefoot. In response to theoutbreak a media release was issued by theNorthern Territory health department, to highlightthe risk for contracting this potentially fatalinfection.
Other leptospirosis surveillanceThe Collaborating Centre for Reference and Researchon Leptospirosis, WHO/FAO Western Pacific Regionreport for 2000
This report summarises the leptospirosis notifi-cation data for 2000. The information has beencollated from questionnaires distributed to allhuman cases in Australia and collected by thecollaborating centre. In total, 204 cases ofleptospirosis were investigated in 2000.
There was an elevated number of cases during thefirst 6 months of the year but not at the levelreported in 1999. The increased number of notifi-cations in the early part of the year reflects anincreasing level of awareness of the diseaseamong clinicians and a higher than averagerainfall. The latter resulted in optimal conditions forthe survival of the organism in the environmentand favourable conditions for an increase in rodentpopulations.
Of the 204 cases, 179 reported illness, and themost frequently reported symptoms includedheadache (68.7%), followed by myalgia (60.9%),severe fever (57.0%), sweats (56.4%), chills (53.1%)and arthralgia (49.7%). The hospitalisation rate forleptospirosis remained high (56.3%) in 2000, andthe average hospital stay for the patients was 5days.

Figure 48. Trends in notification rates ofornithosis, Australia, 1991 to 2000, by year ofonset
Q fever
Q fever is the most common zoonotic diseasereported to the NNDSS in Australia. Q fever is arickettsial illness caused by Coxiella burnetii.Livestock, such as sheep, cattle, goats, cats, dogs,some wild animals (bandicoots and many speciesof feral rodents), birds and ticks are naturalreservoirs.83 Risk occupations include stockyardworkers, meat packing and rendering workers,abattoir and dairy workers, and medical andveterinary research facility workers.84 An effectivevaccine is available for Q fever in Australia85 toprotect the populations which are high at risk ofthis disease.
Transmission is usually through airborne dissemi-nation of the organism in dust particles, throughdirect contact with contaminated material,ingestion of contaminated placentas or ingestion ofmilk. Ticks may also be involved in transmission ofthe organism. Cases have occurred in individualswith no direct contact with contaminated animalsand their bodily fluids. These cases, however, haveresided downwind from contaminated areas.27
In 2000, 573 notifications of Q fever were reportedto the NNDSS with an annual notification rate of3.0 cases per 100,000 population, a slightincrease from 2.7 cases per 100,000 populationreported in 1999 (Figure 49). The majority of Qfever cases occurred in Queensland (68.1%),followed by New South Wales (22.7%). High notifi-cation rates were localised to the South West(250.0 cases per 100,000 population) and theCentral West (164.8 cases per 100,000population) of Queensland.
Annual report of the National Notifiable Diseases Surveillance System
180 CDI Vol 26, No 2, 2002
Data on occupation were available for 169 of the204 leptospirosis cases. Animal associatedoccupations (63/169; 37%) and agricultural basedoccupations (61/169; 36%) accounted for themajority of the notifications nationally. The mostfrequently reported animal contacts were cattle(44.4%) and rats (38%). In Queensland however,agricultural related occupations were reportedmore commonly among the 115 leptospirosiscases (45.2%), specifically, banana farmsaccounted for 35.7 per cent of the totalleptospirosis cases in Queensland.
Serovar information was recorded for 203 of 204leptospirosis cases in 2000. Commonly identifiedserovars were L. hardjo (67/203; 33.0%), followedby L. zanoni (44 cases; 21.6%) and L. australis (37cases; 18%).
The full report Leptospirosis: surveillance report for2000 can be found on the Queensland HealthWebsite at: http://www.health.qld.gov.au/qhpss/qhss/lepto_report2000.htm
Ornithosis
Ornithosis, also known as psittacosis, is an acutegeneralised infection with Chlamydia psittaci. Thedisease in humans is commonly associated withexposure to birds, particularly parrots, althoughsome studies showed an association with lawnmowing and gardening in areas with high numbersof native birds.82 Shedding of C. psittaci into theenvironment by sick birds and subsequentinhalation of aerosolised dust and bird excreta mayalso lead to human infection.
In 2000, ornithosis was notifiable in all States andTerritories in Australia, except New South Walesand Queensland. The NNDSS received 100 notifi-cations of ornithosis in 2000, representing thethird consecutive annual increase in the number ofnotifications since 1998 (Figure 48). The nationalnotification rate was 1.1 cases per 100,000population, and the majority (85%) of casesoccurred in Victoria.
All but one case of ornithosis was linked toexposure to birds. The male to female ratio ofdisease was 2.6:1. The highest age-specific rateswere reported in the 60–64 year age group for bothmen (7.0 cases per 100,000 population) andwomen (2.7 cases per 100,000 population).Reported rates of ornithosis are highest in the olderage groups, which may reflect increased investi-gation and laboratory testing for atypicalcommunity acquired pneumonia in this group.82

Annual report of the National Notifiable Diseases Surveillance System
181CDI Vol 26, No 2, 2002
Figure 49. Trends in notification rates of Q fever, Australia, 1991 to 2000, by year ofonset
The majority (92.8%) of the Q fever cases wereadults in the 15–64 age range. The highest age-specific notification rates were in the 40–44 yearage group for men (8.6 cases per 100,000population) and in the 35-44 year age range forwomen (1.9 cases per 100,000 population) (Figure 50). The male to female ratio was 4.8:1.The true prevalence of the disease is likely to beunder-estimated as the disease may beasymptomatic or self-limited.86 Among 1,417Australian abattoir staff tested for Q fever, 394(27.8%) had serological evidence of exposure to Qfever.87
Figure 50. Notification rates of Q fever,Australia, 2000, by age and sex
Other bacterial infections
Legionellosis, leprosy, meningococcal infection andtuberculosis were notifiable in all States andTerritories in 2000 and in the NNDSS are groupedas 'other bacterial infections'. A total of 2,121notifications were classified as other bacterialinfections in 2000, which accounted for 2.3 percent of all notifications. Notifications of otherbacterial infections reported to the NNDSS areshown in Tables 26 and 27.
Legionellosis
Legionellosis is an acute bacterial infection withtwo clinical manifestations: Legionnaires’ diseaseand Pontiac fever. Legionellosis describes a groupof diseases caused by various species of Legionellaas well as the pneumonia of classical Legionnaires'disease caused by Legionella pneumophila.
L. pneumophila occurs in water sources, and cantolerate a wide range of temperatures, pH anddissolved oxygen contents. Depending onfavourable temperatures, sediment accumulationand the presence of commensal microflora, thebacteria can proliferate in cooling towers and watersystems, despite chlorination. Inhalation ofaerosols containing the bacteria is the major modeof transmission. The risk of infection with Legionellais increased by age, chronic lung disease, immuno-suppression and cigarette smoking.88
L. longbeachae has been recognised for some yearsas a frequent cause of Legionella pneumonia inAustralia.89,90 A study found that 26 of 45Australian potting soils were tested positive for L. longbeachae, suggesting this route of exposuremay be important in the epidemiology of sporadiclegionellosis in Australia.91,92
Legionellosis is notifiable in all the States andTerritories in Australia, and includes notifications ofinfections caused by all Legionella species. Therewere 472 notifications of legionellosis in 2000resulting in a notification rate of 2.5 cases per100,000 population which has reached the highestlevel since 1991 (Figure 51). The seasonal trendshowed a peak of 114 notifications in November2000.

Annual report of the National Notifiable Diseases Surveillance System
CDI Vol 26, No 2, 2002182
Figure 51. Trends in notification rates ofLegionellosis, Australia, 1991 to 2000, bymonth of onset
The reporting rates of legionellosis were highest inSouth Australia (5.9 cases per 100,000population) and Victoria (5.2 cases per 100,000population) (Tables 2 and 3). Men accounted for 65per cent of reported cases. Cases occurred inalmost all age groups, with a peak in the 75–79year age group for men (15.1 cases per 100,000population) and the 65–69 year age group forwomen (6.4 cases per 100,000 population) (Figure 52).
Figure 52. Notification rates of Legionellosis,Australia, 2000, by age and sex
Data on the causative species were available for448 (95%) of the legionellosis cases. Of these, 311(69%) cases were identified as L. pneumophilia,followed by L. longbeachae (131 cases, 29%), L. micdadei (4 cases) and L. bozemannii (2 cases).
In 2000, there was a total of 22 deaths as theresult of legionellosis reported by States orTerritories. Victoria reported 12 deaths (11 cases ofL. pneumophila and 1 case of L. micdadei), SouthAustralia reported 5 deaths (3 cases of L. pneumophilia and 2 cases of L. longbeachae),New South Wales reported 3 deaths (2 cases of L. pneumophilia and 1 case of L. longbeachae) andWestern Australia reported 2 deaths (species dataunavailable).
Table 26. Trends in notifications of other bacterial infections, Australia, 1991 to 2000*
Disease 1991 1992 1993 1994 1995 1996 1997 1998 1999 2000
Legionellosis 119 208 170 178 161 208 157 262 249 472
Leprosy 14 20 17 10 10 7 12 3 6 4
Meningococcal infection 347 308 377 385 377 420 494 480 591 621
Tuberculosis 661 904 986 994 1093 978 989 960 1,143 1,024
Table 27. Trends in notification rates of other bacterial infections, Australia, 1991 to 2000 (rate per100,000 population)*
Disease 1991 1992 1993 1994 1995 1996 1997 1998 1999 2000
Legionellosis 0.7 1.2 1.0 1.0 0.9 1.1 0.8 1.4 1.3 2.5
Leprosy 0.1 0.1 0.1 0.1 0.1 < 0.1 0.1 < 0.1 < 0.1 < 0.1
Meningococcal infection 2.0 1.8 2.1 2.2 2.1 2.3 2.7 2.6 3.1 3.2
Tuberculosis 3.8 5.2 5.6 5.6 6.0 5.3 5.3 5.1 6.0 5.3
* All jurisdictions reputed for all years
* All jurisdictions reputed for all years

Annual report of the National Notifiable Diseases Surveillance System
183CDI Vol 26, No 2, 2002
Six outbreaks of legionellosis were identified in2000 and all occurred in Victoria.93,94,95 Australia’slargest outbreak of legionellosis to date occurred inMelbourne in April 2000, with a total of 125confirmed cases (J. Greig, Victoria Department ofHuman Services, personal communication). Theoutbreak was linked to the newly openedMelbourne Aquarium. Of the 125 cases, 110occurred in visitors to the aquarium between 11 and 27 April, and the remainder were in peoplewho were within 500m of the building. During thistime period 83,500 people visited the touristattraction, giving a crude attack rate of 0.13 per cent.
The median age of cases was 64 years, and 57 percent were male. Of the cases, 76 per cent werehospitalised for an average of 12.8 days, and 17per cent of cases required admission to intensivecare at some time during their hospital stay. Theoverall case fatality rate was 3.2 per cent, including2 aquarium visitors and 2 people who were in thevicinity during the risk period. Most cases (83%)were diagnosed by urinary antigen test for L. pneumophila serogroup 1. Use of the urinaryantigen test for early diagnosis of cases and rapidpublic health action probably contributed torelatively low morbidity and case fatality rates.
Of the remaining 5 outbreaks identified in Australiain 2000, four were in metropolitan Melbourne andone was in rural Victoria. A total of 28 cases wereinvolved in these 5 outbreaks.95
Leprosy
Leprosy is a chronic infection of skin and peripheralnerves with the bacterium Mycobacterium leprae.Leprosy is a rare disease in Australia, with themajority of cases occurring among migrants toAustralia from leprosy-endemic countries.
There were 4 cases of leprosy notified nationally in2000 compared with six in 1999. Two of the casesin 2000 occurred in New South Wales with oneeach in Queensland and South Australia. Of the 4cases, one was male and three were female andthe age range was 20–59 years. Information oncountry of birth was available for 3 cases, one wasborn in India, one in the Philippines and another inViet Nam.
Invasive meningococcal disease
Neisseria meningitidis is the one cause of bacterialmeningitis. Worldwide, invasive meningococcaldisease accounts for at least 500,000 cases and
50,000 deaths per annum. Many of these occur inthe sub-Saharan Africa 'meningitis belt'. Serogroup Ais mainly associated with the pandemic ofmeningococcal disease in Africa.96,97 Serogroups Band C are the major cause of both sporadic andepidemic meningococcal disease in industrialisedcountries, including Australia, while serogroups Yand W-135 are uncommon. New Zealand hasexperienced an on-going epidemic of meningo-coccal disease associated with serogroup B since1991 which peaked at 16.9 cases per 100,000population in 1997. The average rate for the period1996 to 2000 was 13.9 cases per 100,000population.98
Four distinct clinical situations are associated withmeningococcal infection; asymptomatic nasopha-ryngeal colonisation, benign bacteremia,meningitis and meningococcemia. The organism iscarried in the nose of up to 5–10 per cent of thepopulation. A small minority of those colonised willprogress to invasive disease. Meningococcalmeningitis is the most common pathologic presen-tation, especially during epidemics. Meningococcalsepticaemia is the most severe form of infectionand has a high fatality rate.99
In Australia, there were 621 notifications ofinvasive meningococcal disease nationally in2000. The annual notification rate of 3.2 cases per100,000 population is the highest rate since 1991(Figure 53). Of the total, 471 (75.8%) cases wereculture-confirmed. Of these, 274 (58.2%) wereserogroup B, 173 (36.7%) were serogroup C, 11(2.3%) were serogroup W-135 and 13 (2.8%) wereserogroup Y. Although serogroup B remains thepredominant serogroup among the notifications,notifications of serogroup C have increasedsteadily during the period (Table 28).
Figure 53. Trends in notification rates ofinvasive meningococcal infection, Australia,1991 to 2000, by month of onset

Annual report of the National Notifiable Diseases Surveillance System
184 CDI Vol 26, No 2, 2002
1995 31 8.1 15 4.0 335 87.9 381
1996 155 36.8 85 20.2 181 43.0 421
1997 96 19.8 57 11.8 331 68.4 484
1998 139 30.7 83 18.3 231 51.0 453
1999 212 37.3 143 25.2 213 37.5 568
2000 274 44.1 173 27.8 174 28.0 621
Table 28. Meningococcal notifications, Australia, 1995 to 2000, by serogroup
Year B C Other or Unknown Total
n % n % n %
In 2000, the pattern of seasonal variation inmeningococcal notifications continued, with thegreatest number of cases occurring in late Winteror early Spring (Figure 53). The distribution of notifi-cations by age shows the highest peak in childrenaged 0–4 years (15.8 cases per 100,000population) and an additional peak in the 15–24year age range (8.7 cases per 100,000 population)(Figure 54). The overall male to female ratio was 1.1:1.
Figure 54. Notification rates of invasivemeningococcal infection, Australia, 2000, byage and sex
Forty-one deaths from meningococcal infectionswere reported in 2000, including 14 deaths in NewSouth Wales, 13 deaths in Victoria, 6 deaths inWestern Australia, 4 deaths in Queensland and 2deaths in both South Australia and Tasmania.There were no major outbreaks of invasivemeningococcal infection reported, and only threepairs of linked cases were identified.
The notification rate for meningococcal diseasehas been slowly, but consistently increasing overthe past 10 years from 1.8 cases per 100,000population in 1992 to 3.2 cases per 100,000population in 2000 (Figure 53). It was suggestedthat the increase of meningococcal disease inAustralia has been primarily due to the expansion ofvirulent phenotypes of serogroups B and C.100,101,102,103
In addition, the case definition has been changedin some jurisdictions to include suspected casesand expanded laboratory diagnosis methods.104
Despite rising public awareness and improvementsin personal and environmental health measures,meningococcal disease remains the major life-threatening infection for children and adolescentsin Australia.
Laboratory based meningococcal surveillance
The Australian Meningococcal SurveillanceProgramme annual report for 2000105 summarisedthe phenotype and antibiotic susceptibility ofNeisseria meningitidis from invasive cases ofmeningococcal disease. In 2000, a total of 388isolates were examined by the National NeisseriaNetwork laboratories, the highest number ofisolates since the inception of the program in1994.
Of the 388 isolates typed, serogroup B still predom-inated nationally (217 type B; 56% of total) and inall the jurisdictions, except Victoria. This wasfollowed by serogroup C (143 isolates; 37% oftotal), serogroup Y (13 isolates; 3.2%) andserogroup W-135 (9 isolates; 2.3%). Serogroup Cwas the major serogroup in Victoria (58 isolates,53.7% of total). Nationally the proportion ofserogroup B of all strains was lower than in theprevious 3 years. Phenotypes C:2a:P1.4(7),

Annual report of the National Notifiable Diseases Surveillance System
185CDI Vol 26, No 2, 2002
C:2a:P1.2 and C:2a:P1.5 were first isolated inAustralia in 1999. Phenotypes C:2a:P1.4(7) andC:2a:P1.2 were still commonly isolated in Victoriain 2000, but were occasionally encountered inother jurisdictions. Phenotype C:2a:P1.5 remainedcommon in New South Wales. About two-thirds ofall isolates showed decreased susceptibility to thepenicillin group of antibiotics (MIC 0.06 to 0.5 mg/L).All isolates tested were susceptible to thirdgeneration cephalosporins and to the prophylacticagents rifampicin and ciprofloxacin.
In 2000, the number of non-culture diagnoses ofinvasive meningococcal disease increased to 147cases from 92 cases in 1999. Of the 147 cases, 91tested positive by PCR, 49 were positive by serologyonly and 7 tested positive by both PCR andserology.
Data on outcome (whether the patient survived ordied) were available for 278 patients (71%). Of the278, 25 (9%) patients died as a result of theirinfection. There were 13 deaths among cases withserogroup C infection, 9 deaths of serogroup Binfection, 2 deaths of serogroup Y and 1 death ofserogroup W-135.
Tuberculosis
There are three national surveillance systems fortuberculosis. The NNDSS provides the timeliestinformation on national TB notifications. TheNational Mycobacterial Surveillance System(NMSS), a surveillance system dedicated totuberculosis and atypical mycobacterial infections,provides more detailed information on risk factors,diagnostic methods, drug therapy and relapsestatus.106 The Australian Mycobacterial ReferenceLaboratory Network maintains national data ondrug susceptibility profiles, site of disease, age, sexand laboratory method of diagnosis for allmycobacterial isolates. These data are publishedannually in conjunction with the NMSS surveillancereport.107
In 2000, 1,024 TB notifications were received bythe NNDSS, giving a reporting rate of 5.3 cases per100,000 population. The highest rate was reportedin the Northern Territory (22.0 cases per 100,000population), followed by New South Wales (6.8cases per 100,000 population) and Victoria (6.0cases per 100,000 population).
There was little difference in notifications betweenthe genders, with a male to female ratio of 1.1:1.While cases have occurred in all age groups, mostcases occurred in the 20–24 year age group and
older. The highest age-specific rates were in men inthe 80–84 year age group (19.5 cases per100,000 population) and in women in the 25–29year age group (8.7 cases per 100,000population).
Other communicabledisease surveillance
Laboratory Virology and SerologyReporting Scheme
The Laboratory Virology and Serology ReportingScheme is a passive surveillance scheme based onvoluntary reports of infectious agents managed bythe Commonwealth Department of Health andAgeing. LabVISE receives data from virology andserology laboratories around Australia. In 2000,reports from the scheme were analysed andpublished monthly in Communicable DiseasesIntelligence.
LabVISE provides information on a number ofviruses and other infectious agents (bacteria,parasites and fungi), and the demographic charac-teristics of persons they infect. The scheme recordsinformation on some infectious agents that are notreported by other surveillance systems. Thedatabase currently holds over 500,000 recordscollected since 1982.
LabVISE data interpretation is limited byuncertainties about the representativeness of thedata, the lack of denominator data to calculaterates and variable reporting coverage over time. Inaddition, there are no consistent case definitionscurrently in use. For example, in 2000, there were18 reports of Murray Valley encephalitis virusidentification from Western Australia in LabVISEcompared with 9 cases reported to the WesternAustralian health department. The LabVISE reportsprobably include positive screening test resultsfrom people without clinical disease, which falselyinflates the prevalence of clinical MVE disease.
In 2000, 14 laboratories contributed 23,655reports to LabVISE. This was a decrease of 10.6 percent compared with the number of reports in 1999(26,452). Although there were no contributinglaboratories in either the Northern Territory or theAustralian Capital Territory, samples from thesejurisdictions were included in the reports fromreference laboratories (Table 29).

Annual report of the National Notifiable Diseases Surveillance System
186 CDI Vol 26, No 2, 2002
The breakdown of LabVISE reports in 2000 isshown in Table 29. Of the 23,663 reports received,17,337 (73%) were of viral infections and 6,326(27%) were bacterial, spirochaetes, fungal,protozoan or helminthic infections. Ortho/paramyx-oviruses (including influenza A and B, parain-fluenza and respiratory syncytial virus) represented
the most commonly reported group of viralinfections, accounting for 32 per cent of viralreports. Reports of herpesviruses (including herpestype 6, cytomegalovirus, varicella-zoster andEpstein Barr virus) accounted for 27 per cent ofviral reports (Figure 55). Chlamydia accounted formore than half (52%) of all reports of non-viralinfections.
Table 29. Infectious agents reported to LabVISE, Australia, 2000
Organism ACT NSW NT Qld SA Tas Vic WA Aust
Total 397 3,689 776 3,730 4,964 179 3,526 6,402 23,663
Measles virus 3 4 0 0 8 0 19 10 44
Mumps virus 0 0 2 0 4 0 5 38 49
Rubella virus 1 6 3 16 7 0 10 8 51
Hepatitis A virus 2 4 11 28 29 0 3 69 146
Hepatitis D virus 0 1 0 3 0 0 4 1 9
Hepatitis E virus 0 0 1 0 0 2 0 1 4
Ross River virus 1 29 80 322 261 4 28 543 1,268
Barmah Forest virus 0 5 11 120 5 0 1 27 169
Dengue 1 4 62 1 0 1 0 112 181
Murray Valley encephalitis virus 0 0 2 0 0 0 0 18 20
Kunjin virus 0 0 1 0 0 0 0 3 4
Flavivirus (unspecified) 0 0 4 23 0 2 11 0 40
Adenovirus 8 162 9 15 378 6 192 435 1,205
Herpes virus 57 366 36 1,246 1,316 37 686 994 4,738
Other DNA viruses 9 6 5 78 37 2 79 198 414
Picornavirus family 12 369 10 26 30 7 582 491 1,527
Ortho/paramyxoviruses 89 1,272 12 239 1,234 48 761 1,949 5,604
Other RNA viruses 112 740 2 1 464 17 279 249 1,864
Chlamydia trachomatis 51 453 230 770 520 32 98 1,009 3,163
Chlamydia pneumoniae 30 6 0 0 0 0 0 0 36
Chlamydia psittaci 1 0 0 0 0 6 82 13 102
Mycoplasma species 3 49 13 203 128 4 207 87 694
Coxiella burnetii 1 8 0 34 11 0 24 23 101
Rickettsia species 0 0 1 0 0 6 4 11 22
Streptococcus group A 0 27 56 201 0 0 64 0 348
Yersinia enterocolitica 0 11 0 3 0 0 0 1 15
Brucella species 0 1 0 4 1 0 0 0 6
Bordetella pertussis 13 84 2 88 129 4 342 27 689
Legionella pneumophila 0 0 0 1 10 0 26 7 44
Legionella longbeachae 2 1 0 0 23 0 1 32 59
Legionella species 0 1 0 0 0 0 4 0 5
Cryptococcus species 0 6 0 0 11 0 1 0 18
Leptospira species 0 3 1 41 15 0 0 3 63
Treponema pallidum 0 68 222 262 331 0 0 27 910
Protozoa 1 2 0 5 5 0 13 7 33
Echinococcus granulosus 0 1 0 0 7 1 0 9 18

Errata
374 CDI Vol 26, No 3, 2002
ErrataThe following corrections to Communicable Diseases Intelligence Vol 26 No 2 should be noted.
Page 187: Figure 55. Labvise reports, Australia, 2000.The last point in the legend should read ‘Other RNA viruses’ instead of 'Ortho/paramyxoviruses'. The correctfigure is reproduced below.
Figure 55. Labvise reports, Australia, 2000
Page 265. ‘Evaluation of the Australian CJD Surveillance System’ by Monica Robotin.Under the title heading should read ‘Monica Robotin1,2’ instead of ‘Monica Robotin1’
Page 289: Tables 9 and 10 of the Erratum.The birth cohort date for table 9 should read ‘1 July to 30 September 2000’ and for table 10 it should read‘1 July to 30 September 1999’.
Page 303: Table 4. Virology and serology laboratory reports by State or Territory1 for the reportingperiod 1 January to 31 March 2002, and total reports for the year2.The last four column headings are incorrect. The column headings should read as follows:
‘This period 2002’; ‘This period 2001’; ‘Year to date 2002’ and ‘Year to date 2001’

Annual report of the National Notifiable Diseases Surveillance System
187CDI Vol 26, No 2, 2002
Figure 55. LabVISE reports, Australia, 2000
Parainfluenza viruses are an important cause ofacute respiratory infection in infants and children.In March 2000, there was an outbreak of humanparainfluenza type 1 (HPIV–1) in Australia. This isin keeping with biennial outbreaks of this parain-fluenza strain in Autumn in Australia (Figure 56).Parainfluenza type 2 (HPIV–2) causes smalleroutbreaks in alternate years to type 1, while thereare annual outbreaks of parainfluenza type 3(HPIV–3) annually in the Winter months. Themajority of isolates (157/230, 68%) were fromchildren aged 0–4 years.
Figure 56. Trends in laboratory reports ofhuman parainfluenza virus strains 1, 2 and 3,Australia, 1991 to 2000, by month of report
Echovirus type 30 has caused large outbreaks ofaseptic meningitis in many regions of the world inthe past 40 years. LabVISE received 121 reports ofechovirus 30 isolates in 2000. All but three ofthese were from New South Wales and Victoria.This is the first significant reporting of echovirus 30to LabVISE since 1995 (Figure 57). Of the 121cases 51 (42%) were in children under 10 years ofage and 50/89 (56%) with diagnosis informationwere from individuals with a diagnosis ofmeningitis.
Figure 57. Trends in laboratory reports ofEchovirus 30, Australia, 1991 to 2000 bymonth of report
An outbreak of pharyngoconjunctival feveroccurred among school children in NorthQueensland in October 2000. Seven children whohad attended a camp and presented withsymptoms were investigated. Five of these childrenhad positive viral cultures of adenovirus 3. An examination of the absenteeism rates at theschool after the camp, however, suggested that 34children had been infected. Fever, headache andsore throat were the most common symptoms.108
A review of LabVISE reports over the 10 years(1991 to 2000), examining data trends and qualitywill be published in the next issue of CommunicableDiseases Intelligence.
administrator
Note errata on previous page

Annual report of the National Notifiable Diseases Surveillance System
188 CDI Vol 26, No 2, 2002
Rotavirus SurveillanceProgramme 2000/2001109
A national rotavirus surveillance programme wascommenced in June 1999 to undertake thesurveillance and characterisation of rotavirusstrains causing annual epidemics of severediarrhoea in young children throughout Australia.Among 1,108 rotavirus isolates examined betweenJune 2000 and May 2001, serotype G1 was themost common (49.5%) followed by serotypes G9(18.1%), G2 (12.5%) and G4 (9.7%). Two outbreakswere detected, one of serotype G4 in Gove in theNorthern Territory in September 2000 and anotherof serotype G9 in Alice Springs in May 2001.
Reports of the Australian NationalPolio Reference Laboratory110,111
Enterovirus testing of all cases of acute flaccidparalysis is an essential activity in the post-polioeradication era. The WPR, which includes Australia,was officially declared polio-free by the WHO inOctober 2000.
The Australian National Polio Reference Laboratoryis responsible for processing and testing samplesfor poliovirus from all Australian patients with acuteflaccid paralysis and for characterising poliovirusesrecovered from untyped enteroviruses submittedfrom Australian laboratories. Between 1 Januaryand 31 December 2000, 35 specimens from 20patients with acute flaccid paralysis were tested.Poliovirus type 3 Sabin-type was isolated fromsamples from 2 patients while the remainingsamples from the other 18 patients were negative.In both AFP patients with positive culture forpoliovirus, Clostridium botulinum toxin and/or otherbacteria were detected in stool samples. The expertcommittee that reviews all cases did not considerpolio to be the cause of the AFP.
Australian Sentinel PracticeResearch Network
The Research and Health Promotion Unit of theRoyal Australian College of General Practitionersoperates the Australian Sentinel Practice ResearchNetwork (ASPREN). ASPREN is a national networkof general practitioners that report on a number ofconditions each week. The aim of ASPREN is toprovide an indicator of the burden of disease in theprimary care setting and to detect trends in consul-tation rates.
There were approximately 120 general practi-tioners participating in the scheme from all Statesand Territories in 2000. Approximately 75 per centof these are located in metropolitan areas and theremainder are in rural areas. There were onaverage 5,000 consultations each week.
In 2000, 14 conditions were being monitored bythe ASPREN management committee, and five ofthese conditions related to communicablediseases. These were influenza, chickenpox,gastroenteritis, gastroenteritis with stool cultureand ADT immunisations. In total there were392,896 consultations reported to ASPREN ofwhich 9,005 (2.3%) were of communicablediseases related conditions. The majority ofcommunicable diseases reported were gastroen-teritis (4,000 presentations, 44% of the total),followed by influenza (2,481 presentations, 28%),ADT immunisations (2,005 presentations, 22%)and chickenpox (583 presentations, 6%) respec-tively. The weekly reporting of influenza as a rateper 1,000 consultations are shown in Figure 58.Presentations with symptoms of influenza-likeillnesses peaked in the Winter months (week 36).
Figure 58. ASPREN Communicable diseasesurveillance presentations to GPs, 2000

Annual report of the National Notifiable Diseases Surveillance System
189CDI Vol 26, No 2, 2002
National Influenza SurveillanceScheme
Based on Annual report of the National InfluenzaSurveillance Scheme 2000, (CommunicableDiseases Intelligence 2000;25:107).
In 2000, influenza surveillance in Australia wasbased on three systems: laboratory diagnosis byvirus isolation and serology from laboratoriesparticipating in LabVISE, consultation rates forclinically diagnosed influenza illness by sentinelgeneral practitioners; and the absenteeism data ofworkers from a national employer. Sentinel generalpractice schemes were both State-based (in NewSouth Wales, Victoria and the Northern Territory)and national through reporting to the AustralianSentinel Practice Research Network.
In 2000, participating laboratories of the LabVISEscheme reported a total of 1,916 laboratoryisolations of influenza. These included 1,366reports of influenza A and 550 reports of influenzaB. The ratio of influenza A to B was 2.5:1. Totalinfluenza reports showed a low level of activity untilmid-June when there was an increase in reports toapproximately 50 per week, followed by a majorpeak in mid-September, then a decline to baselineby late November. There were few temporaldifferences in the peaks of influenza A comparedwith influenza B activity through the year. The peakof influenza activity in 2000 was significantly laterin the year than in 1999. The pattern in 2000closely resembled that in 1997, when there wasalso a larger proportion of influenza B isolates(influenza A to B ratio of 1.5:1) and a later peak indisease reporting. The overall male to female ratiofor influenza in 2000 was 1.2:1. The age and sexrates were highest among infants and childrenaged less than 5 years, with a second peak amongmen aged 70 years or more and women aged 75years or more.
The Northern Territory Tropical InfluenzaSurveillance scheme data showed two peaks ofinfluenza activity in March and October. TheASPREN data and that of New South Wales andVictorian sentinel schemes all showed a singlepeak in reporting in the week ending 17September. Comparison of the ASPREN andLabVISE reports showed a similar pattern ofactivity, with the peak in laboratory reports oneweek later than that from general practitionersurveillance.
The WHO Collaborating Centre for Reference andResearch on Influenza received a total of 1,116influenza isolates of which 922 (83%) weresuitable for analysis. Of these, 518 (56%) wereinfluenza A (H3N2) subtype, 262 (28%) wereinfluenza B and the remaining 142 (16%) wereinfluenza A (H1N1) subtype.
The influenza A (H1N1) isolates were predomi-nantly (73%) A/New Caledonia/20/99-like viruseswith only 39 isolates characterised asA/Bayern/7/95-like. These two separate lineagesof viruses have co-circulated in Australia for sometime. Although 3 sporadic isolates of the A/NewCaledonia lineage were isolated in 1999, this is thefirst year in which viruses of the lineage have beenisolated in significant numbers in Australia. All butone of the 39 A/Bayern/7/95-like isolates camefrom an outbreak in South Australia.
The majority of the influenza A(H3N2) isolates(94%) were most closely related to the referencestrain A/Moscow/10/99 and vaccine strainA/Panama/2007/99 and were distinguishablefrom the previous prototype and vaccine strainA/Sydney/5/97. Nevertheless, serological studiesdemonstrated that vaccines containing anA/Sydney/5/97-like strain used in the Australian2000 Winter produced similar antibody responsesto the Australian 2000 A (H3N2) isolates asvaccines containing an A/Moscow/10/99-likestrain used in the 2000/2001 NorthernHemisphere Winter. Thus while some antigenicheterogeneity was observed in the influenza A(H3N2) isolates there was no evidence ofsignificant antigenic drift beyond theA/Moscow/10/99 reference strain.
Influenza B strains isolated during the 2000season showed a progressive drift away from theB/Beijing/184/93 strain. The majority (64%) weremost closely related antigenitically to the newreference strain B/Sichuan/379/99.
In 1999/2000, there were a total of 2,591admissions to Australian hospitals forinfluenza/pneumonia (Source: National HospitalMorbidity Database, 1990–2000: AIHW). Influenzavirus was identified in 673 of these were cases.Altogether, influenza was responsible for 4,583hospital patient days in 1999/2000.

Annual report of the National Notifiable Diseases Surveillance System
190 CDI Vol 26, No 2, 2002
Antibiotic resistance in Australia
The major event in the control of antibioticresistance in Australia in 2000 was the publicationof the Commonwealth Government response to thereport of the Joint Expert Technical AdvisoryCommittee on Antibiotic Resistance, August 2000(the Government Response), which was endorsedby the then Minister for Health and Aged Care andthe Minister for Agriculture, Fisheries andForestries - Australia.
In October 1999, the JETACAR made 22recommendations to the CommonwealthGovernment for an antibiotic resistancemanagement program covering regulatory controls;monitoring and surveillance; infection preventionstrategies; education; research; and communi-cation. The Government Response acknowledgesthe threat from antibiotic resistant organisms tothe health and economic prosperity of theAustralian population, and supports thedevelopment of a national antibiotic resistancemanagement program. The Government Responsewas to establish the Expert Advisory Group onAntimicrobial Resistance (EAGAR), to providecontinuing advice on antibiotic resistance andrelated matters; and the CommonwealthInterdepartmental JETACAR Implementation Group(CIJIG) to oversee and coordinate the continuinggovernment response to the JETACAR, to respondto the policy advice received from EAGAR; and toseek funding for implementation purposes.
CIJIG met for the first time in November 2000.CIJIG and EAGAR work collaboratively to furtherdevelop and implement the Government Responsein consultation with stakeholders, including theStates and Territories and industry, to ensureappropriate implementation. To assist formalconsultation with the States and Territories and tomonitor implementation, the Australian HealthMinister’s Conference (AHMC) appointed the AHMCJETACAR Taskforce in August 2000. To fill a similarrole on the animal side and to aid consultation withindustry, discussions are under way with theDepartment of Agriculture, Fisheries and Forestries— Australia to reactivate the Standing Committeeon Agriculture and Resource ManagementJETACAR Taskforce.
As part of the implementation of the JETACARrecommendation DoHA commissioned a study ofthe current surveillance activities for healthcareassociated infections. The National Surveillance ofHealthcare Associated Infection in Australia studywill provide vital information for future national
planning for healthcare associated infectionsurveillance and inform public health action toalleviate the problem of antibiotic resistance. Thereport was made available for public consultationin early 2001 and was provided to the AustralianCouncil for Safety and Quality in Healthcare forconsideration and action.
Creutzfeldt-Jakob disease inAustralia 2000
(Based on the report from the Australian CJDRegistry, The University of Melbourne — update toJanuary 2000)
The Australian Creutzfeldt-Jakob disease (CJD)Registry was established in October 1993 inresponse to the recognition of four probable humanpituitary hormone related CJD deaths. The Registryis funded by the Commonwealth Department ofHealth and Ageing and is based in the Departmentof Pathology at the University of Melbourne. Aninquiry into the use of human pituitary hormonesunder the Australian Human Pituitary HormoneProgram suggested the expansion of someactivities of the Registry.112 These have beenadopted, including retrospective caseascertainment from 1 January 1970. However, inparallel with monitoring possible iatrogenic casesof CJD, the Registry monitors all cases oftransmissible spongiform encephalopathies, bothsporadic and familial, within Australia. There is nosystematic neuropathological or prion proteingenetic assessment, but in line with non-domesticprograms, evaluation of this type is now attemptedin all prospective cases.
As of July 2001, Australia remains free of animalforms of prion disease, such as bovine spongiformencephalopathy and scrapie, and has no confirmedcases of variant CJD. As of the middle of 2001,there were 454 cases on the Registry, whichincluded 237 definite cases, 168 probable casesand 49 incomplete cases (cases positive in animmunoassay but not finally classified).
In Australia, there has been a doubling of theaverage incidence of spongiform encephalopathiesto one case per million since the mid-1980s. Thismainly reflects case ascertainment bias due toimproved recognition, confirmation and reporting.The composition of cases on the Registry is 90.4per cent sporadic, 7.4 per cent familial and 2.2 percent iatrogenic.

Annual report of the National Notifiable Diseases Surveillance System
191CDI Vol 26, No 2, 2002
AppendicesAll definitions from Surveillance Case Definitions, National Health and Medical Research Council, March1994, except those marked * which are draft summary definitions from the Communicable Diseases NetworkAustralia (January 2001). Some Australian States and Territories have their own case definitions for somediseases, which may vary from those shown here.
Appendix 1a. Case definitions and mapping to ICD–10 code for notifiable diseases reported toNNDSS in 2000, bloodborne diseases
Disease Case definition (NHMRC 1994) ICD–10 code(s)
Hepatitis B (incident) Demonstration of documented seroconversion to hepatitis B B16
Hepatitis B (unspecified) HBsAg positive B18.0, B18.1AND either: anti-HBcIgM positiveor demonstration of a clinical illness consistent with acute viral hepatitis (jaundice, elevated aminotransferases)
Hepatitis C (incident) Demonstration of documented seroconversion to hepatitis C B17.1
Hepatitis C (unspecified) Demonstration of anti-hepatitis C positive or hepatitis C PCR positive B18.2AND a clinical illness consistent with acute viral hepatitis AND is not an acute case of hepatitis A, B, or D
Hepatitis D* Positive for anti-hepatitis D virus (HDV) or HDV Ag or seroconversion B17.0, B16.1,or rise in IgG in serum or liver AND HBsAg OR anti-HBc negative B18.0
Hepatitis (NEC) Any other viral hepatitis not classified here B17.8

Annual report of the National Notifiable Diseases Surveillance System
192 CDI Vol 26, No 2, 2002
Appendix 1b. Case definitions and mapping to ICD–10 code for notifiable diseases reported toNNDSS in 2000, gastrointestinal diseases
Disease Case definition (NHMRC 1994) ICD–10 code(s)
Botulism A clinically compatible illness (diplopia, blurred vision, muscle AO5.1weakness, paralysis or bulbar palsy) with a history of exposure to a probable food source in the absence of a contaminated wound ANDone of the following: isolation of Clostridium botulinum from faeces or other clinical specimens, or detection of C. botulinum toxin in serum, faeces or probable food source, or epidemiological linkage to other cases of confirmed foodborne botulism
Campylobacteriosis Isolation of Campylobacter species from a clinical specimen AO4.5
Haemolytic uraemic Acute microangiopathic anaemia on peripheral blood smear D59.3syndrome AND
acute renal impairment AND/ORthrombocytopaenia
Hepatitis A Anti-HAV IgM positive in the absence of recent vaccination B15ORdemonstration of a clinical case of hepatitis (jaundice and/or elevated aminotransferase levels) without a non-infectious cause
Hepatitis E* A person who demonstrates anti-HEV IgM in sera collected less than B17.24 weeks after onset of acute hepatitisORIgG seroconversion in paired sera ORHEV identified by nucleic acid test ORHEV identified by electron microscopy on stool ORa hepatitis-like illness in the absence of other causes of hepatitis and detection of antibodies to HEV
Listeriosis Isolation of Listeria monocytogenes from a site which is normally A32sterile, including foetal gastrointestinal contents
Salmonellosis Isolation of Salmonella species (excluding S. Typhi ) from any AO2clinical specimen
Shigellosis Isolation of Shigella species from any clinical specimen AO3
SLTEC, VTEC* A person with bloody diarrhoea or HUS from whom in a clinical A4.1, A4.4specimen: Shiga-toxin producing E. coli are isolated ORisolation of Shiga toxin from an E. coli isolate ORidentification of the gene associated with the production of Shiga toxin in E. coli
Typhoid Isolation of Salmonella Typhi or S. Paratyphi serotype A, B, or C AO1.1from any clinical specimen
Yersiniosis Isolation of Yersinia enterocolitica or Y. pseudotuberculosis from AO4.6blood or faeces ORdetection of circulating antigen by ELISA or agglutination test ORpositive Yersinia serology in the presence of clinical compatible illness

Annual report of the National Notifiable Diseases Surveillance System
193CDI Vol 26, No 2, 2002
Appendix 1c. Case definitions and mapping to ICD–10 code for notifiable diseases reported toNNDSS in 2000, quarantinable diseases
Disease Case definition (NHMRC 1994) ICD–10 code(s)
Cholera An illness characterised by diarrhoea and/or vomiting AO0AND isolation of toxigenic Vibrio cholerae serogroup O1 or O139 from a clinical sample
Plague A fourfold or greater change in serum antibody titre for Yersinia pestis A20OR isolation of Yersinia pestis from a clinical specimen
Rabies Clinically compatible neurological illness A82AND either detection of viral antigens in tissue or isolation of rabies virus from saliva, skin snips, CSF or neural tissue
Viral haemorrhagic fever Sudden or insidious onset of fever, nausea, vomiting, diarrhoea, A96, A98, A99multifocal haemorrhages and shock. An appropriate travel history to an endemic country is supportive of diagnosis AND one of the following: demonstration of specific IgM antibody by ELISA, IFA or Western blot or isolation of the virus in cell culture or demonstration of viral antigen in a tissue specimen to Ebola virus, Lassa fever virus, Marburg virus or Crimean Congo virus.
Yellow fever A clinically compatible illness A95AND demonstration of yellow fever virus, antigen or genome in any clinical specimen OR a fourfold or greater change in serum antibody titre to yellow fever virus,OR a single elevated yellow fever specific IgM antibody titre, where cross-reaction with other flaviviruses has been ruled out and the patient has not received yellow fever vaccine during the previous 2 months

Annual report of the National Notifiable Diseases Surveillance System
194 CDI Vol 26, No 2, 2002
Appendix 1d. Case definitions and mapping to ICD–10 code for notifiable diseases reported toNNDSS in 2000, sexually transmissible infections
Disease Case definition (NHMRC 1994) ICD–10 code(s)
Chancroid Isolation of Haemophilus ducreyi from a clinical specimen A57ORa clinically compatible illness characterised by painful genital ulcerationand inflammatory inguinal adenopathy, where syphilis, granuloma inguinale and herpes simplex have been excluded ORa clinically compatible illness in a patient who is epidemiologically linked to a laboratory confirmed case
Chlamydial infection Isolation of Chlamydia trachomatis from a clinical (genital) specimen A56ORdemonstration of Chlamydia trachomatis in a clinical (genital) specimen by antigen detection methods
Donovanosis Demonstration of intracytoplasmic Donovan bodies on Wright or A58Giemsa stained smears or biopsies of clinical specimens ORa clinically compatible illness characterised by usually painless, beefy red, granulomatous or ulcerative lesions with rolled edges and a tendency to form scar tissue, where syphilis has been excluded
Gonococcal infection Isolation of Neisseria gonorrhoeae from a clinical specimen A54
Lymphogranuloma Isolation of Chlamydia trachomatis serotype L1, L2 or L3 A55venereum from a clinical specimen
ORdemonstration (by immunofluorescence) of inclusion bodies in leucocytes aspirated from an inguinal lymph node (bubo) ORa positive serological test for lymphogranuloma venereum strain of Chlamydia trachomatis in the presence of a clinically compatible illness (one or more tender, fluctuant inguinal lymph nodes or characteristic proctogenital lesions)
Syphilis A compatible clinical illness or past history A50, A51, A52 ANDdemonstration of Treponema pallidum by darkfield, fluorescent antibody or equivalent microscopic methods ORreactive treponemal tests (e.g.: FTA-ABS, TPHA)
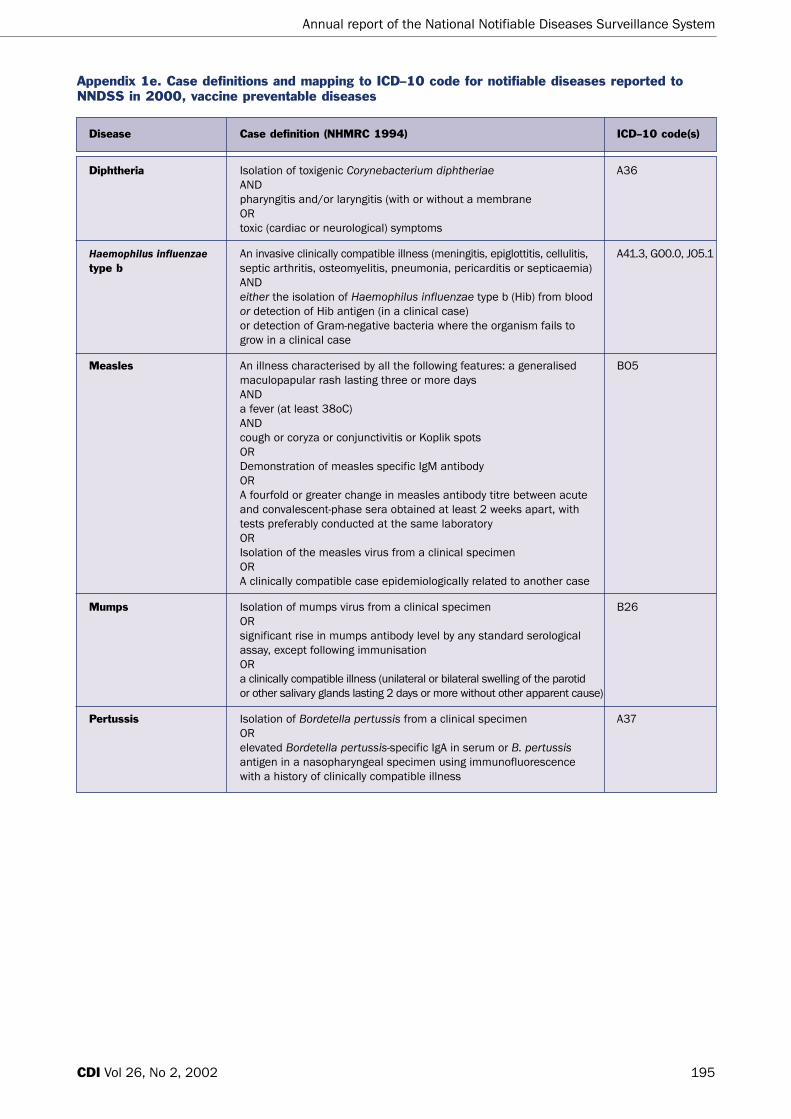
Annual report of the National Notifiable Diseases Surveillance System
195CDI Vol 26, No 2, 2002
Appendix 1e. Case definitions and mapping to ICD–10 code for notifiable diseases reported toNNDSS in 2000, vaccine preventable diseases
Disease Case definition (NHMRC 1994) ICD–10 code(s)
Diphtheria Isolation of toxigenic Corynebacterium diphtheriae A36ANDpharyngitis and/or laryngitis (with or without a membrane ORtoxic (cardiac or neurological) symptoms
Haemophilus influenzae An invasive clinically compatible illness (meningitis, epiglottitis, cellulitis, A41.3, GO0.0, JO5.1type b septic arthritis, osteomyelitis, pneumonia, pericarditis or septicaemia)
ANDeither the isolation of Haemophilus influenzae type b (Hib) from blood or detection of Hib antigen (in a clinical case) or detection of Gram-negative bacteria where the organism fails to grow in a clinical case
Measles An illness characterised by all the following features: a generalised BO5maculopapular rash lasting three or more days ANDa fever (at least 38oC) ANDcough or coryza or conjunctivitis or Koplik spots ORDemonstration of measles specific IgM antibody ORA fourfold or greater change in measles antibody titre between acute and convalescent-phase sera obtained at least 2 weeks apart, with tests preferably conducted at the same laboratory ORIsolation of the measles virus from a clinical specimen ORA clinically compatible case epidemiologically related to another case
Mumps Isolation of mumps virus from a clinical specimen B26ORsignificant rise in mumps antibody level by any standard serological assay, except following immunisation ORa clinically compatible illness (unilateral or bilateral swelling of the parotid or other salivary glands lasting 2 days or more without other apparent cause)
Pertussis Isolation of Bordetella pertussis from a clinical specimen A37ORelevated Bordetella pertussis-specific IgA in serum or B. pertussisantigen in a nasopharyngeal specimen using immunofluorescence with a history of clinically compatible illness

Annual report of the National Notifiable Diseases Surveillance System
196 CDI Vol 26, No 2, 2002
Appendix 1e. Case definitions and mapping to ICD–10 code for notifiable diseases reported toNNDSS in 2000, vaccine preventable diseases continued
Disease Case definition (NHMRC 1994) ICD–10 code(s)
Poliomyelitis Acute onset of a flaccid paralysis of one or more limbs with decreased A80or absent tendon reflexes in the affected limbs without other apparent cause, without sensory or cognitive loss
Rubella A generalised maculopapular rash and fever BO6ANDone or more of: arthralgia/arthritis or lymphadenopathy or conjunctivitis ANDan epidemiological link to a confirmed case ORdemonstration of rubella-specific IgM antibody, except following immunisation ORa fourfold or greater change in rubella antibody titre between acute and convalescent-phase sera obtained at least 2 weeks apart
Tetanus A clinically compatible illness without other apparent cause, with A33or without a history of injury and with or without laboratory evidence of the organism or its toxin
Appendix 1f. Case definitions and mapping to ICD–10 code for notifiable diseases reported toNNDSS in 2000, vectorborne diseases
Disease Case definition (NHMRC 1994) ICD–10 code(s)
Arbovirus infection (NEC) Demonstration of a fourfold or greater change in serum antibody titres A92, A93, A94 between acute and convalescent-phase serum specimens obtained at least 2 weeks apart and preferable, conducted at the same laboratory ORdemonstration of specific IgM antibodies in CSF or acute phase serum ORisolation of virus from blood, CSF or tissue specimens
Barmah Forest virus Demonstration of above criteria for Barmah Forest virus A92.8infection
Ross River virus infection Demonstration of criteria above for Arbovirus infection for Ross River virus B33.1
Dengue Demonstration of above criteria for dengue virus (all types) A90
Malaria Demonstration of malaria parasites (Plasmodium species) in a blood film B50, B51, B52, B53

Annual report of the National Notifiable Diseases Surveillance System
197CDI Vol 26, No 2, 2002
Appendix 1g. Case definitions and mapping to ICD–10 code for notifiable diseases reported toNNDSS in 2000, zoonoses
Disease Case definition (NHMRC 1994) ICD–10 code(s)
Brucellosis Isolation of Brucella species from a clinical specimen A23ORa fourfold or greater change in Brucella agglutination titres or complement-fixation titres between acute and convalescent-phase serum samples at least 2 weeks apart with the tests preferably conducted at the same laboratory
Hydatid infection Positive serological test for infection with Echinococcus granulosus in a A28patient with clinical, radiological or sonographic evidence of hydatid disease ORidentification of Echinococcus granulosus in cyst fluid or sputum ORimmunoelectrophoresis demonstrating arc 5 or three or more arcs
Leptospirosis Isolation of Leptospira species from clinical specimens A27ORa fourfold or greater change in Leptospira agglutination titres or complement-fixation titres between acute and convalescent-phase serum samples at least 2 weeks apart with the tests preferably conducted at the same laboratory ORdemonstration of leptospiral antigen in a clinical specimen ORa single raised Leptospira agglutination titre with a clinically compatible illness
Ornithosis (psittacosis)* A clinically compatible illness (fever, headache, myalgia, dry cough, A70pneumonia) ANDa fourfold or greater rise in serum antibody titres to Chlamydia psittacibetween acute and convalescent phase sera ORdetection of C. psittaci by nucleic acid test ORa single high titre of IgG to C psittaci after the onset of a clinically compatible illness and where other diseases are excluded
Q fever A fourfold or greater change in serum (CF) antibody titre to phase II A78antigen of Coxiella burnetiiORa fourfold or greater change in ELISA antibody titre to phase I or II antigens of C. burnetiiORan IgM fluorescent antibody titre of at least 1:160 during convalescent phase of the illness (i.e: 10 days or more after onset)

Annual report of the National Notifiable Diseases Surveillance System
198 CDI Vol 26, No 2, 2002
Appendix 1h. Case definitions and mapping to ICD–10 code for notifiable diseases reported toNNDSS in 2000, other bacterial infections
Disease Case definition (NHMRC 1994) ICD–10 code(s)
Legionellosis A clinically compatible illness (fever, cough or pneumonia) A48.1ANDat least one of the following: isolation of Legionella species from lung tissues, respiratory secretions, pleural fluid, blood or other tissues ORdemonstration of Legionella species antigens in lung tissue, respiratory secretions or pleural fluid ORa fourfold or greater rise in (IFA) titre against Legionella species to at least 128, between acute and convalescent phase sera ORa stable high Legionella titre (at least 512) in convalescent phase serum
Leprosy Enlarged dermal nerves with associated sensory loss A30ORdemonstration of acid-fast bacilli or biopsy specimenORa histological picture compatible with leprosy in a specimen
Meningococcal infection Isolation of Neisseria meningitidis from a normally sterile site A39ORdetection of meningococcal antigen in joints, blood or CSF ORdetection of Gram-negative intracellular diplococci in blood or CSF
Tuberculosis Isolation of Mycobacterium tuberculosis, Mycobacterium bovis, or A15, A16, A17,Mycobacterium africanum from a clinical specimen A18, A19ORdemonstration of acid-fast bacilli in a clinical specimen or in a histopathological lesion, when culture is not available, in a person with signs or symptoms compatible with tuberculosis ORevidence of resolution of disease where treatment with two or more anti-tuberculosis medications have been prescribed and follow-up has been instigated

Annual report of the National Notifiable Diseases Surveillance System
199CDI Vol 26, No 2, 2002
No. missing age 0 12 51 0 107 8 150 12 340
% complete for age 100.0 100.0 98.5 100.0 98.3 99.5 99.3 99.9 99.6
No. missing sex 3 64 13 3 1 6 307 23 420
% complete for sex 99.8 99.7 99.6 100.0 100.0 99.6 98.5 99.8 99.5
No. missing Indigenous 567 16,727 331 18,829 966 1,251 18,669 3,896 61,236status
% complete for Indigenous 56.7 31.2 90.5 9.3 84.8 23.6 9.1 65.8 31.8status
Appendix 2. Completeness of National Notifiable Diseases Surveillance System data received fromStates and Territories, 2000
Field ACT NSW NT Qld SA Tas Vic WA Aust
314,036 6,463,455 195,463 3,566,357 1,497,634 470,376 4,765,856 1,883,860 19,157,037
Appendix 3. Population totals for States and Territories, 2000*
ACT NSW NT Qld SA Tas Vic WA Australia
* Based on Australian Bureau of Statistics mid-year population estimates

Annual report of the National Notifiable Diseases Surveillance System
200 CDI Vol 26, No 2, 2002
References1. Thackway S. Health surveillance during the Sydney
2000 Olympic and paralympic games. NSW PublicHealth Bulletin 2000;11:142–145.
2. Kennett M, Brussen KA, Wood DJ, van der Avoort HG,Ras A, Kelly HA. Australia's last reported case of wildpoliovirus infection. Commun Dis Intell1999;23:77–79.
3. Torzillo PJ, Gratten M. Conjugate pneumococcalvaccines for Aboriginal children in Australia. Med JAust 2000;173:S51–S53.
4. Black S, Shinefield H, Fireman B. Efficacy, safety andimmunogenicity of heptavalent pneumococcalconjugate vaccine in children. Pediatr Infect Dis J2000;19:187–195.
5. Kirk M. OzFoodNet: enhancing surveillance offoodborne disease across Australia. MicrobiologyAustralia 2001;25:28–29.
6. National Health and Medical Research Council.Surveillance case definitions. Canberra: NationalHealth and Medical Research Council: 1994.
7. Ponnuthurai A, Hall R. Annual report of the NationalNotifiable Diseases Surveillance System, 1991.Commun Dis Intell 1992;16:334–346.
8. Hall R. Annual report of the National NotifiableDiseases Surveillance System, 1992. Commun DisIntell 1993;17:502–511.
9. Longbottom H, Evans D, Myint H, Hargreaves J.Annual report of the National Notifiable DiseasesSurveillance System, 1993. Commun Dis Intell1994;18:518–548.
10. Hargreaves J, Longbottom H, Myint H. Annual reportof the National Notifiable Diseases SurveillanceSystem, 1994. Commun Dis Intell 1995;19:542–574.
11. Herceg A, Oliver G, Myint H. Annual report of theNational Notifiable Diseases Surveillance System,1995. Commun Dis Intell 1996;20:440–464.
12. Curran M, Harvey B, Crerar S. Annual report of theNational Notifiable Diseases Surveillance System,1996. Commun Dis Intell 1997;21:281–307.
13. O'Brien E, D'Souza R, Gilroy N. Australia's notifiablediseases status, 1997. Commun Dis Intell1999;23:1–27.
14. Thomson J, Lin M, Halliday L, Preston G, McIntyre P,Gidding H, et al. Australia's notifiable diseases status,1998. Annual report of the National NotifiableDiseases Surveillance System. Commun Dis Intell1999;23:277–305.
15. Roche P, Spencer J, Lin M, Gidding H, Kirk M, Eyeson-Annan M, et al. Australia's notifiable diseases status,1999. Annual report of the National NotifiableDiseases Surveillance System. Commun Dis Intell2001;25:190-245.
16. Spencer J, Dore G, Robotin M, Correll P, Kaldor J.Outcomes from the first two years of the Australianhepatitis C surveillance strategy. Commun Dis Intell2002;26:14–22.
17. Hsu HH, Feinstone SM, Hoofnagle JH. Acute viralhepatitis. In: Mandell GL, Bennett JE, Dolin R,Principles and Practice of Infectious Diseases. 4thedition. New York: Churchill Livingstone,1995:1136–1153.
18. Mead PS, Slutsker L, Dietz V, McCaig LF, Bresee JS,Shapiro C, et al. Food-related illness and death in theUnited States. Emerging Infectious Diseases1999;5:607–625.
19. Wheeler JG, Sethi D, Cowden JM, Wall PG, RodriguesLC, Tompkins DS, et al. Study of infectious intestinaldisease in England: rates in the community,presenting to general practice, and reported tonational surveillance. BMJ 1999;318:1046–1050.
20. Allos BM. Campylobacter jejuni infections: update onemerging issues and trends. Clinical InfectiousDiseases 2001;32:1201–1206.
21. Joint FAO/WHO expert consultation on riskassessment of microbiological hazards in foods. Riskcharacterization of Salmonella spp in eggs and broilerchickens and Listeria monocytogenes in ready to eatfoods. Rome: FAO; May 2001.
22. McCarthy N, Giesecke J. Incidence of Guillain-Barrésyndrome following infection with Campylobacterjejuni. Am J Epidemiol 2001;153:610–614.
23. Anon. Highlights for October 2000. Commun Dis Intell2000;24:349.
24. Anon. Highlights for November 2000. Commun DisIntell 2000;24:391.
25. National Health and Medical Research Council. TheAustralian Immunisation Handbook. 7th ed. Canberra:Australian Government Publishing Services; 2000.
26. Conaty S, Bird P, Bell G, Kraa E, Grohmann G,McAnulty JM. Hepatitis A in New South Wales,Australia, from consumption of oysters: the firstreported outbreak. Epidemiology and Infection2000;124:121–130.
27. Chin J. Control of Communicable Diseases Manual.7th ed. Washington: American Public HealthAssociation; 2000.
28. Bull AL, Crerar SK, Beers MY. Australia's importedfood program — a valuable source of information onmicro-organisms in foods. Commun Dis Intell2002;26:28–32.
29. National Enteric Pathogen Surveillance Schemehuman annual report, 2000. Melbourne: University ofMelbourne; February 2001.
30. Tribe IG, Walker J. An outbreak of SalmonellaTyphimurium phage type 44 linked to a restaurant inSouth Australia. Commun Dis Intell 2000;24:347.
31. Lesjak M, Delpech V, Ferson M, Morgan K,Paraskevopoulos P, McAnulty J. A Salmonella Mgulanicluster in New South Wales. Commun Dis Intell2000;24:305–306.
32. Menzies R. Shigellosis outbreak among inner-Sydneymen. Commun Dis Intell 2000;24:247.

Annual report of the National Notifiable Diseases Surveillance System
201CDI Vol 26, No 2, 2002
33. Cameron S, Walker C, Beers M, Rose N, Anear E.Enterohaemorrhagic Escherichia coli outbreak inSouth Australia associated with consumption ofmettwurst. Commun Dis Intell 1995;19:70–71.
34. Anon. Food policy in the National Centre for DiseaseControl. Commun Dis Intell 2000;24:95.
35. Kirk M. OzFoodNet: enhancing foodborne diseasesurveillance across Australia: quarterly report,January to March 2001. Commun Dis Intell2001;25:103–106.
36. McDonald A, Musto J. Annual surveillance report.HIV/AIDS, viral hepatitis and sexually transmissibleinfections in Australia. Sydney: National Centre in HIVEpidemiology and Clinical Research; 2001.
37. Miller P. Donovanosis control or eradication? Asituational review of donovanosis in Aboriginal andTorres Strait Islander populations in Australia.Canberra: Commonwealth of Australia; 2001.
38. Donovan B. What is the gonococcus telling us?Commun Dis Intell 1998;22:216–217.
39. Donovan B, Bodsworth NJ, Rohrsheim R, McNulty A,Tapsall JW. Increasing gonorrhoea — not only inLondon. Lancet 2000;355:1908.
40. Tapsall J. Annual report of the Australian GonococcalSurveillance Programme, 2000. Commun Dis Intell2001;25:59–63.
41. Tapsall J. Surveillance of antibiotic resistance inNeisseria gonorrhoeae in the WHO Western PacificRegion, 2000. Commun Dis Intell 2001;25:274–277.
42. O'Brien ED, Sam GA, Mead C. Methodology formeasuring Australia's childhood immunisationcoverage. Commun Dis Intell 1998;22:36–37.
43. Hall R. Notifiable disease surveillance, 1917 to 1991.Commun Dis Intell 1993;17:226–236.
44. Baker M, Taylor P, Wilson E, Jones N, Short P. A caseof diphtheria in Auckland – implications for diseasecontrol. New Zealand Public Health Report1998;5:73–76.
45. Vitek CR, Wharton M. Diphtheria in the Former SovietUnion: re-emergence of a pandemic disease.Emerging Infectious Diseases 1998;4:539–550.
46. Peltola H. Worldwide Haemophilus influenzae type bdisease at the beginning of the 21st century: globalanalysis of the disease burden 25 years after the useof the polysaccharide vaccine and a decade after theadvent of conjugates. Clinical Microbiology Reviews2000;13:302–317.
47. World Health Organization. Measles: Progresstowards global control and regional elimination1998–1999. WER 1999;74:429–440.
48. Gay NJ. Eliminating measles — no quick fix. WHOBulletin 2000;78:949.
49. Gilbert GL, Escott RG, Gidding HF. Impact of theAustralian Measles Control Campaign on immunity tomeasles and rubella. Epidemiol Infect2001;127:297–303.
50. de Serres G, Gay NJ, Farrington CP. Epidemiology oftransmissible diseases after elimination. Am JEpidemiol 2000;151:1039–1048.
51. Hanna J, Richards A, Young D, Hills S, Humphreys J.Measles in health care facilities: some salutarylessons. Commun Dis Intell 2000;24:211–212.
52. Andrews R. Measles outbreak among young adults inVictoria. Commun Dis Intell 2001;25:12.
53. Lambert SB, Kelly HA, Andrews RM, Catton MC, LynchPA, Leydon JA, et al. Enhanced measles surveillanceduring the inter-epidemic period in Victoria. Med J Aust2000;172:114–118.
54. Hewlett EL. Bordetella species. In: Mandell GL,Bennett JE, Dolin R, eds. Principles and Practice ofInfectious Diseases. 4th ed. New York: ChurchillLivingstone; 1995:2078–2084.
55. Mooi FR, van Loo IHM, King AJ. Adaptation ofBordetella pertussis to vaccination: a cause for its re-emergence? Emerging Infectious Diseases2001;7:526–528.
56. Senzilet LD, Halperin SA, Spika JS, Alagaratnam M,Morris A, Smith B. Pertussis is a frequent cause ofprolonged cough illness in adults and adolescents.Clinical Infectious Diseases 2001;32:1691–1697.
57. Department of Health and Aged Care. Nationaldocumentation for certification of poliomyelitiseradication in Australia. Canberra: Commonwealth ofAustralia; 2000.
58. WHO. Major milestone reached in global polioeradication: Western Pacific Region is certified polio-free. Commun Dis Intell 2000;24:304.
59. Spencer JD, Azoulas J, Buick TD, Daniels PW, DoggettSL, Hapgood GD, et al. Murray Valley encephalitisvirus surveillance and control initiatives in Australia.Commun Dis Intell 2001;25:33–48.
60. Flexman JP, Smith DW, Mackenzie JS, Fraser JRE,Bass SP, Hueston L, et al. A comparison of thediseases caused by Ross River virus and BarmahForest virus. Med J Aust 1998;169:159–163.
61. Mackenzie JS, Broom AK, Hall RA, Johansen CA,Lindsay MD, Phillips DA, et al. Arboviruses in theAustralian region, 1990 to 1998. Commun Dis Intell1998;22:93–100.
62. Mackenzie JS, Smith DW. Mosquito-borne viruses andepidemic polyarthritis. Med J Aust 1996;164:90–93.
63. McBride WJ, Bielefeldt-Ohmann H. Dengue viralinfections; pathogenesis and epidemiology. MicrobesInfect 2000;2:1041–1050.
64. Cordova SP, Gilles MT, Beers MY. The outbreak thathad to happen: Bordetella pertussis in the North-WestWestern Australia in 1999. Commun Dis Intell2000;24:375-379.
65. Broom A, Sturrock K, van Heuzen B, Lindsay M, SmithD. Seroconversions in sentinel chickens provide anearly warning of Murray Valley encephalitis virusactivity in Western Australia. Arbovirus Research2001;8:43–47.

Annual report of the National Notifiable Diseases Surveillance System
202 CDI Vol 26, No 2, 2002
66. Walker J. Malaria in a changing world: an Australianperspective. Int J for Parasitol 1998;28:947–953.
67. Kitchener SJ, Auliff AM, Rieckmann KH. Malaria in theAustralian Defence Force during and after partici-pation in the International Force in East Timor. Med JAust 2000;173:583–585.
68. Ertem M, Kuecki AE, Aysev D, Unal E, Ikinciogullari A.Brucellosis transmitted by bone marrow transplan-tation. Bone Marrow Transplantation 2000;26:225–226.
69. Bishara J, Robenshtok E, Weinberger M, Yeshurun M,Sagie A, Pitlik S. Infective endocarditis in renalrecipients. Transplant Infectious Diseases 1999;1:138–143.
70. Palanduz A, Palanduz S, Guler K, Guler N. Brucellosisin a mother and her young infant. Int J Infect Dis2000;4:55–56.
71. Paton NI, Tee NW, Vu CK, Teo TP. Visceral abscessesdue to Brucella suis infection in a retired pig farmer.Clinical Infectious Diseases 2001;32:E129–130.
72. Franz DR, Jahrling PB, Friedlander AM, McClain DJ,Hoover DL, Bryne WR, et al. Clinical recognition andmanagement of patients exposed to biologicalwarfare agents. JAMA 1997;278:399–411.
73. Sider F, Takafuji E, Franz D. Medical aspects ofchemical and biological warfare. Washington DC: USDepartment of Health and Human Services, Office ofthe Surgeon General; 1997.
74. Leggiadro RJ. The threat of biological terrorism: apublic health and infection control reality. InfectControl Hosp Epidemiol 2000;21:53–56.
75. Robson JM, Harrison MW, Wood RN, Tilse MH, McKayAB, Brodribb TR. Brucellosis: re-emergence andchanging epidemiology in Queensland. Med J Aust.1993;159:153–158.
76. Campos-Bueno A, Lopez-Abente G, Andres-CercadilloAM. Risk factors for Echinococcus granulosis infection:a case control study. Am Trop Med Hyg2000;62:329–334.
77. Jenkins DJ, Power K. Human hydatidosis in New SouthWales and the Australian Capital Territory,1987–1992. Med J Aust 1996;164:18–21.
78. McCullagh PJ. Hydatid disease: medical problems,veterinary solutions, political obstacles. Med J Aust1996;164:7–8.
79. Emanuel ML, Mackarras IM, Smith DJW. Theepidemiology of leptospirosis in North Queensland:general survey of animal hosts. J Hyg (Camb)1964;62:451–484.
80. Centers for Disease Control and Prevention. Outbreakof acute febrile illness among athletes participating inEco-challenge Sabah 2000. MMWR 2001;52:21–24.
81. Krause V. Special surveillance report – cases ofleptospirosis in hunters in the Top End – don’t gobarefoot. Comm Dis Intell 2000;24:384.
82. Williams J, Tallis G, Dalton C, Ng S, Beaton S, Catton M,et al. Community outbreak of psittacosis in a ruralAustralian town. Lancet 1998;351:1697–1699.
83. Maurin M, Raoult D. Q fever. Clin Microbiol Rev1999;12:518–553.
84. Casolin A. Q fever in New South Wales Department ofAgriculture workers. Journal of Occupational andEnvironmental Medicine 1999;41:273–278.
85. Marmion BP, Ormsbee RA, Kyrkou M, Wright J,Worswick D, Cameron S, et al. Vaccine prophylaxis ofabattoir-associated Q fever. Lancet 1984;2:1411–1414.
86. Gilroy N, Formica N, Beers M, Egan A, Conaty S,Marmion B. Abattoir-associated Q fever: a Q feveroutbreak during a Q fever vaccination program. Aust NZ J Public Health 2001;25:362–367.
87. Hutson B, Deaker RA, Newland J. Vaccination of cattleworkers at risk of Q fever on the north coast of NewSouth Wales. Aust Fam Physician 2000;29:708–709.
88. Yu VL. Legionella pneumophila (Legionnaires'disease). In: Mandell GL, Bennett JE, Dolin R, eds.Principles and Practice of Infectious Diseases. Fourthed. New York: Churchill Livingstone;1995:2087–2097.
89. Steele TW. Legionella in South Australia. Commun DisIntell 1989;13:2–3.
90. Cameron S, Walker C, Roden D. Epidemiologicalcharacteristics of Legionella infection in SouthAustralia: implications for disease control. Aust N Z JMed 1991;21:65–70.
91. Ruehlmann SA, Crawford GR. Panic in the pottingshed. The association between Legionellalongbeachae serogroup 1 and potting soils inAustralia. Med J Aust 1996;164:36–38.
92. Steele TW, Moore CV, Sangster N. Distribution ofLegionella longbeachae serogroup 1 and otherLegionellae in potting soils in Australia. Appl EnvironMicrobiol 1990;56:2984–2988.
93. Kirk M. Disease activity in Victoria. Commun Dis Intell2000;24:72.
94. Anon. Legionnaires' disease outbreak in Victoria.Commun Dis Intell 2000;24:92.
95. DHS. Surveillence of notifiable disease in Victoria2000. Melbourne: Department of Human Services,State Government of Victoria; 2001.
96. World Health Organization. Meningococcal Disease.In: WHO Report on global surveillance of epidemic-prone infectious diseases. Geneva; 2000.
97. World Health Organization. Control of epidemicmeningococcal disease; WHO practical guidelines.2nd ed. Geneva, Switzerland: WHO; 2000.
98. Baker MG, Martin DR, Kieft CE, Lennon D. A 10-yearmeningococcal epidemic in New Zealand: descriptiveepidemiology, 1991–2000. J Paediat Child Health2001;37:S13–19.
99. Herf C, Nichols J, Fruh S, Holloway B, Anderson CU.Meningococcal disease recognition, treatment andprevention. Nurse Practitioner 1998;23:33–36.
100. Roche P, Spencer J, Merianos A. Editorial:Meningococcal disease. Commun Dis Intell2001;25:126–129.

Annual report of the National Notifiable Diseases Surveillance System
203CDI Vol 26, No 2, 2002
107. Lumb R, Bastian I. Tuberculosis in Australia: bacterio-logically confirmed cases and drug resistance, 2000:Report of the Australian Mycobacterium LaboratoryReference Network. Commun Dis Intell 2002;26:226-233.
108. Harley D, Harrower B, Lyon M, Dick A. A primary schooloutbreak of pharyngoconjunctival fever caused byadenovirus type 3. Commun Dis Intell 2001;25:9–12.
109. Masendycz P, Bogdanovic-Sakran N, Kirkwood C,Bishop R, Barnes G. Report of the AustralianRotavirus Surveillance Programme 2000/2001.Commun Dis Intell 2001;25:143–146.
110. Stambos V, Brussen K, Turnbull A, Ibrahim A, KennettM. Report of the Australian National Polio ReferenceLaboratory: 1 January to 30 June 2000. Commun DisIntell 2000;24:300–303.
111. Stambos V, Brussen K, Turnbull A, Thorley B, KennettM. Report of the Australian National Polio ReferenceLaboratory: 1 July to 31 December 2000. Commun DisIntell. 2001;25:54–58.
112. Allars M. Inquiry into the use of pituitary derivedhormones in Australia and Creutzfeldt-Jakob disease.Report — June 1994. Australian GovernmentPublishing Service. Canberra; 1994.
101. Patel MS, Merianos A, Hanna JN. Epidemic meningo-coccal meningitis in central Australia. Med J Aust1993;158:336–40.
102. Ferson M, Young L, Hansen G, Post J, Tapsall J,Schultz T, et al. Unusual cluster of mild invasiveserogroup C meningococcal infection in a universitycollege. Commun Dis Intell 1999;23:261–264.
103. Jelfs J, Jalaludin B, Munro R, Patel M, Kerr M, Daley D,et al. A cluster of meningococcal disease in westernSydney initially associated with a nightclub. EpidemiolInfect 1998;120:263–270.
104. Skull SA, Butler JRG, Robinson P, Carnie J. Shouldprogrammes for community level meningococcalvaccination be considered in Australia? An economicevaluation. Int J. Epidemiol 2001;30:571–578.
105. Tapsall J. Annual report of the AustralianMeningococcal Surveillance Programme, 2000.Commun Dis Intell 2002;26:242-247.
106. Lin M, Spencer J, Roche P, McKinnon M. Tuberculosisnotifications in Australia, 2000. Commun Dis Intell2002;26:214-225.