This report was prepared at the National Centre for Immunisation Research and Surveillance of...
168
VACCINE PREVENTABLE DISEASES AND VACCINATION COVERAGE IN AUSTRALIA, 2003 TO 2005 National Centre for Immunisation Research and Surveillance of Vaccine Preventable Diseases Communicable Diseases Intelligence Volume 31 Supplement June 2007
Transcript of This report was prepared at the National Centre for Immunisation Research and Surveillance of...

VACCINE PREVENTABLE DISEASES AND
VACCINATION COVERAGE IN AUSTRALIA, 2003 TO 2005
National Centre for Immunisation Research and Surveillance of Vaccine Preventable Diseases
Communicable Diseases IntelligenceVolume 31 Supplement June 2007


VACCINE PREVENTABLE DISEASES AND
VACCINATION COVERAGE IN AUSTRALIA
2003 TO 2005This report was prepared at the National Centre for Immunisation Research
and Surveillance of Vaccine Preventable Diseases (NCIRS) by:
Julia Brotherton
Han Wang
Andrea Schaffer
Helen Quinn
Robert Menzies
Brynley Hull
Glenda Lawrence
James Wood
Nicholas Wood
Alexander Rosewell
Anthony Newall
Raina MacIntyre
Kristine Macartney
Heather Gidding
Peter McIntyre
Robert Booy
University of SydneyRoyal Alexandra Hospital for Children
Communicable Diseases IntelligenceAustralian Government Department of Health and Ageing
NCIRS is a collaborating unit of the Australian Institute of Health and Welfare

© Commonwealth of Australia 2007
ISBN: 1-74186-241-8Online ISBN: 1-74186-242-6Publications Number: P3 -1676
This work is copyright. Apart from any use as permitted under the Copyright Act 1968, no part may be reproduced by any process without prior written permission from the Commonwealth. Requests and inquiries concerning reproduction and rights should be addressed to the Commonwealth Copyright Administration, Attorney General’s Department, Robert Garran Offi ces, National Circuit, Barton ACT 2600 or posted at http://www.ag.gov.au/cca
Communicable Diseases Intelligence aims to diseminate information on the epidemiology and control of communicable diseases in Australia. Communicable Diseases Intelligence invites contributions dealing with any aspect of communicable disease epidemiology, surveillance or prevention and control in Australia. Submissions can be in the form of original articles, short reports, surveillance summaries, reviews or correspondence. Instructions for authors can be found in Commun Dis Intell 2007;31:158–161.
Communicable Diseases Intelligence contributes to the work of the Communicable Diseases Network Australia (http://www.health.gov.au/cdna)
EditorKrissa O’Neil
Editorial and Production StaffPaul Roche, Alison Milton
Editorial Advisory BoardJeremy McAnulty (Chair), Scott Cameron, Charles Guest, John Kaldor, Peter McIntyre, Charles Watson
Websitehttp://www.health.gov.au/cdi
Subscriptions and contactsCommunicable Diseases Intelligence is produced every quarter by:Surveillance BranchOffi ce of Health ProtectionAustralian Government Department of Health and AgeingGPO Box 9848, (MDP 6)CANBERRA ACT 2601;Telephone: +61 2 6289 8245Facsimile: +61 2 6289 7100Email: [email protected]
This journal is indexed by Index Medicus, Medline and the Australasian Medical Index
DisclaimerOpinions expressed in Communicable Diseases Intelligence are those of the authors and not necessarily those of the Australian Government Department of Health and Ageing or the Communicable Diseases Network Australia. Data may be subject to revision.
Front cover photography by Michelle Crampton, Hollywood Studios, Rebecca Hundy, and Phil Wright
Printed by Union Offset, Canberra

CDI Vol 31 Supplement 2007 i
Contents
Acknowledgements vii
Executive summary viiiOverv iew v i i i
Comment ix
1. Introduction S1
2. Methods S3Vaccine preventable diseases data S3
Vaccinat ion coverage data S5
Notes on in terpret ing data S5
3. Vaccine preventable diseases S9Diphther ia S9
Haemophi lus in f luenzae type b (Hib) d isease S11
Hepat i t i s A S15
Hepat i t i s B S20
Inf luenza S26
Measles S31
Meningococcal d isease S37
Mumps S44
Per tuss is S49
Pneumococcal d isease S55
Pol iomyel i t i s S62
Q fever S65
Rotavi rus S69
Rubel la S74
Tetanus S79
Var icel la-zoster v i rus in fect ion S82
4. Vaccination coverage S91Chi ldhood Vaccinat ion Schedule 1998 to 2005 S91
Vaccinat ion coverage es t imates f rom the ACIR 1996 to 2005 S92
Trends in vaccinat ion coverage es t imates f rom the ACIR S92
5. Discussion S103Changes in vaccinat ion pract ice S103
Current and comparat ive morbidi ty f rom vaccine preventable diseases S103
Diseases on the Aust ra l ian Standard Vaccinat ion Schedule in 2003–2005 S103
Vaccine preventable diseases not on the Aust ra l ian Standard Vaccinat ion Schedule in 2003–2005 S108
Vaccine preventable disease not i f icat ion rates compared wi th other indust r ia l i sed countr ies S109
Future survei l lance pr ior i t ies S110
Future vaccinat ion pr ior i t ies S110
Continued next page

ii CDI Vol 31 Supplement 2007
Vaccine preventable diseases and vaccination coverage in Australia, 2003 to 2005
Appendix 1. Historical charts of notifications of vaccine preventable diseases S111
Appendix 2. Notifications by state or territory (January 2000–December 2005) S117
Appendix 3. Hospitalisations by state or territory (1 July 2000–30 June 2005) S122
Appendix 4. Changes to the Australian Standard Vaccination Schedule (1992–2005) S127
Appendix 5. Government funding of national immunisation programs in Australia S131
Appendix 6. Notifiable diseases definitions in use prior to 2004 S135
Abbreviations S140
References S142
Contents, continued

CDI Vol 31 Supplement 2007 iii
Vaccine preventable diseases and vaccination coverage in Australia, 2003 to 2005
TablesTable 1. Notifications, hospitalisations and deaths from 11 diseases preventable by vaccination,
Australia, 2000 to 2005 viii
Table 2. Number of deaths from diseases commonly vaccinated against, by decade, Australia, 1926 to 1995 and 1996 to 2004 S1
Table 3. Haemophilus influenzae type b (Hib) notifications, Hib meningitis hospitalisations and deaths, Australia, 2002 to 2005, by age group S13
Table 4. Hepatitis A notifications, hospitalisations and deaths, Australia, 2002 to 2005, by age group S16
Table 5. Acute hepatitis B notifications, hospitalisations and deaths, Australia, 2002 to 2005, by age group S21
Table 6. Hepatic coma in hospitalised cases with principal diagnosis of acute hepatitis B S22
Table 7. Influenza notifications, hospitalisations and deaths, Australia, 2002 to 2005, by age group S27
Table 8. Measles notifications, hospitalisations and deaths, Australia, 2002 to 2005, by age group S32
Table 9. Indicators of severe morbidity for hospitalised cases of measles, Australia, 2002 to 2005, by age group S33
Table 10. Meningococcal notifications, hospitalisations and deaths, Australia, 2002 to 2005, by age group S39
Table 11. Mumps notifications, hospitalisations and deaths, Australia, 2002 to 2005, by age group S45
Table 12. Indicators of severe morbidity and mortality for hospitalised cases of mumps, Australia, 2002 to 2005, by age group S46
Table 13. Pertussis notifications, hospitalisations and deaths, Australia, 2002 to 2005, by age group S50
Table 14. Vaccination status of notified pertussis cases aged six months to nine years, Australia, 2003 to 2005, by age group S53
Table 15. Pneumococcal disease notifications, hospitalisations and deaths, Australia, 2002 to 2005, by age group S57
Table 16. Invasive pneumococcal disease notification rates, Australia, 2005 as a percentage of average annual rates from 2002 to 2004, by serotype grouping S60
Table 17. Q fever notifications, hospitalisations and deaths, Australia, 2002 to 2005, by age group S66
Table 18. Rotavirus hospitalisations and deaths, Australia, 2002 to 2005, by age group S70
Table 19. Rotavirus hospitalisations and deaths, Australia, 2002 to 2005, by age group (under 5 years) S72
Table 20. Rubella notifications, hospitalisations and deaths, Australia, 2002 to 2005, by age group S75
Table 21. Indicators of severe morbidity for hospitalised cases of rubella S76
Table 22. Tetanus notifications, hospitalisations and deaths, Australia, 2002 to 2005, by age group S80
Table 23. Varicella hospitalisations and deaths, Australia, 2002 to 2005, by age group S83
Table 24. Indicators of severe morbidity for hospitalised cases of varicella, Australia, 2002 to 2005, by age group S84
Table 25. Herpes zoster hospitalisations and deaths, Australia, 2002 to 2005, by age group S87
Table 26. Indicators of severe morbidity for hospitalised cases of herpes zoster, Australia, 2002 to 2005, by age group S87
Table 27. Australian Standard Vaccination Schedule 2005 for children S91
Table 28. Average annual morbidity and mortality from vaccine preventable diseases in Australia for 3 years 1999/2000–2001/2002 S104
Table 29. Average annual morbidity and mortality from vaccine preventable diseases in Australia for 3 years 2002/2003–2004/2005 S105
Table 30. Most recent notification rates per 100,000 population for frequently notified vaccine preventable diseases, by country of residence S109
Table 31. Notifications by state or territory and year (January 2000–December 2005) S118
Table 32. Hospitalisations by state or territory and financial year of separation (1 July 2000–30 June 2005) S123
Continued next page

iv CDI Vol 31 Supplement 2007
Vaccine preventable diseases and vaccination coverage in Australia, 2003 to 2005
Table 33. Diphtheria, tetanus and pertussis vaccination practice in Australia, 1992 to 2005 S128
Table 34. Haemophilus influenzae type b vaccination practice in Australia, 1992 to 2005 S128
Table 35. Hepatitis A vaccination practice in Australia, 1992 to 2005 S128
Table 36. Hepatitis B vaccination practice in Australia, 1992 to 2005 S129
Table 37. Influenza vaccination practice in Australia, 1992 to 2005 S129
Table 38. Measles, mumps and rubella vaccination practice in Australia, 1992 to 2005 S129
Table 39. Meningococcal C vaccination practice in Australia, 1992 to 2005 S129
Table 40. Pneumococcal vaccination practice in Australia, 1992 to 2005 S130
Table 41. Polio vaccination practice in Australia, 1992 to 2005 S130
Table 42. Varicella vaccination practice in Australia, 1992 to 2005 S130
Table 43. Dates when childhood vaccines became available in Australia free of charge in the public and private sectors, up to December 2005 S134
FiguresFigure 1. Haemophilus influenzae type b notifications and Haemophilus meningitis hospitalisations
for all ages, Australia, 1993 to 2005, by month of diagnosis or admission S12
Figure 2. Haemophilus influenzae type b notification and Haemophilus meningitis hospitalisation rates, Australia, 2003 to 2005, by age at admission S12
Figure 3. Haemophilus influenzae type b notification and ‘presumed invasive Haemophilus influenzae type b’ hospitalisation rates and numbers of deaths for children aged 0–4 years, Australia, 1993 to 2005 S14
Figure 4. Hepatitis A notifications and hospitalisations, Australia, 1993 to 2005, by month of diagnosis or admission S16
Figure 5. Hepatitis A notification rates, Australia, 1993 to 2005, by age group, sex and year of diagnosis S17
Figure 6. Hepatitis A hospitalisation rates, Australia, 1993 to 2005, by age group, sex and year of separation S17
Figure 7. Acute hepatitis B notifications, and hospitalisations with a principal diagnosis of acute hepatitis B, Australia, 1993 to 2005,† by month of diagnosis or admission S21
Figure 8. Acute hepatitis B notification rates, Australia, 1993 to 2005, by age group S23
Figure 9. Acute hepatitis B hospitalisation rates, Australia, 2002/2003 to 2004/2005, by age group and sex S23
Figure 10. Influenza hospitalisations and notifications, Australia, July 1993 to December 2005, by month of diagnosis or admission S27
Figure 11. Influenza notification rates 2003 to 2005 and hospitalisation rates 2002/2003 to 2004/2005, Australia, by age group S28
Figure 12. Measles notifications and hospitalisations, Australia, 1993 to 2005, by month of diagnosis or admission S32
Figure 13. Measles notification rates, Australia, 1999 to 2005, by age group and year of diagnosis S34
Figure 14. Measles hospitalisation rates, Australia, 1998 to 2005, by age group and year of separation S34
Figure 15. Meningococcal notifications and hospitalisations, Australia, 1993 to 2005, by month of diagnosis or admission S38
Figure 16. Meningococcal disease notification and death rates, Australia, 2003 to 2005, by age group S40
Figure 17. Meningococcal disease hospitalisation rates, Australia, July 2002 to June 2005, by age group S40
Figure 18. Meningococcal disease notifications, Australia, 1991 to 2005, by serogroup S41
Continued next page
Tables, continued

CDI Vol 31 Supplement 2007 v
Vaccine preventable diseases and vaccination coverage in Australia, 2003 to 2005
Figure 19. Meningococcal serogroup C disease notifications, Australia, 1999 to 2005, by age group eligible for the meningococcal C vaccination program S42
Figure 20. Meningococcal serogroup C disease notifications, Australia, 1999 to 2005, by age group S42
Figure 21. Meningococcal disease notification rates, Australia, by jurisdiction and serogroup S43
Figure 22. Mumps notifications and hospitalisations, Australia, 1993 to 2005, by month of diagnosis or admission S45
Figure 23. Mumps notification rates, Australia, 1999 to 2005, by age group and year of diagnosis S47
Figure 24. Mumps hospitalisation rates, Australia, 1999 to 2005, by age group and year of separation S47
Figure 25. Pertussis notifications and hospitalisations, Australia, 1993 to 2005, by month of diagnosis or admission S50
Figure 26. Pertussis notification rates, Australia, 1993 to 2005, by age group S51
Figure 27. Pertussis hospitalisation rates, Australia, 1993 to 2005, by age group S52
Figure 28. Pertussis hospitalisation rates, Australia, 1993 to 2005, by age group (excluding <1 yrs) S52
Figure 29. Pneumococcal disease notifications and hospitalisations, Australia, January 1996 to December 2005, by month of diagnosis or admission S56
Figure 30. Pneumococcal disease notification rates, Australia, 2002 to 2005, by age group S56
Figure 31. Pneumococcal disease notification rates, Australia, 2002 to 2005, by age group (excluding <2 years) S57
Figure 32. Pneumococcal meningitis, septicaemia and pneumonia hospitalisation rates, Australia, 2002 to 2005, by age group S58
Figure 33. Notification rates of cases with serotypes contained in the 7-valent pneumococcal conjugate vaccine (7vPCV), versus rates for other serotypes, Australia, 2002 to 2005 S59
Figure 34. Q fever notifications and hospitalisations, Australia, 1993 to 2005, by month of diagnosis or admission S66
Figure 35. Q fever notification rates, Australia, 1993 to 2005, by age group and sex S68
Figure 36. Q fever hospitalisation rates, Australia, 1993 to 2005, by age group and sex S68
Figure 37. Rotavirus hospitalisations, Australia, 1993 to 2005, by month of admission S70
Figure 38. Rotavirus hospitalisation rates, Australia, 2002 to 2005, by age group (under 5 years) S71
Figure 39. Rotavirus hospitalisation rates, Australia, 1998 to 2005, by age group (under 5 years) and year of separation S71
Figure 40. Rotavirus notifications, the Northern Territory, 2003 to 2005, by age group (under 5 years) S73
Figure 41. Rubella notifications and hospitalisations, Australia, 1993 to 2005, by month of diagnosis or admission S75
Figure 42. Rubella notification rates, Australia, 1999 to 2005, by age group, sex and year of diagnosis S77
Figure 43. Rubella hospitalisation rates, Australia, 1999/2000 to 2004/2005, by age group, sex and year of separation S77
Figure 44. Tetanus notifications and hospitalisations, Australia, 1993 to 2005, by year of diagnosis or admission S79
Figure 45. Tetanus notification and hospitalisation rates, Australia, 2003 to 2005, by age group S81
Figure 46. Varicella and herpes zoster hospitalisations, Australia, July 1993 to June 2005, by month of admission S83
Figure 47. Varicella hospitalisation rates, Australia, 2002 to 2005, by age group and sex S84
Figure 48. Varicella hospitalisation rates, Australia, 2000 to 2005, by age group (0–4 years) and year of separation S85
Figure 49. Varicella notifications, South Australia, 2002 to 2005, by month of notification S86
Figure 50. Varicella notifications, South Australia, 2003 to 2005, by age group and sex S86
Figure 51. Herpes zoster notifications, South Australia, 2002 to 2005, by month of notification S88
Figure 52. Herpes zoster notifications, South Australia, 2003 to 2005, by age group and sex S88
Continued next page
Figures, continued

vi CDI Vol 31 Supplement 2007
Vaccine preventable diseases and vaccination coverage in Australia, 2003 to 2005
Figure 53. Trends in vaccination coverage estimates from the Australian Childhood Immunisation Register for 12, 24 and 72 month olds S92
Figure 54. Trends in vaccination coverage estimates, by jurisdiction: children ‘fully immunised’ at the age of 12 months S93
Figure 55. Trends in vaccination coverage estimates for individual vaccines: children vaccinated with DTPa, OPV, HepB and Hib at the age of 12 months S94
Figure 56. Immunisation coverage for ‘fully immunised’ at 12 months of age, Australia, December 2005 S95
Figure 57. Timeliness of the third dose of DTPa (due at 6 months of age), by jurisdiction – cohort born 1 January 2004–31 March 2004 S95
Figure 58. Trends in vaccination coverage estimates, by jurisdiction: children ‘fully immunised’ with DTPa, OPV, HepB, Hib and MMR at the age of 24 months S96
Figure 59. Trends in vaccination coverage estimates for individual vaccines: children vaccinated with DTPa, OPV, HepB, Hib and MMR at the age of 24 months S97
Figure 60. Immunisation coverage for ‘fully immunised’ at 24 months of age, Australia, December 2005 S97
Figure 61. Timeliness of the first dose of MMR (due at 12 months of age), by jurisdiction – cohort born 1 January 2003–31 March 2003 S98
Figure 62. Trends in vaccination coverage estimates, by jurisdiction: children ‘fully immunised’ with DTPa, OPV and MMR at the age of 72 months S99
Figure 63. Trends in vaccination coverage estimates for individual vaccines: children vaccinated with DTPa, OPV and MMR at the age of 72 months S99
Figure 64. Immunisation coverage for ‘fully immunised’ at 72 months of age, Australia, December 2005 S100
Historical charts of notifications of vaccine preventable diseases
Diphtheria, 1917–2005 S112
Haemophilus influenzae type b disease, 1991–2005 S112
Hepatitis A, 1952–2005 S113
Measles, 1917–2005 S113
Meningococcal disease (invasive), 1949–2005 S114
Mumps, 1932–2005 S114
Pertussis, 1917–2005 S115
Poliomyelitis, 1917–2005 S115
Rubella, 1942–2005 S116
Tetanus, 1917–2005 S116
Tables, continued

CDI Vol 31 Supplement 2007 vii
Vaccine preventable diseases and vaccination coverage in Australia, 2003 to 2005
AcknowledgementsWe thank the Scientific Advisory Committee of the National Centre for Immunisation Research and Surveillance of Vaccine Preventable Diseases, especially Dr Cathy Mead and Professor John Kaldor, who generated the initial ideas for these reports. Special thanks to Dr Rod Givney, Communicable Diseases Control Branch, Department of Human Services, South Australia, for the provision of South Australian varicella-zoster notifications data and Dr Rosalie Schultz, Dr Peter Markey and Dr Christine Selvey, Centre for Disease Control, Northern Territory, for the provision of Northern Territory rotavirus notifi-cation data.
We wish to acknowledge the following people who provided expert feedback for individual chapters: Dr Paul Roche, Ms Megan Cumerlato and Ms Michelle Bramley for methods, Mr Ross Andrews for pneumococcal disease, Professor Mark Ferson for hepatitis A, Professor Margaret Burgess for rubella, Dr Gregory Dore for hepatitis B, Professor Lyn Gilbert for diphtheria and tetanus, Dr Jeremy McAnulty for Hib disease, Dr Frank Beard for influenza, Dr Bruce Thorley for polio, Dr Steve Lambert for mumps, Dr Michaela Riddell for measles, Ms Karen Peterson for vaccination coverage, Dr Paul van Buynder for pertussis, Dr Mark Veitch for varicella-zoster, Dr Brad McCall for meningococcal disease, Professor Barrie Marmion for Q fever, Dr Vicki Krause for rotavirus and Ms Rebecca Dadds for funding. We also thank Dr Mary Iskander for assistance in preparation of the influenza chapter and Ms Catherine King, Ms Donna Armstrong and Ms Kirsty Whybrow who provided library support and edited the manuscript.
We wish to acknowledge the following organisations for provision of data for this report: the Surveillance Policy and Systems Section of the Office of Health Protection of the Australian Government Department of Health and Ageing, for data from the National Notifiable Diseases Surveillance System; and the Australian Institute of Health and Welfare, Hospitals Unit and Population Health Unit, for data from the National Hospital Morbidity and Mortality Databases.
The report was reviewed by a representative of the Commonwealth, the Australian Institute of Health and Welfare and each Australian jurisdiction from the Communicable Diseases Network Australia before publication.

viii CDI Vol 31 Supplement 2007
Vaccine preventable diseases and vaccination coverage in Australia, 2003 to 2005
Executive summary
Overview
This, the fourth report on vaccine preventable diseases and vaccination coverage in Australia, brings together the four most important national sources of routinely collected data about vaccine preventable diseases and vaccination (deaths, notifications, hospitalisations and vaccination coverage) for all age groups between January 2003 and December 2005. Most recently available hospitalisation and death data cover the period up to 30 June 2005 and 31 December 2004, respectively. The general trend towards improved control of disease and improved vaccination coverage is evident, particularly in the childhood years. Detailed results are available in 16 individual chapters.
Notifications, hospitalisations and deaths for 11 diseases are summarised in Table 1. Although these data have limitations which are discussed in detail in the body of the report, some clear trends are evident.
Compared to the previous review period (2001–2002), there are continuing declines in the overall disease burden, as indicated by these routinely collected data, that are driven by improving control of measles, rubella, Hib and pneumococcal disease, and a dramatic fall in meningococcal disease in 2004/2005.
Table 1. Notifications, hospitalisations and deaths from 11 diseases preventable by vaccination, Australia, 2000 to 2005*
Disease† Notifi cations Hospitalisations DeathsAverage per
year2001–2002
Average per year
2003–2005
Average peryear
July 2000–June 2002
Average peryear
July 2002–June 2005
Average peryear
2001–2002
Average per year
2003–2004
Diphtheria 0.5 0 0.5‡ 0‡ 0 0Hib (<5 yr)§ 12 8 15 12 0 0Infl uenza║ 3,671¶ 3,395 3,139 3,039 44 51Measles 87 49 53 31 0 0Meningococcal disease 687 452 873 712 44 23Mumps** 92 140 43 46 0.5 0.5Pertussis 7,521 8,345 638 440 3 1Pneumococcal disease†† 2,466 2,101 1,057 1,038 15 19Polio‡‡ 0 0 2‡‡ 2‡‡ 0 0Rubella 261 39 27 15 0 0Tetanus 4 4 27 22 0.5 0Total§§ 14,800 14,532 5,873 5,356 106 94
* Notifi cations where the month of diagnosis was between January 2001 and December 2005; hospitalisations where the month of separation was between 1 July 2000 and 30 June 2005; deaths where the date of death was recorded between 2001 and 2004.
† See Chapter 3 for case defi nitions.‡ Only includes hospitalisations coded as pharyngeal, nasopharyngeal or laryngeal diphtheria as per included codes
for previous review period.§ Note that hospitalisations and deaths are for Haemophilus infl uenzae meningitis only and, unlike notifi cations, are
not limited to type b.║ Limitations of notifi cation systems and coding for infl uenza hospitalisations and deaths limit the representativeness
of these data, which grossly underestimate the disease burden due to infl uenza.¶ Notifi cations only complete for 2002 – notifi cations for 2002 only.** Queensland did not notify mumps for the complete calendar year in 2001.†† Pneumococcal hospitalisations and deaths for sepsis or meningitis only.‡‡ Principal diagnosis only.§§ Average per year for the total may not equal the sum of that for each disease, due to rounding.

CDI Vol 31 Supplement 2007 ix
Vaccine preventable diseases and vaccination coverage in Australia, 2003 to 2005
There is an ongoing absence of disease due to polio and diphtheria and a continuing low incidence of tetanus. There have been continuing declines in hepatitis A and hepatitis B incidence. Following the introduction of the National Q Fever Management Program, the incidence of Q fever has also declined. Mumps and pertussis notifications have increased, whereas hospitalisations and deaths for mumps are stable and for pertussis have declined. Influenza and pneumococcal disease continue to contribute the greatest burden of serious disease as indicated by hospitalisation and death data.
Comment
The years 2003 to 2005 have been a period of continuing gains in the control of vaccine preventable diseases and a time of expansion with the implementation of new vaccination programs against meningococcal C disease, varicella-zoster, and pneumococcal disease. Although there has been an increase in the number of diseases against which children are routinely vaccinated, vaccination coverage has been maintained at high levels and such coverage is likely to be facilitated by the now routine use of combination vaccines. Australia, like many other industrialised countries, faces the dual challenges of maintaining high immu-nisation coverage and public confidence in immunisation while implementing increasingly complex decisions about the introduction of new vaccines for children and adults.
In surveillance, the introduction and implementation in 2004 of new national definitions for diseases notified to the National Notifiable Diseases Database was an important step in improving the consist-ency of notifications reported by different jurisdictions. Further challenges remain in working towards improved consistency and completion in the reporting of fields such as vaccination status. In vaccination practice, vaccination coverage targets are probably close to their highest achievable levels in children. However, improving control of mumps and pertussis through vaccination of young adults stands out as a challenge for the next few years.
Careful evaluation of the additional benefits of new programs, such as those for meningococcal C, pneumococcal, and varicella-zoster disease, will be important to convince stakeholders, including the pub-lic and professionals, of the value of vaccination and to ensure the success of immunisation in Australia into the future.

CDI Vol 31 Supplement 2007 S1
Vaccine preventable diseases and vaccination coverage in Australia, 2003 to 2005
1. IntroductionThis is the fourth national report on the morbidity and mortality from vaccine preventable diseases (VPDs) and vaccination coverage in Australia. The first (1993 to 1998) was published in 2000, the second (1999 to 2000) in 2002 and the third (2001 to 2002) in 2004.1–3 The progressive decline in the inci-dence of all the childhood VPDs continues, with the possible exceptions of pertussis and mumps where notifications have increased although this is not reflected in hospitalisations. Most striking has been the 99.75% decline in the numbers of deaths from these diseases since the prevaccination era, despite the Australian population increasing almost threefold (Table 2), and the close associations of declines in individual disease mortality with the introduction of specific vaccination programs.4 Deaths due to pertussis in infants too young to be vaccinated remain an important challenge.
The past fifteen years has seen the introduction of a number of major surveillance and vaccination initiatives in Australia:
a national disease notification system (NNDSS) in 1991;the Australian Childhood Immunisation Register (ACIR) in 1996;5
the Seven Point Plan in 1997 (this included the Measles Control Campaign in the later part of 1998);6
the General Practice Immunisation Initiative in 1998;implementation of new national notifiable diseases definitions, daily data updates to NNDSS and on-line data publication in 2004; andnew vaccination programs for children (against hepatitis B, Haemophilus influenzae type b, meningococ-cal C disease, pneumococcal disease, varicella-zoster virus), the elderly (influenza and pneumococcal disease) and Indigenous people (influenza, pneumococcal disease, hepatitis A).
Although specific enhanced evaluations are important, much can be learned from examining routinely collected data, especially for trends over time. This fourth report uses similar methods to the first three, bringing together data sources available at the national level relevant to VPDs and vaccination (deaths, notifications, hospitalisations and vaccination coverage) for all age groups. The diseases covered in this report include those for which vaccines were funded nationally for children during the review period (diphtheria, Haemophilus influenzae type b (Hib) disease, hepatitis B, invasive pneumococcal disease, measles, meningococcal C disease, mumps, pertussis, poliomyelitis, rubella, tetanus and varicella), those for which vaccines were available but only funded or recommended for specific risk groups (hepatitis A, influenza and Q fever) and for rotavirus, for which new vaccines became available in 2006. The report does not cover some other diseases which are at least partially preventable by vaccination, such as tuber-culosis, on which reports can be found elsewhere.7–9
This and the previous three reports, all from the National Centre for Immunisation Research and Surveillance (NCIRS), provide evidence of the impact of changes in vaccination policy over the past fifteen years, as detailed in Appendix 4. These reports provide baselines against which further initiatives can be evaluated.
•••
••
•
Table 2. Number of deaths from diseases commonly vaccinated against, by decade, Australia, 1926 to 1995 and 1996 to 2004*
Period Diphtheria Pertussis Tetanus Poliomyelitis Measles† Population estimate(yearly average)
1926–1935 4,073 2,808 879 430 1,102 6,600,0001936–1945 2,791 1,693 655 618 822 7,200,0001946–1955 624 429 625 1,013 495 8,600,0001956–1965 44 58 280 123 210 11,000,0001966–1975 11 22 82 2 146 13,750,0001976–1985 2 14 31 2 62 14,900,0001986–1995 2 9 21 0 32 17,300,0001996–2004 0 17 6 0 0 19,200,000
* Sources: Feery B. One hundred years of vaccination. Public Health Bulletin 1997;8:61–63; Feery B. Impact of immunisa-tion on disease patterns in Australia. Medical Journal of Australia 1981;2:172–176. Deaths recorded for 1966–1975 and 1996–2004 updated with data provided by AIHW Mortality Database.
† Excludes deaths from subacute sclerosing panencephalitis.
Indicates decade in which community vaccination started for the disease.


CDI Vol 31 Supplement 2007 S3
Vaccine preventable diseases and vaccination coverage in Australia, 2003 to 2005
2. Methods
Vaccine preventable diseases data
Three sources of routinely collected data were used for this report. Notification data were obtained from the National Notifiable Diseases Surveillance System (NNDSS), hospitalisation data from the Australian Institute of Health and Welfare (AIHW) National Hospital Morbidity Database, and mortal-ity data from the AIHW Mortality Database (unpublished data).
NotificationsThe NNDSS database was established in its current form in 1991, and includes information about cases of vaccine preventable diseases reported by laboratories and health workers to state and territory authori-ties under their current public health legislation. State and territory notification criteria are based on the National Health and Medical Research Council (NHMRC) surveillance case definitions.10 However, historically, application of these definitions has differed between jurisdictions, with some using the 1994 NHMRC case definitions as written (e.g. South Australia and Western Australia) and others using their own definitions (e.g. New South Wales and Victoria) (see Appendix 6 for case definitions in use prior to 2004). In September 2003, new national case definitions for notifications reported to NNDSS were endorsed by the Communicable Diseases Network Australia,11 with nearly all jurisdictions implement-ing the new definitions in January 2004 (New South Wales commenced August 2004). In Queensland, most notifications are from laboratory-confirmed cases and the notification process is highly automated. There are some minor differences between the laboratory criteria for notification in Queensland and the national case definitions for some diseases (e.g. the criteria for laboratory notification of Hib, pertussis and Q fever). However, the public heath protocols for notification in Queensland require cases to meet the national case definitions for notification. In 2001, invasive pneumococcal disease and laboratory-con-firmed influenza became notifiable to the NNDSS. Varicella and herpes zoster were made notifiable in all jurisdictions (except New South Wales) from 2006. Rotavirus infection is not notifiable to NNDSS.
Data extracted from the NNDSS as at 4 June 2006 were examined. Data were checked and cleaned where apparent errors were detected through consultation with appropriate surveillance staff in states and territories. Note that these data are later versions than those used for the 2003 and 2004 Australia’s Notifiable Disease Status reports and the AIHW publication Australia’s Health 2006.12–14 Disease noti-fication data for cases with a date of diagnosis between 1 January 2003 and 31 December 2005 (three years) are included in this report. Notification data are presented and reported by date of diagnosis. Previous reports analysed notifications by date of onset where date of onset was collected from the clinical history where available, or the specimen collection date for laboratory-confirmed cases. As of mid 2005, a date of diagnosis field was generated for all NNDSS records. Date of diagnosis is completed using an algorithm whereby the earliest date in the fields date of onset, date of specimen, date of notification and date notification received (the only compulsory date field) is selected. This applies for all diseases except hepatitis B unspecified and hepatitis C unspecified (not included in this report) where onset date is not used in calculation of the date of diagnosis. Notifications with onset dates between 1 January 1993 and 31 December 2002 were reported previously.1–3 Historical notification data included within this report have been updated and are now presented by date of diagnosis. Q fever notifications are reported for the first time in this report.
The variables extracted for analysis for every disease were disease, date of diagnosis, age at onset, sex, and state or territory of residence. For the first time in this report, the fields for laboratory confirmation and vaccination status have been examined where relevant to that disease. This reflects the ongoing improvement in the completion rate of these fields. For a recent analysis of vaccine preventable diseases data by Indigenous status, please refer to the NCIRS report ‘Vaccine preventable diseases and vaccination coverage in Aboriginal and Torres Strait Islander people, Australia, 1999 to 2002’.15 Data from each state and territory were included when calculating rates only when that jurisdiction had been reporting for a complete year (see Appendix 2, Notifications by state or territory and year, for the years in which states and territories were reporting). Differences in surveillance systems between jurisdictions may have accounted for some of the differences in notification rates. Where there were known differences that were likely to differentially affect notification rates, these have been described under the disease chapter of interest.
HospitalisationsThe AIHW National Hospital Morbidity Database has received administrative, demographic and clini-cal information about patients admitted to public and private hospitals in Australia since 1993. Data are

S4 CDI Vol 31 Supplement 2007
Vaccine preventable diseases and vaccination coverage in Australia, 2003 to 2005
received by financial year of separation (discharge), and the three most recent years for which data are available (2002/2003, 2003/2004 and 2004/2005) were examined. Cases with separation dates between 1 July 1993 and 30 June 2002 (9 years) were reported previously.1–3 This report presents previously analysed historical data for years prior to and including 1997/1998 and updated data for all years from 1998/1999 onwards. Where hospitalisation data is analysed by month, reflecting seasonal trends, data are presented and reported by date of admission. Otherwise, as hospitalisation data for the most recent period (2002/2003–2004/2005) is defined by date of separation, analysis by other variables such as age and sex is grouped by year of separation. Data were extracted based on the International Statistical Classification of Diseases and Related Health Problems, 10th Revision, Australian Modification (ICD-10-AM). Eligible separations were those with the code of interest listed in the principal diagnosis (the diagnosis chiefly responsible for the admission of the patient to hospital) or in any other diagnoses. The proportion of separations for which the diseases were coded as the principal diagnosis is reported for each disease. For acute hepatitis B, only principal diagnoses were included. Where the ICD-10-AM code for a disease specifies a severe manifestation (e.g. measles encephalitis) the number and type of these were reported as complications. The variables extracted for analysis were date of admission, financial year of separation, age at admission, sex, state or territory of residence, length of stay (LOS), and diagnosis (principal and other diagnoses—up to 31 diagnoses were recorded for each admission) coded using ICD-10-AM in the relevant edition for the collection period. In addition, the mode of separation (whether the patient died in hospital) was analysed for hospitalisations due to meningococcal disease as, for this disease, this measure was felt to be of importance. Where state of residence was missing in hospitalisation data, this variable was replaced with state of hospitalisation, affecting 0.5% of records in 2002/2003, 2003/2004 and 2004/2005.
Appendix 3 presents hospitalisation data by disease, year and state or territory. All jurisdictions except New South Wales, Queensland and South Australia required data suppression for cells containing less than five hospitalisations. The figures less than five (but non-zero) in this table for the jurisdictions that requested suppression have been replaced with the symbol <5. Calculation of the suppressed figures (by subtraction from totals) has been prevented by the suppression of another figure with less than five in the same disease category but a different year and of another state’s data where less than five (for the same row/year). Where there was not another figure in the same row or column that was less than five, a cell has been suppressed using the symbol n.p. (not published) to denote that the number was greater than five. In some cases, this has been achieved by suppressing the total for the disease/year or for the five year total by disease/state. The corresponding hospitalisation rates for suppressions are also designated with the symbol n.p.
DeathsDeath data were obtained from the AIHW Mortality Database. These data are supplied annually to the AIHW from the Registrars of Births Deaths and Marriages in each state and territory via the Australian Bureau of Statistics (ABS). Deaths include those in Australian waters as well as on Australian soil, whereas ABS published data exclude deaths in Australian waters. Since 1997, the International Classification of Diseases, 10th Revision (1992) (ICD-10) has been used to identify the cause of death. Although multiple causes of death have been recorded since 1997, only those where the underlying cause of death was the disease of interest are used in this report. Deaths analysed in this report were those registered in 2003 to 2004 (two years). The variables extracted for each death were: underlying cause, age, year death was reported, sex, and state or territory in which death was recorded.
CalculationsAll rates were calculated using finalised ABS mid-year estimated resident populations as at June 2006. Rates are presented as annual rates or average annual rates per 100,000 total population or population in age, sex or geographical subgroups, as appropriate. Average annual rates were calculated by dividing the total number of cases for the period of investigation by the sum of each year’s population for the same period. For hospitalisation data, the mid-year population estimate for the first half of the financial year was used as the denominator—e.g. the 2002 mid-year population estimate was used to calculate rates for 2002/2003. For notification data, the denominator population for each year included only jurisdictions notifying cases for that entire year. Averages were calculated for rates of notifications and hospitalisations and for bed days per year. Medians and ranges, rather than averages, were used to describe the distribu-tion of notifications and hospitalisations per month, and length of stay per admission, as these data were not normally distributed. Where there were small cell sizes for national hospitalisation data (three or less hospitalisations recorded per age/disease category), median length of stay estimates were not published (denoted by n.p.).

CDI Vol 31 Supplement 2007 S5
Vaccine preventable diseases and vaccination coverage in Australia, 2003 to 2005
Report structure for individual diseasesFor each disease, data are generally presented in the following format:
secular trends—the pattern of notifications and hospitalisations over time, with reference to seasonality and outbreaks;severe morbidity and mortality—hospital bed days, length of stay, principal diagnosis, complications and mortality by age group in standard age categories;age and sex distribution—data by age and sex groups as relevant for each particular disease;geographical distribution—case numbers and rates by state or territory, as shown in Appendices 2 and 3. For hospitalisations, some jurisdictions required suppression of hospitalisation data for those cells where there were less than five cases;vaccination status of notified cases and laboratory typing, as relevant;comment—discussion of the data presented.
Vaccination coverage data
During the review period of this report there was one source of data about national vaccination coverage: the Australian Childhood Immunisation Register (ACIR). The ACIR commenced in January 1996 and is administered by Medicare Australia (formerly the Health Insurance Commission) for the Australian Government Department of Health and Ageing. The ACIR records details, as supplied by vaccination providers, about the vaccination status of children aged less than seven years. Vaccination coverage esti-mates derived from ACIR data have been reported in Communicable Diseases Intelligence since early 1998. A complete description of the method for calculating coverage estimates by age cohorts is given elsewhere.16 In this report, we have described trends in ACIR vaccination coverage estimates for all vaccines on the current childhood schedule except meningococcal C vaccine, pneumococcal vaccines and varicella vaccine.
Notes on interpreting data
Vaccine preventable diseases dataComparisons between the notification, hospitalisation and death databases should be made with caution as they differ in their purposes, reporting mechanisms and accuracy. To provide the most recent informa-tion available, and to account for the varied reporting formats, different time periods have been reviewed for each data set. As there were no unique identifying codes to link records for the same individual across databases, and because of differences in the accuracy of each database, it was not possible to analyse deaths and hospitalisations as a subset of notifications.
The rates presented here are crude rates and may be confounded by differences in the population struc-ture (e.g. age, ethnicity and population density) between jurisdictions. An exploratory analysis of 2002 pneumococcal and incident hepatitis B notification rates for the Northern Territory found that directly age-standardising the rates to the 2001 Australian population did not change the rates significantly (pneumococcal crude rate 20.2 per 100,000 vs 20.5 per 100,000 age-standardised; hepatitis B crude rate 6.8 per 100,000 vs 5.7 age-standardised.) The Northern Territory is the jurisdiction with the most dif-ferent age structure and we have elected to continue using crude rates as per previous reports. It is also important to note that jurisdictions with small populations (e.g. the Australian Capital Territory, Tasmania, the Northern Territory) may have high rates even with low absolute numbers of cases, so that a small change in numbers results in a large change in rates.
Notification dataA major limitation of the notification data is that they represent only a proportion of the total cases occurring in the community. This proportion may vary between diseases and over time, with infections diagnosed by a laboratory test more likely to be notified. Data accuracy may also vary between states and territories due to the use of different case definitions for surveillance and varying reporting requirements by medical practitioners, laboratories and hospitals. Under-reporting of notifiable diseases by doctors and from hospitals has been documented in Australia.17–19 There are eight different Public Health Acts
•
•
••
••

S6 CDI Vol 31 Supplement 2007
Vaccine preventable diseases and vaccination coverage in Australia, 2003 to 2005
in operation and no legislative requirement to report to NNDSS although all jurisdictions do so, with daily updates entering the system as of 2004.20 Data constraints are applied to uploaded fields to ensure validity. This is important given that each jurisdiction has its own reporting system with different fields and coding systems in use. A recent evaluation of NNDSS found that this was a major factor limiting data quality and completeness.20 Assessing the sensitivity and positive predictive value of the system was beyond the scope of the evaluation. The review noted that the main use of NNDSS for public health action has been in the area of vaccine preventable diseases.
Hospitalisation dataThe AIHW publishes regular overviews of Australian hospitalisation statistics, including details of the number of hospitals reporting and any documented data problems. In the periods covered by this report (2002/2003, 2003/2004, 2004/2005), in each financial year there were over 6.6 million, 6.8 million and 7 million separations, respectively.21–23 Almost all public and private hospitals were included in each of these periods.21–23 The AIHW performs logical validations on the ICD-10-AM coded data; for example, for sex and age specific diagnoses. Coding audits are also variously performed at hospital level or state and territory level using software such as PICQ (Performance Indicators for Coding Quality) developed by the National Centre for Classification in Health (NCCH).24
Some variation in hospital access, admission practices and record coding may occur between regions and over time and impact upon the use of hospitalisation data for monitoring disease trends over time and between jurisdictions. It is likely that the quality of coding in Australia has improved over time due to increasing levels of training amongst coders25 and the use of coding audits (M Cumerlato, NCCH, personal communication). The National Clinical Coder Workforce Survey of over 1,000 Australian coders in 2002 found that, whilst just over half held tertiary qualifications,10% had no formal coding education. About two thirds of coders reported undertaking regular quality assurance activities in relation to coding.25
In 1998/1999, most states and territories began using ICD-10-AM and in 1999/2000, all jurisdictions were using the new classification. This change impacted on the sensitivity and specificity of some diagnostic codes relevant to this report. The most notable impact has been on the number of hospitalisations for acute hepatitis B as, unlike the previously used ICD-9-CM, ICD-10-AM allows differentiation between acute and unspecified infection. The NCCH updates the ICD-10-AM every two years, under the guid-ance of the Australian Coding Standards Advisory Committee.26,27
There are also limitations associated with the use of ICD codes to identify cases. Errors that cause the ICD code to differ from the true disease include both random and systematic measurement error and may either occur along the patient pathway (e.g. level of detail documented in medical records, clini-cian experience) or along the paper trial (e.g. transcribing errors, coder errors such as miss-specification, unbundling (assigning codes for all the separate parts of a diagnosis rather than the overall diagnosis) and upcoding (using reimbursement values to determine the order of coding)).28 A study of pertussis in children’s hospitals in Sydney noted that, whilst variability in clinician diagnostic practices may reduce the sensitivity of pertussis coding, high specificity enables the codes to be useful for surveillance of infant pertussis trends.19 In the National Clinical Coder Workforce Survey, most Australian coders (77%) nomi-nated incomplete medical record content as the factor most likely to affect coding quality, followed by the principal diagnosis not being identified, complications/co-morbidities not being identified, illegible medical record entries and pressure to maintain coding throughput.25 In Australia, hospital coding errors have been reported to occur more commonly for diseases that the coder was less familiar with (e.g. rare diseases such as tetanus) and for admissions with multiple diagnoses.29
As indicated in relevant disease chapters, the short lengths of stay and lack of notification to public health authorities strongly suggest that some cases with hospitalisation codes for rare diseases, such as tetanus and acute poliomyelitis, are likely to be due to coding errors. For some diseases, such as Haemophilus influenzae type b infection, both the previously used ICD-9-CM and current ICD-10-AM codes lack specificity. This is in contrast to the more stringent case definitions used for notification data. For exam-ple, Wood et al recently documented the poor specificity of hospitalisations coded as acute epiglottitis, with most cases on record review found not to be acute epiglottitis and, in the post-vaccination era, none of these admissions due to Hib disease.30 Thus, care must be taken in ensuring the ICD codes accurately reflect diagnosis of the condition of interest. Generally, codes are most likely to be accurate when the disease has a clear definition with observable signs and symptoms, highly qualified physicians document information on the patient, experienced coders with full access to clinical information assign the codes and the codes are not new.28

CDI Vol 31 Supplement 2007 S7
Vaccine preventable diseases and vaccination coverage in Australia, 2003 to 2005
It must also be noted that the hospitalisation database contains a record for each admission, which means that there are separate records for each readmission or inter-hospital transfer. This is unlikely to have a major impact on the numbers reported for most diseases reviewed, as they are acute illnesses. For hospitalisations where the code of interest was not the principal diagnosis, the code of interest will have been recorded as a co-morbidity (additional or secondary diagnosis), the relative importance of which cannot be gauged.
Death dataMortality data were analysed by year of registration rather than by year of death, thereby avoiding incom-plete data for the latest available year. In recent years, less than 5% of deaths in a particular calendar year are registered in the subsequent year,31 with the bulk comprising that calendar year’s December deaths.
Only those deaths where the underlying cause of death was the disease of interest are reported here. Hence, deaths where the disease of interest was a contributing cause of death are not included.
The problems associated with the accuracy of the ICD codes used for hospital separations may also apply to the mortality data. Information on cause of death are reported routinely for each death on a Standard Medical Certificate of Cause of Death completed by a medical practitioner or coroner. The person complet-ing the certificate must nominate the underlying (principal) cause of death and any associated conditions.31 The accuracy of the ascertainment of the cause of death may clearly vary according to the experience of the practitioner, the complexity of the disease process and the circumstances of the death. The rate of hospital autopsy has been steadily declining (to approximately 12% in Australia in 2002/2003)32 and inaccuracy in cause of death certification, compared to the gold standard of autopsy findings, is clearly documented,33–36 with a recent meta-analysis estimating that around one third of deaths may be misclassified on death certifi-cates.37 In the case of pertussis and tetanus, studies have documented that deaths due to these diseases, that can be otherwise identified through disease surveillance systems and hospitalisation records, sometimes go unrecorded on death certificates.38,39 In addition, the number of causes of death recorded by the ABS increased from 187 in 1907 to around 2,850 in 2000 as medical understanding increased.31 Thus, despite comprehensive mapping algorithms, which attempt to take into account changing disease classification over time, caution is required in interpreting mortality trends.
In processing deaths registered from 1 January 1997, Australia adopted the use of the Automated Coding System (ACS) and introduced ICD-10 codes. As a result, there is now a break in the underlying causes of death series between 1996 and 1997. This is especially important where the death was recorded as hepatitis B. Prior to the use of ICD-10, acute, chronic and unspecified infections could not be differenti-ated. A large artefactual rise in deaths coded as due to pneumonia in 1997–1998 has also been ascribed to changes in coding practices during this period.40
Vaccination coverage dataLimitations of data available from the ACIR must be considered when it is used to estimate vaccina-tion coverage. Vaccine coverage estimates calculated using ACIR data should be considered minimum estimates due to under-reporting.5,41 Another limitation of ACIR data is that records are only held for children up to seven years of age. Coverage is calculated only for children registered on Medicare; how-ever, by the age of 12 months, it is estimated that over 99% of Australian children have been registered with Medicare.16,41,42


CDI Vol 31 Supplement 2007 S9
Vaccine preventable diseases and vaccination coverage in Australia, 2003 to 2005
3. Vaccine preventable diseases
Diphtheria
Diphtheria is an acute toxin-mediated systemic disease caused by the bacterium Corynebacterium diphtheriae. Infection remains localised to the throat or skin but disease is mainly due to local inflamma-tion and/or systemic toxaemia. Pharyngeal diphtheria presents with a membranous inflammation of the upper respiratory tract, which may be extensive enough to cause laryngeal obstruction. Damage to other organs including the myocardium, nervous system and kidneys, caused by the organism’s exotoxin, may complicate pharyngeal or cutaneous diphtheria.43,44 Non-toxigenic C. diphtheriae usually causes mild throat or skin infection, which is occasionally complicated by invasive disease including endocarditis or arthritis. Corynebacterium ulcerans, a bacterium found in cattle and more recently in cats, can also express diphtheria toxin and cause a zoonotic infection in humans that is similar to diphtheria.45,46
Notifications, hospitalisations and deathsThere were no notifications of diphtheria during January 2003 to December 2005 and no deaths due to diphtheria in 2003–2004. For the three year period 2002/2003 to 2004/2005, there were 66 hospitalisations coded as diphtheria. Of these, most were cutaneous (A36.3; n=39), with the remainder coded as other (A36.8; n=16) or unspecified (A36.9; n=11) diphtheria. There were no hospitalisations coded as pha-ryngeal or laryngeal diphtheria. Of the hospitalisations, unspecified diphtheria was given as the prin-cipal diagnosis in three cases. Although numbers are low, the group with the most admissions coded as diphtheria were males aged 25–29 years (n=12).
CommentDiphtheria has become rare in Australia. A cutaneous toxigenic case acquired in East Timor and notified in 2001 was the first case notified since 1993. Culture positive cutaneous and throat infections with non-toxigenic C. diphtheriae are endemic in the Northern Territory,47 but these are not classified as diphtheria in the absence of relevant symptoms.
From 2004, all toxigenic isolates, including those from cutaneous cases, became notifiable. This report includes, for the first time, all ICD codes for diphtheria in hospitalisation data (previously restricted to codes for pharyngeal or nasopharyngeal diphtheria and laryngeal diphtheria in order to be consistent with notification data). In the absence of any notifications during the period 2003–2005, the 66 hospitalisations (three principal diagnosis) were presumably non-toxigenic or culture negative suspected diphtheria cases or coding errors.
Case defi nitions
See Appendix 6 for pre-2004 defi nition
National defi nition from January 2004:11
Isolation of toxigenic Corynebacterium diphtheriae or toxigenic C. ulcerans (confi rmed case)
OR
Isolation of Corynebacterium diphtheriae or C. ulcerans (toxin production unknown) and one of the following presentations as clinical evidence:
• pharyngitis and/or laryngitis (with or without membrane);or
• toxic (cardiac or neurological) symptoms (probable case);or
• clinical evidence as above and an epidemiological link to a confi rmed case (probable case).
Hospitalisations
The ICD-10-AM code used to identify hospitalisations was A36 (diphtheria).
Deaths
The ICD-10 code A36 (diphtheria) was used to identify deaths.

S10 CDI Vol 31 Supplement 2007
Vaccine preventable diseases and vaccination coverage in Australia, 2003 to 2005
Diphtheria is still a global problem with 21 countries in Asia, South America, Africa and Europe report-ing 10 or more cases of diphtheria to the World Health Organization (WHO) in 2005,48 with a total of 8,229 cases reported globally in 2005. In 2002, WHO estimated that there were 5,000 deaths due to diph-theria. The large outbreak of diphtheria in the Newly Independent States (NIS) of the former Soviet Union in the 1990s49 has been gradually brought under control (from a peak of 50,425 cases in 1995 to 176 cases in the European Region in 2004). Four key strategies have been identified to maintain diphtheria control in the region: (1) ensuring high population immunity; (2) strengthened surveillance; (3) early diagnosis and high quality case management; and (4) rapid investigation and management of close contacts.50 The NIS outbreak underscores the risk of diphtheria returning when high vaccination coverage in children (who are critical vectors of respiratory transmission) is not maintained.
In countries with high childhood vaccination coverage against diphtheria, such as Australia, the United Kingdom, Germany, the USA and Canada, cutaneous lesions are the most likely manifestation of C. diphtheriae infection. Cutaneous infection may be caused by local circulating non-toxigenic strains51 (which can also cause invasive disease, including bacteraemia, endocarditis and arthritis, particularly in persons with risk factors such as homelessness, alcoholism, or diabetes)52 or by imported toxigenic types due to overseas travel.53,54 Cutaneous C. diphtheriae infection (due to toxigenic or non-toxigenic strains) may be difficult to diagnose due to a low index of suspicion, may cause chronic infection and may serve as a reservoir for ongoing transmission with greater efficiency than respiratory infection.51,53 Unfortunately, the frequency of international travel now means that even in countries such as Australia, where diphtheria is rare, exposure to a toxigenic strain may occur, with potentially fatal consequences in unvaccinated individuals, or in those whose vaccine induced immunity has waned.55,56 Waning immu-nity may be more of a problem in the small percentage of children of mothers born in countries overseas where cutaneous diphtheria is common, resulting in mothers having more circulating antibody, which, in turn, can reduce infant immune responses to vaccination through greater placental antibody transfer.57 Australian serosurveillance data indicate that, whilst childhood protection is excellent (>99%), waning immunity in adults has resulted in a susceptible population.58 Australians travelling to countries where diphtheria remains a problem should ensure that they are protected against diphtheria through booster immunisation as necessary.

CDI Vol 31 Supplement 2007 S11
Vaccine preventable diseases and vaccination coverage in Australia, 2003 to 2005
Haemophilus influenzae type b (Hib) disease
Haemophilus influenzae is a Gram-negative bacterium which occurs in both encapsulated and unencapsulated forms. It is a commensal of the nasopharynx, especially in young children. Before Hib vaccines became available, one encapsulated serotype, type b (Hib), caused at least 95% of invasive disease due to H. influenzae in children.59,60 Prior to the introduction of Hib vaccination the most common mani-festation of invasive Hib disease was meningitis, with children aged less than 18 months most at risk.59,60 Aboriginal and Torres Strait Islander children had a particularly elevated risk of Hib meningitis, with rates among the highest recorded anywhere in the world, but rarely developed epiglottitis.61 Survivors of Hib meningitis commonly had neurological sequelae such as deafness and intellectual impairment.59,60 Epiglottitis was the other major category of infection, most often occurring in children over the age of 18 months. Other manifestations of Hib disease include cellulitis, septic arthritis, pneumonia, pericardi-tis, osteomyelitis and septicaemia.
Case defi nitions
See Appendix 6 for pre-2004 defi nition
National defi nition from January 2004:11
a) Isolation of Haemophilus infl uenzae type b (Hib) from a normally sterile site where typing has been confi rmed at an approved reference laboratory; or
b) Detection of Hib antigen in cerebrospinal fl uid when other laboratory parameters are consistent with meningitis.
Hospitalisations and deaths
There were no ICD-10-AM/ICD-10 codes which specifi ed Hib as a causative organism. The ICD-10-AM/ICD-10 code used to identify presumed Hib cases was G00.0 (Haemophilus meningitis). The ICD-10-AM/ICD-10 codes for H. infl uenzae pneumonia, H. infl uenzae septicaemia, H. infl uenzae infection and acute epiglottitis were not included as these were thought to be insuffi ciently specifi c for invasive H. infl uenzae type b disease.
Secular trendsDuring the three years from January 2003 to December 2005, a total of 51 invasive Hib infections were notified. The average annual notification rate was 0.08 per 100,000 population (Table 3). A median of one case (range 0–5) was notified per month (Figure 1). There were 57 hospitalisations (average annual rate 0.10 per 100,000) recorded as Haemophilus meningitis, with a median of two cases (range 0–4) hos-pitalised per month.
Severe morbidity and mortalityOverall ,within each age group, there were similar numbers of hospitalisations with H. influenzae men-ingitis and notifications of invasive Hib disease recorded (Table 3). Over the review period, a total of 780 hospital bed days (average 260 days per year) was recorded for patients with Haemophilus meningitis. The median length of stay for hospitalisations with a principal diagnosis of Haemophilus meningitis was 11 days.
In the two years 2003 to 2004, H. influenzae meningitis was certified as the underlying cause of death in one person (who was aged over 85 years) (Table 3). There were two deaths in notified cases reported to NNDSS between 2003 and 2005 (both in 2003). One case was in an infant and the other in a man aged 60–69 years.
Age and sexHospitalisations for presumed Hib disease and notifications were higher in males than in females, with a male:female ratio of 1.21:1 and 1.33:1, respectively. In children aged 0–4 years, there were 23 H. influenzae meningitis cases. Overall, children aged 0–4 years accounted for 45% (23/51) of all notifications, 61% (35/57) of all presumed meningitis hospitalisations but no deaths (Table 3). The age-specific notification rate closely matched the age-specific H. influenzae meningitis hospitalisation rate (Figure 2).

S12 CDI Vol 31 Supplement 2007
Vaccine preventable diseases and vaccination coverage in Australia, 2003 to 2005
Figure 1. Haemophilus influenzae type b notifications and Haemophilus meningitis hospitalisations for all ages, Australia, 1993 to 2005,* by month of diagnosis or admission
0
10
20
30
40
50
60
Jan1993
Jan1994
Jan1995
Jan1996
Jan1997
Jan1998
Jan1999
Jan2000
Jan2001
Jan2002
Jan2003
Jan2004
Jan2005
Year
Num
ber
NotificationsHospitalisations
* Notifi cations where the month of diagnosis was between January 1993 and December 2005; hospitalisations where the month of admission was between 1 July 1993 and 30 June 2005.
Figure 2. Haemophilus influenzae type b notification and Haemophilus meningitis hospitalisation rates, Australia, 2003 to 2005,* by age at admission
0.0
0.1
0.2
0.3
0.4
0.5
0.6
0.7
0.8
0.9
1.0
0-4
5-9
10-1
4
15-1
9
20-2
4
25-2
9
30-3
4
35-3
9
40-4
4
45-4
9
50-5
4
55-5
9
60-6
4
65-6
9
70-7
4
75-7
9
80-8
4
≥85
Age group (years)
Rat
epe
r100
,000
popu
latio
n
Notification rate
Haemophilus influenzae meningitis hospitalisation rate
* Notifi cations where the month of diagnosis was between January 2003 and December 2005;hospitalisations where the month of admission was between 1 July 2003 and 30 June 2005.

CDI Vol 31 Supplement 2007 S13
Vaccine preventable diseases and vaccination coverage in Australia, 2003 to 2005
Table 3. Haemophilus influenzae type b (Hib) notifications, Hib meningitis hospitalisations and deaths, Australia, 2002 to 2005,* by age group
Age group(years)
Notifi cations3 years
(2003–2005)
Hospitalisations3 years
(July 2002–June 2005)
LOS† per admission
(days)
Deaths2 years
(2003–2004)n Rate‡ n n(§) Rate‡ Rate‡(§) Median(§) n Rate‡
0–4 23 0.61 35 26 0.92 0.68 10.0 (10.0) 0 0.005–14 8 0.10 4 4 0.05 0.05 8.5 (8.5) 0 0.00
15–24 1 0.01 3 1 0.04 0.01 n.p. 0 0.0025–59 9 0.03 4 3 0.01 0.01 16.5 (19.0) 0 0.00
60+ 10 0.09 11 9 0.11 0.09 15.0 (15.0) 1 0.01All ages 51 0.08 57 43 0.10 0.07 11.0 (11.0) 1 0.003
* Notifi cations where the month of diagnosis was between January 2003 and December 2005; hospitalisations where the month of separation was between 1 July 2002 and 30 June 2005; deaths where the death was recorded in 2003 or 2004.
† LOS = length of stay in hospital.
‡ Average annual age-specifi c rate per 100,000 population.
§ Principal diagnosis (hospitalisations).
n.p. Not published due to small cell sizes.
Since 1993, all measures of invasive Hib disease in children aged 0–4 years, who had the highest disease incidence prior to the introduction of vaccination (and are the most highly immunised), have progres-sively fallen, though less steeply in recent years (Figure 3). In this age group, the average number of annual notified cases has decreased from approximately 27 in the late 1990s to approximately 10 between 2000 and 2002 to approximately 7 between 2003 and 2005. Six deaths were recorded in this age group in 1993 but none since 1999.
Vaccination statusCompletion of the vaccination status field was expected for all notifications of Hib born after 31/12/1987 in NNDSS during 2003–2005. Overall, 94% of 31 cases had this field completed for this period. Of 20 cases classified as fully (n=10) or partially vaccinated (n=5), vaccination was validated from the Australian Childhood Immunisation Register or written records in 12/20 (60%). Among 14 cases 1–7 years of age notified between 2003 and 2005, nine (64%) were not vaccinated.
Geographical variationAs in previous years, there was little variation in notification and hospitalisation rates between the states and territories, except for the Northern Territory, where notification rates were substantially higher than other jurisdictions, but the absolute number of cases was small (Appendices 2 and 3).
CommentThis report is the first in the series of NCIRS vaccine preventable diseases reports to exclude hospitalisations recorded as epiglottitis from presentation as a measure of Hib disease. This is because a review of hospitalisations coded as epiglottitis in Sydney from 1998 to 2000 showed none of these hospitalisations had Hib isolated from a sterile site, with one due to Streptococcus pneumoniae and a substantial proportion (32%) of incorrect coding.30 Hospitalisation data now includes meningitis only, although as serotype-specific hospitalisation data are still not available, these cases, even when Haemophilus meningitis is the primary diagnosis, could be due to other serotypes.
In 2000, a new Hib immunisation schedule began in Australia with all children receiving PRP-OMP vaccine at 2 and 4 months of age, with a booster at 12 months of age. In this review period, vaccination status data are available for the first time and indicate that, consistent with the very high immunisation coverage reported for Hib vaccine, approaching 95%, the majority of confirmed Hib cases are occur-ring in unimmunised children. This is consistent with high vaccine effectiveness but also indicates that unimmunised children remain at risk of severe disease despite population herd immunity. Further, there is no evidence of any increase in Hib cases in older age groups, although the first cohort of children eligi-ble to receive Hib vaccine are now approaching 20 years of age. Incidence of Hib may not decrease much

S14 CDI Vol 31 Supplement 2007
Vaccine preventable diseases and vaccination coverage in Australia, 2003 to 2005
more than the very low incidence now reached, as it is consistent with the lowest disease rates reported internationally,62,63 and in contrast to the increase in Hib cases seen in the United Kingdom where three doses of Hib vaccine were scheduled at 2, 3 and 4 months of age with no later booster.64 The rarity of invasive Hib disease emphasises the importance of laboratory confirmation of all suspected cases, ideally by typing with polymerase chain reaction (PCR) in a reference laboratory.
Figure 3. Haemophilus influenzae type b notification and ‘presumed invasive Haemophilus influenzae type b’ hospitalisation rates and numbers of deaths* for children aged 0–4 years, Australia, 1993 to 2005†
0
5
10
15
20
25
1993 1994 1995 1996 1997 1998 1999 2000 2001 2002 2003 2004 2005
Year
Rat
epe
r100
,000
popu
latio
n
0
5
10
15
20
25
Num
bero
fdea
ths
Deaths
Notification rate
Hospitalisation rate
* Hospitalisation and deaths include those for Haemophilus meningitis for the period up to 30 June 2005 (hospitalisations) and 31 December 2004 (deaths).
† Notifi cations where the month of diagnosis was between January 1993 and December 2005;hospitalisations where the month of separation was between 1 July 1993 and 30 June 2005; deaths where the death was recorded between January 1993 and December 2004.

CDI Vol 31 Supplement 2007 S15
Vaccine preventable diseases and vaccination coverage in Australia, 2003 to 2005
Hepatitis A
Acute infection with the hepatitis A virus (HAV), a picornavirus, presents a clinical spectrum from malaise and diarrhoea to acute hepatitis with jaundice to fulminant liver failure. Onset of symptoms is usually abrupt with fever, anorexia, malaise, nausea and abdominal discomfort followed by jaundice and dark urine.44 The single most important factor in determining the clinical presentation and outcome of HAV infection is age. Whilst only 10% to 50% of infections acquired before the age of 5 years are symptomatic, 70% to 95% of infected adults will show symptoms.43
Secular trendsThere were 1,075 hepatitis A notifications in the period January 2003 to December 2005 (average annual notification rate 1.8 per 100,000) (Table 4). A median of 27 cases (range 18–56) were notified per month. There were 755 hospitalisations (average annual hospitalisation rate 1.3 per 100,000) with a median of 20 admissions (range 10–36) per month.
Notification and hospitalisation rates continued to decline from 2003 to 2005 (Figure 4).These were the lowest levels recorded since national data have been collated on NNDSS from 1991 and hospitalisations from 1993, following large point-source and community epidemics in the 1990s.
Severe morbidity and mortalityIn the review period July 2002 to June 2005, there were 4,557 hospital bed days (average 1,519 per year) recorded for patients with an ICD-10-AM code for hepatitis A. Hepatitis A was the principal diagnosis in 49% of hospitalisations where hepatitis A was recorded (371 cases, average annual rate 0.6 per 100,000). This proportion was highest in those aged 0–4 years (88%), decreasing with increasing age to 24% in those aged 60 years and over. In this age group, more than 50% of hospitalisations had a principal diag-nosis that was unlikely to be associated with hepatitis A infection, such as cancer, respiratory, ocular, or cardiac conditions or fractures. The median length of stay was longer for those aged 60 years and over than for younger age groups (Table 4). Hepatitis A with hepatic coma (ICD-10-AM B15.0) was recorded for six hospital admissions, one aged less than five years.
In 2003 to 2004, hepatitis A was recorded as the underlying cause of four deaths, all in people aged over 70 years. One of the cases notified to NNDSS between 2003 and 2005 was reported to have died from hepatitis A.
Age and sex distributionThe overall male to female ratio was 1.4:1 for notifications and 1.2:1 for hospitalisations. Three of four reported deaths were in females. The sex ratio was highest in those aged less than five years (notifications 2.5, hospitalisations 2.3) and lowest in those aged five to 24 years (1.2 and 0.9, respectively).
Case defi nitions
See Appendix 6 for pre-2004 defi nition
National defi nition from January 2004:11
a) Detection of anti-hepatitis A virus IgM antibody, in the absence of recent vaccination;
or
b) Detection of hepatitis A virus by nucleic acid testing;
or
c) Clinical hepatitis (jaundice and/or bilirubin in urine) without a non-infectious cause and an epidemiological link to a laboratory-confi rmed case.
Hospitalisations and deaths
The ICD-10-AM/ICD-10 codes B15 (hepatitis A) were used to identify hospitalisations and deaths.

S16 CDI Vol 31 Supplement 2007
Vaccine preventable diseases and vaccination coverage in Australia, 2003 to 2005
Notification and hospitalisation rates for all age and sex groups continued to fall compared with previous years (Figures 5 and 6). The previously high rates in males aged 15–34 years declined so that from 2003 to 2005 the highest notification rate occurred among males and females aged 0–14 years (average annual rate, 2.7 per 100,000), while the highest hospitalisation rates occurred in two age groups: males aged 34–59 years and males and females aged 60 years and over (average annual rates of 1.7 per 100,000).
Notification rates tended to decrease with increasing age, while the reverse was true for hospitalisation rates. The 5–14 year age group had the highest notification rate and the lowest hospitalisation rate. Those aged 60 years and over had the lowest notification rate and the highest hospitalisation rate, and there were nearly twice as many reported hospitalisations with hepatitis A than there were notified cases in that age group.
Table 4. Hepatitis A notifications, hospitalisations and deaths, Australia, 2002 to 2005,* by age group
Age group(years)
Notifi cations3 years
(2003–2005)
Hospitalisations3 years
(July 2002–June 2005)
LOS† per admission
(days)
Deaths2 years
(2003–2004)n Rate‡ n (§) Rate‡ (§) Median (§) n Rate‡
0–4 94 2.5 27 (24) 0.7 (0.6) 3.0 (3.5) 0 05–14 222 2.7 47 (43) 0.6 (0.5) 2.0 (2.0) 0 0
15–24 191 2.3 90 (60) 1.1 (0.7) 3.0 (3.0) 0 025–59 475 1.6 421 (203) 1.4 (0.7) 3.0 (3.0) 0 0
60+ 93 0.9 170 (41) 1.7 (0.4) 6.0 (6.0) 4 0.06All ages 1,075 1.8 755 (371) 1.3 (0.6) 3.0 (3.0) 4 0.01
* Notifi cations where the month of diagnosis was between January 2003 and December 2005; hospitalisations where the month of separation was between 1 July 2002 and 30 June 2005; deaths where the death was recorded in 2003 or 2004.
† LOS = length of stay in hospital.
‡ Average annual age-specifi c rate per 100,000 population.
§ Principal diagnosis.
Figure 4. Hepatitis A notifications and hospitalisations, Australia, 1993 to 2005,* by month of diagnosis or admission
0
100
200
300
400
500
600
700
800
Jan1993
Jan1994
Jan1995
Jan1996
Jan1997
Jan1998
Jan1999
Jan2000
Jan2001
Jan2002
Jan2003
Jan2004
Jan2005
Year
Num
ber
Notifications
Hospitalisations
* Notifi cations where the month of diagnosis was between January 1993 and December 2005; hospitalisations where the month of admission was between 1 July 1993 and 30 June 2005

CDI Vol 31 Supplement 2007 S17
Vaccine preventable diseases and vaccination coverage in Australia, 2003 to 2005
Figure 5. Hepatitis A notification rates, Australia, 1993 to 2005,* by age group, sex and year of diagnosis
0
5
10
15
20
25
30
35
1993 1994 1995 1996 1997 1998 1999 2000 2001 2002 2003 2004 2005
Year of diagnosis
Not
ifica
tions
per1
00,0
00po
pula
tion
Male, Female, 0-14 yrs
Males, 15-34 yrs
Females, 15-34 yrs
Males, 35-59 yrs
Females, 35-59 yrs
Male, Female, 60+ yrs
* Notifi cations where the month of diagnosis was between January 1993 and December 2005.
Figure 6. Hepatitis A hospitalisation rates, Australia, 1993 to 2005,* by age group, sex and year of separation
0
1
2
3
4
5
6
7
8
9
1993/1994 1995/1996 1997/1998 1999/2000 2001/2002 2003/2004
Year of separation
Hos
pita
lisat
ions
per1
00,0
00po
pula
tion Males, Females, 0-14 yrs
Males, 15-34 yrsFemales, 15-34 yrsMales 35-59 yrsFemales, 35-59 yrsMales, Females, 60+ yrs
* Hospitalisations where the month of separation was between 1 July 1993 and 30 June 2005.

S18 CDI Vol 31 Supplement 2007
Vaccine preventable diseases and vaccination coverage in Australia, 2003 to 2005
Geographical distributionThe highest rates were reported from the Northern Territory (average annual rates 20 per 100,000 for notifications and 8 per 100,000 for hospitalisations, Appendices 2 and 3). The jurisdiction with the next highest rates was Western Australia with 3.5 for notifications and 1.5 for hospitalisations, and there was comparatively little difference between the other jurisdictions, which ranged from 0.7 to 1.7 for notifica-tions and 0.7 to 1.4 for hospitalisations (Appendices 2 and 3). There were no clear trends over time in any jurisdiction in the last three years of data.
Vaccination statusVaccination status was reported for 244 (23%) of the 1,075 notifications on NNDSS from 2003 to 2005. Three of those were recorded as fully vaccinated, all adults, and there was no information on whether these were verified by written records or what the length of time was between vaccination and disease.
CommentIn Australia, as in other industrialised countries, hepatitis A occurs sporadically with periodic epidemic peaks related to point-source and community-wide outbreaks. The overall patterns are evident in hepa-titis A notification and hospitalisation rates over the 13 years 1993–2005. Peaks in total hepatitis cases during the 1990s were due to a large outbreak associated with consumption of contaminated oysters in February 199765 and large community-wide epidemics mainly among men who have sex with men and injecting drug users.66–69 The decline following these large outbreaks may have been due to a combina-tion of a reduction in the number of people in high-risk groups who were susceptible to hepatitis A virus infection, and the promotion by local health authorities of vaccination and improved hygiene in target groups.66 Notification and hospitalisation rates remained low during the last three years, with minor peaks associated with two outbreaks in Alice Springs – a food-borne outbreak in 2003 at an interstate gathering,70 and a community outbreak in 2005 for which no source was identified.71
Infection in the elderly has been reported as much more likely to lead to hospitalisation with hepatitis A as the principal cause, to involve complications or to result in death, compared with that in younger adults.72,73 However, the low proportion of hospitalisations in the elderly with hepatitis A as the prin-cipal diagnosis (24%) in these data suggests caution in interpreting hospitalisations with hepatitis A as a contributing cause in this age group. The majority of hospitalisations in this age group had principal causes unlikely to be related to hepatitis A, and, therefore, may reflect the high prevalence of co-morbidi-ties in the elderly and incidental hepatitis A infection. A recent report from the USA of false positive IgM anti-hepatitis A virus tests in those without clinical hepatitis found this to be particularly common in the elderly.74 The contrastingly high proportion with a principal diagnosis in young children (88%) emphasises that hepatitis A infection, although regarded as usually asymptomatic in young children, can require hospitalisation. The total number of hospitalisations recorded here was 70% of the total notifications for a similar period. A US study has estimated that 13% of cases resulted in hospitalisation,72 suggesting substantial under-notification of hepatitis A in Australia over this period.
The most commonly reported risk exposures for notified hepatitis A cases in recent years have been travel to countries where hepatitis A is endemic, household contact with a case and attendance at child care centres.12,13,75 Others at higher risk include sewage workers, men who have sex with men, injecting drug users and Indigenous Australians.76
The epidemiology of hepatitis A differs significantly for the Indigenous population, where it has been endemic. Among non-Indigenous Australians, as in other developed countries, adolescents and young adults have a lower seroprevalence than older adults.68 In contrast, hospitalisation and notification rates are higher among Indigenous Australians, with rates in Indigenous children aged less than five years over twenty times as high as those of non-Indigenous children in the same age group.77 The rate of hos-pitalisation is likely to be underestimated due to the known under-identification of Indigenous people in the hospitalisation data. This greater disease burden in Indigenous children has been particularly pronounced in more remote areas.67,78,79 During 1999–2002, there were three deaths due to hepatitis A among children aged less than five years; all were Indigenous.67,77

CDI Vol 31 Supplement 2007 S19
Vaccine preventable diseases and vaccination coverage in Australia, 2003 to 2005
Hepatitis A vaccines are effective in preventing disease in individuals76 and in controlling outbreaks in some settings.76,80 In Australia, vaccination is recommended for selected at-risk groups and occupations.76 In 1999, an immunisation program commenced for Indigenous children aged 18 months to 6 years living in north Queensland. Data indicate that this program has had a significant impact on reducing hepatitis A across the community.81 This was expanded in 2005 to include all Indigenous children aged 12 to 24 months in the Northern Territory, Queensland, South Australia and Western Australia.82 In the United States, hepatitis A cases decreased substantially following the recommendation of vaccination of children in communities with high rates of disease in 1996, and for states and counties with high hepa-titis A notification rates in 1999. In 2006, this was expanded to include all US infants, as part of a staged implementation of progressively expanded vaccination.83 Continued monitoring should be a priority in Australia, both to assess the impact of these recent changes, and the need for any further expansion of vaccination.

S20 CDI Vol 31 Supplement 2007
Vaccine preventable diseases and vaccination coverage in Australia, 2003 to 2005
Hepatitis B
The focus of this chapter is acute infection with hepatitis B virus (HBV), a hepadnavirus. It produces a range of conditions from subclinical infection to acute and, rarely, fulminant hepatitis. The majority of HBV infections are not clinically recognised, with less than 10% of children and 30%–50% of adults experiencing jaundice.44,84 When illness occurs, it is usually insidious, with anorexia, vague abdominal discomfort, nausea and vomiting, sometimes arthralgia and rash, often progressing to jaundice. The main burden of disease is related to chronic HBV infection. The risk of an acute infection becoming chronic varies inversely with age: chronic HBV infection occurs in about 90% of infants infected at birth, 20%–50% of children infected at 1–5 years of age, and about 1%–10% of persons infected as older children and adults.44 Of people chronically infected with HBV, 15%–40% develop cirrhosis of the liver and/or hepatocellular carcinoma.85,86
HBV transmission occurs by percutaneous or permucosal exposure to infective body fluids such as blood, semen, vaginal secretions and any other body fluid containing blood.44 Major modes of transmission include sexual or close household contact with an infected person, perinatal transmission from mother to infant, injecting drug use and nosocomial exposure.44 The summary below is restricted to acute hepa-titis B. Reviews of the burden of disease related to chronic hepatitis B infection in Australia have been published elsewhere.85,87–89
Case defi nitions
See Appendix 6 for pre-2004 defi nition
National defi nition* for newly acquired hepatitis B from January 2004:11
a) Detection of hepatitis B surface antigen (HBsAg) in a patient shown to be negative within the last 24 months; or
b) Detection of HBsAg and IgM to hepatitis B core antigen, in the absence of prior evidence of hepatitis B virus infection; or
c) Detection of hepatitis B virus by nucleic acid testing, and IgM to hepatitis B core antigen, in the absence of prior evidence of hepatitis B virus infection.
* Queensland implemented a consistent but less comprehensive defi nition for laboratory notifi cation in December 2005 for ‘Hepatitis B (acute)’: HBsAg positive AND Anti-HBc IgM positive. However the public heath protocol for notifi cation in Queensland accepts cases meeting the broader national case defi nitions for notifi cation.
Hospitalisations
The ICD-10-AM code used to identify hospitalisations was B16 (acute hepatitis B).
As in the previous reports, hospitalisations were included only where the relevant ICD code was the principal diagnosis.
Deaths
The ICD-10 code B16 (acute hepatitis B) was used to select deaths from acute hepatitis B.
Secular trendsIn the three years from January 2003 to December 2005, there were 874 notifications (average annual rate 1.5 per 100,000) with a median of 23.5 notifications per month (range 15–40) (Figure 7, Table 5). The peak notification rate was in the 20–29 year age group (average annual rate 3.9 per 100,000). From 2002/2003 to 2004/2005, acute hepatitis B was the principal diagnosis in 35% of all hospitalisations with acute hepatitis B. There were 517 hospitalisations with a principal diagnosis of acute hepatitis B (average annual rate 0.9 per 100,000) with a median of 13 hospitalisations per month (range 7–28). Nearly all (97% (507/521)) of these hospitalisations were coded as ‘acute hepatitis B without delta-agent and with-out hepatic coma’ (ICD-10-AM B16.9). The national notification rate had an upward trend between 1997 and 2001, peaked in 2001 at 2.2 per 100,000 and is now in continuing decline from 1.7 per 100,000 in 2003, to 1.4 per 100,000 in 2004 and down to 1.2 per 100,000 in 2005 (Appendix 2). Hospitalisations have generally declined since 1993/1994 and, since 1999/2000, seem to have stabilised at a national hos-pitalisation rate of 0.8 per 100,000 (Appendix 3).

CDI Vol 31 Supplement 2007 S21
Vaccine preventable diseases and vaccination coverage in Australia, 2003 to 2005
Table 5. Acute hepatitis B notifications, hospitalisations and deaths, Australia, 2002 to 2005,* by age group
Age group(years)
Notifi cations3 years
(2003–2005)
Hospitalisations†
3 years(July 2002–June 2005)
LOS‡ per admission
(days)
Deaths2 years
(2003–2004)n Rate§ n Rate§ Median n Rate§
0–4 6 0.2 0 0 0 0 05–14 16 0.2 12 0.2 1.5 0 0
15–24 229 2.8 98 1.2 3.0 0 025–59 586 2.0 360 1.2 3.0 8 0.04
60+ 37 0.4 47 0.5 7.0 14 0.2All ages 874 1.5 517 0.9 3.0 22 0.06
* Notifi cations where the month of diagnosis was between January 2003 and December 2005; hospitalisations where the month of separation was between 1 July 2002 and 30 June 2005; deaths where the death was recorded in 2003 or 2004.
† Hospitalisations with a principal diagnosis of acute hepatitis B.
‡ LOS = length of stay for hospitalisations with a principal diagnosis of acute hepatitis B.
§ Average annual age-specifi c rate per 100,000 population.
Severe morbidity and mortalityFor patients with a principal diagnosis of acute hepatitis B, 2,408 hospital bed days (914, 829 and 665 bed days in 2002/2003, 2003/2004 and 2004/2005, respectively) were recorded. The median length of stay was three days, with longer stays for adults aged 60 years and over (Table 5). There were 22 deaths from acute hepatitis B recorded in the two years 2003 to 2004, 17 in males and five in females. All of the deaths occurred in those aged 25 years and over, and nearly two thirds (14/22) were aged over 60 years, in whom
Figure 7. Acute hepatitis B notifications, and hospitalisations with a principal diagnosis of acute hepatitis B,* Australia, 1993 to 2005,† by month of diagnosis or admission
0
5
10
15
20
25
30
35
40
45
50
Jan1993
Jan1994
Jan1995
Jan1996
Jan1997
Jan1998
Jan1999
Jan2000
Jan2001
Jan2002
Jan2003
Jan2004
Jan2005
Year
Num
ber
Notifications
Hospitalisations
* Prior to July 1994, hospitalisations for acute hepatitis B could not be distinguished from hospitalisations for chronic hepatitis B infection.
† Notifi cations where the month of diagnosis was between January 1993 and December 2005; hospitalisations where the month of admission was between 1 July 1993 and 30 June 2005. Note that the number of jurisdictions notifying acute hepatitis B increased over the review period until 1996 when acute hepatitis B became notifi able in all states and territories. The Australian Capital Territory did not report in 1994 and Western Australia did not report in 1994 and 1995.

S22 CDI Vol 31 Supplement 2007
Vaccine preventable diseases and vaccination coverage in Australia, 2003 to 2005
nine of the fourteen were males. In 2003, there were twice as many deaths (15/22) as in 2004 (7/22). There were four cases of hepatic coma recorded among hospitalisations with a principal diagnosis of acute hepatitis B, with none of these cases recorded as having delta co-infection (Table 6). There were three deaths reported to NNDSS in notified cases between 2003 and 2005.
Table 6. Hepatic coma* in hospitalised cases with principal diagnosis of acute hepatitis B
Age group(years)
Hepatic coma†
n Hospitalisations (%) 0–4 0 0
5–14 0 015–24 0 025–59 2 0.6
60+ 2 4.3All ages 4 0.8
* Measured using National Hospital Morbidity data where the month of hospital separation was between 1 July 2002 and 30 June 2005.
† ICD-10-AM codes B16.0 and B16.2.
Age and sex distributionHistorically, notification rates have consistently been highest in young adults aged 15–19 years, 20–24 years and 25–29 years (Figure 8). Since 2001, notification rates in these three age groups have declined, par-ticularly in 15–19 year olds, where for the first time in 2005 rates fell below 1 per 100,000 to 0.8 per 100,000. Rates have remained fairly stable in the other age groups from 1993 to 2005. As in previous years, there were more male than female notifications in almost all age groups in 2003, 2004 and 2005, with an overall male:female ratio of 1.7:1.
During the period 2002/2003 to 2004/2005, rates for hospitalisations with a principal diagnosis of acute hepatitis B were highest in adults aged 25–29 years (1.9 per 100,000) and 20–24 years (1.8 per 100,000) (Figure 9). Like notifications, and as in previous years, hospitalisations occurred predominantly in males with an overall male:female ratio of 1.8:1.
Geographical distributionDuring the period 2003–2005, Victoria recorded the highest number of notifications (n=340; 39%), followed by New South Wales (n = 185; 21%). The Northern Territory had the highest average annual notification rate at 4.7 per 100,000. Victoria and Tasmania were next at 2.3 and 2.1 per 100,000, respec-tively, while rates were 1.8 per 100,000 or less in the other jurisdictions (Appendix 2). Rates in jurisdictions other than New South Wales, Queensland, South Australia, and Western Australia, declined between 2004 and 2005. (Appendix 2)
For the same period, Victoria also had the highest number of hospitalisations (n = 198; 198/517, 38%) followed by New South Wales (n = 148; 148/517, 29%).
Vaccination statusThere were six cases of acute hepatitis B in children aged 0–4 years notified between 2003 and 2005 and their vaccination status was recorded as “unknown” on NNDSS.
CommentThe national notification rate for newly acquired hepatitis B appears to have peaked in 2001 at 2.2 per 100,000, mirrored by corresponding peaks in incidence in the 15–24 year old age groups. The decrease in the national acute hepatitis B notification rate observed between 2003 and 2005 is largely confined to young adults aged 15–24 years, and, in particular, young adults aged 15–19 years. Notification rates in the latter group have fallen by 75%, from 3.1 per 100,000 in 2002 to 0.8 per 100,000 in 2005, while rates in 20–24 year olds have almost halved from 5.9 per 100,000 in 2002 to 3.1 per 100,000 in 2005. Rates

CDI Vol 31 Supplement 2007 S23
Vaccine preventable diseases and vaccination coverage in Australia, 2003 to 2005
of unspecified hepatitis B notificationsa in 2000–2004 have also fallen by nearly 50% in the 15–19 year old age group.12 This is important as this age group are not likely to meet NNDSS incident hepatitis B notification criteria (because development of a clinical illness consistent with acute viral hepatitis occurs
a Unspecifi ed hepatitis B notifi cations – detection of hepatitis B surface antigen or hepatitis B virus by nucleic acid testing in cases who do not meet any of the criteria for a newly acquired case.
Figure 8. Acute hepatitis B notification rates, Australia, 1993 to 2005,* by age group
0
1
2
3
4
5
6
7
8
9
1993 1994 1995 1996 1997 1998 1999 2000 2001 2002 2003 2004 2005
Year of diagnosis
Not
ifica
tions
per1
00,0
00po
pula
tion
0-14 years15-19 years20-24 years25-29 years30+ years
* Notifi cations where the month of diagnosis was between January 1993 and December 2005.
Figure 9. Acute hepatitis B hospitalisation rates, Australia, 2002/2003 to 2004/2005,* by age group and sex
0.0
0.5
1.0
1.5
2.0
2.5
0-4
5-9
10-1
4
15-1
9
20-2
4
25-2
9
30-3
4
35-3
9
40-4
4
45-4
9
50-5
4
55-5
9
60-6
4
65-6
9
70-7
4
75-7
9
80-8
4
≥85
Age group (years)
Hos
pita
lisat
ions
per1
00,0
00po
pula
tion
Males
Females
* Hospitalisations where the principal diagnosis was acute hepatitis B and the month of separation was between 1 July 2002 and 30 June 2005.

S24 CDI Vol 31 Supplement 2007
Vaccine preventable diseases and vaccination coverage in Australia, 2003 to 2005
infrequently and they are unlikely to meet “absence of prior evidence of hepatitis B virus infection” criteria). The downward trend in notifications is not likely to be due to under-reporting of notifications as rates in other age groups, under 14 years and over 25 years, have remained unchanged. The change in national notification case definitions for newly acquired hepatitis B in January 2004 to include absence of prior evidence of hepatitis B infection may have resulted in reduced notifications since 2004; however, there was a trend to reduced notifications prior to this change. In addition, notification rates increased or remained the same from 2004 to 2005 in New South Wales, South Australia, Western Australia and Queensland, despite the change in notification definitions in 2004. One potential reason for the consider-able reduction in notifications, particularly in 15–24 year olds, is the declining rates of intravenous drug use since 2000, consistent with trends in hepatitis C virus notifications.90 The first Australian children received hepatitis B vaccines as infants in the late 1980s. In a national serosurvey in 2002, the prevalence of hepatitis B surface antibody detection amongst those aged 12–17 years was 45.5%, suggesting that catch-up programs have had some impact (Helen Quinn, NCIRS, personal communication).
In the Northern Territory, hepatitis B vaccine has been routinely given at birth to Aboriginal and Torres Strait Islander infants since 1988, and to all infants since August 1990. In the rest of Australia, at-risk infants have been given hepatitis B vaccine since 1987 (except in South Australia, which began in 1996), while universal infant hepatitis B immunisation was introduced in May 2000. Since 1997, most juris-dictions (New South Wales 2004, Northern Territory 1998 (catch-up program only), Tasmania 1998, Victoria 1998, South Australia 1999, Western Australia 2002 and Australian Capital Territory 1999) have also implemented hepatitis B catch-up immunisation school-based programs for adolescents in school years 6, 7 or 8 (aged 11–14 years).91 The effect of this policy on the reported incidence of acute hepatitis B is not expected to become apparent until the first cohort of vaccinated infants, part of the universal program, reaches adolescence. In countries with a high burden of hepatitis B, such as Taiwan, universal hepatitis B vaccination programs have had a profound impact on the incidence of chronic infection and hepatocellular carcinoma.88,92,93
At both national and jurisdictional levels, notifications increased between 1993 and 2001 and since then have declined, while hospitalisations have remained steady since 1999. Overall, there were more hospitalisations than would be expected given the number of notifications and the epidemiology of the disease, as usually less than half of infections are clinically recognised. From 1999 to 2002, the notifica-tion rate was twice the hospitalisation rate. However, from 2003 to 2005, the ratio of notifications to hospitalisations fell to less than twofold higher.
The stabilisation in hospitalisations is likely to be a reflection of changes to coding practices, as well as misclassification of hospitalisations due to chronic infection as acute infection. In 1998/1999, ICD-10-AM, which can differentiate between acute and unspecified hepatitis B, replaced the four ICD-9-CM codes. These coding changes, more specific for acute HBV disease, are therefore likely to have been responsible for the initial reduction in hospitalisation rates from 1998/1999 and, once established, have led to the stabilisa-tion observed nationally since 1999/2000. Improved coding practices are also likely to be responsible for the significant decrease in deaths related to acute hepatitis B from an average 50 per year for the period 1993–1997 to a sustained number of approximately 10 per year since 2001. Misclassification is likely to still be a problem, as only one of the 22 deaths recorded for 2003 and 2004 had acute hepatitis B with hepatic coma (B16.0 or B16.2) as the underlying cause of death, when it would be expected to be more frequent for acute hepatitis B deaths. This is essentially unchanged from 2001 and 2002, when one out of 20 deaths had acute hepatitis B with hepatic coma. The age distribution of deaths (nearly two thirds over 60 years old) suggests that many of these cases may have been misclassified chronic HBV deaths.
The variation in notification rates between states and territories may be due to differences in surveillance methods, but could also be a real difference resulting from differences in the proportion of the popula-tion at increased risk of hepatitis B infection. The Australian Capital Territory and Victoria instituted enhanced surveillance of acute hepatitis B in January 2000 and July 2001, respectively, and this can be expected to influence notification rates in these jurisdictions. Enhanced surveillance was instituted in Victoria in 2001, for six months, due to recognition that an outbreak of acute hepatitis B infections was occurring in injecting drug users.94 This outbreak contributed to increased rates reported nationally in 200113 and has since ended.94
Only six cases of hepatitis B were notified to NNDSS for children born after 1 May 2000 (when universal infant hepatitis B vaccination commenced) and all had vaccination status recorded as “unknown”. As this cohort (born after 1 May 2000) ages and increases in size, reporting of vaccination status will become increasingly important. Reporting of cases according to age and vaccination status will add evidence to measure the impact of vaccination. Data on the longevity of immunity following infant vaccination in

CDI Vol 31 Supplement 2007 S25
Vaccine preventable diseases and vaccination coverage in Australia, 2003 to 2005
low endemic countries is sparse. After 2015, nearly all children will have received hepatitis B vaccines in infancy, and notification and hospitalisation rates in 15–19 year olds are likely to reflect the impact of the universal program, as well as the longevity of immunity.
Acute hepatitis B is only one measure of the burden of disease caused by HBV. The current prevalence of chronic HBV infection reflects historical transmission patterns and, in the longer term, the impact of immunisation policies will be reflected in trends in chronic infection and its complications, such as liver cirrhosis and hepatocellular carcinoma, as seen in Taiwan.87,88,95 The recent reduction in hepatitis B notifications, particularly among the 15–24 year olds, may be due to declining intravenous drug use, as has also been seen in hepatitis C notifications. It is likely that the impact of both the targeted infant and catch-up adolescent vaccination programs will become more evident in the next 5–10 years.

S26 CDI Vol 31 Supplement 2007
Vaccine preventable diseases and vaccination coverage in Australia, 2003 to 2005
Influenza
Influenza causes annual epidemics of respiratory disease often indistinguishable clinically from disease caused by other respiratory viruses. Symptoms include abrupt onset of fever, cough, malaise, myalgia, sore throat, and headache. Influenza epidemics usually occur during the winter months in temperate climates, causing an increase in hospitalisations for pneumonia and exacerbation of chronic diseases and also contributing to increased mortality, particularly among the elderly and those with high risk underlying conditions. In tropical climates, influenza infection may have two annual peaks, as illustrated in the Northern Territory.96 Pandemics of influenza, occurring every 30 years or so, are caused by major antigenic shift. Antigenic drift, however, occurs more regularly, producing smaller epidemics.
Case defi nitions
Notifi cations
Laboratory-confi rmed infl uenza is a nationally notifi able disease in all jurisdictions except South Australia. Although infl uenza is not a notifi able disease in South Australia, laboratory reports are collected and sent to NNDSS. Implementation of infl uenza notifi cation occurred in all other jurisdictions, except Tasmania, during 2001.
Laboratory-confi rmed infections are those in which infl uenza virus is isolated by cell culture, detected by nucleic acid amplifi cation, or by infl uenza antigen testing, from appropriate respiratory tract specimens; a recent infection can also be demonstrated by serological methods.11
Hospitalisations
The ICD-10-AM codes used to identify hospitalisations were: J10 (infl uenza due to identifi ed infl uenza virus) and J11 (infl uenza, virus not identifi ed). In this report, we did not make the distinction between admissions where a virus was identifi ed and those where it was not.
Deaths
The ICD-10 codes used to identify deaths were: J10 (infl uenza due to identifi ed infl uenza virus) and J11 (infl uenza, virus not identifi ed).
Secular trendsIn the period January 2003 to December 2005, there were 10,185 notifications, giving an average annual rate of 16.9 per 100,000. Notifications varied considerably by year, with a high of 4,569 in 2005 and a low of 2,133 in 2004. There was a clear seasonal distribution of notifications in all three years with peaks in August-September in 2003, September in 2004 and June-September in 2005.
Between July 2002 and June 2005, there were 9,116 hospitalisations coded as influenza (an average annual rate of 15.3 per 100,000), with the greatest number of hospitalisations (3,956) recorded in 2003/04. There was a clear seasonal pattern, with dramatic increases over the winter months (Figure 10). The median number of admissions per month was 107 (range 47–1,515) with the highest number (973; 1,515 and 446) occurring in July 2002, August 2003 and September 2004, respectively.
Severe morbidity and mortalityA total of 56,955 hospital bed days with an ICD-10-AM code for influenza were recorded over the report-ing period. The median length of stay was at least twice as long in the oldest age group (five days among people aged 60 years or over) than in the younger age groups (Table 7). Influenza was the principal diagnosis for 68% of the hospitalisations. Bed days peaked in 2003/2004 (n=24,156).
From 1 January 2003 to 31 December 2004, influenza was recorded on the death certificate as the underlying cause of death in 101 cases. Of these, 85 (84%) were aged 60 years or more, four (4%) were aged 25–59 years and five (5%) were aged 0–4 years. Deaths officially designated as due to influenza are known to be a gross underestimate of the true number of deaths attributable to influenza in the population.97 Although there is no requirement for clinical information to be entered onto NNDSS for influenza cases, 13 deaths were recorded on NNDSS in influenza notifications 2003–2005; two deaths were recorded in children (age range for deaths in notified cases 1–89 years, median 69 years).

CDI Vol 31 Supplement 2007 S27
Vaccine preventable diseases and vaccination coverage in Australia, 2003 to 2005
Table 7. Influenza notifications, hospitalisations and deaths, Australia, 2002 to 2005,* by age group
Age group(years)
Notifi cations3 years
(2003–2005)
Hospitalisations3 years
(July 2002–June 2005)
LOS† per admission
(days)
Deaths2 years
(2003–2004)n Rate‡ n (§) Rate‡ (§) Median(§) n Rate‡
0–4 3,173 83.7 3,116 (2,458) 82.1 (64.7) 2.0 (2.0) 5 0.205–14 1,125 13.8 731 (544) 9.0 (6.7) 2.0 (2.0) 5 0.09
15–24 1,157 13.9 727 (488) 8.9 (6.0) 1.0 (1.0) 2 0.0425–59 2,994 10.2 2,499 (1,542) 8.6 (5.3) 2.0 (2.0) 4 0.02
60+ 1,724 16.4 2,043 (1,264) 19.9 (12.3) 5.0 (4.0) 85 1.23All ages|| 10,185 16.9 9,116 (6,296) 15.3 (10.6) 2.0 (2.0) 101 0.25
* Notifi cations where the month of diagnosis was between January 2003 and December 2005; hospitalisations where the month of separation was between 1 July 2002 and 30 June 2005; deaths where the date of death was recorded in 2003 or 2004.
† LOS = length of stay in hospital.
‡ Average annual age-specifi c rate per 100,000 population.
§ Principal diagnosis (hospitalisations).
|| Includes cases with unknown ages.
Age and sex distributionInfluenza notification rates vary markedly by age, with peak rates in those under five years of age (Figure 11). In this age group, the highest rates of notifications are in those under one year of age and the rate declines progressively thereafter. The overall male to female ratio was 1.08:1.
Among the age groups specified in Table 7, hospitalisation rates were highest in children aged under five years (82.1 per 100,000). Although overall hospitalisation rates were lower than those in 0–4 year olds, among people aged 60 years and over, the rates increased with increasing age, ranging from 12.2 per 100,000 for those aged 60–64 years to 37.3 per 100,000 for those aged 85 years or more (data not shown).
Figure 10. Influenza hospitalisations and notifications,* Australia, July 1993 to December 2005, by month of diagnosis or admission
0
200
400
600
800
1000
1200
1400
1600
1800
2000
Jan1993
Jan1994
Jan1995
Jan1996
Jan1997
Jan1998
Jan1999
Jan2000
Jan2001
Jan2002
Jan2003
Jan2004
Jan2005
Year
Num
ber
Notifications
Hospitalisations
* Notifi cations where the month of diagnosis was between January 2001 and December 2005; hospitalisations where the month of admission was between 1 July 1993 and 30 June 2005. Note that the Northern Territory, Queensland, Tasmania and Victoria did not notify infl uenza for the complete year in 2001.

S28 CDI Vol 31 Supplement 2007
Vaccine preventable diseases and vaccination coverage in Australia, 2003 to 2005
Among children aged less than five years, the hospitalisation rates were highest among infants (annual average of 173 per 100,000 population aged less than one year, ranging from 97.2 per 100,000 in 2004/2005 to 261.8 per 100,000 in 2003/2004).
The overall male to female hospitalisation ratio was 0.92:1; however, this was not consistent across all age groups. In children under 10 years of age, male hospitalisations were more common (1.2:1).
Geographical distributionThere was a wide variation by state or territory in the average crude hospitalisation rate recorded for the three year review period, ranging from 3.5 per 100,000 (n = 34) in the Australian Capital Territory to 30.0 per 100,000 in the Northern Territory (n = 179) (Appendix 3). Notification rates were similarly varied, with the highest rates reported in the Northern Territory and Queensland (41.8 and 27.5 per 100,000 population, respectively) and the lowest in Tasmania and the Australian Capital Territory (2.0 per 100,000 and 4.8 per 100,000, respectively) (Appendix 2).
In regard to annual hospitalisation rates, the distribution by state or territory was generally consistent with the national pattern, with the highest rates occurring in 2003/2004 in all states except Queensland, while the lowest rates occurred in 2004/2005 in all states except the Australian Capital Territory. Historically, the winter of 1997 remains the period between 1993/1994 and 2004/2005 during which most states and territories recorded the highest number of hospitalisations.
Influenza type and subtypingAlmost all of the influenza notifications reported to NNDSS (98%) recorded influenza type. Most of these were type A (n=8,284; 83%). A further 1,586 cases (16%) were recorded as type B and both A and B were documented in 91 notifications (1%). Subtype or strain information was recorded for 12.4% of notifications (n=1,267). Ninety-five per cent of subtyped influenza A was H3 and 5% was H1. Subtype information was only recorded on NNDSS from some notifications of influenza isolates received in Victoria, New South Wales, Queensland and the Northern Territory, with Queensland and Victoria reporting most of the notifications where subtyping was documented.
Figure 11. Influenza notification rates 2003 to 2005 and hospitalisation rates 2002/2003 to 2004/2005, Australia,* by age group
0
10
20
30
40
50
60
70
80
90
0-4
5-9
10-1
4
15-1
9
20-2
4
25-2
9
30-3
4
35-3
9
40-4
4
45-4
9
50-5
4
55-5
9
60-6
4
65-6
9
70-7
4
75-7
9
80-8
4
≥85
Age (years)
Rat
epe
r100
,000
popu
latio
n
Notifications
Hospitalisations
0
20
40
60
80
100
120
140
160
180
0 1 2 3 4
Age (years)
Rat
epe
r100
,000
popu
latio
n
* Hospitalisations where the month of separation was between 1 July 2002 and 30 June 2005.

CDI Vol 31 Supplement 2007 S29
Vaccine preventable diseases and vaccination coverage in Australia, 2003 to 2005
CommentBoth laboratory notifications and hospitalisations show a similar seasonal pattern. There is a strikingly higher notification and hospitalisation rate in children under one year or age, compared with even the extremely elderly. This is likely to reflect patterns of health care use, and, in particular, diagnostic testing for respiratory viruses, in this age group.
On the other hand, the role of influenza in exacerbating chronic cardiac and respiratory diseases in the elderly may not be adequately reflected in these surveillance data. Deaths and hospitalisations coded as influenza are widely acknowledged to underestimate deaths and hospitalisations due to influenza.97–100 The proportion of deaths due to influenza occurring in people aged 60 years and over (84%) is lower than most other published studies.101,102 This may be due to other contributing causes being preferentially coded, as deaths reported here are only those where influenza was recorded as the principal cause, or to lower rates of virological testing in the elderly age group in Australia in comparison to elsewhere.
It should be noted that there is no specialised diagnostic influenza laboratory in Tasmania or the Northern Territory, with specimens positive on direct fluorescent antibody testing referred interstate. Hospitalisation data referred to in this report are based on discharge coding and it is possible that some of those with less specific influenza codes (e.g. J11) may be due to other respiratory pathogens such as respiratory syncytial virus (RSV),103 coronavirus104 or picornavirus.105,106 The apparent differences in hospitalisation rates between states and territories should be treated with caution as they may reflect differences in coding practices or rates of virological testing of inpatients between jurisdictions.
Both influenza A and B are well known to cause major epidemics of respiratory disease resulting in severe morbidity and mortality. In 2003, the predominant influenza isolate was influenza A (94%), with a majority of the A (99%) being H3 subtypes. Ninety-eight per cent of these were A/Fujian/411/2002 (H3N2) which had shown a significant antigenic drift. The 2003 Australian influenza vaccine con-tained A/Panama/2007/99, which induced two– to fourfold lower antibody response against the drifted strain.107 An A/Fujian/411/2002 (H3N2)-like virus was incorporated in the Australian influenza vaccine for 2004.
In 2004, influenza A was again predominant (76.9%) but with increased influenza B activity compared to the previous season. Of the record low number of viable influenza isolates received (n=454), 98% of type A isolates were H3N2, which showed further antigenic drift, with one third of the isolates distin-guishable from the A/Fujian/411/2002-like reference strain.108
In 2005, influenza A remained the predominant type notified (73%), with further increased influenza B activity. Antigenic analysis of 1,174 samples demonstrated that 689 (58.7%) were H3N2, 210 were A H1N1 (17%), and 275 (23.4%) were B viruses.109
Annual influenza vaccination is currently recommended as the primary method of influenza prevention in people aged 65 years and over, all Indigenous people aged 50 years and over, and all individuals aged 6 months and over with chronic medical conditions likely to be exacerbated by influenza or its com-plications, e.g. chronic pulmonary or cardiovascular disease.76 Vaccination uptake in Australians aged 65 years and over was estimated at 76.9% and 79.1% for 2003110 and 2004,111 respectively. Extension of influenza vaccination to all adult Indigenous people should be considered as both influenza hospitalisa-tion rates and mortality related to influenza and pneumonia are twice that documented in persons of non-Indigenous background across all age groups.77 Influenza vaccination is also encouraged in health care workers and carers of people with high-risk conditions76 as carer vaccination has been shown to reduce morbidity and mortality in those with high-risk conditions.112
As for the paediatric population, in 2003 the USA Advisory Committee on Immunization Practices (ACIP), recommended routine influenza vaccination113,114 of healthy American children aged 6–23 months based on the high burden of illness.99,115,116 More recently, in 2006, the ACIP extended its recommendation to include children up to the age of five years.117 Whilst available Australian data suggest a similar significant burden of illness in young children,118,119 examination of cost-effectiveness, efficacy and feasibility of universal immu-nisation of healthy children is required before implementing such a population level strategy.120

S30 CDI Vol 31 Supplement 2007
Vaccine preventable diseases and vaccination coverage in Australia, 2003 to 2005
There is increasing concern regarding the likelihood of an influenza pandemic with the ongoing pres-ence of H5N1 avian influenza in Asia and more recent spread to Europe and Africa.121 Studies of H5N1 vaccines are beginning to show reassuring immunogenicity even in children and the elderly. Other control measures, such as enhanced infection control (handwashing, quarantine, cohorting), will be especially important early on should a pandemic arise as vaccine production will take some months. Furthermore, achieving high coverage now against seasonal influenza could usefully increase local production capacity of influenza vaccine through increased demand which could speed a switch of production to a pandemic vaccine.122–125

CDI Vol 31 Supplement 2007 S31
Vaccine preventable diseases and vaccination coverage in Australia, 2003 to 2005
Measles
Measles is an acute and highly communicable disease caused by a morbillivirus. The clinical picture pri-marily includes prodromal fever and Koplik spots on the buccal mucosa, rash, and often conjunctivitis, coryza, and cough. Complications include otitis media, pneumonia and encephalitis. Subacute scleros-ing panencephalitis (SSPE) occurs very rarely as a late sequel of wild infection but not vaccination.44
Case defi nitions
See Appendix 6 for pre-2004 defi nition
National defi nition from January 2004:11
a) Isolation of measles virus (confi rmed case); or
b) Detection of measles virus by nucleic acid testing (confi rmed case); or
c) Detection of measles virus antigen (confi rmed case); or
d) Measles virus-specifi c IgG seroconversion or signifi cant increase in IgG antibody level or a fourfold or greater rise in antibody titre to measles virus, with paired sera tested in parallel and in the absence of receipt of measles containing vaccine eight days to eight weeks prior to testing (confi rmed case); or
e) Detection of measles virus-specifi c IgM antibody confi rmed in an approved reference laboratory, in the absence of recent measles containing vaccination (confi rmed case); or
f) A clinical illness characterised by a generalised maculopapular rash lasting at least three days, fever of at least 38°C at the time of rash onset and either cough, coryza, conjunctivitis or Koplik spots, together with an epidemiological link to a confi rmed case (confi rmed case); or
g) A clinical illness as in point (f) above, together with detection of measles-specifi c IgM antibody other than by an approved reference laboratory (in the absence of recent measles-containing vaccination) (probable case).
Hospitalisations and deaths
The ICD-10-AM/ICD-10 code B05 (measles) was used to identify hospitalisations and deaths. SSPE was not included in these analyses.
Secular trendsIn the three year review period, there were 148 notified cases of measles, an average annual notification rate of 0.25 per 100,000 (Table 8). The number of measles notifications progressively decreased from 2003 (n=93) to 2004 (n=45), and in 2005 to the lowest on record (n=10). The median number of notifica-tions per month was two (range 0–15).
In the period 2002/2003 to 2004/2005, there were 94 hospitalisations with the ICD-10-AM code B05 (measles). This equates to an average annual hospitalisation rate of 0.16 per 100,000. Since a decline in the mid-1990s, annual hospitalisation rates have been fluctuating at a low level, and in 2004/2005 were the lowest on record with only 23 separations, a rate of 0.11 per 100,000. The highest rates of hospitalisations were in the 0–4 and 20–35 year age groups. There were two peaks in the number of monthly hospitalisations during the review period, one in May 2003 (n=7), the other in October of 2003 (n=7) (Figure 12). The median number of hospitalisations per month was two (range 0–7).
Severe morbidity and mortalityIn the three year review period, hospital separations for measles accounted for 375 hospital bed days. The median length of stay (LOS) was two days, with the highest median LOS (4.5) in the 60 years and over age group (Table 8). Of the 94 hospitalisations, 72 (77%) had measles recorded as the principal diagnosis. Complications arising from measles infection were recorded for 20 (21%) separations. There was one hospitalisation coded as having otitis media, one with neurological (encephalitis or meningitis) complications, six (6%) as having pneumonia, none with intestinal complications, and 12 (13%) as hav-ing other complications (Table 9). Adults aged 15 years and over accounted for nine of the 12 (75%) hospitalisations coded with other complications.

S32 CDI Vol 31 Supplement 2007
Vaccine preventable diseases and vaccination coverage in Australia, 2003 to 2005
In 2004, there was one death recorded in the National Mortality database where the underlying cause was measles; it was coded as measles complicated by encephalitis. However, further investigation dem-onstrated that the death was miscoded and was actually a result of subacute sclerosing panencephalitis rather than acute measles encephalitis (Peter Markey, Northern Territory Department of Health and Community Services, personal communication).
Table 8. Measles notifications, hospitalisations and deaths, Australia, 2002 to 2005,* by age group
Age group(years)
Notifi cations3 years
(2003–2005)
Hospitalisations3 years
(July 2002–June 2005)
LOS† per admission
(days)
Deaths2 years
(2003–2004)n Rate‡ n (§) Rate‡ (§) Median (§) n Rate‡
0–4 23 0.61 37 (29) 0.97 (0.76) 2.0 (1.0) 0 0.05–14 13 0.16 2 (2) 0.02 (0.02) n.p. 0 0.0
15–24 42 0.51 19 (15) 0.23 (0.18) 2.0 (2.0) 0 0.025–59 70 0.24 32 (24) 0.11 (0.08) 3.0 (3.0) 0 0.0
60+ 0 0.00 4 (2) 0.04 (0.02) 4.5 (2.0) 0 0.0All ages 148 0.25 94 (72) 0.16 (0.12) 2.0 (2.0) 0 0.0
* Notifi cations where the month of diagnosis was between January 2003 and December 2005; hospitalisations where the month of separation was between 1 July 2002 and 30 June 2005; deaths where the death was recorded in 2003 or 2004.
† LOS = length of stay in hospital.
‡ Average annual age-specifi c rate per 100,000 population.
§ Principal diagnosis (hospitalisations).
n.p. Not published due to small cell size.
Figure 12. Measles notifications and hospitalisations, Australia, 1993 to 2005,* by month of diagnosis or admission
0
200
400
600
800
1000
1200Ja
n-93 Ju
lJa
n-94 Ju
lJa
n-95 Ju
lJa
n-96 Ju
lJa
n-97 Ju
lJa
n-98 Ju
lJa
n-99 Ju
lJa
n-00 Ju
lJa
n-01 Ju
lJa
n-02 Ju
lJa
n-03 Ju
lJa
n-04 Ju
lJa
n-05 Ju
l
Year
Num
ber
Notifications
Hospitalisations
0
10
20
30
40
50
60
70
Jan-
98 Jul
Jan-
99 Jul
Jan-
00 Jul
Jan-
01 Jul
Jan-
02 Jul
Jan-
03 Jul
Jan-
04 Jul
Jan-
05 Jul
Year
Num
ber
* Notifi cations where the month of diagnosis was between January 1993 and December 2005;hospitalisations where the month of admission was between 1 July 1993 and 30 June 2005.

CDI Vol 31 Supplement 2007 S33
Vaccine preventable diseases and vaccination coverage in Australia, 2003 to 2005
Table 9. Indicators of severe morbidity* for hospitalised cases of measles, Australia, 2002 to 2005,* by age group
Age group(years)
Measles encephalitis Measles pneumonian % total n % total
0–4 0 0.0 2 2.15–14 0 0.0 0 0.0
15–24 1 1.1 1 1.125–59 0 0.0 2 2.1
60+ 0 0.0 1 1.1All ages 1 1.1 6 6.4
* Measured using National Hospital Morbidity data where the month of hospital separation was between 1 July 2002 and 30 June 2005.
Age and sex distributionBy the end of the three year review period, notification rates for all age groups declined to their low-est recorded levels (Figure 13). Since 1999, there has been a decrease in measles notification rates in 0–12 month olds. Over the review period, notifications in this age group decreased from seven in 2003 to two in 2004 and zero in 2005. The notification rate for 20–34 year olds also decreased each year from 1.30 per 100,000 in 2003, to 0.70 per 100,000 in 2004 and was the lowest on record at 0.12 per 100,000 in 2005. For each year of the review period, the notification rate for the 20–34 year old age group was highest of all groups for the first time since the Measles Control Campaign (MCC) in 1998, followed by the 0–4 year age group which had the highest rates in previous reporting periods.
In 2005, hospitalisation rates were the lowest on record for the 0–4 (0.40 per 100,000), 5–9 (0.00 per 100,000) and 20–34 (0.21 per 100,000) year age groups. Hospitalisation rates for the 10–19 year and over 35 year age groups were higher at the end of the review period than at the beginning (Figure 14). Hospitalisation rates for the 0–4 year age group were consistently the highest of all age groups since reporting began. However, the rates of hospitalisation of 0–12 month olds decreased over the review period, from six in 2003 to zero in 2005 (data not shown).
Over the three year review period, there were more notifications for males than females (male:female ratio 1.5:1). There were also more hospitalisations of males than females (male:female ratio 1.4:1).
Geographical distributionThere were 93 measles notifications in 2003, of which 75 (81%) occurred in seven outbreaks.13 Five of the seven outbreaks are known to have begun with an imported measles case. There were 45 cases of measles notified in 2004, of which 21 (47%) occurred in six outbreaks.12 Four of the six outbreaks are known to have begun with imported measles cases. One of the 2004 outbreaks was an outbreak of measles in six Indigenous people in Western Australia, with no known link to a confirmed imported source case.12
The rate of notification over the reporting period was highest in the Northern Territory with 0.67 per 100,000 (n=4), followed by South Australia with 0.65 per 100,000 (n=30), more than twice the national rate (0.25 per 100,000). The increased notification rates in South Australia during the review period were largely due to one outbreak involving a returned traveller which began in August 2003 (n=21). The high notification rate in the Northern Territory was largely due to unrelated notifications in an overseas traveller and foreign tourists. All jurisdictions reported cases during the reporting period except the Australian Capital Territory (Appendix 2).
There was little variation between the rates of hospitalisation across the states and territories during the review period (0.1–0.2 per 100,000) (Appendix 3).
Victoria reported the highest percentage of notifications during the reporting period with 38% of cases (n=56). New South Wales reported the highest percentage of hospitalisations with 35% (n=33).

S34 CDI Vol 31 Supplement 2007
Vaccine preventable diseases and vaccination coverage in Australia, 2003 to 2005
Figure 14. Measles hospitalisation rates, Australia, 1998 to 2005,* by age group and year of separation
0
1
2
3
1998/1999 1999/2000 2000/2001 2001/2002 2002/2003 2003/2004 2004/2005
Year of separation
Hos
pita
lisat
ions
per1
00,0
00po
pula
tion 0-4 yrs
5-9 yrs
10-19 yrs
20-34 yrs
35+ yrs
* Hospitalisations where the date of separation was between 1 July 1998 and 30 June 2005.
Figure 13. Measles notification rates, Australia, 1999 to 2005,* by age group and year of diagnosis
0
1
2
3
4
5
6
7
1999 2000 2001 2002 2003 2004 2005
Year of diagnosis
Not
ifica
tions
per1
00,0
00po
pula
tion 0-4 Yrs
5-9 Yrs
10-19 Yrs
20-34 Yrs
35+ Yrs
* Notifi cations where the date of diagnosis was between January 1999 and December 2005.

CDI Vol 31 Supplement 2007 S35
Vaccine preventable diseases and vaccination coverage in Australia, 2003 to 2005
Measles typing and vaccination statusIn 2003, seven measles virus genotypes were identified by molecular analysis. The majority of these genotypes were associated with virus importations from countries in Southeast Asia and Japan (H1, D5, D8 and D9). Genotype D2 was also identified after importation from South Africa. The 2003 outbreak of measles in Central Northern Victoria was due to an imported measles strain, confirmed by the Victorian Infectious Diseases Reference Laboratory (VIDRL) as genotype H1. Molecular analysis enabled a second, overlapping outbreak in Melbourne, in which the primary case was a German traveller, to be distinguished from the rural outbreak by the identification of measles virus genotype D8 in clinical samples.126 In 2004, genotyping identified importations of D4 and D5 (from Thailand), D9 (Malaysia and Indonesia), G2 (Singapore) and G3 (Indonesia). Genotypes D4, H1 and G3 were also detected but the index cases were not identified, thus no source country could be identified. In 2005, genotypes D4 (India) and D5 (Thailand) were detected, as were genotypes D8, D9, G3 and H1, although no source country was identified for these latter genotypes. In each year of the reporting period, molecular analysis of clinical specimens was able to confirm cases of vaccine associated illness (genotype A).
Completion of the vaccination status field was expected in NNDSS during 2003–2005 for all measles notifications born after 31/12/1969. Overall, 72% of cases born after 31/12/1969 (97/135) had this field completed for this period. None of the 97 cases reported receipt of two or more vaccine doses. Ten were reported as fully vaccinated for age (with half of these cases aged over four years and reporting only one dose), 18 as partially vaccinated for age, and 65 were not vaccinated (with the four remaining cases aged under one year and unvaccinated, with vaccination status recorded as “not applicable”). Vaccination status was validated by written records in 50% of the cases reported to be fully vaccinated, 28% of partially vaccinated cases and 8% of unvaccinated cases.
CommentIn the three year review period covered by this report, measles notifications and hospitalisations continued to decline to new record lows. Measles accounted for only 10 notifications in 2005 and 23 hospitalisations in 2004/2005. The downward trend is similar to that seen in other countries with high vaccination cover-age, such as those of the Americas.127 Caution is needed in interpreting hospitalisation data presented from this review period, as highlighted by the zero notifications with four hospitalisations in the 60 years and over age group.
Where endemic measles has been eliminated, enhanced surveillance, including a high level of confirma-tion, is required and recommended by the WHO.128 By the end of this review period, a national case definition for measles requiring confirmation of all cases (either by laboratory tests or by linkage to a chain of transmission that includes a laboratory-confirmed case) had been adopted by all jurisdictions. The national case definition is more specific than previous jurisdictional case definitions, as notifications are no longer accepted based on clinical criteria alone, and the detection of measles virus-specific IgM antibody now requires confirmation in an approved reference laboratory. These changes are important for a country in the elimination phase and may have resulted in fewer notifications during the reporting period in states other than Victoria, where laboratory confirmation has been a requirement of notifica-tion since July 2001.
The current two-dose vaccination schedule began in 1998 following the mass vaccination of primary school aged children as part of the Measles Control Campaign (MCC).129 Progress towards elimina-tion of endemic measles in Australia has been underpinned by consistently high vaccination coverage with this schedule prior to school entry. As a result of these efforts, birth cohorts now aged 5–9 and 10–14 years have good coverage with two doses of MMR vaccine and notification rates in these age groups have reached record low levels; in the final year of the review period there was one notification and no hospitalisations from 5–14 year olds. Good vaccination coverage in these birth cohorts has also led to increased herd immunity and may explain why notification rates have remained low in children under 12 months of age (who are not targeted for vaccination).
In Australia, high vaccination coverage in children and reduced exposure to naturally circulating measles virus have left a residual cohort of susceptible young adults born in the 1970s and early 1980s, when measles vaccine was first introduced but coverage was low. Since the MCC, most outbreaks have involved a high proportion of young adults in this birth cohort. To improve immunity in this age group the young adult MMR vaccination campaign was conducted during 2001.129 In 2002, a serosurvey, conducted by the NCIRS to evaluate this targeted program, indicated that the proportion immune in the young adult

S36 CDI Vol 31 Supplement 2007
Vaccine preventable diseases and vaccination coverage in Australia, 2003 to 2005
birth cohort had not increased and that a relatively high proportion of targeted individuals remained susceptible.130 The notification rate for 20–34 year olds in this review period was the highest of all age groups for the first time since the MCC in 1998.
The USA has recently declared their elimination of endemic measles.131,132 The WHO Regional Committee for the Western Pacific determined 2012 as the target date for measles elimination in the Western Pacific region.133 Modelling, using Australian serosurvey data, suggests elimination may already have been achieved130,134 and, using estimates of vaccine uptake, the models predict endemic measles transmission will remain absent from Australia until at least 2012.130 Continued monitoring is, however, still required as different geographic regions within Australia were projected to exceed the epidemic threshold at different times if vaccination coverage remained at current levels.134
Australia, and other countries of the region which have already eliminated indigenous measles transmis-sion, remain at risk of measles importation from neighbouring countries where measles is still endemic. In Australia, the primary case of most recent measles outbreaks acquired their infection in another country and this is supported by molecular genotyping of clinical specimens or measles isolates from the resulting outbreaks.126,135 However, during the review period, there have been several outbreaks for which the source case has not been identified, including a measles outbreak amongst Indigenous people in Western Australia in 2004 (n=6). In summary, the young adult MMR vaccination program does not appear to have increased the proportion immune to measles in this age group and young adults account for a higher proportion of notified cases than ever before. Therefore, to maintain elimination in the longer term, additional efforts may be needed to target this cohort. The other age group most at risk are children aged 0–4 years who continue to have the second highest notification and the highest hospitalisa-tion rates of any age group. Therefore, high coverage with two doses, including better timeliness and completeness of childhood vaccinations among preschool children, should remain an important goal of Australia’s measles control strategy.

CDI Vol 31 Supplement 2007 S37
Vaccine preventable diseases and vaccination coverage in Australia, 2003 to 2005
Meningococcal disease
Meningococcal disease is defined as isolation of Neisseria meningitidis from cerebrospinal fluid (CSF), blood and other normally sterile sites as well as skin lesions. Clinical manifestations include meningitis, meningococcaemia without meningitis (which varies in presentation from fulminant to chronic), men-ingitis and meningococcaemia combined and septic arthritis. In culture-negative cases with a compatible clinical picture (such as fever, haemorrhagic rash and shock), a diagnosis of meningococcal disease can be supported by a range of other laboratory evidence. This includes the identification of Gram-negative intracellular diplococci or meningococcal antigen in blood or CSF, the identification of nucleic acid from Neisseria meningitidis in body fluids or demonstration of a serological response to Neisseria meningitidis.
Case defi nitions
See Appendix 6 for pre-2004 defi nition
National defi nition from January 2004:11
Confi rmed cases require either laboratory defi nitive evidence or laboratory suggestive evidence and clinical evidence. Probable cases require specifi ed clinical evidence only (as below) and are also notifi able.
a) Laboratory defi nitive evidence
• Isolation of Neisseria meningitidis from a normally sterile site.
b) Laboratory suggestive evidence
• Detection of meningococcus from a normally sterile site by nucleic acid testing; or
• Detection of gram-negative diplococci in Gram stain of specimen from a normally sterile site or from a suspicious skin lesion; or
• High titre IgM or signifi cant rise in IgM or IgG titres to outer membrane protein antigens of Neisseria meningitidis; or
• Positive polysaccharide antigen test in cerebrospinal fl uid with other laboratory parameters consistent with meningitis.
c) Clinical evidence (for confi rmed cases with laboratory suggestive evidence)
• Disease which in the opinion of the treating clinician is compatible with invasive meningococcal disease.
d) Clinical evidence for notifi cation of probable cases
• The absence of evidence for other causes of clinical symptoms and either
• Clinically compatible disease including haemorrhagic rash; or
• Clinically compatible disease AND close contact with a confi rmed case within the previous 60 days.
Hospitalisations
The ICD-10-AM code used to identify hospitalisations was A39 (meningococcal infection). This includes meningococcal meningitis (A39.0), Waterhouse-Friderichsen syndrome (A39.1), acute meningococcaemia (A39.2), chronic meningococcaemia (A39.3), meningococcaemia unspecifi ed (A39.4), meningococcal heart disease (A39.5), other meningococcal infections (A39.8), and meningococcal infection unspecifi ed (A39.9). As all cases with one of these codes, not just principal diagnoses, were included, cases were identifi ed in a hierarchical fashion to avoid double counting. First, those with code A39.0 (meningitis), then those without A39.0 but with A39.1 or A39.2 or A39.3 or A39.4 (septicaemia without meningitis), then those with none of these codes but with codes in any other subsection of A39 were selected. However, as re-admissions and inter-hospital transfers are separate records, duplication may occur for a condition such as meningococcal disease where complications are frequent.
Deaths
The ICD-10 code used to identify deaths was A39 (meningococcal infection).

S38 CDI Vol 31 Supplement 2007
Vaccine preventable diseases and vaccination coverage in Australia, 2003 to 2005
Secular trendsThere were 1,355 notifications of meningococcal disease in the three years January 2003 to December 2005, an average annual notification rate of 2.2 per 100,000 population (Table 10). A median of 35.5 cases was notified each month, with a range of 17 to 83 cases. Between July 2002 and June 2005, there were 2,135 hospital admissions recorded as ICD code A39 (average annual rate 3.6 per 100,000), and a median of 50.5 cases (range 25–139) per month. Coinciding with the introduction of the national meningo-coccal C immunisation program in January 2003,136 both the notification and hospitalisation rates for meningococcal disease decreased each year, down from a peak in 2002 (Figure 15). The notification rate decreased by 39% from 2.8 cases per 100,000 in 2003 to 1.9 cases per 100,000 in 2005, while the hospitali-sation rate decreased by 47% from 4.5 per 100,000 in 2002/2003 to 2.4 per 100,000 in 2004/2005.
A clear seasonal pattern was apparent, with the highest number of notifications and hospitalisations occurring between June and September each year (Figure 15).
Severe morbidity and mortalityA total of 16,817 hospital bed days (average 5,606 days per year) were recorded for patients with an ICD-10-AM code of A39, of which 44% were coded as meningococcal meningitis (A39.0) and 46% were coded as septicaemia (A39.1–A39.4, not A39.0). The proportion where a meningococcal disease code was the principal diagnosis varied from 96% of cases among 0–14 year olds to 80% of cases for those aged 15–59 years and 67% for those aged 60 years and over. The average length of stay was six days and increased with age (Table 10).
From death certificate data, in 2003 and 2004 there were 46 deaths (0.12 per 100,000 population) with meningococcal disease recorded as the underlying cause of death (Table 10). Sixty-nine deaths were recorded for the 1,355 cases of meningococcal disease notified to NNDSS for the three years 2003–2005 (case fatality rate of 5%). Of the total 2,135 hospitalisations over three years (Table 10), 72 (3.4%) were recorded as dying before hospital discharge. The proportion of meningococcal infection hospitalisations that died before discharge increased steadily with age from approximately 2% for those aged 0–24 years to 5% for 25–59 year olds and 10% for those aged over 60 years.
Figure 15. Meningococcal notifications and hospitalisations, Australia, 1993 to 2005,* by month of diagnosis or admission
0
20
40
60
80
100
120
140
Jan1993
Jan1994
Jan1995
Jan1996
Jan1997
Jan1998
Jan1999
Jan2000
Jan2001
Jan2002
Jan2003
Jan2004
Jan2005
Year
Num
ber
Notifications
Hospitalisations
* Notifi cations where the month of diagnosis was between January 1993 and December 2005; hospitalisations where the month of separation was between 1 July 1993 and 30 June 2005.
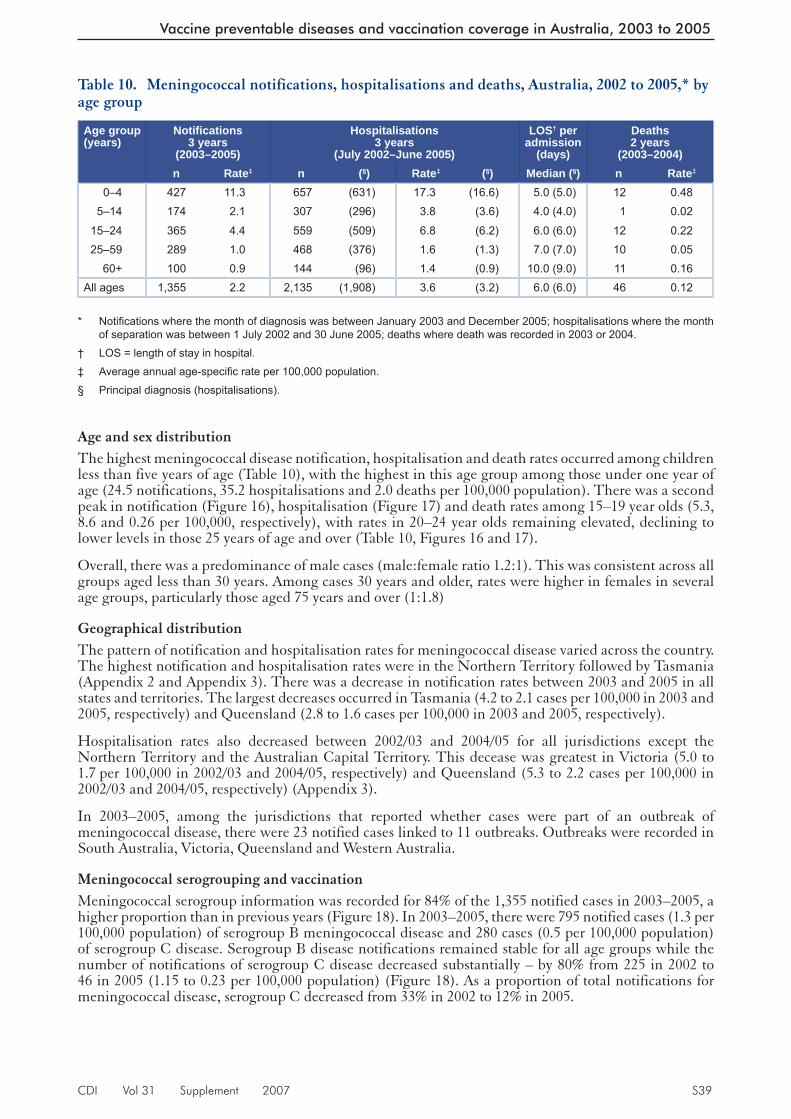
CDI Vol 31 Supplement 2007 S39
Vaccine preventable diseases and vaccination coverage in Australia, 2003 to 2005
Table 10. Meningococcal notifications, hospitalisations and deaths, Australia, 2002 to 2005,* by age group
Age group(years)
Notifi cations3 years
(2003–2005)
Hospitalisations3 years
(July 2002–June 2005)
LOS† per admission
(days)
Deaths2 years
(2003–2004)n Rate‡ n (§) Rate‡ (§) Median (§) n Rate‡
0–4 427 11.3 657 (631) 17.3 (16.6) 5.0 (5.0) 12 0.485–14 174 2.1 307 (296) 3.8 (3.6) 4.0 (4.0) 1 0.02
15–24 365 4.4 559 (509) 6.8 (6.2) 6.0 (6.0) 12 0.2225–59 289 1.0 468 (376) 1.6 (1.3) 7.0 (7.0) 10 0.05
60+ 100 0.9 144 (96) 1.4 (0.9) 10.0 (9.0) 11 0.16All ages 1,355 2.2 2,135 (1,908) 3.6 (3.2) 6.0 (6.0) 46 0.12
* Notifi cations where the month of diagnosis was between January 2003 and December 2005; hospitalisations where the month of separation was between 1 July 2002 and 30 June 2005; deaths where death was recorded in 2003 or 2004.
† LOS = length of stay in hospital.
‡ Average annual age-specifi c rate per 100,000 population.
§ Principal diagnosis (hospitalisations).
Age and sex distributionThe highest meningococcal disease notification, hospitalisation and death rates occurred among children less than five years of age (Table 10), with the highest in this age group among those under one year of age (24.5 notifications, 35.2 hospitalisations and 2.0 deaths per 100,000 population). There was a second peak in notification (Figure 16), hospitalisation (Figure 17) and death rates among 15–19 year olds (5.3, 8.6 and 0.26 per 100,000, respectively), with rates in 20–24 year olds remaining elevated, declining to lower levels in those 25 years of age and over (Table 10, Figures 16 and 17).
Overall, there was a predominance of male cases (male:female ratio 1.2:1). This was consistent across all groups aged less than 30 years. Among cases 30 years and older, rates were higher in females in several age groups, particularly those aged 75 years and over (1:1.8)
Geographical distributionThe pattern of notification and hospitalisation rates for meningococcal disease varied across the country. The highest notification and hospitalisation rates were in the Northern Territory followed by Tasmania (Appendix 2 and Appendix 3). There was a decrease in notification rates between 2003 and 2005 in all states and territories. The largest decreases occurred in Tasmania (4.2 to 2.1 cases per 100,000 in 2003 and 2005, respectively) and Queensland (2.8 to 1.6 cases per 100,000 in 2003 and 2005, respectively).
Hospitalisation rates also decreased between 2002/03 and 2004/05 for all jurisdictions except the Northern Territory and the Australian Capital Territory. This decease was greatest in Victoria (5.0 to 1.7 per 100,000 in 2002/03 and 2004/05, respectively) and Queensland (5.3 to 2.2 cases per 100,000 in 2002/03 and 2004/05, respectively) (Appendix 3).
In 2003–2005, among the jurisdictions that reported whether cases were part of an outbreak of meningococcal disease, there were 23 notified cases linked to 11 outbreaks. Outbreaks were recorded in South Australia, Victoria, Queensland and Western Australia.
Meningococcal serogrouping and vaccinationMeningococcal serogroup information was recorded for 84% of the 1,355 notified cases in 2003–2005, a higher proportion than in previous years (Figure 18). In 2003–2005, there were 795 notified cases (1.3 per 100,000 population) of serogroup B meningococcal disease and 280 cases (0.5 per 100,000 population) of serogroup C disease. Serogroup B disease notifications remained stable for all age groups while the number of notifications of serogroup C disease decreased substantially – by 80% from 225 in 2002 to 46 in 2005 (1.15 to 0.23 per 100,000 population) (Figure 18). As a proportion of total notifications for meningococcal disease, serogroup C decreased from 33% in 2002 to 12% in 2005.

S40 CDI Vol 31 Supplement 2007
Vaccine preventable diseases and vaccination coverage in Australia, 2003 to 2005
Figure 17. Meningococcal disease hospitalisation rates, Australia, July 2002 to June 2005,* by age group
0
2
4
6
8
10
12
14
16
18
20
0-4
5-9
10-1
4
15-1
9
20-2
4
25-2
9
30-3
4
35-3
9
40-4
4
45-4
9
50-5
4
55-5
9
60-6
4
65-6
9
70-7
4
75-7
9
80-8
4
85+
Age group (years)
Hos
pita
lisat
ions
per1
00,0
00po
pula
tion Meningitis and septicaemia
All meningococcal disease
* Hospitalisations where the month of separation was between 1 July 2002 and 30 June 2005.
Figure 16. Meningococcal disease notification and death rates, Australia, 2003 to 2005,* by age group
0
2
4
6
8
10
120-
4
5-9
10-1
4
15-1
9
20-2
4
25-2
9
30-3
4
35-3
9
40-4
4
45-4
9
50-5
4
55-5
9
60-6
4
65-6
9
70-7
4
75-7
9
80-8
4
85+
Age group (years)
Not
ifica
tions
per1
00,0
00po
pula
tion
0.0
0.1
0.2
0.3
0.4
0.5
0-4 5-14 15-24 25-59 >60
Age group (years)
Dea
ths
per1
00,0
00po
pula
tion Septicaemia
All meningococcal
* Notifi cations where the month of diagnosis was between January 2003 and December 2005; deaths where the death was recorded in 2003 or 2004.

CDI Vol 31 Supplement 2007 S41
Vaccine preventable diseases and vaccination coverage in Australia, 2003 to 2005
Much of the decrease in serogroup C disease notifications occurred among the age groups targeted for the national meningococcal C vaccination program during 2003–2005 (Figure 19).136 A decrease in serogroup C notifications was also evident among age groups not included in the vaccination program, including adults aged 25–39 years and those aged 65 years and over (Figure 20). Serogroup C notifica-tions for infants aged less than one year remained low, with an average of four per year (1.7 cases per 100,000 population) compared with an average of 48 serogroup B notifications per year (19.1 cases per 100,000 population).
During 2003–2005, there was considerable heterogeneity between jurisdictions in the relative notification rates of serogroup B and serogroup C meningococcal disease (Figure 21). Following the introduction of the national meningococcal C vaccination program in January 2003, there was an impressive reduction in notification rates across most states and territories with the largest reductions in Tasmania and Victoria (Figure 21).
Meningococcal C vaccination status was recorded for 165 (59%) of the 280 notified cases of serogroup C disease and 84 (70%) of the 120 cases aged 19 years and under. There were two reports of vaccine failure in children aged 1–4 years; both occurred in 2003.
CommentThe incidence of meningococcal disease in Australia increased continuously between 1991 and 2002.3 Following the introduction of the routine and catch-up meningococcal C vaccination programs in January 2003 for those born after 1983 (aged 19 years in 2003),136 there has been a marked decrease in meningococcal disease notifications, hospitalisations and deaths. The reduction in notifications occurred for both serogroup C disease and those where serogroup information was not available, while notifica-tions for serogroup B and other serogroups, mainly W135 and Y, remained relatively stable.
The decrease in serogroup C disease notifications occurred among all the age groups included in the mass vaccination program, particularly those aged 15–19 years at the time of diagnosis. There was also a smaller decrease in serogroup C notifications among two age groups not targeted by the national immunisation program, the 25–39 years and 65 years and over age groups. The 20–24 year age group (age at diagnosis) included some who would have received meningococcal C vaccine as part of the program, plus some who may have been protected by herd immunity, primarily as a consequence of the mass immunisation program and possibly to a lesser extent from natural exposure to pharyngeal infection/colonisation with serogroup C.137 Federal funding for the serogroup C vaccination program has been extended until June 2007 to allow continued catch-up in ‘hard to reach’ groups such as those now aged in their early 20s.138
Figure 18. Meningococcal disease notifications, Australia, 1991 to 2005, by serogroup
0
100
200
300
400
500
600
700
1991 1992 1993 1994 1995 1996 1997 1998 1999 2000 2001 2002 2003 2004 2005
Year of diagnosis
Num
ber
TotalSerogroup not recordedSerogroup BSerogroup COther serogroup

S42 CDI Vol 31 Supplement 2007
Vaccine preventable diseases and vaccination coverage in Australia, 2003 to 2005
Figure 20. Meningococcal serogroup C disease notifications, Australia, 1999 to 2005, by age group*
0
5
10
15
20
25
30
35
40
1999 2000 2001 2002 2003 2004 2005
Year of diagnosis
Num
ber
0 yrs20 - 24 yrs25 - 39 yrs40 - 64 yrs65 yrs +
* Shows the age groups not included in the meningococcal C vaccination program.
Note: different scales for Figures 19 and 20.
Figure 19. Meningococcal serogroup C disease notifications, Australia, 1999 to 2005, by age group eligible for the meningococcal C vaccination program*
0
10
20
30
40
50
60
70
1999 2000 2001 2002 2003 2004 2005
Year of diagnosis
Num
ber
1 to 4 years
5 to 9 years
10 to 14 years
15 to 19 years
* Shows the age groups eligible for the meningococcal C vaccination program from 1 January 2003 (those aged 1–19 years).

CDI Vol 31 Supplement 2007 S43
Vaccine preventable diseases and vaccination coverage in Australia, 2003 to 2005
Data reported by the National Neisseria Network,12 and related disease notification data reported else-where,139 indicate that the majority (77% in 2005)139 of meningococcal disease is due to serogroup B with the highest rate among children less than one year of age. Like other countries that have implemented national meningococcal C immunisation programs, there is no evidence to date of an increase in the incidence of serogroup B disease in Australia due to serogroup replacement in the vaccinated population.12,140,141
Meningococcal disease hospitalisations have been consistently higher than notifications since 1997 (Figure 15). A number of factors may contribute to this discrepancy including inter-hospital transfers (approximately 10% of separations for meningococcal disease), coding of some meningitis admissions as meningococcal disease and incomplete notification of hospitalised cases to public health authorities.
The high burden of meningococcal disease in infants, particularly non-vaccine preventable serogroup B disease, emphasises the importance of early recognition and appropriate clinical management of disease and the need for a vaccine to reduce the significant morbidity and mortality. Several candidate sero-group B vaccines are under investigation in international Phase II clinical trials.142 However, availability of a universal serogroup B vaccine appropriate for use in Australia is still some way off. In New Zealand, a vaccine, based on a particular strain of meningococcus B that was responsible for a major upsurge in disease over an extended period, has proved successful. High rates of vaccine uptake were achieved (more than three million doses distributed) and the rate of disease has been substantially reduced in line with a vaccine effectiveness of about 80% against the epidemic strain.143,144
Figure 21. Meningococcal disease notification rates, Australia, by jurisdiction and serogroup
0.0
0.5
1.0
1.5
2.0
2.5
3.0
3.5
4.0
4.5
ACT NSW NT Qld SA Tas Vic WA Aust
Jurisdiction
Not
ifica
tions
per1
00,0
00po
pula
tion
2003-2005 serogroup B
2003-2005 serogroup C
0
1
2
3
4
ACT NT SA Vic Aust
Jurisdiction
Not
ifica
tions
per1
00,0
00po
pula
tion
2002 serogroup C
2005 serogroup C

S44 CDI Vol 31 Supplement 2007
Vaccine preventable diseases and vaccination coverage in Australia, 2003 to 2005
Mumps
Mumps is an acute viral disease caused by a paramyxovirus. The disease is characterised by fever, swell-ing and tenderness of one or more salivary glands, most commonly the parotid glands. Symptomatic aseptic meningitis occurs in up to 10% of cases. Other potentially serious complications are less frequent and include pancreatitis, orchitis and encephalitis.44
Case defi nitions
See Appendix 6 for pre-2004 defi nition
National defi nition from January 2004:11
Confi rmed cases require either laboratory defi nitive evidence, or laboratory suggestive evidence and clinical evidence, or clinical evidence and an epidemiological link to a laboratory-confi rmed case.
a) Laboratory defi nitive evidence
• Isolation of mumps virus; or
• Detection of mumps virus by nucleic acid testing; or
• IgG seroconversion or a signifi cant increase in antibody level or a fourfold or greater rise in titre to mumps virus in the absence of recent vaccination.
b) Laboratory suggestive evidence
• Detection of mumps-specifi c IgM antibody in the absence of recent vaccination.
c) Clinical evidence
• A clinically compatible illness characterised by swelling of the parotid or salivary glands lasting two days or more without other apparent cause.
Hospitalisations and deaths
The ICD-10-AM/ICD-10 code B26 (mumps) was used to identify hospitalisations and deaths.
Secular trendsDuring the three years from January 2003 to December 2005, there were 419 notifications of mumps (an average annual notification rate of 0.69 per 100,000) (Table 11). Since 2002, when mumps notifications were the lowest on record, mumps cases have increased, and in 2005, reached the highest level since notification began in 1993, with a rate of 1.18 per 100,000 (Figure 22). Monthly numbers of notifications varied considerably, with a median of 9.5 (range 2–32) notifications per month. Notifications peaked in June 2005, with 32 notifications, and were above 10 per month between November 2004 and November 2005.
From July 2002 to June 2005, there were 138 hospitalisations coded as due to mumps (average annual rate of 0.23 per 100,000) (Table 11) with a median of 3.5 admissions per month (range 0–7). Hospitalisation rates were stable over the period, in contrast with the increase in notification rates (Figure 22). However, the hospitalisation rates for this review period were consistently above the record low levels seen in 2001/2002.
Severe morbidity and mortalityThere were 549 hospital bed days (average 183 per year) recorded for patients with an ICD-10-AM code for mumps (Table 11). Of the 138 hospitalisations (average annual rate 0.23 per 100,000), 114 (83%) had mumps recorded as the principal diagnosis. Complications arising from mumps infection were recorded for 19 hospitalisations (14%). As in the past, the most commonly reported complication was orchitis. There were 10 (7%) hospitalised cases coded with orchitis; seven of these were between 15 and 59 years of age (Table 12). There were no hospitalisations coded as neurological (encephalitis or meningitis) or with mul-tiple complications. The median length of stay (LOS) in hospital was two days, but adults aged 25 years and older had a longer median LOS compared with younger age groups (Table 11). The 15–24 year old age group had the highest hospitalisation rate and accounted for 20% of the hospitalisations. Adults over 15 years of age accounted for 75% of hospitalisations. Mumps was recorded as the underlying cause of death in one adult (aged 100 years) in 2004.

CDI Vol 31 Supplement 2007 S45
Vaccine preventable diseases and vaccination coverage in Australia, 2003 to 2005
Table 11. Mumps notifications, hospitalisations and deaths, Australia, 2002 to 2005,* by age group
Age group(years)
Notifi cations3 years
(2003–2005)
Hospitalisations3 years
(July 2002–June 2005)
LOS† per admission
(days)
Deaths2 years
(2003–2004)n Rate‡ n (§) Rate‡ (§) Median (§) n Rate‡
0–4 24 0.63 11 (9) 0.29 (0.24) 1.0 (1.0) 0 0.005–14 24 0.29 23 (20) 0.28 (0.25) 1.0 (1.0) 0 0.00
15–24 81 0.97 27 (24) 0.33 (0.29) 1.0 (1.0) 0 0.0025–59 260 0.88 53 (50) 0.18 (0.17) 2.0 (2.0) 0 0.00
60+ 30 0.28 24 (11) 0.23 (0.11) 6.0 (3.0) 1 0.01All ages 419 0.69 138 (114) 0.23 (0.19) 2.0 (2.0) 1 0.003
* Notifi cations where the month of diagnosis was between January 2003 and December 2005; hospitalisations where the month of separation was between 1 July 2002 and 30 June 2005; deaths where the death was recorded in 2003 or 2004.
† LOS = length of stay in hospital.
‡ Average annual age-specifi c rate per 100,000 population.
§ Principal diagnosis (hospitalisations).
Age and sex distributionSince 2002, low notification rates have continued in the 0–14 year age group but there has been a notable increase in older age groups (Figure 23). In particular, during 2005 there was a high rate of notifications in the 25–29 year age group (5.1 per 100,000) as well as elevated rates in the 20–24 and 30–34 year old age groups. An upward trend in hospitalisations is not apparent (Figure 24), with the highest rates of admissions in those aged 5–9 years (0.45 per 100,000) and 70–74 years (0.47 per 100,000) over the three year period between July 2002 and June 2005.
Figure 22. Mumps notifications and hospitalisations, Australia, 1993 to 2005,* by month of diagnosis or admission†
0
5
10
15
20
25
30
35Ja
n-93 Ju
lJa
n-94 Ju
lJa
n-95 Ju
lJa
n-96 Ju
lJa
n-97 Ju
lJa
n-98 Ju
lJa
n-99 Ju
lJa
n-00 Ju
lJa
n-01 Ju
lJa
n-02 Ju
lJa
n-03 Ju
lJa
n-04 Ju
lJa
n-05 Ju
l
Num
ber
Notifications
Hospitalisations
Year
* Notifi cations where the month of diagnosis was between January 1993 and December 2005; hospitalisations where the month of admission was between 1 July 1993 and 30 June 2005.
† Note that the number of jurisdictions notifying mumps increased over the review period until July 1996 when mumps became notifi able in all states and territories. From July 1999 until June 2001, mumps was not notifi able in Queensland. Only the Australian Capital Territory, New South Wales and Victoria notifi ed for the entire review period.
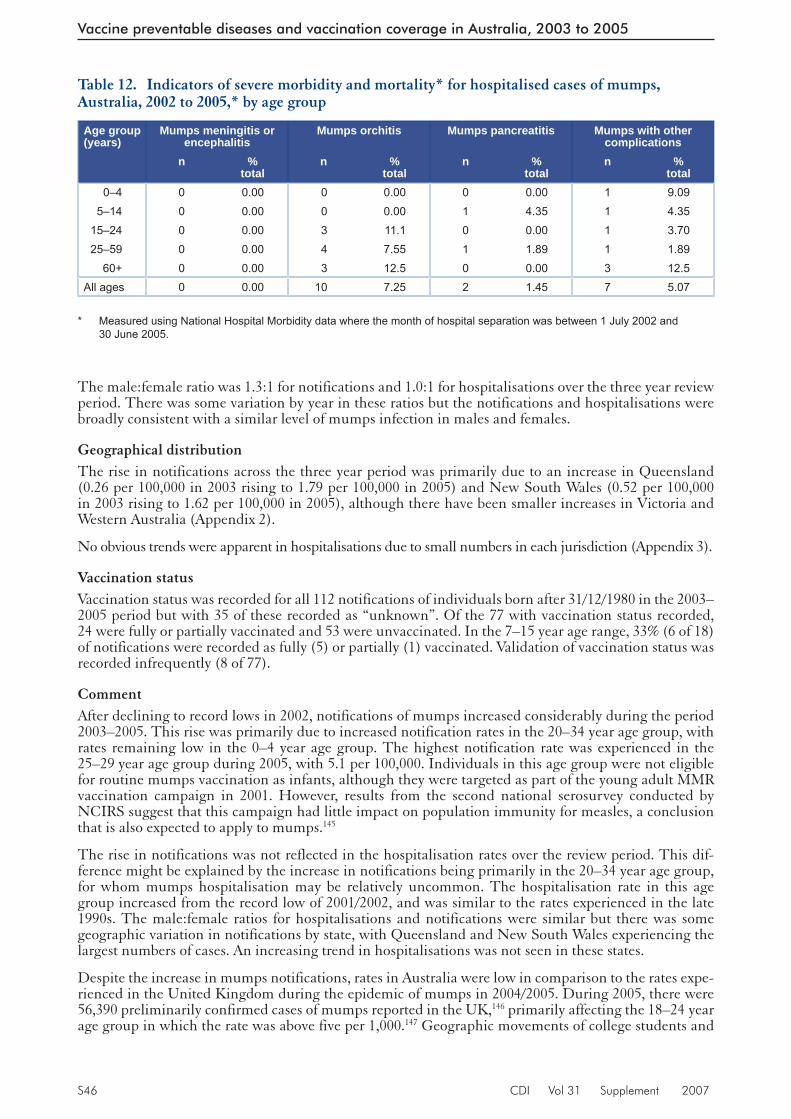
S46 CDI Vol 31 Supplement 2007
Vaccine preventable diseases and vaccination coverage in Australia, 2003 to 2005
Table 12. Indicators of severe morbidity and mortality* for hospitalised cases of mumps, Australia, 2002 to 2005,* by age group
Age group(years)
Mumps meningitis or encephalitis
Mumps orchitis Mumps pancreatitis Mumps with other complications
n % total
n % total
n % total
n % total
0–4 0 0.00 0 0.00 0 0.00 1 9.095–14 0 0.00 0 0.00 1 4.35 1 4.35
15–24 0 0.00 3 11.1 0 0.00 1 3.7025–59 0 0.00 4 7.55 1 1.89 1 1.89
60+ 0 0.00 3 12.5 0 0.00 3 12.5All ages 0 0.00 10 7.25 2 1.45 7 5.07
* Measured using National Hospital Morbidity data where the month of hospital separation was between 1 July 2002 and 30 June 2005.
The male:female ratio was 1.3:1 for notifications and 1.0:1 for hospitalisations over the three year review period. There was some variation by year in these ratios but the notifications and hospitalisations were broadly consistent with a similar level of mumps infection in males and females.
Geographical distributionThe rise in notifications across the three year period was primarily due to an increase in Queensland (0.26 per 100,000 in 2003 rising to 1.79 per 100,000 in 2005) and New South Wales (0.52 per 100,000 in 2003 rising to 1.62 per 100,000 in 2005), although there have been smaller increases in Victoria and Western Australia (Appendix 2).
No obvious trends were apparent in hospitalisations due to small numbers in each jurisdiction (Appendix 3).
Vaccination statusVaccination status was recorded for all 112 notifications of individuals born after 31/12/1980 in the 2003–2005 period but with 35 of these recorded as “unknown”. Of the 77 with vaccination status recorded, 24 were fully or partially vaccinated and 53 were unvaccinated. In the 7–15 year age range, 33% (6 of 18) of notifications were recorded as fully (5) or partially (1) vaccinated. Validation of vaccination status was recorded infrequently (8 of 77).
CommentAfter declining to record lows in 2002, notifications of mumps increased considerably during the period 2003–2005. This rise was primarily due to increased notification rates in the 20–34 year age group, with rates remaining low in the 0–4 year age group. The highest notification rate was experienced in the 25–29 year age group during 2005, with 5.1 per 100,000. Individuals in this age group were not eligible for routine mumps vaccination as infants, although they were targeted as part of the young adult MMR vaccination campaign in 2001. However, results from the second national serosurvey conducted by NCIRS suggest that this campaign had little impact on population immunity for measles, a conclusion that is also expected to apply to mumps.145
The rise in notifications was not reflected in the hospitalisation rates over the review period. This dif-ference might be explained by the increase in notifications being primarily in the 20–34 year age group, for whom mumps hospitalisation may be relatively uncommon. The hospitalisation rate in this age group increased from the record low of 2001/2002, and was similar to the rates experienced in the late 1990s. The male:female ratios for hospitalisations and notifications were similar but there was some geographic variation in notifications by state, with Queensland and New South Wales experiencing the largest numbers of cases. An increasing trend in hospitalisations was not seen in these states.
Despite the increase in mumps notifications, rates in Australia were low in comparison to the rates expe-rienced in the United Kingdom during the epidemic of mumps in 2004/2005. During 2005, there were 56,390 preliminarily confirmed cases of mumps reported in the UK,146 primarily affecting the 18–24 year age group in which the rate was above five per 1,000.147 Geographic movements of college students and

CDI Vol 31 Supplement 2007 S47
Vaccine preventable diseases and vaccination coverage in Australia, 2003 to 2005
waning of vaccine-derived immunity presumably contributed to the scale of this outbreak. The cohort most affected, although included in the UK national campaign of 1994, received measles-rubella (MR) not measles-mumps-rubella (MMR) vaccine, would have been ineligible for routine infant MMR vac-cination and had limited exposure to circulating mumps virus.
Figure 23. Mumps notification rates, Australia, 1999 to 2005,* by age group and year of diagnosis
0
0.5
1
1.5
2
2.5
3
3.5
1999 2000 2001 2002 2003 2004 2005
Year of diagnosis
Not
ifica
tions
per1
00,0
00po
pula
tion 0-4 yrs
5-14 yrs
15-24 yrs
25-34 yrs
35+ yrs
* Notifi cations where the month of diagnosis was between January 1999 and December 2005.
Figure 24. Mumps hospitalisation rates, Australia, 1999 to 2005,* by age group and year of separation
0
0.2
0.4
0.6
0.8
1
1.2
1998/99 1999/00 2000/01 2001/02 2002/03 2003/04 2004/05
Year of separation
Hos
pita
lisat
ions
per1
00,0
00po
pula
tion
0-4 yrs5-14 yrs15-24 yrs25-34 yrs35+ yrs
* Hospitalisations where the month of separation was between 1 July 1998 and 30 June 2005.

S48 CDI Vol 31 Supplement 2007
Vaccine preventable diseases and vaccination coverage in Australia, 2003 to 2005
In the USA, there were also significant numbers of mumps cases reported in 11 states following an outbreak in Iowa, with 2,597 cases reported between January and May 2006.148 Again, these cases were primarily in the 18–24 year age group. In Australia, notification rates have remained low. Nonetheless, in 2005, Australia exceeded the WHO incidence threshold for disease elimination of one case per 100,000. The higher notification rates in the 20–34 year age group suggest that some endemic transmission may be occurring in this age group. The rises in adult notifications of mumps over this reporting period and the recent experience in the USA and UK suggest that surveillance for mumps, with enhancement of immunisation efforts if necessary, is of continued importance in the Australian context.

CDI Vol 31 Supplement 2007 S49
Vaccine preventable diseases and vaccination coverage in Australia, 2003 to 2005
Pertussis
Pertussis (whooping cough) is an acute illness, caused by the Bordetella pertussis bacterium, involving the respiratory tract. The illness begins with an irritating cough that gradually becomes paroxysmal and lasts for one to two months or longer. Paroxysms are characterised by repeated violent coughs and are followed by a characteristic crowing or high-pitched inspiratory whoop. Infants less than six months of age, adolescents and adults often have fewer classical symptoms without paroxysms or whoop.44
Case defi nitions
See Appendix 6 for pre-2004 defi nition
National defi nition from January 2004:11
Confi rmed cases are those with defi nitive laboratory evidence, laboratory suggestive evidence and clinical evidence, or clinical evidence and an established epidemiological link to a confi rmed case. Probable cases require clinical evidence (as below) only and are also notifi ed.
a) Laboratory defi nitive evidence
• Isolation of B. pertussis from a clinical specimen or detection of B. pertussis by nucleic acid testing
b) Laboratory suggestive evidence
• Seroconversion or signifi cant increase in antibody levels or fourfold or greater rise in titre to B. pertussis, in absence of recent vaccination; or
• Single high IgA titre to whole cells; or
• Detection of B. pertussis antigen by immunofl uorescence assay (IFA).
c) Clinical evidence
• A coughing illness lasting two or more weeks; or
• Paroxysms of coughing or inspiratory whoop or post-tussive vomiting.
Hospitalisations and deaths
The ICD-10-AM/ICD-10 code A37 (whooping cough) was used to identify hospitalisations and deaths.
Secular trendsThere were 25,035 notifications of pertussis received by the National Notifiable Diseases Surveillance System (NNDSS) with dates of onset in the three years January 2003 to December 2005 (average annual rate 41.5 per 100,000) (Table 13). A median of 635 cases was notified each month (range 217–1,474). Both 2004 and 2005 were epidemic years, with 8,750 and 11,191 notifications, respectively, compared with 5,094 notifications in 2003. Epidemic peaks have occurred every three to four years since national notifications became available in 1991. The national notification rate was 55.1 per 100,000 in 2005 and was the second highest national rate recorded since 1993, after the 1997 national rate of 58.9 per 100,000 with 10,828 notified cases. A clear seasonal pattern remained apparent, with the highest number of noti-fications in the spring and summer months (between August and February) each year between 1993 and 2005 (Figure 25).
Hospitalisations followed a similar pattern to notifications. There were 1,319 hospital separations coded as pertussis during the review period, 359 in 2002/2003, 373 in 2003/2004 and 587 in 2004/2005 (Table 13 and Appendix 3). The median number of pertussis hospitalisations per month was 37 (range 17–65). The average annual national hospitalisation rate was 2.2 per 100,000 for this reporting period, compared with 3.3 per 100,000 for the previous two years 2000/2001 to 2001/2002.3
Severe morbidity and mortalityThere were 8,038 hospital bed days recorded with an ICD-10-AM code for pertussis between July 2002 and June 2005 (2,500 for 2002/2003, 2,163 for 2003/2004 and 3,375 for 2004/2005). The median length of stay per admission was four days (Table 13). Of the 1,319 hospitalisations, 1,034 (78%) had a prin-cipal diagnosis of pertussis (average annual rate 1.7 per 100,000). The discharge diagnosis code A37.0 (B. pertussis) was recorded for 596 (45%) hospitalisations and was the principal diagnosis for 470 (79%)

S50 CDI Vol 31 Supplement 2007
Vaccine preventable diseases and vaccination coverage in Australia, 2003 to 2005
of these. Bordetella parapertussis (A37.1) was recorded for 14 hospitalisations, and other Bordetella spe-cies (A37.8) for 22 hospitalisations. The remaining 687 (52%) hospitalisations were coded as whooping cough (organism unspecified – A37.9), and this was the principal diagnosis for 544 (79%) of these.
For the two years 2003 to 2004, two deaths were recorded where pertussis was the underlying cause (Table 13). Both occurred in 2004; one case was one month of age and the other was a 95 year old. Between 1993 and 2002, there were 16 deaths attributed to pertussis: all but one were younger than 12 months of age; six occurred in 1997.1–3
There were three deaths in notified cases reported to NNDSS between 2003 and 2005. Two of these are the cases identified in the 2004 death data and the other was a one month old case notified in 2005.
Table 13. Pertussis notifications, hospitalisations and deaths, Australia, 2002 to 2005,* by age group
Age group(years)
Notifi cations3 years
(2003–2005)
Hospitalisations3 years
(July 2002–June 2005)
LOS† per admission
(days)
Deaths2 years
(2003–2004)n Rate‡ n (§) Rate‡ (§) Median(§) n Rate‡
0–4 1,688 44.5 764 692 20.1 18.2 3.0 (3.0) 1 0.045–14 3,551 43.6 104 78 1.3 1.0 2.0 (2.0) 0 0.00
15–24 3,263 39.3 37 28 0.5 0.3 2.0 (2.0) 0 0.0025–59 12,738 43.2 241 150 0.8 0.5 4.0 (3.0) 0 0.00
60+ 3,789 36.0 173 86 1.7 0.8 7.0 (6.0) 1 0.01All ages|| 25,035 41.5 1,319 1,034 2.2 1.7 4.0 (3.0) 2 0.01
* Notifi cations where the month of diagnosis was between January 2003 and December 2005; hospitalisations where the month of separation was between 1 July 2002 and 30 June 2005; deaths where the death was recorded in 2003 or 2004.
† LOS = length of stay in hospital.
‡ Average annual age-specifi c rate per 100,000 population.
§ Principal diagnosis.
|| Includes cases with unknown ages.
Figure 25. Pertussis notifications and hospitalisations, Australia, 1993 to 2005,* by month of diagnosis or admission
0
200
400
600
800
1000
1200
1400
1600
1800Ja
n-93 Ju
lJa
n-94 Ju
lJa
n-95 Ju
lJa
n-96 Ju
lJa
n-97 Ju
lJa
n-98 Ju
lJa
n-99 Ju
lJa
n-00 Ju
lJa
n-01 Ju
lJa
n-02 Ju
lJa
n-03 Ju
lJa
n-04 Ju
lJa
n-05 Ju
l
Num
ber
Notifications
Hospitalisations
Year
* Notifi cations where the month of diagnosis was between January 1993 and December 2005; hospitalisations where the month of admission was between1 July 1993 and 30 June 2005.

CDI Vol 31 Supplement 2007 S51
Vaccine preventable diseases and vaccination coverage in Australia, 2003 to 2005
Age and sex distributionThe highest notification rates were seen in infants aged less than one year (Figure 26), with annual average rates of 113.1 per 100,000 in 2004 and 100.8 per 100,000 in 2005. In the three year review period, infants aged less than one year accounted for 3% of all notifications (n=763) but 50% of hospitalisations (n=655). The average hospitalisation rate for infants was 88.1 per 100,000 in this reporting period compared with 154.1 per 100,000 for the previous two years, 2000/2001–2001/2002 (Figure 27 and Figure 28).3
The 10–19 year age group accounted for 19% of pertussis notifications in 2003–2005 (n=4,824) and 8% of all hospitalisations (n=100). The 10–19 year age group had very high notification rates in 2003 and 2004, similar to recent patterns of notifications in this age group3 and second only to the notification rate in infants aged less than 1 year. In 2005, there was a decline in the notification rate for 10–19 year olds to 41.4 per 100,000, with the notification rate in this age group falling below that of people aged 20–59 years and 60 years and over.
People aged 20–59 years (adults) accounted for 56% of notifications (n =13,902) and 19% of hospital-isations (n =252, with an average annual hospitalisation rate of 0.8 per 100,000, the same as in the previous reporting period).3 Elderly people aged 60 years and over accounted for 15% of notifications (n =3,789) and 13% of hospitalisations (n=173). The notification rates in those aged 20–59 years and 60 years and over have both recently risen to a record high of 62 notifications per 100,000 population, which is in contrast to the relatively steady annual rates previously seen in these age groups. The proportion of notifications in these groups has also been increasing, from 35%–45% between 1993 and 1998 to 83% in 2005.
The overall male:female ratio was 1:1.3 for notifications and 1:1.1 for hospitalisations. Higher rates among females were apparent in most age groups for notifications and hospitalisations. The exception to this was for hospitalisations in people aged 70 years and over, where the male:female ratio was 1.6:1.
Figure 26. Pertussis notification rates, Australia, 1993 to 2005,* by age group
0
50
100
150
200
250
1993 1994 1995 1996 1997 1998 1999 2000 2001 2002 2003 2004 2005
Year of diagnosis
Not
ifica
tions
per1
00,0
00po
pula
tion <1 yr
1-4 yrs5-9 yrs10-19 yrs20-59 yrs60+ yrs
* Notifi cations where date of diagnosis was between 1 January 1993 and 31 December 2005.

S52 CDI Vol 31 Supplement 2007
Vaccine preventable diseases and vaccination coverage in Australia, 2003 to 2005
Geographical distributionPeriodic epidemics of pertussis occur in Australia at intervals of three to four years. However, the fre-quency and length of the epidemic cycles varies within states, particularly in the less populated and/or geographically isolated states and territories, such as Western Australia, the Northern Territory and Tasmania. During the study period, there was a large variation in notification (Appendix 2) and hospi-talisation rates (Appendix 3) between regions and years. The Australian Capital Territory experienced a pertussis epidemic in 2003 and was the only state or territory to do so, with a notification rate of
Figure 27. Pertussis hospitalisation rates, Australia, 1993 to 2005,* by age group
0
50
100
150
200
250
300
1993/1994 1995/1996 1997/1998 1999/2000 2001/2002 2003/2004
Year of separation
Hos
pita
lisat
ions
per1
00,0
00po
pula
tion
<1 yr
1-4 yrs
5-9 yrs
10-19 yrs
20-59 yrs
60+ yrs
* Hospitalisations where date of separation was between 1 July 1993 and 30 June 2005.
Figure 28. Pertussis hospitalisation rates, Australia, 1993 to 2005,* by age group (excluding <1 yrs)
0
5
10
15
20
25
1993/1994 1995/1996 1997/1998 1999/2000 2001/2002 2003/2004
Year of separation
Hos
pita
lisat
ions
per1
00,0
00po
pula
tion
1-4 yrs
5-9 yrs
10-19 yrs
20-59 yrs
60+ yrs
* Hospitalisations where date of separation was between 1 July 1993 and 30 June 2005.

CDI Vol 31 Supplement 2007 S53
Vaccine preventable diseases and vaccination coverage in Australia, 2003 to 2005
110.4 per 100,000 population. In 2004, an elevated notification rate of 106.2 per 100,000 population signified a pertussis epidemic in Western Australia, seven years after the previous epidemic in this state. South Australia (97.7 per 100,000), the Australian Capital Territory (96.9 per 100,000), New South Wales (85.5 per 100,000), the Northern Territory (45.4 per 100,000) and Queensland (44.8 per 100,000) all experienced elevated notification rates in 2005.
Vaccination statusCompletion of the vaccination status field was expected for all pertussis notifications aged under 15 years in NNDSS during 2003–2005. Overall, 72% of cases aged 0–14 years of age had this field completed for this period. Field completion rates varied by age group, ranging from 58% completion for cases aged 10–14 years, to 96% for those aged 6–11 months. The percentage of cases fully and partially vaccinated for age was calculated for people with a known vaccination status aged less than 9 years. The number of cases fully vaccinated for age rose from 37% in infants less than 6 months of age to 70% in those aged 1–4 years (Table 14).
Table 14. Vaccination status of notified pertussis cases aged six months to nine years, Australia, 2003 to 2005,* by age group
Age group Vaccination status(2003–2005)
Fully vaccinated for age Partially vaccinated for agen %† n %†
0–5 months 188 37 61 126–11 months 116 60 30 151–4 years 454 70 14 24–9 years 499 61 51 6
* Notifi cations where the month of diagnosis was between January 2003 and December 2005.
† Percentage of those with a known vaccination status.
CommentSince 1993, pertussis has caused the greatest morbidity of any disease preventable by vaccines recom-mended for children on the National Immunisation Program (NIP) schedule. The highest numbers of pertussis notifications were seen in 2005, with many jurisdictions experiencing an epidemic in that year, followed by 1997 and 2001. Traditionally, hospitalisations in infants aged less than one year have exceeded notifications, indicating that notification rates tend to underestimate pertussis incidence.3,149 However, in the 2003–2005 period, there were more notifications than hospitalisations in this age group, which may be a reflection of the increased use of PCR to diagnose pertussis in children. In children, hospitalisations coded as whooping cough have been shown to have a high correlation with clinical pertussis.19 The high proportion (greater than 50%) of hospitalised cases aged less than one year is consistently observed each year and demonstrates the increased morbidity of pertussis in this age group.
Nationally, the highest notification rates up to 1998 inclusive were among children aged less than one year, followed closely by children aged 5–9 and 10–19 years (Figure 26). Since 1999, notification rates have fallen significantly among 5–9 year olds, reflecting the impact of the fifth dose of pertussis vaccine, introduced since 1994 for four year olds because of waning immunity over time.150 The number of cases reported to be vaccinated for age may be an over-estimate, as the calculation did not include those with an “unknown” status (it is more likely that those recorded as unknown were not vaccinated). Studies show that a primary three-dose course of acellular pertussis vaccine provides 80%–85% protection.76
High incidence rates among 10–19 year olds continued to occur in 2003 and 2004. The susceptibility of this cohort is explained by a combination of low historical coverage (whole-cell vaccine safety concerns in the 1980s) and waning immunity (cohort not eligible for school entry booster dose).150,151 There has been a downward trend in the notification rate for this age group since 2002 and a sharper decline in the rate since 2004. This is likely to reflect the impact of the fifth dose of pertussis vaccine reaching this older cohort and the impact of an adolescent booster vaccine (dTpa), introduced in November 2003. In response to the high incidence rate in adolescents, both New South Wales and Western Australia

S54 CDI Vol 31 Supplement 2007
Vaccine preventable diseases and vaccination coverage in Australia, 2003 to 2005
conducted whole of high school dTpa vaccination programs in 2004. The combined incidence rate for 10–19 year olds in these states decreased from an average of 85.7 per 100,000 population for 1999–2003 to 37.2 per 100,000 population in 2005.152 As Australian school-based dTpa programs mature and suc-cessive cohorts are vaccinated in future years, pertussis in adolescents should become well controlled, as occurred in 5–9 year olds following the introduction of the preschool booster.
In essence, pertussis is now a problem in two broad age groups: infants with the highest notification and hospitalisation rates, particularly those under 6 months of age who are too young to have received two or more doses of DTPa, and people aged 20 years and over, who account for 80% of pertussis notifications. The latter could be partly related to the increased use, especially in adults, of serology as a diagnostic tool (NNDSS data from 2000–2005 shows an increasing percentage of notifications diagnosed by serology (Quinn H et al, NCIRS, unpublished data)). In addition, recommendations for use of pertussis vaccine in adults make it increasingly likely that clinicians will consider pertussis as a potential cause of chronic cough in adults. Hospitalisations in adults are most likely to be related to complications, but could also be falsely inflated because of coding errors. Although severe morbidity and mortality are less likely in adults, increased circulation of pertussis can facilitate transmission to susceptible infants who are too young to be vaccinated.153–155 The recent increase in the incidence and burden of pertussis notifications in persons aged 60 years and over warrants further investigation. As with parents, grandparents are an important source of pertussis transmission to infants.153 It is also unclear whether the morbidity of pertussis in older people is more severe, or if complications are more likely to occur. With this in mind, it is interesting to note that two of eight pertussis deaths in the past five years have been recorded in people aged 60 years and over.3 The current adult pertussis immunisation strategy in Australia is aimed at cocooning infants, by recommending immunisation in adults who are most likely to come into contact with them (such as family members, health care workers and child care workers). It is hoped that, in time, this may have an impact on neonatal cases.

CDI Vol 31 Supplement 2007 S55
Vaccine preventable diseases and vaccination coverage in Australia, 2003 to 2005
Pneumococcal disease
Pneumococcal disease is caused by the bacterium Streptococcus pneumoniae (pneumococcus). Pneumococci are frequently isolated from the upper respiratory tract and can spread directly from the nasopharynx to cause infection in other parts of the respiratory tract (otitis media, sinusitis, pneumonia) or enter the bloodstream. Following bloodstream invasion, clinical manifestations include meningitis, pneumonia and infection at a number of less common sites, as well as septicaemia without focal infection. Invasive pneumococcal disease (IPD) is defined as a sterile site isolate of Streptococcus pneumoniae, usually from blood. In the absence of a sterile site isolate, a presumptive diagnosis of pneumococcal pneumonia may be based on a sputum isolate of Streptococcus pneumoniae and/or clinical features such as the chest x-ray appearance and prompt response to antibiotic therapy.156
Case defi nitions
Notifi cations
Invasive pneumococcal disease has been notifi able in the Northern Territory since 1995 and in Queensland since 1997. From January 2001, invasive pneumococcal disease became notifi able Australia wide, with cases identifi ed by:
a) Isolation of Streptococcus pneumoniae by culture from a normally sterile site
or
b) Detection of Streptococcus pneumoniae from a normally sterile site by nucleic acid testing.
Hospitalisations
The ICD-10-AM codes used to identify hospitalisations were: G00.1 (pneumococcal meningitis); A40.3 (pneumococcal septicaemia) (together considered to be a proxy for invasive pneumococcal disease) and J13 (pneumococcal pneumonia). To avoid double counting, cases were identifi ed in a hierarchical fashion. First, all those with code G00.1 were classifi ed as meningitis, then those without G00.1 but with A40.3 were classifi ed as septicaemia without meningitis, and then those with neither of these codes but with code J13 were counted as pneumococcal pneumonia.
Deaths
ICD-10 codes G00.1, A40.3 and J13 were used to select deaths from IPD.
Secular trendsA total of 6,303 notifications of invasive pneumococcal disease were received for the three year period (2,237 in 2003, 2,377 in 2004 and 1,689 in 2005), an average annual notification rate of 10.5 per 100,000 (Table 15). In all years, there was a winter peak in pneumococcal notifications in August (Figure 29).
The total number of hospitalisations coded as pneumococcal meningitis, septicaemia or pneumonia between July 2002 and June 2005 was 9,543, an average annual rate of 16.0 per 100,000 (Table 15). In 69% of these, pneumococcal disease was recorded as the principal cause of the hospitalisation. Hospitalisations coded as meningitis or septicaemia accounted for 33% of total episodes giving a hospitalisation rate of 5.2 per 100,000. The median number of hospitalisations per month was 73 for meningitis or septicaemia (predominantly septicaemia) and ranged from 31 to 170. For pneumococcal pneumonia, the median number of hospitalisations per month was 161 (range 77–346). Hospitalisations showed a clear winter peak each year between July and September (Figure 29).
Notification rates and hospitalisation rates decreased in 2005 compared to previous years, coinciding with the commencement of universal funded vaccination for infants and the elderly. Notification rates in those aged less than two years were 66% lower in 2005 compared to the average for the previous three years (Figure 30), and 24% lower in those age 65 and over (Figure 31). There were also decreases in age groups not targeted for vaccination; 41% in those aged 2–14 years, 16% in those 15–49 years and 4% in those aged 50–64 years. Hospitalisation rates for the 2004/2005 financial year were also lower than the average of the previous five years, by 37% for those aged less than two years, 22% for those aged 65 and over, and 5% to 25% in other age groups.

S56 CDI Vol 31 Supplement 2007
Vaccine preventable diseases and vaccination coverage in Australia, 2003 to 2005
Figure 29. Pneumococcal disease notifications and hospitalisations, Australia, January 1996 to December 2005,* by month of diagnosis or admission
0
100
200
300
400
500
600
700
800
900Ja
n-96 Ju
l
Jan-
97 Jul
Jan-
98 Jul
Jan-
99 Jul
Jan-
00 Jul
Jan-
01 Jul
Jan-
02 Jul
Jan-
03 Jul
Jan-
04 Jul
Jan-
05 Jul
Year
Num
ber
Notifications
Hospitalisations
* Notifi cations where the month of diagnosis was between January 2001 and December 2005;hospitalisations where the month of admission was between 1 January 1996 and 30 June 2005. Hospitalisations include pneumonia, meningitis and septicaemia.
Figure 30. Pneumococcal disease notification rates, Australia, 2002 to 2005,* by age group
0
20
40
60
80
100
120
2002 2003 2004 2005
Year of diagnosis
Not
ifica
tions
per1
00,0
00po
pula
tion
<2 years2-14 years15-49 years50-64 years65+ years
* Notifi cations where the date of diagnosis was between 1 January 2002 and 31 December 2005.

CDI Vol 31 Supplement 2007 S57
Vaccine preventable diseases and vaccination coverage in Australia, 2003 to 2005
Severe morbidity and mortalityA total of 93,691 hospital bed days (average 31,230 days per year) was recorded for hospital separations with an ICD-10-AM code corresponding to pneumococcal meningitis, septicaemia or pneumonia. The median length of stay increased with age in all categories of infection (Table 15). The average length of stay was greater than the median. For pneumococcal meningitis, the average was 13.5 days in all age groups, higher than that for septicaemia (10.4) or pneumonia (9.3).
Table 15. Pneumococcal disease notifications, hospitalisations and deaths, Australia, 2002 to 2005,* by age group
Age group(years)
Notifi cations3 years
(2003–2005)
Hospitalisations3 years
(July 2002–June 2005)
LOS† peradmission
(days)
Deaths2 years
(2003–2004)n Rate‡ n§ (M/S)|| Rate‡,§ (M/S)‡,|| Median§ (M/S)|| n§ (M/S)|| Rate‡,§ (M/S)‡,¶
0–4 1,712 45.2 1,396 (831) 36.8 (21.9) 3.0 (3.0) 13 (11) 0.5 (0.4)5–14 258 3.2 302 (129) 3.7 (1.6) 3.0 (3.0) 0 (0) 0.0 (0.0)
15–24 247 3.0 357 (86) 4.4 (1.1) 4.0 (5.0) 2 (1) 0.04 (0.02)25–59 1,935 6.6 3,255 (908) 11.1 (3.1) 5.0 (8.0) 20 (10) 0.1 (0.1)
60+ 2,151 20.4 4,233 (1,161) 41.2 (11.3) 8.0 (9.0) 47 (16) 0.7 (0.2)All ages 6,303 10.5 9,543 (3,115) 16.0 (5.2) 6.0 (7.0) 82 (38) 0.2 (0.1)
* Notifi cations where the month of diagnosis was between January 2003 and December 2005; hospitalisations where the month of separation was between 1 July 2002 and 30 June 2005; deaths where the date of death was recorded between 2003 and 2004.
† LOS = length of stay in hospital.
‡ Average annual age-specifi c rate per 100,000 population.
§ All pneumococcal disease.
|| (M/S) = meningitis and septicaemia.
Figure 31. Pneumococcal disease notification rates, Australia, 2002 to 2005,* by age group (excluding <2 years)
0
5
10
15
20
25
30
2002 2003 2004 2005
Year of diagnosis
Not
ifica
tions
per1
00,0
00po
pula
tion
2-14 years15-49 years50-64 years65+ years
* Notifi cations where the date of diagnosis was between 1 January 2002 and 31 December 2005.

S58 CDI Vol 31 Supplement 2007
Vaccine preventable diseases and vaccination coverage in Australia, 2003 to 2005
Of the 82 registry-reported pneumococcal deaths in 2003 to 2004, 44 (54%) were from pneumonia, 20 (24%) from meningitis and 18 (22%) from septicaemia. Mortality rates from meningitis and septicae-mia were highest in the very young and the elderly, while the pneumonia death rate was highest in the elderly (Table 15).
There were 361 deaths from pneumococcal disease in notified cases reported to NNDSS between 2003 and 2005, 6% of notified cases. The death rate increased with age, highest at 20% for those aged 85 years and over and 13% for those aged 65 years and over.
Age and sex distributionMales had higher notification and hospitalisation rates compared to females in all age groups, and all ages combined (1.3 times and 1.4 times higher, respectively). Notification and hospitalisation rates were highest in the very young and the very old, although rates in infants decreased to a greater extent than other age groups in 2005 compared to previous years (Figure 30 and Figure 31). The hospitalisation rate for each age group varied with the focus of infection (Figure 32). For meningitis, rates were highest in those aged less than five years (6 per 100,000). By contrast, the incidence of hospitalisation for septicaemia without meningitis was also high in young children (16.0), but in adults increased with age to be highest in the elderly (24.7 in those 85 years and over).
When total hospitalisations (meningitis, septicaemia and pneumonia) were considered, adults aged 60 years and over had the highest total rate of hospitalisation (41.2 per 100,000, Table 15).
Geographical distributionThe average annual notification rate was 10.5 per 100,000 for Australia, highest in the Northern Territory (39.4, 3.8 times higher than the national rate) and ranged from 7.8 to 13.0 in other jurisdictions. A similar distribution was seen in the hospitalisation rate for pneumococcal meningitis or septicaemia (national rate 5.2), which was higher in the Northern Territory (22.1, 4.3 times higher than the national rate), with little difference between the other jurisdictions (4.2 to 5.8).
Figure 32. Pneumococcal meningitis, septicaemia and pneumonia hospitalisation rates,* Australia, 2002 to 2005, by age group
0
5
10
15
20
25
30
0-4
5-9
10-1
4
15-1
9
20-2
4
25-2
9
30-3
4
35-3
9
40-4
4
45-4
9
50-5
4
55-5
9
60-6
4
65-6
9
70-7
4
75-7
9
80-8
4
≥85
Age group (years)
Hos
pita
lisat
ions
per1
00,0
00po
pula
tion Septicaemia
Meningitis
05
101520253035404550
0-4
10-1
4
20-2
4
30-3
4
40-4
4
50-5
4
60-6
4
70-7
4
80-8
4
Age group (years)
Hos
pita
lisat
ions
per1
00,0
00po
pula
tion
Septicaemia or meningitis
Pneumonia
* Hospitalisations where the month of separation was between 1 July 2002 and 30 June 2005.

CDI Vol 31 Supplement 2007 S59
Vaccine preventable diseases and vaccination coverage in Australia, 2003 to 2005
Pneumococcal typingData on the serotype of cases reported to NNDSS were available from 6,749 of 8,769 cases (77%) from 2002 to 2005, the period when surveillance has been carried out in all jurisdictions. In the pre-vaccina-tion period of 2002 to 2004, 73% of serotyped cases were caused by serotypes contained in the 7-valent conjugate pneumococcal vaccine (7vCPV), used in infants, and 85% of serotyped cases in children aged less than two years. Cases caused by serotypes in the 23-valent pneumococcal polysaccharide vaccine (23vPPV), used in high-risk children and the elderly, were 92% of the total and 90% in those aged 65 years and over. In 2005, the notification rate in 7vPCV-type cases decreased by 80% in those aged less than two years, compared to the average of the previous three years (Figure 33), and by 43% in all ages combined (Table 16). Decreases were seen in all age groups, but they were less marked in younger adults. There was little change in all-age notification rates of cases with serotypes contained in the 23vPPV but not in the 7vPCV (23v-non-7v types), or in serotypes not in any vaccine, in 2005 compared to the previous three years. In those aged 65 years and over, there were decreases in all serotype groupings, i.e. 7vPCV types, 23v-non-7v types, and non-vaccine types. In age groups not included in universal funded vaccination programs (2–64 years), notification rates were higher in 2005 compared to 2002 to 2004 for serotypes not included in the 7vPCV, but total rates were lower, due to decreases in 7vPCV-type cases.
Vaccination statusData on vaccination status were available for 89 (52%) of the 172 cases recorded on NNDSS in children eligible for a full course of the funded universal vaccination and catch-up programs (from 1 January 2005, children born from January 1 2003 and aged more than 6 months at disease onset). Of those, 22 (25%) were reported to be fully vaccinated, and this was validated by vaccination records for 18. Partially completed vaccination was reported by 26 (29%) and 41 (46%) were unvaccinated. In cases aged 65 years and over, vaccination status was reported for 936 of 1,782 (53%). Of those, 35% were reported as fully vaccinated, 11% partially vaccinated and 55% unvaccinated. Information on the source of vaccination status data was available in 709 (76%) of those records, and 94% were reported to be from written vaccination records.
Figure 33. Notification rates of cases with serotypes contained in the 7-valent pneumococcal conjugate vaccine (7vPCV), versus rates for other serotypes, Australia, 2002 to 2005*
0
10
20
30
40
50
60
70
80
<2 years 2-14 years 15-49 years 50-64 years 65+ years
Age
Not
ifica
tions
per1
00,0
00po
pula
tion
7vPCV-type 2002-2004
7vPCV-type 2005
Non-7vPCV type 2002-2004
Non-7vPCV type 2005
* Notifi cations where the date of diagnosis was between 1 January 2002 and 31 December 2005.

S60 CDI Vol 31 Supplement 2007
Vaccine preventable diseases and vaccination coverage in Australia, 2003 to 2005
Table 16. Invasive pneumococcal disease notification rates,* Australia, 2005 as a percentage of average annual rates from 2002 to 2004, by serotype grouping
Age group(years)
Serotype TotalII
7v† 23v-non-7v‡ Non-23v§
<2 20 99 62 342–14 46 116 102 59
15–49 84 114 139 8450–64 81 109 170 96
65+ 69 85 62 76All ages 57 103 98 70
* Notifi cations to the National Notifi able Diseases Surveillance System, per 100,000 population.
† Serotypes contained in the seven-valent pneumococcal conjugate vaccine (7vPCV); 4, 6B, 9V, 14, 18C, 19F, 23F.
‡ Serotypes contained in the 23-valent pneumococcal polysaccharide vaccine but not in the 7vPCV; 1, 2, 3, 5, 7F, 8, 9N, 10A, 11A, 12F, 15B, 17F, 19A, 20, 22F, 33F.
§ Serotypes not included in either vaccine.
II Includes untyped cases.
CommentInvasive pneumococcal disease has historically been a disease predominantly affecting the very young, the very old and those with certain chronic diseases or other high-risk conditions. In particular, much higher rates of disease have been reported in Aboriginal and Torres Strait Islander young children and adults compared to non-Indigenous Australians.157–159 Vaccination with the 23vPPV has been funded nationally since 1999 for Aboriginal and Torres Strait Islander adults aged 50 years and over, and those aged 15–49 years with high-risk conditions.3 Nationally funded 7vPCV vaccination commenced in 2001 for all Aboriginal and Torres Strait Islander infants and other infants with high-risk conditions.3 In 2005, the 7vPCV was funded for all Australian infants and the 23vPPV for all aged 65 years and over.
Reports on IPD national notification data have been published since 2001.160–163 A decrease in rates in Indigenous children following the targeted infants vaccination program has been previously reported, with a threefold higher rate in Indigenous compared to non-Indigenous children under two years of age in 2001 reduced to parity in 2004.163 Data in this report suggest a noticeable impact in the first year of universal infant vaccination, as the IPD notification rate declined by 66% in those aged less than two years in 2005 compared to the three previous years, and 80% in cases with serotypes contained in the vaccine. Smaller decreases occurred in all other age groups, but these should be interpreted with caution due to the smaller numbers of cases in these age groups. Hospitalisation rates were lower in 2004/2005 compared to previous years, although this included only the first six months of the funded vaccination program. There were decreases in all age groups, but the greatest decrease was seen in infants (37%). Similar impacts have been seen in the USA following the commencement of universal infant vaccination in 2001; an estimated 25,000 cases were prevented in 2003, and 49% of those were in non-immunised age groups, presumably due to reductions in nasopharyngeal carriage and, therefore, fewer transmissions to the unvaccinated.164
Hospitalisation rates for pneumococcal disease were approximately 30% higher than IPD notification rates. The hospitalisation codes selected were less specific for identifying invasive disease than the IPD case definition, as they include pneumococcal pneumonia without bacteraemia. In addition, hospitalisations coded as due to bacteraemia have been previously shown to have low sensitivity.165 Hospitalisations for pneumococcal meningitis and septicaemia number approximately half those of IPD notifications. It is, therefore, likely that pneumococcal disease hospitalisations are under-estimated by these data.
In addition to preventing IPD, the 7vPCV has been shown to have some efficacy against the much more common manifestations of non-bacteraemic pneumococcal pneumonia and otitis media.166,167 Therefore, decreases in IPD notification rates represent only a proportion of the total impact of this vaccine. Continued monitoring of hospitalisation rates for pneumococcal pneumonia will be valuable in monitoring some of this impact. The decrease in hospitalisation rates from 1996 to 1999 shown here is

CDI Vol 31 Supplement 2007 S61
Vaccine preventable diseases and vaccination coverage in Australia, 2003 to 2005
likely to be related to coding practices rather than an actual decrease in incidence, as all-cause pneumonia hospitalisation rates did not change over time (data not shown). However, the more stable pattern from 1999 provides a useful baseline for monitoring the impact of vaccination in the future.
Concerns about replacement disease by serotypes not contained in the vaccine have been expressed.167 In the USA, some replacement IPD appears to have occurred, but there is still a substantial overall decrease in IPD notifications.164 The data presented here for Australia on the first year of the vaccination program suggest the possibility of some replacement disease in unvaccinated age groups, but a substantial overall decline in IPD rates. It will be important to monitor this closely in the future.
The 23vPPV has been shown to be effective against IPD in elderly populations without high rates of risk factors, but effectiveness against nasopharyngeal carriage and pneumococcal pneumonia have not been established.43,168 Low vaccine effectiveness has been found in overseas studies in those with chronic disease and high-risk conditions, including indigenous populations.169 Vaccination programs for Indigenous adults from the early 1990s in the Kimberley and mid-1990s in northern Queensland coincided with reductions in IPD incidence in Indigenous adults in those regions.158,170 However, no decrease in incidence has been seen in Northern Territory Indigenous adults, despite vaccination pro-grams targeting those aged 50 years and over since 1995 and all Indigenous adults since 2000.171 Funded vaccination for all Victorians aged 65 years and over since 1998 has been effective in that state,172 and a similar impact could be expected nationally. The data reported here include the period up to the end of the first year of nationally funded vaccination for those aged 65 years and over. Although decreases were seen in hospitalisation and notification rates in this age group in 2005 compared to previous years, the decreases in notifications occurred across a wide range of serotypes and may be attributable to adult vaccination, herd immunity from childhood vaccination, and/or other reasons. It will be necessary to examine this in later years when more data become available. Reported deaths were predominantly in adults, with the highest death rates in the oldest age groups. There were 2.9 times as many pneumococcal deaths reported through NNDSS compared to registry reports, even though registry deaths included the broader category of all pneumococcal pneumonia, suggesting under-reporting of this cause of death by this mechanism.
The Northern Territory has the highest disease burden and there is little difference between the other jurisdictions. Disparities between Indigenous and non-Indigenous children may re-emerge following universal vaccination, due to higher rates of non-vaccine type disease in Indigenous people.163 New con-jugate vaccines with greater serotype coverage may be necessary to address this and the persistently high rates in Northern Territory Indigenous adults.

S62 CDI Vol 31 Supplement 2007
Vaccine preventable diseases and vaccination coverage in Australia, 2003 to 2005
Poliomyelitis
Poliomyelitis is caused by an enterovirus, poliovirus. Infection involves the gastrointestinal tract, and may progress to the nervous system, resulting in paralysis. Acute flaccid paralysis (AFP) occurs in less than 1% of infections. More than 90% of infections are asymptomatic, with a minor illness characterised by fever, headache, malaise and nausea/vomiting occurring in about 10%. The maximum extent of paralysis is usually reached within three to four days of disease onset. Any paralysis still present after 60 days is likely to be permanent.44
Vaccine-associated paralytic poliomyelitis (VAPP) is acute flaccid paralysis due to a Sabin-like poliovirus (i.e. a virus similar to that used in the Sabin live attenuated oral poliovirus vaccine (OPV)). A vac-cine derived poliovirus (VDPV) is defined as having 1%–15% nucleic acid sequence variation from the prototype Sabin strain. The variation is due to long-term (more than one year) virus replication after administration of OPV. The virus replication may occur in an individual with an immunodeficiency (iVDPV) or through sustained person-to-person transmission in areas with low OPV coverage (circu-lating or cVDPV). VDPVs not clearly assigned to either of these categories are known as ambiguous VDPVs (aVDPV).173
Case defi nition
See Appendix 6 for pre-2004 defi nition
National defi nition from January 2004:11
Confi rmed cases require laboratory defi nitive evidence and clinical evidence. Probable cases are also notifi able and require clinical evidence and that the case not be discarded as non-polio acute fl accid paralysis by the Polio Expert Committee.
a) Laboratory defi nitive evidence
• Isolation of wild poliovirus (or Sabin-like poliovirus for VAPP cases), confi rmed in the WHO Western Pacifi c Regional Poliovirus Reference Laboratory; or
• Detection of wild poliovirus (or Sabin-like poliovirus for VAPP cases) by nucleic acid testing, confi rmed in the WHO Western Pacifi c Regional Poliovirus Reference Laboratory.
b) Clinical evidence
• Acute fl accid paralysis (AFP): acute onset of progressive weakness and fl accidity of one or more limbs with decreased or absent tendon refl exes in the affected limbs or bulbar palsy without other apparent cause, and without sensory or cognitive loss.
Hospitalisations and deaths
The ICD-10-AM/ICD-10 code A80 (acute poliomyelitis) was used to identify hospitalisations and deaths.
Note: This code includes VAPP and specifi c codes for indigenous and imported wild-type poliovirus infection. Sequelae of poliomyelitis (ICD-10 code B91) were not included in these analyses.
Notifications, hospitalisations and deathsNo notifications or deaths were recorded for poliomyelitis in 2003, 2004 or 2005. From July 2002 to June 2005 there were 60 hospitalisations with a diagnosis of acute poliomyelitis. Of these, one was coded as VAPP, seven as acute non-paralytic poliomyelitis and 14 as other/unspecified acute paralytic poliomy-elitis. The remaining 38 hospitalisations were coded as acute unspecified poliomyelitis. The majority of separations recorded as acute poliomyelitis were in older persons (92% aged 50 years and over). The number of hospitalisations reported as acute poliomyelitis decreased over the period with 39 cases in 2002/2003, 20 in 2003/2004 and only one case in 2004/2005. Only five hospitalisations were recorded as having a principal diagnosis of poliomyelitis (all from New South Wales in the period 2002/2003).
CommentIt is unclear exactly when the last case of locally acquired poliomyelitis occurred in Australia. The last laboratory-confirmed case was in 1967. Three clinically compatible cases were notified in 1972; how-ever, no additional information is currently available.174 Australia and the Western Pacific Region were declared polio-free in October 2000.175 The most recent case of VAPP was reported in 1995.176,177 As there

CDI Vol 31 Supplement 2007 S63
Vaccine preventable diseases and vaccination coverage in Australia, 2003 to 2005
have been no reports of indigenous wild-type poliovirus transmission in Australia for at least 30 years, the hospitalised cases reported here are almost certainly not missed notifications of acute wild-type polio infection. Some hospitalisations could represent cases of AFP where poliomyelitis could not be excluded, but most are likely to be adults with late effects of poliomyelitis rather than acute cases, as indicated by the age distribution of the hospitalisations. The most recent hospitalisation data, with only one case coded as acute polio unspecified in an elderly male in 2004/2005, is encouraging in relation to possible improve-ments in coding practices. The hospitalisation case coded as VAPP in 2002/2003 would be worthwhile investigating, although it could be a coding error.
Although Australia has been declared polio free, achieving high quality AFP surveillance remains an important challenge. Such surveillance is required to detect any imported cases of wild-type polio infec-tion, cases of VAPP, and outbreaks of circulating vaccine-derived polioviruses (cVDPV). In Australia, surveillance of AFP in children under 15 years of age is co-ordinated through the Victorian Infectious Diseases Reference Laboratory in collaboration with the Australian Paediatric Surveillance Unit (APSU). AFP cases are notified and stool specimens are referred to the Australian National Poliovirus Reference Laboratory for testing for polio and other enteroviruses. Cases are referred to the Polio Expert Committee for a determination as to the cause of the AFP. In 2004, Sabin-like poliovirus types 1 and 2 were isolated from a child presenting with AFP. However, the polioviruses were determined to be an incidental find-ing with the AFP determined as due to infant botulism.178 In 2005, three Sabin-like polioviruses (two isolations of PV3 and one of PV2) were isolated from three patients with AFP, with all considered to be incidental isolations in patients recently vaccinated with OPV.179 A recent review of all specimens referred for testing from AFP cases during 1996–2004 identified no cases as due to polio, with enterovirus 71 now the most common viral cause of AFP. Infant botulism is an important differential diagnosis.180 Three cases of notified AFP were due to infant botulism in 2005.181 AFP cases notified between 1995 and 1999 have also been reviewed, with Guillain-Barré syndrome and transverse myelitis identified as the most common diagnoses.182 In 2005, these two diseases continued to be the primary diagnoses responsible for presentations with AFP.181
The WHO target for surveillance of AFP (one notified case of AFP per 100,000 children aged less than 15 years) has only been intermittently achieved in Australia (in 2000, 2001 and 2004). The WHO target of faecal sampling from 80% of AFP cases has never been achieved, with the 40% sampling rate achieved in 2004 the highest to date (previously 24–36% and falling to 19% in 2005).178,179 Variability in the adequacy of AFP reporting amongst the populous states of Australia has been noted, perhaps relating to the degree of clinician awareness of AFP surveillance protocols locally, which in turn may be related to the differ-ing structure of public health networks and laboratories in different states.183 A capture-recapture study, comparing AFP surveillance reports with hospital records, has indicated that, in Victoria, failure to reach the WHO target rate of one per 100,000 is due to under-reporting rather than to local variation in AFP rates.184
The global aim to eradicate polio by 2000 has proven elusive. During the period 2002–2005, there was a resurgence of poliovirus 1 and importation into 21 previously polio free countries, due to postponement of eradication activities in Nigeria in 2003 and, to a lesser extent, importations from India.185 In eight countries, wild poliovirus transmission was not sustained, whereas in the other 13 countries, sustained transmission occurred. Four countries (Indonesia, Somalia, Sudan, and Yemen) had outbreaks of over 100 polio cases. Countries where transmission was not sustained had a median three-dose vaccination coverage of 83%, compared with only 52% in those where transmission occurred, underscoring the ongo-ing importance of high polio vaccine coverage even in countries where polio has been locally eradicated.185 Control strategies for affected countries have involved large scale supplementary immunisation activities and underscored the critical role of sensitive AFP surveillance.
In 2006, endemic transmission of wild-type poliovirus is now constrained to four countries (an all-time low): Afghanistan, India, Nigeria and Pakistan.186 However, 10 countries have reported polio cases due to importations in 2006.187 The Global Polio Eradication Initiative Strategic Plan 2004–2008188 has four main objectives. The most urgent is the rapid interruption of polio transmission in the remaining endemic countries. This requires high level political and resource commitments and, since 2005, the use of monovalent oral poliovirus vaccine (OPV) in order to provide sufficiently high levels of immunity.186 The other three objectives underscore the need to ensure adequate surveillance (Objective 2: Achieve certification of global polio eradication); to move away from OPV to inactivated poliovirus vaccine (IPV) once the risk of VAPP exceeds that from wild poliovirus (Objective 3: Develop products for the global OPV cessation phase); and to integrate poliovirus control and maintenance strategies into routine disease control structures (Objective 4: Mainstream the Global Polio Eradication Initiative).

S64 CDI Vol 31 Supplement 2007
Vaccine preventable diseases and vaccination coverage in Australia, 2003 to 2005
In 2003, the Australian Government recommended, but did not fund, the use of IPV in place of OPV.76 From November 2005, IPV became a funded part of the routine childhood immunisation schedule in Australia with doses given at 2, 4 and 6 months and 4 years of age. This policy was facilitated by the availability of combination IPV vaccines and removes the risk of VAPP while providing protection against polio importations.189 With the replacement of OPV with IPV in Australia, incidental detection of polioviruses in faecal specimens should no longer occur. Future poliovirus isolations will, therefore, require full investigation.179 An important goal in the diagnosis of all AFP cases is the exclusion of an imported wild or vaccine-associated poliovirus as the cause. The high frequency of arrivals from coun-tries where poliovirus remains endemic and where cVDPV cases have been recently documented (such as China),190,191 by Australian travellers, visitors and refugees, make such importations a distinct possibil-ity. The likelihood of local transmission following importation will be dependent upon the vaccination coverage locally and living conditions primarily relating to the likelihood of faecal contamination of the water supply. Such contamination remains a possibility in rural and remote areas of Australia.192 Travellers should be reminded to ensure that they are vaccinated against polio.193

CDI Vol 31 Supplement 2007 S65
Vaccine preventable diseases and vaccination coverage in Australia, 2003 to 2005
Q fever
Q fever is a zoonotic disease caused by Coxiella burnetii. It infects both wild and domestic animals and their ticks, with cattle, sheep and goats the main source of human infection. Infected animals shed C. burnetii into the environment through their products of conception (in especially high numbers) but also in their urine, milk and faeces. Transmission to humans is via inhalation of infected droplets or dust. Q fever can be acute or chronic,194 and there is increasing acceptance of an association with long-term sequelae including post Q fever fatigue syndrome.195–197 However, in many instances infection is asymptomatic. Symptoms of the acute illness resemble those of influenza but can be complicated by encephalitis, pneumonitis, hepatitis, myocarditis and pericarditis. Chronic Q fever, which may occur years after infection, is most often characterised by endocarditis.198
A vaccine against Q fever, Q-VAX® (CSL Limited) was licensed in Australia in 1989 and, following successful Australian trials,199–201 vaccination programs have been operating in most large abattoirs since the mid 1990s.202 To improve vaccination coverage in the wider at-risk population, the Commonwealth Government funded the National Q fever Management Program (NQFMP).203 The program was funded and delivered in two phases. Phase one targeted the meat and livestock industry, promoting screening and vaccination services to abattoir workers, workers contracted to abattoirs and sheep shearers ($10.6 million funding over three years). Phase two targeted sheep, dairy and beef cattle farmers, their employees and unpaid family members working on farms ($8 million funding over three years). The program was implemented in all states and the Australian Capital Territory during 2001–2002, with vaccination activity peaking in 2002.
Case defi nitions
See Appendix 6 for pre-2004 defi nition
National defi nition from January 2004:11
Confi rmed cases require either laboratory defi nitive evidence or laboratory suggestive evidence and clinical evidence.
a) Laboratory defi nitive evidence
• Detection of Coxiella burnetii by nucleic acid testing; or
• Seroconversion or signifi cant increase in antibody level to Phase II antigens in paired sera tested in parallel in absence of recent Q fever vaccination; or
• Detection of C. burnetii by culture.
b) Laboratory suggestive evidence
• Detection of specifi c IgM in the absence of recent Q fever vaccination.
c) Clinical evidence
• A clinically compatible disease.
Hospitalisations and deaths
The ICD-9 code 083.0 (for historical data) and ICD-10 code A78 were used to identify hospitalisations and deaths.
Secular trendsIn the three year review period there were 1,375 notified cases of Q fever (average annual rate of 2.3 per 100,000) and 652 hospitalisations with the ICD-10 code A78 for Q fever (average annual rate 1.1 per 100,000). Both notification and hospitalisation rates declined over the review period, following a peak in 2002, to the lowest levels on record in the most recent year reviewed (1.7 and 0.8 per 100,000, respec-tively). There was a median of 36 (range 20–79) notifications and 17 hospitalisations (range 9–31) per month. The considerable monthly variation did not appear to be seasonal.
Severe morbidity and mortalityIn the three year review period, hospital separations for Q fever accounted for 3,807 hospital bed days. The median length of stay (LOS) overall was 4 days but, in adults, the LOS increased with age (Table 17).

S66 CDI Vol 31 Supplement 2007
Vaccine preventable diseases and vaccination coverage in Australia, 2003 to 2005
Of the 652 hospitalisations, 502 (77%) had Q fever recorded as the principal diagnosis. However, only 62 (54%) of the 115 hospitalisations in the 60 years and over age group were recorded as the principal diagnosis.
In the National Mortality database, four deaths were recorded with an underlying cause of death coded as Q fever in 2003–2004. All were in adults aged at least 25 years. Three were female and one was male. There were two deaths in notified cases reported to NNDSS between 2003 and 2005.
Table 17. Q fever notifications, hospitalisations and deaths, Australia, 2002 to 2005,* by age group
Age group(years)
Notifi cations 3 years(2003–2005)
Hospitalisations 3 years(July 2002–June 2005)
LOS† per admission
(days)
Deaths 2 years(2003–2004)
n Rate‡ n (§) Rate‡ (§) Median (§) n Rate‡
0–4 5 0.1 3 (2) 0.1 (0.1) 5.0 (3.0) 0 –5–14 39 0.5 14 (13) 0.2 (0.2) 3.0 (3.0) 0 –
15–24 173 2.1 88 (78) 1.1 (1.0) 2.0 (3.0) 0 –25–59 953 3.2 432 (347) 1.5 (1.2) 4.0 (4.0) 3 0.02
60+ 205 2.0 115 (62) 1.1 (0.6) 7.0 (7.0) 1 0.01All ages 1,375 2.3 652 (502) 1.1 (0.8) 4.0 (4.0) 4 0.01
* Notifi cations where the month of diagnosis was between January 2003 and December 2005; hospitalisations where the month of separation was between 1 July 2002 and 30 June 2005; deaths where the death was recorded in 2003 or 2004.
† LOS = length of stay in hospital.
‡ Average annual age-specifi c rate per 100,000 population.
§ Principal diagnosis (hospitalisations).
Figure 34. Q fever notifications and hospitalisations, Australia, 1993 to 2005,* by month of diagnosis or admission
0
10
20
30
40
50
60
70
80
90
100
Jan1993
Jan1994
Jan1995
Jan1996
Jan1997
Jan1998
Jan1999
Jan2000
Jan2001
Jan2002
Jan2003
Jan2004
Jan2005
Year
Num
ber
Notifications
Hospitalisations
* Notifi cations where the month of diagnosis was between January 1993 and December 2005;hospitalisations where the month of admission was between 1 July 1993 and 30 June 2005.

CDI Vol 31 Supplement 2007 S67
Vaccine preventable diseases and vaccination coverage in Australia, 2003 to 2005
Age and sex distributionThe male to female ratio for both notifications and hospitalisations has generally been decreasing over time since the early 1990s, but remained relatively constant over the three year review period at 3.3:1 and 3.8:1, respectively.
As in previous years, adult males aged 15–39 and 40–64 years had the highest notification and hospitali-sation rates (Figure 35). In the 1990s males aged 15–39 years had the highest rates, but, since then, rates have been highest in males aged 40–64 years.
All age/sex groups showed a decline in notification and hospitalisation rates over the three year review period except the 65 years and over age group which had a peak in hospitalisations in 2003/2004. This oldest age group also contributed proportionally more hospitalisations (13%) than notifications (8%) during the review period.
Geographical distributionAs in previous years, notification and hospitalisation rates were highest in Queensland followed by New South Wales (Appendix 2 and Appendix 3). Together, these two states contributed 86% of the notifica-tions and 83% of the hospitalisations for Q fever over the review period.
Consistent with national trends, notification rates in both of these states declined to record low levels over the three years reviewed with only a few outbreaks reported. There were six small clusters of Q fever cases reported nationally in 2003 with five of these in Queensland.13 In 2004, a cluster of ten cases associated with a shearing team was reported in New South Wales.204 Rates in other jurisdictions remained low over the review period. The exceptions were: South Australia, which experienced an outbreak associated with a sheep saleyard in late 2004;12 and the Northern Territory which reported three cases in each of 2004 and 2005 when prior to 2004 there had only been two cases in total reported since 1991. The three cases in 2004 were unrelated. One was a foreign national working on a cattle boat205 and two cases were from Central Australia, one of whom died.206
Hospitalisation rates tended to follow the same pattern as notifications, except that there were few hospitalisations reported from South Australia during the 2004 outbreak.
Vaccination statusVaccination status is requested on all Q fever notifications but was recorded only for 903 (66%) of the 1,375 notified cases in 2003–2005. Fourteen cases were recorded as being fully vaccinated, six of whom had their vaccination status validated by written records.
CommentQ fever notification and hospitalisation rates declined to record low levels during the review period. The decline follows an increase in screening and vaccination activity associated with the NQFMP; phase one was fully implemented by the end of 2002 while phase two activity was predominantly in 2003. These data are supported by a decline in claims for workers’ compensation for Q fever over this period.207 It appears, therefore, that the NQFMP has contributed to a reduction in the burden of Q fever in Australia, although it is difficult to estimate the contribution of non-program factors such as an improvement in drought conditions (droughts promote airborne dissemination) and variation in livestock slaughtering. However, the reductions are most noticeable in young adult males who were the main target in phase one of the program.
Despite these promising findings, longer term and enhanced surveillance is required to fully evaluate the impact of the NQFMP. Most jurisdictions completed the program by 2005, but Victoria and South Australia continued until 30 June 2006, and Queensland will continue until 30 June 2007.12 Ongoing surveillance is, therefore, required to detect variations between states and following completion of the program. Although there have been recent publications using enhanced state notification data to docu-ment trends in Q fever notifications by occupation,208–211 there is a need for enhanced data at a national level, including the occupation of cases and complete information about their vaccination status. Such data will help to better determine the targeted impact of the NQFMP, further understand the epidemiol-ogy of Q fever, and identify the most appropriate vaccination strategies for the future.
Australia is the only country to have implemented a vaccination program of any kind, even though Q fever has been found world-wide (except in New Zealand).195,212,213 Large outbreaks continue to be reported from many countries.214–216 However, annual rates in North America, the United Kingdom and most of Europe

S68 CDI Vol 31 Supplement 2007
Vaccine preventable diseases and vaccination coverage in Australia, 2003 to 2005
are low compared with Australia. In 2000–2004, an average of only 51 cases was reported each year in the USA217 and, since 2000, the number of reported cases in the UK has declined annually to less than 50 sporadic cases each year.218 The variation between countries may be the result of true epidemiological differences, but could also be due to differences in awareness, surveillance, or diagnostic methods.
In summary, there appears to be an impact of the NQFMP on the burden of Q fever in Australia, but confounding factors are difficult to exclude. Q fever surveillance data must, therefore, be monitored over a longer period of time to fully assess the impact of the program. In addition, more complete national surveillance data on the occupation and vaccination status of cases is recommended.
Figure 35. Q fever notification rates, Australia, 1993 to 2005,* by age group and sex
0
2
4
6
8
10
12
14
16
1993 1994 1995 1996 1997 1998 1999 2000 2001 2002 2003 2004 2005
Year of diagnosis
Not
ifica
tions
per1
00,0
00po
pula
tion
Males and Females 0-14 yrsMales 15-39 yrsFemales 15-39 yrsMales 40-64 yrsFemales 40-64 yrsMales and Females 65+ yrs
* Notifi cations where the date of diagnosis was between 1 January 1993 and 31 December 2005.
Figure 36. Q fever hospitalisation rates, Australia, 1993 to 2005,* by age group and sex
0.0
0.5
1.0
1.5
2.0
2.5
3.0
3.5
4.0
4.5
5.0
1993/94 1995/96 1997/98 1999/00 2001/02 2003/04
Year of separation
Hos
pita
lisat
ions
per1
00,0
00po
pula
tion Males and Females 0-14 yrs
Males 15-39 yrsFemales 15-39 yrsMales 40-64 yrsFemales 40-64 yrsMales and Females 65+ yrs
* Hospitalisations where date of separation was between 1 July 1993 and 30 June 2005.

CDI Vol 31 Supplement 2007 S69
Vaccine preventable diseases and vaccination coverage in Australia, 2003 to 2005
Rotavirus
Rotavirus is a non-enveloped virus that is the major cause of acute gastroenteritis in young children and infants. Virtually all children worldwide are infected with rotavirus by 3–5 years of age. However, rotavirus occurs in all age groups.219 Rotaviruses are primarily spread by faecal-oral transmission. Infection can be asymptomatic, cause mild to moderate gastroenteritis, or severe gastroenteritis with dehydration requiring hospitalisation.219 Infection with rotavirus often confers some protection against subsequent disease.220 Severe disease occurs most commonly in those aged 6 months to 2 years.221,222 Rotaviruses are typed based on two surface proteins, VP7 (G protein) and VP4 (P protein). Viruses that contain either G1, 2, 3, 4 or 9 (and either P1a or P1b) are the five most common virus types currently circulating in Australia.223
Two vaccines became available in Australia in 2006 for the prevention of rotavirus gastroenteritis. They are to be funded under the National Immunisation Program (NIP) for all infants born from 1 May 2007. The Northern Territory has made one of the rotavirus vaccines available free of charge since 1 October 2006 for infants born after 1 August 2006. Both products are oral live attenuated vaccines for use in infants in either a two-dose course at 2 and 4 months of age (Rotarix®, GlaxoSmithKline), or a three-dose course at 2, 4, and 6 months of age (RotaTeq®, CSL Limited/Merck and Co Inc). Overall, vaccination is likely to prevent around 70% of rotavirus gastroenteritis of any severity and between 85%–100% of cases of severe gastroenteritis in immunised infants/children.224,225
Case defi nitions
Notifi cations
Rotavirus is not a nationally notifi able disease. Rotavirus became notifi able in the Northern Territory in 1994. Rotavirus became laboratory notifi able in Queensland in December 2005. Other states and territories are currently adopting passive surveillance for rotavirus infections.
Hospitalisations and deaths
The ICD-9 code 008.61(for historical data) and ICD-10 code A08.0 (rotaviral enteritis) were used to identify hospitalisations and deaths. Historical death data were reviewed from 1990–2005.
Northern Territory notifi cation data
Northern Territory notifi cation data for the period January 2003 to December 2005 were included in this report. Rotavirus has been notifi able in the Northern Territory since 1994. Historical notifi cation data is published elsewhere.226 Cases notifi ed in the Northern Territory meet the following case defi nition: ‘Detection of human rotavirus in stool, unless typing reveals it is rotavirus from a vaccine’.
Secular trendsIn the three year review period (2002/2003 to 2004/2005), there were 10,733 hospitalisations for rotavirus (average annual rate of 18.0 per 100,000 total population). Rotavirus was recorded as the principal diagnosis in 89% of these hospitalisations (Table 18). There were more hospitalisations recorded in the first year of the review period than in the subsequent two years (2002/2003 n=4,071, 2003/2004 n=3,803, 2004/2005 n=2,859). In the previous three year period (1999/2000–2001/2002), the number of hospitalisations for rotavirus gastroenteritis was greatest in 1999/2000 before declining (Figure 39), consistent with known fluctuations in rotavirus disease activity between years.227 Rotavirus hospitalisations in temperate regions in Australia have a consistent seasonal pattern, with higher rates in the cooler months of the year from June to November. Data in the period reviewed here was consistent with this observation, with a low of 30 hospitalisations in February 2003 and a peak of 961 hospitalisations in August 2002 (Figure 37).
Severe morbidity and mortalityThe number of bed days and median length of stay (LOS) were calculated only for those hospitalisations with a principal diagnosis of rotavirus. There were a total of 23,454 bed days recorded for rotavirus (aver-age 7,818 per year). The median LOS was two days.

S70 CDI Vol 31 Supplement 2007
Vaccine preventable diseases and vaccination coverage in Australia, 2003 to 2005
The National Mortality Database ‘cause of death’ mortality records indicate a total of 14 deaths due to rotavirus over the last 15 years (1990–2004). Seven of the deaths occurred in children under five years of age, three in those aged 5–69 years, and four in adults aged over 70 years. Since 2001, only one death has been recorded.
Table 18. Rotavirus hospitalisations and deaths, Australia, 2002 to 2005,* by age group
Age group(years)
Hospitalisations3 years
(July 2002–June 2005)
LOS† peradmission‡
(days)
Deaths2 years
(Jan 2003–Dec 2004)n (‡) Rate§ (‡) Median n Rate§
0–4 9,662 (8,601) 254.5 (226.5) 2.0 0 05–14 841 (779) 10.3 (9.6) 2.0 0 0
15–24 26 (18) 0.3 (0.2) 2.0 0 025–59 64 (50) 0.2 (0.2) 3.0 0 0
60+ 140 (86) 1.4 (0.8) 3.0 1 0.01All ages 10,733 (9,534) 18.0 (16.0) 2.0 1 0.003
* Hospitalisations where the month of separation was between 1 July 2002 and 30 June 2005; deaths where the death was recorded in 2003 or 2004.
† LOS = length of stay in hospital.
‡ Principal diagnosis (hospitalisations).
§ Average annual age-specifi c rate per 100,000 population.
Age and sex distributionAcross all age groups slightly more males were hospitalised with rotavirus (male:female ratio 1.18:1). The vast majority of rotavirus hospitalisations occur in those under five years of age (n=9,662, Table 18). The age distribution of hospitalisations in children under 5 years of age can be seen in Figure 38. The highest rates of admission occurred in those aged 6–23 months (Table 19).
Figure 37. Rotavirus hospitalisations, Australia, 1993 to 2005,* by month of admission
0
200
400
600
800
1000
1200
1400
Jan1993
Jan1994
Jan1995
Jan1996
Jan1997
Jan1998
Jan1999
Jan2000
Jan2001
Jan2002
Jan2003
Jan2004
Jan2005
Month of admission
Num
ber
* Hospitalisations where the month of admission was between 1 July 1993 and 30 June 2005.

CDI Vol 31 Supplement 2007 S71
Vaccine preventable diseases and vaccination coverage in Australia, 2003 to 2005
Figure 38. Rotavirus hospitalisation rates, Australia, 2002 to 2005,* by age group (under 5 years)
0
100
200
300
400
500
600
<6 6-11 12-23 24-35 36-47 48-59
Age group (months)
Hos
pita
lisat
ions
per1
00,0
00po
pula
tion
* Hospitalisations where rotavirus was recorded as either a principal or any other diagnosis and the month of separation was between 1 July 2002 and 30 June 2005.
Figure 39. Rotavirus hospitalisation rates, Australia, 1998 to 2005,* by age group (under 5 years) and year of separation
0
100
200
300
400
500
600
700
800
1998/1999 1999/2000 2000/2001 2001/2002 2002/2003 2003/2004 2004/2005
Year of separation
Hos
pita
lisat
ions
per1
00,0
00po
pula
tion
0-5 months6-11 months12-23 months24-35 months36-47 months48-59 months
* Hospitalisations where rotavirus was recorded as either a principal or any other diagnosis and the month of separation was between 1 July 1998 and 30 June 2005.

S72 CDI Vol 31 Supplement 2007
Vaccine preventable diseases and vaccination coverage in Australia, 2003 to 2005
Table 19. Rotavirus hospitalisations and deaths, Australia, 2002 to 2005,* by age group (under 5 years)
Age group(months)
Hospitalisations3 years
(July 2002–June 2005)
LOS† peradmission‡
(days)
Deaths2 years
(Jan 2003–Dec 2004)n (‡) Rate§ (‡) Median n Rate§
0–5 1,090 (768) 320.1 (206.6) 2.0 0 07–11 1,773 (1,526) 476.9 (410.5) 2.0 0 0
12–23 3,519 (2,951) 470.7 (394.7) 2.0 0 024–35 1,849 (1,609) 243.6 (212.0) 2.0 0 036–47 906 (801) 117.5 (103.9) 2.0 0 048–59 517 (452) 66.7 (58.3) 2.0 0 0
All ages 9,654 (8,107) 256.9 (213.9) 2.0 0 0
* Hospitalisations where the month of separation was between 1 July 2002 and 30 June 2005; deaths where the death was recorded in 2003 or 2004.
† LOS = length of stay in hospital.
‡ Principal diagnosis (hospitalisations).
§ Average annual age-specifi c rate per 100,000 population.
Geographical distributionOver the period 2002/2003 to 2004/2005, the Northern Territory recorded over five times the Australian average rate of hospitalisation for rotavirus gastroenteritis (Northern Territory rate: 99.3 per 100,000 population) (Appendix 3). Victoria had the lowest rate of hospitalisation (8.5 per 100,000 population), less than half the Australian average. However, comparison of hospitalisation rates between jurisdictions is complicated by likely differences in testing practices for rotavirus, which may, in part, explain the differences in observed rates of hospitalisation.221,228
Northern Territory notification data, rotavirusA total of 901 cases were notified from January 2003 to December 2005, an average annual rate of 149.7 per 100,000 total population. In 2004, there were almost twice as many notifications (n=407) as in 2002 (n=238) or 2005 (n=256). The male to female ratio amongst notified cases was 1.26:1.
The rate of notification for rotavirus was significantly higher than the hospitalisation rate in the Northern Territory. The notification data from the Northern Territory generally has a younger age structure than hospitalisation data from all of Australia (Figure 40).
CommentRotavirus is responsible for a significant number of hospitalisations in Australia each year (around 3,500 hosp italisations were recorded annually with either a principal or non-principal diagnosis of rotavirus). The primary disease burden is in those under five years of age, with hospitalisations most com-mon in the first two years of life. Universal immunisation of infants in the first six months of life under the NIP should prevent the majority of severe cases of rotavirus and it is anticipated that hospitalisation rates will be substantially reduced. However, it will be important to encourage timeliness of vaccination in order to ensure a maximal impact upon disease. Ongoing analysis of national hospitalisation data will provide valuable data to help assess the impact of a national vaccination program.
In addition to the caveats required in the interpretation of hospitalisation data, the use of the specific rotavirus code (A08.0) for quantifying rotavirus hospitalisations has substantial limitations. Although hospitalised patients with laboratory-confirmed rotavirus infection are likely coded as rotavirus gastro-enteritis, laboratory testing for rotavirus antigen in stool specimens of children hospitalised with acute gastroenteritis is not often conducted. Clinical guidelines for the management of acute uncomplicated gastroenteritis do not recommend routine stool testing for confirmation of the aetiological agent.229 Several international studies have shown that measurement of rotavirus hospitalisation rates utilising the specific rotavirus code underestimated the true number of rotavirus-associated hospitalisations.230,231 Two Australian studies have estimated the burden of rotavirus hospitalisations, as a percentage of the

CDI Vol 31 Supplement 2007 S73
Vaccine preventable diseases and vaccination coverage in Australia, 2003 to 2005
number of acute gastroenteritis (AGE) hospitalisations using distinct methodologies. Both studies, con-ducted a decade apart, estimated that rotavirus is responsible for approximately 10,000 hospitalisations annually.228,232 In addition, emergency department visits for rotavirus were estimated as a percentage of AGE emergency department visits at approximately 21,500 annually.232 These estimations may be a more accurate picture of the true hospitalisation disease burden.
The Australian Rotavirus Surveillance Program was initiated in June 1999 to monitor changes in the distribution of rotavirus serotypes over time. Historically, the dominant serotype in Australia and world-wide has been G1.233 Recent surveillance reports noted a dramatic increase in the prominence of the G9 serotype in the years 2002–2003,234,235 followed by a decline in G9 prevalence in subsequent years.223,236
It appears likely that both rotavirus vaccines are effective against the G9 serotype, as well as the majority of other serotypes detected in Australia.224,225
Data from the Northern Territory hospitalisations and notifications emphasises the higher burden of dis-ease in the region, particularly in Indigenous infants and children. Historically, the Northern Territory has experienced epidemics of rotavirus on the background of endemic disease.226 These epidemics are thought to result from the relative isolation of remote communities with a lack of circulating strains, which then see a rapid spread of infection upon reintroduction of the virus.226,237,238
Compared with other developed countries, Australia has a relatively high rate of hospitalisation, with an estimated one in 26 children hospitalised by five years of age.232 In Europe it is estimated that one in 50 children are hospitalised by the age of five years, although estimates vary by country and study meth-ods.239 Although there are limited data on nosocomial rotavirus infections in Australia, it is recognised as a significant problem in paediatric wards and hospitals, with at least 14%–19% of all rotavirus infections being hospital acquired.240,241 Timely vaccination should control this.
Acknowledgements: Rosalie Schultz, Peter Markey and Christine Selvey, Centre for Disease Control, Northern Territory.
Figure 40. Rotavirus notifications, the Northern Territory, 2003 to 2005,* by age group (under 5 years)
0
1000
2000
3000
4000
5000
6000
<6 6-11 12-23 24-35 36-47 48-59
Age group (months)
Not
ifica
tions
per1
00,0
00po
pula
tion
* Notifi cations that were recorded between 1 January 2003 and 31 December 2005.

S74 CDI Vol 31 Supplement 2007
Vaccine preventable diseases and vaccination coverage in Australia, 2003 to 2005
Rubella
Rubella is caused by the rubella virus (family togaviridae). It is usually a mild, febrile, viral disease characterised by a rash, conjunctivitis, coryza, postauricular and suboccipital lymphadenopathy, and nausea, but may be subclinical in up to 50% of cases. Arthralgia and arthritis may also occur, particularly in women. More severe disease manifestations, such as encephalitis, haemorrhage and Guillain-Barré syndrome, may also rarely occur. Rubella is important because of its ability to produce death or abnormali-ties in the developing fetus (congenital rubella syndrome (CRS)) when acquired in early pregnancy.242
Case defi nition
See Appendix 6 for pre-2004 defi nition
National defi nition from January 2004:11
A confi rmed case requires laboratory defi nitive evidence. A probable case requires clinical evidence and either laboratory suggestive evidence or an epidemiological link to a laboratory-confi rmed case.
a) Laboratory defi nitive evidence
• Isolation of rubella virus; or
• Detection of rubella virus by nucleic acid testing; or
• IgG seroconversion or a signifi cant increase in antibody level or a fourfold or greater rise in titre to rubella virus in the absence of recent rubella vaccination in paired sera tested in parallel; or
• Detection of rubella-specifi c IgM antibody in the absence of recent rubella vaccination (must be confi rmed in a reference laboratory in pregnant women).
b) Laboratory suggestive evidence
• In a pregnant patient, the detection of rubella-specifi c IgM antibody that has not been confi rmed in a reference laboratory, in the absence of recent rubella vaccination.
c) Clinical evidence
• A generalised maculopapular rash and fever, and one or more of: arthralgia/arthritis or lymphadenopathy or conjunctivitis.
Hospitalisations and deaths
The ICD-10-AM/ICD-10 code B06 (rubella [German measles]) was used to identify hospitalisation and deaths.
Congenital rubella cases were not included in this report. Reviews of congenital rubella cases recorded by the Australian Paediatric Surveillance Unit between 1993 and 2004 are available elsewhere.243,244
Secular trendsBetween January 2003 and December 2005, there were 116 notified cases of rubella, an average annual notification rate of 0.2 per 100,000 (Table 20). There was a continuing and marked decline in the number of notifications with a more than sevenfold decrease between the current and previous three year period (2000–2002) when there were 844 cases notified. There were 54 notifications in 2003 (0.27 per 100,000) and 31 notifications (0.15 per 100,000) in 2004 and again in 2005. Between July 2002 and June 2005, 44 hospitalisations were coded as being due to rubella (an average annual rate of 0.07 per 100,000). Hospitalisations coded as rubella fell to historical lows, with 21 separations in 2002/2003, 18 in 2003/2004 and only five in 2004/2005. The current low incidence of rubella now means that the previously discern-ible spring peaks3 in rubella activity are no longer observed (Figure 41).
Severe morbidity and mortalityIn the period 2002/2003–2004/2005, 131 hospital bed days (average 44 per year) were recorded for patients with an ICD-10-AM code for rubella. In 2004/2005, there were only 10 hospital bed days coded with rubella. Of the hospital separations, 75% had a principal diagnosis of rubella (average annual rate 0.06 per 100,000). The median length of stay in hospital was two days, but increased with age (Table 20). In 2003 to 2004, there were no deaths with rubella recorded as the underlying cause.

CDI Vol 31 Supplement 2007 S75
Vaccine preventable diseases and vaccination coverage in Australia, 2003 to 2005
Complications arising from rubella infection were recorded for five (11%) hospitalisations (Table 21). Only one case with complications was recorded in a child. Neither of the two cases with neurological complications was also coded as having other complications of rubella.
Table 20. Rubella notifications, hospitalisations and deaths, Australia, 2002 to 2005,* by age group
Age group(years)
Notifi cations3 years
(2003–2005)
Hospitalisations3 years
(July 2002–June 2005)
LOS† per admission
(days)
Deaths 2 years(2003–2004)
n Rate‡ n (§) Rate‡ (§) Median (§) n Rate‡
0–4 12 0.32 21 (17) 0.55 (0.45) 1.0 (1.0) 0 05–14 2 0.02 3 (2) 0.04 (0.02) n.p. 0 0
15–24 43 0.52 7 (6) 0.09 (0.07) 2.0 (2.0) 0 025–59 56 0.19 10 (6) 0.03 (0.02) 3.0 (1.0) 0 0
60+ 3 0.03 3 (2) 0.03 (0.02) n.p. 0 0All ages 116 0.19 44 (33) 0.07 (0.06) 2.0 (1.0) 0 0
* Notifi cations where the month of diagnosis was between January 2003 and December 2005; hospitalisations where the month of separation was between 1 July 2002 and 30 June 2005; deaths where the death was recorded in 2003 or 2004.
† LOS = length of stay in hospital.
‡ Average annual age-specifi c rate per 100,000 population.
§ Principal diagnosis (hospitalisations).
n.p. Not published due to small cell sizes.
Figure 41. Rubella notifications and hospitalisations, Australia, 1993 to 2005,* by month of diagnosis or admission
0
200
400
600
800
1000
1200
1400
Jan1993
Jan1994
Jan1995
Jan1996
Jan1997
Jan1998
Jan1999
Jan2000
Jan2001
Jan2002
Jan2003
Jan2004
Jan2005
Year
Not
ifica
tions
0
10
20
30
40
50
60
70
80
90
Hos
pita
lisat
ions
NotificationsHospitalisations
0
20
40
60
80
100
120
Jan-
98Ju
l-98
Jan-
99Ju
l-99
Jan-
00Ju
l-00
Jan-
01Ju
l-01
Jan-
02Ju
l-02
Jan-
03Ju
l-03
Jan-
04Ju
l-04
Jan-
05Ju
l-05
0
5
10
15
20
25
30
Note: varying scales between notifi cations and hospitalisations.
* Notifi cations where the month of diagnosis was between January 1993 and December 2005; hospitalisations where the month of admission was between 1 July 1993 and 30 June 2005.

S76 CDI Vol 31 Supplement 2007
Vaccine preventable diseases and vaccination coverage in Australia, 2003 to 2005
Table 21. Indicators of severe morbidity* for hospitalised cases of rubella
Age group(years)
Complication neurological Complication other
n % total n % total0–4 0 0.0 1 4.8
5–14 0 0.0 0 0.015–24 0 0.0 0 0.025–59 1 10.0 0 0.0
60+ 1 33.3 2 66.7All ages 2 4.5 3 6.8
* Measured using National Hospital Morbidity data where the month of hospital separation was between 1 July 2002 and 30 June 2005.
Age and sex distributionFor the three year review period, notification rates were highest in the 20–24 year old age group, who accounted for nearly a quarter (24%) of cases (average annual rate 0.67 per 100,000). Within this age group, males predominated (male:female ration 3.5:1) and it was the only group where the notification rate was over one per 100,000. Together, the 25–29 year and 30–34 year age groups accounted for a further 31% of rubella notifications, with 18 notifications in each of these groups over the three year period (data not shown). The progressive increase seen in the median age of notified cases since the Measles Control Campaign (MCC) in 1998 has plateaued in the last three years, with the median age for notified cases of 25 years in each year 2003–2005 (up from 22 years in 2002.)
In 2003–2005, the male to female ratio for notifications was 1.3:1. This ratio disguises some variation by age group, with males predominating both in infants 0–4 years (10/12 cases) and in those aged over 20 years, but more female than male cases in the 15–19 year age group (11/15 cases). However, due to the low number of cases, these differences should be interpreted with caution.
For the three years combined, 2002/2003–2004/2005, children aged 0–4 years continued to have the highest hospitalisation rates (average annual rate 0.6 per 100,000). Whilst two thirds of hospitalisations in this group were males, the overall male to female ratio for hospitalisations was identical to the ratio for notifications (1.3:1). Whilst just over half of the hospitalisations were in infants too young to be vaccinated (11/21 aged under one year), no notifications were received for infants under one year of age in 2003–2005.
There were 40 notified cases of rubella in women of child bearing age (15–44 years) in 2003–2005, an average annual rate of 0.3 per 100,000. This rate has been declining each year since the outbreak in 1995 (rate 16.0 per 100,000) and is a notable decline from the previous reporting period 2001–2002 when the rate was 1.1 per 100,000. Within this age range, and indeed for any female age group, highest rates were reported in those aged 15–19 years (0.6 per 100,000).
Geographical distributionMost of the notifications received in 2003–2005 were from New South Wales (n=50; rate 0.25 per 100,000) or Queensland (n=43; rate 0.37 per 100,000). In both states, notifications were highest in 2003, following a peak in rubella activity in Queensland in 2002 which was associated with two cases of locally acquired congenital rubella syndrome, and then declined.
No notifications of rubella were received in the Northern Territory or the Australian Capital Territory during 2003–2005. Very low numbers of cases were reported sporadically in Victoria, South Australia and Tasmania (rates of 0.07 per 100,000 or less.) In Western Australia, 12 cases were reported through the period (0.2 per 100,000) (Appendix 2).
Four notifications, all in persons aged 18–36 years, were recorded on NNDSS as imported cases (i.e. ac-quired whilst overseas).
Hospitalisation rates varied over time and between states and territories (Appendix 3). However, there were too few cases in each jurisdiction to identify any trends.

CDI Vol 31 Supplement 2007 S77
Vaccine preventable diseases and vaccination coverage in Australia, 2003 to 2005
Vaccination statusVaccination status for rubella cases is to be recorded on NNDSS for women of child bearing age (15–45 years). Whilst the vaccination status field was completed for all 40 cases, it was categorised as “unknown” in about one third of these (35%). Most women with known vaccination status were
Figure 42. Rubella notification rates, Australia, 1999 to 2005,* by age group, sex and year of diagnosis
0
1
2
3
4
5
6
7
8
9
10
1999 2000 2001 2002 2003 2004 2005
Year of diagnosis
Not
ifica
tions
per1
00,0
00po
pula
tion
Males, 0-14 yrsFemales, 0-14 yrsMales, 15-24 yrsFemales, 15-24 yrsMales, 25+ yrsFemales, 25+ yrs
* Notifi cations where date of diagnosis was between 1 January 1999 and 31 December 2005.
Figure 43. Rubella hospitalisation rates, Australia, 1999/2000 to 2004/2005,* by age group, sex and year of separation
0.0
0.1
0.2
0.3
0.4
0.5
0.6
1999/00 2000/01 2001/02 2002/03 2003/04 2004/05
Year of separation
Hos
pita
lisat
ions
per1
00,0
00po
pula
tion
Males, 0-14 yrsFemales 0-14 yrsMales 15-24 yrsFemales 15-24 yrsMales, 25+ yrsFemales, 25+ yrs
* Hospitalisations where date of separation was between 1 July 1999 and 30 June 2005.

S78 CDI Vol 31 Supplement 2007
Vaccine preventable diseases and vaccination coverage in Australia, 2003 to 2005
unvaccinated (16/26; 62%). Whilst five women reported being fully vaccinated against rubella (i.e. two doses), this was not validated by written records. Vaccination status was confirmed in three of five women who reported partial vaccination (i.e. one dose).
CommentRubella notification and hospitalisation rates continue to decline and, in the most recent year reviewed, were the lowest on record. The adoption of a more specific national case definition in 2004 may have in part contributed to the ongoing decline in notifications. Hospitalisation data reported here suggest that either infants too young to be immunised are still at some (albeit small) risk of rubella in Australia or that coding errors or misdiagnosis are more likely to occur in paediatric age groups. There is no doubt that rubella control is a great immunisation success story in Australia but what challenges remain?
Notification data suggest that there remain vulnerable groups within the Australian population, particu-larly young males who missed out on both school based immunisation programs and natural infection.245 The Queensland rubella ‘outbreak’ of 2001/2002 clearly demonstrated that there are sufficient pockets of susceptibility to rubella within the Australian population to maintain rubella circulation amongst vulnerable individuals for some time and, unfortunately in this context, the risk of locally acquired CRS remains.246,247 Young women who have migrated to Australia may also be vulnerable due to lack of rubella vaccination programs in their countries of origin; in the last two years, six imported CRS cases were notified to the APSU.243,244 Two recent studies of rubella serology records from women’s hospitals in Melbourne and Sydney confirm that overseas born women, particularly from Asia but also from South America and sub-Saharan Africa, are more likely to be non-immune to rubella than other Australian women.248,249 Also of concern, a study of antenatal screening records identified that rural and remote Indigenous women in the Northern Territory have low rates of rubella immunity and, thus, remain susceptible to rubella.250 Antenatal rubella screening and post-natal vaccination, and rubella programs targeting women in these risk groups, will be important components of ongoing rubella control.
Those travelling within the Western Pacific region (and internationally) are at risk of rubella exposure. In 2005, 117 countries, covering 26% of the international birth cohort, were using rubella vaccines in their national immunisation programs.251 Although very few cases on NNDSS were identified as imported cases (n=4), importation status was poorly completed on NNDSS (66% of records had this field missing). WHO received 28,659 notifications of rubella from the Western Pacific Region in 2005. This is a gross underestimate of the disease burden given that many cases are asymptomatic and many countries within the region do not have rubella surveillance or rubella vaccination programs. Rubella outbreaks have been documented in recent years in Tonga and Samoa, and these outbreaks were associ-ated with high rates of rubella encephalitis.252,253 The major regional focus of the Expanded Program on Immunization has been measles control and hepatitis B immunisation. With the increasingly successful achievements of the former target comes the opportunity for rubella programs, which require either targeting of women of child bearing age or sustained high coverage rates of the population. Guidelines to assist countries in assessing the appropriateness of adding rubella control strategies have recently been prepared by the WHO Western Pacific Regional Office. An assessment of local epidemiology, proper surveillance and coverage levels and an ability to meet and sustain the cost of MR vaccine over measles vaccine are critical.252,253
The data reviewed here suggest that Australia may be close to elimination of locally acquired rubella. In this respect, the recent elimination of rubella in the USA254 and the European plan to eliminate rubella by 2010255 will serve as good examples of possible ways forward. The United States declaration of rubella elimination could only occur in the context of a Pan American regional approach, in which successful mass immunisation campaigns, using the ‘catch-up, keep-up and follow-up’ strategies, achieved high population immunity and low disease incidence in neighbouring countries such as Mexico.256 Similar to US requirements, Australia might consider targeted immunisation campaigns for immigrants from low prevalence countries. Whilst Australia already conducts measles genotyping, which provides molecular evidence that there is no indigenous strain of measles circulating, rubella genotyping is not performed. Internationally, the standardisation of nomenclature and genotyping methodology for rubella are con-tinuing to be developed and, at this time, genotyping of rubella has not been performed in Australia.257–259 Despite its continuing development, rubella genotyping has proven a critical tool in declaring the absence of local rubella circulation in the US.260 In Australia, it is increasingly important that suspected rubella cases have specimens collected for PCR which, if positive, can be referred for genotyping.

CDI Vol 31 Supplement 2007 S79
Vaccine preventable diseases and vaccination coverage in Australia, 2003 to 2005
Tetanus
Tetanus is a disease induced by an exotoxin of the Clostridium tetani bacterium, which grows anaerobi-cally at the site of an injury. The disease is characterised by painful muscle contractions, primarily of the masseter and neck muscles, secondarily of the trunk muscles. The case-fatality rate ranges from 10% to 90%, with the highest rates in infants and the elderly.44
Case defi nition
See Appendix 6 for pre-2004 defi nition
National defi nition from January 2004:11
Confi rmed cases require either laboratory defi nitive evidence or clinical evidence.
a) Laboratory defi nitive evidence
• Isolation of Clostridium tetani from a wound in a compatible clinical setting and prevention of positive tetanospasm in mouse test from such an isolate using specifi c tetanus antitoxin.
b) Clinical evidence
• A clinically compatible illness without apparent cause.
Hospitalisations and deaths
The ICD-10-AM/ICD-10 codes A34 (obstetrical tetanus) and A35 (other tetanus) were used to identify hospitalisations and deaths.
Secular trendsThere were 11 notifications of tetanus in the January 2003 to December 2005 review period (an aver-age annual notification rate of 0.02 per 100,000). However, in the period July 2002 to June 2005, there were 66 hospitalisations coded as tetanus (an average annual rate of 0.11 per 100,000). Notifications for tetanus remained relatively stable between 2002 and 2005, ranging from two to five notifications annually. Hospitalisations for tetanus declined between 2002/2003 and 2004/2005 (Figure 44).
Figure 44. Tetanus notifications and hospitalisations, Australia, 1993 to 2005,* by year of diagnosis or admission
0
5
10
15
20
25
30
35
40
45
1993 1994 1995 1996 1997 1998 1999 2000 2001 2002 2003 2004 2005
Year
Num
ber
Notifications
Hospitalisations
* Notifi cations where the year of diagnosis was between January 1993 and December 2005; hospitalisations where the month of admission was between 1 July 1993 and 30 June 2005.

S80 CDI Vol 31 Supplement 2007
Vaccine preventable diseases and vaccination coverage in Australia, 2003 to 2005
Severe morbidity and mortalityA total of 1,061 hospital bed days (average 354 per year) were recorded for patients with an ICD-10-AM code for tetanus. Of the 66 separations, 46 (70%) had tetanus recorded as the principal diagnosis. The median length of stay in hospital was 4.5 days and varied depending on age. Adults aged 60 years and over had longer median lengths of stay (Table 22).
Table 22. Tetanus notifications, hospitalisations and deaths, Australia, 2002 to 2005,* by age group
Age group(years)
Notifi cations3 years
(2003–2005)
Hospitalisations3 years
(July 2002–June 2005)
LOS† per admission
(days)
Deaths2 years
(2003–2004)n Rate‡ n (§) Rate‡ (§) Median (§) n Rate‡
0–4 0 0.00 0 (0) 0.00 (0.00) 0.0 (0.0) 0 0.005–14 0 0.00 1 (1) 0.01 (0.01) n.p. 0 0.00
15–24 0 0.00 6 (4) 0.07 (0.05) 1.0 (1.0) 0 0.0025–59 0 0.00 15 (9) 0.05 (0.03) 2.0 (2.0) 0 0.00
60+ 11 0.10 44 (32) 0.43 (0.31) 12.0 (10.0) 0 0.00All ages 11 0.02 66 (46) 0.11 (0.08) 4.5 (3.5) 0 0.00
* Notifi cations where the month of diagnosis was between January 2003 and December 2005; hospitalisations where the month of separation was between 1 July 2002 and 30 June 2005; deaths where the death was recorded in 2003 or 2004.
† LOS = length of stay in hospital.
‡ Average annual age-specifi c rate per 100,000 population.
§ Principal diagnosis (hospitalisations).
n.p. Not published due to small cell size.
In the review period (2003–2004), there were no deaths in the AIHW mortality database with tetanus recorded as the underlying cause. However, there was one death (in 2004) amongst notified cases reported to NNDSS for the period 2003–2005.
Age and sex distributionAll of the notified case patients and the majority of the hospitalised patients (44/66, 67%) were aged 60 years and over. The youngest hospitalised case was a child aged 5–14 years. The male:female ratio of notified cases was 0.84:1, but there were fewer hospitalised female patients, with a male:female ratio of 1.2:1. In the age group 70 years and over, 66% of the hospitalised cases (23/35) were males.
For both notifications and hospitalisations, rates increased with increasing age (Figure 45). Males aged 70 years and over had the highest average annual hospitalisation rate (0.98 per 100,000).
Geographical distributionNotification and hospitalisation rates varied over time and between states and territories (Appendices 2 and 3). However, there were too few cases in each jurisdiction to identify any trends.
Vaccination statusThe vaccination status of 73% (8/11) of notified cases in NNDSS was “unknown” in 2003–2005. No case was reported as fully vaccinated.
CommentThere has been a downward trend in tetanus hospitalisation rates. Hospitalisation rates remain higher for tetanus than notification rates. It is likely that this discrepancy is principally due to under-reporting, together with multiple hospital admissions for the same case and coding errors.261 Coding errors may have resulted from misclassification of other conditions as tetanus, especially where tetanus was not the

CDI Vol 31 Supplement 2007 S81
Vaccine preventable diseases and vaccination coverage in Australia, 2003 to 2005
principal diagnosis. Notifications of tetanus rely heavily on clinicians rather than laboratories, as labora-tory confirmation of the diagnosis is rarely possible. Clinicians are known to under-notify hospitalised cases of disease;19 thus, under-notification for tetanus is likely.
Tetanus is a disease of older adults. In Australia, booster doses of tetanus vaccine are thought to be poorly utilised, as noted in Canada and Switzerland.262,263 The major impetus for tetanus immunisation in adults is injury,262 but tetanus occurs in cases with trivial or no known injury and the definition of a ‘tetanus prone’ wound is unclear.264,265 International serosurveys and the Australian National Serosurvey have shown progressively lower prevalence of levels of tetanus antibody in older age groups, particularly in women.58,266–269 Although the tetanus organism is ubiquitous in the environment, and the vaccine only provides individual level protection against the toxin, tetanus vaccination programs have had a signifi-cant impact upon the disease burden in Australia. The current tetanus notification rate in Australia is similar to that in other developed countries.264,270–272 A tetanus booster is recommended at the age of 50 unless a booster has been documented within 10 years.76 Whilst the data presented in this report suggest that this is an appropriate recommendation, strategies to improve vaccine uptake at this age need to be investigated. As both notifications and hospitalisations predominate in those aged 65 years and over, review of tetanus immunisation status at the time of annual influenza vaccination is clearly appropriate. Young and middle-aged people have been the focus of a recent tetanus outbreak amongst intravenous drug users in the United Kingdom and also comprise an increasing proportion of notifications in the United States.271,273 Therefore, maintenance of immunity in young adults, through the scheduled booster dose at age 15–17 years, is also important.
Figure 45. Tetanus notification and hospitalisation rates, Australia, 2003 to 2005,* by age group
0.0
0.1
0.2
0.3
0.4
0.5
0.6
0.7
0.8
< 55 55 - 69 >70
Age group (years)
Rat
epe
r100
,000
popu
latio
n
Notification
Hospitalisation
* Notifi cations where the month of diagnosis was between January 2003 and December 2005; hospitalisations where the month of separation was between 1 July 2002 and 30 June 2005.

S82 CDI Vol 31 Supplement 2007
Vaccine preventable diseases and vaccination coverage in Australia, 2003 to 2005
Varicella-zoster virus infection
Varicella (chickenpox) is a highly contagious infection caused by the varicella-zoster virus (VZV). The average incubation period is 14–15 days, and is followed by the appearance of a rash. About 5% of infec-tions are subclinical. Acute varicella may be complicated by cerebellitis, aseptic meningitis, transverse myelitis, thrombocytopenia and pneumonia.44
In unvaccinated populations, varicella is primarily a childhood illness with more than 90% of the popula-tion in temperate countries developing clinical or serological infection by adolescence.274 In Australia, however, seropositivity was 83% by age 10–14 years.275 Varicella is generally a benign, self-limiting illness in children, but morbidity and mortality rates are higher in adults,276 at the extremes of ages, and in the immunocompromised.277 A universal infant varicella vaccination program was introduced in Australia in 2005.
Herpes zoster (HZ) or shingles is a sporadic disease, caused by reactivation of latent VZV. It is usually self-limiting and is characterised by severe dermatomal pain, often followed by post-herpetic neuralgia, which can be chronic and debilitating in the elderly.278 Although herpes zoster can occur at any age, most cases occur after the age of 50 and incidence increases with age.279 However, children infected in utero or those who acquire varicella before the age of one year, and patients on immunosuppressive drugs or infected with human immunodeficiency virus, are also at increased risk of herpes zoster.280–282 A new her-pes zoster vaccine which is over 60% effective in reducing the burden of herpes zoster and post-herpetic neuralgia283 is likely to be available in Australia in 2007.
Case defi nitions
Notifi cations
Varicella is not a nationally notifi able disease. Varicella and herpes zoster became notifi able in South Australia in 2002. Varicella zoster virus infection became laboratory notifi able in Queensland in December 2005. Other jurisdictions are considering varicella zoster surveillance.
Hospitalisations and deaths
The ICD-10-AM/ICD-10 code B01 (varicella [chickenpox]) was used to identify varicella hospitalisations and deaths. The ICD-10-AM/ICD-10 code B02 (zoster [shingles]) was used to identify herpes zoster hospitalisations and deaths.
South Australian surveillance data
South Australian notifi cation data were included in this report. Varicella and herpes zoster have been notifi able diseases in South Australia since 2002. Clinical diagnoses of chickenpox or herpes zoster, and laboratory diagnoses of varicella-zoster virus infection, are considered confi rmed cases for the purposes of surveillance.
Secular trends, varicella and herpes zosterThere were 4,281 hospitalisations (average annual hospitalisation rate 7.2 per 100,000) for varicella between 1 July 2002 and 30 June 2005 (Table 23). A median of 124 cases of varicella (range 60–197) was hospitalised per month (Figure 46). The rate and median monthly admissions are slightly lower than the period 2000–2002, but longer term surveillance is required to determine if this is random fluctuation or a meaningful decrease.
Figure 46 shows that there are significantly more hospitalisations for herpes zoster than varicella. There were 14,926 hospitalisations (average annual hospitalisation rate 25 per 100,000 for all herpes zoster and 10.7 per 100,000 for herpes zoster as a principal diagnosis), between 1 July 2002 and 30 June 2005 (Table 25). A median of 410 cases of herpes zoster (range 310–465) were hospitalised per month (Figure 46). The rate and median monthly admissions are very slightly higher than the period 2000 to 2002, but longer term surveillance is required to determine if this is random fluctuation or a meaningful increase.
There was demonstrable seasonality, with hospitalisations for varicella peaking in late spring/early sum-mer and dropping in late summer/early autumn.

CDI Vol 31 Supplement 2007 S83
Vaccine preventable diseases and vaccination coverage in Australia, 2003 to 2005
Severe morbidity and mortality, varicellaFor patients with an ICD-10-AM code for chickenpox, 21,872 hospital bed days (average 7,290 per year) were recorded from 2002–2005. Of the 4,281 varicella hospitalisations, 2,816 (66%) had a principal diag-nosis of varicella (average annual rate 4.7 per 100,000) (Table 23). Complications arising from varicella infection were recorded for 1,374 hospitalisations (32%). Of all varicella hospitalisations, 115 (2.7%) were coded as having encephalitis and 433 (10.1%) were coded as having pneumonitis (Table 24). Although most hospitalisations were in the youngest age group, people aged 60 years and over had the longest median length of stay. There were 11 deaths recorded with varicella as the underlying cause in the cal-endar years 2003–2004, six (54%) of them for people aged 60 years and over. The highest death rate was in children aged 0–4 years.
Table 23. Varicella hospitalisations and deaths, Australia, 2002 to 2005,* by age group
Age group(years)
Hospitalisations3 years
(July 2002–June 2005)
LOS† per separation
(days)
Deaths2 years
(2003–2004)n (§) Rate‡ (§) Median (§) n Rate‡
0–4 1,597 (1,076) 42.1 (28.4) 2.0 (2.0) 3 0.125–14 668 (421) 8.2 (5.2) 2.0 (2.0) 0 0.00
15–24 403 (274) 4.9 (3.4) 2.0 (2.0) 0 0.0025–59 1,258 (885) 4.3 (3.0) 3.0 (3.0) 2 0.01
60+ 355 (160) 3.5 (1.6) 9.0 (7.0) 6 0.09All ages 4,281 (2,816) 7.2 (4.7) 2.0 (2.0) 11 0.03
* Hospitalisations where the month of separation was between 1 July 2002 and 30 June 2005; deaths where the death was recorded in 2003 or 2004.
† LOS = length of stay in hospital.
‡ Average annual age-specifi c rate per 100,000 population.
§ Principal diagnosis (hospitalisations).
Figure 46. Varicella and herpes zoster hospitalisations, Australia, July 1993 to June 2005,* by month of admission
0
50
100
150
200
250
300
350
400
450
500
Jan1993
Jan1994
Jan1995
Jan1996
Jan1997
Jan1998
Jan1999
Jan2000
Jan2001
Jan2002
Jan2003
Jan2004
Jan2005
Year
Num
ber
Varicella
Zoster
* Hospitalisations where the month of admission was between 1 July 1993 and 30 June 2005.

S84 CDI Vol 31 Supplement 2007
Vaccine preventable diseases and vaccination coverage in Australia, 2003 to 2005
Table 24. Indicators of severe morbidity* for hospitalised cases of varicella, Australia, 2002 to 2005,* by age group
Age group(years)
Varicella encephalitis Varicella pneumonitisn % of cases n % of cases
0–4 22 1.4 51 3.25–14 33 4.9 15 2.2
15–24 10 2.5 41 10.225–59 24 1.9 295 23.4
60+ 26 7.3 31 8.7All ages 115 2.7 433 10.1
* Measured using National Hospital Morbidity data where the month of separation was between 1 July 2002 and 30 June 2005.
Age and sex distribution, varicellaThe highest number and rate of varicella hospitalisations occurred in the youngest age groups, especially the 0–4 years age group (Table 23, Figure 47). Within the age group 0–4 years (Figure 48), a decrease in the 12–23 months age group was observed in 2004/2005, a period which includes the introduction of universal varicella immunisation at 12 months of age, compared to the previous years. For the first time, hospitalisation rates were higher in infants aged less than 12 months than in those aged 12–23 months. The overall male:female ratio of hospitalisations was 1.2:1. Males predominated in all age groups except in young adults aged 15–29 years where there was a slight female predominance (data not shown). Of the 11 varicella deaths, five were males.
Figure 47. Varicella hospitalisation rates, Australia, 2002 to 2005,* by age group and sex
0
10
20
30
40
50
60
70
0-4 5-9 10-34 35+
Age group (years)
Hos
pita
lisat
ions
per1
00,0
00po
pula
tion Males
Females
* Hospitalisations where the date of separation was between 1 July 2002 and 30 June 2005.

CDI Vol 31 Supplement 2007 S85
Vaccine preventable diseases and vaccination coverage in Australia, 2003 to 2005
Geographical distribution, varicellaFor the years 2002/2003–2004/2005, the Northern Territory had the highest average annual hospitalisa-tion rate (10.6 per 100,000) with all other states recording average annual rates between 6 and 8 per 100,000. Hospitalisation rates in the Australian Capital Territory were lower (average annual rate 3.2 per 100,000) (Appendix 3).
South Australian surveillance data, varicellaFigure 49 shows the notifications of varicella by month of notification from January 2002 to December 2005. There is a clear seasonality in the reported incidence of varicella. A total of 2,564 cases of chickenpox were notified in the current review period (2003–2005), an average annual rate of 56 per 100,000. Figure 50 shows the notifications by gender and age for the current review period. In addition to clinical diagnoses of chickenpox and zoster (reported below), 242 laboratory diagnoses of varicella-zoster were received.
Figure 48. Varicella hospitalisation rates, Australia, 2000 to 2005,* by age group (0–4 years) and year of separation
0
10
20
30
40
50
60
70
80
90
100
2000/2001 2001/2002 2002/2003 2003/2004 2004/2005
Year of separation
Hos
pita
lisat
ions
per1
00,0
00po
pula
tion
<12 months12-23 months24-36 months36-47 months48-59 months
* Hospitalisations where the date of separation was between 1 July 2000 and 30 June 2005.

S86 CDI Vol 31 Supplement 2007
Vaccine preventable diseases and vaccination coverage in Australia, 2003 to 2005
Severe morbidity and mortality, herpes zosterFor patients with an ICD-10-AM code for herpes zoster, 175,164 hospital bed days (average 58,388 per year) were recorded. Of the 14,926 herpes zoster hospitalisations, 6,387 (43%) had a principal diagnosis of HZ (average annual rate 10.7 per 100,000) (Table 25). Complications arising from HZ infection were recorded for 7,576 hospitalisations (50.7%). Of all HZ hospitalisations, 139 (0.93%) were coded as having disseminated HZ and 1,817 (12.2%) were coded as having ocular complications (Table 26). By far the greatest number of hospitalisations were in the oldest age group, who also had the longest median length
Figure 49. Varicella notifications, South Australia, 2002 to 2005, by month of notification
0
20
40
60
80
100
120
140
160
Jan-02 Jul-02 Jan-03 Jul-03 Jan-04 Jul-04 Jan-05 Jul-05
Year
Num
ber
* Notifi cations where the date of notifi cation was between 1 January 2002 and 31 December 2005.
Figure 50. Varicella notifications, South Australia, 2003 to 2005,* by age group and sex
0
50
100
150
200
250
300
350
400
0-4 5-9 10-19 20-29 30-39 40-49 50-59 60-69 70-79 80+
Age group (years)
Not
ifica
tions
per1
00,0
00po
pula
tion
0
100
200
300
400
500
600N
umbe
r
Number of males
Number of females
Rate of males
Rate of females
* Notifi cations where the date of notifi cation was between 1 January 2003 and 31 December 2005.

CDI Vol 31 Supplement 2007 S87
Vaccine preventable diseases and vaccination coverage in Australia, 2003 to 2005
of stay. There were 38 deaths recorded with herpes zoster as the underlying cause in the calendar years 2003–2004, 36 of them for people 60 years and over. The highest death rate was also recorded in people 60 years and over.
Age and sex distribution, herpes zosterThe highest number and rate of herpes zoster hospitalisations occurred in the oldest age groups, espe-cially in the over 60 years age group, where the rate was over 112 per 100,000 (Table 25). Across all ages, the male:female rate ratio of hospitalisations was 0.71:1. The male:female rate ratio for deaths due to herpes zoster was 0.53:1.
Geographical distribution, herpes zosterFor the years 2002/2003–2004/2005, South Australia had the highest crude average annual hospitalisa-tion rate for herpes zoster (30.6 per 100,000), followed by Tasmania (29.0 per 100,000). The Northern Territory and the Australian Capital Territory had the lowest rates at around 15 per 100,000, with the other states having rates close to 25 per 100,000 (Appendix 3). That the Northern Territory has the lowest hospitalisation rates for herpes zoster and the highest for varicella presumably reflects the younger age structure of the population of the Northern Territory.
Table 25. Herpes zoster hospitalisations and deaths, Australia, 2002 to 2005,* by age group
Age group(years)
Hospitalisations3 years
(July 2002–June 2005)
LOS† per separation
(days)
Deaths2 years
(2003–2004)n (§) Rate‡ (§) Median (§) n Rate‡
0–4 108 (81) 2.8 (2.1) 3.0 (3.0) 0 0.005–14 269 (183) 3.3 (2.3) 3.0 (3.0) 0 0.00
15–24 224 (120) 2.7 (1.5) 3.0 (3.0) 1 0.0225–59 2,762 (1,240) 9.5 (4.2) 4.0 (3.0) 1 0.01
60+ 11,562 (4,763) 112.6 (46.4) 7.0 (5.0) 36 0.52All ages|| 14,926 (6,387) 25 (10.7) 6.0 (4.0) 38 0.10
* Hospitalisations where the month of separation was between 1 July 2002 and 30 June 2005; deaths where the death was recorded in 2003 or 2004.
† LOS = length of stay in hospital.
‡ Average annual age-specifi c rate per 100,000 population.
§ Principal diagnosis (hospitalisations).
|| Includes cases with unknown ages.
Table 26. Indicators of severe morbidity* for hospitalised cases of herpes zoster, Australia, 2002 to 2005,* by age group
Age group(years)
Zoster encephalitis or meningitis
Zoster with other nervous system
involvement
Disseminated zoster Ocular complications of herpes zoster
n % of cases n % of cases n % of cases n % of cases0–4 4 3.7 5 4.6 1 0.9 27 25.0
5–14 9 3.3 20 7.4 1 0.4 42 15.615–24 13 5.8 20 8.9 4 1.8 29 12.925–59 125 4.5 507 18.4 44 1.6 346 12.5
60+ 145 1.3 3,744 32.4 89 0.8 1,373 11.9All ages 296 2.0 4,296 28.8 139 0.9 1,817 12.2
* Measured using National Hospital Morbidity data where the month of separation was between 1 July 2002 and 30 June 2005.

S88 CDI Vol 31 Supplement 2007
Vaccine preventable diseases and vaccination coverage in Australia, 2003 to 2005
South Australian surveillance data, herpes zosterFigure 51 shows the notifications of herpes zoster by month from January 2002 to December 2005. A total of 1,751 cases were notified in the current review period (2003–2005), an average annual rate of 38.4 per 100,000. Figure 52 shows the notifications by gender and age for the current review period.
Figure 51. Herpes zoster notifications, South Australia, 2002 to 2005, by month of notification
0
10
20
30
40
50
60
70
80
Jan-02 Jul-02 Jan-03 Jul-03 Jan-04 Jul-04 Jan-05 Jul-05
Year
Num
ber
* Notifi cations where the date of notifi cation was between 1 January 2002 and 31 December 2005.
Figure 52. Herpes zoster notifications, South Australia, 2003 to 2005, by age group and sex
0
20
40
60
80
100
120
0-4 5-9 10-19 20-29 30-39 40-49 50-59 60-69 70-79 80+
Age group (years)
Not
ifica
tions
per1
00,0
00po
pula
tion
0
20
40
60
80
100
120
140
160
180
200
Num
ber
Number of males
Number of females
Rate of males
Rate of females
* Notifi cations where the date of notifi cation was between 1 January 2003 and 31 December 2005.

CDI Vol 31 Supplement 2007 S89
Vaccine preventable diseases and vaccination coverage in Australia, 2003 to 2005
CommentHospitalisations for herpes zoster are more common than for varicella, even if only the principal diag-nosis is considered. In addition, the average length of stay for herpes zoster is four days longer than for varicella, so that the burden of disease caused by severe herpes zoster, as indicated in these hospitalisation data, is greater than that caused by severe varicella.
For varicella, the very young were most commonly hospitalised, while the elderly had the longest length of stay. In our data, 32% of hospitalised cases had a recorded complication. For herpes zoster, just over half of the cases had a complication. This routine data is in agreement with a more detailed study that found that over 50% of herpes zoster hospital episodes had a documented complication, the majority of which were neurological.284 In that study, 16% had ophthalmic zoster, which is a serious complication because it threatens vision.284
Varicella vaccine is included in the routine childhood vaccination schedule in Canada and the USA. In regions of the USA where an active immunisation program for varicella is delivered and there is active disease surveillance, the incidence of varicella has declined dramatically. This is evident in all age groups, and is most marked among those aged 1–4 years.285 Universal VZV vaccination was recommended at 18 months of age in Australia in September 2003, and implemented as a national program in 2005, mak-ing it important to have a good understanding of the local epidemiology of disease at baseline. Our early data suggests an impact of the program in 2005 in the age group 12–24 months, with hospitalisations in this group falling below those in the under one year age group for the first time, but longer term trends will need to be observed to confirm this.
In 1952, Hope-Simpson proposed the hypothesis that exposure to varicella may boost immunity against HZ.286 This question has not been addressed in research studies again until recently, when its impor-tance in relation to universal varicella vaccination has become apparent. If exposure to wild varicella provides boosting and protection against activation of HZ, universal infant varicella vaccination and the subsequent decline in wild varicella may result in an increase in HZ incidence.287 There is increasing evidence that exposure to wild VZV does boost immunity to HZ, with two recent observational studies showing lower rates of HZ in groups who are exposed to varicella.288,289 Mathematical modelling sug-gests that widespread infant VZV vaccination might result in a significant increase in the incidence of HZ, affecting more than 50% of people aged 10–50 years at the time of the introduction of vaccination, with the increase in HZ predicted to persist for over 40 years.287 These predictions might not be correct, particularly if vaccine efficacy is less than that suggested by clinical trial data. Currently surveillance data from the USA, where varicella immunisation has been recommended for over a decade, indicates a large reduction in varicella morbidity with no increase in zoster disease yet demonstrated.290,291
The South Australian notification data show no apparent impact on the transmission of varicella by the availability of VZV vaccine on the private market with a slight increase in reported cases noted per year, although this may well be due to increasing awareness amongst clinicians of the need to notify cases rather than any real change in disease prevalence. Interestingly, the South Australian surveillance system, in contrast to hospitalisations, detects varicella more frequently than herpes zoster. The gender-specific and age-specific data from South Australia show a similar epidemiology to the hospitalised cases, sug-gesting that hospitalisation data provides a useful measure of trends in varicella and herpes zoster.
Varicella-zoster surveillance has been funded as part of the national varicella immunisation program292 and will include notification to the NNDSS (in five jurisdictions surveillance will comprise passive notification through GPs and labs; in two it will include passive notification as well as syndromic surveil-lance, with specimen collection through sentinel GPs/emergency departments; and in one state varicella will not be notifiable, with emergency department syndromic surveillance only).293 Additionally trends in disease burden will continue to be reviewed through hospitalisation data and Australian Paediatric Surveillance Unit data on neonatal and congenital varicella infections.
Acknowledgement: Dr Rod Givney, Communicable Diseases Control Branch, Department of Human Services, South Australia.


CDI Vol 31 Supplement 2007 S91
Vaccine preventable diseases and vaccination coverage in Australia, 2003 to 2005
4. Vaccination coverage
Childhood Vaccination Schedule 1998 to 2005
There have been a series of changes to recommended vaccines for children 0–6 years of age between 1998 and 2005.
1998–2000The first change was in the second half of 1998, when the second dose of measles-mumps-rubella (MMR) vaccine (previously recommended at 10–16 years of age) was moved to 4 years of age at the time of the national Measles Control Campaign. The next change occurred in May 2000, when two distinct paths were introduced for children born on or after 1 May 2000,76 using different combination vaccines, out-lined in Table 27. Pathway 1, followed by New South Wales, Queensland, South Australia, the Australian Capital Territory and the Northern Territory, used hepatitis B (Hep B) vaccine in a combination with diphtheria-tetanus-acellular pertussis (DTPa) vaccine, while Pathway 2, followed by Tasmania, Victoria and Western Australia, used Hep B in combination with Haemophilus influenzae type b (Hib) vaccine. This meant that from May 2000, full vaccination at 12 months of age (first milestone) required three doses of DTPa and oral poliomyelitis (OPV) vaccines, two doses of Hib and either two or three doses of Hep B vaccine, depending on the pathway adopted. Full Hib immunisation at 12 months of age required two doses of PRP-OMP. Full Hep B immunisation at 12 months required either three doses of combined DTPa-Hep B (Pathway 1) or two doses of combined Hib-Hep B vaccine (Pathway 2). The neonatal dose of HepB vaccine (scheduled for all newborns since May 2000) was not included in ACIR coverage estimates. In the second year of life, a dose of MMR vaccine remained at 12 months of age as well as booster doses of Hib vaccine (at 12 months) and DTPa (at 18 months) and under Pathway 2 this Hib vaccine was given with Hep B vaccine. In the fifth year of life, a second dose of MMR vaccine was scheduled as well as booster doses of DTPa and OPV.
2001–2005Meningococcal C conjugate vaccine was recommended and funded at 12 months of age from January 2003. In September 2003, the DTPa booster dose at 18 months of age was no longer recommended. Consequently all vaccines in the second year of life for non-Indigenous children were given at 12 months of age. Also in September 2003, the recommended schedule was changed to include universal 7-valent conjugate pneumococcal vaccine at 2, 4 and 6 months of age, varicella-zoster vaccine at 18 months of age, and inactivated poliomyelitis vaccine in place of oral vaccine, although these recommendations were not funded. In January 2005, universal 7-valent conjugate pneumococcal vaccine was funded and, in May 2005, the National Immunisation Program (NIP) schedule replaced the Australian Standard Vaccination Schedule (ASVS) for children aged 0–6 years, with all recommended vaccines to be funded, including varicella-zoster vaccine and inactivated poliomyelitis vaccine from November 2005.
Table 27. Australian Standard Vaccination Schedule 2005 for children
Age VaccineBirth Hep B2 months Hep B*,† DTPa Hib†,‡ IPV 7vPCV4 months Hep B*,† DTPa Hib†,‡ IPV 7vPCV6 months Hep B* DTPa Hib‡ IPV 7vPCV12 months Hep B† Hib† MMR MenCCV18 months VZV 23vPPV§
4 years DTPa IPV MMR
* Diphtheria-tetanus-acellular pertussis/Hep B vaccine from May 2000 (Pathway 1) (three doses, at 2, 4 and 6 months of age).
† Hib PRP-OMP/hep B from May 2000 (Pathway 2) (three doses, at 2, 4 and 12 months of age).
‡ Hib PRP-OMP (Pathway 1) from May 2000 (three doses, at 2, 4 and 6 months of age).
§ 23-valent pneumococcal polysaccharide vaccine for Aboriginal and Torres Strait Islander children in high prevalence jurisdic-tions only from September 2003.

S92 CDI Vol 31 Supplement 2007
Vaccine preventable diseases and vaccination coverage in Australia, 2003 to 2005
Vaccination coverage estimates from the ACIR 1996 to 2005
The methodology for calculating cohort-based vaccination coverage from the ACIR was published with the first coverage estimates in 1998.5 Using this method, a cohort of children is defined by date of birth in three-month groups, the first cohort being born between 1 January 1996 and 31 March 1996.16 The vaccination status of each cohort is assessed at the three key milestones of 12 months, 24 months, and 72 months of age. Coverage is measured several months after the due date for completion of each mile-stone, to allow for delayed notification to the ACIR. To minimise duplicate records, the cohort includes only children enrolled with Medicare (approximately 99% of children).5 It is assumed that notification of receipt of a later vaccine dose implies receipt of earlier doses, even if no earlier vaccination is recorded (‘third dose assumption’).16 A child is now defined as ‘fully vaccinated’ at 12 months of age if he or she has received a third dose of DTPa and poliomyelitis vaccine (oral or inactivated), a second or third dose of Hib vaccine (PRP-OMP), and either a second or a third dose of Hep B vaccine, depending on the pathway taken on the schedule. ACIR coverage estimates (using the ‘assumption’) for the first vaccina-tion milestone (the first three scheduled doses of DTPa, OPV and, recently, two or three doses of Hep B and two or three doses of Hib) have been reported in Communicable Diseases Intelligence since 1998.294 The coverage for MMR has been reported in Communicable Diseases Intelligence since 1998.294 Coverage for the third vaccination milestone at 72 months of age has been reported in Communicable Diseases Intelligence since 2002.295
Trends in vaccination coverage estimates from the ACIR
The trends in childhood vaccination coverage in Australia for three doses of DTPa, OPV and two or three doses of Hib and Hep B assessed at 12 months of age, and for three or four doses of DTPa (according to the vaccine schedule in use), two or three doses of Hib and Hep B, three doses of OPV, and one dose of MMR assessed at 24 months, and for two doses of MMR, four or five doses of DTPa, and four doses of OPV assessed at 72 months of age are shown in Figure 53. Coverage was calculated for 36 consecutive three-month cohorts born from 1 January 1996 to 31 December 2004. For all vaccines due by one year of age, coverage estimates increased steadily from 75% for the first cohort, to 90% by the thirty-sixth cohort, assessed on 31 December 2005. For all vaccines due by 24 months of age, coverage estimates also
Figure 53. Trends in vaccination coverage estimates from the Australian Childhood Immunisation Register for 12, 24 and 72 month olds*
0
10
20
30
40
50
60
70
80
90
100
31M
ar97
30S
ep
31M
ar98
30S
ep
31M
ar99
30S
ep
31M
ar00
30S
ep
31M
ar01
30S
ep
31M
ar02
30S
ep
30M
ar03
30S
ep
31M
ar04
30S
ep
31M
ar05
30S
ep
Coverage assessment date for each cohort
Cov
erag
e(%
)
ACIR-fully vaccinated by 12 mths
ACIR-fully vaccinated by 24 mths
ACIR-fully vaccinated by 6 yrs
90% coverage target
Source: Australian Childhood Immunisation Register.
* By three-month birth cohorts born between 1 January 1996 and 31 December 2004. Coverage assessment date was 12 months, 24 months or 72 months after the last birth date of each cohort.

CDI Vol 31 Supplement 2007 S93
Vaccine preventable diseases and vaccination coverage in Australia, 2003 to 2005
increased steadily from 64% for the first cohort to 92.1% by December 2005. Coverage estimates for all vaccines due by 72 months of age were first reported in Communicable Diseases Intelligence in 2002, and have also increased steadily from 80.6% in early 2002 to 83.8% in late 2005.
Coverage estimates for the 24-month age group had a noticeable increase in September 2003, largely as a result of a more liberal definition of completeness following the removal of the fourth dose of DTPa (due at 18 months) from the immunisation schedule from this quarter onwards. Coverage estimates for the 12-month age group have, however, remained steady over the past five years fluctuating around the 91% level. With up to 3% of Australian parents not immunising their children because they object to, disagree with, or are concerned about immunisation,296 it will be difficult for ‘fully immunised’ cover-age estimates to exceed 95%, especially as the reporting of immunisation encounters is still not totally complete due to poor reporting by some providers and late immunisation by some parents.
Vaccines scheduled in the first year of lifeDifferences between states and territories in estimates of the proportion of children classified as ‘fully immunised’ are shown in Figure 54. ‘Fully immunised’ coverage remained reasonably stable over the three year assessment period for all jurisdictions with almost all of them reaching the Immunise Australia Program target of 90% coverage for the first milestone vaccines. Coverage in the Northern Territory and the Australian Capital Territory fluctuated noticeably over the whole period. Significant changes in coverage in jurisdictions like the Northern Territory and the Australian Capital Territory, who have relatively small populations, are likely to be the result of small numbers of unimmunised children having large impacts on the coverage percentages.
Figure 54. Trends in vaccination coverage estimates, by jurisdiction: children ‘fully immunised’ at the age of 12 months*
80
85
90
95
100
30M
ar03
30Ju
n
30S
ep
31D
ec
31M
ar04
30Ju
n
30S
ep
31D
ec
31M
ar05
30Ju
n
30S
ep
31D
ec
Coverage assessment date for each cohort
Cov
erag
e(%
)
ACT NSW
NT Qld
SA Tas
Vic WA
Source: Australian Childhood Immunisation Register
* By three-month birth cohorts born between 1 January 2002 and 31 December 2004. Coverage assessment date was 12 months after the last birth date of each cohort.

S94 CDI Vol 31 Supplement 2007
Vaccine preventable diseases and vaccination coverage in Australia, 2003 to 2005
The trends in childhood vaccination coverage in Australia for individual vaccines (DTPa, OPV, Hib and Hep B assessed at 12 months) are shown in Figure 55, calculated for 12 consecutive three-month cohorts born from 1 January 2002 to 31 December 2004. Coverage estimates for all vaccines remained stable throughout the 2001 to 2003 period, hovering around the 92% to 95% mark. Coverage for the Hib and Hep B vaccines is greater than DTPa and OPV coverage largely due to the spurious effect of the change in the immunisation schedule in mid 2000, altering the algorithm used to calculate coverage at 12 months of age where a record of two doses of Hib and Hep B on the ACIR is enough for a child to be considered ‘fully immunised’.
Figure 56 presents a map of immunisation coverage at 12 months of age in Australia by Australian Bureau of Statistics (ABS) Statistical Subdivision. The map demonstrates that, whilst coverage is greater than 90% in almost all jurisdictions, there exist a significant number of areas that have low levels of coverage, below 90%, and even below 85% in a few areas such as Richmond-Tweed and Lismore (NSW).
The timeliness of the third dose of DTPa, due at six months of age, by jurisdiction, for the cohort born 1 January 2004 to 31 March 2004 is shown in Figure 57. Timeliness varied by jurisdiction, with children in Western Australia and the Northern Territory experiencing greater vaccination delay, and children in the Australian Capital Territory being more on time for their third dose of DTPa. However, whilst timeliness varies between jurisdictions, eventually all jurisdictions catch up by 12 months of age (Figure 57).297
Figure 55. Trends in vaccination coverage estimates for individual vaccines: children vaccinated with DTPa, OPV, HepB and Hib at the age of 12 months*
80
85
90
95
100
30M
ar03
30Ju
n
30S
ep
31D
ec
31M
ar04
30Ju
n
30S
ep
31D
ec
31M
ar05
30Ju
n
30S
ep
31D
ec
Coverage assessment date for each cohort
Cov
erag
e(%
)
DTPOPVHibHep B
Source: Australian Childhood Immunisation Register.
* By three-month birth cohorts born between 1 January 2002 and 31 December 2004. Coverage assessment date was 12 months after the last birth date of each cohort.

CDI Vol 31 Supplement 2007 S95
Vaccine preventable diseases and vaccination coverage in Australia, 2003 to 2005
Figure 57. Timeliness of the third dose of DTPa (due at 6 months of age), by jurisdiction – cohort born 1 January 2004–31 March 2004
50
55
60
65
70
75
80
85
90
95
100
6 mths 7 mths 8 mths 9 mths 10 mths 11 mths 12+ mths
Age at DTP3
Cum
ulat
ive
%co
vera
ge
ACTNSWNTQldSATasVicWA
NT
ACT NSW
WA
Figure 56. Immunisation coverage for ‘fully immunised’ at 12 months of age, Australia, December 2005

S96 CDI Vol 31 Supplement 2007
Vaccine preventable diseases and vaccination coverage in Australia, 2003 to 2005
Vaccines scheduled in the second year of lifeDifferences between states and territories in estimates of the proportion of children classified as ‘fully immunised’ at 24 months of age are shown in Figure 58. ‘Fully immunised’ coverage at 24 months of age for consecutive cohorts increased markedly for all jurisdictions between the June and September quarters in 2003, mainly due to the removal of the fourth dose of DTPa vaccine at 18 months from the immunisation schedule in September 2003. The coverage assessment for the 24-month cohort now excludes the requirement for the 18-month dose of DTPa. There was significant variation between the jurisdictions across the three-year period with Tasmania, the Northern Territory, South Australia and Victoria consistently having higher coverage levels than the other four jurisdictions. However, by the end of 2005, all jurisdictions had reached the 90% coverage target.
The trends in childhood vaccination coverage in Australia for individual vaccines (DTPa, OPV, Hib, Hep B and MMR assessed at 24 months) are shown in Figure 59, calculated for 12 consecutive three-month cohorts born from 1 January 2001 to 31 December 2003. As discussed previously, there was a sig-nificant increase in coverage for DTPa at 24 months of age during 2003 due to the removal of the fourth dose of DTPa from the schedule. For most of the three-year period, Hep B coverage was higher than for all other vaccines (most likely due to the coverage algorithm accepting two or three doses of Hep B as an indication of fully immunised status), hovering just below 96%, whilst coverage at 24 months of age was lowest for the MMR and Hib vaccines. However, there has been a real lack of movement in coverage for any of the vaccines assessed at this age, as evidenced by the very flat curves for all vaccines.
Figure 60 presents a map of immunisation coverage at 24 months of age in Australia by Australian Bureau of Statistics (ABS) Statistical Subdivision. The map demonstrates, as with Figure 56, that whilst coverage is over 90% in all jurisdictions, there exist many small areas within jurisdictions that have levels of coverage below 90%, such as regional areas in Western Australia and New South Wales.
Figure 58. Trends in vaccination coverage estimates, by jurisdiction: children ‘fully immunised’ with DTPa, OPV, HepB, Hib and MMR at the age of 24 months*
80
85
90
95
100
30M
ar03
30Ju
n
30S
ep
31D
ec
31M
ar04
30Ju
n
30S
ep
31D
ec
31M
ar05
30Ju
n
30S
ep
31D
ec
Coverage assessment date for each cohort
Cov
erag
e(%
)
ACT NSWNT QldSA TasVic WA
Source: Australian Childhood Immunisation Register.
* By three-month birth cohorts born between 1 January 2001 and 31 December 2003. Coverage assessment date was 24 months after the last birth date of each cohort.

CDI Vol 31 Supplement 2007 S97
Vaccine preventable diseases and vaccination coverage in Australia, 2003 to 2005
Figure 60. Immunisation coverage for ‘fully immunised’ at 24 months of age, Australia, December 2005
Figure 59. Trends in vaccination coverage estimates for individual vaccines: children vaccinated with DTPa, OPV, HepB, Hib and MMR at the age of 24 months*
80
85
90
95
10030
Mar
03
30Ju
n
30S
ep
31D
ec
31M
ar04
30Ju
n
30S
ep
31D
ec
31M
ar05
30Ju
n
30S
ep
31D
ec
Coverage assessment date for each cohort
Cov
erag
e(%
)
DTPOPVHibHep BMMR
Source: Australian Childhood Immunisation Register.
* By three-month birth cohorts born between 1 January 2001 and 31 December 2003. Coverage assessment date was 24 months after the last birth date of each cohort.

S98 CDI Vol 31 Supplement 2007
Vaccine preventable diseases and vaccination coverage in Australia, 2003 to 2005
The timeliness of the first dose of MMR by jurisdiction for the cohort born 1 January 2003 to 31 March 2003 is shown in Figure 61. As with the third dose of DTPa, the timeliness of the first dose of MMR varied by jurisdiction, with children in Western Australia and the Northern Territory again experiencing greater vaccination delay, and children in Tasmania being more on time for this vaccine dose. Again, whilst timeliness of MMR vaccination varies between jurisdictions, eventually all jurisdictions catch up by 18 months of age (Figure 61).297
Vaccines given at 4–5 years of ageDifferences between states and territories in estimates of the proportion of children classified as ‘fully immunised’ by 72 months of age are shown in Figure 62. ‘Fully immunised’ coverage increased only slightly over the three year assessment period for most jurisdictions, with some jurisdictions experiencing a greater increase than others, and a couple (Queensland and Western Australia) experiencing an overall slight decrease. Coverage was highest in Victoria and the Australian Capital Territory.
The trends in childhood vaccination coverage in Australia for individual vaccines (DTPa, OPV and MMR assessed at 72 months) are shown in Figure 63, calculated for 12 consecutive three-month cohorts born from 1 January 1997 to 31 December 1999. Coverage for all three vaccines was almost identical and remained steady across the whole period hovering around 85% with very little change.
Figure 64 presents a map of immunisation coverage at 72 months of age in Australia by Australian Bureau of Statistics (ABS) Statistical Subdivision. The map demonstrates that coverage for this age group, compared with other milestones, is below target levels in many areas of Australia, and is less than 85% in a majority of areas. However, there are a few areas in regional Victorian and Western Australia where coverage has reached levels achieved at 12 and 24 months of age.
Figure 61. Timeliness of the first dose of MMR (due at 12 months of age), by jurisdiction – cohort born 1 January 2003–31 March 2003
50
55
60
65
70
75
80
85
90
95
100
12 mths 13 mths 14 mths 15 mths 16 mths 17 mths 18 mths
Age at MMR1
Cum
ulat
ive
%co
vera
ge
ACTNSWNTQldSATasVicWA
Tas
NTWA

CDI Vol 31 Supplement 2007 S99
Vaccine preventable diseases and vaccination coverage in Australia, 2003 to 2005
Figure 63. Trends in vaccination coverage estimates for individual vaccines: children vaccinated with DTPa, OPV and MMR at the age of 72 months*
65
70
75
80
85
90
95
100
30M
ar03
30Ju
n
30S
ep
31D
ec
31M
ar04
30Ju
n
30S
ep
31D
ec
31M
ar05
30Ju
n
30S
ep
31D
ec
Coverage assessment date for each cohort
Cov
erag
e(%
)
DTP
OPV
MMR
Source: Australian Childhood Immunisation Register.
* By three-month birth cohorts born between 1 January 1997 and 31 December 1999. Coverage assessment date was 72 months after the last birth date of each cohort.
Figure 62. Trends in vaccination coverage estimates, by jurisdiction: children ‘fully immunised’ with DTPa, OPV and MMR at the age of 72 months*
75
80
85
90
95
10030
Mar
03
30Ju
n
30S
ep
31D
ec
31M
ar04
30Ju
n
30S
ep
31D
ec
31M
ar05
30Ju
n
30S
ep
31D
ec
Coverage assessment date for each cohort
Cov
erag
e(%
)
ACTNSWNTQldSATasVicWA
Source: Australian Childhood Immunisation Register.
* By three-month birth cohorts born between 1 January 1997 and 31 December 1999. Coverage assessment date was 72 months after the last birth date of each cohort.

S100 CDI Vol 31 Supplement 2007
Vaccine preventable diseases and vaccination coverage in Australia, 2003 to 2005
CommentAustralia is uniquely well placed to monitor immunisation coverage and timeliness of immunisation routinely and regularly because of its universal national childhood immunisation register, the ACIR, the only national register of its kind in the world. The ACIR records immunisation data on all children under the age of 7 years enrolled in the Australian universal health insurance scheme, Medicare, and constitutes a nearly complete population register, as approximately 99% of the 250,000 children born each year are registered with Medicare by 12 months of age.
Estimates of vaccination coverage in Australia for all jurisdictions have increased steadily since the ACIR commenced in 1996 but less so in recent years. There have been increases in coverage for 12 month olds, 24 month olds and 72 month olds, with ‘fully immunised’ coverage for 12 and 24 month olds reaching the Immunise Australia Program target of 90% coverage for the first and second milestone vaccines.
The ACIR is now likely to be performing at close to its maximum achievable capacity in terms of data administration, following the impact of the General Practitioner Immunisation Incentive Scheme, paren-tal incentives, the recording of overseas-given immunisations on the ACIR and data cleaning initiatives such as the ACIR Field Officers. Limitations of the ACIR, related to reliance on provider notification and the currency of Medicare registration, mean that official estimates of coverage are unlikely to rise significantly above current levels, especially at the 12 and 24 month old milestones, unless mechanisms are put in place to further improve notification to the ACIR. Increases in actual coverage will also be difficult to achieve from this point, as there are probably 2%–3% of parents who are officially opposed to immunisation and a further slightly larger percentage that are opposed to immunisation but who do not object through official channels.
To maintain the current high levels and to achieve further increases in coverage, especially in the 72 month old group, efforts need to be directed at improving reporting by providers (and subsequent data clean-ing), and at immunisation of the small group of children now not up to date with their immunisations.
Figure 64. Immunisation coverage for ‘fully immunised’ at 72 months of age, Australia, December 2005

CDI Vol 31 Supplement 2007 S101
Vaccine preventable diseases and vaccination coverage in Australia, 2003 to 2005
The latter will require carefully targeted initiatives, which may include efforts to further improve access to services for disadvantaged groups and specific educational initiatives for those parents and providers concerned about contraindications to immunisation.
Analysis of age appropriateness (timeliness) of childhood immunisation in Australia is not routinely undertaken using ACIR data, with regular reports limited to immunisation coverage for scheduled vaccines at the age milestones of 12, 24 and 72 months for each three-month birth cohort.295 With coverage estimates for most vaccines reaching levels required for herd immunity, the next benchmark for program success is timeliness, which can be regularly reported with an immunisation register, in contrast to the intermittent reports possible from national surveys. In addition, failure to commence the immunisation schedule on time has been shown to be a powerful predictor of failure to complete it.298,299 Measurement of timeliness should be incorporated into routine monitoring of the success of immunisation program delivery in countries with high levels of immunisation coverage.
It should be noted that there are several national, publicly funded, targeted immunisation programs for which systematically collected data on vaccine coverage are not currently available or published. These include meningococcal, pneumococcal and varicella vaccines for infants, Hep B vaccine for adolescents, dTpa vaccine for adolescents, MMR vaccine for 18–30 year olds, influenza and pneumococcal vaccines for Aboriginal and Torres Strait Islander persons over 50 years of age and influenza vaccine for persons over the age of 64 years. While data are available from surveys in local subpopulations91 or national special purpose surveys and studies110,111,300,301 for three of these programs, lack of widely applicable data inhibits planning and evaluation at the regional and national level. As the number and scope of immunisation programs increases, extension of the ACIR to collect data for some or all of the other age groups targeted by vaccines merits active consideration.


CDI Vol 31 Supplement 2007 S103
Vaccine preventable diseases and vaccination coverage in Australia, 2003 to 2005
5. Discussion
Changes in vaccination practice
The years January 2003 to December 2005 were marked in the main by continuing gains in the con-trol of vaccine preventable diseases and further expansion in routine vaccination programs to cover meningococcal C disease, chickenpox and pneumococcal disease. A particular challenge of the period was that, for the first time, recommendations for the routine use of some new childhood vaccines preceded their provision free of charge to parents (varicella-zoster, inactivated poliomyelitis and 7-valent conjugate pneumococcal vaccine).302 In December 2000, the Australian Childhood Immunisation Register (ACIR) documented that the 90% coverage target for immunisation of 12 month olds had been achieved for the first time. This has been maintained and exceeded through to the end of 2005. This target has now also been met for immunisation of two year olds. Such coverage is likely to have been facilitated by the now routine use of combination vaccines.
These vaccine policy and program changes represent a large investment in public health, which is set to further increase in coming years, with increasingly expensive new vaccines (e.g. against rotavirus, human papillomavirus and shingles) and the incremental increasing cost of all the supporting pillars of immunisation in Australia. Like other industrialised countries, Australia faces the dual challenges of maintaining both high immunisation coverage and public confidence in immunisation, while imple-menting increasingly complex decisions about the introduction of new vaccines for both children and adults. Although the full evaluation of the impact of current programs, and prioritisation and planning for future programs, require more detailed and precise data, the multiple data sources (notifications, hospitalisations, mortality and vaccine coverage) contained in this report provide an ongoing picture of progress across the spectrum of Australian immunisation activity.
Current and comparative morbidity from vaccine preventable diseases
A summary of the relative morbidity and mortality due to the diseases covered in the three years prior to the current report (2000 to 2002) is shown in Table 28 and for the three years 2003 to 2005 in Table 29. While the limitations of the data sources for notification, hospitalisation and death should be borne in mind (see Chapter 2), and may be especially evident for rare diseases or diseases which lack a specific diagnostic test, together these data provide an informative overview of trends in the burden of vaccine preventable diseases in Australia over the past several years.
In children under five years of age (the main target of the current childhood program), ongoing reduc-tions in relative disease burden continued in the period 2003 to 2005. Among diseases currently targeted by immunisation, hospitalisations due to measles, rubella, mumps, and presumed Hib disease have all continued to decrease. Although vaccination programs are relatively recent for these diseases, decreases in hospitalisations for meningococcal disease, pneumococcal disease, and varicella disease have also occurred. Hospitalisations due to pertussis continue to be a significant burden in young infants. Influenza, varicella, pneumococcal disease, pertussis and meningococcal disease accounted for the largest numbers of hospitalisations in those under the age of five years. Outside this age group, the three most commonly coded vaccine preventable diseases in hospitalised patients also included influenza and varicella, but zoster was the most common recorded cause. The vaccine preventable diseases most frequently recorded as the underlying cause of death were influenza in adults and meningococcal disease in infants. The implications of these data are discussed below, first with respect to vaccines included in the Australian Standard Vaccination Schedule (ASVS) during the review period and second with respect to vaccines available in Australia but not included in the ASVS up to the end of 2005.
Diseases on the Australian Standard Vaccination Schedule in 2003–2005
Measles and rubellaDuring 2003–2005, measles and rubella notifications and hospitalisations continued their decline, reach-ing record lows, with about 90% and 80% reductions, respectively, compared with earlier in the decade. These achievements reflect the success of the Measles Control Campaign as well as ongoing high child-hood vaccination coverage with measles-mumps-rubella (MMR) vaccine. Australia’s remaining suscep-tible cohort of young adults born in the 1970s and early 1980s were targeted by a young adult MMR vaccination campaign in 2001. Both a serological evaluation130 and data presented in this report suggest that the campaign failed to significantly improve immunity in this age group. Improving immunity in this cohort and communicating the potentially serious nature of infection with measles and rubella in

S104 CDI Vol 31 Supplement 2007
Vaccine preventable diseases and vaccination coverage in Australia, 2003 to 2005
Tabl
e 28
. A
vera
ge a
nnua
l mor
bidi
ty a
nd m
orta
lity
from
vac
cine
pre
vent
able
dis
ease
s in
Aus
tral
ia fo
r 3 y
ears
199
9/20
00–2
001/
2002
*
Dis
ease
†N
otifi
catio
ns
2000
–200
2(a
vera
ge n
o.)
Not
ifi ca
tion
rate
/100
,000
(ave
rage
rate
)
Hos
pita
lisat
ions
19
99/0
0–20
01/0
2(a
vera
ge n
o.)
Hos
pita
lisat
ion
rate
/100
,000
(ave
rage
rate
)
Dea
ths‡
2000
–200
2(a
vera
ge n
o.)
Dea
th ra
te/1
00,0
00(a
vera
ge ra
te)
0–4
yrA
ll ag
es0–
4 yr
All
ages
0–4
yrA
ll ag
es0–
4 yr
All
ages
0–4
yrA
ll ag
es0–
4 yr
All
ages
Dip
hthe
ria‡
00
00
0§0§
00
00
00
Hib
║11
150.
90.
417
181.
30.
40
00
0H
epat
itis
A38
587
33
1344
21.
02.
30.
31.
30.
030.
01H
epat
itis
B‡,
¶2
407
0.13
2.1
0.3
154
0.0
0.81
09
00.
05Infl u
enza
**1,
510
3,67
111
919
696
3,42
554
182
510.
160.
26M
easl
es22
941.
70.
517
581.
40.
30
00
0M
enin
goco
ccal
dis
ease
199
667
163
269
854
21.0
4.5
11.3
390.
890.
20M
umps
††15
132
1.2
0.7
1046
0.8
0.2
01
00.
005
Per
tuss
is60
27,
013
4736
363
542
28.3
2.8
22.
30.
160.
012
Pne
umoc
occa
l (in
vasi
ve)‡‡
, **80
22,
466
6313
341
1,02
126
.65.
32.
314
.30.
180.
07P
olio
mye
litis
‡0
00
00
1.3
00.
007
00
00
Rub
ella
2628
12.
11.
49
280.
70.
140
00
0Te
tanu
s0.
35
0.03
0.03
0.7
290.
050.
150
10
0.00
5Va
ricel
laN
NN
NN
NN
N77
41,
686
609
0.7
80.
050.
04Zo
ster
NN
NN
NN
NN
454,
790
3.5
250
15.3
00.
08
* N
otifi
catio
n da
ta, N
atio
nal N
otifi
able
Dis
ease
s S
urve
illan
ce S
yste
m, J
anua
ry 2
000–
Dec
embe
r 200
2; h
ospi
talis
atio
n da
ta, A
ustra
lian
Inst
itute
of H
ealth
and
Wel
fare
(AIH
W)
Nat
iona
l Mor
bidi
ty d
atab
ase,
Jul
y 19
99–J
une
2002
; dea
th d
ata,
AIH
W N
atio
nal M
orta
lity
data
base
, Jan
uary
200
0–D
ecem
ber 2
002.
† S
ee C
hapt
er 3
for c
ase
defi n
ition
s.
‡ P
rinci
pal d
iagn
osis
onl
y fo
r hos
pita
lisat
ions
(hep
atiti
s B
, pol
iom
yelit
is, d
ipht
heria
), an
d fo
r dea
ths,
onl
y ca
ses
with
dis
ease
cla
ssifi
ed a
s un
derly
ing
caus
e of
dea
th.
§ O
nly
incl
udes
hos
pita
lisat
ions
cod
ed a
s ph
aryn
geal
, nas
opha
ryng
eal o
r lar
ynge
al d
ipht
heria
.
║
Dat
a fo
r Hae
mop
hilu
s in
fl uen
zae
dise
ase
incl
ude
only
cas
es a
ged
0–14
yea
rs. F
or h
ospi
talis
atio
ns a
nd d
eath
s on
ly in
clud
es m
enin
gitis
.
¶ In
clud
es o
nly
acut
e he
patit
is B
not
ifi ca
tions
, hos
pita
lisat
ions
and
dea
ths.
**
Not
ifi ca
tions
onl
y co
mpl
ete
for 2
002
(infl u
enza
and
pne
umoc
occa
l dis
ease
)—no
tifi c
atio
n ra
te fo
r 200
2 on
ly.
††
In Q
ueen
slan
d, m
umps
not
not
ifi ab
le in
200
0.
‡‡
Incl
udes
pne
umoc
occa
l men
ingi
tis a
nd s
eptic
aem
ia o
nly.
NN
Not
Not
ifi ab
le.

CDI Vol 31 Supplement 2007 S105
Vaccine preventable diseases and vaccination coverage in Australia, 2003 to 2005
Tabl
e 29
. A
vera
ge a
nnua
l mor
bidi
ty a
nd m
orta
lity
from
vac
cine
pre
vent
able
dis
ease
s in
Aus
tral
ia fo
r 3 y
ears
200
2/20
03–2
004/
2005
*
Dis
ease
†N
otifi
catio
ns
2003
–200
5(a
vera
ge n
o.)
Not
ifi ca
tion
rate
/100
,000
(ave
rage
rate
)
Hos
pita
lisat
ions
(ave
rage
no.
)H
ospi
talis
atio
n ra
te/1
00,0
00(a
vera
ge ra
te)
Dea
ths‡
2003
–200
4(a
vera
ge n
o.)
Dea
th ra
te/1
00,0
00(a
vera
ge ra
te)
0–4
yrA
ll ag
es0–
4 yr
All
ages
0–4
yrA
ll ag
es0–
4 yr
All
ages
0–4
yrA
ll ag
es0–
4 yr
All
ages
Dip
hthe
ria‡
00
00
0§0§
00
00
00
Hib
║8
100.
60.
312
130.
90.
30
00
0H
epat
itis
A31
358
2.5
1.8
925
20.
71.
30
00
0H
epat
itis
B‡,
¶2
291
0.16
1.5
017
20
0.87
011
00.
06Infl u
enza
1,05
83,
395
8417
1,03
93,
039
8215
2.5
510.
200.
25M
easl
es8
490.
60.
312
311.
00.
20
00
0M
enin
goco
ccal
dis
ease
142
452
112.
321
971
217
3.6
623
0.5
0.1
Mum
ps8
140
0.6
0.7
446
0.3
0.2
00.
50
0.00
3P
ertu
ssis
563
8,34
545
4225
544
020
2.2
0.5
10.
040.
005
Pne
umoc
occa
l (in
vasi
ve)*
*57
12,
101
4510
277
1,03
822
5.2
5.5
190.
40.
095
Pol
iom
yelit
is‡
00
00
0.3
20.
030.
010
00
0R
ubel
la4
390.
30.
27
150.
60.
070
00
0Te
tanu
s0
40
0.02
022
00.
110
00
0Va
ricel
laN
NN
NN
NN
N53
21,
427
427.
21.
55.
50.
120.
03Zo
ster
NN
NN
NN
NN
364,
975
2.8
250
190
0.09
5
* N
otifi
catio
n da
ta, N
atio
nal N
otifi
able
Dis
ease
s S
urve
illan
ce S
yste
m, J
anua
ry 2
003–
Dec
embe
r 200
5; h
ospi
talis
atio
n da
ta, A
ustra
lian
Inst
itute
of H
ealth
and
Wel
fare
(AIH
W) N
atio
nal M
orbi
dity
da
taba
se, J
uly
2002
–Jun
e 20
05; d
eath
dat
a, A
IHW
Nat
iona
l Mor
talit
y da
taba
se, J
anua
ry 2
003–
Dec
embe
r 200
4.
† S
ee C
hapt
er 3
for c
ase
defi n
ition
s.
‡ P
rinci
pal d
iagn
osis
onl
y fo
r hos
pita
lisat
ions
(hep
atiti
s B
, pol
iom
yelit
is, d
ipht
heria
) and
for d
eath
s on
ly c
ases
with
dis
ease
cla
ssifi
ed a
s un
derly
ing
caus
e of
dea
th.
§ O
nly
incl
udes
hos
pita
lisat
ions
cod
ed a
s ph
aryn
geal
, nas
opha
ryng
eal o
r lar
ynge
al d
ipht
heria
as
per i
nclu
ded
code
s fo
r pre
viou
s re
view
per
iod.
║
Dat
a fo
r Hae
mop
hilu
s in
fl uen
zae
dise
ase
incl
ude
only
cas
es a
ged
0–14
yea
rs. F
or h
ospi
talis
atio
ns a
nd d
eath
s on
ly in
clud
es m
enin
gitis
cas
es.
¶ In
clud
es o
nly
acut
e he
patit
is B
not
ifi ca
tions
, hos
pita
lisat
ions
and
dea
ths.
**
Incl
udes
pne
umoc
occa
l men
ingi
tis a
nd s
eptic
aem
ia o
nly.
NN
Not
Not
ifi ab
le

S106 CDI Vol 31 Supplement 2007
Vaccine preventable diseases and vaccination coverage in Australia, 2003 to 2005
the face of near absent disease remain important and far from hypothetical challenges. Whilst regional measles elimination would appear to be in reach, regionally rubella control remains at an early stage. The laboratory identification and typing of isolates from measles and rubella cases is now vital in order to monitor the origin and any transmission of these diseases in Australia.
MumpsSince 2002, when mumps notifications were the lowest on record, mumps notifications have increased, and in 2005 reached the highest level since notification began in 1993. This rise was primarily due to increased notification rates in the 20–34 year age group, especially in Queensland and New South Wales, with the highest incidence occurring during 2005 in the 25–29 year old age group (5.1 per 100,000). Notification rates in children remained low. Despite the increase in mumps notifications, rates in Australia were low in comparison to the rates experienced in the United Kingdom during the epidemic of mumps in 2004/2005.146 The peak age group affected in the UK, and also in recent outbreaks in the USA,148 were 18–24 year olds. Thus, Australia faces similar issues to other developed countries that are also experienc-ing mumps resurgence in older susceptible cohorts. The high notification rates in the 20–34 year age group suggest that some endemic transmission may be occurring in this age group. Surveillance for mumps and further consideration of initiatives to effectively target young adults for immunisation are of continued importance in the Australian context.
Hib diseaseThe virtual disappearance of invasive Hib disease among children less than five years old has been an ongoing success story for vaccination with continued year on year falls in notifications of invasive Hib disease during 2003–2005. Laboratory confirmation with definitive typing remains very important, now that Hib disease is even rarer and as the relative incidence of non-type b invasive Haemophilus influenzae increases. Surveillance of Hib disease, through hospitalisation data, would greatly benefit from a specific ICD code for type b disease, which would provide an additional source of information independent from notifications.
PertussisTrends in pertussis are difficult to interpret as the disease is by nature variable with peaks every 3–4 years. It stands out as an ongoing challenge, with an epidemic year experienced in 2005 greater in size than the previous peak (>11,000 notifications compared with about 9,600 in 2001). However, it is encouraging that pertussis notifications and hospitalisations have fallen in the most immunised age group (1–10 years), with most notifications occurring either in those too young to be immunised or in adolescents and adults whose vaccine-derived or infection-induced immunity has waned over time. The review period saw the incorporation of a booster dose of pertussis vaccine in adolescence and, although it is still early, there are data to support the success of this strategy already, driven perhaps by the active catch-up adolescent programs implemented in two states. Current recommendations also encourage dTpa vaccination for prospective and recent parents and for adults working with young children, but uptake is uncertain and unlikely to be high.76
InfluenzaThe data presented in this report, although minimal estimates of influenza cases, indicate that the disease burden from influenza is large, with the highest number of hospitalisations and bed days occurring at the extremes of age, in children under five years of age and in the elderly. There are intermittent surges in influenza every few years but data from Australia and the UK are consistent with a gradual decline in such peaks; these are largely due to influenza A H3N2 that started as a pandemic strain in 1968 and to which (and its many drift variants) substantial herd immunity has developed. Influenza notifications commenced nationally in 2001 for laboratory-confirmed cases and, although a gross underestimate of disease burden, these provide useful information about the relative size of influenza seasons, circulating influenza strains and changes in age distribution consequent upon vaccination. However, caution in interpretation of these data is required due to differential rates of testing among jurisdictions and age groups. Annual influenza vaccination is currently recommended as the primary method of influenza prevention in people aged 65 years and over, all Indigenous people aged 50 years and over, and all indi-viduals aged 6 months and over with chronic medical conditions likely to be exacerbated by influenza or its complications, e.g. chronic pulmonary or cardiovascular disease.76 Vaccination uptake in Australians aged 65 years and over was estimated at 76.9% and 79.1% for 2003110 and 2004,111 respectively. Extension of influenza vaccination to all adult Indigenous people should be considered as both influenza hospi-talisation rates and mortality related to influenza and pneumonia are twice that documented in persons

CDI Vol 31 Supplement 2007 S107
Vaccine preventable diseases and vaccination coverage in Australia, 2003 to 2005
of non-Indigenous background across all age groups.77 As for the paediatric population, in 2003, the USA Advisory Committee on Immunization Practices (ACIP) recommended routine influenza vac-cination113,114 of healthy American children aged 6–23 months based on the high burden of illness.99,115,116 More recently, in 2006, the ACIP extended its recommendation to include children up to the age of five years.117 Whilst available Australian data suggest a similar significant burden of illness in young chil-dren,118,119 examination of cost-effectiveness, efficacy and feasibility of universal immunisation of healthy children is required before implementing such a population level strategy.120 Notwithstanding bias due to variable rates of documenting notification or hospitalisation across different age groups, it is noteworthy that, during 2003–2005, notifications in children under 5 years of age were five times greater than in the elderly aged 60 years and over and hospitalisation rates were, similarly, four times higher.
Hepatitis BAt both national and jurisdictional levels, notifications increased between 1993 and 2001 and since then have declined, while hospitalisations have remained steady since 1999. Notification rates in Victoria are disproportionately high compared with other jurisdictions, probably reflecting a more active approach to surveillance. However, hospitalisation rates are also higher suggesting the possibility of a truly higher rate of disease in Victoria. The review period saw a decline in notifications that was most marked in young adults aged 15–24 years. However, it is too soon to expect such a decline as a consequence of universal neonatal vaccination, which commenced nationally in 2000. One potential reason for the considerable reduction in notifications, particularly in 15–24 year olds, is the declining rates of intravenous drug use since 2000, consistent with trends in hepatitis C virus notifications.90 It is likely that the impact of both the targeted infant and catch-up adolescent vaccination programs will become more evident in the next 5–10 years.
Rare vaccine preventable diseases (tetanus, diphtheria and poliomyelitis)Tetanus continues to occur at a very low but seemingly declining rate with an average of five cases per year in 2000–2002 compared with 3.7 cases per year in 2003–2005. Tetanus is now largely a disease of older adults, reinforcing the need to check tetanus vaccination status when older adults present for other reasons, such as a routine visit for annual influenza vaccination. There is an ongoing risk of the importa-tion of diphtheria into Australia from regions where diphtheria is not well controlled, reinforcing the need for ensuring adequate immunisation across all age groups, especially amongst travellers. Australia and the Western Pacific region have been declared polio free,303 but the importation and subsequent polio outbreak in Indonesia in 2005185 highlight the ongoing need for high vaccination coverage and improved active surveillance for acute flaccid paralysis until global certification is achieved. The routine use of IPV, implemented in late 2005, will eliminate the small risk of vaccine-associated paralytic poliomyelitis. With the replacement of OPV with IPV in Australia, incidental detection of polioviruses in faecal specimens should no longer occur. Future poliovirus isolations will, therefore, require full investigation.179
Varicella-zosterWith the introduction of varicella-zoster vaccine in late 2005, surveillance of the disease burden due to both varicella and zoster have become greater priorities. Because disease modelling has raised the pos-sibility that an increase in zoster disease may flow on from a reduction in varicella (through reduction of natural ‘boosting’ of immunity due to intermittent exposure to varicella infection in the community),287 zoster surveillance will be as important as documenting declines in varicella infection in the coming years. Currently, surveillance data from the USA, where varicella immunisation has been recommended for over a decade, indicates a large reduction in varicella morbidity with no increase in zoster disease yet demonstrated.291 The availability of a vaccine to prevent zoster may become an important option in the future should surveillance detect an increase in zoster disease.283
Varicella-zoster surveillance has been funded as part of the national varicella immunisation program292 and will include notification to the NNDSS (in five jurisdictions, surveillance will comprise passive notification through GPs and labs; in two, it will include passive notification as well as syndromic surveil-lance, with specimen collection through sentinel GPs/emergency departments; and in one state, varicella will not be notifiable, with emergency department syndromic surveillance only).293 Additionally trends in disease burden will continue to be reviewed through hospitalisation data and Australian Paediatric Surveillance Unit data on neonatal and congenital varicella infections as well as severe infections in older children requiring hospitalisation.

S108 CDI Vol 31 Supplement 2007
Vaccine preventable diseases and vaccination coverage in Australia, 2003 to 2005
Pneumococcal diseaseVaccination with the 23vPPV has been funded nationally since 1999 for Aboriginal and Torres Strait Islander adults aged 50 years and over, and those aged 15–49 years with high-risk conditions.3 Nationally funded 7vPCV vaccination commenced in 2001 for all Aboriginal and Torres Strait Islander infants and other infants with high-risk conditions.3 In 2005, the 7vPCV was funded for all Australian infants and the 23vPPV for all aged 65 years and over. Data in this report suggest a noticeable impact in the first year of universal infant vaccination as, in 2005, the IPD notification rate declined by 25% overall and by 66% in those aged less than two years compared to the three previous years, and by 80% in cases with serotypes contained in the vaccine. Smaller decreases occurred in all other age groups, but these should be interpreted with caution due to the smaller numbers of cases in these age groups. Hospitalisation rates were lower in 2004/2005 compared to previous years, although this included only the first six months of the funded vaccination program. There were decreases in all age groups, but the greatest decrease was seen in infants (37%).
Concerns about replacement disease by serotypes not contained in the vaccine have been expressed.167 In the US, some replacement IPD appears to have occurred, but there is still a substantial overall decrease in IPD notifications.164 The data presented here for Australia on the first year of the vaccination program suggest the possibility of some replacement disease in unvaccinated age groups, but a substantial overall decline in IPD rates. It will be important to monitor this closely in future.
Disparities between Indigenous and non-Indigenous children may re-emerge following universal vac-cination, due to higher rates of non-vaccine type disease in Indigenous people.163 New conjugate vaccines with greater serotype coverage may be necessary to address this and the persistent high rates in Northern Territory Indigenous adults.
Meningococcal diseaseThe incidence of meningococcal disease in Australia increased continuously between 1991 and 2002.3 Following the introduction of the routine and catch-up meningococcal C vaccination programs in January 2003 for those born after 1983 (aged 19 years in 2003),136 there has been a marked decrease in meningococcal disease notifications, hospitalisations and deaths. The reduction in notifications occurred for both serogroup C disease and those where serogroup information was not available, while notifica-tions for serogroup B and other serogroups, mainly W135 and Y, remained relatively stable. A challenge remains to control serogroup C disease in young adults in whom the catch-up campaign was less com-prehensive than for those immunised in schools.
The high burden of meningococcal disease in infants, particularly non-vaccine preventable serogroup B disease, emphasises the importance of early recognition and appropriate clinical management of disease and the need for a vaccine to reduce the significant morbidity and mortality. Several candidate serogroup B vaccines are under investigation in international Phase II clinical trials.142 However, availability of a universal serogroup B vaccine appropriate for use in Australia is still some way off.
Vaccine preventable diseases not on the Australian Standard Vaccination Schedule in 2003–2005
Hepatitis AIn Australia, as in other industrialised countries, hepatitis A occurs sporadically with periodic epidemic peaks related to point-source and community-wide outbreaks. Notification and hospitalisation rates fell over the last three years. The epidemiology of hepatitis A differs significantly for the Indigenous popula-tion, where it has been endemic, compared with the non-Indigenous population. The greater disease burden in Indigenous children has been particularly pronounced in more remote areas. In 1999, an immunisation program commenced for Indigenous children aged 18 months to 6 years living in north Queensland. This was expanded in 2005 to include all Indigenous children aged 12 to 24 months in the Northern Territory, Queensland, South Australia and Western Australia. Continued monitoring should be a priority in Australia, both to assess the impact of these recent changes, and the need for any further expansion of vaccination coverage.82 In the United States, hepatitis A cases decreased substantially fol-lowing the recommendation of vaccination of children in communities with high rates of disease in 1996, and for states and counties with high hepatitis A notification rates in 1999. In 2006, this was expanded to include all US infants, as part of a staged implementation of progressively expanded vaccination.83

CDI Vol 31 Supplement 2007 S109
Vaccine preventable diseases and vaccination coverage in Australia, 2003 to 2005
Q feverAustralia is unique in having a Q fever vaccine available and used in a national program. The National Q fever Management Program (NQFMP), implemented in 2001–2002, promoted and provided screen-ing and vaccination services for those at highest risk of Q fever (meat and livestock industry workers and their families and those working on farms). Subsequently, Q fever notification and hospitalisation rates have declined to record low levels. Both because the program is continuing and because it is difficult to evaluate the contribution of non-program factors (e.g. variations in drought conditions or livestock slaughtering) to reductions in disease, continued and enhanced surveillance will be required in the com-ing years.
RotavirusRotavirus is responsible for a significant number of hospitalisations in Australia each year (around 3,500 hosp italisations were recorded annually with either a principal or non-principal diagnosis of rota-virus). The primary disease burden is in those under five years of age, with hospitalisation most common in the first two years after birth. Two vaccines became available in Australia in 2006 for the prevention of rotavirus gastroenteritis and were recommended for funding under the National Immunisation Program (NIP) for all infants by the Pharmaceutical Benefits Advisory Committee in 2006. The Northern Terri-tory made one of the rotavirus vaccines available free of charge from 1 October 2006 for infants born after 1 August 2006. Universal immunisation of infants in the first six months of life under the NIP should prevent the majority of severe cases of rotavirus and it is anticipated that hospitalisation rates will be substantially reduced. However, it will be important to encourage timeliness of vaccination in order to ensure a maximal impact upon disease. Ongoing analysis of national hospitalisation data will provide valuable data to help assess the impact of a national vaccination program, with laboratory notification in place in the Northern Territory and Queensland and proposed for other jurisdictions.
Vaccine preventable disease notification rates compared with other industrialised countries
The most recent notification rates for five vaccine preventable diseases compared with the rates in New Zealand, the USA, Canada and England, are shown in Table 30. Notifications of invasive Hib disease were low in all countries, reflecting the excellent results of Hib vaccination programs. Australia has moved closer to the situation in North America with respect to measles elimination, with notification rates decreasing from 1.7 per 100,000 in 1998 to 0.1 per 100,000 in 2005. The mumps outbreak in young adults in the UK is clearly evident, with the increasing notifications in Australia mild in comparison. Pertussis notification rates in Australia remain high compared with the USA, Canada and England, although this is attributable at least in part to the availability of serology for diagnosis. New Zealand has experienced a recent epidemic period with high rates in children primarily diagnosed by PCR or culture. Comparisons with other countries are difficult because of differences in case definitions for notification and laboratory diagnosis and notification in Australia. Nevertheless, it is likely that Australia still has a comparatively high pertussis disease burden, as reflected in hospitalisations.
Table 30. Most recent* notification rates per 100,000 population for frequently notified vaccine preventable diseases, by country of residence
Disease Australia New Zealand304 USA305 Canada306 England/Wales307
Hib disease 0.1 0.2 0.7 0.2 0.3Measles 0.1 0.5 0 <0.05 4.6 (0.2)†
Mumps 1.2 1.7 0.1 0.1 31.1 (17.7)‡
Pertussis 55.1 72.8 8.9 8.8 1.0Rubella 0.2 0.3 0 <0.05 2.5 (<0.05)§
* Australia 2005; New Zealand 2005; USA 2004; Canada 2004; England/Wales 2004.
† Incidence corrected for proportion serologically confi rmed = 5%.
‡ Incidence corrected for proportion serologically confi rmed = 57%.
§ Incidence corrected for proportion serologically confi rmed = 0.2%.

S110 CDI Vol 31 Supplement 2007
Vaccine preventable diseases and vaccination coverage in Australia, 2003 to 2005
Future surveillance priorities
For this report, access to and the scope of the data available from the Australian Institute of Health and Welfare (AIHW) National Hospital Morbidity Database and Causes of Death Collection have again been enhanced by NCIRS’ relationship with the AIHW as a collaborating centre. The presentation, for the first time in this report, of some recently enhanced data fields such as immunisation status and typing information from the National Notifiable Diseases Surveillance System (NNDSS), has shown how these fields provide important additional information but that there is still room for improvement in regards to data completeness. The introduction of revised national case definitions in 2004, including those for vaccine preventable diseases, provides increasing consistency to notification data. The requirements for the laboratory confirmation of diseases that have become rare due to the success of immunisation (e.g. Hib disease, measles, mumps and rubella) provide increasing confidence in notification data. The typing of clinical specimens for measles and rubella is now very important to document transmission of any imported cases and absence of endemic circulating types. The recent additions of varicella, meningococcal C and pneumococcal conjugate vaccines to the NIP in 2005 make close monitoring of the impact of these vaccination programs critical. Enhanced laboratory surveillance is in place for meningococcal and pneumococcal disease, and varicella-zoster surveillance through national notification is imminent. A study involving collaboration between NCIRS and APSU will focus on cases hospitalised with severe varicella disease and collect samples for viral characterisation. A similar collaboration to improve sur-veillance for acute flaccid paralysis is underway in order to document elimination of polio disease in Australia. A whole of life vaccination register is under consideration and, if implemented, would aid evaluation of vaccine effectiveness across the spectrum.
Future vaccination priorities
Table 29 provides measures of morbidity for comparison of disease burden relevant to current general or targeted programs. For most vaccine preventable diseases, the notification and hospitalisation rates are highest in children under five years of age. Immunisation programs targeting this age group are probably nearing their highest practically achievable targets, as measured by the Australian Childhood Immunisation Register and supported by a range of parent and provider incentives.41,296,308,309 For other vaccine preventable diseases, there is either a greater disease burden in older age groups, such as hepatitis A and B, pertussis (although rates in infants remain high) and tetanus, or important secondary age peaks in young adults, for diseases such as measles, mumps and meningococcal disease.
With respect to immunisation programs targeting diseases currently included in the NIP schedule, mea-sles, mumps, meningococcal disease and pertussis in older teenagers and young adults remain priorities. Australia has so far not found a successful means to deliver vaccination programs to older adolescents and young adults no longer attending school, with the approaches adopted for the promotion of MMR and meningococcal C vaccines in this age group having relatively little impact. School-based delivery of conjugate meningococcal C and adult-formulated pertussis vaccines has been a success and provides a model for other interventions in educational institutions. Delivery of vaccines such as MMR, pertussis and meningococcal C to young adults is difficult to implement and it is likely that this group will repre-sent an ongoing challenge for control of measles, mumps, rubella, pertussis and meningococcal C over the next few years. The 2003 addition to the ASVS of dTpa for adolescents in Australia demonstrated an international lead in pertussis control, which should be mirrored in notifications, provided high coverage is maintained. Australia is now in the mature phase of control for many vaccine preventable diseases, where incidence is very low and effectively close to elimination. Vaccines against diseases such as human papillomavirus and rotavirus will be implemented in the near future. Evaluation of the impacts of these new programs, as well as continued efforts to maintain current programs, will be required to sustain the success of immunisation in Australia over the coming years.

Appendix 1. Historical charts of notifications of vaccine preventable diseases

S112 CDI Vol 31 Supplement 2007
Vaccine preventable diseases and vaccination coverage in Australia, 2003 to 2005
Diphtheria, 1917–2005
0
50
100
150
200
250
300
350
400
45019
17
1921
1925
1929
1933
1937
1941
1945
1949
1953
1957
1961
1964
-65
1968
-69
1972
1976
1980
1984
1988
1992
1996
2000
2004
Year
Not
ifica
tions
per1
00,0
00po
pula
tion
1953 - DTP vaccination introduced
1932 - Diphtheria vaccination commenced
Haemophilus influenzae type b disease, 1991–2005
0.0
0.5
1.0
1.5
2.0
2.5
3.0
3.5
1991
1992
1993
1994
1995
1996
1997
1998
1999
2000
2001
2002
2003
2004
2005
Year
Not
ifica
tions
per1
00,0
00po
pula
tion 1992 - First Hib vaccines approved
1993 - National Hib vaccination program commenced
Indicates major change in vaccination policy. Source: Hall R. Notifiable disease surveillance, 1917 to 1991. Commun Dis Intell 1993;17:226–36. Updated with NNDSS data 1992–2005

CDI Vol 31 Supplement 2007 S113
Vaccine preventable diseases and vaccination coverage in Australia, 2003 to 2005
Hepatitis A, 1952–2005
0
20
40
60
80
100
120
140
1952
1955
1958
1961
1963
-64
1966
-67
1969
-70
1972
1975
1978
1981
1984
1987
1990
1993
1996
1999
2002
2005
Year
Not
ifica
tions
per1
00,0
00po
pula
tion
Measles, 1917–2005
0
500
1000
1500
2000
2500
3000
1917
1921
1925
1929
1933
1937
1941
1945
1949
1953
1957
1961
1964
-65
1968
-69
1972
1976
1980
1984
1988
1992
1996
2000
2004
Year
Not
ifica
tions
per1
00,0
00po
pula
tion
1970 - Measles vaccine becamewidely available
Indicates major change in vaccination policy. Source: Hall R. Notifiable disease surveillance, 1917 to 1991. Commun Dis Intell 1993;17:226–36. Updated with NNDSS data 1992–2005

S114 CDI Vol 31 Supplement 2007
Vaccine preventable diseases and vaccination coverage in Australia, 2003 to 2005
Mumps, 1932–2005
0
1
10
100
1000
1932
1936
1940
1944
1948
1952
1956
1960
1963
-64
1967
-68
1971
1975
1979
1983
1987
1991
1995
1999
2003
Year
Not
ifica
tions
per1
00,0
00:l
ogar
ithm
icsc
ale
Please note that Y axis is alogarithmic scale
Indicates major change in vaccination policy. Source: Hall R. Notifiable disease surveillance, 1917 to 1991. Commun Dis Intell 1993;17:226–36. Updated with NNDSS data 1992–2005
Meningococcal disease (invasive), 1949–2005
0
1
2
3
4
5
6
719
49
1953
1957
1961
1964
-65
1968
-69
1972
1976
1980
1984
1988
1992
1996
2000
2004
Year
Not
ifica
tions
per1
00,0
00po
pula
tion 2003 - National Meningococcal C
Vaccination Program commenced.Meningococcal C conjugate vaccineadded to vaccination schedule.

CDI Vol 31 Supplement 2007 S115
Vaccine preventable diseases and vaccination coverage in Australia, 2003 to 2005
Poliomyelitis, 1917–2005
0
5
10
15
20
25
30
35
40
45
1917
1921
1925
1929
1933
1937
1941
1945
1949
1953
1957
1961
1964
-65
1968
-69
1972
1976
1980
1984
1988
1992
1996
2000
2004
Year
Not
ifica
tions
per1
00,0
00po
pula
tion
1956 - mass vaccination withIPV commenced
1966 - OPV introduced
Indicates major change in vaccination policy. Source: Hall R. Notifiable disease surveillance, 1917 to 1991. Commun Dis Intell 1993;17:226–36. Updated with NNDSS data 1992–2005
Pertussis, 1917–2005
0
100
200
300
400
500
600
700
800
900
1917
1921
1925
1929
1933
1937
1941
1945
1949
1953
1957
1961
1964
-65
1968
-69
1972
1976
1980
1984
1988
1992
1996
2000
2004
Year
Not
ifica
tions
per1
00,0
00po
pula
tion
1953 - DTP vaccination introduced
1942 - Mass vaccination withpertussis vaccine commenced

S116 CDI Vol 31 Supplement 2007
Vaccine preventable diseases and vaccination coverage in Australia, 2003 to 2005
Rubella, 1942–2005
0
10
20
30
40
50
60
70
80
90
10019
42
1946
1950
1954
1958
1962
1965
-66
1969
-70
1973
1977
1981
1985
1989
1993
1997
2001
2005
Year
Not
ifica
tions
per1
00,0
00po
pula
tion
1971 - School-girl rubellaprogram commenced
1989 - MMR replacedMM vaccine for infants
1993 - 2-doseschedule introduced
Tetanus, 1917–2005
0.0
0.2
0.4
0.6
0.8
1.0
1.2
1.4
1.6
1.8
2.0
1917
1921
1925
1929
1933
1937
1941
1945
1949
1953
1957
1961
1964
-65
1968
-69
1972
1976
1980
1984
1988
1992
1996
2000
2004
Year
Not
ifica
tions
per1
00,0
00po
pula
tion 1953 - DTP vaccination introduced
Indicates major change in vaccination policy. Source: Hall R. Notifiable disease surveillance, 1917 to 1991. Commun Dis Intell 1993;17:226–36. Updated with NNDSS data 1992–2005

Appendix 2. Notifications by state or territory (January 2000–December 2005)

S118 CDI Vol 31 Supplement 2007
Vaccine preventable diseases and vaccination coverage in Australia, 2003 to 2005
Tabl
e 31
. N
otif
icat
ions
by
stat
e or
terr
itor
y an
d ye
ar (
Janu
ary
2000
–Dec
embe
r 200
5)
Dis
ease
*N
umbe
r of n
otifi
catio
nsN
otifi
catio
n ra
te p
er 1
00,0
00 p
opul
atio
n
Year
AC
TN
SWN
TQ
ldSA
Tas
Vic
WA
Tota
lA
CT
NSW
NT
Qld
SATa
sVi
cW
ATo
tal
Dip
hthe
ria20
000
00
00
00
00
––
––
––
––
–20
010
01
00
00
01
––
0.5
––
––
–0.
020
020
00
00
00
00
––
––
––
––
–20
030
00
00
00
00
––
––
––
––
–20
040
00
00
00
00
––
––
––
––
–20
050
00
00
00
00
––
––
––
––
–To
tal†
00
10
00
00
1–
–0.
1–
––
––
0.0
Hae
mop
hilu
s in
fl uen
zae
type
b
men
ingi
tis(<
15 y
rs o
nly)
2000
04
07
10
20
14–
0.3
–0.
90.
3–
0.2
–0.
420
010
63
22
02
116
–0.
45.
90.
30.
7–
0.2
0.2
0.4
2002
04
21
20
16
16–
0.3
3.9
0.1
0.7
–0.
11.
50.
420
030
42
31
01
112
–0.
34.
00.
40.
3–
0.1
0.3
0.3
2004
02
23
20
10
10–
0.2
4.0
0.4
0.7
–0.
1–
0.3
2005
04
12
00
20
9–
0.3
2.0
0.2
––
0.2
–0.
2To
tal†
024
1018
80
98
77–
0.3
3.3
0.4
0.5
–0.
20.
30.
3H
epat
itis
A20
005
202
4513
454
319
318
181
71.
63.
123
.03.
83.
60.
64.
19.
74.
320
0127
198
3812
020
410
540
552
8.5
3.0
19.2
3.3
1.3
0.8
2.2
2.1
2.8
2002
814
547
6716
468
3739
22.
52.
223
.71.
81.
10.
81.
41.
92.
020
035
124
4348
1314
8995
431
1.5
1.9
21.7
1.3
0.9
2.9
1.8
4.9
2.2
2004
113
714
2711
171
5731
90.
32.
07.
00.
70.
70.
21.
42.
91.
620
053
8364
5010
259
5432
50.
91.
231
.61.
30.
60.
41.
22.
71.
6To
tal†
4988
925
144
612
428
585
464
2,83
62.
52.
221
.02.
01.
41.
02.
04.
02.
4H
epat
itis
B
(acu
te)
2000
310
06
5430
1813
173
415
1.0
1.5
3.1
1.5
2.0
3.8
2.8
3.9
2.2
2001
495
349
2221
192
3842
41.
31.
41.
51.
41.
54.
54.
02.
02.
220
020
7912
5311
1917
435
383
–1.
26.
01.
40.
74.
03.
61.
82.
020
030
7415
4010
1015
245
346
–1.
17.
61.
10.
72.
13.
12.
31.
720
045
538
508
1711
029
280
1.5
0.8
4.0
1.3
0.5
3.5
2.2
1.5
1.4
2005
358
559
83
7834
248
0.9
0.9
2.5
1.5
0.5
0.6
1.6
1.7
1.2
Tota
l†15
459
4930
589
8883
725
42,
096
0.8
1.2
4.1
1.4
1.0
3.1
2.9
2.2
1.8

CDI Vol 31 Supplement 2007 S119
Vaccine preventable diseases and vaccination coverage in Australia, 2003 to 2005
Dis
ease
*N
umbe
r of n
otifi
catio
nsN
otifi
catio
n ra
te p
er 1
00,0
00 p
opul
atio
n
Year
AC
TN
SWN
TQ
ldSA
Tas
Vic
WA
Tota
lA
CT
NSW
NT
Qld
SATa
sVi
cW
ATo
tal
Infl u
enza
§20
0126
244
(95)
||(3
96)||
135
(0)||
(176
)||23
4(1
,306
)||8.
13.
748
.010
.98.
90.
03.
712
.36.
7¶
2002
3899
653
1,14
229
17
593
551
3,67
111
.815
.026
.730
.819
.21.
512
.228
.618
.720
037
861
151
890
311
764
061
63,
483
2.2
12.9
76.1
23.4
20.4
1.5
13.0
31.6
17.5
2004
11,
012
3961
475
320
518
42,
133
0.3
15.1
19.5
15.8
4.9
0.6
4.1
9.3
10.6
2005
391,
415
611,
698
277
1959
446
64,
569
12.0
20.9
30.1
42.8
18.0
3.9
11.8
23.2
22.5
Tota
l‡11
14,
528
(399
)||(4
,740
)||1,
089
(36)
||(2
,208
)||2,
051
(15,
162)
||8.
616
.949
.930
.917
.81.
911
.226
.119
.0¶
Mea
sles
2000
336
028
111
2110
110
1.0
0.6
–0.
80.
70.
20.
40.
50.
620
010
310
112
282
1314
1–
0.5
–0.
30.
10.
41.
70.
70.
720
020
80
82
014
032
–0.
1–
0.2
0.1
–0.
3–
0.2
2003
018
111
240
390
93–
0.3
0.5
0.3
1.6
–0.
8–
0.5
2004
012
30
60
159
45–
0.2
1.5
–0.
4–
0.3
0.5
0.2
2005
05
01
01
21
10–
0.1
–0.
0–
0.2
0.0
0.0
0.0
Tota
l†3
110
459
454
173
3343
10.
20.
30.
30.
30.
50.
10.
60.
30.
4M
enin
goco
ccal
di
seas
e20
005
254
966
3215
161
8662
81.
63.
94.
61.
92.
13.
23.
44.
63.
320
018
235
1312
940
2416
474
687
2.5
3.6
6.6
3.6
2.6
5.1
3.4
3.9
3.5
2002
1220
79
124
3026
211
6868
73.
73.
14.
53.
32.
05.
54.
33.
53.
520
0313
202
1210
533
2012
746
558
4.0
3.0
6.0
2.8
2.2
4.2
2.6
2.4
2.8
2004
1114
812
8413
1879
4040
53.
42.
26.
02.
20.
83.
71.
62.
02.
020
058
139
1162
2610
8947
392
2.5
2.1
5.4
1.6
1.7
2.1
1.8
2.3
1.9
Tota
l†57
1,18
566
570
174
113
831
361
3,35
73.
03.
05.
52.
51.
94.
02.
83.
12.
8M
umps
2000
1892
4N
N15
243
39(2
13)||
5.7
1.4
2.0
NA
1.0
0.4
0.9
2.1
1.1¶
2001
228
1(3
)||12
240
29(1
17))||
0.6
0.4
0.5
NA
0.8
0.4
0.8
1.5
0.6¶
2002
027
16
100
1013
67–
0.4
0.5
0.2
0.7
–0.
20.
70.
320
032
350
1013
04
1377
0.6
0.5
–0.
30.
9–
0.1
0.7
0.4
2004
365
017
40
310
102
0.9
1.0
–0.
40.
3–
0.1
0.5
0.5
2005
111
07
718
020
2324
00.
31.
63.
51.
80.
5–
0.4
1.1
1.2
Tota
l†26
357
13(1
07)||
624
120
127
(816
))||1.
30.
91.
10.
50.
70.
10.
41.
10.
7¶
Tabl
e 31
. N
otif
icat
ions
by
stat
e or
terr
itor
y an
d ye
ar (
Janu
ary
2000
–Dec
embe
r 200
5), c
onti
nued

S120 CDI Vol 31 Supplement 2007
Vaccine preventable diseases and vaccination coverage in Australia, 2003 to 2005
Dis
ease
*N
umbe
r of n
otifi
catio
nsN
otifi
catio
n ra
te p
er 1
00,0
00 p
opul
atio
n
Year
AC
TN
SWN
TQ
ldSA
Tas
Vic
WA
Tota
lA
CT
NSW
NT
Qld
SATa
sVi
cW
ATo
tal
Per
tuss
is20
0021
93,
689
954
058
814
371
593
5,99
669
.556
.94.
615
.239
.130
.315
.15.
031
.320
0116
24,
438
150
1,62
62,
010
104
863
227
9,58
050
.767
.575
.844
.813
3.0
22.0
18.0
11.9
49.3
2002
110
1,85
037
1,85
347
337
868
234
5,46
234
.227
.918
.649
.931
.17.
817
.912
.227
.820
0335
72,
770
571
623
213
362
625
55,
094
110.
441
.52.
518
.815
.227
.912
.713
.125
.620
0412
43,
562
271,
033
994
3787
22,
101
8,75
038
.353
.013
.526
.664
.97.
717
.610
6.2
43.6
2005
315
5,79
492
1,77
51,
507
331,
160
515
11,1
9196
.985
.545
.444
.897
.76.
823
.125
.655
.1To
tal†
1,28
722
,103
320
7,54
35,
804
487
5,10
43,
425
46,0
7366
.755
.426
.833
.463
.517
.017
.429
.438
.9(<
5 yr
onl
y)To
tal‡
451,
587
7155
029
937
399
507
3,49
536
.561
.567
.636
.855
.220
.121
.767
.445
.9P
neum
ococ
cal
dise
ase
(inva
sive
)§
2001
3344
399
430
(118
)||62
(383
)||20
4(1
,772
)||10
.36.
750
.111
.8N
A13
.1N
A10
.79.
1¶
2002
6687
666
438
180
6355
222
52,
466
20.5
13.2
33.2
11.8
11.9
13.3
11.4
11.7
12.6
2003
4180
773
468
177
5246
915
02,
237
12.7
12.1
36.8
12.3
11.6
10.9
9.5
7.7
11.3
2004
5591
093
476
198
5738
919
92,
377
17.0
13.5
46.5
12.2
12.9
11.8
7.8
10.1
11.8
2005
3064
671
325
135
4429
913
91,
689
9.2
9.5
35.0
8.2
8.8
9.1
6.0
6.9
8.3
Tota
l‡22
53,
682
402
2,13
7(8
08)||
278
(2,0
92)||
917
(10,
541)
||11
.79.
233
.79.
58.
89.
77.
17.
98.
9¶
Pol
iom
yelit
is20
000
00
00
00
00
––
––
––
––
–20
010
00
00
00
00
––
––
––
––
–20
020
00
00
00
00
––
––
––
––
–20
030
00
00
00
00
––
––
––
––
–20
040
00
00
00
00
––
––
––
––
–20
050
00
00
00
00
––
––
––
––
–To
tal†
00
00
00
00
0–
––
––
––
––
Q fe
ver
2000
013
20
393
111
2414
575
–2.
0–
11.0
0.7
0.2
0.5
0.7
3.0
2001
514
30
444
171
6519
694
1.6
2.2
–12
.21.
10.
21.
41.
03.
620
020
275
135
727
082
2076
2–
4.1
0.5
9.6
1.8
–1.
71.
03.
920
031
288
122
315
114
1956
20.
34.
30.
55.
91.
00.
20.
31.
02.
820
042
220
316
040
029
946
30.
63.
31.
54.
12.
6–
0.6
0.5
2.3
2005
013
93
157
170
286
350
–2.
11.
54.
01.
1–
0.6
0.3
1.7
Tota
l†8
1,19
78
1,73
412
73
242
873,
406
0.4
3.0
0.7
7.7
1.4
0.1
0.8
0.7
2.9
Tabl
e 31
. N
otif
icat
ions
by
stat
e or
terr
itor
y an
d ye
ar (
Janu
ary
2000
–Dec
embe
r 200
5), c
onti
nued

CDI Vol 31 Supplement 2007 S121
Vaccine preventable diseases and vaccination coverage in Australia, 2003 to 2005
Dis
ease
*N
umbe
r of n
otifi
catio
nsN
otifi
catio
n ra
te p
er 1
00,0
00 p
opul
atio
n
Year
AC
TN
SWN
TQ
ldSA
Tas
Vic
WA
Tota
lA
CT
NSW
NT
Qld
SATa
sVi
cW
ATo
tal
Rub
ella
2000
419
10
467
167
632
21.
32.
9–
1.3
0.5
0.2
1.4
0.3
1.7
2001
258
013
45
360
326
50.
60.
9–
3.7
0.3
0.6
1.2
0.2
1.4
2002
635
118
95
116
425
71.
90.
50.
55.
10.
30.
20.
30.
21.
320
030
230
251
11
354
–0.
3–
0.7
0.1
0.2
0.0
0.2
0.3
2004
017
09
20
03
31–
0.3
–0.
20.
1–
–0.
20.
220
050
100
90
06
631
–0.
1–
0.2
––
0.1
0.3
0.2
Tota
l†12
334
141
220
615
025
960
0.6
0.8
0.1
1.8
0.2
0.2
0.5
0.2
0.8
Teta
nus
2000
02
02
30
10
8–
0.0
–0.
10.
20.
00.
0–
0.0
2001
00
00
11
10
3–
––
–0.
10.
20.
0–
0.0
2002
00
03
00
01
4–
––
0.1
––
–0.
10.
020
030
10
20
01
04
–0.
0–
0.1
––
0.0
–0.
020
040
00
32
00
05
––
–0.
10.
1–
––
0.0
2005
01
00
01
00
2–
0.0
––
–0.
2–
–0.
0To
tal†
04
010
62
31
26–
0.0
–0.
00.
10.
10.
00.
00.
0
* S
ee C
hapt
er 3
for c
ase
defi n
ition
s.†
Tota
l cas
es fo
r 6-y
ear p
erio
d an
d av
erag
e an
nual
rate
per
100
,000
pop
ulat
ion.
‡ To
tal c
ases
for 5
-yea
r per
iod
and
aver
age
annu
al ra
te p
er 1
00,0
00 p
opul
atio
n.§
Dis
ease
not
not
ifi ab
le p
rior t
o 20
01.
|| D
isea
se n
ot n
otifi
able
for c
ompl
ete
year
for s
ome
juris
dict
ions
.¶
Nat
iona
l rat
e on
ly in
clud
es ju
risdi
ctio
ns w
here
dis
ease
was
not
ifi ab
le fo
r com
plet
e ye
ar.
Tabl
e 31
. N
otif
icat
ions
by
stat
e or
terr
itor
y an
d ye
ar (
Janu
ary
2000
–Dec
embe
r 200
5), c
onti
nued

Appendix 3. Hospitalisations by state or territory (1 July 2000–30 June 2005)

CDI Vol 31 Supplement 2007 S123
Vaccine preventable diseases and vaccination coverage in Australia, 2003 to 2005
Tabl
e 32
. H
ospi
talis
atio
ns b
y st
ate
or te
rrit
ory
and
fina
ncia
l yea
r of s
epar
atio
n (1
Jul
y 20
00–3
0 Ju
ne 2
005)
*
Dis
ease
†Ye
arN
umbe
r of h
ospi
talis
atio
nsH
ospi
talis
atio
n ra
te p
er 1
00,0
00 p
opul
atio
nA
CT
NSW
NT
Qld
SATa
sVi
cW
ATo
tal
AC
TN
SWN
TQ
ldSA
Tas
Vic
WA
Tota
lH
aem
ophi
lus
infl u
enza
e ty
pe
b m
enin
gitis
‡
(<15
yrs
onl
y)
00/0
10
10
101
<5<5
<5n.
p.–
0.1
–1.
30.
3n.
p.n.
p.n.
p.n.
p.01
/02
04
<52
40
<5<5
16–
0.3
n.p.
0.3
1.4
–n.
p.n.
p.0.
402
/03
03
02
20
07
14–
0.2
–0.
30.
7–
–1.
80.
403
/04
02
<56
40
0<5
15–
0.2
n.p.
0.8
1.4
––
n.p.
0.4
04/0
50
2<5
40
<5<5
0n.
p.–
0.2
n.p.
0.5
–n.
p.n.
p.–
n.p.
Tota
l§0
12<1
524
11<1
0<1
5<1
570
–0.
22.
40.
60.
8n.
p.n.
p.0.
60.
4H
epat
itis
A00
/01
512
513
6628
775
3235
11.
61.
96.
61.
91.
91.
51.
61.
71.
801
/02
n.p.
145
1460
28<5
5416
325
n.p.
2.2
7.1
1.7
1.9
n.p.
1.1
0.8
1.7
02/0
3<5
112
2461
29n.
p.48
2630
7n.
p.1.
712
.11.
61.
9n.
p.1.
01.
41.
603
/04
<587
1725
22n.
p.42
4324
3n.
p.1.
38.
60.
71.
4n.
p.0.
92.
21.
204
/05
<572
938
8<5
5717
205
n.p.
1.1
4.5
1.0
0.5
n.p.
1.1
0.9
1.0
Tota
l§17
541
7725
011
521
276
134
1,43
11.
11.
67.
81.
31.
50.
91.
11.
41.
5H
epat
itis
B
(acu
te) (
prin
cipa
l di
agno
sis
only
)
00/0
10
36<5
1410
n.p.
6522
158
–0.
6n.
p.0.
40.
7n.
p.1.
41.
20.
801
/02
046
n.p.
134
<561
1614
7–
0.7
n.p.
0.4
0.3
n.p.
1.3
0.8
0.8
02/0
3<5
59<5
254
n.p.
7520
194
n.p.
0.9
n.p.
0.7
0.3
n.p.
1.5
1.0
1.0
03/0
40
50<5
238
<562
1816
9–
0.7
n.p.
0.6
0.5
n.p.
1.3
0.9
0.9
04/0
5<5
39<5
158
<561
2215
4n.
p.0.
6n.
p.0.
40.
5n.
p.1.
21.
10.
8To
tal§
<523
0n.
p.90
34n.
p.32
498
822
n.p.
0.7
n.p.
0.5
0.4
n.p.
1.3
1.0
0.8
Infl u
enza
||00
/01
171,
191
3870
133
154
603
536
3,47
15.
418
.419
.419
.722
.011
.512
.728
.618
.101
/02
1181
724
631
293
3649
350
22,
807
3.4
12.4
12.1
17.4
19.4
7.6
10.3
26.4
14.5
02/0
39
997
3678
521
130
543
530
3,14
12.
815
.018
.121
.213
.96.
311
.227
.516
.003
/04
141,
241
108
714
386
7064
477
93,
956
4.3
18.6
54.4
18.8
25.3
14.7
13.1
39.9
19.9
04/0
511
618
3542
314
614
371
401
2,01
93.
49.
217
.510
.99.
52.
97.
520
.310
.0To
tal§
624,
864
241
3,25
41,
367
204
2,65
42,
748
15,3
943.
914
.724
.317
.518
.08.
610
.928
.515
.7M
easl
es00
/01
<514
06
40
36<5
65n.
p.0.
2–
0.2
0.3
–0.
80.
20.
301
/02
010
02
1<5
18n.
p.41
–0.
2–
0.1
0.1
n.p
0.4
0.4
0.2
02/0
30
110
02
<516
<532
–0.
2–
–0.
1n.
p0.
30.
10.
203
/04
<513
09
40
n.p.
<539
n.p.
0.2
–0.
20.
3–
n.p
0.1
0.2
04/0
5<5
9n.
p1
3<5
<5<5
23n.
p.0.
1n.
p0.
00.
2n.
pn.
p0.
20.
1To
tal§
<557
<518
14<5
8517
200
n.p.
0.2
n.p
0.1
0.2
n.p
0.4
0.2
0.2

S124 CDI Vol 31 Supplement 2007
Vaccine preventable diseases and vaccination coverage in Australia, 2003 to 2005
Dis
ease
†Ye
arN
umbe
r of h
ospi
talis
atio
nsH
ospi
talis
atio
n ra
te p
er 1
00,0
00 p
opul
atio
nA
CT
NSW
NT
Qld
SATa
sVi
cW
ATo
tal
AC
TN
SWN
TQ
ldSA
Tas
Vic
WA
Tota
lM
enin
goco
ccal
di
seas
e00
/01
532
310
140
5115
230
9687
01.
65.
05.
13.
93.
43.
24.
95.
14.
501
/02
924
015
178
6044
253
7787
62.
83.
77.
64.
94.
09.
35.
34.
14.
502
/03
<527
710
195
n.p.
1924
395
883
n.p.
4.2
5.0
5.3
n.p.
4.0
5.0
4.9
4.5
03/0
419
250
1415
257
2418
964
769
5.9
3.7
7.1
4.0
3.7
5.0
3.8
3.3
3.9
04/0
512
197
1286
2618
8547
483
3.7
2.9
6.0
2.2
1.7
3.7
1.7
2.4
2.4
Tota
l§n.
p.1,
287
6175
1n.
p.12
01,
000
379
2,13
5n.
p.3.
96.
24.
0n.
p.5.
14.
13.
94.
0M
umps
00/0
1<5
150
104
012
<548
n.p.
0.2
–0.
30.
3–
0.3
n.p
0.3
01/0
20
180
54
<57
<537
–0.
3–
0.1
0.3
n.p
0.1
n.p
0.2
02/0
30
19<5
93
010
<545
–0.
3n.
p0.
20.
2–
0.2
n.p
0.2
03/0
40
16<5
91
<511
n.p.
45–
0.2
n.p
0.2
0.1
n.p
0.2
n.p
0.2
04/0
50
150
94
<512
n.p.
48–
0.2
–0.
20.
3n.
p0.
2n.
p0.
2To
tal§
<583
<542
16<5
5222
223
n.p.
0.3
n.p
0.2
0.2
n.p
0.2
0.2
0.2
Per
tuss
is00
/01
826
710
5678
662
1950
62.
54.
15.
11.
65.
21.
31.
31.
02.
601
/02
<526
044
156
134
n.p.
9868
770
n.p
4.0
22.2
4.3
8.9
n.p.
2.0
3.6
4.0
02/0
3<5
.11
1<5
131
29n.
p.57
2235
9n.
p.1.
7n.
p3.
51.
9n.
p.1.
21.
11.
803
/04
n.p.
141
<576
1918
7335
373
n.p
2.1
n.p
2.0
1.2
3.8
1.5
1.8
1.9
04/0
5n.
p.17
913
8789
<581
129
587
n.p.
2.7
6.5
2.2
5.8
n.p.
1.6
6.5
2.9
Tota
l§27
958
7150
634
940
371
273
2,59
51.
72.
97.
22.
74.
61.
71.
52.
82.
6(<
5 yr
onl
y)To
tal§
1660
560
295
172
2927
620
01,
653
15.5
28.0
68.5
23.8
37.9
18.9
18.0
31.9
26.0
Pne
umoc
occa
l di
seas
e (in
vasi
ve)¶
00/0
114
375
5817
065
1321
899
1,01
24.
45.
829
.74.
84.
32.
84.
65.
35.
301
/02
2036
546
189
104
2525
498
1,10
16.
35.
623
.35.
26.
95.
35.
35.
25.
702
/03
2536
242
175
7327
281
118
1,10
37.
85.
521
.14.
74.
85.
75.
86.
15.
603
/04
1639
045
162
7811
256
851,
043
4.9
5.8
22.7
4.3
5.1
2.3
5.2
4.4
5.2
04/0
515
336
4514
271
2422
211
496
94.
65.
022
.53.
74.
65.
04.
55.
84.
8To
tal§
901,
828
236
838
391
100
1231
514
5,22
85.
65.
523
.84.
55.
14.
25.
15.
35.
3
Tabl
e 32
. H
ospi
talis
atio
ns b
y st
ate
or te
rrit
ory
and
fina
ncia
l yea
r of s
epar
atio
n (1
Jul
y 20
00–3
0 Ju
ne 2
005)
,*co
ntin
ued

CDI Vol 31 Supplement 2007 S125
Vaccine preventable diseases and vaccination coverage in Australia, 2003 to 2005
Dis
ease
†Ye
arN
umbe
r of h
ospi
talis
atio
nsH
ospi
talis
atio
n ra
te p
er 1
00,0
00 p
opul
atio
nA
CT
NSW
NT
Qld
SATa
sVi
cW
ATo
tal
AC
TN
SWN
TQ
ldSA
Tas
Vic
WA
Tota
lP
olio
mye
litis
**00
/01
09
<50
30
<50
n.p.
–0.
1n.
p.–
0.2
–n.
p.–
n.p.
01/0
2<5
6<5
02
<50
014
n.p.
0.1
n.p.
–0.
1n.
p.–
–0.
102
/03
<526
<53
00
n.p.
039
n.p.
0.4
n.p.
0.1
––
n.p.
–0.
203
/04
016
01
00
<5<5
20–
0.2
–0.
0–
–n.
p.n.
p.0.
104
/05††
n.p.
n.p.
n.p.
n.p.
n.p.
n.p.
n.p.
n.p.
1–
––
––
––
–0.
1To
tal§
<557
7n.
p.n.
p.<5
9<5
88n.
p.0.
20.
70.
00.
1n.
p.0.
0n.
p.0.
1.(P
rinci
pal
diag
nosi
s on
ly)
Tota
l§0
60
01
00
07
–0.
0–
–0.
0–
––
0.0
Q fe
ver
00/0
10
620
111
30
13<5
n.p.
–1.
0–
3.1
0.2
–0.
3n.
p.n.
p.01
/02
071
<513
611
<516
<523
9–
1.1
n.p.
3.7
0.7
n.p.
0.3
n.p.
1.2
02/0
3<5
109
<510
717
<513
725
9n.
p.1.
6n.
p.2.
91.
1n.
p.0.
30.
41.
303
/04
011
6<5
869
613
n.p.
238
–1.
7n.
p.2.
30.
61.
30.
3n.
p.1.
204
/05
074
<551
10<5
14<5
155
–1.
1n.
p.1.
30.
7n.
p.0.
3n.
p.0.
8To
tal§
<543
2n.
p.49
150
1169
221,
084
n.p.
1.3
n.p.
2.6
0.7
0.5
0.3
0.2
1.1
Rot
aviru
s00
/01
147
1,72
529
880
544
544
559
452
4,47
546
.626
.615
2.4
22.6
29.6
9.3
11.8
24.1
23.4
01/0
214
21,
630
296
764
325
9542
237
64,
050
44.5
24.8
149.
721
.121
.520
.18.
819
.820
.902
/03
911,
710
199
900
337
4947
231
34,
071
28.3
25.8
100.
224
.322
.210
.49.
716
.320
.703
/04
391,
575
231
567
556
5343
634
63,
803
12.1
23.6
116.
314
.936
.411
.18.
917
.719
.104
/05
4597
216
357
141
311
634
423
52,
859
13.9
14.5
81.6
14.7
26.9
24.1
6.9
11.9
14.2
Tota
l§46
47,
612
1,18
73,
607
2,07
635
72,
233
1,72
219
,258
28.9
23.0
119.
919
.427
.315
.09.
217
.919
.6R
ubel
la00
/01
024
03
10
<5<5
33–
0.4
–0.
10.
1–
n.p.
n.p.
0.2
01/0
20
150
11
<5<5
021
–0.
2–
0.0
0.1
n.p.
n.p.
0.0
0.1
02/0
3<5
90
21
<5n.
p.<5
21n.
p.0.
1–
0.1
0.1
n.p.
n.p.
n.p.
0.1
03/0
40
70
22
<5<5
<518
–0.
1–
0.1
0.1
n.p.
n.p.
n.p.
0.1
04/0
50
10
00
0<5
<55
–0.
0–
––
–n.
p.n.
p.0.
0To
tal§
<556
08
5<5
n.p.
n.p.
98n.
p.0.
2–
0.0
0.1
n.p.
n.p.
n.p.
0.1
Tabl
e 32
. H
ospi
talis
atio
ns b
y st
ate
or te
rrit
ory
and
fina
ncia
l yea
r of s
epar
atio
n (1
Jul
y 20
00–3
0 Ju
ne 2
005)
,*co
ntin
ued

S126 CDI Vol 31 Supplement 2007
Vaccine preventable diseases and vaccination coverage in Australia, 2003 to 2005
Dis
ease
†Ye
arN
umbe
r of h
ospi
talis
atio
nsH
ospi
talis
atio
n ra
te p
er 1
00,0
00 p
opul
atio
nA
CT
NSW
NT
Qld
SATa
sVi
cW
ATo
tal
AC
TN
SWN
TQ
ldSA
Tas
Vic
WA
Tota
lTe
tanu
s**
00/0
10
170
63
<5<5
<531
–0.
3–
0.2
0.2
n.p.
n.p.
n.p.
0.2
01/0
20
60
43
0<5
623
–0.
1–
0.1
0.2
–n.
p.0.
30.
102
/03
06
07
30
56
27–
0.1
–0.
20.
2–
0.1
0.3
0.1
03/0
40
70
4n.
p.<5
<50
17–
0.1
–0.
1n.
p.n.
p.n.
p.–
0.1
04/0
50
50
10n.
p.0
<50
22–
0.1
–0.
3n.
p.–
n.p.
–0.
1To
tal§
041
031
17<5
16n.
p.12
0–
0.1
–0.
20.
2n.
p.0.
1n.
p.0.
1Va
ricel
la00
/01
2254
814
336
152
3034
419
81,
644
7.0
8.4
7.2
9.4
10.1
6.4
7.3
10.6
8.6
01/0
222
570
2130
818
532
344
197
1,67
96.
98.
710
.68.
512
.26.
87.
210
.48.
602
/03
642
818
244
9134
307
130
1,25
81.
96.
59.
16.
66.
07.
26.
36.
86.
403
/04
856
827
354
122
3229
014
51,
546
2.5
8.5
13.6
9.3
8.0
6.7
5.9
7.4
7.8
04/0
517
492
1827
911
347
314
197
1,47
75.
27.
39.
07.
27.
49.
76.
310
.07.
4To
tal§
752,
606
981,
521
663
175
1,59
986
77,
604
4.7
7.9
9.9
8.2
8.7
7.4
6.6
9.0
7.7
Zost
er00
/01
441,
521
1583
844
413
51,
142
416
4,55
514
.023
.47.
723
.529
.528
.624
.122
.223
.801
/02
561,
453
2189
151
413
81,
175
380
4,62
817
.522
.110
.624
.634
.029
.224
.520
.023
.802
/03
571,
619
2685
748
717
61,
222
448
4,89
217
.724
.413
.123
.132
.137
.225
.223
.324
.903
/04
561,
545
2781
745
612
41,
246
436
4,70
717
.323
.113
.621
.529
.926
.025
.422
.423
.704
/05
331,
971
3695
145
911
51,
275
487
5,32
710
.229
.318
.024
.529
.923
.825
.724
.626
.5To
tal§
246
8,10
912
54,
354
2,36
068
86,
060
2,16
724
,109
15.3
24.5
12.6
23.4
31.1
29.0
25.0
22.5
24.6
* N
ote
that
tota
l hos
pita
lisat
ions
pot
entia
lly in
clud
e re
adm
issi
ons
of th
e sa
me
case
and
inte
r-ho
spita
l tra
nsfe
rs. R
epor
ted
data
may
als
o co
ntai
n po
ssib
le c
odin
g er
rors
.
† S
ee C
hapt
er 3
for d
efi n
ing
ICD
cod
es.
‡ H
aem
ophi
lus
infl u
enza
e ty
pe b
(Hib
) hos
pita
lisat
ions
incl
ude
only
hos
pita
lisat
ions
cod
ed a
s G
00.0
(Hib
men
ingi
tis).
The
ICD
-10
code
J05
.1 (a
cute
epi
glot
titis
) use
d in
pre
viou
s re
ports
is n
o lo
nger
incl
uded
due
to e
vide
nce
that
the
spec
ifi ci
ty o
f epi
glot
titis
for H
ib in
fect
ion
is n
ow e
xtre
mel
y lo
w in
Aus
tralia
.
§ To
tal c
ases
for 5
-yea
r per
iod
and
aver
age
annu
al ra
te p
er 1
00,0
00 p
opul
atio
n.
|| Infl u
enza
hos
pita
lisat
ions
are
like
ly to
be
a la
rge
unde
rest
imat
e si
nce
man
y pe
ople
will
be
diag
nose
d w
ith th
e co
mpl
icat
ions
of i
nfl u
enza
, with
out i
nfl u
enza
bei
ng re
porte
d as
the
unde
rlyin
g ca
use.
¶ P
neum
ococ
cal m
enin
gitis
and
sep
ticae
mia
.
**
Hos
pita
lisat
ions
for r
are
dise
ases
suc
h as
pol
iom
yelit
is a
nd te
tanu
s sh
ould
be
inte
rpre
ted
with
cau
tion
due
to p
ossi
ble
codi
ng e
rror
s. T
he o
lder
age
of h
ospi
talis
atio
ns c
oded
as
acut
e po
liom
yeli-
tis s
ugge
sts
that
thes
e ar
e in
fact
hos
pita
lisat
ions
of a
dults
with
a p
ast h
isto
ry o
f pol
iom
yelit
is.
††
All
stat
es a
nd te
rrito
ries
have
bee
n su
ppre
ssed
to a
llow
pub
licat
ion
of th
e na
tiona
l tot
al.
n.p
Not
pub
lishe
d. T
he n
.p. h
as b
een
used
to p
reve
nt c
alcu
latio
n of
the
cells
mar
ked
<5, o
r to
supp
ress
the
rate
per
100
,000
for t
he c
ells
whe
re h
ospi
talis
atio
ns h
ave
been
sup
pres
sed
eith
er fo
r <5
or f
or n
.p.
Tabl
e 32
. H
ospi
talis
atio
ns b
y st
ate
or te
rrit
ory
and
fina
ncia
l yea
r of s
epar
atio
n (1
Jul
y 20
00–3
0 Ju
ne 2
005)
,*co
ntin
ued

Appendix 4. Changes to the Australian Standard Vaccination Schedule (1992–2005)

S128 CDI Vol 31 Supplement 2007
Vaccine preventable diseases and vaccination coverage in Australia, 2003 to 2005
Table 33. Diphtheria, tetanus and pertussis vaccination practice in Australia, 1992 to 2005
Date Intervention1994 Fifth dose of DTP at 4–5 years of age added to the recommended vaccination schedule (replacing CDT vaccine)
Active ADT school vaccination programs commenced in some states for 15–19 year olds1996 Diphtheria-tetanus-acellular pertussis vaccine (DTPa) licensed in Australia 1997 DTPa recommended for fourth and fi fth doses of DTP vaccination (due at 18 months and 4–5 years of age)1999 DTPa recommended for all fi ve childhood DTP doses
Combined DTPa-hepatitis B vaccine approved2000 Second booster dose of DTPa recommended at 4 years of age instead of 4–5 years
NHMRC recommended 10 yearly booster doses of ADT be replaced with a routine booster dose at 50 years of age unless a booster dose has been documented within last 10 yearsDTPa-hepB vaccine included on childhood schedule (used in Qld, NSW, ACT, SA, and NT)Adult/adolescent formulation (dTpa) available for boosting adolescents and adults against pertussis
2001 Combined DTPa-hepB-IPV and DTPa-hepB-IPV-Hib vaccines approved2002 Combined DTPa-IPV and DTPa-IPV-Hib vaccines approved2003 September: Fourth dose of DTPa at 18 months of age no longer recommended. dTpa recommended at 15 years of
age, replacing dT.2004 dTpa funded at 15–17 years of age replacing the diphtheria-tetanus dose
Table 34. Haemophilus influenzae type b vaccination practice in Australia, 1992 to 2005
Date Intervention1992 First Hib vaccines (PRP-D, ProHIBit) licensed in Australia for vaccinating infants aged at least 18 months1993 Hib vaccine recommended as part of the childhood vaccination schedule
Hib vaccines: HBOC (HibTITER), PRP-T (Act-HIB), and PRP-OMP (PedvaxHIB) licensed for infants aged <18 monthsPRP-OMP recommended at 2, 4 and 12 months of age for Aboriginal and Torres Strait Islander children and all children in the Northern Territory, HBOC used otherwise
2000 Combined Hib(PRP-OMP)-hepatitis B vaccine approvedPRP-OMP recommended for all infants (administered separately or in combination with hepatitis B vaccine)
2001 Combined DTPa-hepB-IPV-Hib vaccine approved2002 Combined DTPa-IPV-Hib vaccines approved2005 November: Combined DTPa-IPV-Hib (PRP-T) vaccines used in NSW, ACT, WA and Tasmania; PRP-OMP vaccine
continues to be used in other jurisdictions
Table 35. Hepatitis A vaccination practice in Australia, 1992 to 2005
Date Intervention1994 Hepatitis A vaccine (formaldehyde inactivated HAV) approved in Australia for at-risk groups, three doses
recommended 2005 Hepatitis A vaccination (two doses recommended) recommended for Aboriginal and Torres Strait Islander children
aged 12–24 months of age residing in the Northern Territory, Qld, WA and SA.

CDI Vol 31 Supplement 2007 S129
Vaccine preventable diseases and vaccination coverage in Australia, 2003 to 2005
Table 36. Hepatitis B vaccination practice in Australia, 1992 to 2005
Date Intervention1997 Vaccination recommended for adolescents aged 10–16 years1997 Interim recommendation for universal vaccination of infants at birth1998 School-based programs commenced for 10–16 year olds in Victoria. A ‘catch-up’ campaign was conducted in the
Northern Territory for children 6–16 years of age.1999 SA commenced year 8 immunisation program provided by councils
Combined DTPa-hepatitis B vaccine approved
2000 Thiomersal-free paediatric hepatitis B vaccine approvedCombined Hib(PRP-OMP)-hep B vaccine approvedMay: Universal infant vaccination included in childhood schedule with a birth dose of monovalent paediatric hepatitis B vaccine, followed by three doses as part of a combination vaccine scheduleDTPa-hepB vaccine included on childhood schedule (used in Qld, NSW, ACT, SA, and NT)Hib(PRP-OMP)-hepB vaccine included on childhood schedule (used in Tas, Vic, WA)Preadolescent vaccination recommended at 10–13 years of age rather than 10–16 years of ageBooster doses no longer recommended by NHMRC
2001 Combined DTPa-hepB-IPV and DTPa-hepB-IPV-Hib vaccines approved
Table 37. Influenza vaccination practice in Australia, 1992 to 2005
Date Intervention1997 In Victoria, infl uenza vaccine funded for all adults aged 65 years and over1999 Funding provided for both the national Older Australian Flu program and the National Indigenous Pneumococcal
and Infl uenza lmmunisation (NIPII) program
Table 38. Measles, mumps and rubella vaccination practice in Australia, 1992 to 2005
Date Intervention1992 November: NHMRC recommended second dose of MMR vaccine for both sexes to replace schoolgirl rubella
vaccination program 1993 November: Childhood vaccination schedule updated to include second dose of MMR vaccine for 10–16 year olds
(replacing schoolgirl rubella vaccination) 1998 Recommended age for fi rst dose of MMR vaccine for Aboriginal and Torres Strait Islander children in the Northern
Territory increased to 12 months of age (in line with non-Aboriginal infants)July: Recommended age for second MMR vaccine dose lowered to 4–5 yearsJuly–December: Implementation of Measles Control Campaign (involving mass vaccination of primary school aged children with MMR vaccine)
2000 Recommended age for second MMR dose lowered to 4 years of age not 4–5 yearsMMR rather than rubella vaccine recommended for non-immune women of child-bearing age
2001 Young adult (18 – 30 years) MMR vaccination campaign conducted
Table 39. Meningococcal C vaccination practice in Australia, 1992 to 2005
Date Intervention2001 Meningococcal C conjugate vaccine (Meningitec) approved2002 Meningococcal C conjugate vaccines (NeisVac-C, Menjugate) approved
Funding announced for National Meningococcal C Vaccination Program commencing January 2003 with meningococcal C conjugate vaccine (MenCCV) funded for all children 1–18 years of age, at 12 months of age with a catch-up program for older ages
2003 NHMRC endorses recommended changes. Meningococcal C conjugate vaccine added to childhood vaccination schedule at 12 months of age. National Meningococcal C Vaccination Program commences January 2003.

S130 CDI Vol 31 Supplement 2007
Vaccine preventable diseases and vaccination coverage in Australia, 2003 to 2005
Table 40. Pneumococcal vaccination practice in Australia, 1992 to 2005
Date Intervention1994 Vaccination recommended for Aboriginal and Torres Strait Islanders living in high-risk communities aged over
50 years1997 Vaccination recommended for all persons aged over 65 years
Vaccination recommended for all Aboriginal and Torres Strait Islanders aged over 50 years1998 In Victoria, pneumococcal vaccine funded for all adults aged 65 years and over and all Aboriginal and Torres Strait
Islanders aged 50 years and over1999 Vaccination recommended for Aboriginal and Torres Strait Islanders aged 15–50 years with any of the high-risk
underlying conditions23-valent polysaccharide vaccine funded by the Commonwealth (under the National Indigenous Pneumococcal and Infl uenza Immunisation program - NIPII) for all Aboriginal and Torres Strait Islanders aged at least 50 years and those aged 15–50 years with any of the high-risk underlying conditions
2000 Vaccination recommendation for Aboriginal and Torres Strait Islanders changed from >50 to ≥50 yearsVaccination recommendation for all persons changed from >65 to ≥65 yearsNT recommended 23-valent vaccine for all Aboriginal and Torres Strait Islander people 15 years and over7-valent conjugate pneumococcal vaccine licensed in Australia
2001 Funding made available for the at-risk conjugate pneumococcal vaccination program (all Aboriginal and Torres Strait Islander infants; all Australian children with underlying predisposing medical conditions; non-Indigenous children residing in central Australia up to the second birthday, as catch-up vaccination)
2003 7-valent conjugate pneumococcal vaccine recommended at 2, 4 and 6 months of age2005 January: Universal funded 7-valent pneumococcal conjugate vaccine (7vPCV) replaced the previous targeted
childhood programUniversal 23-valent pneumococcal polysaccharide vaccine (23vPPV) for adults over 65 years replaced previous subsidy through the PBS
Table 41. Polio vaccination practice in Australia, 1992 to 2005
Date Intervention1994 Recommendation for reinforcing dose of OPV to 15 year old adolescents 2001 Combined DTPa-hepB-IPV and DTPa-hepB-IPV-Hib vaccines approved2002 Combined DTPa-IPV and DTPa-IPV-Hib vaccines approved
Fifth dose of OPV at 15–17 years of age no longer recommended2003 IPV recommended to replace OPV at 2, 4 and 6 months and at 4 years of age2005 November: IPV funded to replace OPV, in combination vaccines
Table 42. Varicella vaccination practice in Australia, 1992 to 2005
Date Intervention2003 Varicella vaccine recommended at 18 months of age2005 Universal funded immunisation against varicella at 18 months of age from November 2005 with a school-based
catch-up program for children at 10–12 years of age not previously vaccinated and without a history of varicella infectionNo funded catch-up for children 2–10 years of age
* See also Gidding HF, Burgess MA, Kempe AE. A brief history of vaccination and childhood vaccination practices in Australia. Med J Aust 2001;174:37–40.
Detailed historical tables are available from: http://www.ncirs.usyd.edu.au/publ/publ-79-tbls.html

Appendix 5. Government funding of national immunisation programs in Australia

S132 CDI Vol 31 Supplement 2007
Vaccine preventable diseases and vaccination coverage in Australia, 2003 to 2005
Government funding of national immunisation programs in Australia
Prior to 1988, the Commonwealth provided childhood vaccines to states and territories for distribution to providers in the public sector. During the same time, live attenuated vaccines such as oral polio vac-cine (OPV) and measles vaccine were provided to private practitioners, although it is not certain that this occurred in all states and territories. Private practitioners who provided vaccination services were required to issue prescriptions for the supply of inactivated vaccines, such as DTPw, by a pharmacist.
In July 1988, the Commonwealth made a decision to withdraw from the direct provision of funding to purchase childhood vaccines, and instead increased funding provided to states and territories as part of the Financial Assistance Grants (FAGs) and the Hospital Funding Grants (HFGs). The increase in funding was equivalent to the level of immunisation activity in each jurisdiction in 1988.
As there were increases in vaccination activity above the 1988 levels, states and territories expressed con-cern about the level of funding provided via the FAGs/HFGs. Details of the funding arrangements were also interpreted differently by the Commonwealth and each state and territory, leading to variations in implementation of immunisation programs and uncoordinated and fragmented service delivery.
In April 1993, the National Health and Medical Research Council (NHMRC) reported on Australia’s immunisation programs and made recommendations concerning a National Immunisation Strategy (NIS). The NHMRC Report identified a number of factors contributing to poor immunisation coverage and the rising incidence of vaccine preventable diseases in Australian children. These included the lack of a coordi-nated scheme for the provision of vaccines, and the wide variation in prices which the states and territories paid for vaccines, with the smaller jurisdictions paying higher prices. The Strategy recommended that the Australian Health Ministers’ Advisory Council (AHMAC) consider vaccine funding arrangements.
In 1992, the first Haemophilus influenzae type b (Hib) vaccine was approved for use in children aged 18 months and older. In January 1993, vaccines approved for use in younger children became available. As these were new vaccines, no funding was available within existing arrangements for purchase by states and territories. In July 1993, the Commonwealth provided funds to states and territories for Hib vaccines.
In 1994, the Commonwealth Government agreed to fund the purchase of a number of childhood vaccines (DTP, MMR, OPV) via Specific Purpose Payments (SPPs) to states and territories. Commonwealth fund-ing was conditional on vaccines being provided to all public and private immunisation providers, including medical practitioners, and was formalised in bilateral agreements with each state and territory.
From 1997/1998 to 2003/2004, funding for some vaccines was included in the Public Health Outcome Funding Agreements (PHOFAs). However, a number of vaccines continued to be funded via FAGs (OPV doses 1, 2, 3 and 4 and MMR dose 1) and HFGs (ADT).
In 1997, the NHMRC recommended that the diphtheria-tetanus-acellular pertussis vaccine (DTPa) be used for the fourth and fifth doses of DTP vaccination. These became funded nationally in September 1997.
The 1998/1999 Commonwealth Budget included an initiative to streamline all childhood vaccine fund-ing from 1999 to 2000, with funding for all childhood vaccines on the Australian Standard Vaccination Schedule (ASVS) (up to 15 years of age) being included in the PHOFAs. In the same financial year, pneumococcal vaccine for Indigenous Australians and influenza vaccine for those aged over 65 years were also funded. Existing vaccine funding through the FAGs and HFGs were not adjusted, thereby freeing up state and territory resources to purchase non-Commonwealth funded vaccines.
Federal funding to use DTPa for all five infant vaccinations began in February 1999, immediately after the NHMRC recommended that it be included on the ASVS.
In 1999 to 2000, the funding provided through the PHOFAs for vaccine allowed the states and territories to purchase enough vaccine for 105% of the eligible cohort for each vaccine. The exception at that time was influenza. Commonwealth funding for vaccines is approved by the Federal Minister for Health and Ageing as a ‘special appropriation’ under the provisions of Section 9B of the National Health Act 1953. Based on interpretation of this provision, funds appropriated are for the sole purpose of vaccine purchase.
From May 2000, universal infant vaccination with hepatitis B vaccine was recommended by the NHMRC and funded by the Commonwealth. In 2001, the 7-valent pneumococcal conjugate vaccine was provided at no cost to children in the following three categories: (1) all Aboriginal and Torres Strait Islander chil-

CDI Vol 31 Supplement 2007 S133
Vaccine preventable diseases and vaccination coverage in Australia, 2003 to 2005
dren aged up to two years; (2) in the Central Australian region, Indigenous children aged up to five years and non-Indigenous children aged up to two years; and (3) all children under five years with medical risk factors predisposing them to a high incidence or severity of pneumococcal infection.
Meningococcal C conjugate vaccine was recommended and funded at 12 months of age from January 2003. In September 2003, the DTPa booster dose at 18 months of age was no longer recommended.
In September 2003, the recommended schedule was changed to include the universal 7-valent conjugate pneumococcal vaccine at 2, 4 and 6 months of age, the varicella-zoster vaccine at 18 months of age, and the inactivated poliomyelitis vaccine in place of oral vaccine, although these recommendations were not immediately funded. In January 2005, the 7-valent pneumococcal conjugate vaccination program was extended to all children.
In May 2005, the National Immunisation Program (NIP) schedule replaced the Australian Standard Vaccination Schedule (ASVS) for children aged up to 6 years, with all recommended vaccines on the Schedule to be funded, including the varicella-zoster vaccine and inactivated poliomyelitis vaccine from November 2005.
Table 43 summarises the dates when vaccines were provided at no cost in the public sector and through private medical practitioners, as outlined above. There are separate arrangements for the funding of vac-cine not provided through the NIP, such as travel-related vaccines, vaccines listed on the Pharmaceutical Benefits Scheme (PBS) and those provided by employers.

S134 CDI Vol 31 Supplement 2007
Vaccine preventable diseases and vaccination coverage in Australia, 2003 to 2005
Table 43. Dates when childhood vaccines became available in Australia free of charge* in the public and private sectors, up to December 2005
Vaccine Public sector Private sector†
Australia Exceptions Australia Exceptions
OPV 1966 1994 Qld (? 1998)NSW 1966Tas 1966
DTPw 1953 1994 WA 1988Rubella(adolescent girls)
1971
MMR(infant dose)
1989 1994 NSW 1989Qld 1989
MMR(adolescent dose)
1994 SA 1996 1994 WA 1993SA 1996
ADT 1982 1994 WA 1988CDT 1975 1994 WA 1988Hib vaccines(infants born from Feb 1993)
1993 Apr 1993 Apr
Hib vaccines(all infants aged <5 years)
1993 Jul WA 1993 JanNT 1993 Apr
1993 Jul WA 1993 JanNT 1994
DTPa boosters(infants aged 18 months and 4–5 years)
1997 Sep Tas 1997 OctQld 1997 Dec
1997 Sep Tas 1997 OctQld 1997 Dec
dTpa booster (at 15 years replaces ADT) 2004 Jan 2004 JanDTPainfants aged 2, 4 and 6 months)
1999 Feb NT 1997 Aug SA 1997 AugTas 1999 FebQld 1999 Apr
1999 Feb NT 1997 AugSA 1997 AugTas 1999 FebQld 1999 Apr
Hep B (at-risk infants)
1987 NT 1988 JanSA 1996
Not funded bythe Commonwealth
NSW 1987
Hep B (adolescent dose)
1998 Jan Qld 1998 MarTas 1998 MarNT 1998 AprNSW 1999SA 1999
?1998 Qld 1998 MarTas 1998 MarNT 1998 AprNSW 1999
Hep B (universal infant dose)
2000 May NT 1990 Aug 2000 May NT 1994
7vPCV(at-risk children)
2001 2001
Infl uenza and pneumococcal for Indigenous at risk (15–49 years)
2003 2003
Conjugate meningococcal C (infants aged 12 months and catch-up aged 1–18 years)
2003 Jan 2003 Jan
7vPCV(all children)
2005 Jan 2005 Jan
VZV (infants aged 18 months and children aged up to 12 years without previous history of varicella)
2005 Nov 2005 Nov
IPV (replacing OPV) 2005 Nov 2005 Nov
* Vaccines on the current Australian Standard Childhood Vaccination schedule became free of charge in the public and private sector in all jurisdictions in 1999–2000. Where vaccine is provided by a private medical practitioner, there may be costs associated with the consultation.
† Refers to vaccines provided by private medical practitioners. All scheduled childhood vaccines became free in the private sector in the Australian Capital Territory in 1993 (except for MMR vaccine which became free in the private sector in 1994) and in the Northern Territory in 1994.
Acknowledgement: Rebecca Dadds, Australian Government Department of Health and Ageing.

Appendix 6. Notifiable diseases definitions in use prior to 2004

S136 CDI Vol 31 Supplement 2007
Vaccine preventable diseases and vaccination coverage in Australia, 2003 to 2005
Notifiable diseases definitions in use prior to 2004
In September 2003, new national case definitions for notifications reported to NNDSS were endorsed by the Communicable Diseases Network Australia,11 with nearly all jurisdictions implementing the new definitions in January 2004 (New South Wales commenced August 2004). Prior to the adoption of the national definitions, some jurisdictions used the 1994 NHMRC case definitions10 as written (e.g. South Australia and Western Australia) and others used their own definitions (e.g. New South Wales and Victoria). This Appendix describes the definitions in use for notifiable diseases data prior to 2004 (i.e. the first year (2003) of the three year review period of this report). Further detail about definitions previously in use can be found in earlier reports in this series1–3 and in Skull 2001.310
Diphtheria
Notifi cations prior to 2004
Isolation of toxigenic Corynebacterium diphtheriae and one of the following:
• pharyngitis and/or laryngitis (with or without membrane) or
• toxic (cardiac or neurological) symptoms.
Hib
Notifi cations prior to 2004
a) A clinically compatible illness (meningitis, epiglottitis, cellulitis, septic arthritis, osteomyelitis, pneumonia, pericarditis or septicaemia) and either:
• the isolation of Haemophilus infl uenzae type b (Hib) from blood; or
• detection of Hib antigen (in a clinically compatible case); or
• detection of Gram-negative bacteria where the organism fails to grow in a clinical case.
or
b) A confi dent diagnosis of epiglottitis by direct vision, laryngoscopy or X-ray.
Note: From 2002 in Victoria, notifi cations only included cases where Hib was laboratory confi rmed.311
Hepatitis A
Notifi cations prior to 2004
a) Detection of anti-hepatitis A virus IgM antibody, in the absence of recent vaccination
or
b) A clinical case of hepatitis (jaundice, elevated aminotransferase levels without a non-infectious cause), and an epidemiological link to a serologically confi rmed case.
Hepatitis B
Notifi cations prior to 2004
People who have a positive hepatitis B surface antigen (HBsAg) and one of the following:
a) hepatitis B core antibody (Anti-HBc) IgM
or
b) demonstration of a clinical illness consistent with acute viral hepatitis (jaundice, elevated aminotransferase).

CDI Vol 31 Supplement 2007 S137
Vaccine preventable diseases and vaccination coverage in Australia, 2003 to 2005
Influenza
Became a notifi able disease in 2001 and the defi nition has remained unchanged.
Measles
Notifi cations prior to 2004
a) An illness characterised by all of the following features:
• a generalised maculopapular rash lasting three or more days, and
• a fever (at least 38ºC if measured), and
• cough or coryza or conjunctivitis or Koplik spots
or
b) Demonstration of measles-specifi c IgM antibody
or
c) A fourfold or greater change in measles antibody titre between acute and convalescent phase sera obtained at least two weeks apart, with tests preferably conducted at the same laboratory
or
d) Isolation of measles virus from a clinical specimen
or
e) A clinically compatible case epidemiologically related to another case.
Meningococcal disease
Notifi cations prior to 2004
In jurisdictions apart from New South Wales and the Northern Territory, a notifi cation of meningococcal disease required supportive laboratory evidence, although the nature of this varied. In New South Wales, Queensland and the Northern Territory, a clinical diagnosis of meningococcal disease without laboratory evidence was accepted as a presumptive (New South Wales) or probable (Queensland, Northern Territory) case.
Mumps
Notifi cations prior to 2004
a) Isolation of mumps virus from a clinical specimen
or
b) Signifi cant rise in mumps antibody level by any standard serological assay, except following vaccination
or
c) A clinically compatible illness (unilateral or bilateral swelling of the parotid or other salivary glands lasting two days or more without other apparent cause).
Notes: In New South Wales, only laboratory-confi rmed cases [(a) or (b)] were notifi able. Mumps was not notifi able in Queensland between July 1999 and June 2001. From July 2001, notifi cations based on a clinical case defi nition alone [(c)] were no longer notifi able in Victoria.

S138 CDI Vol 31 Supplement 2007
Vaccine preventable diseases and vaccination coverage in Australia, 2003 to 2005
Pertussis
Notifi cations prior to 2004
a) Isolation of B. pertussis from a clinical specimen
or
b) Elevated B. pertussis-specifi c IgA in serum or the detection of B. pertussis antigen in a nasopharyngeal specimen using immunofl uorescence with history of a clinically compatible illness
or
c) An illness lasting two weeks or more with one of the following:
• paroxysms of coughing, or
• inspiratory whoop without other apparent causes, or
• post-tussive vomiting
or
d) An illness characterised by a cough lasting at least two weeks in a patient who is epidemiologically linked to a laboratory-confi rmed case.
Invasive pneumococcal disease
Became a notifi able disease in 2001 and the defi nition has remained unchanged.
Polio
Notifi cations prior to 2004
Acute-onset fl accid paralysis of one or more limbs with decreased or absent tendon refl exes in the affected limbs without apparent cause, and without sensory or cognitive loss.
Rubella
Notifi cations prior to 2004
a) A generalised maculopapular rash, fever, and one or more of arthralgia/arthritis or lymphadenopathy or conjunctivitis, and an epidemiological link to a confi rmed case
or
b) Demonstration of rubella-specifi c IgM antibody, except following vaccination
or
c) A fourfold or greater rise in rubella antibody titre between acute and convalescent phase sera obtained at least two weeks apart
or
d) Isolation of rubella virus from a clinical specimen.
Note: From July 2001 to July 2002, enhanced rubella surveillance was undertaken in Victoria leading to an increase in the specifi city of notifi cations.312

CDI Vol 31 Supplement 2007 S139
Vaccine preventable diseases and vaccination coverage in Australia, 2003 to 2005
Tetanus
Notifi cations prior to 2004
A clinically compatible illness without other apparent cause, with or without a history of injury, and with or without laboratory evidence of the organism or its toxin.

S140 CDI Vol 31 Supplement 2007
Vaccine preventable diseases and vaccination coverage in Australia, 2003 to 2005
Abbreviations23vPPV 23-valent pneumococcal polysaccharide vaccine
7vPCV 7-valent pneumococcal conjugate vaccine
ABS Australian Bureau of Statistics
ACIP Advisory Committee on Immunization Practices (USA)
ACIR Australian Childhood Immunisation Register
ADT Adult diphtheria-tetanus
AFP Acute flaccid paralysis
AGE Acute gastroenteritis
AIHW Australian Institute of Health and Welfare
Anti-HBc Hepatitis B core antibody
APSU Australian Paediatric Surveillance Unit
ASVS Australian Standard Vaccination Schedule
aVDPV Ambiguous vaccine derived poliovirus
CDT Combined diphtheria-tetanus
CRS Congenital rubella syndrome
CSF Cerebrospinal fluid
cVDPV Circulating vaccine derived poliovirus
DT (dT) Diphtheria-tetanus
DTP Diphtheria-tetanus-pertussis
DTPa Diphtheria-tetanus-pertussis (acellular)
dTpa Adolescent/adult diphtheria-tetanus-pertussis (acellular)
DTPw Diphtheria-tetanus-pertussis (whole cell)
FAG Finance assistance grant
HAV Hepatitis A virus
HBOC Haemophilus influenzae type b polysaccharide conjugated to non-toxic diphtheria CRM197 protein
HBsAg Hepatitis B surface antigen
HBV Hepatitis B virus
HepB Hepatitis B (vaccine abbreviation)
HFG Hospital funding grant
Hib Haemophilus influenzae type b
HZ Herpes zoster
ICD International Classification of Diseases
ICD-10 International Classification of Diseases, 10th Revision
ICD-10-AM International Statistical Classification of Diseases and Related Health Problems, 10th Revision, Australian Modification
ICD-9 International Classification of Diseases, 9th Revision
ICD-9-CM International Classification of Diseases, 9th Revision, Clinical Modification
IgG Immunoglobulin G
IgM Immunoglobulin M

CDI Vol 31 Supplement 2007 S141
Vaccine preventable diseases and vaccination coverage in Australia, 2003 to 2005
IPD Invasive pneumococcal disease
IPV Inactivated poliomyelitis vaccine
iVDPV Immunodeficient vaccine derived poliovirus
LOS Length of stay (in hospital)
MCC Measles Control Campaign
MenCCV Meningococcal C conjugate vaccine
MMR Measles-mumps-rubella
MR Measles-rubella
n.p. Not published
NCCH National Centre for Classification in Health
NCIRS National Centre for Immunisation Research and Surveillance of Vaccine Preventable Diseases
NHMRC National Health and Medical Research Council
NIP National Immunisation Program
NIS National Immunisation Strategy
NNDSS National Notifiable Diseases Surveillance System
NQFMP National Q fever Management Program
OPV Oral poliomyelitis vaccine
PBS Pharmaceutical Benefits Scheme
PCR Polymerase chain reaction
PHOFA Public health outcome funding agreement
PRP-D Haemophilus influenzae type b polysaccharide conjugated to diphtheria toxoid
PRP-OMP Haemophilus influenzae type b polysaccharide conjugated to the outer membrane protein of Neisseria meningitidis vaccine
PRP-T Haemophilus influenzae type b polysaccharide conjugated to tetanus toxoid
RSV Respiratory syncytial virus
SSPE Subacute sclerosing panencephalitis
VAPP Vaccine-associated paralytic poliomyelitis
VDPV Vaccine derived poliovirus
VIDRL Victorian Infectious Diseases Reference Laboratory
VPD Vaccine preventable disease
VZV Varicella-zoster virus
WHO World Health Organization

S142 CDI Vol 31 Supplement 2007
Vaccine preventable diseases and vaccination coverage in Australia, 2003 to 2005
References1. McIntyre P, Amin J, Gidding H, et al. Vaccine preventable diseases and vaccination coverage in Australia, 1993–1998.
Commun Dis Intell 2000;24 Suppl:iii–S83.
2. McIntyre P, Gidding H, Gilmour R, et al. Vaccine preventable diseases and vaccination coverage in Australia, 1999 to 2000. Commun Dis Intell 2002;26 Suppl:iii–S111.
3. Brotherton J, McIntyre P, Puech M, et al. Vaccine preventable diseases and vaccination coverage in Australia, 2001 to 2002. Commun Dis Intell 2004;28 Suppl 2:i–S116.
4. Gidding HF, Burgess MA, Kempe AE. A short history of vaccination in Australia. [erratum appears in Med J Aust 2001;174:260]. Med J Aust 2001;174:37–40.
5. Hull BP, McIntyre PB, Heath TC, Sayer GP. Measuring immunisation coverage in Australia. A review of the Australian Childhood Immunisation Register. Aust Fam Physician 1999;28:55–60.
6. Australian Government Department of Health and Ageing, Immunise Australia Program. Immunise Australia: Seven Point Plan. Available from: http://www.immunise.health.gov.au/internet/immunise/publishing.nsf/Content/history Accessed on 13 March 2007.
7. Samaan G, Roche P, Spencer J, National Tuberculosis Advisory Committee for the Communicable Diseases Network. Tuberculosis notifications in Australia, 2002. Commun Dis Intell 2003;27:449–458.
8. Li J, Roche P, Spencer J, National Tuberculosis Advisory Committee. Tuberculosis notifications in Australia, 2003. Commun Dis Intell 2004;28:464–473.
9. Roche PW, National Tuberculosis Advisory Committee, Communicable Diseases Network Australia. Tuberculosis notifica-tions in Australia, 2004. Commun Dis Intell 2006;30:93–101.
10. Public Health Committee, NHMRC. Surveillance case definitions. Canberra: AGPS, 1994.
11. Communicable Diseases Network Australia. Interim surveillance case definitions for the Australian National Notifiable Diseases Surveillance System. Version 1, 1 January 2004. Available from: http://www.health.gov.au/internet/wcms/publishing.nsf/Content/cda_surveil-nndss-dislist.htm/$FILE/casedef.pdf Accessed on 5 December 2006.
12. Yohannes K, Roche PW, Roberts A, et al. Australia’s notifiable diseases status, 2004, annual report of the National Notifiable Diseases Surveillance System. Commun Dis Intell 2006;30:1–79.
13. Miller M, Roche P, Yohannes K, et al. Australia’s notifiable diseases status, 2003, annual report of the National Notifiable Diseases Surveillance System. Commun Dis Intell 2005;29:1–61.
14. Australian Institute of Health and Welfare (AIHW). Australia’s health 2006. AIHW Cat. No. AUS-73. Canberra: AIHW, 2006.
15. Menzies R, McIntyre P, Beard F. Vaccine preventable diseases and vaccination coverage in Aboriginal and Torres Strait Islander people, Australia, 1999 to 2002. Commun Dis Intell 2004;28 Suppl 1:S1–S45.
16. O’Brien ED, Sam GA, Mead C. Methodology for measuring Australia’s childhood immunisation coverage. Commun Dis Intell 1998;22:36–37.
17. Blogg S, Trent M. Doctor’s notification of pertussis. N S W Public Health Bull 1995;9:53–54.
18. Allen CJ, Ferson MJ. Notification of infectious diseases by general practitioners: a quantitative and qualitative study. Med J Aust 2000;172:325–328.
19. Bonacruz-Kazzi G, McIntyre P, Hanlon M, Menzies R. Diagnostic testing and discharge coding for whooping cough in a children’s hospital. J Paediatr Child Health 2003;39:586–590.
20. Miller M, Roche P, Spencer J, Deeble M. Evaluation of Australia’s National Notifiable Disease Surveillance System. Commun Dis Intell 2004;28:311–323.
21. Australian Institute of Health and Welfare. Australian hospital statistics 2002–2003. AIHW Cat. No. HSE32. (Health Services Series number 22). Canberra: Australian Institute of Health and Welfare, 2004.
22. Australian Institute of Health and Welfare. Australian hospital statistics 2003–2004. AIHW Cat. No. HSE37. (Health Services Series number 23). Canberra: Australian Institute of Health and Welfare, 2005.
23. Australian Institute of Health and Welfare. Australian hospital statistics 2004–2005. AIHW Cat. No. HSE41. (Health Services Series number 26). Canberra: Australian Institute of Health and Welfare, 2006.
24. National Centre for Classification in Health (NCCH). Performance indicators for coding quality (PICQ 2006™). 2006. Available from: http://www3.fhs.usyd.edu.au/ncch/7.3.1.htm Accessed on 12 March 2007.
25. McKenzie K, Walker S, Dixon-Lee C, Dear G, Moran-Fuke J. Clinical coding internationally: a comparison of the coding workforce in Australia, America, Canada and England. Presentation to the 14th International Federation of Health Records Congress, Washington, October 2004. Available from: http://eprints.qut.edu.au/archive/00000575/01/mckenzie_coding.PDF Accessed on 23 March 2006.
26. Perry C, Harrison R. The Australian Coding Standards Advisory Committee. Health Inf Manag 2004;32:26–30.
27. Bramley M. A framework for evaluating health classifications. Health Inf Manag 2005;34:71–83.
28. O’Malley KJ, Cook KF, Price MD, et al. Measuring diagnoses: ICD code accuracy. Health Serv Res 2005;40:1620–1639.
29. MacIntyre CR, Ackland MJ, Chandraraj EJ, Pilla JE. Accuracy of ICD-9-CM codes in hospital morbidity data, Victoria: implications for public health research. Aust N Z J Public Health 1997;21:477–482.

CDI Vol 31 Supplement 2007 S143
Vaccine preventable diseases and vaccination coverage in Australia, 2003 to 2005
30. Wood N, Menzies R, McIntyre P. Epiglottitis in Sydney before and after the introduction of vaccination against Haemophilus influenzae type b disease. Intern Med J 2005;35:530–535.
31. Australian Institute of Health and Welfare. Mortality over the twentieth century in Australia: trends and patterns in major causes of death. AIHW Cat. No. PHE73. (Mortality Surveillance Series number 4). Canberra: Australian Institute of Health and Welfare, 2005.
32. The Royal College of Pathologists of Australasia Autopsy Working Party. The decline of the hospital autopsy: a safety and quality issue for healthcare in Australia. Med J Aust 2004;180:281–285.
33. Mant J, Wilson S, Parry J, et al. Clinicians didn’t reliably distinguish between different causes of cardiac death using case histories. J Clin Epidemiol 2006;59:862–867.
34. Ravakhah K. Death certificates are not reliable: revivification of the autopsy. South Med J 2006;99:728–733.
35. Nashelsky MB, Lawrence CH. Accuracy of cause of death determination without forensic autopsy examination. Am J Forensic Med Pathol 2003;24:313–319.
36. Shojania KG, Burton EC, McDonald KM, Goldman L. Changes in rates of autopsy-detected diagnostic errors over time: a systematic review. JAMA 2003;289:2849–2856.
37. Roulson J, Benbow EW, Hasleton PS. Discrepancies between clinical and autopsy diagnosis and the value of post mortem histology; a meta-analysis and review. Histopathology 2005;47:551–559.
38. Crowcroft NS, Andrews N, Rooney C, Brisson M, Miller E. Deaths from pertussis are underestimated in England. Arch Dis Child 2002;86:336–338.
39. Sutter RW, Cochi SL, Brink EW, Sirotkin BI. Assessment of vital statistics and surveillance data for monitoring tetanus mortal-ity, United States, 1979–1984. Am J Epidemiol 1990;131:132–142.
40. Korda RJ, Butler JR. Trends in pneumonia rates explained by changes in coding practices. Intern Med J 2005;35:138–139.
41. Hull BP, Lawrence GL, MacIntyre CR, McIntyre PB. Immunisation coverage in Australia corrected for under-reporting to the Australian Childhood Immunisation Register. Aust N Z J Public Health 2003;27:533–538.
42. Lister S, McIntyre PB, Burgess MA, O’Brien ED. Immunisation coverage in Australian children: a systematic review 1990–1998. Commun Dis Intell 1999;23:145–170.
43. Plotkin SA, Orenstein WA, eds. Vaccines. 4th edn. Philadelphia: WB Saunders, 2004.
44. Heymann DL, ed. Control of communicable diseases manual. 18th edn. Washington, D.C.: American Public Health Association, 2004.
45. Hatanaka A, Tsunoda A, Okamoto M, et al. Corynebacterium ulcerans diphtheria in Japan. Emerg Infect Dis 2003;9:752–753.
46. DeWinter LM, Bernard KA, Romney MG. Human clinical isolates of Corynebacterium diphtheriae and Corynebacterium ulcerans collected in Canada from 1999 to 2003 but not fitting reporting criteria for cases of diphtheria. J Clin Microbiol 2005;43:3447–3449.
47. Centre for Disease Control Northern Territory. Guidelines for the control of diphtheria in the Northern Territory. Darwin: Northern Territory Government Department of Health and Community Services, 2004. Available from: http://www.nt.gov.au/health/cdc/treatment_protocol/dipthteria.pdf Accessed on 1 December 2006.
48. World Health Organization (WHO). Diphtheria reported cases. WHO, 2006. Available from: http://www.who.int/immunization_monitoring/en/globalsummary/timeseries/tsincidencedip.htm Accessed on 3 December 2006.
49. Vitek CR, Wharton M. Diphtheria in the former Soviet Union: reemergence of a pandemic disease. Emerg Infect Dis 1998;4:539–550.
50. World Health Organization (WHO). Diphtheria in the WHO European Region. WHO, 2006. www.euro.who.int/vaccine/20030724_3 Accessed on 3 December 2006.
51. Wren MW, Shetty N. Infections with Corynebacterium diphtheriae: six years’ experience at an inner London teaching hospital. Br J Biomed Sci 2005;62:1–4.
52. Romney MG, Roscoe DL, Bernard K, et al. Emergence of an invasive clone of nontoxigenic Corynebacterium diphtheriae in the urban poor population of Vancouver, Canada. J Clin Microbiol 2006;44:1625–1629.
53. de Benoist AC, White JM, Efstratiou A, et al. Imported cutaneous diphtheria, United Kingdom. Emerg Infect Dis 2004;10:511–513.
54. Sing A, Heesemann J. Imported cutaneous diphtheria, Germany, 1997–2003. Emerg Infect Dis 2005;11:343–344.
55. Lumio J, Suomalainen P, Ölander RM, Saxén H, Salo E. Fatal case of diphtheria in an unvaccinated infant in Finland. Pediatr Infect Dis J 2003;22:844–846.
56. Centers for Disease Control and Prevention. Fatal respiratory diphtheria in a U.S. traveler to Haiti-Pennsylvania, 2003. MMWR Morb Mortal Wkly Rep 2004;52:1285–1286.
57. Booy R, Haworth EA, Ali KA, Chapel HM, Moxon ER. Immunogenicity of routine vaccination against diphtheria, tetanus, and Haemophilus influenzae type b in Asian infants born in the United Kingdom. Arch Dis Child 2005;90:589–591.
58. Gidding HF, Backhouse JL, Burgess MA, Gilbert GL. Immunity to diphtheria and tetanus in Australia: a national serosurvey. Med J Aust 2005;183:301–304.
59. McIntyre PB, Leeder SR, Irwig LM. Invasive Haemophilus influenzae type b disease in Sydney children 1985–1987: a population-based study. Med J Aust 1991;154:832–837.
60. Gilbert GL, Clements DA, Broughton SJ. Haemophilus influenzae type b infections in Victoria, Australia, 1985 to 1987. Pediatr Infect Dis J 1990;9:252–257.

S144 CDI Vol 31 Supplement 2007
Vaccine preventable diseases and vaccination coverage in Australia, 2003 to 2005
61. Hanna J. The epidemiology and prevention of Haemophilus influenzae infections in Australian aboriginal children. J Paediatr Child Health 1992;28:354–361.
62. Peltola H. Worldwide Haemophilus influenzae type b disease at the beginning of the 21st century: global analysis of the disease burden 25 years after the use of the polysaccharide vaccine and a decade after the advent of conjugates. Clin Microbiol Rev 2000;13:302–317.
63. Bisgard KM, Kao A, Leake J, et al. Haemophilus influenzae invasive disease in the United States, 1994–1995: near disap-pearance of a vaccine-preventable childhood disease. Emerg Infect Dis 1998;4:229–237.
64. McVernon J, Andrews N, Slack MP, Ramsay ME. Risk of vaccine failure after Haemophilus influenzae type b (Hib) combina-tion vaccines with acellular pertussis. Lancet 2003;361:1521–1523.
65. Conaty S, Bird P, Bell G, et al. Hepatitis A in New South Wales, Australia from consumption of oysters: the first reported outbreak. Epidemiol Infect 2000;124:121–130.
66. Ferson MJ, Young LC, Stokes ML. Changing epidemiology of hepatitis A in the 1990s in Sydney, Australia. Epidemiol Infect 1998;121:631–636.
67. Hanna JN, Warnock TH, Shepherd RW, Selvey LA. Fulminant hepatitis A in indigenous children in north Queensland. Med J Aust 2000;172:19–21.
68. Amin J, Gilbert GL, Escott RG, Heath TC, Burgess MA. Hepatitis A epidemiology in Australia: national seroprevalence and notifications. Med J Aust 2001;174:338–341.
69. Gilroy NM, Tribe IG, Passaris I, Hall R, Beers MY. Hepatitis A in injecting drug users: a national problem. Med J Aust 2000;172:142–143.
70. Munnoch SA, Ashbolt RH, Coleman DJ, et al. A multi-jurisdictional outbreak of hepatitis A related to a youth camp—impli-cations for catering operations and mass gatherings. Commun Dis Intell 2004;28:521–527.
71. Schultz R. Hepatitis A outbreak in Central Australia. The Northern Territory Disease Control Bulletin 2005;12:4–7.
72. Bell BP, Shapiro CN, Alter MJ, et al. The diverse patterns of hepatitis A epidemiology in the United States – implications for vaccination strategies. J Infect Dis 1998;178:1579–1584.
73. Brown GR, Persley K. Hepatitis A epidemic in the elderly. South Med J 2002;95:826–833.
74. Centers for Disease Control and Prevention. Positive test results for acute hepatitis A virus infection among persons with no recent history of acute hepatitis—United States, 2002–2004. MMWR Morb Mortal Wkly Rep 2005;54:453–456.
75. Yohannes K, Roche P, Blumer C, et al. Australia’s notifiable diseases status, 2002: Annual report of the National Notifiable Diseases Surveillance System. [erratum appears in Commun Dis Intell 2006;30:221]. Commun Dis Intell 2004;28:6–68.
76. National Health and Medical Research Council. The Australian immunisation handbook. 8th ed. Canberra: Australian Government Department of Health and Ageing, 2003.
77. Menzies R, McIntyre P, Beard F. Vaccine preventable diseases and vaccination coverage in Aboriginal and Torres Strait Islander people, Australia, 1999 to 2002. Commun Dis Intell 2004;28:127–159.
78. Adams L, Johnson G. Hepatitis A virus infection, immunisation and the Kimberley [letter]. Kimberley Public Health Bulletin 2003;May:13.
79. Bowden FJ, Currie BJ, Miller NC, Locarnini SA, Krause VL. Should aboriginals in the “top end” of the Northern Territory be vaccinated against hepatitis A? Med J Aust 1994;161:372–373.
80. D’Argenio P, Adamo B, Cirrincione R, Gallo G. The role of vaccine in controlling hepatitis A epidemics. Vaccine 2003;21:2246–2249.
81. Hanna JN, Hills SL, Humphreys JL. Impact of hepatitis A vaccination of Indigenous children on notifications of hepatitis A in north Queensland. Med J Aust 2004;181:482–485.
82. Government provides free hepatitis A vaccine to Indigenous children. Media release. Minister for Health and Ageing. 28 June 2005. Available from: http://www.health.gov.au/internet/ministers/publishing.nsf/content/health-mediarel-yr2005-ta-abb079.htm/$FILE/abb079.pdf Accessed on July 2006.
83. Centers for Disease Control and Prevention. Prevention of hepatitis A through active or passive immunization: recom-mendations of the Advisory Committee on Immunization Practices (ACIP). MMWR Recomm Rep 2006;55(RR–7):1–23.
84. Kaldor JM, Plant AJ, Thompson SC, Longbottom H, Rowbottom J. The incidence of hepatitis B infection in Australia: an epidemiological review. Med J Aust 1996;165:322–326.
85. Ryder SD, Beckingham IJ. ABC of diseases of liver, pancreas, and biliary system: chronic viral hepatitis. BMJ 2001;322:219–221.
86. O’Sullivan BG, Gidding HF, Law M, et al. Estimates of chronic hepatitis B virus infection in Australia, 2000. Aust N Z J Public Health 2004;28:212–216.
87. Law MG, Roberts SK, Dore GJ, Kaldor JM. Primary hepatocellular carcinoma in Australia, 1978–1997: increasing inci-dence and mortality. Med J Aust 2000;173:403–405.
88. Williams A. Reduction in the hepatitis B related burden of disease—measuring the success of universal immunisation programs. Commun Dis Intell 2002;26:458–460.
89. Amin J, Law MG, Bartlett M, Kaldor JM, Dore GJ. Causes of death after diagnosis of hepatitis B or hepatitis C infection: a large community-based linkage study. Lancet 2006;368:938–945.

CDI Vol 31 Supplement 2007 S145
Vaccine preventable diseases and vaccination coverage in Australia, 2003 to 2005
90. Ministerial Advisory Committee on AIDS, Sexual Health and Hepatitis, Hepatitis C Sub-Committee. Hepatitis C virus projec-tions working group: estimates and projections of the hepatitis C virus epidemic in Australia 2006. Sydney: National Centre in HIV Epidemiology and Clinical Research, 2006. Available from: http://www.health.gov.au/internet/wcms/publishing.nsf/Content/phd-hepc-estimates-project-06-l Accessed on April 2007.
91. Skinner R, Nolan T. Adolescent hepatitis B immunisation – should it be the law? Aust N Z J Public Health 2001;25:230–233.
92. Kao JH, Hsu HM, Shau WY, Chang MH, Chen DS. Universal hepatitis B vaccination and the decreased mortality from fulminant hepatitis in infants in Taiwan. J Pediatr 2001;139:349–352.
93. Huang KY, Lin SR. Nationwide vaccination: a success story in Taiwan. Vaccine 2000;18 Suppl 1:S35–S38.
94. Moloney M. Acute hepatitis B in Victoria 1997–2003. Victorian Infectious Diseases Bulletin 2004;7:58–59.
95. Condon JR, Barnes T, Cunningham J, Armstrong BK. Long-term trends in cancer mortality for Indigenous Australians in the Northern Territory. Med J Aust 2004;180:504–507.
96. Roche P, Spencer J, Hampson A. Annual report of the National Influenza Surveillance Scheme, 2001. Commun Dis Intell 2002;26:204–213.
97. Dushoff J, Plotkin JB, Viboud C, Earn DJ, Simonsen L. Mortality due to influenza in the United States – an annualized regression approach using multiple-cause mortality data. Am J Epidemiol 2006;163:181–187.
98. Nichol KL, Nordin J, Mullooly J, et al. Influenza vaccination and reduction in hospitalizations for cardiac disease and stroke among the elderly. N Engl J Med 2003;348:1322–1332.
99. Izurieta HS, Thompson WW, Kramarz P, et al. Influenza and the rates of hospitalization for respiratory disease among infants and young children. N Engl J Med 2000;342:232–239.
100. Armstrong BG, Mangtani P, Fletcher A, et al. Effect of influenza vaccination on excess deaths occurring during periods of high circulation of influenza: cohort study in elderly people. BMJ 2004;329:660.
101. Thompson WW, Shay DK, Weintraub E, et al. Mortality associated with influenza and respiratory syncytial virus in the United States. JAMA 2003;289:179–186.
102. Simonsen L, Clarke MJ, Schonberger LB, et al. Pandemic versus epidemic influenza mortality: a pattern of changing age distribution. J Infect Dis 1998;178:53–60.
103. Lister S, McIntyre P, Menzies R. The epidemiology of respiratory syncytial virus infections in New South Wales children, 1992–1997. N S W Public Health Bull 2000;11:119–123.
104. Birch CJ, Clothier HJ, Seccull A, et al. Human coronavirus OC43 causes influenza-like illness in residents and staff of aged-care facilities in Melbourne, Australia. Epidemiol Infect 2005;133:273–277.
105. Druce J, Tran T, Kelly H, et al. Laboratory diagnosis and surveillance of human respiratory viruses by PCR in Victoria, Australia, 2002–2003. J Med Virol 2005;75:122–129.
106. Turner J, Tran T, Birch C, Kelly H. Higher than normal seasonal influenza activity in Victoria, 2003. Commun Dis Intell 2004;28:175–180.
107. Yohannes K, Roche P, Hampson A, Miller M, Spencer J. Annual report of the National Influenza Surveillance Scheme, 2003. Commun Dis Intell 2004;28:160–168.
108. Li J, Hampson A, Roche PW, Yohannes K, Spencer JD. Annual report of the National Influenza Surveillance Scheme, 2004. Commun Dis Intell 2005;29:125–136.
109. Firestone SM, Barr IG, Roche PW, Walker JC. Annual report of the National Influenza Surveillance Scheme, 2005. Commun Dis Intell 2006;30:189–200.
110. Australian Institute of Health and Welfare. 2003 Influenza vaccine survey: summary results. AIHW Cat. No. PHE 51. Canberra: Australian Institute of Health and Welfare, Australian Government Department of Health and Ageing, 2004. Available from: http://www.aihw.gov.au/publications/phe/ivs03sr/ivs03sr.pdf Accessed on 15 December 2006.
111. Australian Institute of Health and Welfare. 2004 Adult vaccination survey: summary results. AIHW Cat. No. PHE 56. Canberra: Australian Institute of Health and Welfare, Australian Government Department of Health and Ageing, 2005. Available from: http://www.aihw.gov.au/publications/phe/avssr04/avssr04.pdf Accessed on 15 December 2006.
112. Hayward AC, Harling R, Wetten S, et al. Effectiveness of an influenza vaccine programme for care home staff to prevent death, morbidity, and health service use among residents: cluster randomised controlled trial. BMJ 2006;333:1241.
113. Centers for Disease Control and Prevention. Recommended childhood and adolescent immunization schedule – United States, January–June 2004. MMWR Morb Mortal Wkly Rep 2004;53:Q1–Q4.
114. American Academy of Pediatrics Committee on Infectious Diseases. Recommendations for influenza immunization of children. Pediatrics 2004;113:1441–1447.
115. Centers for Disease Control and Prevention. Update: influenza activity – United States, 2003–04 season. MMWR Morb Mortal Wkly Rep 2004;53:284–287.
116. Neuzil KM, Mellen BG, Wright PF, Mitchel EF, Jr., Griffin MR. The effect of influenza on hospitalizations, outpatient visits, and courses of antibiotics in children. N Engl J Med 2000;342:225–231.
117. Centers for Disease Control and Prevention. Prevention and control of influenza: recommendations of the Advisory Committee on Immunization Practices (ACIP). [erratum appears in MMWR Morb Mortal Wkly Rep 2006;55:800]. MMWR Recomm Rep 2006;55(RR–10):1–42.
118. Beard F, McIntyre P, Gidding H, Watson M. Influenza related hospitalisations in Sydney, New South Wales, Australia. Arch Dis Child 2006;91:20–25.

S146 CDI Vol 31 Supplement 2007
Vaccine preventable diseases and vaccination coverage in Australia, 2003 to 2005
119. Milne BG, Williams S, May ML, et al. Influenza A associated morbidity and mortality in a Paediatric Intensive Care Unit. Commun Dis Intell 2004;28:504–509.
120. Isaacs D. Should all Australian children be vaccinated against influenza? Questions of cost-effectiveness, vaccine efficacy and feasibility are yet to be answered. Med J Aust 2005;182:553–554.
121. Olsen B, Munster VJ, Wallensten A, et al. Global patterns of influenza a virus in wild birds. Science 2006;312:384–388.
122. Avian influenza frequently asked questions. Wkly Epidemiol Rec 2004;79:77–83.
123. Webby RJ, Webster RG. Are we ready for pandemic influenza? Science 2003;302:1519–1522.
124. Fedson DS. Vaccination for pandemic influenza: a six point agenda for interpandemic years. Pediatr Infect Dis J 2004;23 Suppl 1:S74–S77.
125. World Health Organization. Guidelines for the use of seasonal influenza vaccine in humans at risk of H5N1 infection. 2004. Available from: http://www.who.int/csr/disease/avian_influenza/guidelines/seasonal_vaccine/en/ Accessed on 15 December 2006.
126. Counahan M, Tobin S, Andrews R, et al. Measles–get vaccinated! Victorian Infectious Diseases Bulletin 2003;6:33–34.
127. Centers for Disease Control and Prevention. Progress toward measles elimination-region of the Americas, 2002–2003. MMWR Morb Mortal Wkly Rep 2004;53:304–306.
128. World Health Organization, United Nations Children’s Fund. Measles. Mortality reduction and regional elimination. Strategic plan 2001–2005. (WHO/V&B/01.13 Rev. 1). Geneva: WHO, 2001. Available from: http://www.who.int/vaccines-documents/DocsPDF01/www573.pdf Accessed on 1 December 2006.
129. Turnbull FM, Burgess MA, McIntyre PB, et al. The Australian Measles Control Campaign, 1998. Bull World Health Organ 2001;79:882–888.
130. Gidding H. Monitoring measles control in Australia: the national serosurveillance program. The Broad Street Pump [Centre for Infectious Diseases and Microbiology – Public Health, Newsletter] 2006;(8): Available from: http://www.cidmpublichealth.info/cidmphnews.htm Accessed on 12 April 2007.
131. Katz SL, Hinman AR. Summary and conclusions: measles elimination meeting, 16–17 March 2000. J Infect Dis 2004;189 Suppl 1:S43–S47.
132. Orenstein WA, Papania MJ, Wharton ME. Measles elimination in the United States. J Infect Dis 2004;189 Suppl 1:S1–S3.
133. World Health Organization Regional Office for the Western Pacific. Measles elimination. Meeting papers of the Regional Committee 56th session, Noumea, New Caledonia, 19–23 September 2005. WPR/RC56/11. 14 July 2005. Available from: http://www.wpro.who.int/NR/rdonlyres/8A5EF40A-DDC6-4CB2-9CBE-86A589DDF80D/0/15_measles.pdf Accessed on 5 October 2006.
134. MacIntyre CR, Hull B, Burgess M, Gay N. Measles control in NSW divisions of general practice. N S W Public Health Bull 2003;14:13–17.
135. Chibo D, Riddell M, Catton M, et al. Studies of measles viruses circulating in Australia between 1999 and 2001 reveals a new genotype. Virus Res 2003;91:213–221.
136. Cohen NJ. Introduction of the National Meningococcal C Vaccination Program. Commun Dis Intell 2003;27:161–162.
137. Booy R, Jelfs J, El Bashir H, Nissen MD. Impact of meningococcal C conjugate vaccine use in Australia [editorial]. Med J Aust 2007;186:108–109.
138. NSW Health. Extended funding for Meningococcal C vaccine. 2006. Available from: http://www.health.nsw.gov.au/living/immunisation/immunise_prog/menvaccine.html Accessed on 12 April 2007.
139. Australian Meningococcal Surveillance Programme. Annual report of the Australian Meningococcal Surveillance Programme, 2005. Commun Dis Intell 2006;30:211–221.
140. Trotter CL, Ramsay ME, Gray S, Fox A, Kaczmarski E. No evidence for capsule replacement following mass immunisation with meningococcal serogroup C conjugate vaccines in England and Wales. Lancet Infect Dis 2006;6:616–617.
141. de Greeff SC, de Melker HE, Spanjaard L, Schouls LM, van DerEnde A. Protection from routine vaccination at the age of 14 months with meningococcal serogroup C conjugate vaccine in the Netherlands. Pediatr Infect Dis J 2006;25:79–80.
142. Borrow R, Carlone GM, Rosenstein N, et al. Neisseria meningitidis group B correlates of protection and assay stand-ardization – international meeting report Emory University, Atlanta, Georgia, United States, 16–17 March 2005. Vaccine 2006;24:5093–5107.
143. Thornton V, Lennon D, Rasanathan K, et al. Safety and immunogenicity of New Zealand strain meningococcal serogroup B OMV vaccine in healthy adults: beginning of epidemic control. Vaccine 2006;24:1395–1400. PM:16242221
144. Wong S, Lennon D, Jackson C, et al. New Zealand epidemic strain meningococcal B outer membrane vesicle vaccine in children aged 16–24 months. Pediatr Infect Dis J 2007;26:345–350. PM:17414400
145. Gidding HF, Wood J, MacIntyre CR, et al. Sustained measles elimination in Australia and priorities for long term mainte-nance. Vaccine 2007; In press.
146. Centers for Disease Control and Prevention. Mumps epidemic – United Kingdom, 2004–2005. MMWR Morb Mortal Wkly Rep 2006;55:173–175.
147. Office for National Statistics. Mid-2005 population estimates: England and Wales; estimated resident population by single year of age and sex. Available from: http://www.statistics.gov.uk/statbase/Expodata/Spreadsheets/D9389.xls Accessed on 3 November 2006.
CDI Vol 31 Supplement 2007 S147
Vaccine preventable diseases and vaccination coverage in Australia, 2003 to 2005
148. Centers for Disease Control and Prevention. Update: multistate outbreak of mumps – United States, 1 January–2 May, 2006. MMWR Morb Mortal Wkly Rep 2006;55:559–563.
149. Torvaldsen S, McIntyre P. Do variations in pertussis notifications reflect incidence or surveillance practices? A comparison of infant notification rates and hospitalisation data in NSW. N S W Public Health Bull 2003;14:81–84.
150. Torvaldsen S, McIntyre PB. Effect of the preschool pertussis booster on national notifications of disease in Australia. Pediatr Infect Dis J 2003;22:956–959.
151. Brotherton J, McAnulty J. A pertussis epidemic in NSW: how epidemiology reflects vaccination policy. N S W Public Health Bull 2003;14:77–81.
152. Rank C. Epidemiologic impact and vaccine effectiveness following an adolescent pertussis vaccination program in New South Wales. Masters of International Public Health thesis. University of Sydney. 2006.
153. Bisgard KM, Pascual FB, Ehresmann KR, et al. Infant pertussis: who was the source? Pediatr Infect Dis J 2004;23:985–989.
154. Elliott E, McIntyre P, Ridley G, et al. National study of infants hospitalized with pertussis in the acellular vaccine era. Pediatr Infect Dis J 2004;23:246–252.
155. Schellekens J, Wirsing von König CH, Gardner P. Pertussis sources of infection and routes of transmission in the vaccination era. Pediatr Infect Dis J 2005;24 Suppl 5:S19–S24.
156. Mandell GL, Bennett JE, Dolin R, eds. Mandell, Douglas, and Bennett’s Principles and practice of infectious diseases. 6th ed. Philadelphia: Elsevier Churchill Livingstone, 2005.
157. Krause VL, Reid SJ, Merianos A. Invasive pneumococcal disease in the Northern Territory of Australia, 1994–1998. Med J Aust 2000;173 Suppl:S27–S31.
158. Mak DB. Invasive pneumococcal disease in the Kimberley, 1995–2001. Aust J Rural Health 2004;12:237–240.
159. Torzillo PJ, Hanna J, Morey F, et al. Invasive pneumococcal disease in central Australia. Med J Aust 1995;162:182–186.
160. Roche P, Krause V. Invasive pneumococcal disease in Australia, 2001. Commun Dis Intell 2002;26:505–519.
161. Roche P, Krause V, Andrews R, et al. Invasive pneumococcal disease in Australia, 2002. Commun Dis Intell 2003;27:466–477.
162. Roche P, Krause V, Bartlett M, et al. Invasive pneumococcal disease in Australia, 2003. Commun Dis Intell 2004;28:441–454.
163. Roche P, Krause V, Bartlett M, et al. Invasive pneumococcal disease in Australia, 2004. Commun Dis Intell 2006;30:80–92.
164. Centers for Disease Control and Prevention. Direct and indirect effects of routine vaccination of children with 7-valent pneumococcal conjugate vaccine on incidence of invasive pneumococcal disease – United States, 1998–2003. MMWR Morb Mortal Wkly Rep 2005;54:893–897.
165. Madsen KM, Schonheyder HC, Kistensen B, Nielsen GL, Sorensen HT. Can hospital discharge diagnosis be used for surveillance of bacteraemia? A data quality study of a Danish hospital discharge registry. Infect Control Hosp Epidemiol 1998;19:175–180.
166. Straetemans M, Sanders EA, Veenhoven RH, et al. Pneumococcal vaccines for preventing otitis media. Cochrane Database Syst Rev 2004;(1):CD001480. DOI: 10.1002/14651858.CD001480.pub2.
167. Lucero MG, Dulalia VE, Parreno RN, et al. Pneumococcal conjugate vaccines for preventing vaccine–type invasive pneumococcal disease and pneumonia with consolidation on X-ray in children under two years of age. Cochrane Database Syst Rev 2004;(4):CD004977. DOI: 10.1002/14651858.CD004977.
168. Dear KB, Andrews RR, Holden J, Tatham DP. Vaccines for preventing pneumococcal infection in adults. Cochrane Database Syst Rev 2004;(4):CD000422. DOI: 10.1002/14651858.CD000422.
169. Benin AL, O’Brien KL, Watt JP, et al. Effectiveness of the 23-valent polysaccharide vaccine against invasive pneumococcal disease in Navajo adults. J Infect Dis 2003;188:81–89.
170. Hanna JN, Humphreys JL, Murphy DM. Invasive pneumococcal disease in Indigenous people in north Queensland, 1999–2004. Med J Aust 2006;184:118–121.
171. Krause V, Cook H, Selvey CE. Impact of 7vPCV and 23vPPV booster in eligible children in the Northern Territory of Australia: impressive, but not the total answer. Poster presented at 5th International Symposium on Pneumococci and Pneumococcal Diseases (ISPPD5), Alice Springs, Central Australia, April 2006.
172. Andrews RM, Counahan ML, Hogg GG, McIntyre PB. Effectiveness of a publicly funded pneumococcal vaccination pro-gram against invasive pneumococcal disease in Victoria, Australia. Vaccine 2004;23:132–138.
173. Centers for Disease Control and Prevention. Update on vaccine-derived polioviruses. MMWR Morb Mortal Wkly Rep 2006;55:1093–1097.
174. Commonwealth Department of Health and Aged Care. National documentation for certification of poliomyelitis eradica-tion in Australia. Canberra: Commonwealth of Australia, 2000.
175. World Health Organization. Major milestone reached in global polio eradication: Western Pacific Region is certified polio-free. Commun Dis Intell 2000;24:304.
176. Sullivan AA, Boyle RS, Whitby RM. Vaccine-associated paralytic poliomyelitis. Med J Aust 1995;163:423–424.
177. Catton M, Brussen KA, Kennett M. Vaccine-associated paralytic poliomyelitis. Med J Aust 1996;164:255–256.
178. Stambos V, Brussen KA, Thorley BR. Annual report of the Australian National Poliovirus Reference Laboratory, 2004. Commun Dis Intell 2005;29:263–268.
179. Brussen KA, Roberts J, Ibrahim A, Stambos V, Thorley BR. Annual report of the Australian National Poliovirus Reference Laboratory 2005. Commun Dis Intell 2006;30:334–340.

S148 CDI Vol 31 Supplement 2007
Vaccine preventable diseases and vaccination coverage in Australia, 2003 to 2005
180. Kelly H, Brussen KA, Lawrence A, et al. Polioviruses and other enteroviruses isolated from faecal samples of patients with acute flaccid paralysis in Australia, 1996–2004. J Paediatr Child Health 2006;42:370–376.
181. Zurynski Y, Cronin PA, Elliott EJ. Communicable and vaccine-preventable conditions under surveillance by the APSU: 2005 update. Commun Dis Intell 2006;30:341–344.
182. Morris AM, Elliott EJ, D’Souza RM, et al. Acute flaccid paralysis in Australian children. J Paediatr Child Health 2003;39:22–26.
183. Whitfield K, Kelly H. Notification of patients with acute flaccid paralysis since certification of Australia as polio-free. J Paediatr Child Health 2004;40:466–469.
184. Whitfield K, Kelly H. Using the two-source capture-recapture method to estimate the incidence of acute flaccid paralysis in Victoria, Australia. Bull World Health Organ 2002;80:846–851.
185. Centers for Disease Control and Prevention. Resurgence of wild poliovirus type 1 transmission and consequences of importation – 21 countries, 2002–2005. MMWR Morb Mortal Wkly Rep 2006;55:145–150.
186. Centers for Disease Control and Prevention. Progress toward poliomyelitis eradication – India, January 2005–June 2006. MMWR Morb Mortal Wkly Rep 2006;55:772–776.
187. Global polio eradication initiative website. Available from: http://www.polioeradication.org Accessed on 29 September 2006.
188. World Health Organization. Global polio eradication initiative strategic plan 2004–2008. 2003. Available from: http://www.polioeradication.org/content/publications/2004stratplan.pdf Accessed on 9 March 2007.
189. Wood N, Thorley B. Towards global poliomyelitis eradication: The successes and challenges for a developed country. J Paediatr Child Health 2003;39:647–650.
190. Liang X, Zhang Y, Xu W, et al. An outbreak of poliomyelitis caused by type 1 vaccine-derived poliovirus in China. J Infect Dis 2006;194:545–551.
191. Dowdle W, Kew O. Vaccine-derived polioviruses: is it time to stop using the word “rare”? J Infect Dis 2006;194:539–541.
192. Durrheim DN, Massey IP, Kelly H. Re-emerging poliomyelitis—is Australia’s surveillance adequate? Commun Dis Intell 2006;30:275–277.
193. Thorley BR, Brussen KA, Elliott EJ, Kelly HA. Vigilance is required for Australia to remain polio free [letter]. Med J Aust 2006;184:474–475.
194. Harris RJ, Storm PA, Lloyd A, Arens M, Marmion BP. Long-term persistence of Coxiella burnetii in the host after primary Q fever. Epidemiol Infect 2000;124:543–549.
195. Parker NR, Barralet JH, Bell AM. Q fever. Lancet 2006;367:679–688.
196. Marmion BP, Shannon M, Maddocks I, Storm P, Penttila I. Protracted debility and fatigue after acute Q fever. Lancet 1996;347:977–978.
197. Ayres JG, Flint N, Smith E.G, et al. Post-infection fatigue syndrome following Q fever. QJM: monthly journal of the Association of Physicians 1998;91:105–123.
198. Maurin M, Raoult D. Q fever. Clin Microbiol Rev 1999;12:518–553.
199. Marmion BP, Ormsbee RA, Kyrkou M, et al. Vaccine prophylaxis of abattoir-associated Q fever: eight years’ experience in Australian abattoirs. Epidemiol Infect 1990;104:275–287.
200. Ackland JR, Worswick DA, Marmion BP. Vaccine prophylaxis of Q fever. A follow-up study of the efficacy of Q-Vax (CSL) 1985–1990. Med J Aust 1994;160:704–708.
201. Shapiro RA, Siskind V, Schofield FD, et al. A randomized, controlled, double-blind, cross-over, clinical trial of Q fever vaccine in selected Queensland abattoirs. Epidemiol Infect 1990;104:267–273.
202. Garner MG, Longbottom HM, Cannon RM, Plant AJ. A review of Q fever in Australia 1991–1994. Aust N Z J Public Health 1997;21:722–730.
203. Australian Government Department of Health and Ageing. Immunisation programs and initiatives. Q fever management program. 2006. Available from: http://www.immunise.health.gov.au/internet/immunise/publishing.nsf/Content/q-fever-man Accessed on 23 March 2006.
204. Massey P, Taylor K. Q fever cluster in a shearing team. N S W Public Health Bull 2004;15:223–224.
205. Comments on notifications 1 January to 31 March 2004 and 2003. Q fever. The Northern Territory Disease Control Bulletin 2004;11:49.
206. Comments on disease notifications with significant increases. Q fever. The Northern Territory Disease Control Bulletin 2005;12:36.
207. Marmion B, Harris R, Storm P, et al. Q Fever Research Group (QRG), Adelaide: activities – exit summary 1980–2004. Ann N Y Acad Sci 2005;1063:181–186.
208. Public Health Group. Vu T, Counahan M, Morgan M, Lester R, eds. Surveillance of notifiable infectious diseases in Victoria, 2003. Melbourne: Communicable Diseases Section, Rural and Regional Health and Aged Care Services, Victorian Department of Human Services, 2005. Available from: http://www.health.vic.gov.au/ideas/downloads/annual_rpts/snid2003_complete.pdf Accessed on 15 December 2006.
209. Public Health Branch. Fielding J, ed. Surveillance of notifiable infectious diseases in Victoria, 2004. Melbourne: Communicable Diseases Section, Rural and Regional Health and Aged Care Services, Victorian Department of Human Services, 2006. Available from: http://www.health.vic.gov.au/ideas/downloads/annual_rpts/snid2004_complete.pdf Accessed on 15 December 2006.

CDI Vol 31 Supplement 2007 S149
Vaccine preventable diseases and vaccination coverage in Australia, 2003 to 2005
210. Lin M, Delpech V, McAnulty J, Campbell-Lloyd S. Epireview: notifications of Q fever in New South Wales, 1991–2000. N S W Public Health Bull 2001;12:172–175.
211. Milazzo A, Featherstone KB, Hall RG. Q fever vaccine uptake in South Australian meat processors prior to the introduction of the National Q Fever Management Program. Commun Dis Intell 2005;29:400–406.
212. Greenslade E, Beasley R, Jennings L, Woodward A, Weinstein P. Has Coxiella burnetii (Q fever) been introduced into New Zealand? Emerg Infect Dis 2003;9:138–140.
213. Hilbink F, Penrose M, Kovacova E, Kazar J. Q fever is absent from New Zealand. Int J Epidemiol 1993;22:945–949.
214. Tissot-Dupont H, Amadei MA, Nezri M, Raoult D. A pedagogical farm as a source of Q fever in a French city. Eur J Epidemiol 2005;20:957–961.
215. van Woerden HC, Mason BW, Nehaul LK, et al. Q fever outbreak in industrial setting. Emerg Infect Dis 2004;10:1282–1289.
216. Porten K, Rissland J, Tigges A, et al. A super-spreading ewe infects hundreds with Q fever at a farmers’ market in Germany. BMC Infectious Diseases 2006;6:147. Available from: http://www.biomedcentral.com/1471-2334/6/147 Accessed on 23 October 2006.
217. McQuiston JH, Holman RC, McCall CL, et al. National surveillance and the epidemiology of human Q fever in the United States, 1978–2004. Am J Trop Med Hyg 2006;75:36–40.
218. Health Protection Agency. Q fever. Background information. 2006. Available from: http://www.hpa.org.uk/infections/topics_az/zoonoses/q_fever/gen_info.htm Accessed on 23 October 2006.
219. Clark HF, Offit PA, Glass RI, Ward RL. Rotavirus vaccines. In: Plotkin SA, Orenstein WA, Offit PA, eds. Vaccines. 4th ed. Pennsylvania: W.B. Saunders Company, 2004.
220. Velazquez FR, Matson DO, Calva JJ, et al. Rotavirus infections in infants as protection against subsequent infections. N Engl J Med 1996;335:1022–1028.
221. Newall AT, MacIntyre R, Wang H, Hull B, Macartney K. Burden of severe rotavirus disease in Australia. J Paediatr Child Health 2006;42:521–527.
222. Parashar UD, Alexander JP, Glass RI. Prevention of rotavirus gastroenteritis among infants and children. Recommendations of the Advisory Committee on Immunization Practices (ACIP). MMWR Recomm Rep 2006;55(RR–12):1–13.
223. Kirkwood CD, Bogdanovic-Sakran N, Cannan D, Bishop RF, Barnes GL. National Rotavirus Surveillance Program annual report, 2004–05. Commun Dis Intell 2006;30:133–136.
224. Vesikari T, Matson DO, Dennehy P, et al. Safety and efficacy of a pentavalent human-bovine (WC3) reassortant rotavirus vaccine. N Engl J Med 2006;354:23–33.
225. Ruiz-Palacios GM, Pérez-Schael I, Velázquez FR, et al. Safety and efficacy of an attenuated vaccine against severe rotavirus gastroenteritis. N Engl J Med 2006;354:11–22.
226. Armstrong P. Rotaviral gastroenteritis in the NT: a description of the epidemiology 1995–2001 and future directions for research. The Northern Territory Disease Control Bulletin 2001;8(3):1–5. Available from: http://www.nt.gov.au/health/cdc/bulletin/sept_2001.pdf Accessed on November 2006.
227. Blumer C, Roche P, Kirkwood C, Bishop R, Barnes G. Surveillance of viral pathogens in Australia: rotavirus. Commun Dis Intell 2003;27:496–503.
228. Carlin JB, Chondros P, Masendycz P, et al. Rotavirus infection and rates of hospitalisation for acute gastroenteritis in young children in Australia, 1993–1996. Med J Aust 1998;169:252–256.
229. NSW Health Department. Managing young children and infants with gastroenteritis: clinical practice guidelines. Sydney: NSW Health Department, 2002.
230. Riordan FA, Quigley T. Estimating hospital admissions due to rotavirus gastroenteritis from hospital episode statistics. J Infect 2004;49:13–16.
231. Hsu VP, Staat MA, Roberts N, et al. Use of active surveillance to validate international classification of diseases code estimates of rotavirus hospitalizations in children. Pediatrics 2005;115:78–82.
232. Galati JC, Harsley S, Richmond P, Carlin JB. The burden of rotavirus-related illness among young children on the Australian health care system. Aust N Z J Public Health 2006;30:416–421.
233. Bishop RF, Masendycz PJ, Bugg HC, Carlin JB, Barnes GL. Epidemiological patterns of rotaviruses causing severe gastro-enteritis in young children throughout Australia from 1993 to 1996. J Clin Microbiol 2001;39:1085–1091.
234. Kirkwood C, Bogdanovic-Sakran N, Clark R, et al. Report of the Australian Rotavirus Surveillance Program, 2001/2002. Commun Dis Intell 2002;26:537–540.
235. Kirkwood CD, Bogdanovic-Sakran N, Clark R, Bishop RF, Graeme LB. Report of the Australian rotavirus surveillance program 2002–03. Commun Dis Intell 2003;27:492–495.
236. Kirkwood C, Bogdanovic-Sakran N, Ruth B, Barnes G. Report of the Australian Rotavirus Surveillance Program 2003–2004. Commun Dis Intell 2004;28:481–485.
237. Kirkwood C, Bogdanovic-Sakran N, Barnes G, Bishop R. Rotavirus serotype G9P[8] and acute gastroenteritis outbreak in children, Northern Australia. Emerg Infect Dis 2004;10:1593–1600.
238. Schultz R. Rotavirus gastroenteritis in the Northern Territory, 1995–2004. Med J Aust 2006;185:354–356.
239. Soriano-Gabarro M, Mrukowicz J, Vesikari T, Verstraeten T. Burden of rotavirus disease in European Union countries. Pediatr Infect Dis J 2006;25 Suppl 1:S7–S11.

S150 CDI Vol 31 Supplement 2007
Vaccine preventable diseases and vaccination coverage in Australia, 2003 to 2005
240. Ringenbergs ML, Davidson GP, Spence J, Morris S. Prospective study of nosocomial rotavirus infection in a paediatric hospital. Aust Paediatr J 1989;25:156–160.
241. Snelling T, Cripps T, Macartney K, et al. Nosocomial rotavirus infection in an Australian children’s hospital [letter]. J Paediatr Child Health 2007;43:327.
242. World Health Organization (WHO). Rubella vaccines WHO position paper. Wkly Epidemiol Rec 2000;75:161–169.
243. Elliot E, Cronin P, Rose D, Zurynski Y, eds. Australian Paediatric Surveillance Unit surveillance report 2002–2003. Sydney: Australian Paediatric Surveillance Unit, 2005. Available from: http://www.apsu.org.au/publications%202_files/APSU_report.pdf Accessed on April 2007.
244. Elliot E, Cronin P, Zurynski Y, eds. Australian Paediatric Surveillance Unit annual report 2004. Sydney: Australian Paediatric Surveillance Unit, 2005. Available from: http://www.apsu.org.au/publications%202_files/FINAL%20REPORT%202004.pdf Accessed on April 2007.
245. Kelly H, Worth L, Karapanagiotidis T, Riddell M. Interruption of rubella virus transmission in Australia may require vaccina-tion of adult males: evidence from a Victorian sero-survey. Commun Dis Intell 2004;28:69–73.
246. Gidding HF, Young M, Pugh R, Burgess M. Rubella in Australia: can we explain two recent cases of congenital rubella syndrome? Commun Dis Intell 2003;27:537–540.
247. Forrest JM, Burgess M, Donovan T. A resurgence of congenital rubella in Australia? Commun Dis Intell 2003;27:533–536.
248. Francis BH, Thomas AK, McCarty CA. The impact of rubella immunization on the serological status of women of childbear-ing age: a retrospective longitudinal study in Melbourne, Australia. Am J Public Health 2003;93:1274–1276.
249. Sathanandan D, Gupta L, Liu B, Rutherford A, Lane J. Factors associated with low immunity to rubella infection on antenatal screening. Aust N Z J Obstet Gynaecol 2005;45:435–438.
250. Hunt JM, Lumley J. Top end rural and remote Indigenous women: an Australian population group vulnerable to rubella. Commun Dis Intell 2004;28:499–503.
251. World Health Organization. Immunization surveillance, assessment and monitoring. Rubella and Congenital Rubella Syndrome (CRS). Statistics on rubella. 2006. Available from: http://www.who.int/immunization_monitoring/diseases/rubella/en/index.html Accessed on 23 November 2006.
252. World Health Organization Regional Office for the Western Pacific. Report of the UNICEF/WHO workshop on the Expanded Programme on Immunization in the Pacific, Auckland, New Zealand, 8–12 March 2004. ((WP)ICP/EPI/5.2/001-A) Report series number: RS/2004/GE/03(NEZ). Manila, Philippines: World Health Organization, 2004. Available from: http://www.wpro.who.int/NR/rdonlyres/F8FCAC09-0232-4945-907B-0B24C98EB2D4/0/MTGRPT_PIC_JOINT2004.pdf Accessed on 23 November 2006.
253. World Health Organization Regional Office for the Western Pacific. Western Pacific regional guidelines: introducing rubella vaccine. Draft of 25 March 2004. Available from: http://www.spc.int/phs/pphsn/Outbreak/Rubella/WPRO_Rubella_Guidelines_DRAFT-v1.pdf Accessed on 23 November 2006.
254. Reef SE, Cochi SL. The evidence for the elimination of rubella and congenital rubella syndrome in the United States: a public health achievement. Clin Infect Dis 2006;43 Suppl 3:S123–S125.
255. World Health Organization. Eliminating measles and rubella and preventing congenital rubella infection. WHO European Region strategic plan 2005–2010. Available from: http://www.euro.who.int/document/E87772.pdf Accessed on 23 November 2006.
256. Dayan GH, Castillo-Solórzano C, Nava M, et al. Efforts at rubella elimination in the United States: the impact of hemi-spheric rubella control. Clin Infect Dis 2006;43 Suppl 3:S158–S163.
257. Standardization of the nomenclature for genetic characteristics of wild-type rubella viruses. Wkly Epidemiol Rec 2005;80:126–132.
258. Global distribution of measles and rubella genotypes-update. Wkly Epidemiol Rec 2006;81:474–479.
259. The fourth WHO Global Measles and Rubella Laboratory Network meeting, 28–30 August 2006, WHO, Geneva. Final summary and recommendations. Available from: http://www.who.int/immunization_monitoring/FinalSummaryMeaslesRubellaMeetingAug06.pdf Accessed on 23 November 2006.
260. Icenogle JP, Frey TK, Abernathy E, et al. Genetic analysis of rubella viruses found in the United States between 1966 and 2004: evidence that indigenous rubella viruses have been eliminated. Clin Infect Dis 2006;43 Suppl 3:S133–S140.
261. Quinn HE, McIntyre PB. Tetanus in the elderly – an important preventable disease in Australia. Vaccine 2007;25:1304–1309.
262. Skowronski DM, Pielak K, Remple VP, et al. Adult tetanus, diphtheria and pertussis immunization: knowledge, beliefs, behavior and anticipated uptake. Vaccine 2004;23:353–361.
263. Bovier PA, Chamot E, Bouvier Gallacchi M, Loutan L. Importance of patients’ perceptions and general practitioners’ rec-ommendations in understanding missed opportunities for immunisations in Swiss adults. Vaccine 2001;19:4760–4767.
264. Rushdy AA, White JM, Ramsay ME, Crowcroft NS. Tetanus in England and Wales, 1984–2000. Epidemiol Infect 2003;130:71–77.
265. Bowman C, Hearing S, Bewley J. Tetanus toxoid for adults. Lancet 1996;348:1664.
266. Maple PA, Jones CS, Wall EC, et al. Immunity to diphtheria and tetanus in England and Wales. Vaccine 2000;19:167–173.
267. McQuillan GM, Kruszon-Moran D, Deforest A, Chu SY, Wharton M. Serologic immunity to diphtheria and tetanus in the United States. Ann Intern Med 2002;136:660–666.

CDI Vol 31 Supplement 2007 S151
Vaccine preventable diseases and vaccination coverage in Australia, 2003 to 2005
268. Yuan L, Lau W, Thipphawong J, et al. Diphtheria and tetanus immunity among blood donors in Toronto. CMAJ 1997;156:985–990.
269. de Melker HE, van den Hof S, Berbers GA, Conyn-van Spaendonck MA. Evaluation of the national immunisation pro-gramme in the Netherlands: immunity to diphtheria, tetanus, poliomyelitis, measles, mumps, rubella and Haemophilus influenzae type b. Vaccine 2003;21:716–720.
270. Turnbull F, Baker M, Tsang B, Jarman J. Epidemiology of tetanus in New Zealand reinforces value of vaccination. New Zealand Public Health Report 2001;8:57–60.
271. Pascual FB, McGinley EL, Zanardi LR, Cortese MM, Murphy TV. Tetanus surveillance – United States, 1998–2000. MMWR Surveill Summ 2003;52(SS–3):1–8.
272. Public Health Agency of Canada. Notifiable diseases on-line. Tetanus. Available from: http://dsol-smed.phac-aspc.gc.ca/dsol-smed/ndis/disease2/tetn_e.html Accessed on 22 September 2006.
273. Health Protection Agency. Ongoing national outbreak of tetanus in injecting drug users. Commun Dis Rep CDR Wkly 2004;14(9):2-4. Available from: http://www.hpa.org.uk/cdr/archives/2004/cdr0904.pdf Accessed on 13 April 2007.
274. Preblud SR, Orenstein WA, Bart KJ. Varicella: clinical manifestations, epidemiology and health impact in children. Pediatr Infect Dis 1984;3:505–509.
275. Gidding HF, MacIntyre CR, Burgess MA, Gilbert GL. The seroepidemiology and transmission dynamics of varicella in Australia. Epidemiol Infect 2003;131:1085–1089.
276. Guess HA, Broughton DD, Melton LJ, III, Kurland LT. Population-based studies of varicella complications. Pediatrics 1986;78:723–727.
277. Brody MB, Moyer D. Varicella-zoster virus infection. The complex prevention-treatment picture. Postgrad Med 192;102(1):187–190.
278. Bowsher D. The lifetime occurrence of Herpes zoster and prevalence of post-herpetic neuralgia: a retrospective survey in an elderly population. Eur J Pain 1999;3:335–342.
279. Lin F, Hadler JL. Epidemiology of primary varicella and herpes zoster hospitalizations: the pre-varicella vaccine era. J Infect Dis 2000;181:1897–1905.
280. Guess HA, Broughton DD, Melton LJ, III, Kurland LT. Epidemiology of herpes zoster in children and adolescents: a popula-tion-based study. Pediatrics 1985;76:512–517.
281. Gershon AA. Prevention and treatment of VZV infections in patients with HIV. Herpes 2001;8:32–36.
282. Forrest JM, Mego S, Burgess MA. Congenital and neonatal varicella in Australia. J Paediatr Child Health 2000;36:108–113.
283. Oxman MN, Levin MJ, Johnson GR, et al. A vaccine to prevent herpes zoster and postherpetic neuralgia in older adults. N Engl J Med 2005;352:2271–2284.
284. MacIntyre CR, Chu CP, Burgess MA. Use of hospitalization and pharmaceutical prescribing data to compare the prevac-cination burden of varicella and herpes zoster in Australia. Epidemiol Infect 2003;131:675–682.
285. Seward JF, Watson BM, Peterson CL, et al. Varicella disease after introduction of varicella vaccine in the United States, 1995–2000. JAMA 2002;287:606–611.
286. Hope-Simpson RE. Infectiousness of communicable diseases in the household (measles, chickenpox, and mumps). Lancet 1952;260:549–554.
287. Brisson M, Edmunds WJ, Gay NJ, Law B, De Serres G. Modelling the impact of immunization on the epidemiology of varicella zoster virus. Epidemiol Infect 2000;125:651–669.
288. Thomas SL, Wheeler JG, Hall AJ. Contacts with varicella or with children and protection against herpes zoster in adults: a case-control study. Lancet 2002;360:678–682.
289. Brisson M, Gay NJ, Edmunds WJ, Andrews NJ. Exposure to varicella boosts immunity to herpes-zoster: implications for mass vaccination against chickenpox. Vaccine 2002;20:2500–2507.
290. Jumaan AO, Yu O, Jackson LA, et al. Incidence of herpes zoster, before and after varicella-vaccination-associated decreases in the incidence of varicella, 1992–2002. J Infect Dis 2005;191:2002–2007.
291. Macartney K, McIntyre P. Universal varicella vaccination [letter]. Med J Aust 2005;183:278–279.
292. Communicable Diseases Network Australia. A report from the Communicable Diseases Network Australia, 1 April to 30 June 2005. Commun Dis Intell 2005;29:315.
293. Roche P. Surveillance plans for Australia. Presentation at NCIRS VZV Workshop, Sydney, 16–17 November 2006. Available from: http://www.ncirs.usyd.edu.au/newsevents/vzv_workshop_presentations_nov_06.doc Accessed on 8 March 2007.
294. Communicable diseases surveillance. Additional reports. Childhood immunisation coverage. Commun Dis Intell 1998;22:233.
295. Communicable diseases surveillance. Additional reports. Childhood immunisation coverage. Commun Dis Intell 2002;26:491.
296. Lawrence GL, Hull BP, MacIntyre CR, McIntyre PB. Reasons for incomplete immunisation among Australian children. A national survey of parents. Aust Fam Physician 2004;33:568–571.
297. Hull BP, McIntyre PB. Timeliness of childhood immunisation in Australia. Vaccine 2006;24:4403–4408.
298. Hanna JN, Wakefield JE, Doolan CJ, Messner JL. Childhood immunisation: factors associated with failure to complete the recommended schedule by two years of age. Aust J Public Health 1994;18:15–21.
299. Hull BP, McIntyre PB, Sayer GP. Factors associated with low uptake of measles and pertussis vaccines: an ecologic study based on the Australian Childhood Immunisation Register. Aust N Z J Public Health 2001;25:405–410.

S152 CDI Vol 31 Supplement 2007
Vaccine preventable diseases and vaccination coverage in Australia, 2003 to 2005
300. Taylor A, Wilson D, Dal Grande E, Gill T. National influenza survey: a population survey of vaccination uptake in Australia. Adelaide: Centre for Population Studies in Epidemiology, Epidemiology Branch, South Australian Department of Human Services, 2000. Available from: http://dh.sa.gov.au/pehs/PROS/flu-vaccination-2000.pdf Accessed on 12 March 2007.
301. Hull BP, McIntyre PB. What do we know about 7vPCV coverage in Aboriginal and Torres Strait Islander children? Commun Dis Intell 2004;28:238–243.
302. Burgess MA, McIntyre PB. Vaccines: the new Australian best-practice schedule. Med J Aust 2004;180:494–496.
303. World Health Organization Press Release WHO/71 (29 October 2000). Major milestone reached in global polio eradica-tion: Western Pacific Region is certified polio-free. Commun Dis Intell 2000;24:304.
304. New Zealand Ministry of Health. Institute of Environmental Science and Research. New Zealand Public Health Observatory. Available from: http://www.nzpho.org.nz/ Accessed on 8 November 2006.
305. Centers for Disease Control and Prevention. Summary of notifiable diseases – United States, 2004. MMWR Morb Mortal Wkly Rep 2006;53:1–84. Available from: http://www.cdc.gov/mmwr/PDF/wk/mm5353.pdf Accessed on 8 November 2006.
306. Health Canada. Population and Public Health Branch. Notifiable Diseases. Available from: http://dsol-smed.hc-sc.gc.ca/dsol-smed/ndis/c_dis_e.html Accessed on 8 November 2006.
307. Health Protection Agency. Infectious Diseases section. Available from: ttp://www.hpa.org.uk/infections/default.htm Accessed on 8 November 2006.
308. Lawrence GL, MacIntyre CR, Hull BP, McIntyre PB. Effectiveness of the linkage of child care and maternity payments to childhood immunisation. Vaccine 2004;22:2345–2350.
309. Australian Government Department of Health and Ageing. Review of the General Practice Immunisation Incentives (GPII) Scheme. Canberra: Australian Government Department of Health and Ageing, 2004. Available from: http://www.immunise.health.gov.au/internet/immunise/publishing.nsf/Content/DF7218195E74C315CA25719D00183387/$File/gpii_review_2004.pdf Accessed on 13 March 2007.
310. Skull S. A review of national notifiable disease case definitions [report to Communicable Diseases Network Australia and New Zealand (CDNANZ)]. January 2001.
311. O’Grady KA, Counahan M, Birbilis E, Tallis G, eds. Surveillance of notifiable infectious diseases Victoria, 2002. Melbourne: Communicable Diseases Section, Rural and Regional Health and Aged Care Services, Victorian Department of Human Services, 2003. Available from: http://www.health.vic.gov.au/ideas/downloads/annual_rpts/snid2002_complete.pdf Accessed on 22 February 2007.
312. Guy RJ, Andrews RM, Kelly HA, et al. Mumps and rubella: a year of enhanced surveillance and laboratory testing. Epidemiol Infect 2004;132:391–398.