Attention to Stimulus Features Shifts Spectral Tuning of V4 Neurons during Natural Vision
30
Attention to stimulus features shifts spectral tuning of V4 neurons during natural vision Stephen V. David 1,3,5 , Benjamin Y. Hayden 2,3,6 , James A. Mazer 4,7 , and Jack L. Gallant 3,4 1 Program in Bioengineering, University of California, Berkeley 2 Department of Molecular and Cellular Biology, University of California, Berkeley 3 Program in Neuroscience, University of California, Berkeley 4 Department of Psychology, University of California, Berkeley SUMMARY Most current neurophysiological data indicate that selective attention can alter the baseline response level or response gain of neurons in extrastriate visual areas but that it cannot change neuronal tuning. Current models of attention therefore assume that neurons in visual cortex transmit a veridical representation of the natural world, via labeled lines, to central areas responsible for executive processes and decision-making. However, some theoretical studies have suggested that attention might modify neuronal tuning in visual cortex and thus change the neural representation of stimuli. To test this hypothesis experimentally, we measured orientation and spatial frequency tuning of area V4 neurons during two distinct natural visual search tasks, one that required fixation and one that allowed free-viewing during search. We find that spatial attention modulates response baseline and/ or gain but does not alter tuning, consistent with previous reports. In contrast, attention directed toward particular visual features often shifts neuronal tuning. These tuning shifts are inconsistent with the labeled line model, and tend to enhance responses to stimulus features that distinguish the search target. Our data suggest that V4 neurons behave as matched filters that are dynamically tuned to optimize visual search. Keywords ATTENTION; SPECTRAL RECEPTIVE FIELD; REVERSE CORRELATION; MATCHED FILTER; LABELED LINE INTRODUCTION Cortical area V4 is an extrastriate visual area critical for form and shape perception (Gallant et al., 1993; Gallant et al., 2000; Ogawa and Komatsu, 2004; Pasupathy and Connor, 1999; © 2008 Elsevier Inc. All rights reserved. Corresponding author: Jack Gallant, 3210 Tolman Hall #1650, University of California, Berkeley, CA 94720-1650. Tel: (510) 642-2606. FAX: (510) 542-5293. E-mail: [email protected]. 5 Current address: 2202 A.V. Williams Building, University of Maryland, College Park, MD 20742 6 Current address: 433 Bryan Research Building, Duke University Medical Center. Box 3209, Durham, NC 27710 7 Current address: Department of Neurobiology, Yale School of Medicine, POB 208001, New Haven, CT 06520 Publisher's Disclaimer: This is a PDF file of an unedited manuscript that has been accepted for publication. As a service to our customers we are providing this early version of the manuscript. The manuscript will undergo copyediting, typesetting, and review of the resulting proof before it is published in its final citable form. Please note that during the production process errors may be discovered which could affect the content, and all legal disclaimers that apply to the journal pertain. NIH Public Access Author Manuscript Neuron. Author manuscript; available in PMC 2010 October 1. Published in final edited form as: Neuron. 2008 August 14; 59(3): 509–521. doi:10.1016/j.neuron.2008.07.001. NIH-PA Author Manuscript NIH-PA Author Manuscript NIH-PA Author Manuscript
-
Upload
independent -
Category
Documents
-
view
3 -
download
0
Transcript of Attention to Stimulus Features Shifts Spectral Tuning of V4 Neurons during Natural Vision
Attention to stimulus features shifts spectral tuning of V4 neuronsduring natural vision
Stephen V. David1,3,5, Benjamin Y. Hayden2,3,6, James A. Mazer4,7, and Jack L. Gallant3,41Program in Bioengineering, University of California, Berkeley2Department of Molecular and Cellular Biology, University of California, Berkeley3Program in Neuroscience, University of California, Berkeley4Department of Psychology, University of California, Berkeley
SUMMARYMost current neurophysiological data indicate that selective attention can alter the baseline responselevel or response gain of neurons in extrastriate visual areas but that it cannot change neuronal tuning.Current models of attention therefore assume that neurons in visual cortex transmit a veridicalrepresentation of the natural world, via labeled lines, to central areas responsible for executiveprocesses and decision-making. However, some theoretical studies have suggested that attentionmight modify neuronal tuning in visual cortex and thus change the neural representation of stimuli.To test this hypothesis experimentally, we measured orientation and spatial frequency tuning of areaV4 neurons during two distinct natural visual search tasks, one that required fixation and one thatallowed free-viewing during search. We find that spatial attention modulates response baseline and/or gain but does not alter tuning, consistent with previous reports. In contrast, attention directedtoward particular visual features often shifts neuronal tuning. These tuning shifts are inconsistentwith the labeled line model, and tend to enhance responses to stimulus features that distinguish thesearch target. Our data suggest that V4 neurons behave as matched filters that are dynamically tunedto optimize visual search.
KeywordsATTENTION; SPECTRAL RECEPTIVE FIELD; REVERSE CORRELATION; MATCHEDFILTER; LABELED LINE
INTRODUCTIONCortical area V4 is an extrastriate visual area critical for form and shape perception (Gallantet al., 1993; Gallant et al., 2000; Ogawa and Komatsu, 2004; Pasupathy and Connor, 1999;
© 2008 Elsevier Inc. All rights reserved.Corresponding author: Jack Gallant, 3210 Tolman Hall #1650, University of California, Berkeley, CA 94720-1650. Tel: (510) 642-2606.FAX: (510) 542-5293. E-mail: [email protected] address: 2202 A.V. Williams Building, University of Maryland, College Park, MD 207426Current address: 433 Bryan Research Building, Duke University Medical Center. Box 3209, Durham, NC 277107Current address: Department of Neurobiology, Yale School of Medicine, POB 208001, New Haven, CT 06520Publisher's Disclaimer: This is a PDF file of an unedited manuscript that has been accepted for publication. As a service to our customerswe are providing this early version of the manuscript. The manuscript will undergo copyediting, typesetting, and review of the resultingproof before it is published in its final citable form. Please note that during the production process errors may be discovered which couldaffect the content, and all legal disclaimers that apply to the journal pertain.
NIH Public AccessAuthor ManuscriptNeuron. Author manuscript; available in PMC 2010 October 1.
Published in final edited form as:Neuron. 2008 August 14; 59(3): 509–521. doi:10.1016/j.neuron.2008.07.001.
NIH
-PA Author Manuscript
NIH
-PA Author Manuscript
NIH
-PA Author Manuscript

Schiller and Lee, 1991). Responses of V4 neurons are modulated by both spatial (Luck et al.,1997; Maunsell and Cook, 2002; McAdams and Maunsell, 1999; Moran and Desimone,1985; Motter, 1993; Reynolds and Chelazzi, 2004) and feature-based attention (Hayden andGallant, 2005; Mazer and Gallant, 2003; McAdams and Maunsell, 2000; Motter, 1994; Ogawaand Komatsu, 2004). Previous neurophysiological studies have reported that spatial attentiondirected into the receptive field (RF) of a V4 neuron can increase baseline firing rate, gain, orcontrast sensitivity, but has little effect on feature selectivity (Luck et al., 1997; McAdams andMaunsell, 1999; Ogawa and Komatsu, 2004; Reynolds et al., 2000; Williford and Maunsell,2006). Studies of feature-based attention have been fewer in number. One important early studysuggested that feature-based attention might change color selectivity, resulting in increasedsensitivity to behaviorally relevant features (Motter, 1994). However, subsequent studies offeature-based attention in area V4 (McAdams and Maunsell, 2000) and MT (Martinez-Trujilloand Treue, 2004) have reported only changes in response gain. In this study, we used a newexperimental and modeling approach to determine if feature-based attention does, in fact, shiftthe visual tuning of V4 neurons.
Although neurophysiological evidence for tuning shifts in V4 is limited, a few theoretical andpsychophysical studies have suggested that visual search might make use of a matched filterthat shifts neuronal tuning toward the attended target (Carrasco et al., 2004; Compte and Wang,2006; Lee et al., 1999; Lu and Dosher, 2004; Olshausen et al., 1993; Rao and Ballard, 1997;Tsotsos et al., 1995). Consistent with this idea, several reports have demonstrated that spatialattention can shift spatial receptive fields in both V4 and MT toward the attended location inthe visual field (Connor et al., 1996; Connor et al., 1997; Tolias et al., 2001; Womelsdorf etal., 2006). For feature-based attention, the matched filter hypothesis predicts that whenattention is directed toward a spectral feature (e.g., a particular orientation or spatial frequency)neurons should shift their spectral tuning toward that feature. Evidence that attention alterstuning to visual features would challenge the classical, widely accepted hypothesis that neuronsin visual cortex act as labeled lines with fixed tuning properties (i.e, the same optimal stimulus),regardless of attention state (Adrian and Matthews, 1927; Barlow, 1972; Marr, 1982).
Previous studies of attention in V4 may not have identified clear and compelling changes invisual tuning for two reasons. First, in order to maximize statistical power, most studies haveused sparse stimulus sets of 2–8 distinct, synthetic images that vary along one or twodimensions (Haenny et al., 1988; Luck et al., 1997; McAdams and Maunsell, 1999; McAdamsand Maunsell, 2000; Moran and Desimone, 1985; Motter, 1993; Reynolds et al., 2000). Forthese small stimulus sets, tuning changes are detectable only when they fall directly along thedimension where the stimuli vary. Second, previous studies have focused primarily on theeffects of spatial attention (Luck et al., 1997; McAdams and Maunsell, 1999; Reynolds et al.,2000). Space is represented topographically in extrastriate cortex while other features, such asorientation and spatial frequency, are not (Gattass et al., 1988). Thus spatial attention mayoperate by a different mechanism and have different effects on tuning than attention to otherfeatures (Hayden and Gallant, 2005; Maunsell and Treue, 2006).
To investigate whether feature-based attention alters the tuning of V4 neurons, we performedtwo complementary experiments. These experiments used a spectrally rich set of naturalimages selected to fully span the likely tuning space encoded by V4 neurons, and they engagedboth feature-based and spatial attention. The first, a match-to-sample task, allows simultaneous,independent manipulation of both spatial and feature-based attention in the absence of eyemovements (Hayden and Gallant, 2005). The second, a free-viewing visual search task,manipulates feature-based attention while allowing natural eye movements (Mazer andGallant, 2003). Both tasks use natural images that broadly sample visual stimulus space andallow for the measurement of neuronal response properties under conditions approximatingnatural vision. We adopted a conservative analytical approach to identify tuning shifts; the
David et al. Page 2
Neuron. Author manuscript; available in PMC 2010 October 1.
NIH
-PA Author Manuscript
NIH
-PA Author Manuscript
NIH
-PA Author Manuscript

statistical significance of shifts was assessed only after accounting for and removing any shiftsin response baseline or gain. Other results from these experiments were reported previously(Hayden and Gallant, 2005; Mazer and Gallant, 2003).
RESULTSTo test the hypothesis that attention can alter tuning to visual features in area V4, we recordedresponses from single neurons during a match-to-sample task (MTS; Figure 1A, (Hayden andGallant, 2005)) and a free-viewing visual search task (FVVS; Figure 1B, (Mazer and Gallant,2003)). In both tasks feature-based attention was manipulated by specifying a natural imagesearch target, and a large number of natural image distractors were presented in the receptivefield of each neuron under each attention condition.
We characterized visual tuning by estimating the spectral receptive field (SRF, (David et al.,2006)) of each neuron from responses evoked by the distractors under different attentionconditions. The SRF is a two-dimensional tuning profile that describes the joint orientation-spatial frequency tuning of a neuron (Mazer et al., 2002). The SRF provides a general second-order model of visual tuning, so it can be used to predict responses to arbitrary visual stimuli(David et al., 2006; Wu et al., 2006). Each SRF was estimated by normalized reverse correlation(Theunissen et al., 2001), a procedure that reliably characterizes tuning properties fromresponses to natural stimuli in both the visual (David and Gallant, 2005; David et al., 2006)and auditory systems (Woolley et al., 2005).
To determine how attention influences V4 SRFs during visual search, we evaluated threequantitative models of attentional modulation. (1) The no modulation model (Figure 2A)assumes that the estimated SRF is not affected by the state of attention. (2) The baseline/gainmodulation model (Figure 2B) assumes that attention modulates the baseline (i.e., firing ratein the absence of stimulation) or gain of each SRF but does not change spectral tuning(McAdams and Maunsell, 2000; Reynolds et al., 2000). Both the no modulation and baseline/gain modulation models are consistent with the labeled line hypothesis. However, if thebaseline/gain model is correct then SRFs whose baseline and overall gain are fit separately foreach attention condition should predict neuronal responses better than the no modulationmodel. (3) The tuning modulation model (Figure 2C) assumes that attention can modulatespectral tuning (i.e., the shape of the SRF), thereby changing a neuron’s preferred stimulus.This model is inconsistent with the labeled line hypothesis. If the tuning modulation model iscorrect then SRFs estimated separately for each attention condition should predict neuronalresponses better than either of the other two models. In our approach, these three models aredesigned hierarchically; each one is fit successively to the residual of the previous one (seeMethods). Thus, the tuning modulation model accounts only for changes in neuronal responsesthat cannot be attributed to baseline or gain modulation.
Feature-based attention shifts spectral tuning in V4 during match-to-sampleTo determine whether feature-based attention modulates spectral tuning during MTS, wecollapsed the data over both conditions of spatial attention (into and away from the receptivefield). The three models described above were then fit to the collapsed data from every neuronin the sample (n=105). The performance of each model was evaluated using a strict cross-validation procedure. This procedure precluded the possibility of over-fitting to noise andallowed for unbiased comparison of models with different numbers of parameters (David andGallant, 2005). Figure 3 shows SRFs and model fits for one V4 neuron whose tuning ismodulated by feature-based attention during MTS. The SRF estimated for the no modulationmodel shows that this neuron is tuned for a narrow range of orientations and a wide range ofspatial frequencies (75–90 deg and 5–10 cyc/RF). We quantified the performance of the nomodulation model by measuring its prediction accuracy relative to the predictive power of the
David et al. Page 3
Neuron. Author manuscript; available in PMC 2010 October 1.
NIH
-PA Author Manuscript
NIH
-PA Author Manuscript
NIH
-PA Author Manuscript

most comprehensive model tested (i.e., the tuning modulation model, see below). For thisneuron, the no modulation SRF accounts for 77% of the total predicted response variance.
The effects of feature-based attention on response baseline and gain are visualized by plottingdistractor responses predicted by the no modulation model against responses actually observedin each attention condition (Figure 3B). Because each point is averaged over only two stimuluspresentations, there is substantial scatter due to neuronal response variability. When the datais binned across stimuli predicted to give similar responses (solid lines), the differencesbetween attention conditions become more apparent. The change in slope indicates that thisneuron shows greater gain when feature-based attention is directed to the preferred target (T1,i.e., the target that elicits the stronger visual response, averaged across attention conditions),than when it is directed to the non-preferred target (T2). The baseline/gain modulation modelaccounts for an additional 8% of the total predicted response variance for this neuron, asignificant increase over the no modulation model (p<0.05, jackknifed t-test).
The tuning modulation model was fit by estimating SRFs separately for trials when T1 was isthe target and when T2 was the target (Figure 3C). This model also shows a significant increasein predictive power over the baseline/gain modulation model, accounting for the remaining15% of total predicted response variance (p<0.05, jackknifed t-test). The shift in spectral tuningbetween attention conditions suggests a strategy that facilitates target detection: during T1 trialsspatial frequency tuning is sharper and higher than during T2 trials. Inspection of the powerspectra of the target images (Figure 3C, bottom row) reveals that T1 has more power than T2at high spatial frequencies. Thus, feature-based attention appears to shift spectral tuning tomore closely match the spectral properties of the target. To test for this effect quantitatively,we computed a target similarity index (TSI) from the SRFs measured under each condition offeature-based attention (see Methods). TSI values significantly greater than zero indicate thatthe SRF shifts toward the power spectrum of the search target. (More specifically, whencomparing SRFs estimated separately from T1 and T2 trials, a positive TSI indicates that theSRF estimated from T1 trials is more like the spectrum of T1 and/or the SRF estimated fromT2 trials is more like the spectrum of T2.) An extreme value of 1 indicates a perfect matchbetween the SRF and target spectra in both conditions of feature-based attention (i.e., a perfectmatched filter). A tuning shift away from the target will produce a negative TSI, and a shift inany direction orthogonal to the target axis will produce a TSI of zero. For this neuron, the TSIof 0.17 is significantly greater than zero (p<0.05, jackknifed t-test), indicating a significantshift toward the search target.
Figure 4 shows another V4 neuron whose spectral tuning is also altered by feature-basedattention. The no modulation SRF shows that this neuron is broadly tuned for orientation andnarrowly tuned for spatial frequency, accounting for 30% of total predicted response variance(Figure 4A). On T1 trials response gain increases (baseline/gain modulation model, 9% of totalpredicted response variance, Figure 4B, p<0.05) and spectral tuning shifts toward higher spatialfrequencies, as compared to T2 trials (tuning modulation model, 61% of total predictedresponse variance, Figure 4C, p<0.05). As in the previous example, the observed SRF changesare correlated with the spectral differences between T1 and T2; T1 has more power at lowspatial frequencies than does T2. This neuron enhances tuning at low frequencies on trials whenattention is directed toward T1, but its tuning at higher spatial frequencies remains unchanged(TSI: 0.04, p<0.05, jackknifed t-test).
Feature-based attention modulates baseline and gain in about half of the neurons in our sample(55/105, 52%, p<0.05, jackknifed t-test, Figure 5A), a finding consistent with previous studies(McAdams and Maunsell, 2000; Motter, 1994) and consistent with the labeled line hypothesis.However, feature-based attention also shifts the spectral tuning of nearly one third of theneurons, a finding that is inconsistent with the labeled line hypothesis (31/105, 30%, p<0.05,
David et al. Page 4
Neuron. Author manuscript; available in PMC 2010 October 1.
NIH
-PA Author Manuscript
NIH
-PA Author Manuscript
NIH
-PA Author Manuscript

jackknifed t-test). In order to explain the observed effects of feature-based attention, a completemodel of attention must account for changes in the shape of the tuning profile in addition tochanges in response baseline and gain.
Figure 5B compares the contribution of different attention-dependent models to the predictivepower of SRFs for all neurons significantly modulated by attention (n=87/105). Modulationof response baseline and gain by feature-based attention (baseline/gain modulation model)accounts for an average of 19% to the total predicted response variance. Modulation of spectraltuning by feature-based attention (tuning modulation model) accounts for an additional 14%of the predicted response variance. (The remaining bulk of the predicted response variance isaccounted for by the no modulation model.)
Note that the tuning shifts that we report here are conservative. In our cross-validationprocedure, each model is fit using one data set and then evaluated in terms of its predictivepower in an entirely separate validation data set. Therefore, our results represent a lower boundon the true proportion of neurons that show tuning shifts due to feature-based attention, andon the magnitude of the shifts themselves.
To determine whether spatial attention also modulates spectral tuning during MTS wecollapsed data for each neuron over both feature-based attention conditions (T1 and T2) andfit the three models described above. For the neuron shown in Figure 4, the no modulationmodel accounts for 23% of total predicted response variance (Figure 4A). Spatial attentionsignificantly modulates both response baseline and gain (77% of response variance, Figure 4D,p<0.05), but does not alter the shape of the SRF (p>0.2). Therefore the SRFs estimated inseparate spatial attention conditions (Figure 4E) show no discernible tuning shifts. Becausefeature-based attention shifts the spectral tuning of this neuron but spatial attention does not,this example demonstrates that feature-based and spatial attention can have different effectson tuning in the same neuron.
Spectral tuning is shifted by spatial attention during MTS in less than fifteen percent of theneurons in our sample (12/105, 12%, p<0.05, jackknifed t-test, Figure 5A). This fraction issignificantly lower than observed for feature-based attention (p<0.001, randomized paired t-test). In contrast, nearly three quarters of the neurons (73/105) show significant modulation ofbaseline and/or gain by spatial attention (p<0.05, jackknifed t-test), significantly more than forfeature-based attention (p<0.001, randomized paired t-test). These differences are alsoreflected in the fraction of response variance accounted for by the baseline/gain and tuningmodulation models (Figure 5B). For spatial attention, the baseline/gain modulation modelaccounts for an average of 38% of total explained variance, and the tuning modulation modelaccounts for only 7%. Thus, spatial attention imposes large modulations on the responses ofV4 neurons, but, unlike feature-based attention, its effects are restricted to response baselineand gain.
Feature-based attention shifts spectral tuning toward target featuresThe examples presented above suggest that feature-based attention shifts spectral tuning towardthe spectrum of the attended search target. If true, such shifts would suggest that area V4 actsas a matched filter that enhances the representation of task-relevant information and reducesthe representation of task-irrelevant channels (Figure 2C and (Compte and Wang, 2006;Martinez-Trujillo and Treue, 2004; Rao and Ballard, 1997; Tsotsos et al., 1995)). To test thishypothesis we computed the target similarity index (TSI) for each neuron that showedsignificant spectral tuning modulation during MTS. SRFs estimated using the tuningmodulation model for each of the 31 neurons showing significant tuning modulation appear inSupplementary Figure 1. About 50% of neurons (16/31) have TSIs significantly greater thanzero (p<0.05, jackknifed t-test) while only one TSI is significantly less than zero (p<0.05,
David et al. Page 5
Neuron. Author manuscript; available in PMC 2010 October 1.
NIH
-PA Author Manuscript
NIH
-PA Author Manuscript
NIH
-PA Author Manuscript

jackknifed t-test). The population average TSI of 0.13 is also significantly greater than zero(p<0.01, jackknifed t-test, Figure 6). Thus, V4 neurons tend to shift their tuning toward theattended feature, as predicted by the matched filter hypothesis.
The examples shown in Figure 3 and Figure 4 suggest that during MTS, tuning shifts occurprimarily along the spatial frequency dimension rather than the orientation dimension.However, the specific pattern of tuning modulation across area V4 neurons is diverse (seeSupplementary Figure 1), perhaps due to the substantial diversity of estimated SRFs (David etal., 2006). To determine if matched filter effects occur mainly along the spatial frequencytuning dimension, we computed the TSI for each neuron with significant tuning modulationafter collapsing the SRFs along the spatial frequency or orientation axis. When measuredseparately for these dimensions, the average TSI for spatial frequency tuning is 0.12 and theaverage for orientation tuning is 0.06. Both means are significantly greater than zero (p<0.01,jackknifed t-test). Few individual neurons show significant shifts, which is likely due to thelimited signal-to-noise level available for this more fine-grained analysis.
Feature-based attention modulates spectral tuning in V4 during free-viewing visual searchTo determine whether feature-based attention modulates visual tuning under more naturalisticconditions, we analyzed a separate data set acquired in a free viewing visual search (FVVS)task in which voluntary eye movements were permitted (Figure 1B, (Mazer and Gallant,2003)). Data were analyzed by estimating SRFs for each neuron using the same three modelsused to evaluate the MTS data.
Figure 7 illustrates one V4 neuron whose spectral tuning depended on the search target duringFVVS. The SRF estimated using the no modulation model shows that this neuron is tuned tovertical orientations and low spatial frequencies (92% of total predicted response variance,Figure 7A). Feature-based attention has no significant effect on either response baseline orgain (0% of total predicted response variance, Figure 7B). However, spatial frequency tuningon T1 trials is higher than on T2 trials (8% of total predicted response variance, Figure 7C,p<0.05). Inspection of the power spectra of the target images (Figure 7C, bottom row) revealsthat T1 has more power than T2 at vertical orientations and high spatial frequencies (TSI=0.05,p<0.05, jackknifed t-test). Thus, feature-based attention shifts the tuning of this neuron to moreclosely match the spectral properties of the target during FVVS.
About 45% (39/87) of the V4 neurons in our sample show significant baseline/gain modulationduring FVVS, and 25% (22/87) show significant spectral tuning shifts (p<0.05, jackknifed t-test, Figure 5A). The frequency of occurrence for both types of modulation under these morenatural conditions is not significantly different than for the feature-based attention effects weobserve during MTS (jackknifed t-test). We also measured the fraction of response varianceaccounted for by each of the three attentional modulation models (Figure 5B). For the FVVSdata, the no modulation model accounts for an average of 78% of the total predicted responsevariance. The baseline/gain modulation model accounts for an average of 13%, and the tuningmodulation model accounts for the remaining 9%. These figures are also not significantlydifferent from those observed during MTS.
Eye movements were not controlled during FVVS. Thus it is theoretically possible that themodulation observed during FVVS might reflect eye movement-related differences acrosssearch conditions. To test this possibility, we compared mean fixation duration and saccadelength during different attention conditions (Supplementary Figure 2). We rarely observedsignificant differences in the pattern of eye movements between attention conditions, and thesedifferences were no larger for neurons that showed significant tuning modulation than for thosethat did not show tuning modulation.
David et al. Page 6
Neuron. Author manuscript; available in PMC 2010 October 1.
NIH
-PA Author Manuscript
NIH
-PA Author Manuscript
NIH
-PA Author Manuscript

To determine if the shifts in spectral tuning observed during FVVS are also compatible witha matched filter, we measured TSI for the 22 neurons in our sample that showed significantshifts in spectral tuning. In contrast to what we observed during MTS, only 4 neurons had TSIssignificantly greater than zero (p<0.05, jackknifed t-test) and none were significantly less thezero. The average TSI of 0.007 for the FVVS data was not significantly greater than zero. Thisdifference between the FVVS and MTS data could reflect differences in the effects ofattentional mechanisms between tasks, but it is more likely that it simply reflects the relativelylower signal to noise level in FVVS SRF estimates (because of uncertainty in eye calibration,(Mazer and Gallant, 2003)).
Feature-based and spatial attention are additive and independentPrevious neurophysiological (Hayden and Gallant, 2005; McAdams and Maunsell, 2000;Motter, 1994; Treue and Martinez-Trujillo, 1999) and psychophysical (Rossi and Paradiso,1995; Saenz et al., 2003) studies have reported that feature-based attention is deployedsimultaneously throughout the visual field, independent of the locus of spatial attention. Thesereports suggest that the top-down influences of feature-based and spatial attention arise fromseparate networks that feed back into V4. If the two forms of attention are implemented byseparate networks, then their effects on neuronal responses should be additive and independent.
During MTS, we find that both feature-based and spatial attention effects tend to co-occur inthe same V4 neurons: neurons that are modulated by either feature-based or spatial attentionare also modulated by the other form of attention significantly more often than would beexpected if these two forms of attention operated on random subsets of neurons (Figure 8A,p<0.001). This suggests that some neurons, perhaps those more highly connected to centralareas, are more often influenced by top-down processes, but these effects could still be additiveand independent.
To test for dependency between feature-based and spatial attention directly, we measured theeffect of feature-based attention separately when spatial attention was either directed towardor away from the receptive field. In neurons with high signal to noise, tuning modulation byfeature-based attention is similar when the data are analyzed separately for the two spatialattention conditions (Supplementary Figure 3). The number of neurons in our sample that showsignificant modulation of baseline/gain and spectral tuning by feature-based attention is notsignificantly different when spatial attention is directed toward or away from the receptive field(Figure 8B). Therefore, feature-based and spatial attention tend to affect the same neurons, buttheir effects are largely additive and independent.
If feature-based and spatial attention operate through different feedback networks, they mayalso have different effects on response baseline and gain. To evaluate baseline/gain effects inmore detail, we calculated the average visual response to each distractor during MTS (i.e., theaverage response collapsed across all conditions of feature-based and spatial attention), andplotted the change in response due to either feature-based or spatial attention as a function ofthe visual response (Figure 8C). For feature-based attention, we compared distractor responseson T1 (preferred) trials to T2 (non-preferred) trials. Responses are generally enhanced whenattention is directed to the preferred feature, but the enhancement is not uniform across stimuli.Responses to distractors that elicit larger responses show larger modulation, while responsesto distractors that elicit weak responses are not typically modulated (red curve, Figure 8C). Incontrast, spatial attention modulates responses to all distractors, including those that elicit onlysmall responses (green curve, Figure 8C). This pattern suggests that feature-based attentionmodulates response gain but not response baseline while spatial attention modulates bothbaseline and gain (McAdams and Maunsell, 1999; Reynolds et al., 2000). This differenceprovides further support for the idea that feature-based and spatial attention are implementedin distinct neural circuits.
David et al. Page 7
Neuron. Author manuscript; available in PMC 2010 October 1.
NIH
-PA Author Manuscript
NIH
-PA Author Manuscript
NIH
-PA Author Manuscript
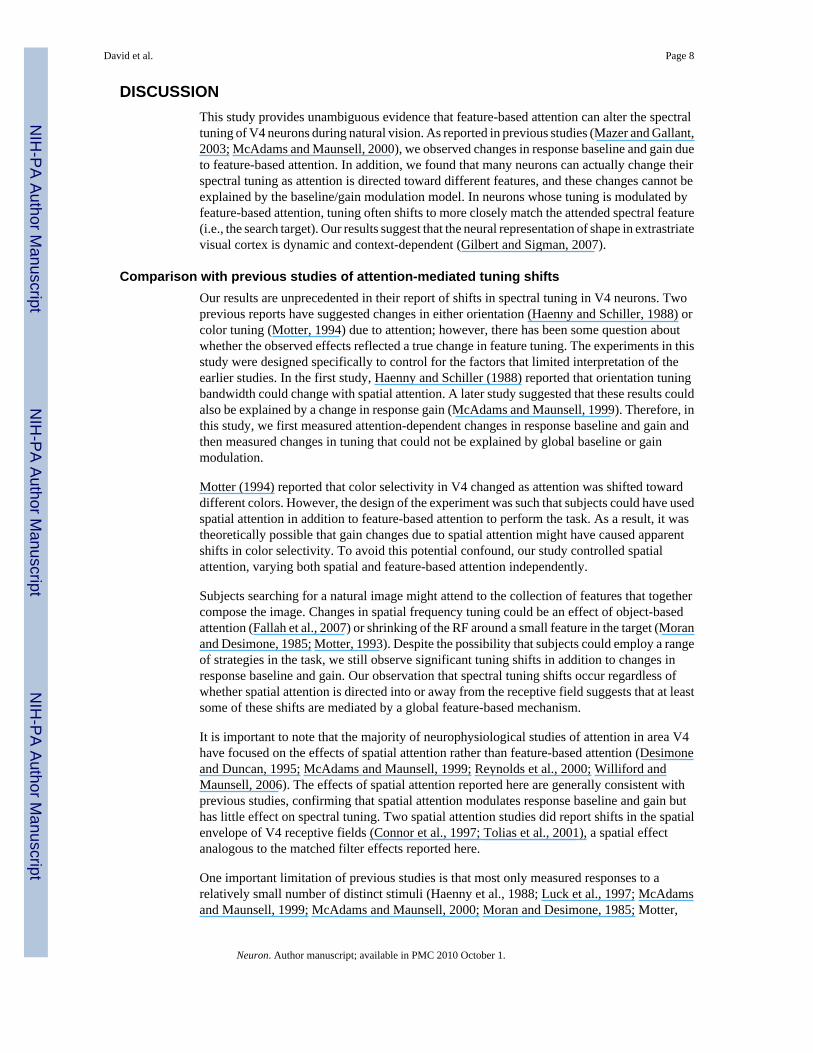
DISCUSSIONThis study provides unambiguous evidence that feature-based attention can alter the spectraltuning of V4 neurons during natural vision. As reported in previous studies (Mazer and Gallant,2003; McAdams and Maunsell, 2000), we observed changes in response baseline and gain dueto feature-based attention. In addition, we found that many neurons can actually change theirspectral tuning as attention is directed toward different features, and these changes cannot beexplained by the baseline/gain modulation model. In neurons whose tuning is modulated byfeature-based attention, tuning often shifts to more closely match the attended spectral feature(i.e., the search target). Our results suggest that the neural representation of shape in extrastriatevisual cortex is dynamic and context-dependent (Gilbert and Sigman, 2007).
Comparison with previous studies of attention-mediated tuning shiftsOur results are unprecedented in their report of shifts in spectral tuning in V4 neurons. Twoprevious reports have suggested changes in either orientation (Haenny and Schiller, 1988) orcolor tuning (Motter, 1994) due to attention; however, there has been some question aboutwhether the observed effects reflected a true change in feature tuning. The experiments in thisstudy were designed specifically to control for the factors that limited interpretation of theearlier studies. In the first study, Haenny and Schiller (1988) reported that orientation tuningbandwidth could change with spatial attention. A later study suggested that these results couldalso be explained by a change in response gain (McAdams and Maunsell, 1999). Therefore, inthis study, we first measured attention-dependent changes in response baseline and gain andthen measured changes in tuning that could not be explained by global baseline or gainmodulation.
Motter (1994) reported that color selectivity in V4 changed as attention was shifted towarddifferent colors. However, the design of the experiment was such that subjects could have usedspatial attention in addition to feature-based attention to perform the task. As a result, it wastheoretically possible that gain changes due to spatial attention might have caused apparentshifts in color selectivity. To avoid this potential confound, our study controlled spatialattention, varying both spatial and feature-based attention independently.
Subjects searching for a natural image might attend to the collection of features that togethercompose the image. Changes in spatial frequency tuning could be an effect of object-basedattention (Fallah et al., 2007) or shrinking of the RF around a small feature in the target (Moranand Desimone, 1985; Motter, 1993). Despite the possibility that subjects could employ a rangeof strategies in the task, we still observe significant tuning shifts in addition to changes inresponse baseline and gain. Our observation that spectral tuning shifts occur regardless ofwhether spatial attention is directed into or away from the receptive field suggests that at leastsome of these shifts are mediated by a global feature-based mechanism.
It is important to note that the majority of neurophysiological studies of attention in area V4have focused on the effects of spatial attention rather than feature-based attention (Desimoneand Duncan, 1995; McAdams and Maunsell, 1999; Reynolds et al., 2000; Williford andMaunsell, 2006). The effects of spatial attention reported here are generally consistent withprevious studies, confirming that spatial attention modulates response baseline and gain buthas little effect on spectral tuning. Two spatial attention studies did report shifts in the spatialenvelope of V4 receptive fields (Connor et al., 1997; Tolias et al., 2001), a spatial effectanalogous to the matched filter effects reported here.
One important limitation of previous studies is that most only measured responses to arelatively small number of distinct stimuli (Haenny et al., 1988; Luck et al., 1997; McAdamsand Maunsell, 1999; McAdams and Maunsell, 2000; Moran and Desimone, 1985; Motter,
David et al. Page 8
Neuron. Author manuscript; available in PMC 2010 October 1.
NIH
-PA Author Manuscript
NIH
-PA Author Manuscript
NIH
-PA Author Manuscript

1993; Reynolds et al., 2000). When using small stimulus sets, tuning shifts that do not alignclosely with the dimension being probed might be missed. In fact, a shift along orthogonal,unprobed dimensions will appear as a change in response baseline or gain. Our study wasdesigned to increase the likelihood of identifying tuning shifts by measuring responses to alarge number of multi-dimensional stimuli and by characterizing tuning to both orientation andspatial frequency.
Despite the greater sensitivity to tuning shifts provided by our technique, the magnitude andfrequency of spectral tuning shifts reported here represent a lower bound on the true magnitudeand frequency with which they occur during natural vision. The SRF provides an effective,second-order model of neuronal shape selectivity in area V4 (David et al., 2006), but V4neurons are also tuned to features not captured by the SRF (Cadieu et al., 2007; Desimone andSchein, 1987; Gallant et al., 1996). Tuning along these unmodeled dimensions might also bemodulated by attention, but they would appear to be changes in response baseline or gain. Thusour measurements of baseline and gain modulation may partially reflect changes in tuningoutside the scope of the SRF. Our study also examined only a relatively small number offeature-based attention conditions, compared to the vast number of possible conditions, andtarget features were chosen independently of the tuning preferences of the neurons beingstudied. Exploration of a wider range of attention states and tailoring target features to be at ornear preferred tuning is likely to reveal additional tuning modulation.
Tuning shifts may be conferred by gain changes in more peripheral visual areasMost previous neurophysiological studies of attention in V4 have reported modulation ofbaseline, gain and contrast response (Desimone and Duncan, 1995; McAdams and Maunsell,1999; Reynolds et al., 2000; Williford and Maunsell, 2006). These findings are consistent withthe idea that neurons in sensory cortex function as labeled lines that encode input featuresconsistently, regardless of the state of attention. Such modulation is well described by thefeature-similarity gain model (Maunsell and Treue, 2006; Treue and Martinez-Trujillo,1999), which holds that neurons increase their gain when attention is directed to their preferredfeature or location. However, the feature-similarity gain model does not account for the changeswe observe in the spectral tuning profiles of individual neurons that violate the constraints ofa labeled line.
Modulation of spectral tuning requires a feedback mechanism capable of adjusting the effectiveweights of synapses that provide visual input to V4 neurons. One computational modelproposes that tuning shifts are mediated by top-down feedback signals that increase the gainof neurons whose tuning matches the target of attention (Compte and Wang, 2006). (Thispattern of gain change is similar to that proposed by the feature-similarity gain model.)Increasing the gain of this specific subpopulation of neurons will cause downstream neuronsto shift their tuning toward the target of attention. The gain changes we observe for both feature-based and spatial attention are compatible with the first stage of this model. We find thatneurons respond more strongly when attention is directed to the preferred feature (i.e., the targeteliciting the stronger response) or the preferred spatial location (i.e. into the receptive field,and see (Luck et al., 1997; Martinez-Trujillo and Treue, 2004; McAdams and Maunsell,1999; Mehta et al., 2000)). The shifts we observe in spectral tuning are compatible with thesecond stage of this model. Neurons tend to shift their tuning to match the attended feature, aspredicted for the downstream neural population if response gain is enhanced in the subset ofinput neurons that prefer the attended feature.
The tuning shifts effected by feature-based attention occur independently of spatial attention(Hayden and Gallant, 2005; McAdams and Maunsell, 2000; Rossi and Paradiso, 1995; Saenzet al., 2003; Treue and Martinez-Trujillo, 1999), suggesting that these two forms of attentionoperate through different feedback networks (Maunsell and Treue, 2006). Area V4 is organized
David et al. Page 9
Neuron. Author manuscript; available in PMC 2010 October 1.
NIH
-PA Author Manuscript
NIH
-PA Author Manuscript
NIH
-PA Author Manuscript
retinotopically, and many previous studies have shown that spatial attention only modulatesresponses near a single retinotopic location (Desimone and Duncan, 1995; McAdams andMaunsell, 1999; Reynolds et al., 2000; Williford and Maunsell, 2006). The distribution ofneurons tuned for different spectral features within area V4 is not known, but it is likely thateach spectral feature is represented by an anatomically distributed set of neurons. Feedbacksignals for feature-based attention that modulate tuning must somehow target just those neuronsthat represent relevant spectral features.
Area V4 and the matched filter hypothesisOur data suggest that area V4 can function as an attention-mediated matched filter that discardsirrelevant information about the stimulus and enhances the representation of information mostrelevant to the task at hand. This idea is consistent with proposals from computational modelingstudies (Compte and Wang, 2006; Tsotsos et al., 1995) and with Kalman filtering schemes forsignal detection (Rao and Ballard, 1997). In the most extreme theoretical case, individualneurons could act as matched filters and shift their tuning to match the target exactly. However,our data show that feature-based attention does not completely change the tuning properties ofneurons in V4, but merely shifts tuning toward the attended feature. This is not unexpectedgiven the finite number of synaptic connections providing input to each V4 neuron, and therelatively fast timescale of attentional modulation (Olshausen et al., 1993). Therefore, singleV4 neurons are not perfect matched filters, but a population of these neurons could functiontogether as a matched filter (or could contribute to a complete matched filter at more centralstages of processing).
The effects of spatial attention in V4 are also compatible with a matched filter. If spatialattention engages a matched filter, then the spatial envelope of receptive fields should shifttoward the attended location without changing spectral tuning. Previous studies havedemonstrated that spatial attention can indeed modulate the spatial receptive field envelope(Connor et al., 1996; Connor et al., 1997; Tolias et al., 2001), and we report here that spatialattention has little effect on spectral tuning. Taken together, these results suggest that shiftsmight occur only along feature and spatial dimensions only when they match, respectively, thetarget of feature-based and spatial attention.
Although we did observe shifts in spectral tuning in the FVVS data, we did not observesignificant evidence for a matched filter. This difference from the MTS data likely reflects thefact that the signal-to-noise level of the MTS data is much higher than that of FVVS (becauseof the difficulty of tracking eye position with complete accuracy). However, we cannot ruleout the possibilities that this difference instead reflects a strategy unique to free-viewing visualsearch or the influence of eye movement control signals that attenuate the effects of feature-based attention.
The experiments reported here used targets and distractors selected from a pool of complexnatural images. In this paradigm, the target can be identified by one of many features thatdistinguish it from the distractors, and a matched filter could shift tuning toward any of thesedistinct features. During MTS, matched filter effects were stronger along the dimension ofspatial frequency, which suggests that subjects were attending preferentially to the spatialfrequency spectrum of the target. The tendency to shift spatial frequency tuning rather thanorientation tuning may simply reflect the strategy used during this specific task, or it mightreflect a more fundamental constraint on how spectral tuning can be modulated. This questioncan be answered with studies using simpler stimuli that more strictly constrain the task-relevantfeatures.
David et al. Page 10
Neuron. Author manuscript; available in PMC 2010 October 1.
NIH
-PA Author Manuscript
NIH
-PA Author Manuscript
NIH
-PA Author Manuscript

ConclusionThe functional properties of V4 neurons are typically described in terms of static, feed-forwardmodels compatible with the labeled line hypothesis (Cadieu et al., 2007; David et al., 2006;Pasupathy and Connor, 1999). Our findings suggest that such models are incomplete, and thatthe tuning properties of V4 neurons change dynamically to meet behavioral demands. Area V4is critically involved in intermediate stages of visual processing such as figure-groundsegmentation, grouping, and pattern recognition (Gallant et al., 2000; Schiller and Lee,1991), and it is likely that dynamic tuning shifts in V4 play a critical role in these processes.Just as individual V4 neurons participate in representing visual objects by decomposing theminto different dimensions, they participate in attentional selection by modulating their tuningalong those dimensions.
EXPERIMENTAL PROCEDURESData collection
All procedures were in accordance with the NIH Guide for the Care and Use of LaboratoryAnimals and approved by the Animal Care and Use Committee at the University of California,Berkeley. Single neuron activity was recorded from area V4 of four macaques (Macacamulatta), two while performing a match-to-sample task (MTS, (Hayden and Gallant, 2005))and the other two while performing a free-viewing visual search task (FVVS, (Mazer andGallant, 2003)). Behavioral control, stimulus presentation and data collection were performedusing custom software running on Linux microcomputers. Eye movements were recorded usingan infrared eye tracker (500 Hz, Eyelink II, SR Research, Osgoode, ON, Canada). Neuronalactivity was recorded using high impedance (10–25 MΩ) epoxy-coated tungstenmicroelectrodes (Frederick Haer Company, Bowdoin, ME). Single neurons were isolated andspike events were recorded with 1 ms resolution using a dedicated multichannel recordingsystem (MAP, Plexon, Dallas, TX).
At the beginning of each recording session, spatial receptive fields were determined while eachanimal performed a fixation task using an automated mapping procedure (Mazer and Gallant,2003). Reverse correlation was used to generate spatial kernels from responses to sparse noise,which were fit with a two-dimensional Gaussian to estimate RF location (mean) and size(standard deviation).
Match-to-sample task—The MTS task required the identification of a specific naturalimage patch in a stream of natural image patches at one of two spatial locations during fixation(see Figure 1A and (Hayden and Gallant, 2005)). On each trial, a cue indicated one of twopossible target natural images (feature cue) and to a location either within the RF or in theopposite quadrant of the visual field (spatial cue). New target images were chosen each daybefore beginning neurophysiological recordings, in order to optimize behavioral performance.Therefore, responses to target stimuli varied substantially across the neurons in our sample.Following a delay period, two rapid, randomly ordered sequences of images (~4 Hz) appearedat the two locations. Subjects responded to the reappearance of the target at the cued locationby releasing a bar. Frequent spatial and feature catch stimuli were presented to ensure thatsubjects were performing as expected. For each neuron, we obtained responses to a large setof natural images (600–1200 distinct images) in each of four crossed attention conditions (i.e.,two conditions of feature-based attention and two conditions of spatial attention).
Search targets and distractors were circular natural image patches extracted at random from alibrary of black and white digital photographs (Corel Inc., Eden Prairie, MN). Patches werecropped to the size of the receptive field of each recorded neuron, and the outer 10% of eachpatch was blended smoothly into the gray background.
David et al. Page 11
Neuron. Author manuscript; available in PMC 2010 October 1.
NIH
-PA Author Manuscript
NIH
-PA Author Manuscript
NIH
-PA Author Manuscript

Free viewing visual search task—The FVVS task required detection of a specific naturalimage patch embedded in a random array of visually similar distractors, with no constraintson eye movements (see Figure 1B and (Mazer and Gallant, 2003)). Trials were cued by onsetof a textured 1/f2-power random noise pattern that served as the background pattern for thesearch task. Each trial was initiated when the animal grabbed the capacitive touch bar. A searchtarget was then presented for 2–5 s at the center of the display. Animals were allowed to inspectthe target using voluntary eye movements. After a 2–4 s delay, an array of 9–25 potential matchstimuli appeared, and this remained visible for 2–5 s. If the array contained the target the animalhad to release the touch bar within 500 ms after array offset in order to receive a reward. (Theywere not required to indicate the position of the target, but only its presence.) If the array didnot contain the target then the animal had to continue to hold the bar until another array appearedafter a 2–3 s delay. Up to seven different arrays could occur in any single trial. The temporaland spatial position of the target was selected at random before each trial, as were the positionsof all distractors.
Search targets and distractors were circular image patches extracted at random from the samelibrary of digital photographs used for MTS. (One photograph was chosen as the image patchsource for each recording session.) Patches were cropped to the size of the receptive field ofeach recorded neuron, and the outer 10% of each patch was blended smoothly into thebackground pattern. Search array spacing was adjusted so that fixation of one patch placed adifferent patch close to the center of the receptive field of the recorded cell. For parafovealneurons (<2 deg eccentricity) patch size was adjusted so that patches encompassed both theRF and the fovea, and array spacing was adjusted to prevent overlap of the patches.
We did not control spatial attention during FVVS. Instead, we controlled feature-basedattention by varying the search target from trial to trial and assumed that spatial attention effectswere averaged out over the large number of unconstrained eye movements. SRFs wereestimated according to the no modulation, baseline/gain modulation, and tuning modulationmodels using the same procedure as for the MTS data. Stimuli for SRF estimation weregenerated by using measured eye movements to reconstruct the spatio-temporal visual inputstream that fell in the receptive field during the search phase of the FVVS task.
Characterization of attention-dependent visual tuning propertiesNeurons in area V4 exhibit several nonlinear response properties including phase invarianceand position invariance (Desimone and Schein, 1987; Gallant et al., 1996). Therefore, toaccurately characterize the visual tuning of V4 neurons we applied a nonlinear spatial Fourierpower transformation to each stimulus (David et al., 2006). This transform discards absolutespatial information and makes the stimulus-response relationship more linear (Wu et al.,2006). We call the linear mapping from power-transformed stimulus to neural response thespectral receptive field (SRF). We assessed the effects of attention on neural responses bytesting whether the SRF changed with attention conditions.
The no modulation model assumes that attention does not have any effect on visual responses.It was fit by estimating the SRF with all the data acquired during behavior, without consideringthe target identity or spatial position. The relationship between the stimulus and response isdescribed by the SRF, h0,
David et al. Page 12
Neuron. Author manuscript; available in PMC 2010 October 1.
NIH
-PA Author Manuscript
NIH
-PA Author Manuscript
NIH
-PA Author Manuscript

where r(t) is the firing rate 50–200 ms after the onset of stimulus frame t, and ŝ(ωx,ωy,t) is thetwo-dimensional spatial Fourier transform (i.e., Fourier power spectrum) of the stimulus in thereceptive field. The constant, d0 describes the baseline firing rate.
The baseline/gain modulation model assumes that attention can change the response baselineand/or gain, but that it does not change tuning (i.e., the structure of the SRF). This model wasfit by introducing a state variable, a, corresponding to the state of attention (i.e., feature-basedattention to target T1 or T2 or spatial attention inside or outside the RF),
where h0, is the SRF fit from the no modulation model and d(a), baseline response, and g(a),global gain are free to vary with attention state.
The tuning modulation model assumes that attention can change the spectral tuning profile ofa neuron. In addition to response baseline and gain, the SRF, h(ωx,ωy,a), is fit separately foreach attention state,
Model fitting procedure—Each SRF was estimated using a normalized reverse correlationprocedure that finds the best linear mapping between stimulus and response (David et al.,2006; David et al., 2004; Theunissen et al., 2001). For the tuning modulation model, SRFswere estimated using the same method as for the no modulation model, but the data used to fiteach SRF were drawn only from individual attention conditions. SRFs were estimated onlyfrom responses to distractors (i.e., excluding target and catch stimuli) recorded during correcttrials; responses to targets and responses recorded on error trials were excluded. To eliminatepotential bias in SRFs estimated under different attention conditions, the same regularizationwas applied to all SRFs for a single neuron. In the MTS experiment, where stimuli could becontrolled exactly, the same distractors were used in each of the four behavioral conditions,eliminating the possibility of sampling bias.
Our model fitting procedure can be viewed as stepwise regression, because each successivelymore complicated model encompasses all of the simpler models. For each neuron, we used across-validation procedure to determine whether each model represented a significantimprovement over the simpler alternatives. Each model was fit using only 95% of the availabledata, and the resulting model was used to predict responses in the remaining 5%. Modelperformance was quantified by computing the squared correlation coefficient (Pearson’s r)between predicted and observed responses. Statistical significance of modulation by attentionwas assessed by a jackknifing procedure in which the estimation-validation analysis wasrepeated 20 times, each time reserving a different 5% of data for validation. A model was takento provide significantly improved predictions if its prediction score was significantly greater(p<0.05) than the simpler model.
Significance tests—Unless otherwise specifically mentioned, we used a one-tailed,jackknifed t-test to verify the statistical significance of our findings (Efron and Tibshirani,1986). In many cases, a traditional t-test is sufficient to determine whether two mean valuesare significantly different. However, the traditional t-test assumes that individual
David et al. Page 13
Neuron. Author manuscript; available in PMC 2010 October 1.
NIH
-PA Author Manuscript
NIH
-PA Author Manuscript
NIH
-PA Author Manuscript

measurements follow a Gaussian distribution, and estimates of standard error will be biased ifthe distributions are not Gaussian. The jackknifed t-test uses a bootstrapping procedure thatavoids potential bias from non-Gaussian distributions in measurements of standard error.
Target similarity index—To determine if SRFs estimated using the tuning modulationmodel to shift their tuning toward the target of feature-based attention, we measured a targetsimilarity index (TSI) for each neuron. The TSI is the change in correlation (i.e., normalizeddot product) between the SRF and the spectra of the two target images on attended versus non-attended trials,
Here, t1 and t2 are the Fourier power spectra of the two target images, T1 and T2, and h1 andh2 are SRFs estimated separately under each feature-based attention condition. Both the powerspectra and the SRFs are normalized so that their standard deviation is 1. The dot indicatespoint-wise multiplication and then summing over spatial frequencies. Index values greater thanzero indicate SRFs that more closely match the spectrum of T1 on trials when feature-basedattention is directed toward T1 and/or more closely match the spectrum of T2 on trials whenattention is directed toward T2. A value of 1 indicates a perfect match between SRF and targetin both attention conditions.
To study spectral tuning shifts in more detail, we also computed the TSI separately fororientation and spatial frequency tuning. SRFs and target power spectra were decomposed bysingular value decomposition into orientation and spatial frequency curves that best predictedthe full two-dimensional spectrum (David et al., 2006). The same equation was then used tocompute TSI values separately for each of these tuning curves.
Data preprocessing—To prepare visual stimuli for analysis, the stimulus falling in thereceptive field was downsampled to 20 × 20 pixels, multiplied by a Hanning window withradius equal to the receptive field (to reduce edge artifacts), and transformed into the Fourierpower domain by computing and squaring the two-dimensional FFT (David et al., 2006). Theresponse to each stimulus frame was taken as the spike rate (spikes/sec) 50–200 ms afterstimulus onset.
To analyze data acquired in the FVVS task, we first had to determine what visual stimuli fellin and around the receptive field during each fixation. Eye calibration data (Mazer and Gallant,2003) were used to determine where each animal was looking at every moment. Fixations andsaccades were distinguished by smoothing and differentiating measured eye velocity; a fixationwas defined as any period where the eye remained stationary for 100 ms. Eye movementstatistics for an example behavior session appear in Supplementary Figure 2.
Supplementary MaterialRefer to Web version on PubMed Central for supplementary material.
AcknowledgmentsThis work was supported by grants from the National Science Foundation (S.V.D.) and the National Eye Institute(J.L.G.). The authors would like to thank Kate Gustavsen, Kathleen Hansen, and two anonymous reviewers for helpfulcomments on the manuscript.
David et al. Page 14
Neuron. Author manuscript; available in PMC 2010 October 1.
NIH
-PA Author Manuscript
NIH
-PA Author Manuscript
NIH
-PA Author Manuscript

REFERENCESAdrian ED, Matthews R. The action of light on the eye: Part I. The discharge of impulses in the optic
nerve and its relation to the electric changes in the retina. J Physiol 1927;63:378–414. [PubMed:16993896]
Barlow HB. Single units and sensation: a neuron doctrine for perceptual psychology? Perception1972;1:371–394. [PubMed: 4377168]
Cadieu C, Kouh M, Pasupathy A, Connor C, Riesenhuber M, Poggio TA. A Model of V4 Shape Selectivityand Invariance. J Neurophysiol. 2007
Carrasco M, Ling S, Read S. Attention alters appearance. Nat Neurosci 2004;7:308–313. [PubMed:14966522]
Compte A, Wang XJ. Tuning curve shift by attention modulation in cortical neurons: a computationalstudy of its mechanisms. Cereb Cortex 2006;16:761–778. [PubMed: 16135783]
Connor CE, Gallant JL, Preddie DC, Van Essen DC. Responses in area V4 depend on the spatialrelationship between stimulus and attention. Journal of Neurophysiology 1996;75:1306–1308.[PubMed: 8867139]
Connor CE, Preddie DC, Gallant JL, Van Essen DC. Spatial attention effects in macaque area V4. Journalof Neuroscience 1997;17:3201–3214. [PubMed: 9096154]
David SV, Gallant JL. Predicting neuronal responses during natural vision. Network 2005;16:239–260.[PubMed: 16411498]
David SV, Hayden BY, Gallant JL. Spectral receptive field properties explain shape selectivity in areaV4. J Neurophysiol 2006;96:3492–3505. [PubMed: 16987926]
David SV, Vinje WE, Gallant JL. Natural stimulus statistics alter the receptive field structure of V1neurons. J Neurosci 2004;24:6991–7006. [PubMed: 15295035]
Desimone R, Duncan J. Neural mechanisms of selective visual attention. Annual Review of Neuroscience1995;18:193–222.
Desimone R, Schein SJ. Visual properties of neurons in area V4 of the macaque: Sensitivity to stimulusform. Journal of Neurophysiology 1987;57:835–868. [PubMed: 3559704]
Efron B, Tibshirani R. Bootstrap methods for standard errors, confidence intervals, and other measuresof statistical accuracy. Statistical Science 1986;1:54–77.
Fallah M, Stoner GR, Reynolds JH. Stimulus-specific competitive selection in macaque extrastriate visualarea V4. Proc Natl Acad Sci U S A 2007;104:4165–4169. [PubMed: 17360494]
Gallant JL, Braun J, Van Essen DC. Selectivity for polar, hyperbolic, and Cartesian gratings in macaquevisual cortex. Science 1993;259:100–103. [PubMed: 8418487]
Gallant JL, Connor CE, Rakshit S, Lewis JW, Van Essen DC. Neural Responses to Polar, Hyperbolic,and Cartesian Gratings in Area V4 of the Macaque Monkey. Journal of Neurophysiology1996;76:2718–2739. [PubMed: 8899641]
Gallant JL, Shoup RE, Mazer JA. A human extrastriate cortical area functionally homologous to MacaqueV4. Neuron 2000;27:227–235. [PubMed: 10985344]
Gattass R, Souza APB, Gross CG. Visuotopic organization and extent of V3 and V4 of the macaque.Journal of Neuroscience 1988;8:1831–1844. [PubMed: 3385477]
Gilbert CD, Sigman M. Brain states: top-down influences in sensory processing. Neuron 2007;54:677–696. [PubMed: 17553419]
Haenny PE, Maunsell JHR, Schiller PH. State dependent activity in monkey visual cortex. II. Retinal andextraretinal factors in V4. Experimental Brain Research 1988;69:245–259.
Haenny PE, Schiller PH. State dependent activity in monkey visual cortex. 1. Single cell activity in V1and V4 on visual tasks. Experimental Brain Research 1988;69:225–244.
Hayden BY, Gallant JL. Time course of attention reveals different mechanisms for spatial and feature-based attention in area V4. Neuron 2005;47:637–643. [PubMed: 16129394]
Lee DK, Itti L, Koch C, Braun J. Attention activates winner-take-all competition among visual filters.Nature Neuroscience 1999;2:375–381.
Lu ZL, Dosher BA. Spatial attention excludes external noise without changing the spatial frequencytuning of the perceptual template. J Vis 2004;4:955–966. [PubMed: 15595898]
David et al. Page 15
Neuron. Author manuscript; available in PMC 2010 October 1.
NIH
-PA Author Manuscript
NIH
-PA Author Manuscript
NIH
-PA Author Manuscript

Luck SJ, Chelazzi L, Hillyard SA, Desimone R. Neural mechanisms of spatial selective attention in areasV1, V2 and V4 of macaque visual cortex. Journal of Neurophysiology 1997;77:24–42. [PubMed:9120566]
Marr, D. Vision. San Francisco: W.H. Freeman; 1982.Martinez-Trujillo JC, Treue S. Feature-based attention increases the selectivity of population responses
in primate visual cortex. Curr Biol 2004;14:744–751. [PubMed: 15120065]Maunsell JH, Cook EP. The role of attention in visual processing. Philos Trans R Soc Lond B Biol Sci
2002;357:1063–1072. [PubMed: 12217174]Maunsell JH, Treue S. Feature-based attention in visual cortex. Trends Neurosci 2006;29:317–322.
[PubMed: 16697058]Mazer JA, Gallant JL. Goal-related activity in V4 during free viewing visual search. Evidence for a ventral
stream visual salience map. Neuron 2003;40:1241–1250. [PubMed: 14687556]Mazer JA, Vinje WE, McDermott J, Schiller PH, Gallant JL. Spatial Frequency and Orientation Tuning
Dynamics in Area V1. Proceedings of the National Academy of Sciences USA 2002;99:1645–1650.McAdams CJ, Maunsell JHR. Effects of attention on orientation-tuning functions of single neurons in
macaque cortical area V4. Journal of Neuroscience 1999;19:431–441. [PubMed: 9870971]McAdams CJ, Maunsell JHR. Attention to both space and feature modulates neuronal responses in
macaque area V4. Journal of Neurophysiology 2000;83:1751–1755. [PubMed: 10712494]Mehta AD, Ulbert I, Schroeder CE. Intermodal selective attention in monkeys. I: distribution and timing
of effects across visual areas. Cereb Cortex 2000;10:343–358. [PubMed: 10769247]Moran J, Desimone R. Selective attention gates visual processing in the extrastriate cortex. Science
1985;229:782–784. [PubMed: 4023713]Motter BC. Focal attention produces spatially selective processing in visual cortical areas V1, V2 and
V4 in the presence of competing stimuli. Journal of Neurophysiology 1993;70:909–919. [PubMed:8229178]
Motter BC. Neural correlates of attentive selection for color or luminance in extrastriate area V4. Journalof Neuroscience 1994;14:2178–2189. [PubMed: 8158264]
Ogawa T, Komatsu H. Target selection in area V4 during a multidimensional visual search task. JNeurosci 2004;24:6371–6382. [PubMed: 15254093]
Olshausen BA, Anderson CE, Van Essen DC. A neural model of visual attention and invariant patternrecognition based on dynamic rerouting of information. Journal of Neuroscience 1993;13:4700–4719. [PubMed: 8229193]
Pasupathy A, Connor CE. Responses to contour features in macaque area V4. Journal of Neurophysiology1999;82:2490–2502. [PubMed: 10561421]
Rao RPN, Ballard DH. Dynamic model of visual recognition predicts neural response properties in thevisual cortex. Neural Computation 1997;9:721–763. [PubMed: 9161021]
Reynolds JH, Chelazzi L. Attentional modulation of visual processing. Annu Rev Neurosci 2004;27:611–647. [PubMed: 15217345]
Reynolds JH, Pasternak T, Desimone R. Attention increases sensitivity of V4 neurons. Neuron2000;26:703–714. [PubMed: 10896165]
Rossi AF, Paradiso MA. Feature-specific effects of selective visual attention. Vision Res 1995;35:621–634. [PubMed: 7900301]
Saenz M, Buracas GT, Boynton GM. Global feature-based attention for motion and color. Vision Res2003;43:629–637. [PubMed: 12604099]
Schiller PH, Lee K. The role of primate extrastriate area V4 in vision. Science 1991;251Theunissen FE, David SV, Singh NC, Hsu A, Vinje WE, Gallant JL. Estimating spatial temporal receptive
fields of auditory and visual neurons from their responses to natural stimuli. Network: Computationin Neural Systems 2001;12:289–316.
Tolias AS, Moor T, Smirnakis SM, Tehovnik EJ, Siapas AG, Schiller PH. Eye movements modulatevisual receptive fields of V4 neurons. Neuron 2001;29:757–767. [PubMed: 11301034]
Treue S, Martinez-Trujillo JC. Feature-based attention influences motion processing gain in macaquevisual cortex. Nature 1999;399:575–578. [PubMed: 10376597]
David et al. Page 16
Neuron. Author manuscript; available in PMC 2010 October 1.
NIH
-PA Author Manuscript
NIH
-PA Author Manuscript
NIH
-PA Author Manuscript
Tsotsos JM, Culhane SM, Wai WYK, Lai Y, Davis N, Nuflo F. Modeling visual attention via selectivetuning. Artificial Intelligence 1995;78:507–545.
Williford T, Maunsell JH. Effects of spatial attention on contrast response functions in macaque area V4.J Neurophysiol 2006;96:40–54. [PubMed: 16772516]
Womelsdorf T, Anton-Erxleben K, Pieper F, Treue S. Dynamic shifts of visual receptive fields in corticalarea MT by spatial attention. Nat Neurosci 2006;9:1156–1160. [PubMed: 16906153]
Woolley SM, Fremouw TE, Hsu A, Theunissen FE. Tuning for spectro-temporal modulations as amechanism for auditory discrimination of natural sounds. Nat Neurosci 2005;8:1371–1379.[PubMed: 16136039]
Wu MC-K, David SV, Gallant JL. Complete functional characterization of sensory neurons by systemidentification. Annual Review of Neuroscience 2006;12:477–505.
David et al. Page 17
Neuron. Author manuscript; available in PMC 2010 October 1.
NIH
-PA Author Manuscript
NIH
-PA Author Manuscript
NIH
-PA Author Manuscript

Figure 1.A, Match-to-sample (MTS) task. Fixation was maintained at the center of the screen while arandom, rapid sequence of natural images was presented. Spatial and feature-based attentionwere controlled independently on each trial: a spatial cue directed attention toward the receptivefield of a V4 neuron (dashed box, not shown during the experiment) or toward the oppositehemifield; an image cue indicated the target. The task required a response when the cued targetimage appeared at the cued spatial location. B, Free-viewing visual search (FVVS) task. Eyemovements were permitted while a random sequence of natural image arrays was shown.Feature-based attention was controlled with an image cue before array onset. (During the actualexperiment both the image patches and the background texture were shown at the same RMScontrast; the contrast of the background has been reduced here for illustrative purposes.) Thetask required a response whenever the sample image appeared in one of the image arrays (blackarrowhead, not shown during the experiment).
David et al. Page 18
Neuron. Author manuscript; available in PMC 2010 October 1.
NIH
-PA Author Manuscript
NIH
-PA Author Manuscript
NIH
-PA Author Manuscript

Figure 2.Alternative models of modulation by attention. A, The no modulation model assumes thatneuronal responses are not affected by attention. The set of Gaussian curves represents thetuning of a population of neurons in an arbitrary stimulus space (horizontal axis). T1 and T2represent two points where attention can be directed in the stimulus space. Tuning curves arethe same whether attention is directed to T1 (top panel) or T2 (bottom panel). B, The baseline/gain modulation model assumes that attention modulates mean responses or response gain butdoes not change tuning. This model is consistent with a labeled line code. C, The tuningmodulation model assumes that attention can shift (or reshape) tuning curves of individual
David et al. Page 19
Neuron. Author manuscript; available in PMC 2010 October 1.
NIH
-PA Author Manuscript
NIH
-PA Author Manuscript
NIH
-PA Author Manuscript

neurons. This model is inconsistent with a labeled line code. If neurons behave as matchedfilters then tuning should shift toward the attended target.
David et al. Page 20
Neuron. Author manuscript; available in PMC 2010 October 1.
NIH
-PA Author Manuscript
NIH
-PA Author Manuscript
NIH
-PA Author Manuscript

Figure 3.Representative V4 neuron in which spectral tuning is modulated by feature-based attentionduring MTS. A, Spectral receptive field (SRF) estimated after averaging over all attentionconditions (the no modulation model). Red regions indicate excitatory orientation and spatialfrequency channels, and blue regions indicate suppressive channels. Contours enclose channelswhose amplitude is one/two standard deviations above/below zero. This neuron is sharplytuned for orientation and broadly tuned for spatial frequency (75–90 deg and 5–10 cyc/RF).B, To test for baseline/gain modulation, responses predicted by the no modulation SRF frompanel A (horizontal axis) are plotted against observed responses (vertical axis) on trials whenthe target was T1 (red) or T2 (black). Solid lines show binned responses and error bars indicate
David et al. Page 21
Neuron. Author manuscript; available in PMC 2010 October 1.
NIH
-PA Author Manuscript
NIH
-PA Author Manuscript
NIH
-PA Author Manuscript
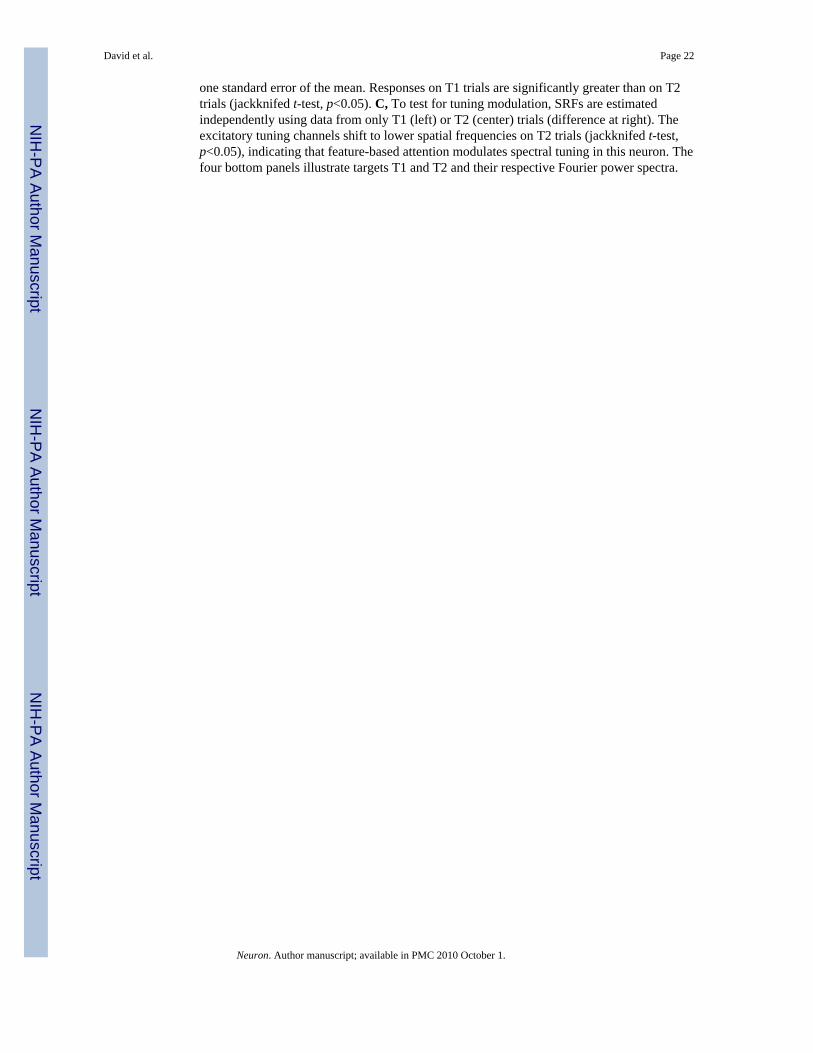
one standard error of the mean. Responses on T1 trials are significantly greater than on T2trials (jackknifed t-test, p<0.05). C, To test for tuning modulation, SRFs are estimatedindependently using data from only T1 (left) or T2 (center) trials (difference at right). Theexcitatory tuning channels shift to lower spatial frequencies on T2 trials (jackknifed t-test,p<0.05), indicating that feature-based attention modulates spectral tuning in this neuron. Thefour bottom panels illustrate targets T1 and T2 and their respective Fourier power spectra.
David et al. Page 22
Neuron. Author manuscript; available in PMC 2010 October 1.
NIH
-PA Author Manuscript
NIH
-PA Author Manuscript
NIH
-PA Author Manuscript

Figure 4.Representative V4 neuron in which spectral tuning is modulated by feature-based attention andresponse baseline/gain is modulated by both feature-based and spatial attention during MTS.Data are plotted as in Figure 3. A, SRF estimated after averaging over all attention conditions(the no modulation model). This neuron is tuned to a broad range of orientations at low spatialfrequencies (0–180 deg and 1–3 cyc/RF). B, Responses on T1 trials are larger than on T2 trials,indicating a significant modulation of baseline/gain by feature-based attention (jackknifed t-test, p<0.05). C, Feature-based attention modulates spectral tuning in this neuron. The lowspatial frequency tuning that appears in the SRF during T1 trials is absent during T2 trials,reflecting a shift in tuning toward higher spatial frequencies (jackknifed t-test, p<0.05). D,
David et al. Page 23
Neuron. Author manuscript; available in PMC 2010 October 1.
NIH
-PA Author Manuscript
NIH
-PA Author Manuscript
NIH
-PA Author Manuscript

Responses when spatial attention is directed into the receptive field are stronger than when itis directed away, indicating a significant modulation of baseline/gain by spatial attention(p<0.05). E, Spatial attention does not modulate spectral tuning in this neuron. Aside from theglobal change in gain also observed in D, the SRF estimated using trials when spatial attentionis directed into the receptive field are not significantly different from those obtained when itis directed away, and not different from the SRF estimated under the no modulation modelshown in panel A.
David et al. Page 24
Neuron. Author manuscript; available in PMC 2010 October 1.
NIH
-PA Author Manuscript
NIH
-PA Author Manuscript
NIH
-PA Author Manuscript
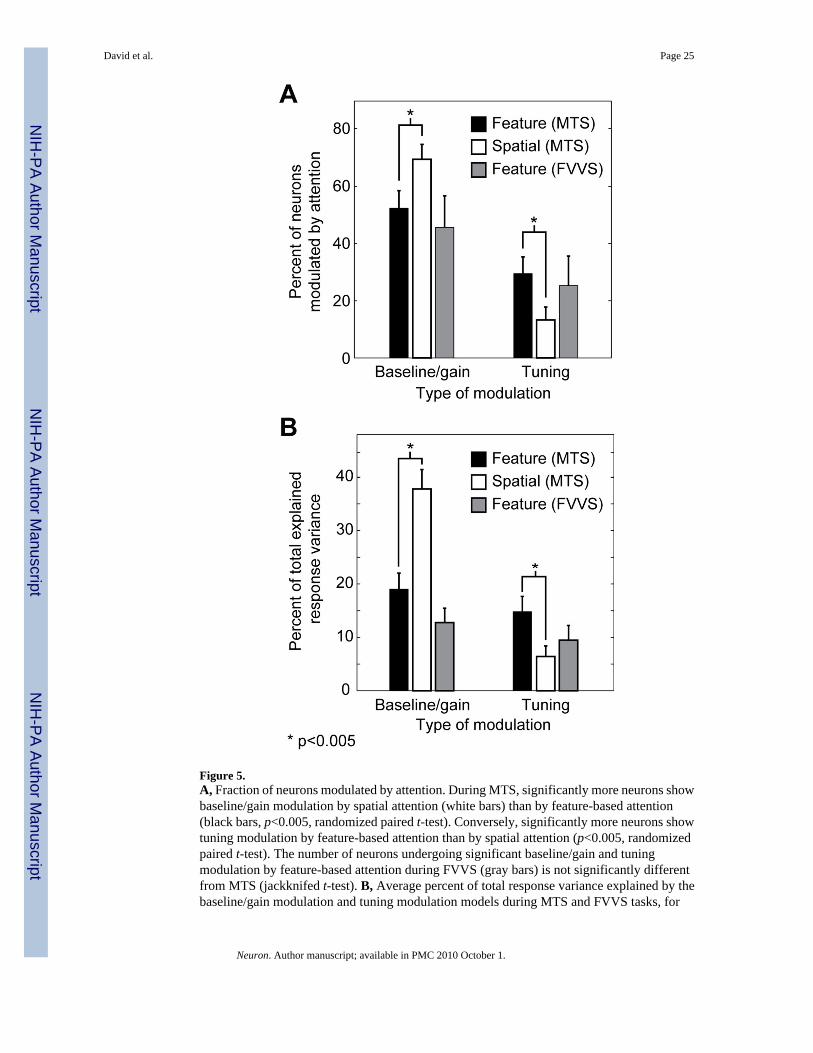
Figure 5.A, Fraction of neurons modulated by attention. During MTS, significantly more neurons showbaseline/gain modulation by spatial attention (white bars) than by feature-based attention(black bars, p<0.005, randomized paired t-test). Conversely, significantly more neurons showtuning modulation by feature-based attention than by spatial attention (p<0.005, randomizedpaired t-test). The number of neurons undergoing significant baseline/gain and tuningmodulation by feature-based attention during FVVS (gray bars) is not significantly differentfrom MTS (jackknifed t-test). B, Average percent of total response variance explained by thebaseline/gain modulation and tuning modulation models during MTS and FVVS tasks, for
David et al. Page 25
Neuron. Author manuscript; available in PMC 2010 October 1.
NIH
-PA Author Manuscript
NIH
-PA Author Manuscript
NIH
-PA Author Manuscript

those neurons that show any significant effect of attention (MTS: 84/105; FVVS: 55/87). Theremaining portion of response variance is explained by the no modulation model.
David et al. Page 26
Neuron. Author manuscript; available in PMC 2010 October 1.
NIH
-PA Author Manuscript
NIH
-PA Author Manuscript
NIH
-PA Author Manuscript

Figure 6.Evidence for a matched filter in V4. Histogram plots the tuning shift index (TSI) for neuronsthat show significant tuning modulation by feature-based attention during MTS (n=31/105).Index values greater than zero indicate that spectral tuning shifts to match the spectrum oftarget images under different feature-based attention conditions. A value of 1 indicates a perfectmatch between SRF and target spectrum in both attention conditions. Black bars indicate TSIssignificantly greater than 0 (16/31 neurons, p<0.05, jackknifed t-test), and gray bars indicateTSIs significantly less than 0 (1/31 neurons, p<0.05). The mean TSI of 0.13 is significantlygreater that zero (p<0.01, jackknifed t-test), indicating that tuning tends to shift to match thespectrum of the target. This increase in TSI is what would be expected if feature-based attentionin area V4 implemented a matched filter.
David et al. Page 27
Neuron. Author manuscript; available in PMC 2010 October 1.
NIH
-PA Author Manuscript
NIH
-PA Author Manuscript
NIH
-PA Author Manuscript

Figure 7.Representative V4 neuron in which spectral tuning is modulated by feature-based attentionduring FVVS. Data are plotted as in Figure 3. A, SRF estimated after averaging over bothtargets (the no modulation model). This neuron is tuned to is tuned to vertical orientations andlow spatial frequencies (170-30 deg and 1–4 cyc/RF). B, Responses on T1 and T2 trials areequal, indicating that baseline/gain are not modulated by feature-based attention. C, Feature-based attention modulates spectral tuning in this neuron. The excitatory tuning channels areshifted significantly to lower spatial frequencies on T2 trials than on T1 trials (jackknifed t-test, p<0.05).
David et al. Page 28
Neuron. Author manuscript; available in PMC 2010 October 1.
NIH
-PA Author Manuscript
NIH
-PA Author Manuscript
NIH
-PA Author Manuscript

Figure 8.Effects of feature-based and spatial attention are additive and independent. A, Venn diagramsummarizes the overlap of neurons with significant modulation by feature-based attention(baseline/gain and tuning modulation shown separately) and by spatial attention. A largeproportion of the neurons are modulated by both forms of attention (83%), which issignificantly greater than chance (random percent overlap: 72%, jackknifed t-test, p<0.001).Of neurons that are modulated significantly by feature-based attention, a significant proportionshow changes both in baseline/gain responses and in spectral tuning (68%, random overlap:52%, jackknifed t-test, p<0.05). B, Test for dependency between the effects of feature-basedand spatial attention on response properties. At left, bars show the fraction of V4 neurons that
David et al. Page 29
Neuron. Author manuscript; available in PMC 2010 October 1.
NIH
-PA Author Manuscript
NIH
-PA Author Manuscript
NIH
-PA Author Manuscript

show significant baseline/gain modulation for data averaged over both conditions of spatialattention, and for each spatial attention condition separately. The number of significantlymodulated cells (p<0.05, jackknifed t-test) is largest when data are averaged across spatialattention conditions (black bar), indicating that the effects of feature-based attention are thesame in both spatial conditions and that averaging across spatial conditions improves the signal-to-noise of recorded responses. The number of modulated neurons is slightly larger whenspatial attention is directed into the receptive field (gray bar) than away from the receptive field(white bar), but the difference is not significant (jackknifed t-test). Similarly, the fraction ofneurons showing tuning modulation by feature-based attention was not significantly differentbetween spatial attention conditions (bars at right). C, Comparison of baseline and gainmodulation by feature-based and spatial attention. Red curve gives the difference in responseto distractors in preferred (T1) versus non-preferred (T2) feature conditions during MTS, as afunction of the response averaged across attention conditions (n=87 neurons that undergo anysignificant modulation by attention). Responses are enhanced during T1 trials only for stimulithat elicit strong responses under both feature-based attention conditions. Green curve givesthe difference in response to distractors when spatial attention is directed into and away fromthe receptive field, as a function of the average response (n=87). Responses are enhanced whenattention is directed into the receptive field, regardless of the effectiveness of the stimuli.
David et al. Page 30
Neuron. Author manuscript; available in PMC 2010 October 1.
NIH
-PA Author Manuscript
NIH
-PA Author Manuscript
NIH
-PA Author Manuscript