atomic energy - International Nuclear Information System (INIS)
67
- «O."W038 CA9200046 ATOMIC ENERGY WJSM ENERGIE ATOMIQUE OF CANADA LIMITED \ ^ j F DU CANADA LIMITEE Research Company ^^^^ Socie'te de Recherche RESIDUAL STRAIN, SCALE EFFECTS, AND TIME-DEPENDENT BEHAVIOUR AT THE 2 4 0 m LEVEL OF THE UNDERGROUND RESEARCH LABORATORY DEFORMATION RESiDUELLE, EFFETS D'ECHELLE ET COMPORTEMENT DEPENDANT DU TEMPS AU NIVEAU DE 240 m DU LABORATOIRE DE RECHERCHES SOUTERRAIN R. S. Read Whiteshell Nuclear Research Etablissement de recherches Establishment nucleaires de Whiteshell Pinawa, Manitoba ROE 1LO January 1990 Janvier
-
Upload
khangminh22 -
Category
Documents
-
view
3 -
download
0
Transcript of atomic energy - International Nuclear Information System (INIS)

- «O . "W038 C A 9 2 0 0 0 4 6
ATOMIC ENERGY WJSM ENERGIE ATOMIQUE
OF CANADA LIMITED \ ^ j F DU CANADA LIMITEEResearch Company ^ ^ ^ ^ Socie'te de Recherche
RESIDUAL STRAIN, SCALE EFFECTS, AND TIME-DEPENDENT
BEHAVIOUR AT THE 2 4 0 m LEVEL
OF THE UNDERGROUND RESEARCH LABORATORY
DEFORMATION RESiDUELLE, EFFETS D'ECHELLE ET COMPORTEMENT
DEPENDANT DU TEMPS AU NIVEAU
DE 240 m DU LABORATOIRE DE RECHERCHES SOUTERRAIN
R. S. Read
Whiteshell Nuclear Research Etablissement de recherchesEstablishment nucleaires de Whiteshell
Pinawa, Manitoba ROE 1LOJanuary 1990 Janvier

Copyright © Atomic Energy of Canada Limited, 1990.

ATOMIC ENERGY OF CANADA LIMITED
RESIDUAL STRAIN, SCALE EFFECTS, AND TIME-DEPENDENT BEHAVIOURAT THE 240-m LEVEL OF THE UNDERGROUND RESEARCH LABORATORY
by
R. S. Read
Whiteshell Nuclear Research EstablishmentPinawa, Manitoba ROE 1L0
1990
AECL-10038

DÉFORMATION RÉSIDUELLE, EFFETS D'ÉCHELLE ET COMPORTEMENT DÉPENDANT DU
TEMPS AU NIVEAU DE 240 m DU LABORATOIRE DE RECHERCHES SOUTERRAIN
par
R.S. Read
RÉSUMÉ
On a surveillé continuellement deux trous de forage orthogonaux presquehorizontaux au cours du surcarottage concentrique au niveau de 240 m duLaboratoire de Recherches Souterrain (LRS). On a déterminé l'intensité etl'orientation des principaux éléments de déformation résiduelle du régimede contrainte en champ proche en supposant un comportement élastique liné-aire de la masse rocheuse et des conditions isotropiques; on a comparé lesrésultats avec ceux d'essais précédents au niveau de 240 m du point de vuede l'intensité. Toutefois, les résultats sur l'orientation ne sont pasconcluants. En outre, on a étudié les effets d'échelle et l'orientationdes trous de forage (par rapport à la direction de la contrainte princi-pale) sur les résultats d'un essai de surcarottage avec jauge modifiéetriaxiale CSIR; aucuns effets d'échelle n'ont été apparents lors de l'essaimais l'orientation des trous de forage a réellement influé sur les résul-tats. Enfin, on a détecté et surveillé le comportement dépendant du tempsdu granite de Lac du Bonnet entre des essais successifs de surcarottageexécutés dans l'un des trous de forage. On présente les résultats sur ladéformation résiduelle, les effets d'échelle, le comportement dépendant dutemps ainsi que les limites de la technique d'essai et les modificationspossibles à y apporter.
Énergie atomique du Canada limitéeÉtablissement de recherches nucléaires de Whiteshell
Pinawa, Manitoba ROE 1L01990
AECL-10038

RESIDUAL STRAIN, SCALE EFFECTS, AND TIME-DEPENDENT BEHAVIOURAT THE 240-m LEVEL OF THE UNDERGROUND RESEARCH LABORATORY
by
R. S. Read
ABSTRACT
Two subhoiizontal, orthogonal boreholes were monitored continuously during concentricovercoring at the 240-m level of the Underground Research Laboratory (URL). Themagnitude and orientation of principal residual strain components in the near-field stressregime were determined assuming linear elastic behaviour of the rock mass and isotropicconditions. In terms of magnitude, results compared favourably with those from previoustests at the 240-m level. However, orientation results were inconclusive. The effects of scaleand borehole orientation relative to the principal stress direction on the results from amodified CSIR triaxial cell overcore test were also investigated; no scale effects wereapparent in the experiment, but borehole orientation did affect results. Finally, time-dependent behaviour was detected in the Lac du Bonnet granite, and was monitored betweensuccessive overcore tests in one of the boreholes. Results on residual strain, scale effects,and time-dependent behaviour are presented, along with limitations and possiblemodifications to the testing procedure.
Atomic Energy of Canada LimitedWhiteshell Nuclear Research Establishment
Pinawa, Manitoba ROE 1L01990
AECL-10038

CONTENTS
Page
1. INTRODUCTION 1
2. SITE DESCRIPTION 2
2.1 GEOLOGY 22.2 IN SITU STRESS CONDITIONS 3
3. DETAILS OF THE INVESTIGATION 5
3.1 BACKGROUND 53.2 EQUIPMENT AND INSTRUMENTATION 63.3 TEST LAYOUT AND PROCEDURE 73.4 DATA MANAGEMENT 93.5 ANALYTIC APPROACH 9
4. RESULTS AND DISCUSSION 12
4.1 RESIDUAL STRAIN 124.2 SCALE EFFECTS 144.3 TIME-DEPENDENT BEHAVIOUR 16
4.4 SOURCES OF ERROR 17
5. CONCLUSIONS 17
6. RECOMMENDATIONS 18
ACKNOWLEDGEMENTS 18
REFERENCES 19

CONTENTS (concluded)
Page
APPENDIX A MONITORING RESULTS A.I
APPENDIX B FIELD WORK SUMMARY B.I
APPENDIX C CALCULATIONS AND RESULTS OF DATA ANALYSIS C. 1

1. INTRODUCTION
The in situ stresses acting on a body of rock fall into two main categories: applied stressessuch as gravitational and tectonic stresses, and residual stress caused by paleotopographic,paleotectonic, thermal and chemical effects locked into the grains and cementing matrix ofthe rock (Friedman 1972). Most in situ stress characterisation programs for the constructionof engineering structures, including the program at the Underground Research Laboratory(URL), are designed to measure the component of the in situ stress attributable to the appliedstresses. However, the superposition of residual stress can create a complicated response inovercoring strain measurements.
In much of the literature regarding residual stress, the terms strain and stress are usedinterchangeably: strain is measured directly as a change of length in a strain measuringdevice relative to its initial length, whereas stress is determined indirectly from assumedmaterial properties of the rock mass and the measured strains. In the simplest case, the rockmass is modelled as a continuous, homogeneous, isotropic, linear elastic medium, but muchmore complex cases may be explored assuming anisotropic or non-linear behaviour. In manycases, the choice of realistic material properties that adequately define the behaviour of therock mass is not straightforward; for this reason, the results of this investigation are discussedin terms of strain instead of stress wherever possible. In this paper, residual strain ispotentially recoverable elastic deformation of constituent crystals, satisfying internalequilibrium conditions, in a volume of rock with no external loads across its boundaries(Friedman 1972). Residual stress describes the value of stress calculated from the residualstrain measurements based on the assumed material behaviour.
Residual strain manifests itself when grain boundaries in the rock are freed, or new freesurfaces are created through such processes as drilling or excavation. As suggested byFriedman (1972), residual strain in certain rock masses may account for a significant part ofthe measured strain response, with values representing stresses of 30 to 40 MPa measured inquartzites, sandstones and granites. Other authors have suggested residual strain may belocked into the rock mass at different scales (Bielenstein and Barron 1971), and that only asthe scale of the excavation approaches the scale at which the residual strain is locked into therock mass will its full influence be measured. If these scales are comparable, thecorresponding residual stress is indistinguishable from other applied stresses. Because thereare reasons to suggest that residual strain exists on the rock-grain scale (Bielenstein andBarron 1971), its effect on strain measurements using the modified CSIR triaxial strain cell(Thompson and Lang 1987) may be significant, and must be considered.
If a volume of rock is isolated by diamond drilling from the in situ stress regime, part of theresidual strain stored in the rock mass can be measured by overcoring progressively smallerconcentric cylinders in the initial rock cylinder, and recording the corresponding strainresponse (Nichols 1975). Although the total residual strain is not relieved during overcoringbecause of limited liberation of grains, the use of the CSIR triaxial strain cell allowsdefinition of the complete tensor for the residual strain relieved. Other techniques forestimating the magnitude and direction of residual strain in rock include X-ray diffraction

- 2 -
(Friedman 1972), strain-relief using photoelastic gauges (Brown 1970), and ultrasonicattenuation (Bur et al. 1969), but each has its own limitations.
The residual strain experiment at the 240-m level of the URL was conducted between 1988March 17 and August 22. A series of integral in situ overcore tests, using drill bits rangingfrom 600- to 96-mm diameter, were completed in two subhorizontal, orthogonal boreholes toconfirm previous measurements of residual strain at the URL (Lang et al. 1986). The effectsof scale and borehole orientation on results from the modified CSIR overcore test, and time-dependent behaviour were also investigated. This paper presents the testing methodology,the test results, and describes the limitations of the method.
2. SITE DESCRIPTION
The selection of an appropriate site for theresidual strain experiment was influencedmainly by geological factors. Twoorthogonal boreholes were planned inhomogeneous, massive grey granite tocompare results from overcoring atdifferent directions relative to the mainprincipal stress direction without theinfluence of geological structure in therock. After review of geologic maps of the240-m level, boreholes 210-020-RST1 and209-054-RST2 were targeted in Rooms210 and 209, respectively (Figure 1), withrespective orientations of 300.887-02.35°and 030.037-02.06° (trend/plunge).
2.1 GEOLOGY
FIGURE 1: Location of Residual StrainBoreholes at the 240-m Levelof the URL
As discovered in previous overcore tests at the URL, heterogeneity in lithology near any ofthe three strain rosettes in the modified CSIR triaxial strain cell can adversely affect themeasured strain response. For example, if the host lithologic unit is very coarse-grained orpegmatitic, the individual strain gauges may be bonded to only one or two large mineralcrystals. Consequently, the measured strain response to overcoring may not represent theresponse of the rock mass as a whole, but only that of the individual crystals in contact withthe strain gauges.
Like lithology, structural components of the rock mass must also be considered. Forinstance, discontinuities in the rock can affect the performance of a strain rosette.Continuous and discontinuous fractures can cause local concentration and re-orientation ofthe stress field, or partial strain relief if displacement has occurred along the fracture plane(Herget 1973, Hudson and Cooling 1988). Similarly, microcracks with a preferential

- 3 -
Depth BOREHOLE 210-C20-RSTI
Fetdspir/Quartz Vetilsts
FeWspar/Ouartz Veintet
Granodicrite Stringer
BOREHOLE 209-054-RST2HMO tonh<
Quartz PegmatiteZone
orientation can affect strain measurements by opening during drilling (Norman 1970). Inboth cases, the measured response to overcoring is affected by the presence of thediscontinuity, and may not be representative of the rock mass response at a larger scale. Inaddition, foliations and rock fabric can form planes of anisotropy in the rock mass, andtherefore influence overcoring results (Brown et al. 1988). Investigations of bothunderground and surface exposures in the URL lease area have identified numerous sets offoliations and fabric elements in the Lac du Bonnet batholith (Brown and Soonawala 1982).
A summary of the geology of eachborehole is shown in Figure 2. Thegeology intersected in borehole 210-020-RST1 comprises mainly massive, medium-grained grey granite, with isolatedfeldspar/quartz veinlets within about thefirst 2 m of dr i l l ing . An isolatedgranodiorite stringer was intersected near3-m depth, and a granodiorite dyke with aleucocratic lower margin was presentbetween 6- and 6.8-m depth. No fracturesor pervasive microcracks were visible inthe core. Similar geology was intersectedin the second borehole, 209-054-RST2.However, the grey granite near thisborehole showed a weak gneissic foliation,and contained isolated porphyroblasts. Aquartz pegmatite zone was intersectedbetween 1- and 2-m depth , and afeldspar/quartz veinlet was discovered near4-m depth . Mic rocracks with anorientation of 255°(345°)/740 [strike (dipdirection)/dip] were noted in isolatedquartz grains.
Feldspar/Quartz Veinlet
Granodtorite Dykewith LeucocraticLower Margin
LEGEND
Grey Granite {massive 10 weakly gneissic)
Fefdspar/Quanz Veintet
Granodorite Dyke or Stringer
I Quartz Pegnatite Zone
FIGURE 2: Summary of IntersectedBorehole Geology
2.2 IN SITU STRESS CONDITIONS
The far-field in situ stress conditions at the 240-m level of the URL have been estimated frommany types of testing, including suites of overcore tests using both the USBM and CSIRmethod (Thompson and Lang 1987, Martin and Christiansson in preparation). Results fromovercore tests in one borehole near Room 209 and three near Room 210 are representative ofthe in situ stress conditions in the test area, and are shown in Figure 3 with 90% confidencelimits on the principal stresses generated by a Monte Carlo simulation (Dzik et al. 1989).
The near-field in situ stress conditions result from stress redistribution around the excavatedtunnel. The analytical solution for stresses around a circular opening in a biaxial stress field(Kirsch 1898) can be used to determine the state of stress at any point in a plane. However,in applying the solution to the actual conditions of the residual strain experiment, thefollowing simplifying assumptions are necessary:

-4-
/
/
//
\\\ ,
X
•—1 —^
• — - .
* % •
' • '
N
^ - ^
A \
+ v s\
V . 2D9-069-PH3
i
0 0.
ROOM 209+ o 2
\
s\
\
/
Confidence Limits on Stress Magnitude (MPa)-90%Mean+90%
27.2529.7032.30
10.0310.9912.80
Orientation of Principal Stresses <°)TrendPlunge
216.419.9
110.936.6
8.4810.0210.70
328.946.7
Data from 5 CSIR Overcore Tests in Borehole 209-069-PH3
/ *\ 210-060-OCI/+\ 210-059-OCI4B-
\ 210-003-OCl/3^
\ /1 1
y \ °og °!«y V-.^ ° i
LEGEND
Borehole •90% Confidence Limits
O3
X /'
O 0i
N
*• + ' A
A \ ^ \it.
&A AA. A
/<5 ( ,
/ +
ROOM 210+ o 2
Confidence Limits on Stress Magnitude (MPa)-90% 20.19Mean 24.35+90% 32.21
13.3317.4222.89
Orientation of Principal Stresses (")Trend 234.8Plunge 05.7
143.710.6
; \(* \
\ S\A ° ^ . \
1
- - - - /
A 0 3
6.5313.9316.30
352.678.0
Data from 33 CSIR Overcore Tests in Boreholes 210-060-OC1,210-003-OCl, and 210-059-OC1
FIGURE 3: Summary of Far-field Stresses from Boreholes Near the Test Site
1) plane strain conditions exist;
2) the borehole is parallel to one principal stress direction;
3) the minor principal stress is vertical;
4) the rock mass is continuous, homogeneous, isotropic and linear elastic; and
5) the tunnel has a circular cross section.
Although the tunnel geometry at the 240-m level of the URL is roughly horseshoe-shaped,use of a boundary element model demonstrated that a detailed representation of the actualgeometry is not warranted because of the uncertainty introduced by the other assumptions.The near-field in situ stress around a circular opening was calculated with the Kirschequations using the mean stress conditions for each tunnel derived in the Monte Carlosimulation of the far-field stresses. According to the assumptions, in a horizontal radialborehole the near-field principal stress axes coincide with those of the far-field. However,the stress magnitudes vary considerably in the near-field regime.

-5 -
For a horizontal radial borehole, the shearstress at each overcore test depth is zero,and the radial and tangential stresscomponents correspond to the near-fieldhorizontal and vertical stress components,respectively. As shown in Figure 4, thecalculated horizontal stress is zero at theexcavation wall, and increases withdistance to the far-field horizontal stress inthe cross-sectional plane of the excavationfor both Rooms 209 and 210. The trend ofthe vertical stress component away fromthe excavation wall differs for each roombecause of the different stress ratio actingin the cross-sect ional plane of theexcavation. However, the near-fieldvertical stress approaches the far-fieldvertical stress as the distance from theexcavation wall increases. The axial stressincreases away from the excavation in eachcase.
V)
I H
ROOM 209
1 2 3 4 5 6 7 8 9 10 II 12Distance from Excavation Wall (m)
ROOM 210
2 3 4 3 6 7 8 9 10 11
Distance from Excavation Wall (m)
LEGENDHorizoiUl Stren -Vertical Sttcii —Axial Stress -
FIGURE 4: Calculated Near-field In Situ Stressin a Radial Horizontal Borehole
3. DETAILS OF THE INVESTIGATION
3.1 BACKGROUND
A previous investigation of residual strain, using the concentric overcoring technique,showed calculated residual stress constitutes 1 to 2 MPa, or 1.5 to 2.5% of the total calculatedin situ stress near Room 206 at the 240-m level of the URL (Lang et al. 1986). Both theCouncil for Scientific and Industrial Reseaich (CSIR) triaxial strain cell and the United StatesBureau of Mines (USBM) borehole deformation gauge (Hooker and Bickel 1974) were usedfor the investigation; however, equipment limitations and technical difficulties wereencountered throughout the investigation. The residual strain experiment in Rooms 209 and210 used a broader range of bit sizes, a modified CSIR triaxial strain cell, and modified fieldprocedures to minimize experimental errors.
As part of the Room 206 study, the effects of bit size and borehole orientation on themeasured in situ stress obtained by overcoring were examined (Lang et al. 1986). If nosignificant differences in overcoring results are apparent, the use of smaller drill bitsminimizes the required borehole length and associated drilling costs. As discussed in Lang etal. (1986), investigators in the U.S.A., Canada, and the United Kingdom prefer to use thelarger 150-mm-diameter drill bit to minimize drill-breakage in weak rock, the effects of heatgeneration during drilling, and the effect of small-scale heterogeneity on the results. Swedishinvestigators prefer the more economical 88-mm-diameter bit. In the Canadian Shield, and inparticular at the URL, the 96-mm-diameter drill bit has been used extensively in overcoretests because of the excellent rock conditions and accurate control of drill-water temperature

- 6 -
(Herget 1973, Lang et al. 1986). Overcore tests using 150-mm-, 200-mm-, and 300-mm-diameter bits have also been carried out at the URL.
The principle behind the experiment was to install a modified CSIR triaxial strain cell in a37.7-mm-diameter (EWG-size) borehole in a volume of massive granite, then concentricallyovercore the cell initially with a 600- or 300-mm diameter and then with successively smallerboreholes. For each of the five successful tests conducted, the largest borehole relieved theapplied stresses acting on the volume of rock, and the smaller boreholes relieved a portion ofthe residual stress locked into the rock. As well, other effects such as dependence onborehole size and orientation, and long-term creep were assessed from monitoring results.The field investigation was designed to control such influencing factors as temperature andwater pressure. Furthermore, the six-month duration of the experiment and continuousmonitoring helped identify potential sources of error with the instrumentation that may havegone undetected in a shorter experiment.
3.2 EQUIPMENT AND INSTRUMENTATION
The experiment was carried out with equipment available at the URL, with the exception ofthe 600-mm- and 300-mm-diameter drill bits. Both boreholes were completed with anelectric-powered Longyear 38 drill. The overcoring bits used for the experiment ranged insize from 600-mm- to 96-mm-OD; drill-bit information is summarized in Table 1. Drillingwater was supplied from two sources: cold water (4° C) from cooled tanks, and warm water(14° C) from the settling pond at surface.
Nominal Size(mm)
6003002001509638
TABLE 1
DRILL-BIT INFORMATION
Borehole Diameter Core Diameter(mm)
607.9307.1204.5152.996.037.7
(mm)
596.0295.2195.1144.586.721.5
Bit Length(mm)
153515351030101062035
The drill was equipped with instruments to monitor thrust, torque, speed and penetrationdepth, and instrumentation was installed in the borehole to monitor water temperature andpressure. A modified CSIR triaxial cell was installed for each test to record the strainresponse on twelve strain gauges arranged in three rosettes. For all except the first test, thestrain gauge on channel 12 was replaced with a stable resistor to provide a baseline

- 7 -
measurement of resistance in the system to correct results for instrument drift. Allinstrumentation was connected to a Fluke 2280B portable datalogger and continuouslymonitored during the experiment. An extra thermistor was also installed in the datalogger tomonitor its operating temperature. In all, 22 separate channels of data were recorded on tapecartridges; these channels are described in Appendix A.
The tunnel air temperature was also continuously monitored with a separate system ofinstruments for the duration of the experiment.
3.3 TEST LAYOUT AND PROCEDURE
The actual test layout for each borehole was restricted by both equipment size and tunnelgeometry. For example, the length of the 600-mm-diameter drill bit was limited by the widthof the tunnel and drill size to approximately 1.5 m. This restriction reduced the maximumlength-to-diameter ratio for this size of bit to only 2.5:1. To completely relieve the appliedstresses and to avoid the influence of end effects, a minimum drilled length of two bit-diameters on each side of the CSIR triaxial strain cell, corresponding to a length-to-diameterratio of 4:1, was required. Only three tests were attempted with the 600-mm-diamet,er bitbecause of the restricted length and drilling problems associated with the bit design. Theremaining tests were started with the 300-mm-diameter bit, satisfying the length-to-diametercriteria with a ratio of 5:1.
Two designs were completed for the drilling sequence, based on the largest bit size to be usedin the test (Figure 5). For the first test involving the 600-mm-diameter bit, the strain cell waspositioned 0.90 m from the starting reference of the test. To minimize the end effects insubsequent overcore sizes, the 300-mm-, 200-mm-, 150-mm- and 96-mm-diameter drill runsended two bit-diameters past the strain cell. For the 200-mm-diameter and smaller bits, apreliminary starter hole was drilled to compensate for the available lengths of bits on site.For subsequent tests, the design was modified to place the CSIR cell 0.60 m from the startingreference of each test. This new configuration eliminated the need for a preliminary hole forthe 20C-mm diameter and smaller bit-sizes, and reduced the stress effects on the 600-mm-diameter core at the connected end of the rock cylinder. For tests starting at the 300-mm-diameter size, the 600-mm-diameter bit was eliminated from the configuration. Centralizingplates were designed to keep successively smaller drill runs concentric, and stabilizers wereused to minimize sag in the drill rods and to provide support at the borehole collar.
Following installation of the CSIR cell, the stability of the cable connecting the CSIR cell tothe datalogger was checked by changing the temperature of the water in contact with thecable and monitoring the strain readings. If noticeable fluctuations were recorded, the systemwas checked for possible malfunctions and repaired. If the strain readings were stable (i.e.,less than 10 ̂ .e over ten minutes), overcore tests were started.
The overcore tests in the first borehole, 210-020-RST1, were conducted with a stabilizationperiod of up to five days before and after each consecutive overcore to monitor any time-dependent behaviour. Overcoring was not started for the successive run until the strainresponse had stabilized to less than 10 jie/h on all channels. Owing to the excessive delays

- 8 -
DRILLING SEQUENCE
Start 300 mm
Start 200 mm
Start 150 mm
Drill 96 mm and flatten
Drill 38 mm
Install CSIR cell
Ovorcore 600 mm
Overcore 300 mm
Overcore 200 mm
Overcore 150 mm
Overcore 96 mm
DRILLED LENGTH (mm)
300
H N30380
1500
1470
870
420
a) Initial Test Configuration
Stan 300 mm
Start 200 mm
Start 150 mm
Drill 96 mm and flatten
Drill 38 mm
Install CSIR cell
Overcore 600 mm
Overcore 300 mm
Overcore 200 mm
Overcore 150 mm
Overcore 96 mm
1170
420
b) Modified Test Configuration
FIGURE 5: Residual Strain Test Configurations

- 9 -
imposed on the drilling schedule by the stabilization periods after each overcore test, tests inthe second borehole were carried out with only a minimum stabilization period between runs.
Following the overcore testing at each test depth, a pressure/temperature response test wascarried out. The strains were monitored under constant temperature while the water pressurewas stepped through various levels, then the pressure was held constant and the watertemperature was varied. In general, the pressure variation of up to 300 KPa had a very smalleffect (0.03 |ie/KPa) on the measured strains. However, the variation in temperatureproduced a marked response in the strains, ranging from about -15 to -3 (ie/°C for the variousgauges. Plots of strain response are contained in Appendix A. The results of the responsetest emphasize the importance of maintaining temperature control throughout the overcoringoperation.
As a final step, a measurement of the cell orientation was made, and the core was carefullybroken out of the borehole. At surface, a biaxial test of the H-size (86.5-mm-diameter) corewas performed to determine the material properties of the tested sample of rock. A summaryof the field work performed for the residual strain experiment is contained in Appendix B. Acomplete copy of the experimental procedures is maintained at the URL.
3.4 DATA MANAGEMENT
Data collected by the datalogger were transferred regularly to the VAX computer as each tapecartridge was brought to surface. Preliminary plots of the data were compiled daily to assessthe quality of the results and to plan modifications to the experimental procedures. Fromthese plots, it was evident that events such as rod changes, reaming and equipment break-down resulted in "noise" that obscured the actual strain response to overcoring.Consequently, each data file was edited to filter out the noise caused by these extraneousactivities, and replotted to show the actual response due to overcoring. Examples of anunfiltered and filtered plot of the same data are shown in Figures 6 and 7, respectively.
From the filtered data files, changes in strains due to overcoring were extracted for analysis.A representative stable portion of each strain response curve on each side of the CSIR cellwas selected, and the average strain change was calculated for each of the gauges. Thedifference in cell temperature was also recorded. As detailed in the next section, these datawere then analyzed using an isotropic analysis program and the material propertiesdetermined from the biaxial test. The orientation and magnitude of the principal stressesindicated by the strain response were calculated, and the associated principal strains wereback-calculated (Appendix C).
3.5 ANALYTIC APPROACH
Measurement of residual strain is theoretically independent of the location of a nearbyexcavation assuming no associated damage to the rock mass has occurred. However, incomparing calculated applied stresses, the proximity of the excavation must be considered.In both boreholes, strain measurements were taken between 1.50 and 7.05 m from the wall ofthe 3.5-m-wide tunnel. From elastic theory, the zone of influence around the openingextends approximately two tunnel-diameters, or in this case, 7.0 m into the rock mass.

-10-
CSIROVEHCORETEST
MfCROSTRAiNVS DEPTH
HOLE: 209-054-RST2
DEPTH: 2 .08
FIGURE 6: Example of an Unfiltered Data Plot
TC £ E"OWBCOB6 DEPTH • cm
DWINDLENCHTHM -EA9TH3CUVA1QN -
W1IUTM
I D . - M M
O.D. - mmU M O . SM
BOCK TtM*f PUO
flEADOUT 9EWAL NO.
OATEMTAUED-OVElCOftfD-
CSIHOVEHCORETEST
MICROSTRAIN VS DEPTH
HW.E 209-054-RST2DEPTH: 2.08 (600 mm)
FIGURE 7: Example of a Filtered Data Plot

-11 -
Therefore, all strain measurements, with the possible exception of the last overcore test in210-020-RST1, were completed in the near-field stress regime.
The elastic constants determined from the biaxial chamber varied considerably from onesample to the next. Therefore, to compare with other stress measurements, principal stresseswere standardized using a uniform secant Young's modulus (E=50 MPa) and Poisson's ratio(v=0.20); these elastic constants represent typical results from laboratory tests conducted atthe URL. Where applicable, the strain tensor was used instead of the stress tensor to simplifythe analysis. For a continuous, homogeneous, isotropic, linear elastic medium, the principalstrains (£j, £2, £3) are related to the principal stresses (Oj, a2, 03) by:
- v(c2 + a3)](1)
[o2 - v(Oi + a3)](2)
[a3 - v(aj + a2)]£3= (3)
Principal in situ and residual strains were back-calculated from the principal stress resultsobtained from the isotropic stress analysis, using the elastic constants from the biaxial test ofeach 86.5-mm-diameter overcore. The in situ strain tensor was expected to vary for differenttest locations because of the influence of the excavation. However, in a homogeneousvolume of rock, the principal residual strain components should be relatively consistent inboth direction and magnitude. In practice, the residual strain tensor also varied for eachovercore test due to inherent heterogeneity in the rock and instrumentation limitations.
In dealing with stress or strain tensors, care must be taken in determining the averagemagnitude and orientation of the principal stresses or strains. A second-order tensor, unlike ascalar or a vector, has six independent components. The correct approach involvestransforming each tensor to a common set of reference axes, averaging the six tensorcomponents separately, then calculating the principal stresses of the resultant mean tensor(Hudson and Cooling 1988). This approach was used in determining the 90% confidencelimits on the principal stresses and strains.
A means of comparing the relative magnitude of strain responses is the volumetric strain (A),or relative volume change, defined by:
A = ej + e2 + £3 (4)
This equation is analogous to that for the first stress invariant, and is useful for identifyingresidual strain and effects of scale on overcore results. If no residual strain exists at the URL,

- 1 2 -
once the applied stresses are relieved by the initial overcore test, volumetric strain due tosubsequent overcoring is theoretically zero. If, however, residual strain is present, then thevolumetric strain tends to some non-zero value, depending on the relative magnitudes of theprincipal strain components. In Barre granite, both compressional and extensional residualstrains were measured (Nichols 1975).
As noted by Nichols (1975), the magnitude of the residual strain relief depends partly on thedegree of grain liberation, which in turn may be related to the scale of the test performed.Furthermore, the equilibrium conditions at the surface of the overcored rock cylinder, andpossibly the state of residual strain, are altered by each successive overcore. Therefore, ifresidual strain relief is scale-dependent, the volumetric strain for the various overcore testsizes should vary.
The volumetric strain was predicted fromthe derived near-field stress conditions forvarious points away from the excavation(Appendix C). As shown in Figure 8, thepredicted volumetric strain increases awayfrom the excavation, approaching aconstant value at approximately two tunneldiameters from the wall of the excavation.The volumetric strain from measurementsof in situ stress in various boreholes inRooms 209 and 210 is plotted forcomparison. In general, the measuredvalues are scattered about the curve for thepredicted volumetric strain; the maximumdifference between predicted and measuredstrains is about 28% of the predicted value.
.5
0.100.090.080.07
CO 0 0 6
y 0.05
'jS 0.040.03
LEGENDPredicted Values Measured Values— Room 210 A-209-028-OC1
Room 209
0.02-0.01-0.00
1 2 3 4 5 6 7 8 9 10 11 12 13 14
Distance from Excavation Wall (m)
FIGURE 8: Comparison of Predicted andMeasured Near-field VolumetricStrains
4. RESULTS AND DISCUSSION
4.1 RESIDUAL STRAIN
The prime objective of the experiment was to determine the magnitude and orientation ofresidual strain at the 240-m level of the URL. As previously described, the magnitude andorientation of the principal stresses calculated from the measured strain response duringovercoring were converted to equivalent principal strains by Equations 1, 2 and 3. Stressresults were also standardized for comparison with previous results.
The effect of anisotropy in the rock mass on the measured strains is not clear. Asdemonstrated in several applications, the anisotropic stress analysis conducted at the URLtends to rotate the major principal strain component into the plane of anisotropy forconditions where strong anisotropy exists. This rotation generally results in a higher degreeof precision in the data, but is dependent on the magnitude of the anisotropy. Work is

- 1 3 -
currently ongoing at the URL to characterise the anisotropy at the 240-m level.Consequently, to avoid assumptions regarding the orientation and magnitude of anisotropy,and to compare with isotropic results from previous work, an isotropic analysis wascompleted in detail. The results of these calculations are summarized in Appendix C.
The calculated residual strain and corresponding residual stress in each of the boreholes areshown in Figure 9. The average magnitude of the principal residual strains (EJR, ?2R' and£3R) an£* l^ e r a n S e °f values within the 90% confidence limit are similar in both boreholes;mean magnitudes of major, intermediate and minor residual strain components were 10.32,0.44 and -9.11 fie, respectively, for borehole 209-054-RST2, and 17.24, -3.61 and -6.79 jxefor borehole 210-020-RST1. In terms of stress, the average magnitude of the major principalresidual stress component near Rooms 209 and 210 is only 1.5 and 3.3%, respectively, of thecalculated major principal far-field in situ stress component. These results comparefavourably with those of Lang et al. (1986).
In contrast to the residual strain magnitudes, the mean orientation of the three straincomponents is significantly different for each borehole, with EJR showing a dependency onborehole orientation in each case. Significant differences in mean orientations of the straincomponents in near-perpendicular boreholes have been noted in other isotropic analyses of
//
1 \\ /
V (\\\\\
N^ - *- * ^ ^
S 1 a• \ /
/ — \
\ A S\ ^
o
209-054-RST2^t « •,.
ROOM 209
° E1R (a1R) + ea, (o :
\
\
• ' * • " • • • \/+ ^
' / ++ 1'••r/7^ /\^/// LEGEND
Borehole •90% Confidence
E1R
E£4 E 3 R ( O 3 R )
Confidence Limits on Residual Strain Magnitude (JJE) *-90%Mean+90%
1.50 -9.6010.32(0.45) 0.44(0.04)28.99 10.72
Orientation of Principal Axes (°)TrendPlunge
008.0 100.607.9 18.6
-22.39-9.11 (-0.36)-3.95
256.069.7
A • \/ a >
V-—c<\fr'
Limits
\ + >
° EIR (OIR)
N•
j
V ^ "
\)VI
](/
ROOM 210
+ Ea< (O2R)
V \
V \
1 210-020-RSTl/
\ * ^\ f\y^/
* £3R (°3R)
Confidence Limits on Residual Strain Magnitude (ux) *-90% 6.45Mean 17.24 (0.81)+90% 39.36
-12.07-3.61 (-0.06)8.83
Orientation of Principal Axes (°)Trend 307.4Plunge 08.0
Residual stress magnitudes (MPa) shown in parentheses.
094.880.6
-2621-6.79 (-0.19)-3.18
216.705.0
FIGURE 9: Summary of Residual Strain and Stress for Each Borehole

-14 -
overcore results at the 240-m level of the URL (Martin and Christiansson, in preparation);these differences may be attributable to inherent anisotropy in the rock not accounted for bythe isotropic analysis. In addition, the orientations of the strain components within eachborehole show considerable variability as demonstrated by the size of the area encompassedby the 90% confidence limit. In comparison to the far-field in situ stress symmetries, theresidual strain symmetries are rotated anticlockwise for each borehole. Also, compared to thenear-field in situ stress symmetries, clockwise rotation of the residual stress symmetries isapparent in both cases. These symmetries suggest influence of geology or tunnel geometryon the strain measurements (Brown, pers. comm.).
4.2 SCALE EFFECTS
The second main goal of the investigation was to determine the effect of scale on overcoringresults, both for the total in situ and the residual strain measurements. The near-field in situstate of stress was calculated from the strain response from the initial overcore at each testlocation. The results from all the tests in each borehole were combined and compared withpredicted values calculated from the average in situ stress conditions.
ROOM 209
0 1 2 3 4 5 6 7 8 9 ID 11 12
Distance from Kxcavation Wall (m)
ROOMS 209 AND 210o o , <T3
Orientation of Principal Axes (°)Trend 262.1 166.6Plunge 23.2 12.7
90% Confidence Limitsrj, o 2 O3-
Borehole •
050.063.2
h to
TCL.600-
! J I 1 - 1 Ttt-mm I
Test 1-2300-mm
Test 13300-mnl
ROOM 210
2 3 4 5 6 7 8 9 10 11 12Distance from lixcavalion Wall (m)
LK3I-ND
Horizoiul StressVerticil S&eisAxul Stress
2IO-020RST1 209054RST2Test 1-1 @ 2.43 m Test 2-1 @ 2.08 mTest 1-2 @ 5.57 m Tesl 2-2(3) 3.95 mTe«[email protected]
FIGURE 10: Comparison of Predicted and Measured Near-field In Situ Stress
As shown in Figure 10, the measured near-field in situ stress components at each test locationdeviate from the predicted values, both in orientation and magnitude. Even considering the90% confidence limits shown in Figure 10, CT3 is not vertical, and consequently Gj and <5^ donot lie in a horizontal plane as assumed for the predicted values. Furthermore, the meantrend of a j is 262°, which differs significantly from the predicted value of 210°. Somedependence of the orientation of a* on borehole orientation is also apparent in the twoboreholes.

In Room 209, the magnitude of each stress component measured from the first test with the600-mm-diameter bit exceeded the predicted value. The second test, using a 300-mm-diameter bit, showed CTj and a^ below, and O"2 above, the predicted magnitudes. In Room210, the first test was started using a 600-mm-diameter bit, the second and third using a 300-mm-diameter bit. The third test experienced some equipment malfunction before the in situstress was fully relieved, so only part of the strain response was recorded. For the first twotests, the magnitudes of the three principal stress components exceeded the predicted values,although the measured value of a^ was close to the predicted value. Owing to the problemsin the third test, all the stress components measured were lower than predicted.
In terms of scale effects, no consistent trend was exhibited by the in situ principal stresscomponents measured for each test. In 209-054-RST2, the magnitudes measured with the600-mm-diameter test appear to be larger for all components than those measured with the300-mm-diameter bit. However, in 210-020-RST1, the major principal in situ stressmagnitude measured while using the 300-mm-diameter bit exceeds that from the 600-mm-diameter test; the other stress component magnitudes are comparable. In this case, axiallengthening due to opening of microcracks orthogonal to the core axis during overcoring maybe more prevalent at the smaller overcore size.
In a further attempt to identify the effectsof scale on the overcore results for in situstress, the measured volumetric strain foreach overcore test was calculated. Thesecalculated results were then compared tothe predicted values for the assumed in situstress conditions. As shown in Figure 11,there does appear to be a trend in themeasured in situ volumetric strain relatedto scale. In Room 210, the measuredvolumetric strain exceeds the predictedresponse in both of the successful tests.Tests in Room 209, in contrast, showmeasured volumetric strains close to or lessthan those predicted. This difference maybe at t r ibutable to the influence ofpreferentially oriented microcracks in 210-020-RST1 creating an exaggerated axialstrain response.
LEGENDPredicted Values
Room 210Room 209
Measured Values
I 210-020-RST1 A 209-054-RST2
Teal 1-1 @ 2.43 mTest l-2@ 5.57 [email protected]
Test 2-1 @> 208Ten 2-2C* 3.95
0 1 2 3 4 5 6 7 8 9 10 11 12 13 14
Distance from Excavation Wall (m)
FIGURE 11: Comparison of Predicted andMeasured In Situ VolumetricStrains
In both cases, the volumetric strain from the 600-mm-diameter test exceeded that from the300-mm-diameter test despite the fact that the predicted volumetric strain for the first test ineach borehole was less than that for the second test. However, larger volumetric strain forthe 600-mm-diameter bit may be partly due to larger temperature gradients across the rockcylinder and greater damage to the rock caused by difficulties in drilling with this bit size;similar difficulties were not encountered with the othc" bit sizes.

-16 -
Volumetric strain was also used as a meansof determining scale-related effects in themeasurements of residual strain. Themeasured volumetric strain was between0.0037% and -0.0028% for all the residualstrain determinations; this compares to anaverage of 0.07% for the far-field in situstress determinations in the area.
A summary of volumetric strains for eachovercore at each test depth is presented inAppendix C. As shown in Figure 12, nodefinite trend exists in the data; bothpositive and negative volumetric strainswere measured for each size of bit.
4.3 TIME-DEPENDENT BEHAVIOUR
LEGENDTEST DIAMETER
• 300-mm EJ150-mm• 200-mm D96-mm
210-020-RST11-1 Depth 2.43 m1-2 Depth 5.57 m1-3 Depth 7.05 m
209-054-RST22-1 Depth 2.08 m2-2 Depth 3.96 m
2-1 2-
209-054-BST2
FIGURE 12: Summary of ResidualVolumetric Strain
Between successive overcore tests, the strain rosette was monitored for up to five days toidentify any time-dependent behaviour in the granite. As shown in the plots in Appendix A,an increase in strain readings was apparent in all cases monitored. However, in cases where astable resistor was not used in place of strain gauge 12, or where the stable resistormalfunctioned, correction for instrument drift was impossible.
The average volumetric strain rate was calculated for three monitoring periods. This wasaccomplished by measuring the change on each strain gauge over a known time interval,converting the readings to equivalent principal strains, and calculating the volumetric strainfrom Equation 4 (p. 11). Results of the analysis are shown in Table 2.
TestDepth(m)
Borehole5.575.57
Borehole3.96
CoreSize(mm)
Aei
(ye)
210-020-RST1300200
100.236.6
209-054-RST2200 28.6
TABLE2
VOLUMETRIC STRAIN
Ae2
(ye)
-28.78.7
-2.3
Ae3
(ye)
-48.1-14.0
-15.0
RATES
TimeInterval(min)
5040960
897
VolumetricStrain Rate
(%/h)
2.79 x W5
1.96X10"4
7.55 x W5

-17 -
Because of time constraints, only short stabilization periods were carried out between mosttests in borehole 209-054-RST2. However, a small increase in strain was detected betweeneach successive test. In both boreholes, anomalous behaviour in some of the gauges,particularly the 135° strain gauges, was noticed between several of the tests. In these cases,the strain readings from the anomalous gauges were not included in the calculation ofprincipal strains and stresses. The exclusion of these readings was possible because ofredundancy in the strain rosettes.
Instrument calibration tests on the CSIR triaxial strain cell at the URL have shown a typicaldrift rate over a five-day period of about 1.5 x 10" ̂ %/h; therefore, only a small portion ofthe measured response can be attributed to instrument drift.
4.4 SOURCES OF ERROR
The principal source of error in the experiment was equipment malfunction. On twooccasions, the tape cartridge in the datalogger failed. On other occasions, power to thedatalogger was cut off, and the stable resistor in the CSIR cell malfunctioned for one test.For both boreholes, the 600-mm-diameter bit could only be used for the initial test; forsubsequent tests the bit deformed to produce an oval hole. Slow penetration rates with thelarger bits and the need to disrupt the overcoring process to break and add rods also impededthe tests, and affected the ability to maintain a constant temperature. Glue creep was notconsidered a problem because of extensive laboratory testing on the glue used in the test.However, on numerous occasions, the CSIR cell debonded from the borehole wall.
Temperature and water pressure were kept as constant as possible throughout the experiment,but fluctations in each were unavoidable. As observed in the temperature/pressure responsepart of the investigation, temperature changes can have a significant effect on the strainreadings; in terms of volumetric strain, the temperature effect averaged -1.2 x lO'-* %/°C.Tunnel temperature and humidity were not controlled throughout the experiment, and mayhave been contributing factors to debonding of the CSIR cell.
5. CONCLUSIONS
The conclusions that can be drawn from this investigation are as follows:
1) Residual strain is present at the 240-m level of the URL but represents aresidual stress of less than 1 MPa (3.3% of the major principal far-field insitu stress component). Furthermore, no unique orientation of the principalresidual strain components was discernable from the measured results; EJRwas closely aligned with the trend of the borehole in each case.
2) Scale effects did not significantly affect the measured in situ or residualstrains. No trend related to core size was apparent in the calculated principalin situ stress components; however, volumetric strain measured during relief

-18 -
of the in situ stress field was greater for the 600-mm-diameter tests. Notrend in principal residual stress components or volumetric strain was foundduring relief of residual strain. These results . uggest that the use of moreeconomical 96-mm-diameter overcoring is preferred over larger-sizeovercoring in situations where core discing is not a problem.
3) Time-dependent behaviour in the Lac du Bonnet granite, represented by anincrease in volumetric strain, was detected between successive overcore tests.In several cases it was possible to measure the volumetric strain rate over aperiod of up to five days.
4) Careful monitoring and control of test conditions, including instrumentationand equipment, is essential throughout the experiment. Variations in celltemperature can produce strains of similar magnitude to those recordedduring overcoring to relieve residual strain.
6. RECOMMENDATIONS
Possible improvements to the testing procedure and equipment were identified during theexperiment. These include
• increased clearance at the boreholes to permit the use of longer drill rods;this would eliminate stoppages to break the drill string and add rods.
• drill bits with a length to diameter ratio of at least 4:1 , and robustconstruction to prevent deformation during drilling.
• data link to allow experiment monitoring at surface; this would minimizeproblems with the datalogger caused by varying temperature and humidity.
• improved glue performance to ensure adhesion of the CSIR cell to theborehole wall for the duration of the experiment.
Further work using anisotropic analysis of the data is recommended once studies ofanisotropy at the 240-m level of the URL are complete. In addition, a study of microcrackingaround each overcored sample may lend some insight into the validity of assuming elasticityaround the triaxial strain cell. Without significant improvements in technology and analysistechniques, further testing of this kind at the 240-m level of the URL is not recommended.
ACKNOWLEDGEMENTS
I would like to thank J. Mitchell for her excellent effort in editing the data files and producingthe data plots, J. Martino and E. Dzik for their assistance in compiling the data, and D.Martin for his constructive input.

- 1 9 -
REFERENCES
Bielenstein, H.V. and K. Barron. 1971. In situ stresses. In Proceedings of the 7th CanadianRock Mechanics Symposium, Edmonton, (Alberta), 1971 March 25-27.Department of Energy, Mines and Resources, Mines Branch, Ottawa, RS120.
Brown, A. 1970. Measurement of recoverable strain in rocks from Llano, Texas, and Cody,Wyoming. Geol. Soc. Am. Abstr. 2, 273.
Brown, A., and N. Soonwala. 1982. Geology of the Underground Research Laboratory site,Lac du Bonnet batholith, southeastern Manitoba. Geological Association ofCanada field trip guidebook for 1982, Trip 15.
Brown, A., D.M. Kingston and R.A. Everitt. 1988. In situ strain recovery at the surface ofthe Underground Research Laboratory site. Atomic Energy of Canada LimitedTechnical Record, TR-442*.
Bur, T.R., R.E. Thill and K.E. Hjelmstad. 1969. An ultrasonic method for determining theattenuation symmetry of materials. U.S. Bureau of Mines, Report, Invest. 7335,U.S. Government Printing Office, Washington, D.C.
Dzik, E.J., J.R. Walker and C D . Martin. 1989. A computer program (COSTUM) tocalculate confidence intervals for in situ stress measurements, Volume 1. AtomicEnergy of Canada Limited Report, AECL-9575.
Friedman, M. 1972. Residual elastic strain in rocks. Tectonophysics .15(4), 297-330.
Herget, G. 1973. First experiences with the C.S.I.R. triaxial strain cell for stressdeterminations. Int. J. Rock Mech. Min. Sci. & Geomech. Abstr. 10, 509-522.
Hooker, V.E. and D.L. Bickel. 1974. Overcoring equipment and techniques used in rockstress determination. U.S. Bureau of Mines, Information Circular 8618, U.S.Government Printing Office, Washington, D.C.
Hudson, J.A. and CM. Cooling. 1988. In situ rock stresses and their measurement in theU.K. - Part I. The current state of knowledge. Int. J. Rock Mech. Min. Sci. &Geomech. Abstr. 25(6), 363-370.
Kirsch, G. 1898. Die theorie der elastizitat und die bedurfnisse der festigkeitslehre. Veit.Ver. Deut. Ing. 42(28), 797-807.
Lang, P. A., P.M. Thompson and L.K.W. Ng. 1986. The effect of residual stress and drillhole size on the in situ stress determined by overcoring. In Proceedings of theInternational Symposium on Rock Stress and Rock Stress Measurements,Stockholm, pp. 687-694.

- 2 0 -
Martin, CD. and R.C. Christiansson. In preparation. Overcoring in highly stressed granite.Part I - Comparison of USBM gauge and modified CSIR triaxial strain cell. Forsubmission to the Int. J. Rock Mech. Min. Sci. & Geomech. Abstr. 1989 June.
Nichols, T.C. 1975. Deformations associated with relocation of residual stresses in a sampleof Barre Granite from Vermont. U.S. Geological Survey Professional Paper 875,U.S. Government Printing Office, Washington, D.C.
Norman, C.E. 1970. Geometric relationships between geologic structure and ground stressesnear Atlanta, Georgia. U.S. Bureau of Mines, Report, Invest. 7365, U.S.Government Printing Office, Washington, D.C.
Thompson, P.M. and P.A. Lang. 1987. Geomechanical instrumentation applications at theCanadian Underground Research Laboratory. In, Proceedings of the 2ndInternational Symposium on Field Measurements in Geomechanics, Kobe, Japan,pp. 963-983
Unrestricted, unpublished report, available from SDDO, Atomic Energy of CanadaLimited Research Company, Chalk River, Ontario KOJ 1 JO.

- A . I -
APPENDIX A
MON: I'ORING RESULTS
CONTENTS
Page
A.I. EXPLANATION OF DATA CHANNELS A.2
A.2. OVERCORE PLOTS A.3
A.3. STABILIZATION MONITORING PLOTS A.17

-A.2-
A.l. EXPLANATION OF DATA CHANNELS
The pin connections on the CSIR triaxial cell, their function, and corresponding channelnumber at the datalogger are shown in Figure A-l.
THERMISTOR
FIGURE A-l: View of Pins on CSIR Cell Looking Downhole
Cell Pin
ABCDEFGHIJKLMNO
0°0°0°0°
120°120°120°120°240°240°240°240°
90°135C
0°45°
90°135°0°45°90°135°0°45°
Channel Number
3 (Circumferential)4I (Axial)2Common Green7 (Circumferential)85 (Axial)6I1 (Circumferential)129 (Axial)10Thermistor (T)Thermistor (T)
a is the angle in degrees describing the position of the midpoint of the strain gauge on the circumference of (heborehole (looking into the hole, clockwise from North or up).
B is the angle in degrees between the direction of the strain gauge and the axis of the borehole passing throughthe midpoint of the gauge and directed away from the borehole mouth (clockwise from axis of borehole iflooking from outside of borehole).

-A.3-
A.2. OVERCORE PLOTS
_ _ WTCIt INWATCH OUT
. OAT*. LOGGER
mTEff kP« , SPECO (WUTOflQOE NM _ R A T E n»Jml<THRUST kH
To To 3TOVERCOflE DEPTH - cm
OHIH HOLE COORDINATES"H0KTH1NC * 35704M 00EASTING » 1)3121 J4ELCVATIOM • 94 12D1P(+I«« DOW) • -2 1AZltftJTH i 300 0
OCFTH OF O/C START I SO i.
DEPTH Or CHO HOLE i.7% m
CORE D 1 I C H S I 0 N S ( M . )
T O . - 37 70OO. • •00-00LCNO - tt»
ROCK TCITERATUftE 10 4'C
CAUSE SCfllAk NO. 000
KEAOOUT SENTAL NO 000
TEST DONE SY iCS. CK
INSTALLEOOVEHCORCD:
DATE TItC6S-0J- - I I 23S0St-OJ-17 1700
CSIR OVERCORE TEST
UICROSTRAIN VS DEPTH
HOLE 210-020-RSTlDEPTH 2 . 43 (600 tmt)
DATE 7-APR-A9
FIGURE A-2: 600-mm-Diameter Overcore, Borehole 210-020-RSTl (2.43-m Depth)
«t*TCR IN»»TER OUT
. DATA LOGGER
__ MITT« hPo SPCCO KPUTOHQUC Mi- -RATE t»m/n«lnTHRUST fcH
OVERCORE DEPTH - em
M I L L HOLE COORDINATESWORTHING - 957041* .00EASTING - USBZt 14ELEVATION • 34.22OIP(-t iva 00»N) - - 2 . 3AZIUUTH - 3 0 0 *
DEPTH OF O/C START 1.4(1 *
DEPTH OF E*O HOLE 2 79 «
COKE OltCMSZtMSfnti}T O . - 37.70O D. - 300.00LENC - 9 t *
ROCK TEMPERATURE
GAUGE SERIAL NO.
READOUT SERIAL NO
TEST DONE Br
10 4'C
000
009
•CS.CK
INSTALLEDOVERCOffED
DATE TIUEBB-O3MB 2230B8-O3-23 1320
CSIR OVERCORE TEST
MICROSTRAIM VS OCPTH
HOLE : 210-020-RSTlDE'TH 2 . 4 3 (300 mm)
DATE 7-APR-89
FIGURE A-3: 300-mm-Diameter Overcore, Borehole 210-020-RSTl (2.43-m Depth)
-A.4-
W»TEH IN. . . WATfft OUT
DAlA IOCCEH
_ . WATER irPo SPECD RPU_ . TORQUE N» RATE mm/mtr„ . THRUST WN
• — \ .
I.
500
400.
300.
200.
100
\ \ \
.100 ( f
• 0 70OVERCORE DEPTH - cm
DfflLL HOLE COORDINATESNORTHING - 35704t9.<EASTING - 2«SB2» t'ELEVATION - 94 27D I P ( - t w i DO*N) - -3 J
A71UUTH - 300 9
DCPTfl Or 0/C STAKT l . 64 *
DEPTH Of f * C HOLE Z "S «
CORC D1tEN5]0N5(«f.)
ID - 37.70O.D. - IIS 10LCNC - • ! •
ROCK TEMPERATURE 10 4'C
CAUCE SERIAL NO 000
READOUT SERIAL NO 003
DATE TIKE
8 6 - 0 3 - 1 * OHO
CSIR OVERCORE TEST
MTCROSTRAIN VS DEPTH
HOLE 210-020-RST1DEPTH 2 . 4 3 (200 mm)
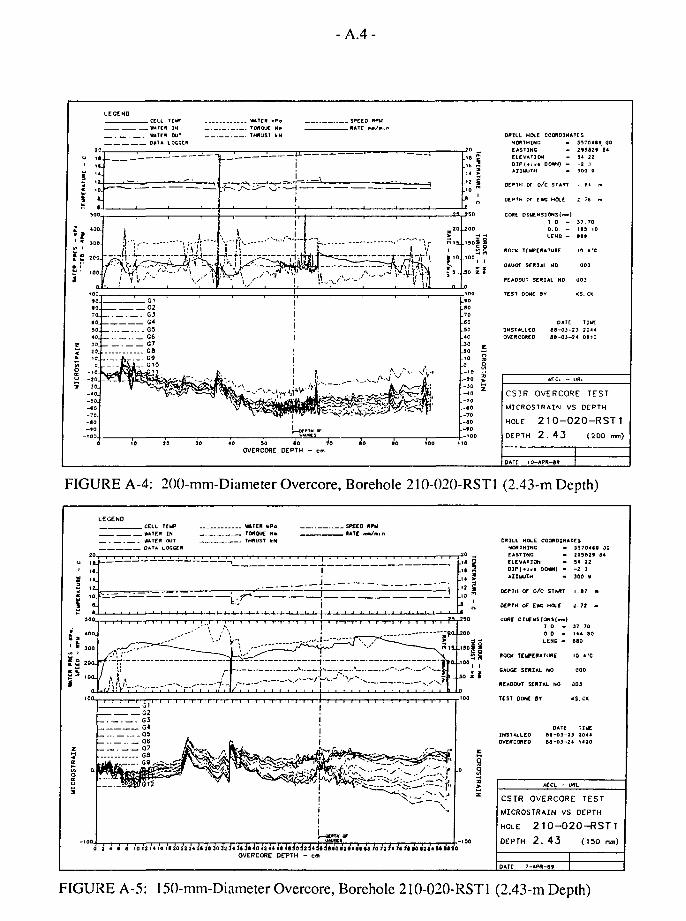
FIGURE A-4: 200-mm-Diameter Overcore, Borehole 210-020-RST1 (2.43-m Depth)
LEGEND
<-> IB.
' 11
» : ;
300.
1 ' 300
S •* looj1
! .o
- - • -
g sga
< i * < a
WATER IN. WTEft OUT _
DATA LOCG£N
„. . ~ . _ . ^ —
' G1_ G 2
. G3_ G4. - G 5
_ ae K
10 U 14 ia 1120 322431
. - . TMOUt N-. _ . THRUST kN
in h h i* i§ i**a iz *« «'• it iaOVERCOME DEPTH
1 ' 1
1
I
^ J v ^ —
0AUCKS
j2JiJt3»i0i:«n'«««707J717t;<
- cm
1
.it S
10 "*
2^ 7 * n
jf1
""""'jj0"
•- (?.
- " " \
IO12a'<UM9
200
" S
JO i f
100
UIC
RO
ST
z
DRILL HOLE COORDINATES
ELEVATION • 34 22D1P{-H<« DOt*.) - - 2 JAZIUUIH - JOO 9
DEPTH OF C*C H a E ^.72 «
CORE OltCNSIONS(m)T O - J7 700 D - 144.30LENC - BiO
HOCK T£liPERATUR£ 10 4'C
READOUT SERIAL NO 003
TEST DONE Of .(S. CK
DATEINSTALLEO 6 8 - 0 3 -OVERCORED Bf l -03-
3 30444 1420
AECL - URL
CSIR OVERCORE TEST
MICROSTRAIN VS DEPTH
HOLE 2 10-020-RST1DEPTH 2 . 4 3 (150 ir.ni)
DATE 7-APR-89
FIGURE A-5: 150-mm-Diameter Overcore, Borehole 210-020-RST1 (2.43-m Depth)

-A.5-
^ _ _ _ _ WATER IN
. WATER OUT
_„ DATA LOOCCR
TOKQue N*
_ „ _ _ _ . . THRUST %N
OVEHCORE DEPTH - cm
JOJO.70.COJO
.-10
.-20
.-30
.-40
.-30
.-SO.-70. - • 0
M I L L HOLE COORDINATES:
NORTHINO - 3 3 T O « » . 00EASTING - 21312* .14
ELEVATION - 34.22D I P ( + U « 00*N) - - 2 . 3AZXUUTH - 300-9
DEPTH or a/c START
oe^TH or c w MOLE
COIte 01i£NSZ0H3(*m)
2.20
i.72
T.O. - 37 700.0- « I t 01LENC - 4*0
ROCK TChVERATuM iQ. **C
CAUGC SERIAL. NO- M2
READOUT SERIAL NO. 003
TCST QQNE 9Y Cf. OH
INSTALLED-OVERCORED-
OATE TlkCSI -03 -23 204*88-03-23 1035
ACCL - UAL
CSIR OVERCORE TEST
MICROSTRAIN VS DEPTH
HOLE 210-020-RST1DEPTH 2 . 43 (H)
O A T E
FIGURE A-6: 96-mm-Diameter Overcore, Borehole 210-020-RSTl (2.43-m Depth)LEGEND
? «
1 "•
L
g g g
6AUCC ORIENTATION: 9ETA-
* « A L fO
133 DECREES 133
CIRCUIT ERCNTXAL 0
43 DECREES 49
\
s
o o o
v\s' \ - \
^ *\^
s sT T
Kosrrrc o*
G3S«
v
\ wVw
N
• -
\
\
\ \
\
X
v
S S S g7 T 7 T
UICROSTRAXh
_ " * Y1IG6G7
_ .„„„ GS
\
w\
" N ,
\
17 7 7
ROSETTE ! M *
ZL.—^ZZT G10G i l
, _ _ _ „ _ _ _ _ _ G12
|
IL
1
uII/̂/////
— w
II1I
7
t
PR
ES
SU
RE
.14 %Q
12
•
SECANT UODUCUS(CPa)( 0 - 2 3 1 * * ) E3 - 43 * •
E7 - • « . 13
POISSOHS RATIO
<0-23l#a} V, , -
47. 73
O.*3
0. 17
0. 14
0. 11
CALIBRATION fACTORS•ci - i.OOK3 - 1.00
CORE DIICMS1ONS<M>)
T.O - 3 1 . 100.0 • H .O ILENC - ZSZ
CHAIflER LENGTH {«») J*0
GAUGE SERIAL NO
READOUT SERIAL NO.
TEST OONE BV
DATE
JO*
5014
IK
TIVE TfUP
FINISH: »»-04-14 11*4 10.4%
AECL - URL
CSIR BIAXIAL TESTPRESSURE VS MICROSTRAIN
HOLE: 210-020-fiSTiDEPTH 02. 43
DATE 2B->*PR-69
FIGURE A-7: Biaxial Test Results, Borehole 210-020-RSTl (2.43-m Depth)

-A.6-
LEGEND
° 23
L ! i
5 «•
' * 300.
£ S 200H
£ •" >oa.
aoa.
7oa
z »oa.
< 3oa
(A 400.
£ 300.a 200.
100.
-100.
-aoa.
_CELL TEUPWtTER INWATCH 0U1
OATA LOGCER
G. '
GJG4G5G6G7
G9GtOGl 1G12
• • • ! ^ ^
* *
_ . THRUST k N
1
i
ii
i
! i
1 i ,Jj '
i /!/
/ . / / / ^ ' ^ . - ' ^ • • '
7,. r ~
OVERCORE DEPTH - cm
1 rpin
A i ia
1 n
J O
JO a
.15 g
J '
123
.JOO
-IJO ~*
.800
-700
.500
_500
.400
JOO
.200
.100
-100
-zoo
3D
S
f
C
o9T
RA
IN
DRILL HOLE COORDINATES
ELEVATION - 54 22D I P ( - * U . DOMM) - -2 3A2IOJTH - 100 »
DEPTH OF O/C 5TART a 00 •
DEPTH OF CWC HOLE b A3 •
CORE DlUENS10MS(i»)
I 0. - IT 700 0 - 300 00LENS - 99*
GAUGE: SERIAL NO 427
INSTALLED 81-03-1 S 1 U 0
OVEHCOREO Bt-aS-lQ 1100
AECL - URL
CSIR OVERCORE TEST
WICBOSTRAIM VS DEPTH
HOLE 210-020-RSTl
DEPTH. 5 . 5 7 (JOO mm)
DATC IO-APH-69 f
FIGURE A-8: 300-mm-Diameter Overcore, Borehole 210-020-RST1 (5.57-m Depth)
tMTER IN. . WATER OUT
DATA LOCCER
WATER kPo SPEEO flFUTOHQUt N« RATE mm/MTHRUST irN
STJL x: \ ,/7.=-.-,-v- r~
OVCRCORC DEPTH - cm
DRILL HOLE COORDINATESUOflTHJNC - S57D*I» 00
EASTING - 2KS2B 14E L E V A T I O N - 54.22D1P(-*W« DOVM) - - 3 . 3AI3UU1H * 300 ft
DEPTH Of O/C START i 00 m
DEPTH Of { M i HOLE 5 «» 1.
CMC DJiCMSIONSliMft)
ID - 37 700 0 - 1*5 10LENS - tS»
ROCK TChPEftATURE
CAUGC SERIAL NO
READOUT SERIAL NO
TEST DONE IY
12 I 'C
427
001
«j.L
3NS1ALLC0DATE TIME
t a - 0 3 - l B 2 1 4 0
CSIR OVERCORE TEST
MICROSTRA1N VS DEPTH
HOLE 210-020-RST1
DEPTH 5 . 5 7 (200 mm)
FIGURE A-9: 200-mm-Diameter Overcore, Borehole 210-020-RSTI (5.57-m Depth)

-A.7-
**icn I NW I E H our
_ DATA ideceit
_ . WATCH hP« SPECO RPli_ . TOftQUC tit* RATE mmJm.it_ . THRUST kN
0 2 4 1 1 1012l41Cia2022242(2a3032343C3a404Z444le48^053^4S65acaS2C4CSga?1O7l2747lfi7laaQa2a4i*a<atat2«4»i9aV 0OVERCCRE DEPTH - cm
DRILL HOLE COORDINATES•JORTMMC - 397O4tt. 00CASTING • 2>nit 14
OIP(+I<« DO*N> • - nAZIULJTH m JOO.t
OCPTH Or 0/C START -5 .40 *
OCPTH OF EWB HOLE i l ) w
C « f O2tCNS2ON5f*M) -1 .0 . - 37.700 . 0 . <• 144.30IENO - MO
ROCtr TEIFEKATURE I2.2*C
CAUCE SERIAL HO. 427
REAOOUT SERIAL NO 00*
TEST DONE • ¥ : ALL
INSTALLED'OVERCORED
DATE flUE• • - 0 5 - 1 1 1140
AECL - URL
CSIR OVERCORE TEST
MICROSTRAIN VS DEPTH
HOLE : 210-020-RST1DEPTH: 5 . 5 7 (150 ir»)
OATE I2-APR-B9
FIGURE A-10: 150-mm-Diameter Overcore, Borehole 210-020-RST1 (5.57-m Depth)
WHTtR IN. mrcit OUT
DATA LOGGER
_ tiMTER kPd SPEED «PUTORQUE N* RATE mm/mitTMtUST kH
^ - - - ••• - . . . . - A . .
- i " •
1 20 21 20VERCOHE DEPTH - cm
12 44 4« 41 50
0JIUL HOLE C0W01NATESWORTHING - 337041* 00CASTING - I*S»2t • •
OlPf+W* DOW) • - 1 1
A2IUUTH - 300-9
DEPTH or 0/C START 5 J3 -
DEPTH OF rWD rfOLE i-13 *
CORE O2l£NSI0NS(«0
l.D. - 37.70o D. ' at aLENG - 910
HOCK TCIPERATURC • I 3 2 ' C
GAUGE SERIAL NO. : 427
RCAOOUT SERIAL HO. 0 0 *
TEST OONC Or • ALL
INSTALLS0OVERCOREO
DATE T1ICH-09-11 2140aa-oa-it u*o
CSIR OVERCORE TEST
MICROSTRAIN VS DEPTH
HOLE 210 -020 -RST1
DEPTH 5. 57 (H)
DATE H-APW- l l
FIGURE A-l 1: 96-mm-Diameter Overcore, Borehole 210-020-RST1 (5.57-m Depth)

- A . 8 -
«.CC£NO
1 It.
1 * .
* 14
4.
O Q O
5 3 51 1
CAUCC ORIKHTATIOH-
133 DECREE?
45 KCffEES
^ _ _
. \\
\
\
\
-
3 § 2 S
KTA-
U3
43
\
R05OTT 0* •
\
\
o
\ \
\
I\
o a a
\\AV\
.
00
lilCKOSTRAir*
nosmt
-
1 \
\ \
•. I
• •
\\ \
V \
s \• ^
T T
no*S3
" oa
; \ \
VV1
s s
ROSCTTE 340*
/
/
1
l1iniila
(f
o o oo a
0
1
III
JOO
.
51« "
1 0
SECANT M00ULUS(C*a)(0-23l#«) £3 - 43. • *
E7 - 34 I I
P0IS3ON3 RATIO'(0-231*0) V, , -
V, ,, -
31 13
0. (30 230. 240.20
CALIBRATION FACTORS-<1 - 1.00
CORE aiUENSIOHSfHw)T.D- - 37 910.0. - 91 J l
CMAkMER LENOTH(nai> J30
GAUGE SERIAL NO. 42T
READOUT SERIAL HO. 3014
' W I S H a i - 0 9 - 3 7 1030 10.4-C
AECL - URL
CSIR BIAXIAL TESTPRESSURE VS MICROSTRAIN
HOLE 210-020-RSTlDEPTH- 05. 57
DATE ;a-Apw-e»
FIGURE A-12: Biaxial Test Results, Borehole 210-020-RST1 (5.57-m Depth)
**TER IN_ . _ HATER OUT
DATA uOCCCR
iajin
__ « T E R *f>a SPEED RPU_ . TORQUE *m _ . t A T E nWwtc
THRUST hN
I.16 r
OVERCORE DEPTH - -.m
DRILL HOLE COORDINATESWORTHING - 5370*t9 00EASTING - ;»9fi29 34ELEVATION - ** 12Dipr*w, aotwj - -t. JAZIUUTH - JOO 9
DEPTH OF 0/C START b *« i
DEPTH Of E«O HOLE T J3 it
CORE DH-CNSIONSfimi)T O . - 37 703.0 . - JOO 00
LENC - 9t»
ROCK TEI^ERATURE 9 1 *C
CAUCE SERIAL .10. 413
READOUT SERIAL NO J03
TEST DONE BT U L
DATE TTIC
aa-07-06 i4»o
AECL - UI»L
CSIR OVERCORE TEST
UICROSTRAIN VS DEPTH
HOLE 210-020-RSTlDEPTH 7 . 0 5 (JOO rrmi
I
FIGURE A-13: 3(K)-m:n-Diameter Overcore, Borehole 210-020-RSTl (7.05-m Depth)

-A.9-
Ii
i
•x.<X
(EU
a
LEGEND
20.3
3.0
-20.-23-30.
*00_
300.
200.
too.
20.
-10.
-2oJ
-JO.a 2 * * B
VMTCtt IN. WTCft 0U1
OATA LOCCCH
' 'e'i ' ' ' ' 'G2
_. S3G*
.. .05G6
_ G7
l-I^IWPT]
srrt,~;
GHUPJU
itwfm
. THRUST kN
i
i
, .^.JL. Jk. J.. / - * £
V'• i•
ii
J—«•
OVERCOHE DEPTH - cm
, „ , <r—.^..ri:r.L^
ii! n
i.i ! H1
TN or
1*
alia
i:i
if
20>5
J
!-2!
200
.130
.too
JO
™
J O
10
0
-10
-ao
-30
j
TOftO
UC
-
THR
US
T
-
I fM
ICR
OS
>Z
tORTHINC
ELEVATION -DIF(-+i«* 0 0 * ) -
DEPTH Of O/C START
DEPTH or I W HOLE
T O . -0 0 -LENC -
ROCK TElTERATURE
CAUCC SERIAL NO
READOUT SERIAL NO
TEST DOME BY
DATE
337Q4«« JO
34 12-1 i300. 4
* 4« •
7 Ji *
) • 10200 OQ4»]
« J *C
001
•U.L
A £ C - URL
CSIR OVERCORE TEST
MICROSTRAIN VS DEPTH
HOLE 210-020-RST1DEPTH 7 . 0 5 (200 mm)
DATE ^-*JAY-e9
FIGURE A-14: 200-mm-Diameter Overcore, Borehole 210-020-RST1 (7.05-m Depth)
' 2 * $ B 1012UiB»B20222*262B30323*363B«n*2***e»fl50323*5BSB60Sa8*«S6a?07a74T67880B2ai«saa«0«21OVERCORE DEPTH - cm
DRK.L HOLE COORDINATESMCMTHlNC * 55704ft
EICVAIIOH - 34 it01P(+ lv . DOW) - -2.3AilUUTH - J O O *
DEPTH Or 0/C S»ART <j * • •
DEPTH Of EW HOLE 1 33 m
CORe DlhCNSIONSfvWT O - Jt tO0.0. - 150 00LEMC - *t2
ROCK TEITCRATURC
CAUCC SERIAL NO
READOUT SERIAL NO
TEST OOX 6V
i. 3 'C
DATE 1I IC0»-O7- ) l OOJtB8-0T-M 2046
CSIR OVERCORE TEST
UICBOSTRAIN VS DEPTH
HOLE 210-020-RST1DEPTH 7 . 0 5 (150 mmj
FIGURE A-15: 150-mm-Diameter Overcore, Borehole 210-020-RST1 (7.05-m Depth)

- A . 1 0 -
mit* IN
mil* our
. OATA LOGGER
__ U*TCR kPo SPCEQ RPU_ . TORQUE NM RATE mm/nir_ . THRUST WM DRILL HOLE COORDINATES
SORTHT.N9 - 3S70*»t 00
EASTING - 2I9<2I I*
ELEVATION - 34. 22
OXPf-ti'a DOM) - -2 3AZIUJTH - 30Q 9
DEPTH Of O/C START 4 §1 m
DEPTH Or iaC HOLC 7 J3 *
CQHt OIl*HSIOMS(—)
T O - 3*. 10
0 0 - 14 13
LENC - 412
ROCK TChPERATURE 10 * 'C
GAUCC SERIAL MO «»3
READOUT SERIAL HO. iJOJ
TEST D 0 « » r *k /5P
DftTC
• •-07-ii
28 ia 32
OVtBCOffC DCPTH - cm
A£CL - URL
CSIR OVERCORtl TEST
MICR0S7RAIN vS DEPTH
HOLC 210 -020 -RST1
DEPTH 7. 05 (H)
FIGURE A-16: 96-mm-Diameter Overcore, Borehole 210-020-RST1 (7.05-m Depth)
LEGEND
i n
1 L
2«
22.
2a
4 1(L
Sa.
12.
10.
4
V
\ \
g § g— — "
&AUCC MTCHTAT1ON
139 DCCIICCS
ClKCUhTtRCNTIAL
45 DCCRCCS
kV
\
V
S a o
Z ° T
• SETA i«
133
0
49
\
•<>
00.
T 7
OSETTt 0*
. G2
GJ
at
\ k\ \
\
BOSCTTC i »
VV
A\
\W\\\
x\.
g S g
T 7 T
MICBOSTRAIN
N,\\
w\ Vi
d oo a
7 7
_ G«
_ G7
. . 08
\
\ ^
%
s7
HOSETTE 2*0*
GIO
C l l
111/1
li(1Irj;i<i
jl/
g g g
PR
ES
SU
RE
j
o
• 13
10
SECANI UODULUS(CPa)
E7 * 3* 2*
C«v« * 99 O
(0-23k#a) V, , . 0 19V , , - 0 21
V f ,, » 0 33V«v« . 0 JO
CALIBRATION f * C T W SKl - 1.00K* - 1 00
CORE 0TlCN51ONS(«i«1I D - 31 10
O.D. - • • I I
LCNC - 4t2
CHAhBER LENCTM(fM) i*t
C*U<X 5CRTAL MO 415
HEAOOUT SERIAL NO. 90t4
TEST D0»« tt OM
DATE Tt iC TC*F
CSIR BIAXIAL TESTPRESSURE VS MICROSTPAIN
HOLE 210-020-RSTT
DEPTH 07. 05
DATE- J8-APR-49
FIGURE A-17: Biaxial Test Results, Borehole 210-020-RST1 (7.05-m Depth)

-A . l l -
LEGENO.CELL I t *aKTEJt IN>«re« our
. OAT* IOCGEH
TOAQUC N*SPtEO «PMRATE « • / • ! <
OVCRCOftE DEPTH - cm
DRILL HOLE COORDINATESNORTHING * SiTOSti 00
CLtVATIGN - 54 42
- -a i
* 10.0AZIMUTH
DEPTH Of Q/C START .1 .31 •
DEPTH Of C M HO.C . l . M •
COM OlNCNSXONSfM) :
1.0. - I I 00
0 0 - 100 00
LENS - 300
ROCK TEMPERATURE . 11.0*C
GAUGC SERIAL NO. ] « •
READOUT SERIAL MO 00J
K I T OONC iy . on is. ft
1NSTM.LCO.OVCKCOAEO.
OATC TIMEI I -OT-H 1S3D• • - O T - 2 I l i a r
CSIR OVERCORE TEST
MICROSTRAIM VS DEPTH
HOLE :209-054-RST2DEPTH: 2 . 0 8 (600 nn)
FIGURE A-18: 600-mm-Diameter Overcore, Borehole 209-054-RST2 (2.08-m Depth)
C£LL TCUP
-mtcn JNmiEU OUT
WTEH WPa Sl-etD ttPit
TOROUC Nm ff*Tt iWmlr
^ THRUST ItH
JO ^
"I•"I
30 BO 70 flO
OVERCORE DEPTH - cm
W i l t . HOLt COOftOlHATCS
•tCRIHINC - 9970511. OO
£ASTTNQ • I f914 I . | Ttt.CV*TlCM m 34. 4fD1P(-»W« OOM4) • - 2 . 1AZIMUTH - 30.0
DEPTH Of O/C START I S« m
DEPTH Or EWB HOLE | . 1 » •
CORE D 1 I C N 5 I O M S ( < M )
ID. - 31.00O-D. - 300 00LfNO * J0O
ROCK TCUPERATUff£ • I 1 O*C
GAUGE SCRtAL NO. J««
REAOOUT SERIAL NO. 00]
TEST DONE BY - *K. DM
DATE TIUC
8t-07-J5 1004
AECL - URL
CSIR OVERCORE TEST
M1CR0STRAIN VS DEPTH
HOLE 209-054-RST2DEPTH 2 . 0 8 (300 mm)
DATE' 18-APR-B»
FIGURE A-19: 300-mm-Diameter Overcore, Borehole 209-054-RST2 (2.08-m Depth)

-A.12-
•
I
z
a.
a<r
MIC
L C C E N 0
31u so.
I"i ^
500.
S »a
0_
5 0 .
-Si.
-9i
-153.
L • 'L
-J—1—1—L.
. MUR 001
Gi. . . GJ_ G4
(1 M R U S T h N
. . . • 1 . . 1 1 1 | . , . ,
i
If. . . . .
i
OvERCOC DCTH - en.
r J
J—i—i—i—i—i—i i i—J—i—i i i_
\ :
»
J5 5
JO 5
15 S
.10 '
J 0 0
.IOO"1
JO x i
- 1 0
UIC
RO
ST
-70 >
-80 Z
-1 10
- U 0
-150
DRILL HOtt COO«D1N»IE5
ELEVATION - i» 420TP(-rw« D0*N) * -2 iA21UUTH - JO 0
DtPTh O<- t*C HOtE 2. J6 i
TO - Jt i)O0 0 - 3DO 00
ROCK TEtf>ERATUR£
GAUGE SERIAL NO
O»Tt
11 0*C
Jt6
T1UC
* £ C t - I/KL
C5IR OVERCORE TEbT
WICROSTRAIN VS DEPTH
HOLE 209-054-RST2
DEPTH 2 . 0 8 (200 rr-i.)
FIGURE A-20: 200-mm-Diameter Overcore, Borehole 209-054-RST2 (2.08-m Depth)
£<
i
<s&a
30.
^ ZO
( «5L
! io.
LEGEND
^nn
*0O_
300.
; 200.
100,
sa
40.
30.
za
10.
a
-10.
-20.
-30.
. , 1.
Err;:;
0 Z 4' 1
OATA
1 GI 'G2
. . G3_ G4. - G 5_ G6_ G7
GS. . G9
• 10 13
TEMPINOUT
LOGGER
mm
14 I f
, 1 !i ,
Tr 1 -
i t SO 22
n
24 28
. TMRUST kN
r
4f
21 30 32 34. 31 38 40 ll *4 4'* 4S 50 52 34 56
OVERCOHE DEPTH - cm
« orIS
. 1 .
' 1
>
- ' • • 4 y -
20
.10
no
20a
.ISO
30
-50
40
JO
-20
10
Ji
-20
-JO
31 *0 12 I * St Cl 7
*
ft
UIC
RO
ST
>
•x.
AZIUU1H - 30 d
DEPTH Of 0/C START 1 34 *
DEPTH 0 / EttC HOLE I , J « •»
COKE 0IhCHSI0HS(«w)I D * 11 000 D ' 111 00LENC - 300
ROCK TEl*CR*TUK£ 11 O'C
GAUCC SCRIW. NO J<*
READOUT SERIAL NO 003
TEST DONE *f
DATEINSTALLED • • - 0 7 - 2OVCRCOREO 1 1 - 0 7 - 2
1 13307 1131
*£CL - URL
CSIR OVERCORE TE5T
MICROSTRMN VS DEPTH
HOLE 209-054-RST2DEPTH 2 . O S ( 1 5 0 fwn,
DATE J?-APR-I«
FIGURE A-21: 150-mm-Diameter Overcore, Borehole 209-054-RST2 (2.08-m Depth)

- A . 1 3 -
HATE* kM „ . . 9TCE0. IMOUC N» RATE
IHKUST kH
^>^^^'^V^^^<^»^^^
DftlLl HOLE COORDINATES:NORTHING - 3370311 OD
- S t .«3- - 2 . 1- 3 0 . 0
ELEVATION
A2IMUTH
DEf TH Or O/C START : i . 16 -
DEfTH Or EVA HOLE 2.3t •
CORE DlkCNSIONS<M>>1.0 - 31.000.0. - »*.00LENC * 500
ROCK TEIPERATURE - 11.O'C
QAUCE SERIAL NO- J*S
READOUT SERIAL NO 003
TEST OONE I V ' KS, 0 *
INSTALLED'OVERCOftEO•
DATE T2t£8A-O7-Z1 l»30ea -07 -3? 1441
CSIR OVERCORE TEST
MICROSTRAIN VS DEPTH
HOLE : 209-054-RST2DEPTH: 2 . 08 <H)
FIGURE A-22: 96-mm-Diameter Overcore, Borehole 209-054-RST2 (2.08-m Depth)
LEGEND:
QtG2ca
zt_
2L.
24
22.
20.
* 111
Uior if.
s i*.CL-
IO.
4.
0. 00
1
z
/// ,
y
I i
7/
s
y
S
/
/
y'
y f
/
/// ,/•' y
;
j
/
77y
//
/ ' •
7
CANTILEVER STRAIN X 10"
f
•/
/
u
It
20-•
>• S
.» si
.4 *
12
10
I - -9* M **
StCAMt HOOULUS(GPB).( 0 - I 5 l * o | Cl - 41.34
ea - js i«El - 21 11C*v -
CALIIftATlON f ACTORSiCI -K2 -Hi •
CMC fiIl£MSIGNS(«)
34. 74
2* 1313 4425.10
I D - 31 00O.O. - 100.DO
CHAMIER LEHCTH ( M ) : 121
CMJCC SERIAL NO fl«3
REAOOUT SERIAL HO
TEST OOHC IV
DATEITAUt ; 1 1 - 1 0 -
1014
KM
TIME T C *0 134S (It O'C0 IJ55 C» O'C
AECL - URL
USBM BIAXIAL TESTPRESSURE VS MICROSTRAIN
HOLE :209-054-RST2DEPTH: 0 2 . OS RA:00O*
OAIE 5-KAV-et
FIGURE A-23: Biaxial Test Results, Borehole 209-054-RST2 (2.08-m Depth)

- A.14-
LCCCHO:
. WATER OUT„ . _ _ . _ DATA LOGGER
MATCH kp« . . . SPC£O I_ . TpROUE Hi. RATE m_ . THRUST UH
_ O 21J 03
04G5G6G7oa
I G9
OVERCORE DEPTH - cm
DRILL HOLC COORDINATE5
•JORTH1NS - 3370311 >
ClCVMIOH - 34. 43
AZIUUTH - JO 0
DEPTH OT 0/C START i it m
OEPTH Or EWO HOLE 4 . 1 2 M
COM 0ItCNSIONS{aw)
io. • 3a oo0 0 - 300 00LEHO - 300
ROCK TEiTERATURE lO.fl'C
GAUGE SERIAL NO 4I«
READOUT SERIAL NO 003
INSTA1.LC0OUERCOKEO
DATE TI tCifl-07-2» il»Ott-OI-03 20M
CSIR OVERCORE TEST
MICROSTRAIN VS DEPTH
HOLE 209-054-RST2DEPTH 3 . 96 (300 fim)
FIGURE A-24: 300-mm-Diameter Overcore, Borehole 209-054-RST2 (3.96-m Depth)
WATCH I N. . WAtCK OUT
DATA LOGGER
_ . VttkTER hPa SPEED KfU_ . XOItQUC Ntn RATE irmJm%t_ . THdUST liN
OVERCORE DEPTH - cm
DRILL HOtC COORDINATES10RTH1NC - 3 3 7 0 3 1 * 00
ELEVATION0 1 P f - * w * DA2IuUtH
* 34.*2
- - 2 t- JO 0
DCPTH Of a/C ST*«T
DEPTH OF CMC HOLE 4 . 2 3 <•
CORE OIlCNSIOMS(m-)T O - 3» 000 0 - 200 00LCHG - 300
ROCK TEkFEftATURE
GAUGE SERIAL NO
READOUT SEAIAt MO
TEST DOME 6V
INSTALLEDOVERCORED
• 0 «*C
TIlC1130
CSIR OVERCORE TEST
MICROSTRAIN VS DEPTH
HOLE 209-054-RST2DEPTH 3 9 6 (200 mm;
DATE J7-*M-*t
FIGURE A-25: 200-mm-Diameter Overcore, Borehole 209-054-RST2 (3.96-m Depth)

- A . 1 5 -
. mitt hfo - 5PCCO RPU_ . TOBOUC No RATE t„ . THHUST kN
O 3 4 < | 101214 l» l l3023242«2l3O32343»3J«042444f4aS032345t3a«OI2f4S»«a7O72747«7l«ai2 l4««SI«OOVERCORE OEPTH - cm
MILL HOLE COORDINATES
ELEVATION - S4 41D l P ( * i ' « OOUH) - - 2 1
A2IJUIH - JO &
DCPIH Of 0/C START J Jl •
OEPTH OT E M HOLE 4 . 3 2 •
CMC O I X N S I Q N S ( M )
r.o ' it oa0.0 - 130 JO
LCHC - 300
ROCIT TClTCRAiURE 10 I'C
CAUU SERIAL NO *•«
REAOOUT SERIAL NO 003
TEST PONE IY VS K3
2NSTALLE0OUCflCORfO
OATC I I *M-07-It 1303Sl-Ot-tt 0100
CSIR OVERCORE TEST
MICROSTRAIN VS OEPTH
HOLE 209-054-RST2DEPTH 3 - 9 6 (150 rrm;
DATE 2?-*FR-tt
FIGURE A-26: 150-mm-Diameter Overcore, Borehole 209-054-RST2 (3.96-m Depth)
I—ar»TM or
ao as it za 2a Jo 32" ?4~OVERCOflE OEPTH - em
DBTLL MOLE C0OHDIMATC5•JMTH1NC - 3 S 7 0 3 I * 00EASTING - 2»5««t.47CLEVATIOM - 54.430!P( * lv * OOW) • -2- IAZIUUTH - 30.0
DEPTH Of 0/C START
DEPTH Or E M HOLE 4 21
cone D]ICNSIMS(M>)1.0- - 3D 000.0. - 100 00LtNC - SOO
ROCK TElPEffATUre IO.**C
OAUCE SERIAL HO 4»
READOUT sr t lAL MO 003
TCST DONE BY VS. KS
INSTALLEDOVCRCOftED
OATt TIUE8 8 - 0 7 - I t tBiOBi-oe-ii in*
CSIR OVERCORE TEST
MICROSTRAIN VS DEPTH
HOLE 209-054-RST2DEPTH 3 . 96 (H)
OATE• a-MAY-Bt
FIGURE A-27: 96-mm-Diameter Overcore, Borehole 209-054-RST2 (3.96-m Depth)

-A.16-
3a
21.
2*.
24.
* "i
ia
A.
a
I.CGCNO
\
\
I I I
4AUGE ORIENTATION• X1AL133 OCCflCESC1RCUUTEREN1IAL43 OECftEE?
A
\ ;
\\ \
1(T'10
'350
«5
\
\ \
, \
-
\ \
. \\
T
nosei
li!
\ l
\
\
\\
TC 0 J
G;G .
k\
1l \
•1\ \
\ \
s ^
" N
T T
\
\
\ \
v V\ \\ \
\
fU1CROSTRA1N
- • -
\ \
I\\{•
w%
s
TC 13
" -
1
\
\
i '
\ V.
\ \
A
o
0*- - G 3_ GS_ G7— G8
\
\
v\
ffOSCTTE 3*0*
/
1 /\!>
i fLiI/,
l ' /
1 !i
1
a a o7 "" "*
_ GG
.. G
1/ /
/
Ti
012
•
I i
J O
1*
J3P
fiES
ii *"*
12
10
*
0
<0-33t*«} E3 -n •»e r t -c . . . -
(0-33(V«) V, , *
V f ,, -
CALIIRAIION fACIOM«(l - 1Kl - 1
COtC attCN5I0MS(M}1 0 - 30 . 0 - t
• ft1 327 837 73
0»31
. 3023
0000
1 0000 00
CHA40CR LENOlHlm) J«0
GAUGE SCKlAL NO «<•
HEAOOUT SERIAL NO >01*
TEST 0ONC IY K3
DATE TIlC TEkT
'1NISH I I - O I - 2 3 1)S» 10 »'C
CSIR BIAXIAL TEST
PRESSURE VS UICffOSTRAlN
HOLE 209-054-RST2
DEPTH 0 3 . 9 6
DATE :a-*pR-fl*
FIGURE A-28: Biaxial Test Results, Borehole 209-054-RST2 (3.96-m Depth)

- A.17-
A.3. STABILIZATION MONITORING PLOTS
W It H |N
«UTCR OUTDAT* LOCMR
_ . TOtlOl* MB_ . IHRUJT hH
0^"' *"*" •—'—•---.- ^ .^^crrr^r^r^.
S*0 *IO TIB HO 1100 1««0 UtO iflO 2110 2400 I«*0 1880 3130 3j«0 ]«0O 3t«O 40t0 *3J0 *3*0 4100 !
SKILL HOLE COOROIK&tCI
CLCVATIOH . s* ii
Olf( + l-« OOWt) - -t.3AHIUTH - 100 I
OEPTH OF O/C SlART 1.90 M
H M H or CM HOLC X.Tt •
CORE 01lCH91ON3tm)1ft m 31.000.* . - •00-00tfNt - sat
HOCK 1[WI*MMC
«AUCC setiAi NO
READOUT SCRIM. MO.
TC3T OOP* I T
It •T
tit
001
MS. U.C
IN3TM.LC0OVERCWCO-
OAtC T I NM-Ol-li 1109M-O)-tT 1119
CSIF OVERCORE TEST
MICROSTRAIN V5 TTfcC
H«.t 210-020-RST,OCPTH 2 . 43 (600 m)
FIGURE A-29: Post- 600-mm-Diameter Overcore, Borehole 210-020-RST1(2.43-m Depth), 88-03-17 22:37:11 to 88-03-21 09:08:46
_ _ _ « U T C R IN. _ . _ . _ . VMTCR OUT
OAl* (.06CCR
m m u*m_ . . . . . TORQUE Ha_ _ . _ _ , _ _ . TMRUFT km
Gfl- . . _ . Cfi
HO. . „ — _ . G10Gi l
*I?S3i:*MC£31
300 i«0
TXUt - mi.
M I L L HOLC COOROIIUTCl•iORIHIHO - »»»*••C*STIN« - itin* iCLCVAIJM - J*. 11stf>(«i*« oom) - - a . j
AXlMUtM • JOO.I
KPtM fiT O/C tTMT 1.90 >
OCPXH V I K MOLC <• 71 •
CORC OltCHlKMSfaa)I B , * at ooO.P. - 100.06LINC - 3M
NOCK TCITCRAlURC
CMIGC scmu. MO
WAD0U1 UR1AL NO.
TCST DOHC «Y
oto
003
OftlC TliC• • - O J - J T 110091-03-17 2143
CSIR OVERCORE TEST
UICROSTRAIN VS TJhC
HOLE 210HD20-RST1DEPTH 2. 43 (600 m)
±L.
FIGURE A-30: Post- 600-mm-Diameter Overcore, Borehole 210-020-RST1(2.43-m Depth), 88-03-21 20:21:20 to 88-03-22 08:13:23

- A . 1 8 -
UECCNO_ _ ^ _ _ CELL f Ct^_ _ • _ mnn IN_ . _ . _ . MkTCB OUT
_ _ » _ „ DATA LQCCCII
— . _ . _ . — . _ TORQUE N«DRILL HOLE COORDINATES-
NORTHIMe - » 7 D < M . 0 DCAST1NC - |«9*3t.t4ELEVATION > s«. l lDIP(*W« OOW) • - l . J
AZ1WU1H - 30D I
PCMH Or 0/C ST*H1 - 1 4 * •
K f T H Or t *C MOLt 1.71 m
cane 0 f t r N 5 H » s < * W
l .D . • J I .00O.P. - 300.00IKwe - seo
ROCK TCl^eilATIifte ' >0 **C
C*UCt SERIAL HO. 000
MAPOUl SCR1A). MO 003
TtSl DQ*C IV «S. CX. C
INSTALLED-
OVCKCOHCD'
D«1C 11IC(•-OJ-15 1*00• • - 0 3 - 1 1 1*00
C5IR OVERCORE TEST
UICROSTRAIN VS TIME
HOLE 210-020-RST1
DEPTH 2. 4 3 (JOO «»)
FIGURE A-31: Post- 300-mm-Diameter Overcore, Borehole 210-020-RST1(2.43-m Depth), 88-03-22 16:31:40 to 88-03-23 08:44:25
9R1LL HOLE C00M01NATCI•KWTN1NS - 5 )70* *1
CLCVAT1QH - 34.130 1 » ( « I * B OOWt> - -2 3AriUUfH - JOO •
DEPTH 0/ 0/C START I «• •
DCPtM Of [«O HOLE 1 ~l *
CMC DIUCMSlONS(w)1.0 - 3» 000 0 - 100 00LEMC - 300
NOCK TElVENATuftE
t*uCt ItMlAL NO
READOUT SERIAL NO
U S ! OQftf «Y
10 4*C
DATE
• • - 0 3 - 1 1 t
CSIR OVERCORE TEST
UICROSTRMN VS TIME
HOLE 2 1 0 - 0 2 0 - K S T t
DEPTH' 2. 43 (200 rm)
FIGURE A-32: Post- 200-mm-Diameter Overcore, Borehole 210-020-RSTl(2.43-m Depth), 88-03-23 23:47:32 to 88-03-24 09:02:48

- A . 1 9 -
LCCCNO
— " » IN_ „ _ . _ . m i c a OUT_ _ _ _ _ _ 0A»* kOQCC*
400.
J• 300.
I 1ML
» 0 .
°-
——•—
02
ri03OS
570» ,09
mien ̂ «.r̂ "i^J
S
^ — • — -
^ " ^ ~
i -J • - • • > - T — — * ^ , — - " T - a t a £ _ _
.190
30
1*0
- »
a
498 «OC
TIlC - Ki
WILL NOLI COM0IIUTC1-•fORiMlKI • })!•*••.MtW\U$ m 1*9*1* • •• ( . IMI IM • »« JlBIP<*t'« IOWI - -».JA11MJIM • 1H.I
perm or «/c ITMT I.«T •
oc^m or C M MOLC J . T I •
CORE ei_tl(IIWS[-»)
i t . - ja.«tO.t. * !»• 0»LCHO * « •
•oat TrtruunMC - • • **c
l-liCC ItNlM. NO- «M
RCAOOVr UR1M. MO. M l
TCST oa« I T «j , at.c
O*TC meIHSTU.LCD- l i -03-«T l | | «oviffcono it-03-u uof
CSIR OVERCORE TEST
MICROSTRA1N V5 TIME
HOLE 210-020-RST1DEPTH 2. 43 (130 m)
FIGURE A-33: Post- 150-mm-Diameter Overcore, Borehole 210-020-RSTl(2.43-m Depth), 88-03-24 15:39:36 to 88-03-25 09:09:24
M I L L M«LC COOMIMATCS•tOHTHlHa _ »7««tfl MCASTIlM - X«»ttt •«ILCV-tlON - 9 * 1 *O I P ( - * < * « oom) - -2j
A2IWUIH - ) • • •
K # T M or o/e S T _ T j . i * •
oc*TM of i n wac J7 i •
CMC •liCHSI_f(_)
1.0 - 31 1*0.0 - Mil
LCHO - M l
•OCX TCWWUTtrtC i» ••€
U M I KKtAL NO. J31
M-BOUT UHIAL NO. 003
TCST OONt IV • V . DH.ff
DAir TIiC•• -OJ*]3 10*4
CSIR OVERCORE TEST
UICROSTIUIN VS TIlUE
HOL£ 210-020-RST1
DEPTH: 2. 43 (H)
FIGURE A-34: Post- 96-mm-Diameter Overcore Pressure/Temperature Test,Borehole 210-020-RSTl (2.43-m Depth), 88-03-25 11:16 to 88-03-25 14:25

- A.20 -
L £ C E W -
., _ OAlA LOCCtK
« ^ - - - - - - p L - - — L ^ _.-.__
s «. ± __
* T 1 ] 1Sflrt
_ *oo. _ _ _. - - - - - - - - - -
' " 100. ± -.M I T
i s »«. I _ _ _ _ _
0. pd k. .•win
G I
^ too. _ f i l _ _
-•oo, . ' :" ( i ( 1^.n,«, , . 7 .B
TIUC
,. jjj
. La . ,„ ! S
_ . L O J O I ?
-« ; £ i • " _ JBO
«--*-'""s'""- 3 " 3
o
-r- _ , J . J p_ _ , _ .-100
DRILL HIXC COOtplNATtl
DJ-( + . ^ . 00-*) - - t . JA2IHUTH * 300 t
OCPTK Of CIW MOtt J.5J •
I D - S» >0
LCNC - 391
10 *"C
CAUCC SCRtAi. HO JS2
WA00UT SCRIM. MO 00)
TCST fiOC RV
DATE
CP.DM *
Ttyr
OVERCMCO • • - 0 3 - 1 3 m l
AfCl - U"L
CSIR OVERCORE TEST
UlCftOSTRAlN VS TIM.
HOLE 2i0-020-RST)
DEPTH 2 . 4 3 (H)
FIGURE A-35: Post- 96-mm-Diameter Overcoie, Borehole 210-020-RST1(2.43-m Depth), 88-03-25 16:58:18 to 88-03-25 18:35:53
, *»TEi IN4 * T [ | OUT
„_ ^. 0 * 1 * LOCCCR
•20 1*00 2110 33tO 3BI0 *JJO 4*00 33IS 97*0 «a*0 «7I0 T200
OtP(-*ln« 00«M) - - I J
AiltAlTM - 103 •
OCflM of 0/c STAR! 1 i)9 •
OCPTM Of C«B NOLC 1 1 3 •
COW I 1 0 - 310.0 - iOOLCNC • 309
00
ROCK TCt#CfUTuAC fl K
Q U t O C S E R I A L N O * X 7
R E A D O U T S E R I A L M Q O 0 «
T C 5 T O O H C * V O t . O H . K
OATC TtlCMS7M.LC0 M-03-»» J)DO0VCRC0M0 IS-O5-I0 MSI
CSIR OVERCORE TEST
MtCROSTRAlN VS TIM£
HOLE 210-020-RST1
DEPTH: 5 - 57 (300 mm)
FIGURE A-36: Post- 300-mm-Diameter Overcore, Borehole 210-020-RST1(5.57-in Depth), 88-05-20 14:19:47 to 88-05-25 08:20:58

-A.21 -
mxtn IN_ . WTCR OUT
DATA IOCCCR
. . . . . . WITCH **•TORQUC W*TMIIU1T UN
II
M I L L HOLC COORDIIUTCS•KMTHtMC • 337C««t C3CA3TINS - Iflllt «*CLCVATIW • 3J I IOJP<+i,. QOW) - - t lA1IUJTH - 304 I
OC#TH or o/c sr**T s ao ••
OCfTH or CM MOLE ) IS •
COM DItCN31ONS(—.)
TO - it JO0.0. - 100 09
LCNQ - 90S
ROCK TCtFCRATUMC IJ.1T
«AUCC 3CR1A1. MO. *17
RtAOOUT SCtllM. NO. dOfl
T t l T OOMC *V H.L
CSIR OVERCOME TEST
MICWOSTFAIN VS TIME
HOLE 2 1 0 - 0 2 0 - R S T 1DEPTH 5. 57 (200 i-w)
FIGURE A-37: Post- 200-mm-Diameter Overcore, Borehole 210-020-RST1(5.57-m Depth), 88-05-25 14:25:33 to 88-05-26 08:27:47
CSIR OVERCORE TEST
UXCROSTRAIN VS TZUC
HOLE : 2 1 0 - 0 2 0 - f t S T lOEFTH; 5 . 57 (130 «•)
FIGURE A-38: Post- 150-mm-Diameter Overcore, Borehole 210-020-RST1(5.57-m Depth), 88-05-26 12:56:00 to 88-05-26 13:45:20

- A.22 -
M I C * IN_ _ . _ _ . _ . MICH OUT
OAF* LOCCf*
*00
500
too.
ioa
n
• 00.
a.
nn
— —
1117.
JzZ-
02_ . 03
Oi.. -OS. _ 08
0700G9010CM
\ . ~ . -~
V
t
v :
32'*-X
w^^«=w^g^>»* ̂ y^H** *" * * f *' *"tji ""p'w
JOS
.130
J I
JOO
100
.a
ELCVAI10M - 1 * 21
A2IIWTH • 3 « 0 . t
C^TM Of O/C 9TAJIT - 3 . 0 0 •
•CTTH OF C M HOLE 4 « » •
1.0. « J ' * •0.0 . - • • J*Lena - «oi
KAOOVT SERIAL. MO- OOt
TEST OONE I T - M.L
INSTM.LCO-OVHCORCO-
CSIR OVERCORE TEST
MICROSTRAIN VS TIME
HOLE 2 1 0 - 0 2 0 - R S T 1
DEPTH 5. 57 (H)
FIGURE A-39: Post- 96-mm-Diameter Overcore Pressure/Temperature Test,Borehole 210-020-RST1 (5.57-m Depth), 88-05-26 15:27:53 to 88-05-26 21:29:32
i
u£E£»
Z
oS5
LECCNO-
ttto.
14
10
400
300.
100.
10L
10.
a.
~ -
J
'l
0 2 « »
_ C t l L T t »
. . MTtft OUTOATA LOCGtl*
. .^_.^rr
C2. . OJ
G4. . 0 5
06_ 07
— °' .*,
—
\J'f \\ffl
TH—JST hM
T1UC
_ _ . . _ ircco
; ,
- mm
'" ,
t
. . . I . . " -
i xa
VW
«s
••Ii*-
if.too, ,50 s f
<0
ES
* sI
-10
WILL HOLE eOOmlNATCI•ftMTHINO - 9970«l*. 00CASTINC - J t S I I f • •
OJF(+I*« ODIN] * ->-3ATIKJTH - 380- *
OCFTH Of O/C START » *« *
COME OXICNSIMSIm}-1.0- - 3fl iO0.0. • 300 00LCMC - 4*1
ROCK TEtKtUTURC t . • T
cAuac icffiAL m «i»
HfAOOtn SERIAL NO 065
Tt iT OOM » r - «IL
DATC TIlCINSTALLED' i l -OT-Oi 0031OVtNCOKED I I - 4 T - 0 I 1733
tfCw - U«L
CSIR OVERCORE TEST
MICROSTRAIN VS TIME
HOLE 210-020-RST1
DEPTH 7 . 0 5 (300 mm)
DATE 2-4UT-4*
FIGURE A-40: Post- 300-mm-Diameter Overcore, Borehole 210-020-RST1(7.05-m Depth), 88-07-08 16:27:27 to 88-07-08 17:33:06

- A.23 -
DRILL MOLC COORDINATES•IORTHTNC - 9970411. 00CASTXMO - ZtUZt «*ELEVATION • 34.1ZOIPf+i*« DO1H) - -1 .3aZIUUTM m 300 1
DEPTM or O/e STARI • • *9 •
oepTM or C M w a r 7. J J -
l .D. -O . D . •
LEM9 -
MOCK TZkPCR*TU*t
CMIGE SERIAL MO.
KA0OUT SERIAL NO.
TEST DOW *r
OATE
••-07-1)
I 44 41 90 SI S* 9* SI •• M •«
ACCL - URL
CSIR OVERCORE TEST
UICROSTRAIN VS TIME
HOLE 210-020-RSTlDEPTH 7 . 0 5 (200 rnn)
0* TE
FIGURE A-41: Post- 200-mm-Diameter Overcore, Borehole 210-020-RSTl(7.05-m Depth), 88-07-11 13:37:25 to 88-07-11 14:39:24
VHTCR INW»TER OUT
. OAT* L0CCCR
. » . WtJt* kp«_ . . TW0UC Hm- . THRUST kU
900.
too.I
'• 300.
! loo.
100.
DRILL HOLE COOROIMATCSNORTMTNC • S3T04C*.a0
CLCVATIOM • S* I Ioir(•*!*• aowii - - i 3AIIUUTH . 3 0 0 . •
DEPTH or a/c START • 4» «
DEPTH Of [«C HOLE 7 J i •
CORE O 1 I C N S 3 O N S ( M )
to. • JI. id
0 0 - ISO. 00
MOOC TCl#ERATUfl£ % }
QUICK SCRIM. MO. 419
READOUT SERIM. MO 003
TC3T DOK I f «j.L
BiTt TIiC1I-O7-M 0031•t-OT-ll 104*
CSIR OVERCORE TEST
UICROSTflAlN VS TIME
HOt£ : 2 1 0 - 0 2 0 - R S T l
O£PTH 7. Q5 (ISO mm)
FIGURE A-42: Post- 150-mm-Diameter Overcore, Borehole 210-020-RSTl(7.05-m Depth), 88-07-11 19:37:12 to 88-07-12 08:30:16

- A.24 -
0*lLL "01.t COOROINAiCSSOUTHING - 137OIM 90CAITIHB - itstiti*CLCVAriON - 9«. I I0IP[*l*« COIN) - - * . SAZItftJTH * 300 t
DCPTH Or 0/C STAUT » *3 >•
XfTM Of CM «OLC T. J3 .
CMC 0H*NSTWJ<—>
1.0 - JW 10O.D - • • UtCNO - *»I
ROCK TCmitAIUKt )0 I*C
«*U« SfflZM. fO *13
«AO0UT tt»lAL HO. OOJ
TCHT OOHC tT * *K/SP
OATC T1UCM-07-01 00]»• • - 0 7 - 1 1 1200
CSIR OVERCORE TEST
UICROSTRAIN VS TIME
HOLE 2T0-02O-RST7DEPTH- 7 . 0 5 {H)
DATE- J-M»Y-M
FIGURE A-43: Post- 96-mm-Diameter Overcore Pressure/Temperature Test,Borehole 210-020-RST1 (7.05-m Depth), 88-07-12 16:44:59 to 88-07-12 20:01:34
— . _ . _ _ . «rr« OUT3 A T A LOCCCft
9W3LL M a c CQO*OIN*Tt3-•KWTH1H0 « JS703I* . 30
C A S T I N G - i»s««i *7CLtVATION - 34 4]
- - J . 1ZIUJTH . 3 0 . 0
ROCK TEt*Cft«TURC
CAWSC S M I At. NO. J l l
READOUT SERIAL NO. 003
TEST 0ONC I V DW.KS.
"u sio" * 4 S i i
L C12
-.ooJ v-—"-"r""-""^;^-""I"Il*17^171"I71"rj-lTC" .->00
.-200
CSIR OVERCORE TEST
MICSOSTRAIN VS TIME
HOLE 209-054-RST2OEPTH' 2 . 0 6 C600 mm)
FIGURE A-44: Post- 60()-mm-Diameter Overcore, Borehole 209-054-RST2(2.08-m Depth), 88-07-22 19:39:00 to 88-07-25 16:57:00

- A.25 -
. _ M U R IM _ . — . _ . _ . _ . IOROUE M»_ . WMTCft OUT _ _ . „ „ . THRUST bN— 0 * 1 * LOCCCft
I « • a 10 I t H I I IS 20 23 24 21 21 30 32 >« 31 3B 40 42 U 41 U SO 92 9* SI SI «0 12 14 «• • • 70
CUCV4H0N - » • - • •oi^(4i*t torn) m -itAZIUJtH - 30.4
DCPIH Of 0/C STMT l.»4 i
KPTH Of CIC MOLE !.|t *
cone oi icmiONi<a«i
t.O - 11.000.0- • JOPMLCMO - SOD
K M.Ot
SWGC SCKXAL NO Jl»
RCKOOUT SC1I1U. HO 003
TEST DDK »r « . Cm
DATE TliCJHS1ALLC0- a i - 0 7 - t t 1939OVMCOWe- J I - 07 -19 200*
CSIR OVERCORE TESTMICROSTRAIN VS TI^C
HOLE 209-054-RST2DEPTH: 2 . 0 8 (300 rm>)
OAie • 4 - *wr -« t
FIGURE A-45: Post- 300-mm-Diameter Overcore, Borehole 209-054-RST2(2.08-m Depth), 88-07-25 20:04:47 to 88-07-25 21:10:06
MTCN TMVMTCR OUTDAT* LOCCtR
_ . . l i iTW kP*_ . - . _ TttOUC Hm
_ . THKUST bN MILL MAE COOtDlMTCS•HHTHIHC - 5JT0SH. ft
KLCVJITXON - »*.•!DIP(•***• OOW) - - 2 . 1A31UUIH - 30.0
XPIM Or O/C 3TAR1 1.54 H
K P I H or t i e HOiE - 3 . * « i»
COM 0»CNSI0NS(«a)
1.0. - 31.000.0. - 200.00
LC*C • 500
ROCK TCIPCflAllME ' H.flt
CAUOC S H I M . NO. J M
KADOUT SCRIM. NO- 003
teST DOHC IV - «3.DW
1HSTM.LCSOVCtCOKO-
OATC TliC•1-07-11 1SJD
CSIR OVERCORE TEST
MICROSTRAIN VS TIME
HOLE 209-054-RST2DEPTH- 2 . 08 (200 m)
D*Tt • *^*>Y-*t
FIGURE A-46: Post- 200-mm-Diameter Overcore, Borehole 209-054-RST2(2.08-m Depth), 88-07-25 22:06:16 to 88-07-26 09:22:35

- A.26 -
i ui« iaS n
s ':& a
LCCCNO
* r t f l . . .
j *
IS Ml
<
104^
13a.
J 101•C
o
a.
-90.
__
. DATA kOCCZt
\
GiCJGt
G6G7GBGtG10Gi l . . y '
- MIA
•
JO j
:«iJ n
*aS
I 30.
1 ia
1 0 01 i
ISO
""• s
aJO 1
z
j>
-at
OKILL HOLE C00R01NA•iOHTHlNG
CLCVAT10N01P(-M«* OCNN) •
OEFTH OF O/C S1ART
DCfTH DT two MOLC
TtS1S7011I.00
54.(1
-1.110 0
1 34 *
l . S < -
T.o. - i « oo
0 D - 100-00UHC - 300
ROCK T C W C R A T U M M ft*C
SAUCC SERIAL NO. J t t
READOUT SERIAL NO. 003
DATE T!hCINSTALLED a t - 0 7 - n is JOOVCRCOREO • • - 0 7 - I « 1133
ACCL - W(l.
CSIR OVERCORE TEST
UICROS7RA1N VS TIME
HOLE 2 0 9 - 0 5 4 - R S T 2
DEPTH 2 . 08 (200 mr.)
DAIC 2 7 - A M - H
FIGURE A-47: Post- 200-mm-Diameter Overcore, Borehole 209-054-RST2(2.08-m Depth), 88-07-26 11:52:00 to 88-07-26 18:34:02
•latiHTHOtASIIMC
- 13709t* 00- 1*914* IT- 3*. 11
ocmt) » -i. i- JO O
»4 >.DCPTH Of O/C 3TART
MftH or CM HOLE X.Ji
COJIX OlUENtlONSfasI
T.D. - 31 000.0. - M 00LCMO - 300
•oar ie«»en»iu«t;
OAUCC SERIAL NO.
HCAOOUT SCRIM. MO.
TCJT 0OHC »T •
OATCti-07-tl
t.o*c
C5IR OVERCORE TEST
MICROSTRAIN VS TIME
HOLE 209-054-RST2
DEPTH 2 . 0 8 (H)
PATE
FIGURE A-48: Post- 150-mm-Diameter Overcore, Borehole 209-054-RST2(2.08-m Depth), 88-07-27 13:18:23 to 88-07-27 13:50:04

- A.27 -
OZ^(«lv« 0O*N> - - 1 . t
AZIKJfH - 30.0
DCFIH or o/e j t w t i i.»« *
K f l H or CM NB.C ).J« •
COffr eZtCMS3CN9|aa> -1.0 - J* OB0.0. • •• 00
LCHC - 900
HOCK TEireHAluftt n.0*C
CMfGC m i A l NO- i l l
NtAOOUT SCHlAL HO. 003
TEST DONE tY - ftl. 3 *
DATE TItft••-07-11 1330••-07-17 ••«*
CSIR OVCRCORE TEST
MICROSTRAIN VS TIME
HOLE 209-054-RST2OEPTH- 2 . 0 8 (H)
FIGURE A-49: Post- 96-mm-Diameter Overcore Pressure/Temperature Test,Borehole 209-054-RST2 (2.08-m Depth), 88-07-27 14:41:12 to 88-07-27 19:47:07
mil* JM• * « " OUTp«1* IOCGCR
is
MC
101
C2G30'S50«07OBe»
ioa ctoCtiCIJ
M I L L MOLE COOR01HA1ESUOTTNtHC - 9370911
ILCMT30N • 3**1DIP(•*!•• DOW) - - S . tAZIIVtM - 30.0
KF1H or O/C START J .4 I •
DCMH OT CM MCCC : « , j j -
CORE DllCNnONS(PM) -1,0. - 31-000.0- - 100.00ICHO - 900
PlOCtf TEtPEHAIUKC : 10 f C
•MJOC KR1AL NO. 411
REAOOtn KR1AL NO. 009
TCIT DOME «f • VS. SIT
3NSTW.IEP
ovcircano-
DA1E HUEM^I7-ia i>90<«-a#-i* t in
CSIR OVERCORE TEST
MXCROSTRMN VS TIfcC
HOLC -209-054-RST2OEPTH 3 . 9 6 (200 m)
FIGURE A-50: Post- 200-mm-Diameter Overcore, Borehole 209-054-RST2(3.96-m Depth), 88-08-18 16:22:02 to 88-08-19 08:15:26

- A.28 -
!i
ui
z
1O
ga
LtGCHO-
49,409»iau.t j .
»0
«nn
400.
300.
200.
100.
SO.
4 a
30.
20.
>CL
a
-10.
. i r t i i JN»1tR OUTDAI* 10CCCR
Gl 'C2
asat
ceG7G9G9CIO
. \ _ . :
ys:-~
THRUST kN
V*
TI1C - min
^ /*'
4a
R
33Q-
z
i za
- ^ ^
.40 EJ5 SJO *
• " s
| C n
JOO
••"II.100
JO ? !
.40
JO
r E
s-»• s
?• 0 Z
0
- t o
D*)LL HOLE COORDINATES1ORTMINC • SS7DSII.S0
ELCVATlfM0!»( -» l -« OOW) -AZIMUTH -
t>£»TM Or c«C HOLE
l .D -O.D -LEHC -
ROOT TElPEIUUfRC
OAUCC SERIAL MO
READOUT SERIAL HO
DATE
OVEHCORfO• k l -OS-1
94 41- 2 . 1JO 0
«.n -
130 00
300
IC.fC
* • •
003
• 0«00
AECL - URL
CSIR OVERCORE TEST
MICROSTRAIN VS TIME
HOLE : 209-054-RST2DEPTH: 3 . 9 6 (150 iwn)
DATE • J 7 - A M - B )
FIGURE A-51: Post- 150-mm-Diameter Overcore, Borehole 209-054-RST2(3.96-m Depth), 88-08-19 10:18:27 to 88-08-19 10:51:24
CHILL HOLE COORDINATES-HORTHlNC - 3 3 7 0 9 H . JO
ELEUAUCM - 34. *a01* (+ (« • * oenn} - - a . iAZIMUTH . 30 .J
oerTH or o /e STANT JH •
acpiH or c u HOLE * ii •
COUC OI ICNSIONS(B)
1 0 - 31 000.0. - .00.00LENS - 300
ROCK TCtfEKATURC - 10 IX
6AUGC SCRIW. NO. * •<
UA00UT SEKIAL NO 00J
TEST DONC • * A . K l
OAtC TI1Kai-07-It 111
ia-o«-ia iti
CSIR OVERCORE TEST
UXCROSTftAlN VS TIME
HOLE 209-O54-RST2OEPTH- 3 . 9 6 (H)
FIGURE A-52: Post- 96-mm-Diameter Overcore, Borehole 209-054-RST2(3.96-m Depth), 88-08-19 12:43:44 to 88-08-19 13:25:10

- A.29 -
. „» . . » WTH **•_ . _ . _ . _ . _ Tonoue M *
. _ „ THRUST hU
. . _„ . .__ arcm i
-10.
-to.
- J t .
czGJ
jo. atC7
so. as
S.S1Z1Z. cio
«Ql2OO
I « 1 . I M *
DRILL HOLE COORDINATES•IMTHIH6 - S57OS1I.00CASTIMC - 2191*1.1?CLCV*rj0N m 34. it
Oll*(+I>* DOW) - -IIAZIMUTH - 30 0
•CPTH Or 0/C S1ART :t Jt •
ofpm or ew Mac *-» •
CORC KlCHSIONtla*)1.0 - 3 *000.0- - 100 DOLEHI - 900
ROCK TCtTEMTUK 10 t*C
•AUOE SERIAL HO. * • •
RCA0OUT SERIAL NO. SOS
TtJT OOM I f - rt. K«
INSTALLEOt
OVCMCCMCD
OATE Tl tCjg-07-lt 1*10••-O«-tt I I t l
CSIR OVERCORE TEST
MICROSTRAIN VS TIME
HOLE -209-054-RST2DEPTH Z. 9 6 (H)
FIGURE A-53: Post- 96-mm-Diameter Overcore Temperature Test, Borehole209-054-RST2 (3.96-m Depth), 88-08-19 13:41:50 to 88-08-19 14:24:44
_ ^ . _ _ WTCR 1H . . . TONOUC Urn_ _ . _ . _ . . «MTCR OUT - . _ . _ _ . THRUST kU
DATA LOGGER
t ao 22 24 at at so si i t 4« » «o «i * i it «• io0 1 1 > I
BRILL HOLC COONOIfUTCIWORTHING - 9S7031A.O0CASnNC - 2131* 1 « 7CLCVA1I0M - 94. 42
0JH*lv COW) - - > . IAZSIUTH • 30-0
DtrTH OT 0/C STAST :J.T1 •
K9TH Of CM HOLC 4.22 *
CORE OIMMSIOMlfw)
1.0- - 31 000.0. • 100.M
UKQ - 900
ROCK TClVnATUK ' 10. f*C
CM1CC SEMAi. HO. • • *
RCAOOUT SERIAL NO- 003
TEST DOME I T : tfl. KS
OATC T I K1MSTALLC0: M-0T -2 I U10OVCRCORCO M - Q » - H )2I4
CSIR OVERCORE TESTU1CR05TRA1N VS TIME
HOLE . 209-054-RST2DEPTH: 3 . 9 6 (H)
FIGURE A-54: Post- 96-mm-Diameter Overcore Pressure Test, Borehole209-054-RST2 (3.96-m Depth), 88-08-19 14:30:21 to 88-08-19 15:21:27

- B . l -
APPENDIX B
FIELD WORK SUMMARY
CONTENTS
Page
B.I. FIELD WORK SUMMARY B.2

-B.2-
B.l. FIELD WORK SUMMARY
Borehole
1)
2)
3)
4)
5)
TABLE B-l
FIELD ACTIVITIES
Activity Description
210-020-RST1
Drill set-up and removal of initial rock plug
Testing at 2.43-m depth
a)b)c)d)e)0g)h)
Hole preparation and CSIR cell installation600-mm -diameter overcore300-mm-diameter overcore200-mm-diameter overcore150-mm-diameter overcore96-mm-diameter overcorePressure/temperature response testBiaxial test
Testing at 4.17-m depth
a)b)
Hole preparation and CSIR cell installationUnsuccessful overcore tests
Testing at 5.57-m depth
a)b)c)d)e)0g)
Hole preparation and CSIR cell installation300-mm-diameter overcore200-mm-diameter overcore150-mm-diameter overcore96-mm-diameter overcorePressure/temperature response testBiaxial test
Testing at 7.05-m depth
a)b)c)d)e)0g)
Hole preparation and CSIR cell installation300-mm-diameter overcore200-mm-diameter overcore150-mm-diameter overcore96-mm-diameter overcorePressure/temperature response testBiaxial test
Start Date
1988-03-01
1988-03-11
1988-03-111988-03-171988-03-221988-03-231988-03-241988-03-251988-03-251988-04-14
1988-05-01
1988-05-011988-05-13
1988-05-19
1988-05-191988-05-201988-05-251988-05-261988-05-261988-05-261988-05-27
1988-07-07
1988-07-071988-07-081988-07-081988-07-111988-07-121988-07-121988-07-13
End Date
1988-03-10
1988-04-14
1988-03-171988-03-171988-03-221988-03-241988-03-241988-03-251988-03-251988-04-14
1988-05-19
1988-05-101988-05-19
1988-05-27
1988-05-191988-05-201988-05-251988-05-261988-05-261988-05-261988-05-27
1988-07-13
1988-07-071988-07-081988-07-111988-07-111988-07-121988-07-121988-07-13

- B . 3 -
TABLE B-l (cont.)
Activity Description Start Date End Date
Borehole 209-054-RST2
1)
2)
3)
Drill set-up and removal of initial rock plug
Testing at 2.08-m depth
a)b)c)d)e)0g)h)
Hole preparation and CSIR cell installation600-mm-diameter overcore300-mm-diameter overcore200-mm-diameter overcore150-mm-diameter overcore96-mm-diameter overcorePressure/temperature response testBiaxial test
Testing at 3.96-m depth
a)b)c)d)e)0g)
Hole preparation and CSIR cell installation300-mm-diameter overcore200-mm-diameter overcore150-mm-diameter overcore96-mm-diameter overcorePressure/temperature response testBiaxial test
1988-07-13
1988-07-19
1988-07-191988-07-221988-07-251988-07-261988-07-271988-07-271988-07-271988-07-27
1988-07-28
1988-07-281988-08-031988-08-181988-08-191988-08-191988-08-191988-08-22
1988-07-19
1988-07-27
1988-07-221988-07-221988-07-251988-07-261988-07-271988-07-271988-07-271988-07-27
1988-08-22
1988-08-031988-08-181988-08-181988-08-191988-08-191988-08-191988-08-22

-C . l -
APPENDIX C
CALCULATIONS AND RESULTS OF DATA ANALYSIS
CONTENTS
Page
C. 1. PRELIMINARY INPUT DATA C.2
C.2. CALCULATED PRINCIPAL AND VOLUMETRIC STRAINS C.2

-C.2-
C. 1. PRELIMINARY INPUT DATA
The strain data used in the isotropic analysis, and their associated standard deviation, aresummarized in Tables C-l and C-2, respectively.
C.2. CALCULATED PRINCIPAL AND VOLUMETRIC STRAINS
The results of the isotropic analysis in terms of principal and volumetric strains aresummarized in Tables C-3 through 5. Comparative results from other boreholes are shown inTable C-6.

TABLE C-1
SUMMARY OF MEAN CHANGES IN GAUGE READINGS
Depth(m)
2.43
5.57
7.05
2.08
3.96
Cor* SB*
(mm)
596.0296 2
105.1
144.566.7
295.2
105.1
144.586.7
295.2195.1144.586.7
596.0295 2195.1144.586.7
295 2
195.1144.586.7
AxialGauge 1
4754
19
34
14
543
• 3
41
3
17875
19
40924
10
10
38
2264
16
•10
Strain Rosette 145
Gauge 2
632
209
12
•13
579
104214
226
35
22
49027
-21
•234
62257S
CireumGauges
944
•8-8
•to
•34856
•20
•13
•32
417
-5-1
3
29847
8
-77
660
•2-1
16
135Gauge 4
697-4
7
•a
9
790
•18
7
-30
37301
0
29949•9
2132
273
S100
Anal
Gauge 5
26t5517
2627
390-4
27
-3
188
10
3
13
27514
9
8
12
95
8
11
10
Strain Rosette 245
Gauge 6
90517
51
2904
3157
26
40955
0
26625-4
284
53
00
• 3
CircumGauge 7
1018-15
-8
-30
-28
836
28
20•35358
-241
675-2
-32-11
-34
3268
•20-22
135Gu«S
AxialGauge 9
Strain Rosette 345
Gauge 10
BOREHOLE 210-020-RST1
524-11
41
-7
41313
12-67
1301-1
0
3938
1829
38475
•234-It
16897
23
354
- l»18
9Z7
264
22
35-3»
1114
523
BOREHOLE 209-054-RSTi
-60
-39•63
0•IT
443
12•14
-12
27114
-11
30
185
5187
546
1
-38-1819
27«
-28
19
CircumGauge 11
567
-18•3
-30-16
449
20
23-34
195• 1
4
4
576
10-43-22
-8
423
•8-18
30
135
Gauge 12
68911
64
3
0
0
00
00
00
•52•31
-640
- I *
0
00
0
CelTemperature
0.62-0.090.06
•0.01-0.51
0.26
0.92
-0.56-0.3S0.880.81-0.221.18
4.040.51
1.600.430.980.130.64
0.40•0.09
AllAxial
(Mean)
434
6
18
30
26
489-3
34
0177
95
18
318
17
-107
17169
6152
All
45 Sheaf(Mean)
630
19
10
7
5
582•?1
3820
249
4
515
434
18
•21
-49
2821
47
All
Circum(Mean)
843-13
-6-3326
714
9
10•34
324
•3
23
51619
-28•13
-12470
• I
•13
8
All
135 Shear(Mean)
637
•1
62
2
602-2
9-43
25201
0
29949
-92132
3589
• 2
• «
All
Shear(Mean)
1
633
7
8
53
590
1224
•12
25034
11
400
25•18
2
15
312
4
22
Axial andCircum(Mean)
680-56
20
5S13
22-20260
34
11
1
417
18-19-32
31921
&
o
Note: Gauge readings not uted In calculation! shown in bold italics.

TABLE C-2
SUMMARY OF STANDARD DEVIATION FOR GAUGE READING CHANGES
Depth(m)
2.43
5.57
7.05
2.08
3.96
Cora Size(mm)
596.0295.2195.1144.586.7
295.2195.1
144.586 7
295.2195.1
144.5S6.7
596.0295.2
195.1144.586.7
295.2195.1
144.588.7
AxialGauge 1
447
6g
a57
e44
84
84
57
5
847
5
Strain Roselte 1
45Gauge 2
56667
6
613
64
5
94
64
55
S7
56
5
CircumGauge 3
458
11
B54
63
5595
844
6
564
54
135Gauge 4
536
17
96
4
6
544
84
544
55757
5
Anal
Gauge &
75
66
S6
577
4
594
73
56
6
54
54
Strain Rosette 2
45Gauge 6
547
674
7
11
«
4
594
84
4
654
47A
CircumGauge?
557
784
57
4
54
84
155e6
554
64
135
G»uge8Axial
Gauge 9
Strain Rosette 345
Gauge 10
BOREHOLE 210.020.RST1
557
9
86
3
6a5444
4477
87
5
811
54
84
44
667
6
6
1213
3494
BOREHOLE 2O9-054-RST2
2610
105
IS64
64
64
56
695
85
64
5
55
54
74
CircumGauge 11
456
6844
54
34
95
115
5
654
4
54
135
Gauge 12
4
4
667
0
00
0
000
0
271010
0
1500
00
Cell
Temperature
0.040.010.090.14
0.180.07
0.220.30
0.110.17
0.180.140.13
0.19
0.100.210.120.10
0.01
0.130.10
006
AllAnal
(Mean)
3344
54
34
5
2353
423
4
3534
3
All45 Shear
(Mean)
334
4
4
3
4
7
S2
353
4
33
33
334
3
AllCircum(Mean)
334
5
52
24
2
33
S
3
7
33
33
323
2
All135 Shear
(Mean)
324
7
55
344
33
53
135
54
85353
AllShear(Mean)
2234
3
32
54
224
2
633
243
23
2
Anal artCircum(Mean)
22
33
32
233
2
242
42
22
2
32
32
o

-C.5-
TestDepth
(m)
* 2.432.432.432.432.43
* 5.575.575.575.57
* 7.057.057.057.05
TestDepth
(m)
* 2.082.082.082.082.08
* 3.963.963.963.96
SUMMARY
CoreSize
(mm)
600300195.1144.586.1
300195.1144.586.4
300195.1144.586.1
(He)
490.2514.0518.9932.3328.67
530.4315.1637.8327.77
225.748.895.45
2103
SUMMARY
CoreSize
(mm)
600300195.1144.586.1
300195.1144.586.5
e1
G*e)
389.0422.620.15
17.9922.06
290.186.71
15.4912.46
OF PRINCIPAL
Plunge
(°)
24.819.405.703.206.318.175.604.132.821.702.702.517.3
Trend
(°)
284.4314.8119.3124.2112.2285.8301.1308.5316.4274.0302.8128.1131.3
OF PRINCIPAL
Plunge
(°)
28.411.022.520.805.709.920.400.239.2
Trend
<°)
221.4002.6333.7001.8189.2259.5222.4023.4110.8
TABLE C-3
STRAINS FOR BOREHOLE 210-020-RSTl
E2
ftie)
326.84-2.27-2.77
-13.90-8.67
259.933.125.67
-11.34109.92
-1.301.43
-0.49
TABLE
Plunge
(°)
18.422.050.578.366.415.013.277.819.100.277.287.442.2
C-4
Trend
(°)
185.6216.6022.3018.5007.6190.8144.5057.8213.5183.9045.0323.9024.9
e3
(M«)
175.29-13.39-5.49
-17.36-17.3299.34-6.13-6.36
-38.6439.95-2.90-0.71-3.98
Plunge
(°)
58.360.039.011.222.666.205.511.450.768.312.500.742.7
Trend
(°)
063.0082.3213.9214.8204.8063.4053.2217.7098.4093.5212.2218.1238.0
STRAINS FOR BOREHOLE 209-054-RST2
e2
(fie)
145.4412.82-7.20-7.50-0.97
145.340.83
-2.652.17
Plunge
(°)
61.615.329.235.319.740.734.708.701.4
Trend
(°)
040.7095.777.0
107.4097.2160.8327.3113.5201.9
(He)
68.24-9.73
-20.92-15.34-14.21
0.01-4.32
-11.23-7.63
Plunge
(°)
00.371.051.747.369.547.648.181.350.8
Trend
(°)
131.2238.1212.1247.4294.6000.5107.9291.9293.6
*Near-field in situ strain measurement. All others near-field residual strain.

-C.6-
TABLE C-5
CALCULATION OF PRINCIPAL STRAINS FROM RESIDUAL STRAIN TESTS
TestRef.
R11600R21600R12300R13300R22300R11300R21300R11200R12200R13200R21200R22200R11150R12150R13150R21150R22150R11100R12100R131OOR21100R22100
(MPa)
31.1226.3535.7413.0919.410.551.370.890.830.39
-0.480.331.322.170.280.650.661.190.881.041.020.63
CT2(MPa)
24.5116.4124.05
8.7713.50-0.110.970.010.310.01
-0.780.09
-0.550.780.13
-0.39-0.08-0.32-0.810.200.080.21
CT3(MPa)
18.3813.2617.116.167.57
-0.560.05
-0.10-0.09-0.05-1.34-0.12-0.690.260.05
-0.71-0.43-0.67-1.990.07
-0.46-0.19
E(GPa)
47.7350.1951.8644.7650.1947.7350.1947.7351.8644.7650.1950.1947.7351.8644.7650.1950.1947.7351.8644.7650.1950.19
V
0.180.230.200.200.230.180.230.180.200.200.230.230.180.200.200.230.230.180.200.200.230.23
El(Me)
490.25389.04530.43225.74290.18
14.0522.6218.9915.168.890.156.71
32.3337.83
5.4517.9915.4928.6727.7722.0322.0612.46
E2(Me)
326.84145.44259.93109.92145.34
-2.2712.82-2.773.12
-1.30-7.200.83
-13.905.671.43
-7.50-2.65-8.67
-11.34-0.49-0.972.17
e3
175.2968.2499.3439.950.01
-13.39-9.73-5.49-6.13-2.90
-20.92-4.32
-17.36-6.36-0.71
-15.34-11.23-17.32-38.64-3.98
-14.21-7.63
VolumetricStrain, A
(%)
0.09920.06030.08900.03760.0436
-0.00020.00260.00110.00120.0005
-0.00280.00030.00010.00370.0006
-0.00050.00020.0003
-0.00220.00180.00070.0007
%ofA
In Situ
100.0100.0100.0100.0100.0
0.24.31.11.41.24.60.70.14.21.60.80.40.32.54.71.11.6
Note: Test reference describes borehole #, test #, and borehole diameter. For example, Rl 1300 refers toborehole RSTl (Rl), Test 1 (1), and 300-mm borehole size (300).

-C.7-
TestDepth(m)
Borehole8.279.239.84
10.3510.8511.3413.17
(MPa)
TABLE C-6
CALCULATION OF FAR-FIELD PRINCIPAL STRAINS
(MPa)
210-060-OC134.0942.5144.1630.6331.3133.7532.97
23.1024.8925.6417.3822.3420.8120.60
Borehole 210-003-OCl12.6013.0914.1714.6815.2315.7316.2616.8117.36
42.3028.2518.0331.8124.4030.9635.0737.0039.43
16.1917.0912.0519.9215.1619.7620.6920.9322.77
Borehole 209-069-PH310.8311.3911.9712.5013.05
28.8531.1332.4130.4927.50
14.3016.9515.1716.6012.75
Borehole 210-059-OCl9.05
10.0710.5811.0911.6312.1613.1713.6714.2914.7016.2116.71
34.7534.0634.8734.1934.8730.2230.3330.0930.2032.5033.9538.22
23.3120.9020.2522.3721.5820.2616.8417.5918.4919.4821.3523.40
(MPa)
11.5817.4014.397.31
13.1611.2213.99
5.126.504.66
16.679.70
16.2416.3214.7316.56
11.9212.1412.1911.2911.71
12.4613.6713.0314.4612.8511.5512.137.59
10.8211.7712.7512.46
E(GPa)
58.2551.4548.9154.0755.5954.1450.19
60.2060.5160.5060.5160.5060.5055.1050.9154.52
53.5258.5159.6954.2548.38
54.8750.5853.1254.8152.9450.1655.7358.1255.6558.6550.8951.59
V
0.160.210.180.210.200.170.23
0.200.200.200.200.200.200.170.200.16
0.200.130.170.160.14
0.220.190.180.160.210.190.170.170.140.140.120.12
e l(M«0
489.98653.63755.56470.60435.51522.81498.39
631.86388.89242.78404.76321.12392.73522.29586.68607.80
441.07467.41465.05479.77497.64
489.90543.53543.67516.28522.09481.98455.86444.07468.94479.54586.72657.43
e2(H£)
271.12239.24308.75174.08241.88243.17195.24
111.40167.58124.17168.96137.85170.58216.95207.90253.33
114.84193.55127.12182.77150.07
235.53233.91218.90266.12218.34245.69172.65192.44229.06226.47309.41335.69
e3(He)
41.7163.0937.33
-51.2743.7135.9233.25
Mean
-109.27-42.44-22.41104.5129.55
100.76124.1561.76
121.20Mean
61.47100.6668.7169.23
125.57Mean
-5.7163.8158.5298.7118.8039.0573.77-8.8771.9476.60
120.1498.19
Mean
VolumetricStrain, A
(%)
0.08030.09560.11020.05930.07210.08020.07270.0815
0.06340.05140.03450.06780.04890.06640.08630.08560.09820.0669
0.06170.07620.06610.07320.07730.0709
0.07200.08410.08210.08810.07590.07670.07020.06280.07700.07830.10160.10910.0815

ISSN 0067-0367
To identify individual documents in the series
we have assiancd an AECL—number 10 each.
Please refer to the AECL— number when
requesting additional copies of (his document
from
Scientific Document Distribution Office
Atomic Energy of Canada Limited
Chalk River, Ontario, Canada
K0.I I JO
Price: B
ISSN 0067-0367
Pour identifier les rapports individuels
faisant partie de cette serie, nous avons
affect e un numero AECL—a ehacun J'eux.
Veuille/ indiquer le nunieiu AECL— lorsque
vous demande/ d'autres exemplaires de ce rapport
au
Service de Distribution des Documents Officiels
Energie Atomique du Canada Limitec
Chalk River, Ontario, Canada
K0.I 1.10
Prix: B