ATOMIC ENERGY Ä J Ä ENERGIE AT0MIQUE
48
AECL—8407 CA9200686 — ATOMIC ENERGY Ä J Ä ENERGIE AT0MI Q UE OF CANADA LIMITED ^ f i j r DU CANADA LIMITÉE POTENTIAL HEALTH HAZARD OF NUCLEAR FUEL WASTE AND URANIUM ORE RISQUE POSSIBLE POUR LA SANTÉ PROVENANT DES DÉCHETS DE COMBUSTIBLE NUCLÉAIRE ET DU MINERAI D'URANIUM Kishor Mehta, G. R. Sherman, S. G. King Whiteshell Laboratories Laboratoires de Whiteshell Pinawa, Manitoba ROE HO June 1991 juin
-
Upload
khangminh22 -
Category
Documents
-
view
8 -
download
0
Transcript of ATOMIC ENERGY Ä J Ä ENERGIE AT0MIQUE

AECL—8407 CA9200686 —
ATOMIC ENERGY Ä J Ä ENERGIE A T 0 M IQU E
OF CANADA LIMITED ^ f i j r DU CANADA LIMITÉE
POTENTIAL HEALTH HAZARD
OF NUCLEAR FUEL WASTE AND URANIUM ORE
RISQUE POSSIBLE POUR LA SANTÉ PROVENANT DES DÉCHETS DE
COMBUSTIBLE NUCLÉAIRE ET DU MINERAI D'URANIUM
Kishor Mehta, G. R. Sherman, S. G. King
Whiteshell Laboratories Laboratoires de WhiteshellPinawa, Manitoba ROE HO
June 1991 juin

Copyright Atomic Energy of Canada Limited, 1991.

AECL RESEARCH
POTENTIAL HEALTH HAZARD
OF NUCLEAR FUEL WASTE AND URANIUM ORE
by
Kishor Mehta, G.R. Sherman and S.G. King
Whiteshell LaboratoriesPinawa, Manitoba ROE 1L0
1991
AECL-8407

RISQUE POSSIBLE POUR LA SANTÉ PROVENANT DES DECHETS DECOMBUSTIBLE NUCLÉAIRE ET DU MINERAI D'URANIUM
par
Kishor Mehta, G.R. Sherman et S.G. King
RESUME
On évalue la variation de la radioactivité des déchets de combus-tible nucléaire (combustible usé et déchets de retraitement du combustible)avec le temps et le risque possible pour la santé (ou radiotoxicité inhé-rente) provenant de l'ingestion des radionucléides dans le cas des réac-teurs à l'uranium naturel CANDU (CANada Deuterium Uranium). On considèrequatre groupes de radionucléides contenus dans les déchets de combustiblenucléaire: actinides, produits de fission, produits d'activation duZircaloy et produits d'activation des impuretés du combustible. On comparel'apport de chacun de ces groupes à la radioactivité et au risque possiblepour la santé.
On compare ensuite le risque possible pour la santé provenant ducombustible usé avec celui du minerai d'uranium, des résidus d'exploitationminière et de l'uranium raffiné (combustible neuf) sur la base de quantitéséquivalentes d'uranium.
On décrit le programme HAZARD réalisé en particulier pour effec-tuer les calculs.
EACL RechercheLaboratoires de WhiteshellPinawa, Manitoba ROE 1L0
1991
AECL-8407

POTENTIAL HEALTH HAZARD
OF NUCLEAR FUEL WASTE AND URANIUM ORE
by
Kishor Mehta, G.R. Sherman and S.G. King
ABSTRACT
The variation of the radioactivity of nuclear fuel waste (usedfuel and fuel reprocessing waste) with time, and the potential health haz-ard (or inherent radiotoxicity) resulting from its ingestion are estimatedfor CANDU (CANada Deuterium Uranium) natural-uranium reactors. Four groupsof radionuclides in the nuclear fuel waste are considered: actinides, fis-sion products, activation products of Zircaloy, and activation products offuel impurities. Contributions from each of these groups to the radioacti-vity and to the potential health hazard are compared and discussed.
The potential health hazard resulting from used fuel is thencompared with that of uranium ore, mine tailings and refined uranium (freshfuel) on the basis of equivalent amounts of uranium.
The computer code HAZARD, specifically developed for these compu-tations, is described.
AECL ResearchWhiteshell LaboratoriesPinawa, Manitoba ROE 1L0
1991
AECL-8407

CONTENTS
Page
1. INTRODUCTION 1
2. TOXICITY 2
2.1 GENERAL 22.2 RADIOACTIVITY 52.3 POTENTIAL HEALTH HAZARD 5
3. DATA
3.3.3.3.
1234
USED
4.4.4.4.
1234
GENERALINVENTORYRISK FACTORDOSE CONVERSION FACTOR
FUEL
GENERALCOMPOSITIONRADIOACTIVITYPOTENTIAL HEALTH HAZARD
6667
4. USED FUEL 8
881010
5. FUEL REPROCESSING WASTE 14
5.1 GENERAL 145.2 COMPOSITION 145.3 RADIOACTIVITY 145.4 POTENTIAL HEALTH HAZARD 16
6. POTENTIAL HEALTH HAZARD: USED FUEL VERSUS FUEL 21REPROCESSING WASTE
7. POTENTIAL HEALTH HAZARD AT VARIOUS STAGES OF A 21NUCLEAR FUEL CYCLE
CONCLUSIONS 24
REFERENCES 24
APPENDIX A - THE COMPUTER PROGRAM HAZARD 27

1. INTRODUCTION
In a nuclear reactor, uranium fuel generates energy by fission ofisotopes of uranium and plutonium. When a fuel bundle is discharged fromthe reactor, its appearance is very similar to what it was before enteringthe reactor; however, its radiological properties have changed significant-ly. For example, the radioactivity level of a typical Pickering NuclearPower Generating Station-A fuel bundle is about 6 x 10¹⁴ Bq when dischargedfrom the reactor, compared with about 1 x 10⁹ Bq before irradiation.Because of its radioactive nature, nuclear fuel waste is toxic and, if notisolated from the biosphere, it can be harmful to man. Thus, permanentdisposal of this waste is an important task facing the nuclear industry.The objective of such disposal is to reduce the risk to man to an accept-able level.
One way of judging acceptability of a disposal system is to com-pare the risk from this system with that from unmined uranium ore. Such acomparison helps provide a meaningful perspective on the risk from thewaste. Wick and Cloninger (1980) investigated the proposed general criter-ion that a nuclear fuel waste repository should impose no greater radiolog-ical risk than naturally occurring uranium deposits. They compared intrin-sic characteristics and potential radiological consequences for several oredeposits within the United States with reference geological waste reposi-tories. These types of analyses are useful; however, as concluded by theauthors, the variability in the natural system is so great that it does notallow a specific criterion to be stated in quantitative terms.
Cohen et al. (1989) also compared the risk of a high-level wasterepository with that of the uranium ore deposit from which the nuclear fuelwas originally extracted. However, unlike Wick and Cloninger (1980), theirstudy was based on equivalent amounts of heavy metal in the ore and in thereactor fuel. Their comparison consisted of two parts: (1) the inherentradiotoxicity, and (2) the availability of the toxic material to humans.Using the most recent data (ICRP 1981, ICRP 1986), their analysis showedthat the inherent toxicity of the waste is comparable to that of the oreafter about 100 000 years. Assuming that radioactivity in a waste reposi-tory is less than 1/10 as available for human assimilation as that in auranium ore deposit, they concluded that the risk from the waste is compar-able to that of the ore body after about 10 000 years.
There are thus two types of risk that are generally assessed:
the potential risk or potential health hazard (PHH) associatedwith the possible intake of the radioactive material, whichdepends on the inherent radiotoxicity of the material; and
the real or residual risk, which takes into account the avail-ability of the radioactive material through the engineered andgeological barriers that reduce the amount of radionuclidesreaching man. This type of assessment thus considers the poten-tial for the toxic materials to migrate and be assimilated byhumans.

The potential health hazard is a useful concept when long term radiologicalrisks are compared for different fuel cycles or for "uranium fuel" at dif-ferent stages of the fuel cycle, as in fhe case of the present work.
In this report, the radioactivity level and the associated poten-tial health hazard (inherent radiotoxicity) due to ingestion of nuclearfuel wastes aie discussed. We have not included the possible contributionfrom inhalation and external exposure pathways because, for radioactivityburied underground as is the case with both the nuclear fuel waste and theore deposit, the predominant exposure mode is via ingestion (Uuschke et al.1985). The nuclear fuel waste can be either used fuel (UF) or fuel repro-cessing waste (FRV). As discussed above, the inherent radiotoxicity is ameasure of harm a radionuclide could cause if ingested, and is calculatedassuming that the toxic substance is directly accessible to man withoutdispersion, absorption, or dilution in the geosphere and biosphere. Theradiotoxicity for nuclear fuel waste is then compared with that for uraniumand associated radionuclides at different stages in the fuel cycle. Sincethe radioactivity level of the waste decreases with time, it is importantto characterize the associated toxicity as a function of time.
We have computed the radiotoxicity of equivalent amounts oi"uranium fuel" at various stages of the fuel cycle. A typical fuel cycleand the relationships between its various stages are shown in Figure 1.The amounts of materials at different stages are shown normalized to 1 g ofuranium in fresh fuel. Thus, the ore contains 1.05 g of uranium along withits daughter products in secular equilibrium; mine tailings contain 0.05 g(i.e., 5%) of uranium plus the uranium daughter products from equilibrationwith 1.05 g of uranium; and refined uranium (fresh fuel) contains 1 g ofuranium only. This 1 g of refined uranium is fabricated into fuel and usedin a CANDU(1) nuclear reactor. The used fuel discharged from the reactorthen contains the unused portion of uranium and the newly formed plutonium,other actinides, fission products and other activation products. If theused fuel were reprocessed, we assume, for example, that 99.5% of theplutonium and uranium would be recovered. The remainder, called fuelreprocessing waste, contains 0.5% of the plutonium and uranium from theused fuel, and nearly all the remaining radionuclides that were present inthe used fuel.
Several measures have been used in the literature in order tocompare the toxicity of radionuclides in wastes and naturally occurringmaterials. These are discussed in Section 2.
TOXICITY
2.1 GENERAL
Radioactive material, if ingested, could cause cancer or geneticdamage. Thus it is useful to have a thorough understanding of the behavi-our of the radioactivity of nuclear fuel waste with time.
CANada Deuterium Uranium, registered trademark.

- 3 -
URANIUM ORE
Uranium (1.05 g)U DaughtersRock
5%U 95 %U
MINE TAILINGS
Uranium (0.05 g)U DaughtersRock
REFINED U
(Fresh Fuel)
- Uranium (1.0 g)
USED FUEL
U (0.988 g), PuFission ProductsOther Actinides
99.5% U, Pu
- Uranium- Plutonium
0.5% U, Pu
FUEL RECYCLE "WASTE
- U.Pu- Fission Products- Other Actinides
FIGURE 1: Simplified Flow Chart for a Nuclear Fuel Cycle(Starting with Uranium Ore Containing 1.05 g U)

- 4
The toxicity associated with a given quantity of a radionuclidedepends on its mode of decay, rate of disintegration and its behaviourwithin the body, for example, its residence time, affinity for differenttissues and distribution amongst various organs. The toxicity is themeasure of the probability that an individual who ingests the radionuclidecould develop cancer or hereditary effects.
Various measures have been used in the past by differentresearchers to compare radiotoxicity. In the 1970s, the radiotoxicityscale was usually based on the amount of water required to dilute theradioactivity to a value specified by health regulations as being accept-able for release to the general public (Dell and Dillon 1971, Hamstra 1975,Blomeke et al. 1973). Haug (1976) modified this scale and introduced adimensionless relative toxicity index (RTI) based on the radiotoxicity (asdefined above) of low-grade uranium ore. He used this scale to compare thelong-term radiotoxicity of different high-level and actinide-containingwastes from nuclear fuel reprocessing, and that of naturally occurringradioactive materials (Haug 1976).
In the 1980s, with the appearance of Publications 26 and 30 ofthe International Commission on Radiological Protection (ICRP) (ICRP 1977a,1981) the focus changed. The toxicity was now based on annual limit onintake (ALI), described in ICRP-30, or on cancer risk. Runkle and Soldat(1982) used a CRPC (cancer iisk per curie) index to compare the radiotoxi-city levels of a high-level waste repository based on ICRP-2 (ICRP 1959)and ICRP-30 (1981) internal dosimetry models. They defined the CRPC indexof a radionuclide as the product of the dose conversion factor for theradionuclide (rem/curie121) and the risk factor for carcinogenic effects(risk/rem). Elayi and Schapira (1987a) expressed radiotoxicity of a radio-nuclide as a ratio of the activity of the radionuclide to its ALI. Thetotal radiotoxicity of a waste containing various radionuclides is thenobtained by summing the ratios for all the radionuclides. Using this scaleof radiotoxicity they calculated the effect of burnup extension and the useof mixed-oxide fuels on the long-term radiotoxicity of nuclear fuel wastesproduced by light-water reactors (Elayi and Schapira 1987a). They alsoused the same scale to measure the impact of the recommendations ofICRP-26, ICRP-30 and ICRP-48 (ICRP 1977a, 1981, 1986) on the radiotoxicityof used fuels from various reactor types (Elayi and Schapira 1987b).
Cohen (1982) calculated the radiotoxicity of high-level waste interms of "cancer doses", using the data from ICRP-30 (1981) and BEIR-III(NAS 1980), and compared them with those calculated using ICRP-2 (1959) andBEIR-I (NAS 1972). He defined "cancer doses" (risk/tonne) as the number ofexpected cancer deaths in a group of people who had ingested one tonne ofwaste converted into a digestible form.
In the present report we have calculated radiotoxicity in termsof PHH, which is very similar to the "cancer doses" of Cohen, except thatthe risk factor in the present work also includes genetically significantdamage. The present report differs in three aspects from Cohen's report:
(2> 1 Ci = 37 CÎBq100 rem = 1 Sv

(i) we have used data relevant to waste management, such as age-dependentdose conversion factors and environmental pathways that result in differentinternal dosimetry model parameters than those used in ICRP-30 (Johnson andDunford 1983); (ii) the analysis is based on nuclear fuel wastes fromCANDU reactors; and (iii) the analysis is extended to cover the front endof the fuel cycle, namely, the mine tailings.
The relevant time-dependent mathematical equations for the radio-activity levels and for the potential health hazard to man are developed inthe following sections.
2.2 RADIOACTIVITY
The radioactivity at time t, A(t), of one gram of a radionuclidecan be defined as
A(t) = N(t) X = N(t) ±P-1 (1)1l/2
where A(t) = level of radioactivity at time t (Bq),X = radiological decay constant of the radionuclide (s"1),T1/2 = half-life of the radionuclide (s),N(t) = number of atoms in one gram of the radionuclide at time t.
In a radioactive decay series, the amount (N) and therefore thelevel of radioactivity of a particular radionuclide changes continuouslywith time according to its rate of disintegration and the rate of ingrowthfrom its precursors. A computer code, HAZARD, was developed to compute thetime variation of the radioactivity level of each radionuclide present innuclear fuel vaste. HAZARD is similar to the computer code CANIGEN (Cleggand Coady 1977) except that it also calculates, unlike CANIGEN, the radio-activity resulting from the activation of Zircaloy and the fuel impurities.It can also compute the PHH, can accommodate different source terms conven-iently, and has the flexibility of providing a variety of outputs. Thecode and the necessary data are described in Appendix A.
2.3 POTENTIAL HEALTH HAZARD
As discussed earlier, the PHH of a radionuclide is a measure ofits radiotoxicity if ingested. Its value depends on the level of radio-activity, the behaviour of the radionuclide in the human body and thedetrimental effect radiation dose has on the body. This relationship isrepresented mathematically in Equation (2).
If one gram of radionuclide i were ingested by a large popula-tion(3), the PHH is given by
13 ' If one assumes the linear relationship between dose and cancer risk,this result is independent of the number of people involved or the waythe material is distributed among them, so long as the individual doseequivalent is small enough that only the stochastic health effects areobserved.
- 6 -
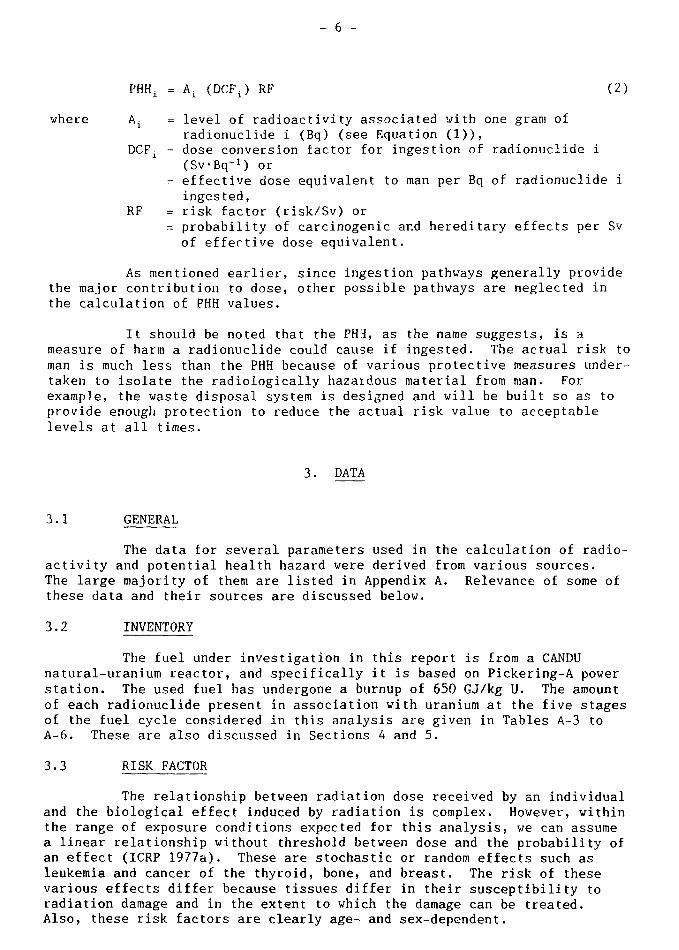
PHHi = Ax (DCF^ RF (2)
where At = level of radioactivity associated with one gram ofradionuclide i (Bq) (see Equation (1)),
DCFi = dose conversion factor for ingestion of radionuclide i(SvBq-1) or
= effective dose equivalent to man per Bq of radionuclide iingested,
RF = risk factor (risk/Sv) or= probability of carcinogenic and hereditary effects per Svof effective dose equivalent.
As mentioned earlier, since ingestion pathways generally providethe major contribution to dose, other possible pathways are neglected inthe calculation of PHH values.
It should be noted that the PHtf, as the name suggests, is ameasure of harm a radionuclide could cause if ingested. The actual risk toman is much less than the PHH because of various protective measures under-taken to isolate the radiologically hazardous material from man. Forexample, the waste disposal system is designed and will be built so as toprovide enough protection to reduce the actual risk value to acceptablelevels at all times.
3. DATA
3.1 GENERAL
The data for several parameters used in the calculation of radio-activity and potential health hazard were derived from various sources.The large majority of them are listed in Appendix A. Relevance of some ofthese data and their sources are discussed below.
3.2 INVENTORY
The fuel under investigation in this report is from a CANDUnatural-uranium reactor, and specifically it is based on Pickering-A powerstation. The used fuel has undergone a burnup of 650 GJ/kg U. The amountof each radionuclide present in association with uranium at the five stagesof the fuel cycle considered in this analysis are given in Tables A-3 toA-6. These are also discussed in Sections 4 and 5.
3.3 RISK FACTOR
The relationship between radiation dose received by an individualand the biological effect induced by radiation is complex. However, withinthe range of exposure conditions expected for this analysis, we can assumea linear relationship without threshold between dose and the probability ofan effect (ICRP 1977a). These are stochastic or random effects such asleukemia and cancer of the thyroid, bone, and breast. The risk of thesevarious effects differ because tissues differ in their susceptibility toradiation damage and in the extent to which the damage can be treated.Also, these risk factors are clearly age- and sex-dependent.

- 7 -
Applying the appropriate weighting factors for various tissues,and averaging over age and sex, the ICRP (ICRP 1977a, 1977b) concluded thatthe mortality risk is about 1.25 x 10~2 Sv"1. If the risk of geneticdamage that may occur in subsequent generations is included (ICRP 1977a),the total risk factor is 2.05 x 10"2 Sv"1.141
3.4 DOSE CONVERSION FACTOR'-"
The values used in this study for the ingestion dose conversionfactors (DCF) for Reference Man (adult) and infant (1 year old) for all therelevant radionuclides are given in Tables A-3 to A-6. The ALIs and com-mitted doses given in ICRP-30 (1981) are directly applicable to occupa-tional exposures. However, exposures to the public involve other agegroups not adequately represented by Reference Man (ICRP 1975), and envi-ronmental pathways that may result in different internal dosimetry modelparameters than those used in ICRP-30. Therefore, we have used DCF valuesof Johnson and Dunford (1983) specifically calculated for environmentalexposures.
These ingestion DCFs refer to 50-a committed dose, which can beshown to be equivalent to annual dose when equilibrium has been reachedfrom constant intakes by an individual, or after 50 a, whichever is sooner.A requirement for this equivalence is that the individual's retention char-acteristics do not change, which will not be true for infants. However,Johnson (1982) has shown that the use of 50-a committed DCF approximates,or more often overestimates, the actual dose a child would receive at anyage because of radionuclide intake up to that age.
The fractional absorption from the gastrointestinal tract, the fxfactor, used for most of the calculations by Johnson and Dunford was takenfrom ICRP-30 (1981). However, data given in ICRP-23 (1975) suggests thatthe ICRP-30 ft values may be much too small for some elements if they areincorporated into environmental matrices. For example, ICRP-30 givesft = 2 x 10~
4 for thorium, whereas the data summarized in ICRP-23 indicatesthat f: = 0.03 is more appropriate for use in environmental exposures(Johnson and Dunford 1983).
The most uncertain values are the fx factors for the actinides.Recently, the ICRP revised the values for some of these factors in theirReport 48 (ICRP 1986) as shown in Table 1. It should be recalled that thepresent study uses the f1 values that were recommended in ICRP-30 for theelements listed in Table 1. Of all the actinides, Np has had its fx valuechange the most. The value recommended by the ICRP, before their Report 30was released, was 10~4. Thus, the value was increased by a factor of 100through ICRP-30 and now it is decreased by a factor of 10 through ICRP-48.
M l Recently, the ICRP (1990) have extended the definition of radiationdetriment to include non-fatal cancers. Also, the expression of theeffective dose equivalent now explicitly includes many more organswith revised values of the organ weighting factors. The overalleffect of these changes is to increase the risk factor to a value of6.4 x 10-2 Sv-1.

- 8 -
TABLE 1
f, FACTOR VALUES
Element ICRP-30 (1981) Values ICRP-48 (1986) Values(fx x 10
4) (f1 x 1O4)
PuCmAmNp
GENERAL
155
100
4. USED FUEL
10101010
4.1
The disposal of used fuel back to the environment does not changeto a significant level the natural inventory of uranium and its daughters,if one disregards the small fraction of uranium fissioned in a nuclearreactor. In the short term, the short-lived radioactive fission productsadd significantly to the radioactivity. However, uranium and its daughter226Ra (and its daughters) are the toxic elements of long-term concern.This is also true for natural uranium deposits. Also of long-term concernfor the waste disposal system are the long-lived fission products "Tc, 14Cand 1 2 9I, the heavy isotopes such as 237Np and its precursor 241Am, andisotopes of plutonium, which, for all practical purposes, do not exist inthe natural deposits.
4.2 COMPOSITION
Table 2 lists the quantities of naturally occurring uranium iso-topes, other actinides, fission products, and Zircaloy and fuel impurityactivation products in typical fresh and used CANDU fuel bundles. Thetable shows that about 1.2% of the uranium is transformed during its stayin the reactor, partly into fission products and partly into heavier acti-nides through neutron absorption. The actinides can be divided into fourgroups according to whether the atomic mass number is equal to 4n, 4n + 1,4n + 2, or 4n + 3, where n is an integer (Mehta 1982). Besides uranium, aCANDU fuel bundle contains oxygen, since the fuel is U02, and certainimpurities. It also contains Zircaloy in the form of cladding, end plates,spacers, etc. These materials can also become radioactive by neutronabsorption, and therefore their activation products are included inTable 2. A more complete description, including the amount of each radio-nuclide present in used fuel, is given by Mehta (1982).
For the present analysis, the radionuclides present in the usedCANDU fuel bundle are grouped as follows:

- 9 -
TABLE 2
COMPOSITION OF A TYPICAL PICKERING FUEL BUNDLE
Constituent mg/g Initial Uranium
Fresh Fuel Used Fuel*
Naturally Occurring Uranium
235U234y
992.7.0.
90505
985.2.0.
5304
Other Actinides
239pu
Other Pu isotopes236y
Other elements
0.00.0
0.00.0
21
00
.6.2.7.04
Fission Products
StableActive
0.00.0
6.51.1
Zircaloy Activation Products 0.0 0.07
Activation Products of Fuel Impurities 0.0 0.0004
* Assuming a burnup of 650 GJ*(kg U)" 1 and a cooling time of 0.5 a

- 10
actinides (An, 4n + 1, 4n + 2, and 4n + 3 decay series),fission products,activation products of Zircaloy, andactivation products of fuel impurities.
4. 3 RADIOACTIVITY
Figure 2 shows, as calculated by the computer code HAZARD, thetotal radioactivity of used fuel associated with 1 g of initial uranium asa function of time after the fuel is discharged from the reactor. Radio-nuclides151 with half-lives less than 20 a are not included in these calcu-lations. The figure also shows the contributions of each of the fourgroups of radionuclides (see Section 4.2). The contributions of activationproducts of Zircaloy and fuel impurities are not very significant. Radio-activity from fission products dominates up to about 200 a, and thendecreases rapidly. After that, the actinides are the major contributor.After about 1C7 a, all the radioactivity in the used fuel would havedecayed away except that from 238U (T1/, = 4.5 x 10
q a) and its daughterproducts, and, to a much lesser extent, from 232Th (T} ,2 = 1.4 x 1O
10 a)and its daughter products. Since more than 98£ of the initial uranium ispresent in used fuel, the level of radioactivity of used fuel eventuallyapproaches that of an equivalent amount of uranium ore.
4.4 POTENTIAL HEALTH HAZARD
As mentioned earlier, the computer code HAZARD also computesthe PHH. Appendix A provides the half-lives, dose conversion factors, therisk factor and the initial radionuclide inventory in used fuel employed inthese computations.
Figure 3 compares the PHH of used fuel to adults with that toinfants. It shows that the PHH to infants exceeds that to adults by aboutone-half to one order of magnitude. The figure also shows contributions ofvarious groups of radionuclides to the PHH to adults. Again, activationproducts of Zircaloy and fuel impurities contribute very little to the PHH.Fission products are the major contributors during the first 100 a. Subse-quently, various actinide chains are major contributors at different times,and eventually, by 107 a, the 238U series (i.e., 4n + 2 series) is thedominant one.
The amounts of radionuclides that are members of multiple-decaychains generally go through a maximum at some point in time. The amountsof other radionuclides (one-radioactive-member decay chain), foi example,fission products, continuously decrease with time. Thus, the relativecontribution of each radionuclide to the total PHH changes with time. Thisis illustrated in Figure 4. For about the first 100 a, the two fissionproducts, 90Sr (T1/2 = 29.12 a) and
131Cs (T1/2 = 30.0 a), are the maincontributors. After the decay of the fission products, 241Am (Tj-, =432.2 a), 240Pu (T1/2 = 6537 a) and
239Pu (T1/2 = 24 065 a) dominate up to
<5> Table A-3 in the Appendix lists the radionuclides included in theanalysis.

- 11
10 8
to
10
10
FUEL IMPURITIES
I I
ZIRCALOY
\\
1 \ 1
\ \
\ \
\ '
\
I
\\
%\
i
10 I02 10 10 10° 10TIME OUT OF REACTOR ( a )
10' 10 8
FIGURE 2: Time Variation of Total Radioactivity and of Contributions fromFour Groups of Radionuclides for the Case of Used Fuel.(Vertical scale is normalized to 1 g of U in fresh fuel.)

12 -
cai<
3M
Oft-
10
TOTAL (Infants)
10*
TIME OUT OF REACTOR (a)
FIGURE 3: Time Variation of Total Potential Health Hazard to Adults andInfants and of Contributions to Adults from Various Groups ofRadionuclides for the Case of Used Fuel. (Vertical scale isnormalized to 1 g of U in fresh fuel.)

FIGURE 4: Radionuclides with Major Contributions to Potential HealthHazard for the Case of Used Fuel. (Vertical scale is normalizedto 1 g of U in fresh fuel.)

- 14
about 10s a. The total PHH curve goes through a local maximum around 10' aas a result of the 229Th (Tj ,2 = 7340 a), and eventually stabilizes to thecontribution from the 238U daughter products, 230Th, :irPb, :10Po, etc.Note that the PHH from 23SlJ is much less than that from its daughter pro-ducts. The figure also shows the PHH for :29I and 237Np, isotopes thatsome assessment studies have identified as being important for nuclear fuelwaste disposal.
However, the recent changes discussed in Section 3.4 in thevalues of f1( specifically for plutonium, alter significantly the relativeweights of the contributors to the PHH. It is seen from Figure 4 thatbetween 1 000 and 50 000 a, where plutonium isotopes are the most significant contributors, the PHH value would increase by about a factor of 10.Before that time, the impact would be less apparent.
5. FUEL REPROCESSING WASTE
5.1 GENERAL
Since the plutonium and uranium present in used fuel are poten-tial energy sources from which further energy can be extracted, there maybe requirements to separate them from used fuel in an advanced fuel cycle.
5.2 COMPOSITION
There are several reprocessing scenarios depending upon the fuelstrategy chosen and the type of reactor in use. For the purpose of thisanalysis, we have assumed (Wuschke et al. 1985) that
the used fuel is cooled for 10 a before reprocessing, andQ.5Z of the plutonium and uranium remain with the fuel reprocess-ing waste.
Fuel reprocessing wastes, thus, contain all the radionuclidespresent in used fuel except 99.5% of the plutonium and uranium. It isfurther assumed that the fuel reprocessing waste is incorporated into fourseparate waste forms (Wuschke et al. 1985):
1) a Zircaloy waste form, containing Zircaloy activation productsless >'C,
2) an iodine waste form, containing Ï291,3) a carbon waste form, containing 1AC, and4) a glass waste form, containing all the remaining radionucl \dvr-
(all actinides and all fission products except ' ^ I ) .
5.3 RADIOACT1VITY
Figure 5 shows the variation with time of the total radioactivityfrom fuel reprocessing waste arising from one gram of initial uranium. Italso shows the contribution of each of the four waste forms discussedabove. For the entire time period, the glass waste form is the major contributor to radioactivity.

- 15 -
o
0"
108
I0
I05
10
IODINE WF
\
10 10' I03 I04 I05 I06 10 108
TIME OUT OF REACTOR (a)
FIGURE 5: Time Variation of Total Radioactivity and of Contributions fromFour Waste Forms for the Case of Fuel Reprocessing Waste.(Vertical scale is normalized to 1 g of U in fresh fuel.)

- 16 -
Figure 6 shows the contribution to total radioactivity of each ofthe four groups of radionuclides, namely, actinides, fission products,activation products of Zircaloy, and activation products of fuel impuri-ties. The contributions of the last three groups are identical to theircontributions from used fuel (see Figure 2). As before, the radioactivitylevels of the last two groups are not very significant. Fission products,as in the case of used fuel, dominate for 200 a; however, unlike the used-fuel case, they become dominant again between about 104 and 107 a afterdischarge. This is because 99.5% of plutonium isotopes, which are the maincontributors in the case of used fuel during this time interval, are absentin fuel reprocessing waste. After about 107 a, all radioactivity in fuelreprocessing waste has decayed away except that due to 238U and its daugh-ter products, and, to a much lesser extent, 232Th and its daughterproducts.
5. 4 POTENTIAL HEALTH HAZARD
Appendix A contains the half-lives, dose conversion factors, riskfactor and initial radionuclide inventory needed to compute the PHH of thereprocessing waste forms.
As with used fuel, the PHH to adults is about one-half to oneorder of magnitude lower than the PHH to infants at all times. This isillustrated in Figure 7, which also shows the contributions to the PHH toadults from various groups of radionuclides present in fuel reprocessingwaste. Activation products of Zircaloy and fuel impurities contribute verylittle to the PHH. Fission products are the major contributors during thefirst 100 a. Subsequently, the 4n + 1 actinide chain is the major contri-butor until about 107 a, when the 238U series (i.e., 4n + 2) becomes thedominant one.
Figure 8 shows the contributions to the PHH of each of the fourwaste forms. For the entire time period, the glass waste form dominates,so much so that its PHH and the total PHH are nearly identical.
As with used fuel, the contributions of different radionuclidesto the PHH vary with time. The major contributors to the adult PHH atdifferent times are shown in Figure 9. For about the first 100 a, the twofission products, 90Sr and 137Cs, are the main contributors. After thedecay of the fission products and up to about 3000 a, 241Am is the dominantradionuclide. The absence of plutonium isotopes in fuel reprocessing wasteallows 237Np (Tj 2 = 2.14 x 10
6 a) to become a major contributor from about3000 to 30 000 a. After this, 229Th dominates, as with used fuel, untilabout 107 a, going through a peak at about 106 a. Beyond 107 a, the totalPHH approaches the value for 238U (T1/? = 4.468 x 10
9 a) and its daughterproducts, 230Th, J10Pb, 210Po, etc.
However, the recent changes discussed in Section 3.4 in the valueof the fj factor, especially for americium and neptunium, alter signifi-cantly the relative weights of the contributors to the total PHH. As seenfrom Figure 9, between 300 and 3000 a where americium is a significantcontributor, the total PHH would increase by about a factor of 2. On theother hand, between 3000 and 30 000 a the PHH value would decrease by abouta factor of 5 to 10 because of neptunium. There is very little plutoniumpresent in the fuel reprocessing waste (see Section 5.2).

- 17
IQ'
08
10'
5 I0
1 I05
\0c
\\
FUEL IMPURITIES
I
10 10* 10° 10* 10° 10TIME OUT OF REACTOR (a)
10' 108
FIGURE 6: Time Variation of Total Radioactivity and of Contributions fromFour Groups of Radionuclides for the Case of Fuel ReprocessingWaste. (Vertical scale is normalized to 1 g of U in freshfuel.)

- 18 -
ccd.<
C
0
0"
0-2
10-3
10-4
.-510
io6k-
10-7
TOTAL (Infants)
4n + 2
FUEL IMPURITIESi i
10 10' 10 10TIME OUT OF REACTOR (a)
io5 io6 io7 io8
FIGURE 7: Time Variation of Total Potential Health Hazard and of Contribu-tions from Various Groups of Radionuclides for the Case of FuelReprocessing Waste. (Vertical scale is normalized to 1 g of Uin fresh fuel.)

- 19 -
10
10
à iö'
-I
io 4
10_g
10- 7
TOTAL ( A d u l t s )
GLASS WF
ZIRCALOY WF
10 r. \\ CARBON WF
L A "\IODINE WF ( 1 2 9 I )
10 10 10° 10TIME OUT OF REACTOR (a)
IO5 I06 IOr I08
FIGURE 8: Time Variations of Total Potential Health Hazard and of Contri-butions from Four Groups of Radionuclides for the Case of FuelReprocessing Waste. (Vertical scale is normalized to 1 g of Uin fresh fuel.)

- 20 -
10 I02 I03 I04 !05 I06 I07 I08
TIME OUT OF REACTOR (a)
FIGURE 9: Radionuclides with Major Contribution to Potential Health Hazardfor the Case of Fuel Reprocessing Waste. (Vertical scale isnormalized to 1 g of U in fresh fuel.)

- 21 -
6. POTENTIAL HEALTH HAZARD: USED FUEL VERSUS FUEL REPROCESSING VASTE
Figure 10 compares the total PHH from used fuel with that fromthe fuel reprocessing waste. The curves are nearly the same for the first100 a when fission products are the main contributors (see Figures 4 and9). Subsequently, since 241Am is the dominant radionuclide until about1000 a, the two curves are still very close; however, by thp year 1000, theeffect of the absence of plutonium isotopes in the fuel reprocessing wasteis becoming significant. This effect is most pronounced at around 104 a,when both 239Pu and 240Pu in used fuel are the major contributors. The twocurves are close again around 106 a, when 22<3Th is the main contributor forboth types of waste. Eventually, at about 107 a and beyond, when the 238Udecay series is dominant, the PHH from the fuel reprocessing waste is about200 times less than that from the used fuel. This difference is attributedto the fact that the fuel reprocessing waste contains only 0.5% (i.e.,1/200) of uranium present in the used fuel.
For reprocessing strategies in which 100% of the uranium ispresent in the waste stream, the two curves will be nearly the same beyond106 a. However, the difference at 10'1 a, which is due to plutonium iso-topes, would still be present.
7. POTENTIAL HEALTH HAZARD AT VARIOUS STAGES OF A NUCLEAR FUEL CYCLE
Figure 11 compares the PHH from used fuel with that from theequivalent amount of uranium ore, refined uranium, and mine tailings. Asbefore, the normality factor is one gram of uranium in refined uranium(i.e., fresh fuel). The large-dash horizontal line shows the PHH fromuranium ore (containing 1.05 g of uranium). When the ore is refined, about95% (i.e., 1.0 g) of the uranium is separated (to be used as reactor fuel),and about 5% (i.e., 0.05 g) of the uranium, along with all the daughterproducts from the ore, remain in the tailings. The dash/dot and small-dashhorizontal lines show the values of the PHH associated with the refineduranium and the tailings respectively. Since uranium is relatively lesstoxic, the PHH value of the refined uranium is very low. On the otherhand, uranium daughter products being highly toxic, the PHH associated withtailings is very high. However, when these radionuclides decay with time,their amounts are not replenished to the same extent as in uranium ore.The PHH from tailings reaches a level corresponding to 0.05 g of uranium,that is about 1/20 of that from uranium ore (also see Figure A-3).
The refined uranium is fabricated into fuel bundles and placed innuclear reactors. On discharge from the reactor, used fuel has a muchhigher PHH than refined uranium (fresh fuel). However, as shown inFigure 11 (solid line), the PHH decreases with time and, by 107 a, allradionuclides have decayed away except 238lf and its daughters, and, to amuch lesser extent, 232Th and its daughters. Since about 94% of uranium inore is present in used fuel, the PHH from used fuel eventually approaches avalue approximately equal to that for uranium ore. Figure 11 shows thatthe PHH from used fuel has decreased to about ten times that for the equi-valent uranium ore by 1000 a, and to about two times the ore equivalent by20 000 a.

- 22 -
10
10-3
W
C-4
10
IO5U
I O 6 U
0-7
PLUTONIUMEFFECT
USED FUEL
FUEL REPROCESSING WASTE
I I
_238U DAUGHTERSEFFECT
10 10 10 10 10 10TIME OUT OF REACTOR (a)
I07 I08
FIGURE 10: Comparison Between the Potential Health Hazard from Used Fueland Fuel Reprocessing Waste. (Vertical scale is normalized to1 g of U in fresh fuel.)

FIGURE 11: Potential Health Hazard at Various Stages of a Nuclear Fuel Cycle

- 24 -
8. CONCLUSIONS
The protection to be provided by a disposal system depends on thePHH of the fuel waste. Thus, the source and the time variation of the PHHof the waste are important considerations in determining a suitable methodof waste disposal.
Comparison of the PHH of used fuel and of fuel reprocessing wastewith that of uranium ore gives a measure of perspective to the nuclear fuelwaste disposal objectives.
At early times, to about 100 a, the fission products, especially90Sr and i37Cs, contribute most to the PHH, while 229Th causes a local peakaround 106 a. Of the fuel reprocessing waste forms, the glass contributesnearly all of the PKH.
The PHH to infants is about one-half to one order of magnitudelarger than to adults.
The total radioactivity and PHH are higher for used fuel than forfuel reprocessing waste in the periods between 103 and 105 a (because ofthe difference in plutonium contents), and beyond 106 a (because of thedifference in uranium contents). The difference after 106 a would be eli-minated in reprocessing strategies that left all of the uranium in thewaste stream. The PHH for used fuel approaches that for ore by about107 a.
REFERENCES
Bell, M.J. and R.S. Dillon. 1971. The long-term hazard of radioactivewastes produced by the enriched uranium, Pu-238U, and 233U-Th fuelcycles. Oak Ridge National Laboratory Report, ORNL-TM-3548.
Blomeke, J.O., J.P. Nichols and U.C. McClain. 1973. Managing radioactivewastes. Physics Today 26(8), 36-42.
Clegg, L.J. and J.R. Coady. 1977. Radioactive decay properties of CANDUfuel- Volume 1: The natural uranium fuel cycle. Part 1: Startingmaterials: uranium ore, separated uranium and uranium mill tailings,and Part 2: Irradiated fuel. Atomic Energy of Canada Limited Report.AECL-4436/1.
Cohen, B.L. 1982. Effects of ICRP Publication 30 and the 1980 BEIR reporton hazard assessments of high-level waste. Health Physics 4_2, 133-143. ~
Cohen, J.J, G.R. Daer, C.F. Smith, D.K. Vogt and S.W. Woolfolk. 1989. Anassessment of issues related to determination of time periods requiredfor isolation of high level waste. In Waste Management '89, Proceed-ings Symposium on Waste Management, Tucson, AZ, 1989, 187-195.

25 -
Elayi, A.G. and J.P. Schapira. 1987a. Long-term radiotoxicity of high-level wastes and spent fuels produced by light water reactors: Impactof burn-up extension and of the use of mixed oxide fuels. RadioactiveWaste Management and the Nuclear Fuel Cycle 8, 1-21.
Elayi, A.G. and J.P. Schapira. 1987b. Impact of the changes fromI.C.R.P.-26 to I.C.R.P.-48 recommendations on the potential radiotoxi-city of the discharged LWR, FBR, and CANDU fuels. Radioactive WasteManagement and the Nuclear Fuel Cycle 8, 327-338.
Hamstra, J. 1975. Radiotoxic hazard measure for buried solid radioactivewaste. Nuclear Safety 16, 180-189.
Hang, H.O. 1976. Some aspects and long-term problems of high-level andactinide contaminated spent fuel reprocessing wastes from the U-Pu andTh-U fuel cycles. In Proceedings of the IAEA Symposium on Managementof Radioactive Wastes from the Nuclear Fuel Cycle, Vienna, 1976,Vol. II, 233-242.
ICRP (International Commission on Radiological Protection). 1959. Reportof Committee II on Permissible Dose for Internal Radiation. ICRPPublication 2, Pergamon Press, N.Ï.
ICRP (International Commission on Radiological Protection). 1975. Refer-ence Man: Anatomical, Physiological and Metabolic Characteristics.ICRP Publication 23.
ICRP (International Commission on Radiological Protection). 1977a. Recom-mendations of the International Commission on Radiological Protection.ICRP Publication 26, Annals of the ICRP, Vol. 1, No. 3.
ICRP (International Commission on Radiological Protection). 1977b. Prob-lems Involved in Developing an Index of Harm. ICRP Publication 27,Annals of the ICRP, Vol. 1, No. 4.
ICRP (International Commission on Radiological Protection). 1981. Limitsfor Intakes of Radionuclides by Workers. ICRP Publication 30, Annalsof the ICRP, Vol. 2-8.
ICRP (International Commission on Radiological Protection). 1986. TheMetabolism of Plutonium and Related Elements. ICRP Publication 48,Annals of the ICRP, Vol. 16, No. <V3.
ICRP (International Commission on Radiological Protection). 1990. 1990Recommendations of the International Commission on Radiological Pro-tection. ICRP Publication 60, Annals of the ICRP, Vol. 21, No. 1-3.
Johnson, J.R. 1982. Dose conversion factors used in the current Canadianhigh level waste disposal assessment study. Radiation ProtectionDosime try, 3(1/2), 47-50.
Johnson, J.R. and D.W. Dunford. 1983. Dose conversion factors for intakesof selected radionuclides by infants and adults. Atomic Energy ofCanada Limited Report, AECL-7919.

- 26 -
Mehta, K. 1982. Nuclide inventory for nuclear fuel waste management:Post-closure phase. Atomic Energy of Canada Limited Report,AECL-6830.
NAS (National Academy of Sciences). 1972. The Effects on Populations ofExposure to Low Levels of Ionizing Radiation. Report by the NationalAcademy of Sciences Committee on Biological Effects of IonizingRadiation, Washington, D.C. Referred to as BEIR I.
NAS (National Academy of Sciences). 1980. The Effects on Populations ofExposure to Low Levels of Ionizing Radiation. Report by the NationalAcademy of Sciences Committee on Biological Effects of IonizingRadiation, Washington, D.C. Referred to as BEIR III.
Runkle, G.E. and J.K. Soldat. 1982. Comparison of ICRP2 and ICRP30 forestimating the dose and adverse health effects from potential radio-nuclide releases from a geological waste repository. Iri Proceedingsof the ANS Waste Management Conference, 1982, Tucson, AZ, Vol. 3,59-70.
Wick, O.J. and M.O. Cloninger. 1980. Comparisons of potential radiologi-cal consequences from a spent-fuel repository and natural uraniumdeposits. Battelle Pacific Northwest Laboratories, Richland, Report,PNL-3540.
Wuschke, D.M., P.A. Gillespie, K.K. Mehta, W.F. Heinrich, D.M. LeNeveu,V.M. Guvanasen, G.R. Sherman, D.C. Donahue, B.W. Goodwin, T.H. Andresand R.B. Lyon. 1985. Second interim assessment of the Canadian con-cept for nuclear fuel waste disposal. Volume A: Post-closureassessment. Atomic Energy of Canada Limited Report, AECL-8373-4.

27 -
APPENDIX A
THE COMPUTER PRÜGRAM HAZARD
A.I INTRODUCTION
The computer program HAZARD calculates the time-dependent radio-activity level, as well as potential health hazard (PHH) to man from theingestion of radioactive nuclides, for a user-specified initial inventory.The radioactivity and the hazard to adults and to infants are calculatedfor each nuclide, totalled for each decay chain or nuclide group, andtotalled for all nuclides present. The results are plotted versus time, upto 108 a.
The program has been used to evaluate the PHH from uranium ore,mine tailings, separated uranium, used fuel, and fuel reprocessing waste.
A.2 METHOD
The amount of radionuclide, Mj(mol), present at time t is definedusing the Bateman coefficients, C.i (Bateman 1910), where i is the index inthe decay chain of the input, or source, nuclide, and j is the index of thenuclide of interest:
j(A.I)
where Xx = decay constant of nuclide i (a"1).
The Bateman coefficients are defined by
= Z ]k=l
where
and
• 3 i(A.2)
= initial (at t = 0) amount of nuclide k (mol)
i = j = kXkji = 1
j
nm=k
KK-K
i * ji it k
asThe radioactivity at time t, A(t), of a radionuclide is defined
A(t)= A°XM(t)/K (A.3)

- 28 -
where A(t) --- radioactivity at time t (Bq),A0 --• Avogadro's number (atom/mol) = 6.02252 x 10²³,X :: radiological decay constant of the radionuclide (a"1),M(t) - amount of radionuclide at time t (mol),
K - time conversion factor (s/a) = 3.156 x 10⁷.
The potential health hazard at time t, PHH(t), is given by
PHHj(5) - Ax(t) DCFi RF (A.A)
where Ai - radioactivity associated with radionuclide i (Bq),DCFa - dose conversion factor for radionuclide i (Sv/Bq),
•-• effective dose equivalent to man from ingestion of 1 Bq ofradionuclide i,
RF ^ risk factor (Sv 1),= probability of carcinogenic and genetic effects per 1 Svof effective dose equivalent.
Activity and potential health hazard for a nuclide decay chain, or anuclide group, are evaluated by summing the contribution from each includednuclide, at each time point. Case totals are the summation of contribu-tions from ail nuclides at each time point.
The modular structure of the HAZARD program is illustrated inFigure A-l. Each box represents a subroutine; the name is in the upperright corner, and a brief description of its purpose is included. Subrou-tines at the head of large arrows are called by those at the tail. Subrou-tine arguments are shown alongside the call arrows, with the direction ofdata transfer indicated by small arrows. Small boxes within module boxesdisplay the names of contained common blocks, with the direction of infor-mation transfer indicated. The variables in these common blocks are iden-tified in Figure A-2, and variable definitions are given in Table A-l.
A.3. INPUT DATA
Input to HAZARD is contained in a sequential disk data file; thename of the data file is entered interactively. Nuclides may be groupedfor evaluation, e.g., separate decay chains, fission products, activationproducts of Zircaloy, or activation products of fuel impurities. Eachnuclide in a decay chain, or a nuclide group, is described in a recordgiving values for initial inventory, half-life, dose conversion factor forinfant, and dose conversion factor for adult.
A. 3.1 IrUe_rac_t_i_ve_Terminal Input
The program will request the name of the file containing data tobe used foi the case. The input data file name can have up to 10 charac-ters (up to 6 characters followed by a ".", and a file-name extension of upto three characters).

29
A..]. ? Dis k File Input
Table A-2 describes the HAZARD input data file. Tables A-3 toA-5 are examples of the input data files. Table A-3 shows nuclide proper-ties of used fuel; Table A-4 shows nuclide properties of mine tailings; andTable A-5 shows nuclide properties of separated uranium.
A.4 OUTPUT DATA
The output from HAZARD includes printed input data, and plots ofthe radioactivity and PHH to infants and adults.
A.4.1 Printed Output
The nuclide chain and grouped nuclide identification, withnuclide properties as they are read in, are echoed to a data file called"HAZARD.PRT", for printing (see Table A-6 for sample output data file).
A.4.2 Plot ted Output
For each nuclide decay chain or each set of grouped nuclides inthe case, three plots are produced:
(1) radioactivity from each nuclide and the total for the group (Bq);
(2) PHH to infants from each nuclide and the total for the group; and
(3) PHH to adults from each nuclide and the total for the group (seeFigure A-3 for sample plot).
Three final plots are produced:
(1) total radioactivity from all nuclide chains and grouped nuclidesin the case (see Figure A-4 for sample plot);
(2) total PHH to infants for all nuclide chains and grouped nuclidesin the case; and
(3) total PHH to adults for all nuclide chains and grouped nuclidesin the case.
The plots show radioactivity, or PHH, as the ordinate (y axis)and time as the abscissa (x axis). Both scales are logarithmic. Eachnuclide, or a total, is represented by lines with different dash-dot codes,identified in a legend.

30 -
A.5 PROGRAM EXECUTION
HAZARD is a FORTRAN 77 program (with a few extensions, describedby Hoffman and Sherman (1985)) written for a VAX-11/785 system with aVERSATEC plotter. The program code is stored in the user area[ESAB.HAZARD] at. the Whiteshell Laboratories, and contains approximately1500 lines of code. Typical CPU time required for execution is less than1 s per nuclide, with decay chain lengths of about 8 (4 in secular equili-brium), and gi"oup.s of about 10 nuclides.
HAZARD may be run interactively using the following commands:
$ RUN [F.SAB. HAZARD]HAZARD$ PLOT
A command file may be used to submit a HAZARD job to batch:
$ SUBMIT/0UE=[queue name] [command file name]
The batch execution command file contains:
S RUN | ESAB.HAZARD]HAZARD[name of input file to be used)$ PLOT$ EXIT
REFERENCES
Bateman, H. 1019. Solutions of a system of differential equations occur-ring in the theory of radioactive transformation. Proc. CambridgePhil. Sof. 15, 423.
Hoffman, K.J. and G.R. Sherman. 1985. Standards for the development ofscientific research software. Atomic Energy of Canada LimitedTechnical Record, TR-291.*
Johnson, J.R. and D.U. Dunford. 1983. Dose conversion factors for intakesof selected radionuclides by infants and adults. Atomic Energy ofCanada limited Report, AECL-7919.
Mehta, K. 1982. Nuclides inventory for nuclear fuel waste management:Post-closure phase. Atomic Energy of Canada Limited Report,AECL-6H3D.
Internal report available from SDDO, AECL Research, Chalk RiverLaboratories, Chalk River, Ontario K0J UO.

TABLE A-l
COMMON BLOCK VARIABLE DEFINITIONS
VARIABLE DEFINITION
CYLX x-axis cycle length [inches]
CYLY y-axls cycle length [inches]
DS Pseudo arc length for line smoothing
DY y-axis units per interval
DYIN inches per y-axis Interval
DUMMY dummy array, offset in common block PPEP1
DX x-axis units per interval
DXIN Inches per x—axis interval
DZ z-axis units per interval
DZIN inches per z-axis interval
LIMCHK when non-zero, checks for attempts
to plot off page
LPW line width (1 to 5 dots, each 0.005 inches
LMSK line mask
MINXP minimum x-axis power
MINYP minimum y-axis power
MSK line masking switch
NDIVX number of x-axis subdivision levels
NDIVY number of y-axis subdivision levels
NV number of elements in each row of VECTOR
NXCY number of x-axis cycles
NYCY number of y-axis cycles
TIC length of major tick marks on axis [inches
VECTOR pen up/pen down increments for dash-dot
coded line
XLEN length of abscissa [inches]
XMIN minimum x-axis value
YLEN length of ordinate [inches]
YMIN minimum y - a x i s v a l u e
ZMIN minimum z-axis value

- 32
TABLE A-2
HAZARD INPUT FILE DESCRIPTION
Variable Description Data type
NCHAIN the number of decay chains to beconsidered for the case.
Integer
repeat for each decay chain to be considered for the case
CIINII) chain identification (up to Char*80
80 characters)
NUMHUC the number of nuclides in a
decay chain
Integer
repeat for each nuclide in the chain
NUCID nuclide identification (an "=" Char*10following the nuclide nameindicates that radioactive decayof the nuclide equilibrates veryrapidly compared with other nuclides,and the activity of the nuclide isassumed to be the same as that of itsparent. The parent nuclide isdesignated by an integer number afterthe "=", indicating the position ofthe parent nuclide in the chain.)
AMTBGN initial nuclide inventory [mol/kg U] real
HAFLIF nuclide half-life [a] real
DCFIN nuclide dose conversion realfactor for infant [Sv/Bq]
DCFAD nuclide dose conversion realfactor for adult [Sv/Bq]
continued.

33 -
TABLE A--2 (concluded)
Variable Description Data type
NGROUP the number of groups of nuclidesto be considered for the case
integer
repeat for each group to be considered for the case
GRPID group identification char*80
NUMNUC the number of nuclides in the group integer
repeat for each nuclide in the group
NUC1D nuclide identification Char*10
AMTBGN initial nuclide inventory [mol/kg U] real
HAFLIF nuclide half-life [a] real
DCFIN nuclide dose conversion real
factor for infant [Sv/Bq]
DCFAD nuclide dose conversion real
factor for adult [Sv/Bq]

- 34 -
TABLE A-3
INPUT FILE OF NUCLIDE PROPERTIES FOR USED FUEL
ACTINIDliSco'PU240''U2361
'TH2321
'RA228'
'TH228=4''RA224=4'
ACïINIDES
y'CM245''AM2411
'NP237'•U233'
'TH229'
'PU241=1''PA233=3'IRA225=51
'AC225=5'ACTINIDES10'CM246''PU242'fU238''U2341
'TH2301
'RA2261
'TH234=3'fPB210=6'•BI210=6''PO210=6'
ACTINIDES9'AM243''PU239'•U235''PA231''NP239=1''TH231=3''AC227=4''TH227=4''RA223=4'
AND
AH!)
AND
AND
THEIR DAUGHTERS
439184
•208E-31 '•142E-3•909E-10.776E-19.237E-12.287E-14
THEIR DAUGHTERS
52149445.3
.780E-9•880E-4.252E-4.113E-10.236E-15.780E-4.322E-12.O4OE-2O.380E-20
THEIR DAUGHTERS
5.2.4,2,5.2,6,4.2.6.
.146E-10
.127E-4
.139
.O12E-4
.817E-9
.379E-13
.111E-11
.167E-16
.550E-19•105E-18
THEIR DAUGHTERS
8.1.9.1.7.3.i ,
4.2.
449E-6154E-2143E-3488E-10372E-12892E-3916E-14467E-17711E-17
4N
6.2.1.5.1.1.
SERIES
,537E3(2)
342E7• 40E107591300E-2
4N+1 SERIES
8.4.2.1.7.1.7.A.2.
5E332E214E6592E534E3
47E139E-2
O5E-274E-2
4N+2 SERIES
4342716213
.73E3
.76E5
.468E9
.44E5
.7E4
.60E3
.598E-2
.23E1•37E-2.789E-1
4N+3 SERIES
72.736225.3.
•380E3.411E4.04E8.28E4.434E-3.911E-3.177E1.125E-2.129E-2
111397
559131159
5111,5.1,5,7.2.9.
5.1.1.2.1.8.3.3.1.
.1E-6• 4E-7.9E-4.0E-10.9E-5.1E-7
• 6E-6.4E-6.8E-5• 5E-7.8E-4
.9E-&
.3E-9
.3E-7
• 0E-8
.5E-6
.OE-6
.3E-7
.5E-7• 5E-5
.2E-6
.7E-9• 3E-6,7E-9,2E-7
4E-61E-64E-74E-56E-96E-105E-57E-62E-6
( 3)1.2E-78.1E-81.1E-47.7E-111.5E-59.3E-8
6.2E-76.0E-71.1E-58.7E-81.4E-42.1E-99.4E-105.0E-83.1E-8
6.1E-71.2E-77.5E-88.5E-82.1E-53.2E-73.1E-91.6E-61.7E-95.3E-7
6.OE-71.2E-77.9E-82.9E-68.6E-103.6E-1O3.8E-64.4E-71.5E-7
(4)
continued.

35 -
TABLE A-3 (concluded)
3ACTIVATION PRODUCTS OF FUEL
7'C 1 4 '' C A 4 1 '' N I 5 9 '•NI63''AGI.08M'•TB1571
'MO9 3 'FISSION11•SI' 7 9 ''S 1190f
'ZR931
•TC991
•PD107''SN121M''SN126'' 1 1 2 9 ''CS135''CS137 '•SMI 5 1 '
ZIRCALOY9•C141
•NI59 '' N I 6 3 '•ZR931
'MO931
•NB94''TC99''SNI21M1
•PB2051
1824683
PRODUCTS
1.1.1.1.4,6,3,3.2.1,1.
( i )
.301E-5
.804E-7
.864E-6
.206E-7
.189E-8
.454E-11
.659E-9
.509E-5
.O71E-3
.734E-3
.970E-3
.993E-4
.302E-9
.666E-5
.274E-4
.567E-4
.67OE-3•579E-5
ACTIVATION PRODUCTS
1.6 .9 .7.4.3 .1 .7.1.
•870E-5,677E-6819E-7•237E-4582E-8O63E-6151E-7
•O67E-6156E-8
IMPURITIES(2)
5.73E31.3E58.OE41.0E21.30E21.5E23.5E3
6.5E42.9E11.5E62.13E56.5E65.0E11.0E51.59E72.3E63.02E19.3E1
5.73E38.0E41.0E21.5E63.5E32.0E42.13E55.0E11.4E7
3113751
I2,1.3,5.3.1.1.5.2 .1.
3 .1 .3 .1 .1 .3 .3 .3 .1 .
( 3 )
.3E-9
.4E-9
.1E-10•5E-10.5E-9•5E-11.OE-9
.OE-8
.4E-7
.3E-9
.3E-9
.7E-11•2E-10.6E-9,8E-7.2E-9• 5E-8.9E-10
3E-9.1E-105E-103E-9OE-91E-83E-92E-106E-9
5331433
234141971,1.1,
5.3 .1.4 .3 .1.1.1 .4.
I 4 )•2E-10•6E-10.5E-11•1E-10.9E-9.3E-11.8E-10
.3E-9
.4E-8
.5E-10
.4E-9
.1E-11
.8E-10
.1E-10• 8E-8.9E-9.4E-8.1E-10
.2E-10
.5E-11•1E-10•5E-108E-103E-84E-98E-107E-10
(1) Initial nuclide inventory for used fuel 10 a out of the reactor with aburnup of 650 GJ-kg IT1 (mol/kg U) (Mehta 1982).
(2) Radionuclide half-life (a).
(3) Radionuclide dose conversion factor for infant (Sv/Bq) (Johnson andDunford 1983).
(4) Radionuclide dose conversion factor for adult (Sv/Bq) (Johnson andDunford 1983).

- 36 -
TABLE A-4
INPUT FILE OF NUCLIDE PROPERTIES FOR MINE TAILINGS
ACTINIDES AND THEIR DAUGHTERS 4N+2 SERIES
•U238''U234''TH230''RA226''TH234=1''PB21O=4'fBI2L0=4''PO21O=4'0
2.088E-11.155E-57.296E-51.498E-6C O0.00 . 00 .0
4.468E92.44E57.7E41.60E36.598E-22.23E11.37E-23.789E-1
1.3E-71.5E-75.5E-51.2E-65.7E-97.3E-62.7E-99.2E-7
7.5E-88.5E-82.1E-53.2E-73.1E-91.6E-61.7E-95.3E-7
TABLE A-5
INPUT FILE OF NUCLIDE PROPERTIES OF SEPARATED URANIUM
ACTINIDES AND THEIR DAUGHTERS 4N+2 SERIES8•U238'•U234''TH2301
•RA2261
•TH234=r'PB210=4''BI210=4''PO21O=4'0
4.172E02.308E-40 . 00 . 00 . 00 . 00 . 00 .0
4.468E92.44E57.7E41.60E36.598E-22.23E11.37E-23.789E-1
1.3E-71.5E-75.5E-51.2E-65.7E-97.3E-62.7E-99.2E-7
7.5E-88.5E-82.1E-53.2E-73.1E-91.6E-61.7E-95.3E-7

- 37 -
TABLE A-6
OUTPUT DATA FILE FOR PROPERTIES OF NUCLIDES FOR MINE TAILINGS
ACTINIDES AND THEIR DAUGHTERS 4N+2 SERIES
NUCLIDE
U238U234TH230RA226TH234=1PB210=4BI210=4PO21O=4
INVENTORY
2.O88E-O11.155E-O57.296E-O51.498E-O6O.OOOE+OOO.OOOE+OOO.OOOE+OOO.OOOE+OO
HALF LIFE
4.468E+O92.44OE+O57.7OOE+O41.6OOE+O36.598E-O22.230E+011.37OE-O23.789E-O1
DCF INFANT
1.3OOE-O71.5OOE-O75.500E-051.200E-065.7OOE-O97.3OOE-O62.7OOE-O99.200E-07
DCF ADULT
7.5OOE-O83.5OOE-O82.1OOE-O53.2OOE-O73.1OOE-O91.600E-061.7OOE-O95.3OOE-O7

AMTBGN vDECCÛNNUCOUT \ l / BfiTCOF
flGEIDTITLENUCIDNUMNUCHflZRDTIME
BflTECODEFINEBATEMRNCOEFFICIENTS
\ /
PLOTHRZRRD
PLHZRD
SCRIL
HflZflRDCflLCULRTEPOTENTIALHERLTH HflZRRDDUE TORflDIOfiCTIVlTY
TITLENUCIDNPflRNTNNONEQNUMNUCHCTTIME \ / NUCID
RGEIDTITLETHRZRDTIME \ | /
PLOTRCTIVITY
PLflCTV
SCfllL
TITLETflCTTIME \ | /
PLOTTOTflLHfiZflRDFOR THECflSE
PLHTOT
SCfllL
PLflTOTPLOTTOTflLPflDIOflCTIVITYFOR THECRSESCfllL
CD
i
FINGNCSTRNG >SIZEr vXLCODE \
RNGNCSTRNG 1SIZE !
Y vX
/ LCODE \
LflNTPLOT flDflSH-DOTLINE CODEDESCRIPTION
PLOTV - ^ SCRIL
1YXNPTS
/ LCODE \
flNOTPLOT ACHRRRCTERSTRING
PLOTV L- - SCRIL
1NYY vNX
/ X \
CODLDRRW RDASH-DOTCODEDLINE
NCY 'YL9B -i-NCX
/ XLRB \
LGSLCRLCULRTESCRLINGFRCTORS FORLOGRITHMICPLOTLSCfiL - •—-SCfllL
/
LGLGflDRRW flLOGfiRITHMlCGRIDHITHRXISPPEP1 - *- PLOTVLSCflL ^ -! SCRIL
FIGURE A-l: Program HAZARD Structure Chart

39 -
LSCflLHINXPCTLXNXCTHINTPCTLTNTCT
PPEPlDUHMTMSKLMSK
PLOTVLPHLIMCHKVECTORNVTICNOIVXNOIVTOS
SCfllLXLENXMINOXDXINTLENTHINOTDTINZMINDZOZIN
FIGURE A-2: HAZARD Common Blocks and Their Associated Variables

flCTINIDCS FIND THEIR DflUGHTERS 4N+2 SERIES
5 "]-•U23Q
a:
o
Œ
Œ
O
—'coCt i
• \ !
\
\
• \
TH230
RR226
TH234
PB210
BI210-
P0210\\
\
X
\
H
\ ' • • • • •
.1.
o '
\
\
I M I l l l | i ITTITHI 7 I M I Ml[ I i I I Mil l I I I I I II1J I I I I I II7| I rTUTTTl
102 103 104 105 1Ü6 1O7 1O8
TIME (a)
FIGURE A-3: Potential Health Hazard from Each Nuclide to Adults

- 41 -
i ] i
no1 104
TIME
FIGURE A-4: Total Radioactivity from all Nuclides' Chains and GroupedNuclides in a Case

ISSN 0067-0367
To identity individual documents in the series
we have assigned an AECL—number to each.
Please refer to the AECL— number when
requesting additional copies of this document
from
Scientific Document Distribution Office
Atomic Energy of Canada Limited
Chalk River, Ontario, Canada
KOJ 1J0
Price: B
ISSN 0067-0367
Pour identifier les rapports individuels
faisant partie de cette série, nous avons
affecté un numéro AECl.—à chacun d'eux.
Veiiill' - indiquer le numéro ALCL— lorsque
\ous demande/ d'autres exemplaires de ce rapport
au
Service de Distribution des Documents Officiels
Energie Atomique du Canada Limitée
Chalk Ri\er. Ontario, Canada
K0.I IJ0
Prix: B