Atmospheric soluble dust records from a Tibetan ice core: Possible climate proxies and...
13
Atmospheric soluble dust records from a Tibetan ice core: Possible climate proxies and teleconnection with the Pacific Decadal Oscillation B. Grigholm, 1 P. A. Mayewski, 1 S. Kang, 2,3 Y. Zhang, 2 S. Kaspari, 1,4 S. B. Sneed, 1 and Q. Zhang 2 Received 3 October 2008; revised 5 April 2009; accepted 2 July 2009; published 30 October 2009. [1] In autumn 2005, a joint expedition between the University of Maine and the Institute of Tibetan Plateau Research recovered three ice cores from Guoqu Glacier (33°34 0 37.8 00 N, 91°10 0 35.3 00 E, 5720 m above sea level) on the northern side of Mt. Geladaindong, central Tibetan Plateau. Isotopes (d 18 O), major soluble ions (Na + ,K + , Mg 2+ , Ca 2+ , Cl , NO 3 , SO 4 2 ), and radionuclide (b-activity) measurements from one of the cores revealed a 70-year record (1935 – 2005). Statistical analysis of major ion time series suggests that atmospheric soluble dust species dominate the chemical signature and that background dust levels conceal marine ion species deposition. The soluble dust time series have interspecies relations and common structure (empirical orthogonal function (EOF) 1), suggesting a similar soluble dust source or transport route. Annual and seasonal correlations between the EOF 1 time series and National Centers for Environmental Prediction/National Center for Atmospheric Research reanalysis climate variables (1948–2004) suggest that the Mt. Geladaindong ice core record provides a proxy for local and regional surface pressure. An approximately threefold decrease of soluble dust concentrations in the middle to late 1970s, accompanied by regional increases in pressure and temperature and decreases in wind velocity, coincides with the major 1976–1977 shift of the Pacific Decadal Oscillation (PDO) from a negative to a positive state. This is the first ice core evidence of a potential teleconnection between central Asian atmospheric soluble dust loading and the PDO. Analysis of temporally longer ice cores from Mt. Geladaindong may enhance understanding of the relationship between the PDO and central Asian atmospheric circulation and subsequent atmospheric soluble dust loading. Citation: Grigholm, B., P. A. Mayewski, S. Kang, Y. Zhang, S. Kaspari, S. B. Sneed, and Q. Zhang (2009), Atmospheric soluble dust records from a Tibetan ice core: Possible climate proxies and teleconnection with the Pacific Decadal Oscillation, J. Geophys. Res., 114, D20118, doi:10.1029/2008JD011242. 1. Introduction [2] Atmospheric dust aerosols play a significant role in the global climate system influencing the Earth’s radiative budget and albedo by scattering and absorbing incoming shortwave (solar) radiation [Claquin et al., 1999; Tegen et al. , 1996] and acting as cloud condensation nuclei [Pruppacher and Klett, 1978]. Atmospheric dust particles are also influential in atmospheric chemical reactions, as a source of nutrients for biological systems [Li-Jones and Prospero, 1998; Zhang and Carmichael, 1999], and can have serious impacts on human health, agriculture, and economics. Therefore, the reconstruction of past atmospheric dust concentrations is important in understanding variations in climate and environmental conditions. Ice core records provide the most direct and detailed way to investigate preinstrumental temporal variations of atmospheric dust and extrapolate paleoclimatic and paleoatmospheric conditions. Central Asia, one of the Northern Hemisphere’s major dust source regions, is a prime location for the retrieval of ice cores because it contains several of the Earth’s highest mountain ranges (e.g., Himalayas, Pamirs, Hindu Kush, Tien Shan, Altai) and, the Tibetan Plateau (TP), which spans 2.5 million km 2 at an average elevation of 4000 m. It is at these elevations that middle- to low-latitude ice core environmental records are best preserved. Since the early 1980s ice core research has been conducted in carefully selected high-altitude sites [Aizen et al., 1996, 2004; Kang et al., 2001, 2002a, 2002b; Kreutz et al., 2001; Kreutz and Sholkovitz, 2000; Lyons and Mayewski, 1983; Mayewski et al., 1983, 1984; Qin et al., 2000, 2002; Thompson et al., 1989, 1993, 1995, 1997, 2000; Wake et al., 1990, 1993, 1994] providing high-resolution paleoclimate JOURNAL OF GEOPHYSICAL RESEARCH, VOL. 114, D20118, doi:10.1029/2008JD011242, 2009 Click Here for Full Article 1 Climate Change Institute, Department of Earth Sciences, University of Maine, Orono, Maine, USA. 2 Institute of Tibetan Plateau Research, Chinese Academy of Sciences, Beijing, China. 3 Also at State Key Laboratory of Cryospheric Science, Chinese Academy of Sciences, Lanzhou, China. 4 Also at Department of Geological Sciences, Central Washington University, Ellensburg, Washington, USA. Copyright 2009 by the American Geophysical Union. 0148-0227/09/2008JD011242$09.00 D20118 1 of 13
Transcript of Atmospheric soluble dust records from a Tibetan ice core: Possible climate proxies and...

Atmospheric soluble dust records from a Tibetan ice core: Possible
climate proxies and teleconnection with the Pacific Decadal Oscillation
B. Grigholm,1 P. A. Mayewski,1 S. Kang,2,3 Y. Zhang,2 S. Kaspari,1,4 S. B. Sneed,1
and Q. Zhang2
Received 3 October 2008; revised 5 April 2009; accepted 2 July 2009; published 30 October 2009.
[1] In autumn 2005, a joint expedition between the University of Maine and the Instituteof Tibetan Plateau Research recovered three ice cores from Guoqu Glacier (33�34037.800N,91�10035.300E, 5720 m above sea level) on the northern side of Mt. Geladaindong, centralTibetan Plateau. Isotopes (d18O), major soluble ions (Na+, K+, Mg2+, Ca2+, Cl�, NO3
�,SO4
2�), and radionuclide (b-activity) measurements from one of the cores revealed a 70-yearrecord (1935–2005). Statistical analysis of major ion time series suggests that atmosphericsoluble dust species dominate the chemical signature and that background dust levelsconceal marine ion species deposition. The soluble dust time series have interspeciesrelations and common structure (empirical orthogonal function (EOF) 1), suggesting asimilar soluble dust source or transport route. Annual and seasonal correlations betweenthe EOF 1 time series and National Centers for Environmental Prediction/NationalCenter for Atmospheric Research reanalysis climate variables (1948–2004) suggest thatthe Mt. Geladaindong ice core record provides a proxy for local and regional surfacepressure. An approximately threefold decrease of soluble dust concentrations in the middleto late 1970s, accompanied by regional increases in pressure and temperature anddecreases in wind velocity, coincides with the major 1976–1977 shift of the PacificDecadal Oscillation (PDO) from a negative to a positive state. This is the first ice coreevidence of a potential teleconnection between central Asian atmospheric soluble dustloading and the PDO. Analysis of temporally longer ice cores from Mt. Geladaindong mayenhance understanding of the relationship between the PDO and central Asianatmospheric circulation and subsequent atmospheric soluble dust loading.
Citation: Grigholm, B., P. A. Mayewski, S. Kang, Y. Zhang, S. Kaspari, S. B. Sneed, and Q. Zhang (2009), Atmospheric soluble dust
records from a Tibetan ice core: Possible climate proxies and teleconnection with the Pacific Decadal Oscillation, J. Geophys. Res.,
114, D20118, doi:10.1029/2008JD011242.
1. Introduction
[2] Atmospheric dust aerosols play a significant role inthe global climate system influencing the Earth’s radiativebudget and albedo by scattering and absorbing incomingshortwave (solar) radiation [Claquin et al., 1999; Tegen etal., 1996] and acting as cloud condensation nuclei[Pruppacher and Klett, 1978]. Atmospheric dust particlesare also influential in atmospheric chemical reactions, as asource of nutrients for biological systems [Li-Jones andProspero, 1998; Zhang and Carmichael, 1999], and canhave serious impacts on human health, agriculture, and
economics. Therefore, the reconstruction of past atmosphericdust concentrations is important in understanding variationsin climate and environmental conditions. Ice core recordsprovide the most direct and detailed way to investigatepreinstrumental temporal variations of atmospheric dust andextrapolate paleoclimatic and paleoatmospheric conditions.Central Asia, one of the Northern Hemisphere’s major dustsource regions, is a prime location for the retrieval of icecores because it contains several of the Earth’s highestmountain ranges (e.g., Himalayas, Pamirs, Hindu Kush,Tien Shan, Altai) and, the Tibetan Plateau (TP), whichspans �2.5 million km2 at an average elevation of �4000m. It is at these elevations that middle- to low-latitude icecore environmental records are best preserved. Since theearly 1980s ice core research has been conducted incarefully selected high-altitude sites [Aizen et al., 1996,2004; Kang et al., 2001, 2002a, 2002b; Kreutz et al., 2001;Kreutz and Sholkovitz, 2000; Lyons and Mayewski, 1983;Mayewski et al., 1983, 1984; Qin et al., 2000, 2002;Thompson et al., 1989, 1993, 1995, 1997, 2000; Wake et al.,1990, 1993, 1994] providing high-resolution paleoclimate
JOURNAL OF GEOPHYSICAL RESEARCH, VOL. 114, D20118, doi:10.1029/2008JD011242, 2009ClickHere
for
FullArticle
1Climate Change Institute, Department of Earth Sciences, University ofMaine, Orono, Maine, USA.
2Institute of Tibetan Plateau Research, Chinese Academy of Sciences,Beijing, China.
3Also at State Key Laboratory of Cryospheric Science, ChineseAcademy of Sciences, Lanzhou, China.
4Also at Department of Geological Sciences, Central WashingtonUniversity, Ellensburg, Washington, USA.
Copyright 2009 by the American Geophysical Union.0148-0227/09/2008JD011242$09.00
D20118 1 of 13

records that have greatly added to the understanding of theAsian climate during the late Holocene.[3] Here we present a 70-year atmospheric soluble
dust deposition record (1935–2004) developed from a Mt.Geladaindong ice core located in the Tanggula Mountainson the TP (Figure 1) and investigate the spatial and temporalrelationships between ice core chemistry and related climateparameters (pressure, wind velocity, precipitation, andtemperature) that impact atmospheric soluble dust concen-trations on local and regional scales. We also investigate thepotential of the Mt. Geladaindong ice core chemistry toserve as a climate proxy for preinstrumental periods andexplore a potential teleconnection between TP atmosphericsoluble dust concentrations and the Pacific DecadalOscillation (PDO).
2. Study Region
[4] The modern TP climate is strongly influenced bypolar air masses from the Arctic, continental air massesfrom central Asia, and equatorial-maritime air masses fromthe Indian and Pacific Oceans [Bryson, 1986]. Its massivesize splits the upper-level westerlies and effects surfaceand upper-level pressure distributions. Northern regions of
the TP are dominated by the interaction of Siberiananticyclones and westerly cyclones [Aizen et al., 1996],while southern regions are dominated by westerly cyclonesand the Asian monsoon. Seasonal heating and cooling overnorthern Asia creates large pressure differences between theAsian continent and the Indian Ocean and generates con-ditions that form the South Asian Monsoon (or the IndianMonsoon), the largest seasonal reversal of wind patterns andprecipitation regimes on Earth. The Tanggula Mountains,central TP, are thought to mark the northern extent of theIndian Monsoon, while regions further north receive mois-ture provided by continental water recycling [Tian et al.,2001].[5] Transitions in atmospheric circulation over the TP
occur in the spring and in the autumn. During the autumnthe westerly wind velocity over the plateau intensifiesreaching a maximum in winter. Coupling between upperlevel wind patterns and surface winds during surges of coldcontinental air masses and the polar jet stream are thought togenerate cyclones responsible for dust storms. During thespring the westerlies begin to migrate to the north and windvelocities decrease reaching minimum values during thesummer.
Figure 1. Location map of study area. Star represents drill site. Square represents National Centers forEnvironmental Prediction (NCEP)/National Center for Atmospheric Research (NCAR) reanalysis grid.Area within black oval approximately represents areas covered by calcisols, solonchaks, and leptosols[Institute of Soil Science of Academia Sinica, 1985]. Examples of distal dust source regions includeTaklamakan and Thar deserts (Google Maps image).
D20118 GRIGHOLM ET AL.: DUST RECORDS FROM A TIBETAN ICE CORE
2 of 13
D20118

[6] The major central Asian dust sources are located inthe deserts of northern and northwestern China and con-tribute �100–800 Tg dust yr�1 [Laurent et al., 2006;Zhang et al., 1997]. Springtime cyclonic activity and wintertemperatures in these regions result in peaks in dust activitybetween mid-February and late May, with a strong maxi-mum in late April to early May [Merrill et al., 1989; Qian etal., 2002]. On the TP, a dust source upwind of the ChineseLoess Plateau, atmospheric dust is generated from localsoils on the plateau, while other materials are transportedinto the region from long-distance sources. Dust from theTP is suggested to be composed of �70% local and 25%distant material [Zhang et al., 1996]. Abundant local soilsinclude calcisols, solonchaks, and leptosols [Institute of SoilScience of Academia Sinica, 1985]. Other areas withentrainable materials include dried lake sediments, whichare scattered across the TP [Li et al., 2007]. These potentialdust sources are located all around Mt. Geladaindong,however, considering westerly circulation most dust aerosolsare probably originating to the west of Mt. Geladaindong.Comparison between back trajectory models (HY-SPLIT 4)and microparticle concentrations and fluxes from severalMt Geladaindong snow pits suggest that dust aerosols aremainly coming from northwestern areas of the TP [Zhang etal., 2008]. Distal dust sources may derive from the aridregions in northern China (e.g., Taklmakan desert) or otherdeserts in northern India, Pakistan, or central Asia [Zhang etal., 2001; Liu et al., 2008]. Weather station records on theTP show that dust activity occurs primarily betweenNovember and May [Han et al., 2004]. The amount thatTP dust sources contribute to long-distance atmosphericdust transport is still unknown. Research suggests that theatmospheric loading of Asian dust originating from thedeserts of north and northwestern China dominate long-distance transport when compared to dust input from the TP[Zhang et al., 2001]. However, recent study suggests thatdue to the high elevation of the TP, entrainment of dust mayregularly reach upper tropospheric transport pathways andtherefore contribute more to long-distance Asian dust trans-port than previously thought [Fang et al., 2004].
3. Methodology
3.1. Retrieval and Analysis of the Mt. GeladaindongIce Core
[7] During October and November 2005, an ice coredrilling expedition was conducted on the Guoqu Glacierlocated on the northern slope of Mt. Geladaindong
(33.58�N, 91.17�E, 5720 m above sea level) in the TanggulaMountains located in the center of the TP (Figure 1). Threeice cores were recovered (74 m, 147 m, and 22 m) from theflat firn basin in the accumulation zone of Guoqu Glacierusing the Cold and Arid Regions Environmental andEngineering Research Institute (CAREERI) electromechanicaldrill. The ice cores were transported frozen to the State KeyLaboratory of Cryospheric Science in Lanzhou, China. Thisstudy focuses on the 74 m core.[8] Preparations for sampling the core involved cutting
the ice core sections longitudinally into quarters and scrap-ing all ice surfaces with stainless steel scalpels precleanedwith deionized (DI) water (>18.2 MW). The ice core wasmelted at the State Key Laboratory of Cryospheric Sciencein Lanzhou, China using a continuous melter with discretesampling (CMDS) system with a nickel 270 (>99.99% Ni)melt head [Osterberg et al., 2006]. Continuous melterblanks and detection limits (3s) were calculated from DIwater blanks passed through the entire CMDS systemthroughout the melting campaign (Table 1). Na+, K+,NO3�, and SO4
2� had CMDS detection limits below theinstrumental detection limits of the ion chromatograph.Detection limits of Cl�, Mg2+, and Ca2+ were approximately1%, 2% and 6% of mean concentration values, respectively.Sample resolution was 3–5 cm yielding 23 samples yr�1 onaverage. A total of 1621 coregistered samples were collectedinto high-density polyethylene (HDPE) vials and precleaned(with DI water) polypropylene (PP) vials for analysis ofstable isotope ratios (d18O) and soluble ion concentrations(Na+, K+, Ca2+, Mg2+, Cl�, NO3
�, SO42�). Samples were
analyzed at the University of Maine for major soluble ionconcentration using Dionex DX-500 ion chromatographs.d18O was analyzed via a MAT-253 at the Institute ofTibetan Plateau Research, Chinese Academy of Science.The b-activity was analyzed at �1 m resolution
(�1 sample yr�1) at the Maine State Lab in Augusta.
3.2. Dating the Ice Core
[9] The Mt. Geladaindong depth-age scale is presented inFigure 2a. Annual dating was calibrated using the 1963nuclear test horizon (marked as a b-activity peak) as anabsolute age marker complemented by a multiparameterannual layer-counting methodology using subannuallyresolved stable isotopes and major soluble ions. The maxi-mum b-activity peak was selected as 1963 to reflect themaximum fallout of nuclear weapons testing [Anspaugh etal., 2000]. The mean annual accumulation rate (0.53 m water
Table 1. Statistical Summary of Mt. Geladaindong Major Soluble Ions, Procedural Blanks, and Procedural and Instrument Detection
Limitsa
Ion Mean Median SD Min. Max. %TCb CMDS Blankc CMDS DL (3s) IDL
Na+ 286.0 132.1 494.8 <IDL 4846 11.7 <IDL <IDL 0.62K+ 28.3 16.4 38.6 <IDL 337 1.5 <IDL <IDL 0.64Mg2+ 87.0 52.0 114.8 <IDL 976 4.6 8.6 1.5 0.12Ca2+ 928.4 489.6 1501.6 <IDL 16698 43.4 50.7 52.2 0.24Cl� 336.0 175.2 531.8 <IDL 4727 15.5 7.6 3.3 0.52NO3� 183.5 107.5 252.9 <IDL 2154 9.5 <IDL <IDL 0.48
SO42� 379.4 156.4 788.5 <IDL 15368 13.5 <IDL <IDL 2.32aValues are in micrograms per liter. Abbreviations are as follows: CMDS, continuous melter with discrete sampling; DL, detection limit; IDL, instrument
detection limit.bPercentage of total ion concentration of mean Mt. Geladaindong sample.cMean value.
D20118 GRIGHOLM ET AL.: DUST RECORDS FROM A TIBETAN ICE CORE
3 of 13
D20118

equivalent (weq.)) at the Mt. Geladaindong site allows forthe preservation of distinct seasonal cycles in chemicalspecies. On the basis of the results of onsite snow pitstudies individual years were selected by identifying the
seasonality of d18O depleted summer monsoon precipitationand late autumn-spring peaks in major ion dust species(Na+, K+, Ca2+, Mg2+, Cl�, NO3
�, and SO42�) [Kang et al.,
2007] (Figure 2b). It is important to note that not all of themajor ions in the snow pits showed the same patterns asmight be expected if the record had been postdepositionallyaltered. Ca2+, for example, in the snow pits and the ice coreshow independent as well as shared peaks with Na+, K+,Mg2+, Cl�, and SO4
2� during autumn-spring. The variationin chemistry concentration peaks may suggest the influenceof different dust source regions at different times of the year.In addition, snow pit studies showed that the commonseasonality of major soluble ions was supported by verysimilar trends in microparticles (concentration and flux)[Zhang et al., 2008]. Dating of the entire core was notpossible due to a sudden loss in overall ion concentrationsand variability at �50 m. The loss of an ion signal suggeststhe past presence of meltwater, which was discoveredduring drilling at 74 m. The 147 m ice core encounteredno water and preliminary major ion analysis revealed noloss of ion variability throughout the core. Upper sections ofboth ice cores share major soluble ion trends and variability.This study is focused on the major ion time series (1935–2004) from the top 47 m of the ice core.
4. Results and Discussion
4.1. Major Soluble Ion Time Series
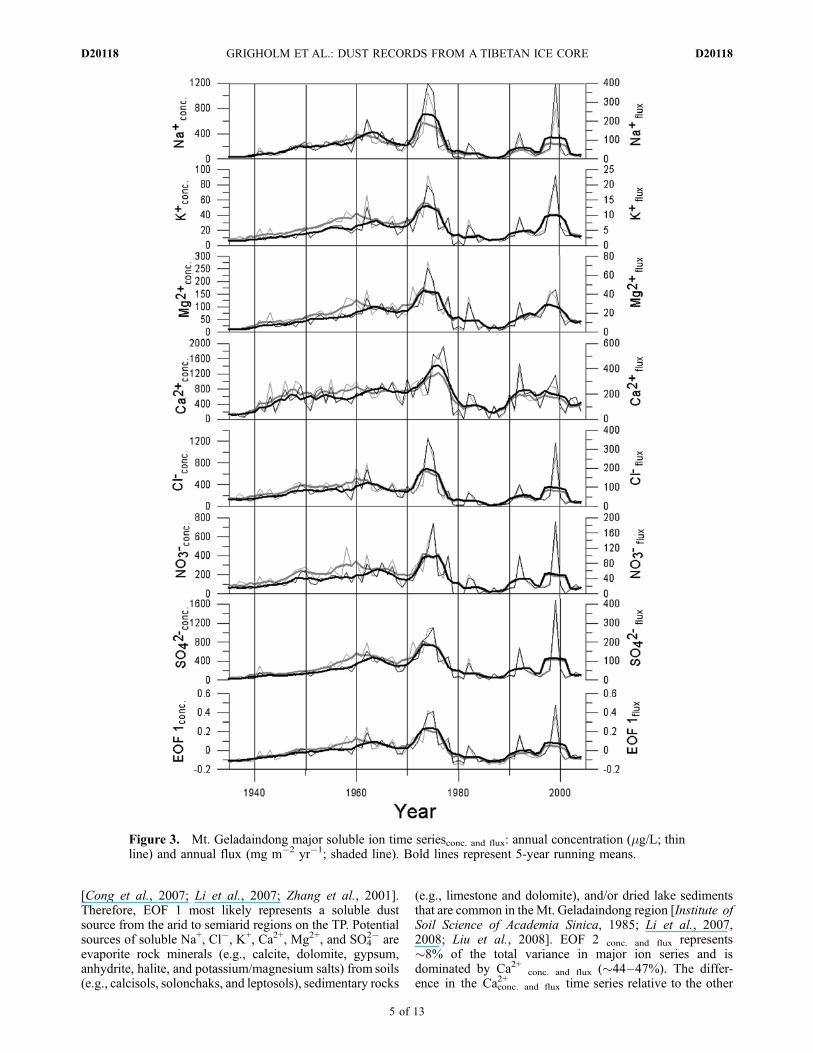
[10] Major soluble ion concentration records are shown inFigure 2a. Each record consists of 1635 samples, averaging23 samples yr�1. A statistical summary of the major ions isprovided in Table 1; presenting mean, median, standarddeviation (SD), minimum, and maximum concentrationvalues. Major soluble ion annual median concentrations(conc.) and annual median fluxes (flux) were calculated todetermine any accumulation biases. Time series of majorsoluble ionconc. and major soluble ionflux displayed overallvery similar trends, although some differences are apparent(Figure 3). Because exact dust input timing is unknown(e.g., dry versus wet deposition) one (concentration or flux)time series cannot more accurately be selected, therefore,both annual median concentration and flux of major solubleion series are investigated. Individual sample data, annualmedian concentration and annual median flux correlationsindicate strong positive relationships among major ionssuggesting that major ions may originate from a commondust source or share common atmospheric transport path-ways (Table 2). Additional, separate Empirical OrthogonalFunction (EOF) analysis was conducted on major solubleion conc. and major soluble ion flux data to characterizecovariability of the time series and investigate potentialannual interspecies associations (e.g., transport pathwaysand provenance; Table 3). EOF analysis also produced newtime series that represent the covariability of differentvariables. Hereon the conc. and flux subscript refersin singular reference to two separate time series (e.g.,EOF 1 conc. and flux). EOF 1 conc. and flux accounted for �84–86% of the total variance in the major ion series. Thestrong relationship among the major ion species suggeststhat most of the major ions have a common source orsimilar atmospheric transport pathways. Crustal aerosolsrepresent the dominant component of the TP atmosphere
Figure 2. (a) Mt. Geladaindong ice core depth–age scale.(b) Annual layer dating based on seasonality of summermonsoon d18O depleted precipitation and late autumn–springseasonality of major soluble ion dust species (Cl�).
D20118 GRIGHOLM ET AL.: DUST RECORDS FROM A TIBETAN ICE CORE
4 of 13
D20118
[Cong et al., 2007; Li et al., 2007; Zhang et al., 2001].Therefore, EOF 1 most likely represents a soluble dustsource from the arid to semiarid regions on the TP. Potentialsources of soluble Na+, Cl�, K+, Ca2+, Mg2+, and SO4
2� areevaporite rock minerals (e.g., calcite, dolomite, gypsum,anhydrite, halite, and potassium/magnesium salts) from soils(e.g., calcisols, solonchaks, and leptosols), sedimentary rocks
(e.g., limestone and dolomite), and/or dried lake sedimentsthat are common in the Mt. Geladaindong region [Institute ofSoil Science of Academia Sinica, 1985; Li et al., 2007,2008; Liu et al., 2008]. EOF 2 conc. and flux represents�8% of the total variance in major ion series and isdominated by Ca2+ conc. and flux (�44–47%). The differ-ence in the Ca2+conc. and flux time series relative to the other
Figure 3. Mt. Geladaindong major soluble ion time seriesconc. and flux: annual concentration (mg/L; thinline) and annual flux (mg m�2 yr�1; shaded line). Bold lines represent 5-year running means.
D20118 GRIGHOLM ET AL.: DUST RECORDS FROM A TIBETAN ICE CORE
5 of 13
D20118

major ion time series suggests that there may be a secondarydust source dominated by Ca2+ that has varied annuallyfrom the EOF 1conc. and flux dust source. This sourcemay possibly be a calcite source as no other ions load onEOF 2 conc. and flux. Although marine air masses do penetratethe Geladaindong region during the summer monsoonseason, the lack of an EOF directly representing sea saltions suggests that the ion input of marine air masses isconcealed by abundant crustal inputs (e.g., soluble dust).Any anthropogenic ion inputs, (e.g., HCl [Shrestha et al.,2002]), are also assumed to be concealed by crustal inputs.[11] To emphasize long-term atmospheric major soluble
ion conc. and flux trends, 5-year running means were calcu-lated (Figure 3). Between 1935 and the early 1970s all ionsdisplay a gradual rise with slight undulations in concen-trations followed by a sharp rise in the mid 1970s. Anabrupt drop in concentrations and a low-dust period duringthe 1980s follows this concentration/flux peak. Comparisonbetween 10-year periods before and after the mid-1970speak in dust concentrations indicate an approximately two-to threefold decrease in concentration/flux in all major ions.During the 1990s concentration/flux levels increased with amajor peak in 1999, followed by lower levels to the present.Ca2+ conc. and flux generally has the same trend as the otherions, however, its mid-1970s peak and subsequent drop inconcentrations occurs 2 years later. Another prominentfeature in the Ca2+ conc. and flux not seen in the other ionrecords is the sharp increase during the early 1990s. Thesedifferences in the Ca2+ concentration time series, assuggested by EOF analysis, support the presence of anadditional Ca2+ source and/or transport route.
4.2. EOF 1conc. and flux and National Centersfor Environmental Prediction/National Centerfor Atmospheric Research Reanalysis ClimateParameters
[12] EOF 1conc. and EOF 1flux were selected for compar-ison with NCEP/NCAR reanalysis climate parametersbecause they represent �84–86% of the variance in themajor ion seriesconc. and flux and most likely originate fromsimilar sources and/or transport pathways. A NCEP/NCARreanalysis 2.5� � 2.5� grid (Figure 1) overlapping the Mt.Geladaindong site provides data time series (1948–2004)for surface temperature, pressure, scalar wind velocity(SWV), and precipitation [Kalnay et al., 1996]. Compar-isons between atmospheric aerosols and climate parameterscan help determine potential proxies and relationships thatcan be used to reconstruct climate in the preinstrumentalera. It is important to note, that the coarse resolution ofNCEP/NCAR reanalysis cannot resolve all of the complex
topography that may influence small-scale climate on theTP. However, Xie et al. [2007] investigated the reliability ofNCEP/NCAR reanalysis in the Himalayan/Tibetan Plateauregion and found that much of the synoptic-scale climatevariability was captured.[13] Variations in annual averages and 5-year running
means for surface-level climate variables (precipitation,temperature, SWV, and pressure) from 1948 to 2004 inthe Mt. Geladaindong region, along with EOF 1conc. and flux.
(annual median and 5-year running mean) from 1935 to2004, are displayed in Figure 4. Surface SWV is calculatedfrom the NCEP/NCAR reanalysis parameters surface zonalwind velocity (u) and surface meridional wind velocity (v)[Jacobson, 2005].[14] Corresponding abrupt shifts in the mid-1970s are
prominent between EOF 1(conc. and flux), pressure, and SWV.Trends in pressure, a potential indicator of cyclonicstorm activity, show a general negative relationship withEOF 1(conc. and flux) both before and after the mid-1970sshift. The pre-mid-1970s lower-pressure period correspondsto higher values (i.e., higher soluble dust concentration/flux)of EOF 1(conc. and flux), while the post-mid-1970s higher-pressure period corresponds to lower values (i.e., lowersoluble dust concentration/flux) of EOF 1(conc. and flux). Therelationship is negative, indicating that during years oflower-pressure EOF 1(conc. and flux) values are higher, mostlikely a result of more intense cyclonic storm activity asdemonstrated by other ice core – climate calibrations in theArctic, Antarctic, and subpolar regions [e.g., Mayewski etal., 2004; Kang et al., 2002a; Kaspari et al., 2007].Decreases in pressure for cyclonic features result in inten-sification of wind velocities and increased incorporation ofchemistry over the land and sea. The assumption thatpressure may indicate cyclonic storm activity is additionallysupported by Qian et al. [2002] who reported a rapiddecrease in cyclonic activity between 1976 and the late
Table 2. Correlation Coefficients Between Major Ions in Mt. Geladaindong Corea
Na+ K+ Mg2+ Ca2+ Cl� NO3� SO4
2�
Na+ – 0.86 (0.91, 0.94) 0.66 (0.88, 0.87) 0.46 (0.71, 0.58) 0.93 (0.96, 0.97) 0.78 (0.89, 0.92) 0.83 (0.96, 0.94)K+ – 0.83 (0.91, 0.92) 0.52 (0.71, 0.65) 0.81 (0.87, 0.91) 0.75 (0.81, 0.88) 0.80 (0.92, 0.93)Mg2+ – 0.65 (0.81, 0.71) 0.60 (0.85, 0.82) 0.70 (0.88, 0.81) 0.67 (0.90, 0.85)Ca2+ – 0.44 (0.66, 0.54) 0.40 (0.79, 0.70) 0.40 (0.76, 0.67)Cl� – 0.71 (0.88, 0.89) 0.78 (0.90, 0.89)NO3� – 0.76 (0.87, 0.93)
SO42� –aCorrelation coefficients are of individual sample data, and parentheses indicate annual median concentrations and annual median flux. All coefficient
values have p > 0.001.
Table 3. Empirical Orthogonal Function Analysis of Major
Soluble Ionsconc. and fluxa
EOF 1 EOF 2
Concentration Flux Concentration Flux
Na+ 93.82 91.61 �4.41 �6.02K+ 93.40 92.07 �0.66 �0.23Mg2+ 85.72 84.18 0.75 0.53Ca2+ 54.23 51.81 44.47 46.56Cl� 88.66 86.48 �6.04 �5.02NO3� 90.34 88.84 0.00 0.02
SO42� 93.02 90.42 �0.29 �0.25
Total 85.60 83.63 8.09 8.44aEOF, empirical orthogonal function.
D20118 GRIGHOLM ET AL.: DUST RECORDS FROM A TIBETAN ICE CORE
6 of 13
D20118

1990s in northern China coinciding with the abrupt rise andrelatively higher values of pressure in the Mt. Geladaindongregion. SWV trends display a consistent association withpressure/storm strength showing a positive relationship withEOF 1(conc. and flux) suggesting that greater wind velocityresults in more aerosols entrained into the atmosphere.Temperature and precipitation display shifts in trends priorto the mid-1970s EOF 1(conc. and flux) shift. Fluctuations intemperature and precipitation will have impacts on landsurface properties that affect the potential of dust entrain-ment in the atmosphere (i.e., soil moisture).[15] EOF analysis and linear correlations were used to quan-
tify potential annual relationships between EOF 1(conc. and flux)
with climate variables (Table 4). EOF 1(conc. and flux) werecompared to annual averages (January–December) and tothe annual averages of the months of primary dust stormactivity (November–May), hereon referred to as dust
months (DM). The DM were selected based on multipleweather station monthly dust storm records in theMt. Geladaindong region [Han et al., 2004]. Annual aver-ages of climate variables were also examined becausealthough dust activity is reduced during the incursion ofthe summer monsoon season, major dust events can stilloccur [Huang et al., 2007].[16] EOF analysis was conducted on two series at a time
(e.g., EOF 1conc. and pressure). The first component (EOF 1)expresses the dominant similarity (positive correlation) ordissimilarity (negative correlation) between the two seriesand estimates the common association between the series.For pressure (DM and annual) EOF analysis reveals that64% and 67% of the variance in the EOF 1conc. and pressureseries is represented by the first EOF (negative correlation),respectively. The EOF 1flux and pressure (DM and annual)series analysis reported 69% and 74% of the variance
Figure 4. NCEP/NCAR reanalysis annual average surface climate parameters (precipitation,temperature, scalar wind velocity, pressure) and empirical orthogonal function (EOF) 1conc. and flux.versus time. Five-year running mean (bold lines) and 1-year mean (thin lines).
D20118 GRIGHOLM ET AL.: DUST RECORDS FROM A TIBETAN ICE CORE
7 of 13
D20118

(negative correlation), respectively. On the basis of theprobability of red noise series (Monte Carlo estimation),Meeker and Mayewski [2002] reported that shared variancevalues exceeding 64% is equivalent to p < 0.01. Thecorrespondence between annual pressure and the potentialglaciochemical proxy (EOF 1conc. and flux) is shown inFigure 5 (the first common component is shown as dashedgray line). Linear correlations also reported significantvalues for pressure (all reported p values are two tail).Pressure exhibited the strongest linear correlationswith EOF 1flux (annual: r = �0.49, p = 0.0001, n = 57;DM: r = �0.39, p < 0.003, n = 57) and slightly weakercorrelations with EOF 1conc. (annual: r =�0.35, p < 0.01, n =
57; DM: r = �0.36, p < 0.03, n = 57). Spatial correlationof EOF 1flux and conc. with annual pressure is presented inFigure 6 demonstrating that EOF 1/pressure relationshipis reflected throughout theTP.EOFanalysisofEOF1flux and conc.and the SWV time series show overall weaker correlationsthan pressure. EOF 1flux and SWV share 61% (DM) and65% (annual) of their variance (positive correlation), whileEOF 1conc. displayed 55% (DM) and 56% (annual) of theirvariance. Only EOF 1flux reported significant values forSWV; EOF 1flux (annual: r = 0.3, p < 0.03, n = 57). EOFanalysis and linear correlation for precipitation report onlysignificant values for EOF 1flux and annual precipitation (r =
Table 4. EOF Analysis and Linear Correlation of EOF 1conc. and fluxa
Series
Concentration Flux
EOF 1 (%) r p value EOF 1 (%) r p value
Annual pressure 67.34 �0.35 <.01 74.52 �0.49 0.0001DM pressure 64.71 �0.29 <.03 69.47 �0.39 <0.003Annual SWV 56.80 0.14 64.83 0.30 <.03DM SWV 54.55 0.09 61.24 0.22Annual precipitation 56.92 �0.14 63.79 �0.28 <.04DM precipitation 50.09 0.00 53.41 �0.07Annual temperature 50.05 0.00 55.74 �0.11DM temperature 50.09 �0.02 57.73 �0.13PDO index 70.88 �0.42 <.001 72.86 �0.46 <.0001
aAbbreviations are as follows: DM, dust month; EOF, empirical orthogonal function; PDO, Pacific Decadal Oscillation;SWV, scalar wind velocity. P values > 0.05 are not given.
Figure 5. Plots of annual pressure and EOF 1conc. and flux (solid line) and their common EOF 1 (dashedshaded line). For negative correlations (e.g., EOF 1conc. and EOF 1flux), the EOF is oriented inversely.
D20118 GRIGHOLM ET AL.: DUST RECORDS FROM A TIBETAN ICE CORE
8 of 13
D20118

0.28, p < 0.04, n = 57). No significant relationships werereported for temperature.[17] The relationships reflected by EOF analysis and
linear correlations suggest that pressure can best explainthe annual variations in EOF 1conc. and flux. Pressure varia-tions are indicative of atmospheric circulation and canprovide natural aerosol (e.g., soluble dust) transportmechanisms to Mt. Geladaindong. As previously mentionednegative correlation between EOF 1 and pressure mayreflect cyclonic storm activity. Lower-pressure years maysuggest more intense or frequent cyclonic storm activityresulting in greater dust entrainment that subsequently leadsto higher concentrations of major soluble ions. Higher-pressure years probably corresponding to weaker or lessfrequent cyclonic storm activity entrain less dust into theatmosphere and lead to lower concentrations of majorsoluble ions. Pressure shows significant correlation valuesfor both EOF 1conc. and EOF 1flux. The stronger overallpressure correlations with EOF 1flux could possibly suggestthat flux values better reflect deposition conditions on theglacier. However, it is not clear which record actually is abetter representation based on the uncertainties of the timingof dry and wet deposition. The overall stronger correlationvalues displayed by annual correlations relative to DMcorrelations may reflect the significant influence of cyclonicactivity during the so-called non-DM (June–October) whenatmospheric aerosols are at baseline concentrations.[18] Although, SWVappears to show a multiyear positive
relationship with EOF 1 conc. and flux (e.g., pre and post mid-1970s shift) annual correlations are not as robust as pressure,displaying only one significant positive relationship (annualEOF 1flux). SWV is associated with cyclonic intensity,however, annual or monthly averages of wind strengthmay not necessarily reflect cyclonic activity therebyexplaining overall weaker correlations. Precipitation correla-tions only yield significant values for annual EOF 1flux, whichcould possibly reflect summer monsoon input (as DM reportno significant correlations). The negative relationshipbetween precipitation and EOF 1flux may suggest thatincreased precipitation reduced summer atmosphericaerosols via scavenging and/or enhanced soil moisture that
limited entrainment areas over the summer or subsequentyear.[19] In addition to primary climate variables (i.e., pressure,
SWV, temperature, and precipitation), atmospheric dustconcentrations depend on the amount of available entrain-able sediments. Therefore, the assessment of possible futureatmospheric dust scenarios must consider land cover varia-tions such as desertification, which can alter land surfaces tobecome more susceptible to dust entrainment. The TP is oneof the most sensitive regions to global temperature changeexceeding increase rates for the northern hemispheric andsame latitude zones [Liu and Chen, 2000]. Recent warminghas resulted in permafrost degradation throughout the TPand it is believed the loss of permafrost will lead todesertification [Wang et al., 2000b]. In addition to climatevariations, inappropriate land management practices on theTP have led to an alarming rate of land degradation anddesertification [Gong et al., 2004; Wang et al., 2000a; Zenget al., 2003]. On the TP, over 62% of land is used foragriculture with 80% being used for livestock grazing and19% for forestry [Wu and Yang, 2000]. Previous studieshave shown that desert areas in China have increased by�2% to �7% since the 1950s [Zhong, 1999; Zhu and Zhu,1999] and suggest that these new ‘‘desertified’’ areas wouldproduce 10–40%more dust storms under the meteorologicalconditions of the 1950s. If the trend of land degradation anddesertification continues on the TP, a present return to thepre-mid-1970s atmospheric conditions would most likelylead to higher atmospheric dust concentrations.
4.3. Potential Teleconnection to the Pacific DecadalOscillation
[20] The Pacific Decadal Oscillation (PDO) is a long-lived (El Nino–like) interdecadal climate pattern that existsover the northern Pacific Ocean. It involves the location andintensity of large pools of warm and/or cold sea surfacetemperature anomalies in the central and eastern areas of thenorthern Pacific and has a periodicity of �20–30 years.PDO reconstructions have been developed from tree ringrecords in western North America [Biondi et al., 2001;Cook, 2002; D’Arrigo et al., 2001; Gedalof and Smith,
Figure 6. NCEP/NCAR reanalysis spatial correlation with EOF 1conc.and flux and January–December1948–2004 surface pressure (r = �0.34, p< 0.01, n = 57). Stars represent the Mt. Geladaindong site.
D20118 GRIGHOLM ET AL.: DUST RECORDS FROM A TIBETAN ICE CORE
9 of 13
D20118

2001; MacDonald and Case, 2005]; however, PDO recon-struction studies for Asia are very limited [D’Arrigo andWilson, 2006]. Although PDO reconstructions are scarce,recent research suggests that the Asian climate plays animportant role in the PDO. The PDO is thought to interactwith the Asian monsoon, and North Pacific SST anomalieshave been correlated with eastern Asian climate extremes[Chan and Zhou, 2005; Chongyin et al., 2004; Lau et al.,2004; Nakamura et al., 2002]. PDO regime shifts have beenrelated to interdecadal trends of precipitation and air tem-perature in north central China [Ma, 2007] and Japanesecoastal air temperature [Minobe, 1997]. Frauenfeld andDavis [2002] suggest that the 1976 regime shift may havebeen a result of recent Asian landmass heating, implyingthat the Eurasian atmosphere may have a strong influenceon decadal Pacific SST variability.
[21] Comparison between the annual PDO index (http://jisao.washington.edu/pdo/PDO.latest) and annualEOF 1conc. and EOF 1flux suggest that there is a teleconnec-tion between the PDO and atmospheric crustal aerosols on theTP. A relationship is most prominently suggested by theabrupt shifts in trends during the mid-1970s in the PDO andEOF 1conc. and flux time series (Figures 7a and 7b).EOF analysis revealed that �71% (EOF 1conc.) and �73%(EOF 1flux) of the variance with the PDO index series wasrepresented by the first EOF (negative correlation). The closecorrespondence between the PDO Index and the potentialproxy (EOF 1) is shown in Figure 7a where their firstcommon component (EOF 1) is shown as a dashedgray line. The linear correlation coefficient between theEOF 1conc. and flux and the PDO Index time series revealed asignificant relationship (conc.: r =�0.42, p < 0.0001, n = 70;
Figure 7. (a) Plots of the Pacific Decadal Oscillation (PDO) index and EOF 1flux (solid line) and theircommon EOF 1 (dashed shaded line). For negative correlations (e.g., EOF 1flux), the EOF is orientedinversely. (b) NCEP/NCAR reanalysis: Mt. Geladaindong grid (pressure, scalar wind velocity, andprecipitation), Asian surface temperature (10.0�–70.0�N; 70.0�–105.0�E), annual PDO index (see http://jisao.washington.edu/pdo/PDO.latest), and EOF 1conc. 3-year running mean (bold lines) and 1-year mean(thin lines) of the annual average.
D20118 GRIGHOLM ET AL.: DUST RECORDS FROM A TIBETAN ICE CORE
10 of 13
D20118

flux: r =�0.46, p < 0.0001, n = 70). This inverse relationshipsuggests that negative PDO values correspond to higheratmospheric soluble dust aerosols at Mt. Geladaindong. The1947–1976 PDO negative phase coincided with overalllower pressure, higher SWV, and higher soluble dust aerosolconcentrations, while the 1977–2004 positive phase coin-cides with higher pressure, lower wind velocities, and lowersoluble dust aerosol concentrations suggesting a multideca-dal relationship (Figure 7b). It is interesting to note that theanomalously high soluble aerosol concentrations in 1999coincide with an abrupt negative year in the PDO.Examination of 1999 NCEP/NCAR reanalysis climatevariables showed a decrease in precipitation over theMt. Geladaindong region, which may explain increasedatmospheric soluble dust as a product of dryer, more readilyentrained particles and reduced atmospheric scavenging.Similar correlations were conducted with the North AtlanticOscillation (NAO), Atlantic Multidecadal Oscillation(AMO), and Southern Oscillation Index (SOI). NAO(http://cdc.noaa.gov/gcos_wgsp/Timeseries/Data/nao.dat)and AMO (http://cdc.noaa.gov/data/correlation/amon.us.data) reported no significant values (p > 0.05); however,the SOI (http://born.gov.au/climate/glossary/soi.shtml) dis-played significant correlations (EOF 1conc.: r = �0.26, p <0.0001, n = 70; EOF 1flux: r = �0.29, p < 0.0001, n = 70)that are weaker overall than the PDO correlations.The similarity in significant correlations in not surprisingconsidering the teleconnection between the PDO and ElNino–Southern Oscillation [McCabe and Dettinger, 1999].
4.4. Shifts in Atmospheric Dust Concentrationsand the Warming of Asia
[22] Annual surface temperature differences between1948 and 1976 and 1977–2004 indicate that northern Asiaand regions of the TP have experienced warmer temper-atures since 1977 (Figure 8). The reconstructed temperature
series from the Mt. Geladaindong d18O ice core record isconsistent with recent regional Tibetan Plateau and NorthernHemisphere warming [Kang et al., 2007]. Examinationof NCEP/NCAR reanalysis average annual surface airtemperature trends over a large portion of the Asiancontinent (10.0�–70.0�N; 70.0�–105.0�E) suggests a rela-tionship between the PDO, Asian landmass warming, andMt. Geladaindong EOF 1conc. and flux (i.e., soluble dust)which are all highlighted by concurrent mid-1970s shifts(Figure 7b). The relationship between Asian landmasswarming and atmospheric dust concentrations on the TPmay be explained by reductions in regional temperaturegradients that reduce regional pressure gradients. Regionalpressure gradients are the dominant control on cyclonicsystems and wind velocity strengths: two of the primaryfactors in dust entrainment and transport.[23] Whether this warming in Asia is partly a response to
or cause of the PDO shift is not yet clear, although it hasbeen suggested that decadal Pacific SST variability could beforced by the atmosphere over Eurasia and that the 1976/1977PDO shift is a response of recent Asian landmassheating [Frauenfeld and Davis, 2002]. Regardless ofthe cause, the correlation between Mt. GeladaindongEOF 1conc. and flux and the PDO index suggests thatEOF 1conc. and flux may be used as a proxy to reconstructthe PDO using longer Mt. Geladaindong ice cores andthereby potentially enhancing the understanding of PDOmechanisms.
5. Conclusions
[24] This paper presents the atmospheric soluble dusthistory between 1935 and 2004 from an ice core fromMt. Geladaindong on the TP. Annual interspecies majorsoluble ion correlations and EOF analysis suggest thatMt. Geladaindong has multiple dust sources. Major solubleion time series show an abrupt threefold decrease inconcentrations during the mid-1970s corresponding tomajor shifts in NCEP/NCAR reanalysis surface pressureand SWV. EOF analysis and linear correlations betweenMt. Geladaindong EOF 1conc. and flux and NCEP/NCARreanalysis climate variables suggest that the EOF 1conc. and flux
records may be a proxy for surface pressure (cyclonic stormactivity). Mt. Geladaindong EOF 1conc. and flux records alsodemonstrated a significant negative correlation with thePDO Index, indicating that the PDO may be teleconnectedtodust entrainmenton theTP.Therelationship ismostprominentduring the 1976/1977 PDO phase shift, which coincides with alargeandabruptdecrease inEOF1conc. and fluxvalues (i.e., solubledust concentrations). Investigation of regional climatevariable trends with the PDO Index showed potentialrelationships between the 1976/1977 PDO phase shift andmajor shifts in regional surface pressure and SWV on theTP. The large increase in overall Asian landmass annualtemperature trends during the 1970s also coincided with the1976/1977 PDO shift. Late-20th-century warming overAsia and resultant reductions in regional temperaturegradients may have weakened pressure gradients responsiblefor cyclonic activity and wind strength, the two primarycomponents of dust entrainment and transport. The resultsfrom the 70-yearlong Mt. Geladaindong ice core suggest
Figure 8. Annual surface temperature differences between1948 and 1976 and 1977–2004.
D20118 GRIGHOLM ET AL.: DUST RECORDS FROM A TIBETAN ICE CORE
11 of 13
D20118

that longer records hold potential to reconstruct a PDOIndex for central Asia.
[25] Acknowledgments. This research is supported by grants fromthe National Oceanic and Atmospheric Administration (NA04OAR4600179), the National Science Foundation (ATM0754644), the NationalNatural Science Foundation of China (40401054, 40121101), the NationalBasic Research Program of China (2005CB422004), the ‘‘Talent Project,’’the Innovation Project (KZCX3-SW-339/334) of the Chinese Academy ofSciences, and Dean Foundation of CAS.
ReferencesAizen, V., E. Aizen, J. Melack, and T. Martma (1996), Isotopic measure-ments of precipitation on central Asian glaciers (southeastern Tibet,northern Himalayas, central Tien Shan), J. Geophys. Res., 101, 9185–9196, doi:10.1029/96JD00061.
Aizen, V., E. Aizen, J. Melack, K. Kreutz, and L. Cecil (2004), Associationbetween atmospheric circulation patterns and firn-ice core records fromthe Inilchek glacierized area, central Tien Shan, Asia, J. Geophys. Res.,109, D08304, doi:10.1029/2003JD003894.
Anspaugh, L., et al. (2000), Report of the United Nations ScientificCommittee on the Effects of Atomic Radiation to the General Assembly,United Nations, New York.
Biondi, F., A. Gershunov, and D. Cayan (2001), North Pacific decadalclimate variability since AD 1661, J. Clim., 14, 5 –10, doi:10.1175/1520-0442(2001)014<0005:NPDCVS>2.0.CO;2.
Bryson, R. A. (1986), Airstream climatology of Asia, in Proceedings of theInternational Symposium on the Qinghai-Xizang Plateau and MountainMeteorology, pp. 604–617, Am. Meteorol. Soc., Boston, Mass.
Chan, J. C. L., and W. Zhou (2005), PDO, ENSO and the early summermonsoon rainfall over south China, Geophys. Res. Lett., 32, L08810,doi:10.1029/2004GL022015.
Chongyin, L., H. Jinhai, and Z. Jinhong (2004), A review of decadal/interdecadal climate variation studies in China, Adv. Atmos. Sci., 21,425–436, doi:10.1007/BF02915569.
Claquin, T., M. Schulz, and Y. J. Balkanski (1999), Modeling the mineralogyof atmospheric dust sources, J. Geophys. Res., 104, 22,243–22,256,doi:10.1029/1999JD900416.
Cong, Z., S. Kang, X. Liu, and G. Wang (2007), Elemental composition ofaerosol in the Nam Co region, Tibetan Plateau, during summer monsoonseason, Atmos. Environ., 41, 1180 – 1187, doi:10.1016/j.atmosenv.2006.09.046.
Cook, E. (2002), Reconstructions of Pacific decadal variability from longtree-ring records, Eos Trans. AGU, 83(19), Spring Meet. Suppl., AbstractGC42A-04.
D’Arrigo, R., and R. Wilson (2006), On the Asian expression of the PDO,Int. J. Climatol., 26, 1607–1617, doi:10.1002/joc.1326.
D’Arrigo, R., R. Villalba, and G. Wiles (2001), Tree-ring estimates ofPacific decadal climate variability, Clim. Dyn., 18, 219 – 224,doi:10.1007/s003820100177.
Fang, X., Y. Han, and J. Ma (2004), Characteristics of dust storm and loesssediment in the Tibetan Plateau: A case study of dust event on Mar. 4,2003 in Lhasa, Chin. Sci. Bull., 49, 1084–1090.
Frauenfeld, O., and R. Davis (2002), Midlatitude circulation patterns asso-ciated with decadal and interannual Pacific Ocean variability, Geophys.Res. Lett., 29(24), 2221, doi:10.1029/2002GL015743.
Gedalof, Z., and D. Smith (2001), Interdecadal climate variability andregime-scale shifts in Pacific North America, Geophys. Res. Lett., 28,1515–1518, doi:10.1029/2000GL011779.
Gong, S. L., X. Y. Zhang, T. L. Zhao, and L. A. Barrie (2004), Sensitivity ofAsian dust storm to natural and anthropogenic factors, Geophys. Res.Lett., 31, L07210, doi:10.1029/2004GL019502.
Han, Y., X. Xi, and L. Song (2004), Spatio-temporal sand-dust distributionin Qinghai-Tibet Plateau and its climatic significance, J. Desert Res., 24,588–592.
Huang, J., P. Minnis, Y. Yi, Q. Tang, X. Wang, Y. Hu, Z. Liu, K. Ayers,C. Trepte, and D. Winker (2007), Summer dust aerosols detected fromCALIPSO over the Tibetan Plateau, Geophys. Res. Lett., 34, L18805,doi:10.1029/2007GL029938.
Institute of Soil Science of Academia Sinica (1985), Soils of Tibet, Sci.Press, Beijing.
Jacobson,M. Z. (2005),Fundamentals of AtmosphericModeling, CambridgeUniv. Press, Cambridge, U. K.
Kalnay, E., et al. (1996), The NCEP/NCAR 40-year reanalysis project, Bull.Am. Meteorol. Soc., 77, 437–470, doi:10.1175/1520-0477(1996)077<0437:TNYRP>2.0.CO;2.
Kang, S. C., D. H. Qin, P. A. Mayewski, C. P. Wake, and J. W. Ren (2001),Climatic and environmental records from the Far East Rongbuk ice core,Mt. Qomolangma (Mt. Everest), Episodes, 24, 176–181.
Kang, S., P. A. Mayewski, D. Qin, Y. Yan, S. Hou, D. Zhang, J. Ren, andK. Kruetz (2002a), Glaciochemical records from a Mt. Everest ice core:Relationship to atmospheric circulation over Asia, Atmos. Environ., 36,3351–3361, doi:10.1016/S1352-2310(02)00325-4.
Kang, S. C., P. A. Mayewski, D. H. Qin, Y. P. Yan, D. Q. Zhang, S. G.Hou, and J. W. Ren (2002b), Twentieth century increase of atmosphericammonia recorded in Mount Everest ice core, J. Geophys. Res., 107(D21),4595, doi:10.1029/2001JD001413.
Kang, S., Y. Zhang, D. Qin, J. Ren, Q. Zhang, B. Grigholm, and P. A.Mayewski (2007), Recent temperature increase recorded in an ice core inthe source region of Yangtze River, Chin. Sci. Bull., 52, 825–831,doi:10.1007/s11434-007-0140-1.
Kaspari, S., et al. (2007), Reduction in northward incursions of the SouthAsian monsoon since �1400 AD inferred from a Mt. Everest ice core,Geophys. Res. Lett., 34, L16701, doi:10.1029/2007GL030440.
Kreutz, K. J., and E. R. Sholkovitz (2000), Major element, rare Earthelement, and sulfur isotopic composition of a high-elevation firn core:Sources and transport of mineral dust in central Asia, Geochem. Geophys.Geosyst., 1(11), 1048, doi:10.1029/2000GC000082.
Kreutz, K. J., V. B. Aizen, L. D. Cecil, and C. P. Wake (2001), Oxygenisotopic and soluble ionic composition of a shallow firn core, InilchekGlacier, central Tien Shan, J. Glaciol., 47, 548 –554, doi:10.3189/172756501781831819.
Lau, K., J. Lee, K. Kim, and I. Kang (2004), The North Pacific as aregulator of summer climate over Eurasia and North America, J. Clim.,17, 819–833, doi:10.1175/1520-0442(2004)017<0819:TNPAAR>2.0.CO;2.
Laurent, B., B. Marticorena, G. Bergametti, and F. Mei (2006), Modelingmineral dust emissions from Chinese and Mongolian deserts, GlobalPlanet. Change, 52, 121–141, doi:10.1016/j.gloplacha.2006.02.012.
Li, C., S. Kang, Q. Zhang, and S. Kaspari (2007), Major ionic compositionof precipitation in the Nam Co region, central Tibetan Plateau, Atmos.Res., 85, 351–360, doi:10.1016/j.atmosres.2007.02.006.
Li, M., S. Kang, L. Zhu, Q. You, Q. Zhang, and J. Wang (2008), Mineralogyand geochemistry of the Holocene lacustrine sediments in Nam Co, Tibet,Quat. Int., 187, 105–116, doi:10.1016/j.quaint.2007.12.008.
Li-Jones, X., and J. M. Prospero (1998), Variations in the size distributionof non-sea-salt sulfate aerosol in the marine boundary layer at Barbados:Impact of African dust, J. Geophys. Res., 103, 16,073 – 16,084,doi:10.1029/98JD00883.
Liu, X., and B. Chen (2000), Climatic warming in the Tibetan Plateauduring recent decades, Int. J. Climatol., 20, 1729–1742, doi:10.1002/1097-0088(20001130)20:14<1729::AID-JOC556>3.0.CO;2-Y.
Liu, Z., et al. (2008), Airborne dust distributions over the Tibetan Plateauand surrounding areas derived from the first year of CALIPSO lidarobservations, Atmos. Chem. Phys., 8, 5045–5060.
Lyons, W. B., and P. A. Mayewski (1983), Nitrate plus nitrite concentra-tions in a Himalayan ice core, Geophys. Res. Lett., 10, 1160–1163,doi:10.1029/GL010i012p01160.
Ma, Z. (2007), The interdecadal trend and shift of dry/wet over the central partof north China and their relationship to the Pacific Decadal Oscillation(PDO), Chin. Sci. Bull., 52, 2130–2139, doi:10.1007/s11434-007-0284-z.
MacDonald, G., and R. Case (2005), Variations in the Pacific DecadalOscillation over the past millennium, Geophys. Res. Lett., 32, L08703,doi:10.1029/2005GL022478.
Mayewski, P. A., W. B. Lyons, and N. Ahmad (1983), Chemical composi-tion of a high altitude fresh snowfall in the Ladakh Himalayas, Geophys.Res. Lett., 10, 105–108, doi:10.1029/GL010i001p00105.
Mayewski, P. A., W. B. Lyons, N. Ahmad, G. Smith, and M. Pourchet(1984), Interpretation of the chemical and physical time-series retrievedfrom Sentik Glacier, Ladakh, Himalaya, India, J. Glaciol., 30, 66–76.
Mayewski, P. A., et al. (2004), A 700 year record of Southern Hemisphereextratropical climate variability, Ann. Glaciol., 39, 127 – 132,doi:10.3189/172756404781814249.
McCabe, G. J., andM. D. Dettinger (1999), Decadal variations in the strengthof ENSO teleconnections with precipitation in the western United States,Int . J. Climatol . , 19 , 1399 – 1410, doi:10.1002/(SICI)1097-0088(19991115)19:13<1399::AID-JOC457>3.0.CO;2-A.
Meeker, L. D., and P. A.Mayewski (2002), A 1400-year high-resolution recordof atmospheric circulation over the North Atlantic and Asia, Holocene, 12,257–266, doi:10.1191/0959683602hl542ft.
Merrill, J. T., M. Uematsu, and R. Bleck (1989), Meteorological analysis oflong range transport of mineral aerosol over the North Pacific, J. Geo-phys. Res., 94, 8584–8598, doi:10.1029/JD094iD06p08584.
Minobe, S. (1997), A 50–70 year climatic oscillation over the North Pacificand North America, Geophys. Res. Lett., 24, 683–686, doi:10.1029/97GL00504.
D20118 GRIGHOLM ET AL.: DUST RECORDS FROM A TIBETAN ICE CORE
12 of 13
D20118
Nakamura, H., T. Izumi, and T. Sampe (2002), Interannual and decadalmodulations recently observed in the Pacific storm track activity and EastAsian winter monsoon, J. Clim., 15, 1855–1874, doi:10.1175/1520-0442(2002)015<1855:IADMRO>2.0.CO;2.
Osterberg, E. C., M. J. Handley, S. B. Sneed, P. A. Mayewski, and K. J.Kreutz (2006), Continuous ice core melter system with discrete samplingfor major ion, trace element, and stable isotope analyses, Environ. Sci.Technol., 40, 3355–3361, doi:10.1021/es052536w.
Pruppacher, H. R., and J. D. Klett (1978), Microphysics of Clouds andPrecipitation, Kluwer Acad., Norwell, Mass.
Qian, W., L. Quan, and S. Shi (2002), Variations of the dust storm in Chinaand its climatic control, J. Clim., 15, 1216–1229, doi:10.1175/1520-0442(2002)015<1216:VOTDSI>2.0.CO;2.
Qin, D. H., P. A. Mayewski, S. C. Kang, J. W. Ren, S. G. Hou, T. D. Yao,Q. Z. Yang, Z. F. Jin, and D. S. Mi (2000), Evidence for recent climatechange from ice cores in the central Himalaya, Ann. Glaciol., 31, 153–158, doi:10.3189/172756400781819789.
Qin, D. H., S. G. Hou, D. Q. Zhang, J. W. Ren, S. C. Kang, P. A.Mayewski, and C. P. Wake (2002), Preliminary results from the chemicalrecords of an 80.4 m ice core recovered from East Rongbuk Glacier,Qomolangma (Mount Everest), Himalaya, Ann. Glaciol., 35, 278–284,doi:10.3189/172756402781816799.
Shrestha, A. B., C. P. Wake, J. E. Dibb, and S. I. Whitlow (2002), Aerosoland precipitation chemistry at a remote Himalayan site in Nepal, AerosolSci. Technol., 36, 441–456, doi:10.1080/027868202753571269.
Tegen, I., A. A. Lacis, and I. Fung (1996), The influence on climate forcingof mineral aerosols from disturbed soils, Nature, 380, 419 – 422,doi:10.1038/380419a0.
Thompson, L. G., E. Mosley-Thompson, M. E. Davis, J. F. Bolzan, J. Dai,T. Yao, N. Gundestrup, X. Wu, L. Klein, and Z. Xie (1989), Holocene–Late Pleistocene climatic ice core records from Qinghai-Tibetan Plateau,Science, 246, 474–477, doi:10.1126/science.246.4929.474.
Thompson, L. G., E. Mosley-Thompson, M. Davis, P. N. Lin, T. Yao,M. Dyurgerov, and J. Dai (1993), ‘‘Recent warming’’: Ice core evidencefrom tropical ice cores with emphasis on central Asia, Global Planet.Change, 7, 145–156, doi:10.1016/0921-8181(93)90046-Q.
Thompson, L. G., E. Mosley-Thompson, M. E. Davis, P. N. Lin, K. A.Henderson, J. Cole-Dai, J. F. Bolzan, and K. B. Liu (1995), Late GlacialStage and Holocene tropical ice core records from Huscaran, Peru,Science, 269, 46–50, doi:10.1126/science.269.5220.46.
Thompson, L. G., V. Mikhalenko, E. Mosley-Thompson, M. Durgerov, P. N.Lin,M.Moskalevsky,M. E. Davis, S. Arkhipov, and J. Dai (1997), Ice corerecords of recent climatic variability: Grigoriev and It-Tish ice caps incentral Tien Shan, central Asia, Mater. Glyatsiol. Issled., 81, 100–109.
Thompson, L. G., T. Yao, E.Mosley-Thompson,M. E. Davis, K. A. Henderson,and P. N. Lin (2000), A high-resolution millennial record of the South Asianmonsoon from Himalayan ice cores, Science, 289, 1916–1919, doi:10.1126/science.289.5486.1916.
Tian, L., V. Masson-Delmotte, M. Stievenard, T. Yao, and J. Jouzel (2001),Tibetan Plateau summer monsoon northward extent revealed by measure-ments of water stable isotopes, J. Geophys. Res., 106, 28,081–28,088,doi:10.1029/2001JD900186.
Wake, C. P., P. A. Mayewski, and M. J. Spencer (1990), A review of centralAsian glaciochemical data, Ann. Glaciol., 14, 301–306.
Wake, C. P., P. A. Mayewski, Z. C. Xie, P. Wang, and Z. Q. Li (1993),Regional distribution of monsoon and desert dust signals recorded inAsian glaciers, Geophys. Res. Lett., 20, 1411– 1414, doi:10.1029/93GL01682.
Wake, C. P., P. A. Mayewski, Z. Li, J. Han, and D. Qin (1994), Moderneolian dust deposition in central Asia, Tellus, Ser. B, 46, 220–233,doi:10.1034/j.1600-0889.1994.t01-2-00005.x.
Wang, G., Y. Shen, and G. Cheng (2000a), Eco-environmental changes andcausal analysis in the source regions of the Yellow River (in Chinese),J. Glaciol. Geocryol., 22, 200–206.
Wang, S., H. Jin, S. Li, and L. Zhao (2000b), Permafrost degradation on theQinghai-Tibet Plateau and its environmental impacts, PermafrostPeriglacial Processes , 11 , 43 – 53, doi:10.1002/(SICI)1099-1530(200001/03)11:1<43::AID-PPP332>3.0.CO;2-H.
Wu, S., and Q. Yang (2000), Land-use and agricultural development, inMountain Genecology and Sustainable Development of the TibetanPlateau, edited by D. Zheng, Q. Zhang, and S. Wu, pp. 181–202, KluwerAcad., Dordrecht, Netherlands.
Xie, A., J. Ren, X. Qin, and S. Kang (2007), Reliability of NCEP/NCARreanalysis data in the Himalayas/Tibetan Plateau, J. Geogr. Sci., 17, 421–430, doi:10.1007/s11442-007-0421-2.
Zeng, Y., Z. Feng, and G. Cao (2003), Land cover change and itsenvironmental impact in the upper reaches of the Yellow River, northeastQinghai–Tibetan Plateau,Mt. Res. Dev., 23, 353–361, doi:10.1659/0276-4741(2003)023[0353:LCCAIE]2.0.CO;2.
Zhang, X. Y., Z. Shen, G. Zhang, T. Chen, and H. Liu (1996), Remotemineral aerosol in westerlies and their contributions to Chinese loess, Sci.China, Ser. D, 39, 67–76.
Zhang, X. Y., R. Arimoto, and Z. S. An (1997), Dust emission from Chinesedesert sources linked to variations in atmospheric circulation, J. Geophys.Res., 102, 28,041–28,047, doi:10.1029/97JD02300.
Zhang, X. Y., R. Arimoto, J. J. Cao, Z. S. An, and D. Wang (2001), Atmo-spheric dust aerosol over the Tibetan Plateau, J. Geophys. Res., 106,18,471–18,476, doi:10.1029/2000JD900672.
Zhang, Y., and G. R. Carmichael (1999), The role of mineral aerosol intropospheric chemistry in East Asia: A model study, J. Appl. Meteorol.,38, 353–366, doi:10.1175/1520-0450(1999)038<0353:TROMAI>2.0.CO;2.
Zhang, Y., S. C. Kang, Q. G. Zhang, Z. Cong, and Y. Zhang (2008),Microparticle variations in snowpits from Mt. Geladaindong in the sourceregion of Yangtze River and its environmental significance, Environ. Sci.,29, 2117–2122.
Zhong, D. C. (1999), The dynamic changes and trends of modern desert inChina, Adv. Earth Sci., 14, 229–234.
Zhu, J. F., and Z. D. Zhu (1999), Combating Desertification in China,China For. Press, Beijing.
�����������������������B. Grigholm, S. Kaspari, P. A. Mayewski, and S. B. Sneed, Climate
Change Institute, Department of Earth Sciences, University of Maine, 134Sawyer Environmental Research Center, Orono, ME 04469, USA.([email protected])S. Kang, Q. Zhang, and Y. Zhang, Institute of Tibetan Plateau Research,
Chinese Academy of Sciences, Beijing 100085, China.
D20118 GRIGHOLM ET AL.: DUST RECORDS FROM A TIBETAN ICE CORE
13 of 13
D20118