An investigation of recent decadal-scale storm events in the eastern Irish Sea
12
Click Here for Full Article An investigation of recent decadal‐scale storm events in the eastern Irish Sea Jennifer M. Brown, 1 Alejandro J. Souza, 1 and Judith Wolf 1 Received 24 July 2009; revised 8 December 2009; accepted 17 December 2009; published 20 May 2010. [1] The Proudman Oceanographic Laboratory Coastal Modelling System coupled to the WAve Model (POLCOMS‐WAM) modeling system has been used to model combined tides, surges, waves, and wave‐current interaction in the Irish Sea on a 1.85 km grid. A method for data analysis is presented to determine what factors and interactions contribute to extreme conditions in a region of interest. An 11 year hindcast (1996–2006) has been performed to investigate the meteorological conditions that cause extreme surge and/or wave conditions in Liverpool Bay. A one‐way nested model approach was used. For waves, a 1° North Atlantic WAM model forces the boundary of the Irish Sea model, driven by ERA‐40 wind (∼1° resolution every 6 h). To capture the external surge generated outside of the Irish Sea, the (1/9° × 1/6°) Proudman Operational surge model extending to the continental shelf edge was run for tide and surge and was forced by Met Office mesoscale winds (∼12 km resolution every hour). The data implied that the largest surges at Liverpool are generally driven by winds from the south to the west while the largest waves are forced by winds from the west to the northwest. The worst storm conditions in Liverpool Bay result under southwesterly wind conditions that veer to the west. The large tidal range in the region acts to enhance the impact of the surge through tide‐surge interaction. Moreover, the highest water levels in Liverpool Bay are in response to southwesterly winds combined with high‐water spring tide. Even though no significant surge occurs at this time, the flood threat is at its greatest. Citation: Brown, J. M., A. J. Souza, and J. Wolf (2010), An investigation of recent decadal‐scale storm events in the eastern Irish Sea, J. Geophys. Res., 115, C05018, doi:10.1029/2009JC005662. 1. Introduction [2] Coastal flooding is caused by high water levels that are generated by the combined effect of tides and storm surges. Often the overtopping of coastal defenses by waves accompanies such conditions [Wolf, 2008]. The risk of coastal flooding in low‐lying areas is likely to increase in the future in response to global warming and climate change [e.g., Houghton, 2005; Lowe and Gregory, 2005; Lowe et al., 2001], as a result of future sea level rise combined with an increase in the intensity and frequency of storms. Storm winds over England and Wales have the following directional dependencies: 29% SW, 30% W, 21% NW, and 12% S, where the directions represent from where the wind has come [Lamb, 1991]. The shallow eastern Irish Sea is susceptible to large storm surges [Wolf, 2008], which at Liverpool can reach up to 2.5 m [Pye and Blott, 2008] as a result of storm winds and low‐pressure systems. A major surge at Liverpool is likely to occur if a secondary depres- sion with a speed of ∼40 knots approaches such that its rear‐ right quadrant (defined in Figure 2) can act over a long fetch [Lennon, 1963]. Other factors which also contribute to a major surge are whether the depression can be represented as an independent, concentric system with a radius of ∼150– 200 nautical miles and if a pressure gradient of 30 mb over 250 nautical miles is present in the rear‐right quadrant [Lennon, 1963]. For surges in the eastern Irish Sea the flow into the Irish Sea through the North Channel and Celtic Sea (the external surge) is about equally as important as the locally generated surge [Jones and Davies, 1998]. The large tidal range in Liverpool Bay (∼10 m on spring tides) causes a significant tide‐surge interaction. This large tidal range reduces the risk of the peak surge occurring at high water [Horsburgh and Wilson, 2007]. Details on tide‐surge in- teraction are given by Prandle and Wolf [1978] and Wolf [2009]. The largest waves and surges in Liverpool Bay are generated by westerly and northwesterly winds which have the longest fetch (Figure 1). Liverpool Bay is sheltered from swell waves from the Atlantic and experiences locally wind‐ generated sea. The Coastal Flooding by Extreme Events (CoFEE) project and European Union (EU) FP7 Morpho- logical Impacts and Coastal Risks induced by Extreme storm events (MICORE) project are investigating the flood risks in the eastern Irish Sea/Liverpool Bay. This study area includes many of England’s coastal types and the project focuses on the management of the Sefton coast (between the 1 Proudman Oceanographic Laboratory, Liverpool, UK. Copyright 2010 by the American Geophysical Union. 0148‐0227/10/2009JC005662 JOURNAL OF GEOPHYSICAL RESEARCH, VOL. 115, C05018, doi:10.1029/2009JC005662, 2010 C05018 1 of 12
Transcript of An investigation of recent decadal-scale storm events in the eastern Irish Sea
ClickHere
for
FullArticle
An investigation of recent decadal‐scale storm events in the easternIrish Sea
Jennifer M. Brown,1 Alejandro J. Souza,1 and Judith Wolf1
Received 24 July 2009; revised 8 December 2009; accepted 17 December 2009; published 20 May 2010.
[1] The Proudman Oceanographic Laboratory Coastal Modelling System coupled to theWAve Model (POLCOMS‐WAM) modeling system has been used to model combinedtides, surges, waves, and wave‐current interaction in the Irish Sea on a 1.85 km grid. Amethod for data analysis is presented to determine what factors and interactions contributeto extreme conditions in a region of interest. An 11 year hindcast (1996–2006) has beenperformed to investigate the meteorological conditions that cause extreme surge and/orwave conditions in Liverpool Bay. A one‐way nested model approach was used. Forwaves, a 1° North Atlantic WAM model forces the boundary of the Irish Sea model,driven by ERA‐40 wind (∼1° resolution every 6 h). To capture the external surgegenerated outside of the Irish Sea, the (1/9° × 1/6°) Proudman Operational surge modelextending to the continental shelf edge was run for tide and surge and was forced by MetOffice mesoscale winds (∼12 km resolution every hour). The data implied that the largestsurges at Liverpool are generally driven by winds from the south to the west while thelargest waves are forced by winds from the west to the northwest. The worst stormconditions in Liverpool Bay result under southwesterly wind conditions that veer to thewest. The large tidal range in the region acts to enhance the impact of the surge throughtide‐surge interaction. Moreover, the highest water levels in Liverpool Bay are in responseto southwesterly winds combined with high‐water spring tide. Even though no significantsurge occurs at this time, the flood threat is at its greatest.
Citation: Brown, J. M., A. J. Souza, and J. Wolf (2010), An investigation of recent decadal‐scale storm events in the easternIrish Sea, J. Geophys. Res., 115, C05018, doi:10.1029/2009JC005662.
1. Introduction
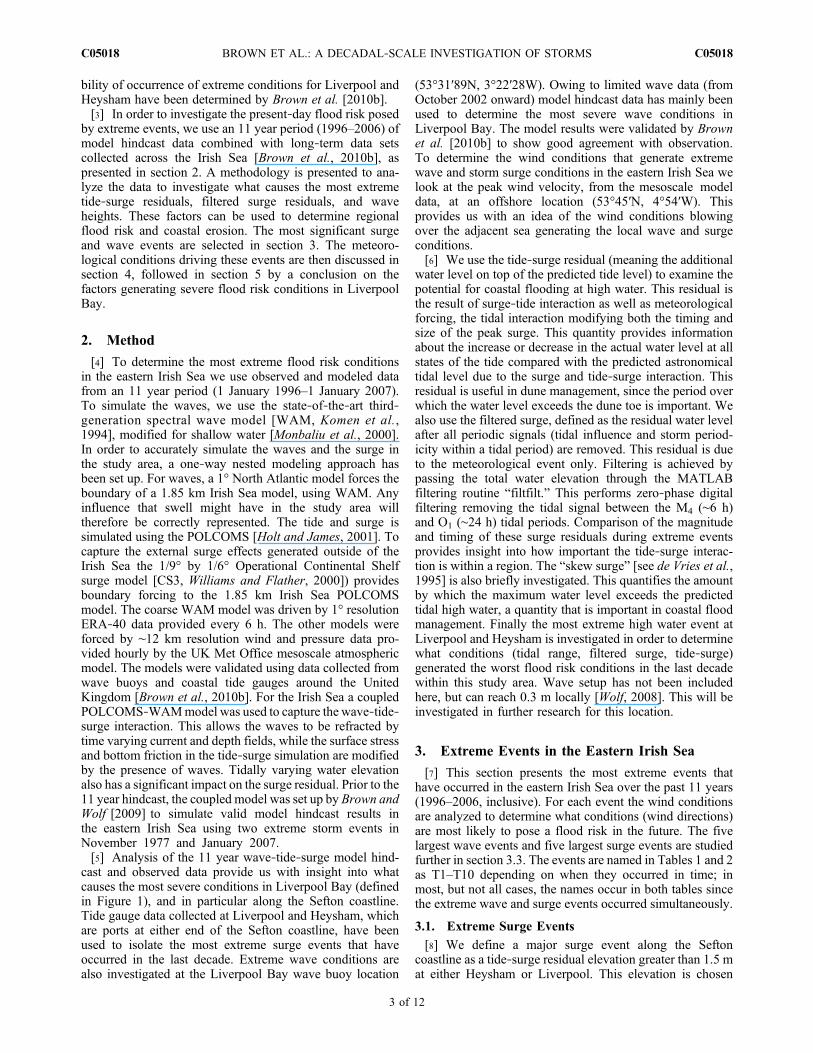
[2] Coastal flooding is caused by high water levels thatare generated by the combined effect of tides and stormsurges. Often the overtopping of coastal defenses by wavesaccompanies such conditions [Wolf, 2008]. The risk ofcoastal flooding in low‐lying areas is likely to increase inthe future in response to global warming and climate change[e.g., Houghton, 2005; Lowe and Gregory, 2005; Lowe etal., 2001], as a result of future sea level rise combinedwith an increase in the intensity and frequency of storms.Storm winds over England and Wales have the followingdirectional dependencies: 29% SW, 30% W, 21% NW, and12% S, where the directions represent from where the windhas come [Lamb, 1991]. The shallow eastern Irish Sea issusceptible to large storm surges [Wolf, 2008], which atLiverpool can reach up to 2.5 m [Pye and Blott, 2008] as aresult of storm winds and low‐pressure systems. A majorsurge at Liverpool is likely to occur if a secondary depres-sion with a speed of ∼40 knots approaches such that its rear‐right quadrant (defined in Figure 2) can act over a long fetch
[Lennon, 1963]. Other factors which also contribute to amajor surge are whether the depression can be representedas an independent, concentric system with a radius of ∼150–200 nautical miles and if a pressure gradient of 30 mb over250 nautical miles is present in the rear‐right quadrant[Lennon, 1963]. For surges in the eastern Irish Sea the flowinto the Irish Sea through the North Channel and Celtic Sea(the external surge) is about equally as important as thelocally generated surge [Jones and Davies, 1998]. The largetidal range in Liverpool Bay (∼10 m on spring tides) causesa significant tide‐surge interaction. This large tidal rangereduces the risk of the peak surge occurring at high water[Horsburgh and Wilson, 2007]. Details on tide‐surge in-teraction are given by Prandle and Wolf [1978] and Wolf[2009]. The largest waves and surges in Liverpool Bay aregenerated by westerly and northwesterly winds which havethe longest fetch (Figure 1). Liverpool Bay is sheltered fromswell waves from the Atlantic and experiences locally wind‐generated sea. The Coastal Flooding by Extreme Events(CoFEE) project and European Union (EU) FP7 Morpho-logical Impacts and Coastal Risks induced by Extremestorm events (MICORE) project are investigating the floodrisks in the eastern Irish Sea/Liverpool Bay. This study areaincludes many of England’s coastal types and the projectfocuses on the management of the Sefton coast (between the
1Proudman Oceanographic Laboratory, Liverpool, UK.
Copyright 2010 by the American Geophysical Union.0148‐0227/10/2009JC005662
JOURNAL OF GEOPHYSICAL RESEARCH, VOL. 115, C05018, doi:10.1029/2009JC005662, 2010
C05018 1 of 12
Ribble and Mersey estuaries) with its mobile dunes. Thepast, present, and future flood risk posed by extreme eventsis being investigated using surge and wave models [Wolf etal., 2008; Brown et al., 2009a]. Previously, an extremeevent in November 1977, which coincided with tidal high‐water overtopping coastal defenses throughout Lancashireand Cumbria, has been hindcast to represent a past extremesurge event [Brown and Wolf, 2009]. This event and asevere event in January 2007, for which both wave and surgedata were available, have been used to initially validateand tune the coupled Proudman Oceanographic LaboratoryCoastal Modelling System‐WAve Model (POLCOMS‐WAM) set up for the eastern Irish Sea [Brown and Wolf,2009], prior to a long‐term (11 year) hindcast [Brown et al.,2010b]. It is known that the largest recorded surge atLiverpool at total high water was 1.98 m in January 1976.This resulted in a high water level of 5.56 m above the meantidal level (MTL). However, the largest surges generallyoccur during lower water levels. The largest recorded surgeachieved 2.47 m in February 1990. At Heysham, largersurges and tidal levels occur. The largest surge recordedwas 2.6 m in February 1990 and the highest‐observed tideexceeded 6.46 m (MTL) in February 1983; unfortunatelythe tide gauge failed during the peak tidal level. Since the1990s the frequency and magnitude of extreme high waterlevels for the eastern Irish Sea has increased [Pye and Blott,2008]. Waves have only been recorded continuously since
October 2002, and the data show that waves exceed 3 mduring 5–10 events per year and 4 m during 1–5 events peryear. The 1 in 50 year wave height is about 5.5 m [Wolf,2008]. Over the last 25 years the maximum wave heightacross the North Atlantic is thought to have increased[Carter, 1999]. The changes in extreme surges and wavescould be linked to the North Atlantic Oscillation (NAO), andin particular the strength of the prevailing westerly winds[Woodworth et al., 2007;Wolf and Woolf, 2006]. The foot ofthe Sefton dunes lies just above the mean spring high waterlevel. Consequently, during the largest tides and mean springtides combined with a storm surge, waves can break directlyonto the dune frontage [Pye and Neal, 1994]. Significantdune erosion along the Sefton coastline has resulted fromindividual extreme storms, some of which lasted for morethan a single high water, that occurred in 1961, 1965, 1967,1968, 1975, 1976, 1983, 1990, 1997, 2002, and 2004 [Pyeand Blott, 2008]. The most damaging storms occurred inNovember 1977, January 1983, and February 1990 [Pye andNeal, 1994]. During the 1977 [Jones and Davies, 1998] and1990 [Pye, 1991] events the damage was due to windsveering west from the southwest generating extreme surgeand wave conditions. To project the future risk of erosionand flooding, extreme value theory [Coles and Tawn,2005] and joint probability of waves and water level[Hawkes et al., 2002] need to be considered. The returnperiods for both waves and water level and the joint proba-
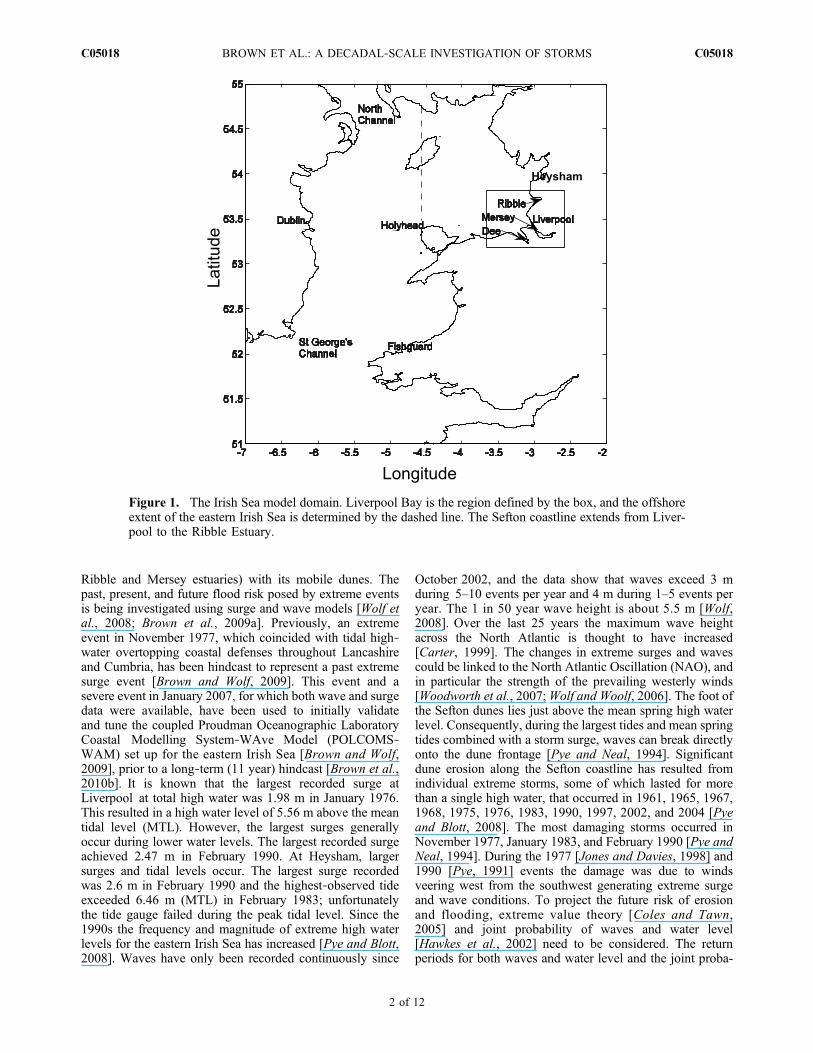
Figure 1. The Irish Sea model domain. Liverpool Bay is the region defined by the box, and the offshoreextent of the eastern Irish Sea is determined by the dashed line. The Sefton coastline extends from Liver-pool to the Ribble Estuary.
BROWN ET AL.: A DECADAL‐SCALE INVESTIGATION OF STORMS C05018C05018
2 of 12
bility of occurrence of extreme conditions for Liverpool andHeysham have been determined by Brown et al. [2010b].[3] In order to investigate the present‐day flood risk posed
by extreme events, we use an 11 year period (1996–2006) ofmodel hindcast data combined with long‐term data setscollected across the Irish Sea [Brown et al., 2010b], aspresented in section 2. A methodology is presented to ana-lyze the data to investigate what causes the most extremetide‐surge residuals, filtered surge residuals, and waveheights. These factors can be used to determine regionalflood risk and coastal erosion. The most significant surgeand wave events are selected in section 3. The meteoro-logical conditions driving these events are then discussed insection 4, followed in section 5 by a conclusion on thefactors generating severe flood risk conditions in LiverpoolBay.
2. Method
[4] To determine the most extreme flood risk conditionsin the eastern Irish Sea we use observed and modeled datafrom an 11 year period (1 January 1996–1 January 2007).To simulate the waves, we use the state‐of‐the‐art third‐generation spectral wave model [WAM, Komen et al.,1994], modified for shallow water [Monbaliu et al., 2000].In order to accurately simulate the waves and the surge inthe study area, a one‐way nested modeling approach hasbeen set up. For waves, a 1° North Atlantic model forces theboundary of a 1.85 km Irish Sea model, using WAM. Anyinfluence that swell might have in the study area willtherefore be correctly represented. The tide and surge issimulated using the POLCOMS [Holt and James, 2001]. Tocapture the external surge effects generated outside of theIrish Sea the 1/9° by 1/6° Operational Continental Shelfsurge model [CS3, Williams and Flather, 2000]) providesboundary forcing to the 1.85 km Irish Sea POLCOMSmodel. The coarse WAM model was driven by 1° resolutionERA‐40 data provided every 6 h. The other models wereforced by ∼12 km resolution wind and pressure data pro-vided hourly by the UK Met Office mesoscale atmosphericmodel. The models were validated using data collected fromwave buoys and coastal tide gauges around the UnitedKingdom [Brown et al., 2010b]. For the Irish Sea a coupledPOLCOMS‐WAMmodel was used to capture the wave‐tide‐surge interaction. This allows the waves to be refracted bytime varying current and depth fields, while the surface stressand bottom friction in the tide‐surge simulation are modifiedby the presence of waves. Tidally varying water elevationalso has a significant impact on the surge residual. Prior to the11 year hindcast, the coupled model was set up by Brown andWolf [2009] to simulate valid model hindcast results inthe eastern Irish Sea using two extreme storm events inNovember 1977 and January 2007.[5] Analysis of the 11 year wave‐tide‐surge model hind-
cast and observed data provide us with insight into whatcauses the most severe conditions in Liverpool Bay (definedin Figure 1), and in particular along the Sefton coastline.Tide gauge data collected at Liverpool and Heysham, whichare ports at either end of the Sefton coastline, have beenused to isolate the most extreme surge events that haveoccurred in the last decade. Extreme wave conditions arealso investigated at the Liverpool Bay wave buoy location
(53°31′89N, 3°22′28W). Owing to limited wave data (fromOctober 2002 onward) model hindcast data has mainly beenused to determine the most severe wave conditions inLiverpool Bay. The model results were validated by Brownet al. [2010b] to show good agreement with observation.To determine the wind conditions that generate extremewave and storm surge conditions in the eastern Irish Sea welook at the peak wind velocity, from the mesoscale modeldata, at an offshore location (53°45′N, 4°54′W). Thisprovides us with an idea of the wind conditions blowingover the adjacent sea generating the local wave and surgeconditions.[6] We use the tide‐surge residual (meaning the additional
water level on top of the predicted tide level) to examine thepotential for coastal flooding at high water. This residual isthe result of surge‐tide interaction as well as meteorologicalforcing, the tidal interaction modifying both the timing andsize of the peak surge. This quantity provides informationabout the increase or decrease in the actual water level at allstates of the tide compared with the predicted astronomicaltidal level due to the surge and tide‐surge interaction. Thisresidual is useful in dune management, since the period overwhich the water level exceeds the dune toe is important. Wealso use the filtered surge, defined as the residual water levelafter all periodic signals (tidal influence and storm period-icity within a tidal period) are removed. This residual is dueto the meteorological event only. Filtering is achieved bypassing the total water elevation through the MATLABfiltering routine “filtfilt.” This performs zero‐phase digitalfiltering removing the tidal signal between the M4 (∼6 h)and O1 (∼24 h) tidal periods. Comparison of the magnitudeand timing of these surge residuals during extreme eventsprovides insight into how important the tide‐surge interac-tion is within a region. The “skew surge” [see de Vries et al.,1995] is also briefly investigated. This quantifies the amountby which the maximum water level exceeds the predictedtidal high water, a quantity that is important in coastal floodmanagement. Finally the most extreme high water event atLiverpool and Heysham is investigated in order to determinewhat conditions (tidal range, filtered surge, tide‐surge)generated the worst flood risk conditions in the last decadewithin this study area. Wave setup has not been includedhere, but can reach 0.3 m locally [Wolf, 2008]. This will beinvestigated in further research for this location.
3. Extreme Events in the Eastern Irish Sea
[7] This section presents the most extreme events thathave occurred in the eastern Irish Sea over the past 11 years(1996–2006, inclusive). For each event the wind conditionsare analyzed to determine what conditions (wind directions)are most likely to pose a flood risk in the future. The fivelargest wave events and five largest surge events are studiedfurther in section 3.3. The events are named in Tables 1 and 2as T1–T10 depending on when they occurred in time; inmost, but not all cases, the names occur in both tables sincethe extreme wave and surge events occurred simultaneously.
3.1. Extreme Surge Events
[8] We define a major surge event along the Seftoncoastline as a tide‐surge residual elevation greater than 1.5 mat either Heysham or Liverpool. This elevation is chosen
BROWN ET AL.: A DECADAL‐SCALE INVESTIGATION OF STORMS C05018C05018
3 of 12
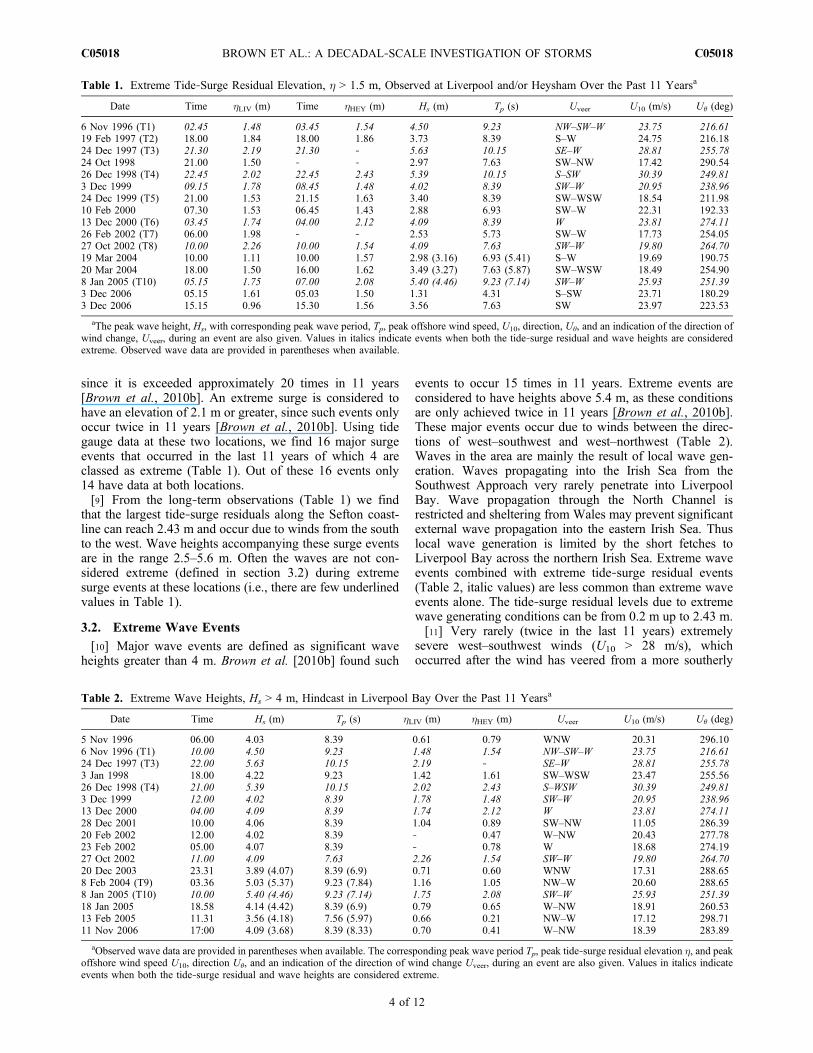
since it is exceeded approximately 20 times in 11 years[Brown et al., 2010b]. An extreme surge is considered tohave an elevation of 2.1 m or greater, since such events onlyoccur twice in 11 years [Brown et al., 2010b]. Using tidegauge data at these two locations, we find 16 major surgeevents that occurred in the last 11 years of which 4 areclassed as extreme (Table 1). Out of these 16 events only14 have data at both locations.[9] From the long‐term observations (Table 1) we find
that the largest tide‐surge residuals along the Sefton coast-line can reach 2.43 m and occur due to winds from the southto the west. Wave heights accompanying these surge eventsare in the range 2.5–5.6 m. Often the waves are not con-sidered extreme (defined in section 3.2) during extremesurge events at these locations (i.e., there are few underlinedvalues in Table 1).
3.2. Extreme Wave Events
[10] Major wave events are defined as significant waveheights greater than 4 m. Brown et al. [2010b] found such
events to occur 15 times in 11 years. Extreme events areconsidered to have heights above 5.4 m, as these conditionsare only achieved twice in 11 years [Brown et al., 2010b].These major events occur due to winds between the direc-tions of west–southwest and west–northwest (Table 2).Waves in the area are mainly the result of local wave gen-eration. Waves propagating into the Irish Sea from theSouthwest Approach very rarely penetrate into LiverpoolBay. Wave propagation through the North Channel isrestricted and sheltering from Wales may prevent significantexternal wave propagation into the eastern Irish Sea. Thuslocal wave generation is limited by the short fetches toLiverpool Bay across the northern Irish Sea. Extreme waveevents combined with extreme tide‐surge residual events(Table 2, italic values) are less common than extreme waveevents alone. The tide‐surge residual levels due to extremewave generating conditions can be from 0.2 m up to 2.43 m.[11] Very rarely (twice in the last 11 years) extremely
severe west–southwest winds (U10 > 28 m/s), whichoccurred after the wind has veered from a more southerly
Table 2. Extreme Wave Heights, Hs > 4 m, Hindcast in Liverpool Bay Over the Past 11 Yearsa
Date Time Hs (m) Tp (s) hLIV (m) hHEY (m) Uveer U10 (m/s) U� (deg)
5 Nov 1996 06.00 4.03 8.39 0.61 0.79 WNW 20.31 296.106 Nov 1996 (T1) 10.00 4.50 9.23 1.48 1.54 NW–SW–W 23.75 216.6124 Dec 1997 (T3) 22.00 5.63 10.15 2.19 ‐ SE–W 28.81 255.783 Jan 1998 18.00 4.22 9.23 1.42 1.61 SW–WSW 23.47 255.5626 Dec 1998 (T4) 21.00 5.39 10.15 2.02 2.43 S–WSW 30.39 249.813 Dec 1999 12.00 4.02 8.39 1.78 1.48 SW–W 20.95 238.9613 Dec 2000 04.00 4.09 8.39 1.74 2.12 W 23.81 274.1128 Dec 2001 10.00 4.06 8.39 1.04 0.89 SW–NW 11.05 286.3920 Feb 2002 12.00 4.02 8.39 ‐ 0.47 W–NW 20.43 277.7823 Feb 2002 05.00 4.07 8.39 ‐ 0.78 W 18.68 274.1927 Oct 2002 11.00 4.09 7.63 2.26 1.54 SW–W 19.80 264.7020 Dec 2003 23.31 3.89 (4.07) 8.39 (6.9) 0.71 0.60 WNW 17.31 288.658 Feb 2004 (T9) 03.36 5.03 (5.37) 9.23 (7.84) 1.16 1.05 NW–W 20.60 288.658 Jan 2005 (T10) 10.00 5.40 (4.46) 9.23 (7.14) 1.75 2.08 SW–W 25.93 251.3918 Jan 2005 18.58 4.14 (4.42) 8.39 (6.9) 0.79 0.65 W–NW 18.91 260.5313 Feb 2005 11.31 3.56 (4.18) 7.56 (5.97) 0.66 0.21 NW–W 17.12 298.7111 Nov 2006 17:00 4.09 (3.68) 8.39 (8.33) 0.70 0.41 W–NW 18.39 283.89
aObserved wave data are provided in parentheses when available. The corresponding peak wave period Tp, peak tide‐surge residual elevation h, and peakoffshore wind speed U10, direction U�, and an indication of the direction of wind change Uveer, during an event are also given. Values in italics indicateevents when both the tide‐surge residual and wave heights are considered extreme.
Table 1. Extreme Tide‐Surge Residual Elevation, h > 1.5 m, Observed at Liverpool and/or Heysham Over the Past 11 Yearsa
Date Time hLIV (m) Time hHEY (m) Hs (m) Tp (s) Uveer U10 (m/s) U� (deg)
6 Nov 1996 (T1) 02.45 1.48 03.45 1.54 4.50 9.23 NW–SW–W 23.75 216.6119 Feb 1997 (T2) 18.00 1.84 18.00 1.86 3.73 8.39 S–W 24.75 216.1824 Dec 1997 (T3) 21.30 2.19 21.30 ‐ 5.63 10.15 SE–W 28.81 255.7824 Oct 1998 21.00 1.50 ‐ ‐ 2.97 7.63 SW–NW 17.42 290.5426 Dec 1998 (T4) 22.45 2.02 22.45 2.43 5.39 10.15 S–SW 30.39 249.813 Dec 1999 09.15 1.78 08.45 1.48 4.02 8.39 SW–W 20.95 238.9624 Dec 1999 (T5) 21.00 1.53 21.15 1.63 3.40 8.39 SW–WSW 18.54 211.9810 Feb 2000 07.30 1.53 06.45 1.43 2.88 6.93 SW–W 22.31 192.3313 Dec 2000 (T6) 03.45 1.74 04.00 2.12 4.09 8.39 W 23.81 274.1126 Feb 2002 (T7) 06.00 1.98 ‐ ‐ 2.53 5.73 SW–W 17.73 254.0527 Oct 2002 (T8) 10.00 2.26 10.00 1.54 4.09 7.63 SW–W 19.80 264.7019 Mar 2004 10.00 1.11 10.00 1.57 2.98 (3.16) 6.93 (5.41) S–W 19.69 190.7520 Mar 2004 18.00 1.50 16.00 1.62 3.49 (3.27) 7.63 (5.87) SW–WSW 18.49 254.908 Jan 2005 (T10) 05.15 1.75 07.00 2.08 5.40 (4.46) 9.23 (7.14) SW–W 25.93 251.393 Dec 2006 05.15 1.61 05.03 1.50 1.31 4.31 S–SW 23.71 180.293 Dec 2006 15.15 0.96 15.30 1.56 3.56 7.63 SW 23.97 223.53
aThe peak wave height, Hs, with corresponding peak wave period, Tp, peak offshore wind speed, U10, direction, U�, and an indication of the direction ofwind change, Uveer, during an event are also given. Values in italics indicate events when both the tide‐surge residual and wave heights are consideredextreme. Observed wave data are provided in parentheses when available.
BROWN ET AL.: A DECADAL‐SCALE INVESTIGATION OF STORMS C05018C05018
4 of 12
direction, have generated waves up to 5.63 m. This is largerthan the more frequently generated waves (4–5 m) in thelast decade due to weaker west–southwesterly through tonorthwesterly wind conditions. These waves have thelongest periods, but are still locally generated according tocoastal engineering formulae [see Hurdle and Stive, 1989].Assuming waves in Liverpool Bay have a maximum fetchof 200 km in a depth of 20 m (approximate depth at wavebuoy), then a wind of 29 m/s can generate waves between5.47–5.67 m with periods between 9.67–11.57 s. The largestwaves are generated by the strongest winds (Table 2), but thewind duration and wind speed over fetches between thesouthwest to northwest will determine the peak wave con-ditions. For example, the waves on 26 December 1998 aresmaller than on 24 December 1997. Even though the peakwind from west–southwest was stronger on 26 December1998 it veered more westerly during the peak wind condi-tions on the 24 December 1997. The winds are often strongerwhen blowing from a southwest to west–southwest direction,generating larger wave heights (Table 2). Such conditionslead to extreme waves combined with extreme surge, sincethis is when the most significant surge is also generated (seesection 3.1).
3.3. Storm Tracks
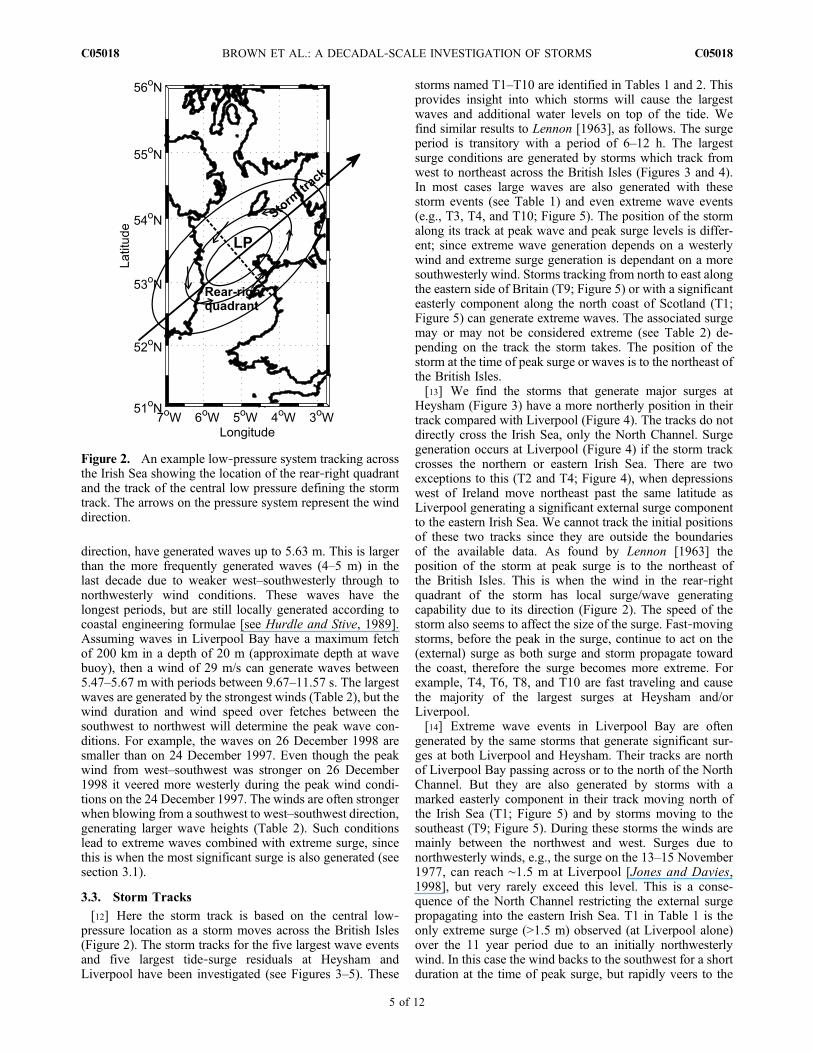
[12] Here the storm track is based on the central low‐pressure location as a storm moves across the British Isles(Figure 2). The storm tracks for the five largest wave eventsand five largest tide‐surge residuals at Heysham andLiverpool have been investigated (see Figures 3–5). These
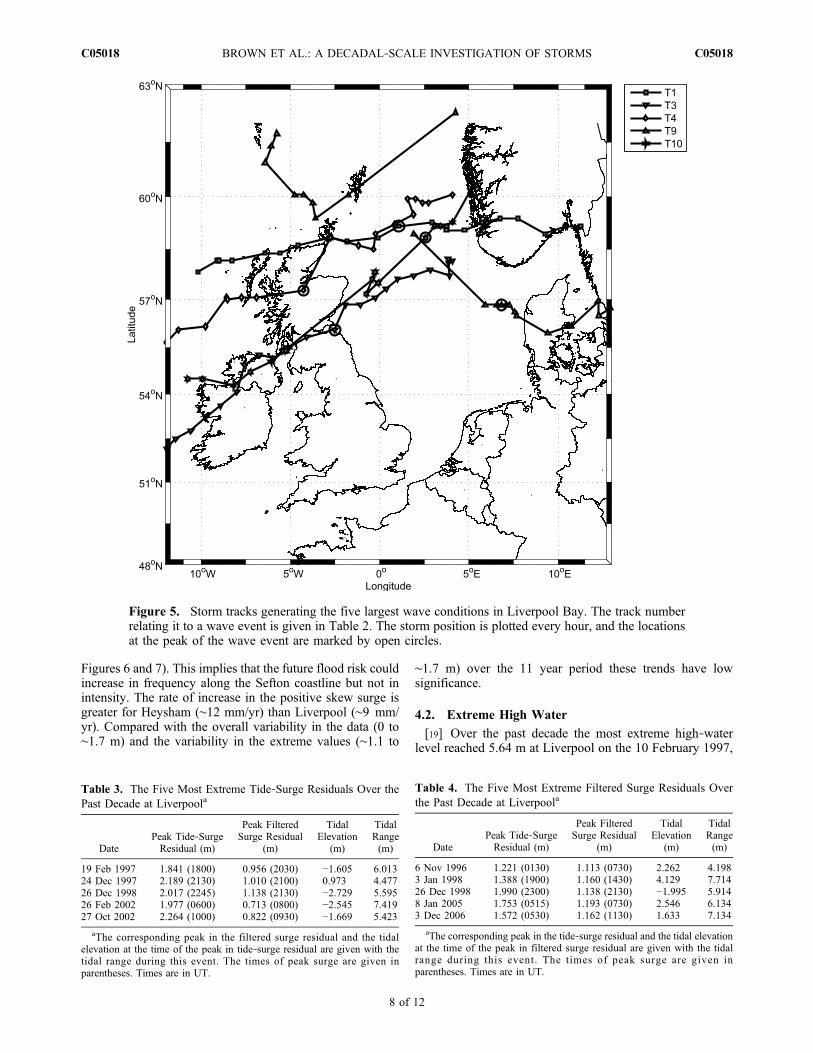
storms named T1–T10 are identified in Tables 1 and 2. Thisprovides insight into which storms will cause the largestwaves and additional water levels on top of the tide. Wefind similar results to Lennon [1963], as follows. The surgeperiod is transitory with a period of 6–12 h. The largestsurge conditions are generated by storms which track fromwest to northeast across the British Isles (Figures 3 and 4).In most cases large waves are also generated with thesestorm events (see Table 1) and even extreme wave events(e.g., T3, T4, and T10; Figure 5). The position of the stormalong its track at peak wave and peak surge levels is differ-ent; since extreme wave generation depends on a westerlywind and extreme surge generation is dependant on a moresouthwesterly wind. Storms tracking from north to east alongthe eastern side of Britain (T9; Figure 5) or with a significanteasterly component along the north coast of Scotland (T1;Figure 5) can generate extreme waves. The associated surgemay or may not be considered extreme (see Table 2) de-pending on the track the storm takes. The position of thestorm at the time of peak surge or waves is to the northeast ofthe British Isles.[13] We find the storms that generate major surges at
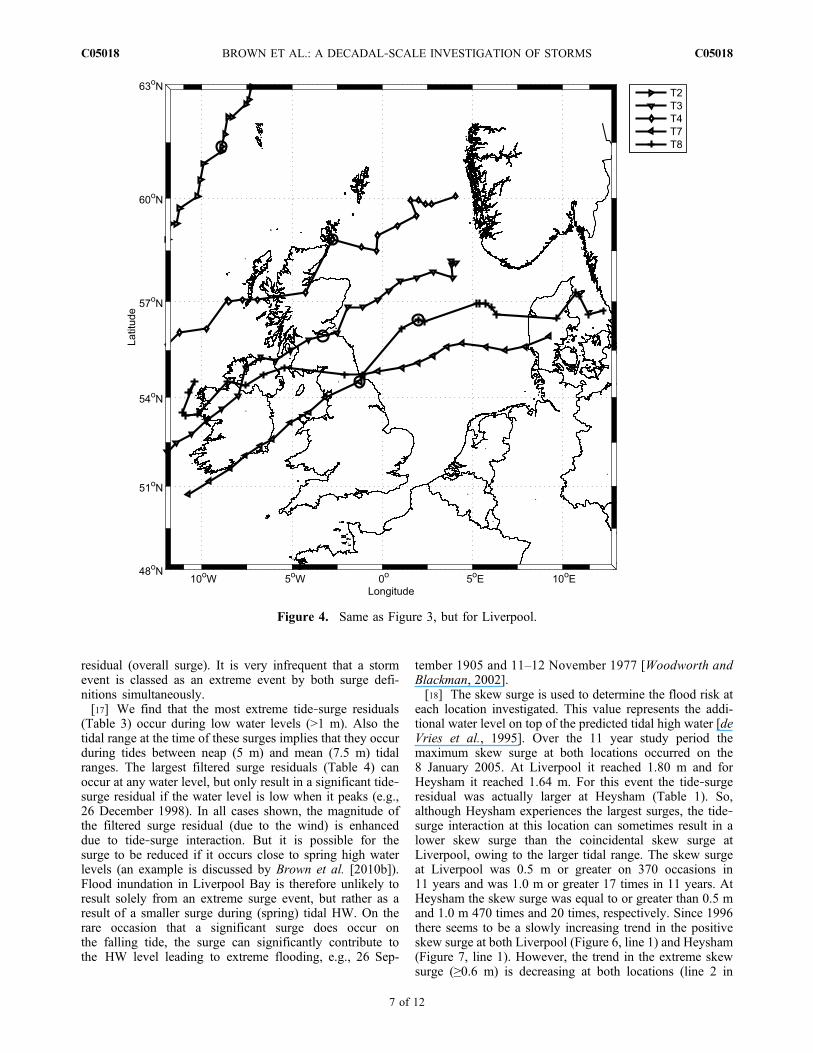
Heysham (Figure 3) have a more northerly position in theirtrack compared with Liverpool (Figure 4). The tracks do notdirectly cross the Irish Sea, only the North Channel. Surgegeneration occurs at Liverpool (Figure 4) if the storm trackcrosses the northern or eastern Irish Sea. There are twoexceptions to this (T2 and T4; Figure 4), when depressionswest of Ireland move northeast past the same latitude asLiverpool generating a significant external surge componentto the eastern Irish Sea. We cannot track the initial positionsof these two tracks since they are outside the boundariesof the available data. As found by Lennon [1963] theposition of the storm at peak surge is to the northeast ofthe British Isles. This is when the wind in the rear‐rightquadrant of the storm has local surge/wave generatingcapability due to its direction (Figure 2). The speed of thestorm also seems to affect the size of the surge. Fast‐movingstorms, before the peak in the surge, continue to act on the(external) surge as both surge and storm propagate towardthe coast, therefore the surge becomes more extreme. Forexample, T4, T6, T8, and T10 are fast traveling and causethe majority of the largest surges at Heysham and/orLiverpool.[14] Extreme wave events in Liverpool Bay are often
generated by the same storms that generate significant sur-ges at both Liverpool and Heysham. Their tracks are northof Liverpool Bay passing across or to the north of the NorthChannel. But they are also generated by storms with amarked easterly component in their track moving north ofthe Irish Sea (T1; Figure 5) and by storms moving to thesoutheast (T9; Figure 5). During these storms the winds aremainly between the northwest and west. Surges due tonorthwesterly winds, e.g., the surge on the 13–15 November1977, can reach ∼1.5 m at Liverpool [Jones and Davies,1998], but very rarely exceed this level. This is a conse-quence of the North Channel restricting the external surgepropagating into the eastern Irish Sea. T1 in Table 1 is theonly extreme surge (>1.5 m) observed (at Liverpool alone)over the 11 year period due to an initially northwesterlywind. In this case the wind backs to the southwest for a shortduration at the time of peak surge, but rapidly veers to the
Figure 2. An example low‐pressure system tracking acrossthe Irish Sea showing the location of the rear‐right quadrantand the track of the central low pressure defining the stormtrack. The arrows on the pressure system represent the winddirection.
BROWN ET AL.: A DECADAL‐SCALE INVESTIGATION OF STORMS C05018C05018
5 of 12
west generating the peak in wave height. In the case ofstorm T9, two storms track around the British Isles, which iswhy there is a break in the track as one storm diminishes andthe second grows. Although the first storm generates west-erly winds it is thought that the second storm has moreimpact on wave growth as it moves closer to the BritishIsles. For this storm only a low (locally generated) surgeoccurs since the storm was badly positioned for externalsurge generation into the eastern Irish Sea. The location ofthe storm at the time of peak wave activity is either close tothe east coast of Scotland or further offshore in the NorthSea. The speed of the storm has less affect on the waveconditions. T4 is the only fast moving storm before the peakin wave heights, but many storms, e.g., T3, T4, T9, and T10generate extreme waves (>5 m).
4. Tidal Effects
[15] At Liverpool it is known that large surges generallyavoid tidal high water (HW) and occur more frequently onthe rising tide, especially under spring tide conditions, due
to the tide‐surge interaction. The annual maximum HWbetween 1768 and 1999 exceeded the average annual meanhigh water by 1.3–2.6 m. These extreme high waters occuron spring tides, with the largest high water occurring in1905 [Woodworth and Blackman, 2002]. To investigate theimportance of the tide, we compare the magnitude of thepeak tide‐surge residual to peak filtered surge residual forthe five largest tide‐surge residuals and five largest filteredsurge residuals at Liverpool. The tidal and surge residualconditions are also analyzed to determine what causedthe largest high water levels at Liverpool over the past11 years.
4.1. Tide‐Surge Interaction
[16] Tide‐surge interaction is significant at Liverpool[Brown et al., 2010b]. We look at the five most extremetide‐surge residuals (Table 3) and the 5 most extreme fil-tered surge residuals (Table 4) to determine how the tidalrange modifies the magnitude of the peak in filtered surge(meteorological surge) to create the peak in tide‐surge
Figure 3. Storm tracks generating the five largest surge events at Heysham. The track number relating itto a surge event is given in Table 1. The storm position is plotted every hour, and the locations at peaksurge are marked by open circles.
BROWN ET AL.: A DECADAL‐SCALE INVESTIGATION OF STORMS C05018C05018
6 of 12
residual (overall surge). It is very infrequent that a stormevent is classed as an extreme event by both surge defi-nitions simultaneously.[17] We find that the most extreme tide‐surge residuals
(Table 3) occur during low water levels (>1 m). Also thetidal range at the time of these surges implies that they occurduring tides between neap (5 m) and mean (7.5 m) tidalranges. The largest filtered surge residuals (Table 4) canoccur at any water level, but only result in a significant tide‐surge residual if the water level is low when it peaks (e.g.,26 December 1998). In all cases shown, the magnitude ofthe filtered surge residual (due to the wind) is enhanceddue to tide‐surge interaction. But it is possible for thesurge to be reduced if it occurs close to spring high waterlevels (an example is discussed by Brown et al. [2010b]).Flood inundation in Liverpool Bay is therefore unlikely toresult solely from an extreme surge event, but rather as aresult of a smaller surge during (spring) tidal HW. On therare occasion that a significant surge does occur onthe falling tide, the surge can significantly contribute tothe HW level leading to extreme flooding, e.g., 26 Sep-
tember 1905 and 11–12 November 1977 [Woodworth andBlackman, 2002].[18] The skew surge is used to determine the flood risk at
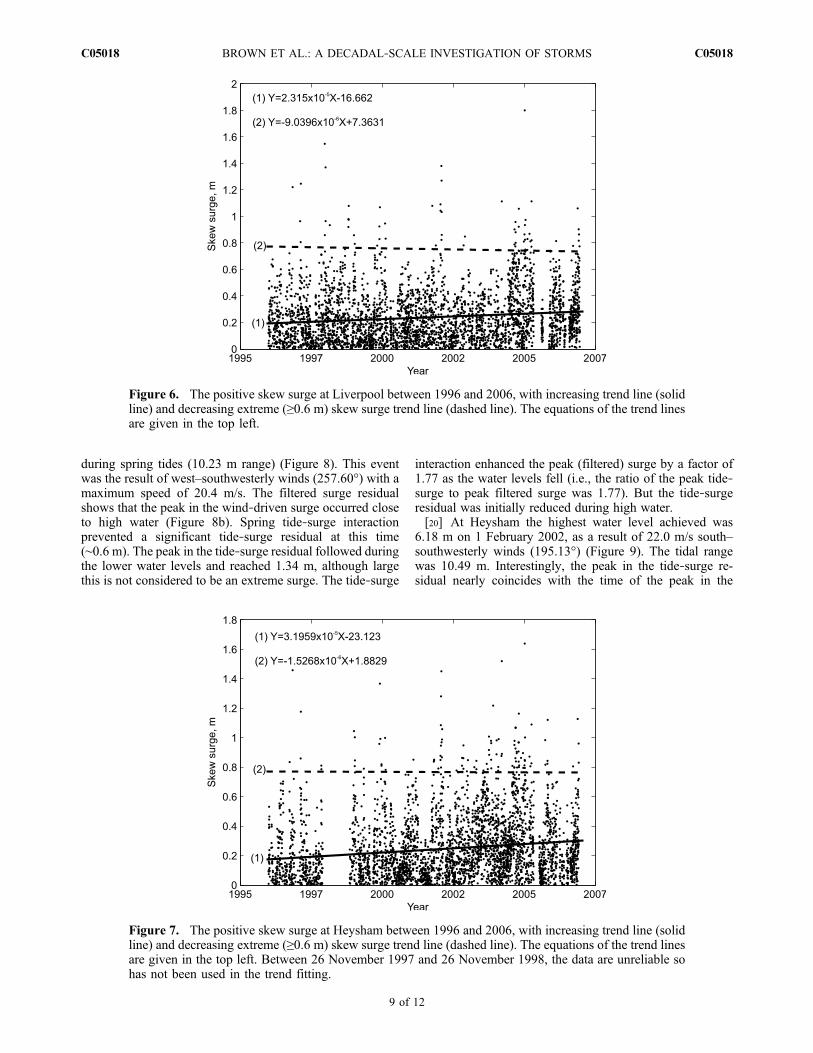
each location investigated. This value represents the addi-tional water level on top of the predicted tidal high water [deVries et al., 1995]. Over the 11 year study period themaximum skew surge at both locations occurred on the8 January 2005. At Liverpool it reached 1.80 m and forHeysham it reached 1.64 m. For this event the tide‐surgeresidual was actually larger at Heysham (Table 1). So,although Heysham experiences the largest surges, the tide‐surge interaction at this location can sometimes result in alower skew surge than the coincidental skew surge atLiverpool, owing to the larger tidal range. The skew surgeat Liverpool was 0.5 m or greater on 370 occasions in11 years and was 1.0 m or greater 17 times in 11 years. AtHeysham the skew surge was equal to or greater than 0.5 mand 1.0 m 470 times and 20 times, respectively. Since 1996there seems to be a slowly increasing trend in the positiveskew surge at both Liverpool (Figure 6, line 1) and Heysham(Figure 7, line 1). However, the trend in the extreme skewsurge (≥0.6 m) is decreasing at both locations (line 2 in
Figure 4. Same as Figure 3, but for Liverpool.
BROWN ET AL.: A DECADAL‐SCALE INVESTIGATION OF STORMS C05018C05018
7 of 12
Figures 6 and 7). This implies that the future flood risk couldincrease in frequency along the Sefton coastline but not inintensity. The rate of increase in the positive skew surge isgreater for Heysham (∼12 mm/yr) than Liverpool (∼9 mm/yr). Compared with the overall variability in the data (0 to∼1.7 m) and the variability in the extreme values (∼1.1 to
∼1.7 m) over the 11 year period these trends have lowsignificance.
4.2. Extreme High Water
[19] Over the past decade the most extreme high‐waterlevel reached 5.64 m at Liverpool on the 10 February 1997,
Figure 5. Storm tracks generating the five largest wave conditions in Liverpool Bay. The track numberrelating it to a wave event is given in Table 2. The storm position is plotted every hour, and the locationsat the peak of the wave event are marked by open circles.
Table 3. The Five Most Extreme Tide‐Surge Residuals Over thePast Decade at Liverpoola
DatePeak Tide‐SurgeResidual (m)
Peak FilteredSurge Residual
(m)
TidalElevation
(m)
TidalRange(m)
19 Feb 1997 1.841 (1800) 0.956 (2030) −1.605 6.01324 Dec 1997 2.189 (2130) 1.010 (2100) 0.973 4.47726 Dec 1998 2.017 (2245) 1.138 (2130) −2.729 5.59526 Feb 2002 1.977 (0600) 0.713 (0800) −2.545 7.41927 Oct 2002 2.264 (1000) 0.822 (0930) −1.669 5.423
aThe corresponding peak in the filtered surge residual and the tidalelevation at the time of the peak in tide‐surge residual are given with thetidal range during this event. The times of peak surge are given inparentheses. Times are in UT.
Table 4. The Five Most Extreme Filtered Surge Residuals Overthe Past Decade at Liverpoola
DatePeak Tide‐SurgeResidual (m)
Peak FilteredSurge Residual
(m)
TidalElevation
(m)
TidalRange(m)
6 Nov 1996 1.221 (0130) 1.113 (0730) 2.262 4.1983 Jan 1998 1.388 (1900) 1.160 (1430) 4.129 7.71426 Dec 1998 1.990 (2300) 1.138 (2130) −1.995 5.9148 Jan 2005 1.753 (0515) 1.193 (0730) 2.546 6.1343 Dec 2006 1.572 (0530) 1.162 (1130) 1.633 7.134
aThe corresponding peak in the tide‐surge residual and the tidal elevationat the time of the peak in filtered surge residual are given with the tidalrange during this event. The times of peak surge are given inparentheses. Times are in UT.
BROWN ET AL.: A DECADAL‐SCALE INVESTIGATION OF STORMS C05018C05018
8 of 12
during spring tides (10.23 m range) (Figure 8). This eventwas the result of west–southwesterly winds (257.60°) with amaximum speed of 20.4 m/s. The filtered surge residualshows that the peak in the wind‐driven surge occurred closeto high water (Figure 8b). Spring tide‐surge interactionprevented a significant tide‐surge residual at this time(∼0.6 m). The peak in the tide‐surge residual followed duringthe lower water levels and reached 1.34 m, although largethis is not considered to be an extreme surge. The tide‐surge
interaction enhanced the peak (filtered) surge by a factor of1.77 as the water levels fell (i.e., the ratio of the peak tide‐surge to peak filtered surge was 1.77). But the tide‐surgeresidual was initially reduced during high water.[20] At Heysham the highest water level achieved was
6.18 m on 1 February 2002, as a result of 22.0 m/s south–southwesterly winds (195.13°) (Figure 9). The tidal rangewas 10.49 m. Interestingly, the peak in the tide‐surge re-sidual nearly coincides with the time of the peak in the
Figure 6. The positive skew surge at Liverpool between 1996 and 2006, with increasing trend line (solidline) and decreasing extreme (≥0.6 m) skew surge trend line (dashed line). The equations of the trend linesare given in the top left.
Figure 7. The positive skew surge at Heysham between 1996 and 2006, with increasing trend line (solidline) and decreasing extreme (≥0.6 m) skew surge trend line (dashed line). The equations of the trend linesare given in the top left. Between 26 November 1997 and 26 November 1998, the data are unreliable sohas not been used in the trend fitting.
BROWN ET AL.: A DECADAL‐SCALE INVESTIGATION OF STORMS C05018C05018
9 of 12
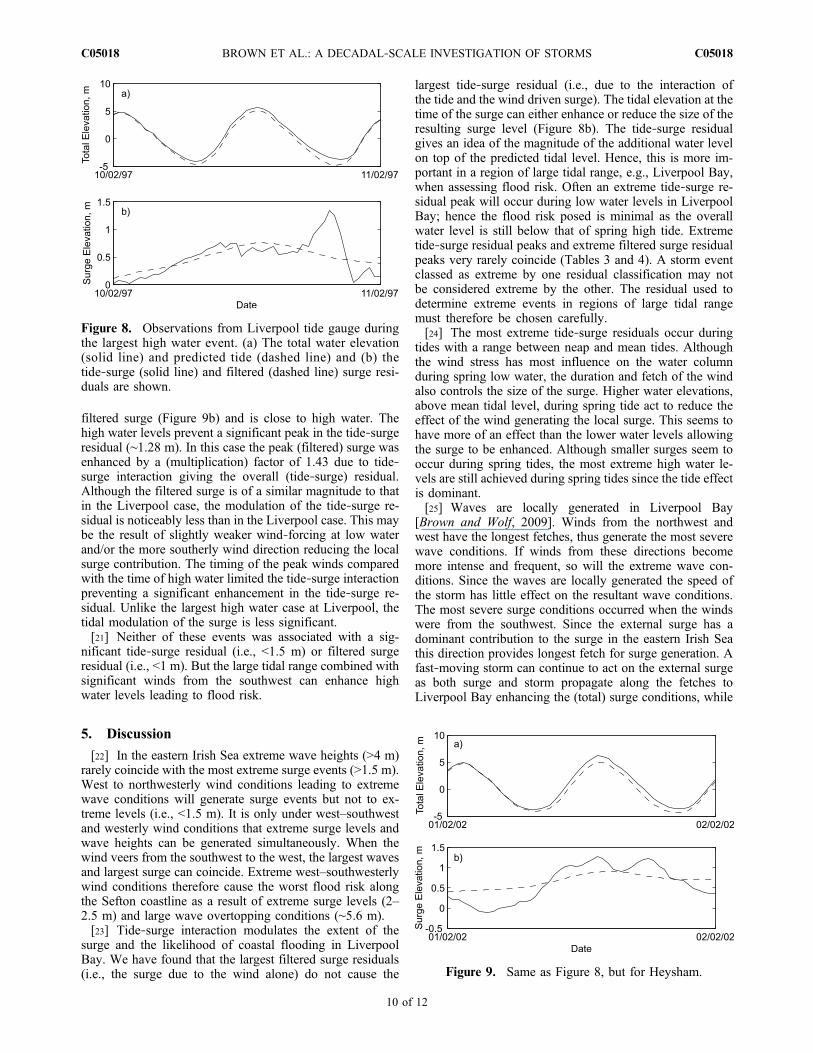
filtered surge (Figure 9b) and is close to high water. Thehigh water levels prevent a significant peak in the tide‐surgeresidual (∼1.28 m). In this case the peak (filtered) surge wasenhanced by a (multiplication) factor of 1.43 due to tide‐surge interaction giving the overall (tide‐surge) residual.Although the filtered surge is of a similar magnitude to thatin the Liverpool case, the modulation of the tide‐surge re-sidual is noticeably less than in the Liverpool case. This maybe the result of slightly weaker wind‐forcing at low waterand/or the more southerly wind direction reducing the localsurge contribution. The timing of the peak winds comparedwith the time of high water limited the tide‐surge interactionpreventing a significant enhancement in the tide‐surge re-sidual. Unlike the largest high water case at Liverpool, thetidal modulation of the surge is less significant.[21] Neither of these events was associated with a sig-
nificant tide‐surge residual (i.e., <1.5 m) or filtered surgeresidual (i.e., <1 m). But the large tidal range combined withsignificant winds from the southwest can enhance highwater levels leading to flood risk.
5. Discussion
[22] In the eastern Irish Sea extreme wave heights (>4 m)rarely coincide with the most extreme surge events (>1.5 m).West to northwesterly wind conditions leading to extremewave conditions will generate surge events but not to ex-treme levels (i.e., <1.5 m). It is only under west–southwestand westerly wind conditions that extreme surge levels andwave heights can be generated simultaneously. When thewind veers from the southwest to the west, the largest wavesand largest surge can coincide. Extreme west–southwesterlywind conditions therefore cause the worst flood risk alongthe Sefton coastline as a result of extreme surge levels (2–2.5 m) and large wave overtopping conditions (∼5.6 m).[23] Tide‐surge interaction modulates the extent of the
surge and the likelihood of coastal flooding in LiverpoolBay. We have found that the largest filtered surge residuals(i.e., the surge due to the wind alone) do not cause the
largest tide‐surge residual (i.e., due to the interaction ofthe tide and the wind driven surge). The tidal elevation at thetime of the surge can either enhance or reduce the size of theresulting surge level (Figure 8b). The tide‐surge residualgives an idea of the magnitude of the additional water levelon top of the predicted tidal level. Hence, this is more im-portant in a region of large tidal range, e.g., Liverpool Bay,when assessing flood risk. Often an extreme tide‐surge re-sidual peak will occur during low water levels in LiverpoolBay; hence the flood risk posed is minimal as the overallwater level is still below that of spring high tide. Extremetide‐surge residual peaks and extreme filtered surge residualpeaks very rarely coincide (Tables 3 and 4). A storm eventclassed as extreme by one residual classification may notbe considered extreme by the other. The residual used todetermine extreme events in regions of large tidal rangemust therefore be chosen carefully.[24] The most extreme tide‐surge residuals occur during
tides with a range between neap and mean tides. Althoughthe wind stress has most influence on the water columnduring spring low water, the duration and fetch of the windalso controls the size of the surge. Higher water elevations,above mean tidal level, during spring tide act to reduce theeffect of the wind generating the local surge. This seems tohave more of an effect than the lower water levels allowingthe surge to be enhanced. Although smaller surges seem tooccur during spring tides, the most extreme high water le-vels are still achieved during spring tides since the tide effectis dominant.[25] Waves are locally generated in Liverpool Bay
[Brown and Wolf, 2009]. Winds from the northwest andwest have the longest fetches, thus generate the most severewave conditions. If winds from these directions becomemore intense and frequent, so will the extreme wave con-ditions. Since the waves are locally generated the speed ofthe storm has little effect on the resultant wave conditions.The most severe surge conditions occurred when the windswere from the southwest. Since the external surge has adominant contribution to the surge in the eastern Irish Seathis direction provides longest fetch for surge generation. Afast‐moving storm can continue to act on the external surgeas both surge and storm propagate along the fetches toLiverpool Bay enhancing the (total) surge conditions, while
Figure 8. Observations from Liverpool tide gauge duringthe largest high water event. (a) The total water elevation(solid line) and predicted tide (dashed line) and (b) thetide‐surge (solid line) and filtered (dashed line) surge resi-duals are shown.
Figure 9. Same as Figure 8, but for Heysham.
BROWN ET AL.: A DECADAL‐SCALE INVESTIGATION OF STORMS C05018C05018
10 of 12
having little influence on the (locally generated) wave con-ditions. The coast is at most risk from flooding when asouthwesterly wind veers to the west during HW spring tide.Under these conditions substantial wave heights coincidewith a low to moderate surge on top of extreme tidal levels.This leads to a high risk of defenses being overtopped andextreme dune erosion (e.g., November 1977) [Jones andDavies, 1998; Pye and Neal, 1994].[26] The worst flood risk in Liverpool Bay, due to water
levels alone, will be posed when strong southwesterly windscoincide with maximum spring high tide. During theseconditions flooding could be worse if waves are present. Incontrast, at times of highest water elevation the actual tide‐surge residual is not classed as extreme due to the consid-erable water depth at the time of the peak in wind effect. Alarge tide‐surge residual may occur during times of lowertidal levels, but will not pose a flood risk as a consequenceof the much lower tidal levels at this time. Flood riskposed by wave overtopping is greatest during westerly ornorthwesterly wind conditions, especially if combined withmaximum tidal water levels. The effect of wave setup willbe assessed in further research using a higher resolution(185 m) model of Liverpool Bay.[27] No long‐term change in the level by which the
average annual mean HW is exceeded by extreme high waterlevels is expected [Woodworth and Blackman, 2002].However, an increase in future extreme water levels aroundthe United Kingdom is expected due to sea level rise and anincrease in wave height, up to 5% of present‐day conditionsby 2075 is projected around the United Kingdom bySutherland and Wolf [2002], due to climate change. Ifcoastal defenses remain unchanged then overtopping ofseawalls could increase by 150%. This increased flood riskis mainly posed by sea level rise [Sutherland and Wolf,2002]. At Liverpool the present rate of sea level rise is1.4 mm/yr [Woodworth et al., 1999]. Thus the change inwater depth over the next decade will be small comparedwith the tidal range in the eastern Irish Sea. The major threatto Liverpool Bay will be an increase in the frequency andintensity of west–southwesterly wind events. These condi-tions generate the most extreme locally generated surge andwave events in response to storms. More rapid change in themorphology of the (Sefton) coastline could also result as aconsequence of the increased frequency of extreme events.A change in the northeasterly storm tracks such that themaximum southwest winds cross over the eastern Irish Seawould also increase the flood risk within Liverpool Bay,whereas a shift further north would reduce the flood risk inLiverpool Bay.
6. Conclusions
[28] Using the presented methodology applied to modelhindcast and observational data for the last 11 years (1996–2006, inclusive) we have found that the largest surge in theeastern Irish Sea during that period was 2.43 m and thelargest significant wave height was 5.6 m. Extreme surgeconditions in the eastern Irish Sea are generated by south-westerly to westerly winds. Extreme wave conditions aregenerated by westerly to northwesterly winds. The mostextreme wave and surge conditions occur (simultaneously)
when a southwesterly wind with significant strength (≥20m/s)veers to the west. This often occurs when a storm tracksacross or just north of the eastern Irish Sea and into theNorth Sea in a northeast direction. The peaks of the surge orwaves occur at different times during the storm propagation,but both peaks occur between 6–12 h into the storm track.[29] When strong southwesterly winds occur close to
spring high tide in Liverpool Bay the most extreme waterlevels result. When combined with the presence of waves,overtopping of coastal defenses along the Sefton coastlinecould lead to coastal flooding. Future flood risk will there-fore increase with sea level rise and if more intense south-westerly wind conditions occur. Under these conditions theadditional water level on top of spring high tide may beless than a meter, but the very high tidal range contributessignificantly.[30] The track of the storm determines the wind sequence
experienced in the eastern Irish Sea. Storms travelingnortheast passing to the north of Liverpool Bay cause theworst surge conditions in the bay. Often large waves areassociated with these storm tracks. Storms moving southeastoff the east coast of Britain or moving east just north ofScotland can generate significant waves within LiverpoolBay, with no simultaneous large surge event. From the re-sults presented we can conclude that southwesterly windconditions veering west pose the greatest flood risk as theygenerate the largest tide‐surge residual and extreme waveconditions on top of the raised water levels.
[31] Acknowledgments. The CoFEE project is funded under theNERC Flood Risk in Extreme Environments (FREE) program (grant NE/E002471/1) and the MICORE project is funded by the EU FP7 program(grant 202798). Thanks to Jane Williams, the operational surge model out-put and Met data were provided over the 11 year period. Met data were alsoobtained from ECMWF to drive the coarse WAM model. Phil Knight isthanked for providing a tidal analysis program to validate the model data.Measured data for these validations were obtained from BODC, CEFAS,and both the U.K. and Irish Met Offices.
ReferencesBrown, J. M., and J. Wolf (2009), Coupled wave and surge modelling forthe eastern Irish Sea and implications for model wind‐stress, Cont. ShelfRes., 29(10), 1329–1342, doi:10.1016/j.csr.2009.03.004.
Brown, J. M., A. J. Souza, and J. Wolf (2010a), Surge modelling in theeastern Irish Sea: Present and future storm impact, Ocean Dyn., 60,227–236, doi:10.1007/s10236-009-0248-8.
Brown, J. M., A. J. Souza, and J. Wolf (2010b), An 11‐year validation ofwave‐surge modelling in the Irish Sea, using a nested POLCOMS‐WAM modell ing system, Ocean Modell . , 33 (1–2), 118–128,doi:10.1016/j.ocemod.2009.12.006.
Carter, D. J. T. (1999), Variability and trends in the wave climate of theNorth Atlantic: A review, paper presented at 9th International Offshoreand Polar Engineering Conference, ISOPE, Cupertino, Calif.
Coles, S., and J. Tawn (2005), Bayesian modelling of extreme surges onthe UK east coast, Philos. Tran. R. Soc. A, 363(1831), 1387–1406,doi:10.1098/rsta.2005.1574.
De Vries, H., M. Breton, T. De Mulder, Y. Krestenitis, J. Ozer, R. Proctor,K. Ruddick, J. C. Salomon, and A. Voorrips (1995), A comparison of2‐D storm surge models applied to three shallow European seas, Environ.Softw., 10(1), 23–42, doi:10.1016/0266-9838(95)00003-4.
Hawkes, P. J., B. P. Gouldby, J. A. Tawn, and M. W. Owen (2002), Thejoint probability of waves and water levels in coastal engineering design,J. Hydraul. Res., 40(3), 241–251.
Holt, J. T., and I. D. James (2001), An s coordinate density evolving modelof the northwest European continental shelf: 1. Model descriptionand density structure, J. Geophys. Res., 106(C7), 14,015–14,034,doi:10.1029/2000JC000304.
BROWN ET AL.: A DECADAL‐SCALE INVESTIGATION OF STORMS C05018C05018
11 of 12
Horsburgh, K. J., and C. Wilson (2007), Tide‐surge interaction and its rolein the distribution of surge residuals in the North Sea, J. Geophys. Res.,112, C08003, doi:10.1029/2006JC004033.
Houghton, J. (2005), Global warming, Rep. Prog. Phys., 68(6), 1343–1403,doi:10.1088/0034-4885/68/6/R02.
Hurdle, D. P., and R. J. H. Stive (1989), Revision of SPM 1984 wave hind-cast model to avoid inconsistencies in engineering applications, CoastalEng., 12(4), 339–351, doi:10.1016/0378-3839(89)90011-2.
Jones, J. E., and A. M. Davies (1998), Storm surge computations for theIrish Sea using a three‐dimensional numerical model including wave‐current interaction, Cont. Shelf Res., 18(2), 201–251, doi:10.1016/S0278-4343(97)00062–9.
Komen, G. J., L. Cavaleri, M. Donelan, K. Hasselmann, S. Hasselmann,and P. A. E. M. Janssen (1994), Dynamics and Modelling of OceanWaves, 532 pp. Cambridge Univ. Press, Cambridge, U. K.
Lamb, H. (1991), Historic Storms of the North Sea, British Isles and North-west Europe, 204 pp., Cambridge Univ. Press, Cambridge, U. K.
Lennon, G. W. (1963), The identification of weather conditions associatedwith the generation of major storm surges along the west coast ofthe British Isles, Q. J. R. Meteorol. Soc., 89, 381–394, doi:10.1002/qj.49708938110.
Lowe, J. A., and J. M. Gregory (2005), The effects of climate change onstorm surges around the United Kingdom, Philos. Trans. R. Soc. A,363, 1313–1328, doi:10.1098/rsta.2005.1570.
Lowe, J. A., J. M. Gregory, and R. A. Flather (2001), Changes in theoccurrence of storm surges around the United Kingdom under a futureclimate scenario using a dynamic storm surge model driven by HadleyCentre climate models, J. Clim., 18(3–4), 179–188.
Monbaliu, J., R. Padilla‐Hernández, J. C. Hargreaves, J. C. Carretero‐Albiach, W. Luo, M. Sclavo, and H. Günther (2000), The spectralwave model WAM adapted for applications with high spatial resolution,Coastal Eng., 41(1–3), 41–62.
Prandle, D., and J. Wolf (1978), The interaction of surge and tide in theNorth Sea and River Thames, Geophys. J. R. Astron. Soc., 55, 203–216.
Pye, K. (1991), Beach deflation and backshore dune formation followingerosion under storm surge conditions: An example from northwest Eng-land, in Aeolian Grain Transport, vol. 2, The Erosional Environment,Acta Mech. Suppl., vol. 2, edited by O. E. Barndorff‐Nielsen andB. B. Willetts, pp. 171–181, Springer, Berlin.
Pye, K., and S. J. Blott (2008), Decadal‐scale variation in dune erosion andaccretion rates: An investigation of the significance of changing stormtide frequency and magnitude on Sefton coast, U.K., Geomorphology,102(3–4), 652–666.
Pye, K., and A. Neal (1994), Coastal dune erosion at Formby Point, northMerseyside, England: Causes and mechanisms, Mar. Geol., 119(1–2),39–56, doi:10.1016/0025-3227(94)90139-2.
Sutherland, J., and J. Wolf (2002), Coastal defence vulnerability 2075, Rep.590, HR Wallingford, 30 pp., HR Wallingford, Oxford, U. K.
Williams, J. A., and R. A. Flather (2000), Interfacing the operational stormsurge model to a new mesoscale atmospheric model, POL Internal Doc.127, 18 pp., Proudman Oceanogr. Lab., Liverpool, U. K.
Wolf, J. (2008), Coupled wave and surge modeling and implications forcoastal flooding, Adv. Geosci., 17, 1–4.
Wolf, J. (2009), Coastal flooding: Impacts of coupled wave‐surge‐tidemodels, Nat. Hazards, 49, 241–260, doi:10.1007/s11069-008-9316-5.
Wolf, J., and D. K. Woolf (2006), Waves and climate change in thenorth–east Atlantic, Geophys. Res. Lett., 33, L06604, doi:10.1029/2005GL025113.
Wolf, J., J. Brown, G. Lymbery, A. Souza, and J. Williams (2008), Coastalflooding in extreme events, paper presented at 9th International Confer-ence, Littoral, Venice, Italy, 25–28 Nov.
Woodworth, P. L., and D. L. Blackman (2002), Changes in extreme highwaters at Liverpool since 1768, Int. J. Climatol., 22(6), 697–714,doi:10.1002/joc.761.
Woodworth, P. L., M. N. Tsimplis, R. A. Flather, and I. Shennan (1999), Areview of the trends observed in British Isles mean sea level data mea-sured by tide gauges, Geophys. J. Int., 136(3), 651–670, doi:10.1046/j.1365-246x.1999.00751.x.
Woodworth, P. L., R. A. Flather, J. A. Williams, S. L. Wakelin, andS. Jevrejeva (2007), The dependence of the UK extreme sea levels andstorm surges on the North Atlantic Oscillation, Cont. Shelf Res., 27(7),935–946, doi:10.1016/j.csr.2006.12.007.
J. M. Brown, A. J. Souza, and J. Wolf, Proudman OceanographicLaboratory, Joseph Proudman Building, 6 Brownlow Street, LiverpoolL3 5DA, UK. ([email protected])
BROWN ET AL.: A DECADAL‐SCALE INVESTIGATION OF STORMS C05018C05018
12 of 12