Decadal responses in soil N dynamics at the Bear Brook Watershed in Maine, USA
17
Decadal responses in soil N dynamics at the Bear Brook Watershed in Maine, USA Sultana Jefts a , Ivan J. Fernandez a,* , Lindsey E. Rustad b , D. Bryan Dail a a Department of Plant, Soil, and Environmental Sciences, University of Maine, Orono, ME 04469-5722, USA b USDA Forest Service, Northeastern Research Station, Durham, NH 03824, USA Received 6 April 2003; received in revised form 20 May 2003; accepted 24 August 2003 Abstract Atmospheric nitrogen deposition to forested ecosystems is a concern because of both geochemical and biological consequences for ecosystem integrity. High levels of prolonged N deposition can lead to ‘‘N saturation’’ of the ecosystem. The Bear Brook Watershed in Maine is a long-term, paired forested watershed experiment with over a decade of experimental N additions (34 kg ha 1 per year ¼ ambient þ treatmentÞ to investigate the biogeochemical consequences of N saturation. Both in situ and laboratory studies of N mineralization and nitrification were carried out to evaluate the changes in N cycling brought about by the long-term N additions. Consistent with hypotheses set forth in the literature (sensu [BioScience 39 (1989) 378]), the treated watershed had higher rates of N cycling compared to the reference watershed. In addition, we report important differences in N cycling rates as a function of forest cover type and soil horizon. Higher rates of net N mineralization occurred in hardwood O horizons compared to softwoods, but the opposite was true in the mineral soils suggesting an important link between litter type and N mineralization that varies with depth in the pedon. Nitrification showed the greatest response to N treatments, with the majority of mineralized N subsequently oxidized to nitrate in the mineral soils. By comparing the data herein with that previously reported for the Bear Brook experiment, it appears that the ecosystem response to N treatment continues to evolve on a decadal time scale and inherent differences in forest cover types and their underlying soils alter the fate of depositional N. # 2003 Elsevier B.V. All rights reserved. Keywords: Nitrogen cycling; Nitrogen mineralization; Nitrification; N saturation 1. Introduction Over the past century atmospheric N deposition has increased across both Europe (Gunderson, 1995; Dise and Wright, 1995) and the northeastern US (Galloway et al., 1995; Aber et al., 1993), and this is largely due to human activities including fossil fuel combustion and changes in agricultural practices. Although N is considered to be limiting to growth in most forest ecosystems throughout the world (Schlesinger, 1997), it can also be considered a major pollutant (Torseth and Semb, 1997). Nitrogen in excess of biological demand can lead to soil acidification, which in turn can cause root damage, thereby reducing the ability of plants to take up nutrients (Henriksen and Hessen, 1997). Other consequences of elevated N deposi- tion include: acid fog damage and spruce decline (McNulty et al., 1996), soil aluminum (Al) mobili- zation (Lawrence and David, 1997), mercury (Hg) accumulation in fish (Driscoll et al., 1994), increased Forest Ecology and Management 189 (2004) 189–205 * Corresponding author. Tel.: þ1-207-581-2932; fax: þ1-207-581-2999. E-mail address: [email protected] (I.J. Fernandez). 0378-1127/$ – see front matter # 2003 Elsevier B.V. All rights reserved. doi:10.1016/j.foreco.2003.08.011
-
Upload
independent -
Category
Documents
-
view
1 -
download
0
Transcript of Decadal responses in soil N dynamics at the Bear Brook Watershed in Maine, USA
Decadal responses in soil N dynamics at the Bear BrookWatershed in Maine, USA
Sultana Jeftsa, Ivan J. Fernandeza,*, Lindsey E. Rustadb, D. Bryan Daila
aDepartment of Plant, Soil, and Environmental Sciences, University of Maine, Orono, ME 04469-5722, USAbUSDA Forest Service, Northeastern Research Station, Durham, NH 03824, USA
Received 6 April 2003; received in revised form 20 May 2003; accepted 24 August 2003
Abstract
Atmospheric nitrogen deposition to forested ecosystems is a concern because of both geochemical and biological
consequences for ecosystem integrity. High levels of prolonged N deposition can lead to ‘‘N saturation’’ of the ecosystem.
The Bear Brook Watershed in Maine is a long-term, paired forested watershed experiment with over a decade of experimental N
additions (�34 kg ha�1 per year ¼ ambient þ treatmentÞ to investigate the biogeochemical consequences of N saturation. Both
in situ and laboratory studies of N mineralization and nitrification were carried out to evaluate the changes in N cycling brought
about by the long-term N additions. Consistent with hypotheses set forth in the literature (sensu [BioScience 39 (1989) 378]), the
treated watershed had higher rates of N cycling compared to the reference watershed. In addition, we report important
differences in N cycling rates as a function of forest cover type and soil horizon. Higher rates of net N mineralization occurred in
hardwood O horizons compared to softwoods, but the opposite was true in the mineral soils suggesting an important link
between litter type and N mineralization that varies with depth in the pedon. Nitrification showed the greatest response to N
treatments, with the majority of mineralized N subsequently oxidized to nitrate in the mineral soils. By comparing the data
herein with that previously reported for the Bear Brook experiment, it appears that the ecosystem response to N treatment
continues to evolve on a decadal time scale and inherent differences in forest cover types and their underlying soils alter the fate
of depositional N.
# 2003 Elsevier B.V. All rights reserved.
Keywords: Nitrogen cycling; Nitrogen mineralization; Nitrification; N saturation
1. Introduction
Over the past century atmospheric N deposition has
increased across both Europe (Gunderson, 1995; Dise
and Wright, 1995) and the northeastern US (Galloway
et al., 1995; Aber et al., 1993), and this is largely due
to human activities including fossil fuel combustion
and changes in agricultural practices. Although N is
considered to be limiting to growth in most forest
ecosystems throughout the world (Schlesinger, 1997),
it can also be considered a major pollutant (Torseth
and Semb, 1997). Nitrogen in excess of biological
demand can lead to soil acidification, which in turn
can cause root damage, thereby reducing the ability of
plants to take up nutrients (Henriksen and Hessen,
1997). Other consequences of elevated N deposi-
tion include: acid fog damage and spruce decline
(McNulty et al., 1996), soil aluminum (Al) mobili-
zation (Lawrence and David, 1997), mercury (Hg)
accumulation in fish (Driscoll et al., 1994), increased
Forest Ecology and Management 189 (2004) 189–205
* Corresponding author. Tel.: þ1-207-581-2932;
fax: þ1-207-581-2999.
E-mail address: [email protected] (I.J. Fernandez).
0378-1127/$ – see front matter # 2003 Elsevier B.V. All rights reserved.
doi:10.1016/j.foreco.2003.08.011
NO3-N leaching resulting in acidification of stre-
ams, eutrophication of estuaries and coastal waters
(Murdoch and Stoddard, 1992; Henriksen and Hessen,
1997), and NO3-N contamination of drinking water
(Spalding and Exner, 1993).
Most forest soils not influenced by high N deposi-
tion are N-limited, and contain small amounts of
exchangeable inorganic N as compared to the pool
of organic N in the forest floor. The inorganic N pool is
usually dominated by NH4-N, which is made available
via mineralization from the organic pool and is then
quickly utilized by plants, microbial communities or
adsorbed to cation exchange sites. This can result in
little NH4-N being leached or available for nitrifica-
tion. However, once assimilatory needs have been met,
additional NH4-N may be utilized by bacterial nitrifier
communities that oxidize NH4-N to NO3-N thereby
fixing atmospheric CO2 with the energy gained. This
NO3-N can then be leached from the soil owing to its
low retention by most soils. Under conditions of low
oxygen availability, denitrification can convert much
of the NO3-N to N2O or N2 (Aber, 1993; McNulty
et al., 1996; Mohn et al., 2000).
Nitrification and N mineralization rates are one
among many microbial processes that have been
studied to assess the effects of site factors (Christ
et al., 2002) as well as ecosystem disturbances such as
fertilization (Gilliam et al., 1996; McNulty and Aber,
1993), harvesting (Fenn et al., 1998; Frazer et al.,
1990), historical land use and related disturbances
(Goodale and Aber, 2001; Goodale et al., 2000) and
climate (Mitchell et al., 1996a; Pastor and Post, 1988;
Rustad et al., 2000; Peterjohn et al., 1994). Nitrogen
mineralization has also been used to evaluate forest
succession (Gower and Son, 1992) and the effects on
forest types (Cole and Rapp, 1981; Campbell et al.,
2000; Peterjohn et al., 1999) on ecosystem processes.
A number of researchers have found O horizon soils
under hardwoods have significantly higher rates of N
mineralization compared to O horizon soils under
softwoods (Campbell et al., 2000; Aber et al., 1993;
Finzi et al., 1998; Ferrari, 1993). This has been
attributed to differences in soil moisture, pH, tem-
perature, carbon to nitrogen (C/N) ratios and biotic
mechanisms related to competition between plants
and microbes (Campbell et al., 2000; Aber et al.,
1993). Campbell et al. (2000) and Aber et al.
(1993) have hypothesized that the lower N cycling
rates observed in softwoods could indicate that soft-
woods might be more sensitive to deleterious effects
of increased N deposition than hardwoods.
Long-term elevated N deposition can result in N
saturation at a site where N availability is chronically
in excess of microbial and plant demand (Aber et al.,
1989; Agren and Bosatta, 1988). Nitrogen saturation is
manifested in an ecosystem by initial increases in net
N mineralization (NNM) rates (thought to be a ferti-
lization effect) followed by sharp declines. These
declines in N mineralization parallel increases in
net nitrification (NN) rates and are often followed
by declining tree growth as N saturation conditions
develop (Aber et al., 1998).
Since many of Europe’s ecosystems have pro-
gressed further on the N saturation continuum than
in North America, researchers there have provided
valuable insights into the progression of N dynamics
during the evolution of N saturation. The EXperi-
mental MANipulation of Forest Ecosystems project
in Europe (EXMAN) (Rasmussen et al., 1990) and
the NITRogen Saturation EXperiments in Europe
(NITREX) (Dise and Wright, 1992) addressed the
effects of increased N deposition on biogeochemical
cycling in European coniferous forests. In both Europe
and North America the most commonly used indi-
cator of the N status of a site is stream NO3-N export
(e.g. Aber et al., 1993; Adams et al., 1997; Andersson
et al., 2002). However, stream chemistry is a function
of internal watershed processes such as N minerali-
zation and nitrification in soils. The objectives of
this research were to determine the effects of increa-
sed N deposition on NNM and NN at the Bear Brook
Watershed in Maine (BBWM) after more than a
decade of experimental whole-watershed N enrich-
ment.
2. Materials and methods
2.1. Site description
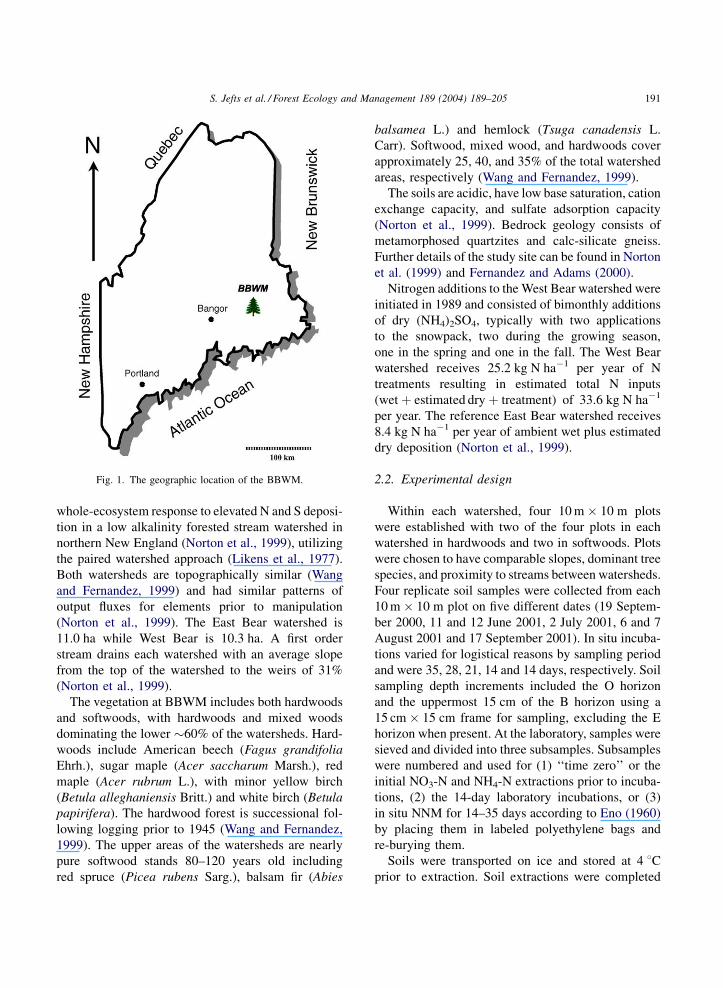
The BBWM is located in eastern Maine at 448520Nlatitude and 688060W longitude, approximately 60 km
from the coast of Maine (Fig. 1), situated in the upper
210 m of the southeast slope of Lead Mountain.
BBWM is a paired watershed experiment that began
in 1987. The study was established to evaluate
190 S. Jefts et al. / Forest Ecology and Management 189 (2004) 189–205
whole-ecosystem response to elevated N and S deposi-
tion in a low alkalinity forested stream watershed in
northern New England (Norton et al., 1999), utilizing
the paired watershed approach (Likens et al., 1977).
Both watersheds are topographically similar (Wang
and Fernandez, 1999) and had similar patterns of
output fluxes for elements prior to manipulation
(Norton et al., 1999). The East Bear watershed is
11.0 ha while West Bear is 10.3 ha. A first order
stream drains each watershed with an average slope
from the top of the watershed to the weirs of 31%
(Norton et al., 1999).
The vegetation at BBWM includes both hardwoods
and softwoods, with hardwoods and mixed woods
dominating the lower �60% of the watersheds. Hard-
woods include American beech (Fagus grandifolia
Ehrh.), sugar maple (Acer saccharum Marsh.), red
maple (Acer rubrum L.), with minor yellow birch
(Betula alleghaniensis Britt.) and white birch (Betula
papirifera). The hardwood forest is successional fol-
lowing logging prior to 1945 (Wang and Fernandez,
1999). The upper areas of the watersheds are nearly
pure softwood stands 80–120 years old including
red spruce (Picea rubens Sarg.), balsam fir (Abies
balsamea L.) and hemlock (Tsuga canadensis L.
Carr). Softwood, mixed wood, and hardwoods cover
approximately 25, 40, and 35% of the total watershed
areas, respectively (Wang and Fernandez, 1999).
The soils are acidic, have low base saturation, cation
exchange capacity, and sulfate adsorption capacity
(Norton et al., 1999). Bedrock geology consists of
metamorphosed quartzites and calc-silicate gneiss.
Further details of the study site can be found in Norton
et al. (1999) and Fernandez and Adams (2000).
Nitrogen additions to the West Bear watershed were
initiated in 1989 and consisted of bimonthly additions
of dry (NH4)2SO4, typically with two applications
to the snowpack, two during the growing season,
one in the spring and one in the fall. The West Bear
watershed receives 25.2 kg N ha�1 per year of N
treatments resulting in estimated total N inputs
(wet þ estimated dry þ treatment) of 33.6 kg N ha�1
per year. The reference East Bear watershed receives
8.4 kg N ha�1 per year of ambient wet plus estimated
dry deposition (Norton et al., 1999).
2.2. Experimental design
Within each watershed, four 10 m � 10 m plots
were established with two of the four plots in each
watershed in hardwoods and two in softwoods. Plots
were chosen to have comparable slopes, dominant tree
species, and proximity to streams between watersheds.
Four replicate soil samples were collected from each
10 m � 10 m plot on five different dates (19 Septem-
ber 2000, 11 and 12 June 2001, 2 July 2001, 6 and 7
August 2001 and 17 September 2001). In situ incuba-
tions varied for logistical reasons by sampling period
and were 35, 28, 21, 14 and 14 days, respectively. Soil
sampling depth increments included the O horizon
and the uppermost 15 cm of the B horizon using a
15 cm � 15 cm frame for sampling, excluding the E
horizon when present. At the laboratory, samples were
sieved and divided into three subsamples. Subsamples
were numbered and used for (1) ‘‘time zero’’ or the
initial NO3-N and NH4-N extractions prior to incuba-
tions, (2) the 14-day laboratory incubations, or (3)
in situ NNM for 14–35 days according to Eno (1960)
by placing them in labeled polyethylene bags and
re-burying them.
Soils were transported on ice and stored at 4 8Cprior to extraction. Soil extractions were completed
Fig. 1. The geographic location of the BBWM.
S. Jefts et al. / Forest Ecology and Management 189 (2004) 189–205 191

within 24 h of collection. Extracts were frozen until
they could be analyzed for NH4-N and NO3-N. Ana-
lyses were conducted by comparable methods at both
the Institute of Ecosystem Studies (IES) in Millbrook,
NY and the University of Maine’s Analytical Labora-
tory. A subset of samples were analyzed at both
laboratories to assure data quality with excellent
agreement between facilities.
2.3. NNM and NN
NNM and NN were assessed using both a 14-day
laboratory incubation (Hart et al., 1994) and an in
situ method (Eno, 1960). Methods were chosen to
estimate NNM and NN rates in the field (in situ
method) and the substrate potential for NNM and NN
under the controlled temperature of a laboratory
incubation (14-day laboratory incubation method).
While laboratory incubations do not measure actual
rates of N processes under field conditions, they are
widely used as an index of N dynamics in forest
soils for practical reasons. NNM is defined as the
difference between the sum of NO3-N and NH4-N
at the initiation (e.g. time ¼ 0) of incubation and
at some final point in time, while NN is the differ-
ence for NO3-N alone. Field moist O horizon soils
were sieved through a 6 mm mesh sieve and mineral
soils were sieved through a 2 mm mesh sieve. A
15 � 0:05 g subsample of field moist soil was placed
in a polycarbonate cup and incubated in the dark at
�22 8C for 14 days. Another �5 g subsample of field
moist soil was used to determine oven-dry moisture
content (O horizon soils were dried at 65 8C and
mineral soils were dried at 105 8C). At the initiation
of the experiment, time zero subsamples were
extracted immediately with 100 ml of 2 M KCl to
determine initial NO3-N and NH4-N concentrations.
After 14 days of laboratory incubation or 14–35 days
of in situ incubation, soils were extracted as above.
Soil pH was determined in deionized water accord-
ing to Hendershot et al. (1993) for samples collected
in September 2000. Soil pH from this research was
highly correlated with soil pH measured during a
quantitative soil study in 1998 at BBWM (Fernandez
et al., 2003) when evaluated at the plot level. Con-
centrations of NO3-N and NH4-N were determined
on an OI1 Analytic Dual-Channel Automated Ion
Analyzer at the University of Maine’s Analytical
Laboratory and on a Perstop1 Flow Solutions
3000 Injection Analyzer at IES.
2.4. Estimates of ecosystem N
Biomass N was estimated as the sum of above- and
belowground biomass N content using allometric
equations from the literature and stem data from
Eckhoff (2000). Total soil N was calculated from a
quantitative pedon soil study conducted in 1998 at
BBWM (Fernandez, unpublished data). Total N in the
mineral soils was defined in this study as all soil below
the O horizons, excluding the E horizon, but including
all B and C horizons to a 1 m depth. Total pedon N
values were the sum of the O horizon and all mineral
soils. Extractable N data from the 1998 soil studies
were only available for the O horizons and the upper
5 cm depth increment of mineral soils. Annual in situ
NNM was taken as growing season NNM and calcu-
lated for 1 May 2001 to 31 October 2001. Since soils
were collected in June–September 2001, June and
September 2001 were used to extrapolate estimates
for both May and October.
2.5. Statistical design
The statistical design was a split–split plot among
treatments, forest types and time. In this design, factor
A was the East and West Bear watersheds, factor B
was the hardwood and softwood forest types, and
factor C was time. Analyses were performed sepa-
rately on O horizons and mineral soils given the
different characteristics of each horizon. Data required
rank transformations and were subsequently analyzed
by ANOVA on the statistical analysis system (SAS
Institute, 1999–2000) with an alpha level of 0.05.
3. Results and discussion
3.1. NNM and NN—watershed effects
Table 1 shows O and mineral soil means for the
main effects of watershed and forest type from this
study. O horizon potential NNM was significantly
higher in the treated West Bear watershed compared
to the reference East Bear watershed, however there
were no significant differences between mineral soils
192 S. Jefts et al. / Forest Ecology and Management 189 (2004) 189–205
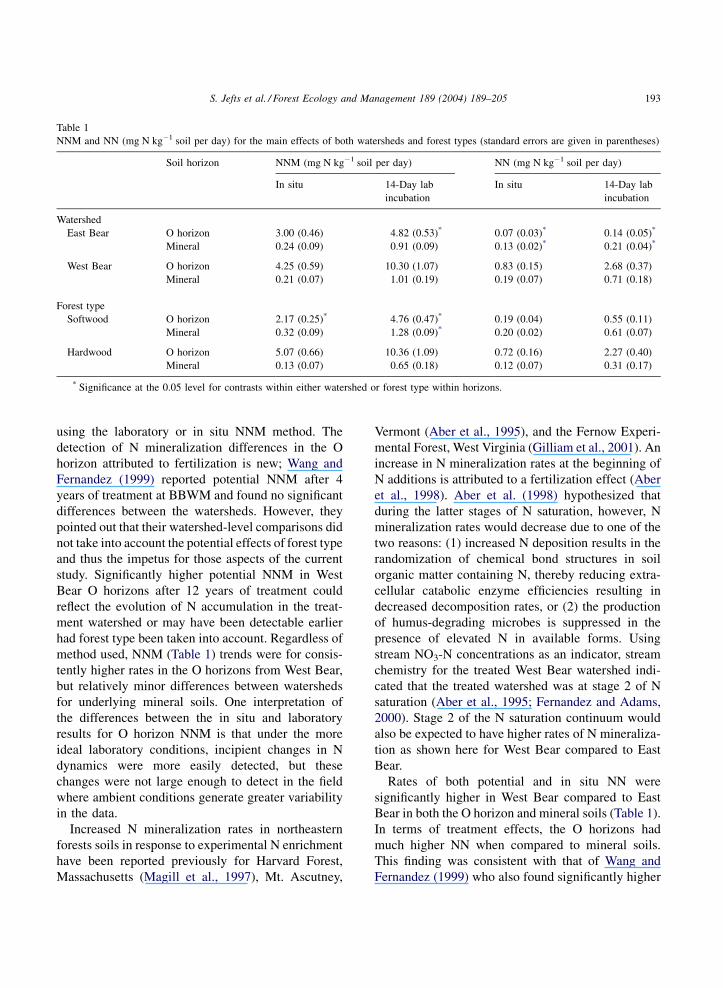
using the laboratory or in situ NNM method. The
detection of N mineralization differences in the O
horizon attributed to fertilization is new; Wang and
Fernandez (1999) reported potential NNM after 4
years of treatment at BBWM and found no significant
differences between the watersheds. However, they
pointed out that their watershed-level comparisons did
not take into account the potential effects of forest type
and thus the impetus for those aspects of the current
study. Significantly higher potential NNM in West
Bear O horizons after 12 years of treatment could
reflect the evolution of N accumulation in the treat-
ment watershed or may have been detectable earlier
had forest type been taken into account. Regardless of
method used, NNM (Table 1) trends were for consis-
tently higher rates in the O horizons from West Bear,
but relatively minor differences between watersheds
for underlying mineral soils. One interpretation of
the differences between the in situ and laboratory
results for O horizon NNM is that under the more
ideal laboratory conditions, incipient changes in N
dynamics were more easily detected, but these
changes were not large enough to detect in the field
where ambient conditions generate greater variability
in the data.
Increased N mineralization rates in northeastern
forests soils in response to experimental N enrichment
have been reported previously for Harvard Forest,
Massachusetts (Magill et al., 1997), Mt. Ascutney,
Vermont (Aber et al., 1995), and the Fernow Experi-
mental Forest, West Virginia (Gilliam et al., 2001). An
increase in N mineralization rates at the beginning of
N additions is attributed to a fertilization effect (Aber
et al., 1998). Aber et al. (1998) hypothesized that
during the latter stages of N saturation, however, N
mineralization rates would decrease due to one of the
two reasons: (1) increased N deposition results in the
randomization of chemical bond structures in soil
organic matter containing N, thereby reducing extra-
cellular catabolic enzyme efficiencies resulting in
decreased decomposition rates, or (2) the production
of humus-degrading microbes is suppressed in the
presence of elevated N in available forms. Using
stream NO3-N concentrations as an indicator, stream
chemistry for the treated West Bear watershed indi-
cated that the treated watershed was at stage 2 of N
saturation (Aber et al., 1995; Fernandez and Adams,
2000). Stage 2 of the N saturation continuum would
also be expected to have higher rates of N mineraliza-
tion as shown here for West Bear compared to East
Bear.
Rates of both potential and in situ NN were
significantly higher in West Bear compared to East
Bear in both the O horizon and mineral soils (Table 1).
In terms of treatment effects, the O horizons had
much higher NN when compared to mineral soils.
This finding was consistent with that of Wang and
Fernandez (1999) who also found significantly higher
Table 1
NNM and NN (mg N kg�1 soil per day) for the main effects of both watersheds and forest types (standard errors are given in parentheses)
Soil horizon NNM (mg N kg�1 soil per day) NN (mg N kg�1 soil per day)
In situ 14-Day lab
incubation
In situ 14-Day lab
incubation
Watershed
East Bear O horizon 3.00 (0.46) 4.82 (0.53)* 0.07 (0.03)* 0.14 (0.05)*
Mineral 0.24 (0.09) 0.91 (0.09) 0.13 (0.02)* 0.21 (0.04)*
West Bear O horizon 4.25 (0.59) 10.30 (1.07) 0.83 (0.15) 2.68 (0.37)
Mineral 0.21 (0.07) 1.01 (0.19) 0.19 (0.07) 0.71 (0.18)
Forest type
Softwood O horizon 2.17 (0.25)* 4.76 (0.47)* 0.19 (0.04) 0.55 (0.11)
Mineral 0.32 (0.09) 1.28 (0.09)* 0.20 (0.02) 0.61 (0.07)
Hardwood O horizon 5.07 (0.66) 10.36 (1.09) 0.72 (0.16) 2.27 (0.40)
Mineral 0.13 (0.07) 0.65 (0.18) 0.12 (0.07) 0.31 (0.17)
* Significance at the 0.05 level for contrasts within either watershed or forest type within horizons.
S. Jefts et al. / Forest Ecology and Management 189 (2004) 189–205 193
potential NN rates in the forest floor of West Bear after
only 4 years of treatment. This also reinforces the
notion that West Bear reflects stage 2 of N saturation
(Aber et al., 1998) where both N mineralization and
nitrification have increased. Future measurements of
these processes will be necessary to determine if N
mineralization is increasing or decreasing over time,
reflecting the ecosystems progress between stages 2
and 3 of the N saturation continuum.
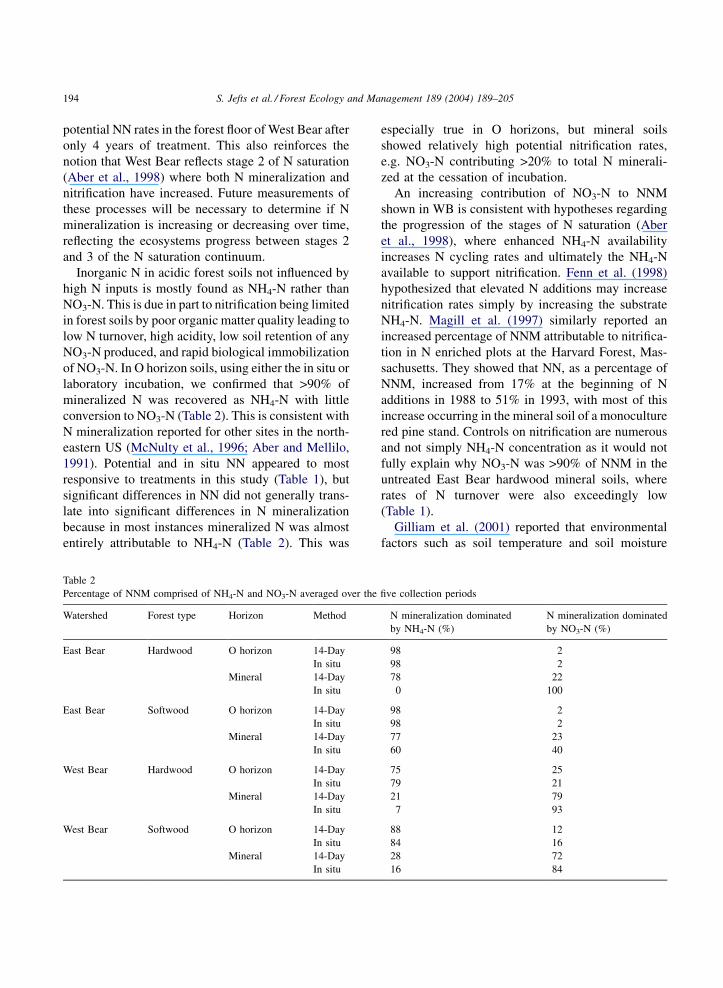
Inorganic N in acidic forest soils not influenced by
high N inputs is mostly found as NH4-N rather than
NO3-N. This is due in part to nitrification being limited
in forest soils by poor organic matter quality leading to
low N turnover, high acidity, low soil retention of any
NO3-N produced, and rapid biological immobilization
of NO3-N. In O horizon soils, using either the in situ or
laboratory incubation, we confirmed that >90% of
mineralized N was recovered as NH4-N with little
conversion to NO3-N (Table 2). This is consistent with
N mineralization reported for other sites in the north-
eastern US (McNulty et al., 1996; Aber and Mellilo,
1991). Potential and in situ NN appeared to most
responsive to treatments in this study (Table 1), but
significant differences in NN did not generally trans-
late into significant differences in N mineralization
because in most instances mineralized N was almost
entirely attributable to NH4-N (Table 2). This was
especially true in O horizons, but mineral soils
showed relatively high potential nitrification rates,
e.g. NO3-N contributing >20% to total N minerali-
zed at the cessation of incubation.
An increasing contribution of NO3-N to NNM
shown in WB is consistent with hypotheses regarding
the progression of the stages of N saturation (Aber
et al., 1998), where enhanced NH4-N availability
increases N cycling rates and ultimately the NH4-N
available to support nitrification. Fenn et al. (1998)
hypothesized that elevated N additions may increase
nitrification rates simply by increasing the substrate
NH4-N. Magill et al. (1997) similarly reported an
increased percentage of NNM attributable to nitrifica-
tion in N enriched plots at the Harvard Forest, Mas-
sachusetts. They showed that NN, as a percentage of
NNM, increased from 17% at the beginning of N
additions in 1988 to 51% in 1993, with most of this
increase occurring in the mineral soil of a monoculture
red pine stand. Controls on nitrification are numerous
and not simply NH4-N concentration as it would not
fully explain why NO3-N was >90% of NNM in the
untreated East Bear hardwood mineral soils, where
rates of N turnover were also exceedingly low
(Table 1).
Gilliam et al. (2001) reported that environmental
factors such as soil temperature and soil moisture
Table 2
Percentage of NNM comprised of NH4-N and NO3-N averaged over the five collection periods
Watershed Forest type Horizon Method N mineralization dominated
by NH4-N (%)
N mineralization dominated
by NO3-N (%)
East Bear Hardwood O horizon 14-Day 98 2
In situ 98 2
Mineral 14-Day 78 22
In situ 0 100
East Bear Softwood O horizon 14-Day 98 2
In situ 98 2
Mineral 14-Day 77 23
In situ 60 40
West Bear Hardwood O horizon 14-Day 75 25
In situ 79 21
Mineral 14-Day 21 79
In situ 7 93
West Bear Softwood O horizon 14-Day 88 12
In situ 84 16
Mineral 14-Day 28 72
In situ 16 84
194 S. Jefts et al. / Forest Ecology and Management 189 (2004) 189–205
strongly influenced NN rates in the untreated forested
watersheds at the Fernow Experimental Forest (FEF)
in West Virginia. However, they found that the
strength of the correlation between these environmen-
tal factors and NN rates decreased in their experi-
mental watershed between 4 and 6 years after the
beginning of treatments with (NH4)2SO4. They sug-
gested that N additions might alter microbial commu-
nities in ways that make them more sensitive to N than
other environmental factors. Koopmans et al. (1995)
found similar results in coniferous forests in The
Netherlands where environmental factors were not
as strongly correlated with NN rates in high N deposi-
tion plots compared to the ambient and low N deposi-
tion plots. It could be that soil eutrophication brought
about by N additions selects for a nitrifier community
that is less responsive to the soil microclimate, how-
ever little is known about the shifts in soil microbial
populations undergoing this sort of nutrient manipula-
tion. It must be noted that for our study, no significant
correlations between soil temperature or soil moisture
and potential or in situ NNM were detected. The
apparent difference between this study and that of
Gilliam et al. (2001) may be due to climatic or other
edaphic features that differ between the sites; some
notable differences include the fact that the Fernow
Experimental Forest has a mean annual temperature
5 8C higher and receives on average 15 cm per year
more precipitation than BBWM resulting in warmer
soil temperatures and possibly higher moisture con-
tents in the soil (Fernandez and Adams, 2000).
3.2. NNM and NN—forest type effects
Table 1 shows the potential and in situ NNM by
major forest type at the BBWM. Both potential and in
situ methods resulted in significantly higher rates of
NNM in hardwood compared to softwood O horizons.
In contrast, the underlying mineral soil NNM assays
suggested lower potential NNM in hardwood com-
pared to softwood stands. NN data showed no sig-
nificant differences between forest types although
trends paralleled the NNM patterns when comparing
O and mineral soil horizons.
Higher NN in O horizons compared to mineral soils
for hardwoods, but in mineral soils compared to O
horizons for softwoods, is a contrast that has been
reported in other studies in the northeastern US (Aber
et al., 1993; Fernandez et al., 2000; Campbell et al.,
2000; Finzi et al., 1998). Campbell et al. (2000)
attributed higher N cycling rates in hardwood O
horizons compared to softwoods to differences in soil
moisture, pH, and biotic controls reflecting competi-
tion between plants and microbes. They found lower
rates of N mineralization in the mineral soils for
hardwoods although there were no significant differ-
ences between forest types in mineral soils.
Fernandez et al. (2000) looked at potential NNM,
potential NN and potential net ammonification at 20
hardwood stands and 9 softwood stands across the 4
major climatic regions of Maine, including the refer-
ence watershed at BBWM. They found significantly
higher potential NNM and potential NN in O horizons
from hardwood stands as compared to those under
softwoods. They also found similar O horizon N
concentrations in both forest types; however, total C
concentrations were higher under softwoods with the
net result being higher C/N ratios. Higher C/N ratios
are often correlated with lower NNM rates in forest
soils (Blair et al., 1990; Fernandez and Adams, 2000;
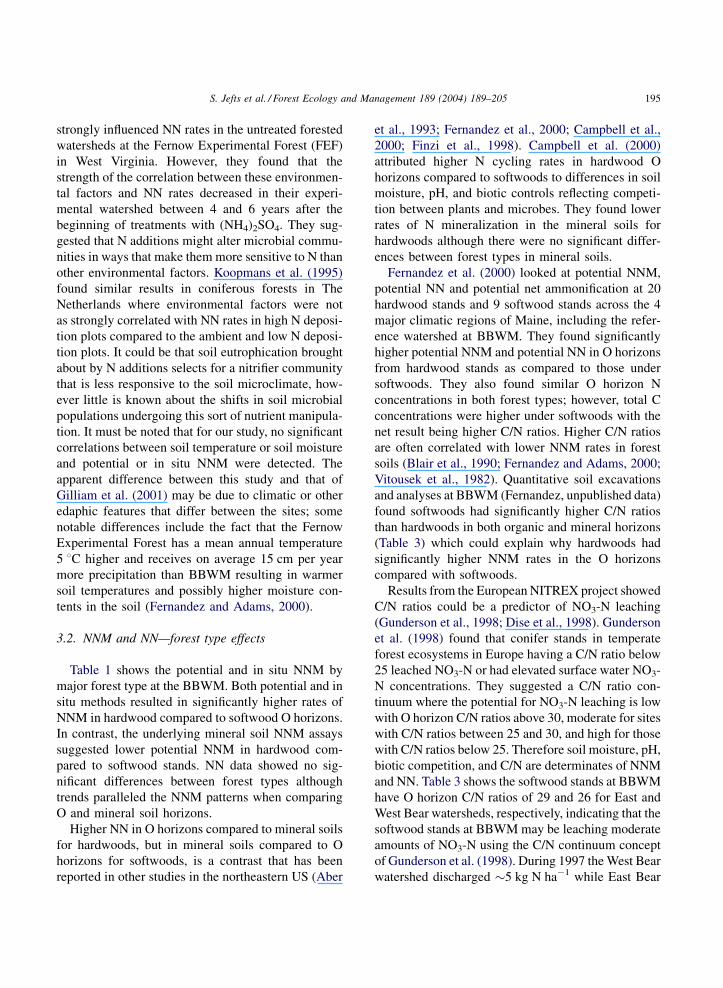
Vitousek et al., 1982). Quantitative soil excavations
and analyses at BBWM (Fernandez, unpublished data)
found softwoods had significantly higher C/N ratios
than hardwoods in both organic and mineral horizons
(Table 3) which could explain why hardwoods had
significantly higher NNM rates in the O horizons
compared with softwoods.
Results from the European NITREX project showed
C/N ratios could be a predictor of NO3-N leaching
(Gunderson et al., 1998; Dise et al., 1998). Gunderson
et al. (1998) found that conifer stands in temperate
forest ecosystems in Europe having a C/N ratio below
25 leached NO3-N or had elevated surface water NO3-
N concentrations. They suggested a C/N ratio con-
tinuum where the potential for NO3-N leaching is low
with O horizon C/N ratios above 30, moderate for sites
with C/N ratios between 25 and 30, and high for those
with C/N ratios below 25. Therefore soil moisture, pH,
biotic competition, and C/N are determinates of NNM
and NN. Table 3 shows the softwood stands at BBWM
have O horizon C/N ratios of 29 and 26 for East and
West Bear watersheds, respectively, indicating that the
softwood stands at BBWM may be leaching moderate
amounts of NO3-N using the C/N continuum concept
of Gunderson et al. (1998). During 1997 the West Bear
watershed discharged �5 kg N ha�1 while East Bear
S. Jefts et al. / Forest Ecology and Management 189 (2004) 189–205 195
discharged �0.1 kg N ha�1 (Kahl et al., 1999) con-
sistent with the differences in the C/N ratios between
watersheds. Dise et al. (1998) also examined the
hypothesis that C/N ratios of the O horizons could
be used to estimate the level of NO3-N leaching from
an ecosystem, but went further and examined a range
of N deposition conditions to evaluate how N deposi-
tion affects both C/N ratios and NO3-N leaching.
Dise et al. (1998) found that at low levels of N
deposition (<9 kg N ha�1 per year), NO3-N leaching
was minimal regardless of the O horizon C/N ratio. At
intermediate (9–18 kg N ha�1 per year), high (18–
30 kg N ha�1 per year), and very high (>30 kg N ha�1
per year) inputs of N deposition, NO3-N leaching
increased with increasing N deposition and decreasing
C/N ratios. BBWM receives an estimated ambient
total N deposition of 8.4 kg N ha�1 per year, with
the treated West Bear watershed receiving 33.6 kg
N ha�1 per year as both ambient atmospheric deposi-
tion plus treatment (Kahl et al., 1999). According to
Dise et al. (1998) the very high N deposition
(>30 kg N ha�1 per year) to West Bear should induce
higher NO3-N leaching compared to East Bear. This is
consistent with higher stream NO3-N export in West
Bear compared with East Bear (Kahl et al., 1999).
Ultimately, other parameters need to be taken into
account when predicting NO3-N leaching besides C/N
ratios and amounts of N deposition such as plant
demand, site and land-use history (Goodale and Aber,
2001; Ollinger et al., 2002; Gunderson et al., 1998;
Dise and Wright, 1995; Dise et al., 1998).
Researchers in the US also have examined the
relationship between C/N ratios and N mineralization,
nitrification and NO3 leaching, typically reporting
negative correlations between O horizon soil C/N
ratios and N mineralization and nitrification rates
(Goodale and Aber, 2001; McNulty et al., 1991,
1996; Ollinger et al., 2002). The strongest correlations
are usually between soil C/N ratios and nitrification
rates. Lovett and Rueth (1999), Ollinger et al. (2002)
and McNulty et al. (1996) all reinforced the premise
that a threshold forest floor C/N ratio of 20–25 exists
in both softwoods and hardwoods where nitrification
sharply increases at or below this range.
The typical negative correlation between C/N ratio
and NNM and NO3-N leaching is a logical mechanism
to explain why the O horizons in hardwoods have
significantly higher NNM rates compared to soft-
woods, e.g. hardwoods have a lower C/N. It does
not explain why the opposite trend exists in the soft-
wood mineral soils. We hypothesize one of the two
possibilities for the softwood mineral soil results. The
first hypothesis is that O horizons in hardwoods
mineralize N at a faster rate than softwoods because
of higher tissue N concentrations (Nadelhoffer et al.,
1995) and more rapid rates of litter decomposition
Table 3
Soil pH, total N, total C and total C:N ratio by horizon and depth from the quantitative soil excavations in 1998 (standard errors are given in
parentheses)
Watershed Forest type pHw Total N
(mg kg�1)
Total C
(mg kg�1)
Total C:N Fine earth
(kg ha�1)
East Bear Hardwoods O horizon 4.01 (0.06)* 1.56 (0.06) 34.3 (1.49)* 22 (0.99)* 82652 (9957)*
5 cm 4.28 (0.04)* 0.49 (0.06) 8.83 (0.84) 19.41 (0.81)* 146059 (20177)
5–25 cm 4.66 (0.03)* 0.32 (0.03) 6.14 (0.52) 20.24 (0.56)* 804855 (99647)
East Bear Softwoods O horizon 3.54 (0.04)*,** 1.41 (0.03) 40.64 (0.81)*,.** 29.20 (0.94)*,** 159393 (27270)*
5 cm 4.07 (0.05)* 0.39 (0.04) 9.28 (0.82) 24.39 (0.62)*,** 144733 (12750)
5–25 cm 4.36 (0.06)* 0.32 (0.03) 7.69 (0.70) 24.08 (0.41)*,** 680275 (60916)
West Bear Hardwoods O horizon 3.97 (0.06)* 1.44 (0.05) 33.63 (1.45) 23.31 (0.54) 86111 (19293)*
5 cm 4.18 (0.05) 0.43 (0.03) 8.59 (0.64) 19.92 (0.37)* 120254 (11001)
5–25 cm 4.59 (0.05)* 0.33 (0.03) 6.65 (0.57) 20.60 (0.39)* 704367 (81687)
West Bear Softwoods O horizon 3.69 (0.05)*,** 1.49 (0.05) 37.54 (1.26)** 25.68 (1.25)** 139519 (11661)*
5 cm 4.09 (0.04) 0.46 (0.05) 9.81 (0.95) 22.22 (0.67)* 143093 (12571)
5–25 cm 4.43 (0.04)* 0.30 (0.02) 6.47 (0.38) 22.28 (0.68)*,** 768772 (50000)
* Significance between vegetation types within a watershed at the 0.05 level.** Significance between watersheds within a vegetation type at the 0.05 level.
196 S. Jefts et al. / Forest Ecology and Management 189 (2004) 189–205
(Finzi et al., 1998). This leaves only the more
recalcitrant humic materials to illuviate into the
mineral soils below. In contrast, softwood litter is
slower to decompose in the O horizons because of
its higher lignin:N and C/N ratios (Ferrari, 1993),
resulting in less O horizon mineralization and humi-
fication with more mineralizable substrate illuviating
into the mineral soils. Thus, more labile C is avail-
able in softwood mineral soils to respond to N
enrichment. While this mechanism remains plausi-
ble, Parker et al. (2002) did not find clear evidence
for higher labile C in softwood compared to hard-
wood B horizon soils at BBWM. The second hypoth-
esis is that softwood and hardwood mineral soils
mineralize N at similar rates, but softwood mineral
soils are more sensitive to increased N deposition.
This would cause a more rapid increase in NNM to
result in the softwoods with N enrichment compared
to hardwoods, a characteristic also reported by others
(Campbell et al., 2000; Aber et al., 1995). Campbell
et al. (2000) hypothesized that softwood species may
be more sensitive to N deposition if softwood sites
have lower rates of N assimilation into foliage and
bolewood compared to hardwood sites (Nadelhoffer
et al., 1995), resulting in a greater effect on soil
processes.
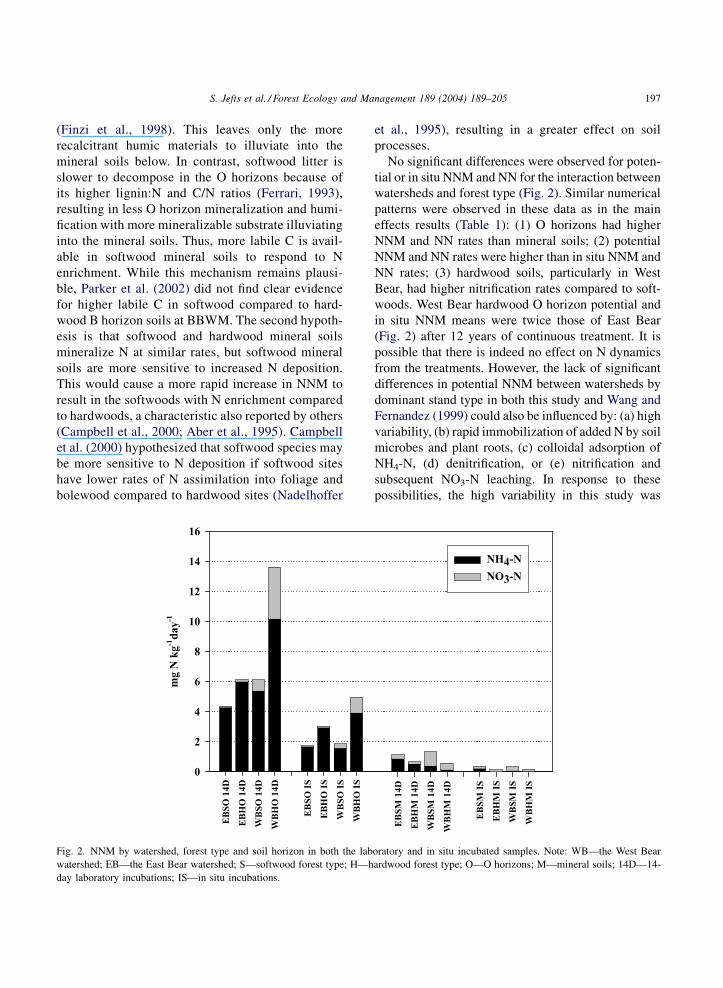
No significant differences were observed for poten-
tial or in situ NNM and NN for the interaction between
watersheds and forest type (Fig. 2). Similar numerical
patterns were observed in these data as in the main
effects results (Table 1): (1) O horizons had higher
NNM and NN rates than mineral soils; (2) potential
NNM and NN rates were higher than in situ NNM and
NN rates; (3) hardwood soils, particularly in West
Bear, had higher nitrification rates compared to soft-
woods. West Bear hardwood O horizon potential and
in situ NNM means were twice those of East Bear
(Fig. 2) after 12 years of continuous treatment. It is
possible that there is indeed no effect on N dynamics
from the treatments. However, the lack of significant
differences in potential NNM between watersheds by
dominant stand type in both this study and Wang and
Fernandez (1999) could also be influenced by: (a) high
variability, (b) rapid immobilization of added N by soil
microbes and plant roots, (c) colloidal adsorption of
NH4-N, (d) denitrification, or (e) nitrification and
subsequent NO3-N leaching. In response to these
possibilities, the high variability in this study was
EB
SO 1
4D
EB
HO
14D
WB
SO 1
4D
WB
HO
14D
EB
SO I
S
EB
HO
IS
WB
SO I
S
WB
HO
IS
mg
N k
g-1da
y-1
0
2
4
6
8
10
12
14
16
NH4-N
NO3-N
EB
SM 1
4D
EB
HM
14D
WB
SM 1
4D
WB
HM
14D
EB
SM I
S
EB
HM
IS
WB
SM I
S
WB
HM
IS
Fig. 2. NNM by watershed, forest type and soil horizon in both the laboratory and in situ incubated samples. Note: WB—the West Bear
watershed; EB—the East Bear watershed; S—softwood forest type; H—hardwood forest type; O—O horizons; M—mineral soils; 14D—14-
day laboratory incubations; IS—in situ incubations.
S. Jefts et al. / Forest Ecology and Management 189 (2004) 189–205 197
evident by the large standard deviations of the mean
(120% of the mean for the 14-day laboratory incuba-
tions and 160% of the mean for the in situ incuba-
tions). Immobilization by soil microbes and plant
roots was not in the scope of this study; however,
there was evidence for this immobilization mechanism
in both soil biota based on previous work at BBWM
(White et al., 1999; Nadelhoffer et al., 1999). Ammo-
nium fixation in clays is likely insignificant in these
sandy loam Spodosols, but given the high CEC of the
O horizons at BBWM as well as the greater exchange-
able NH4-N in the West Bear watershed, it is probable
that there was adsorptive retention of NH4-N. Unfor-
tunately, there is no denitrification data from BBWM
at this time although research is ongoing to address
this question. Ample evidence exists of both increased
nitrification and NO3-N leaching in the treated
watershed streams at BBWM (Kahl et al., 1999).
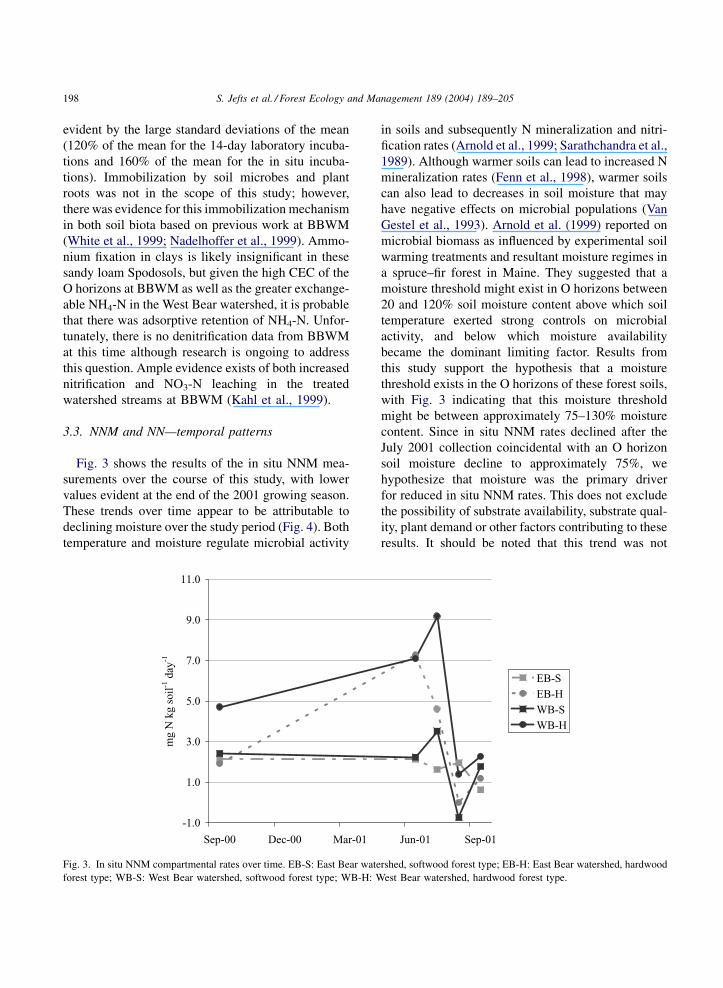
3.3. NNM and NN—temporal patterns
Fig. 3 shows the results of the in situ NNM mea-
surements over the course of this study, with lower
values evident at the end of the 2001 growing season.
These trends over time appear to be attributable to
declining moisture over the study period (Fig. 4). Both
temperature and moisture regulate microbial activity
in soils and subsequently N mineralization and nitri-
fication rates (Arnold et al., 1999; Sarathchandra et al.,
1989). Although warmer soils can lead to increased N
mineralization rates (Fenn et al., 1998), warmer soils
can also lead to decreases in soil moisture that may
have negative effects on microbial populations (Van
Gestel et al., 1993). Arnold et al. (1999) reported on
microbial biomass as influenced by experimental soil
warming treatments and resultant moisture regimes in
a spruce–fir forest in Maine. They suggested that a
moisture threshold might exist in O horizons between
20 and 120% soil moisture content above which soil
temperature exerted strong controls on microbial
activity, and below which moisture availability
became the dominant limiting factor. Results from
this study support the hypothesis that a moisture
threshold exists in the O horizons of these forest soils,
with Fig. 3 indicating that this moisture threshold
might be between approximately 75–130% moisture
content. Since in situ NNM rates declined after the
July 2001 collection coincidental with an O horizon
soil moisture decline to approximately 75%, we
hypothesize that moisture was the primary driver
for reduced in situ NNM rates. This does not exclude
the possibility of substrate availability, substrate qual-
ity, plant demand or other factors contributing to these
results. It should be noted that this trend was not
-1.0
1.0
3.0
5.0
7.0
9.0
11.0
Sep-00 Dec-00 Mar-01 Jun-01 Sep-01
mg
N k
g s
oil
-1 d
ay
-1
EB-S
EB-H
WB-S
WB-H
Fig. 3. In situ NNM compartmental rates over time. EB-S: East Bear watershed, softwood forest type; EB-H: East Bear watershed, hardwood
forest type; WB-S: West Bear watershed, softwood forest type; WB-H: West Bear watershed, hardwood forest type.
198 S. Jefts et al. / Forest Ecology and Management 189 (2004) 189–205
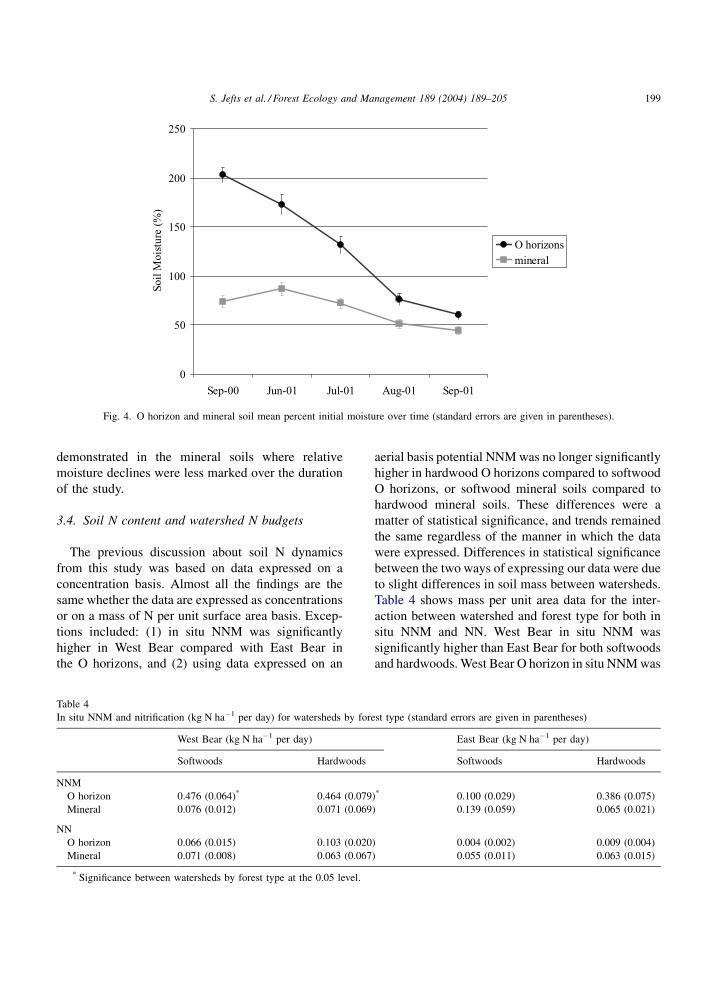
demonstrated in the mineral soils where relative
moisture declines were less marked over the duration
of the study.
3.4. Soil N content and watershed N budgets
The previous discussion about soil N dynamics
from this study was based on data expressed on a
concentration basis. Almost all the findings are the
same whether the data are expressed as concentrations
or on a mass of N per unit surface area basis. Excep-
tions included: (1) in situ NNM was significantly
higher in West Bear compared with East Bear in
the O horizons, and (2) using data expressed on an
aerial basis potential NNM was no longer significantly
higher in hardwood O horizons compared to softwood
O horizons, or softwood mineral soils compared to
hardwood mineral soils. These differences were a
matter of statistical significance, and trends remained
the same regardless of the manner in which the data
were expressed. Differences in statistical significance
between the two ways of expressing our data were due
to slight differences in soil mass between watersheds.
Table 4 shows mass per unit area data for the inter-
action between watershed and forest type for both in
situ NNM and NN. West Bear in situ NNM was
significantly higher than East Bear for both softwoods
and hardwoods. West Bear O horizon in situ NNM was
0
50
100
150
200
250
Sep-00 Jun-01 Jul-01 Aug-01 Sep-01
So
il M
ois
ture
(%
)
O horizons
mineral
Fig. 4. O horizon and mineral soil mean percent initial moisture over time (standard errors are given in parentheses).
Table 4
In situ NNM and nitrification (kg N ha�1 per day) for watersheds by forest type (standard errors are given in parentheses)
West Bear (kg N ha�1 per day) East Bear (kg N ha�1 per day)
Softwoods Hardwoods Softwoods Hardwoods
NNM
O horizon 0.476 (0.064)* 0.464 (0.079)* 0.100 (0.029) 0.386 (0.075)
Mineral 0.076 (0.012) 0.071 (0.069) 0.139 (0.059) 0.065 (0.021)
NN
O horizon 0.066 (0.015) 0.103 (0.020) 0.004 (0.002) 0.009 (0.004)
Mineral 0.071 (0.008) 0.063 (0.067) 0.055 (0.011) 0.063 (0.015)
* Significance between watersheds by forest type at the 0.05 level.
S. Jefts et al. / Forest Ecology and Management 189 (2004) 189–205 199
�5� East Bear for softwoods but only �1.2� for
hardwoods. Using the in situ NNM method, we
detected a treatment response that suggested a greater
apparent increase in softwood O horizon soil NNM as
compared to those under hardwoods. This suggests
that softwood soils may be more responsive than
hardwood soils to changes in N inputs after 12 years
of treatment. This is in contrast to results from earlier
in the BBWM program where, after 3 years of treat-
ment, it appeared that hardwood O horizons were
more responsive than softwoods (Wang and Fernan-
dez, 1999).
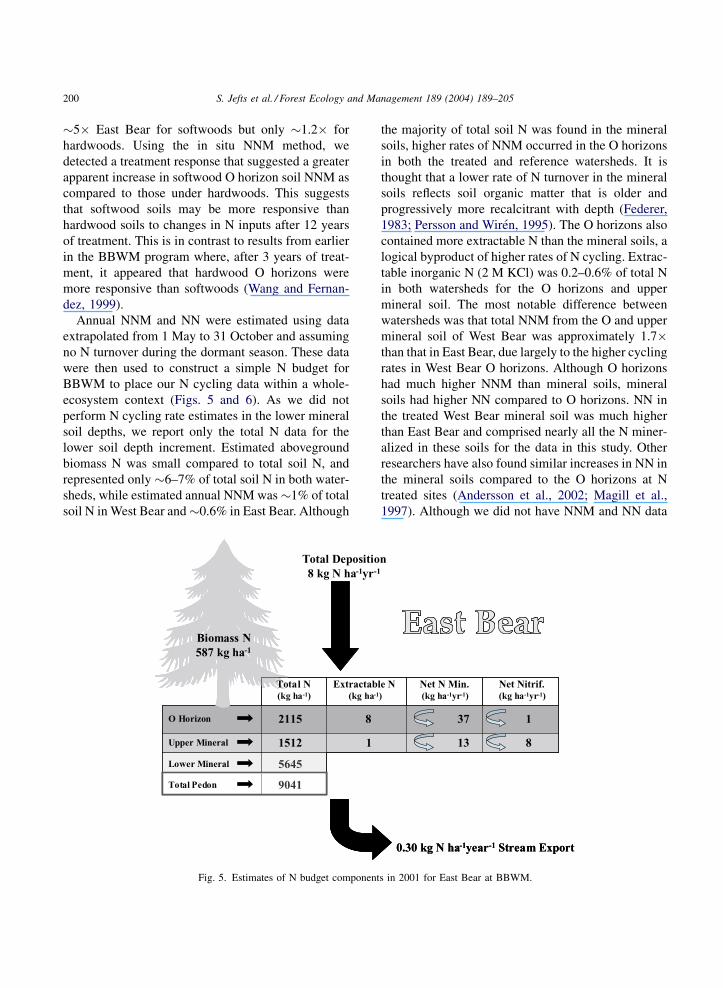
Annual NNM and NN were estimated using data
extrapolated from 1 May to 31 October and assuming
no N turnover during the dormant season. These data
were then used to construct a simple N budget for
BBWM to place our N cycling data within a whole-
ecosystem context (Figs. 5 and 6). As we did not
perform N cycling rate estimates in the lower mineral
soil depths, we report only the total N data for the
lower soil depth increment. Estimated aboveground
biomass N was small compared to total soil N, and
represented only �6–7% of total soil N in both water-
sheds, while estimated annual NNM was �1% of total
soil N in West Bear and �0.6% in East Bear. Although
the majority of total soil N was found in the mineral
soils, higher rates of NNM occurred in the O horizons
in both the treated and reference watersheds. It is
thought that a lower rate of N turnover in the mineral
soils reflects soil organic matter that is older and
progressively more recalcitrant with depth (Federer,
1983; Persson and Wiren, 1995). The O horizons also
contained more extractable N than the mineral soils, a
logical byproduct of higher rates of N cycling. Extrac-
table inorganic N (2 M KCl) was 0.2–0.6% of total N
in both watersheds for the O horizons and upper
mineral soil. The most notable difference between
watersheds was that total NNM from the O and upper
mineral soil of West Bear was approximately 1.7�than that in East Bear, due largely to the higher cycling
rates in West Bear O horizons. Although O horizons
had much higher NNM than mineral soils, mineral
soils had higher NN compared to O horizons. NN in
the treated West Bear mineral soil was much higher
than East Bear and comprised nearly all the N miner-
alized in these soils for the data in this study. Other
researchers have also found similar increases in NN in
the mineral soils compared to the O horizons at N
treated sites (Andersson et al., 2002; Magill et al.,
1997). Although we did not have NNM and NN data
Fig. 5. Estimates of N budget components in 2001 for East Bear at BBWM.
200 S. Jefts et al. / Forest Ecology and Management 189 (2004) 189–205

for the lower mineral soils for these ecosystem N
estimates, we expect the majority of the N turnover
to be attributable to upper soil increments as has been
reported elsewhere (Federer, 1983; Persson and
Wiren, 1995). Nevertheless, these estimates of
NNM and NN did not encompass the entire pedon
and are for perspective only. It is also worthy to note
these estimates assume no N cycling beyond the
growing season of northern New England, and are
therefore likely to be an underestimate of N cycling.
The data reported here appear consistent with simi-
lar forest soil N data reported in the literature. Lit-
erature values for total soil N range from 1034 and
2275 kg N ha�1 for a low elevation spruce–fir forest in
Howland, Maine (Fernandez et al., 1993), to 1932 and
877 kg N ha�1 in the O horizon and mineral soil,
respectively, for the Adirondack Region of New York
(Mitchell et al., 2001). Federer (1983) reported the
total N in a softwood stand in Maine was 1802 and
3224 kg N ha�1, and NNM was 15 and 27 kg N ha�1
per year, for O horizons and mineral soils, respec-
tively. Cole and Rapp (1981) analyzed data from 14
sites included in the International Biological Program
(IBP) from around the world and found temperate
coniferous forest soils averaged 6821 kg N ha�1
and temperate deciduous forest soils averaged
5177 kg N ha�1. Devito et al. (1999) reported NNM
values for O horizons in Canadian soils ranged from
114 kg N ha�1 per year for deciduous forest types to
140 kg N ha�1 per year for mixed conifer forest types.
They also reported N mineralization rates of 52 and
46 kg N ha�1 per year for deciduous and mixed forest
types, respectively, in the upper 10 cm of the mineral
soils, which is �4 times than that at BBWM. In their
measurements of annual NNM, they included the
winter months for which they reported high rates of
NNM (49–92% of annual NNM). It will be important
in future research to better define dormant season
forest soil N dynamics across a range of climatic
regimes for northern forest types.
Input–output estimates showed that �20% of the
total N inputs were exported annually in West Bear
stream after 12 years of treatments, while this figure
was �4% in the reference East Bear stream. Therefore
�80% of total input N was still retained in West
Bear, despite the long-term N amendments to this
watershed. Other investigators in both Europe and
US have reported high retention of inorganic N even
after experimental N additions in forested ecosystems.
Bergholm and Majdi (2001) reported 93% retention of
Fig. 6. Estimates of N budget components in 2001 for West Bear at BBWM.
S. Jefts et al. / Forest Ecology and Management 189 (2004) 189–205 201
N inputs in a Norway spruce stand in Sweden treated
with (NH4)2SO4, and 96% retention for their reference
watershed. They suggested that the spruce stand had a
relatively high capacity to accumulate N due to high
aboveground production. Mitchell et al. (1996b)
reported that an untreated watershed in the Adiron-
dack State Park of New York retained 74% of
wet inputs of N. Similarly, Magill et al. (1997)
observed that 85–99% of varying N additions
(50 and 150 kg N ha�1 per year of NH4NO3) were
retained at the Harvard Forest in Massachusetts.
Despite NO3-N leaching in the softwood site at Har-
vard Forest occurring fairly early in the study, these
soils were still retaining greater than 90% of very high
N amendments. It must be noted that none of these
studies measured gaseous loss, ostensibly by way of
denitrification, which may modify these estimates of
N retention. Even so, it is likely that under moderate N
treatments these forest soils have both a large potential
for further accumulation of N, mostly in soil N pools,
and a high susceptibility for accelerated N mineraliza-
tion, nitrification, and NO3-N export in soil solutions
and streams.
4. Conclusions
Our results indicate that after 12 years of whole-
watershed experimental N enrichment, the West Bear
watershed demonstrated higher rates of NNM and
NN consistent with the evolution of N saturation.
While the majority of the soil N pool is in the mineral
soil, higher rates of N mineralization as determined
by NNM assays are in the O horizon. It is the O
horizon that shows the greatest response to enhanced
N deposition. Watershed retention of N input was
still nearly 80% in the treated watershed and over
95% in the reference watershed, indicating a signifi-
cant potential in both watersheds for continued N
accumulation. Perhaps of greater importance are the
changes in N dynamics within the treated watershed
that are developing over time. These results indicate
that the rapid changes in N dynamics evident early in
the BBWM experiment (Wang and Fernandez, 1999)
continue but are evolving. With chronically elevated
N inputs, soils under the softwood forest types have
recently begun to respond to treatments, as indicated
by changes in N cycling rates, whereas hardwood
soils were first to respond to treatments earlier in the
experiment. We note that there are important differ-
ences in the response attributable to surface O and
subsoil mineral horizons for different forest types.
We believe that the type and availability of carbon
under these two forest cover types may be driving
the differences we see in soil horizons. Nitrification
is becoming increasingly important in the overall
NNM of the treated soils as might be expected. The
findings from this whole-watershed N enrichment
experiment are generally consistent with current
concepts of N saturation and N cycling in forested
watersheds. Yet they also indicate the need to better
understand the interactions between C and N that
relate to forest type and impinge upon deeper,
mineral soil layers as N saturation evolves on dec-
adal time scales.
Acknowledgements
The authors extend their sincere thanks to the
Institute of Ecosystem Studies for their financial sup-
port, analyses and collaboration. This research is
possible due to the support and collaboration of Inter-
national Paper, Inc., and the US Environmental Pro-
tection Agency (contract no.: 425/7233). The authors
also thank Amy Jones, Blanka Peridot, Cullen Wilson,
Lara Smart, Bruce Hoskins and Cheryl Spencer for
their invaluable help in both the field and laboratory.
This is Maine Agricultural and Forest Experiment
Station publication no. 2653.
References
Aber, J.D., 1993. Modification of nitrogen cycling at the regional
scale: the subtle effects of atmospheric deposition. In:
McDonnell, M., Pickett, S.T.A. (Eds.), Humans as Components
of Ecosystems. Springer, New York, NY, pp. 163–174.
Aber, J.D., Nadelhoffer, K.J., Steudler, P., Melillo, J.M., 1989.
Nitrogen saturation in northern forest ecosystems. BioScience
39, 378–386.
Aber, J.D., Magill, A., Boone, R., 1993. Plant and soil responses to
chronic nitrogen additions at the Harvard Forest, Massachu-
setts. Ecol. Appl. 3, 156–166.
Aber, J.D., Magill, A., McNulty, S.G., Boone, R.D., Nadelhoffer,
K.J., Downs, M., Hallett, R., 1995. Forest biogeochemistry and
primary production altered by nitrogen status. Water Air Soil
Pollut. 85, 1665–1670.
202 S. Jefts et al. / Forest Ecology and Management 189 (2004) 189–205
Aber, John D., Mellilo, M., 1991. Terrestrial ecosystems. Saunders
College Publishing, Philadelphia, Pennsylvania, USA.
Aber, J., McDowell, W., Nadelhoffer, K., Magill, A., Berntson, G.,
Kamakea, M., McNulty, S., Currie, W., Rustad, L., Fernandez,
I., 1998. Nitrogen saturation in temperate forest ecosystems—
hypotheses revisited. BioScience 11, 921–934.
Adams, M.B., Angradi, T.R., Kochenderfer, J.N., 1997. Stream
water and soil solution responses to 5 years of nitrogen and
sulfur additions at the Fernow Experimental Forest, West
Virginia. For. Ecol. Manage. 95, 79–91.
Agren, G.I., Bosatta, E., 1988. Nitrogen saturation of terrestrial
ecosystems. Environ. Pollut. 54, 185–197.
Andersson, P., Berggren, D., Nilsson, I., 2002. Indices for nitro-
gen status and nitrate leaching from Norway spruce (Picea
abies (L.) Karst.) stands in Sweden. For. Ecol. Manage. 157,
39–53.
Arnold, S.S., Fernandez, I.J., Rustad, L.E., Zibilske, L.M., 1999.
Microbial response of an acid forest soil to experimental soil
warming. Biol. Fert. Soils 30, 239–244.
Bergholm, J., Majdi, H., 2001. Accumulation of nutrients in above
and below ground biomass in response to ammonium sulfate
addition in a Norway spruce stand in southwest Sweden. Water
Air Soil Pollut. 130, 1049–1054.
Blair, J.M., Parmelee, R.W., Beare, M.H., 1990. Decay rates,
nitrogen fluxes, and decomposer communities of single- and
mixed-species foliar litter. Ecology 71, 1976–1985.
Campbell, J.L., Eagar, C., McDowell, W.H., Hornbeck, J.W.,
2000. Analysis of nitrogen dynamics in the Lye Brook
Wilderness Area, Vermont, USA. Water Air Soil Pollut. 122,
63–75.
Christ, M.J., Peterjohn, W.T., Cumming, J.R., Adams, M.B., 2002.
Nitrification potentials and landscape, soil and vegetation
characteristics in two central Appalachian watersheds differing
in NO3� export. For. Ecol. Manage. 159, 145–158.
Cole, D.W., Rapp, M., 1981. Elemental cycling in forest
ecosystems. In: Reichle, D.E. (Ed.), Dynamic Properties of
Forest Ecosystems. Cambridge University Press, Cambridge,
pp. 341–409.
Devito, K.J., Westbrook, C.J., Schiff, S.L., 1999. Nitrogen
mineralization and nitrification in upland and peatland forest
soils in two Canadian shield catchments. Can. J. For. Res. 29,
1793–1804.
Dise, N.B., Wright, R.F., 1992. The NITREX project (nitrogen
saturation experiments). Ecosystem Research Report 2. Com-
mission of the European Communities, Brussels, 101 pp.
Dise, N.B., Wright, R.F., 1995. Nitrogen leaching from European
forests in relation to nitrogen deposition. For. Ecol. Manage.
71, 153–161.
Dise, N.B., Matzner, E., Forsius, M., 1998. Evaluation of organic
horizon C:N ratio as an indicator of nitrate leaching in conifer
forests across Europe. Environ. Pollut. 102 (S1), 453–456.
Driscoll, C.T., Yan, C., Schofield, C.L., Munson, R., Holsapple, J.,
1994. The mercury cycle and fish in the Adirondack lakes.
Environ. Sci. Technol. 28, 136A–143A.
Eckhoff, J.D., 2000. Efficacy of forest health monitoring indicators
to evince impacts on a chemically manipulated watershed.
Doctoral Thesis. University of Maine, Orono, ME, 318 pp.
Eno, C.F., 1960. Nitrate production in the field by incubation
the soil in polyethylene bags. Soil Sci. Soc. Proc. 24, 277–
279.
Federer, C.A., 1983. Nitrogen mineralization and nitrification:
depth variation in four New England forest soils. Soil Sci. Soc.
Am. J. 47, 1008–1014.
Fenn, M.E., Poth, M.A., Aber, J.D., Baron, J.S., Bormann, B.T.,
Johnson, D.W., Lemly, A.D., McNulty, S.G., Ryan, D.F.,
Stottlemyer, R., 1998. Nitrogen excess in North American
ecosystems: predisposing factors, ecosystem responses, and
management strategies. Ecol. Appl. 8, 706–733.
Fernandez, I.J., Adams, M.B., 2000. Nitrogen saturation: an
experimental approach at the watershed scale. In: Mickler, R.,
Birdsey, R., Hom, J. (Eds.), Responses of Northern US
Forests to Environmental Change. Springer, New York,
pp. 333–355.
Fernandez, I.J., Rustad, L.E., Lawrence, G.B., 1993. Estimating
total soil mass, nutrient content, and trace metals in soils
under a low elevation spruce–fir forest. Can. J. Soil Sci. 73,
317–328.
Fernandez, I.J., Simmons, J.A., Briggs, R.D., 2000. Indices of
forest floor nitrogen status along a climate gradient in Maine,
USA. For. Ecol. Manage. 134, 177–187.
Fernandez, I.J., Rustad, L.E., Norton, S.A., Kahl, J.S., Cosby, B.J.,
2003. Experimental acidification causes soil base cation
depletion in a New England forested watershed. Soil Sci.
Soc. Am. J. 6, in press.
Ferrari, J.B., 1993. Spatial patterns of leaf litterfall, nitrogen
cycling and understory vegetation in a hemlock–hardwood
forest. Ph.D. Dissertation. University of Minnesota, St. Paul,
MN, USA.
Finzi, A.C., Van Breeman, N., Canham, C.D., 1998. Canopy tree–
soil interactions within temperate forests: species effects on soil
carbon and nitrogen. Ecol. Appl. 8, 440–446.
Frazer, D.W., McColl, J.G., Powers, R.F., 1990. Soil nitrogen
mineralization in a clearcutting chronosequence in a northern
California conifer forest. Soil Sci. Soc. Am. J. 54, 1145–
1152.
Galloway, J.N., Schlesinger, W.H., Levy II, H., Michaels, A.,
Schnoor, J.L., 1995. Nitrogen fixation: anthropogenic enhance-
ment–environmental response. Glob. Biogeochem. Cycl. 9,
235–252.
Gilliam, F.S., Adams, M.B., Yurish, B.M., 1996. Ecosystem
nutrient responses to chronic nitrogen inputs at Fernow
Experimental Forest, West Virginia. Can. J. For. Res. 26,
196–205.
Gilliam, F.S., Yurish, B.M., Adams, M.B., 2001. Temporal and
spatial variation of nitrogen transformations in nitrogen-
saturated soils of a central Appalachian hardwood forest.
Can. J. For. Res. 31, 1768–1785.
Goodale, C.L., Aber, J.D., 2001. The long-term effects of land-use
history on nitrogen cycling in northern hardwood forests. Ecol.
Appl. 11, 253–267.
Goodale, C.L., Aber, J.D., McDowell, W.H., 2000. The long-term
effects of disturbance on organic and inorganic nitrogen export
in the White Mountains, New Hampshire. Ecosystems 3,
433–450.
S. Jefts et al. / Forest Ecology and Management 189 (2004) 189–205 203
Gower, S.T., Son, Y., 1992. Differences in soil and leaf litterfall
nitrogen dynamics for five forest plantations. Soil Sci. Soc. Am.
J. 56, 1959–1966.
Gunderson, P., 1995. Nitrogen deposition and leaching from
European forests—preliminary results from a data compilation.
Water Air Soil Pollut. 85, 1179–1184.
Gunderson, P., Callesen, I., de Vries, W., 1998. Nitrate leaching in
forest ecosystems is related to forest floor C/N ratios. Environ.
Pollut. 102 (S1), 403–407.
Hart, S.C., Stark, J.M., Davidson, E.A., Firestone, M.K., 1994.
Nitrogen mineralization, immobilization, and nitrification.
In: Weaver, R.W., Angle, S., Bottomley, P., Bezdicek, D.,
Smith, S., Tabatabi, A., Wollum, A. (Eds.), Methods of Soil
Analysis. Part 2. Microbiological and Biochechemical Proper-
ties. Soil Science Society of America, Madison, WI, pp. 985–
1018.
Hendershot, W.H., Lalande, L., Duquette, M., 1993. Soil reaction
and exchangeable acidity. In: Carter, M.R. (Ed.), Soil Sampling
and Methods of Analysis. Lewis Publishers, Boca Raton, FL,
pp. 141–145.
Henriksen, A., Hessen, D.O., 1997. Whole catchment studies on
nitrogen cycling: nitrogen from mountains to fjords. Ambio 26,
254–257.
Kahl, J., Norton, S., Fernandez, I., Rustad, L., Handley, M., 1999.
Nitrogen and sulfur input–output budgets in the experimental
and reference watersheds, Bear Brook watershed in Maine
(BBWM). Environ. Monit. Assess. 55, 113–131.
Koopmans, C.J., Lubrecht, W.C., Tietema, A., 1995. Nitrogen
transformations in two nitrogen saturated forest ecosystems
subjected to an experimental decrease in nitrogen deposition.
Plant Soil 175, 205–218.
Lawrence, G.B., David, M.B., 1997. Response of aluminum
solubility to elevated nitrification in soil of a red spruce stand
in eastern Maine. Environ. Sci. Technol. 31, 825–830.
Likens, G.E., Bormann, F., Pierce, R.S., Eaton, J.S., Johnson, N.M.,
1977. Biogeochemistry of a Forested Ecosystem. Springer,
New York, 146 pp.
Lovett, G.M., Rueth, H., 1999. Soil nitrogen transformations in
beech and maple stands along a nitrogen deposition gradient.
Ecol. Appl. 9, 1330–1334.
Magill, A.H., Aber, J.D., Hendricks, J.J., Bowden, R.D., Melillo,
J.M., Steudler, P.A., 1997. Biogeochemical response of forest
ecosystems to simulated chronic nitrogen deposition. Ecol.
Appl. 7, 402–415.
McNulty, S.G., Aber, J.D., 1993. Effects of chronic nitrogen
additions on nitrogen cycling in a high elevation spruce–fir
stand. Can. J. For. Res. 23, 1252–1263.
McNulty, S.G., Aber, J.D., Boone, R.D., 1991. Spatial changes in
forest floor and foliar chemistry of spruce–fir forests across
New England. Biogeochemistry 14, 13–29.
McNulty, S.G., Aber, J.D., Newman, S.D., 1996. Nitrogen
saturation in a high elevation New England spruce–fir stand.
For. Ecol. Manage. 84, 109–121.
Mitchell, M.J., Driscoll, C.T., Kahl, J.S., Likens, G.E., Murdoch,
P.S., Pardo, L.H., 1996a. Climatic control of nitrate loss from
forested watersheds in the northeast United States. Environ.
Sci. Technol. 30, 2609–2612.
Mitchell, M.J., Raynal, D.J., Driscoll, C.T., 1996b. Biogeochem-
istry of a forested watershed in the central Adirondack
Mountains: temporal changes and mass balances. Water Air
Soil Pollut. 88, 355–369.
Mitchell, M.J., Driscoll, C.T., Owen, J.S., Schaefer, D., Michener,
R., Raynal, D., 2001. Nitrogen biogeochemistry of three
hardwood ecosystems in the Adirondack region of New York.
Biogeochemistry 56, 93–133.
Mohn, J.A., Schurmann, F., Hagedorn, P., Schleppi, Bachofen, R.
2000. Increased rates of denitrification in nitrogen-treated
forest soils. For. Ecol. Manage. 137, 113–119.
Murdoch, P.S., Stoddard, J.L., 1992. The role of nitrate in the
acidification of streams in the Catskill Mountains of New York.
Water Resour. Res. 28, 2707–2720.
Nadelhoffer, K.N., Downs, M.R., Fry, B., Aber, J.D., Magill, A.H.,
Melillo, J.M., 1995. The fate of 15N-labelled nitrate additions to
a northern hardwood forest in eastern Maine, USA. Oecologia
103, 292–301.
Nadelhoffer, K., Downs, M., Fry, B., Magill, A., Aber, J., 1999.
Controls on N retention and exports in a forested watershed.
Environ. Monit. Assess. 55, 187–210.
Norton, S., Kahl, J., Fernandez, I., Haines, T., Rustad, L., Nodvin,
S., Scofield, J., Strickland, T., Erickson, H., Wigington Jr., P.,
Lee, J., 1999. The Bear Brook Watershed, Maine (BBWM),
USA. Environ. Monit. Assess. 55, 7–51.
Ollinger, S.V., Smith, M.L., Martin, M.E., Hallett, R.A., Goodale,
C.L., Aber, J.D., 2002. Regional variation in foliar chemistry
and N cycling among forests of diverse history and composi-
tion. Ecology 83, 339–355.
Parker, J.L., Fernandez, I.J., Rustad, L.E., Norton, S.A., 2002. Soil
C fractions in experimental forested watersheds. Water Air Soil
Pollut. 138, 101–121.
Pastor, J., Post, W.M., 1988. Response of northern forests to CO2-
induced climate change. Nature 334, 55–58.
Persson, T., Wiren, A., 1995. Nitrogen mineralization and potential
nitrification at different depths in acid forest soils. Plant Soil
168/169, 55–65.
Peterjohn, W.T., Melillo, J.M., Steudler, P.A., Newkirk, K.M.,
Bowles, S.T., Aber, J.D., 1994. Responses of trace gas fluxes
and N availability to experimentally elevated soil temperatures.
Ecol. Appl. 4, 617–625.
Peterjohn, W.T., Foster, C.J., Christ, M.J., Adams, M.B., 1999.
Patterns of nitrogen availability within a forested watershed
exhibiting symptoms of nitrogen saturation. For. Ecol. Manage.
119, 247–257.
Rasmussen, L., Beier, C., van Breemen, N., de Visser, P., Kreutzer,
K., Schierl, R., Matzner, E., Farrell, E.P., 1990. Study on acid
deposition effects by manipulating forest ecosystems. EX-
MAN—Experimental MANipulation of forest ecosystems in
Europe. Air Pollution Research Report 24. Commission of the
European Communities, Brussels, 42 pp.
Rustad, L.E., Melillo, J.M., Mitchell, M.J., Fernandez,
I.J., Steudler, P.A., McHale, P.J., 2000. Effects of soil
warming on C and N cycling in northern US forest soils. In:
Mickler, R., Birdsey, R., Hom, J. (Eds.), Responses of
Northern US Forests to Environmental Change. Springer,
New York.
204 S. Jefts et al. / Forest Ecology and Management 189 (2004) 189–205
Sarathchandra, S.U., Perrot, K.W., Littler, R.A., 1989. Soil
microbial biomass: influence of simulated temperature changes
on size, activity and nutrient content. Soil Biol. Biochem. 21,
987–993.
SAS Institute, 1999–2000. The SAS System for Windows Version
4.9. SAS Institute, Inc., Cary, NC, USA.
Schlesinger, W.H., 1997. Biogeochemistry: An Analysis of Global
Change. Academic Press, California, 588 pp.
Spalding, R.F., Exner, M.E., 1993. Occurrence of nitrate in ground-
water—a review. J. Environ. Qual. 22, 392–402.
Torseth, K., Semb, A., 1997. Atmospheric deposition of nitrogen,
sulfur, and chloride in two watersheds located in southern
Norway. Ambio 26, 258–265.
Van Gestel, M., Merckx, R., Vlassak, K., 1993. Microbial biomass
and activity in soil with fluctuating water contents. Geoderma
56, 617–626.
Vitousek, P.M., Gosz, J.R., Grier, C.C., Melillo, J.M., Reiners, W.A.,
1982. A comparative analysis of potential nitrification and nitrate
mobility in forest ecosystems. Ecol. Monogr. 52, 155–177.
Wang, Z., Fernandez, I., 1999. Soil type and forest vegetation influ-
ences on forest floor nitrogen dynamics at the Bear Brook Water-
shed in Maine (BBWM). Environ. Monit. Assess. 55, 221–234.
White, G., Fernandez, I., Wiersma, G., 1999. Impacts of
ammonium sulfate treatment on the foliar chemistry of forest
trees at the Bear Brook Watershed in Maine. Environ. Monit.
Assess. 55, 235–250.
S. Jefts et al. / Forest Ecology and Management 189 (2004) 189–205 205