Atlas of Early Cretaceous Paleogeographic Maps
14
Transcript of Atlas of Early Cretaceous Paleogeographic Maps
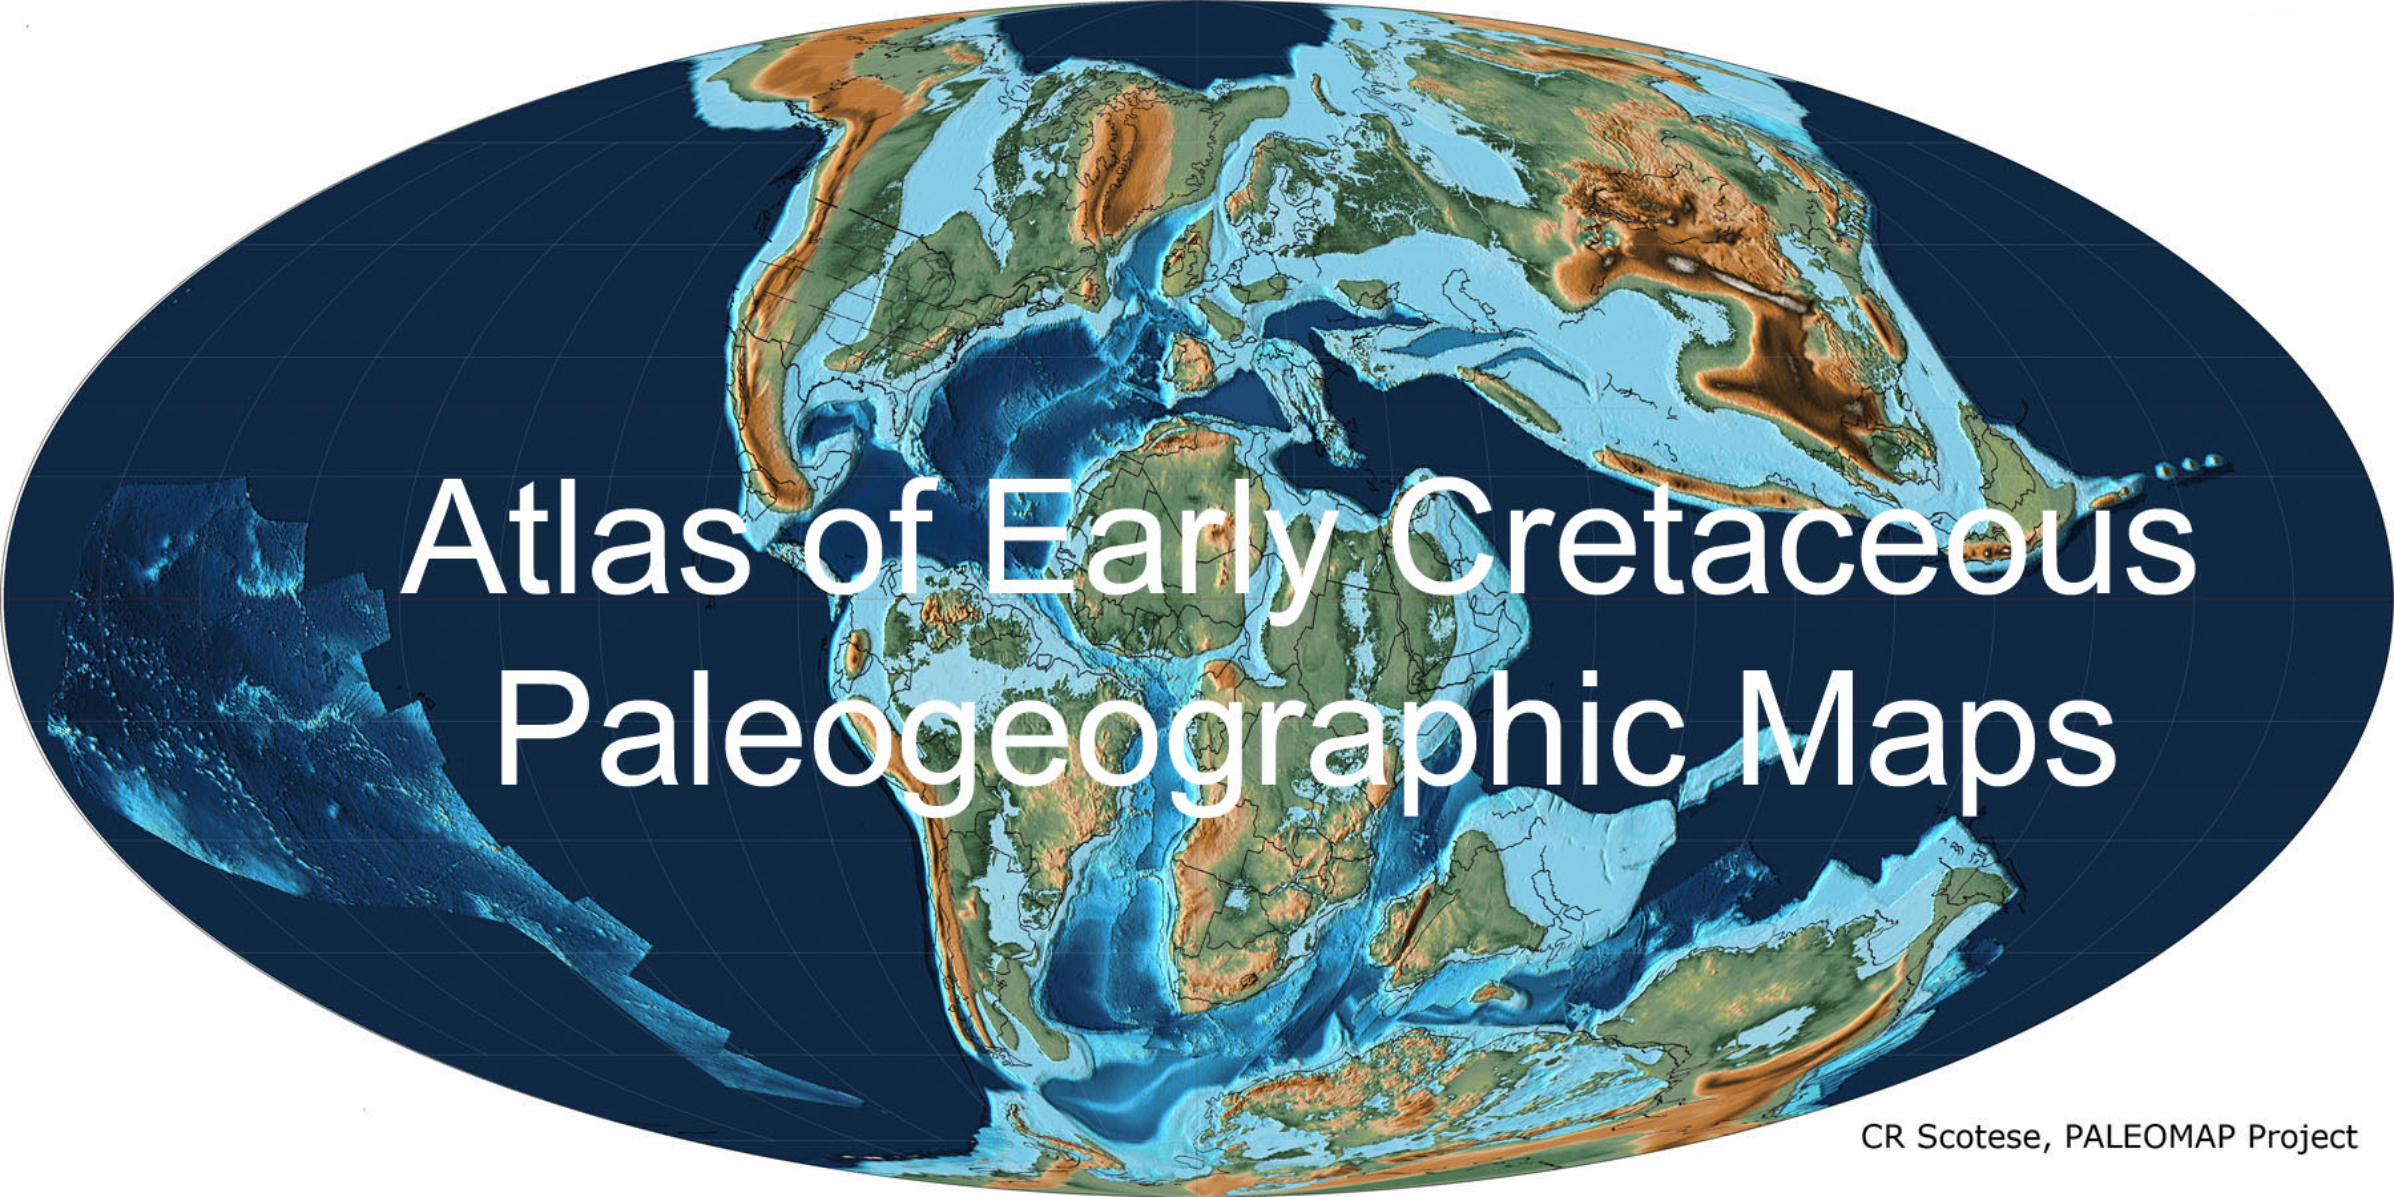
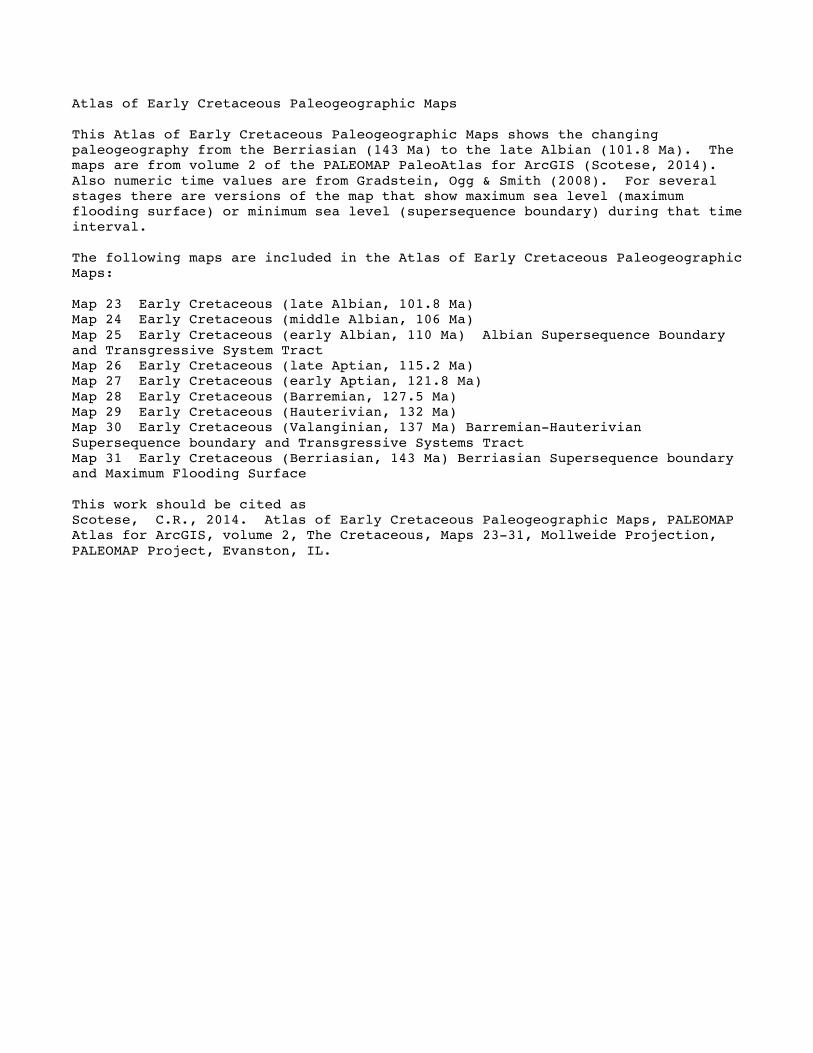
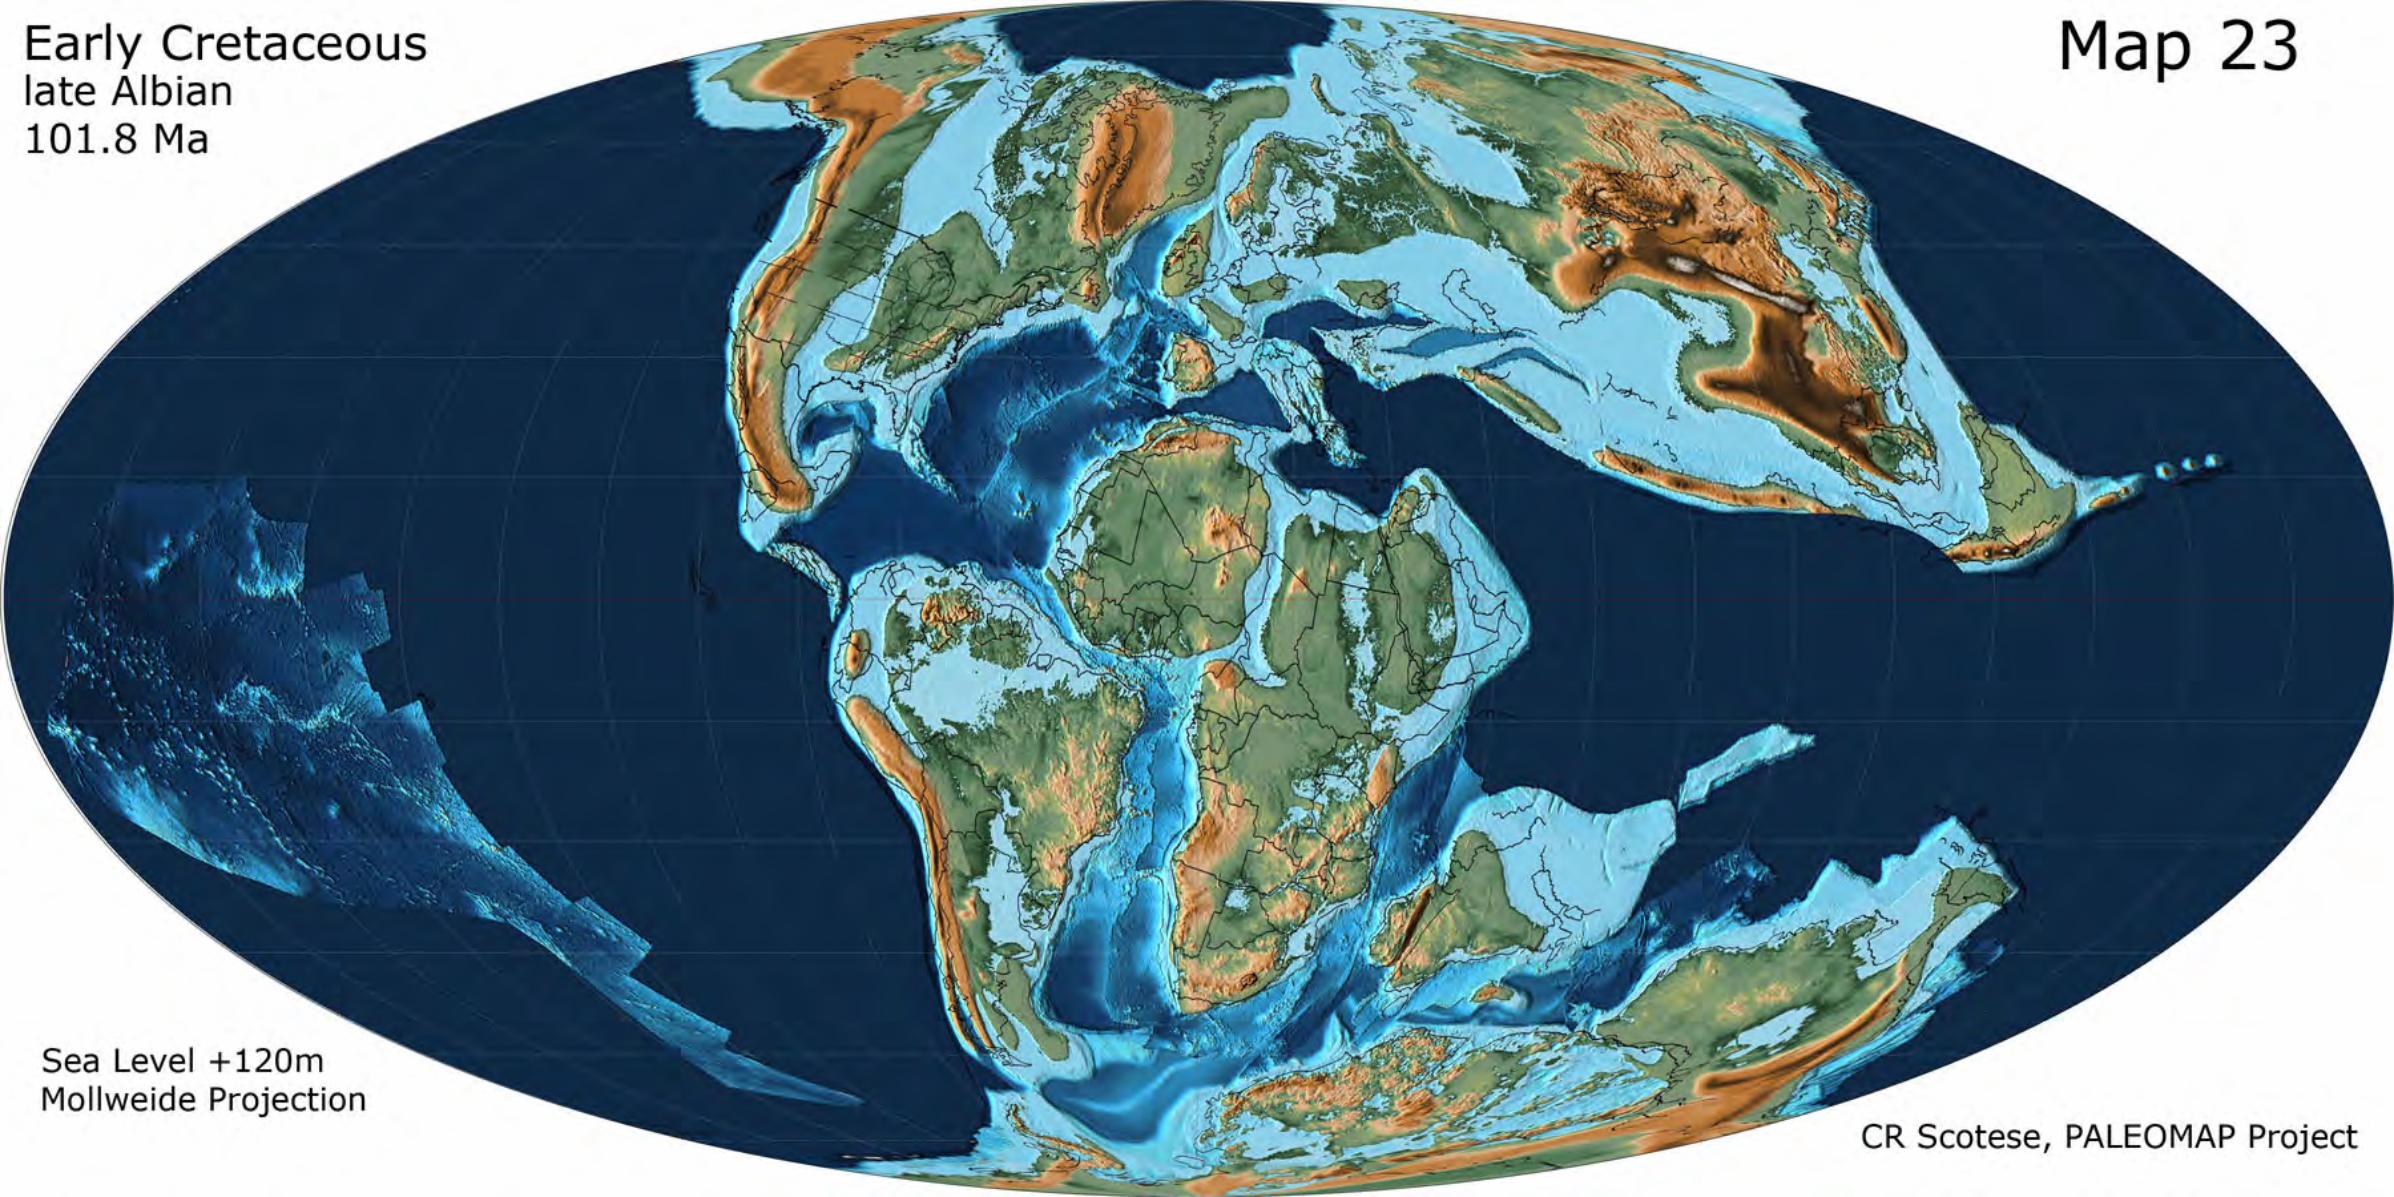
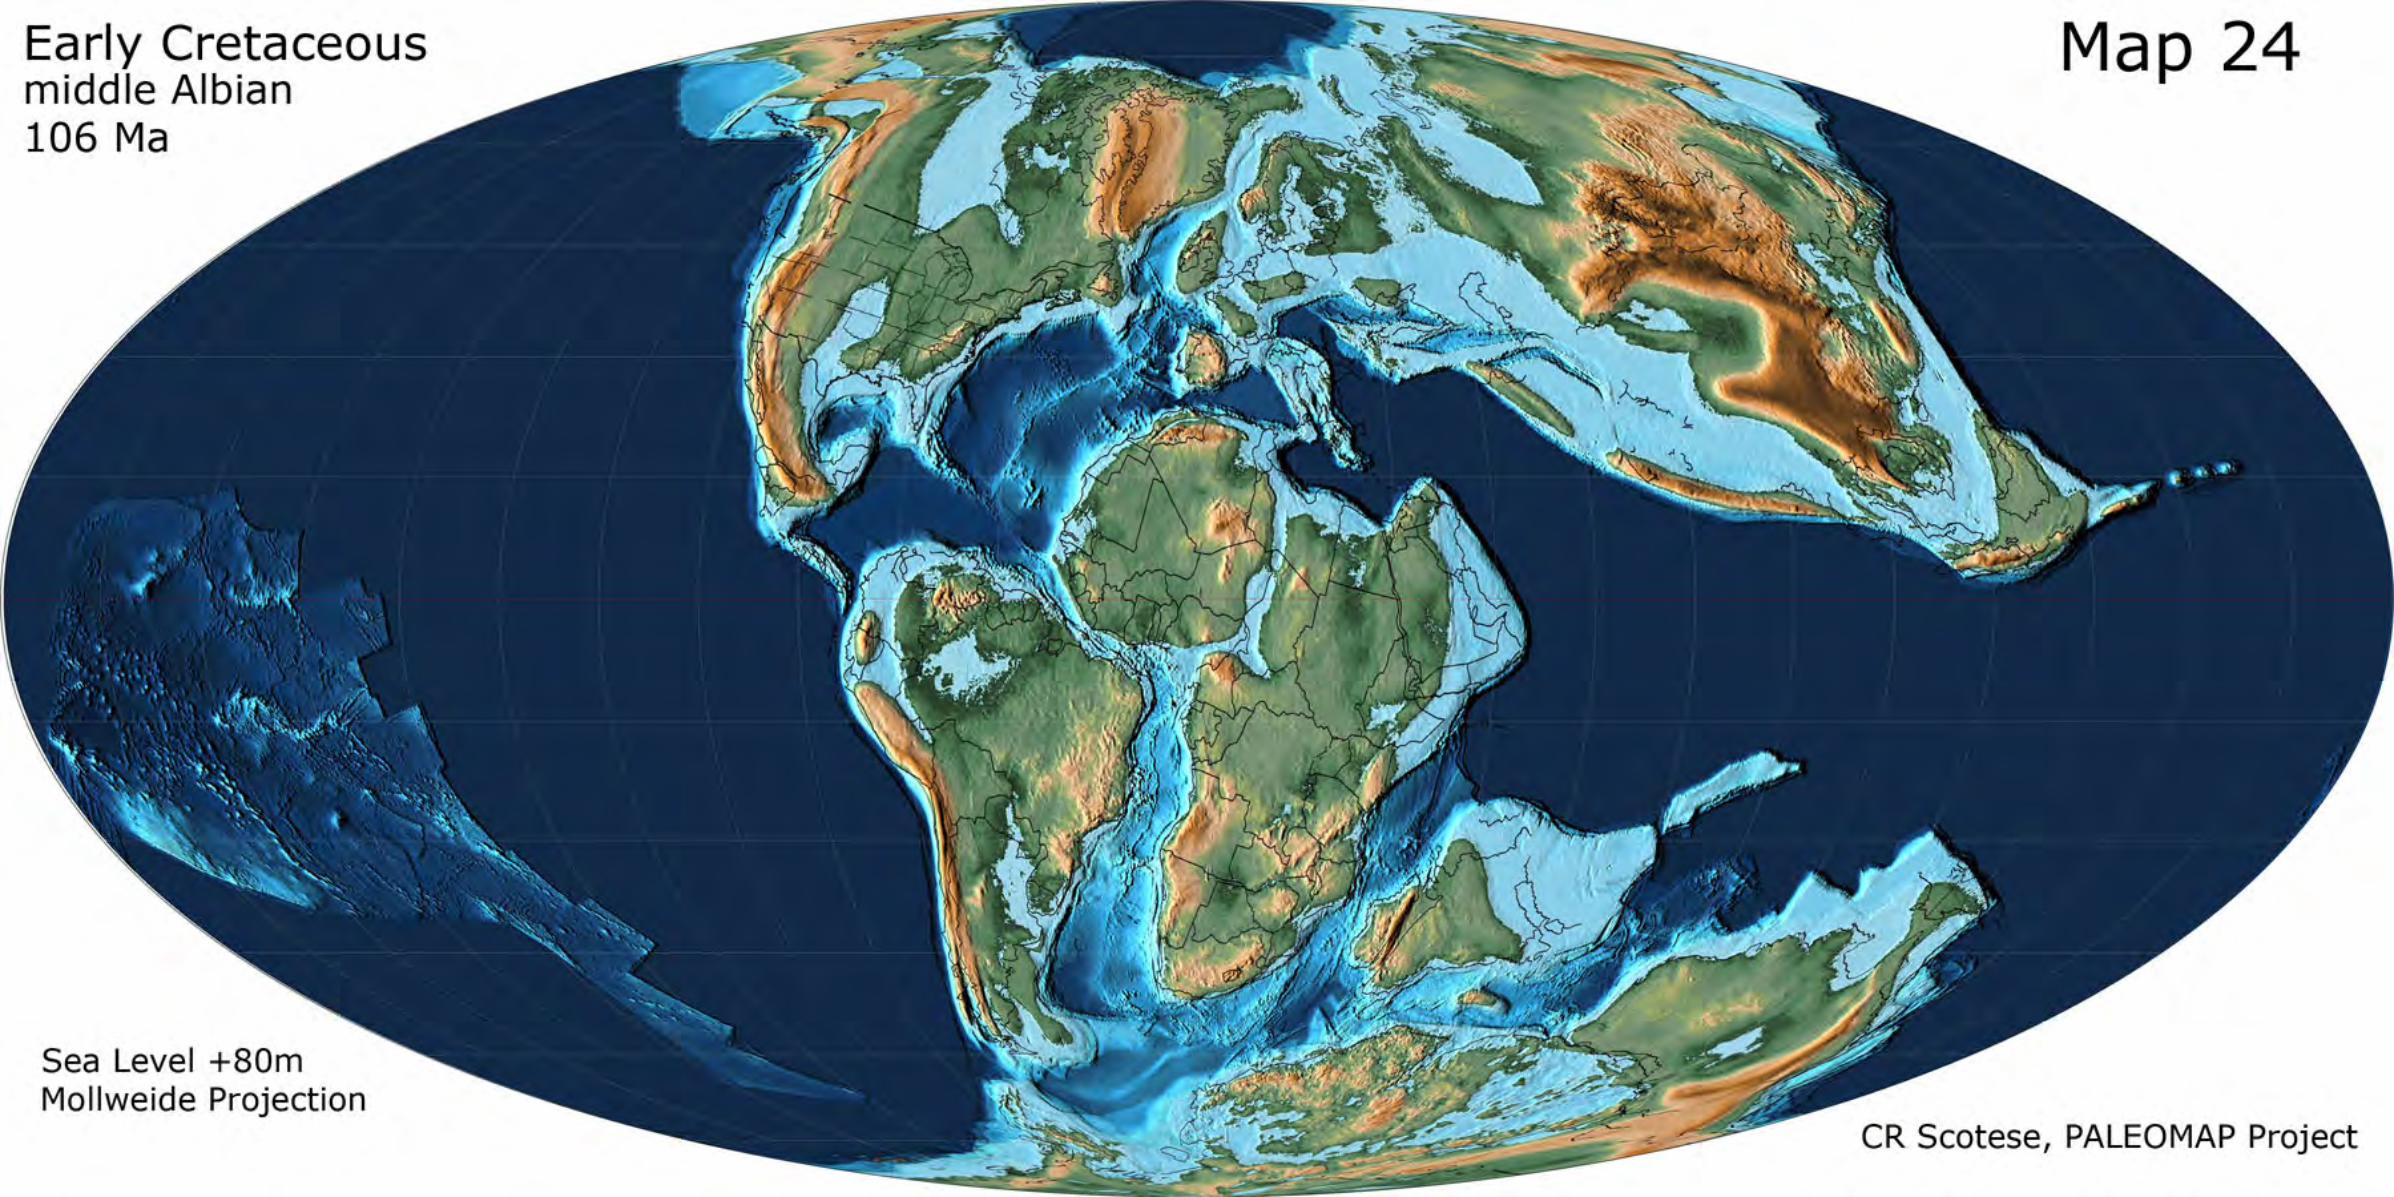
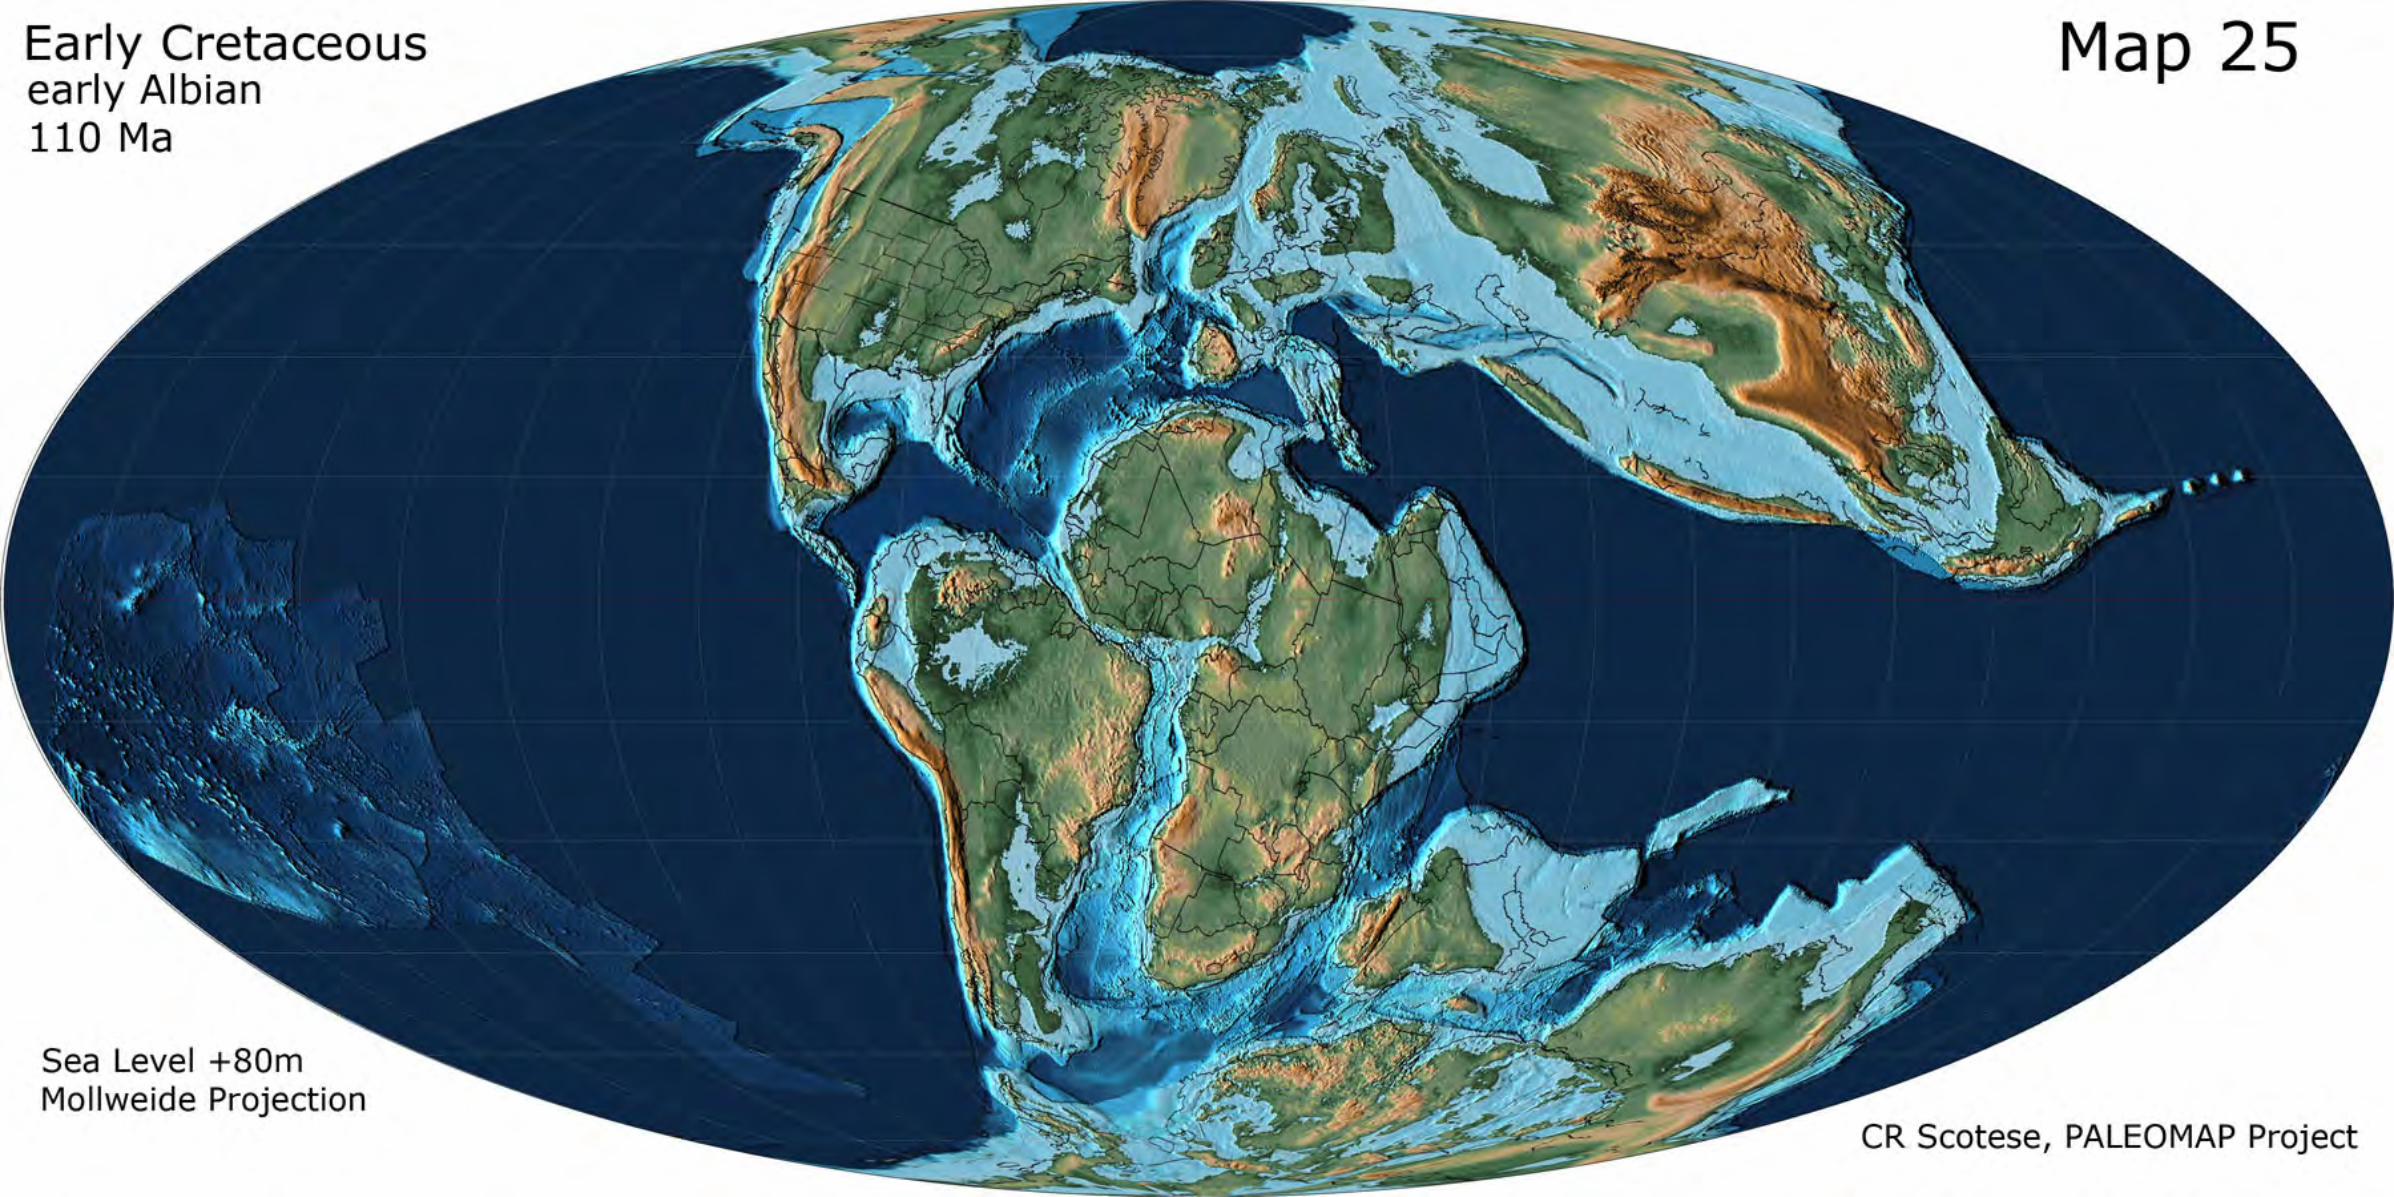
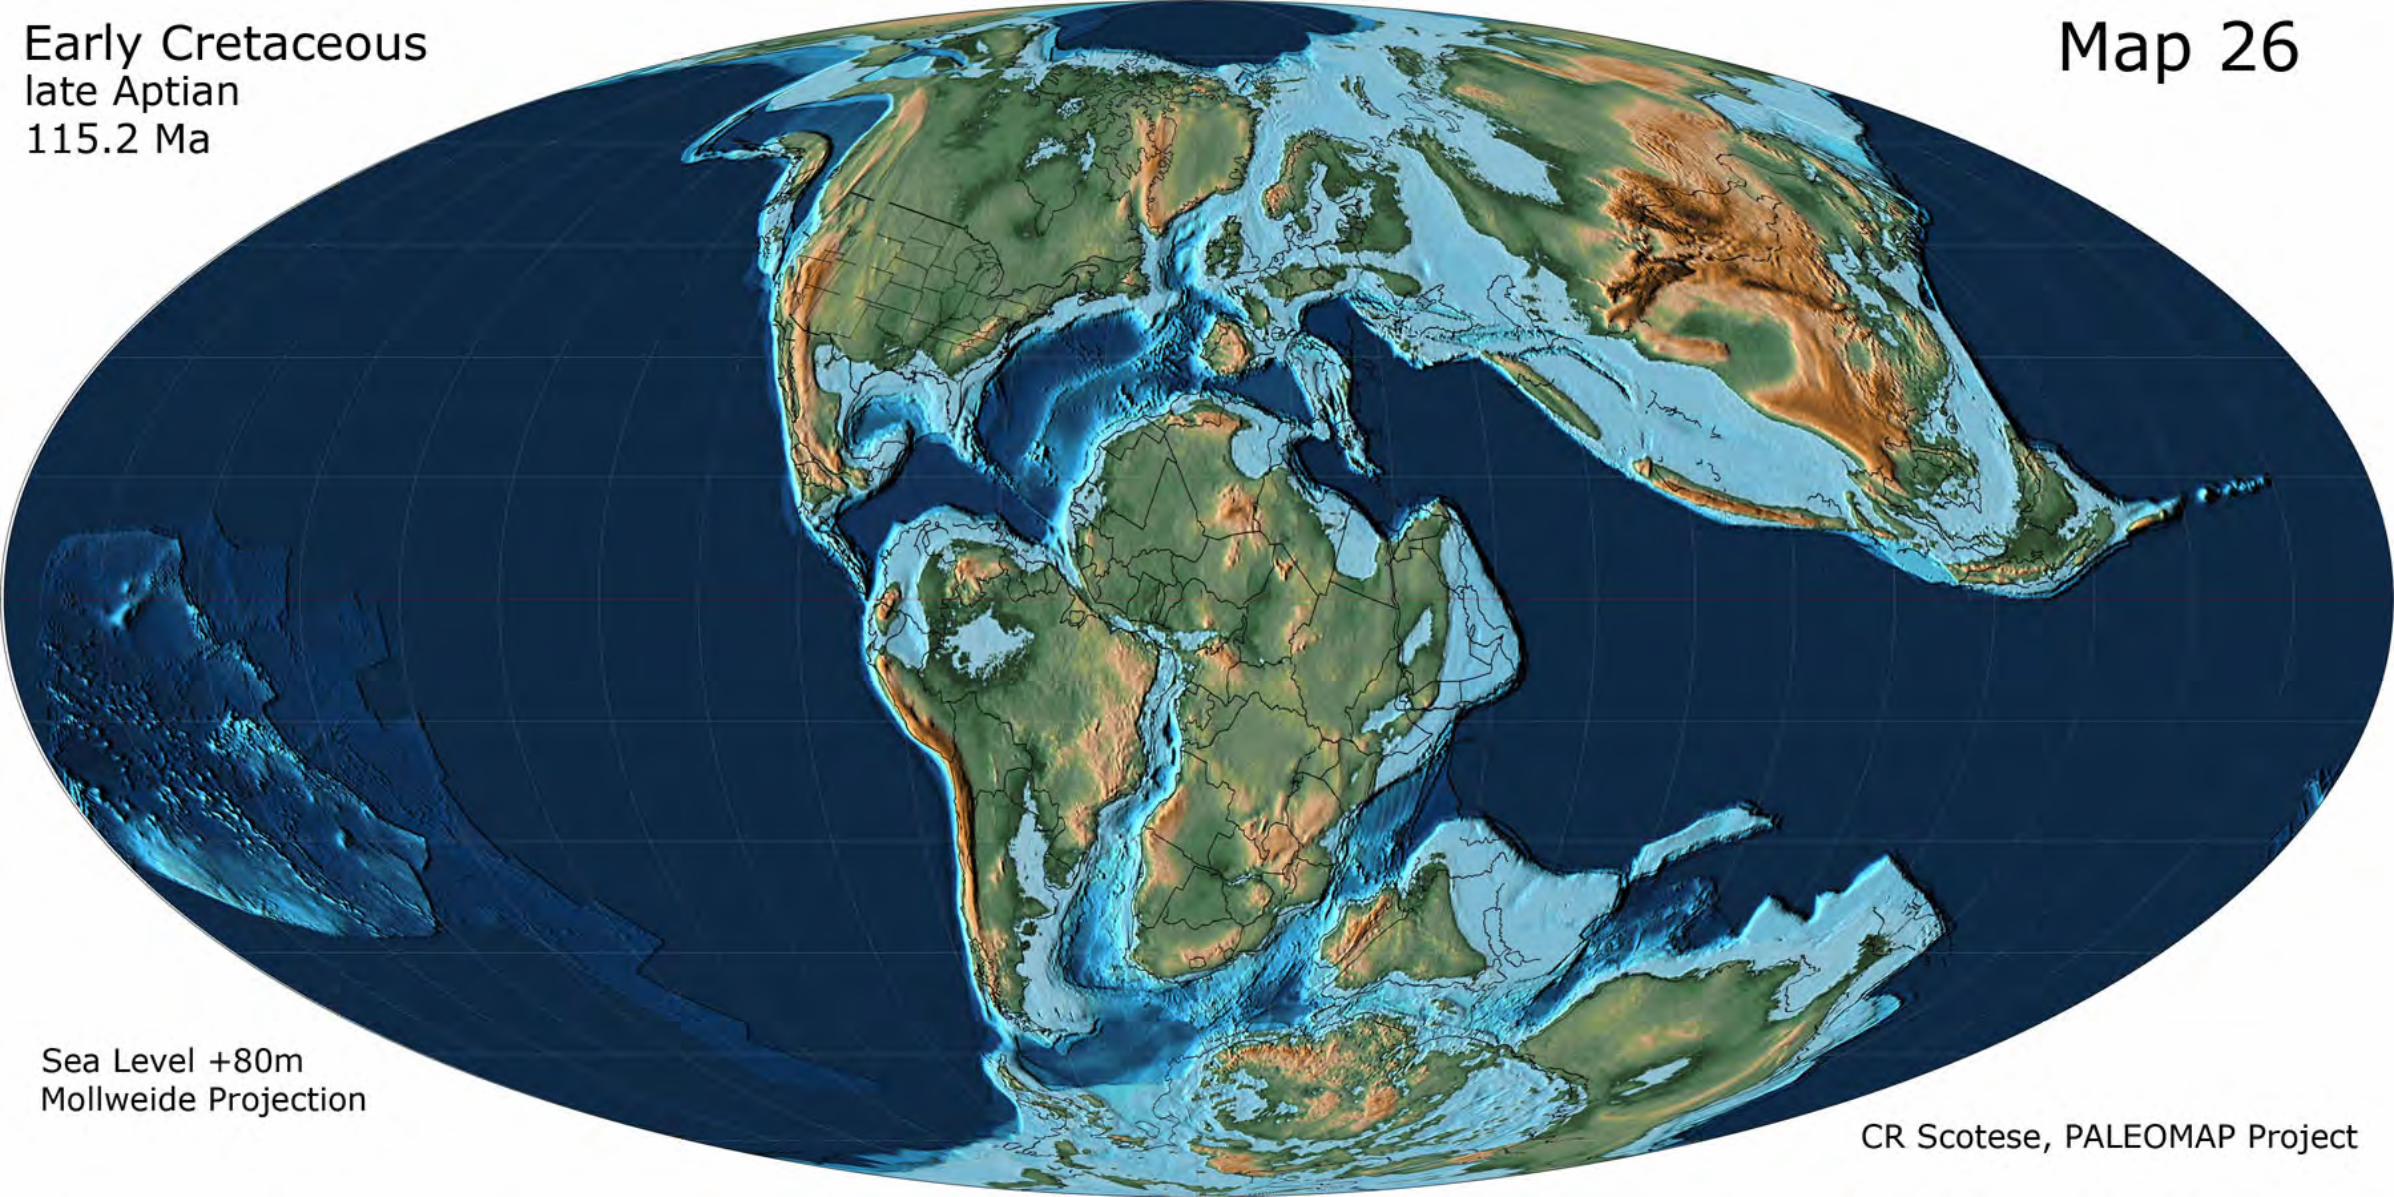
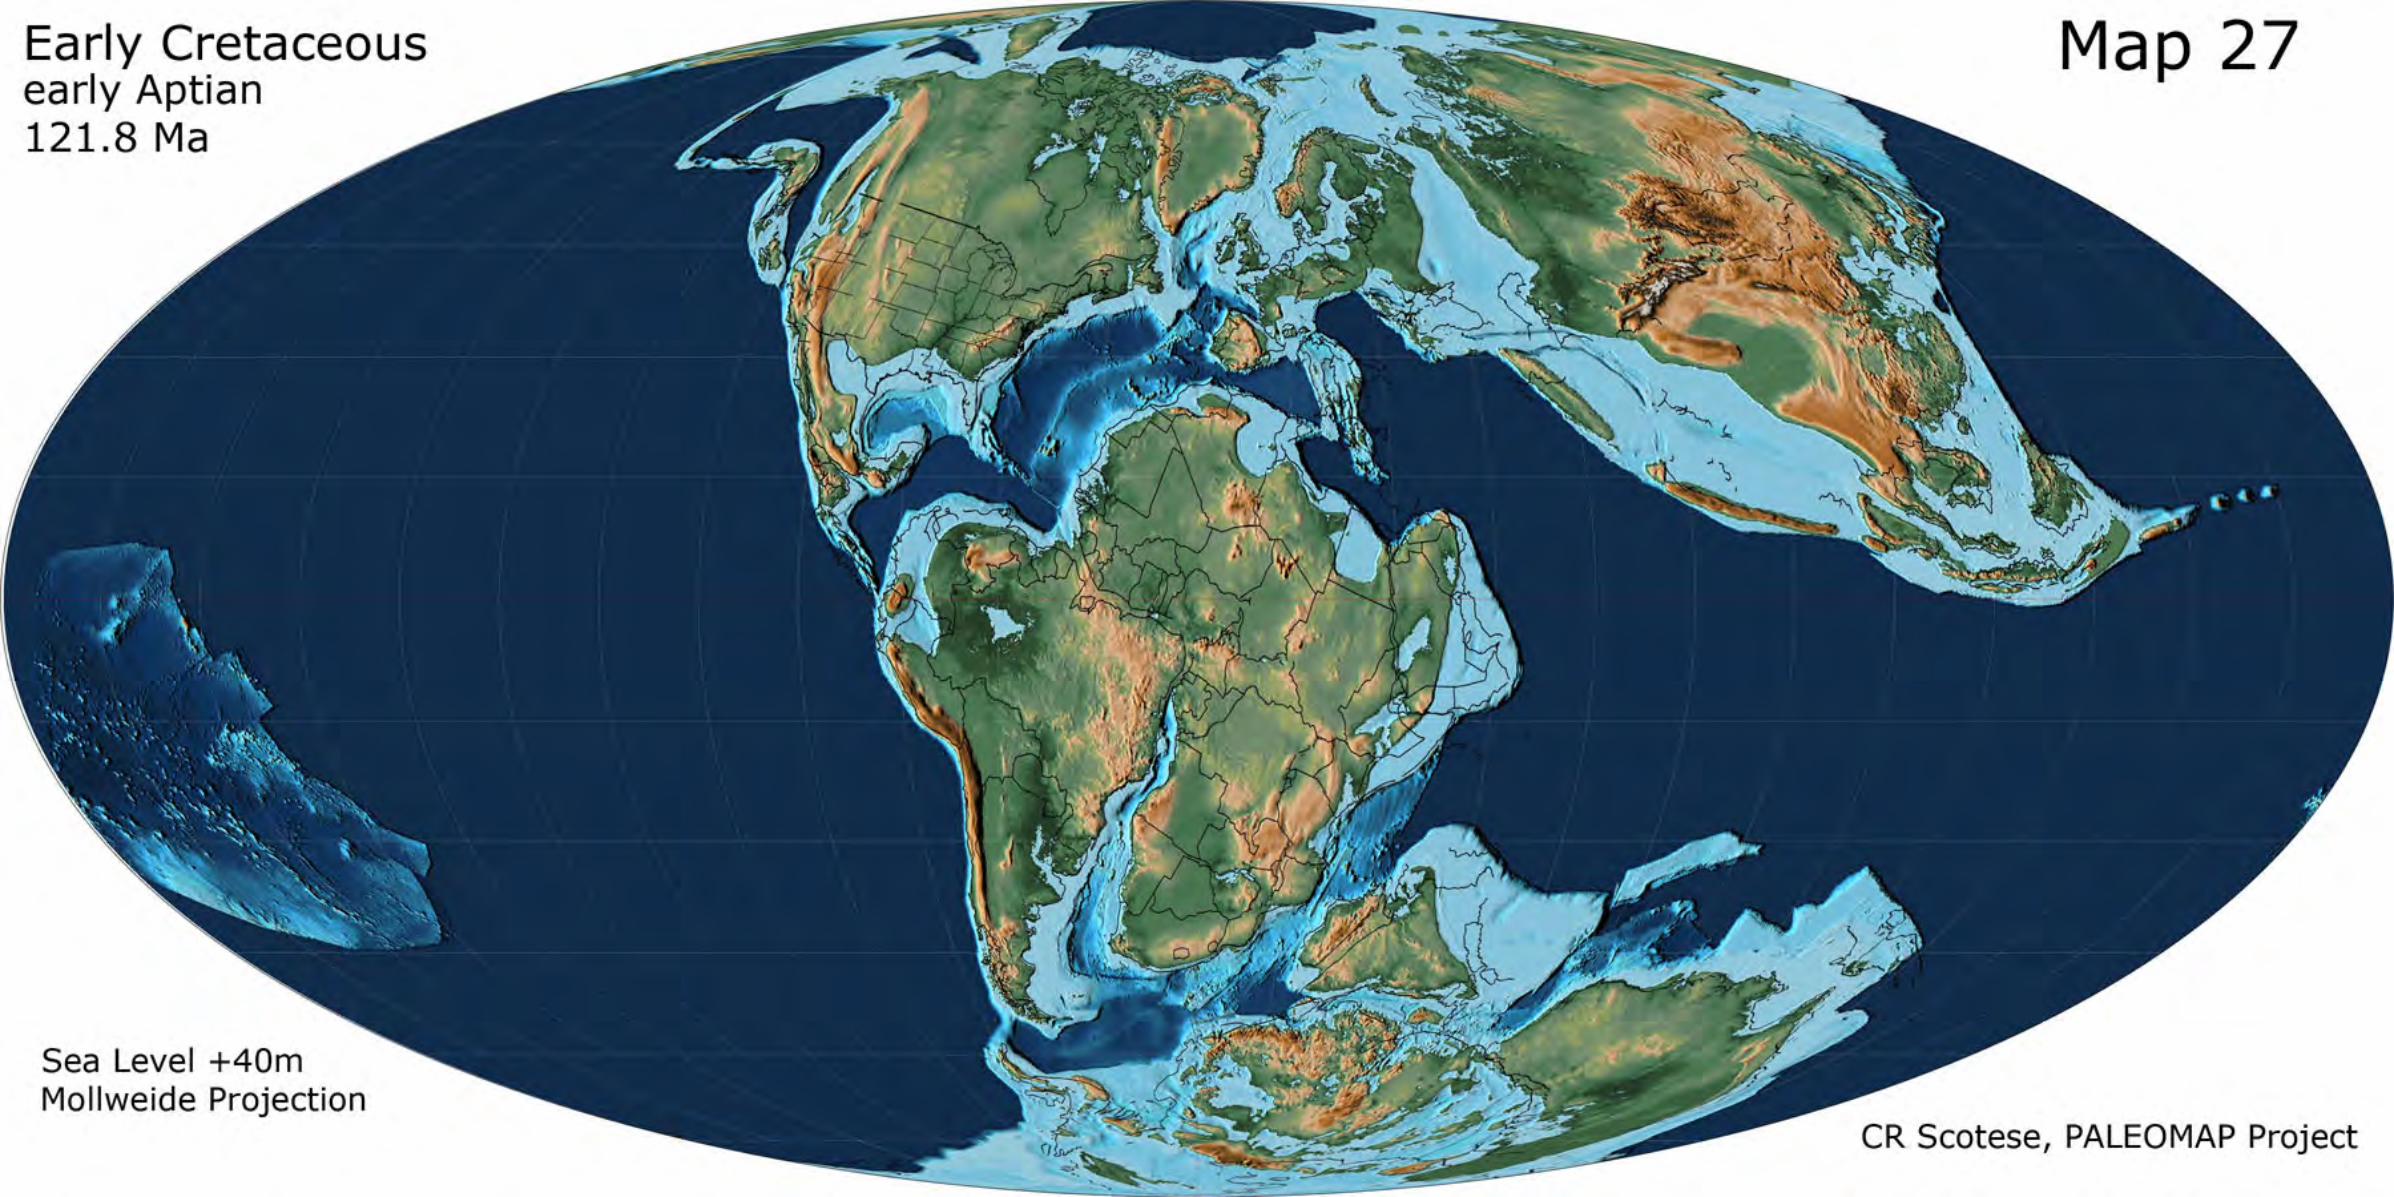
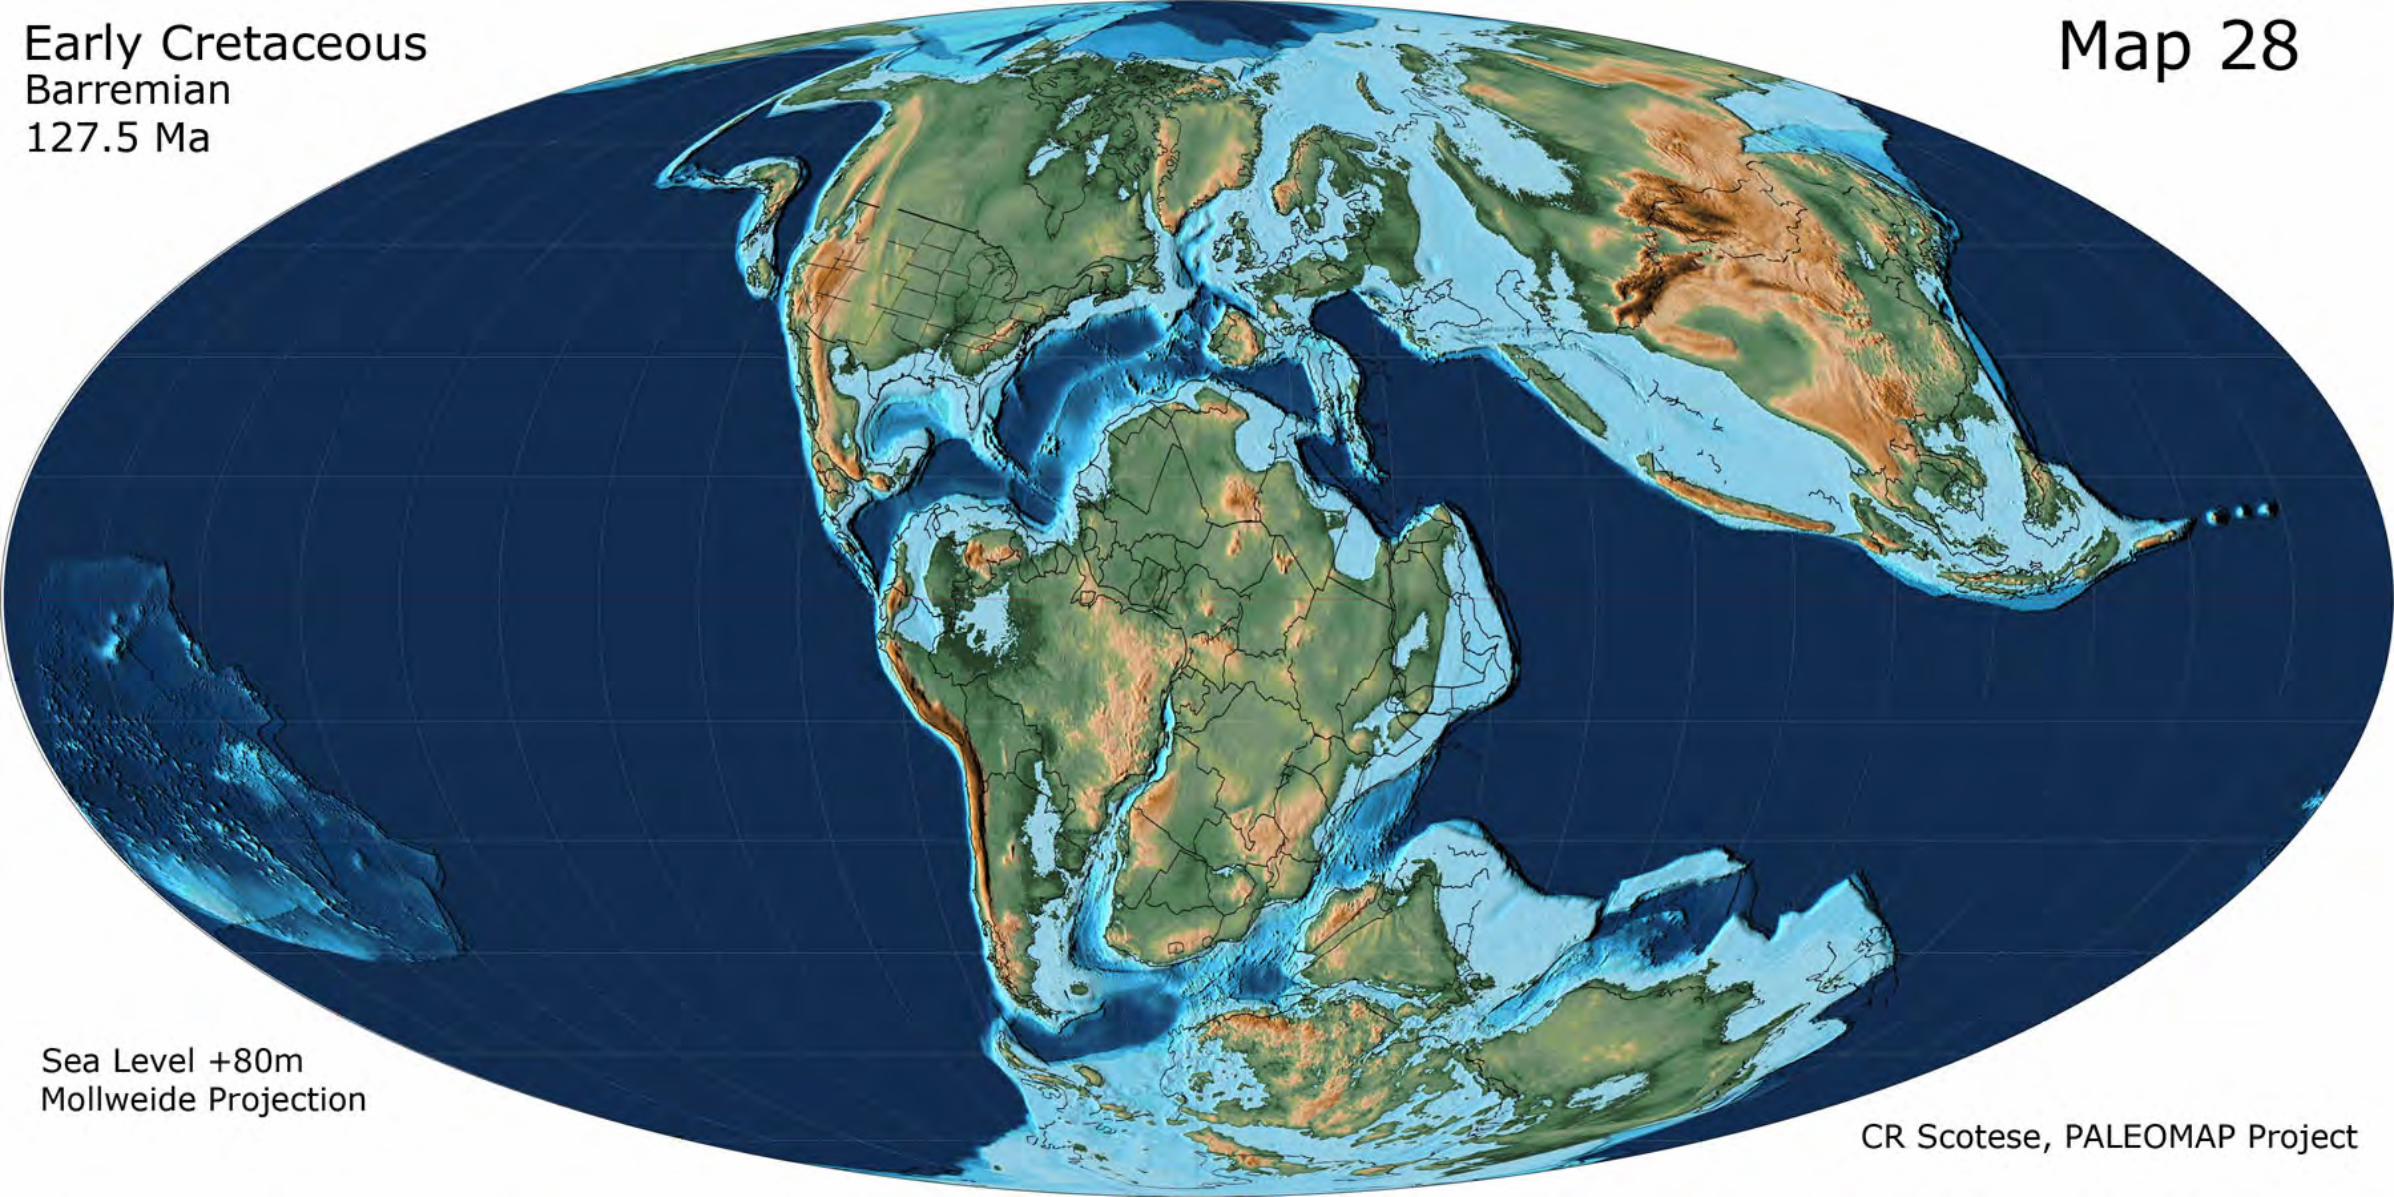
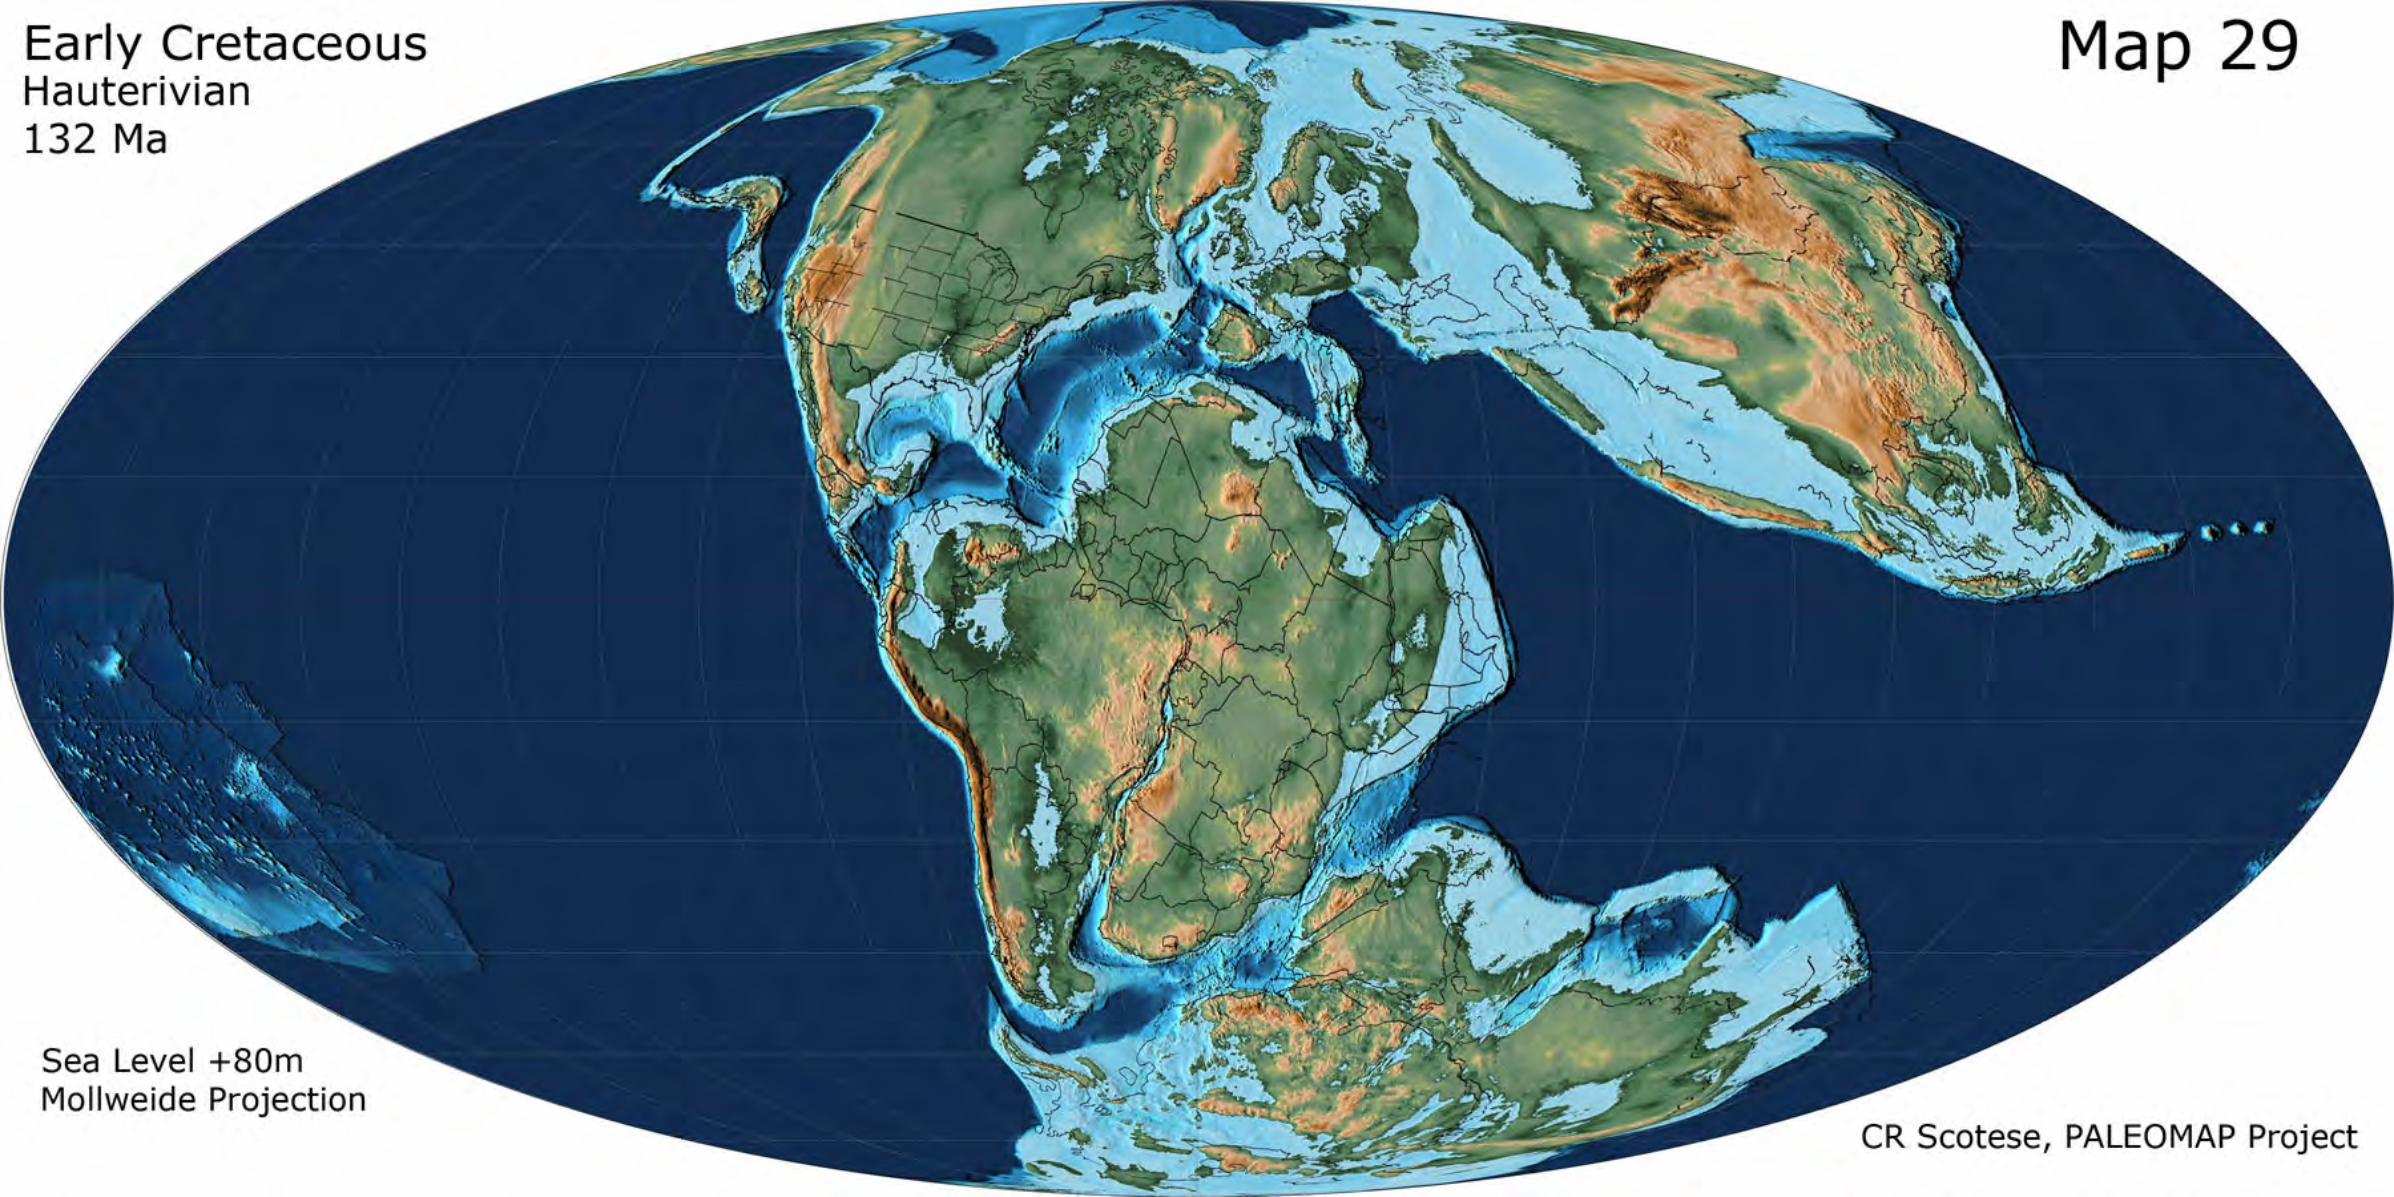
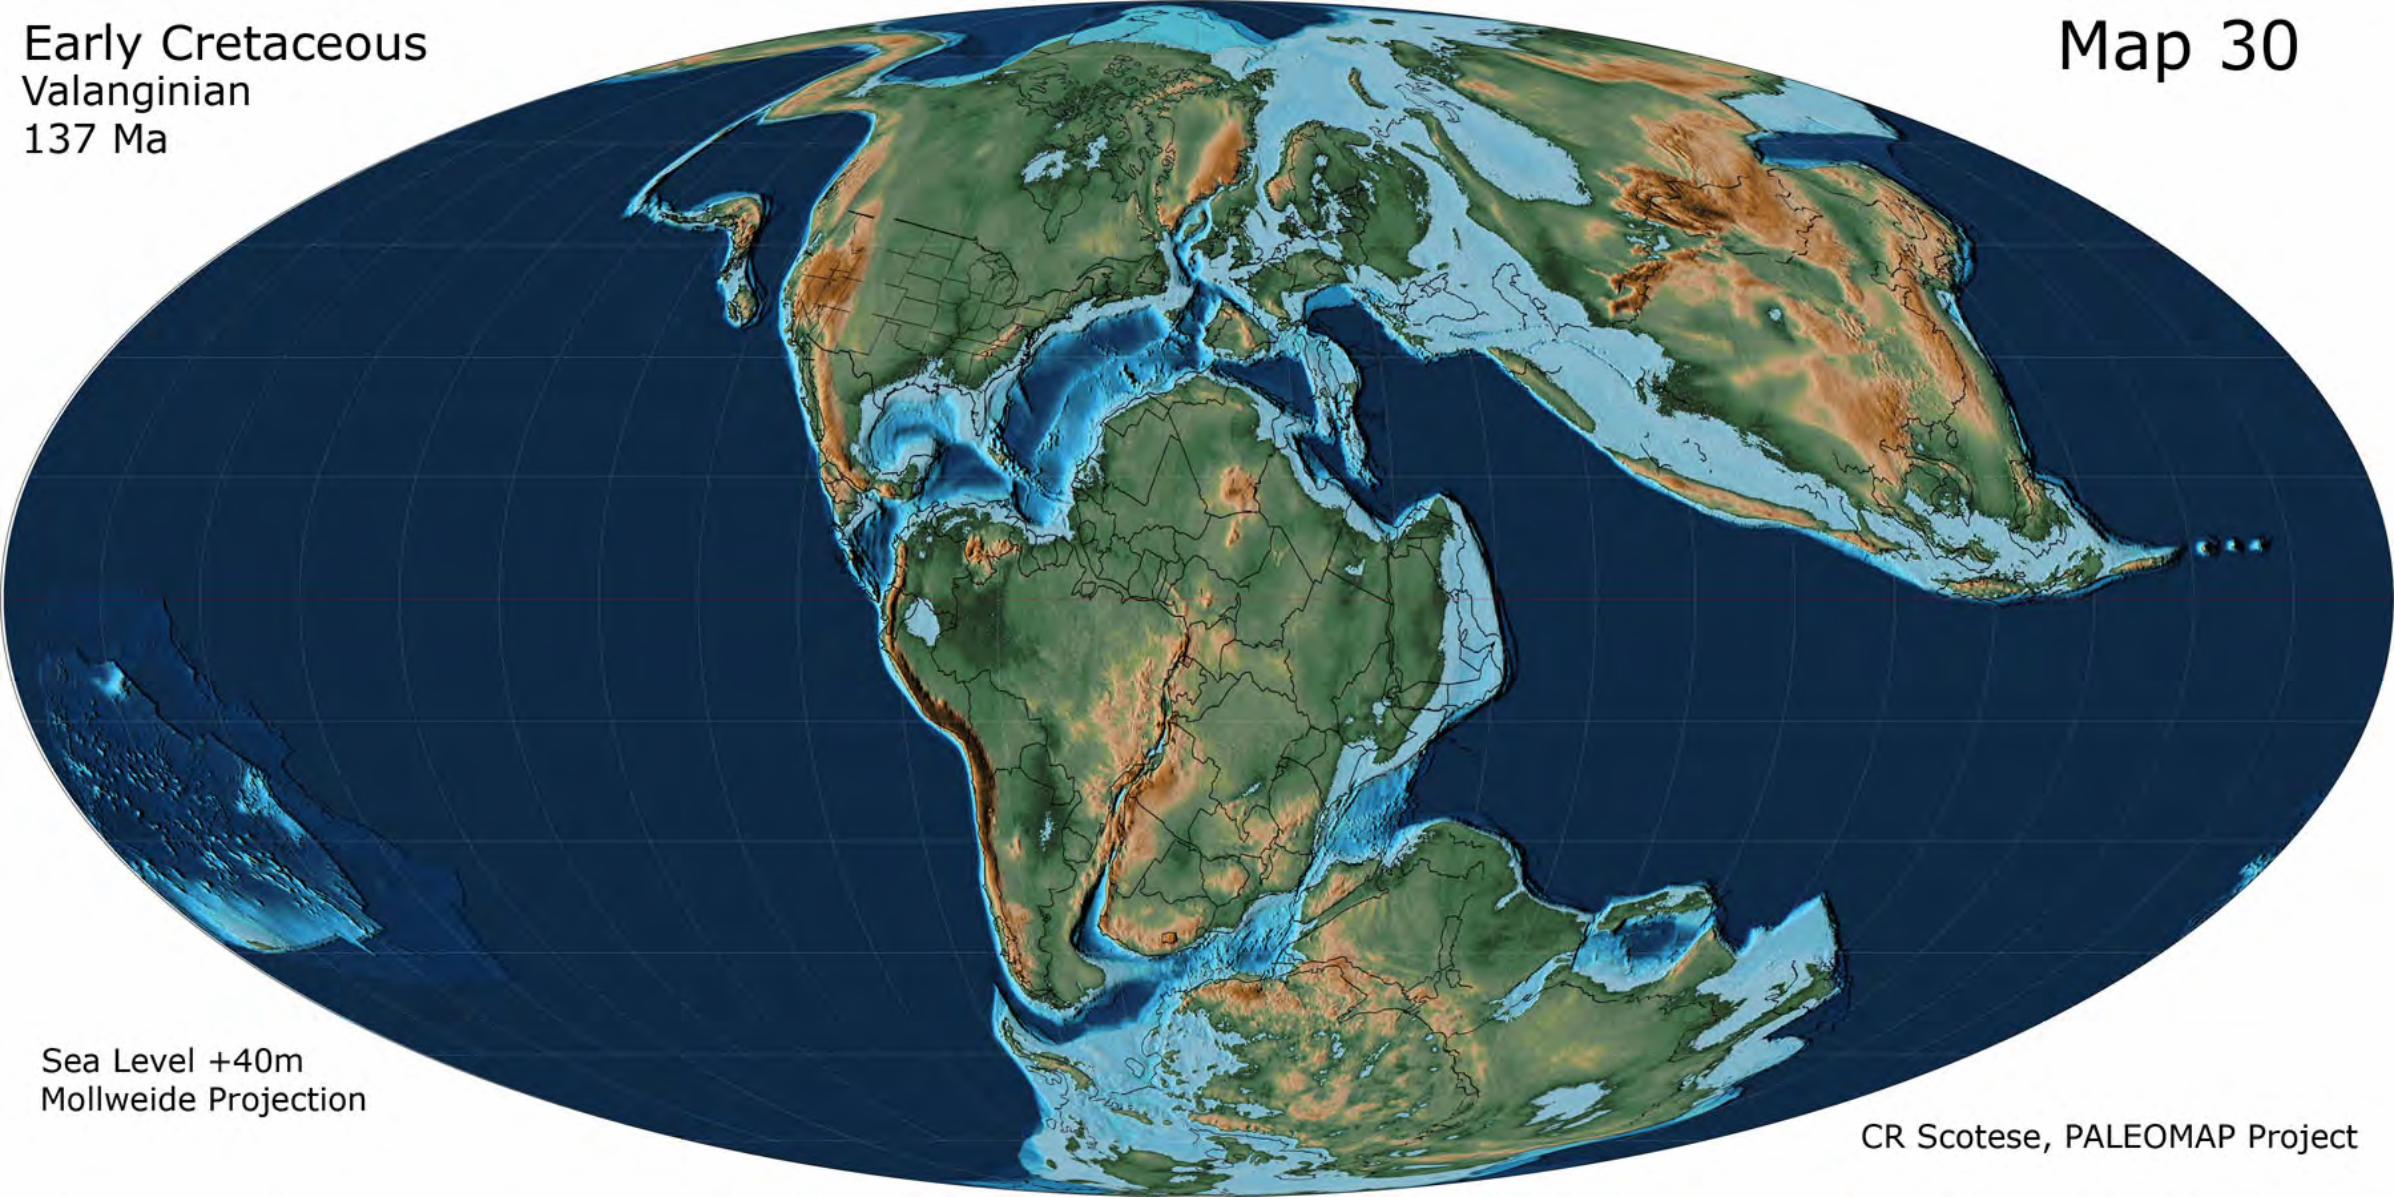
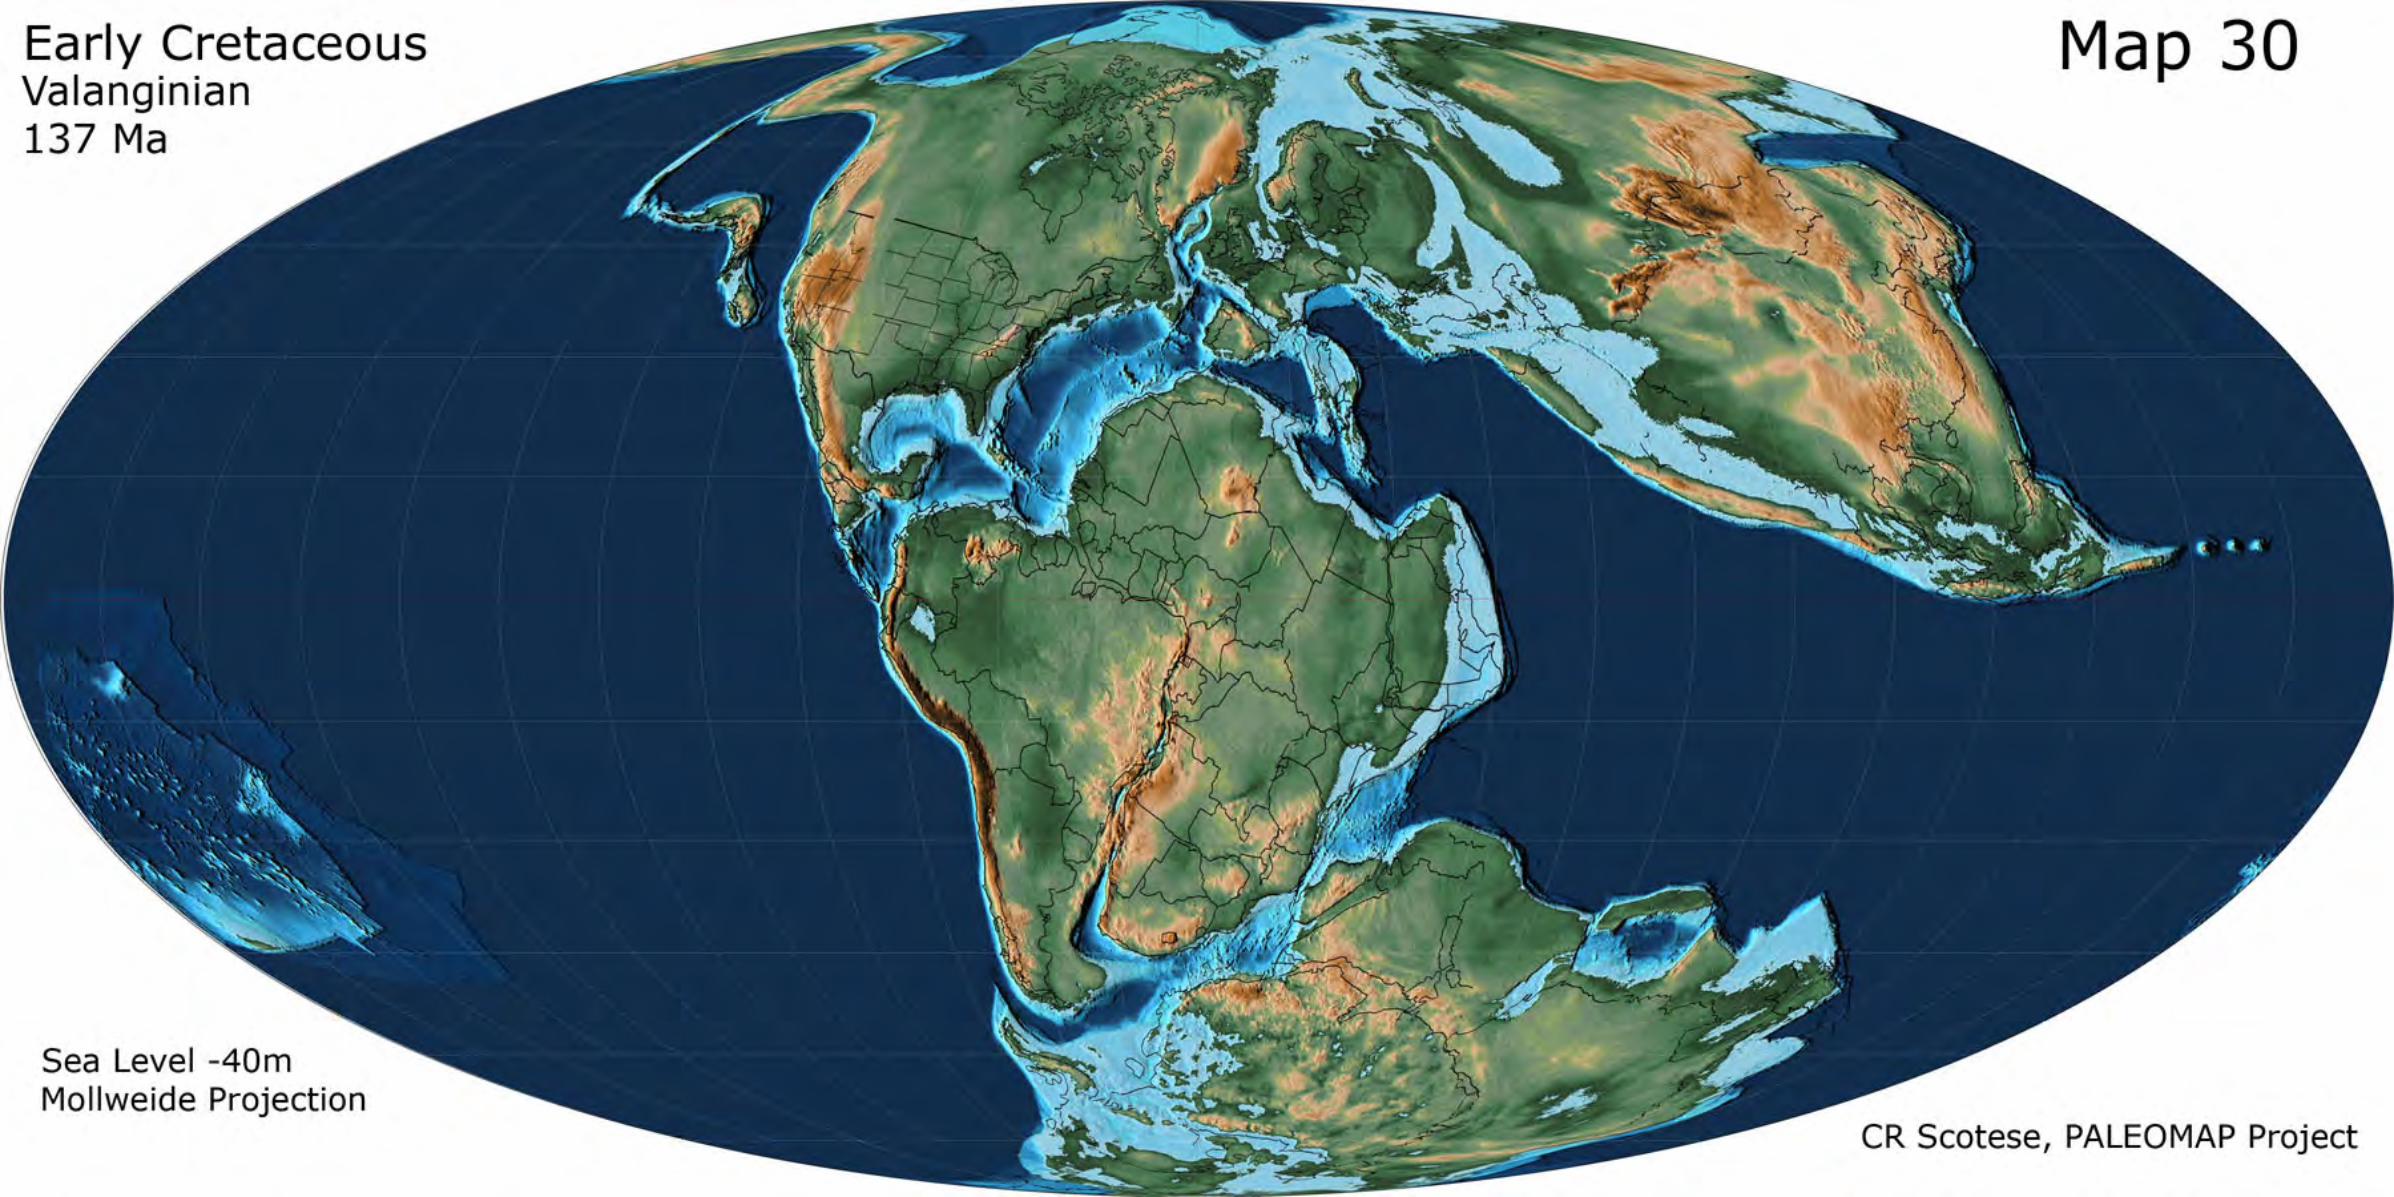
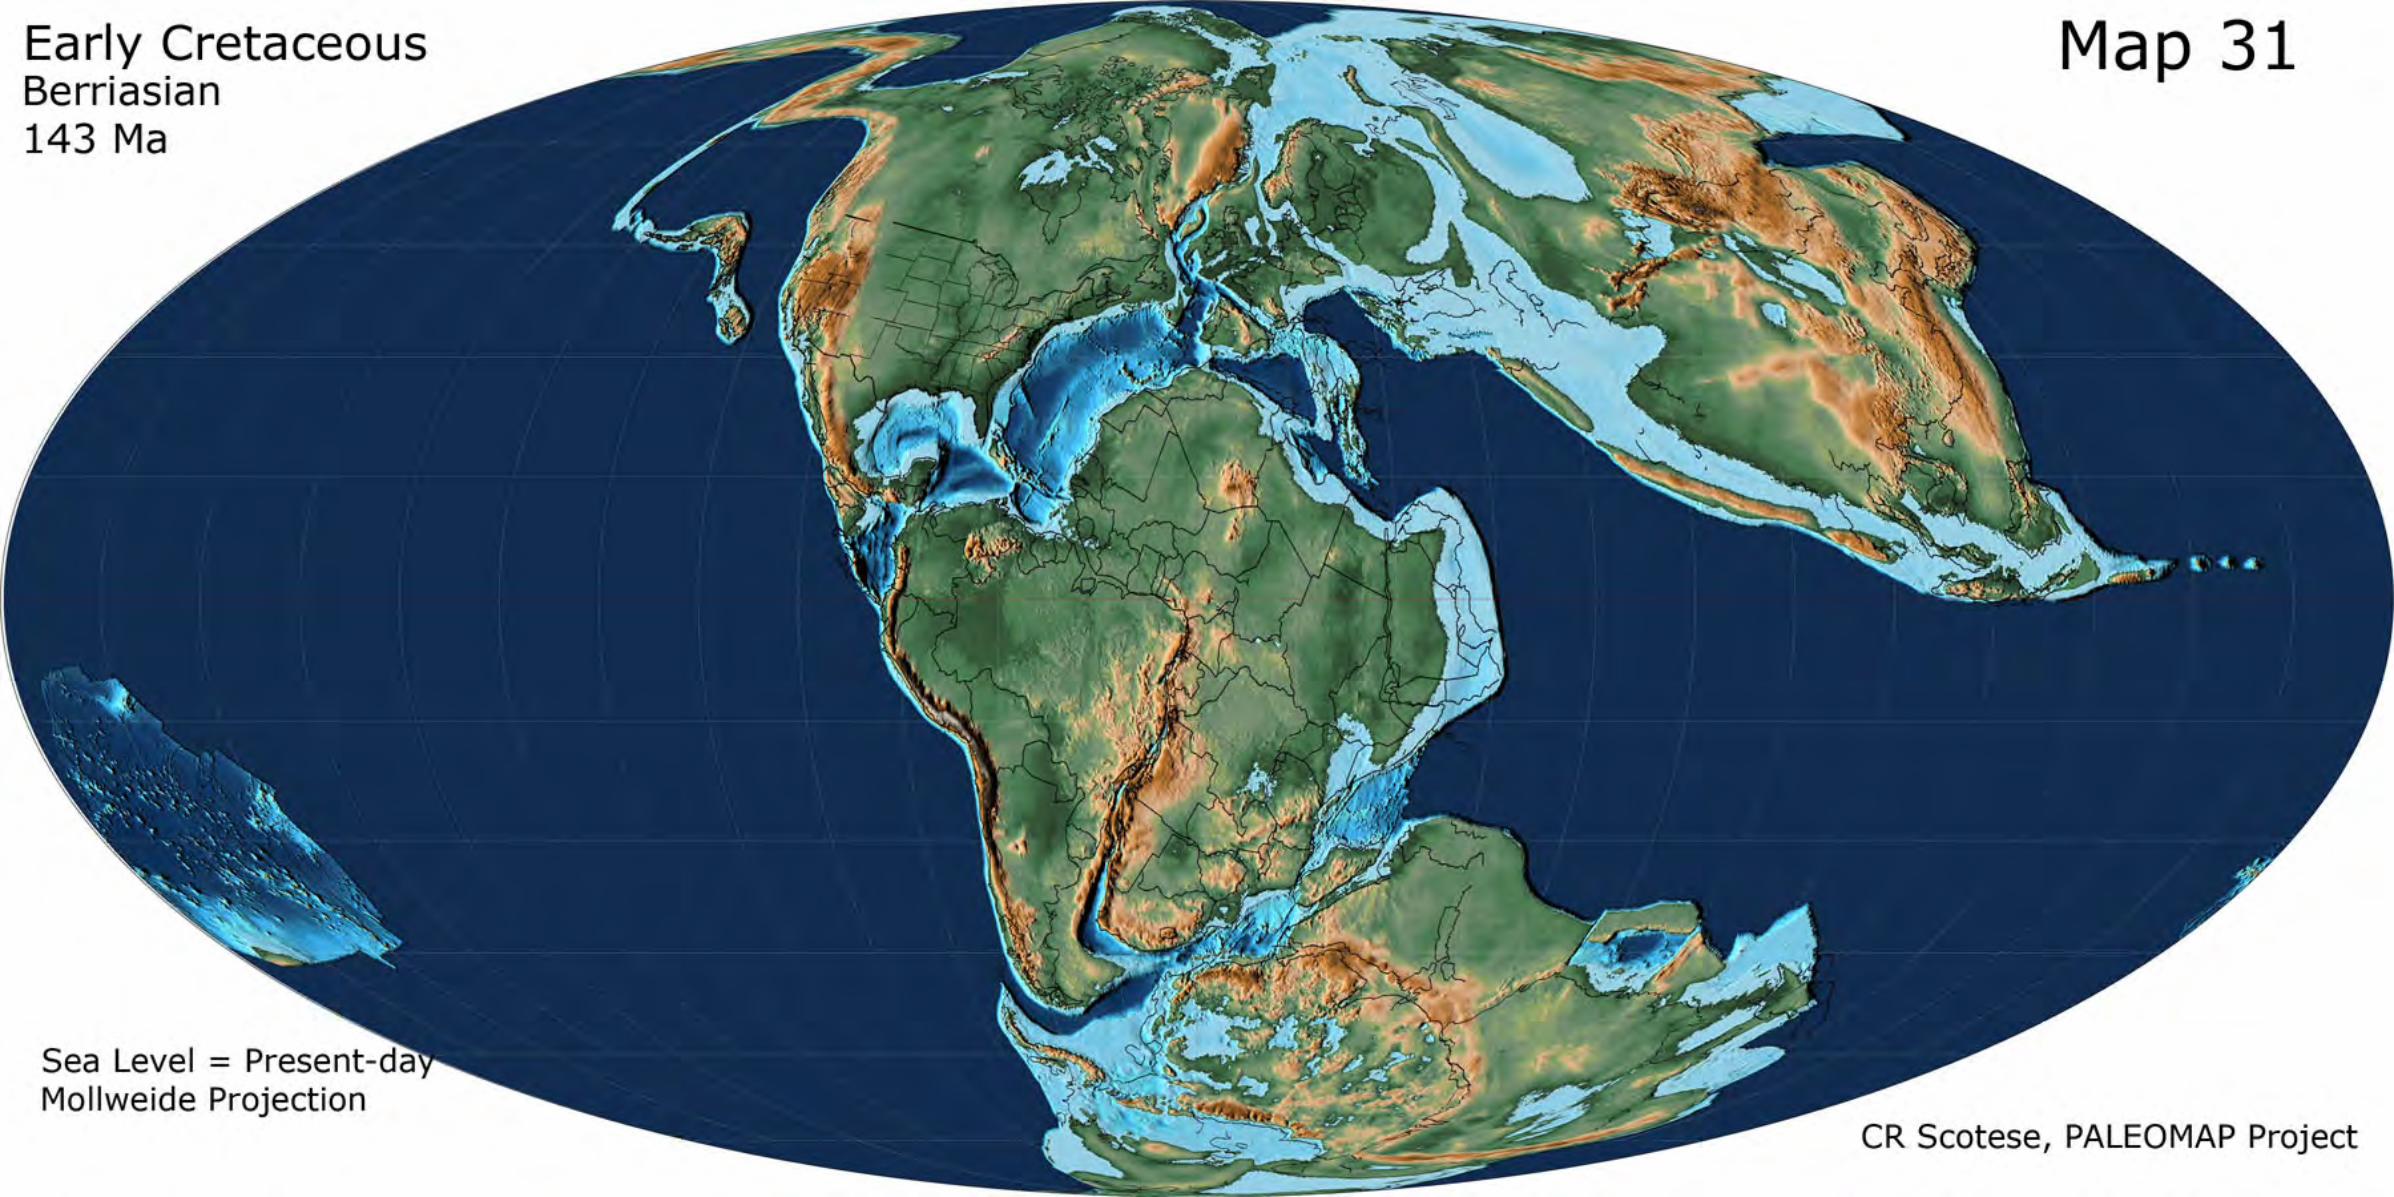
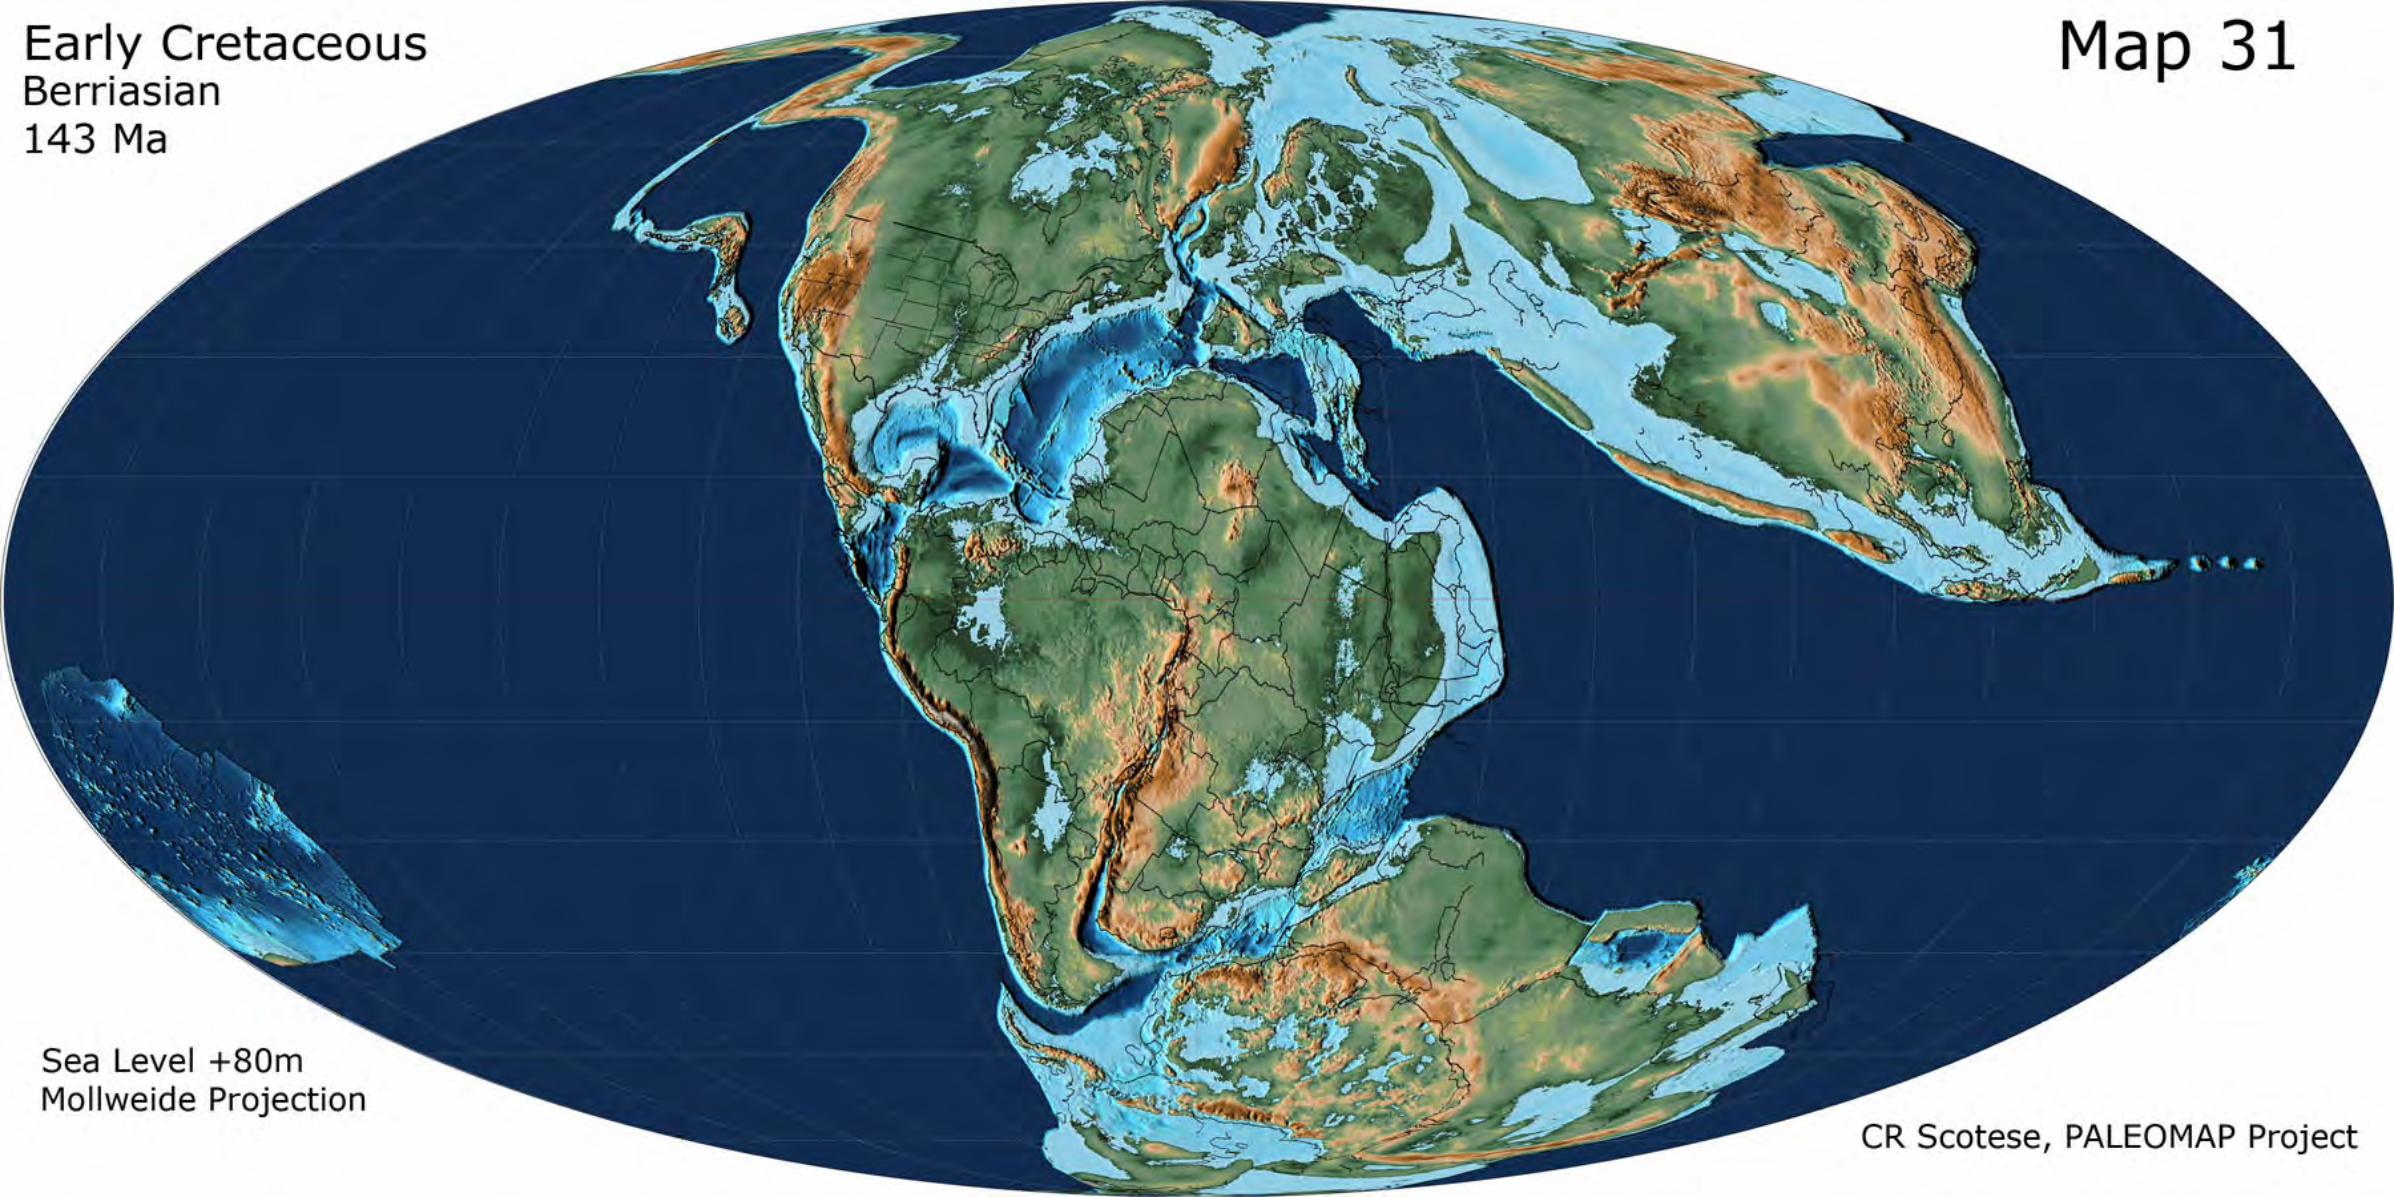
Atlas of Early Cretaceous Paleogeographic Maps This Atlas of Early Cretaceous Paleogeographic Maps shows the changing paleogeography from the Berriasian (143 Ma) to the late Albian (101.8 Ma). The maps are from volume 2 of the PALEOMAP PaleoAtlas for ArcGIS (Scotese, 2014). Also numeric time values are from Gradstein, Ogg & Smith (2008). For several stages there are versions of the map that show maximum sea level (maximum flooding surface) or minimum sea level (supersequence boundary) during that time interval. The following maps are included in the Atlas of Early Cretaceous Paleogeographic Maps: Map 23 Early Cretaceous (late Albian, 101.8 Ma) Map 24 Early Cretaceous (middle Albian, 106 Ma) Map 25 Early Cretaceous (early Albian, 110 Ma) Albian Supersequence Boundary and Transgressive System Tract Map 26 Early Cretaceous (late Aptian, 115.2 Ma) Map 27 Early Cretaceous (early Aptian, 121.8 Ma) Map 28 Early Cretaceous (Barremian, 127.5 Ma) Map 29 Early Cretaceous (Hauterivian, 132 Ma) Map 30 Early Cretaceous (Valanginian, 137 Ma) Barremian-Hauterivian Supersequence boundary and Transgressive Systems Tract Map 31 Early Cretaceous (Berriasian, 143 Ma) Berriasian Supersequence boundary and Maximum Flooding Surface This work should be cited as Scotese, C.R., 2014. Atlas of Early Cretaceous Paleogeographic Maps, PALEOMAP Atlas for ArcGIS, volume 2, The Cretaceous, Maps 23-31, Mollweide Projection, PALEOMAP Project, Evanston, IL.